SECURITIES AND EXCHANGE COMMISSION
Washington, D.C. 20549
FORM 20-F
| | | |
| o | | REGISTRATION STATEMENT PURSUANT TO SECTION 12(b) OR 12(g) OF THE SECURITIES EXCHANGE ACT OF 1934 |
OR
| | | |
| x | | ANNUAL REPORT PURSUANT TO SECTION 13 OR 15(d) OF THE SECURITIES EXCHANGE ACT OF 1934 |
| | | |
| | For the fiscal year ended December 31, 2003. |
| | | |
| | Commission file number:000-30134 |
OR
| | | |
| o | | TRANSITION REPORT PURSUANT TO SECTION 13 OR 15(d) OF THE SECURITIES EXCHANGE ACT OF 1934 |

(Exact name of Registrant as specified in its charter)
Cayman Islands
(Jurisdiction of incorporation or organization)
34/F Citicorp Centre
18 Whitfield Road
Causeway Bay
Hong Kong
telephone: (852) 2893-8200
facsimile: (852) 2893-5245
e-mail: investor-relations@hk.china.com
(Address of principal executive offices)
Securities for which there is a reporting obligation pursuant to Section 15(d) of the Act:
Class A common shares
Indicate the number of outstanding shares of each of the Issuer’s class of capital or common stock as of the close of the period covered by this Annual Report:
| | | |
| Class of shares | | Number outstanding as of March 15, 2004 |
| |
|
Class A common shares
Preferred Shares | | 103,930,895
Nil |
Indicate by check mark whether the registrant (1) has filed all reports required to be filed by Section 13 or 15(d) of the Securities Exchange Act of 1934 during the preceding 12 months (or for such shorter period that the registrant was required to file such reports), and (2) has been subject to such filing requirements for the past 90 days.
Yesx Noo
Indicate by check mark which financial statement item the registrant has elected to follow.
Item 17o Item 18x
NOTE TO SHAREHOLDERS
In connection with our proposed acquisition of Ross Systems, Inc., we have filed the proxy statement/prospectus we propose to use in connection with the transaction with the United States Securities and Exchange Commission. As part of the typical SEC review process for such documents, we have received comments from the SEC, including comments relating to our financial statements. In particular, we have received comments from the SEC inquiring about the appropriate amortization period for our URLs and the appropriate method to recognize revenue in our mobile services and applications business. Currently, we use a 20 year amortization period for our URLs, and we recognize revenue in our mobile services and applications business on a “net” basis, which means that we do not include as revenues in our mobile services and applications business amounts paid to China Mobile and China Unicom as part of our revenue sharing arrangements with them, as opposed to on a “gross” basis in which we would include as revenues the amount paid to China Mobile and China Unicom. We believe that our accounting treatment for these arrangements is appropriate. However, depending upon the outcome of such review, we may need to amend our Annual Report on Form 20-F and/or our 2003 financial statements in response to these comments from the SEC or other comments received from the SEC. If as a result of these comments we are required to adopt a shorter amortization period for our URLs, there may be a material adverse impact on net income in 2003 and prior periods.
For additional discussion concerning our URLs, see Item 3.D “Risk Factors - - Risks Relating to chinadotcom — Risks relating to our overall business — We are subject to various risks, including intellectual property claims and claims of unreasonable purchase price paid, related to our purchase of URLs from CIC, which could materially and adversely impact our business prospects and financial condition”. For additional discussion concerning our revenue recognition policies in our mobile services and applications business, see Item 5 — “Operating and Financial Review and Prospects — Critical Accounting Policies and Estimates — Revenue recognition — Mobile services and applications”.
GENERAL INTRODUCTION
In this Annual Report, except as otherwise specified, all references to “we,” “us,” “our,” “the Company” or “chinadotcom” refer to chinadotcom corporation and its consolidated subsidiaries and their respective operations. Unless otherwise specified, all information contained in this Annual Report, including share and per share data, reflects the two-for-one share splits approved by our shareholders as of each of December 6, 1999 and April 28, 2000, respectively, and effective as of the close of trading on the Nasdaq National Market on December 13, 1999 and May 8, 2000, respectively. In this annual report, any reference to US GAAP means the generally accepted accounting principles of the United States and, unless indicated otherwise, any reference to “U.S.$”, “US$”, or “$” is to United States dollars.
Presentation of Financial Information
chinadotcom was incorporated as China Information Infrastructure Limited under the laws of the Cayman Islands in June 1997 as a wholly-owned subsidiary of China Internet Corporation Limited, or CIC, a company incorporated under the laws of Bermuda. In June 1999, CIC distributed its total interest in chinadotcom to CIC’s shareholders in a reorganization. The transaction involved the distribution of a total of 46,975,972 of our Class A common shares to CIC’s shareholders on a one-for-one basis with respect to each issued and outstanding share of CIC’s capital stock at the time of the distribution. Upon completion of its reorganization, CIC ceased to have any ownership interest in chinadotcom. As part of this corporate reorganization, CIC also transferred certain subsidiaries, portals and related assets comprising the integrated portal business, which began in early 1996, to chinadotcom. The transfer was accounted for as a reorganization of entities under common control in a manner similar to a pooling of interests. In April 2000, our shareholders voted to change our name to chinadotcom corporation.
The summary consolidated financial data for fiscal year 1999 in this Annual Report has been prepared as if the corporate reorganization of chinadotcom referred to above had occurred retroactively. Accordingly, the results of operations and related net assets and liabilities of the operations transferred by CIC to chinadotcom as a part of CIC’s reorganization have been included in the summary consolidated financial data for fiscal year 1999. chinadotcom believes that the methods used in the allocation of expenses are reasonable and the statements of operations include all revenues and costs directly and indirectly attributable to the Company. The amounts related to chinadotcom have been determined by segregating amounts related to the operation of chinadotcom from those related to the operations retained by CIC. The determination of these amounts was made by reference to individual records for costs specifically relating to chinadotcom or by allocation based on number of personnel, time spent by personnel or similar references. Management believes the allocated costs are representative of the costs that would have been incurred if chinadotcom had operated on a stand-alone basis.
On each of December 13, 1999 and May 8, 2000, chinadotcom effected a two-for-one share split. Upon the occurrence of each of these share splits, each issued and outstanding Class A common share of chinadotcom was split into two Class A common shares of half the previous par value per share. The current par value of our Class A common share is US$0.00025 per share. Unless indicated otherwise, the consolidated financial statements and related notes in this Annual Report have been prepared, and the consolidated financial and share information in this Annual Report, including share and per share data, have been presented, as if the two share splits had occurred retroactively.
The consolidated financial statements have been prepared in accordance with US GAAP.
Forward-Looking Statements
Included in this Annual Report are forward-looking statements, which can be identified by the use of forward-looking terminology including “may,” “will,” “expect,” “anticipate,” “estimate,” “plan,” “continue,”
1
“believe” or other similar words. We have made forward-looking statements concerning the following, among others:
| | • | | our goals and strategies; |
| |
| | • | | our acquisition and expansion strategy; |
| |
| | • | | expectations regarding market growth, development and structural changes; |
| |
| | • | | expectations and targets for our results of operations; |
| |
| | • | | our operations and business prospects; |
| |
| | • | | the importance and expected growth of software, Internet and mobile phone applications; |
| |
| | • | | the pace of change in the software, Internet and mobile phone applications marketplaces; |
| |
| | • | | the demand for software, Internet and value-added mobile services; and |
| |
| | • | | advertising revenues. |
These statements are forward-looking and reflect management’s current expectations only. They are subject to a number of risks and uncertainties, including but not limited to, the following:
| | • | | our ability to realize strategic objectives by taking advantage of market opportunities in our geographic markets; |
| |
| | • | | any changes in the regulatory policies of the Ministry of Information Industry in the PRC, or MII, and other relevant government authorities relating to, among other matters, the grant and approval of licenses and the restrictions on Internet content; |
| |
| | • | | our ability to integrate operations or new acquisitions in accordance with business strategy; |
| |
| | • | | our ability to make changes in business strategy, development plans and product offerings to respond to the needs of current, new and potential customers, suppliers and strategic partners; |
| |
| | • | | the effects of restructurings on our ability to successfully support our operations and to secure and retain customers; |
| |
| | • | | our ability to acquire additional companies and technologies and manage an increasingly broad range of businesses; |
| |
| | • | | risks associated with the development and licensing of software generally, including potential delays in software development and technical difficulties that may be encountered in the development or use of our software; |
| |
| | • | | increased global competition; |
| |
| | • | | our ability to manage regulatory and litigation risks; |
| |
| | • | | our ability to rationalize operations in a cost effective manner; |
| |
| | • | | the risk that our various contractual relationships with China Mobile or China Unicom will terminate or be altered in a way that adversely affects our value-added mobile services and applications business; |
2
| | • | | our reliance on our contractual arrangements with our affiliated Chinese entities; |
| |
| | • | | the future growth of the mobile telecommunications and Internet industries in the PRC; |
| |
| | • | | the development of new technologies and applications or services affecting our current and future business; |
| |
| | • | | changes in political, economic, legal and social conditions in the PRC, including the PRC government’s specific policies with respect to foreign investment in the telecommunications industry, economic growth, inflation, foreign exchange and the availability of credit; |
| |
| | • | | general risks of the software, mobile services, marketing and internet sectors; and |
| |
| | • | | the uncertain economic and political climate in Asia, the United States and throughout the rest of the world, and the potential that such climate may deteriorate further, including the recent adverse effects on general economic conditions in Asia as a result of the outbreak of severe acute respiratory syndrome, or SARS. |
We do not intend to update or otherwise revise the forward-looking statements in this annual report, whether as a result of new information, future events or otherwise. Because of these risks, uncertainties and assumptions, the forward-looking events and circumstances discussed in this annual report might not occur in the way we expect, or at all. Accordingly, you should not place undue reliance on any forward-looking information. You should read these statements in conjunction with the risk factors disclosed in Item 3.D - “Key Information — Risk Factors”.
ITEM 1.IDENTITY OF DIRECTORS, SENIOR MANAGEMENT AND ADVISORS
Not applicable.
ITEM 2.OFFER STATISTICS AND EXPECTED TIMETABLE
Not applicable.
3
ITEM 3. KEY INFORMATION
A. Selected Financial Data
The following selected consolidated financial data of chinadotcom and our subsidiaries should be read in conjunction with the consolidated balance sheets as of December 31, 2002 and 2003 and the related consolidated statements of operations, cash flows and shareholders’ equity for the years ended December 31, 2001, 2002 and 2003 and the notes thereto, or together referred to as the Consolidated Financial Statements, included as Item 18 — “Financial Statements”, and the information included in Item 5 — “Operating and Financial Review and Prospects”. The Consolidated Financial Statements have been prepared and presented in accordance with US GAAP. The following selected consolidated financial data of chinadotcom and our subsidiaries as of and for the years ended December 31, 1999 and 2000, and the consolidated balance sheet as of December 31, 1999, 2000 and 2001 are derived from our audited financial data, after adjustment for the restatement of discontinued operations and segment reporting, which are not included in this Annual Report.
Unless otherwise indicated, share and per share data is expressed as if our two-for-one share splits that were effected on each of December 13, 1999 and May 8, 2000 had occurred retroactively. The selected consolidated financial data for fiscal year 1999 present financial results of chinadotcom and our subsidiaries as if our 1999 reorganization had been completed retroactively. The financial data reflect the financial condition and results of operations of chinadotcom and our subsidiaries for such periods and do not necessarily reflect our financial condition as if we had been a stand-alone entity for all periods. (see Item 4 — “Information on the Company”)
| | | | | | | | | | | | | | | | | | | | | |
| | | Year ended December 31,
|
| | | 1999
| | 2000
| | 2001
| | 2002
| | 2003
|
| | | (in thousands of U.S. dollars except share and per share data) |
Income Statement Data:(1) | | | | | | | | �� | | | | | | | | | | | | |
Revenues: | | | | | | | | | | | | | | | | | | | | |
| Software and consulting services | | | | | | | | | | | | | | | | | | | | |
| Sales of IT products | | | — | | | | — | | | | 743 | | | | 1,339 | | | | 8,000 | |
| Consulting services | | | 7,914 | | | | 45,791 | | | | 15,900 | | | | 14,166 | | | | 42,699 | |
| Mobile services and applications | | | — | | | | — | | | | — | | | | — | | | | 16,876 | |
| Advertising and marketing activities | | | 6,126 | | | | 37,645 | | | | 18,087 | | | | 26,682 | | | | 19,558 | |
| Other income | | | 1,306 | | | | 1,004 | | | | 4,507 | | | | 1,821 | | | | 2,299 | |
| | | |
| | | |
| | | |
| | | |
| | | |
| |
| | | | 15,346 | | | | 84,440 | | | | 39,237 | | | | 44,008 | | | | 89,432 | |
| Cost of revenues: | | | | | | | | | | | | | | | | | | | | |
| Software and consulting services | | | | | | | | | | | | | | | | | | | | |
| Sales of IT products | | | — | | | | — | | | | (472 | ) | | | (668 | ) | | | (6,123 | ) |
| Consulting services | | | (4,046 | ) | | | (28,972 | ) | | | (11,451 | ) | | | (6,255 | ) | | | (25,697 | ) |
| Mobile services and applications | | | — | | | | — | | | | — | | | | — | | | | (2,247 | ) |
| Advertising and marketing activities | | | (3,905 | ) | | | (24,524 | ) | | | (11,625 | ) | | | (19,999 | ) | | | (12,966 | ) |
| Other income | | | (606 | ) | | | (1,123 | ) | | | (1,892 | ) | | | (845 | ) | | | (1,084 | ) |
| | | |
| | | |
| | | |
| | | |
| | | |
| |
Gross margin | | | 6,789 | | | | 29,821 | | | | 13,797 | | | | 16,241 | | | | 41,315 | |
| Selling, general and administrative expenses | | | (26,557 | ) | | | (92,226 | ) | | | (73,297 | ) | | | (27,161 | ) | | | (34,325 | ) |
| Depreciation and amortization expenses | | | (6,079 | ) | | | (29,863 | ) | | | (19,180 | ) | | | (9,882 | ) | | | (7,182 | ) |
4
| | | | | | | | | | | | | | | | | | | | | |
| | | Year ended December 31,
|
| | | 1999
| | 2000
| | 2001
| | 2002
| | 2003
|
| | | (in thousands of U.S. dollars except share and per share data) |
| Impairment of goodwill and intangible assets | | | — | | | | (31,712 | ) | | | (21,908 | ) | | | — | | | | — | |
| | | |
| | | |
| | | |
| | | |
| | | |
| |
Operating loss | | | (25,847 | ) | | | (123,980 | ) | | | (100,588 | ) | | | (20,802 | ) | | | (192 | ) |
| Interest income | | | 3,826 | | | | 29,750 | | | | 26,689 | | | | 23,713 | | | | 13,440 | |
| Interest expense | | | — | | | | (851 | ) | | | (1,272 | ) | | | (2,463 | ) | | | (1,070 | ) |
| Gain/(loss) arising from share issuance of a subsidiary | | | — | | | | 140,031 | | | | (55 | ) | | | — | | | | — | |
| Gain/(loss) on disposal of available-for-sale securities | | | 6,282 | | | | 1,685 | | | | 4,411 | | | | (163 | ) | | | 4,599 | |
| Gain/(loss) on disposal of subsidiaries and cost investments | | | — | | | | 13,981 | | | | (1,915 | ) | | | (66 | ) | | | 469 | |
| Other non-operating gains | | | — | | | | — | | | | — | | | | 508 | | | | 961 | |
| Other non-operating losses | | | (42 | ) | | | (2,065 | ) | | | (922 | ) | | | (288 | ) | | | (153 | ) |
| Impairment of cost investments and available-for-sale securities | | | — | | | | (84,696 | ) | | | (12,260 | ) | | | (5,351 | ) | | | — | |
| Share of income/(losses) in equity investees(2) | | | (65 | ) | | | (9,423 | ) | | | (2,592 | ) | | | 682 | | | | (115 | ) |
| | | |
| | | |
| | | |
| | | |
| | | |
| |
| Income/(loss) before income taxes | | | (15,846 | ) | | | (35,568 | ) | | | (88,504 | ) | | | (4,230 | ) | | | 17,939 | |
| Income tax benefits/(income taxes) | | | — | | | | (582 | ) | | | (186 | ) | | | (113 | ) | | | 689 | |
| | | |
| | | |
| | | |
| | | |
| | | |
| |
| Income/(loss) before minority interests | | | (15,846 | ) | | | (36,150 | ) | | | (88,690 | ) | | | (4,343 | ) | | | 18,628 | |
| Minority interests in losses/(income) of consolidated subsidiaries | | | 12 | | | | 546 | | | | 3,162 | | | | 248 | | | | (2,204 | ) |
| | | |
| | | |
| | | |
| | | |
| | | |
| |
Income/(loss) from continuing operations | | | (15,834 | ) | | | (35,604 | ) | | | (85,528 | ) | | | (4,095 | ) | | | 16,424 | |
Discontinued operations | | | | | | | | | | | | | | | | | | | | |
| Loss from operations of discontinued subsidiaries | | | (2,883 | ) | | | (24,198 | ) | | | (38,857 | ) | | | (14,681 | ) | | | (3,027 | ) |
| Gain on disposal/dissolution of discontinued subsidiaries, net | | | — | | | | — | | | | — | | | | 545 | | | | 2,127 | |
| | | |
| | | |
| | | |
| | | |
| | | |
| |
Net income/(loss) | | | (18,717 | ) | | | (59,802 | ) | | | (124,385 | ) | | | (18,231 | ) | | | 15,524 | |
| | | |
| | | |
| | | |
| | | |
| | | |
| |
| Basic earnings/(loss) per share | | | (0.26 | ) | | | (0.61 | ) | | | (1.21 | ) | | | (0.18 | ) | | | 0.15 | |
| Diluted earnings/(loss) per share(3) | | | (0.26 | ) | | | (0.61 | ) | | | (1.21 | ) | | | (0.18 | ) | | | 0.15 | |
| Weighted average number of shares | | | | | | | | | | | | | | | | | | | | |
| Basic | | | 71,879,704 | | | | 98,091,541 | | | | 102,589,760 | | | | 102,269,735 | | | | 100,532,594 | |
| Diluted | | | 71,879,704 | | | | 98,091,541 | | | | 102,589,760 | | | | 102,269,735 | | | | 103,199,421 | |
| | | | | | | | | | | | | | | | | | | | | |
| | | As of December 31,
|
| | | 1999
| | 2000
| | 2001
| | 2002
| | 2003
|
| | | (in thousands of U.S. dollars except share and per share data) |
Balance Sheet Data: | | | | | | | | | | | | | | | | | | | | |
| Cash and cash equivalents | | | 12,913 | | | | 47,483 | | | | 20,820 | | | | 33,153 | | | | 55,508 | |
| Restricted cash | | | — | | | | 4,134 | | | | 1,274 | | | | 109 | | | | 238 | |
| Available-for-sale debt securities(4) | | | 111,612 | | | | 242,324 | | | | 346,980 | | | | 320,056 | | | | 282,145 | |
| Restricted debt securities | | | — | | | | 148,622 | | | | 134,960 | | | | 151,123 | | | | 31,109 | |
5
| | | | | | | | | | | | | | | | | | | | | |
| | | As of December 31,
|
| | | 1999
| | 2000
| | 2001
| | 2002
| | 2003
|
| | | (in thousands of U.S. dollars except share and per share data) |
| Available-for-sale equity securities | | | 5,419 | | | | 10,368 | | | | 2,064 | | | | 2,050 | | | | 590 | |
| Bank loans(5) | | | — | | | | 3,934 | | | | 118,455 | | | | 127,384 | | | | 26,826 | |
| Working capital (6) | | | 124,209 | | | | 450,391 | | | | 359,412 | | | | 340,476 | | | | 270,451 | |
| Total assets | | | 183,123 | | | | 622,920 | | | | 596,494 | | | | 580,957 | | | | 546,054 | |
| Total shareholders’ equity | | | 163,822 | | | | 512,024 | | | | 389,861 | | | | 377,700 | | | | 390,446 | |
Book value per common share | | | 1.87 | | | | 5.03 | | | | 3.80 | | | | 3.73 | | | | 3.84 | |
| | | |
| | | |
| | | |
| | | |
| | | |
| |
| | (1) | | In 2003, chinadotcom adopted new reporting segmentation, changing from the previous segmentation of e-business solutions, advertising, and sales of IT products, to the current segmentation of software and consulting services, mobile services and applications and advertising and marketing activities. In addition, chinadotcom discontinued the operations of certain subsidiaries in the software and consulting services and the advertising and marketing activities segments. In accordance with SFAS 144, Accounting for the Impairment of Disposal of Long-Lived Assets, the operating results on the discontinued operating units were retroactively reclassified as a loss from operations of discontinued subsidiaries on the consolidated statements of operations. As a result of SFAS 144, the results of the continuing operations of 1999, 2000, 2001 and 2002 were reclassified to conform to the 2003 presentation. |
| |
| | (2) | | The term “equity investees” refers to chinadotcom’s 20% to 50% owned investments other than subsidiaries. |
| |
| | (3) | | For the years 1999 to 2002, the computation of diluted earnings/(loss) per share did not assume the conversion of any issued stock options or the warrants of the company because their inclusion would have been antidilutive. |
| |
| | (4) | | Available-for-sale debt securities includes short-term and long-term debt securities available-for-sale. |
| |
| | (5) | | Bank loans include short-term and long-term bank loans. |
| |
| | (6) | | Working capital represents current assets less current liabilities. |
B. Capitalization and Indebtedness
Not applicable.
C. Reasons for the Offer and Use of Proceeds
Not applicable.
D. Risk Factors
Risks Relating to chinadotcom
Risks relating to our overall business
Because we have a limited operating history and our business model and strategy are evolving, we lack experience in our new markets and cannot assure you that we will be successful in meeting the needs of customers in these markets.
We have a limited operating history beginning in June 1997 as a pan-Asian integrated Internet company with our business model centered around our e-business solutions and advertising businesses, including e-marketing services, portal services and other media. Our business model has evolved to focus on providing enterprise software and related support services, outsourced software development and support services, advertising, SMS for mobile devices and portal services. With this new focus, our goal is to be a leading integrated enterprise solutions company offering technology, marketing and media services for companies and end users throughout Greater China (comprised of Taiwan, Hong Kong and the PRC) and the Asia-Pacific region, North America and the United Kingdom.
You will not be able to evaluate our prospects solely by reviewing our past businesses, but should consider our prospects in light of the changes in our business focus. Each of our targeted markets is rapidly changing, and we cannot assure you that we can successfully address the challenges in our new lines of business or adapt our business model and strategy to meet the needs of customers in these markets. If we fail to modify our business model or strategy to adapt to these markets, our business could suffer.
6
We have until recently a history of losses and cannot provide any assurance that we can achieve or sustain profitability.
Since inception, we have incurred net losses in each of our last four fiscal years until fiscal year 2003, in which we recorded net income. We have generated net income and incurred net losses in the last five fiscal years as follows:
| | | | | | | | | | | | | | | | | | | | | |
| | | 1999
| | 2000
| | 2001
| | 2002
| | 2003
|
| | | (in thousands of U.S. dollars) |
| Net income/(loss) | | | (18,717 | ) | | | (59,802 | ) | | | (124,385 | ) | | | (18,231 | ) | | | 15,524 | |
While we have recorded net income in the fourth quarter of 2002 and fiscal year 2003, we have continued to post losses from operations during these periods. Our operating losses may increase in the future and we may never achieve operating profitability or sustain net profitability. We may continue to incur operating losses and post net losses in the future due to several factors, including:
| | • | | additional acquisition activities related to the growth and development of our enterprise software, outsourced software development, SMS for mobile devices and portal businesses and services; |
| |
| | • | | a high level of planned operating expenditures; |
| |
| | • | | increased sales and marketing costs; |
| |
| | • | | increased investment activities; |
| |
| | • | | further decreases in the value of our prior investments, including prior Internet-related acquisitions and our publicly traded, unlisted and other marketable securities; |
| |
| | • | | greater levels of product development expenses; |
| |
| | • | | even greater competition; and |
| |
| | • | | our general business and growth objectives. |
In addition, while we experienced sequential quarterly increases in revenues in 2003, we cannot be certain that revenue growth will continue in the future. We may see a reversal of the recent growth in quarterly revenues due to several factors, including:
| | • | | a slowdown in the Asian, U.S. and other economic markets; |
| |
| | • | | the ongoing low level of expenditures in the software, Internet and media markets; |
| |
| | • | | the potential or actual loss of key clients and key personnel, including those from our software development and outsourcing, mobile service and e-marketing services businesses; |
| |
| | • | | our inability to identify or acquire suitable target companies to implement our business model and strategy and grow our business; |
| |
| | • | | our decision to exit the low-margin online network advertising business in South Korea which will cause revenues from our advertising and e-marketing businesses to decline; |
| |
| | • | | our disposal of certain subsidiaries and investments; |
7
| | • | | our decision to discontinue certain products and services; and |
| |
| | • | | the recent adverse effect on general economic conditions in Asia as a result of concerns about SARS and the avian influenza virus. |
These factors could also adversely affect our ability to sustain profitability. We cannot assure you that we will generate sufficient revenue to sustain profitability or that we can sustain or increase profitability on a quarterly or annual basis in the future. If revenue does not meet our expectations, or if operating expenses exceed what we anticipate or cannot be reduced accordingly, our business, results of operations and financial condition will be materially and adversely affected.
Our strategy of expansion through acquisitions or investments, including the proposed acquisition of Ross, and the recent acquisitions of Pivotal and IMI, has been and will continue to be costly and may not be effective, and we may realize losses on our investments.
As a key component of our business and growth strategy, we have acquired and invested in, and intend to continue to acquire and invest in, companies and assets that we believe will enhance our business model, revenue base, operations and profitability, particularly relating to our strategy in enterprise software, outsourced software development and mobile services. Recent significant acquisitions were IMI and Pivotal and Ross is a significant proposed acquisition. Our acquisitions and investments have resulted in, and will continue to result in, the use of significant amounts of cash, dilutive issuances of our common shares and amortization expenses related to certain intangible assets, each of which could materially and adversely affect our business, results of operations and financial condition.
During 2003, we were dependent upon our acquisitions for our increase in revenues, and we cannot assure you that we will be successful in increasing our revenues through organic growth of our businesses.
During 2003, we acquired several businesses material to our 2003 results for which we commenced consolidation at an interim period during the year:
| | • | | In February 2003, we acquired Praxa Limited, or Praxa, a leading Australian information technology outsourcing and professional services organization. We commenced consolidating the results of Praxa in February 2003, and Praxa contributed US$22.3 million of revenues during 2003, representing approximately 24.9% of our revenues. |
| |
| | • | | In April 2003, we acquired Newpalm (China) Information Technology Co., Ltd., or Newpalm, a leading SMS provider based in Beijing, China to deliver value added mobile services and products in China. We commenced consolidating the results of Newpalm in April 2003, and Newpalm contributed US$16.9 million of revenues during 2003, representing approximately 18.9% of our revenues. |
| |
| | • | | In September 2003, we acquired a 51% stake in Industri-Matematik International Corp., or IMI, an international provider of software to the supply chain management sector principally across Europe and the United States. We commenced consolidating the results of IMI in September 2003, and IMI contributed US$11.2 million of revenues during 2003, representing approximately 12.5% of our revenues. |
The acquisitions of Praxa, Newpalm and IMI contributed a total of approximately US$50.4 million of revenues during 2003, representing approximately 56.4% of our total revenues. Between 2002 and 2003, our revenues increased by US$45.4 million from US$44.0 million in 2002 to US$89.4 million in 2003. Excluding the impact of these acquired businesses, total revenues would have decreased by US$5.0 million during 2003 as
8
compared to 2002. As a result, during 2003, we were dependent upon our acquisitions for our increase in revenues.
While we will seek to grow our businesses, including the businesses we have acquired, organically in the future, we cannot assure you that we will be successful in increasing revenues through organic growth. Our ability to achieve organic growth in our businesses is subject to numerous risks and uncertainties, including the following:
| | - | | We may face difficulties in integrating, assimilating and managing the operations, technologies, intellectual property, products and personnel of our acquired businesses individually and cumulatively; |
| |
| | - | | We may be required to make additional new investments, increase sales and marketing efforts, provide additional training, and develop new products in order to generate organic growth, none of which may ultimately prove successful in generating such growth; |
| |
| | - | | We may not be successful in introducing products and services we acquire to new markets. For example, one of our strategies in our software and consulting services business is to target the emerging market in Greater China for applications software. However, although we acquired Pivotal Corporation, or Pivotal, in February 2004, an international customer relationship management, or CRM, company with over 1,700 customers worldwide, Pivotal does not have a single installation of its products in mainland China; and |
| |
| | - | | While with the completion of our recent acquisition of Pivotal, we have added an additional 1,700 customers to our customer base which totals approximately 2,200 worldwide, and we expect to add approximately 1,000 additional customers from our pending acquisition of Ross, we may not be successful in our strategy of leveraging upon cross-selling opportunities with respect to our expanded customer base. |
Our inability to achieve organic growth in our businesses will have a material adverse effect on our business, results of operations and financial condition.
Our acquisitions may divert management’s attention, and will require controls, procedures and policies that may increase the costs of our acquisitions and reduce employee morale.
Executing on our acquisitions may divert management’s attention from our operations both during the period of negotiation through closing and thereafter to integrate acquired businesses. In addition, to realize the benefits of our acquisitions, we need to implement operational, managerial and financial controls, procedures and policies within businesses we acquire, which may divert management’s attention further, increase transaction costs, and reduce employee morale. As a result, our acquisitions involve significant risks, including:
| | • | | incurring transaction costs that may outweigh the benefits of the acquisitions; |
| |
| | • | | financing for future acquisitions may not be available to us on favorable terms or at all; |
| |
| | • | | adequately managing the currency, interest rate and equity price fluctuations relating to our acquisitions and investments; |
| |
| | • | | retaining key employees and managing employee morale; |
| |
| | • | | facing potential claims filed by terminated employees and contractors; and |
| |
| | • | | adapting to local market conditions and business practices. |
9
Any one of these challenges could strain our management resources.
We have been expanding our business through acquisitions and may lose our entire investment if we do not successfully integrate the businesses we acquire.
We have been expanding our operations rapidly, both in size and scope, through acquisitions, and need to integrate, manage and protect our interests in the businesses we acquire. We may experience difficulties in integrating, assimilating and managing the operations, technologies, intellectual property, products and personnel of our acquired businesses individually and cumulatively, and may need to reorganize or restructure our operations to achieve our operating goals. This may include creating or retaining separate units or entities within each of our operating segments. Our failure to integrate and manage our acquired businesses successfully could delay the contribution to profit that we anticipate from these acquisitions, and could have a material adverse effect on our business, results of operations and financial condition.
Our continued international acquisitions and investments may expose us to additional regulatory and political risks, and could negatively impact our business prospects.
Our expansion throughout international markets exposes us to the following risks, any of which could negatively impact our business prospects:
| | • | | adverse changes in regulatory requirements, including export restrictions or controls; |
| |
| | • | | potentially adverse tax and regulatory consequences; |
| |
| | • | | differences in accounting practices; |
| |
| | • | | different cultures which may be relatively less accepting of our business; |
| |
| | • | | difficulties in staffing and managing operations; |
| |
| | • | | greater legal uncertainty; |
| |
| | • | | tariffs and other trade barriers; |
| |
| | • | | changes in the general economic and investment climate affecting valuations and perception of our business sectors; |
| |
| | • | | political instability and fluctuations in currency exchange rates; and |
| |
| | • | | different seasonal trends in business activities. |
A decrease in the value of our investments may lead to impairment of our goodwill and other intangible assets and have a material adverse impact on our financial condition.
As economic, market and other conditions continue to fluctuate, we have recorded in the past and may record in the future impairment losses for decreases in value of our investments and have incurred in the past and may record in the future unrealized losses in the fair value of our marketable securities. For each of the fiscal years ended December 31, 2001 and 2002, we recognized an impairment loss in an aggregate amount of US$8.1 million and US$0.3 million, respectively, for the decrease in fair value of our unlisted equity investments in which we hold interests of less than 20%, and incurred an unrealized aggregate loss of US$4.2 million and
10
US$5.1 million respectively, for the decrease in fair value of our marketable securities. For fiscal 2003, we recognized no impairment loss. On January 1, 2002, we began to apply Statement of Financial Accounting Standards, or SFAS, No. 142, which requires that goodwill and intangible assets with indefinite useful lives be reviewed annually for impairment, or more frequently if indications of impairment arise. We performed the transitional impairment test for goodwill on June 30, 2002, and the annual impairment test on December 31, 2002 and 2003, and no impairment charge was recorded during 2002 and 2003. However, we cannot assure you that we will not have to record losses due to impairment of our goodwill and intangible assets in the future. A decrease in the value of our investments may lead to impairment of our goodwill and other intangible assets and have a material adverse impact on our financial condition.
For a further discussion on our investment risk, see Item 11 — “Quantitative and Qualitative Disclosures About Market Risk”.
We have significant fixed operating expenses, which may be difficult to adjust in response to unanticipated fluctuations in revenues, and therefore could have a material adverse effect on our operations.
A significant part of our operating expenses, particularly personnel, rent, depreciation and amortization, are fixed in advance of any particular quarter. As a result, an unanticipated decrease in the number or average size of, or an unanticipated delay in the scheduling for, our engagements may cause significant variations in operating results in any particular quarter and could have a material adverse effect on operations for that quarter.
In addition, an unanticipated termination of a project or decrease in size or scope of a major engagement, or the completion of several major client engagements in any given quarter could require us to retain underutilized employees and could have a material adverse effect on our business, results of operations and financial condition.
From 2001 to 2003, our accounts receivable balances remained outstanding longer than would be expected if our credit policies were consistently enforced. While we have recently improved the collections process for accounts receivable, our financial condition and results of operations would be adversely impacted if our judgments regarding the collectibility of accounts receivable proved to be incorrect.
Generally, we offer customers in each of our business segments the following credit terms:
| | • | | For sales of IT products, “30 to 60 days credit from date of delivery of software” or “cash on delivery”; |
| |
| | • | | For sales of consulting services, “30 to 60 days credit after completion of milestones set forth in the agreement”; |
| |
| | • | | For sales in the mobile services and applications segment (a business segment introduced in 2003), “90 days credit from the date of the issuance of invoices which usually takes place one month following the month of actual sales”; and |
| |
| | • | | For sales in the advertising and marketing activities segment, “cash on delivery”, “14 days after completion of campaign” or “30 days credit”. |
In the software and consulting services segment, during 2001 and 2002, 34.3% and 40.6% of accounts receivables were outstanding greater than 60 days, respectively, aggregating US$4.7 million and US$2.8 million, respectively. Days sales outstanding in this segment were 301 and 162 days, respectively, during 2001 and 2002. During 2003, accounts receivables outstanding greater than 60 days declined to 9.3% of accounts receivable and aggregated US$1.0 million. Days sales outstanding was reduced to 78 days during 2003.
11
In the advertising and marketing activities segment, during 2001 and 2002, 50.5% and 52.8% of accounts receivables were outstanding greater than 30 days, respectively, aggregating US$5.6 million and US$5.7 million, respectively. Days sales outstanding in this segment were 224 and 148 days, respectively, during 2001 and 2002. During 2003, accounts receivables outstanding greater than 30 days declined to 43.8% of accounts receivable and aggregated only US$0.7 million. Days sales outstanding was reduced to 30 days during 2003.
In the mobile services and applications segment (a business segment introduced in 2003), during 2003, 20.3% of accounts receivables were outstanding greater than 90 days aggregating US$1.3 million. Days sales outstanding in this segment were 138 days during 2003.
As a result, during 2001 and 2002, our accounts receivables balances were outstanding longer than would be expected if our stated credit policies were consistently enforced. We attribute the inconsistency to several factors, including the following:
| | • | | The general economic downturn commencing in 2000 and continuing through 2002 which impacted in particular the internet industry and internet companies, and caused many of such companies who were our customers to experience cashflow problems and delay payments to suppliers; |
| |
| | • | | Turnover in a client’s organization whereby the new persons-in-charge did not acknowledge the original project contracts signed with us or accept the work authorized by their predecessors; |
| |
| | • | | A change of control in the customer’s organization during the project period whereby all payments were withheld and time of payment became uncertain; |
| |
| | • | | Miscommunication within a client’s organization, such as between the user department and the finance department, which resulted in partial or non-payment; |
| |
| | • | | A common business practice in China where customers delay payments beyond their due dates; and |
| |
| | • | | A common business practice in China where if a company is perceived to be “failing” or discontinuing its businesses, then debtors to the company would not settle their outstanding payments, irrespective of any contractual obligations because of a view by the debtor that the company would not have the resources or capacity to be able to collect or effectively enforce collection. |
Improvements during 2003 in the aggregate accounts receivable balances overdue, accounts receivables balances overdue as a percentage of aggregate accounts receivables, and days sales outstanding was attributable to several factors, including the following:
| | • | | Acquisition of businesses, such as IMI, that have shorter and better-managed credit terms; and |
| |
| | • | | Improvements in our collection processes. |
We have concluded, despite such inconsistencies, that the recorded accounts receivable balances are collectible based on our credit procedures, including assessing customers’ credit risk, establishing credit limits, performing credit checks when warranted, and signing contracts with all customers to establish a legal obligation to pay. In addition, we comply with the revenue recognition criteria relating to collectibility for mobile applications and advertising and marketing activities in SAB 101, for sale of IT products in SOP 97-2 paragraph 8, and for consulting services in SOP 81-1 paragraph 23.
While we have improved the collectibility of our accounts receivable and believe that our cash and cash equivalents balance of US$343 million as of December 31, 2003 should allow us to continue operations despite
12
any continued delays in collecting our accounts receivable, our financial condition and results of operations would be adversely affected in the event that our judgments regarding the collectibility of our accounts receivable proves to be incorrect.
Because we rely on local management for many of our localized enterprise software and value added mobile services businesses, our business may be adversely affected if we cannot effectively manage local officers or prevent them from acting in a manner contrary to our interests or failing to act at our direction.
In connection with our strategy to develop our enterprise software business, outsourced software development and service business, and mobile and portal businesses, we may have and may continue to acquire interests in companies in local markets where we have limited experience with operating assets and businesses in such jurisdictions, including enterprise software companies in the United States, Europe and Canada, outsourced software developers in the People’s Republic of China, or PRC, and India, and developers of value-added mobile services in Hong Kong and the PRC. As a result, we may need to rely on our local management with limited oversight. If we cannot effectively manage our local officers and management, or prevent them from acting in a manner contrary to our interests or failing to act at our direction, these problems could have a material adverse effect on our business, financial condition, results of operations and share price.
Because some of our directors and officers act in similar capacities for CIC or Xinhua News Agency, or Xinhua,, they may not be able to devote sufficient attention to us or may have conflicts of interest with us.
One of our seven directors also serves as a director of CIC. Our Vice Chairman and Chief Executive Officer also serves as an officer for CIC and beneficially owns a significant percentage of the equity of both chinadotcom and CIC. Affiliated companies of Xinhua, a significant shareholder, also own a significant percentage of CIC. Another of our directors is an executive officer of Xinhua. Because these individuals are or will be required to devote attention to CIC or Xinhua, they may be unable to devote a sufficient amount of attention to us. Furthermore, additional conflicts of interest may arise to the extent that future changes in our business model and strategy cause it to compete with CIC, Xinhua and their respective affiliates in similar industries and markets in Greater China and elsewhere in Asia. In June 1999, we entered into an agreement with CIC which limits the ability of those of our directors or officers who are also CIC directors or officers to take advantage of corporate opportunities presented to them as directors or officers of chinadotcom. There is no assurance that this agreement can be enforced effectively if it is violated against our interest.
Our shareholders may include some of our suppliers, customers and debtors, the interests of which may be in conflict with ours, and whose actions may affect our business negatively.
Our shares may be held by institutional investors, strategic shareholders, suppliers, customers, investees, guarantors and debtors. The deterioration of our relationships with any of these shareholders for any reason could cause them to dispose of their chinadotcom shares and could negatively affect our financial condition, business prospects and share price.
In addition, despite non-compete and confidentiality arrangements and other fiduciary obligations that may apply to our shareholders or directors, we cannot assure you that any such persons would not use information obtained as a result of association with us to compete against us, directly or indirectly. If such information is used to compete against us, our business, financial condition and share price could be materially and adversely affected.
We are subject to risks related to our purchase of URLs from CIC, which could materially and adversely impact our business strategy and the value of these assets in the event the value paid for the URLs was not reasonable, third parties bring claims for intellectual property infringement, third party creditors of CIC bring claims of unfair preference in the event CIC is liquidated, or we are required to record an impairment in the value of the URLs.
13
In February 2002 we completed the payment related to the purchase of three Uniform Resource Locators, or URLs, www.china.com, www.hongkong.com and www.taiwan.com, and related intellectual property rights for US$16.8 million from CIC pursuant to an agreement reached with CIC in October 2001.
While we believe that the URLs are material to our business strategy and operations, our acquisition of the URLs involves significant risks, including the following:
| | • | | While we relied upon valuations as determined by internationally recognized third party professionals, as well as commercial negotiations with CIC, we cannot guarantee that the purchase price we paid for the URLs is fair, reasonable or market value or that such fair, reasonable and market value price is readily or objectively determinable. |
| |
| | • | | Under existing intellectual property laws in various countries (such as the United States and Hong Kong), a mark that has location or geographical significance such as the URLs cannot be registered as a trademark. As a result, the purchase of the URLs may not be effective in resolving our trademark ownership concerns and we may continue to be vulnerable to intellectual property ownership and use risks, such as challenges by third parties of infringement. |
| |
| | • | | We believe that the URLs will serve an important business purpose for us for a period of 20 years, and as such we have chosen to amortize them on a straight-line basis over a period of 20 years. However, given the unique nature of the URLs and our short operating history, we cannot be assured that this time period will accurately correlate with the actual useful life of the URLs and we may need to amortize the URLs for a period longer than we can use them. |
| |
| | • | | We cannot provide any assurances that we will not have to record impairment of the value of the URLs to comply with US GAAP. |
Any of these risks could materially and adversely affect our reputation, our mobile services and advertising businesses and business prospects.
If we are unable to take advantage of opportunities to market and sell the products and services of our newly-acquired, 51%-owned subsidiary, IMI, to our customers, distribution channels and business partners in Asia, the value of our investment in IMI will be significantly diminished.
In September 2003, we acquired a 51% interest in Cayman First Tier, the holding company of IMI, an international provider of software to the supply chain management sector, in exchange for US$25.0 million to subscribe for new shares in Cayman First Tier and up to an aggregate of US$25.0 million in revolving loan facilities provided to Cayman First Tier. Symphony Technology Group, a Palo Alto, California based venture capital company holds the remaining 49% in Cayman First Tier. Cayman First Tier’s assets consist of holding through intermediate holding companies, 100% of the shares of IMI. IMI’s assets include software solutions which it has developed for retailers, wholesalers and consumer goods manufacturers, particularly in the grocery, specialty goods, and pharmaceutical and over-the-counter drugs industries.
A significant anticipated benefit of the IMI acquisition is expanding IMI’s business in the Asia Pacific region by leveraging our local expertise and distribution channels. IMI expects to take advantage of our existing customer bases and sales network in order to promote and sell IMI’s products and services to our traditional customers and business partners because IMI’s products and services target the supply chain management needs of large enterprises, including customer fulfillment and warehouse management, which is a market in which we did not previously offer a specialized enterprise software product. We believe IMI’s software will be attractive to many of our customers and partners in the manufacturing, distribution, and retail sectors, and IMI can adapt its software to integrate with the existing enterprise software products, primarily in the areas of financials, manufacturing, distribution and payroll, which we may have previously sold to our customer base.
14
The products and services of IMI are highly technical, principally servicing the supply chain management needs of large enterprises, a market in which we have limited experience, and our salespersons may not be successful in marketing IMI’s products and services. In the event that our traditional customers and business partners are not receptive to IMI’s products and services, we may not realize some of the expected benefits of our investment in IMI, and the value of our investment will be significantly diminished. In addition, while we also believe any need to adapt IMI’s products to work with a customer’s existing enterprise software products can be accomplished in a more cost-effective and time efficient manner utilizing our outsourced software development capabilities, we cannot assure you that we will be able to realize the benefits of this anticipated synergy.
We have an obligation to purchase the shares of IMI from IMI’s minority shareholder upon the occurrence of certain events which may result in the use of a significant amount of our cash or issuance of a significant number of our shares.
Symphony, which holds the remaining 49% interest in the holding company of IMI, has an option to compel us to purchase all of its 49% interest in IMI at any time during the twelve months following the occurrence of unpermitted changes in the composition of IMI’s executive committee, a decision of IMI’s executive committee being overruled by the IMI board, or modifications to the rights, powers or responsibilities of IMI’s executive committee without the approval of the directors appointed by Symphony.
The purchase price for Symphony’s interest in IMI is based on the financial performance of IMI, and is set at a fixed multiple of IMI’s annual revenues. The multiple, while subject to review, is selected based upon a formula using IMI’s revenue growth and EBITDA as a percentage of revenue. The fixed multiple varies from 0.25, in the event revenues for IMI are decreasing by greater than 10% per year and EBITDA as a percentage of revenues for IMI is less than 5%, to 6.0, in the event revenues for IMI are increasing by greater than 20% per year and EBITDA as a percentage of revenues for IMI is greater than 20%. The form of payment of the purchase price will be determined by the parties, and may consist of cash, chinadotcom common shares, a combination of cash and chinadotcom common shares, or other form of payment.
An exercise by Symphony of its option to compel us to purchase its entire 49% interest in IMI may result in the use of a significant amount of our cash or issuance of a significant number of our shares, which may have a material adverse effect on our capital resources and stock price due to actual or perceived dilution.
If we cannot or choose not to enforce the terms under which we have agreed to loan up to US$25 million to Cayman First Tier, we may face additional risks in collecting any amounts advanced to Cayman First Tier.
In addition to a US$25 million investment into Cayman First Tier, the holding company parent of IMI, as consideration for our majority 51% stake in Cayman First Tier, we provided additional consideration in the form of two loan facilities under which we have agreed to loan up to an aggregate of US$25 million. The two loan facilities, one with Cayman First, as borrower, and the second with Symphony Enterprise Solutions, S.ar.L., which is a wholly-owned subsidiary of Cayman First Tier (and unrelated to Symphony Technology Group, except through Symphony’s 49% interest in Cayman First Tier), as borrower, have substantially similar terms. Copies of the loan facilities provided by us have been filed with the Commission under cover of our Current Report on Form 6-K filed on September 15, 2003.
Proceeds of advances may be used for the following purposes:
| | • | | to acquire assets of, or equity interests in, companies that are in the business of providing software for warehousing management, logistics and distribution management, and supply chain execution; |
| |
| | • | | to provide working capital for any businesses so acquired; |
15
| | • | | to make loans and capital contributions to subsidiaries; or |
| |
| | • | | to repay a then existing loan agreement among affiliates of IMI and Foothill Capital Corporation. |
If Cayman First Tier does not use the proceeds of any loan advance for one of the approved purposes, it may not have sufficient funds to pursue acquisitions, or to improve the business of the companies it acquires which may delay or impair the ability to integrate these businesses with our other operations, which could have a material adverse effect on our business, financial condition and results of operations.
Under the loan facilities, each of the borrowers agrees that, upon our request, it will deliver to us guarantees and security agreements guaranteeing and/or securing payment of the borrower’s obligations under the loan facilities, which could include liens on the assets of the borrower and the assets and securities of subsidiaries which are acquired. We cannot assure you that any guarantees or security we receive to guarantee and/or secure payment of the borrowers’ obligations under the loan facilities will be adequate or sufficient to secure the full amount of the borrowers’ obligations in the event the borrowers are unable to make payment under the loan facilities.
In addition, the lines of credit contain other covenants typical for such facilities, including limitations on liens, limitations on debt and restrictions on sale of assets. In addition, at any time when we are no longer entitled to appoint a majority of the board of directors of IMI, the borrower is required to comply with financial covenants including maintaining minimum tangible asset value, specified EBITDA and minimum consolidated cash levels. We cannot assure you that if it is no longer entitled to appoint a majority of the board of directors of Cayman First Tier, and the borrower is required to comply with the foregoing financial covenants, that such financial covenants will be adequate or appropriate to protect its loan, or that the borrower will be able to comply with the requirements of the financial covenants.
As of March 31, 2004, US$7 million had been drawn under the line of credit between us and Cayman First Tier, and no amounts had been drawn under the line of credit between us and Symphony Enterprise Solutions, S.ar.L. (an entity unrelated to Symphony Technology Group, except through Symphony’s 49% interest in Cayman First Tier). Amounts drawn under the line of credit between us and Cayman First Tier had been used to repay amounts understanding under a Loan and Security Agreement, or Loan Agreement, among affiliates of IMI and Foothill Capital Corporation, or Foothill, as lender, so that the Foothill Loan Agreement could be terminated. In January 2003, prior to our acquisition of a majority 51% stake in Cayman First Tier, affiliates of IMI had entered into the Foothill Loan Agreement. The affiliates of IMI party to the Foothill Loan Agreement as borrowers were IMI Global Holdings Ireland Limited, IMI Holdings Ireland Limited, IMI North American Holdings Limited and Industri-Matematik, Limited, each of which is currently a wholly-owned subsidiary of Cayman First Tier. As of September 8, 2003, immediately prior to our acquisition of a 51% stake in Cayman First Tier, approximately US$6.5 million was outstanding under the Foothill Loan Agreement. The Foothill Loan Agreement contained covenants typical for such facilities, including covenants not to cause a change of control and create indebtedness with limited exceptions. The consummation of our acquisition of a majority 51% stake in Cayman First Tier conflicted with, and resulted in a default under, the Foothill Loan Agreement. Prior to our consummation of the acquisition, we discussed with Symphony their proposed transaction with Foothill, and agreed with Foothill that the Foothill Loan Agreement would be repaid reasonably soon after our consummation of the acquisition, and the Foothill Loan Agreement would be terminated. As a result, IMI did not seek to return to compliance with the covenants under the Foothill Loan Agreement after our consummation of the acquisition. On November 3, 2003, Cayman First Tier repaid all amounts outstanding under the Foothill Loan Agreement, and the agreement was terminated.
As of March 31, 2004, Cayman First Tier was in compliance with its debt covenants under the lines of credit provided by us, although no assurances can be given that Cayman First Tier will be in compliance with its debt covenants under the lines of credit in future periods. The US$7 million drawn under the line of credit between us and Cayman First Tier has been secured by a first priority pledge by Symphony in favor of us of all
16
of Symphony’s right, title and interest in Symphony’s 49% interest in Cayman First Tier. As described in the following risk factor, Symphony’s 49% interest in Cayman First Tier is also used as security in connection with a US$25 million non-recourse loan from Cayman First Tier to Symphony. The security interest granted in connection with the line of credit is senior to the security interest to secure the non-recourse loan. Other than the US$7 million drawn under the line of credit to pay the Foothill Loan Agreement and the US$25 million non-recourse loan from Cayman First Tier to Symphony, Symphony’s 49% interest in Cayman First Tier is not used as security for any other debt or loan. In the event the value of Symphony’s 49% interest in the joint venture with us in Cayman First Tier declines, we may be unable to recover the full amount owed to it under the line of credit, which may have a material adverse effect on our financial statements.
If we are unable to take advantage of opportunities to market and sell the products and services of our newly-acquired subsidiary, Pivotal, to our customers, distribution channels and business partners in Asia, we may not realize some of the expected benefits of the acquisition.
A significant anticipated benefit of the acquisition of Pivotal is expanding Pivotal’s business in the Asia-Pacific region by leveraging our local expertise and distribution channels. In particular, we believe we can cross-sell and market Pivotal’s CRM applications and implementation services (an area in which CDC Software’s existing product offerings have limited functionality), in growth markets for such software in Asia where CDC Software has an established China presence. In the event that we cannot adapt the Pivotal products to the needs of the local markets or if our traditional customers and business partners are not receptive to Pivotal’s products and services, we may not realize some of the expected benefits of the acquisition of Pivotal, which may adversely affect our business and financial condition.
Risks relating to our software and consulting services business
As we pursue our strategy of developing our enterprise software business, we are exposed to a variety of risks in this market that may affect our ability to generate revenues from the sale of enterprise application software and related support services.
As we pursue our strategy of developing our enterprise software business, we anticipate that we will generate additional revenues in the future from the sale of various enterprise software application packages and related services. Accordingly, any factor that adversely affects fees derived from the sale of such systems would have a material adverse affect on our business, results of operations and performance. For example, the market for enterprise software application products was negatively impacted in 1999 and the first half of 2000 by Year 2000 concerns. Similarly, in 2001 and continuing through most of 2003, the market for enterprise software application products continued to be negatively impacted by challenging economic conditions in the United States. Other such factors may include:
| | • | | competition from other products; |
| |
| | • | | flaws in our products; |
| |
| | • | | incompatibility with third party hardware or software products; |
| |
| | • | | negative publicity or valuation of our products and services; and |
| |
| | • | | obsolescence of the hardware platforms or software environments on which our products run. |
The market for enterprise software application products and services is highly competitive. We have entered this market recently, and if we fail to compete effectively, our failure could, have a material adverse effect on our business, financial condition and results of operations.
17
The business information systems industry in general and the enterprise software industry in particular are very competitive and subject to rapid technological change. Many of our current and potential competitors have longer operating histories, significantly greater financial, technical and marketing resources, greater name recognition, larger technical staffs and a larger installed customer base than we do. A number of companies offer products that are similar to our products and that target the same markets. In addition, many of these competitors may be able to respond more quickly to new or emerging technologies and changes in customer requirements, and to devote greater resources to the development, promotion and sale of their products than we can. Furthermore, because there are relatively low barriers to entry in the software industry, we expect additional competition from other established and emerging companies. Such competitors may develop products and services that compete with our products and services or may acquire companies, businesses and product lines that compete with us. It is also possible that competitors may create alliances and rapidly acquire significant market share. Accordingly, we cannot assure you that our current or potential competitors will not develop or acquire products or services comparable or superior to those that we develop, combine or merge to form significant competitors or adapt more quickly than we can to new technologies, evolving industry trends and changing customer requirements. Competition could cause price reductions, reduced margins or loss of market share, any of which could materially and adversely affect our strategy in this market, and affect our business, operating results and financial condition.
We are focused on building our intellectual property asset base, establishing partnerships with software vendors and broadening the overall software product offerings in the areas of enterprise solutions and integration. We are pursuing this strategy through acquisitions, strategic partnerships, joint ventures, consolidation of software assets and restructurings, or combinations of the foregoing approaches. We cannot assure you that we will be able to successfully implement this strategy or that the strategy will prove successful.
The overall market for our consulting services business remained relatively weak during the first half of 2003. While there did appear to be some increase in activity in the second half of the year, demand may remain weak for some time because of the current economic climate, which could lead to cancellations or delays in business and technology consulting initiatives adversely affecting our business and growth prospects.
The market for consulting services has changed rapidly over the last several years. Since the second half of 2000, many companies have experienced financial difficulties or uncertainty, and canceled or delayed spending on technology initiatives as a result. These companies typically are not demonstrating the same urgency regarding technology initiatives that existed during the economic expansion that stalled in 2000. If large companies continue to cancel or delay their business and technology consulting initiatives because of the current economic climate, or for other reasons, our business, results of operations and financial condition and results of operations may be materially and adversely affected.
A substantial amount of our consulting revenues are billed on a fixed price basis which may be subject to cost overruns if we do not accurately estimate the costs of these engagements or if clients change the scope of a project.
A substantial percentage of our consulting engagements consists of individual, non-recurring, short-term projects billed on a fixed price basis as distinguished from a method of billing on a time and materials basis. At times this requires us to commit unanticipated additional resources to complete consulting engagements, which may result, and has in the past resulted, in losses on certain engagements. Our failure to obtain new consulting business in any given quarter or estimate accurately the resources and time required for a consulting engagement, to manage client expectations effectively regarding the scope of the services to be delivered for the estimated fees or to complete fixed price engagements within budget, on time and to clients’ satisfaction (particularly if a client changes the scope of the project) could
18
expose us to risks associated with cost overruns and penalties, any of which could have a material adverse effect on our business, results of operations and financial condition.
Our clients could unexpectedly terminate their contracts for our services which could result in a loss of expected revenues and additional expenses for redeployment of staff and resources.
The standard terms for many of our consulting services contracts include a down payment of 30% of the fee at the commencement of the contract with the balance of the payments subject to the achievement of specific milestones and deliverables. We generally do not require collateral for accounts receivable. The final payment is not due until completion of successful user acceptance testing. However, most of our consulting services contracts can be cancelled by the client with limited advance notice and without significant penalty. Termination by any client of a contract for our services could result in a loss of expected revenues, additional expenses for redeployment of staff and resources that were allocated to the terminated engagement, and underutilized employees and resources. The unexpected cancellation or significant reduction in the scope of any of our large projects could have a material adverse effect on our business, results of operations and financial condition.
Our service contracts may expose us to potential litigation and liabilities.
Our consulting services and advertising businesses involve services agreements with customers, some of which do not have disclaimers or limitations on liability for special, consequential and incidental damages, or do not have caps or have relatively high caps on the amounts its customers can recover for damages. Some of our subsidiaries do not carry professional indemnity or other insurance covering our exposure to any liability for any claims or breaches under the customer contracts. While there are no current claims or litigation in connection with the service contracts, there can be no assurance that future claims will not arise. Any claim under customer contracts could subject us to litigation and give rise to substantial liability for damages, including special, consequential or incidental, that could materially and adversely affect our business and financial condition.
Failure by our third party suppliers to provide us with software and hardware components will affect our ability to operate our business.
We depend on third party suppliers of software and hardware components. For our various business units, we rely on components that are sourced from key suppliers, including Best Software, Inc., Cisco Systems, Inc., International Business Machines Corporation, LSI Logic Corporation, Microsoft Corporation, Network Appliance, Inc., Oracle Corporation, Siebel Systems Inc., Sun Microsystems Corporation and Vignette Corporation. Any failure or delay on the part of our suppliers may prevent us from receiving the components, products and support we need to conduct our operations. Our inability to develop alternative sources for the software and hardware we need to operate our business may materially and adversely affect our operating efficiency and results of operations.
Timing differences between when we are obligated to pay our vendors for our purchase of software products from them and the time we are paid by our customers for the software products we resell to them exposes us to credit risks, which may adversely affect our business and results of operations.
In connection with our sale of software products and enterprise software, we may purchase such products from vendors and then resell to customers. Typically, the payment terms for the third party software are 60 days from the date of invoice, but in some cases payment may be required upon delivery. If the customers do not pay the full amount invoiced by us, which may occur if a customer files for bankruptcy among other circumstances, we may not collect sufficient funds from customers to cover the original cost of the third party software that we have already purchased. In addition, if we cannot collect funds from our customers in a timely manner, which may occur if a customer is experiencing cashflow issues among other circumstances, we may not
19
generate sufficient cashflows to cover the original purchase price of third-party products. These credit risks may adversely affect our business and results of operations.
Our failure to successfully to introduce, market and sell new products and technologies, enhance and improve existing products in a timely manner, and properly position or price our products, as well as undetected errors or delays in new products or new versions of a product or the failure of anticipated market growth could individually and/or collectively have a material adverse effect on our business, results of operations or financial position.
Our IT and enterprise software products compete in a market characterized by rapid technological advances in hardware and software development, evolving standards in computer hardware and software technology and frequent new product introductions and enhancements. We continually seek to expand and refresh our product offerings to include newer features or products, and enter into agreements allowing integration of third-party technology into our products. The introduction of new products or updated versions of continuing products has inherent risks, including, but not limited to:
| | • | | product quality, including the possibility of software defects, which could result in claims against us or the inability to sell our software products; |
| |
| | • | | the fit of the new products and features with the customer’s needs, which could result in the customer seeking the product elsewhere; |
| |
| | • | | the successful adaptation of third-party technology into our products, which may result in the failure of our product to perform at its maximum potential; |
| |
| | • | | educating our sales, marketing and consulting personnel to work with the new products and features, which may strain our resources; |
| |
| | • | | competition from earlier and more established entrants that may have more significant resources than us; |
| |
| | • | | market acceptance of initial product releases; |
| |
| | • | | marketing effectiveness; and |
| |
| | • | | the accuracy of assumptions about the nature of customer demand, whereas actual demand could be limited or non-existent. |
Additionally, as newer products are deployed, our service and maintenance organizations, along with our partners, will have to rapidly increase their ability to install and service these products, and we must rapidly improve our products’ ease-of-implementation and ease-of-use. Our failure to successfully increase these capacities and make these improvements could result in significantly lower customer satisfaction, which could lead to lower license revenue.
Failure to upgrade older products will adversely affect our software revenue.
As we or our competition introduce newer products, the market’s demand for our older products declines. Declining demand reduces revenue from additional licenses and reduces maintenance revenue from past purchasers of our software. We must continually upgrade our older products in order for our customers to continue to see value in our maintenance services. If we are unable to provide continued improvements in functionality or move customers with our older products to our newer products, declining maintenance and new license revenue from older products could have a material adverse effect on our enterprise software business.
20
If we are unable to develop new and enhanced products that achieve widespread market acceptance, we may be unable to recover product development costs, and our earnings and revenue may decline.
Our future success depends on our ability to address the rapidly changing needs of customers by developing and introducing new products, product updates and services on a timely basis. We must also extend the operation of our products to new platforms and keep pace with technological developments and emerging industry standards. We commit substantial resources to developing new software products and services. If the markets for these new products do not develop as anticipated, or demand for our products and services in these markets does not materialize or materializes later than we expect, we will have expended substantial resources and capital without realizing sufficient revenue, and our enterprise software business and operating results could be adversely affected.
Our enterprise software revenues and operating results fluctuate significantly from quarter to quarter which may cause volatility in our share price.
Many factors have caused and may in the future cause our enterprise software revenue and operating results to fluctuate significantly. Some of these factors are:
| | • | | the timing of significant orders, delivery and implementation of products; |
| |
| | • | | the gain or loss of any significant customer; |
| |
| | • | | the number, timing and significance of new product announcements and releases by us or our competitors; |
| |
| | • | | our ability to acquire or develop (independently or through strategic relationships with third parties), introduce and market new and enhanced versions of our products on a timely basis; |
| |
| | • | | possible delays in the shipment of new products and purchasing delays of current products as our customers anticipate new product releases; |
| |
| | • | | order cancellations and shipment rescheduling or delays; |
| |
| | • | | patterns of capital spending and changes in budgeting cycles by our customers; |
| |
| | • | | market acceptance of new and enhanced versions of our products; |
| |
| | • | | changes in the pricing and the mix of products and services we sell; |
| |
| | • | | seasonal variations in our sales cycle; |
| |
| | • | | the level of product and price competition; |
| |
| | • | | changes in operating expenses; |
| |
| | • | | exchange rate fluctuations; |
| |
| | • | | the timing of any acquisitions and related costs; and |
| |
| | • | | changes in personnel and related costs. |
In addition, we expect that a substantial portion of our enterprise software revenues will continue to be derived from renewals of maintenance contracts from customers of our software applications. These maintenance contracts typically expire on an annual basis, and the timing of cash collections from related revenues varies
21
from quarter to quarter. In addition, our new license revenue and results of operations may fluctuate significantly on a quarterly and annual basis in the future, as a result of a number of factors, many of which are beyond our control. A sale of a new license generally requires a customer to make a purchase decision that involves a significant commitment of capital. As a result, the sales cycle associated with the new license revenue will vary substantially and will be subject to a number of factors, including customers’ budgetary constraints, timing of budget cycles and concerns about our pricing or introduction of new products by us or our competitors.
Risks relating to our mobile services and applications and portal businesses
We depend on the two mobile network operators in China for delivery of our mobile services and applications, and the termination or alteration of our various contracts with either of them or their provincial or local affiliates could materially and adversely impact our business.
We offer our mobile services and applications to consumers through the two mobile network operators in China, China Mobile and China Unicom, which service nearly all of China’s approximately 282.3 million mobile subscribers, as estimated by China’s MII. Such dominant market position limits our negotiating leverage with these network operators. If our various contracts with either network operator are terminated or adversely altered, it may be impossible to find appropriate replacement operators with the requisite licenses and permits, infrastructure and customer base to offer our services, and our business would be significantly impaired. For the year ended December 31, 2003, we derived approximately 18.9% of our total revenues from sales made through the network operators and are, therefore, particularly dependent on them.
Delivery of our mobile services and applications is governed by contracts between us and the national, provincial or local affiliates of China Mobile and China Unicom. Each of these contracts is nonexclusive and has a limited term (generally one or two years). We usually renew these contracts or enter into new ones when the prior contracts expire, but on occasion the renewal or new contract can be delayed by periods of one month or more. The terms of these contracts vary, but the network operators are generally entitled to terminate them in advance for a variety of reasons or, in some cases, for no reason in their discretion. For example, several of our contracts with the network operators can be terminated if:
| | • | | we fail to achieve performance standards established by the applicable network operator from time to time; |
| |
| | • | | we breach our obligations under the contracts, which include, in many cases, the obligation not to deliver content that violates the network operator’s policies and applicable law; |
| |
| | • | | the network operator receives high levels of customer complaints about our mobile applications or services; or |
| |
| | • | | the network operator sends us written notice that it wishes to terminate the contract at the end of the applicable notice period. |
We may also be compelled to alter our arrangements with these mobile network operators in ways which materially and adversely affect our business. China Mobile and China Unicom have unilaterally changed their policies as applied to third party service providers in the past, and may do so again in the future. For example, China Mobile banned all cooperative arrangements known as “SMS Website Unions” in July 2003, effectively precluding large service providers from aggregating unregistered websites and utilizing China Mobile’s billing platform to gather fees for these services. In August 2003, China Mobile further banned service providers from using its network to charge customers for services which were deemed by it to be not purely wireless services. Although we were not engaged in these activities and, therefore, these particular policy changes did not impact our business, we may not be able to respond adequately to negative developments in our contractual
22
relationships with China Mobile and China Unicom in the future because we are not able to predict any unilateral policy changes.
China Mobile and China Unicom have imposed penalties on chinadotcom for technical breaches and irregularities in the provision of services to users. If penalties are imposed in the future, chinadotcom’s business and financial results could be materially adversely affected.
In the first quarter of 2004, China Mobile and China Unicom imposed penalties, in the form of fines, on chinadotcom for certain technical breaches and irregularities in chinadotcom’s provision of services to certain of their mobile users. While chinadotcom has taken steps to prevent a reoccurrence of these technical breaches and irregularities, there can be no assurance that additional technical breaches and irregularities will not occur resulting in further penalties and/or fines imposed by China Mobile and China Unicom. Such penalties and/or fines could have a material adverse effect on chinadotcom’s operation and financial result.
Our business could be adversely affected if China Mobile or China Unicom or both begin providing their own mobile applications and services.
Our mobile business may be adversely affected if China Mobile or China Unicom or both decide to terminate our existing revenue-sharing relationship and begin providing their own mobile services and applications to subscribers. In that case, we would not only face enhanced competition, but could be partially or fully denied access to their networks.
If China Mobile or China Unicom blocks our access to their mobile networks or their billing and collection systems, our mobile business could be discontinued.
We rely exclusively on China Mobile and China Unicom, and their respective provincial and local affiliates, for access to our subscribers over their mobile networks and for revenues collected through their billing and collection systems. Currently, there are no other mobile network operators in China. If China Mobile, China Unicom or any of their affiliates blocks our access to their mobile networks or limits our services, we may be unable to find a reliable and cost-effective replacement in a timely manner upon acceptable terms, if at all. If one or more of these events occurs, our mobile services and applications business would not be viable and we may need to discontinue such business.
If China Mobile or China Unicom fails to bill their customers or to provide billing confirmations for our mobile services and applications, our mobile services and applications revenues could be significantly reduced.
We depend upon China Mobile and China Unicom to maintain accurate records of the fees paid by users and their willingness to pay us. Specifically, the network operators provide us with monthly statements that do not provide itemized information indicating for which mobile services and applications the network operator has collected fees. As a result, monthly statements that we have received from the network operators cannot be reconciled to our internal records on a segmented basis. In addition, access to the network operators’ internal billing and collection records is subject to the discretion of such operators; we have only limited means to verify the information provided to us independently. Our mobile services and applications revenues could be significantly reduced if these network operators miscalculate the revenues generated from our mobile services and applications and our portion of those revenues.
Our mobile services and applications revenues are affected by billing and transmission failures which are often beyond our control.
We do not collect fees for delivery of our mobile services and applications from China Mobile and China Unicom in a number of instances, including if:
23
| | • | | the delivery of our mobile services and applications to a subscriber is prevented because his or her mobile phone is turned off for an extended period of time, the customer’s prepaid phone card has no value or the subscriber has ceased to be a customer of the applicable network operator; |
| |
| | • | | China Mobile or China Unicom experiences technical problems with its network which prevent the delivery of our mobile services and applications to the subscriber; |
| |
| | • | | we experience technical problems with our technology platform that prevents delivery of our mobile services and applications; or |
| |
| | • | | the subscriber refuses to pay for our mobile services and applications due to quality or other problems. |
These situations are known in the mobile services and applications industry as billing and transmission failures. We do not expect to recover revenues that are lost due to billing and transmission failures. The failure rate can vary among network operators, and by province, and also have fluctuated significantly in the past. For example, for the year ended December 31, 2003, the average monthly transmission failure rate ranged from 10% to 30%. We do not have any agreements with the mobile operators that provide that if such differences are greater than a fixed percentage, we have the right to adjust the differences. The mobile operators have absolute discretion in the adjustment of any difference. Any significant billing and transmission failures therefore will significantly lower our recorded revenues.
Because China Mobile and China Unicom do not provide information showing revenues and transmission information on a service-by-service basis, we can only estimate our actual revenues by service type.
China Mobile’s and China Unicom’s monthly statements to service providers regarding mobile services and applications delivered through their networks currently do not contain revenues and billing and transmission failure information on a service-by-service basis. Although we maintain our own records reporting the mobile services and applications provided, we can only estimate the actual revenues by service type because we are unable to confirm which services were transmitted but resulted in billing and transmission failures. As a result, we are unable to calculate and monitor service-by-service revenues, margins and other financial information, such as average revenue per user by service and total revenues per user by service, with precision to allow us to accurately determine which of our mobile services and applications are or may be profitable.
China Mobile and China Unicom may impose higher service or network fees if we are unable to satisfy customer usage and other performance criteria, thereby reducing our mobile services and applications revenues.
Fees for our mobile services and applications are charged on a monthly subscription or per use basis. Based on our contractual arrangements, we rely upon China Mobile and China Unicom for both billing of, and collection from, subscribers of fees for our mobile services and applications.
China Mobile and China Unicom generally charge us service fees of 15% and 12% of the revenues generated by our mobile services and applications, respectively. To the extent that the number of messages sent by us over China Mobile’s network exceeds the number of messages our subscribers send to us, we must pay per message channel fees, which decrease in several provinces as the volume of customer usage of our mobile services and applications increases. The number of messages sent by us will exceed those sent by our subscribers, for example, if the subscriber sends us a single message to order a game but we must send that subscriber several messages to confirm his or her order and deliver the game itself. Any increase in China Mobile’s or China Unicom’s network fees and service charges could reduce our gross margins.
24
China Mobile and China Unicom may not authorize our mobile services and applications to be offered on their networks if we fail to achieve minimum customer usage, revenues and other criteria, thereby adversely affecting our mobile services and applications revenues.
Our business could be adversely affected if we fail to achieve minimum customer usage, revenues and other criteria imposed or revised by China Mobile and China Unicom at their discretion from time to time. China Mobile and China Unicom, through their provincial and local offices, have historically preferred to work only with a small group of the best-performing mobile services and applications providers, based upon the uniqueness of the service offered by each provider, total number of subscribers, usage and revenues generated in the applicable province or municipality, the rate of customer complaints, and marketing expenditures in the applicable province or municipality.
For example, China Mobile has recently been increasing its promotion of STK cards, which are semiconductor chips for mobile phones that have the services of various third-party service providers preselected by the network operators’ provincial or municipal offices embedded on the chip. Generally, the services of a limited number of service providers are embedded on the STK card, with the selection based on the quantitative criteria referenced above. While several of our mobile services and applications have been selected by ten of the provincial and municipal China Mobile offices (out of a total of 31 that offer STK cards) for inclusion on their STK cards, the remaining provinces and municipalities have either not launched STK cards or have not selected us for inclusion on their STK cards.
In the future, we may fail to meet the then-current performance criteria that network operators in these or other provinces or municipalities set from time to time. In any such case, our mobile services and applications could be excluded from those cards or from their entire networks at a national, provincial or municipal level, or we could be precluded from introducing new services, which would adversely affect our revenues and growth prospects.
Our mobile services and applications and their pricing are subject to approval by China Mobile and China Unicom, and if requested approvals are not granted in a timely manner, our mobile services and applications business could be adversely affected.
We must obtain approval from China Mobile and China Unicom with respect to each mobile service or application that we propose to offer to their subscribers and the pricing for such mobile service or application. In addition, any changes in our existing mobile services and applications as well as the pricing of such services and applications must be approved in advance by these network operators. No assurance can be given that such approvals will be granted in a timely manner or at all. Moreover, under some of our contracts with the network operators, we cannot change prices more than once every six months or charge prices outside a fixed range. Failure to obtain, or a delay in, obtaining such approvals could place us at a competitive disadvantage in the market and adversely affect our mobile services and applications business.
We rely heavily on certain regions in China for a significant share of our mobile services and applications revenues. An economic downturn or any loss of our contracts with mobile operators in these provinces could have a material adverse effect on our results of operations.
A significant portion of our revenues from mobile services and applications are derived from Shanghai and the provinces of Shandong, Jiangsu, Guangdong and Zhejiang in China. Customers in these regions accounted for 55.8% of our total mobile services and applications revenues for the year ended December 31, 2003. As such, our results of operations are susceptible to changes in the economies of these regions. An economic downturn in any one of these regions, or our failure to renew our contracts with either China Mobile or China Unicom in any one of these regions, could reduce our mobile services and applications revenues.
25
If other new mobile operators gain a significant share of the mobile market in China, we will need to establish new arrangements with those mobile operators and if we fail to do so, our mobile services and applications business may suffer.
The success of our mobile data business depends on our relationship with China’s mobile operators. Currently, China Mobile and China Unicom are the only companies permitted to provide mobile services in China. If the PRC government further opens the mobile market in China to allow greater competition, we may need to establish new arrangements with new market entrants in order to continue to provide our mobile services. We may not succeed in establishing such new arrangements, and our failure to do so may limit access to our mobile services, thereby causing our business to suffer.
If we fail to keep pace with changes in mobile technology, our competitive position and ability to generate revenues could be adversely affected.
Our current value-added mobile services focus on SMS, but mobile technology is changing rapidly to support multi-media messaging services, mobile e-commerce, music and image downloads, and other complex services. We are developing new mobile related products and services, and the success of our new products and services is subject to risks and uncertainties. For example, technical, operational or distribution problems could delay or prevent the introduction of our new products or services. We can provide no assurance that our new products and services will achieve widespread market acceptance or generate meaningful revenue. If we fail to introduce new products and services that offer the latest mobile technology, our competitive position and our ability to generate new revenues could be compromised.
Our portal business depends substantially on third party content providers and may be adversely affected if we are unable to maintain existing arrangements with these content providers.
We rely on third parties to create traffic and provide content for our portal network to make it more attractive to advertisers and consumers. Our content providers include Xinhua, a major shareholder of chinadotcom, as well as commercial content providers and our registered community members. If Xinhua or these third parties fail to provide us with high quality content, our portal network could lose viewers, subscribers and advertisers and our revenue from these sources would decrease. Our existing relationships with Xinhua and other commercial content providers are not exclusive and may not result in sustained business partnerships or successful service offerings or sustained traffic on our portal network or future revenues.
Our mobile and portal business could be materially adversely affected if the current ownership structure of our Chinese companies that hold the ICP licenses is challenged by the PRC authorities.
The PRC government has imposed foreign ownership restrictions and prohibitions on Internet content and telecommunications operations. PRC laws and regulations require all Internet portal and mobile portal operators to obtain an Internet content provider, or ICP, license before they may operate the portals in China. Under current PRC regulations, ICP license holders must be PRC nationals or domestic PRC companies. As a result, we cannot be the legal owner of such ICP licenses, which are necessary to operate our mobile and portal businesses in China. Currently, Newpalm’s ICP licenses are held by two PRC companies, Beijing New Palm Technology Co., Ltd. and Beijing Wisecom Technology Co., Ltd. However, the two PRC individuals that own 100% of the shares of these companies have entered into certain trust deed arrangements with our indirect subsidiary, hongkong.com Limited. Under these arrangements, the two PRC individuals are trustees or nominees of hongkong.com Limited and may only act at its direction. Similar deed of trust arrangements have been entered into between certain PRC individuals and our indirect subsidiary, chinadotcom Portals Limited, in connection with the ICP license for the www.china.com portal.
Due to the uncertainties relating to the interpretation and application of telecommunications and Internet legislation in China, the PRC authorities could, at any time, assert that any part of our existing or future business,
26
or the ownership of the PRC companies and their ICP licenses through the trust deed arrangements, violate PRC laws or regulations. If we are found to be in violation of any PRC law or regulation, the relevant authorities would have broad discretion in imposing penalties, which could include one or more of the following:
| | • | | levying of fines; |
| |
| | • | | compulsory disgorgement of income for both current and past periods; |
| |
| | • | | revocation of our ICP or business license; |
| |
| | • | | closure or suspension of our China operations; and |
| |
| | • | | compulsory restructuring of our China operations or licensing arrangements. |
Any of these actions may disrupt our services in China, may harm our reputation and could have a material adverse effect on our portal and mobile operations in China. In particular, if any of these ICP licenses are revoked or terminated, our Internet content and mobile operations in China that are dependent on such licenses will be discontinued, which will have a material adverse effect on our results of operation and financial condition.
Our business could be materially adversely affected if we cannot provide effective operational control of our mobile and portal business due to the current ownership structure of our Chinese companies.
We rely upon certain PRC individuals as the legal owners of the PRC companies that hold the ICP licenses, which are necessary to operate our Internet and mobile businesses in China. Although our indirect subsidiaries are the beneficial owners of these PRC companies and such PRC individuals may be our directors or employees, the rights provided in these trust arrangements are contractual in nature and do not guarantee the necessary operational control. If our trustees fail to perform their obligations, the contractual remedies available in jurisdictions outside China may not provide us with effective control over these PRC companies due to the uncertainty of enforcing foreign judgments or arbitral awards in China. The loss of effective control over our China operations and licensing would significantly harm our portal and mobile businesses in China.
If we are held liable for claims based on information originating from our portal network or communicated through our SMS products, we may incur significant costs contesting such claims or paying damages.
We may face liability for defamation, negligence, copyright, patent or trademark infringement and other claims based on the nature and content of information originating from our portal network or communicated through our SMS products. Such information could include content and material posted by our registered community members on our message boards, online communities, voting systems, e-mail or chat rooms. By providing technology for hypertext links to third-party websites, we may be held liable for copyright or trademark violations by those third-party sites. Third parties could assert claims against us for losses incurred in reliance on erroneous information distributed by us. Users of our web-based e-mail or SMS could seek damages for:
| | • | | unsolicited e-mail or SMS messages; |
| |
| | • | | lost or misplaced messages; |
| |
| | • | | illegal or fraudulent use of e-mail or SMS messages; or |
| |
| | • | | interruptions or delays in service. |
27
We do not carry liability insurance to cover potential claims of this type. We may incur significant costs in investigating and contesting these claims. Any judgment, fine, damage awards or liability imposed on us could significantly increase our costs. Moreover, our reputation may suffer as a result of these claims, which could reduce traffic on our portal network or reduce our revenues.
If the PRC government considers our existing licensing structures to be insufficient in meeting compliance requirements with applicable licensing restrictions, or if we fail to comply with changes to these requirements or restrictions, our portal and mobile applications businesses could be materially adversely affected.
The PRC government regulates access to the Internet by imposing strict licensing requirements on Internet service providers, or ISPs. Generally, the provision of different types of infrastructure telecommunication services and value-added telecommunication services is subject to different licensing regimes in the PRC. In April 2003, a new regulation was promulgated by MII in connection with the categorization of each kind of telecommunication business.
While we believe that our current operation complies with all existing PRC laws, rules and regulations, there are substantial uncertainties regarding the interpretation of current Internet laws and regulations. It is possible the PRC government may take a view contrary to ours because there are no well established precedents or clear judicial interpretations to support our interpretations and views of the laws, rules and regulations. Issues, risks and uncertainties relating to PRC government regulation of China’s Internet sector include:
| | • | | recently enacted regulations applying to Internet-related services and telecom-related activities. While many aspects of these regulations remain unclear, they purport to limit and require licensing of various aspects of the provision of Internet information services. If these regulations are interpreted to preclude our current ownership structure or business model, our portal and mobile applications businesses could be severely impaired; and |
| |
| | • | | the activities of ICPs are subject to regulation by various PRC government authorities depending on the specific activities conducted by the ICP as stated by the MII. Various government authorities have enacted several new laws and regulations that govern these activities. The areas of regulation currently contemplated include: |
| | • | | online advertising; |
| |
| | • | | online news reporting; |
| |
| | • | | online publishing; |
| |
| | • | | online securities trading; |
| |
| | • | | online gaming; |
| |
| | • | | online broadcasting; |
| |
| | • | | bulletin board service; and |
| |
| | • | | the provision of industry-specific information (e.g., pharmaceutical products) over the Internet, etc. |
Other aspects of our online operations may be subject to regulation in the future.
In addition to the regulations promulgated by the PRC national government, some local governments, such as the Beijing local government, have also promulgated local rules applicable to Internet companies
28
operating within their respective jurisdictions. These local rules may also create additional barriers in relation to the operation of our business.
If we fail to establish and maintain relationships with content providers and mobile network operators, we may not attract or retain users.
We rely on a number of third party relationships to attract traffic and provide content to make our portals more attractive to advertisers and consumers. Most of these arrangements are not exclusive and are short-term or may be terminated at the convenience of the other party. We cannot assure you that our existing relationships will result in sustained business partnerships, successful service offerings, significant traffic or significant revenues. In addition, much of the third party content provided to our portal is also available from other sources or may be provided to other companies. If our competitors present the same or similar content in a superior manner, it would adversely affect our visitor traffic.
The dividends and other distributions on equity we may receive from our subsidiaries or other payments we may receive from Beijing Newpalm or Beijing Wisecom are subject to restrictions under PRC law or agreements that these entities may enter into with third parties.
We are a holding company. Our subsidiaries hongkong.com Corporation, or hongkong.com, hongkong.com Limited and Newpalm entered into contractual arrangements with Beijing Newpalm and Beijing Wisecom. We conduct our mobile services and applications business activities and receive substantially all of our revenues from this business in the form of service fees through Beijing Newpalm and Beijing Wisecom. We rely on dividends and other distributions on equity paid by our subsidiaries and service fees from Beijing Newpalm and Beijing Wisecom for our cash requirements in excess of any cash raised from investors and retained by us. If any of our subsidiaries incurs debt in the future, the instruments governing the debt may restrict their ability to pay dividends or make other distributions to us. In addition, PRC law requires that payment of dividends by our subsidiaries that are incorporated in China can only be made out of their net income, if any, determined in accordance with PRC accounting standards and regulations. Under PRC law, those subsidiaries are also required to set aside a portion, up to 10% of their after-tax net income each year to fund certain reserve funds, and these reserves are not distributable as dividends. Any limitation on the payment of dividends by our PRC subsidiaries could have a material adverse effect on our ability to grow, fund investments, make acquisitions, pay dividends, and otherwise operate our mobile services and applications business.
For a more detailed discussion regarding our arrangements with Beijing Newpalm and Beijing Wisecom, see Item 4.C — “Information on the Company — Organizational Structure — Our PRC Corporate Structure”.
Risks relating to our advertising and marketing business
We are seeking to re-orient our advertising strategy, and have significantly reduced operations in online advertising and e-marketing services and cannot assure you that we will be successful in generating revenues or margins from our reoriented advertising strategy sufficient to replace revenues and margins from our reduced online advertising and e-marketing services businesses.
We are seeking to re-orient our advertising strategy away from online advertising and e-marketing services with low margins performed for a fixed fee which rely upon short-term advertising campaigns dependent upon high volume to higher margin database marketing related services used to develop targeted campaigns for clients. In our experience, margins from online advertising and e-marketing services range from 20% to 30% versus margins in database marketing related services which range from 50% to 70%. We cannot assure you that we will be successful in generating sufficient revenues or margins from our database marketing related services to replace revenues and margins from our reduced online advertising and e-marketing services business.
29
Our strategy to target higher margin database marketing related services through our subsidiary, Mezzo Business Databases Pty Limited, or Mezzo Business, which generated only a small portion of our advertising revenues in 2003, is subject to numerous risks, may not be successful, and could therefore limit the amount of advertising revenues we can generate.
Our re-oriented advertising strategy is to target higher margin database marketing related services utilizing data mining techniques. Data mining involves the process of analyzing significant amounts of data retained in a database to uncover underlying patterns that may indicate trends or relationships, and has become a more important part of CRM, as a method to better understand customer behavior and preferences. The uncovered relationship can then be utilized by a client to develop a targeted customer campaign. Database marketing related services generated only a small portion of our advertising revenues in 2003, and is subject to numerous risks, including the following:
| | • | | we may not be able to successfully market services in this business segment outside of Australia where most of the businesses providing these services are currently located; |
| |
| | • | | we may not be able to attract larger clients with correspondingly larger marketing budgets due to the limited size and scope of our currently operational base in Australia; |
| |
| | • | | we may not be able to compete against other companies in this business segment which may have or develop better quality data sets and related products and services than ours; |
| |
| | • | | we may not be able to successfully migrate, if necessary, our current data sets, products and services to other technology formats in the future; |
| |
| | • | | we may not be able to effectively manage Mezzo Business if the founder and current general manager leave the business at the conclusion of the earn-out period on June 30, 2004; and |
| |
| | • | | we may suffer reductions in revenues and profits in the future as a result of any changes in privacy related legislation that could reduce the distribution potential of our databases. |
Our re-oriented advertising strategy depends upon Mezzo Business’s ability to maintain up-to-date databases. If Mezzo Business fails to maintain its databases, its services will be less attractive to customers, and our prospects relating to our advertising business will be adversely affected.
Our re-oriented advertising strategy depends upon the ability of Mezzo Business, to maintain up-to-date data sets. If Mezzo Business fails to maintain its databases, its services will be less attractive to customers. The ability of Mezzo Business to maintain its databases can be affected by governmental actions in Australia, as well as actions by third parties to protect their proprietary rights, although Mezzo Business is not aware of any current prohibitions which would prohibit its ability to maintain its databases. For example:
| | • | | The Australian government has moved to restrict the use of publicly available telephone data in the Integrated Public Number Database for both consumers and business. While Mezzo Business believes that such governmental action will not impact its results of operations because such data has not historically been used as a data source, restrictions on the use of such data eliminates a potentially cost effective manner to increase the accuracy of telephone contact data in the datasets of Mezzo Business; and |
| |
| | • | | A number of other database marketing organizations in Australia which compete with Mezzo Business rely on digitized versions of the Yellow Pages business telephone directory to generate and maintain their databases. Telstra, which owns the copyright to the Australian Yellow Pages, has recently moved to restrict the publishing and sale of Yellow Pages data by taking legal action against the major publisher of that material in Australia. Mezzo Business does not believe that |
30
| | | | actions by Telstra will impact its business because Mezzo Business does not rely on Yellow Pages material to produce its datasets. |
Privacy concerns may limit or prevent us from selling demographically targeted online advertising in the future.
To the extent we collect data derived from user activity on our online advertising network, we cannot be certain that any trade secret, copyright or other protection will be available for this data or that third parties will not assert their rights to the data. We are required to also keep information regarding Web publishers confidential under our contracts with Web publishers. In addition, various technologies seeking to protect privacy, including the following, have affected or may affect our advertising business:
| | • | | any limitation on our ability to use cookies, which are bits of information keyed to a specific server, file pathway or directory location that are stored on a user’s hard drive and passed to a Web site’s server through the user’s browser software, could impair our future targeting capabilities; and |
| |
| | • | | web-browsing software with enhanced privacy preference settings, allowing users to define settings to reject third party cookies automatically, may lower the total pool of users from whom any cookie-based third party ad serving solutions can collect and target ad delivery based on demographic data or data mining techniques. |
In Hong Kong, a company will contravene the Personal Data Ordinance, privacy legislation in force in Hong Kong, if it collects information on its users, analyzes the information for a profile of the user’s interests and sells or transmits the profiles to third parties for direct marketing purposes without the user’s consent. As part of our future advertisement delivery system, we will be integrating information including a user’s online response rate to advertisements, name, address, age or e-mail address with third party databases to generate a comprehensive demographic profile of the Internet user. The transfer of this information, which provides an individual’s profile, may contravene the Personal Data Ordinance unless the individual expressly consents to the use of this information. Our future inability to obtain demographic profiles from Internet users that do not consent to this use or any contravention of relevant privacy legislation in our data collection or use or storage may have a material and adverse effect on our business.
Risks relating to treasury management
In an attempt to increase our treasury yield, we have invested in debt securities which expose us to interest rate and credit risks which could cause us to lose our interest payments or invested principal.
In order to increase the yield from our invested cash pending our use in the conduct of our business, we have increased our leverage and invested in debt securities that expose us to market risks such as credit default and interest rate risk.
We manage our interest rate risk by maintaining a portfolio of trading and held-to-maturity investments which we believe to have high credit quality and relatively short average maturities. These instruments may include, but are not limited to, money-market instruments, bank time deposour, and variable rate and fixed rate obligations of corporations, government, and government sponsored enterprises such as the Federal National Mortgage Association, or Fannie Mae, in accordance with an investment policy approved by our Board of Directors. These instruments are denominated in U.S. dollars. The fair market value of our debt security investments, as of March 31, 2004, was US$232.4 million.
We also hold cash balances in accounts with commercial banks in the United States and foreign countries. These cash balances represent operating balances only and are invested in short-term time deposits of the local bank.
31
Many of our investments carry interest rate risk. When interest rates fall, the income from our investments in variable-rate securities declines. When interest rates rise, the fair market value of our investments in fixed-rate securities declines. Due in part to these factors, our future investment income may fall short of expectations or we may suffer losses in principal if forced to sell securities, which have declined in market value due to changes in interest rates. We attempt to mitigate risk by holding fixed-rate securities to maturity, but, if our liquidity needs force us to sell fixed-rate securities prior to maturity, we may experience a loss of principal.
We are also exposed to the risk of default by the issuers of our debt securities. We attempt to mitigate credit default risk by purchasing only investment grade securities as categorized by Moody’s Investor Service and Standard and Poor’s. The following chart breaks down our debt securities portfolio into four primary risk categories based on the Standard and Poor’s credit ratings as of December 31, 2003.
| | | | | | | | | | | | | | | | | | | | | |
Rating (Standard & Poor’s)
| | AAA
| | AA
| | A
| | BBB
| | Total
|
| Amounts of debt securities outstanding as of December 31, 2003 (in US$ millions) | | | | | | | | | | | | | | | | | | | | |
| Moody’s Investors Service | | | 293.9 | | | | 0.0 | | | | 0.0 | | | | 19.4 | | | | 313.3 | |
| Standard & Poor’s | | | 293.9 | | | | 0.0 | | | | 0.0 | | | | 19.4 | | | | 313.3 | |
As of December 31, 2003, our entire treasury portfolio of US$350.4 million, was effectively reflected in our consolidated financial statements at current market prices. At the end of each quarter, if the end of quarter price is below the original investment cost, the difference is charged to “accumulated other comprehensive income” under the shareholders’ equity section of our consolidated balance sheet. If the fair market value of any of our debt investments remains below our investment cost and is considered “other than temporary”, this decline would then be reflected as an expense under “impairment of cost investments and available-for-sale securities” in our consolidated income statement. An such adjustment could have a material adverse effect on our business, financial condition, results of operations and share price.
In addition, sharp price movements or volatility shocks may reduce the liquidity of our treasury portfolio and in some circumstances our debt instruments may have no tradeable market. This could prevent us from altering or closing our security positions without incurring substantial losses. Certain of our investments would be subject to the additional risks of trading in foreign debt securities, which may not be regulated as rigorously as similar investments in the United States. Any losses from our investments in treasury instrument could have a material adverse effect on our business, financial condition, results of operations and share price.
Our entry into repurchase facilities with Fortis Bank and DBS Bank exposes us to interest rate, market and credit risks when we borrow funds from these facilities to make other investments.
We have entered into repurchase facilities with Fortis Bank nv-sa an AA- rated bank (as rated by Standard & Poor’s) and DBS Bank, an A+ rated bank (as rated by Standard & Poor’s). The Fortis Bank facility allows us to draw up to US$250.0 million for a one-year term. The DBS Bank facility allows us to draw up to US$150.0 million for a three year term. Each drawdown will be agreed upon with the corresponding bank before execution. Both facilities were established to provide us with a source of capital to give us the flexibility to finance working capital requirements and acquisitions, as well as our treasury management program, without having to liquidate our investment portfolio on short notice.
Under the repurchase facilities, a drawdown requires us to sell debt securities from our portfolio to the bank at an agreed to price, and the bank agrees to sell back to us the same securities at the same purchase price at a later date. In effect, the bank retains title to our securities as collateral during the life of the drawdown; however, the bank has agreed to pay us any income associated with the debt securities sold. In return, we have agreed to pay interest to the bank at a base-rate of Libor plus a fixed 0.20% or 0.35%. This base rate is set on every 3 month, 6 month or 1 year anniversary of the execution of the draw down, as we and the bank may mutually agree.
32
Use of the repurchase facilities with Fortis Bank and DBS Bank creates the following three primary risks:
| | • | | The risk associated with increased leverage which includes our obligation to pay back the borrowed funds in a timely manner which may require us to liquidate a portion of our treasury portfolio at a loss to repay the borrowing. |
| |
| | • | | By setting aside debt securities as collateral under either repurchase facility, we incur the risk that if the banks themselves were to undergo an insolvency event, we could lose all or part of our debt securities set aside at such time with the bank. |
| |
| | • | | The interest that we pay under the repurchase facilities is dependent upon Libor, and therefore, our future interest expenses with respect to any amounts drawn under the repurchase facilities may exceed our expectations due to changes in interest rates. For example, if Libor rises extremely rapidly over the next few years, our interest expenses will rise commensurately. |
Further, because we have purchased, as of December 31, 2003, under the repurchase facilities approximately US$10.1 million of debt securities with drawdowns under our repurchase facilities, we are subject to risk associated with investment leverage. Since the base rate (Libor) of our drawdowns are reset periodically, in rising interest rate environments, we run the risk that our borrowing rate might exceed any interest income that we receive from the debt securities purchased with the proceeds of draw downs from the repurchase facilities. Any such negative interest rate differential, or “negative carry”, could lead to material adverse effect on our financial results.
We rely upon our internal control systems to manage our treasury operations, and our treasury portfolio and returns on our treasury portfolio may be adversely affected if we incur greater risk than otherwise appropriate or downgrades occur in our portfolio.
Any failure by us to maintain adequate treasury management control systems, could have a material adverse effect on our business, results of operations and financial condition. While we continually assess and improve our treasury management systems and policies, there is no assurance that our system of controls and policies will effectively prevent the incurrence of greater risk than is otherwise appropriate. Downgrades in our portfolio of investment grade debt securities may have a material adverse effect on our business, results of operations and financial condition. We may decide to outsource all or a portion of the investment management of our portfolio of debt securities to third party professional bond portfolio managers.
We generally have not outsourced management of our debt investment portfolio to professional portfolio managers. A professional portfolio manager may be able to generate a higher return on our debt investments than our internal treasury staff.
We generally have not outsourced a significant portion of our debt investment portfolio to professional portfolio managers. Professional managers may have broader experience and might enjoy greater resources than those available to our internal treasury personnel. We may have achieved a higher return on investments if we had outsourced management of our debt investment portfolio. Our portfolio of securities managed by a third party professional manager includes only US$20.0 million invested with the Centauri Fund (currently rated BBB by Standard & Poor’s and Baa2 by Moody’s Investors Service) which is a bond fund. Accordingly, we are exposed to external management risk for this investment, and we rely on the professional skills of the fund manager to deliver our target interest income. The investment in the Centauri Fund is highly illiquid and could be difficult to realize prior to first available redemption in 2006.
33
Risks relating to our network, intellectual property and personnel
Our computer network is vulnerable to hacking, viruses, spamming and other disruptions which may cause us to lose key clients, expose us to liability for our clients’ losses, or prevent us from securing future business.
Inappropriate use of our Internet services or errors or omissions in processing instructions or data available in our computer system or databases could jeopardize the security of confidential information stored in our computer system, which may cause us to lose key clients, expose us to liability for our clients’ losses and prevent us from securing future business, any of which could have a material adverse effect on our business, financial condition, results of operations and share price.
Inappropriate use of the Internet includes attempting to gain unauthorized access to information or systems (commonly known as cracking or hacking) and repeated transmission of unsolicited e-mail messages (commonly known as e-mail bombing or spamming). Our current policies, procedures and configurations for managing our systems, including our computer servers, may not be adequate to protect our facilities and the integrity of our user and customer information. Although we implement security measures to protect our facilities and the integrity of our user and customer information, such measures could be ineffective or circumvented.
Spam
As is typical for many businesses offering online based products and services such as emails, we experience spam attacks on a regular basis. Our systems use filters which identify common words and sentence structures typically used in spamming to block spam attacks. Our network administrators constantly review spam activities as a part of system maintenance, and also consult with outside authorities to learn about the latest techniques spammers use to attack systems which is often used to update our filters. In addition, the email products we offer have their own filtering capabilities which allow users to further refine the emails which should be blocked. We encourage users to notify us of any suspect email activity, and we will terminate user accounts which are detected as engaging in spamming activities. However, our systems continue to experience spam attacks regularly, and there is no assurance that the spam attacks will not become more frequent and materially disrupt our operations.
Viruses
While our computer systems have occasionally experienced problems as a result of viruses, we have not experienced extended system outages as a result of viruses. To protect our systems from viruses, we have installed in on our networks commercially available antivirus software produced for enterprise networks. We update on a daily basis our library of viruses to be scanned for, and perform anti-virus updating activities upon computers when they log on to our network. In addition, upon receipt of specific information that a new virus is causing difficulties across the computer networks of a number of other companies, our system administrators will send out virus alerts to its users to inform them about the virus activities, including, when applicable, advice not to open emails with specified tag lines or headers. Nonetheless, our efforts to protect our systems from viruses may not be adequate and there is no assurance that we will not experience extended system outages due to viruses in the future.
Hacking
Our computer networks have been the target of sporadic hacking activities over the years, although most hacking activities have been targeted against the gateways our computer systems use to access the Internet which are operated by third parties, rather than directly against our systems. We have set up firewalls using commercially available software to shield our systems from hacker attacks. In addition, we use commercially available software which monitors traffic across our network looking for abnormal activities and traffic which may signal a hacker attack, and also use restricted access lists to restrict unauthorized traffic on our routers to
34
limit hacker attacks. However, we may continue to be the target of hacking activities, and there is no assurance that the firewalls and software we have implemented will adequately protect our systems from such hacking activities.
Alleviating problems caused by computer viruses or other inappropriate uses or security breaches may require interruptions, delays or cessation in our services, in addition to the outages that occur in our systems from time to time for various reasons, including power interruptions, errors in instructions, equipment inadequacy, capacity and other technical problems. We do not carry errors and omissions or other insurance covering losses or liabilities caused by computer viruses, security breaches or spamming attacks. Compromises or breaches in the security or integrity of our facilities or customer or user information, or inappropriate use of our Internet services, could subject us to litigation and could adversely affect our customer base, business, share price, results of operation and financial condition.
We rely on software and hardware systems that are susceptible to failure, and in the event of service operations or other related problems, our operating efficiency and results of operations may be adversely affected.
Any system failure or inadequacy that interrupts our services or increases the response time of our services could reduce user satisfaction, future traffic and our attractiveness to advertisers and consumers. There can be no assurance that our technologies, services and products will not experience interruptions or other related problems, which could affect our operating efficiency and results of operations.
In addition, if our SMS subscriptions, web page views and overall internet traffic increases, there can be no assurance that we will be able to increase the scale of our systems proportionately. There also can be no assurance that our ad serving capabilities will be adequate for our business needs. We also depend on Web browsers, ISPs, and other Web site operators in Greater China and elsewhere that have experienced significant system failures and electrical outages in the past. Our users have experienced difficulties due to system failures that were unrelated to our systems and services.
We have limited backup systems and redundancy and we have experienced system failures and electrical outages that have disrupted our operations. We do not have a disaster recovery plan in the event of damage from fire, natural disasters, power loss, telecommunications failures, break-ins and similar events. We may experience a complete system shut-down if any of these events were to occur. To improve performance and to prevent disruption of our services, we may have to make substantial investments to deploy additional servers or one or more copies of our Web sites to mirror our online resources. Because we carry property insurance with low coverage limits, our coverage may not be adequate to compensate us for our losses. If we do not increase our capacity and our redundancy, these constraints could have a material adverse effect on our business, results of operations and financial condition.
We may be unable to protect or enforce our own intellectual property rights adequately and may be involved in future litigation over our use of technology rights.
We have increasingly developed and acquired intellectual property, including:
| | • | | the purchase of the URLs; |
| |
| | • | | the purchase of OpusOne Technologies International Inc., or OpusOne Technologies, which has developed several proprietary enterprise software related applications for use in human resources, payroll administration, attendance tracking and financial accounting; |
| |
| | • | | the recent purchase of IMI which provides supply chain management solutions for complex retail, wholesale, consumer goods, and distribution operations; |
35
| | • | | the recent purchase of Pivotal, which provides a complete set of highly flexible CRM applications; and |
| |
| | • | | the recent purchase of Executive Suite, a business intelligence and analytics software product. |
Accordingly, we regard the protection of our trademarks, service marks, copyrights, patents, domain names, trade dress and trade secrets as important to our success. We protect our intellectual property rights by relying on a combination of trademark, service mark, copyright, patent, trade dress and trade secret laws and through the domain name dispute resolution system. We also rely on contractual restrictions to protect our proprietary rights in products, services and methodologies.
We enter into confidentiality agreements and assignments of intellectual property with our employees, consultants, resellers and sub-agents, and control access to and distribution of our documentation, source code and other licensed information. In spite of these precautions, it may be possible for such persons to breach such precautions or controls or a third party to copy or otherwise obtain and use our licensed services or technology without authorization, or to develop and apply similar technology independently. In addition, effective copyright, trademark, service mark and trade secret protection is very expensive to maintain, and may be unavailable or limited. The global nature of the markets in which we operate also makes it practically impossible to control the ultimate destination of our goods and products. Protection may not be available in every country in which our intellectual property and technology is used. Furthermore, we must also protect our trademarks, patents and domain names in an increasing number of jurisdictions, a process that is expensive and may not be successful in every location. Policing the unauthorized use of our licensed technology is difficult as are the steps necessary to prevent the misappropriation or infringement of our licensed technology. In addition, further litigation may be necessary to enforce our intellectual property rights, to protect our trade secrets or to determine the validity and scope of the proprietary rights of others, which could result in substantial cost to us, divert our resources and have a material adverse effect on our business, results of operations and financial condition.
We currently own, license, resell and distribute via sub-agents intellectual property and technology from third parties. As we continue to develop intellectual property and introduce new products and services that require new technology, we anticipate that we may need to obtain licenses for additional third party technology. We cannot provide assurance that these existing and additional technology licenses will be or will continue to be available to us on commercially reasonable terms, if at all. In addition, it is possible that in the course of using new technology, we or our sub-agents may inadvertently breach the technology rights of third parties and face liability for our breach. Our inability to obtain these technology licenses or avoid breaching third party technology rights could require us to obtain substitute technologies of lower quality or performance standards or at greater cost which could delay or compromise the introduction of new products and services, and could materially and adversely affect our business and financial condition.
We are subject to possible infringement claims, which could be time consuming and costly to defend, divert management’s attention and resources or cause product shipment delays.
We expect that software product developers will increasingly be subject to infringement claims as the number of products and competitors in our various industry segments grows and the functionality of products in different industry segments overlaps. Any such claims, with or without merit, could be time consuming and costly to defend, divert management’s attention and resources, cause product shipment delays or require chinadotcom to enter into royalty or licensing agreements. Such royalty or licensing agreements, if required, may not be available on terms acceptable to us, if at all, and may require the payment of substantial amounts of money. In the event of a successful product infringement claim against us or our failure or inability to license
36
the infringed or similar technology, our business, operating results and financial condition could be materially adversely affected.
We are exposed to product liability claims, which could be time consuming and costly to defend, divert management’s attention and could have a material adverse effect on our business, operating results and financial condition.
Our enterprise software license agreements with our customers typically contain provisions designed to limit its exposure to potential product liability claims. Any such claims, with or without merit, could be time consuming and costly to defend and divert management’s attention and resources. Some of our subsidiaries carry insurance to protect against certain of these claims. It is possible, however, that the limitation of liability provisions contained in our license agreements may not be effective as a result of U.S. or foreign laws or ordinances enacted in the future or because of judicial decisions, and that liability insurance may not be available, or that coverage for specific claims may be denied. Although we have not experienced any material product liability claims to date, our sale and support of products may entail the risk of such claims. A successful product liability claim brought against us could have a material adverse effect on our business, operating results and financial condition.
Defects in our enterprise software products could increase our costs, adversely affect our reputation, diminish demand for our products and hurt our operating results.
As a result of their complexity, our enterprise software products may contain undetected errors or viruses. Errors in new products or product enhancements might not be detected until after initiating commercial shipments, which could result in additional costs, delays, possible damage to our reputation and could cause diminished demand for our products. This could lead to customer dissatisfaction and reduce the opportunity to renew maintenance or sell new licenses.
We rely on key personnel. In the event we lose the services of key employees, it may be costly and time consuming for us to locate other personnel with the required skills and experience.
Our success depends on the continued efforts of our board members, our senior management and our technical, marketing and sales personnel. These persons may terminate their association or employment with us, or they may be terminated by us, at any time. We do not maintain life insurance policies for our key personnel. Loss of the services of key members of senior management or experienced personnel in our key revenue producing businesses, or our inability to attract or retain additional qualified board members, senior managers or personnel in a timely manner, or health, family or other personal problems of key personnel could have a material adverse effect on our business, financial condition, results of operations and share price.
The process of hiring employees with the combination of skills and attributes required to implement our business strategy can be extremely competitive and time-consuming. We compete for a limited number of qualified individuals with more established companies with greater resources that offer more attractive compensation or employment conditions. As a result, we may be unable to retain or integrate existing personnel or identify and hire additional qualified personnel. Furthermore, our success depends upon our ability to retain or replace the members, particularly the independent members, of our board of directors.
We have relied on stock options to compensate our employees. In the event employees do not consider their options as valuable compensation, we may need to provide additional compensation at additional expense.
We have granted stock options to many of our employees in lieu of additional salary. Some of our employees may not consider their options to be valuable compensation, and we may need to provide additional compensation, in the form of additional salary, bonuses or equity, in an effort to retain those existing employees. Our inability to retain our employees, particularly our senior officers, and key sales, technical, marketing and
37
other service personnel in our key revenue producing businesses could have a material adverse effect on our business, financial condition, results of operations and share price.
Risks Relating to our Class A Common Shares
Our share price could be adversely affected if our major strategic shareholders materially change their holdings in our shares, particularly if the share holdings are not disposed of in an orderly manner.
As of April 1, 2004, Xinhua, through a wholly-owned subsidiary, owned 7,362,734 of our common shares, or approximately 7.3% of our total outstanding share capital. As of April 1, 2004, Asia Pacific Online Limited, or APOL, owned 18,789,528 of our common shares or approximately 18.1% of our total outstanding share capital which includes shares to be acquired within 60 days. APOL is owned by the spouse of Mr. Peter Yip, chinadotcom’s chief executive officer, and by a trust established for the benefit of Mr. Yip’s children. There is no guarantee that Xinhua or APOL will continue to hold our shares going forward for any length of time. If either Xinhua or APOL disposes, or if our investors expect either Xinhua or APOL to dispose of, a substantial portion of its holdings in chinadotcom at any time, it could adversely affect our share price.
For more information regarding the shareholdings of Xinhua and APOL, see Item 7.A — “Major Shareholders and Related Party Transactions”.
A small group of our existing shareholders controls a significant percentage of our common shares, and their interests may differ from other shareholders.
APOL has beneficial ownership of approximately 18.1% of our common shares. In addition, based solely upon information derived from publicly available information as of April 1, 2004, each of Xinhua, Capital Group International, Inc. and Jayhawk Capital Management, L.L.C. has beneficial ownership of approximately 7.3%, 4.0% and 1.8% of our common shares, respectively.
Accordingly, these shareholders, particularly if they act together, will have significant influence in determining the outcome of any corporate transaction or other matter submitted to shareholders for approval, including:
| | • | | mergers, consolidations and other business combinations which under the law of the Cayman Islands requires the approval of at least 75% of the shares voting at the meeting; |
| |
| | • | | election or non-election of directors which under the law of the Cayman Islands requires the approval of a simple majority of the shares voting at the meeting; |
| |
| | • | | removal of directors which under the law of the Cayman Islands requires the approval of at least 66 2/3% of the shares voting at the meeting; and |
| |
| | • | | amendments to chinadotcom’s memorandum and articles of association which under the laws of the Cayman Islands requires the approval of at least 66 2/3% of the shares voting at the meeting. |
As a result, these shareholders, if they act together, may be able to effectively prevent a merger, consolidation or other business combination, elect or not elect directors, prevent removal of a director and prevent amendments to our memorandum and articles of association.
For more information regarding the shareholdings of Xinhua and APOL, see Item 7.A — “Major Shareholders and Related Party Transactions”.
38
Our share price has been, and may continue to be, extremely volatile, which may not be attractive to investors.
The trading price of our common shares has been, and is likely to continue to be, extremely volatile. During the period from July 12, 1999, the date we completed our initial public offering, or IPO, to December 31, 2002, the closing price of our shares ranged from US$1.86 to US$73.4375, adjusted for our two stock splits. From January 1, 2003 to April 30, 2004, the closing price of our shares ranged from a low of US$2.73 per share on March 11, 2003 to a high of US$14.46 per share on July 14, 2003. There is no assurance that our share price will not fall below its historic or yearly low.
The trading price of our Class A common shares is subject to significant volatility in response to, among other factors:
| | • | | investor perceptions of our business, the market performance of our peer companies in the Greater China portal and mobile application business, and enterprise software businesses in general; |
| |
| | • | | our significant acquisitions, partnerships, joint ventures or capital commitments; |
| |
| | • | | trends and developments in all the markets in which we compete; |
| |
| | • | | variations in our operating results; |
| |
| | • | | our new product or service offerings; |
| |
| | • | | changes in our financial estimates by financial or industry analysts; |
| |
| | • | | technological innovations; |
| |
| | • | | litigation; |
| |
| | • | | changes in pricing made by us, our competitors or providers of alternative services; |
| |
| | • | | the depth and liquidity of the market for our shares; and |
| |
| | • | | general economic and other factors. |
In addition, the trading price of our common shares has experienced extreme price and volume fluctuations. These fluctuations often have been unrelated or disproportionate to our operating performance. Broad market, political and industry factors may also decrease the price of our common shares, regardless of our operating performance. Securities class-action litigation and regulatory investigations often have been instituted against companies following steep declines in the market price of their securities.
In addition, the market price of our common shares may decline as a result of our recent acquisitions of IMI and Pivotal, and our proposed acquisition of Ross, for a number of reasons, including if:
| | • | | we do not achieve the perceived benefits of the acquisitions as rapidly or to the extent anticipated by our shareholders or financial or industry analysts; |
| |
| | • | | the effect of the acquisitions on our financial results is not consistent with the expectations of our shareholders or financial or industry analysts; or |
| |
| | • | | significant shareholders following the acquisitions decide to dispose of their shares because the results of the acquisitions are not consistent with their expectations. |
39
We are currently the subject of a class action lawsuit with respect to our IPO allocations which, if finally judicially determined against us, could cause us to be liable for significant judgment awards.
A class action lawsuit was filed in the United States District Court, Southern District of New York on behalf of purchasers of our securities between July 12, 1999 (the date of our IPO) and December 6, 2000, inclusive. The complaint charges us and the underwriters in our IPO with violations of Sections 11, 12(a)(2) and 15 of the Securities Act of 1933 and Section 10(b) of the Securities Exchange Act of 1934 and Rule 10b-5 promulgated thereunder. The complaint alleges that the prospectus used in our IPO was materially false and misleading because it failed to disclose, among other things, that (i) the underwriters had solicited and received excessive and undisclosed commissions from certain investors, in exchange for which the underwriters allocated to those investors material portions of the restricted numbers of our shares issued in connection with the IPO; and (ii) the underwriters had entered into agreements with customers whereby the underwriters agreed to allocate our shares to those customers, in exchange for which the customers agreed to purchase additional shares in the aftermarket at pre-determined prices.
On June 26, 2003, the plaintiffs in the consolidated IPO class action lawsuits currently pending against us and over 300 other issuers who went public between 1998 and 2000, announced a proposed settlement with us and the other issuer defendants. The proposed settlement provides that the insurers of all settling issuers will guarantee that the plaintiffs recover US$1 billion from non-settling defendants, including the investment banks that acted as underwriters in those offerings. In the event that the plaintiffs do not recover US$1 billion, the insurers for the settling issuers will make up the difference. Under the proposed settlement, the maximum amount that could be charged to our insurance policy in the event that the plaintiffs recovered nothing from the investment banks would be approximately US$3.9 million. We believe that we have sufficient insurance coverage to cover the maximum amount that we may be responsible for under the proposed settlement. The independent members of our board of directors approved the proposed settlement at a meeting held in June 2003. It is possible, however, that the parties may not reach agreement on the final settlement documents or that the federal district court may not approve the settlement in whole or in part, in which event litigation could continue, and we could be liable for significant judgment awards against us if a final judgment is rendered against us. No provision has been made for any expenses that might arise as a result of the class action lawsuits.
There can also be no assurance that we will not be subjected to additional litigation of a similar form or type in the future. These class action lawsuits and any future litigation or investigations, if initiated against us would result in substantial costs and a diversion of its management’s attention and resources and could have a material adverse affect on our business, results of operation, financial condition and share price.
We may incur significant costs to avoid being considered an investment company under the Investment Company Act of 1940.
We may incur significant costs and management time to avoid investment company status under the Investment Company Act of 1940. Based upon an analysis of our assets as at December 31, 2003 and income for the year 2003 and the manner in which we intend to operate our business, we do not believe we will be considered an investment company. The determination of whether we will be an investment company will be based primarily upon the composition and value of our assets, which are subject to change, particularly when market conditions are volatile. As a result, we could inadvertently become an investment company in the future. It is not feasible for us to be regulated as an investment company because application of Investment Company Act regulations are inconsistent with our strategy of actively managing, operating and promoting collaboration among our businesses and network of strategic partners.
40
We are classified as a passive foreign investment company, or PFIC which will subject our U.S. investors to adverse tax rules.
Based upon an analysis of our assets as at December 31, 2003 and income for the year 2003, during 2003, we were a PFIC for United States federal income tax purposes. We have substantial passive assets in the form of cash and cash equivalents and treasury instruments, and can provide no assurance that we will not continue to be classified as a PFIC for 2004 or any future tax year. The determination of whether we would continue to be a PFIC would be principally based upon:
| | • | | the composition of our assets, including goodwill, the amount of which will depend, in part, on our total net assets and the market value of our Class A common shares, which is subject to change; and |
| |
| | • | | the amount and nature of our income from time to time. |
We have limited control over these variables. To the extent we do have control over these variables, we may take steps to reduce the material and adverse effect that our PFIC classification may have on our share price.
Since we are a PFIC, U.S. investors will be subject to adverse United States federal income tax consequences. For further discussion regarding our status as a PFIC, see Item 10.E—“Additional Information — Taxation — Tax Consequences of U.S. Holders — Passive Foreign Investment Company Status”. U.S. investors are strongly urged to consult their own tax advisors regarding the application of the PFIC rules to their particular circumstances.
Substantial amounts of our common shares are eligible for future sale, which could adversely affect the market price of our shares.
Sales of substantial amounts of our Class A common shares in the public market could adversely affect the market price for our shares. As of March 15, 2004, we had 103,930,895 Class A common shares issued and outstanding, substantially all of which may be sold pursuant to an effective registration statement under the Securities Act or an applicable exemption from registration thereunder, including Rule 144, which permits resales of securities subject to limitations depending on the holding period of such securities.
In addition, as we continue to issue and register shares to fulfill our contractual and acquisition-related obligations, and as our employees and other grantees have been or are granted additional options and warrants to purchase our shares, additional shares will be available-for-sale in the public market. We have also granted options to certain of our shareholders, directors and officers to purchase our shares, the vesting of which options may be accelerated upon an occurrence of a change-of-control event. As a result, additional shares may be available-for-sale in the public market. The availability or perceived availability of additional shares could have a dilutive and negative impact on the market price of our shares.
In the future, we also may issue additional shares, convertible notes or warrants to purchase our shares, in connection with acquisitions and our efforts to expand our business. Shareholders could face further dilution from our future share issuances.
Anti-takeover provisions in our charter documents may adversely affect the rights of holders of our common shares
Our memorandum and articles of association include provisions that could limit the ability of others to acquire control of chinadotcom, modify our structure or cause us to engage in change-of-control transactions. These provisions could have the effect of depriving shareholders of an opportunity to sell their shares at a
41
premium over prevailing market prices by discouraging third parties from seeking to obtain control of chinadotcom in a tender offer or similar transaction.
For example, our board of directors is divided into three classes, each having a term of three years, with the term of one class expiring each year. This provision would delay the replacement of a majority of our directors and would make changes to the board of directors more difficult than if such provision was not in place. In addition, our board of directors has the authority, without further action by our shareholders, to issue up to 5,000,000 preferred shares in one or more series and to fix their designations, powers, preferences, privileges, and relative participating, optional or special rights and the qualifications, limitations or restrictions, including dividend rights, conversion rights, voting rights, terms of redemption and liquidation preferences, any or all of which may be greater than the rights associated with our Class A common shares. Preferred shares could be issued quickly with terms calculated to delay or prevent a change in control or make removal of management more difficult. If our board of directors issues preferred shares, the price of our Class A common shares may fall and the voting and other rights of the holders of our Class A common shares may be adversely affected.
Our shareholders may face difficulties in protecting their interests because we are incorporated under Cayman Islands law.
Our corporate affairs are governed by our memorandum and articles of association, by the Companies Law and the common law of the Cayman Islands. The rights of shareholders to take action against our directors, actions by minority shareholders and the fiduciary responsibilities of our directors under Cayman Islands law are to a large extent governed by the common law of the Cayman Islands. The common law in the Cayman Islands is derived in part from comparatively limited judicial precedent in the Cayman Islands and from English common law, the decisions of whose courts are of persuasive authority but are not binding on a court in the Cayman Islands. Cayman Islands law in this area may conflict with jurisdictions in the United States. As a result, our public shareholders, may face more difficulties in protecting their interests in the face of actions against the management, directors or our controlling shareholders than would shareholders of a corporation incorporated in a jurisdiction in the United States. For instance a class action lawsuit may not be available to our shareholders as a vehicle for litigating securities matters against us in the Cayman Islands. In addition, shareholder derivative actions may generally not be brought by a minority shareholder in the Cayman Islands.
If you are not a registered shareholder and do not hold greater than 10,000 shares, you may not receive our proxy materials or other corporate communications.
chinadotcom is a Cayman Islands company and as such, we only need to distribute our proxy materials to our registered shareholders. Our proxy materials are delivered to all of our registered shareholders. We offer electronic delivery of proxy materials to our registered shareholders, and we mail proxy materials to each registered owner who has not opted to receive materials electronically. You are a registered shareholder if you have an account with our transfer agent, The Bank of New York, and if you hold a stock certificate evidencing your ownership of our common shares. You are a beneficial shareholder if a brokerage firm, bank trustee or other agent holds your common shares. However, your name would not appear anywhere on our records, but rather the name of the broker, bank or other nominee appears on our records as retained by our transfer agent, The Bank of New York. Although we only need to distribute our proxy materials to registered shareholders under Cayman Islands law, we also distribute proxy materials to beneficial shareholders who hold greater than 10,000 of our shares. In an effort to maintain cost effectiveness, we have, and will continue to, mail the proxy materials to those beneficial shareholders who hold greater than 10,000 of our shares. If you are not a registered shareholder and do not hold greater than 10,000 of our shares, you may not receive our proxy materials or other corporate communications. Therefore, if you are a beneficial shareholder and want to ensure that you do receive proxy materials, you are urged to become a registered owner. If you have questions on how to do so, we encourage you to contact your broker or bank to find out how to do so and you may also contact us.
42
There is uncertainty as to our shareholders’ ability to enforce civil liabilities in Australia, the Cayman Islands, Hong Kong, South Korea, the PRC and Singapore.
We are a Cayman Islands company and a substantial majority of our assets are located outside the United States. A substantial portion of our current operations is conducted in Australia, Hong Kong, South Korea, the PRC and Singapore. In addition, a majority of our directors and officers are nationals and/or residents of countries other than the United States. All or a substantial portion of the assets of these persons are located outside the United States. As a result, it may be difficult for you to effect service of process within the United States upon these persons. In addition, there is uncertainty as to whether the courts of Australia, the Cayman Islands, Hong Kong, South Korea, the PRC, Singapore and other jurisdictions would recognize or enforce judgments of United States courts obtained against us or such persons predicated upon the civil liability provisions of the securities laws of the United States or any state thereof, or be competent to hear original actions brought in Australia, the Cayman Islands, Hong Kong, South Korea, the PRC, Singapore or other jurisdictions against us or such persons predicated upon the securities laws of the United States or any of its states.
Risks Relating to the Greater China and Asian Software, Consulting, Mobile Applications and Marketing Industries
The industries in which we operate are intensely competitive and volatile, which could cause us to experience lower valuations, greater difficulty in obtaining funding, reduced liquidity, risks of consolidation and litigation.
The Greater China and Asian technology and internet markets, encompassing software, e-business consulting, mobile applications, internet portal and marketing, are characterized by intense competition. These markets in North America, Asia and elsewhere have experienced marked downturns resulting in, among other things, lower valuations, greater difficulty in obtaining funding, increased consolidation, reduced liquidity, litigation and other structural problems. As a result, our competitors may be able to better position themselves to compete as they further consolidate, change or mature.
In addition, many of our existing competitors, as well as a number of potential new competitors, have longer operating histories in each of our target markets, greater name recognition, larger customer bases and greater financial, technical and marketing resources when compared to us. Any of our present or future competitors may provide products and services that provide significant performance, price, creative or other advantages over those offered by us. We can provide no assurance that we will be able to compete successfully against our current or future competitors, particularly as markets continue to consolidate, change or mature.
Software competition.Our competition in the market for a broad range of sophisticated enterprise software applications, including procurement, collaborative planning, financial, manufacturing, distribution, supply chain management, customer relationship management and human resource management is varied and includes a combination of international and local software providers. Our major competitors include:
| | • | | enterprise solutions software companies targeting mid-market companies, including Exact Corporation, Microsoft Corporation, Scala Business Solutions NV, Systems Union Group Inc. and local providers such as FlexSystem Holdings Ltd., Kingdee International Software Group Company Limited and UFSoft; |
| |
| | • | | human resources and payroll solution providers, including PeopleSoft, Inc., SAP AG, and various local providers in Greater China, including Cityray Technology (China) Ltd. and UFSoft; |
| |
| | • | | process manufacturing enterprise resource planning providers, including Peoplesoft and QAD, Inc.; |
43
| | • | | large information technology consulting and outsourcing service providers including Accenture Ltd., Cambridge Technology Partners Inc., Electronic Data Systems Corporation, Infosys Technologies and Wipro Ltd; |
| |
| | • | | customer relationship management providers including Onyx, Sales Logics, Salesforce.com and Siebel Systems, Inc.; |
| |
| | • | | providers of business intelligence solutions including Business Objects SA, Cognos, Inc. and Hyperion, Inc.; and |
| |
| | • | | providers of supply chain management solutions, including Aspen Technologies, i2 Technologies, Inc., Manhattan Associates, Manugistics Group, Inc. and MAPICS, Inc. |
Many of these companies are well funded with long operating histories of profitable performance. They possess a number of tangible strengths and advantages, including high quality client lists and high numbers of highly qualified staff, complemented by extensive operating infrastructures. The principal competitive factors in the market for enterprise software application software include product reputation, product functionality, performance, quality of customer support, size of installed base, financial stability, hardware and software platforms supported, price, and timeliness of installation.
Software consulting services competition.Our competition for strategic expertise, online marketing, technical solution delivery, and general business consultancy problem solving skills include:
| | • | | computer hardware and service vendors including Hewlett-Packard Company and International Business Machines; |
| |
| | • | | Internet integrators and Web site design and development companies including Delirium Cybertouch Corporation, Digitas, Inc., Dimension Data Holdings Limited and Sapient Corporation; |
| |
| | • | | large information technology consulting service providers including Accenture Ltd., Cambridge Technology Partners Inc. and Electronic Data Systems Corporation; and |
| |
| | • | | local service providers in an individual market. |
Many of these companies are well funded with long operating histories of profitable performance. They possess a number of tangible strengths and advantages including extensive client lists and large numbers of skilled staff, complemented by well-established operating infrastructures. Our revenue streams have been volatile and despite the extended market downturn, the competitive threat has still not evaporated and it remains challenging in most markets. This has resulted in continued price pressure and an intensive level of competition in these markets.
Outsourced software development and support services competition. In February 2003, we acquired Praxa which is seeking to develop a China and India-based outsourcing platform which can offer clients outsourced software application development and support services. As our business evolves to place greater emphasis on outsourced software development and support services, we will face competition from many of the large Asia Pacific-based outsourcing firms such as Infosys Technologies Ltd and Wipro Ltd. While these competitors have traditionally focused on servicing the U.S. markets, due to lower demand in the United States they have entered the English-speaking markets in Asia (such as Australia, Singapore and Hong Kong) where we are developing our business.
Mobile applications and services competition.We are not the only company providing value-added SMS and generating subscription revenues in China. We anticipate that we will face increasing competition for subscribers, mobile applications and content from companies such as: (1) Sina Corporation; (2) Sohu.com Inc.;
44
(3) NetEase.com Inc.; (4) Tom Online Inc.; (5) Tencent.com Technology Limited; (6) Linktone Ltd.; and (7) Mtone Wireless Corporation, as well as a number of smaller companies that serve China’s SMS market. We expect competitors are also seeking to develop or have already developed mobile applications that are more sophisticated than SMS. Many of our current competitors have more experience and longer operating histories in our target markets than us, as well as greater name recognition, larger customer bases and greater financial, technical and marketing resources. We may not be able to compete successfully against our competitors. In addition, mobile operators, including China Mobile or China Unicom, may seek to develop and launch services that compete with our own. Moreover, these competitors may be more successful in developing and implementing higher-margin value-added mobile services. Our failure to remain competitive may cause us to lose our market share in the mobile services and applications business and our profitability may suffer.
Advertising and marketing competition.With respect to our strategy of moving towards higher margin database marketing related services, we anticipate that we will compete with companies that have developed high quality data sets and related products and services, such as Axciom and The Dun & Bradstreet Corporation. With respect to our online advertising strategy, we compete with a variety of Internet advertising networks, including BMC Software, Inc. and DoubleClick, Inc., for the sale of advertisements to our network of advertising affiliates.
In our overall advertising business, we also compete with content aggregators, companies engaged in advertising sales networks, advertising agencies and traditional advertising media including print, radio and television.
Portal competition.Our competition for user traffic, ease of use and functionality include Chinese and/or English language based Web search and retrieval companies, including AltaVista Co., Apple Daily, ChinaByte, FindWhat.com, Google, Inc., HotBot, HotWired Ventures, Lycos, Inc., Mingpao.com, MSN, Netease.com, Inc., Netvigator.com, Overture Services, Inc., Shanghai Online, Sina Corporation, Sohu.com, Inc., Tom Online Inc. and Yahoo!, Inc.
We may also encounter increased competition from ISPs, Web site operators and providers of Web browser software, including Microsoft Corporation or Netscape Communications Corporation, that incorporate search and retrieval features in their products. Our competitors may develop Web search, retrieval services, freemail and community services that are equal or superior to those we offer our users and may achieve greater market acceptance than our offerings in the area of performance, ease of use and functionality.
Merger and acquisition competition.The significant slowdown in capital markets activity over the past three years has resulted in an increased trend of mergers and acquisitions as a means for companies to expand and realize value. Across the Asia-Pacific region, many of our competitors have greater financial and other resources and brand name recognition when compared to us. These competitors may limit our ability to effect strategic acquisitions or combinations, particularly as our markets consolidate further through local and regional mergers and acquisitions. If we cannot merge or combine with or acquire strategically significant companies on reasonable terms, our ability to compete in our markets may be compromised.
Our growth within the broad PRC Internet market depends on the availability of an adequate telecommunications infrastructure in the PRC by the PRC government. In the event of any disruption or failure, we may have no means of accessing alternative networks or services which would adversely affect our business.
Unlike Taiwan and Hong Kong, where the telecommunications infrastructure is comparable to U.S. standards and where private companies compete as ISPs, the telecommunications infrastructure in the PRC is not as well developed. In addition, access to the Internet in the PRC is accomplished primarily by means of the government’s backbone of separate national interconnecting networks that connect with the international gateway to the Internet. This gateway is owned and operated by the PRC government and is the only means for the domestic PRC Internet network to connect to the international Internet network. Although private sector ISPs
45
exist in the PRC, almost all access to the Internet is accomplished through ChinaNet, the PRC’s primary commercial network, which is owned and operated by the PRC government. We rely on this backbone and China Telecom to provide data communications capacity primarily through local telecommunications lines. As a result, we will continue to depend on the PRC government to establish and maintain a reliable Internet infrastructure to reach a broader base of Internet users in the PRC. We will have no means of accessing alternative networks and services in the PRC, on a timely basis or at all, in the event of any disruption or failure. There can be no assurance that the Internet infrastructure in Greater China will support the demands associated with continued growth. If the necessary infrastructure standards or protocols or complementary products, services or facilities are not developed by the PRC government, our business could be materially and adversely affected.
Political, Economic and Regulatory Risks
Increased Sino-U.S. political tension may make our company less attractive to investors and clients and our Web sites more vulnerable to hacking and other disruptions.
The relationship between the United States and the PRC is subject to sudden fluctuation and periodic tension. For example, relations may be compromised if the U.S. becomes a more vocal advocate of Taiwan or proceeds to sell certain military weapons and technology to Taiwan. Any weakening of relations between the U.S. and the PRC could have a material adverse effect on our business and could attract hacking or result in other disruptions to our Web sites. Anti-U.S. or anti-PRC sentiment could make our company and our shares less attractive since we are listed in the United States. In addition, changes in political conditions in the PRC and changes in the state of Sino-U.S. relations are difficult to predict and could adversely affect our operations or cause the Greater China market to become less attractive to investors and clients because of our relationship with Xinhua and because we operate in the PRC.
The economic climate in Asia is volatile and vulnerable, which has affected and may continue to affect, our business through declining spending levels by customers, deferred or uncollectible accounts receivable, and restricted ability to access lines of credit.
Over the last decade, many countries in Asia experienced significant economic downturns and related difficulties. As a result of the decline in the value of the region’s currencies, many Asian governments and companies had difficulties servicing foreign currency-denominated debt and many corporate borrowers defaulted on their payments. As the economic crisis spread across the region, governments raised interest rates to defend their weakening currencies, which adversely impacted domestic growth rates. In addition, liquidity was substantially reduced as foreign investors curtailed investments in the region and domestic banks restricted additional lending activity. The currency fluctuations, as well as higher interest rates and other factors, have materially and adversely affected the economies of a number of countries in Asia, many of which are still recovering or have yet to recover.
Economic developments in countries outside Asia could also materially and adversely affect the Asian markets and our business, results of operations and financial condition. For example, the recent volatility of the U.S. stock market and the interest rate environment, the downturn in the high-tech sector, and the slowdown of the U.S. economy have had a negative impact on Asian markets. A further reduction in exports and a further decrease in direct foreign investment could reduce demand for our services, especially in those countries heavily dependent on technology export sales from where we derive significant revenue.
The economic crisis and its effect on the Asian economies has had and may continue to have an adverse impact on our business in the following respects:
| | • | | spending by companies in Asia for enterprise software products may decline; |
46
| | • | | spending levels by both Asian and international companies for advertising in the Asian markets may continue to decline; |
| |
| | • | | payments on our accounts receivable may be deferred and may become more difficult to collect or become uncollectable; and |
| |
| | • | | our ability to access lines of credit or other financing may be restricted. |
Any recurrence of SARS or another widespread public health problem, could adversely affect our business and results of operations.
A renewed outbreak of SARS or another widespread public health problem in China could have a negative effect on our China operations. Our China operations may be impacted by a number of health-related factors, including the following:
| | • | | quarantines or closures of some of our offices which would severely disrupt our operations, |
| |
| | • | | the sickness or death of key officers and employees, and |
| |
| | • | | a general slowdown in the Chinese economy. |
Any of the foregoing events or other unforeseen consequences of public health problems could adversely affect our business and results of operations.
There are economic risks associated with doing business in the countries in which we primarily operate which could adversely affect our business.
PRC. A significant part of our current revenues are, and a significant part of our future revenues are expected to be, derived from the PRC market.
The PRC economy differs from the economies of most developed countries in many respects, including:
| | • | | amount of government involvement; |
| |
| | • | | level of development; |
| |
| | • | | growth rate; |
| |
| | • | | control of foreign exchange; and |
| |
| | • | | allocation of resources. |
While the PRC economy has experienced significant growth in the past twenty years, growth has been uneven, both geographically and among various sectors of the economy. The PRC government has implemented various measures to encourage economic growth and guide the allocation of resources. Some of these measures benefit the overall PRC economy, but may also have a negative effect on us. For example, our financial condition and results of operations may be adversely affected by government control over capital investments or changes in tax regulations that are applicable to us.
The PRC economy has been transitioning from a planned economy to a more market-oriented economy. Although in recent years, the PRC government has implemented measures emphasizing the utilization of market forces for economic reform, the reduction of state ownership of productive assets and the establishment of sound corporate governance in business enterprises, a substantial portion of productive assets in China is still owned by the PRC government. In addition, the PRC government continues to play a significant role in regulating industry
47
development by imposing industrial policies. It also exercises significant control over PRC economic growth through the allocation of resources, controlling payment of foreign currency-denominated obligations, setting monetary policy and providing preferential treatment to particular industries or companies.
Hong Kong. A significant part of our facilities and operations are currently located in Hong Kong. Hong Kong is a Special Administrative Region of the PRC with its own government and legislature. Although Hong Kong enjoys a high degree of autonomy from the PRC under the principle of “one country, two systems”, we can give no assurance that Hong Kong will continue to enjoy autonomy from the PRC.
PRC regulation of content distributed on the Internet may adversely affect our business.
The PRC has enacted regulations governing Internet access and the distribution of news and other information. The MII has published implementing regulations that subject online information providers to potential liability for content included on their portals and the actions of subscribers and others using their systems, including liability for violation of the PRC laws prohibiting the distribution of content deemed to be socially destabilizing. Because many PRC laws, regulations and legal requirements with regard to the Internet are relatively new and untested, their interpretation and enforcement of what is deemed to be socially destabilizing by PRC authorities may involve significant uncertainty.
Under the PRC’s regulations on telecommunications and Internet information services, Internet information service providers are prohibited from producing, duplicating, releasing or distributing any information which falls within one or more of the nine stipulated categories of “undesirable content”. These categories cover any information which:
| | • | | contravenes the basic principles enshrined in the PRC Constitution; |
| |
| | • | | endangers the security or unity of the State; |
| |
| | • | | undermines the State’s religious policies; |
| |
| | • | | undermines public order or social stability; or |
| |
| | • | | contains obscene, pornographic, violent or other illegal content or information otherwise prohibited by law. |
In addition, the PRC legal system is a civil law system based on written statutes. Unlike common law systems, it is a system in which decided legal cases have little precedential value. As a result, it is difficult to determine the type of content that may result in liability. We cannot predict the effect of further developments in the PRC legal system, particularly with regard to the Internet and the dissemination of news content, including the creation of new laws, changes to existing laws or the interpretation or enforcement thereof, or the pre-emption of local rules and regulations by national laws.
Violations or perceived violations of PRC laws arising from information displayed, retrieved from or linked to our portals could result in significant penalties, including a temporary or permanent cessation of our business in the PRC. PRC government agencies have announced restrictions on the transmission of state secrets through the Internet. State secrets have been broadly interpreted by PRC governmental authorities in the past. We may be liable under these pronouncements for content and materials posted or transmitted by users on our message boards, virtual communities, chat rooms or e-mails. If the PRC government were to take any action to limit or eliminate the distribution of information through our portal network or to limit or regulate any current or future applications available to users on our portal network, this action could have a material adverse effect on our business, financial condition and results of operations.
48
A change in currency exchange rates could increase our costs relative to our revenues thereby potentially adversely affecting our financial condition, results of operations and increasing market risk.
Substantially all of our revenues, expenses and liabilities are denominated in renminbi, Hong Kong dollars, South Korean won, U.S. dollars, Euros, Canadian dollars, Swedish Kronas and Australian dollars. We also generate revenues, expenses and liabilities in other currencies such as Singapore dollars, British pounds and New Taiwan dollars. However, our quarterly and annual financial results are reported in U.S. dollars. In the future, we may also conduct business in additional foreign countries and generate revenues, expenses and liabilities in other foreign currencies. As a result, we are subject to the effects of exchange rate fluctuations with respect to any of these currencies and the related interest rate fluctuations. We have not entered into agreements or purchase instruments to hedge our exchange rate risks although we may do so in the future.
Restrictions on currency exchange in the PRC may limit our ability to utilize our revenues effectively to fund business activities outside the PRC, which could result in increased costs for capital.
Although PRC government policies were introduced in 1996 to allow greater convertibility of the renminbi, significant restrictions still remain. We can provide no assurance that the PRC regulatory authorities will not impose greater restrictions on the convertibility of the renminbi. Because a significant amount of our future revenues may be in the form of renminbi, any future restrictions on currency exchanges may limit our ability to utilize revenue generated in renminbi to fund our business activities outside the PRC.
ITEM 4. INFORMATION ON THE COMPANY
A. History and Development of the Company
We were incorporated in June 1997 as China Information Infrastructure Limited, a company limited by shares under the Companies Law of the Cayman Islands. Our principal executive offices are located at 34/F Citicorp Centre, 18 Whitfield Road, Causeway Bay, Hong Kong. Our contact telephone number in Hong Kong is (852) 2893-8200 and in the United States is (212) 661-2160. We have a website that you may access at http://www.corp.china.com/. Information contained on our website does not constitute part of this Annual Report.
We were organized as a wholly-owned subsidiary of CIC Holding Limited, or CIC, which was incorporated in July 1996. CIC established chinadotcom to operate CIC’s Internet portal and related businesses. Subsequent to the incorporation of chinadotcom, the board of directors of CIC authorized the transfer of all material contracts that were relevant to the business operations of chinadotcom from CIC and CIC-HK to chinadotcom, as well as CIC’s equity and beneficial interests in the following subsidiaries:
| | • | | The Connection Group (BVI) Limited, also known as The Web Connection and rebranded Ion Global (BVI) Ltd. in April 2001, is a British Virgin Islands company that serves as the holding company for our e-business Solutions subsidiaries; |
| |
| | • | | CIC (Shanghai) Company Limited, a PRC company that engages in Web-based advertising sales in the PRC and serves as the holding company for our other operations in the PRC; and |
| |
| | • | | China.com Corporation Limited, a Hong Kong company. |
The aggregate value of the assets transferred to chinadotcom was recorded at a historical cost of US$12.7 million.
In June 1999, CIC distributed its entire interest in chinadotcom to CIC’s shareholders. The transaction involved the distribution of a total of 46,975,972 Class A common shares to CIC’s shareholders on a one-for-one
49
basis with respect to each issued and outstanding share of CIC’s capital stock at the time of the distribution. Upon completion of that transaction, CIC ceased to have any ownership interest in chinadotcom. APOL and a wholly-owned subsidiary of Xinhua provided a mutual right of first refusal to buy the other party’s shares of chinadotcom owned as of that time in the event either party sought to dispose of its chinadotcom shareholdings. Additionally, APOL received rights to place shares of chinadotcom owned by the Xinhua subsidiary to prospective buyers on behalf of the Xinhua subsidiary in exchange for a commission. New World Infrastructure Limited also provided a right of first refusal to a wholly-owned subsidiary of Xinhua to buy its shares of chinadotcom in the event New World Infrastructure Limited sought to dispose of its shareholdings in chinadotcom.
In July 1999, we completed our IPO of the equivalent of 19,320,000 Class A common shares on the Nasdaq National Market at the equivalent of a public offering price of US$5.00 per share on a stock split adjusted basis. All of the shares registered were sold and net proceeds from the IPO totaled US$85.6 million.
On December 6, 1999, our shareholders approved a two-for-one share split that became effective on December 13, 1999 and split the par value of our shares to US$0.0005 per share.
In January 2000, we completed a second public offering of the equivalent of 9,952,884 Class A common shares on the Nasdaq National Market at the equivalent of a public offering price equal to US$42.50 per share on a stock split adjusted basis. Of the 9,952,884 Class A common shares sold, 2,325,000 shares were offered by certain of our shareholders. The selling shareholders received an aggregate of US$94.1 million in net proceeds for their shares. All of the shares registered were sold and net proceeds from the offering to chinadotcom totaled US$303.9 million.
In March 2000, we listed our then wholly-owned subsidiary hongkong.com on the Growth Enterprise Market, or GEM, of the Hong Kong Stock Exchange and received net proceeds of approximately US$168.5 million for selling approximately 16% of hongkong.com. We currently continue to own approximately 81.3% of hongkong.com.
In April 2000, our shareholders approved the change of our company name from China.com Corporation to chinadotcom corporation. On April 28, 2000, our shareholders approved a further two-for-one share split that became effective as of May 8, 2000 and split the par value of our shares to US$0.00025 per share.
Our total capital expenditures amounted to US$8.3 million and US$5.5 million and US$1.6 million in fiscal 2001, 2002 and 2003, respectively. The primary capital expenditure in each of those years was the purchase of computers, servers and network equipment, and other items related to the expansion of our business network across the Asia Pacific, the United States and the United Kingdom.
We have recorded an operating loss in every year since our inception in June 1997 until fiscal 2003. In fiscal 2003, we recorded net income of US$15.5 million. We have funded our operations and capital expenditures principally through funds raised from our shareholders, including private rounds of financing prior to our IPO in July 1999 and a second public offering in January 2000, and interest income derived from those funds.
Acquisitions
We spent approximately US$5.3 million and US$48.3 million (comprising of US$45.4 million in cash and US$2.9 million in Chinadotcom shares) in connection with strategic acquisitions and investments for each of the two years ended December 31, 2002 and 2003, respectively. The following is a summary of our material and strategic acquisitions and investments completed since January 1, 2001 which includes those for which we paid or committed US$5.0 million or more during the course of each transaction.
50
| | | | | |
| | | Acquisition, | | |
| Acquisition or partner | | payment or | | |
company
| | partnership date
| | Acquired or partner company’s activities
|
| URLs from CIC | | Via tranches during October 2001 and February 2002 | | We acquired from CIC the three URLs, www.china.com, www.hongkong.com and www.taiwan.com, and the related intellectual property rights. |
| | | | | |
| Layabo Pty. Limited | | March 2002 | | We acquired Layabo Pty. Limited (now renamed Mezzo Business Databases Pty Limited), an Australian database marketing business and owner of the trademark IncNet. With the acquisition of Layabo Pty. Limited and the prior acquisition of RNR International Marketing Group (Australia) Pty Limited in 2000, we are consolidating our marketing business in Australia under the MEZZO brand. |
| | | | | |
| OpusOne Technologies International Inc. | | March 2002 and May 2003 | | We acquired OpusOne Technologies, the parent of Platinum China Holdings, Inc., a developer and service provider of business management software solutions for state enterprises and multi-national corporations in Greater China. |
| | | | | |
| Praxa Limited | | February 2003 | | We completed the acquisition of Praxa, a leading Australian information technology professional services organization with a 21-year operating history. The acquisition was completed for a purchase price of up to A$11.0 million (approximately US$6.4 million), subject to clawback provisions based on future performance. |
| | | | | |
| Newpalm (China) Information Technology Co., Ltd. | | April 2003 | | We completed the acquisition of the parent of Newpalm, a leading short messaging service mobile software platform developer and application service provider in China, through our 81.3% owned subsidiary, hongkong.com. Consideration was payable in installments. The first installment of US$14.0 million was paid in 2003 and the second installment of US$41.0 million was paid in February 2004. |
| | | | | |
| PK Information Systems | | August 2003 | | We acquired PK Information Systems, an established IT services business in Australia which has specialized capabilities in the areas of .Net application development and business intelligence solutions, with clients mainly in the New South Wales state government sector. |
| | | | | |
| Ascent Computing Group, Inc | | September 2003 | | We acquired all the assets and business of Ascent Computing Group which provides applications and system outsourcing services. |
| | | | | |
| Industri-Matematik International Corp. | | September 2003 | | We acquired a 51% stake in the holding company of IMI, an international provider of software to the supply chain management sector principally across Europe and the United States. The acquisition of the controlling stake in IMI was made through the formation of a joint venture between chinadotcom’s CDC Software unit, which holds a 51% interest, and Symphony Technology Group, a Palo Alto, California-based venture capital company which holds the remaining 49% interest. In November 2003, Symphony agreed to waive their right to dividends and provide us with a liquidation preference for a period of two years. Accordingly, we include in our income 100% of IMI’s financial results. |
51
| | | | | |
| | | Acquisition, | | |
| Acquisition or partner | | payment or | | |
company
| | partnership date
| | Acquired or partner company’s activities
|
| Executive Suite Software | | October 2003 | | We acquired the intellectual property rights for the Executive Suite business intelligence software from CIP-Global ApS, a Danish software company in liquidation. Executive Suite is a fully integrated financial management application based on Microsoft technology which delivers budgeting, planning, forecasting, consolidation, reporting and analysis to a broad spectrum of customers. |
| | | | | |
| Pivotal Corporation | | February 2004 | | We acquired all the outstanding shares of Pivotal in exchange for a combination of cash and shares. Pivotal is a leading international CRM company that provides a complete set of highly flexible CRM applications and implementation services for mid-sized enterprises, with over 1,700 clients worldwide. |
| | | | | |
| Go2Joy | | April 2004 | | In April, 2004, chinadotcom acquired Go2Joy, a leading mobile applications and services provider in the PRC with established partnerships with media companies in the PRC. Go2Joy also offers a unique mobile payment service through an exclusive partnership with the official mobile payment platform authorized by China Mobile to handle third party collections of non-mobile related services. In connection with the acquisition, chinadotcom made an initial payment of US$9.6 million in April 2004, with remaining consideration, not to exceed US$50.4 million, to be paid in two installments in early 2005 and 2006. |
| | | | | |
| Beijing 17game Network Technology Co., Ltd. | | Pending | | On February 12, 2004, chinadotcom, through its 81.3% owned subsidiary, hongkong.com, entered into a secured convertible loan agreement with Beijing 17game Network Technology Co., Ltd., a Beijing based online games company. The convertible loan from hongkong.com to 17game, of up to US$3.2 million can be drawn down by 17game in two stages. The first draw-down of US$1.2 million occurred upon closing the transaction. The second draw-down of US$2.0 million will occur upon satisfaction of certain conditions for hongkong.com’s benefit. Upon the second draw-down, the loan will be automatically converted into shares of 17game, representing an ownership interest of 28.6%. hongkong.com will then have an option to acquire the remaining interest based on an earn-out formula, with total consideration not to exceed US$50 million. Upon hongkong.com achieving majority ownership, 17game will have an option to put their then minority shareholding to hongkong.com based on the same earn-out formula. |
| | | | | |
| Ross Systems, Inc. | | Pending | | We entered into a merger agreement with Ross in September 2003 which contemplates our acquisition of all the outstanding shares of Ross in exchange for a combination of cash and shares. |
Divestitures
Our principal divestiture in 2000 was our sale of 16% of hongkong.com in its initial public offering on GEM, resulting in proceeds of US$168.5 million and a one time gain of US$140.0 million. We also disposed of 20% of our then wholly-owned subsidiary, Pacific Connection Limited in exchange for shares of the purchaser, e2Capital (Holdings) Limited, worth US$3.7 million. Finally in 2000, we sold 99.9% of our then wholly-owned subsidiary, 24/7 Media Asia Limited, for which we received shares of its purchaser, 24/7 Media Inc., with a value of US$10.8 million. We did not make any principal divestitures in 2001. In 2002, the following chinadotcom subsidiaries either ceased operations, were liquidated or were disposed of, which resulted in a gain of approximately US$1.0 million: 24/7 Media (Singapore) Pte Ltd, Ion Global (Taiwan) Ltd, Ion Global
52
(Australia) Pty Ltd, Shanghai Full-Time Internet Corporation, MEZZO Marketing (Taiwan) Ltd, Pandora Interactive Studio Pte Ltd and Travellerzone Limited. In 2003, various of our subsidiaries either ceased operations, were liquidated or were disposed of, which resulted in a gain of approximately US$2.0 million. The principal divestitures among those completed in 2003 were e2e Business Solutions Limited, Ion Global (Beijing) Limited, Ion Global (Japan) Inc., Ion Global (Oregon), Inc. (formerly known as Tkai, Inc.), Netville Co. Ltd., and Wealth Corporation Ltd.
B. Business Overview
We are a leading provider of enterprise software and solutions, value-added mobile services and applications and marketing and advertising services. We offer the following services for companies throughout Greater China and Asia, North America, the United Kingdom and Europe:
| | • | | software products and services, including implementation and development of packaged software for use in enterprise resource planning targeting mid-market manufacturers; |
| |
| | • | | value-added mobile services and applications, including offering SMS to mobile subscribers in China and providing mobile development and technology services in Korea for leading telecom network operators, mobile handset manufacturers and mobile application and content providers; |
| |
| | • | | technology services and outsourcing, including offering economical, high-quality software development services to our enterprise software customer base, utilizing programmers located principally in China and India; and |
| |
| | • | | marketing and advertising services, including developing targeted advertising campaigns by utilizing information gathered from our proprietary databases. |
Enterprise resource planning involves the technique of supporting and automating the processes of an organization. Enterprise software attempts to achieve company-wide integration of business and technical information across multiple divisions and organizational boundaries, such as finance, manufacturing, logistics, human resources and sales, utilizing common databases and programs that share data real time across multiple business functions. Our enterprise software business focuses on key industry groups, including manufacturing for export, finance and travel, and in key business areas, including supply chain management, human resource and payroll administration and customer relationship management. We intend to leverage our expertise in our core business areas through alliances and partnerships to help drive innovative client solutions. We currently have operations in more than 14 markets internationally with over 1,400 employees.
In connection with our strategy to increase our high margin revenue base in the software services and products area, we have formed a separate wholly owned software unit, CDC Software. CDC Software is focused on building our intellectual property asset base, establishing partnerships with software vendors and broadening overall software product offerings in the areas of enterprise solutions and integration. Our management may pursue CDC Software’s strategy through acquisitions, strategic partnerships, joint ventures, consolidation of our software assets and restructurings or combinations of the foregoing approaches. We own 51% of IMI and recently acquired 100% of Pivotal. IMI is an established provider of software to the supply chain management sector principally servicing customer packaged goods manufacturers and suppliers, retail stores and wholesale distributors across Europe and the United States. Pivotal is an international customer relationship management company that provides a complete set of highly flexible customer relationship management applications and implementation services for mid-sized enterprises, with over 1,700 customers worldwide. In addition, we have entered into a merger agreement with Ross, which we anticipate to close in the second quarter of 2004 for total consideration of approximately US$68.1 million in the form of cash and our Class A Common Shares. Ross is a software company that provides enterprise software solutions to manufacturers with a focus on the food and beverage, life sciences, chemicals, metals and natural products industries, with over 1,000 customers worldwide.
53
Through chinadotcom Mobile Interactive Corporation, or CDC Mobile, a newly formed wholly owned subsidiary, we provide mobile services and applications, mobile technology consulting, and advertising and interactive media services in Asia. Value-added mobile services have increased in popularity in China in recent years. The most popular of these services is SMS which allows subscribers to send short messages and access various products and services for delivery to their mobile handsets on demand. In April 2003, CDC Mobile’s 81.3% owned subsidiary, hongkong.com, acquired Newpalm, a leading SMS provider based in Beijing, China, to deliver our mobile services and products in China. Newpalm has access to the large mobile subscriber base in China through the two mobile operators, China Mobile and China Unicom. As of December 31, 2003, Newpalm had 5.5 million subscriptions and generated revenues of US$16.9 million for the year then ended. CDC Mobile intends to utilize its industry knowledge and international experience providing mobile technology consulting and development services in Korea for Korean leading telecom network operators to enhance our mobile services and applications offerings in China.
Through our wholly owned outsourcing subsidiary, CDC Outsourcing, we provide customers in countries such as the United Kingdom, the United States and Australia with elements of workflow, such as client and project management services using technologies and applications sourced from our low-cost outsourcing centers in China or India. In February 2003, CDC Outsourcing completed the acquisition of Praxa, an Australian information technology, or IT, outsourcing and professional services organization focusing on the development of relationships with large organizations that have a need for outsourced application development, management and maintenance. Praxa has an established client base consisting mainly of large enterprises and government agencies in Australia. We anticipate that Praxa will provide a distribution platform for our self-developed software products, as well as for the range of software solutions that we currently deliver across the Asia-Pacific region. In May 2003, CDC Outsourcing announced a 51%-49% joint venture with vMoksha Technologies, or vMoksha, an offshore IT outsourcing company headquartered in Bangalore, India. The intention of this joint venture is to provide a broad range of outsourcing related services to major software vendors and enterprises in the United States, Europe and Asia. CDC Outsourcing has sales and marketing offices in the United States, the United Kingdom and Australia, while its offshore development is located in India and China.
We provide advertising and marketing services primarily through Mezzo Business. Mezzo Business maintains multiple databases containing information about companies and businesses in Australia and New Zealand, such as standard and proprietary industry codes, sales revenue turnover, number of employees and company contact details. Mezzo Business conducts direct marketing activities for clients using information available from its database, such as telemarketing campaigns conducted through an in-house call center, direct mailing campaigns, and management of customer loyalty programs and campaigns. We also provide database marketing services through Mezzo Interactive Pty Limited, or Mezzo Interactive. Mezzo Interactive focuses on growing our database marketing business in the areas of traditional direct marketing and e-mail marketing utilizing data mining techniques, which involves a process of analyzing significant amounts of data to uncover patterns and relationships. Data mining has become an important part of customer relationship management as a method to better understand customer behavior and preferences.
Software and consulting services
Overview
Revenues from our software and consulting services business increased to US$50.7 million in 2003 from US$15.5 million in 2002. As a percentage of total revenues, revenues from our software and consulting services increased to 57% of total revenues in 2003 from 35% of total revenues in 2002.
54
Sales of IT products
Revenues from our sales of IT products business increased to US$8.0 million in 2003 from US$1.3 million in 2002. As a percentage of total revenues, revenues from our sales of IT products increased to 9% of total revenues in 2003 from 3% of total revenues in 2002.
Our sales of IT products business consists of the distribution, sales, and licensing of both our own proprietary enterprise resource planning software products and third-party enterprise resource planning software products. In addition, we provide our customers with professional services after the sale of an enterprise software product, including consulting services, training and post-contract support.
Enterprise application software is designed to support and automate the processes of an organization. Enterprise application software attempts to achieve company-wide integration of business and technical information across multiple divisions and organizational boundaries, such as finance, manufacturing, logistics, human resources, marketing, sales and customer service, utilizing common databases and programs that share data real time across multiple business functions. Enterprise application software can be further sub-categorized into more highly specialized processes an enterprise must engage in, including the following:
| | • | | Customer relationship management (CRM).CRM involves the technique of establishing and maintaining a long-term business relationship with customers by integrating information from the entire enterprise to provide detailed profiles of customers which allows all the links in the chain to have the information necessary to provide services. |
| |
| | • | | Supply chain management (SCM).Supply chain management involves the coordination of processes involved in producing, shipping and distributing products to ensure that the correct amount of product is in the correct locations at the right time and at the lowest possible cost. |
| |
| | • | | Business intelligence (BI).Business intelligence involves converting large volumes of data collected and stored by businesses into meaningful information and multi-dimensional reports and analyses for use in decision-making. Integrated with other components of enterprise application software, BI enhances the development of a business environment driven by performance management. |
| |
| | • | | Enterprise Resource Planning (ERP).ERP includes: |
| | • | | Human resource management (HRM). Human resource management involves processes to enable an organization to improve business results and increase workforce performance by leveraging technology and applications to manage and mobilize a unified, global workforce. These processes seek to more efficiently connect people, processes and systems, and align workforce contribution with business objectives. |
| |
| | • | | Financial management (FM).Financial management involves accounting and analysis applications that allow an organization to obtain greater visibility into financial results and control over expenditures, and provide guidance for better financial decisions. |
We are building a portfolio of enterprise software products which seeks to provide our customers with a complete range of “world-class” applications no matter what their enterprise needs. We currently offer products in each of the CRM, SCM, BI, HRM and FM enterprise software markets, and we will continue to seek to acquire additional software and technologies to complement the capabilities which our products offer.
We are targeting mid-sized enterprises and divisions of large businesses as our principal customer base. We believe that the mid-enterprises market is underserved, and represents a significant opportunity for us because we believe that these customers would find appealing the ability to contract with a single company which can offer a complete range of enterprise software products to meet all of their enterprise software needs.
55
We believe our large, global customer base is one of our competitive strengths. With the completion of our recent acquisition of Pivotal, we have added an additional 1,700 customers to our customer base which totals approximately 2,200 accounts worldwide, and we expect to add on additional 1,000 customers from our pending acquisition of Ross. Our software and consulting services clients include many of the world’s leading companies such as ASIMCO, BMW South Korea, Bosch, Carrefour, Cathay Pacific, Disney, Emirate Airlines, Guangzhou Baiyun Airport, HSBC, Hyandai Merchant Marine, Johnson & Johnson, KT Freetel (Korea Telecom’s wireless services arm), L’Oreal, LG Insurance, Mercer Consulting, Microsoft China, Nanjing Bayer, Northwest Airlines, Philips, Raybestos, Samsung Electronics, Shangri-La Hotels, Shell, United Carrier China, Volvo, and Wells Fargo. Clients also include governmental agencies such as the Hong Kong Housing Authority, the Australia Post, the Brisbane City Council, the United Kingdom Department of Trade, and Industry and the United Kingdom Department of Land Registry.
While we have clients worldwide, one of our key target markets will be the Greater China market. We believe that we can increase the rate of our revenue growth by targeting the emerging market in Greater China for applications software. We believe that the potential growth of the enterprise software and consulting services market for mid-market manufacturing is significant in Greater China.
Enterprise application software
Customer Relationship Management (CRM) Software. Our CRM software products are principally offered by Pivotal. Pivotal is an international CRM company that provides a complete set of highly flexible CRM applications and implementation services for mid-sized enterprises, with over 1,700 customers worldwide. We acquired Pivotal in February 2004 for US$35.9 million in cash and 1.85 million Class A common shares with a value of US$20.7 million using the value for chinadotcom shares in the transaction formula (the value of these shares was US$21.4 million using the trading price of chinadotcom shares on the day the acquisition was consummated).
Pivotal’s CRM suite consists of five product suites that help companies control the sales, marketing, service and partner processes core to their businesses.
| | • | | Pivotal Sales. Pivotal Sales provides critical customer information, opportunity management tools, and “best practices” sales methodologies for the enterprise sales force. It helps to enable global sales organizations to sell collaboratively across multiple regions, currencies and channels. With Pivotal Sales, organizations can share information across sales teams, accurately forecast their business, manage pipelines, automatically generate quotes and proposals, and easily configure products and services that meet specific customer needs. |
| |
| | • | | Pivotal Marketing.Pivotal Marketing is a comprehensive marketing automation product designed for end-to-end management of multi-channel campaigns and marketing processes. It reduces both the cost and time to create smart, personalized campaigns and significantly increases the ability to deliver better leads to the right sales resources at the right time. Pivotal Marketing also enables companies to optionally outsource their marketing automation solution, reducing total-cost-of-ownership by eliminating the need to invest in communications and hardware infrastructure. |
| |
| | • | | Pivotal Service. Pivotal Service provides customer service professionals with a robust solution to efficiently capture, track, manage, escalate, and resolve customer service or support requests. Pivotal Service automates the capture, management and resolution of customer service and support requests across multiple channels. It integrates with sales and marketing functions to provide service professionals with the tools and information they need to deliver personalized service for improved customer satisfaction. |
56
| | • | | Pivotal Interactive Selling. Pivotal Interactive Selling is a comprehensive product suite that enables companies to deliver a personalized online buying or selling experience for customers and sales professionals. Pivotal Interactive Selling simplifies the buying and selling experience for sophisticated products and services with interactive needs analysis and intelligent guided-selling services. Through Pivotal Interactive Selling, organizations increase sales effectiveness across all channels via comprehensive needs analysis, product cataloging, fixed and dynamic pricing, and configuration capabilities; and |
| |
| | • | | Pivotal Partner Management.Pivotal Partner Management empowers companies to more effectively manage their partner relationships. Pivotal Partner Management helps our customers’ partners to become collaborative members of their customer’s extended business team to generate sales, deliver customer value, and keep customers satisfied, while reducing the costs associated with managing those partners. |
In addition, Pivotal provides industry-specific products aimed at the financial services (capital markets, private banking, commercial banking and asset management), healthcare insurance, real estate/construction, and life sciences (medical device manufacturing) markets.
Supply Chain Management (SCM) Software. Our SCM software products are principally offered by IMI. IMI is an established international provider of software to the supply chain management sector, principally across Europe and the United States. We acquired our interest in IMI by acquiring 51% of IMI’s holding company, Cayman First Tier, in September 2003 in exchange for US$25.0 million to subscribe for new shares in Cayman First Tier and up to an aggregate of US$25.0 million in revolving loan facilities to Cayman First Tier. Symphony, a Palo Alto, California based venture capital company, holds the remaining 49% in Cayman First Tier.
IMI develops, markets, and supports client/server and Internet architectured application software that enables manufacturers, distributors, wholesalers, retailers, logistics service providers, and e-businesses to more effectively manage their supply chains. Supply chain management encompasses the execution of multiple customer-focused order fulfillment processes, including order management, pricing and promotion, handling, sourcing, warehouse management, transportation management, service management, CRM, and replenishment planning and coordination. The software products are designed to meet the complex fulfillment and customer service needs of distribution-intensive businesses. Vertical market solutions have been designed for retailers, wholesalers and consumer goods manufacturers.
| | • | | Solutions for retailers. IMI’s retail solutions help retailers (including grocery, specialty hard goods, and direct merchant retailers) improve ordering, fulfillment, and customer service across sales channels. The products are designed to provide full visibility and control of distribution center and store inventory, as well as managing orders from vendors, warehouses, stores, customers, and consumers. They permit distribution centers and stores to maintain and control product inventory and goods-in-transit, and to replenish store shelves based on expected consumer demand. The control and visibility of inventory helps retailers reduce out-of-stocks, increase product availability at the shelf, improve response to customer demand and better utilize store shelf capacity. |
| |
| | • | | Solutions for wholesalers. IMI’s wholesaler solutions focus on the grocery, specialty goods, and pharmaceutical and over-the-counter drugs industries. The solutions contain advanced order management, replenishment management, warehouse management, and collaborative management components. It is designed to give the wholesaler a logistics platform to enable very late customer orders, allow for multi-channel distribution within the same customer order, lower inventory handling and storage costs through managing cross-docking and merge-in-transit strategies throughout the logistics network, and support collaborative purchasing operations by providing suppliers with time-phased forecasts and replenishment schedules over the Internet. |
57
| | • | | Solutions for consumer goods manufacturers. IMI’s consumer goods manufacturer solutions target distribution-intensive supply chain operations and complement existing enterprise resource planning and supply chain planning systems. The products are designed to solve the problem of multi-channel integration through a collaborative order management solution that can fulfill global customer orders and deliver a single point of contact to customers. |
Business Intelligence (BI).Our BI software product, Executive Suite, is offered through all of the companies within CDC Software, in combination with their respective software offerings.
| | • | | Executive Suite.Executive Suite is a fully integrated financial management BI application providing budgeting and forecasting, statutory consolidations, reporting and analysis to a broad spectrum of customers. Executive Suite is based on Microsoft.NET and Microsoft SQL technology which allows access via web-based technology. |
Enterprise resource planning — Human Resource Management (HRM) and Financial Management (FM) Software. Our HRM and FM software products are principally offered by OpusOne Technologies. OpusOne Technologies is a developer and service provider of business management software solutions for state enterprises and multi-national corporations in Greater China. We acquired a majority interest in OpusOne Technologies in March 2002, and acquired the remaining interest in OpusOne Technologies that we did not otherwise already own in May 2003. The total consideration payable will be based upon a set multiple of average net earnings under US GAAP for the three years from 2003 through 2005, inclusive, and is payable in cash and chinadotcom common shares in installments during that period.
OpusOne’s products include the following:
| | • | | PowerHRP. PowerHRP is used in human resources and payroll administration to provide comprehensive data management functions for the storing, calculating, reading and tracking of employee information. Data management functions include comprehensive employee information management, including employee personnel information, payroll data, attendance, leave status, training, position, benefits and other user definable information. PowerHRP also provides process management functions, including recruiting, training, compensation and benefits, and employee performance functionality. Decision support tools are also available to assist in employee succession planning and budgeting. |
| |
| | • | | PowerATS.PowerATS is an attendance tracking system which provides functionality with respect to organizing working shifts, administering temporary changes to shifts, tracking late arrivals, early departures, absence, overtime and leave, tracking of meal locations, times and number of meals, and administering salary deductions. |
| |
| | • | | PowerESS.PowerESS is an Internet based employee self-service application which provides employees and managers with self-service functions for accessing and updating various human resources related data, such as personal information, leave applications and approvals, training applications and approvals, time sheets and pay slip inquiries. |
| |
| | • | | PowerBooks. PowerBooks is a financial accounting application which provides core financial accounting functionality, including general ledger, accounts receivable, accounts payable, cash management, project accounting and purchase and sales order. PowerBooks is capable of maintaining multiple sets of books within one company which may be used for dual US GAAP reporting, cash and accrual accounting, budgeting and forecasts. The product is tailored for the China market, and includes functionality for monthly PRC statutory reports and tracking value added taxes. PowerBooks is designed to provide credit management reports, including aged receivables reports, aged payable reports, and bank reconciliations. |
58
Distribution of third-party enterprise software products
CDC Software has entered into master distributorship arrangements with a number of software companies to distribute business applications to the Greater China market, including arrangements with Vignette to distribute content management and portal solutions, Best Software to distribute financial accounting and process manufacturing applications and Ross to distribute enterprise software applications to process manufacturers. CDC Software provides the sales, marketing, support and localized infrastructure necessary to enter into the master distributorship and value-added reseller arrangements.
Consulting services
We offer support and maintenance services to our software products through our 51%-owned subsidiary, IMI. Revenues from our consulting services increased to US$42.7 million in 2003 from US$14.2 million in 2002. As a percentage of total revenues, revenues from our consulting services increased to 48% of total revenues in 2003 from 32% of total revenues in 2002.
We offer eBusiness solutions consulting services primarily through our wholly-owned subsidiary, Ion Global. Ion Global (other than Ion Global Korea which is engaged in providing mobile solutions) is engaged in planning, architecting, and delivering e-business consulting services for both Fortune 500 multinational corporations and blue chip pan-Asian clients. We typically assist our clients with the adoption of web-based technologies to help them improve their CRM, enterprise application integration, and/or supply chain management. We focus on helping clients deploy web-based initiatives to either lower costs, increase sales, or increase efficiency. The industries with which we have the most experience are financial services, travel and transportation, government and consumer goods.
Our Australian subsidiaries, Praxa and PK Information Systems, or PKIS, which we acquired in 2003, provide information technology services in Australia with specialized capabilities in the areas of .NET application development and business intelligence solutions. Their clients include government agencies, local corporates as well as multinational corporations.
Outsourcing services
Through the joint venture between CDC Outsourcing and vMoksha, we intend to provide outsourcing related services to major software vendors and enterprises in the United States, Europe and the Asia-Pacific region, including information technology and applications services. In addition, with the acquisition of Praxa, which specializes in the provision of information technology products and services in the form of outsourcing, application development and support, and system integration in Australia, we expect to increase the number of potential clients for our low-cost PRC and India-based outsourcing platform.
Mobile services and applications
Overview
Revenue contributed by our mobile services and applications business constituted US$16.9 million, or approximately 19% of our total revenues, in 2003. As this segment was first introduced in 2003, there is no comparable data for 2002.
Mobile services and applications include SMS, content downloads and interactive services, such as chatting and mobile dating. Our mobile services and applications business is operated through Newpalm, which we acquired through our 81.3% owned subsidiary, hongkong.com in April 2003. Consideration was payable in installments. The first installment of US$14.0 million was paid in 2003 and the second installment of US$41.0 million was paid in February 2004.
59
Newpalm currently offers a comprehensive suite of mobile data applications, including dating, chatting, entertainment, information-related content and community services to mobile subscribers in China. Newpalm’s SMS and other mobile data services have experienced significant growth in both the number of subscriptions and revenues since it began offering these services in mid-2002. As of December 31, 2003, Newpalm had approximately 5.5 million subscriptions for its services, representing a growth rate of approximately 139% from 2.3 million subscriptions as of December 31, 2002. We expect Newpalm’s mobile services and applications business will continue to grow and contribute materially to our revenues and income. China has the world’s largest mobile subscriber base while its mobile penetration rate is relatively low when compared to developed countries.
On December 12, 2003, we announced that we intend to reorganize our mobile and portal unit as a wholly-owned subsidiary, CDC Mobile, and register an offering of CDC Mobile’s American Depositary Shares under the Securities Act of 1933, as amended. The purpose of the intended offering is to fund the operations of CDC Mobile following its reorganization as an independent company holding our assets and businesses that provide mobile services and applications, advertising and interactive media and Internet services including Newpalm. As a selling shareholder, we may also receive proceeds from the intended offering. While the offering is expected to commence in the first half of 2004, subject to the completion of all applicable regulatory review and market conditions, there is no assurance that it will be successfully completed. We anticipate that Newpalm will be included within CDC Mobile.
Products and services
Newpalm offers over ten different SMS products and subscription packages, with subscription fees ranging from RMB0.10 to RMB5.00 per SMS message or from RMB5.00 to RMB12.00 per month. Newpalm has revenue sharing arrangements with China Mobile and China Unicom under which Newpalm receives 85% to 88% of the subscription fee collected from a mobile subscriber, with the balance being retained by the mobile operators. In addition to our charges, the mobile operators separately charge their subscribers RMB0.10 or RMB0.20 for every SMS sent. These amounts are collected by the mobile operator and not shared with us. Some of Newpalm’s more popular products and services include:
Mobile Dating. Newpalm’s mobile dating service, X-City, is a subscription-based community service that provides a dating and chatting platform through which subscribers may meet and socialize or arrange to meet in person by sending and receiving short messages. X-City users can select a particular geographic location to meet friends and set criteria, including age, gender, hobbies and qualifications, for the friends they would like to meet. Newpalm may offer other value-added services at no additional charge with an X-City subscription, including news and weather information, and ringtone, picture and logo downloads to cross-sell its other mobile services. The monthly subscription fee for X-City is RMB5.00. In conjunction with our www.china.com portal, Newpalm launched X-City II in September 2003, an enhanced version of X-City that combines Newpalm’s mobile platform with Internet portals. X-City II allows subscribers to conduct chat sessions with online subscribers or mobile subscribers. In addition, subscribers are able to record and upload video clips and/or photos onto online websites, which enhances the communication among our online and mobile subscribers. We recently offered a new service to our X-City II subscribers in conjunction with the first official Miss China Pageant 2003. X-City II’s subscribers were able to view photos and video clips of the contestants on our www.china.com website. Newpalm charges a RMB8.00 monthly subscription fee for X-City II. Since the launch of X-City in September 2002, we believe X-City and X-City II have grown to be one of the most popular mobile dating communities in China. X-City and X-City II accounted for approximately 37.3% of Newpalm’s total revenues in 2003.
Fortune Telling. We offer a subscription and on-demand service that provides fortune telling and tips on one’s luck for the day. Users enter their birth dates and select fortune categories, such as relationships, general fortune or career that they would like to inquire. User fees for fortune telling consist of a monthly subscription
60
fee of RMB5.00 for daily fortunes or a fee of RMB0.20 for each fortune delivered on demand. Fortune telling accounted for approximately 19.9% of Newpalm’s total revenues for 2003.
Jokes. We offer jokes on both a subscription and on-demand basis. Users can subscribe to a fixed number of jokes to be delivered each day, or they can order on a per-joke basis, which is delivered on demand. Newpalm develops its daily jokes internally or selects jokes submitted by its users. The subscription fee for jokes consist of a monthly fee, depending on the number of daily jokes actually delivered or a fee of RMB0.20 for each joke ordered on demand. Jokes accounted for approximately 20.4% of Newpalm’s total revenues for 2003.
Mobile Games. Newpalm offers mobile games to subscribers through partnerships with third party game developers. Users can download these games to their handsets and play them with their handsets repeatedly. User fees for games are RMB5.00 to 9.00 per downloaded game. Mobile games accounted for less than 2.2% of Newpalm’s total revenues for 2003.
Information-Related Services. Newpalm offers current information, such as stock quotes, news and local weather conditions to its subscribers on a subscription and on-demand basis. Most of the information distributed from Newpalm’s mobile platform is aggregated from its content partners through revenue sharing arrangements. Newpalm users generally pay a fee of RMB0.20 per message, while selected services, such as weather information, are available on a monthly subscription basis at RMB6.00 per month. Information-related services accounted for approximately 17% of Newpalm’s total revenues for 2003.
Pictures and Ringtones. We provide ringtone, picture and logo downloads through Yahoo!’s portal and through our subscriber’s mobile handsets. The fee ranges from RMB1.00 to RMB2.00 per download, depending on the type of content downloaded. Pictures and ringtones accounted for less than 1.0% of Newpalm’s total revenues for 2003.
Lottery. In conjunction with provincial authorities in Heilongjiang, Jiangxi and Hubei, Newpalm, through a 50-50 joint venture arrangement with Shenzhen Shui Cai Company, offers lottery games that can be accessed through mobile phones. Newpalm’s mobile authentication and security technologies enable mobile phone users to enter wagers and receive prizes through their handsets. Newpalm receives a user subscription fee of RMB5.00 per month from each subscriber and shares 5% to 10% of the lottery revenue with the joint venture.
New SMS Products and Services. Newpalm has launched a China news SMS and multi-media messaging service, or MMS, that provides news content from our www.china.com portal for Newpalm’s subscribers. Developed in conjunction with the www.china.com portal, Newpalm recently added a celebrity news channel available to subscribers for RMB6.00 per month. We expect to continue to expand our existing mobile data products and services by developing and integrating new mobile data applications that we acquire, develop internally, or source through our operations in other markets, including Korea.
Newpalm is also offering limited wireless access protocol, or WAP, services, although we believe such services will expand in future periods as the base of WAP-enabled handsets continues to grow. Our WAP service offerings are similar to our SMS service offerings, except that the WAP products are delivered through our WAP platform in color graphics to handsets typically equipped with bigger or color screens.
Sales and Marketing. We focus our sales and marketing efforts on enhancing our relationships with China Mobile and China Unicom and launching promotions both through our portals and the general media. Currently we have approximately 100 marketing personnel who are located in Beijing, Nanjing, Shandong, Guangdong and Hangzhou and maintain our relationships with China’s mobile operators at the national and local provincial level. Our primary sales and marketing initiatives in mobile services and applications include promotional activities through mobile operators, bundled access through partnerships with mobile operators and handset manufacturers, direct marketing through consumer portals www.hongkong.com and www.china.com,
61
and general medial advertising in traditional media, including point-of-purchase promotions, newspaper and magazine advertisements, radio and TV advertisements.
Mobile Solutions
Ion Global Korea, our wholly-owned subsidiary, provides technology consultancy and development services for a number of leading Korean companies in the telecommunication industry. Ion Global Korea’s customers include network operators, mobile handset manufacturers and mobile application and content providers in Korea. Ion Global Korea offers a broad suite of mobile technology consulting and development services, such as hardware embedded development services and mobile content interface development services that cater to the CDMA network. Ion Global Korea has expertise in designing user interfaces and graphic user interfaces which are considered critical to the success or failure of a new mobile application. Ion Global Korea uses its expertise to provide technology services that allow its customers to distribute mobile content easily across a variety of mobile handsets and networks. In addition, Ion Global Korea has developed mobile marketing applications for its customers that enhance two-way interaction between mobile end-users and corporate advertisers.
Recent initiatives
Mobile payment services and interactive media services. In April 2004, we acquired Go2joy, a China-based mobile applications and services provider which offers, through a joint venture, a mobile payment service which enables users to pay for products and services using their mobile phones, and have the payments debited directly from their bank account. Go2joy has also partnered with other media companies in China which are seeking to develop interactive media services for television, including services to incorporate interactive voice recognition technology in television programs run on China’s national state-owned television station. In addition, Go2joy currently offers entertainment-related content to subscribers which use its interactive voice recognition technologies. In connection with the acquisition, we made an initial payment of US$9.6 million in April 2004, with remaining consideration, not to exceed US$50.4 million, to be paid in two installments in early 2005 and 2006.
Interactive games. In February 2004, our 81.3% owned subsidiary, hongkong.com, made a strategic investment in Beijing 17game Network Technology Co., Ltd., or 17game, a Beijing based online games company which has launched and distributed several successful online games in the China market, including Droiyan, which is one of the most popular games in the China market according to an online game magazine in China. 17game’s distribution network in China includes Internet cafes, software distributors, bookstores and department stores. 17game is continuing to build its portfolio of online games. 17game has licensed Travia, a leading online fantasy role-playing game in Korea, and expects to launch the game in the China market in the second quarter of 2004. In addition, 17game expects to launch a new online game, Yulgang, during 2004. Under the terms of the strategic investment, hongkong.com has the option to acquire a controlling interest in 17game with consideration to be paid over the next two years based upon an earn-out formula.
Advertising and marketing
Revenues from our advertising and marketing business decreased to US$19.6 million in 2003 from US$26.7 million in 2002. As a percentage of total revenues, revenues from our advertising and marketing business decreased to 22% of total revenues in 2003 from 61% of total revenues in 2002. Approximately US$11.0 million of the US$19.6 million of advertising and marketing activities revenues in 2003 was generated from our operations in South Korea, which have contracted significantly and which we believe will continue to decline principally due to the expiry in April 2003 of our exclusive service agreement with Daum Communications, a leading South Korean portal company, from which we had generated a significant amount of our online advertising and e-marketing services business.
62
Other reasons for the decline in advertising and marketing activities revenue between 2002 and 2003 are:
| | • | | our decision to close some of the non-profitable subsidiaries engaged in the advertising and marketing business; and |
| |
| | • | | difficult market conditions brought on by the outbreak of SARS in early 2003. |
During 2002 and 2003, because of low margins, we significantly reduced our operations involving online banner advertisement campaigns and online direct mailing and sponsorships programs. These operations were ceased in each of Australia, Hong Kong, Japan, the PRC, Singapore and Taiwan, and our operations in South Korea have contracted significantly. We are seeking to re-orient our advertising strategy away from online advertising and e-marketing services with low margins, to higher margin database marketing related services used to develop targeted campaigns for clients utilizing data mining techniques. Data mining involves the process of analyzing significant amounts of data retained in a database to uncover underlying patterns that may indicate trends or relationships, and has become a more important part of CRM as a method to better understand customer behavior and preferences. The uncovered relationship can then be utilized by a client to develop a targeted customer campaign.
Mezzo Business is at the forefront of our re-oriented advertising strategy to target higher margin database marketing related services by maintaining multiple databases containing information about companies and businesses in Australia and New Zealand. Mezzo Business provides clients with access to its databases to assist them in developing and refining marketing campaigns and offers analytical services utilizing data mining techniques. Mezzo Business also conducts direct marketing services, such as telemarketing campaigns, direct mailing campaigns, and management of customer loyalty programs. While these services constituted only a small part of our advertising revenues during 2003, we believe they will represent an increasing proportion of our revenues from advertising and marketing services activities in future periods.
For information regarding risks involved in our advertising and marketing activities, see Item 3.D —"Key Information — Risk Factors — Risks Relating to chinadotcom — Risks Relating to Our Advertising and Marketing Business”.
The online advertising revenues from the network of affiliated Web sites and advertising revenues recorded on our portals across Greater China from our www.china.com portal is also included in this segment. Our portal services and other media assets deliver content, create online communities and enable commerce across Asia, including Greater China.
Other income
Revenues from other income increased to US$2.3 million in 2003 from US$1.8 million in 2002. As a percentage of total revenues, revenues from other income decreased to 3% of total revenues in 2003 from 4% of total revenues in 2002.
Our other income is principally generated by our portal services. Each of our Web sites is a portal that acts as a gateway to the Internet. We have been developing our portal network since our inception in June 1997. Our portal network currently provides users with Chinese versions of Greater China content services, online community products, and e-commerce services, and an English version for Hong Kong. Our portals offer a unique blend of:
| | • | | content delivery services such as search engines, directories and localized information; |
| |
| | • | | community products such as e-mail, SMS, web-hosting, newsletters, chat and message boards; and |
63
| | • | | e-commerce products such as an online shopping mall and online subscription based products and services. |
Treasury management
We generated US$13.4 million of interest income in 2003, and as of December 31, 2003 our debt securities investment portfolio amounted to US$313.3 million. The prolonged period of low interest rates in 2003 presented us with the opportunity to continue executing our strategy of reducing our investments in long-term debt and transitioning to shorter-term, callable debt of higher credit quality, in anticipation of rising interest rates.
We invest on the basis of recommendations from international investment banks, as well as information and credit ratings provided by independent ratings agencies including Moody’s Investors Service and Standard & Poor’s. When purchasing or selling debt securities, our policy is to obtain between three and five competing quotes. Generally, a debt security’s credit quality depends on the issuer’s ability to pay interest on the amount borrowed and to repay principal. The lower the credit rating, the greater the risk the issuer will default or fail to meet their payment obligations, as determined by the rating agency. As of December 31, 2003, 93.86% of our debt securities were invested in AAA-rated callable securities of U.S. government sponsored enterprises or U.S. Treasuries. At present, we hold only one security that is rated lower than AAA. In the event of a downgrade in an investment to BBB-, as rated by Standard & Poor’s, or Baa3, as rated by Moody’s Investors Service, we will generally implement an orderly sale of the security in order to maintain a relatively conservative stance in our portfolio, although on a case-by-case basis we may decide to retain such debt securities. For a summary of the effects of our treasury management program on our liquidity and capital resources and our material market risks, see Item 3 — “Key Information — Risk Factors — Risks relating to chinadotcom — Risks relating to treasury management”, Item 5 — “Operating and Financial Review and Prospects # Liquidity and Capital Resources” and Item 11 — “Quantitative and Qualitative Disclosures About Market Risk”.
As of December 31, 2003, our entire investment in debt securities of US$313.3 million is effectively reflected in our consolidated financial statements at current market prices. At the end of each quarter, if the end of the quarter market price of a debt investment is below the original investment cost, the difference is charged to “accumulated other comprehensive income” under the shareholders’ equity section of our consolidated balance sheet. If the fair market value of any of our debt investments remains below its investment cost and is considered “other than temporary”, this decline would then be reflected as an expense under “impairment of cost investments and available-for-sale securities” in our consolidated income statement.
As of December 31, 2003, we had generated a significant portion of our interest income from our investment in debt securities. Our interest income, which was US$13.4 million for 2003, is a source of liquidity for our working capital needs. Of this US$13.4 million, US$12.3 million was generated by our investment in debt securities. Our consolidated quarterly interest income ranged from approximately US$2.9 million to US$4.0 million during 2003. Of this, interest income from debt securities ranged from approximately US$2.4 million to US$3.7 million. This reflects an annual interest income of US$12.3 million or a yield of 3.1% on the average balance of US$392.2 million of debt securities between January 1 and December 31, 2003, compared to a yield of 4.8% in 2002. The drop in yield from 4.8% in 2002 to 3.1% in 2003 was due to declining interest rates, the elimination of our holdings of long-term Range Accrual Notes and the ongoing implementation of a more conservative investment strategy of buying more highly rated securities for our investment portfolio.
C. Goals and Strategy
We have historically operated as a pan-Asian integrated Internet company with our business model centered around our e-business solutions and advertising businesses, including e-marketing services, portal services and other media. Our business model has evolved away from a pan-Asian Internet company, and our goal is to be a leading integrated enterprise solutions and outsourcing, value-added mobile services and
64
applications, and high value-added advertising and marketing services company offering services throughout Greater China and the Asia-Pacific region, Australia, North America, and the United Kingdom.
In light of the challenging environment in which our businesses operate, we have been and intend to be flexible in fulfilling our goal.
Software and consulting services
Competitive strengths
We believe our principal competitive strengths in our software and consulting services business include the following:
We offer a range of enterprise software products which enable businesses to increase revenues, margins and customer loyalty.Our enterprise software products attempt to achieve enterprise-wide integration of business and technical information across multiple divisions and organizational boundaries, such as finance, manufacturing, logistics, human resources and sales, utilizing common databases and programs that share data on a real time basis across multiple business functions. For example, our customer relationship management, or CRM, products unify sales, marketing and customer service employees and partners around customer processes and interactions. By maintaining all customer information in a shared database, our CRM products make it easy for different users to maximize their contribution to CRM by better capturing customer profiles and building one-to-one customer relationships. We believe our range of enterprise software products enables businesses to increase revenues through improving customer loyalty, which increases both customer retention and customer net value. Our customers also realize decreased costs by streamlining processes and interactions between employees, partners and customers. We offer enterprise software products for a range of enterprise activities, such as human resources and payroll administration, attendance tracking, Web based employee self service applications, financial accounting applications, warehouse management, order management, supply chain management and CRM.
We have developed industry products for specific industry segments (“micro-verticals”) in high growth markets. Many of our enterprise software products have been tailored to be industry-specific which allow businesses to immediately gain business benefits as the industry-specific customizations have already been completed. For example, with respect to Pivotal’s products, products have already been optimized and configured for such industries as financial services and healthcare, as well as specific segments within industries, including retail banking, investment banking/capital markets, private banking, asset management, commercial banking, healthcare insurance, real estate/construction and life sciences (medical device manufacturing). With respect to IMI’s products, IMI has tailored its order management, warehouse management, and store replenishment software products to the grocery, specialty goods and pharmaceutical and over-the-counter drugs industries.
Our products can be implemented rapidly and can be easily customized which helps to yield a low total cost of ownership. Businesses can use our products without significant customization, thereby expediting the implementation process. If they so desire, businesses can easily customize our products to reflect their own internal processes. As a result, our products can be cost-effectively deployed, and require few customer resources for ongoing support, system maintenance and end-user training. Our products are also relatively easy for end-users to learn, which results in lower ongoing training costs.
Our products can be scaled with the growing needs of our customers. Many of our customers require that our products support their growing number of employees, customers and partners. Our underlying architectures enable our customers to expand our products as their businesses grow by adding servers in a number of locations. This capability improves performance and enables our products to support larger numbers of concurrent users.
65
CDC Outsourcing is CMM-certified. CDC Outsourcing allows for elements of workflow, such as client and project management to be provided in the contracted country, including the United Kingdom, the United States or Australia, with technology and applications sourced from our low-cost, industry standard CMM-certified, or Capability Maturity Model, outsourcing centers in China or India.
Strategy
Our goal is to become a leading integrated enterprise solutions company offering a complete range of software products to meet the needs of mid-sized enterprises, with the capability of providing high quality, low cost outsourced software development services to develop additional products and offer support services complementary to our product line to meet our customers’ needs. The key elements of our strategy are as follows:
Grow our product line through selective acquisitions. We have been growing the breadth of enterprise software products we offer, and will seek to acquire additional software and technologies to complement the capabilities which our products offer. In March 2002, we acquired OpusOne Technologies which has developed several proprietary enterprise software related applications, including human resources and payroll administration, attendance tracking, Web based employee self service applications, and financial accounting applications. In September 2003, we acquired a 51% stake in the holding company of IMI which offers warehouse management, order management and supply chain management software. In February 2004, we completed our acquisition of Pivotal which offers a complete set of highly flexible CRM applications for mid-sized enterprises. We believe that mid-market customers would find appealing the ability to contract with a single company which can offer a complete range of enterprise software products to meet all of their enterprise software needs, and we will continue to seek to acquire from around the world “best of breed” software and technologies to complement the line of enterprise software products which we offer.
Extend existing applications and product scope. We intend to continue the development of our applications to add new functionality. For example, in April 2003, Pivotal introduced Pivotal 5 which features assisted selling, comprehensive marketing automation functionality, new eService capabilities, and significant platform enhancements to improve flexibility, ease of customization, user productivity, and web services enablement. We also released version 6.1 and 6.2 of our OpusOne human resource and payroll solution with significantly improved flexibility and functionality. We developed a new “HR Analyzer” module that provides business intelligence functionality to human resource and payroll databases. In 2004, CDC Software intends to release version 2.1.5 of Executive Suite, its fully integrated financial and business performance management application. Version 2.1.5 is expected to enable double-byte language for the Asia markets and other functional improvements. We believe continued investments in our core products will increase our competitiveness in attracting new customers and increase our cross-selling opportunities within our existing customer base. In addition, we plan to offer new versions of our applications that support a wider variety of international customers and their respective business practices and languages. We also intend to continue to develop industry products for specific industry segments (“micro-verticals”) in high growth markets where we believe we can cost effectively generate leads and enhance our product differentiation.
Leverage upon cross-selling opportunities with our expanded customer base. With the completion of our recent acquisition of Pivotal, we have added an additional 1,700 customers to our customer-base which totals approximately 2,200 worldwide, and we expect to add approximately 1,000 additional customers from our pending acquisition of Ross. We believe that this large, global customer base provides a solid platform for cross-selling synergies within the group, and we plan on offering to individual customers the capability of purchasing from our group of related companies complementary product and service offerings. We further believe that our ability to approach individual customers is further enhanced with our greater global scale and global marketing presence. Through our group of related companies, we have a presence in North America, the PRC, India, Japan, Singapore, France, Germany, Ireland, the United Kingdom, Australia and New Zealand, among other places.
Target the emerging market in Greater China for applications software and leverage upon our experience and well-recognized brand name in the Asia-Pacific region.While we have clients worldwide, one of our key target markets will be the Greater China market. We believe that the potential growth of the enterprise software and consulting services market for mid-market manufacturing is significant in Greater China
66
because many companies are re-locating their manufacturing operations to Greater China due to lower overhead and labor costs, and because enterprise software products developed for the mid-market are more appropriate for the Greater China market due to the facts that in general, such products are easier to use, can be implemented rapidly and can be easily customized which helps to yield a low total cost of ownership; yet, such products can also be scaled with the growing needs of the customer. We believe our chinadotcom brand is well-recognized throughout China, and we intend to leverage upon our knowledge, experience and brand name in the Asia-Pacific region to grow our business.
Expand development and support capabilities, particularly through outsourcing to China and India.Through CDC Outsourcing, we have invested in our ability to offer high quality, low cost software development and support capabilities in India and China. Our outsourcing capability has grown through our 51%-49% joint venture with vMoksha technologies, an offshore IT outsourcing company headquartered in Bangalore, India which we entered into in May 2003 and our February 2003 acquisition of Praxa, an Australian IT outsourcing and professional services organization. In addition, Pivotal, which we acquired in February 2004, has a significant portion of its development resources and capability in Bangalore. We believe that these are important investments which will ultimately help our customers lower costs of critical functions such as software customization and enhancements, research and development, professional services and technical support. For example, in October 2003, we announced that Ross intends to outsource to our development center in China the development of an executive analytics application designed to provide users of Ross’ iRenaissance enterprise application with a summary of key performance indicators of financial metrics, sales, inventory and production information. We will continue to expand our development and support presence in China and India as part of our strategy to build out our product line and support our global customer base.
Mobile services and applications
Competitive strengths
We believe our principal competitive strengths in our mobile services and applications business include the following:
Integrated mobile and portal platforms with global exposure.We have established an international presence enabling us to offer a broad range of mobile products and services in China through our integrated mobile and portal platforms. We leverage our global exposure to introduce advanced mobile services and applications and to expand and enhance our product selections in China. Through Ion Global Korea’s mobile technologies expertise in Korea, which is considered to have one of the most advanced CDMA networks in the world, we can access over 500 content providers, allowing us to broaden our content offerings for our mobile applications products in China. In addition, we have made recent strategic investments to further enhance our capability to expand our product offerings and develop new products internationally.
Scalable, high-margin business model. Our mobile services and applications business is highly scalable with relatively low incremental operating costs. We have developed a cost-effective development and distribution platform. After incurring initial research and development costs for mobile applications, we can deliver such products to a large mobile subscriber base quickly and at a low cost.
Extensive China-wide network coverage with direct local connectivity. Newpalm’s mobile services and applications are accessible to China’s large mobile subscriber base through Newpalm’s nationwide network coverage. Newpalm offers direct local connectivity with China Mobile in 27 provinces and with China Unicom in 24 provinces. We believe our nationwide coverage facilitates our promotional activities and results in a higher sign-up rate for subscribers. Our coverage also contributes to our high success rate for SMS messages sent, which enhances our revenues and financial position.
67
Well-recognized brand names globally and in China. We believe our chinadotcom brand is well recognized throughout China and internationally, and we operate the popular www.china.com portal. As of April 1, 2004, Alexa, a subsidiary of Amazon.com, ranked www.china.com as 42nd of all websites globally, and also ranked www.china.com as 13th among all simplified Chinese character websites, as measured by user traffic. In addition, Newpalm is a well-recognized brand in China for SMS and value-added mobile services.
Experienced management team. Our management team has extensive experience in our businesses. For example, Newpalm’s management has an average of over 15 years of experience in the mobile data applications market in China and members of Newpalm’s management helped Motorola establish operations in China in the early 1990’s. We believe that our management’s extensive industry experience, combined with our dedication to and reputation for technical excellence, differentiates us from our competitors and provides us with a competitive advantage when introducing new mobile applications and recruiting new talent.
Strategy
Our goal in our value-added mobile services business is to become the dominant provider of mobile services and applications in China and to emerge as a major player in the mobile services and applications sector internationally. To achieve this goal, we intend to:
Expand our product selection and integrate new mobile services and applications. We are expanding our existing mobile data products and services by developing and integrating new applications. We also intend to leverage our existing integrated mobile applications, interactive media and marketing platforms to identify and develop new mobile data applications with the potential to generate significant consumer demand. We plan to use Ion Global Korea and joint venture partnerships to introduce to our subscribers in China and elsewhere a wide variety of online and mobile games and enhanced value-added mobile content that complement our existing suite of mobile data products. We plan to introduce leading mobile applications and innovative technology from various international markets to capitalize on the long term growth opportunities for mobile data services in China. We also intend to access developed markets to source advanced and innovative technologies and applications from these markets to the China market.
Broaden our customer base. We have maintained strong relationships with leading mobile telecommunications providers in China, at both the national and local provincial levels. We intend to further develop these relationships to expand our existing mobile data products, broaden our customer base and increase our average revenue per unit. We also intend to work more closely with provincial mobile operators to implement joint promotional services that target their mobile subscribers. We intend to use a variety of traditional media, including television, radio, newspaper and magazine advertisement, in addition to our existing marketing channels to enhance our marketing efforts.
Pursue selective strategic acquisitions and investments worldwide to achieve greater scale. We anticipate subscriber usage of data and other non-voice applications on mobile devices to grow significantly as China’s mobile network becomes more technically sophisticated through the deployment of newer network technologies. In response to this increasing demand, we intend to pursue strategic acquisitions and investments aimed at complementing our existing suite of mobile data products, services and applications. We are also actively pursuing selective investments outside China, such as investments in mobile data applications companies, to increase the scale of our business and strengthen our position as a leading provider of mobile services and applications in China.
Leverage our existing development capabilities in China to introduce mobile services and applications to other markets.We intend to extend our international presence by leveraging our existing development capabilities in China to introduce advanced mobile services and applications to other markets. We plan to use China as a development center for deploying domestic and international products and services by expanding our research and development capabilities in China. Currently, we plan to expand our research and development
68
center in Nanjing and conduct feasibility studies for new research and development centers at major Chinese universities. We believe the cost advantages associated with our development capabilities in China, and our mobile data experience in China, will enable us to introduce new and cost-effective mobile applications and services to the international market.
Advertising and marketing services
We are seeking to re-orient our advertising strategy away from online advertising and e-marketing services, with low margins performed for a fixed fee often relying upon short-term advertising campaigns and high volume, to higher margin database marketing and related services used to develop targeted campaigns for clients. In our experience, margins from online advertising and e-marketing services range from 20% to 30%, compared to that of margins in database marketing and related services, which range from 50% to 70%. We intend to focus on proprietary marketing and data mining services using our existing database marketing capabilities in Australia through Mezzo Business and Mezzo Interactive. Our current strategy includes:
| | • | | developing and enhancing our existing proprietary marketing databases; |
| |
| | • | | extending into recurring subscription based data services; and |
| |
| | • | | solidifying our existing sales channel relationships. |
While our new focus on database marketing is expected in generate higher margins in this business segment, we expect the revenues generated from our database marketing related services to be substantially lower than the revenues from online advertising and e-marketing services. Revenues from online advertising and e-marketing services have decreased following the expiry in April 2003 of our exclusive service agreement with Daum Communications, a leading South Korean portal company and the disposal of our Mezzo Korea business at the end of 2003.
Markets and Operations
We operate in 14 markets across Asia-Pacific, Australia, North America and Europe. Greater China represented 26%, 21% and 28%, of our total revenue in 2001, 2002 and 2003, respectively. The advertising and marketing activities business had been our primary revenue contributor over the last two years; however, as a result of our change in strategic direction, this business segment started to decrease in importance in 2003, accounting for 46%, 61% and 22% of total revenues in 2001, 2002 and 2003, respectively. The percentage of total revenues generated by advertising and marketing activities business declined in 2003 principally due to our decision to close some of the non-profitable subsidiaries engaged in the advertising and marketing business, the expiry in April 2003 of our exclusive service agreement with Daum Communications, a leading South Korean portal company, from which we had generated a significant amount of our online advertising and e-marketing services business, and the acquisition of Newpalm, which resulted in a significant percentage of revenues being generated by the mobile services and applications business. Software and consulting services accounted for 42%, 35% and 57% of total revenues in 2001, 2002 and 2003, respectively. Mobile services and applications, a new business segment introduced in the second quarter of 2003 as a result of our acquisition of Newpalm, accounted for 19% of total revenues in 2003. Other income, accounted for 12%, 4% and 2% of total revenues in 2001, 2002 and 2003, respectively.
As a material percentage of our business is derived from Greater China, seasonality linked to those markets, particularly the PRC, may affect our business. For example, the PRC, which accounted for 27% of our total revenues in the fourth quarter of 2003, has an extended holiday for the Lunar New Year in the first quarter of each year which affects all our operations in the mainland.
69
D. Organizational Structure
chinadotcom corporation was incorporated in June 1997. The following table sets forth our significant subsidiaries organized by business segment as of December 31, 2003. Please note that the following table does not include our intermediate holding companies.
Corporate Structure
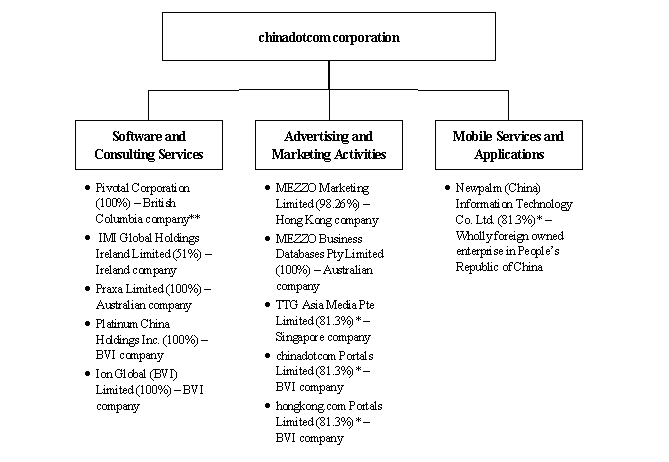
( ) Denotes percentage ownership
| * | | Subsidiaries held under chinadotcom Mobile Interactive Corporation through its 81.3% owned hongkong.com, which is listed on the Growth Enterprise of The Stock Exchange of Hong Kong Limited, or GEM |
| |
| ** | | Acquired February 25, 2004 |
70
Our PRC Corporate Structure
To comply with PRC legal considerations, hongkong.com conducts a significant portion of its operations through Beijing Newpalm Technology Co., Ltd., or Beijing Newpalm, and Beijing Wisecom Technology Co. Ltd., or Beijing Wisecom. hongkong.com has entered into trust deed arrangements with two of its employees, Mr. Wang and Ms. Xie, in connection with the shares of Beijing Newpalm and Beijing Wisecom. Mr. Wang and Ms. Xie each own 50% of Beijing Newpalm and 50% of Beijing Wisecom, respectively. Mr. Wang and Ms. Xie are trustees of the trusts. hongkong.com Limited, a wholly owned subsidiary of hongkong.com, is the beneficiary of the trusts.
Under the trust deed arrangements, Mr. Wang and Ms. Xie act as trustees of the shares of Beijing Newpalm and Beijing Wisecom, respectively, with hongkong.com as beneficiary. The appointment of Mr Wang and Ms. Xie is indefinite, unless terminated by the beneficiary. The trust deed arrangements require the trustees to transfer and administer the shares held under trust and distribute all dividends and interests payable on the shares held under the trust as directed by hongkong.com as the beneficiary. In addition, the trust deed arrangements require the trustees to vote their shares at such meeting in such manner as the beneficiary directs in writing. The trust deeds are governed by Hong Kong law and subject to arbitration in Hong Kong. No additional compensation is payable to Mr. Wang and Ms. Xie.
Beijing Newpalm and Beijing Wisecom hold the licenses required by the regulatory authorities in the PRC to provide SMS and other mobile application and services to public subscribers in the PRC. Beijing Newpalm has entered into an agreement with China Mobile to provide these services to mobile phone subscribers using the China Mobile network, and Beijing Wisecom has a entered into an agreement with China Unicom to provide these services to mobile phone subscribers using the China Unicom network. Beijing Newpalm and Beijing Wisecom have each entered into long term exclusive services agreements with Newpalm to outsource technical support and content from Newpalm, including sales and marketing, billing, and administrative services, in exchange for a fee. To facilitate the delivery of the technical support and content services, Newpalm owns all of the physical assets, including servers, switches and computers, and employs all of the technical, sales and administrative personnel necessary to deliver these services. The fees currently charged by Newpalm to Beijing Newpalm and Beijing Wisecom for its services represent approximately 85% of the gross revenue of each of Beijing Newpalm and Beijing Wisecom.
As part of the trust deed arrangements, we obtained executed share transfer documentation for the shares of Beijing Newpalm and Beijing Wisecom held by each of Mr. Wang and Ms. Xie. We can replace either Mr. Wang or Ms. Xie as trustee by submitting the executed transfer documentation to the Office of Administration of Industry and Commerce, or the OAIC, in the PRC. While OAIC’s approval of a share transfer is generally a routine procedure, a transfer from a trustee to a beneficiary would be unusual because it would represent a purported transfer for no consideration, and this may attract additional scrutiny by the OAIC. The OAIC could also delay or withhold approval if the former trustee alleges fraud or forgery in the transfer procedure. Because of these risks in the share transfer procedure, the trust deed arrangements may not be as effective in providing control as direct ownership of the businesses.
E. Property and Equipment
As of December 31, 2003, our executive headquarters occupy approximately 26,305 square feet of gross office space under various leasing arrangements at 34/F, Citicorp Centre, 18 Whitfield Road, Causeway Bay, Hong Kong. We also lease office and other space, as well as space for our servers, in various locations in Asia, Australia and the United States. The only real estate we own is our building located at 2-4 Old Street, Islington, London, which houses our Ion Global operations in the United Kingdom.
71
ITEM 5. OPERATING AND FINANCIAL REVIEW AND PROSPECTS
You should read the following discussion of our financial condition and results of operations together with our consolidated financial statements and the related notes included elsewhere in this Annual Report. This discussion contains forward-looking statements that involve risks and uncertainties. Our actual results may differ significantly from those anticipated in these forward-looking statements as a result of factors including, but not limited to, those set forth under Item 3.D. of this Annual Report, Key Information — Risk Factors, and included elsewhere in this Annual Report and Item 11 of this Annual Report, Quantitative and Qualitative Disclosures About Market Risk.
Overview
We are a leading provider of enterprise software products and mobile applications and services in China and internationally. Our strategic focus is to achieve scale in our two core business areas through a combination of ongoing organic expansion coupled with strategic acquisitions. In the enterprise software area, we made several significant acquisitions in 2003 (including Praxa, IMI and Executive Suite), and in February 2004 we acquired an internationally established pure-play CRM provider, Pivotal. We will consolidate Pivotal’s financial results from March 2004 onwards. In addition, in September 2003 we proposed the acquisition of Ross, an internationally established pure-play process manufacturing ERP software provider. We expect to complete our acquisition of Ross in the first half of 2004. In the mobile services and applications business, we acquired Newpalm, a leading SMS provider base in Beijing, China, in April 2003. The contribution of both Pivotal and Ross to our consolidated financial statements, combined with a full year of contribution in 2004 from companies acquired in 2003, will result in a considerable expected increase in annual revenues in 2004 as compared to 2003.
Subsequent to the year ended December 31, 2002, as a result of the evolution in our business strategy, in order to present our revenue in a more representative format, we changed our business segmental reporting from:
| | • | | “e-business Solutions”, |
| |
| | • | | “Advertising”, |
| |
| | • | | “Sale of IT Products”, and |
| |
| | • | | “Other Income” |
to:
| | • | | “Software and Consulting Services”, |
| | • | | “Sale of IT Products” |
| |
| | • | | “Consulting Services” |
| | • | | “Mobile Services and Applications”, |
| |
| | • | | “Advertising and Marketing Activities”, and |
| |
| | • | | “Other Income”, |
effective from January 1, 2003. From the first quarter of 2003 onwards, all prior periods’ comparative figures have been adjusted accordingly.
In addition, since we discontinued the operations of certain subsidiaries in the software and consulting services and advertising and marketing activities segments, certain historical comparative amounts have been reclassified to conform with the current year’s presentation. Only the numbers from continuing operations as of December 31, 2003 are presented for comparative purposes in the following sections.
72
We recorded net profit of US$15.5 million in 2003, on US$89.4 million of revenues from continuing operations, including acquisitions. For 2003, US$50.7 million of revenues were derived from software and consulting services, US$16.9 million from mobile services and applications, US$19.6 million from advertising and marketing activities, and US$2.3 million from other income. We recorded our first year of profit in 2003 since our IPO in July 1999, as the result of a continued focus on cost control, the divestment or closure of non-profitable or underperforming businesses, the contribution from new acquisitions, and from interest income derived from our existing cash balances.
Since 2000, we have derived a substantial portion of our income from interest income from our investment in primarily AAA-rated debt securities. For the fiscal year 2001, 2002, and 2003, we recorded interest income of US$26.7 million, US$23.7 million and US$13.4 million, respectively. We expect to earn less interest income in the future as we deploy our cash and invest the remaining cash in interest-bearing debt securities with lower yields than our current investments.
Effect of acquisitions
During 2003, we acquired several businesses material to our 2003 results for which we commenced consolidation at an interim period during the year:
| • | | In February 2003, we acquired Praxa, a leading Australian information technology outsourcing and professional services organization. We commenced consolidating the results of Praxa in February 2003, and Praxa contributed US$22.3 million of revenues during 2003, representing approximately 24.9% of our revenues. |
| |
| • | | In April 2003, we completed the acquisition of Newpalm, a leading SMS provider based in Beijing, China to deliver value added mobile services and products in China, and commenced consolidating the results of Newpalm. Newpalm contributed US$16.9 million of revenues during 2003, representing approximately 18.9% of our revenues. |
| |
| • | | In September 2003, we completed the acquisition of a 51% stake in IMI, an international provider of software products and services to the supply chain management sector principally across Europe and the United States, and commenced consolidating the results of IMI. IMI contributed US$11.2 million of revenues during 2003, representing approximately 12.5% of our revenues for the period. |
The acquisitions of Praxa, Newpalm and IMI contributed a total of approximately US$50.4 million of revenues during 2003, representing approximately 56.4% of our total revenues. Excluding the impact of these acquired businesses, revenues would have decreased by US$5.0 million during 2003, as compared to 2002. This reduction reflects the company’s planned exit from its low-margin, unprofitable on-line network advertising operation in Korea, MEZZO Korea. MEZZO Korea contributed US$10.7 million in revenues in 2003, down 43% from US$19.0 million in 2002. We reduced our holding in MEZZO Korea from 55% to 40% in November 2003, and sold our remaining holding completely in January 2004. Excluding MEZZO Korea’s revenues, core operating revenues in 2003 from continuing operations, not including acquisitions, were US$28.3 million, up 13% from 2002.
Revenues by business segment
The table below sets forth the revenues from our principal business segments in US dollars and as percentages of our total revenues for the periods indicated:
73
| | | | | | | | | | | | | | | | | | | | | | | | | |
| | | Year ended December 31,
|
| | | 2001
| | 2002
| | 2003
|
| | | (in thousands of US$, except percentages) |
Revenues | | | | | | | | | | | | | | | | | | | | | | | | |
| Software and consulting services | | | | | | | | | | | | | | | | | | | | | | | | |
| Sales of IT products | | | 743 | | | | 2 | % | | | 1,339 | | | | 3 | % | | | 8,000 | | | | 9 | % |
| Consulting services | | | 15,900 | | | | 41 | % | | | 14,166 | | | | 32 | % | | | 42,699 | | | | 47 | % |
| Mobile services and applications | | | — | | | | — | | | | — | | | | — | | | | 16,876 | | | | 19 | % |
| Advertising and marketing activities | | | 18,087 | | | | 46 | % | | | 26,682 | | | | 61 | % | | | 19,558 | | | | 22 | % |
| Other income | | | 4,507 | | | | 11 | % | | | 1,821 | | | | 4 | % | | | 2,299 | | | | 3 | % |
| | | |
| | | |
| | | |
| | | |
| | | |
| | | |
| |
| | | | 39,237 | | | | 100 | % | | | 44,008 | | | | 100 | % | | | 89,432 | | | | 100 | % |
| | | |
| | | |
| | | |
| | | |
| | | |
| | | |
| |
Our revenues increased from US$39.2 million in 2001, to US$44.0 million in 2002 and to US$89.4 million in 2003, representing increases of 12% between 2001 and 2002 and 103% between 2002 and 2003. The increase in 2003 was principally a result of three significant acquisitions, Praxa in February 2003, Newpalm in April 2003, and IMI in September 2003. Our principal revenue segments are composed of (i) software and consulting services, divided into sales of IT products and consulting services, (ii) mobile services and applications, and (iii) advertising and marketing activities.
Software and consulting services
Sales of IT products.This business sub-segment consists of sales of software products (third-party software as well as proprietary and internally-developed software). This segment generated approximately 9% of our revenues during 2003, increasing from 3% of our revenues during 2002. Software revenue increased by 497% from US$1.3 million during 2002 to US$8.0 million during 2003 due primarily to the acquisition of Praxa in February 2003 which contributed revenues of US$6 million to this revenue segment during 2003. We expect revenues from this segment to increase in 2004 due to a full year of consolidation of results from Praxa and IMI which we acquired in February 2003 and September 2003, respectively, the consolidation of the results of Pivotal, which we acquired at the end of February 2004, starting from March 2004, and potentially the inclusion of the financial results of Ross which we have proposed to acquire within the first half of 2004.
Consulting services.This business sub-segment consists of income from provision of support and maintenance services of the software products, outsourcing of information technology consultants, professional consulting services, Web site design, and development and integration services. This segment generated approximately 48% of our revenues during 2003, increasing from 32% of our revenues during 2002. Consulting services revenue increased by 201% from US$14.2 million during 2002 to US$42.7 million during 2003 due primarily to the acquisition of Praxa in February 2003 and IMI in September 2003 which contributed revenues of US$16.3 million and US$11.1 million respectively during 2003. We expect revenues from this segment to increase in 2004 due to a full year of consolidation of results from Praxa which we acquired in February 2003 and IMI which we acquired in September 2003.
Mobile services and applications
This business segment was introduced in the second quarter of 2003 as a result of our acquisition of Newpalm. The mobile services and applications segment consists of income from SMS subscriptions, content downloads and interactive services, such as chatting and mobile dating, and contributed approximately 19% of our revenues in 2003. We believe the acquisition of Newpalm brought significant strategic and financial value to chinadotcom. During 2003, gross margin attributed to Newpalm amounted to US$14.6 million, representing a gross margin percentage of approximately 87%. Newpalm’s rate of sequential quarter-on-quarter growth began to slow in the third and fourth quarter of 2003, partly due to a considerably larger subscription base of over 5 million in the third quarter of 2003 compared to under 2.5 million as of the beginning of 2003. In addition to
74
slower sequential growth from an increasingly large subscription base, in the second half of 2003 Newpalm began a deliberate focus on new product development rather than on active marketing of existing products, which reduced the rate of new net subscription additions in the second half of 2003. Furthermore, the overall SMS market in China appeared to be experiencing a slowdown in growth during the second half of 2003. Despite a slower sequential quarterly growth rate recorded in the last two quarters of 2003, we expect revenues from this segment to continue to increase in 2004, due to both a full year of consolidation of results from Newpalm (which we acquired in April 2003), and also to the expected continued growth in the mobile applications industry and SMS market in China during 2004.
Advertising and marketing activities
This business segment consists of income from travel-related publishing and exhibition organizing activities, the sale of online banner advertising, sponsorships, direct mailings and offline advertising campaigns. Advertising and marketing activities revenue decreased 27% to US$19.6 million during 2003 from US$26.7 million during 2002. This segment generated approximately 22% of our revenues during 2003, decreasing from 61% of our revenues during 2002. The significant decline in the percentage of overall revenues attributable to advertising and marketing activities was due in large part to the acquisitions of Newpalm, Praxa, and IMI which resulted in a significant increase in our total revenues from these business segments. In addition, the expiry of our exclusive service agreement with Daum Communications, a leading South Korean portal company, in April 2003 also resulted in a decline in our revenues in this business segment. Because of low margins, we have terminated during 2003 most of our operations in Internet advertising and e-marketing services that involve the planning, sales, electronic delivery, tracking and post-campaign analysis of advertisements on a network of Web sites. Our last remaining on-line network internet advertising operation in South Korea was fully divested in January 2004. As a result, we expect the revenues from this segment to further decline in 2004, when compared to 2003.
Our top 10 customers accounted for 9%, 14% and 28% of our revenues for 2001, 2002 and 2003, respectively. Percentage of revenues generated from the top 10 customers increased between 2002 and 2003 due to the addition of several large governmental contracts, including contracts with Australia Post, a government agency in Australia, and a contract with the Department of Trade and Industry in the United Kingdom. No single customer accounted for 10% or more of the revenues during any of 2001, 2002 or 2003.
Cost of Revenues
Our cost of revenues increased from US$25.4 million in 2001, to US$27.8 million in 2002 and to US$48.1 million in 2003, representing increases of 9% between 2001 and 2002 and 73% between 2002 and 2003. The increase in 2003 was principally a result of the three significant acquisitions of Praxa in February 2003, Newpalm in April 2003, and IMI in September 2003. However, the relatively high gross margin of the Newpalm operation resulted in a significantly lower growth in cost of revenues than in revenues for 2003.
Software and consulting services.
Sales of IT products.Our cost of revenue from software sales increased to US$6.1 million for the year ended December 31, 2003 from US$668,000 in 2002. As a percentage of revenues, our cost of revenues for our sales of IT products increased to 76.5% in 2003 from 50% in 2002 mainly due to the lower margin of the sales of IT products revenue from Praxa as reseller of the IT products.
Consulting services.Our cost of revenue from consulting services increased to US$25.7 million for the year ended December 31, 2003 from US$6.3 million in 2002. As a percentage of revenues, our cost of revenues for our software and consulting services increased to 60% in 2003 from 44% in 2002 mainly due to the lower
75
margin of the outsourcing revenue from Praxa which amounted to US$16.3 million, or 38% revenues of the consulting services revenue in 2003.
Mobile services and applications.
This business segment was introduced in the second quarter of 2003 as a result of our acquisition of Newpalm. Although this segment contributed approximately 19% of our revenues in 2003, its high gross margin percentage of approximately 87% resulted in cost of revenues of only US$2.2 million, or only 5% of total cost of revenues for the company during 2003. We anticipate that the cost of revenues from this segment will increase in 2004, due to both a full year of consolidation of results from Newpalm (which we acquired in April 2003), and also to the expected continued growth in the mobile applications industry and SMS market in China during 2004. In addition, we anticipate that cost of revenues will increase at a slightly higher rate than the expected growth in revenues due to competitive pressures and pricing erosion in the marketplace.
Advertising and marketing activities.
The cost of revenues from advertising and marketing activities decreased 35% to US$13.0 million during 2003, from US$20.0 million during 2002, reflecting the 27% fall in revenues for the period and the reduced relative percentage of revenues contributed from the MEZZO Korea operation, which was characterized by a high cost of revenues and a commensurate low gross profit margin. Because of low margins, we terminated most of our operations in Internet advertising and e-marketing services during 2003 that involve the planning, sales, electronic delivery, tracking and post-campaign analysis of advertisements on a network of Web sites. As part of this trend, the expiry of our exclusive service agreement with Daum Communications, a leading South Korean portal company, in April 2003 resulted in a decline in our revenues and a more rapid decline in cost of revenues in the MEZZO Korea business segment. Our last remaining on-line network internet advertising operation in South Korea was fully divested in January 2004. As a result, we expect the cost of revenues from this segment to further decline in 2004, when compared to 2003.
Selling, General & Administrative expenses (SG&A)
S,G&A expenses increased to US$34.3 million in the year ended December 31, 2003, up 26% from US$27.2 million in 2002. The rise in S,G&A expenses was principally a result of the three major acquisitions made during 2003, Praxa, Newpalm and IMI. Praxa contributed US$5.3 million of S,G&A during 2003, Newpalm contributed US$3.7 million, and IMI contributed US$2.8 million. It is expected that S,G&A expenses will continue to rise in 2004, due to the acquisition of Pivotal in February 2004 as well as increased headcount, marketing and other expenses required for us to execute on our strategy of cross-selling the acquired companies’ products and integrating their operations in 2004 and beyond.
Depreciation and amortization
Depreciation and amortization expenses fell 27% from US$9.9 million in 2002 to US$7.2 million in 2003. The decrease was primarily due to a reduction in additional purchases of fixed assets combined with a greater percentage of fully depreciated fixed assets during the course of the year.
Net interest income
Net interest income fell 42% to US$12.4 million in 2003, from US$21.2 million in 2002. The reduction was principally the result of the following factors: (i) investments made during 2003 in acquiring new businesses which reduced the overall cash balance during the year as compared to 2002, and; (ii) lower prevailing interest rates in 2003 compared to 2002; (iii) a continuation of our strategy of reducing the overall tenure of our investments in debt securities to shorter-term, and lower yielding instruments. As of December 31, 2003, we had generated nearly all of our interest income from our investment of US$313.3 million in debt securities. The
76
treasury management program in 2003 involved investments in debt securities that were funded with credit facilities, such as the Global Master Repurchase Agreement between us and Fortis Bank nv-sa entered into in August 2001, or Repurchase Agreement, and the Total Return Swap Transaction Agreement between us and DBS Bank entered into in August 2002, or Swap Agreement. Under the Repurchase Agreement and the Swap Agreement, we may borrow up to US$400.0 million on such terms as we and the banks may mutually agree. These arrangements do not have termination dates, but are reviewed annually for renewal. Our debt security investments funded with the Repurchase Agreement and Swap Agreement are composed of more conservative, lower yielding instruments, involving the investment of cash holdings primarily into the debt securities of the U.S. government or U.S. government sponsored enterprises. During 2004, we intend to continue executing our strategy of reducing our investments in long-term debt and transitioning to shorter-term, callable debt of higher quality in anticipation of rising interest rates in the future. See “B – Liquidity and Capital Resources”.
Income Taxes
We recorded US$0.7 million of income tax benefits for the year ended December 31, 2003, principally as a result of deferred tax income arising from Newpalm which generated deductible temporary differences for the year, as compared to an income tax expense of US$0.1 million in 2002. While Newpalm tax concessions may not continue, due to the cumulative historical losses experienced by the Company in many of its key operating businesses over the last few years, we anticipate that our total income tax expenses in 2004 and 2005 will be lower than the statutory imposed rates in our major markets.
Net loss/income
We generated full year net income for the first time in 2003 of US$15.5 million. We had a net loss of US$18.2 million in 2002, which represented an 85% decrease from our net loss of US$124.4 million in 2001. As of December 31, 2001 and 2002, we had an accumulated deficit of US$216.2 million and US$234.4 million, respectively. As of December 31, 2003, accumulated deficit was reduced to US$218.9 million. We had incurred net losses in each quarter from our inception in June 1997 until September 30, 2002. We have recorded net income in each quarter since the quarter ended December 31, 2002. While we plan to continue our cost reduction efforts and expect to generate net income in future periods as we integrate our acquisitions, we are also subject to numerous risks. For further discussion regarding risks involved in our continued profitability, see Item 3.D — “Key Information — Risk Factors — Risks Relating to chinadotcom — Risks Relating to Our Overall Business — We have until recently a history of losses and cannot provide any assurance that we can achieve or sustain profitability”.
The following table summarizes our historical results of operations in U.S. dollars and as percentages of total revenues for the years ended December 31, 2001, 2002 and 2003.
| | | | | | | | | | | | | | | | | | | | | | | | | |
| | | Year ended December 31,
|
| | | 2001
| | 2002
| | 2003
|
| | | (in thousands of U.S. dollars, except percentages) |
Revenues | | | | | | | | | | | | | | | | | | | | | | | | |
| Software & Consulting Services | | | | | | | | | | | | | | | | | | | | | | | | |
| Sales of IT products | | | 743 | | | | 2 | % | | | 1,339 | | | | 3 | % | | | 8,000 | | | | 9 | % |
| Consulting services | | | 15,900 | | | | 41 | % | | | 14,166 | | | | 32 | % | | | 42,699 | | | | 47 | % |
| Mobile Services & Applications | | | — | | | | 0 | % | | | — | | | | 0 | % | | | 16,876 | | | | 19 | % |
| Advertising & Marketing activities | | | 18,087 | | | | 46 | % | | | 26,682 | | | | 61 | % | | | 19,558 | | | | 22 | % |
| Other income | | | 4,507 | | | | 11 | % | | | 1,821 | | | | 4 | % | | | 2,299 | | | | 3 | % |
| | | |
| | | |
| | | |
| | | |
| | | |
| | | |
| |
| | | | 39,237 | | | | 100 | % | | | 44,008 | | | | 100 | % | | | 89,432 | | | | 100 | % |
| | | |
| | | |
| | | |
| | | |
| | | |
| | | |
| |
77
| | | | | | | | | | | | | | | | | | | | | | | | | |
| | | Year ended December 31,
|
| | | 2001
| | 2002
| | 2003
|
| | | (in thousands of U.S. dollars, except percentages) |
Cost of revenues | | | | | | | | | | | | | | | | | | | | | | | | |
| Software & Consulting Services | | | | | | | | | | | | | | | | | | | | | | | | |
| Sales of IT products | | | (472 | ) | | | -1 | % | | | (668 | ) | | | -2 | % | | | (6,123 | ) | | | -7 | % |
| Consulting services | | | (11,451 | ) | | | -29 | % | | | (6,255 | ) | | | -14 | % | | | (25,697 | ) | | | -29 | % |
| Mobile Services & Applications | | | — | | | | 0 | % | | | — | | | | 0 | % | | | (2,247 | ) | | | -3 | % |
| Advertising & Marketing activities | | | (11,625 | ) | | | -30 | % | | | (19,999 | ) | | | -45 | % | | | (12,966 | ) | | | -14 | % |
| Other income | | | (1,892 | ) | | | -5 | % | | | (845 | ) | | | -2 | % | | | (1,084 | ) | | | -1 | % |
| | | |
| | | |
| | | |
| | | |
| | | |
| | | |
| |
| | | | (25,440 | ) | | | -65 | % | | | (27,767 | ) | | | -63 | % | | | (48,117 | ) | | | -54 | % |
| | | |
| | | |
| | | |
| | | |
| | | |
| | | |
| |
Gross Margin | | | 13,797 | | | | 35 | % | | | 16,241 | | | | 37 | % | | | 41,315 | | | | 46 | % |
Gross Margin % | | | | | | | | | | | | | | | | | | | | | | | | |
| Selling, general and administrative expenses | | | (73,297 | ) | | | -187 | % | | | (27,161 | ) | | | -62 | % | | | (34,325 | ) | | | -38 | % |
| Depreciation and amortization expenses | | | (19,180 | ) | | | -49 | % | | | (9,882 | ) | | | -22 | % | | | (7,182 | ) | | | -8 | % |
| Impairment of goodwill and intangible assets | | | (21,908 | ) | | | -56 | % | | | — | | | | — | | | | — | | | | — | |
| | | |
| | | |
| | | |
| | | |
| | | |
| | | |
| |
| | | | (114,385 | ) | | | -292 | % | | | (37,043 | ) | | | -84 | % | | | (41,507 | ) | | | -46 | % |
| | | |
| | | |
| | | |
| | | |
| | | |
| | | |
| |
Operating income/(loss) | | | (100,588 | ) | | | -256 | % | | | (20,802 | ) | | | -47 | % | | | (192 | ) | | | 0 | % |
| Interest income | | | 26,689 | | | | 68 | % | | | 23,713 | | | | 54 | % | | | 13,440 | | | | 15 | % |
| Interest expense | | | (1,272 | ) | | | -4 | % | | | (2,463 | ) | | | -7 | % | | | (1,070 | ) | | | -2 | % |
| Gains arising from share issuance of a subsidiary | | | (55 | ) | | | 0 | % | | | — | | | | — | | | | — | | | | — | |
| Gain/(loss) on disposal of available-for-sale securities | | | 4,411 | | | | 11 | % | | | (163 | ) | | | 0 | % | | | 4,599 | | | | 5 | % |
| Gain/(loss) on disposal of subsidiaries and investments | | | (1,915 | ) | | | -5 | % | | | (66 | ) | | | 0 | % | | | 469 | | | | 1 | % |
| Other non-operating gains | | | — | | | | 0 | % | | | 508 | | | | 1 | % | | | 961 | | | | 1 | % |
| Other non-operating (losses) | | | (922 | ) | | | -2 | % | | | (288 | ) | | | -1 | % | | | (153 | ) | | | 0 | % |
| Impairment of cost investment and AFS sec | | | (12,260 | ) | | | -31 | % | | | (5,351 | ) | | | -12 | % | | | — | | | | 0 | % |
| Share of income/(loss) in equity investees | | | (2,592 | ) | | | -7 | % | | | 682 | | | | 2 | % | | | (115 | ) | | | 0 | % |
| | | |
| | | |
| | | |
| | | |
| | | |
| | | |
| |
Gain/(Loss) before income taxes | | | (88,504 | ) | | | -226 | % | | | (4,230 | ) | | | -10 | % | | | 17,939 | | | | 20 | % |
| | | |
| | | |
| | | |
| | | |
| | | |
| | | |
| |
| Income taxes benefits (expenses) | | | (186 | ) | | | 0 | % | | | (113 | ) | | | 0 | % | | | 689 | | | | 1 | % |
| Gain/(loss) before minority interests | | | (88,690 | ) | | | -226 | % | | | (4,343 | ) | | | -10 | % | | | 18,628 | | | | 21 | % |
| Minority interests in income of consolidated subsidiaries | | | 3,162 | | | | 8 | % | | | 248 | | | | 1 | % | | | (2,204 | ) | | | -2 | % |
| | | |
| | | |
| | | |
| | | |
| | | |
| | | |
| |
Income/(loss) from continuing operations | | | (85,528 | ) | | | -218 | % | | | (4,095 | ) | | | -9 | % | | | 16,424 | | | | 18 | % |
| | | |
| | | |
| | | |
| | | |
| | | |
| | | |
| |
Discontinued operations | | | | | | | | | | | | | | | | | | | | | | | | |
| Loss from operations | | | (38,858 | ) | | | -99 | % | | | (14,681 | ) | | | -33 | % | | | (3,027 | ) | | | -3 | % |
| Income from disposals | | | — | | | | 0 | % | | | 545 | | | | 1 | % | | | 2,127 | | | | 3 | % |
| | | |
| | | |
| | | |
| | | |
| | | |
| | | |
| |
Net income/(loss) | | | (124,386 | ) | | | -317 | % | | | (18,231 | ) | | | -41 | % | | | 15,524 | | | | 17 | % |
| | | |
| | | |
| | | |
| | | |
| | | |
| | | |
| |
| (1) | | In 2003, chinadotcom adopted new reporting segmentation, changing from the previous segmentation consisting of e-business solutions, advertising, sales of IT products and other income, to the current segmentation of software and consulting services, mobile services and applications, advertising and marketing activities and other income. In addition, chinadotcom discontinued the operations of certain subsidiaries in the software and consulting services and the advertising and marketing activities segments. In accordance with SFAS 144, Accounting for the Impairment or Disposal of Long-Lived Assets, the operating results of the discontinued operating units were retroactively reclassified as a loss from operations of discontinued subsidiaries on the consolidated statements of operations. As a result, the results of the continuing operations of 2001 and 2002 were reclassified to conform to the 2003 presentation. |
Year ended December 31, 2003 compared to year ended December 31, 2002
Due to the adoption of the new reporting segments as described in note (1) above, and due to the discontinued operations of certain subsidiaries in the software and consulting services and advertising and marketing segments, certain historical comparative amounts have been reclassified to conform with the current year’s presentation. Only the numbers from continuing operations as at December 31, 2003 are presented for comparison purposes in the following sections.
Revenues
Total revenues for the year ended December 31, 2003 increased 103% to US$89.4 million from US$44.0 million in 2002, principally as a result of three major acquisitions made in the enterprise software and mobile applications segments, including Praxa, IMI and Newpalm.
78
Software and consulting services
Sales of IT products. Revenues from our sale of IT products for the year ended December 31, 2003 increased to US$8.0 million from US$1.3 million in 2002. The significant increase in software and consulting services revenue was primarily attributable to the acquisition of Praxa in February 2003 which contributed US$6.0 million of revenue from the date of the acquisition to December 2003. The acquisition represents part of our strategy to grow our software business. Excluding the acquisition of Praxa, revenue in 2003 would have increased over 2002 by US$0.7 million.
Consulting services. Revenues from our consulting services for the year ended December 31, 2003 increased to US$42.7 million from US$14.2 million in 2002. The significant increase in consulting services revenue was primarily attributable to the acquisition of Praxa in February 2003 and IMI in September 2003, which contributed US$16.3 million and US$ 11.1 million of revenue from the date of their acquisitions to December 2003. The consulting services include the support and maintenance services provided by IMI during the period. Excluding the acquisition of Praxa and IMI, revenue in 2003 would have increased over 2002 by US$1.1 million.
Mobile services and applications
This revenue segment was introduced in the second quarter of 2003 as a result of the acquisition of Newpalm in April 2003 through our 81.3% owned subsidiary, hongkong.com. Revenue from this segment which amounted to US$16.9 million for the year ended December 31, 2003 was attributable to the subscription revenue from this newly acquired business. During 2003, Newpalm recorded a rapid increase in paid SMS subscriptions, from approximately 2.2 million at the start of 2003 to approximately 5.5 million at the end of the year.
Advertising and marketing activities
Advertising and marketing revenues decreased to US$19.6 million for the year ended December 31, 2003 from US$26.7 million in the same period of 2002. The general decline in advertising and marketing activities revenue between 2002 and 2003 is attributable to several factors, including:
| • | | our decision to close some of the non-profitable subsidiaries engaged in the advertising and marketing business; |
| |
| • | | the expiry in April 2003 of our exclusive service agreement with Daum Communications, a leading South Korean portal company, from which we had generated a significant amount of our online advertising and e-marketing services business; |
| |
| • | | a reduction in our holding in Mezzo Korea from 55% to 40% in November 2003, and to 0% in January 2004; and |
| |
| • | | difficult market conditions brought on by the outbreak of SARS in early 2003. |
The adverse impact was partially offset by the contribution and performance of Travel Trade Gazette, or TTG, a Singapore-based trade publication owned by hongkong.com, contributing revenue of US$5.3 million for the year ended December 31, 2003. While we saw signs during the fourth quarter of 2003 of recovery in those markets which were exposed to SARS earlier in the year, we do not expect a full recovery in such markets until at least the second half of 2004.
Other income.Revenues from other products and services we offer to our clients, mainly from portal operations, increased to US$2.3 million for the year ended December 31, 2003 from US$1.8 million in 2002. Despite the unfavorable operating environment as a result of SARS, the portal continued to make progress in
79
terms of joint partnerships and strategic developments, which contributed to the improvement in performance during the year.
Cost of revenues
Total cost of revenues increased by 73% to US$48.1 million for the year ended December 31, 2003, up from US$27.8 million in 2002. The increase in cost of revenues was lower than the increase in revenues due to the fact that the newly acquired revenues had a higher gross profit margin compared to our existing products. It is anticipated that this trend will continue in 2004 with the addition of Pivotal and a full year of consolidation of Newpalm’s operating results., which has a higher prevailing gross profit margin (and hence lower relative cost of revenues) than our existing businesses.
Software and consulting services
Sales of IT products.Our cost of revenue from software sales increased to US$6.1 million for the year ended December 31, 2003 from US$668,000 in 2002. As a percentage of revenues, our cost of revenues for our sales of IT products increased to 76.5% in 2003 from 50% in 2002 mainly due to the lower margin of the sales of IT products revenue from Praxa as reseller of the IT products.
Consulting services.Our cost of revenue from consulting services increased to US$25.6 million for the year ended December 31, 2003 from US$6.3 million in 2002. As a percentage of revenues, our cost of revenues for our software and consulting services increased to 60% in 2003 from 44% in 2002 mainly due to the lower margin of the outsourcing revenue from Praxa which amounted to US$16.3 million, or 38% revenues of the consulting services revenue in 2003.
Mobile services and applications
Our cost of revenue from mobile services and applications was US$2.2 million for the year ended December 31, 2003, representing a gross margin of 87% due to the high margin nature of the subscription revenue of mobile value added services in China.
Advertising and marketing activities
Our cost of revenue from advertising and marketing activities revenues decreased by 35% to US$13.0 million for the year ended December 31, 2003 from US$20.0 million in 2002. This decline was greater than the 27% decline in revenues for this segment in the year ended December 31, 2003 due to the steady reduction in significance of the on-line network advertising operations in Korea, which had lower gross profit margins (and hence higher cost of revenues) than the average for this segment. An additional contributing factor was the slightly higher margin contribution from the travel-related revenue from TTG which amounted to US$5.3 million in 2003. Consequently, as a percentage of revenues, our cost of revenues for our advertising and marketing activities decreased to 66% in 2003 from 75% in 2002.
Other income. Our cost of revenue from other income sources increased by 30% to US$1.1 million for the year ended December 31, 2003 from US$845,000 in 2002. The increase was in line with the corresponding increase in revenue. As a percentage of revenues, our cost of revenue for our other income sources increased slightly to 47% in 2003 from 46% in 2002.
Operating expenses
Total operating expenses rose by 12% for the year ended December 31, 2003 to US$41.5 million, from US$37.0 million in 2002. The increase was principally a result of the three acquisitions made in the enterprise software and mobile applications segments, offset by reductions in costs across the remainder of our businesses.
80
Selling, general and administrative expenses.Our selling, general and administrative expenses increased 26% to US$34.3 million for the year ended December 31, 2003 from US$27.2 million in 2002. As a percentage of revenues, our selling, general and administrative expenses decreased to 38% of revenues in 2003 from 62% of revenues in 2002. The decrease in selling, general and administrative expenses as a percentage of revenues is attributable to several factors, including the following:
| • | | the ongoing implementation of cost control measures, including reductions in our workforce and closure of non-profitable offices. Excluding the additional headcount resulting from our acquisitions of Newpalm, IMI and Praxa, total headcount from our existing businesses was reduced by approximately 40% from 952 in December 2002 to 576 in December 2003, resulting in US$1.9 million of cost savings in continuing operations. As at December 31, 2003, the headcount at Newpalm and IMI were 189 and 213, respectively. Headcount at Praxa as at December 31, 2003 was 201, comprised of 123 permanent employees and 78 temporary staff. In addition, we closed non-profitable offices relating to our software and consulting services operations in Taiwan, the PRC, Hong Kong, Korea, the United States, Japan and Thailand. We also closed non-profitable offices relating to our advertising and marketing services operations in Taiwan and the PRC. |
| |
| • | | a more rapid increase in revenues as a result of the acquisitions of Newpalm, Praxa and IMI which, in general, have higher net margins than our existing operations. During 2003, Newpalm, Praxa and IMI had selling, general and administrative expenses of US$3.5 million, US$5.3 million and US$2.8 million, respectively, although these companies contributed US$16.9 million, US$22.3 million and US$11.2 million of our revenues, respectively, during 2003. |
Excluding the impact of the acquisitions of Newpalm, Praxa and IMI, selling, general and administrative expenses decreased as a percentage of revenues from 61% during 2002 to 57% in 2003.
Depreciation and amortization.Our depreciation and amortization expenses decreased to US$7.2 million for the year ended December 31, 2003 from US$9.9 million in 2002. This decrease reflected the slowdown in investment in new property, plant and equipment during the course of the years 2002 and 2003, as well as the increasing percentage of fully depreciated fixed assets. However, this decrease was partially offset by the increase in amortization expenses of intangible assets as a result of the acquisition of Praxa, Newpalm and IMI which collectively contributed an additional US$1.9 million of amortization expenses in 2003.
Impairment of goodwill and intangible assets. There was no impairment of goodwill and intangible assets in 2003 or in 2002 based on our impairment tests performed in accordance with SFAS 142. See Item 5 — “Operating and Financial Review and Prospects — Critical Accounting Policies and Estimates — goodwill and intangible assets”.
Interest income
Our interest income decreased to US$13.4 million for the year ended December 31, 2003 from US$23.7 million in 2002. This decrease was attributable to several factors, including:
| • | | lower overall prevailing interest rates in 2003 as compared to 2002; |
| |
| • | | implementation of a more conservative investment strategy of buying shorter term securities with higher credit ratings and lower attendant yields; |
| |
| • | | lower overall cash levels in 2003 due to our acquisition activities; and |
| |
| • | | a decrease in our holding of long-term range accrual notes. |
On a quarterly basis, our interest income ranged from approximately US$2.9 million to US$4.0 million.
81
The treasury management program in 2003 involved investments in debt securities that were funded with credit facilities, such as the Global Master Repurchase Agreement between us and Fortis Bank nv-sa entered into in August 2001, or Repurchase Agreement, and the Total Return Swap Transaction Agreement between us and DBS Bank entered into in August 2002, or Swap Agreement. For further information on our repurchase facilities and their related risks, see Item 5 — “Operating and Financial Review and Prospects — Liquidity and Capital Resources”.
The weighted average interest rates on short-term borrowings as of December 31, 2002 and 2003 were 2.1% and 1.4%, respectively.
Interest expense
Our interest expense decreased to US$1.1 million for the year ended December 31, 2003 from US$2.5 million in 2002. This decrease in interest expense was principally due to a reduction in aggregate borrowings under our repurchase facilities and a decline in average interest rates during the same period.
Other gains and losses
Our gain on disposal of available-for-sale securities was US$4.6 million for the year ended December 31, 2003 as compared to a loss on disposal of US$163,000 in 2002. We had no gain or loss on disposal of subsidiaries compared to a loss of US$66,000 in 2002, which included the write-off of balances due from disposed subsidiaries. We recorded other non-operating losses of US$153,000 in 2003, compared to US$288,000 in 2002. We recorded a loss of US$115,000 for the share of income in equity investees in 2003 compared with a gain of US$682,000 in 2002. There was no impairment of available-for-sale securities in 2003 compared to a loss of US$5.4 million in 2002.
Net income/(loss)
For the year ended December 31, 2003 we recognized a net income of US$15.5 million compared to a net loss of US$18.2 million in 2002. The principal contributors to profitability were (i) a continued focus on the closure of underperforming, unprofitable businesses; (ii) ongoing cost reduction exercises across key markets and operations, including strategic headcount reductions, and; (iii) the acquisition of businesses that contributed profit in 2003, principally Newpalm, but also including Praxa and IMI.
During 2003, we generated net income from continuing operations of US$16.4 million compared to a net loss from continuing operations of US$4.1 million during 2002. The major factors behind the increase in net income from continuing operations were a net contribution of US$10.9 million attributable to the Praxa and Newpalm acquisitions and US$4.6 million of gains arising from the disposal of securities during 2003.
During 2003, we generated net losses from discontinued operations of US$3.0 million compared to net losses from discontinued operations of US$14.7 million during 2002. Operations that were discontinued had incurred expenses of US$16.7 million and US$2.5 million for the years ended December 31, 2002 and 2003, respectively. Income from disposals of such discontinued operations resulted in a gain of US$2.1 million in 2003 and US$545,000 in 2002.
Year ended December 31, 2002 compared to year ended December 31, 2001
Certain historical comparative amounts have been reclassified to conform with new presentation in 2003, due to the adoption of new reporting segmentation. In 2003, we changed from the previous segmentation of e-business solutions, advertising, sales of IT products and other income, to the current segmentation of software and consulting services, mobile services and applications, advertising and marketing activities and other income. We also discontinued the operations of certain subsidiaries in the software and consulting services
82
and the advertising and marketing activities segments in 2003. Only the numbers from continuing operations are presented for comparison purposes in the following sections.
Revenues
Total revenues for the year ended December 31, 2002 increased 12% to US$44.0 million, from US$39.2 million in 2001, principally as a result of a strong revenue income from the on-line network advertising business in Korea, as a result of the 2002 Soccer World Cup, partially offset by US$1.1 million decrease in revenue from our software and consulting services business and US$2.7 million decrease from our portal operations.
Software and consulting services
Sales of IT products. Revenues from our software sales increased to US$1.3 million for the year ended December 31, 2002 from US$743,000 in 2001. The increase of sales was mainly attributable to the increased sales of railroad ticketing software and hardware in China under Times Software in 2002.
Consulting services. Revenues from our continuing operations in consulting services decreased to US$14.2 million for the year ended December 31, 2002 from US$15.9 million in 2001. The decline in consulting services revenue was generally attributable to an overall deterioration in market conditions in 2002 across all of our major markets, as well as lower revenues from our business units in Korea, Taiwan, Australia, Hong Kong, the United States, Japan, the PRC and Thailand, due to the closure of non-profitable units. These operations generated revenues of US$23.5 million and US$15.1 million, before restatement for discontinued operations, respectively, for the years ended December 31, 2001 and 2002, which represented 41% and 26% of total revenues for 2001 and 2002, respectively. The continued global economic slowdown in 2002 resulted in a dramatic reduction in the demand for our services and in the ability of companies to budget for and commission such services.
Advertising and marketing activities
Our advertising and marketing revenues increased to US$26.7 million for the year ended December 31, 2002 from US$18.1 million in 2001 due principally to increased online network advertising revenues from South Korea which experienced a significant increase in demand for marketing services, increasing revenues from US$7.8 million in 2001 to US$18.9 million in 2002, as a result of South Korea’s hosting the World Cup in 2002. In addition, the acquisition of IncNet and other direct marketing and data mining businesses in Australia resulted in additional revenues of US$2.6 million for the year ended December 31, 2002.
Other income
Revenues from other products and services we offer to our clients, mainly from portal operations, decreased to US$1.8 million for the year ended December 31, 2002 from US$4.5 million in 2001. The decline in other income revenue was generally attributable to an overall deterioration in revenue and market conditions in 2002 from portal operations including hongkong.com and china.com.
Cost of revenues
Total cost of revenues for the year ended December 31, 2002 increased 9% to US$27.8 million, from US$25.4 million in 2001. The increase was broadly in line with the increase in revenues for the year, and was principally the result of the growth in the marketing and advertising business during the course of the year.
83
Software and consulting services
Sales of IT products.Our cost of revenue from sales of IT products increased to US$668,000 for the year ended December 31, 2002 from US$472,000 in 2001. As a percentage of revenues, our cost of revenues for software and consulting services decreased to 50% in 2002 from 64% in 2001 primarily due to the improved margins of sale of railroad ticketing software and hardware products in China.
Consulting services.Our cost of revenue from consulting services decreased to US$6.3 million for the year ended December 31, 2002 from US$11.5 million in 2001. As a percentage of revenues, our cost of revenues for software and consulting services decreased to 44% in 2002 from 72% in 2001. Cost of revenues for consulting services revenue in 2002 decreased from 2001 due principally to the reduced level of business activity during 2002.
Advertising and marketing activities
Our cost of revenues from advertising and marketing activities increased to US$20.0 million for the year ended December 31, 2002 from US$11.6 million in 2001, reflecting the overall trend of revenue growth as a result of the soccer World Cup held in Korea in mid-2002. As a percentage of revenues, our cost of revenues for advertising and marketing activities increased to 75% in 2002 from 64% in 2001. This increase reflected the higher cost of revenues, and hence lower gross profit margins, of the Korean marketing business relative to other marketing activities.
Other income
Our cost of revenue for other income sources decreased to US$845,000 for the year ended December 31, 2002 from US$1.9 million in 2001 which is consistent with the 60% decrease in revenues from other income from US$4.5 million in 2001 to US$1.8 million in 2002. The decline in revenues from other income was generally attributable to an overall deterioration in market conditions in 2002 for our portal operations business, including hongkong.com and china.com.
Operating expenses
Total operating expenses decreased 68% for the year ended December 31, 2002, to US$37.1 million, from US$114.2 million in 2001. The decrease was due to (i) reduced selling, general and administrative expenses due to decreased overall headcount, as well as across-the-board cost savings throughout the company; (ii) Lower depreciation and amortization expenses in 2002; (iii) no impairment of goodwill and intangible assets in 2002, as compared to US$21.9 million of such expenses recorded in 2001.
Selling, general and administrative.Our selling, general and administrative expenses significantly decreased to US$27.2 million for the year ended December 31, 2002 from US$73.3 million in 2001. As a percentage of revenues, our selling, general and administrative expenses decreased to 62% of revenues in 2002 from 187% of revenues in 2001. This was due to effective cost control measures, including closure of some non-profitable business units during the period, and overall reductions in group-wide headcount.
Depreciation and amortization expense.Our depreciation and amortization expense decreased to US$9.9 million for the year ended December 31, 2002 from US$19.2 million in 2001. This decrease reflected the decrease in additional purchases of property, plant and equipment during the course of the years 2001 and 2002, as well as an increase in the percentage of fully depreciated fixed assets.
Impairment of goodwill and intangible assets.Based on our impairment tests performed in accordance with SFAS 142, there was no impairment of goodwill and intangible assets in 2002 as compared to US$21.9 million recorded in 2001. See Item 5 — “Operating and Financial Review and Prospects — Critical Accounting Policies and Estimates — goodwill and intangible assets”.
84
Interest income
Our interest income decreased to US$23.7 million for the year ended December 31, 2002 from US$26.7 million in 2001. This decrease was principally due to several factors, including lower overall prevailing interest rates during 2002, the implementation of a more conservative investment strategy of buying more highly rated securities for our investment portfolio with lower yields, lower cash levels in 2002, and a decrease in our holdings of long-term range accrual notes. The treasury management program in 2002 involved investments in debt securities that were funded with credit facilities, such as the Repurchase Agreement and the Swap Agreement, and the investments were composed of more conservative, lower yielding instruments, involving the investment of cash holdings primarily into the debt securities of U.S. government sponsored-enterprises.
As of December 31, 2002, an aggregate of US$125.1 million was outstanding under our repurchase facilities with US$115.0 million outstanding under our Repurchase Agreement and US$10.1 million outstanding under our Swap Agreement. Proceeds from the drawdowns were used to purchase additional treasury instruments that yielded US$3.8 million in interest income in 2002. Approximately US$151.1 million, or 30.0%, of our total cash and cash equivalents and debt securities available-for-sale as of December 31, 2002 is effectively set aside as collateral under the Repurchase Agreement and Swap Agreement, and categorized as restricted debt securities in our consolidated balance sheet.
The weighted average interest rate on short-term borrowings as of December 31, 2001 and 2002 was 2.2% and 2.1%, respectively.
Interest expense
Our interest expense increased to US$2.5 million for the year ended December 31, 2002 from US$1.3 million in 2001. This increase was principally due to an increase in aggregate borrowings under our repurchase facilities for the purchase of additional investments in debt obligations.
Other gains and losses
There was no gain or loss arising from share issuance of a subsidiary for the year ended December 31, 2002 as compared to a loss of US$55,000 in 2001. Our loss on disposal of available-for-sale securities was US$163,000 in 2002 as compared to a US$4.4 million gain in 2001. Our loss on disposal of subsidiaries and cost investments decreased to US$66,000 in 2002 from a loss of US$1.9 million in 2001 which included the write-off of balances due from disposed subsidiaries of US$93,000. We recorded other non-operating gains of US$508,000 in 2002 and other non-operating losses of US$288,000 in 2002. We also recorded a gain of US$682,000 for the share of results in equity investees in 2002 compared with a loss of US$2.6 million in 2001.
Impairment of cost investments and available-for-sale securities
We recorded a loss of US$5.4 million for the impairment of cost investments and available-for-sale securities for the year ended December 31, 2002 compared to a loss of US$12.3 million in 2001. This loss was principally the result of impairments on our available-for-sale securities.
Net loss
We recognized a net loss from continuing operations of US$4.1 million for the year ended December 31, 2002 compared to a net loss of US$85.5 million in 2001. The principal contributors to the reduction in losses were a continued focus on the closure of underperforming, unprofitable businesses, and ongoing cost reduction exercises across key markets and operations, including strategic headcount reductions. The net loss of the subsidiaries classified as discontinued operations for the years ended for the year ended December 31, 2001 and 2002 was US$38.9 million and US$14.7 million, respectively.
85
| B. | | Liquidity and Capital Resources |
Liquidity.The table below sets forth the summary of our cash flows for the periods indicated:
| | | | | | | | | | | | | |
| | | Year ended December 31,
|
| | | 2001
| | 2002
| | 2003
|
| | | (in thousands of US$) |
| Net cash provided by (used in) operating activities | | | (17,642 | ) | | | 15,926 | | | | 13,195 | |
| Net cash provided by (used in) investing activities | | | (120,527 | ) | | | (8,830 | ) | | | 118,119 | |
| Net cash provided by (used in) financing activities | | | 111,506 | | | | 5,237 | | | | (108,959 | ) |
| Net increase (decrease) in cash and cash equivalents | | | (26,663 | ) | | | 12,333 | | | | 22,355 | |
| Cash and cash equivalents at beginning of period | | | 47,483 | | | | 20,820 | | | | 33,153 | |
| Cash and cash equivalent as at end of period | | | 20,820 | | | | 33,153 | | | | 55,508 | |
Cash from operating activities.Net cash provided by operating activities was US$14.9 million for the year ended December 31, 2003 compared to US$15.9 million for 2002. The positive cash flow from operations in 2003 was attributable principally to the net income of US$15.5 million, gain on disposal of available-for-sale securities of US$4.6 million, gain on disposal of subsidiaries and cost investments of US$ 2.6 million, and a net increases in operating liabilities of US$6.8 million. These items were partially offset by adjustments for certain non-cash items including depreciation of US$5.3 million and amortization of goodwill and intangible assets of US$3.6 million.
Despite a net loss of US$18.2 million for the year ended December 31, 2002, cash flow from operations in that year was US$15.9 million. This was due primarily to a net reduction in accounts receivable of US$7.2 million due to improvements in credit control management, and a net reduction in deposits, prepayments and other receivables of US$11.0 million due to the reduction in office space and a prepayment for an investment which was subsequently paid. These items were partially offset by the adjustments for certain non-cash items including loss on disposal of property and equipment of US$1.7 million, depreciation of US$11.3 million, amortization of US$1.2 million, net investment impairment of US$ 5.4 million and other non-cash items, amounting to US$17.4 million.
There was a cash outflow from operating activities of US$17.6 million for the year ended December 31, 2001 principally as a result of ongoing operating losses.
Cash from investing activities.Net cash provided by investing activities was US$116.4 million for the year ended December 31, 2003, which was mainly from the net proceeds from disposal of available-for-sale securities of US$155.9 million, partially offset by the use of US$13.4 million for the acquisitions of subsidiaries (net of cash acquired of US$5.9 million and exclusive of US$25 million paid for the acquisition of IMI which is eliminated on consolidation), including US$14.0 million as the first installment for the purchase of Newpalm and US$3.6 million for the purchase of Praxa. In addition, loans of US$25.0 million to Symphony and US$2.0 million to Pivotal relating to the acquisition were extended during the year.
Net cash used in investing activities was US$8.8 million for fiscal year 2002. During 2002, we used US$18.9 million to expand our business in the Asia-Pacific region, which included US$5.5 million used for property and equipment, US$4.6 million used for the acquisitions of OpusOne Technologies and Mezzo Australia, and US$8.8 million for the acquisition of intangible assets. In addition, US$7.0 million was used for the purchase of promissory notes and warrants to Sagent. These were partially offset by the net proceeds from disposal of available-for-sale securities of US$15.1 million.
86
Net cash used in investing activities in 2001 was US$120.5 million, the result of numerous acquisitions made in the strategic business areas of e-business consulting, marketing and advertising, and portal and related businesses.
Cash used in financing activities.During the year ended December 31, 2003, cash flows used in financing activities of US$109.0 million consisted primarily of net repayment of bank loans of US$106.4 million and US$11.0 million used in the purchase of treasury stocks, offset by an issuance of share capital of US$8.5 million.
Positive cash flow from financing activities of US$5.2 million during 2002 was due to net increase of bank loans of US$8.9 million, offset by US$4.4 million used for the purchase of treasury stocks.
Positive cashflow from financing activities was US$111.5 million in 2001, due to a net increase of bank loans.
Capital Resources
As of December 31, 2003, we had US$55.5 million in cash and cash equivalents, US$238,000 of restricted cash, which consisted of time deposits pledged for utilities, and approximately US$313.3 million mainly invested in available-for-sale securities issued by U.S. government-sponsored enterprises, international corporations and commercial banking institutions. We believe that the combination of our available cash and cash equivalents, the net cash provided by operating activities and interest income will be sufficient to meet our capital needs for the foreseeable future.
Funding arrangements.Our primary capital funding sources are cash flow from operations and interest income generated from our cash holdings and debt securities, which can fluctuate according to the composition of our investment portfolio.
From July 1999 until December 2003, we financed our operations and met our capital expenditures and commitments from the net proceeds of our private placements, our July 1999 IPO, our second public offering in January 2000 and our March 2000 initial public offering for hongkong.com, as well as the interest income derived from investing such proceeds in debt securities. For the year ended December 31, 2003, we generated net income of US$15.5 million.,
Our total capital expenditures amounted to US$8.3 million, US$5.5 million and US$1.6 million in 2001, 2002 and 2003 respectively. The primary capital expenditure in each of those years was the purchase of computers, servers and network equipment, and other items related to the expansion of our business network across the Asia-Pacific region, the United States and the United Kingdom.
For the foreseeable future we anticipate that we will fund operations and capital expenditures primarily with net income generated by our operations, as well as by applying the cash holdings still available to us from the proceeds of our equity offerings.
We have primary lines of credit with two commercial banks through our repurchase facilities, which in the aggregate enable us to borrow up to US$400.0 million on such terms as we and the banks may mutually agree. In August 2001, each of chinadotcom and our subsidiary, hongkong.com, entered into a Global Master Repurchase Agreement with Fortis Bank nv-sa, an AA- rated bank (as rated by Standard & Poor’s) to establish a repurchase facility which enables us to draw down via Fortis Bank, Hong Kong Branch up to US$250.0 million in funding for a one year term. In addition, another repurchase facility with similar terms was negotiated in August 2002 with DBS Bank, allowing us additional access of up to US$150.0 million for a three-year term. Both facilities were established to provide us with a source of reasonably priced capital to give us flexibility to finance operational working capital and acquisitions, as well as our treasury management program, without having to liquidate our investment portfolio at short notice.
87
Under these repurchase facilities, any drawdown requires us to sell certain debt securities to the bank at a certain price, and the bank agrees to sell back to us the same securities at the same purchase price at a later date. During the period of the drawdown, the bank has agreed to pay us any income generated by coupons in respect to the sold debt securities. In return, we have agreed to pay interest to the bank at Libor plus a spread. As of December 31, 2003, our cost of borrowing was Libor plus 0.20% for the Fortis Repurchase Agreement and Libor plus 0.35% for the DBS Bank Swap Agreement.
Over the course of 2003, we had an average outstanding balance from our repurchase facilities of US$75.1 million used for the purpose of providing working capital for operations, liquidity for tranche payments for acquisitions, and for purchasing debt securities. Net of interest expense of US$1.1 million, these debt securities produced US$1.0 million of interest income, or approximately 7.5% of our total interest income in 2003. These investments were composed of more conservative, lower yielding instruments, involving the investment of cash holdings primarily into the debt securities of U.S. government sponsored enterprises. We have reduced our total outstanding balances under these repurchase facilities from US$125.1 million as at January 1, 2003 to US$25.1 million as of December 31, 2003. Of this US$25.1 million, US$15.0 million was used for financing working capital needs and not for purchasing debt investments, and is repayable within twelve months from December 31, 2003. The remaining US$10.1 million is repayable through 2005. Approximately US$31.1 million, or 8.4%, of our total cash and cash equivalents and debt securities are effectively set aside as collateral under the Repurchase Agreement and Swap Agreement, and categorized as restricted debt securities in our consolidated balance sheet.
As at March 11, 2004, we had executed additional drawdowns of US$62.0 million under the Fortis Repurchase Agreement to bring our total outstanding balance under our lines of credit to US$87.1 million. As at such date, approximately US$104.3 million has been set aside as collateral and categorized as restricted debt securities. These additional drawdowns were used to fund the final tranche payment of US$41.0 million for Newpalm, and our acquisition of Pivotal, and not for the purchase of additional debt securities.
In addition, certain of our operating companies maintain usual and customary lines of credit and overdraft protection accounts with banks to meet their operating needs.
Contractual Obligations and Other Commitments
Total long-term bank loans amounted to US$11.5 million as at December 31, 2003. Of this amount, US$10.1 million represents a swap transaction loan which is due in 2005. Debt securities with a fair value of US$11.9 million were pledged as collateral to secure this loan. The balance of long-term bank loans of approximately US$1.4 million represents mortgages on property. Freehold land and buildings with a carrying amount at December 31, 2003 of US$2.8 million are pledged as collateral to secure these mortgage loans. The weighted average interest rates on long-term bank loans as of December 31, 2003 was 1.6% compared to 2.1% as of December 31, 2002.
Commitments, leases and long-term contracts.As of December 31, 2003, we had future minimum office rental and telephone line lease payments under non-cancelable operating leases of US$5.5 million for 2004, US$2.7 million for 2005, US$1.8 million for 2006, US$1.3 million for 2007, US$0.7 million for 2008 and US$3.5 million thereafter.
| | | | | | | | | | | | | | | | | | | | | |
| | | Payments due by period |
| | | (in thousands of U.S. dollars)
|
| | | Total
| | less than 1 year
| | 2-3 years
| | 4-5 years
| | more than 5 years
|
| Operating lease obligations(1) | | | 15,612 | | | | 5,527 | | | | 4,512 | | | | 2,066 | | | | 3,507 | |
| Purchase obligations(2) | | | 41,000 | | | | 41,000 | | | | — | | | | — | | | | — | |
| | | |
| | | |
| | | |
| | | |
| | | |
| |
| Total | | | 56,612 | | | | 46,527 | | | | 4,512 | | | | 2,066 | | | | 3,507 | |
| | | |
| | | |
| | | |
| | | |
| | | |
| |
| As of December 31, 2003, we had incurred contractual obligations of US$56.6 million, consisting of the following: |
| |
| (1) | | Operating lease obligations consist of –future minimum office rental and telephone line lease payments under non-cancelable operating leases. |
88
| (2) | | Purchase obligations of US$41 million for the final installment in the acquisition of Newpalm, which was paid in February 2004. |
IMI.We have contractual obligations, as lender, for up to US$25 million under two loan facilities we have entered into in connection with our investment in IMI. In addition, in connection with our investment in IMI, we had granted Symphony, our joint venture partner, an option to sell to us all of its 49% interest in IMI under certain events. See Item 10.C – “Material Contracts – Expansion through Acquisitions and Partnerships – Cayman First Tier Loan Facilities” and “– Put Option Agreement”.
Pivotal. At December 31, 2003, we had a contractual obligation pursuant to a definitive agreement signed on December 8, 2003 to acquire Pivotal for total consideration of US$35.9 million in cash, 1.85 million common shares with a value of US$20.7 million using the value for chinadotcom shares in the transaction formula (the value of these shares was US$21.4 million using the trading price of chinadotcom shares on the day the acquisition was consummated) and US$481,000 in stock option conversion expenses. The acquisition was completed on February 25, 2004. See Item 10.C — “Material Contracts — Expansion through Acquisitions and Partnerships — Pivotal”.
Ross. We have contractual obligations under a definitive agreement entered into on September 4, 2003 to acquire Ross Systems, Inc. for aggregate consideration of approximately US$68.3 million in cash and chinadotcom shares. See Item 10.C – “Material Contracts – Expansion through Acquisitions and Partnerships – Ross Merger Agreement”.
Annual variations
Our historical revenues and operating results have varied substantially from year to year, and we expect this to continue. Factors that cause fluctuations in our operating results include:
| • | | completion of acquisitions, partnerships, joint ventures and other business combinations;; |
| |
| • | | discontinuation of non-performing and non-profitable businesses; |
| |
| • | | interest income from our treasury portfolio; |
| |
| • | | mark to market or realized losses and realized gains related to our treasury portfolio; |
| |
| • | | salaries and benefits to our employees; |
| |
| • | | administrative expenditures such as legal and other professional services; |
| |
| • | | general health of the economy and our sector and the ability of our customers to remain or become viable to pay for services provided; |
| |
| • | | demand for our software, mobile services and advertising and marketing services; |
| |
| • | | the amount and timing of capital expenditures and other costs relating the expansion of our operations; |
| |
| • | | our ability to record revenue from key clients; and |
| |
| • | | the introduction or elimination of products and services by us or our competitors. |
89
Inflation and changing prices
We do not anticipate any material impact on our net sales and revenues, or on our income from continuing operations as a result of the impact of inflation and changing prices.
Critical Accounting Policies and Estimates
Our discussion and analysis of our financial condition and results of operations are based upon our consolidated financial statements, which have been prepared in accordance with US GAAP. The preparation of these financial statements requires us to make estimates and judgments that affect the reported amounts of assets, liabilities, revenues and expenses, and related disclosure of contingent assets and liabilities. On an on-going basis, we evaluate our estimates, including those related to goodwill and intangible assets, investment, revenue recognition, accounts receivable and allowance for doubtful accounts. We base our estimates on historical experience and on various other assumptions that are believed to be reasonable under the circumstances, the results of which form the basis for making judgments about the carrying values of assets and liabilities that are not readily apparent from other sources. Actual results may differ from these estimates under different assumptions or conditions.
We believe the following critical accounting policies affect the more significant judgments and estimates used in the preparation of our consolidated financial statements.
Revenue recognition
We generate revenues from three primary sources: software and consulting services, mobile services and applications, and advertising and marketing services. Revenue is recognized in accordance with accounting principles generally accepted in the United States, or US GAAP. The specific literature we follow in connection with revenue recognition is the Securities and Exchange Commission’s Staff Accounting Bulletin No. 101 (“SAB 101”) Revenue Recognition in Financial Statements, the American Institute of Certified Public Accountants Statement of Position (“SOP”) 97-2, Software Revenue Recognition, as amended by SOP 98-9 Modification of SOP 97-2, Software Revenue Recognition, With Respect to Certain Transactions, and in certain instances, SOP 81-1, Accounting for Performance of Construction-Type and Certain Production-Type Contracts. We recognize revenue when we have persuasive evidence of an arrangement, the product has been shipped and title has passed or the services have been delivered, the price is fixed or determinable and collectibility is reasonably assured. In addition to these basic criteria, the following are the specific revenue recognition policies followed for each major stream of revenue by reporting segment.
Software and consulting services.Revenues in the software and consulting services segment are derived from the sale of software products, the maintenance, service and support for software licenses, the outsourcing of information technology consultants and the design, development and integration of Internet web sites.
Revenue from the sale of software products often includes a combination of hardware, software, training and maintenance services. We allocate the arrangement fee in these multi-element deals to each individual element using its fair value as determined by “vendor specific objective evidence”. Vendor specific objective evidence of fair value is determined by the customary price charged for each element when sold separately after the application of any standard approved discount. Where fair value exists for all undelivered elements of the arrangement, we apply the “residual” method of accounting and defer revenue allocated to the undelivered elements while recognizing the residual revenue allocated to the delivered elements. In the absence of vendor specific objective evidence for any undelivered element, we defer the entire arrangement fee and recognize revenue when all undelivered elements are delivered assuming all other basic criteria for revenue recognition have been met.
90
Outsourcing of information technology consultants involves contractual time and material outsourcing agreements whereby consultants are provided at agreed-upon billing rates for customers to deploy on their own internal projects. Revenues from time and materials outsourcing contracts are recognized as the services are delivered assuming all other basic criteria for revenue recognition have been met.
Revenues related to training services for software products are deferred and recognized as the services are delivered, assuming all other basic criteria for revenue recognition have been met. Where training services are sold as part of a multi-element deal, those services are evaluated, on a case-by-case basis, to determine whether they are essential to the functionality of the other elements of the arrangement. In cases where training services are considered essential to the functionality of the other elements of the arrangement, revenue from the total arrangement is deferred and recognized as the training services are delivered.
Revenues related to maintenance agreements on software products are deferred and recognized ratably over the term of the agreement which is normally one year.
Provisions for discounts and rebates to customers, estimated returns and allowances, and other adjustments are provided for in the same period in which the related revenues are recorded. Such provisions are calculated after considering relevant historical data.
Some of the engagements in the software and consulting services segment are for the design, development and integration of Internet web sites. These projects are usually fixed price and most have durations of six months or less. Customers enter into contractual arrangements with us that specify the required web design features, layout, functionality, implementation services required, expected deliverables, pricing, payment terms and project timetable. Invoicing and payments are usually made throughout the term of the project in accordance with the contractual terms. A majority of the projects include acceptance clauses requiring customers�� sign off at the conclusion of the projects. The arrangements allow the customer to withhold 10% of the total project cost as a retention until sign off and acceptance is obtained. Historically, we have not experienced many projects where sign off or acceptance has been withheld by a customer resulting in a material loss on a project. In limited situations, we receive change orders from customers, in which case, each change order request is assessed for its impact on the existing arrangement, and contract revenues and costs are only adjusted after both parties agree to the changes. We also receive change orders which result in the initiation of a separate project.
Revenues from the design and development of Internet web sites and the integration of those web sites with clients’ computer systems are recognized using contract accounting. In order to calculate the amount of revenue earned, we use the cost-to-cost percentage-of-completion method whereby amounts recognized are calculated by reference to the hours incurred as a percentage of the total estimated hours to complete the project. We use this input method to calculate revenues because historical experience has demonstrated that it produces a reliable indication of the progress on each engagement. Estimates of total projected contract costs are re-evaluated on a regular basis and, if appropriate, revised. Any adjustments to revenue due to changes in estimates are accounted for in the period of the change in estimate. When estimates indicate that a loss will be incurred on a contract upon completion, a provision for the expected loss is recorded in the period in which the loss becomes evident. Historically, we have not experienced material losses on fixed-price contracts. The majority of our contracts are short term in duration, and the use of the completed contract method would not result in a material difference in revenue earned.
We provide maintenance services related to Internet web sites. Maintenance services related to Internet web sites involves support in connection with non-significant customer requested changes to web site functionality, updates to web site information, and telephone support for web site administrators. Revenues from Internet web site maintenance agreements are deferred and recognized ratably over the term of the related agreements which are usually for periods of six months or one year.
91
Mobile services and applications.Our mobile services and applications segment derives revenues from the provision of value-added SMS such as dating and friends matching, e-mail, ring tone and logo downloads and various other related products to mobile phone users. We rely on mobile network operators in China to transmit the SMS messages and bill mobile phone users for SMS fees on a monthly or per message basis.
SMS revenues are recognized in the month in which the services are performed, assuming all other basic criteria for revenue recognition have been met. We book revenues on a monthly basis based upon confirmations from the network operators. At the end of each reporting period, where an operator fails to provide us with a monthly statement confirming the amount of SMS charges billed to their mobile phone users for that month, we use information generated from our own internal system and historical financial data to make estimates of the billing reconciliation rate and collectable SMS fees, and revenues are accrued accordingly.
Revenues from SMS services are recognized net of the mobile phone operator’s share of revenue and uncollectible amounts because we consider the operators to be the primary obligors in the information transmission and delivery process. The network operators are the primary obligor in the arrangement. The mobile phone operators are responsible for fulfillment, including the transmission of the SMS messages to the end users. We are transparent to the mobile phone users because we provide the services through the mobile phone operators. We recognize revenues on a monthly basis in the case of monthly subscriptions, on a message-received basis in the case of per message services, and on the basis of each successfully downloaded content in the case of games, ringtones and logos. We have no discretion over pricing of the services. Under arrangements with each mobile phone operator, changes require both parties’ approval. We have no discretion over supplier selection since there are currently only two mobile phone operators in China, and all SMS services must be routed through their networks.
Advertising and marketing services.Advertising and marketing services revenues are derived from the sale of online banner advertising, sponsorships, direct mailings and offline advertising campaigns.
Online banner advertising revenues are derived from short-term advertising contracts (normally less than 90 days), in which customers’ advertisements are placed on web sites for a set period of time or for a set number of impressions. Impressions are defined as the number of times that an advertisement appears on a selected web page. Customers typically identify the web sites they wish their advertisements to be displayed on, and in certain situations, the advertisements are also displayed on our own or our affiliated companies’ web sites. Revenues from online banner advertising are recognized in the period in which the advertisement is displayed at the lesser of the ratio of impressions delivered over total guaranteed impressions or ratably over the term of contract.
Sponsorship revenues are derived from advertisements placed on our own or our affiliated companies’ web sites and are usually for longer display periods than online banner advertisement agreements, but normally do not exceed one year. Sponsorship revenues are recognized ratably over the term of contracts, assuming all other basic criteria for revenue recognition have been met.
Direct mailing revenues are derived from targeted advertising campaigns. We transmit the advertisements in either electronic or hard copy form to the target profile or market. On occasion, we may also assist with the design of the advertisements. Revenues from direct mailing are recognized when the advertisements are sent, assuming all other basic criteria for revenue recognition have been met.
Offline advertising revenues are derived from the production and placement of advertisements in magazines and publications for the travel and tourism industry. Revenues are realized when the advertisements are published, assuming all other basic criteria for revenue recognition have been met.
92
We pay web sites for providing advertising space and become obligated to make the payment in the period the advertising is delivered. Such expenses are classified as cost of revenues in the consolidated statement of operations.
Certain of our subsidiaries act as advertising agents for their customers, and the related revenues derived from these agreements are recorded net in the consolidated statement of operations.
We pay affiliated web sites a percentage of advertising revenue, ranging from 50% to 85%, in exchange for providing advertising space to our network. We become obligated to make payments to such affiliated web sites in the period the advertising is delivered. Such expenses are classified as cost of revenues in the consolidated statement of operations. We record the revenue on a gross basis since it is responsible for the fulfillment of the contract, including the selection of the web site, arrangement of the ad placement and acceptability of the ad. In addition, we assume the credit risk for the amount billed to the customer and owed to an affiliated web site after the web site performs, regardless of whether we fully collect the sales price from the customer.
Goodwill and intangible assets
Goodwill represents the excess of cost over the fair value of net tangible and identifiable intangible assets of acquired businesses. Effective January 1, 2002, we adopted SFAS 142,Goodwill and Other Intangible Assets. In accordance with SFAS 142, we ceased amortizing goodwill and performed a transitional test of our goodwill as of January 1, 2002. SFAS 142 requires that goodwill be tested for impairment at the reporting unit level (operating segment or one level below an operating segment) on an annual basis and between annual tests in certain circumstances. The performance of the test involves a two-step process. The first step of the impairment test involves comparing the fair value of our reporting units with the reporting unit’s carrying amount, including goodwill. Fair value is primarily determined by computing the future discounted cash flows expected to be generated by the reporting unit. If the carrying value exceeds the fair value, goodwill may be impaired. If this occurs, we perform the second step of the goodwill impairment test to determine the amount of impairment loss. The fair value of the reporting unit is allocated to its assets and liabilities in a manner similar to a purchase price allocation in order to determine the implied fair value of the reporting unit goodwill. This implied fair value is then compared with the carrying amount of the reporting unit goodwill, and if it is less, we would then recognize an impairment loss. Prior to January 1, 2002, goodwill was amortized to expense on a straight-line basis over a period of two to five years. The carrying value of goodwill was reviewed for possible impairment whenever events or changes in circumstances indicated that an impairment might exist. The transitional impairment test performed in June 2002 indicated that the fair value of our reporting units exceeded the reporting units’ carrying amount including goodwill, and accordingly, goodwill was not impaired. In December 2003, an annual impairment test was performed, and the fair value of our reporting units exceeded the reporting units’ carrying amount including goodwill. As such, we concluded that goodwill was not impaired.
Intangible assets represent trademarks, service marks, URLs, software applications and programs, customer base, business licenses and partnership agreements. Intangible assets are carried at cost less accumulated amortization. Amortization is computed using the straight-line method over the estimated economic lives of the respective assets. The estimated useful lives of the intangible assets used are as follows:
| | | |
| Trademarks, service marks and URLs | | 20 years |
| Software applications and programs | | 2 to 15 years |
| Customer base and contracts | | 1.5 to 10 years |
| Business licenses and partnership agreements | | 6 to 7 years |
Annually, we review and adjust the carrying value of purchased intangible assets if the facts and circumstances suggest purchased intangible assets may be impaired. If this review indicates that purchased intangible assets may not be recoverable, as determined based on the undiscounted cash flows of the entity
93
acquired over the remaining amortization period, the carrying value of intangible assets will be reduced by the estimated shortfall in discounted cash flows.
Investments
Debt and marketable equity investments which represent securities classified as available-for-sale are recorded at gain or loss at fair value. Unrealized holding gains or losses, net of tax, on available-for-sale securities are reported in other comprehensive income/(loss) and are included in a separate component of shareholders’ equity. Realized gains and losses and declines in fair value judged to be other than temporary on available-for-sale securities are included in gain/(loss) on disposal of available-for-sale securities and impairment of available-for-sale securities, respectively. The cost of securities sold is based on the first-in, first-out method. Interest and dividends on securities classified as available-for-sale are included in interest income and other income, respectively.
All other investments, as to which we are unable to exercise significant influence and there is not a readily determinable market value, are accounted for under the cost method of accounting. Dividends and other distributions of earnings from investees, if any, are recorded as income when declared. We periodically evaluate the carrying value of our investments accounted for under the cost method of accounting, and any decline in value is included in impairment of cost investments.
When determining whether an impairment of investments exists or a decline in value of an available-for-sale security is other than temporary, we evaluate evidence to support a realizable value in excess of the current market price for securities with readily determinable fair value. Such information may include the investment’s financial performance, including such factors as earnings trends, dividend payments, asset quality and specific events, the near term prospects of the investment, the financial condition and prospects of the investment’s region and industry, and our investment intent. Typically, a sustained decline in the market value of a quoted security for six months is generally indicative of an other-than-temporary impairment.
Accounts receivable and allowance for doubtful accounts
As we have operations in over 10 countries, there are variations in credit terms from country to country and from segment to segment. Within the broad range of credit policies, the credit terms applicable to each of our individual business segments are based on the following general guidelines:
For 2002
| • | | For sales of IT products, we offer “30 to 60 days credit from date of delivery of software” or “cash on delivery”; |
| |
| • | | For sales of consulting services, we offer “30 to 60 days credit after completion of milestones per agreement”; and |
| |
| • | | For sales in the advertising and marketing activities business, we offer three standard payment options “cash on delivery”, “14 days after completion of campaign” or “30 days credit”. |
For 2003
| • | | For sales of IT products, we offer “30 to 60 days credit from date of delivery of software” or “cash on delivery”; |
| |
| • | | For sales of consulting services, we offer “30 to 60 days credit after completion of milestones per agreement”; |
94
| • | | For sales in the mobile services and applications segment, we offer “90 days credit from the date of issuance of invoices which usually takes place one month following the month of actual sales”; and |
| |
| • | | For sales in the advertising and marketing activities business, we offer three standard payment options “cash on delivery”, “14 days after completion of campaign” or “30 days credit”. |
Our general policy for the provision of allowance for doubtful accounts in 2002 and 2003 was as follows:
| | | | | |
| Number of days past due | | Rate (% of Accounts Receivable) |
| Over 90 days | | | 25 | % |
| Over 120 days | | | 50 | % |
| Over 180 days | | | 100 | % |
Accounts receivable are carried at their original amount less an allowance for doubtful accounts. We have adopted credit control policies to ensure that collection of accounts receivable is probable and that recognition of the related revenue is appropriate. The allowance for doubtful accounts is established based on our credit control policies.
Our accounts receivable balances are in excess of what would be expected if we consistently enforced our credit terms. The reasons for the inconsistency in each segment are as follows:
Software and consulting services:
The 26% and 38% of receivables over 90 days outstanding in 2001 and 2002, respectively, was mainly due to the prevailing practice for customers in China to delay payments beyond their due dates. In addition, the rapid global reversal of spending on technology and internet-related products and services that occurred during the course of 2001 had a severe knock-on effect which reduced economic growth in the markets and for the companies to which we were exposed, particularly in China. As a result, many of the companies that we provided services for were unable to pay or simply delayed payment, or in some instances refused payment, when the time came for collection. The reduction in the days sales outstanding, or DSO and the improvements in aging to over 94% receivables outstanding less than 90 days in 2003 was mainly attributable to improvement in the collection process. In addition, the acquisition of IMI, a company which has generally shorter credit terms, resulted in an overall improvement of accounts receivable aging. The DSO of 78 days in 2003 was approximately in line with our credit terms disclosed above.
For 2001, 2002 and 2003, we made the appropriate provision for allowance for doubtful accounts based on our credit policies as described above.
Mobile services and applications:
The DSO in 2003 of 138 days is approximately consistent with the credit terms as disclosed above.
For 2003, we made the appropriate provision for allowance for doubtful accounts based on our credit policies for the provision of doubtful debts as described above.
Advertising and marketing activities:
The 7% and 23% of receivables over 90 days outstanding in 2001 and 2002, respectively, was mainly due to the same factors as described above which affected the collection rates for software and consulting services, namely the prevailing practice for customers in China to delay payments beyond their due dates. In addition, the adverse economic environment in 2002 also affected some customers’ ability to pay on time. The
95
reduction in receivables aged over 90 days in 2003 was attributable to improvements in the collection process, and the closing of business units that had a history of long outstanding accounts receivable. The DSO of 30 days in 2003 is consistent with our credit terms disclosed above.
For 2001, 2002, and 2003, we made the appropriate provision for allowance for doubtful accounts based on our credit policies as described above.
In each period, we concluded that the recorded accounts receivable balances were collectible and that revenue recognition was appropriate based on the criteria outlined in SAB 101 for mobile applications and services and advertising and marketing activities, in SOP 97-2 for sales of IT products, and in SOP 81-1 for consulting services. Specifically, in each case where a receivable is recorded and revenue is recognized:
| • | | Persuasive evidence of an arrangement existed - evidence of the arrangement is provided by a contract signed by ourselves and the customer. |
| |
| • | | Delivery has occurred - delivery occurs when the customer has taken title and assumed the risks and rewards of ownership. Risk of ownership must have passed to the customer. Delivery is considered not to have occurred if there are undelivered elements that are essential to the functionality of the product or services that we have delivered. |
| |
| • | | Fee is fixed or determinable – prices for products and services are always pre-determined and included in the terms of the contract. |
| |
| • | | Collectibility is reasonably assured – determined by assessing customers’ credit, establishing credit limits, performing credit checks as warranted and signing contracts with all customers to establish a legal obligation to pay, to provide assurances that accounts will be collectible. |
We believe that our assessment of the collectibility of accounts receivable has subsequently proven to be valid, as evidenced by the percentage subsequent settlement received up to April 2004 for balances as at December 31, 2002 and 2003.
Accounting treatment of the business combination
We will account for the business combinations of Ross and Pivotal in our financial statements prepared in accordance with US GAAP using the purchase method of accounting pursuant to SFAS 141, “Business Combinations”. The assets acquired and liabilities assumed from Ross and Pivotal will be recorded at their fair values as of the date of the business combination. Any excess of the purchase price over the fair value of the net tangible assets and identifiable intangible assets acquired will be recorded as goodwill. The results of operations of Ross and Pivotal will be included in our results of operations from the date of the closing of the business combination. A final determination of the required purchase accounting adjustments and the fair value of the assets and liabilities has not yet been made.
Impact of Certain Recently Issued Accounting Standards
In May 2003, the FASB issued SFAS 150, Accounting for Certain Financial Instruments with Characteristics of both Liabilities and Equity. This statement establishes standards for classifying and measuring as liabilities certain financial instruments that embody obligations of the issuer and have characteristics of both liabilities and equity. Instruments that are indexed to and potentially settled in an issuer’s own shares that are not within the scope of SFAS 150 remain subject to existing guidance. SFAS 150 must be applied immediately to instruments entered into or modified after May 31, 2003 and to all other instruments that exist as of the beginning of the first interim financial reporting period beginning after June 15, 2003. Certain provisions of this statement relating to non-controlling interests in limited-life subsidiaries were deferred indefinitely. We adopted
96
SFAS 150 and there was no impact on our results of operations or financial position upon the adoption of the new statement.
In January 2003, the FASB issued FIN 46, consolidation of Variable Interest Entities. In December 2003, the FASB modified FIN 46 to make certain technical corrections and address certain implementation issues that had arisen. FIN 46 provides a new framework for identifying variable interest entities (“VIEs”) and determining when a company should include the assets, liabilities, non-controlling interests and results of activities of a VIE in its consolidated financial statements. In general, a VIE is a corporation, partnership, limited liability corporation, trust, or any other legal structure used to conduct activities or hold assets that either (i) has an insufficient amount of equity to carry out its principal activities without additional subordinated financial support, (ii) has a group of equity owners that are unable to make significant decisions about its activities, or (iii) has a group of equity owners that do not have the obligation to absorb losses or the right to receive returns generated by its operations. FIN 46 requires a VIE to be consolidated if a party with an ownership, contractual or other financial interest in the VIE (a variable interest holder) is obligated to absorb a majority of the risk of loss from the VIE’s activities, is entitled to receive a majority of the VIE’s residual returns (if no party absorbs a majority of the VIE’s losses), or both. A variable interest holder that consolidates the VIE is called the primary beneficiary. Upon consolidation, the primary beneficiary generally must initially record all of the VIE’s assets, liabilities and non-controlling interests at fair value and subsequently account for the VIE as if it were consolidated based on majority voting interest. FIN 46 also requires disclosures about VIEs that the variable interest holder is not required to consolidate but in which it has a significant variable interest.
FIN 46 was effective immediately for VIEs created after January 31, 2003. The provisions of FIN 46, as revised, were adopted early in respect of our interests in all VIEs and there was no cumulative effect on our results of operations or financial position upon the adoption of the provisions of the revised FIN 46.
| C. | | Research and Development, Patents and Licenses, etc. |
We do not have a formal research and development policy, and to date we have not spent significant amounts on company-sponsored research and development activities. During fiscal 2003, research and development costs represented approximately 1% of our revenues. As part of our overall strategy to develop and introduce more proprietary products to sell across our business lines and service offerings, we anticipate that our research and development costs may increase as a percentage of overall revenues, particularly considering the anticipated cost of software development activities in China. As a result of the acquisition of several software companies in 2003 and early 2004, we expect our research and development costs for 2004 to increase as a percentage of revenues compared to 2003, but our expectation is that it will continue to be less than 5% of total revenues in 2004.
Our focus on the enterprise software and mobile applications industries has positioned us within industry sectors which continued to undergo rapid change over the course of fiscal 2003 as competitive models evolved. In enterprise software, the industry continues to see consolidation internationally, as larger competitors aim to increase their scale and breadth of service offerings. During 2003, we made progress in achieving scale through acquisitions of supply-chain, business analytics, application outsourcing and other software-related products and services. These acquisitions complemented the growth in our core China-based human resource and payroll administration and financial reporting packages. We continued complementary acquisitions in February 2004 with the purchase of an internationally established CRM front-office software provider, Pivotal. With an enlarged product portfolio, we believe it will take several quarters for us to leverage the synergies that we consider are inherent within our enlarged software businesses, and we expect 2004 overall to be a year of integration and focus on operational improvements. We will continue to execute our software strategy through investments in software-related business and through entering strategic partnerships with leading software vendors.
97
In the mobile applications sector, the addition of Newpalm, a mobile SMS services and applications provider in the PRC, in April 2003 provided significant impetus to our revenue growth in a rapidly growing sector of the mobile applications market in China, and helped contribute to an overall increase in our gross margins. We continue to look to add investments in mobile applications-related companies that feature their own proprietary intellectual property. In this way, we aim to continue to broaden our service offering by overlaying such acquisitions on our existing subscriber base and technical platform capabilities.
While the first half of fiscal 2003 continued to reflect the effects of the regional and global economic slowdown due to the SARS epidemic, there were signs by the fourth quarter of fiscal 2003 that conditions were beginning to stabilize, as evidenced by a 20% improvement in our revenues for the fourth quarter of fiscal 2003 compared to the third quarter of fiscal 2003, through both organic growth as well as through acquisitions. For the company as a whole, as a result of rigorous cost control, improvements in core operations, and the complementary acquisitions outlined above, we recorded a net profit of US$15.5 million for the year ended December 31, 2003, our first annual profit since our public offering in July 1999.
Looking forward, we will seek to increase the proportion of revenues in our business generated by projects with recurrent revenue streams, particularly in the software and consulting services business areas where maintenance and support revenues can comprise over 50% of the combined revenues of such businesses, as well as by looking to acquire companies that have a relatively high percentage of recurrent revenues in their current business mix. We believe such characteristics can be found in some of our recent acquisition activities, such as that of IMI, the supply-chain management software company based out of Europe. IMI’s core business is the provision of mission critical software which enables large retail and wholesale distribution companies to manage their supply chains. IMI has a core group of long established clients that provide a regular maintenance revenue stream on an annual basis.
In 2004, we expect continued growth in our software and consulting revenues, as well as our mobile applications revenues, as a result of ongoing organic growth and the addition of complementary acquisitions. However, we expect our advertising revenues to continue to decline as a percentage of total revenues, due to the material acquisitions made in the enterprise software area and the growth seen in our mobile applications business as well as our divestiture of our online network advertising business as of January 2004. While we are re-orienting our advertising strategy to higher margin database marketing related services, we are uncertain whether we will be successful in generating sufficient revenues or margins from these services to replace revenues and margins from our online network advertising business.
In light of the many risks and uncertainties surrounding chinadotcom, Greater China, Asia and the enterprise software, technology, mobile applications, marketing and media markets, shareholders, investors and prospective investors should keep in mind that we cannot guarantee that the forward-looking statements described in this Annual Report will or can materialize.
| E. | | Off Balance Sheet Arrangements |
The company does not have, and has not engaged or entered into, any off balance sheet transactions, agreements, or other contractual arrangements.
| F. | | Tabular Disclosure of Contractual Obligations |
See “– B Liquidity and Capital Resources – Contractual Obligations and Other Commitments” above.
98
ITEM 6. DIRECTORS, SENIOR MANAGEMENT AND EMPLOYEES
| A. | | Directors and Senior Management |
The following table sets forth information regarding our directors and executive officers as of May 6, 2004:
| | | | | | | |
Board of Directors**
| | Age
| | Position
| | Class of Directorship
|
| Raymond K.F. Ch’ien | | 52 | | Executive Chairman | | III, term to expire in 2005 |
| Peter Yip | | 52 | | Vice Chairman and Chief Executive Officer | | III, term to expire in 2005 |
| Zhou Shun Ao | | 55 | | Vice Chairman | | III, term to expire in 2005 |
| Thomas M. Britt, III | | 43 | | Director | | I, term to expire in 2004* |
| William Fung | | 55 | | Director | | II, term to expire in 2004* |
| Kwong Ki Chi | | 53 | | Director | | III, term to expire in 2004* |
| Carrick John Clough | | 56 | | Director | | I, term to expire in 2004* |
| |
Executive Officers | | | | | | |
| Daniel Widdicombe | | 37 | | Chief Financial Officer | | |
| Steven Chan | | 36 | | General Counsel and Company Secretary | | |
| Rudy Chan | | 42 | | Chief Executive Officer of CDC Mobile | | |
| John Xiao | | 40 | | Chief Executive Officer of Newpalm and | | |
| | | | | hongkong.com | | |
| * | | Subject to re-election by shareholders at our 2004 annual general meeting. |
| |
| ** | | Both Mr. J. Carter Beese, Jr. and Mr. Harry Edelson ceased to be a director on June 17, 2003. Mr. Chan Wing-Tak, Douglas ceased to be a director on July 17, 2003. |
The address of each of our executive officers and directors is c/o chinadotcom corporation, 34/F Citicorp Centre, 18 Whitfield Road, Causeway Bay, Hong Kong. The following is a brief biography of each of our directors and executive officers:
Raymond K.F. Ch’ienhas served as executive chairman of our board of directors since April 2001. Previously, since January 1999, Dr. Ch’ien served as our chairman. Between October 1996 and March 2001, he was also a member of the board of directors of our former parent company, CIC. Dr. Ch’ien is chairman and executive committee member of our Hong Kong listed subsidiary, hongkong.com. Dr. Ch’ien is also currently on the boards of HSBC Holdings plc, the Hongkong and Shanghai Banking Corporation Limited, Inchcape plc, Convenience Retail Asia Limited, VTech Holdings Ltd. and The Wharf (Holdings) Limited. He is also non-executive chairman of HSBC Private Equity (Asia) Limited and MTR Corporation Limited. Dr. Ch’ien is chairman of the Hong Kong/Japan Business Co-operation Committee and chairman of the Advisory Committee on Corruption of the Independent Commission Against Corruption. In addition, Dr. Ch’ien is the honorary president and past chairman of the Federation of Hong Kong Industries. He is also President of Hong Chi Association, Hong Kong’s leading non-government organization helping mentally handicapped persons. From 1992 to 1997, Dr. Ch’ien was a member of the Executive Council of Hong Kong, then under British Administration. He was appointed a member of the Executive Council of the Hong Kong SAR from July 1997 and served until June 2002. Dr. Ch’ien received a doctoral degree in economics from the University of Pennsylvania in 1978. He was appointed a Justice of the Peace in 1993 and a Commander in the Most Excellent Order of the British Empire in 1994. In 1999, he was awarded the Gold Bauhinia Star medal.
99
Peter Yipis a vice chairman of our board of directors. He has been our chief executive officer since January 1999. Mr. Yip is also an executive director of hongkong.com. Between May 1996 and February 2003, he was also the vice chairman of the board of directors of CIC. Mr. Yip has international experience as an entrepreneur in the media and telecommunications industry. Prior to forming chinadotcom, Mr. Yip founded a systems integration company which eventually was sold to SHL Systemshouse, a company since acquired by MCI. He previously was a senior management consultant at KPMG Consulting and was a Senior Research Fellow at Wharton Applied Research. Mr. Yip received a master’s degree in business administration from the Wharton School and both a master’s degree and a bachelor’s degree in electrical engineering from the University of Pennsylvania.
Zhou Shun Aohas been a vice chairman of our board of directors since December 2000. He was our chief China officer from January 1999 to December 2000. Mr. Zhou has served for more than 30 years at Xinhua, and is currently general manager of the Asia-Pacific Bureau at Xinhua. He has also served as executive deputy general manager at Xinhua. He was deputy director of Xinhua Department for Business Development, general manager of China Media Development Corporation and chairman of the board of China Global Public Relations Corporation. Mr. Zhou has also served as an executive director of our Hong Kong listed subsidiary, hongkong.com. He has also served as the chairman of the board of directors of CIC since October 1998.
Thomas M. Britt, IIIhas served as an independent director since May 2000. Mr. Britt is a partner with the international law firm, Debevoise & Plimpton LLP, resident in the firm’s Hong Kong office. Prior to joining Debevoise & Plimpton in 2004, Mr. Britt was the Managing Director of IRG Limited, an investment banking boutique he co-founded in 2000. Prior to co-founding IRG, Mr. Britt was the senior partner of the US Securities Group in the Hong Kong office of Clifford Chance LLP, the world’s largest law firm, and the founding and managing partner of the Hong Kong office of Rogers & Wells LLP, a leading US law firm. Mr. Britt has a juris doctor and a master’s degree in business administration from New York University and a bachelor’s degree from Georgetown University.
Carrick John Cloughhas served as an independent director since December 2003. Prior to this, Mr. Clough has served as the non-executive chairman of the board of Praxa since May 2003. He has been a special advisor to General Atlantic Partners since December 2000. Before joining General Atlantic Partners, Mr. Clough gained over 25 years of management experience in the IT industry internationally. He was a co-founder and managing director of the CSSL Group, A mid-range software distributors and hardware reseller in Asia. Prior to co-founding the CSSL Group, Mr. Clough held the position of general manager of JBA in Asia, an Australia-based worldwide mid-range software distributor, and gained working experience as a consultant in the United Kingdom and Europe. Mr. Clough received his education in New Zealand.
William Funghas served as an independent director since June 2001. Dr. Fung is group managing director of Li & Fung Limited, and has held key positions in major trade associations. He is the current chairman of the Pacific Economic Cooperation Council and is a member of the Economic Advisory Committee to the Financial Secretary. Dr. Fung is also non-executive director of Convenience Retail Asia Limited, HSBC Holdings plc, VTech Holdings Limited and CLP Group Holdings Limited. He was past chairman of the Hong Kong General Chamber of Commerce, the Hong Kong Exporters’ Association and the Hong Kong Committee for the Pacific Economic Cooperation Council. Dr. Fung holds a bachelor’s degree in Engineering from Princeton University and a master’s degree in business administration from the Harvard Graduate School of Business. He has been awarded an honorary doctorate degree in business administration by the Hong Kong University of Science and Technology.
Kwong Ki Chihas served as an independent director since June 2003. Mr. Kwong has served in the Government of Hong Kong for 27 years and held positions principally in the economic and financial fields. He was the Secretary for the Treasury from 1995 to 1998, with responsibility for the public finances, and also the first appointee to the new position of Secretary for Information Technology and Broadcasting from 1998 to March 2000, with responsibility for information technology, telecommunications and broadcasting. After
100
retiring from government service in March 2000, Mr. Kwong joined the Hong Kong Exchanges and Clearing Limited as its first chief executive until April 2003, following the demutualization and merger of the Stock Exchange of Hong Kong, the Hong Kong Futures Exchange and their associated clearing houses. In January 2004, Mr. Kwong was appointed managing director of Hsin Chong International Holdings Ltd., alternate director of each of Hsin Chong Construction Group Ltd. and Synergis Holdings Ltd., and also director of Hsin Chong Land Ltd. and Summit Insurance (Asia) Ltd. With effect from April 26, 2004, Mr. Kwong has been appointed an independent non-executive director of Giordano International Ltd. Mr. Kwong is a non-official Justice of the Peace in Hong Kong and has been awarded the Gold Bauhinia Star. He holds a number of public service positions, including council member of the Chinese University of Hong Kong and board director of the Hong Kong Community Chest. Mr. Kwong earned a Bachelor of Science degree in physics and mathematics from the University of Hong Kong and a Master of Philosophy degree in economics and politics of development from the University of Cambridge, England.
Daniel Widdicombehas served as our chief financial officer since December 2000. Prior to joining chinadotcom, Mr. Widdicombe was chief financial officer of I-Quest Corporation. He was also the managing director of Telecoms and Internet Equity Research at Bear Stearns Asia Ltd. where he worked as an investment analyst researching and evaluating companies across Asia. He was previously an equity analyst at HSBC James Capel in London and Hong Kong. Mr. Widdicombe is a first class honors graduate of Edinburgh University, Scotland.
Steven Chanhas served as our director, legal and company secretary since May 2001 and as general counsel and company secretary since October 2003. He is responsible for the management and execution of the global legal operations of the company and that of its various businesses worldwide. He advises the management of the company on legal, operational and strategic issues. In such regard, Mr. Chan concentrates on refining the existing operations and developing future operations, principally through mergers, acquisitions, strategic investments and synergistic operational initiatives. Prior to joining the company, Mr. Chan had worked with the New York offices of Morrison & Foerster LLP and Milbank, Tweed, Hadley & McCloy LLP. He received a juris doctor degree from Boston College Law School and a bachelor’s degree from University of California at Berkeley.
Rudy Chanserved as chief executive officer at hongkong.com from February 2000 until January 2004, and currently serves as chief executive officer of our wholly owned subsidiary, CDC Mobile since January 2004. Mr. Chan first joined us as director of e-commerce in November 1999. Immediately prior to joining us, Mr. Chan was a founding member of Bartercard in Hong Kong. His previous experience includes eight years with Time Inc., and he has served as the managing director of Time Inc.’s Asian operations. Mr. Chan received his bachelor’s degree and master’s degree in business administration from the Wharton School at the University of Pennsylvania. He is also a certified public accountant registered with the State of New York.
John Xiaois the founder of Newpalm which hongkong.com acquired in April 2003 and has been chief executive officer of Newpalm since March 2000. In November 2003, Mr. Xiao was appointed as executive director of hongkong.com and in January 2004, he was appointed as the chief executive officer of hongkong.com. Prior to founding Newpalm, Mr. Xiao served as director of wireless Internet, personal networking group at Motorola (Asia). Mr. Xiao graduated from Donghua University with a bachelor’s of science degree in mechanical engineering. He also earned a master’s of science degree in computer science from the University of Illinois at Urbana-Champaign.
101
Directors
During fiscal 2003, we paid our directors compensation, inclusive of directors’ fees in an aggregate amount equal to US$160,000, as well as options to purchase our Class A common shares as described below. Directors are reimbursed for all expenses incurred in connection with each meeting of the board of directors and when carrying out their duties as directors of chinadotcom.
In 2002, our board of directors established the director compensation structure with respect to our non-executive directors and chairman. In 2003, our policy was to pay each non-employee director and the chairman US$25,000 per year for their respective services, provided they attend at least 60% of the board meetings held each year. We also pay members of our audit committee US$10,000 per year for their services on the audit committee, and we pay US$40,000 to the independent members of our executive committee, provided they each attend at least 60% of their respective committee meetings held each year.
During 2003, we granted our newly appointed non-executive directors options to purchase a total of 70,000 Class A common shares to be vested quarterly over two years.
Executive Officers
During fiscal 2003, we paid our executive officers as a group compensation in an aggregate amount equal to US$825,589 and granted to them a total of 894,264 options to purchase Class A common shares, with exercise prices ranging between US$4.95 and US$7.43 per share. All of such options expire in 2013. We have entered into employment agreements with a number of the executive officers named in Item 6.A— “Directors, Senior Management and Employees — Directors and Senior Management”. These arrangements provide for terms of service, salary and additional compensation arrangements, including in some cases housing refunds and other benefits, all of which have been reflected in the aggregate compensation amount for fiscal 2003. For certain directors and executive officers, these arrangements also include the right to receive a payment equal to three months of their respective salaries if such person is terminated by us without cause.
Mandatory Provident Fund
The Mandatory Provident Fund, or MPF, scheme is the standard pension payment required by the Hong Kong government. In the MPF scheme, mandatory contributions are basically calculated on the basis of 10% of an employee’s relevant income, with the employer and employee each paying US$128 per month or up to 5% of the employee’s relevant income. This requirement also applies to our executive officers in compliance with the overall scheme.
1999 Stock Option Plan
Pursuant to our 1999 Stock Option Plan, as amended, options may be granted to directors, executive officers, employees and consultants of chinadotcom corporation and our subsidiaries for the purchase of up to an aggregate of 20.0 million Class A common shares. As of February 29, 2004, there are approximately 6.6 million Class A common shares reserved for issuance under outstanding options granted under our 1999 Stock Option Plan, with a weighted average exercise price of approximately US$6.49 per share. These options are generally exercisable for a period of five or ten years. From the inception of the Stock Option Plan, our directors and employees had exercised options to purchase approximately 5.2 million Class A common shares. As of February 29, 2004, outstanding options to purchase 3.7 million Class A common shares under our 1999 Stock Option Plan have vested. Of the total number of shares reserved for issuance under options outstanding under our 1999 Stock Option Plan, 500,000 shares are reserved for issuance under options granted to APOL, a company owned by the spouse of Mr. Yip, our chief executive officer and a trust established for Mr. Yip’s children, 200,000 of which are exercisable at a price of US$2.82, another 200,000 of which are exercisable at a price of US$4.95, and 100,000 of which are exercisable at a price of US$5.16. In addition to the 20.0 million Class A common shares reserved under our 1999 Stock
102
Option Plan, there are also 1,881,442 Class A common shares reserved for issuance under options we granted to APOL at an exercise price of US$5.00.
Our 1999 Stock Option Plan is administered by the compensation committee of the board of directors, which determines, at its discretion, the number of Class A common shares subject to each option granted and the related purchase price and option period.
The 1999 Stock Option Plan requires that each option will expire on the date specified by the compensation committee, but not more than ten years from the date on which the option was granted. Under the 1999 Stock Option Plan, unless otherwise specified in the option award agreement, upon the voluntary termination of employment by an option holder or termination of an option holder for cause by chinadotcom, any options granted under the 1999 Stock Option Plan to the option holder generally will terminate. If termination was due to death, retirement or disability, the option holder, or his or her successors, have a period of one year within which to exercise the option holder’s options. If termination was due to any other reason, options granted under the 1999 Stock Option Plan may be exercised within three months of the termination. Options granted are nontransferable except by will or as otherwise authorized by the compensation committee.
Upon the occurrence of any change in our capital structure, including any merger, liquidation, reorganization, or recapitalization, the compensation committee may amend the 1999 Stock Option Plan to preserve the rights of option holders substantially proportionate to their rights existing prior to the occurrence of such event, as it may deem necessary. Upon the occurrence of a change of control in chinadotcom, the compensation committee may amend the 1999 Stock Option Plan as it may deem appropriate provided that such adjustments do not have a substantial adverse impact on the option holder. Unless terminated earlier by action of the board of directors, the 1999 Stock Option Plan will terminate on May 17, 2009, the ten year anniversary of the approval of the 1999 Stock Option Plan by the board of directors and the shareholders.
Options Held by Directors and Officers
As of February 29, 2004, of the approximately 6.6 million outstanding options for the purchase of our Class A common shares, our directors and executive officers as a group held options to purchase a total of approximately 3.7 million of our Class A common shares. The weighted average exercise price of these options is approximately US$5.78 per share. The options granted to such directors and executive officers generally vest 25%, 33-1/3%, 50% or 100% per year on a quarterly basis over a one to four year period, as applicable, commencing immediately upon grant, on the first quarter or first anniversary of the relevant grant. As of March 31, 2004, our directors and officers, as a group, held vested options to purchase approximately 2.3 million Class A common shares.
Warrants
In connection with AOL’s strategic acquisition of 6,795,200 of our Class A common shares prior to our IPO in July 1999, we granted AOL two warrants to purchase subject to certain conditions up to 18.5% and 6.5% of our total outstanding capital at an exercise price of US$5.00 per share and US$42.50 per share, respectively. The first of these warrants became exercisable in October 2000 and the second became exercisable in July 2001. Both warrants expired in July 2003.
In connection with our acquisition of all the issued and outstanding shares of Pacific Connections Limited, in August 1999, we granted the initial shareholders of Pacific Connections Limited an option to acquire an additional 240,000 Class A common shares at an exercise price of US$9 per share. During fiscal 2003, 140,000 of these options had been exercised and the remaining options expired in August 2003.
103
Terms of Directors and Executive Officers
Our board of directors is divided into three classes, each class generally having a term of three years. Each year the term of one class expires and nominees for membership in that class are eligible to be elected at the relevant annual meeting of shareholders. All directors hold office until the relevant annual meeting of shareholders or until their successors have been duly elected and qualified. Executive officers are elected by and serve at the discretion of the board of directors.
Mr. Peter Yip was appointed chief executive officer of chinadotcom pursuant to a services agreement, as amended, dated July 12, 1999 between chinadotcom and APOL. The services agreement was replaced and the new services agreement approved by the Board of Directors in January 2002 for an initial term of one year with automatic renewal provisions. Mr. Yip currently also serves as vice chairman and director of our board of directors and his term as director ends in 2005 subject to re-election by shareholders at the 2005 annual shareholder meeting.
Dr. Raymond Ch’ien was appointed as executive chairman of our board of directors pursuant to a services agreement between chinadotcom and Dr. Ch’ien. The term of Dr. Ch’ien’s services agreement ended as of April 27, 2004 and a new services agreement is currently being negotiated. His current term as director continues until 2005 when he is subject to re-election by shareholders at the 2005 annual shareholder meeting. For a summary of the terms of Dr. Ch’ien’s services agreement, see Item 7.B—“Major Shareholders and Related Party Transactions — Related Party Transactions”.
No director or executive officer has been the subject of any order, judgment, or decree of any governmental agency or administrator or of any court of competent jurisdiction, revoking or suspending for cause any license, permit or other authority of such person or of any corporation in which he or she is a director or executive officer, to engage in normal business activities of such person or corporation.
There are no family relationships between any of the named directors and executive officers. There are no material arrangements or understandings that exist between any such director or executive officer and chinadotcom pursuant to which any such person was appointed as a director or executive officer of chinadotcom except for the arrangements between chinadotcom and each of Mr. Yip and Dr. Ch’ien.
Committees of the Board of Directors
During fiscal 2003, the board of directors had four standing committees:
| • | | the executive committee; |
| |
| • | | the audit committee; |
| |
| • | | the compensation committee; and |
| |
| • | | the nominating committee. |
The executive committee is authorized during any interim period between quarterly meetings of the full board of directors, to act for and in lieu of the full board of directors and to approve of any transaction requiring board approval by the board of directors that does not exceed aggregate consideration to be paid by chinadotcom of more than US$20.0 million in cash and equity, with any equity component not to exceed 1.0 million Class A common shares. Currently, Messrs. Ch’ien, Yip, Zhou, Britt and Clough serve on the executive committee with Dr. Ch’ien serving as chairman.
104
The audit committee selects and engages, on our behalf, the independent public accountants to audit our annual financial statements, and will review and approve the planned scope of our annual audit. In addition, since February 2002, the audit committee reviews the terms of proposed transactions with related parties in accordance with the terms of our articles of association. Since May 2003, the audit committee has also had responsibility to review our compliance with the Sarbanes-Oxley Act . This includes reviewing documentation of our internal controls and key processes and procedures in order to report on compliance with Section 404, “Management Assessment of Internal Controls”. We have appointed to the audit committee directors who qualify as an independent director for purposes of the rules and regulations of the Nasdaq National Market and the Sarbanes-Oxley Act of 2002. The audit committee operates under a charter that is compliant with the rules and regulations of the Nasdaq National Market. Currently, Messrs. Kwong, Britt and Clough serve on the audit committee with Mr. Britt serving as chairman.
The compensation committee establishes remuneration levels for our officers, performs such functions as provided under employee benefit programs and administers the 1999 Stock Option Plan and the 2000 and 2001 Employee Share Purchase Plans. Currently, Messrs. Ch’ien, Kwong and Fung serve on the compensation committee with Dr. Ch’ien serving as chairman.
The Nominating Committee formulates and reviews appropriate criteria to be used in connection with selection of persons to serve on our board of directors and assesses and recommends nominees for election to our board of directors by shareholders at the Annual General Meeting. Currently, Messrs. Ch’ien, Fung and Britt serve on the nominating committee with Dr. Ch’ien serving as chairman.
As of December 31, 2003, we had approximately 1,179 full-time, part-time and temporary employees, as compared to 952 at the beginning of fiscal 2003. Of our 1,179 employees, 421 are in technical positions, 121 are in research and development positions, 81 in design and editorial positions, 210 in sales, marketing and business development positions, 65 in finance positions, 13 in legal positions, 18 in human resources positions, 37 in administration positions, 5 in mergers and acquisitions and 67 in general and operations management positions, with the remainder principally consisting of part-time and temporary employees. Going forward, we aim to continue to attract, retain and motivate highly qualified technical and management personnel, particularly highly skilled technical personnel and engineers involved in new product development. From time to time, we also employ independent contractors to support our research and development, marketing, sales and support and administrative organizations. Our employees are not represented by any collective bargaining unit, and we have never experienced a work stoppage.
Beneficial ownership of our Class A common shares by our directors, senior executive officers and other major shareholders is determined in accordance with the rules of the Commission, and generally includes voting or investment power with respect to those shares. In computing the number of Class A common shares beneficially owned by a person, and the percentage ownership of that person, Class A common shares subject to options or warrants held by that person that are currently exercisable or will become exercisable within 60 days after April 1, 2004 are deemed beneficially owned and outstanding, but such Class A common shares are not deemed outstanding for the purposes of computing the ownership percentage of any other person.
None of our directors or senior executive officers beneficially owned more than 1% of our Class A common shares as of April 1, 2004, other than Mr. Peter Yip who is the beneficial owner of approximately 18,789,528 or approximately 18.1%, of our Class A common shares. Mr. Yip’s beneficial ownership under the Commission’s rules is the same as that of his spouse and APOL. APOL is the owner of record of 11,835,686 Class A common shares and the beneficial owner of an additional 2,318,942 Class A common shares due to exercisable options attributable to APOL. Mr. Yip is the beneficial owner of 190,000 Class A common shares
105
due to options attributable to him. Mr. Yip’s spouse owns 4,444,900 Class A common shares. APOL is a company owned by Mr. Yip’s spouse and a trust established for the benefit of Mr. Yip’s children. This information is based solely on information reported on a Schedule 13D jointly filed with the SEC on April 2, 2004 by APOL, Mr. Yip and his spouse.
ITEM 7. MAJOR SHAREHOLDERS AND RELATED PARTY TRANSACTIONS
We are a publicly owned corporation, and our shares are owned by U.S. residents and residents of other countries. As of March 15, 2004, we were not directly owned or controlled by another corporation or by any foreign government, and a total of 452 shareholders of record were U.S. residents holding approximately 75% of our Class A common shares. Holders of our Class A common shares do not have different voting rights.
The following table sets forth information concerning each person known by us who own beneficially 5% or more of our Class A common shares as at April 1, 2004:
| | | | | | | | | |
| | | Beneficial Ownership
|
| | | Shares
| | Percent
|
Shareholder | | | | | | | | |
| Asia Pacific Online Limited(1) | | | 18,789,528 | | | | 18.1 | % |
| Xinhua News Agency(2) | | | 7,362,734 | | | | 7.1 | % |
| (1) | | APOL is owned by the spouse of our chief executive officer and a trust established for the benefit of Mr. Yip’s children. APOL was the owner of record, as at April 1, 2004, of 11,835,686 Class A common shares and the beneficial owner of an additional 2,318,942 Class A common shares due to exercisable options attributable to APOL. Mr. Yip was the beneficial owner of 190,000 Class A common shares due to exercisable options attributable to him. Mr. Yip’s spouse owned 4,444,900 Class A common shares. |
| |
| (2) | | Xinhua holds our shares through a wholly-owned subsidiary, Golden Tripod Technology Limited. |
Based on publicly available information, America Online, Inc., a wholly-owned subsidiary of AOL Time Warner Inc., ceased to be one of our shareholders following the sale of their entire chinadotcom shareholding in September 2003.
Based on publicly available information as of December 31, 2003, Capital Group International, Inc. and Jayhawk Capital Management, L.L.C. have reduced their shareholdings to 4% and 1.82% respectively during the year 2003.
For a discussion of risks associated with the holdings of our major shareholders, see Item 3.D — “Key Information — Risk Factors — Risks Related to Our Class A Common Shares — Our share price could be adversely affected if our major strategic shareholders materially change their holdings in our shares, particularly if the share holdings are not disposed of in an orderly manner” and “— A small group of our existing shareholders control a significant percentage of our common shares, and their interests may differ from other shareholders”.
| B. | | Related Party Transactions |
New World.In October 2000, we entered into an agreement to acquire a 50.3% interest in Wealth Corporation Limited for an aggregate consideration of US$9.3 million consisting of US$6.8 million worth of our Class A Common Shares to purchase shares from the selling shareholders and US$2.5 million in cash to purchase newly issued shares. The selling shareholders of Wealth Corporation Ltd. included New World
106
Infrastructure, one of our former shareholders, which as of October 2002 held approximately 11.4% of our Class A common shares, and received approximately US$1.4 million worth of our Class A common shares as consideration for its shares in Wealth Corporation Ltd. Wealth Corporation Ltd. operated a web site which sold travel products and services, such as airline tickets and hotel accommodations, to corporations and travel agencies in the PRC. The acquisition was based upon a strategy to build a Greater China online and off-line travel capability focused on the tour-group market.
As a result of deteriorating financial performance at Wealth Corporation Limited through 2002, we de-emphasized the development on an online travel business in Greater China and sought to recover some of its original investment in the company. We entered into negotiations with the other shareholders in Wealth Corporation Limited, including New World Infrastructure, and in November 2002, the parties agreed to permit us to reduce our shareholdings to 19.9% through a share repurchase by Wealth Corporation Limited. Wealth Corporation Limited was not profitable at such time, and the shareholders agreed to value the company based upon the cash balances of the company. As a result of the consummation of the share repurchase, we reduced our shareholdings to 19.9% for a payment from Wealth Corporation of US$1.0 million.
In January 2003, New World Infrastructure Limited ceased to be one of our shareholders following the sale of their entire chinadotcom shareholding in the open market, as well as in privately negotiated transactions with us, APOL and our chairman, Dr. Ch’ien. We purchased 4,468,560 Class A common shares, APOL purchased 4,300,000 Class A common shares, and our chairman purchased 200,000 Class A common shares from New World Infrastructure Limited in January 2003.
24/7 Real Media, Inc. Pursuant to a License and Software Agreement entered into with 24/7 Real Media, Inc. (formerly known as 24/7 Media, Inc. and hereafter referred to as “24/7”) on October 23, 1998, 24/7 granted to us a non-exclusive license to use certain 24/7 software products to serve advertisements on the Internet and an exclusive license to use the “24/7 Media” trademark in the Asian market.
Under the terms of the agreement with 24/7, we were obligated to pay to 24/7 10% of our revenues generated from advertisements on our advertising network. Net revenue included all revenue generated from advertising sales, net of commissions retained or paid to advertising agencies, and service fees paid to advertising affiliates or our Web sites. Service fees paid to our Web sites, exclusive of ourwww.cww.comportal, were set at 70% of advertising sales while service fees to advertising affiliates, including ourwww.cww.com portal, ranged from 30% to 50% of advertising sales. During the year ended December 31, 2001 and December 31, 2002, payments made under the Agreement amounted to US$800,000 and nil, respectively.
Where U.S. based advertisements were sold on our advertising network by 24/7, 24/7 was obligated to pay 70% of the sales revenue, net of commissions retained or paid to advertising agencies, to us. 24/7 served as our exclusive agent for the sale of U.S. based advertisements on our advertising network.
Where Asian-based advertisements were sold on 24/7 U.S. network of advertising affiliates, we would pay 70% of such sales revenue, net of commissions retained or paid to advertising agencies, to 24/7. We served as 24/7 Media Asia’s exclusive agent for the sale of Asian-based advertisements on 24/7 U.S. network of advertising affiliates.
In August 2000, the agreement with 24/7 was superceded by the 24/7 Media-Asia Agreement and supplemental related agreements. In October 2000, as part of the Media Asia Agreement, we sold 19.9% of our shares in 24/7 Media Asia Limited, a then wholly-owned subsidiary, to 24/7 in exchange for 2,500,000 shares of common stock of 24/7 valued at US$4.3125 per share, resulting in a net gain of US$10.4 million.
In June 2001, we gave notice of termination of the Media Asia Agreement to 24/7, which notice was effective September 2001.
107
In June 2001, we demanded from 24/7 Media Asia Limited the repayment of a portion of loans that we had extended to 24/7 Media Asia Limited. In January 2002, 24/7 Media Asia Limited completed a rights issue whereby it issued and allotted additional equity shares to all shareholders participating in the rights issue as a means to settle the loan demand. While we participated in this rights issue, 24/7 chose not to participate in this rights issue and therefore, 24/7’s interest in 24/7 Media Asia Limited was effectively diluted. Our interest in 24/7 Media Asia Limited increased to approximately 98% while 24/7’s interest declined to under 2%.
In February 2003, 24/7 filed suit in Federal District Court in New York against us to enforce obligations allegedly owed under the Media Asia Agreement. We contest these allegations and, in May 2003, obtained an order compelling arbitration of the claims, at the International Chamber of Commerce, or the ICC.
Pursuant to the ICC arbitration, in July 2003 we filed a request for arbitration seeking damages in excess of US$24.0 million for breach of the Media Asia Agreement. In October 2003, 24/7 filed an answer and counterclaim seeking US$2.6 million in damages for, among other things, services allegedly unpaid under the same agreement. In December 2003, we filed a reply to answer and counterclaims denying these allegations. Since December 2003, no further documents have been filed by either party.
In 2003, 24/7 ceased to be a related party.
AOL Time Warner, Inc.During 2001, we paid advertising fees totaling US$3.5 million to AOL Time Warner Inc., a shareholder, for the provision of Internet advertising services. In addition, we paid AOL Time Warner Inc. US$3.7 million for computer software from PurchasePro.com, Inc., a strategic alliance partner of AOL Time Warner Inc. In other matters involving AOL, we sought the return of US$2.2 million which we spent under a software development agreement among AOL, CIC and chinadotcom. Under the terms of the software development agreement dated February 1, 2000, we agreed to provide AOL with US$2.2 million to finance the development of AOL software which could be utilized in the China market. We entered into the software development agreement in anticipation of a joint venture with AOL to develop consumer interactive services for the Chinese market. No joint venture arrangement with AOL was ever entered into, and AOL never delivered a software product. In addition, we sought the return of US$3.5 million in connection with an agreement to purchase advertising services from AOL. Under the terms of the agreement dated March 8, 2001, AOL agreed to render ad impressions on its web sites for a total fee of approximately US$7.0 million, and we paid US$3.5 million, approximately one-half of the amount due, on March 31, 2001. These amounts were expensed under sales, general and administrative expenses in March 2001. We entered into the agreement to purchase advertising services from AOL and made partial payment under the contract as a result of representations from AOL’s representatives that AOL would be more favorably inclined to enter into a joint venture with us to develop consumer interactive services for the Chinese market if we purchased the advertising services, which did not occur following our purchase of and payment for the advertising services. We are cooperating with information requests by the Commission and other government agencies in connection with their investigation of AOL with respect to the PurchasePro.com and advertising services transactions.
On July 28, 2003, we reached a settlement with AOL including all claims between the two companies and their affiliates. We also agreed with AOL to cancel AOL’s two warrants to acquire additional shares in chinadotcom. We currently have no remaining operational, strategic or other agreements with AOL. Based solely upon filings with the Commission, on September 11, 2003, AOL disposed of its entire holding of chinadotcom shares.
Golden Tripod.In June 2001, we signed contracts with entities affiliated with Xinhua, Golden Tripod (Holdings) Limited, or Golden Tripod, and Xinhua News Agency Shanghai Branch, or Shanghai Xinhua, to acquire 30% of the shares of Xin Hua Asia Pacific TV (H.K.) Center Limited, a company 51% owned by Golden Tripod and 49% owned by Shanghai Xinhua, as well as to form a 50% owned joint venture in the PRC. We paid
108
US$500,000 as a deposit after the contracts had been signed. As certain conditions precedent for the joint venture were not met during the course of 2001, we terminated the transaction and made a bad debt provision for the full deposit amount at the end of the year. We actively sought a refund during the course of 2001 and 2002, and obtained a refund of US$348,000 in 2003. For the years ended December 31, 2001, 2002 and 2003, we paid management fees of US$261,000, US$293,000 and US$137,000, respectively, to Golden Tripod Limited, an entity affiliated with Xinhua, one of our major shareholders, for the provision of general management services to us.
Dr. Raymond Ch’ien.In April 2001, we entered into an executive services agreement with our chairman and director Raymond Ch’ien to serve as our executive chairman. Under this agreement we have agreed to provide Dr. Ch’ien the following:
| • | | options to purchase 400,000 Class A common shares, par value US$0.00025 per share, at an exercise price of US$2.74 per share that vest quarterly over three years starting July 27, 2001; |
| |
| • | | options to purchase up to 400,000 additional Class A common shares at an exercise price of US$2.97 that vest quarterly over three years starting October 13, 2001; |
| |
| • | | an annual salary of US$1.00; |
| |
| • | | reimbursement of company car expenses, as well as office executive assistant expenses incurred, capped at a maximum amount of US$100,000 per annum; and |
| |
| • | | reimbursement of all reasonable travel, entertainment and subscription fees incurred in the performance of his duties as executive chairman. |
While Dr. Ch’ien’s services agreement expired on April 27, 2004, a new services agreement is currently being negotiated.
CIC.In June 1999, we entered into a Support Services Agreement with CIC under which we agreed to provide CIC with the services required to operate local online services for AOL in Hong Kong which was amended in April 2000. CIC was our parent company until June 1999 when, concurrently with entry into the support services agreement, CIC distributed its total interest in us to CIC’s shareholders. At the time of entry into the support services agreement, several members of the board of directors of CIC also served as members of our board of directors.
Since January 1, 2001, we did not recognize any revenue in connection with the amended and restated support services agreement due to the uncertainty of the collectibility of the receivable from CIC. We recorded US$5.4 million incurred in connection with the provision of these services under selling, general and administrative expenses in 2001. In September 2001, as we had already decided at the beginning of the year to waive our legal rights to the amount owing, we agreed to CIC’s request to formalize the forgiveness of up to US$7.7 million owed to us by CIC.
In October 2001, we entered into an asset purchase agreement with CIC to purchase the three URLs, www.china.com, www.hongkong.com and www.taiwan.com, and related intellectual property rights for US$16.8 million and the final payment for the purchase was made in February 2002. A portion of the proceeds was used to repay loans extended to CIC by certain of our shareholders and members of our board of directors, some of whom are also our shareholders, officers and members of our board of directors. We sought third party advice related to accounting, legal and valuation issues when considering the transaction. We obtained releases with respect to registered charges over CIC’s assets, including the URLs from material creditors of CIC which included our affiliates. See Item 3.D — “Key Information — Risk Factors — Risks relating to chinadotcom — We are subject to risks related to our purchase of the URLs from CIC”, and Item 4.B — “Business Overview — Software and other investment initiatives”.
Sportasia.In November 2001, as part of the liquidation of our equity investee Sportasia Media Limited, we acquired the URL, www.sportasia.com.
109
Asia Pacific Online Limited.For the year ended December 31, 2001, we reimbursed US$120,000 per year to APOL for expenses incurred for the provision of general management services principally consisting of providing the full-time services of Mr. Peter Yip to act as our chief executive officer. In January 2002, we entered into a new services agreement with APOL. Under this agreement, we agreed to provide an annual management fee of US$1 and reimburse expenses incurred up to US$270,000 annually for the provision of general management services principally consisting of providing the full-time services of Mr. Peter Yip to act as our chief executive officer. APOL is a trust owned by the spouse of Mr. Peter Yip, who is our chief executive officer, for the benefit of Mr. Yip’s children. There are no common directors between us and APOL. Mr. Yip acted as our chief executive officer in each of 2001, 2002 and 2003. APOL is the owner of record of 11,835,686 Class A common shares and the beneficial owner of an additional 2,318,942 Class A common shares due to exercisable options attributable to APOL. In addition, Mr. Yip is the beneficial owner of 190,000 Class A common shares due to exercisable options attributable to him. As of March 31, 2004, Mr. Yip’s spouse also owns 4,444,900 Class A common shares. See Item 7.A – “Major Shareholders”.
| C. | | Interests of Experts and Counsel |
Not applicable.
ITEM 8. FINANCIAL INFORMATION
We have appended our Consolidated Financial Statements as of and for the year ended December 31, 2003 on pages F-1 to F-45 of our annual report.
ITEM 9. THE OFFER AND LISTING
| A. | | Offer and Listing Details |
Our shares have been quoted on the Nasdaq National Market under the symbol “CHINA” since our IPO on July 12, 1999. Prior to July 12, 1999, there was no public market for our shares. The following table sets forth, for the years indicated, the high and low closing prices per share as reported on the Nasdaq National Market. On December 31, 2003, the closing price for our Class A common shares on the Nasdaq National Market was US$8.07 per share.
| | | | | | | | | |
| | | Closing prices(1)
|
| | | High
| | Low
|
| | | (in U.S. dollar per share) |
| 2000: | | | | | | | | |
| Annual | | | 73.4375 | | | | 4.4063 | |
| 2001: | | | | | | | | |
| First quarter | | | 7.6250 | | | | 2.3125 | |
| Second quarter | | | 3.5500 | | | | 2.0625 | |
| Third quarter | | | 4.0000 | | | | 1.8700 | |
| Fourth quarter | | | 3.0000 | | | | 1.9500 | |
| Annual | | | 7.6250 | | | | 1.8700 | |
| 2002: | | | | | | | | |
| First quarter | | | 3.2800 | | | | 2.6300 | |
| Second quarter | | | 2.7800 | | | | 2.1600 | |
| Third quarter | | | 2.5400 | | | | 1.8600 | |
| Fourth quarter | | | 3.0722 | | | | 1.9100 | |
110
| | | | | | | | | |
| | | Closing prices(1)
|
| | | High
| | Low
|
| | | (in U.S. dollar per share) |
| Annual | | | 3.2800 | | | | 1.8600 | |
| 2003: | | | | | | | | |
| First quarter | | | 3.5800 | | | | 2.7300 | |
| Second quarter | | | 8.4100 | | | | 3.2100 | |
| Third quarter | | | 14.4600 | | | | 8.2800 | |
| Fourth quarter | | | 10.3800 | | | | 7.4300 | |
| Annual | | | 14.4600 | | | | 2.7300 | |
| Past six calendar months: | | | | | | | | |
| 2003: | | | | | | | | |
| December | | | 8.6700 | | | | 7.4300 | |
| November | | | 9.4500 | | | | 8.2600 | |
| October | | | 10.3800 | | | | 8.2000 | |
| September | | | 10.1300 | | | | 8.2800 | |
| August | | | 11.9900 | | | | 8.6700 | |
| July | | | 14.4600 | | | | 9.2500 | |
| (1) | | All share prices are adjusted retroactively to reflect the two-for-one share split effected as of each of December 13, 1999 and May 8, 2000, respectively. |
Source: Bloomberg.
| B. | | Plan of Distribution |
| |
| | | Not applicable. |
Our Class A common shares have been traded on the Nasdaq National Market in the United States under the symbol “CHINA” since our IPO on July 12, 1999. Prior to July 12, 1999, there was no public market for our shares. There can be no assurance we can continue to satisfy the relevant criteria for maintaining our listing on the Nasdaq National Market.
| D. | | Selling Shareholders |
| |
| | | Not applicable. |
| |
| E. | | Dilution |
| |
| | | Not applicable. |
| |
| F. | | Expenses of the Issue |
| |
| | | Not applicable. |
ITEM 10. ADDITIONAL INFORMATION
| A. | | Share Capital |
| |
| | | Not Applicable. |
| |
| B. | | Memorandum and Articles of Association |
111
We incorporate by reference into this Annual Report the description of our Amended and Restated Articles of Association contained in our Current Report of Foreign Private Issuer on Form 6-K (File No. 000-30134) filed with the Commission on September 18, 2002.
Expansion through Acquisitions and Partnerships
We have acquired, and intend to continue to acquire, companies and assets that we believe will enhance our business model, revenue base, operations and profitability, particularly relating to our strategy in enterprise software, outsourced software development and mobile services. Our acquisitions require the investment of significant amounts of cash and our Class A common shares, and, in the past has involved amortization expenses related to certain intangible assets. A brief summary of our material transactions during the past three years is set forth below.
In October 2001, we entered into an asset purchase agreement with CIC to purchase the three URLs, www.china.com, www.hongkong.com and www.taiwan.com, and related intellectual property rights for US$16.8 million from CIC, and the final payment for the purchase was made in February 2002. For further details, see Item 3.D — “Key Information — Risk Factors — Risks relating to chinadotcom — We are subject to risks related to our purchase of the URLs from CIC” and Item 7.B — “Major Shareholders and Related Party Transactions — Related Party Transactions”.
In March 2002, we acquired Layabo Pty. Limited (now renamed Mezzo Business Databases Pty Limited), an Australian database marketing business and owner of the trademark IncNet. With the acquisition of Layabo Pty. Limited and the prior acquisition of RNR International Marketing Group (Australia) Pty Limited in 2000, we are consolidating our marketing business in Australia under the MEZZO brand.
In March 2002, we acquired a 51% interest in OpusOne Technologies, the parent of Platinum China Holdings, Inc., a developer and service provider of business management software solutions for state enterprises and multi-national corporations in Greater China. We acquired the remaining interest in OpusOne Technologies in May 2003. The total consideration was based upon a set multiple of average net earnings under US GAAP for the three years from 2003 through 2005 inclusive, and will be paid in installments during that period. The total consideration is payable in cash and shares and will be contingent upon the future performance of the business.
In October 2002, we entered into a transaction with Sagent Technology, Inc., a provider of enterprise business intelligence solutions, involving an asset-based senior secured loan with a principal amount of US$7.0 million and warrants for shares of Sagent. In March 2003, based upon the occurrence of what we viewed to be certain events of default under the loan, we exercised our rights as a secured lender to enforce our security interest in certain loan collateral and filed a claim for damages against Sagent. In April 2003, we reached a settlement with Sagent pursuant to which our loan was repaid in full, and we received an additional agreed upon sum in respect of terminated warrants and other rights we had in the company.
In February 2003, our subsidiary, CDC Australia Limited, completed the acquisition of Praxa, a leading Australian information technology professional services organization with a 21-year operating history. The acquisition was completed for a purchase price of up to A$11.0 million (approximately US$6.4 million), subject to clawback provisions based on future performance. We paid US$3.5 million in cash in February 2003 at the time of acquisition. As of December 31, 2003, we had future commitments relating to the acquisition of Praxa for up to US$2.9 million. The amount to be paid will depend upon Praxa’s earnings before interest, tax, depreciation and amortization for the year ended December 31, 2003. In the event Praxa’s EBITDA for 2003 multiplied by 3.004 is greater than US$6.4 million, then we are required to pay US$2.9 million. In the event Praxa’s EBITDA for 2003 multiplied by 3.004 is less than US$6.4 million, then we are only required to pay the difference between US$2.9 million minus the difference between US$6.4 million minus such product, such
112
amount not to be less than zero. As of the date of this filing, the determination of this contingent portion of the consideration had not been finalized. In addition, we had a US$3.9 million loan to Praxa outstanding pursuant to a Loan Agreement — Fully Drawn Advance Facility dated as of February 12, 2004.
In April 2003, we completed the acquisition of Newpalm, a leading short message service mobile software platform developer and application service provider in China, through our mobile applications and portal arm and 81.3%-owned subsidiary, hongkong.com. We paid cash consideration of US$14.0 million in 2003 and US$41.0 million in February 2004.
In May 2003, our wholly-owned subsidiary, CDC Outsourcing Holdings Ltd., entered into a 51% owned joint venture agreement with vMoksha Technologies Limited, an information technology outsourcing company headquartered in Bangalore, India. The joint venture aims to provide a broad range of outsourcing related services to major software vendors and enterprises in the United States, Europe and the Asia-Pacific region.
In September 2003, we acquired a majority interest in IMI, an international provider of software to the supply chain management sector principally across Europe and the United States, by acquiring 51% of IMI’s holding company, Cayman First Tier, in exchange for US$25.0 million to subscribe for new shares in Cayman First Tier and up to an aggregate of US$25.0 million in revolving loan facilities provided to Cayman First Tier. Symphony Technology Group, a Palo Alto, California based venture capital company, holds the remaining 49% in Cayman First Tier. The following discussion sets forth the terms of some of our arrangements with Cayman First Tier and our joint venture partner, Symphony.
Cayman First Tier Loan Facilities.In addition to the US$25.0 million investment we paid as consideration for our 51% stake in Cayman First Tier, we provided additional consideration in the form of the Cayman Loan Facility, in which Cayman First Tier is the borrower, and the Symphony Loan Facility, in which Symphony Enterprise Solutions, S.ar.L., a wholly-owned subsidiary of Cayman First Tier is the borrower. Under these loan facilities, we are obligated to loan up to an aggregate of US$25.0 million. The two loan facilities have substantially similar terms. Each of the loan facilities are documented as revolving credit facilities and expire on September 8, 2008. Under their terms, we agreed to make advances in the form of cash or chinadotcom shares. Interest on advances accrues at the rate of 3% per year, and is payable quarterly in arrears. The borrower has the option of prepaying borrowed amounts at any time upon three business days’ notice without penalty or premium in increments of US$100,000. The borrower is required to make a mandatory prepayment of all outstanding advances in full upon our request in the event any one of our competitors makes an equity investment in Symphony in excess of US$2.0 million or more than one of our competitors make equity investments in Symphony in excess of US$5.0 million in the aggregate.
Proceeds of advances may be used for the following purposes:
| • | | to acquire assets of, or equity interests in, companies that are in the business of providing software for warehousing management, logistics and distribution management, and supply chain execution; |
| |
| • | | to provide working capital for any businesses so acquired; |
| |
| • | | to make loans and capital contributions to subsidiaries; or |
| |
| • | | to repay a then existing loan agreement among affiliates of IMI and Foothill Capital Corporation. |
Under each of the loan facilities, the borrowers are obligated to provide, upon our request, guarantees and security agreements guaranteeing and/or securing payment of the borrower’s obligations under the loan facilities, which could include liens on the assets of the borrower and the assets and securities of subsidiaries. In addition, the lines of credit contain other covenants typical for such facilities, including limitations on liens, limitations on debt and restrictions on sale of assets. In addition, at any time when we are no longer entitled to
113
appoint a majority of the board of directors of IMI, the borrower is required to comply with the following financial covenants:
| • | | maintain tangible asset value, which is defined as total assets minus goodwill and other intangible assets, as follows: |
| º | | if the total outstanding advances are less than US$15.0 million, greater than the total outstanding advances; or |
| |
| º | | if the total outstanding advances are greater than US$15.0 million, greater than US$15.0 million plus a specified percentage of the total outstanding advances greater than US$15.0 million which percentage is 33% during the first year of the advance, 66% during the second year of the advance, and 100% of the advance thereafter; |
| • | | maintain positive EBITDA for each fiscal quarter as follows: |
| º | | if budgeted EBITDA was at least US$3.0 million, at least 50% of such amount; or |
| |
| º | | if budgeted EBITDA is less than US$3.0 million, not more than US$1.5 million less than the amount budgeted for such quarter; |
| |
| º | | make expenditures for fixed or capital assets only to the extent that the aggregate of all such expenditures in such year do not exceed the lesser of 3% of the gross revenues of the borrower and the amount equal to 120% of the amount of such expenditures budgeted for such year; and |
| • | | maintain consolidated cash and permitted investments of at least US$3.0 million. |
As of December 31, 2003, US$7.0 million was outstanding under the Cayman Loan Facility, and no amount was outstanding under the Symphony Loan Facility. Amounts drawn under the Cayman Loan Facility were used to repay amounts outstanding under, and to terminate, a Loan and Security Agreement among affiliates of IMI and Foothill Capital Corporation, as lender. The US$7.0 million drawn under the Cayman Loan Facility is secured by a first priority pledge by Symphony in our favor for all of Symphony’s right, title and interest in Symphony’s 49% interest in Cayman First Tier.
Put Option Agreement. Also in connection with our investment in IMI, we granted Symphony an option to sell us all of Symphony’s 49% interest in IMI at any time during the twelve months following the occurrence of any of the following events:
| • | | The composition of IMI’s executive committee is altered by the IMI board such that it does not consist of four members of the IMI board, with two members elected by each of chinadotcom and Symphony; provided, that a change in the composition of the executive committee to five members permitted under the terms of the executive committee charter in limited circumstances, does not trigger Symphony’s option; |
| |
| • | | A decision of the executive committee, made under the exclusive authority delegated to it under the executive committee charter is overruled by the entire IMI board; or |
| |
| • | | The rights, powers or responsibilities set forth in the executive committee charter are adjusted or terminated by the entire IMI board without the approval of the directors elected by Symphony. |
The purchase price for Symphony’s interest in IMI is based on the financial performance of IMI, and is set at a fixed multiple of IMI’s annual revenues. The multiple is selected based upon a table using IMI’s revenue growth and EBITDA as a percentage of revenue as the selected metrics. The fixed multiple varies from 0.25, in the event revenues for IMI are decreasing greater than 10% per year and EBITDA as a percentage of revenues for IMI is less than 5%, to 6.0, in the event revenues for IMI are increasing greater than 20% per year and
114
EBITDA as a percentage of revenues for IMI is greater than 20%. The parties have agreed to review the fixed multiples set forth in the table at least once a year so that the multiples would accurately reflect the fair market value for enterprise software companies, or earlier in the event the Nasdaq National Market composite index changes by more than 30% between periods the multiples are last reviewed. The form of payment of the purchase price will be determined by the parties, and may consist of cash, chinadotcom common shares, a combination of both cash and chinadotcom common shares, or other form of payment.
Symphony Note.In addition to the Symphony Loan Facility and the Cayman Loan Facility, on November 14, 2003, Cayman First Tier provided a loan in the principal amount of US$25.0 million to Symphony in exchange for a non-recourse promissory note from Symphony, or the Symphony Note. Symphony would use the proceeds from the loan to pursue acquisitions of enterprise resource planning software companies. Under the terms of the Symphony Note, the entire principal amount outstanding is payable by Symphony on November 14, 2007, with interest accruing at the rate of 3% per annum. Accrued interest is payable quarterly in the event Symphony’s net worth falls below the amount outstanding under the Symphony Note. Symphony has the option of prepaying borrowed amounts at any time upon three business days’ notice without penalty or premium, in increments of US$100,000. Symphony’s obligations under the promissory note are secured by a pledge from Symphony in favor of Cayman First Tier of all of Symphony’s right, title and interest in Symphony’s 49% interest in Cayman First Tier. The security interest is subordinate to the security interest Symphony granted in its 49% interest in Cayman First Tier to secure amounts outstanding under the line of credit we provided to Cayman First Tier. The promissory note allows Cayman First Tier to declare the note immediately due and payable upon the occurrence of events of default typical for such promissory notes including payment defaults, Symphony’s inability to pay its debts as they become due or becomes insolvent, or if the security agreement fails to create a valid lien on the collateral to secure the loan.
In connection with the US$25.0 million loan under the Symphony Note and the US$7.0 million loan under the Cayman Loan Facility, on November 14, 2003, Symphony waived its right to receive, and granted to us, up to a maximum of US$10.0 million per year of Symphony’s pro rata portion of the profits of IMI available for distribution by dividend to Symphony during the two year period ending September 30, 2005. If the total profits of IMI during the two year period are less than US$20.0 million, the term of Symphony’s waiver and grant automatically extends until the earlier of March 31, 2006 or such time as the total profits of IMI waived by Symphony equal US$20.0 million. Any such amounts we receive from Symphony’s pro rata portion of IMI’s actual aggregate profits available for distribution by dividend to Symphony may be used to set-off any amounts of accrued and unpaid interest and outstanding principal under the Symphony Note. The amount of profits of IMI that will be available for distribution by dividend, if any, will depend upon the financial performance of IMI which is subject to risks and uncertainties.
Also in connection with the US$25.0 million loan under the Symphony Note and the US$7.0 million loan under the Cayman Loan Facility, on November 14, 2003, Symphony granted Cayman First Tier an option to purchase from Symphony a portion of the securities of the company Symphony acquired with the proceeds from the Symphony Note, or the Symphony Acquisition. Symphony granted Cayman First Tier an option to purchase a number of securities in equal to 5% of the amount of securities acquired by Symphony in the Symphony Acquisition. The purchase price for the securities was set at 175% of the price Symphony paid for the acquired securities. Cayman First Tier, with the consent of Symphony, has assigned the option to us.
Ross Merger Agreement.Pursuant to a definitive agreement entered on September 4, 2003 as amended among Ross, chinadotcom and CDC Software Holdings, we proposed to acquire Ross for approximately US$68.1 million in consideration. Under the amended merger agreement, stockholders of Ross have the option to receive either:
| • | | US$17.00 in cash, or |
| |
| • | | US$19.00 in a combination of cash and chinadotcom common shares |
115
for each share of Ross common stock. As a result of the amended merger agreement, at the closing of the merger, Ross stockholders who elect to receive cash and shares will receive, for each share of Ross common stock, US$5.00 in cash and a number of chinadotcom shares equal to US$14.00 divided by the average closing price of chinadotcom shares for the 10 trading days preceding the second trading day before the closing date. Moreover, if the average price of chinadotcom shares is below US$8.50, the amended merger agreement permits chinadotcom to elect to increase the amount of cash that Ross common stockholders will receive and decrease the number of chinadotcom shares that Ross common stockholders will receive. In such case, Ross common stockholders still would receive US$19.00 in a combination of cash and chinadotcom shares for each share of Ross common stock, but would receive more than US$5.00 in cash per share and less than US$14.00 worth of chinadotcom shares for each Ross common share.
In connection with the acquisition of Ross, Ross stock options with an exercise price of US$19.00 per share or less will be replaced with options to purchase chinadotcom common shares under substantially similar terms. Each Ross stock option will be converted into an option to acquire a number of chinadotcom common shares based on a conversion ratio. The conversion ratio is calculated as follows:
| • | | If we do not elect to adjust the exchange ratio to determine the merger consideration, the conversion ratio is the sum of: (a) US$14.00 divided by the average closing price of chinadotcom common shares for the 10 trading days ending on, and including, the second trading day before the closing date of the merger; and (b) US$5.00 divided by the closing sales price of chinadotcom common shares on Nasdaq for the last trading day prior to the closing date of the merger. |
| |
| • | | If we elect to adjust the exchange ratio to determine the merger consideration, the conversion ratio is the sum of: (a) the adjusted exchange ratio, which is a fraction, (i) the numerator of which is US$14.00, and (ii) the denominator of which is a number, not less than the ten-day average price or more than US$8.50, to be determined by us, and (b) the quotient obtained by dividing the total cash amount to be paid per share of Ross common stock based on the adjusted exchange ratio by the closing price of each chinadotcom common share on the Nasdaq National Market for the last trading date before the closing date of the merger. |
Pivotal.On December 8, 2003, we announced that we had signed a definitive agreement to acquire Pivotal by way of either an all-cash or a cash-and-stock transaction. We consummated our acquisition of Pivotal on February 25, 2004. Pivotal is a leading international CRM company that provides a complete set of highly flexible, powerful CRM applications and implementation services for mid-sized enterprises, licensed to over 1,700 clients worldwide. CDC Software acquired all of the outstanding shares of Pivotal under a plan of arrangement pursuant to which Pivotal shareholders elected to receive, for each Pivotal share, either (1) US$2.00 in cash; or (2) US$2.14 comprised of US$1.00 cash plus US$1.14 of common shares of chinadotcom. The value of the share portion of this option was calculated using the average closing price of the chinadotcom shares on the Nasdaq National Market over the ten trading day period ending two days prior to closing, which was US$11.2204.
In addition to the consideration paid for each outstanding Pivotal share, each outstanding option to acquire Pivotal common shares with an exercise price of less than US$2.00 was converted into an option to acquire, on the same terms and conditions as were applicable under the Pivotal option plans before closing, chinadotcom common shares. Each such option to acquire Pivotal common shares was converted into a number of chinadotcom common shares equal to the product of (a) the number Pivotal common shares issuable upon exercise of option immediately before closing; multiplied by (b) the exchange ratio. The exchange ratio is equal to a fraction, the numerator of which is US$2.00, and the denominator of which was the average per share closing price of chinadotcom common shares on the Nasdaq National Market during the ten consecutive trading days ending on (and including) the trading day that is two trading days before closing, or US$11.2204.
116
In connection with the acquisition, we paid total consideration of US$35.9 million in cash, 1.85 million common shares with a value of US$20.7 million using the formula above (the value of these shares was US$21.4 million using the trading price of chinadotcom shares on the day the acquisition was consummated), US$0.5 million in stock option conversion expenses, and approximately US$0.5 million in deal-related expenses.
Financings
Each of us and our subsidiary, hongkong.com has entered into a Global Master Repurchase Agreement with Fortis Bank nv-sa, an AA- rated bank, as rated by Standard & Poor’s, to establish a repurchase facility which enables us to draw down via Fortis Bank, Hong Kong Branch as of May 31, 2003 up to US$250.0 million in funding for a one year term. The Fortis Bank facility has been renewed for 2003. In addition, another repurchase facility with similar terms was negotiated with DBS Bank, an A+ rated bank, as rated by Standard & Poor’s, allowing us to draw down up to US$150.0 million for a three-year term. Each drawdown under the DBS Bank facility is to be agreed upon between ourselves and DBS Bank prior to execution. Both facilities were established to provide us with a source of reasonably priced capital to give us flexibility to finance operational working capital requirements and acquisitions, as well as our treasury management program, without having to liquidate our investment portfolio at short notice. Under these repurchase facilities, any draw down requires us to sell certain debt securities to the bank at a certain price, and the bank agrees to sell back to us the same securities at the same purchase price at a later date. The repurchase dates are set in three or six month intervals for an entire term of one year or three years, depending on which facility is drawn. In effect, the bank retains title to our securities as collateral to enable us to draw down up to a total of US$400.0 million. See Item 5.B — “Operating and Financial Review and Prospects — Liquidity and Capital Resources” and Item 11 — “Quantitative and Qualitative Disclosures About Market Risk”.
General
There are no exchange control restrictions on payments of dividends on our Class A common shares or on the conduct of our operations in Hong Kong, where our principal executive offices are located, or the Cayman Islands, where chinadotcom is incorporated. In addition, both Hong Kong and the Cayman Islands are not party to any double tax treaties and no exchange control regulations or currency restrictions exist in these countries.
We are a Cayman Islands company and our affairs are governed by, among other things, the Companies Law of the Cayman Islands. The following is a summary of material differences between the Companies Law and general corporate law in the United States insofar as they relate to the material terms of our Class A common shares.
Differences in Corporate Law
The Companies Law of the Cayman Islands is modeled after that of England but does not follow recent United Kingdom statutory enactments and differs from laws applicable to United States corporations and their shareholders. Set forth below is a summary of the significant differences between the provisions of the Companies Law applicable to chinadotcom and the laws applicable to companies incorporated in the United States and their shareholders.
Mergers and Similar Arrangements.Cayman Islands law does not provide for mergers as that expression is understood under U.S. corporate law. However, there are statutory provisions that facilitate the reconstruction and amalgamation of companies, provided that the arrangement in question is approved by a majority in number of each class of shareholders and creditors with whom the arrangement is to be made, and who must in addition represent three-fourths in value of each such class of shareholders or creditors, as the case may be, that are present and voting either in person or by proxy at a meeting, or meetings convened for that purpose. The
117
convening of the meetings and subsequently the arrangement must be sanctioned by the Grand Court of the Cayman Islands. While a dissenting shareholder would have the right to express to the court the view that the transaction ought not to be approved, the court can be expected to approve the arrangement if it satisfies itself that:
| • | | the statutory provisions as to majority vote have been complied with; |
| |
| • | | the shareholders have been fairly represented at the meeting in question; |
| |
| • | | the arrangement is such as a businessman would reasonably approve; and |
| |
| • | | the arrangement is not one that would more properly be sanctioned under some other provision of the Companies Law. |
When a take over offer is made and accepted by holders of 90% of the shares within four months, the offeror may, within a two month period, require the holders of the remaining shares to transfer such shares on the terms of the offer. An objection can be made to the Grand Court of the Cayman Islands but this is unlikely to succeed unless there is evidence of fraud, bad faith or collusion.
If the arrangement and reconstruction is thus approved, the dissenting shareholder would have no rights comparable to appraisal rights, which would otherwise ordinarily be available to dissenting shareholders of United States corporations, providing rights to receive payment in cash for the judicially determined value of the shares.
Shareholders’ Suits. Based solely on our inspection of the Register of Writs and Other Originating process in the Grand Court of the Cayman Islands from the date of our incorporation, except for the petition filed by e-Planet Sdb. Bhd. which was withdrawn on September 16, 2003, as of April 30, 2004, we are not currently aware of any actions or petitions pending against us in the courts of the Cayman Islands.
Indemnification
Cayman Islands law does not limit the extent to which a company’s articles of association may provide for indemnification of officers and directors, except to the extent any such provision may be held by the Cayman Islands courts to be contrary to public policy, such as to provide indemnification against civil fraud or the consequences of committing a crime. Our Articles of Association provide for indemnification of officers and directors for losses, damages, costs and expenses incurred in their capacities as such, except if they acted in a willfully negligent manner or defaulted in any action against them.
Insofar as indemnification for liabilities arising under the Securities Act may be permitted to directors, officers or persons controlling the registrant pursuant to the foregoing provisions, we have been informed that in the opinion of the Commission such indemnification is against public policy as expressed in the Securities Act and is therefore unenforceable.
Inspection of Books and Records
Holders of our Class A common shares will have no general right under Cayman Islands law to inspect or obtain copies of our list of shareholders or our corporate records. However, we provide our shareholders with annual audited financial statements.
Proxy materials
Under Cayman Islands law, we are only obligated to send proxy materials to “members” which is equivalent to the registered shareholders of record. Our proxy materials are delivered to all of our registered
118
shareholders. We offer electronic delivery of proxy materials to our registered shareholders, and we mail proxy materials to each registered owner who has not opted to receive proxy materials electronically. In an effort to maintain cost effectiveness, we have, and will continue to, mail the proxy materials to those beneficial shareholders who hold greater than 10,000 of our shares.
Restrictions on Nonresident or Foreign Shareholders
Under Cayman Islands law there are no limitations on the rights of nonresident or foreign shareholders to hold or vote our Class A common shares.
The following is a summary of the material Cayman Islands and United States Federal income tax consequences of an investment in the Class A common shares based upon laws and relevant interpretations thereof in effect as of the date of this Annual Report, all of which are subject to change. This summary does not deal with all possible tax consequences relating to an investment in the Class A common shares, such as the tax consequences under state, local and other tax laws.
Cayman Islands Taxation
The Cayman Islands currently levy no taxes on individuals or corporations based upon profits, income, gains or appreciation and there is no taxation in the nature of inheritance tax or estate duty. There are no other taxes likely to be material to us levied by the Government of the Cayman Islands except for stamp duties which may be applicable on instruments executed in, or after execution brought within the jurisdiction of, the Cayman Islands. The Cayman Islands are not party to any double taxation treaties. There are no exchange control regulations or currency restrictions in the Cayman Islands.
United States Federal Income Taxation
The following summary sets forth certain material U.S. Federal income tax consequences of the purchase, ownership and disposition of the Class A common shares as a capital asset. This summary is based upon the Internal Revenue Code of 1986, as amended, or the Code, our legislative history, existing and proposed U.S. Treasury regulations promulgated thereunder, published rulings by the U.S. Internal Revenue Service, or the IRS, and court decisions, all in effect as of the date of this Annual Report, all of which authorities are subject to change or differing interpretations, which changes or differing interpretations could apply retroactively. This summary does not purport to discuss all aspects of U.S. Federal income tax which may be relevant to particular investors, such as financial institutions, insurance companies, dealers or traders in securities or currencies, regulated investment companies, tax-exempt entities, U.S. holders, as defined below, liable for alternative minimum tax, persons holding Class A common shares as part of a position in a straddle or as part of a hedging transaction or conversion transaction for U.S. tax purposes, persons that enter into a constructive sale transaction with respect to Class A common shares, persons holding 10% or more of our voting shares or U.S. holders whose functional currency as defined in Section 985 of the Code is not the U.S. dollar. In addition, this summary does not discuss any foreign, state or local tax considerations. This summary only applies to original purchasers of Class A common shares who purchase Class A common shares as capital assets, or property held for investment within the meaning of Section 1221 of the Code.
The term U.S. holder means a beneficial owner of a note or Class A common shares who or which is:
| • | | a citizen or resident of the United States; |
| |
| • | | a corporation or partnership created or organized in or under the laws of the United States or of any political subdivision of the United States; |
| |
| • | | an estate the income of which is subject to U.S. Federal income tax regardless of our source; |
119
| • | | a trust if a court within the United States is able to exercise primary supervision over the administration of the trust and one or more U.S. persons have authority to control all substantial decisions of the trust, or the trust elects under U.S. Treasury Regulations to be treated as a U.S. person; or |
| |
| • | | any other person who is subject to U.S. Federal income taxation on a net income basis with respect to a Class A common share. |
Partners of a partnership holding Class A common shares should consult their tax advisor.
Tax Consequences of U.S. Holders
Dividends
Subject to the discussion inPassive Foreign Investment Company Status below, in the event that a U.S. holder receives a distribution, other than pro rata distributions of Class A common shares or rights with respect to Class A common shares, on the Class A common shares, that U.S. holder will be required to include the distribution in gross income as a taxable dividend to the extent such distribution is paid from our current or accumulated earnings and profits as determined for United States Federal income tax purposes. Distributions in excess of our current and accumulated earnings and profits will first be treated, for United States Federal income tax purposes, as a nontaxable return on capital to the extent of the U.S. holder’s basis in the Class A common shares and thereafter as gain from the sale or exchange of a capital asset. Dividends paid by us will not be eligible for the corporate dividends received deduction. The amount of any distribution of property other than cash will be the fair market value of such property on the date of distribution.
Dividends will constitute foreign source income for foreign tax credit limitation purposes. The limitation on foreign taxes eligible for credit is calculated separately with respect to specific classes of income. For this purpose, dividends distributed by us with respect to Class A common shares will be passive income or, in the case of U.S. holders, financial services income. Special rules apply to individuals whose foreign source income during the taxable year consists entirely of qualified passive income and whose creditable foreign taxes paid or accrued during the taxable year do not exceed US$300 or US$600 in the case of a joint return. Further, in particular circumstances, a U.S. holder that:
| • | | has held Class A common shares for less than a specified minimum period during which it is not protected from risk of loss; |
| |
| • | | is obligated to make payments related to the dividends; or |
| |
| • | | holds the Class A common shares in arrangements in which the U.S. holder’s expected economic profit, after non-U.S. taxes, is insubstantial |
will not be allowed a foreign tax credit for foreign taxes imposed on dividends paid on Class A common shares.
Distributions to a U.S. holder of Class A common shares or rights to subscribe for Class A common shares that are received as part of a pro rata distribution to all our shareholders should not be subject to United States Federal income tax. The basis of the new Class A common shares or rights so received will be determined by allocating the U.S. holder’s basis in the old Class A common shares between the old Class A common shares and the new Class A common shares or rights received, based on their relative fair market values on the date of distribution. However, the basis of the rights will be zero if (i) the fair market value of the rights is less than 15% of the fair market value of the old Class A common shares at the time of distribution or (ii) the rights are not exercised and expire.
120
Dispositions of Shares
Subject to the discussion inPassive Foreign Investment Company Status below, gain or loss realized by a U.S. holder on the sale or other disposition of the Class A common shares will be subject to United States Federal income tax as capital gain or loss in an amount equal to the difference between that U.S. holder’s basis in the Class A common shares and the amount realized on the disposition. Such capital gain or loss will be long-term capital gain or loss if the U.S. holder has held the Class A common shares for more than one year at the time of the sale or exchange. Generally, gain or loss realized by a U.S. holder will be treated as U.S. source gain or loss for U.S. foreign tax credit purposes.
Passive Foreign Investment Company Status
Based upon an analysis of our assets as at December 31, 2003 and income for the year 2003, during 2003, we are a PFIC for United States federal income tax purposes. Although we intended to conduct our business activities in a manner to reduce the risk of our classification as a PFIC, we have substantial passive assets in the form of cash and cash equivalents and treasury instruments, and can provide no assurance that we will not continue to be classified as a PFIC for 2004 or any future tax year. The determination of whether we would continue to be a PFIC would be principally based upon:
| • | | the composition of our assets, including goodwill, the amount of which will depend, in part, on our total net assets and the market value of our Class A common shares, which is subject to change; and |
| • | | the amount and nature of our income from time to time. |
We have limited control over these variables. To the extent we do have control over these variables, we may take steps to reduce the material and adverse effect that our PFIC classification may have on our business, financial condition and results of operations.
In general, we will be a PFIC with respect to a U.S. holder if, for any taxable year in which the holder owns Class A common shares:
| • | | at least 75% of our gross income for such taxable year is passive income; or |
| • | | at least 50% of our assets, measured by value on a quarterly average basis, produce or are held for the production of passive income. |
For this purpose, passive income generally includes dividends, interest, rents, royalties, other than certain rents and royalties derived in the active conduct of a trade or business, annuities, gains from assets that produce passive income, net income from notional principal contracts and certain payments with respect to securities loans. If we own, directly or indirectly, at least 25% by value of the stock of another corporation, we will be treated as owning our proportionate share of the assets of the other corporation and as receiving directly our proportionate share of the other corporation’s income.
Subject to the discussion of the mark to market election and qualified electing fund, or QEF, election below, if we were a PFIC for any taxable year during which the investor held Class A common shares, the investor would be subject to special tax rules, regardless of whether we ceased to be a PFIC at a later date, with respect to:
| • | | any excess distribution by us to the investor, which means any distributions, possibly including any return of capital distributions, received by the investor on the Class A common shares in a taxable year that are greater than 125% of the average annual distributions received by the investor in the three preceding taxable years, or the investor’s holding period for the Class A common shares, if shorter; and |
| • | | any gain realized on the sale or other disposition, including a pledge, of Class A common shares. |
121
| Under these special tax rules: |
| • | | the excess distribution or gain would be allocated ratably over the U.S. holder’s holding period for the Class A common shares; |
| • | | the amount allocated to the current taxable year and any taxable year prior to the first taxable year in which we were a PFIC would be treated as ordinary income; |
| • | | the amount allocated to each of the other years would be taxed as ordinary income at the highest tax rate in effect for that year; and |
| • | | the interest charge applicable to underpayments of tax would be imposed with respect to the resulting tax attributable to each prior year in which we were a PFIC. |
If we are a PFIC in any year, you will be required to make an annual return on Internal Revenue Service, or IRS, Form 8621 regarding distributions received with respect to the Class A common shares and any gain realized on the disposition of the Class A common shares.
As an alternative to the special rules, a U.S. holder may elect to treat our Class A common shares that constitute marketable stock as if those Class A common shares were sold and immediately repurchased by the U.S. holder at the close of each taxable year, a mark to market election. If the election is made, the U.S. holder would be required to include as ordinary income the amount of any increase in the market value of the Class A common shares since the close of the preceding taxable year, or the beginning of the U.S. holder’s holding period, if such holding period began during the taxable year. Likewise, the U.S. holder would be allowed an ordinary deduction for the amount of any decrease in the market value of the Class A common shares since the close of the preceding taxable year, up to the amount of any prior increase in the Class A common shares’ market value that has not previously been taken into account in calculating allowable deductions. The U.S. holder’s basis in our Class A common shares would be increased by the amount of any ordinary income, and reduced by the amount of any deduction, arising under the mark to market election. In the case of a sale or other disposition of Class A common shares as to which a mark to market election is in effect, any gain realized on the sale or other disposition would be treated as ordinary income. Any loss realized on the sale or other disposition would be treated as an ordinary deduction, up to the amount of any prior increase in the Class A common shares’ market value that has not previously been taken into account in calculating allowable deductions, and as a capital loss to the extent of any excess. PFIC shares, other than shares held by certain regulated investment companies, are considered marketable only if the foreign exchange or market on which the shares are regularly traded is designated by the U.S. Treasury Department as a qualified foreign exchange or market. Under the Treasury Regulations, the Class A common shares would be considered to be regularly traded on a qualified foreign exchange or market if (i) the ordinary shares are traded at least 15 days during each calendar quarter of the relevant calendar year in more than de minimis quantities, and (ii) the foreign exchange or market on which the ordinary shares are regularly traded is subject to regulation or supervision by a governmental authority of the country in which such exchange or market is located and the exchange has financial disclosure, surveillance and other requirements designed to prevent fraudulent and manipulative practices and remove impediments to the mechanism of a free and open, fair and orderly market and the rules of the exchange effectively promote active trading of listed stocks. We expect that the Class A common shares to be marketable within the meaning of the Treasury Regulations.
As a second alternative, a U.S. holder can make a QEF election to include annually our pro rata share of a PFIC’s earnings and net capital gains currently in income each year, regardless of whether or not dividend distributions are actually distributed. This means a U.S. holder could have a tax liability for the earnings or gain without a corresponding receipt of cash. The U.S. holder’s basis in the common stock will be increased to reflect the amount of the taxed but undistributed income. Distributions of income that had previously been taxed will result in a corresponding reduction of basis in the common stock and will not be taxed again as a distribution to the U.S. holder. Each U.S. holder who desires QEF treatment must individually make a QEF election. To make a
122
QEF election you will need to have an annual information statement from the PFIC setting forth the earnings and capital gains for the year. As a PFIC, we would supply the PFIC annual information statement to any shareholder or former shareholder who requests it. In general, a U.S. holder must make a QEF election on or before the due date for filing its income tax return for the first year to which the QEF election will apply. U.S. holders will be permitted to make retroactive elections in particular circumstances, including if the U.S. holder had a reasonable belief that the foreign corporation was not a PFIC and filed a protective election. Investors should consult their tax advisors as to the consequences of making a protective QEF election or other consequences of the QEF election.
As soon as practicable after the date of this filing, we will make our 2003 PFIC annual information statement and other PFIC-related information available under a link entitled “PFIC” on our corporate website which you may access at http://www.corp.china.com/investor_relations. Information contained on our website does not constitute a part of this Annual Report.
Although we generally will be treated as a PFIC as to any U.S. holder if we are a PFIC for any year during a U.S. holder’s holding period, if we cease to satisfy the requirements for PFIC classification, you may avoid such classification for years after such cessation if (1) you have made a QEF election in the first taxable year in which you own the Class A common shares, or (2) you elect to recognize gain based on the realized appreciation in the Class A common shares through the close of the tax year in which we cease to be a PFIC.
Transfer Reporting Requirements
Under recently promulgated regulations, a U.S. holder, including a tax exempt entity, that purchases Class A common shares for cash will be required to file an IRS Form 926 or similar form with the IRS, if (1) the U.S. holder owned, directly or by attribution, immediately after the transfer at least 10% by vote or value of us, or (2) the purchase, when aggregated with all purchases made by that U.S. holder, or any related person thereto, within the preceding 12 month period, exceeds US$100,000. If a U.S. holder fails to file any such required form, the U.S. holder could be required to pay a penalty equal to 10% of the gross amount paid for the Class A common shares, subject to a maximum penalty of US$100,000, except in cases involving intentional disregard. You should consult your tax advisors with respect to this or any other reporting requirement which may apply with respect to their acquisition of the Class A common shares.
Backup Withholding and Information Reporting
The relevant paying agents for the shares must comply with information reporting requirements in connection with dividend payments or other taxable distributions made within the U.S. on the Class A common shares to a non-corporate U.S. person. In addition, “backup withholding” at the rate of 31% generally will apply to those payments unless the beneficial owner provides an accurate taxpayer identification number on a properly completed IRS Form W-9, certifies its non-U.S. status under penalties of perjury on a properly completely IRS Form W-8BEN, or otherwise certifies that the beneficial owner is not subject to backup withholding.
Payment of the proceeds from sale of the Class A common shares to or through a U.S. office of a broker is subject to both U.S. backup withholding and information reporting requirements, unless the beneficial owner provides an accurate taxpayer identification number or establishes an exemption from backup withholding, as described in the preceding paragraph. In general, neither U.S. backup withholding nor information reporting will apply to a payment of sale proceeds made outside the U.S. through an office outside the U.S. of a non-U.S. broker. Special rules may require information reporting in the case of payments of sale proceeds made outside the U.S. through a U.S. broker.
Amounts withheld under the backup withholding rules may be credited against a U.S. Holder’s U.S. federal income tax liability, and a holder may obtain a refund of any excess amounts withheld under the backup withholding rules by filing the appropriate claim for refund with the IRS.
123
| F. | | Dividends and Paying Agents |
| |
| | | Not applicable. |
| |
| G. | | Statement by Experts |
| |
| | | Not applicable. |
| |
| H. | | Documents on Display |
Any statement in this Annual Report about any of our contracts or other documents is not necessarily complete. If the contract or document is filed as an exhibit to the registration statement, the contract or document is deemed to modify the description contained in this Annual Report. You should review the exhibits for a complete description of the contract or document.
We are subject to the periodic reporting and other informational requirements of the Securities Exchange Act of 1934, as amended. Under the Exchange Act, we are required to file reports and other information with the Commission. Specifically, we are required to file annually a Form 20-F no later than six months after the close of our fiscal year, which is December 31. Copies of the registration statement, its accompanying exhibits, as well as reports and other information, when filed, may be inspected without charge and may be obtained at prescribed rates at the public reference facilities maintained by the Commission at Judiciary Plaza, 450 Fifth Street, N.W., Washington, D.C. 20549, and at the regional offices of the Securities and Exchange Commission located at Seven World Trade Center, New York, New York 10048 and Citicorp Center, 500 West Madison Street, Suite 1400, Chicago, Illinois 60661. The public may obtain information regarding the Washington, D.C. Public Reference Room by calling the Commission at 1-800-SEC-0330. You may access the Securities and Exchange Commission’s Web site at http://www.sec.gov. Our Class A common shares are listed for trading on NASDAQ under the symbol “CHINA”. As a foreign private issuer, we are exempt from the rules under the Exchange Act prescribing the furnishing of proxy statements, and officers, directors and principal shareholders are exempt from the reporting and short-swing profit recovery provisions contained in Section 16 of the Exchange Act.
��We furnish our shareholders with annual reports, which include a review of operations and annual audited consolidated financial statements prepared in conformity with US GAAP.
| I. | | Subsidiary Information |
For a listing of our material subsidiaries, see Item 4.C — “Information on the Company — Organizational Structure”.
ITEM 11. QUANTITATIVE AND QUALITATIVE DISCLOSURES ABOUT MARKET RISK
You should read the following discussion of our Quantitative and Qualitative Disclosures About Market Risk together with our financial condition and results of operations as set forth in Item 5 of this Annual Report, Operating and Financial Review and Prospects and with our consolidated financial statements and the related notes included elsewhere in this Annual Report.
Market risk is the risk related to adverse changes in market prices of financial instruments. We are exposed to various types of market risks, including changes in interest rates and foreign currency exchange rates, in the normal course of business. In addition, we are exposed to investment risks due to our substantial investment holdings of available-for-sale debt securities in our treasury management program.
Interest Rate Risk.Our exposure to interest rate risk relates primarily to our short-term and long-term available-for-sale debt securities. In general, when interest rates change, the price of a fixed-coupon bond changes in the
124
opposite direction. Thus, when interest rates increase, a bond’s value drops. If we were to sell securities under such adverse interest rate conditions, we could lose some of our principal. Historically the fluctuation in value of our debt portfolio has not exceeded 5% although there can be no guarantee that our portfolio will not undergo greater fluctuations in the future.
As of December 31, 2003, we had invested US$313.3 million in fixed and floating rate debt securities, including US$31.1 million of restricted debt securities set aside as collateral pursuant to US$25.1 million in drawdowns under our repurchase facilities.
The following table sets forth information as of December 31, 2003 about our debt investments that are sensitive to changes in interest rates.
| | | | | | | | | | | | | | | | | | | | | | | | | | | | | |
| | | Expected Maturity Dates
|
| | | | | | | | | | | | | | | | | | | | | | | 2008 and | | |
| | | 2003
| | 2004
| | 2005
| | 2006
| | 2007
| | thereafter
| | Total
|
| | | (in thousands of U.S. dollars, except percentages) |
| Debt securities: | | | | | | | | | | | | | | | | | | | | | | | | | | | | |
| Unsecured | | | — | | | | 30,022 | | | | — | | | | 22,701 | | | | 43,068 | | | | 166,655 | | | | 262,746 | |
| Fixed Rate | | | — | | | | 2 | % | | | — | | | | 2%-3.1 | % | | | 2.58%-3.4 | % | | | 3.03%-4.5 | % | | | | |
| Unsecured | | | — | | | | — | | | | — | | | | — | | | | — | | | | 19,400 | | | | 19,400 | |
| Variable interest rate | | | — | | | | — | | | | — | | | | — | | | | — | | | LIBOR+2.50% | | | | |
| Secured | | | — | | | | — | | | | — | | | | 7,267 | | | | 5,672 | | | | 18,169 | | | | 31,108 | |
| Fixed rate | | | — | | | | — | | | | — | | | | 2.0%-3.1 | % | | | 2.58 | % | | | 3.75%-4.125 | % | | | | |
Foreign Exchange Risk. Most of our monetary assets and liabilities are denominated in Hong Kong dollars, RMB, and U.S. dollars. Approximately 49% of our revenues for the year ended December 31, 2003 was derived from our Asia subsidiaries, which conducted their businesses and also incurred expenses in their local currency. We do not use any derivatives to hedge against foreign currency fluctuations. As exchange rates in these Asian currencies vary, our revenues and operating results, when translated, may be adversely impacted and vary from expectations. The effect of foreign exchange rate fluctuations on our financial results for the year ended December 31, 2003 was not material. All of our debt securities are US-dollar denominated and therefore not subject to foreign currency risk. However, as long as we continue to rely on US-dollar denominated interest income for a significant portion of our cashflows and use this to support our operations, any material depreciation of the U.S. dollar against currencies of the countries where we have operations might have a negative effect on our cashflows.
Renminbi, or RMB, is not freely convertible into foreign currencies. On January 1, 1994, the PRC government abolished the dual rate system and introduced a single rate of exchange as quoted daily by the People’s Bank of China. However, the unification of the exchange rates does not imply the convertibility of RMB into United States dollars or other foreign currencies. All foreign exchange transactions continue to take place either through the People’s Bank of China or other banks authorized to buy and sell foreign currencies at the exchange rates quoted by the People’s Bank of China. Approval of foreign currency payments by the People’s Bank of China or other institutions requires submitting a payment application form together with suppliers’ invoices, shipping documents and signed contracts.
Credit Default and Investment Risk.When we purchase debt securities as part of our treasury management program, we are subject to risks that can reduce the value of our investments. The primary factors that can cause significant fluctuations or a decline in the fair market value of our investments include:
| • | | the issuer’s actual or perceived credit quality following changes in its debt to equity ratio; |
| |
| • | | increased writedowns for goodwill or intangible assets; |
| |
| • | | declining revenues or earnings that fall short of expectations; and |
125
| • | | inability to comply with financial instrument covenants. |
These and other indicators could reduce the value of our investments due to:
| • | | reduced liquidity; |
| |
| • | | ratings downgrades, or a negative outlook by credit agencies; |
| |
| • | | a decline in the price of an issuer’s equity or debt securities; or |
| |
| • | | an issuer being placed on CreditWatch. |
While all of our current investments in debt securities are investment grade, there can be no assurance that the issuers of those securities will not default on their obligations or their ratings will remain investment grade. A debt security may remain an investment grade instrument, but events such as those listed above could cause the value of that debt security to decline. In such an instance, we would suffer either an actual loss if we sell the debt security, or a mark to market loss if the fair market value were less than its purchase price for six or more consecutive months. As of December 31, 2003, we recorded approximately US$34,000 in accumulated other comprehensive income in the shareholder’s equity account in our consolidated balance sheet, reflecting an aggregate appreciation in fair market value of our debt portfolio since the date of investment.
We are exposed to the risk of default by the issuers of our debt securities. We can quantify the risk by dividing our debt securities portfolio into the four primary risk categories based on the Standard and Poor’s credit ratings of the debt issuers as of December 31, 2003. Even if an issuer did not default, but the market perceives an increased likelihood of a default, we may suffer a principal loss if we sell a debt security of such issuer under unfavorable market circumstances. The table below shows the value of our debt securities as of December 31, 2003 as categorized based on ratings assigned to our debt securities by each of Standard & Poor’s and Moody’s Investors Service.
| | | | | | | | | | | | | | | | | | | | | |
| Rating (Standard & Poor’s) | | AAA | | AA | | A | | BBB | | |
| Rating (Moody’s Investors Service) | | Aaa | | Aa2 | | A2 | | Baa2 | | Total |
| Amounts of debt securities outstanding as of December 31, 2003 (in US$ millions) | | | | | | | | | | | | | | | | | | | | |
| Moody’s Investors Service | | | 293.9 | | | | 0 | | | | 0 | | | | 19.4 | | | | 313.3 | |
| Standard & Poor’s | | | 293.9 | | | | 0 | | | | 0 | | | | 19.4 | | | | 313.3 | |
Our investment in Centauri Fund, currently rated Baa2 by Moody’s Investors Service and BBB by Standard & Poor’s, a bond fund managed by a third party professional manager, is also exposed to external management risk, as the Centauri Fund relies on the professional skills of the fund manager to deliver its target interest income. There can be no assurance that we will achieve our interest income target. Also, our investment in the Centauri Fund is highly illiquid and could be difficult to realize prior to first available redemption in 2006. On January 15, 2004, we disposed of US$9.7 million of our original US$19.4 million holdings of Centauri Fund.
Call Risk. If interest rates decrease, it is possible that issuers of debt securities with the right to call such instruments might exercise their right to call, or exercise the right to buy back their debt at predetermined dates prior to their maturity date at a predetermined price. If this were to happen our portfolio yield could potentially decrease as we might have to reinvest this portion of the portfolio in new investments at lower interest rates. In addition, the cash flows associated with callable bonds are somewhat unpredictable, since the bond life could be much shorter than it’s stated maturity.
Risks Related to the Repurchase Facilities.We have invested funds borrowed from our repurchase facilities in fixed rate AAA-rated debt securities issued by U.S. government sponsored enterprises to enhance our investment income. As of December 31, 2003, we had borrowed US$10.1 million from our repurchase
126
facilities for this purpose. Use of the repurchase facilities with Fortis Bank and DBS Bank creates the following three primary risks for us:
| • | | The risk associated with increased leverage, which includes our ability to pay back the borrowed funds in a timely manner and without which we may need to liquidate a portion of our treasury portfolio at a time where we may need to incur losses on the sale of sufficient debt instruments to repay the borrowing. |
| |
| • | | By setting aside debt securities as collateral under either repurchase facility, we incur the risk that if the banks themselves were to undergo an insolvency event, we could lose all or part of our debt securities set aside at such time with the bank. Currently, Fortis’ credit rating is AA- by Standard & Poor’s and Aa3 by Moody’s Investors Service and DBS Bank’s credit rating is A+ by Standard & Poor’s and Aa2 by Moody’s Investors Service. |
| |
| • | | The interest that we pay under our repurchase facilities is dependent upon Libor and therefore, our future interest expenses with respect to any amounts drawn down under the repurchase facilities may exceed our expectations due to changes in interest rates. For example, if Libor rises extremely rapidly over the next few years, interest expenses will rise commensurately |
Negative Interest Rate Differential.When purchasing debt securities using proceeds from our repurchase facilities, we expect the coupon paid on these debt securities will be substantially higher than the interest we pay on our repurchase facilities. However, we will be exposed to the risk of a negative interest rate differential, or negative carry situation, if interest rates rise. For example, if on the day of a drawdown current LIBOR is 1.2%, and our cost of borrowing is LIBOR + 0.20%, our total cost of borrowing will be 1.4%. Since the interest rate on our repurchase facilities are reset either every three, six or twelve months as we so choose prior to each drawdown, assuming we use the proceeds from our repurchase facilities to purchase a fixed-rate coupon bond yielding 2.3% and a 1.0% increase in LIBOR occurs, our total borrowing cost on the facility would increase to 2.4%
Equity Price Risk
As of December 31, 2003, we had US$0.6 million invested in shares of publicly listed companies. The table below presents the carrying amounts and fair values of our investment in shares of publicly listed companies, which are held for non-trading purposes. The amount of the carrying value is the same as the fair value because we have marked to market the carrying amount of our investments as at the end of the period.
| | | | | | | | | | | | | | | | | |
| | | December 31, 2002
| | December 31, 2003
|
| | | Carrying | | Fair | | Carrying | | Fair |
| | | amount
| | value
| | amount
| | value
|
| Available-for-sale equity securities (US$ million) | | | 2.1 | | | | 2.1 | | | | 0.6 | | | | 0.6 | |
ITEM 12. DESCRIPTION OF SECURITIES OTHER THAN EQUITY SECURITIES
Not applicable.
127
PART II
ITEM 13. DEFAULTS, DIVIDEND ARREARAGES AND DELINQUENCIES
Not applicable.
ITEM 14. MATERIAL MODIFICATIONS TO THE RIGHTS OF SECURITY HOLDERS AND USE OF PROCEEDS
None.
ITEM 15. CONTROLS AND PROCEDURES
An evaluation of the effectiveness of our disclosure controls and procedures was carried out under the supervision and with the participation of our management, including our Chief Executive Officer, or CEO, and our Chief Financial Officer, or CFO. Based on that evaluation, our CEO and CFO concluded that as of the end of the period covered by this report we maintained disclosure controls and procedures that are effective in providing reasonable assurance that information required to be disclosed in our reports under the Securities Exchange Act of 1934 is recorded, processed, summarized and reported within the time periods specified in the Commission’s rules and forms, and that such information is accumulated and communicated to our management, including our CEO and its CFO, as appropriate, to allow timely decisions regarding required disclosure.
There have been no changes in our internal control over financial reporting that occurred during the period covered by this report that have materially affected, or is reasonably likely to materially affect, our internal control over financial reporting.
ITEM 16. [RESERVED]
ITEM 16A. AUDIT COMMITTEE FINANCIAL EXPERT
The board of directors has determined that Thomas M. Britt III is an audit committee financial expert, as defined in Item 16A of Form 20-F. Thomas M. Britt III is an independent audit committee member.
ITEM 16B. Code of Ethics
We have adopted a Code of Ethics and Guidelines for Employee Conduct, or Code of Conduct, that applies to our principal executive officer, principal financial officer and principal accounting officer as well as all our directors, other officers and employees. This Code of Conduct is available upon request from the address on the cover of this Form 20-F.
ITEM 16C. Principal Accountant Fees and Services
Ernst & Young has served as our independent public accountant for each of the fiscal years in the three-year period ended December 31, 2003, for which audited financial statements appear in this annual report on Form 20-F. The auditor is elected annually by our shareholders at the Annual General Meeting. The audit committee will propose to our shareholders at the 2004 Annual General Meeting that Ernst & Young be elected as our auditor for fiscal 2004.
128
(a) Audit Fees.Audit fees were US$574,000 in fiscal 2003 and US$456,000 in fiscal 2002. Audit fees consist of fees billed for the annual audit of our consolidated financial statements and the statutory financial statements of our subsidiaries.
(b) Audit-Related Fees.Audit-related fees were US$845,000 in fiscal 2003 and US$206,000 in 2002. Audit-related fees consist of fees billed for services that are reasonably related to the review of the company’s financial statements or that are traditionally performed by the external auditor. Of the US$845,000 billed for audit-related fees in 2003, US$753,000 was incurred in respect of services related to mergers and acquisitions and capital market transactions.
(c) Tax Fees. Tax fees were US$10,000 in 2003 and US$13,000 in 2002. Tax Fees include fees billed for tax compliance services, including the preparation of original and amended tax returns and claims for refund; tax consultations, such as assistance in connection with tax audits and appeals, tax advice related to mergers and acquisitions, transfer pricing, and requests for rulings or technical advice from taxing authorities; tax planning services; and expatriate tax compliance, consultation and planning services.
(d) All Other Fees. All other fees were nil in 2003 and nil in 2002.
(e)
(1) Audit Committee Pre-approval Policies and Procedures
The audit committee of our board of directors is responsible, among other matters, for the oversight of the external auditor subject to the requirements of applicable securities and corporate laws. The audit committee has adopted a policy regarding pre-approval of audit and permissible non-audit services provided by our independent auditors, or the Policy. Under the Policy, proposed services are approved either (i) by general approval, which provides pre-approval by the audit committee without consideration of specific case-by-case services; or (ii) specific pre-approval, which provides the specific pre-approval of the audit committee. The audit committee may delegate either type of pre-approval authority to one or more of its members. The appendices to the Policy set out the audit, audit-related, tax and other services that have received the general pre-approval of the audit committee; these services are subject to annual review by the audit committee. All other audit, audit-related, tax and other services must receive a specific pre-approval from the audit committee.
(2) Percentage of Services Approved by the Audit Committee
During 2003, none of the fees for services provided to us by Ernst & Young described in each of paragraphs (b) through (d) above were approved by the audit committee pursuant to paragraph (c)(7)(i)(c) of rule 2-01 of Regulation S-X. All fees were approved either by general or specific approval, as described in paragraph (e)(1) above.
ITEM 16D. Exemptions from the Listing Standards for Audit Committees
Not Applicable
129
ITEM 16E. Purchases of Equity Securities by the Issuer and Affiliated Purchasers
| | | | | | | | | | | |
| | | | | | | | | (c) Total number of | | (d) Maximum Number |
| | | | | | | | | Shares Purchased as | | of Shares that May |
| | | | | | | | | Part of Publicly | | Yet Be Purchased |
| | | (a) Total Number of | | (b) Average Price | | Announced Plans or | | Under the Plans or |
Period
| | Shares Purchased*
| | Paid Per Share*
| | Programs
| | Programs
|
| January 1, 2003 to | | 200,000 Class A | | US$ | 2.50 | | | | | |
| January 31, 2003 | | common shares | | | | | | | | |
| | | purchased by | | | | | | | | |
| | | Raymond Ch'ien | | | | | | | | |
| | | 4,300,000 Class A | | US$ | 2.50 | | | | | |
| | | common shares | | | | | | | | |
| | | purchased by APOL | | | | | | | | |
| | | 4,468,560 Class A | | US$ | 2.50 | | | 4,468,560 Class A | | |
| | | common shares | | | | | | common shares | | |
| | | purchased by CCC | | | | | | purchased under the | | |
| | | Nominees Limited | | | | | | Share Repurchase | | |
| | | | | | | | | Program | | |
| February 1, 2003 to February 28, 2003 | | NIL | | | — | | | | | |
| March 1, 2003 to March 31, 2003 | | NIL | | | — | | | | | |
| April 1, 2003 to April 30, 2003 | | NIL | | | — | | | | | |
| May 1, 2003 to May 31, 2003 | | NIL | | | — | | | | | |
| June 1, 2003 to June 30, 2003 | | 127,530 | | $ | 3.2062 | | | | | |
| July 1, 2003 to July 31, 2003 | | 211,696 | | $ | 3.3388 | | | | | |
| August 1, 2003 to August 31, 2003 | | 197,526 | | $ | 3.4033 | | | | | |
| September 1, 2003 to September 30, 2003 | | 194,900 | | $ | 3.2006 | | | | | |
| October 1, 2003 to October 31, 2003 | | 36,700 | | $ | 2.7307 | | | | | |
| November 1, 2003 to November 30, 2003 | | 36,700 | | $ | 3.2832 | | | | | |
| December 1, 2003 to December 31, 2003 | | 56,700 | | $ | 2.4220 | | | | | |
*Represents shares purchased pursuant to option exercises only.
130
PART III
ITEM 17 FINANCIAL STATEMENTS
We have elected to provide financial statement pursuant to Item 18.
ITEM 18 FINANCIAL STATEMENTS
We have appended our Consolidated Financial Statements as of and for the year ended December 31, 2003 on pages F-1 to F-62 of this annual report.
ITEM 19 EXHIBITS
| | | |
No.
| | Description
|
| 1.1 | | Conformed copy of the Amended and Restated Memorandum of Association.******* |
| | | |
| 1.2 | | Conformed copy of the Amended and Restated Articles of Association.******* |
| | | |
| 2(a).1 | | 1999 Employee Stock Option Plan, as amended.* |
| | | |
| 2(a).2 | | 2000 Employee Share Purchase Plan.** |
| | | |
| 2(a).3 | | 2001 Employee Share Purchase Plan.***** |
| | | |
| 4.(a).1 | | Amended and Restated Support Services Agreement dated April 1, 2000 by and between China Internet Corporation Limited and chinadotcom corporation.**** |
| | | |
| 4.(a).2 | | Agreement dated March 12, 2001 by and between China Internet Corporation Limited and chinadotcom corporation. **** |
| | | |
| 4.(a).3 | | Agreement dated March 13, 2001 by and between China Internet Corporation Limited and chinadotcom corporation. **** |
| | | |
| 4.(a).4 | | Guarantee Agreement dated April 4, 2001 by chinadotcom corporation in favor of hongkong.com Limited. **** |
| | | |
| 4.(a).5 | | Asset Purchase Agreement dated October 24, 2001 between China Internet Corporation Limited and chinadotcom Strategic, Inc.****** |
| | | |
| 4.(a).6 | | Share Purchase Agreement by and among CDC Australia Limited, Praxa Limited, Mantech International Corporation and Mantech Australia |
131
| | | |
No.
| | Description
|
| | International Inc. dated December 31, 2002. |
| | | |
| 4.(a).7 | | Share Purchase Agreement by and between CDC Mobile Media Corporation, hongkong.com Corporation and Palmweb Inc., dated March 14, 2003. ++++++ |
| | | |
| 4.(a).8 | | Agreement and Plan of Merger among chinadotcom corporation, CDC Software Holdings, Inc. and Ross Systems, Inc., dated as of September 4, 2003.+++ |
| | | |
| 4.(a).9 | | Transition and Stock Vesting Agreement among chinadotcom corporation, CDC Software Holdings, Inc., Ross Systems, Inc. and J. Patrick Tinley dated as of September 4, 2003.+++ |
| | | |
| 4.(a).10 | | Transition and Stock Vesting Agreement among chinadotcom corporation, CDC Software Holdings, Inc., Ross Systems, Inc. and Robert B. Webster dated as of September 4, 2003.+++ |
| | | |
| 4.(a).11 | | Series B Preferred Share Purchase Agreement by and between Cayman First Tier and chinadotcom Capital Limited, dated September 8, 2003.++++ |
| | | |
| 4.(a).12 | | Shareholders Agreement by and among Cayman First Tier, Symphony Technology II-A, L.P. and chinadotcom Capital Limited, dated September 8, 2003.++++ |
| | | |
| 4.(a).13 | | Voting Agreement by and among Cayman First Tier, Symphony Technology II-A, L.P. and chinadotcom Capital Limited, dated September 8, 2003.++++ |
| | | |
| 4.(a).14 | | Put Option Agreement by and among Cayman First Tier, Symphony Technology II-A, L.P. and chinadotcom Capital Limited, dated September 8, 2003.++++ |
| | | |
| 4.(a).15 | | Amended and Restated Memorandum and Articles of Association of Cayman First Tier, adopted of September 4, 2003.++++ |
| | | |
| 4.(a).16 | | Executive Committee Charter of Cayman First Tier, adopted September 4, 2003.++++ |
| | | |
| 4.(a).17 | | Revolving Credit Agreement by and between Cayman First Tier and chinadotcom Capital Limited, dated September 8, 2003.++++ |
| | | |
| 4.(a).18 | | Revolving Credit Agreement by and between Symphony Enterprise Solutions, S.ar.l and and chinadotcom Capital Limited, dated September 8, 2003.++++ |
| | | |
| 4.(a).19 | | Amendment to Agreement and Plan of Merger signed between chinadotcom corporation, CDC Software Holdings, Inc. and Ross Systems, Inc., dated October 3, 2003.+++++ |
| | | |
| 4.(a).20 | | Guaranty dated as of September 8, 2003 from chinadotcom corporation.+++++ |
| | | |
| 4.(a).21 | | Amended and Restated Memorandum and Articles of Association of Cayman First Tier adopted November 14, 2003.y |
132
| | | |
No.
| | Description
|
| 4.(a).22 | | Amended and Restated Executive Committee Charter of Cayman First Tier adopted November 14, 2003.y |
| | | |
| 4.(a).23 | | Second Amendment to the Agreement and Plan of Merger among chinadotcom corporation, CDC Software Holdings, Inc. and Ross Systems, Inc., dated January 7, 2004.yy |
| | | |
| 4.(a).24 | | Arrangement Agreement by and among Pivotal Corporation, chinadotcom corporation, a Cayman Islands corporation and CDC Software Corporation, dated December 6, 2003.yy |
| | | |
| 4.(a).25 | | Notice of Extraordinary General Meeting to be held on February 23, 2004 and Management Information Circular and Notice of Hearing of Petition for Arrangement under the British Columbia Company Act relating to a proposed arrangement involving Pivotal Corporation and Its Common Shareholders and Its Optionholders and CDC Software Corporation, dated January 20, 2004.yy |
| | | |
| 4.(a).26 | | Amended and Restated Arrangement Agreement by and among Pivotal Corporation, chinadotcom corporation, a Cayman Islands corporation and CDC Software Corporation, dated January 19, 2004.yy |
| | | |
| 4.(a).27 | | Third Amendment to the Agreement and Plan of Merger among chinadotcom corporation, CDC Software Holdings, Inc. and Ross Systems, Inc., dated April 29, 2004.+++++++ |
| | | |
| 4.(a).28 | | Amendment to Share Purchase Agreement by and among CDC Australia Limited, Praxa Limited, Mantech International Corporation and Mantech Australia International Inc. dated February 10, 2003. |
| | | |
| 4,(a).29 | | Amendment to Preferred Stockholder Agreement by and among chinadotcom corporation, Ross Systems, Inc. and Benjamin W. Griffith, III dated January 31, 2004.+++++++ |
| | | |
| 4.(b).1 | | Cooperation Agreement on Short Message Services between China Unicom, Sichuan, and Beijing Newpalm Information Technology Co. Ltd.yyy |
| | | |
| 4.(b).2 | | Monternet SMS Cooperation Agreement.yyy |
| | | |
| 4.(c)1 | | Executive Services Agreement dated April 27, 2001, by and between chinadotcom corporation and Raymond Ch’ien. **** |
| | | |
| 4.(c)2 | | Executive Services Agreement effective as of January 1, 2002, by and between chinadotcom corporation and Asia Pacific Online Limited.****** |
| | | |
| 6. | | Details of how EPS information is calculated can be found in Note 4(o) to our Consolidated Financial Statements. |
| | | |
| 8. | | List of principal subsidiaries of the Company. |
| | | |
| 12.1 | | Certification of Chief Executive Officer required by Rule 13a-14(a) |
| | | |
| 12.2 | | Certification of Chief Financial Officer required by Rule 13a-14(a) |
| | | |
| 13.(a).1 | | Certification of Chief Executive Officer pursuant to 18 U.S.C. Section 1350, as adopted pursuant to Section 906 of the Sarbanes-Oxley Act of 2002 |
| | | |
| 13.(a).2 | | Certification of Chief Financial Officer pursuant to 18 U.S.C. Section 1350, as adopted pursuant to Section 906 of the Sarbanes-Oxley Act of 2002 |
133
| * | | Incorporated by reference to our registration statement on Form S-8 (File No.: 333-12966) filed with the Commission on December 7, 2000. |
| |
| ** | | Incorporated by reference to our registration statement on Form S-8 (File No.: 333-12958) filed with the Commission on December 7, 2000. |
| |
| *** | | Incorporated by reference to our registration statement on Form F-3 (File No. 333-12674) filed with the Commission on October 3, 2000. |
| |
| **** | | Incorporated by reference to our annual report on Form 20-F (File No. 000-30134) filed with the Commission on May 10, 2001. |
| |
| ***** | | Incorporated by reference to our current report on Form 6-K (File No. 000-30134) filed with the Commission on February 28, 2002. |
| |
| ****** | | Incorporated by reference to our annual report of Form 20-F (File No. 000-30134) filed with the Commission on June 11, 2002. |
| |
| ******* | | Incorporated by reference to our current report on Form 6-K (File No. 000-30134) filed with the Commission on September 18, 2002. |
| |
| + | | Incorporated by reference to our annual report on Form 20-F (File No. 000-30134) filed with the Commission on June 16, 2003. |
| |
| ++ | | Incorporated by reference to our current report on Form 6-K (File No. 000-30134) filed with the Commission on June 16, 2003. |
| |
| +++ | | Incorporated by reference to our current report on Form 6-K (File No. 000-30134) filed with the Commission on September 5, 2003. |
| |
| ++++ | | Incorporated by reference to our current report on Form 6-K (File No. 000-30134) filed with the Commission on September 15, 2003. |
| |
| +++++ | | Incorporated by reference to our registration statement on Form F-4 (File No. 333-109493) filed with the Commission on October 6, 2003. |
| |
| ++++++ | | Incorporated by reference to Amendment No. 2 to our registration statement on Form F-4 (File No. 333-109493) filed with the Commission on January 21, 2004. |
| |
| +++++++ | | Incorporated by reference to Amendment No. 4 to our registration statement on Form F-4 (File No. 333-109493) filed with the Commission on May 7, 2004. |
| |
| y | | Incorporated by reference to our current report on Form 6-K (File No. 000-30134) filed with the Commission on December 11, 2003. |
| |
| yy | | Incorporated by reference to our current report on Form 6-K (File No000-30134) filed with the Commission on January 8, 2004. |
| |
| yyy | | Incorporated by reference to our registration statement on Form F-4/A (File No. 333-109493) filed with the Commission on January 21, 2004. |
134
SIGNATURES
The registrant hereby certifies that it meets all of the requirements for filing on Form 20-F and that it has duly caused and authorized the undersigned to sign this Annual Report on its behalf on this 7th day of May, 2004.
| | | |
| |  |
| | | |
| | /s/ Raymond K.F. Ch’ien |
| |
|
| | Raymond K.F. Ch’ien |
| | Executive Chairman |
| | | |
| | /s/ Peter Yip |
| |
|
| | Peter Yip |
| | Vice Chairman and Chief Executive Officer |
| | | |
| | /s/ Daniel Widdicombe |
| |
|
| | Daniel Widdicombe |
| | Chief Financial Officer |
135
INDEX TO FINANCIAL STATEMENTS
| | | | | |
| | | Page
|
| Report of the Independent Auditors | | | F-2 | |
| Consolidated Balance Sheets as of December 31, 2001 and 2002 | | | F-3 | |
| Consolidated Statements of Operations for each of the three years ended December 31, 2000, 2001 and 2002 | | | F-4 | |
| Consolidated Statements of Cash Flows for each of the three years ended December 31, 2000, 2001 and 2002 | | | F-6 | |
| Consolidated Statements of Changes in Shareholders’ Equity for each of the three years ended December 31, 2000, 2001 and 2002 | | | F-9 | |
| Notes to Consolidated Financial Statements | | | F-12 | |
REPORT OF THE INDEPENDENT AUDITORS
The Board of Directors and Shareholders
chinadotcom corporation
We have audited the accompanying consolidated balance sheets of chinadotcom corporation and subsidiaries as of December 31, 2002 and 2003, and the related consolidated statements of operations, cash flows and shareholders’ equity for each of the three years in the period ended December 31, 2003. These financial statements are the responsibility of the Company’s management. Our responsibility is to express an opinion on these financial statements based on our audits. We did not audit the financial statements of IMI Global Holdings Ireland Limited, a 51% owned subsidiary acquired in September 2003, which statements reflect total assets constituting 4.0% in 2003 and total revenues constituting 12.5% in 2003 of the related consolidated totals. Those statements were audited by other auditors whose report has been furnished to us, and our opinion, insofar as it relates to the amounts included for IMI Global Holdings Ireland Limited, is based solely on the report of the other auditors.
We conducted our audits in accordance with auditing standards generally accepted in the United States. Those standards require that we plan and perform the audit to obtain reasonable assurance about whether the financial statements are free of material misstatement. An audit includes examining, on a test basis, evidence supporting the amounts and disclosures in the financial statements. An audit also includes assessing the accounting principles used and significant estimates made by management, as well as evaluating the overall financial statement presentation. We believe that our audits and the report of the other auditors provide a reasonable basis for our opinion.
In our opinion, based on our audits and the report of the other auditors, the financial statements referred to above present fairly, in all material respects, the consolidated financial position of chinadotcom corporation and subsidiaries at December 31, 2002 and 2003, and the consolidated results of their operations and their cash flows for each of the three years in the period ended December 31, 2003, in conformity with accounting principles generally accepted in the United States.
As discussed in notes 2(c) and 4 to the consolidated financial statements, the Company changed its method of accounting for goodwill and other intangible assets in 2002 and variable interest entities in 2003.
Ernst & Young
Hong Kong
April 28, 2004
F-2
chinadotcom corporation
CONSOLIDATED BALANCE SHEETS
(Amounts in thousands of U.S. dollars, except number of shares and per share data)
| | | | | | | | | | | | | |
| | | | | | | December 31, | | December 31, |
| | | Notes | | 2002 | | 2003 |
| ASSETS | | | | | | | | | | | | |
| Current assets: | | | | | | | | | | | | |
| Cash and cash equivalents | | | | | | | 33,153 | | | | 55,508 | |
| Restricted cash | | | 5 | | | | 109 | | | | 238 | |
| Accounts receivable (net of allowance of USD4,139 for 2002 and USD2,816 for 2003) | | | 6 | | | | 15,030 | | | | 16,562 | |
| Deposits, prepayments and other receivables | | | | | | | 8,363 | | | | 10,461 | |
| Available-for-sale debt securities | | | 7 | | | | 300,056 | | | | 262,745 | |
| Restricted debt securities | | | 7 | | | | 139,255 | | | | 19,213 | |
| Deferred tax assets | | | | | | | — | | | | 240 | |
| | | | | | | |
| | | |
| |
| Total current assets | | | | | | | 495,966 | | | | 364,967 | |
| Loan receivables | | | 8 | | | | 5,325 | | | | 27,000 | |
| Property and equipment, net | | | 9 | | | | 9,375 | | | | 7,210 | |
| Goodwill | | | 10 | | | | 12,016 | | | | 81,427 | |
| Intangible assets | | | 11 | | | | 16,980 | | | | 28,880 | |
| Investments in equity investees | | | | | | | 330 | | | | 434 | |
| Investments under cost method | | | | | | | 387 | | | | 609 | |
| Available-for-sale debt securities | | | 7 | | | | 20,000 | | | | 19,400 | |
| Restricted debt securities | | | 7 | | | | 11,868 | | | | 11,896 | |
| Available-for-sale equity securities | | | 12 | | | | 2,050 | | | | 590 | |
| Deferred tax assets | | | | | | | — | | | | 305 | |
| Other assets | | | | | | | 6,660 | | | | 3,336 | |
| | | | | | | |
| | | |
| |
| Total assets | | | | | | | 580,957 | | | | 546,054 | |
| | | | | | | |
| | | |
| |
| LIABILITIES AND SHAREHOLDERS’ EQUITY | | | | | | | | | | | | |
| Current liabilities: | | | | | | | | | | | | |
| Accounts payable | | | | | | | 13,662 | | | | 7,800 | |
| Other payables | | | | | | | 12,952 | | | | 4,602 | |
| Purchase consideration payable | | | 2 | (c) | | | — | | | | 39,835 | |
| Accrued liabilities | | | | | | | 9,064 | | | | 16,896 | |
| Short-term bank loans | | | 13 | | | | 115,650 | | | | 15,199 | |
| Long-term bank loans, current portion | | | 14 | | | | 149 | | | | 171 | |
| Deferred revenue | | | | | | | 2,693 | | | | 9,357 | |
| Income tax payable | | | | | | | 636 | | | | 656 | |
| Amounts due to related parties | | | | | | | 684 | | | | — | |
| | | | | | | |
| | | |
| |
| Total current liabilities | | | | | | | 155,490 | | | | 94,516 | |
| Deferred tax liabilities | | | | | | | — | | | | 1,618 | |
| Long-term bank loans, net of current portion | | | 14 | | | | 11,585 | | | | 11,456 | |
| Accrued pension liability | | | | | | | — | | | | 2,272 | |
| Minority interests | | | | | | | 36,182 | | | | 45,746 | |
| Shareholders’ equity: | | | | | | | | | | | | |
| Class A common shares, USD0.00025 par value: | | | | | | | | | | | | |
| Authorized - 800,000,000 shares | | | | | | | | | | | | |
| Issued and outstanding - 101,588,009 shares as of December 31, 2003 and 101,296,363 shares as of December 31, 2002 | | | | | | | 25 | | | | 25 | |
| Preferred shares, USD0.001 par value: | | | | | | | | | | | | |
| Authorized - 5,000,000 shares | | | | | | | | | | | | |
| Issued and outstanding - Nil as of December 31, 2002 and 2003 | | | | | | | — | | | | — | |
| Additional paid-in capital | | | | | | | 610,340 | | | | 614,721 | |
| Treasury stock - 63,564 shares as of December 31, 2002 and 1,766,552 shares as of December 31, 2003 | | | | | | | (238 | ) | | | (4,067 | ) |
| Accumulated deficits | | | | | | | (234,417 | ) | | | (218,893 | ) |
| Accumulated other comprehensive income | | | 15 | | | | 1,990 | | | | (1,340 | ) |
| | | | | | | |
| | | |
| |
| Total shareholders’ equity | | | | | | | 377,700 | | | | 390,446 | |
| | | | | | | |
| | | |
| |
| Total liabilities and shareholders’ equity | | | | | | | 580,957 | | | | 546,054 | |
| | | | | | | |
| | | |
| |
The accompanying notes form an integral part of these consolidated financial statements.
F-3
chinadotcom corporation
CONSOLIDATED STATEMENTS OF OPERATIONS
(Amounts in thousands of U.S. dollars, except number of shares and per share data)
| | | | | | | | | | | | | | | | | |
| | | | | | | Year ended | | Year ended | | Year ended |
| | | | | | | December 31, | | December 31, | | December 31, |
| | | Notes | | 2001 | | 2002 | | 2003 |
| Revenues (a) | | | | | | | | | | | | | | | | |
| Software and consulting services | | | | | | | | | | | | | | | | |
| Sales of IT products | | | | | | | 743 | | | | 1,339 | | | | 8,000 | |
| Consulting services | | | | | | | 15,900 | | | | 14,166 | | | | 42,699 | |
| Mobile services and applications | | | | | | | — | | | | — | | | | 16,876 | |
| Advertising and marketing activities | | | | | | | 18,087 | | | | 26,682 | | | | 19,558 | |
| Other income | | | | | | | 4,507 | | | | 1,821 | | | | 2,299 | |
| | | | | | | |
| | | |
| | | |
| |
| | | | | | | | 39,237 | | | | 44,008 | | | | 89,432 | |
| Less: Cost of revenues | | | | | | | | | | | | | | | | |
| Software and consulting services | | | | | | | | | | | | | | | | |
| Sales of IT products | | | | | | | (472 | ) | | | (668 | ) | | | (6,123 | ) |
| Consulting services | | | | | | | (11,451 | ) | | | (6,255 | ) | | | (25,697 | ) |
| Mobile services and applications | | | | | | | — | | | | — | | | | (2,247 | ) |
| Advertising and marketing activities | | | | | | | (11,625 | ) | | | (19,999 | ) | | | (12,966 | ) |
| Other income | | | | | | | (1,892 | ) | | | (845 | ) | | | (1,084 | ) |
| | | | | | | |
| | | |
| | | |
| |
| Gross margin | | | | | | | 13,797 | | | | 16,241 | | | | 41,315 | |
| Selling, general and administrative expenses (b) | | | | | | | (73,297 | ) | | | (27,161 | ) | | | (34,325 | ) |
| Depreciation and amortization expenses | | | | | | | (19,180 | ) | | | (9,882 | ) | | | (7,182 | ) |
| Impairment of goodwill and intangible assets | | | | | | | (21,908 | ) | | | — | | | | — | |
| | | | | | | |
| | | |
| | | |
| |
| Operating loss | | | | | | | (100,588 | ) | | | (20,802 | ) | | | (192 | ) |
| Interest income | | | | | | | 26,689 | | | | 23,713 | | | | 13,440 | |
| Interest expense | | | | | | | (1,272 | ) | | | (2,463 | ) | | | (1,070 | ) |
| Loss arising from share issuance of a subsidiary | | | | | | | (55 | ) | | | — | | | | — | |
| Gain/(loss) on disposal of available-for-sale securities | | | | | | | 4,411 | | | | (163 | ) | | | 4,599 | |
| Gain/(loss) on disposal of subsidiaries and cost investments | | | | | | | (1,915 | ) | | | (66 | ) | | | 469 | |
| Other non-operating gains (c) | | | | | | | — | | | | 508 | | | | 961 | |
| Other non-operating losses | | | | | | | (922 | ) | | | (288 | ) | | | (153 | ) |
| Impairment of cost investments and available-for-sale securities | | | | | | | (12,260 | ) | | | (5,351 | ) | | | — | |
| Share of income/(losses) in equity investees | | | | | | | (2,592 | ) | | | 682 | | | | (115 | ) |
| | | | | | | |
| | | |
| | | |
| |
| Income/(loss) before income taxes | | | | | | | (88,504 | ) | | | (4,230 | ) | | | 17,939 | |
| Income tax benefits/(income taxes) | | | 18 | | | | (186 | ) | | | (113 | ) | | | 689 | |
| | | | | | | |
| | | |
| | | |
| |
| Income/(loss) before minority interests | | | | | | | (88,690 | ) | | | (4,343 | ) | | | 18,628 | |
| Minority interests in losses/(income) of consolidated subsidiaries | | | | | | | 3,162 | | | | 248 | | | | (2,204 | ) |
| | | | | | | |
| | | |
| | | |
| |
| Income/(loss) from continuing operations | | | | | | | (85,528 | ) | | | (4,095 | ) | | | 16,424 | |
| Discontinued operations: | | | 20 | | | | | | | | | | | | | |
| Loss from operations of discontinued subsidiaries, net of related tax expense of USD175 for 2001, USD47 for 2002 and USD1 for 2003 | | | | | | | (38,857 | ) | | | (14,681 | ) | | | (3,027 | ) |
| Gain on disposal/dissolution of discontinued subsidiaries, net | | | | | | | — | | | | 545 | | | | 2,127 | |
| | | | | | | |
| | | |
| | | |
| |
| Net income/(loss) | | | 19 | | | | (124,385 | ) | | | (18,231 | ) | | | 15,524 | |
| | | | | | | |
| | | |
| | | |
| |
| Basic earnings/(loss) per share | | | 19 | | | | (1.21 | ) | | | (0.18 | ) | | | 0.15 | |
| | | | | | | |
| | | |
| | | |
| |
| Diluted earnings/(loss) per share | | | 19 | | | | (1.21 | ) | | | (0.18 | ) | | | 0.15 | |
| | | | | | | |
| | | |
| | | |
| |
F-4
chinadotcom corporation
CONSOLIDATED STATEMENTS OF OPERATIONS
(Amounts in thousands of U.S. dollars, except number of shares and per share data)
| | | | | | | | | | | | | | | | | |
| | | | | | | Year ended | | Year ended | | Year ended |
| | | | | | | December 31, | | December 31, | | December 31, |
| | | | | Notes | | 2001 | | 2002 | | 2003 |
| (a) | | Software and consulting services revenue from related parties | | 17 | | | 60 | | | | — | | | | — | |
| | | | | | | |
| | | |
| | | |
| |
| (b) | | Selling, general and administrative expenses to related parties | | 17 | | | (10,106 | ) | | | (413 | ) | | | (257 | ) |
| | | | | | | |
| | | |
| | | |
| |
| (c) | | Non-operating gain from a related party | | 17 | | | — | | | | — | | | | 715 | |
| | | | | | | |
| | | |
| | | |
| |
The accompanying notes form an integral part of these consolidated financial statements.
F-5
chinadotcom corporation
CONSOLIDATED STATEMENTS OF CASH FLOWS
(Amounts in thousands of U.S. dollars, except number of shares and per share data)
| | | | | | | | | | | | | |
| | | Year ended | | Year ended | | Year ended |
| | | December 31, | | December 31, | | December 31, |
| | | 2001 | | 2002 | | 2003 |
| Cash flows from operating activities: | | | | | | | | | | | | |
| Net income/(loss) | | | (124,385 | ) | | | (18,231 | ) | | | 15,524 | |
| Adjustments to reconcile net income/(loss) to net cash provided by/(used in) operating activities: | | | | | | | | | | | | |
| Minority interests in income/(losses) of consolidated subsidiaries | | | (4,010 | ) | | | (1,036 | ) | | | 2,204 | |
| Loss on disposal/write-off of property and equipment | | | 3,066 | | | | 1,732 | | | | 127 | |
| Loss arising from share issuance of a subsidiary | | | 55 | | | | — | | | | — | |
| Loss/(gain) on disposal of available-for-sale securities | | | (4,411 | ) | | | 158 | | | | (4,599 | ) |
| Loss/(gain) on disposal of subsidiaries and cost investments | | | 2,055 | | | | (428 | ) | | | (2,596 | ) |
| Amortization of goodwill and intangible assets | | | 15,323 | | | | 1,183 | | | | 3,571 | |
| Depreciation | | | 12,739 | | | | 11,340 | | | | 5,293 | |
| Stock compensation expenses | | | 1,169 | | | | 309 | | | | 328 | |
| Share of losses/(income) in equity investees | | | 2,592 | | | | (682 | ) | | | 115 | |
| Impairment of cost investments and available-for-sale securities | | | 12,260 | | | | 5,351 | | | | — | |
| Impairment of goodwill and intangible assets | | | 40,698 | | | | — | | | | — | |
| Gain in value of derivative instruments | | | — | | | | (571 | ) | | | — | |
| Changes in operating assets and liabilities: | | | | | | | | | | | | |
| Accounts receivable | | | 10,427 | | | | 7,191 | | | | 9,486 | |
| Deposits, prepayments and other receivables | | | (8 | ) | | | 10,909 | | | | 3,144 | |
| Amounts due from related companies | | | 21,450 | | | | — | | | | — | |
| Other assets | | | 1,623 | | | | (252 | ) | | | 1,794 | |
| Accounts payable | | | (1,468 | ) | | | (1,107 | ) | | | (7,413 | ) |
| Other payables | | | (5,754 | ) | | | 4,824 | | | | (8,505 | ) |
| Accrued liabilities | | | 145 | | | | (3,968 | ) | | | (4,006 | ) |
| Deferred revenue | | | (2,307 | ) | | | (66 | ) | | | (557 | ) |
| Amounts due to related companies | | | 1,099 | | | | (730 | ) | | | (715 | ) |
| | | |
| | | |
| | | |
| |
| Net cash provided by/(used in) operating activities | | | (17,642 | ) | | | 15,926 | | | | 13,195 | |
| | | |
| | | |
| | | |
| |
F-6
chinadotcom corporation
CONSOLIDATED STATEMENTS OF CASH FLOWS (continued)
(Amounts in thousands of U.S. dollars, except number of shares and per share data)
| | | | | | | | | | | | | |
| | | Year ended | | Year ended | | Year ended |
| | | December 31, | | December 31, | | December 31, |
| | | 2001 | | 2002 | | 2003 |
| Cash flows from investing activities: | | | | | | | | | | | | |
| Acquisition of subsidiaries, net of cash acquired | | | (15,580 | ) | | | (4,587 | ) | | | (13,446 | ) |
| Acquisition of property and equipment | | | (8,250 | ) | | | (5,471 | ) | | | (1,551 | ) |
| Acquisition of cost investments | | | (398 | ) | | | — | | | | — | |
| Acquisition of available-for-sale securities | | | (1,932,249 | ) | | | (660,599 | ) | | | (424,667 | ) |
| Acquisition of intangible assets | | | (12,392 | ) | | | (8,800 | ) | | | (2,355 | ) |
| Advances of loans to equity investees | | | (179 | ) | | | — | | | | — | |
| Issuance of loans | | | — | | | | — | | | | (27,000 | ) |
| Purchase of promissory notes and warrants | | | — | | | | (7,000 | ) | | | — | |
| Collection of promissory notes and warrants | | | — | | | | — | | | | 6,878 | |
| Proceeds from disposal of available-for-sale securities | | | 1,843,943 | | | | 675,728 | | | | 580,607 | |
| Proceeds from disposal of property and equipment | | | 138 | | | | 1,386 | | | | 381 | |
| Proceeds/(cash disbursements) from share issuance by disposal of subsidiaries | | | 982 | | | | (652 | ) | | | (2,349 | ) |
| Proceeds from disposal of cost investments | | | 598 | | | | — | | | | 1,750 | |
| Decrease/(increase )in restricted cash | | | 2,860 | | | | 1,165 | | | | (129 | ) |
| | | |
| | | |
| | | |
| |
| Net cash provided by/(used in) investing activities | | | (120,527 | ) | | | (8,830 | ) | | | 118,119 | |
| | | |
| | | |
| | | |
| |
| Cash flows from financing activities: | | | | | | | | | | | | |
| Issuance of share capital | | | 279 | | | | 724 | | | | 8,585 | |
| Additional bank loans | | | 117,307 | | | | 125,278 | | | | 15,015 | |
| Repayment of bank loans | | | (2,737 | ) | | | (116,349 | ) | | | (121,388 | ) |
| Purchases of treasury stock | | | — | | | | (4,416 | ) | | | (11,171 | ) |
| Settlement of promissory notes in relation to acquisitions | | | (3,343 | ) | | | — | | | | — | |
| | | |
| | | |
| | | |
| |
| Net cash provided by/(used in) in financing activities | | | 111,506 | | | | 5,237 | | | | (108,959 | ) |
| | | |
| | | |
| | | |
| |
| Net increase/(decrease) in cash and cash equivalents | | | (26,663 | ) | | | 12,333 | | | | 22,355 | |
| Cash and cash equivalents at beginning of year | | | 47,483 | | | | 20,820 | | | | 33,153 | |
| | | |
| | | |
| | | |
| |
| Cash and cash equivalents at end of year | | | 20,820 | | | | 33,153 | | | | 55,508 | |
| | | |
| | | |
| | | |
| |
F-7
chinadotcom corporation
CONSOLIDATED STATEMENTS OF CASH FLOWS
(Amounts in thousands of U.S. dollars, except number of shares and per share data)
| | | | | | | | | | | | | |
| | | Year ended | | Year ended | | Year ended |
| | | December 31, | | December 31, | | December 31, |
| | | 2001 | | 2002 | | 2003 |
| Interest paid | | | 1,495 | | | | 2,632 | | | | 519 | |
| Non-cash activities: | | | | | | | | | | | | |
| Class A common shares issued for settlement of other payables | | | 4,467 | | | | — | | | | — | |
| Class A common shares issued for settlement of promissory notes | | | 3,033 | | | | — | | | | — | |
| Subsidiary’s ordinary shares issued for acquisition of a subsidiary | | | 1,410 | | | | — | | | | — | |
| Subsidiary’s ordinary shares issued for purchases of assets | | | 221 | | | | — | | | | — | |
| Repurchase of Class A common shares from disposal of an equity investee | | | 53 | | | | — | | | | — | |
| Reissuance of treasury stock for the acquisition of subsidiaries | | | — | | | | — | | | | 2,810 | |
| Reissuance of treasury stock for settlement of employee stock ownership plan obligations | | | — | | | | 24 | | | | — | |
| Purchase consideration on the acquisition of a subsidiary | | | — | | | | — | | | | 39,835 | |
The accompanying notes form an integral part of these consolidated financial statements.
F-8
chinadotcom corporation
CONSOLIDATED STATEMENTS OF SHAREHOLDERS’ EQUITY
(Amounts in thousands)
| | | | | | | | | | | | | | | | | | | | | | | | | | | | | | | | | |
| | | | | | | | | | | | | | | | | | | | | | | Accumulated | | | | Total |
| | | | | | | | | | | Additional | | | | | | | | other | | | | shareholders’ |
| | | Number | | Common | | paid-in | | Treasury | | Comprehensive | | comprehensive | | Accumulated | | equity/ |
| | | of | | shares | | capital | | stock | | loss | | income/(loss) | | deficits | | (deficit) |
| | | shares | | USD | | USD | | USD | | USD | | USD | | USD | | USD |
| Balance at January 1, 2001 | | | 101,828 | | | | 25 | | | | 604,566 | | | | — | | | | | | | | (766 | ) | | | (91,801 | ) | | | 512,024 | |
| Exercise of employee stock options | | | 92 | | | | — | | | | 279 | | | | — | | | | — | | | | — | | | | — | | | | 279 | |
| Issuance of shares for non-cash transactions | | | 795 | | | | 1 | | | | 7,499 | | | | — | | | | — | | | | — | | | | — | | | | 7,500 | |
| Redemption and retirement of shares for non-cash transactions | | | (23 | ) | | | — | | | | (53 | ) | | | — | | | | — | | | | — | | | | — | | | | (53 | ) |
| Stock compensation expenses on options granted | | | — | | | | — | | | | 1,169 | | | | — | | | | — | | | | — | | | | — | | | | 1,169 | |
| Unrealized losses, net of unrealized gains, on available-for-sale securities | | | — | | | | — | | | | — | | | | — | | | | (9,956 | ) | | | (9,956 | ) | | | — | | | | (9,956 | ) |
| Other-than-temporary impairment of available-for-sale securities | | | — | | | | — | | | | — | | | | — | | | | 4,216 | | | | 4,216 | | | | — | | | | 4,216 | |
| Minority interests’ share of unrealized losses, net of unrealized gains on available-for-sale securities | | | — | | | | — | | | | — | | | | — | | | | 337 | | | | 337 | | | | — | | | | 337 | |
| Foreign currency translation adjustments | | | — | | | | — | | | | — | | | | — | | | | (1,199 | ) | | | (1,199 | ) | | | — | | | | (1,199 | ) |
| Less: reclassification adjustment for gains, net of losses included in net loss | | | — | | | | — | | | | — | | | | — | | | | (71 | ) | | | (71 | ) | | | — | | | | (71 | ) |
| Net loss for the year | | | — | | | | — | | | | — | | | | — | | | | (124,385 | ) | | | — | | | | (124,385 | ) | | | (124,385 | ) |
| | | | | | | | | | | | | | | | | | | |
| | | | | | | | | | | | | |
| Comprehensive income | | | | | | | | | | | | | | | | | | | (131,058 | ) | | | | | | | | | | | | |
| | | |
| | | |
| | | |
| | | |
| | | |
| | | |
| | | |
| | | |
| |
| Balance at December 31, 2001 | | | 102,692 | | | | 26 | | | | 613,460 | | | | — | | | | | | | | (7,439 | ) | | | (216,186 | ) | | | 389,861 | |
| | | |
| | | |
| | | |
| | | |
| | | | | | | |
| | | |
| | | |
| |
The accompanying notes form an integral part of these consolidated financial statements.
F-9
chinadotcom corporation
CONSOLIDATED STATEMENTS OF SHAREHOLDERS’ EQUITY
(Amounts in thousands)
| | | | | | | | | | | | | | | | | | | | | | | | | | | | | | | | | |
| | | | | | | | | | | | | | | | | | | | | | | Accumulated | | | | Total |
| | | | | | | | | | | Additional | | | | | | | | | | other | | | | shareholders’ |
| | | Number | | Common | | paid-in | | Treasury | | Comprehensive | | comprehensive | | Accumulated | | equity/ |
| | | of | | shares | | capital | | stock | | loss | | income/(loss) | | deficits | | (deficit) |
| | | shares | | USD | | USD | | USD | | USD | | USD | | USD | | USD |
| Balance at January 1, 2002 | | | 102,692 | | | | 26 | | | | 613,460 | | | | — | | | | | | | | (7,439 | ) | | | (216,186 | ) | | | 389,861 | |
| Exercise of employee stock options | | | 296 | | | | — | | | | 724 | | | | — | | | | — | | | | — | | | | — | | | | 724 | |
| Redemption of shares | | | — | | | | — | | | | — | | | | (4,416 | ) | | | — | | | | — | | | | — | | | | (4,416 | ) |
| Retirement of shares | | | (1,692 | ) | | | (1 | ) | | | (4,153 | ) | | | 4,154 | | | | — | | | | — | | | | — | | | | — | |
| Reissuance of treasury stock for non-cash transactions | | | — | | | | — | | | | — | | | | 24 | | | | — | | | | — | | | | — | | | | 24 | |
| Stock compensation expenses on options granted | | | — | | | | — | | | | 309 | | | | — | | | | — | | | | — | | | | — | | | | 309 | |
| Unrealized losses, net of unrealized gains on available-for- sale securities | | | — | | | | — | | | | — | | | | — | | | | (1,276 | ) | | | (1,276 | ) | | | — | | | | (1,276 | ) |
| Other-than-temporary impairment of available-for-sale securities | | | — | | | | — | | | | — | | | | — | | | | 5,125 | | | | 5,125 | | | | — | | | | 5,125 | |
| Minority interests’ share of unrealized gains, net of unrealized losses on available-for-sale securities | | | — | | | | — | | | | — | | | | — | | | | (484 | ) | | | (484 | ) | | | — | | | | (484 | ) |
| Foreign currency translation adjustments | | | — | | | | — | | | | — | | | | — | | | | 661 | | | | 661 | | | | — | | | | 661 | |
| Less: reclassification adjustment for losses, net of gains included in net loss | | | — | | | | — | | | | — | | | | — | | | | 5,403 | | | | 5,403 | | | | — | | | | 5,403 | |
| Net loss for the year | | | — | | | | — | | | | — | | | | — | | | | (18,231 | ) | | | — | | | | (18,231 | ) | | | (18,231 | ) |
| | | | | | | | | | | | | | | | | | | |
| | | | | | | | | | | | | |
| Comprehensive income | | | | | | | | | | | | | | | | | | | (8,802 | ) | | | | | | | | | | | | |
| | | |
| | | |
| | | |
| | | |
| | | |
| | | |
| | | |
| | | |
| |
| Balance at December 31, 2002 | | | 101,296 | | | | 25 | | | | 610,340 | | | | (238 | ) | | | | | | | 1,990 | | | | (234,417 | ) | | | 377,700 | |
| | | |
| | | |
| | | |
| | | |
| | | | | | | |
| | | |
| | | |
| |
The accompanying notes form an integral part of these consolidated financial statements.
F-10
chinadotcom corporation
CONSOLIDATED STATEMENTS OF SHAREHOLDERS’ EQUITY
(Amounts in thousands)
| | | | | | | | | | | | | | | | | | | | | | | | | | | | | | | | | |
| | | | | | | | | | | | | | | | | | | | | | | Accumulated | | | | Total |
| | | | | | | | | | | Additional | | | | | | | | | | other | | | | shareholders’ |
| | | Number | | Common | | paid-in | | Treasury | | Comprehensive | | comprehensive | | Accumulated | | equity/ |
| | | of | | shares | | capital | | stock | | loss | | income/(loss) | | deficits | | (deficit) |
| | | shares | | USD | | USD | | USD | | USD | | USD | | USD | | USD |
| Balance at January 1, 2003 | | | 101,296 | | | | 25 | | | | 610,340 | | | | (238 | ) | | | | | | | 1,990 | | | | (234,417 | ) | | | 377,700 | |
| Exercise of employee stock options | | | 2,592 | | | | 1 | | | | 8,584 | | | | — | | | | — | | | | — | | | | — | | | | 8,585 | |
| Redemption of shares | | | — | | | | — | | | | — | | | | (11,171 | ) | | | — | | | | — | | | | — | | | | (11,171 | ) |
| Retirement of shares | | | (2,300 | ) | | | (1 | ) | | | (5,749 | ) | | | 5,750 | | | | — | | | | — | | | | — | | | | — | |
| Reissuance of treasury stock for non-cash transactions | | | — | | | | — | | | | 1,218 | | | | 1,592 | | | | — | | | | — | | | | — | | | | 2,810 | |
| Stock compensation expenses on options granted | | | — | | | | — | | | | 328 | | | | — | | | | — | | | | — | | | | — | | | | 328 | |
| Unrealized gains, net of unrealized losses on available-for- sale securities | | | — | | | | — | | | | — | | | | — | | | | 644 | | | | 644 | | | | — | | | | 644 | |
| Minority interests’ share of unrealized losses, net of unrealized gains on available-for-sale securities | | | — | | | | — | | | | — | | | | — | | | | 184 | | | | 184 | | | | — | | | | 184 | |
| Foreign currency translation adjustments | | | — | | | | — | | | | — | | | | — | | | | 186 | | | | 186 | | | | — | | | | 186 | |
| Less: reclassification adjustment for gains, net of losses included in net income | | | — | | | | — | | | | — | | | | — | | | | (4,344 | ) | | | (4,344 | ) | | | — | | | | (4,344 | ) |
| Net income for the year | | | — | | | | — | | | | — | | | | — | | | | 15,524 | | | | — | | | | 15,524 | | | | 15,524 | |
| | | | | | | | | | | | | | | | | | | |
| | | | | | | | | | | | | |
| Comprehensive income | | | | | | | | | | | | | | | | | | | 12,194 | | | | | | | | | | | | | |
| | | |
| | | |
| | | |
| | | |
| | | |
| | | |
| | | |
| | | |
| |
| Balance at December 31, 2003 | | | 101,588 | | | | 25 | | | | 614,721 | | | | (4,067 | ) | | | | | | | (1,340 | ) | | | (218,893 | ) | | | 390,446 | |
| | | |
| | | |
| | | |
| | | |
| | | | | | | |
| | | |
| | | |
| |
The accompanying notes form an integral part of these consolidated financial statements.
F-11
chinadotcom corporation
NOTES TO CONSOLIDATED FINANCIAL STATEMENTS
(Amounts in thousands, except number of shares, number of options and per share data)
| 1. | | ORGANIZATION AND BASIS OF PRESENTATION |
chinadotcom corporation (“chinadotcom” or the “Company”) is a leading provider of enterprise software and solutions, value-added mobile services and applications and marketing and advertising services. The Company offers the following services to companies throughout Greater China and Asia, North America, the United Kingdom and the rest of Europe:
| | - | | software products and services, including the implementation and development of packaged software for use in enterprise resource planning targeting mid-market manufacturers; |
| |
| | - | | value-added mobile services and applications, including offering SMS to mobile subscribers in China and providing mobile development and technology services in Korea for leading telecom network operators, mobile handset manufacturers and mobile application and content providers; |
| |
| | - | | technology services and outsourcing, including offering economical, high-quality software development services to the Company’s enterprise software customers by utilizing programmers located principally in China and India; and |
| |
| | - | | marketing and advertising services, including developing targeted advertising campaigns by utilizing information gathered from the Company’s proprietary databases. |
The Company was incorporated under the laws of the Cayman Islands in June 1997 as a wholly-owned subsidiary of China Internet Corporation Limited (“CIC”), a company incorporated under the laws of Bermuda.
In March 2000, hongkong.com Corporation (“hongkong.com”), a then wholly-owned e-business solutions and advertising services provider, was listed on the Growth Enterprise Market of The Stock Exchange of Hong Kong Limited and 736,000,000 shares of hongkong.com were issued at a price of USD0.24 per share for net proceeds of USD168,462. As a result, the Company’s shareholding in hongkong.com was diluted to 84%. Currently, the Company’s ownership interest is 81.3%. No deferred tax has been provided for the gain as the future disposal of shares in hongkong.com by the Company will not be taxable in any jurisdiction.
On December 12, 2003, the Company announced that it would reorganize its mobile and portal unit as a wholly-owned subsidiary, chinadotcom Mobile Interactive Corporation, “CDC Mobile”), and register an offering of CDC Mobile’s American Depositary Shares under the Securities Act of 1933, as amended. The purpose of the intended offering is to fund the operations of CDC Mobile following its reorganization as an independent company holding the Company’s assets and businesses that provide mobile services and applications, advertising and interactive media and Internet services. As a selling shareholder, the Company may also receive proceeds from the intended offering. While the offering is expected to commence in the first half of 2004, subject to the completion of all applicable regulatory review, there is no assurance that it will be successfully completed. The Company anticipates that Newpalm will be included within CDC Mobile.
The consolidated financial statements were prepared in accordance with accounting principles generally accepted in the United States.
F-12
chinadotcom corporation
NOTES TO CONSOLIDATED FINANCIAL STATEMENTS
(Amounts in thousands, except number of shares, number of options and per share data)
(a) OpusOne Technologies International Inc. (“OpusOne”)
On February 28, 2002, the Company acquired a 51% equity interest in OpusOne, through the purchase of outstanding and newly issued common shares of OpusOne. The results of OpusOne’s operations have been included in the consolidated financial statements since the date of acquisition. OpusOne is a developer of business software solutions in the People’s Republic of China (the “PRC”). As a result of the acquisition, OpusOne is expected to complement and serve to further expand the Company’s portfolio of proprietary software solutions in the PRC market and the Company is expected to reduce costs and improve operational profitability through economies of scale.
The total initial purchase price was USD8,950 cash for 368,100 issued and outstanding and 300,000 newly issued common shares of OpusOne. The Company paid USD4,488 cash on the date of acquisition. The remaining purchase price will be paid in three yearly installments subsequent to December 31, 2002 and will be adjusted based on the audited financial statements of OpusOne for each of the fiscal years ended December 31, 2003, 2004 and 2005.
The following table summarizes the estimated fair values of the assets acquired and liabilities assumed at the date of acquisition.
| | | | | |
| | | USD |
| Current assets | | | 1,850 | |
| Property and equipment, net | | | 297 | |
| Goodwill | | | 4,764 | |
| Intangible assets* | | | 720 | |
| Other assets | | | 821 | |
| | | |
| |
| Total assets acquired | | | 8,452 | |
| | | |
| |
| Current liabilities | | | (3,532 | ) |
| Long-term debt | | | (432 | ) |
| | | |
| |
| Total liabilities assumed | | | (3,964 | ) |
| | | |
| |
| Net assets acquired | | | 4,488 | |
| | | |
| |
* The estimated weighted average useful life of the identifiable intangible assets acquired is 3 years.
During the year ended December 31, 2003, the Company acquired the remaining 49% equity interest in OpusOne through the issuance of 519,032 common shares of the Company to OpusOne’s minority shareholders.
Goodwill of USD6,794 in aggregate in respect of the two stages of the acquisition was assigned to the software and consulting services segment and such goodwill is not deductible for tax purposes.
F-13
chinadotcom corporation
NOTES TO CONSOLIDATED FINANCIAL STATEMENTS
(Amounts in thousands, except number of shares, number of options and per share data)
| 2. | | BUSINESS COMBINATIONS (continued) |
(b) Praxa Limited (“Praxa”)
On February 12, 2003, the Company acquired a 100% equity interest in Praxa, through the acquisition of the entire issued share capital of Praxa. The results of Praxa’s operations have been included in the consolidated financial statements since the date of acquisition. Praxa’s core business is the provision of information technology products and services in the form of outsourcing, application development and support, and systems integration in Australia and Asia. As a result of the acquisition, the Company is expected to increase the number of clients for its low-cost China-based outsourcing platform and to extend the distribution network of the Company’s own software products to Australia.
The purchase price was approximately USD3,567 cash for 6,304,478 common shares of Praxa.
The following table summarizes the estimated fair values of the assets acquired and liabilities assumed at the date of acquisition.
| | | | | |
| | | USD |
| Current assets | | | 4,552 | |
| Property and equipment, net | | | 1,061 | |
| Goodwill | | | 3,589 | |
| Intangible assets* | | | 1,996 | |
| Other assets | | | 193 | |
| | | |
| |
| Total assets acquired | | | 11,391 | |
| | | |
| |
| Current liabilities | | | (7,292 | ) |
| Deferred tax liabilities | | | (532 | ) |
| | | |
| |
| Total liabilities assumed | | | (7,824 | ) |
| | | |
| |
| Net assets acquired | | | 3,567 | |
| | | |
| |
* The estimated weighted average useful life of the identifiable intangible assets acquired is 4.5 years.
The goodwill of USD3,589 was assigned to the software and consulting services segment and such goodwill is not deductible for tax purposes.
F-14
chinadotcom corporation
NOTES TO CONSOLIDATED FINANCIAL STATEMENTS
(Amounts in thousands, except number of shares, number of options and per share data)
| 2. | | BUSINESS COMBINATIONS (continued) |
(c) Palmweb Inc. (“Palmweb”)
In April 2003, hongkong.com acquired a 100% equity interest in Palmweb, through the acquisition of the entire issued share capital of Palmweb. The results of operations of Palmweb and its subsidiary and variable interest entities (collectively the “Palmweb Group”) have been included in the consolidated financial statements since the date of acquisition. Palmweb is primarily engaged in the provision of mobile services and applications in the mainland of the PRC (“Mainland China”). As a result of the acquisition, the Company can participate in the provision of value-added mobile services in Mainland China. Pursuant to the corresponding share purchase agreement (the “Agreement”), the total purchase consideration, including certain amount to be paid to certain employees of Palmweb as further detailed below, has been agreed as follows:
| | - | | an initial cash consideration of USD14,000; and |
| |
| | - | | an earnout cash consideration, which is equal to the aggregate of (i) an amount equal to the audited net income of the Palmweb Group for the year ended December 31, 2003 multiplied by 3.56918 and (ii) an amount equal to the audited net income of the Palmweb Group for the year ended December 31, 2004 multiplied by 1.13982 (the “Contingent Consideration”). |
The initial cash consideration of USD14,000 was paid in April 2003. The total purchase consideration is subject to a maximum of USD55,000.
The following table summarizes the estimated fair values of the assets acquired and liabilities assumed at the date of acquisition.
| | | | | |
| | | USD |
| Current assets | | | 7,058 | |
| Property and equipment, net | | | 402 | |
| Goodwill* | | | 7,869 | |
| Intangible assets** | | | 2,822 | |
| Other assets | | | 66 | |
| | | |
| |
| Total assets acquired | | | 18,217 | |
| | | |
| |
| Current liabilities | | | (3,286 | ) |
| Deferred tax liabilities | | | (931 | ) |
| | | |
| |
| Total liabilities assumed | | | (4,217 | ) |
| | | |
| |
| Net assets acquired | | | 14,000 | |
| | | |
| |
| | *Based on the initial consideration payable at the date of acquisition, which was subsequently adjusted to USD47,704 upon the finalization of the Contingent Consideration as further detailed below. |
| |
| | **The estimated weighted average useful live of the identifiable intangible assets acquired is 2.67 years. |
F-15
chinadotcom corporation
NOTES TO CONSOLIDATED FINANCIAL STATEMENTS
(Amounts in thousands, except number of shares, number of options and per share data)
| 2. | | BUSINESS COMBINATIONS (continued) |
(c) Palmweb Inc. (“Palmweb”) (continued)
Based on the audited net income of the Palmweb Group for the year ended December 31, 2003 and in accordance with the Agreement, the Contingent Consideration, which is limited to the maximum consideration less the amount already paid, was finalized at USD41,000 and was paid in February 2004. That part of the Contingent Consideration that was directly related to the acquisition of Palmweb, equal to USD39,835, has been accounted for as an adjustment of the purchase price of Palmweb. That part of the Contingent Consideration that was paid to certain employees of Palmweb, who were the former holders of the share options of Palmweb and who are subject to certain continuing employment requirements, equal to USD1,165 has been accounted for as compensation for services.
The total goodwill of USD47,704 in relation to the acquisition of Palmweb was assigned to the mobile services and applications segment and such goodwill is not deductible for tax purposes.
The business in which the Palmweb Group operates is subject to foreign ownership restrictions in the PRC. To comply with the PRC laws and regulations that prohibit or restrict foreign ownership of telecommunications and other information services within the PRC, Palmweb arranged for the establishment of two entities (the “PRC Entities”). The legal owners of the PRC Entities are two PRC citizens who are also employees of the Company (the “Nominees”). In order to control the PRC Entities, the Company entered into certain cooperation, trust and other arrangements with relevant parties, including the PRC Entities and the Nominees.
Based on the contractual arrangements mentioned above, the Company believes that the PRC Entities are considered as Variable Interest Entities under the revised Financial Accounting Standards Board (“FASB”) Interpretation No. 46 (“FIN 46”),Consolidation of Variable Interest Entities, an Interpretation of ARB No. 51,because the equity investors in the PRC Entities do not have the characteristics of a controlling financial interest and the Company is the primary beneficiary of the PRC Entities. Accordingly, the PRC Entities have been consolidated by the Company in accordance with FIN 46.
F-16
chinadotcom corporation
NOTES TO CONSOLIDATED FINANCIAL STATEMENTS
(Amounts in thousands, except number of shares, number of options and per share data)
| 2. | | BUSINESS COMBINATIONS (continued) |
(d) IMI Global Holdings Ireland Limited (“IMI”)
On September 9, 2003, CDC Software, a wholly-owned subsidiary and a software unit of the Company, acquired a 51% equity interest in Cayman First Tier, an investment holding company organized in the Cayman Islands which owns 100% of IMI, a leading provider of supply chain management solutions in North America and Europe. Supply chain management software is considered by the Company as an important component of a broad enterprise resource planning product and service offering, and forms part of the Company’s strategic software initiative. The remaining 49% equity interest is held by Symphony Technology Group (“Symphony”), a Palo Alto, California-based private equity firm focused on enterprise software and services, which previously owned 100% of IMI. Symphony has an option to sell to the Company all of its 49% interest in IMI at any time during the twelve months following the occurrence of unpermitted changes in the composition of IMI’s executive committee being overruled by the IMI board, or modifications to the rights, powers or responsibilities of IMI’s executive committee without the approval of the directors appointed by Symphony. The purchase price for Symphony’s interest in IMI is based on the financial performance of IMI, and is set at a fixed multiple of IMI’s annual revenues. In consideration for the 51% interest, CDC Software has agreed to invest USD25,000 into Cayman First Tier, and has also agreed to finance loan facilities for Cayman First Tier and Symphony Enterprise Solutions, S.ar.L., a wholly-owned subsidiary of Cayman First Tier of up to an aggregate of USD25,000. All the funds provided to Cayman First Tier are intended to be used primarily for further expansion in the supply chain management software sector via acquisitions, strategic investments and organic growth.
The following table summarizes the estimated fair values of the assets acquired and liabilities assumed at the date of acquisition.
| | | | | |
| | | USD |
| Current assets | | | 36,363 | |
| Property and equipment, net | | | 1,689 | |
| Goodwill | | | 15,802 | |
| Intangible assets* | | | 5,063 | |
| Other assets | | | 2,184 | |
| | | |
| |
| Total assets acquired | | | 61,101 | |
| | | |
| |
| Current liabilities | | | (26,178 | ) |
| Minority interests | | | (9,923 | ) |
| | | |
| |
| Total liabilities assumed | | | (36,101 | ) |
| | | |
| |
| Net assets acquired | | | 25,000 | |
| | | |
| |
* The estimated weighted average useful life of the identifiable intangible assets acquired is 7 years.
The goodwill of USD15,802 was assigned to the software and consulting services segment and such goodwill is not deductible for tax purposes.
F-17
chinadotcom corporation
NOTES TO CONSOLIDATED FINANCIAL STATEMENTS
(Amounts in thousands, except number of shares, number of options and per share data)
| 2. | | BUSINESS COMBINATIONS (continued) |
(e) Unaudited pro forma consolidated financial information
The following unaudited pro forma consolidated financial information reflects the results of the operations of the Company for the years ended December 31, 2001, 2002 and 2003, as if the acquisition of OpusOne had occurred on January 1, 2001 and the acquisitions of Praxa, Palmweb and IMI had occurred on January 1, 2002. These pro forma results have been prepared for comparative purposes only and do not purport to be indicative of what operating results would have been had the acquisitions of subsidiaries actually taken place on January 1, 2001 and 2002, respectively, and may not be indicative of future operating results.
| | | | | | | | | | | | | |
| | | Year ended | | Year ended | | Year ended |
| | | December 31, | | December 31, | | December 31, |
| | | 2001 | | 2002 | | 2003 |
| | | USD | | USD | | USD |
| | | (unaudited) | | (unaudited) | | (unaudited) |
| Revenue | | | 46,913 | | | | 45,503 | | | | 94,334 | |
| Net income/(loss) | | | (129,217 | ) | | | (18,045 | ) | | | 16,261 | |
| Basic and diluted earnings/(loss) per share | | | (1.26 | ) | | | (0.18 | ) | | | 0.16 | |
| | | |
| | | |
| | | |
| |
The difference in the pro forma and audited net income/(loss) for the years ended December 31, 2001, 2002 and 2003 is primarily due to the inclusion of the results of operations of those acquired subsidiaries from the beginning of the respective years of acquisition to the date of acquisition and for the immediately preceding comparable year as though the corresponding business combinations had been completed at the beginning of that year, net of the additional amortization of corresponding purchased amortizable intangible assets for the years ended December 31, 2001, 2002 and 2003.
| 3. | | CHANGES IN THE PRESENTATION OF COMPARATIVE FINANCIAL STATEMENTS |
Subsequent to the year ended December 31, 2002, the Company’s operating segments have been changed from e-business solutions, advertising, the sale of IT products and other income, to software and consulting services, mobile services and applications, advertising and marketing activities, and other income. The Company believes that this new segmental classification is more representative of the Company’s business strategies and reflects the Company’s current internal reporting practices.
Due to the change of operating segments and the discontinued operations of certain components, certain comparative amounts have been reclassified to conform with the current year’s presentation.
F-18
chinadotcom corporation
NOTES TO CONSOLIDATED FINANCIAL STATEMENTS
(Amounts in thousands, except number of shares, number of options and per share data)
| 4. | | SUMMARY OF SIGNIFICANT ACCOUNTING POLICIES |
(a) Principles of consolidation
The accompanying consolidated financial statements include the accounts of the Company and its majority-owned subsidiaries that are not considered variable interest entities and all variable interest entities for which the Company is the primary beneficiary, after eliminations of all material inter-company accounts, transactions and profits.
(b) Use of estimates
The preparation of the consolidated financial statements in conformity with accounting principles generally accepted in the United States requires management to make estimates and assumptions that affect the amounts reported in the financial statements and accompanying notes. Actual results could differ from those estimates.
(c) Cash and cash equivalents
The Company considers all highly liquid investments with a maturity of three months or less when purchased to be cash equivalents. Except for the restricted cash disclosed in note 5, none of the Company’s cash and cash equivalents is restricted as to withdrawal or use.
(d) Property and equipment and depreciation
Buildings, leasehold improvements, furniture and fixtures, office equipment, computer equipment and motor vehicles are stated at cost less accumulated depreciation. Maintenance, repairs and minor renewals are expensed as incurred. Depreciation of buildings, leasehold improvements, furniture and fixtures, office equipment, computer equipment and motor vehicles is computed using the straight-line method over the assets’ estimated useful life. No depreciation is provided on freehold land, which is stated at cost. The principal annual rates used are as follows:
| | | |
| Buildings | | 4% |
| Leasehold improvements | | Over the lesser of the lease term and the estimated useful life |
| Furniture and fixtures | | 10% to 100% |
| Office equipment | | 20% to 33 1/3% |
| Computer equipment | | 33 1/3% to 100% |
| Motor vehicles | | 33 1/3% |
F-19
chinadotcom corporation
NOTES TO CONSOLIDATED FINANCIAL STATEMENTS
(Amounts in thousands, except number of shares, number of options and per share data)
| 4. | | SUMMARY OF SIGNIFICANT ACCOUNTING POLICIES (continued) |
(e) Goodwill and intangible assets
Goodwill represents the excess of cost over the fair value of net tangible and identifiable intangible assets of acquired businesses. Effective January 1, 2002, the Company adopted Statement of Financial Accounting Standards (“SFAS”) 142,Goodwill and Other Intangible Assets. In accordance with SFAS 142, the Company ceased amortizing goodwill and performed a transitional test of its goodwill as of January 1, 2002. SFAS 142 requires that goodwill be tested for impairment at the reporting unit level (operating segment or one level below an operating segment) on an annual basis and between annual tests in certain circumstances. The performance of the test involves a two-step process. The first step of the impairment test involves comparing the fair value of the Company’s reporting units with the reporting unit’s carrying amount, including goodwill. Fair value is primarily determined by computing the future discounted cash flows expected to be generated by the reporting unit. If the carrying value exceeds the fair value, goodwill may be impaired. If this occurs, the Company performs the second step of the goodwill impairment test to determine the amount of impairment loss. The fair value of the reporting unit is allocated to its assets and liabilities in a manner similar to a purchase price allocation in order to determine the implied fair value of the reporting unit goodwill. This implied fair value is then compared with the carrying amount of the reporting unit goodwill, and if it is less, the Company would then recognize an impairment loss. Prior to January 1, 2002, goodwill was amortized to expense on a straight-line basis over a period of two to five years. The carrying value of goodwill was reviewed for possible impairment whenever events or changes in circumstances indicated that an impairment might exist. The transitional impairment test performed in June 2002, indicated that the fair value of the Company’s reporting units exceeded the reporting units’ carrying amount including goodwill, and accordingly, goodwill was not impaired. In December 2002 and 2003, annual impairment tests were performed and the fair value of the Company’s reporting units exceeded the reporting units’ carrying amount including goodwill. As such, the Company concluded that goodwill was not impaired.
Intangible assets represent trademarks, service marks and uniform resource locators (“URLs”); software applications and programs; customer base and contracts; and business licenses and partnership agreements. Intangible assets are carried at cost less accumulated amortization. Amortization is computed using the straight-line method over the estimated useful lives of the respective assets. The estimated useful lives of the intangible assets are as follows:
| | | |
| Trademarks, service marks and URLs | | 20 years |
| Software applications and programs | | 2 to 15 years |
| Customer base and contracts | | 1.5 to 10 years |
| Business licenses and partnership agreements | | 6 to 7 years |
Annually, the Company reviews and adjusts the carrying value of purchased intangible assets if the facts and circumstances suggest purchased intangible assets may be impaired. If this review indicates that purchased intangible assets may not be recoverable, as determined based on the undiscounted cash flows of the entity acquired over the remaining amortization period, the carrying value of intangible assets will be reduced by the estimated shortfall in discounted cash flows.
F-20
chinadotcom corporation
NOTES TO CONSOLIDATED FINANCIAL STATEMENTS
(Amounts in thousands, except number of shares, number of options and per share data)
| 4. | | SUMMARY OF SIGNIFICANT ACCOUNTING POLICIES (continued) |
(f) Investments
Debt and equity investments which represent available-for-sale securities are stated at fair value. Unrealized holding gain or loss, net of tax, on available-for-sale securities is reported in other comprehensive income/(loss) and is included in a separate component of the shareholders’ equity. Realized gains and losses and any decline in fair value judged to be other-than-temporary on available-for-sale securities are included in gain/(loss) on disposal of available-for-sale securities and impairment of available-for-sale securities, respectively. The cost of securities sold is based on the first-in, first-out method. Interest on securities classified as available-for-sale securities are included in interest income.
All other investments, for which the Company does not have the ability to exercise significant influence and there is not a readily determinable fair value, are accounted for under the cost method of accounting. Dividends and other distributions of earnings from investees, if any, are included in income when declared. The Company periodically evaluates the carrying value of its investments accounted for under the cost method of accounting and any decline in value is included in impairment of cost investments.
When determining whether an impairment of investments exists or a decline in value of an available-for-sale security is other-than-temporary, the Company evaluates evidence to support a realizable value in excess of the current market price for securities with fair value. Such information may include the investment’s financial performance (including such factors as earnings trends, dividend payments, asset quality and specific events), the near term prospects of the investment, the financial condition and prospects of the investment’s region and industry, and the Company’s investment intent. Typically, a sustained decline in the market value of a quoted security for six months is generally indicative of an other-than-temporary impairment.
(g) Investments in equity investees
The Company’s investments in equity investees for which its ownership exceeds 20%, but which are not majority-owned, are accounted for using the equity method. Under the equity method, the Company’s proportionate share of each equity investee’s net income or loss and amortization of the Company’s net excess investment over its equity in each equity investee’s net assets is included in “share of income/(losses) in equity investees”. Amortization is recorded on a straight-line basis over the estimated useful life of three years.
(h) Foreign currency translation
Foreign currency transactions are translated at the applicable rates of exchange ruling at the transaction dates. Monetary assets and liabilities denominated in foreign currencies at the balance sheet date are translated at the applicable rates of exchange ruling at that date. Exchange differences are dealt with in the statement of operations.
The functional currency of the Company is the United States dollar. The functional currency of the Company’s subsidiaries in the locations outside Hong Kong are the respective local currencies. The financial statements of the Company’s subsidiaries have been translated into United States dollars in accordance with SFAS 52,Foreign Currency Translation. All balance sheet accounts have been translated using the exchange rates in effect at the balance sheet date. Statement of operations amounts have been translated using the average exchange rates for the year. The effects of foreign currency translation adjustments are included as a component of accumulated other comprehensive income/(loss) in the shareholders’ equity.
F-21
chinadotcom corporation
NOTES TO CONSOLIDATED FINANCIAL STATEMENTS
(Amounts in thousands, except number of shares, number of options and per share data)
| 4. | | SUMMARY OF SIGNIFICANT ACCOUNTING POLICIES (continued) |
(i) Advertising expenses
Advertising expenses are charged to the consolidated statement of operations when incurred. The advertising expenses are indirect costs for promoting the brand name of the Company and for implementing its corporate marketing strategy, which are included in the “selling, general and administrative expenses” line item.
(j) Shipping and handling
Costs related to shipping and handling are included in cost of revenues for all periods presented.
(k) Revenue recognition
The Company generates revenues from three primary sources: software and consulting services, mobile services and applications, and advertising and marketing services. Revenue is recognized in accordance with accounting principles generally accepted in the United States, or GAAP. The specific literature the Company follows in connection with revenue recognition is the Securities and Exchange Commission’s Staff Accounting Bulletin No. 101 (“SAB 101”)Revenue Recognition in Financial Statements, the American Institute of Certified Public Accountants Statement of Position (“SOP”) 97-2,Software Revenue Recognition, as amended by SOP 98-9 Modification of SOP 97-2,Software Revenue Recognition, With Respect to Certain Transactions,and in certain instances, SOP 81-1,Accounting for Performance of Construction-Type and Certain Production-Type Contracts. The Company recognizes revenue when it has persuasive evidence of an arrangement, the product has been shipped and title has passed or the services have been delivered, the price is fixed or determinable and collectibility is reasonably assured. In addition to these basic criteria, the following are the specific revenue recognition policies for each major stream of revenue by reporting segment.
Revenues in the software and consulting services segment are derived from the outsourcing of information technology consultants, the sale of software products and the design, development and integration of Internet web sites.
| | | Outsourcing of information technology consultants involves contractual time and materials outsourcing agreements whereby consultants are provided at agreed-upon billing rates for customers to deploy on their own internal projects. Revenues from time and materials outsourcing contracts are recognized as the services are delivered assuming all other basic criteria for revenue recognition have been met. |
F-22
chinadotcom corporation
NOTES TO CONSOLIDATED FINANCIAL STATEMENTS
(Amounts in thousands, except number of shares, number of options and per share data)
| 4. | | SUMMARY OF SIGNIFICANT ACCOUNTING POLICIES (continued) |
(k) Revenue recognition (continued)
Revenue from the sale of software products often includes a combination of hardware, software, training and maintenance services. The Company allocates the arrangement fee in these multi-element deals to each individual element using its fair value as determined by “vendor specific objective evidence”. Vendor specific objective evidence of fair value is determined by the customary price charged for each element when sold separately after the application of any standard approved discount. Where fair value exists for all undelivered elements of the arrangement, the Company applies the “residual” method of accounting and defers revenue allocated to the undelivered elements while recognizing the residual revenue allocated to the delivered elements. In the absence of vendor specific objective evidence for any undelivered element, the Company defers the entire arrangement fee and recognizes revenue when all undelivered elements are delivered assuming all other basic criteria for revenue recognition have been met.
Revenues related to training services for software products are deferred and recognized as the services are delivered, assuming all other basic criteria for revenue recognition have been met. Where training services are sold as part of a multi-element deal, those services are evaluated, on a case-by-case basis, to determine whether they are essential to the functionality of the other elements of the arrangement. In cases where training services are considered essential to the functionality of the other elements of the arrangement, revenue from the total arrangement is deferred and recognized as the training services are delivered.
Revenues related to maintenance agreements on software products are deferred and recognized ratably over the term of the agreement which is normally one year.
Provisions for discounts and rebates to customers, estimated returns and allowances, and other adjustments are provided for in the same period in which the related revenues are recorded. Such provisions are calculated after considering relevant historical data.
Some of the engagements in the software and consulting services segment are for the design, development and integration of Internet web sites. These projects usually have fixed prices and most have durations of six months or less. Customers enter into contractual arrangements with the Company that specify the required web design features, layout, functionality, implementation services required, expected deliverables, pricing, payment terms and project timetable. Invoicing and payments are usually made throughout the term of the project in accordance with the contractual terms. A majority of the projects include acceptance clauses requiring customers’ sign off at the conclusion of the projects. The arrangements allow the customer to withhold 10% of the total project cost as a retention until sign off and acceptance is obtained. Historically, the Company has not experienced projects where sign off or acceptance has been withheld by a customer resulting in a material loss on a project. In limited situations, the Company receives change orders from customers, in which case, each change order request is assessed for its impact on the existing arrangement, and contract revenues and costs are only adjusted after both parties agree to the changes. The Company also receives change orders which result in the initiation of a separate project.
F-23
chinadotcom corporation
NOTES TO CONSOLIDATED FINANCIAL STATEMENTS
(Amounts in thousands, except number of shares, number of options and per share data)
| 4. | | SUMMARY OF SIGNIFICANT ACCOUNTING POLICIES (continued) |
(k) Revenue recognition (continued)
Revenues from the design and development of Internet web sites and the integration of those web sites with clients’ computer systems are recognized using contract accounting. In order to calculate the amount of revenue earned, the Company uses the cost-to-cost percentage-of-completion method whereby amounts recognized are calculated by reference to the hours incurred as a percentage of the total estimated hours to complete the project. The Company uses this input method to calculate revenues because historical experience has demonstrated that it produces a reliable indication of the progress on each engagement. Estimates of total projected contract costs are re-evaluated on a regular basis and, if appropriate, revised. Any adjustments to revenue due to changes in estimates are accounted for in the period of the change in estimate. When estimates indicate that a loss will be incurred on a contract upon completion, a provision for the expected loss is recorded in the period in which the loss becomes evident. Historically, the Company has not experienced material losses on fixed-price contracts. The majority of the Company’s contracts are short term in duration, and the use of the completed contract method would not result in a material difference in revenue earned.
The Company provides maintenance services related to Internet web sites. Maintenance services related to Internet web sites involves support in connection with non-significant customer requested changes to web site functionality, updates to web site information, and telephone support for web site administrators. Revenues from Internet web site maintenance agreements are deferred and recognized ratably over the terms of the related agreements which are usually for periods of six months or one year.
The Company’s mobile services and applications segment derives revenues from the provision of value-added short messaging services, or SMS, such as dating and friends matching, e-mail, ring tone and logo downloads and various other related products to mobile phone users. The Company relies on mobile network operators in Mainland China to transmit the SMS messages and bill mobile phone users for SMS fees on a monthly or per message basis.
SMS revenues are recognized in the month in which the services are performed, assuming all other basic criteria for revenue recognition have been met. The Company books revenues on a monthly basis based upon confirmations from the network operators. At the end of each reporting period, where an operator fails to provide the Company with a monthly statement confirming the amount of SMS charges billed to their mobile phone users for that month, the Company uses information generated from its own internal system and historical financial data to make estimates of the billing reconciliation rate and collectible SMS fees, and revenues are accrued accordingly.
Revenues from SMS are recognized net of the mobile phone operator’s share of revenue and uncollectible amounts because the Company considers the operators to be the primary obligors in the information transmission and delivery process. The network operators are the primary obligor in the arrangement. The mobile phone operators are responsible for fulfillment, including the transmission of the SMS messages to the end users. The Company is transparent to the mobile phone users because it provides the services through the mobile phone operators. The Company recognizes revenues on a monthly basis in the case of monthly subscriptions, on a message-received basis in the case of per message services, and on the basis of each successfully downloaded content in the case of games, ringtones and logos. The Company has no discretion over pricing of the services. Under arrangements with each mobile phone operator, changes require both parties’ approval. The Company has no discretion over supplier selection since there are currently only two mobile phone operators in Mainland China, and all SMS must be routed through their networks.
F-24
chinadotcom corporation
NOTES TO CONSOLIDATED FINANCIAL STATEMENTS
(Amounts in thousands, except number of shares, number of options and per share data)
| 4. | | SUMMARY OF SIGNIFICANT ACCOUNTING POLICIES (continued) |
(k) Revenue recognition (continued)
Advertising and marketing services revenues are derived from the sale of online banner advertisements, sponsorships, direct mailings and offline advertising campaigns.
Online banner advertising revenues are derived from short-term advertising contracts (normally less than 90 days), in which customers’ advertisements are placed on web sites for a set period of time or for a set number of impressions. Impressions are defined as the number of times that an advertisement appears on a selected web page. Customers typically identify the web sites they wish their advertisements to be displayed on, and in certain situations, the advertisements are also displayed on the Company’s own or affiliated companies’ web sites. Revenues from online banner advertising are recognized in the period in which the advertisement is displayed at the lesser of the ratio of impressions delivered over total guaranteed impressions or ratably over the term of the contract.
Sponsorship revenues are derived from advertisements placed on the Company’s own or affiliated companies’ web sites and are usually for longer display periods than online banner advertisement agreements, but normally do not exceed one year. Sponsorship revenues are recognized ratably over the term of contracts, assuming all other basic criteria for revenue recognition have been met.
Direct mailing revenues are derived from targeted advertising campaigns. The Company transmits the advertisements in either electronic form to the target profile or market. On occasion, the Company may also assist with the design of the advertisements. Revenues from direct mailing are recognized when the advertisements are sent, assuming all other basic criteria for revenue recognition have been met.
Offline advertising revenues are derived from the production and placement of advertisements in magazines and publications for the travel and tourism industry. Revenues are realized when the advertisements are published, assuming all other basic criteria for revenue recognition have been met.
The Company pays web sites for providing advertising space and becomes obligated to make the payment in the period the advertising is delivered. Such expenses are classified as cost of revenues in the consolidated statement of operations.
Certain subsidiaries of the Company act as advertising agents for their customers, and the related revenues derived from these agreements are recorded net in the consolidated statement of operations.
The Company pays affiliated web sites a percentage of advertising revenue, ranging from 50% to 85%, in exchange for providing advertising space to the Company’s network. The Company becomes obligated to make payments to such affiliated web sites in the period the advertising is delivered. Such expenses are classified as cost of revenues in the consolidated statement of operations. The Company records the revenue on a gross basis since it is responsible for the fulfillment of the contract, including the selection of the web site, arrangement of the advertisement placement and acceptability of the advertisement. In addition, the Company assumes the credit risk for the amount billed to the customer and owed to an affiliated web site after the web site performs, regardless of whether the Company fully collects the sales amount from the customer.
F-25
chinadotcom corporation
NOTES TO CONSOLIDATED FINANCIAL STATEMENTS
(Amounts in thousands, except number of shares, number of options and per share data)
| 4. | | SUMMARY OF SIGNIFICANT ACCOUNTING POLICIES (continued) |
(l) Deferred revenue
Deferred revenue represents cash received for software and consulting services and advertising and marketing services in advance of services being rendered.
The Company reports deferred revenue as a liability on the balance sheet when there is a contractual obligation as at the balance sheet date to provide services or software product to the customer but the services have not yet been completed or product has not yet been delivered, and thus no recognition of revenue has taken place.
The Company has adopted revenue recognition polices in respect of deferred revenue as follows:
| | • | | contracted support/maintenance revenue is recognized ratably (straight-line) over the life of the contracts, which are typically one year in duration; |
| |
| | • | | contracted training and installation revenue is recognized as service is delivered and completed; |
| |
| | • | | contracted online paid email/advertising campaign revenue is recognized ratably (straight-line) over the life of the contracts, which are typically one year in duration for paid email and two to three months for advertising campaigns; and, |
| |
| | • | | deferred contracted consulting revenue is recognized as services are delivered. |
(m) Income taxes
Income taxes, if any, are determined under the liability method as required by SFAS 109,Accounting for Income Taxes.
F-26
chinadotcom corporation
NOTES TO CONSOLIDATED FINANCIAL STATEMENTS
(Amounts in thousands, except number of shares, number of options and per share data)
| 4. | | SUMMARY OF SIGNIFICANT ACCOUNTING POLICIES (continued) |
(n) Stock compensation expenses
The Company accounts for stock-based employee compensation arrangements in accordance with the provisions of Accounting Principles Board Opinion (“APB”) No. 25,Accounting for Stock Issued to Employees, and complies with the disclosure provisions of SFAS 123,Accounting for Stock-Based Compensation. The Company and hongkong.com issued share options to certain of their employees in accordance with their respective stock option plans. Under APB 25, compensation cost is recognized over the vesting period based on the difference, if any, on the date of grant between the fair value of the Company’s and hongkong.com’s shares and the amount an employee must pay to acquire the shares. Had the Company determined compensation cost based on the fair value at the grant date for the stock options under SFAS 123, the Company’s net income would have been reduced as indicated below:
| | | | | | | | | | | | | |
| | | Year ended | | Year ended | | Year ended |
| | | December 31, | | December 31, | | December 31, |
| | | 2001 | | 2002 | | 2003 |
| | | USD | | USD | | USD |
| Net income/(loss): | | | | | | | | | | | | |
| As reported | | | (124,385 | ) | | | (18,231 | ) | | | 15,524 | |
| Add: Stock compensation expense included in income/(loss) | | | 1,227 | | | | 309 | | | | 328 | |
| Deduct: Stock compensation expense determined under fair value based method | | | (29,625 | ) | | | (15,924 | ) | | | (4,886 | ) |
| | | |
| | | |
| | | |
| |
| Pro forma | | | (152,783 | ) | | | (33,846 | ) | | | 10,966 | |
| | | |
| | | |
| | | |
| |
| Basic earnings/(loss) per share: | | | | | | | | | | | | |
| As reported | | | (1.21 | ) | | | (0.18 | ) | | | 0.15 | |
| Pro forma | | | (1.49 | ) | | | (0.33 | ) | | | 0.11 | |
| | | |
| | | |
| | | |
| |
| Diluted earnings/(loss) per share: | | | | | | | | | | | | |
| As reported | | | (1.21 | ) | | | (0.18 | ) | | | 0.15 | |
| Pro forma | | | (1.49 | ) | | | (0.33 | ) | | | 0.11 | |
| | | |
| | | |
| | | |
| |
| | | For the purposes of pro forma disclosures above, the estimated fair value of the options is amortized to expense over the options’ vesting period. |
(o) Earnings/(loss) per share
The Company computes earnings/(loss) per share in accordance with SFAS 128,Earnings per Share. Under the provisions of SFAS 128, basic earnings or loss per share is computed by dividing the net income or loss available to common shareholders for the year by the weighted average number of common shares outstanding during the year. Diluted earnings or loss per share is computed by dividing the net income or loss for the year by the weighted average number of common and common equivalent shares outstanding during the year. Common equivalent shares, composed of incremental common shares issuable upon the exercise of stock options, are included in diluted earnings or loss per share to the extent such shares are dilutive.
F-27
chinadotcom corporation
NOTES TO CONSOLIDATED FINANCIAL STATEMENTS
(Amounts in thousands, except number of shares, number of options and per share data)
| 4. | | SUMMARY OF SIGNIFICANT ACCOUNTING POLICIES (continued) |
(p) Repurchase agreements
Debt securities sold under agreements to repurchase are classified as secured borrowings. Agreements with the third party specify the third party’s rights to request additional collateral. Both parties monitor the fair value of the underlying securities as compared with the related receivable or payable, including accrued interest, and may request a cash transfer at least equal to that net exposure as necessary.
(q) Accounts receivable and allowance for doubtful accounts
Accounts receivable are carried at their original amount less an estimate made for uncollectible amounts.
The allowance for doubtful accounts is established based on the Company’s credit control policies. Allowances are made based upon regular reviews of all significant outstanding invoices and, in addition, invoices not specifically reviewed are provided for at differing rates, based upon the age of the receivable. The determination of these rates is based upon our historical collection experience and assessment of the economic environment in which the customer is situated. Receivables more than 180 days past due are automatically reserved unless collection is deemed probable. If the assessments made and historical data used to calculate the allowance for doubtful accounts does not reflect the ability to collect outstanding receivables, additional provisions for doubtful accounts may be needed, and the future results of operations could be materially affected.
(r) Comprehensive income/(loss)
Comprehensive income/(loss) includes net earnings or loss as well as additional other comprehensive income/(loss). The Company’s other comprehensive income/(loss) consists of unrealized gains and loss on available-for-sale securities and foreign currency translation, all recorded net of tax.
(s) Gain on issuances of shares by subsidiaries
At the time a subsidiary sells its shares to unrelated parties at a price in excess of its book value, the Company’s net investment in that subsidiary increases. If at that time, the subsidiary is not a newly-formed, non-operating entity, nor a research and development, start-up or development stage company, nor is there question as to the subsidiary’s ability to continue in existence, the Company records the increase as a non-operating gain in the consolidated statement of operations. Otherwise, the increase is reflected in “effect of subsidiaries’ equity transactions” in the Company’s consolidated statement of shareholders’ equity.
(t) Retirement costs
Retirement costs relating to defined benefit plans are actuarially determined based on assumptions concerning the future events that will determine the amount and timing of the benefit payments. Contributions relating to defined contribution plans are made based on a percentage of the employees’ salaries and are charged to the results of operations as they become payable.
F-28
chinadotcom corporation
NOTES TO CONSOLIDATED FINANCIAL STATEMENTS
(Amounts in thousands, except number of shares, number of options and per share data)
| 4. | | SUMMARY OF SIGNIFICANT ACCOUNTING POLICIES (continued) |
(u) Derivative instruments
SFAS 133,Accounting for Derivative Instruments and Hedging Activities, as modified by SFAS 149,Amendment of Statement No. 133 on Derivative Instruments and Hedging Activities, requires all contracts which meet the definition of a derivative to be recognized in the consolidated financial statements as either assets or liabilities and recorded at fair value. Changes in the fair value of derivative financial instruments are either recognized periodically in the income/(loss) or in shareholders’ equity as a component of other comprehensive income depending on the use of the derivative and whether it qualifies for hedge accounting. Changes in fair values of derivatives not qualified as hedges are reported in income. The estimated fair values of derivative instruments are determined at discrete points in time based on the relevant market information. These estimates are calculated with reference to the market rates using industry standard valuation techniques.
(v) Impact of recently issued accounting standards
In May 2003, the FASB issued SFAS 150,Accounting for Certain Financial Instruments with Characteristics of both Liabilities and Equity. This statement establishes standards for classifying and measuring as liabilities certain financial instruments that embody obligations of the issuer and have characteristics of both liabilities and equity. Instruments that are indexed to and potentially settled in an issuer’s own shares that are not within the scope of SFAS 150 remain subject to existing guidance. SFAS 150 must be applied immediately to instruments entered into or modified after May 31, 2003 and to all other instruments that exist as of the beginning of the first interim financial reporting period beginning after June 15, 2003. Certain provisions of this statement relating to noncontrolling interests in limited-life subsidiaries were deferred indefinitely. The Company adopted SFAS 150 and there was no impact on the Company’s results of operations or financial position upon the adoption of the new statement.
In January 2003, the FASB issued FIN 46. In December 2003, the FASB modified FIN 46 to make certain technical corrections and address certain implementation issues that had arisen. FIN 46 provides a new framework for identifying variable interest entities (“VIEs”) and determining when a company should include the assets, liabilities, non-controlling interests and results of activities of a VIE in its consolidated financial statements. In general, a VIE is a corporation, partnership, limited liability corporation, trust, or any other legal structure used to conduct activities or hold assets that either (i) has an insufficient amount of equity to carry out its principal activities without additional subordinated financial support, (ii) has a group of equity owners that are unable to make significant decisions about its activities, or (iii) has a group of equity owners that do not have the obligation to absorb losses or the right to receive returns generated by its operations. FIN 46 requires a VIE to be consolidated if a party with an ownership, contractual or other financial interest in the VIE (a variable interest holder) is obligated to absorb a majority of the risk of loss from the VIE’s activities, is entitled to receive a majority of the VIE’s residual returns (if no party absorbs a majority of the VIE’s losses), or both. A variable interest holder that consolidates the VIE is called the primary beneficiary. Upon consolidation, the primary beneficiary generally must initially record all of the VIE’s assets, liabilities and non-controlling interests at fair value and subsequently account for the VIE as if it were consolidated based on majority voting interest. FIN 46 also requires disclosures about VIEs that the variable interest holder is not required to consolidate but in which it has a significant variable interest.
�� FIN 46 was effective immediately for VIEs created after January 31, 2003. The provisions of FIN46, as revised, were early adopted for the Company’s interests in all VIEs and there was no cumulative effect on the Company’s results of operations or financial position upon the adoption of the provisions of the revised FIN 46.
F-29
chinadotcom corporation
NOTES TO CONSOLIDATED FINANCIAL STATEMENTS
(Amounts in thousands, except number of shares, number of options and per share data)
At December 31, 2002 and 2003, cash of USD109 and USD238, respectively, was pledged for banking facilities.
| | | | | | | | | |
| | | December 31, | | December 31, |
| | | 2002 | | 2003 |
| | | USD | | USD |
| Accounts receivable: | | | | | | | | |
| Amounts billed | | | 17,648 | | | | 18,058 | |
| Unbilled | | | 1,521 | | | | 1,320 | |
| | | |
| | | |
| |
| | | | 19,169 | | | | 19,378 | |
| Allowance for doubtful accounts | | | (4,139 | ) | | | (2,816 | ) |
| | | |
| | | |
| |
| Net | | | 15,030 | | | | 16,562 | |
| | | |
| | | |
| |
| | | | | | | | | | | | | |
| | | Year ended | | Year ended | | Year ended |
| | | December 31, | | December 31, | | December 31, |
| | | 2001 | | 2002 | | 2003 |
| | | USD | | USD | | USD |
| Allowance for doubtful accounts: | | | | | | | | | | | | |
| Balance at beginning of year | | | 3,488 | | | | 6,538 | | | | 4,139 | |
| Additions | | | 3,050 | | | | 4,296 | | | | 2,297 | |
| Write-offs net of recoveries | | | — | | | | (6,695 | ) | | | (3,620 | ) |
| | | |
| | | |
| | | |
| |
| Balance at end of year | | | 6,538 | | | | 4,139 | | | | 2,816 | |
| | | |
| | | |
| | | |
| |
As the Company has operations in many countries, there are variations in its credit terms between countries and between revenue segments. Within the range of credit policies, the credit terms for each revenue segment are based on the following general guidelines:
| | • | | For sales of IT products, the Company offers “30 to 60 days credit from date of delivery of software” or “cash on delivery”; |
| |
| | • | | For sales of consulting services, the Company offers “30 to 60 days credit after completion of milestones per agreement”; |
| |
| | • | | For sales in the mobile services and applications, the Company offers “90 days credit from the date issuance of invoices which usually takes place one month following the month of actual sales”; |
| |
| | • | | With respect to sales in advertising and marketing activities segment, the Company offers three standard payment options “cash on delivery”, “14 days after completion of campaign” or “30 days credit”. |
F-30
chinadotcom corporation
NOTES TO CONSOLIDATED FINANCIAL STATEMENTS
(Amounts in thousands, except number of shares, number of options and per share data)
| 6. | | ACCOUNTS RECEIVABLE (continued) |
Accounts receivable are carried at their original amount less allowance for doubtful accounts. The Company has adopted credit control policies to ensure that collection of the accounts receivable is probable and that recognition of the related revenue is appropriate. The allowance for doubtful accounts is established based on the Company’s credit control policies as listed below:
| | | | | |
Period
| | Rate (% of accounts receivable)
|
| Over 90 days | | | 25 | % |
| Over 120 days | | | 50 | % |
| Over 180 days | | | 100 | % |
Allowances are made based upon regular reviews of all significant outstanding invoices and, in addition, invoices not specifically reviewed are provided for at differing rates, based upon the aging of the accounts receivable. The determination of these rates is based upon the Company’s historical collection experience and assessment of the customer’s economic environment. Accounts receivable which are more than 180 days past due are automatically reserved unless collection is deemed probable.
Unbilled receivables of USD1,521 and USD1,320 in 2002 and 2003, respectively, represented the recognized sales value of performance relating to software and consulting services and these amounts had not been billed and were not billable to the customers at the date of the balance sheet. The balances will be billed upon the fulfillment of certain conditions agreed between the parties.
| 7. | | AVAILABLE-FOR-SALE DEBT SECURITIES |
In 2002, the Company recorded an impairment loss of certain available-for-sale debt securities of approximately USD5,000. The value of debt securities was determined to have been impaired because the fair value of the debt securities was below the cost for over six months in 2002. The decline in fair value was not expected to recover prior to the time of sale as the Company may not hold such debt securities to maturity.
| | | | | | | | | |
| | | December 31, | | December 31, |
| | | 2002 | | 2003 |
| | | USD | | USD |
| Debt obligations issued by corporations and federally supervised/chartered organizations: | | | | | | | | |
| Amortized cost | | | 467,842 | | | | 313,219 | |
| Net unrealized gain/(loss)* | | | 3,337 | | | | 35 | |
| | | |
| | | |
| |
| Estimated fair value | | | 471,179 | | | | 313,254 | |
| Restricted debt securities pledged for banking facilities | | | (151,123 | ) | | | (31,109 | ) |
| | | |
| | | |
| |
| Non-restricted | | | 320,056 | | | | 282,145 | |
| | | |
| | | |
| |
| | *The net unrealized gain/(loss) consisted of the gross unrealized gain of USD1,471 (2002: USD3,959) and the gross unrealized loss of USD1,436 (2002: USD622). |
F-31
chinadotcom corporation
NOTES TO CONSOLIDATED FINANCIAL STATEMENTS
(Amounts in thousands, except number of shares, number of options and per share data)
| 7. | | AVAILABLE-FOR-SALE DEBT SECURITIES (continued) |
For the years ended December 31, 2002 and 2003, the gross realized gain amounts were USD1,258 and USD6,834, respectively, and the gross realized loss amounts were USD1,166 and USD5,356, respectively.
Non-restricted available-for-sale debt securities consist of:
| | | | | | | | | |
| | | December 31, | | December 31, |
| | | 2002 | | 2003 |
| | | USD | | USD |
| Current | | | 300,056 | | | | 262,745 | |
| Non-current | | | 20,000 | | | | 19,400 | |
| | | |
| | | |
| |
| | | | 320,056 | | | | 282,145 | |
| | | |
| | | |
| |
At December 31, 2003, all the debt securities were carried at market value and temporary unrealized gains and losses at December 31, 2003 were reported in other comprehensive income/(loss).
At December 31, 2002 and 2003, the Company’s debt securities had maturity dates falling due as follows:
| | | | | | | | | |
| | | December 31, | | December 31, |
| | | 2002 | | 2003 |
| | | USD | | USD |
| Maturity date | | | | | | | | |
| One year or less | | | 15,459 | | | | 30,322 | |
| Over one year to five years | | | 294,817 | | | | 233,342 | |
| Over five years to ten years | | | 160,903 | | | | 49,590 | |
| | | |
| | | |
| |
| | | | 471,179 | | | | 313,254 | |
| | | |
| | | |
| |
All debt securities held by the Company have maturity terms ranging from one to over ten years. At December 31, 2003, all the debt securities were carried at market value and temporary unrealized gains and losses at December 31, 2003 were reported in other comprehensive income.
Included in debt securities owned as of December 31, 2002 and 2003 were debt securities with a market value of USD151,123 and USD31,109, respectively, which were segregated and secured in accordance with the Global Master Repurchase Agreement and the Total Return Swap Transaction Agreement as further detailed in note 13.
All debt securities as at December 31, 2002 and 2003 had been in an unrealized loss position for less than 12 months. For the debt securities in an unrealized loss position at the year end, the Company evaluated the length of the time and the extent to which the market value had been less than cost as well as the financial condition and performance of the issuer, and reached the conclusion that the impairments are not other-than-temporary.
F-32
chinadotcom corporation
NOTES TO CONSOLIDATED FINANCIAL STATEMENTS
(Amounts in thousands, except number of shares, number of options and per share data)
The balance as of December 31, 2003 is comprised of (i) a USD2,000 loan to Pivotal Corporation, a subsidiary newly acquired subsequent to the balance sheet date as further detailed in note 28, which is unsecured, bears interest at the U.S. prime rate and is repayable in December 2006, and (ii) a USD25,000 loan to Symphony, a minority shareholder of IMI as further detailed in note 2 (d), which is secured by a pledge from Symphony in favor of Cayman First Tier (the holding company organized in the Cayman Islands which owns 100% of IMI) of all of Symphony’s right, title and interest in Symphony’s 49% interest in Cayman First Tier, bears interest at 3% per annum and is repayable in November 2007.
The balance as of December 31, 2002 represented a USD5,325 loan to Sagent Technology Inc., a NASDAQ listed company. The balance was early settled in 2003.
| 9. | | PROPERTY AND EQUIPMENT |
| | | | | | | | | |
| | | December 31, | | December 31, |
| | | 2002 | | 2003 |
| | | USD | | USD |
| Freehold land | | | 1,262 | | | | 1,348 | |
| Buildings | | | 1,262 | | | | 1,348 | |
| Leasehold improvements | | | 2,579 | | | | 2,156 | |
| Furniture and fixtures | | | 2,531 | | | | 301 | |
| Office equipment | | | 2,142 | | | | 1,740 | |
| Computer equipment | | | 29,408 | | | | 26,754 | |
| Motor vehicles | | | 488 | | | | 511 | |
| | | |
| | | |
| |
| | | | 39,672 | | | | 34,158 | |
| Less: Accumulated depreciation | | | (30,297 | ) | | | (26,948 | ) |
| | | |
| | | |
| |
| | | | 9,375 | | | | 7,210 | |
| | | |
| | | |
| |
F-33
chinadotcom corporation
NOTES TO CONSOLIDATED FINANCIAL STATEMENTS
(Amounts in thousands, except number of shares, number of options and per share data)
The changes in the carrying amount of goodwill for the years ended December 31, 2002 and 2003 are as follows:
| | | | | | | | | | | | | | | | | |
| | | | | | | Mobile | | | | |
| | | Software and | | services | | Advertising | | |
| | | consulting | | and | | and marketing | | |
| | | services | | applications | | activities | | Total |
| | | USD | | USD | | USD | | USD |
| Balance as of January 1, 2002 | | | 1,834 | | | | — | | | | 4,596 | | | | 6,430 | |
| Goodwill acquired during the year | | | 5,277 | | | | — | | | | 1,295 | | | | 6,572 | |
| Less: Goodwill written off related to sale/dissolution of business units | | | (203 | ) | | | — | | | | (783 | ) | | | (986 | ) |
| | | |
| | | |
| | | |
| | | |
| |
| Balance as of December 31, 2002 | | | 6,908 | | | | — | | | | 5,108 | | | | 12,016 | |
| Reallocation of goodwill | | | 653 | | | | — | | | | (653 | ) | | | — | |
| | | |
| | | |
| | | |
| | | |
| |
| Balance as of January 1, 2003 | | | 7,561 | | | | — | | | | 4,455 | | | | 12,016 | |
| Goodwill acquired during the year | | | 21,063 | | | | 47,704 | | | | 879 | | | | 69,646 | |
| Less: Goodwill written off related to sale/dissolution of business units | | | (235 | ) | | | — | | | | — | | | | (235 | ) |
| | | |
| | | |
| | | |
| | | |
| |
| Balance as of December 31, 2003 | | | 28,389 | | | | 47,704 | | | | 5,334 | | | | 81,427 | |
| | | |
| | | |
| | | |
| | | |
| |
Due to the adoption of SFAS 142 on January 1, 2002, the Company ceased amortizing goodwill. Had SFAS 142 been in effect during the year ended December 31, 2001, the Company would not have recorded goodwill amortization expenses of USD15,323. The following table summarizes net loss adjusted to exclude amortization expense in relation to goodwill that is no longer subject to amortization:
| | | | | | | | | | | | | |
| | | Year ended | | Year ended | | Year ended |
| | | December 31, | | December 31, | | December 31, |
| | | 2001 | | 2002 | | 2003 |
| | | USD | | USD | | USD |
| Reported net income/(loss) | | | (124,385 | ) | | | (18,231 | ) | | | 15,524 | |
| Goodwill amortization | | | 15,323 | | | | — | | | | — | |
| | | |
| | | |
| | | |
| |
| Adjusted net income/(loss) | | | (109,062 | ) | | | (18,231 | ) | | | 15,524 | |
| | | |
| | | |
| | | |
| |
| Basic earnings/(loss) per share | | | (1.06 | ) | | | (0.18 | ) | | | 0.15 | |
| | | |
| | | |
| | | |
| |
| Diluted earnings/(loss) per share | | | (1.06 | ) | | | (0.18 | ) | | | 0.15 | |
| | | |
| | | |
| | | |
| |
F-34
chinadotcom corporation
NOTES TO CONSOLIDATED FINANCIAL STATEMENTS
(Amounts in thousands, except number of shares, number of options and per share data)
The goodwill represents the excess consideration paid for the purchase of subsidiaries over the fair values of the identifiable net assets acquired at the date of acquisition adjusted for contingent consideration paid, if any.
The following table summarizes the Company’s amortized intangible assets, net, as of December 31:
| | | | | | | | | | | | | | | | | | | | | | | | | |
| | | 2002
| | 2003
|
| | | Gross | | | | | | | | | | Gross | | | | |
| | | carrying | | Accumulated | | | | | | carrying | | Accumulated | | |
| | | amount | | amortization | | Net | | amount | | amortization | | Net |
| | | USD | | USD | | USD | | USD | | USD | | USD |
| Trademarks, service marks and URLs | | | 17,092 | | | | (885 | ) | | | 16,207 | | | | 17,092 | | | | (1,765 | ) | | | 15,327 | |
| Software applications and programs | | | 720 | | | | (200 | ) | | | 520 | | | | 6,585 | | | | (813 | ) | | | 5,772 | |
| Customer base and contracts | | | 351 | | | | (98 | ) | | | 253 | | | | 9,303 | | | | (2,098 | ) | | | 7,205 | |
| Business licenses and partnership agreements | | | — | | | | — | | | | — | | | | 654 | | | | (78 | ) | | | 576 | |
| | | |
| | | |
| | | |
| | | |
| | | |
| | | |
| |
| | | | 18,163 | | | | (1,183 | ) | | | 16,980 | | | | 33,634 | | | | (4,754 | ) | | | 28,880 | |
| | | |
| | | |
| | | |
| | | |
| | | |
| | | |
| |
For the year ended December 31, 2003, the Company recognized USD3,571 of amortization expense. Based on the current amount of intangible assets subject to amortization, the estimated amortization expense for each of the succeeding five years is as follows:
| | | | | |
| Year ended December 31: | | USD |
| 2004 | | | 4,994 | |
| 2005 | | | 3,812 | |
| 2006 | | | 3,092 | |
| 2007 | | | 2,415 | |
| 2008 | | | 1,576 | |
F-35
chinadotcom corporation
NOTES TO CONSOLIDATED FINANCIAL STATEMENTS
(Amounts in thousands, except number of shares, number of options and per share data)
| 12. | | AVAILABLE-FOR-SALE EQUITY SECURITIES |
| | | | | | | | | |
| | | December 31, | | December 31, |
| | | 2002 | | 2003 |
| | | USD | | USD |
| Cost | | | 1,875 | | | | 813 | |
| Net unrealized gain/(loss) | | | 175 | | | | (223 | ) |
| | | |
| | | |
| |
| Market value | | | 2,050 | | | | 590 | |
| | | |
| | | |
| |
| | *The net unrealized gain/(loss) consisted of gross unrealized gain of USD103 (2002: USD755) and gross unrealized loss of USD326 (2002: USD580). |
For the years ended December 31, 2002 and 2003, the gross realized gain was USD243 and USD3,545, respectively, and the gross realized loss was USD498 and USD424, respectively.
All equity securities as at December 31, 2002 and 2003 had been in an unrealized loss position for less than 12 months. The Company’s available-for-sale equity securities are held for sale. For the equity securities in an unrealized loss position at the year end, the Company evaluated the length of the time and the extent to which the market value had been less than cost as well as the financial condition and performance of the issuer of the equity securities, and reached the conclusion that the impairments are not other-than-temporary.
Under line of credit arrangements with two banks, including the Global Master Repurchase Agreement (the “Repurchase Agreement”) and the Total Return Swap Transaction Agreement (the “Swap Agreement”) as described below, the Company may borrow up to USD401,554 on such terms as the Company and the banks mutually agree upon. Except for bank loans of USD15,199 due in 2004 and USD11,456 due in 2005 through to 2011, these arrangements do not have termination dates, but are reviewed annually for renewal. At December 31, 2003, the unused portion of the credit lines was USD374,899.
The Company entered into the Repurchase Agreement with Fortis Bank pursuant to which the Company sold certain debt securities to the bank at a discounted price (the “Purchase Price”) and the bank agreed to sell back to the Company at the Purchase Price at a later date (the “Repurchase Date”). Either party with a net exposure from the transaction arising from the fluctuations in the market value of the securities or other means may request the other party to make a cash or acceptable debt securities transfer at least equal to that net exposure. During the period between the date that the Company sold the debt securities to the bank (the “Purchase Date”) and the Repurchase Date, the bank shall pay to the Company any income in respect of the debt securities and the Company shall pay to the bank interest calculated using the Purchase Price at London Inter-Bank Offered Rate (“LIBOR”) plus 0.2% per annum and the number of days between the Purchase Date and the Repurchase Date. At December 31, 2002 and 2003, the repurchase transactions entered into only allowed the buyer to request the seller to make a cash or acceptable debt securities transfer at least equal to the net exposure.
F-36
chinadotcom corporation
NOTES TO CONSOLIDATED FINANCIAL STATEMENTS
(Amounts in thousands, except number of shares, number of options and per share data)
| 13. | | CREDIT ARRANGEMENTS (continued) |
The Company entered into the Swap Agreement with another bank pursuant to which the Company transferred securities and financial instruments to the bank in exchange for cash and concurrently the Company agreed to reacquire the securities and financial instruments at a future date for an amount equal to the cash exchanged and an interest factor. The Swap Agreement permitted the Company to elect for net cash settlement upon termination of the total return swap transaction. During the period between the Purchase Date and the Repurchase Date of three calendar years, the bank would pay to the Company any income in respect of the securities transferred and the Company would in return pay to the bank a price differential calculated by the Purchase Price multiplied by LIBOR plus 0.35% per annum and the number of days between the Purchase Date and the Repurchase Date.
In connection with the credit lines granted to the Company, the Company maintained compensating balances of USD238 and USD109 in cash at December 31, 2003 and 2002, respectively, and pledged debt securities with a net book value of USD31,109 and USD151,123 at December 31, 2003 and 2002, respectively.
The weighted average interest rates on short-term borrowings as of December 31, 2002 and 2003 were 2.1% and 1.4% per annum, respectively.
| | | Long-term bank loans consist of the following: |
| | | | | | | | | |
| | | December 31, | | December 31 |
| | | 2002 | | 2003 |
| | | USD | | USD |
| LIBOR + 1.75% mortgage loan | | | 831 | | | | 777 | |
| 4.1% mortgage loan | | | 830 | | | | 777 | |
| LIBOR + 0.35% total return swap transaction loan | | | 10,073 | | | | 10,073 | |
| | | |
| | | |
| |
| | | | 11,734 | | | | 11,627 | |
| Less: Current portion | | | (149 | ) | | | (171 | ) |
| | | |
| | | |
| |
| | | | 11,585 | | | | 11,456 | |
| | | |
| | | |
| |
Maturities of long-term debts for the five years succeeding December 31, 2003 are USD171 in 2004, USD10,249 in 2005, USD189 in 2006, USD204 in 2007, USD226 in 2008 and USD588 thereafter.
The above mortgage loans will be repaid by installments with the last payment due in 2011. Freehold land and buildings with a carrying amount of USD2,524 at December 31, 2002 and USD2,806 at December 31, 2003 were pledged as collateral to secure these loans.
The above total return swap transaction loan is due in 2005. Debt securities with a fair value of USD11,896 at December 31, 2003 were pledged as collateral to secure the loan.
The weighted average interest rates on long-term bank loans as of December 31, 2002 and 2003 were 2.1% and 1.6% per annum, respectively.
F-37
chinadotcom corporation
NOTES TO CONSOLIDATED FINANCIAL STATEMENTS
(Amounts in thousands, except number of shares, number of options and per share data)
| 15. | | ACCUMULATED OTHER COMPREHENSIVE INCOME |
The components of accumulated other comprehensive income are as follows:
| | | | | | | | | | | | | |
| | | Unrealized | | | | |
| | | gains/(losses) | | Foreign | | |
| | | on available- | | currency | | |
| | | for-sale | | translation | | |
| | | securities | | adjustments | | Total |
| | | USD | | USD | | USD |
| Balance at December 31, 2000 | | | 71 | | | | (837 | ) | | | (766 | ) |
| Unrealized losses, net of unrealized gain of available-for-sale securities | | | (9,956 | ) | | | — | | | | (9,956 | ) |
| Other-than-temporary impairment of available-for-sale securities | | | 4,216 | | | | — | | | | 4,216 | |
| Minority interests’ share of unrealized losses, net of unrealized gains of available-for-sale securities | | | 337 | | | | — | | | | 337 | |
| Foreign currency translation adjustments | | | — | | | | (1,199 | ) | | | (1,199 | ) |
| Less: reclassification adjustment for gains, net of losses included in net loss | | | (71 | ) | | | — | | | | (71 | ) |
| | | |
| | | |
| | | |
| |
| Balance at December 31, 2001 | | | (5,403 | ) | | | (2,036 | ) | | | (7,439 | ) |
| Unrealized losses, net of unrealized gains of available-for-sale securities | | | (1,276 | ) | | | — | | | | (1,276 | ) |
| Other-than-temporary impairment of available-for-sale securities | | | 5,125 | | | | — | | | | 5,125 | |
| Minority interests’ share of unrealized gains, net of unrealized losses of available-for-sale securities | | | (484 | ) | | | — | | | | (484 | ) |
| Foreign currency translation adjustments | | | — | | | | 661 | | | | 661 | |
| Less: reclassification adjustment for gains, net of losses included in net income | | | 5,403 | | | | — | | | | 5,403 | |
| | | |
| | | |
| | | |
| |
| Balance at December 31, 2002 | | | 3,365 | | | | (1,375 | ) | | | 1,990 | |
| Unrealized gains, net of unrealized losses of available-for-sale securities | | | 644 | | | | — | | | | 644 | |
| Minority interests’ share of unrealized losses, net of unrealized gains of available-for-sale securities | | | 184 | | | | — | | | | 184 | |
| Foreign currency translation adjustments | | | — | | | | 186 | | | | 186 | |
| Less: reclassification adjustment for gains, net of losses included in net income | | | (4,344 | ) | | | — | | | | (4,344 | ) |
| | | |
| | | |
| | | |
| |
| Balance at December 31, 2003 | | | (151 | ) | | | (1,189 | ) | | | (1,340 | ) |
| | | |
| | | |
| | | |
| |
F-38
chinadotcom corporation
NOTES TO CONSOLIDATED FINANCIAL STATEMENTS
(Amounts in thousands, except number of shares, number of options and per share data)
| 16. | | SUPPLEMENTARY OPERATIONS STATEMENT INFORMATION |
| | | | | | | | | | | | | |
| | | Year ended | | Year ended | | Year ended |
| | | December 31, | | December 31, | | December 31, |
| | | 2001 | | 2002 | | 2003 |
| | | USD | | USD | | USD |
| The Company incurred the following expenses: | | | | | | | | | | | | |
| Rental expenses — minimum rental under operating leases | | | 8,100 | | | | 4,198 | | | | 3,086 | |
| Advertising expenses | | | 9,110 | | | | 930 | | | | 580 | |
| Defined contribution retirement plans expenses | | | 475 | | | | 1,423 | | | | 2,922 | |
| 17. | | RELATED PARTY TRANSACTIONS |
In addition to the transactions and balances detailed elsewhere in these financial statements, the Company had the following material transactions with related parties during the years ended December 31, 2001, 2002 and 2003:
(a) 24/7 Real Media, Inc.
Pursuant to the License and Software Agreement (the “Agreement”) entered into by the Company and 24/7 Real Media, Inc. (formerly known as 24/7 Media, Inc. and hereafter referred to as “24/7”), which was a shareholder of the Company in 2001. On October 23, 1998, 24/7 granted to the Company a non-exclusive license to use certain 24/7 software products to serve advertisements on the Internet and an exclusive license to use the “24/7 Media” trademark in the Asian market.
Under the terms of the agreement with 24/7, the Company was obligated to pay to 24/7 10% of the Company’s net revenue generated from advertisements on the Company’s advertising network. Such net revenue included all revenues generated from advertising sales, net of commissions retained or paid to advertising agencies, and service fees paid to advertising affiliates or the Company’s web sites. Service fees paid to the Company’s web sites, exclusive of the Company’swww.cww.comportal, was set at 70% of advertising sales while service fees to the advertising affiliates, including the Company’swww.cww.comportal, ranged from 30% to 50% of advertising sales. During the year ended December 31, 2001, payments made under the Agreement amounted to USD800.
Where U.S. based advertisements were sold on the Company’s advertising network by 24/7, 24/7 was obligated to pay 70% of the sales revenue, net of commissions retained or paid to advertising agencies, to the Company. 24/7 served as the Company’s exclusive agent for the sale of U.S. based advertisements on the Company’s advertising network.
F-39
chinadotcom corporation
NOTES TO CONSOLIDATED FINANCIAL STATEMENTS
(Amounts in thousands, except number of shares, number of options and per share data)
| 17. | | RELATED PARTY TRANSACTIONS (continued) |
(a) 24/7 Real Media, Inc. (continued)
Where Asian-based advertisements were sold on 24/7 U.S. network of advertising affiliates, the Company would pay 70% of such sales revenue, net of commissions retained or paid to advertising agencies, to 24/7. The Company served as 24/7 Media Asia Limited’s exclusive agent for the sale of Asian-based advertisements on 24/7 U.S. network of advertising affiliates.
In August 2000, the Agreement was superceded by the 24/7 Media Asia Agreement and supplemental related agreements (collectively the “Media Asia Agreement”). In October 2000, as part of the Media Asia Agreement, the Company sold 19.9% of its shares in 24/7 Media Asia Limited, a then wholly-owned subsidiary of the Company, to 24/7 in exchange for 2,500,000 shares of common stock of 24/7 valued at USD4.3125 per share, resulting in a net gain of USD10,417. The Company continued to own less than 5% of 24/7.
In June 2001, the Company gave notice of termination of the Media Asia Agreement to 24/7, which notice was effective in September 2001.
In June 2001, the Company demanded from 24/7 Media Asia Limited the repayment of a portion of certain loans that the Company had extended to 24/7 Media Asia Limited. The loans consisted of USD10,956 made prior to June 30, 2000 and USD9,569 made during the period from July 1, 2000 to May 31, 2001. The Company entered into negotiations with 24/7 Media Asia Limited, and, due to limited cash resources available at 24/7 Media Asia Limited and a desire by the parties to allow 24/7 Media Asia Limited to keep the proceeds of the remaining USD9,569 to enable it to continue to fund its operations, the Company agreed that 24/7 Media Asia Limited would repay only the loans made prior to June 30, 2000 amounting to USD10,956. In January 2002, 24/7 Media Asia Limited completed a rights issue whereby it issued and allotted additional equity shares to all shareholders participating in the rights issue as a means to settle the loan demand. While the Company participated in this rights issue, 24/7 chose not to participate in this rights issue and therefore, 24/7’s interest in 24/7 Media Asia Limited was effectively diluted to under 2%, while the Company’s interest in 24/7 Media Asia Limited increased to approximately 98%. In February 2003, 24/7 filed suit against the Company in the Federal District Court in New York to enforce obligations allegedly owed under the Media Asia Agreement. The Company contested these allegations and, in May 2003, obtained an order staying the lawsuit in New York and compelling arbitration of the claims at the International Chamber of Commerce, or the ICC. Pursuant to the ICC arbitration, in July 2003 the Company filed a request for arbitration seeking damages in excess of USD24,000 for the breach of the Media Asia Agreement. In October 2003, 24/7 filed an answer and counterclaim seeking USD2,600 being damages for, among other things, services allegedly unpaid under the same agreement. In December 2003, the Company filed a reply to answer and counterclaims denying these allegations. The arbitration is at an early stage and the arbitration panel is yet to be fully constituted.
F-40
chinadotcom corporation
NOTES TO CONSOLIDATED FINANCIAL STATEMENTS
(Amounts in thousands, except number of shares, number of options and per share data)
| 17. | | RELATED PARTY TRANSACTIONS (continued) |
(b) Equity investee
The Company derived software and consulting services revenues from the following equity investee of the Company:
| | | | | | | | | | | | | |
| | | Year ended | | Year ended | | Year ended |
| | | December 31, | | December 31, | | December 31, |
| | | 2001 | | 2002 | | 2003 |
| | | USD | | USD | | USD |
| Sportasia Media Limited | | | 60 | | | | — | | | | — | |
| | | |
| | | |
| | | |
| |
In November 2001, the Company acquired the URL of “www.sportasia.com” from Sportasia Media Limited for a consideration of USD39.
(c) CIC
In June 1999, the Company entered into a Support Services Agreement with CIC under which the Company agreed to provide CIC with the services required to operate local online services for America Online, Inc. (“AOL”) in Hong Kong which was amended in April 2000.
Since January 1, 2001, the Company has not recognized any revenue arising from the Amended and Restated Support Services Agreement due to the uncertainty of the collectibility of the receivable from CIC. USD5,425 incurred in connection with the provision of these services was recorded under selling, general and administrative expenses in 2001. Therefore, in September 2001, the Company agreed to CIC’s request to formalize the forgiveness of up to USD7,730 owed to the Company from CIC.
In October 2001, the Company entered into an Asset Purchase Agreement with CIC to acquire the URLs of “www.china.com”, “www.hongkong.com” and “www.taiwan.com”, and all intellectual property and other proprietary rights in connection with the URLs for a cash consideration of USD16,800. The purchase price of the URLs was determined by reference to valuations performed by third party appraisers and negotiation with CIC.
During 2003, CIC waived the current account with the Company amounting to USD715.
(d) Golden Tripod Limited
In June 2001, the Company signed contracts with entities affiliated with Xinhua, Golden Tripod (Holdings) Limited, or Golden Tripod, and Xinhua News Agency Shanghai Branch, or Shanghai Xinhua, to acquire 30% of the shares of Xin Hua Asia Pacific TV (H.K.) Center Limited, a company 51% owned by Golden Tripod and 49% owned by Shanghai Xinhua, as well as to form a 50% owned joint venture in the PRC. The Company paid USD500 as a deposit after the contracts had been signed. As certain conditions precedent for the joint venture were not met during the course of 2001, the Company terminated the transaction and made a bad debt provision for the full deposit amount at the end of the year. The Company obtained a refund amounting to USD348 in 2003.
F-41
chinadotcom corporation
NOTES TO CONSOLIDATED FINANCIAL STATEMENTS
(Amounts in thousands, except number of shares, number of options and per share data)
| 17. | | RELATED PARTY TRANSACTIONS (continued) |
(d) Golden Tripod Limited (continued)
For the years ended December 31, 2001, 2002 and 2003, the Company paid management fees of USD261, USD293 and USD137, respectively, to Golden Tripod Limited, an entity affiliated with Xinhua News Agency, one of the Company’s major shareholders, for the provision of general management services to the Company, including the consultancy fees of Zhao Shun Ao and Li Yong Chian, Chen You Hua in the years 2001 and 2002, and Wang Xiao Hui in the year 2003.
(e) Asia Pacific Online Limited
For the year ended December 31, 2001, the Company reimbursed USD120 to Asia Pacific Online Limited, or APOL, for expenses incurred for the provision of general management services principally consisting of providing the full-time services of Mr. Peter Yip to act as the Company’s chief executive officer. In January 2002, the Company entered into a new service agreement with APOL. Under this agreement, the Company agreed to provide an annual management fee of USD0.001 and reimburse expenses incurred up to USD270 annually for the provision of general management services principally consisting of providing the full-time services of Mr. Peter Yip to act as the Company’s chief executive officer. The management service agreement was renewed in 2003 under the terms of the agreement. APOL is a Cayman Islands company that is owned 50% by the spouse of Mr. Peter Yip, who is the chief executive officer of the Company, and 50% owned by a trust set up for the benefit of Mr. Yip’s children. There are no common directors between APOL and the Company. APOL is the owner of 11,835,686 Class A common shares and has exercisable options to purchase 2,381,442 additional Class A common shares. These options include options to purchase 200,000 Class A common shares granted on June 3, 2003 at an exercise price of US$4.95 per share and 100,000 Class A common shares granted on June 14, 2003 at an exercise price of US$5.16 per share. In addition, Mr. Yip has exercisable options to purchase 190,000 Class A common shares. Mr. Yip’s spouse also owns 6,142,900 Class A common shares including 1,500,000 Class A common shares which may be acquired pursuant to a trading plan between her and Redwine & Company, Inc. dated December 19, 2003.
Mr. Yip acted as the Company’s chief executive officer in each of 2001, 2002 and 2003.
(f) New World Infrastructure
In October 2000, the Company entered into an agreement to acquire a 50.3% interest in Wealth Corporation Limited for an aggregate consideration of USD9,300 consisting of USD6,800 of the Company’s Class A common shares to purchase shares from the selling shareholders, and USD2,500 in cash to purchase newly issued shares. The selling shareholders of Wealth Corporation Ltd. included New World Infrastructure, a former shareholder of the Company which as of October 2002 held approximately 11.4% of the Company’s Class A common shares, and received approximately USD1,400 worth of the Company’s Class A common shares as consideration for its shares in Wealth Corporation Ltd. Wealth Corporation Ltd. operated a web site which sold travel products and services, such as airline tickets and hotel accommodations, to corporations and travel agencies in the PRC. The acquisition was based upon a strategy to build a Greater China online and off-line travel capability which focused on the tour-group market.
F-42
chinadotcom corporation
NOTES TO CONSOLIDATED FINANCIAL STATEMENTS
(Amounts in thousands, except number of shares, number of options and per share data)
| 17. | | RELATED PARTY TRANSACTIONS (continued) |
(f) New World Infrastructure (continued)
As a result of deteriorating financial performance at Wealth Corporation Limited through 2002, the Company de-emphasized the development of an online travel business in Greater China and sought to recover some of its original investment in the company. The Company entered into negotiations with the other shareholders in Wealth Corporation Limited, including New World Infrastructure, and in November 2002, the parties agreed to permit the Company to reduce its shareholdings to 19.9% through a share repurchase by Wealth Corporation Limited. Wealth Corporation Limited was not profitable at such time, and the shareholders agreed to value the company based upon the cash balances of the company. As a result of the consummation of the share repurchase, the Company reduced its shareholdings to 19.9% for a payment from Wealth Corporation of USD1,000.
In January 2003, New World Infrastructure ceased to be one of the Company’s shareholders following the sale of its entire shareholding in the Company in the open market, as well as in privately negotiated transactions with the Company, APOL and Dr. Raymond Ch’ien. The Class A common shares of the Company purchased from New World Infrastructure were 4,468,560 by the Company, 4,300,000 by APOL and 200,000 by Dr. Raymond Ch’ien. Accordingly, New World Infrastructure ceased to be a related party of the Company since then.
(g) AOL Time Warner Inc.
During the year ended December 31, 2001, the Company paid advertising fees totaling USD3,500 to AOL Time Warner Inc., a shareholder of the Company, for the provision of Internet advertising services to the Company. In addition, the Company paid AOL Time Warner Inc. USD3,700 for computer software from PurchasePro.com, Inc., a strategic alliance partner of AOL Time Warner Inc. In other matters involving AOL, the Company sought the return of USD2,200 spent by the Company under a software development agreement among AOL, CIC and the Company. Under the terms of the software development agreement dated February 1, 2000, the Company agreed to provide AOL with USD2,200 to finance the development of AOL software which could be utilized in the China market. The Company entered into the software development agreement in anticipation of a joint venture between AOL and the Company to develop consumer interactive services for the Chinese market. No joint venture arrangement with AOL was ever entered into, and AOL never delivered a software product to the Company. In addition, the Company sought the return of USD3,500 in connection with an agreement to purchase advertising services from AOL as well as the return of USD3,700 in connection with the PurchasePro.com, Inc. computer software for which the Company paid AOL. These amounts were expensed under selling, general and administrative expenses in March 2001.
In July 2003, the Company reached a settlement with AOL involving all claims between the two companies and their affiliates including as summarized above. The Company also agreed with AOL to cancel AOL’s two warrants as described in note 24(c) to acquire additional shares in the Company. The Company currently has no remaining operational, strategic or other agreements with AOL. According to public filings, as of September 2003, AOL disposed of its entire holding of the Company’s shares. Accordingly, AOL has ceased to be a related party of the Company.
F-43
chinadotcom corporation
NOTES TO CONSOLIDATED FINANCIAL STATEMENTS
(Amounts in thousands, except number of shares, number of options and per share data)
Under the current tax laws of the Cayman Islands, the Company and its subsidiaries are not subject to tax on income or capital gains, and no Cayman Islands withholding tax is imposed upon payments of dividends by the Company to its shareholders.
The subsidiaries in all geographical regions are governed by the respective local income tax laws with statutory tax rates ranging from 0% to 35%.
Deferred tax liabilities and assets are comprised of the following:
| | | | | | | | | |
| | | December 31, | | December 31, |
| | | 2002 | | 2003 |
| | | USD | | USD |
| Deferred tax liabilities: | | | | | | | | |
| Accelerated depreciation allowances | | | (193 | ) | | | (1,618 | ) |
| | | |
| | | |
| |
| Deferred tax assets: | | | | | | | | |
| Net operating loss carryforwards | | | 34,484 | | | | 58,353 | |
| Others | | | 5,213 | | | | 1,000 | |
| | | |
| | | |
| |
| Total deferred tax assets | | | 39,697 | | | | 59,353 | |
| Valuation allowance for deferred tax assets | | | (39,504 | ) | | | (59,048 | ) |
| | | |
| | | |
| |
| Net deferred tax assets | | | 193 | | | | 305 | |
| | | |
| | | |
| |
| Net deferred tax liabilities | | | — | | | | (1,313 | ) |
| | | |
| | | |
| |
Significant components of the provision for income taxes are as follows:
| | | | | | | | | | | | | |
| | | Year ended | | Year ended | | Year ended |
| | | December 31, | | December 31, | | December 31, |
| | | 2001 | | 2002 | | 2003 |
| | | USD | | USD | | USD |
| Current: | | | | | | | | | | | | |
| Tax expense/(benefit) allocated to net income/loss from continuing operations | | | 186 | | | | 113 | | | | (117 | ) |
| Tax expense/(benefit) allocated to net income/loss From discontinued operations | | | 175 | | | | 47 | | | | 1 | |
| | | |
| | | |
| | | |
| |
| | | | 361 | | | | 160 | | | | (116 | ) |
| Deferred | | | — | | | | — | | | | (572 | ) |
| | | |
| | | |
| | | |
| |
| Total provision for income taxes | | | 361 | | | | 160 | | | | (688 | ) |
| | | |
| | | |
| | | |
| |
F-44
chinadotcom corporation
NOTES TO CONSOLIDATED FINANCIAL STATEMENTS
(Amounts in thousands, except number of shares, number of options and per share data)
| 18. | | INCOME TAXES (continued) |
The reconciliation of income taxes computed at the respective statutory tax rates to the effective income tax provision recorded is as follows:
| | | | | | | | | | | | | |
| | | Year ended | | Year ended | | Year ended |
| | | December 31, | | December 31, | | December 31, |
| | | 2001 | | 2002 | | 2003 |
| | | USD | | USD | | USD |
| Income tax benefits/(income taxes) computed at the respective statutory rates | | | (15,702 | ) | | | 453 | | | | (3,482 | ) |
| Changes in tax rates | | | — | | | | 384 | | | | (1,181 | ) |
| Tax concession of a subsidiary of Palmweb | | | — | | | | — | | | | (2,806 | ) |
| Non-deductible items | | | 2,349 | | | | 108 | | | | 3,903 | |
| Non-taxable items | | | (3,378 | ) | | | (308 | ) | | | (1,271 | ) |
| Change in valuation allowance | | | 16,917 | | | | (524 | ) | | | 4,148 | |
| | | |
| | | |
| | | |
| |
| Total income taxes from continuing operations | | | 186 | | | | 113 | | | | (689 | ) |
| | | |
| | | |
| | | |
| |
| Total income taxes from discontinued operations | | | 175 | | | | 47 | | | | 1 | |
| | | |
| | | |
| | | |
| |
Benefits from operating losses not recorded from discontinued operations amounted to USD3,131, USD4,139 and USD177 for the years ended December 31, 2001, 2002 and 2003, respectively.
Due to its history of losses, the Company does not believe that sufficient objective, positive evidence currently exists to conclude that the recoverability of certain of its deferred tax assets is more likely than not. Consequently, the Company has provided a valuation allowance of USD58,808 and USD39,504 as of December 31, 2003 and 2002, respectively, to cover its net deferred tax assets.
At December 31, 2003, the Company had net operating loss carryforwards of approximately USD203,479 for income tax purposes that expire in years 2004 to indefinity.
NewPalm (China) Information Technology Company Limited (“NewPalm”), a subsidiary of Palmweb established in the PRC, is subject to PRC corporate income tax at a rate of 33%. Upon fulfilling certain criteria, NewPalm is entitled to certain PRC corporate income tax exemptions. During the year ended December 31, 2003, based on interim information provided to the tax authorities, NewPalm received a preliminary confirmation from the relevant tax authorities that it would be fully exempt from PRC corporate income tax for the 2003 fiscal year. Management believes the necessary criteria for tax exemption stated in the preliminary confirmation have been met for the full year of 2003 and accordingly, no provision for PRC corporate income tax has been made for the year. The tax concession was USD2,806 for the year ended December 31, 2003 and the per share effect is approximately USD0.03. Corporate income tax exemption of NewPalm for future periods is not as certain as of December 31, 2003 and the effect of the future tax exemptions will be recognized when the approval has been obtained from the relevant tax authorities.
F-45
chinadotcom corporation
NOTES TO CONSOLIDATED FINANCIAL STATEMENTS
(Amounts in thousands, except number of shares, number of options and per share data)
| 19. | | BASIC AND DILUTED EARNINGS/(LOSS) PER SHARE |
The following table sets forth the computation of basic and diluted earnings/(loss) per share:
| | | | | | | | | | | | | |
| | | Year ended | | Year ended | | Year ended |
| | | December 31, | | December 31, | | December 31, |
| | | 2001 | | 2002 | | 2003 |
| | | USD | | USD | | USD |
| Numerator for basic and diluted earnings/(loss) per share: | | | | | | | | | | | | |
| Income/(loss) from continuing operations | | | (85,528 | ) | | | (4,095 | ) | | | 16,424 | |
| Loss from discontinued operations, net of gain on disposal/dissolution | | | (38,857 | ) | | | (14,136 | ) | | | (900 | ) |
| | | |
| | | |
| | | |
| |
| Income/(loss) attributable to common shareholders | | | (124,385 | ) | | | (18,231 | ) | | | 15,524 | |
| | | |
| | | |
| | | |
| |
| | | Number | | Number | | Number |
| Denominator for basic earnings/(loss) per share: | | | | | | | | | | | | |
| Weighted average number of shares after adjusting for the Share Splits | | | 102,589,760 | | | | 102,269,735 | | | | 100,532,594 | |
| | | |
| | | |
| | | |
| |
| | | Number | | Number | | Number |
| Denominator for basic earnings/(loss) per share: | | | | | | | | | | | | |
| Weighted average number of shares after adjusting for the Share Splits | | | 102,589,760 | | | | 102,269,735 | | | | 100,532,594 | |
| Effect of dilutive securities: | | | | | | | | | | | | |
| Dilutive common shares equivalent | | | — | | | | — | | | | 2,666,827 | |
| | | |
| | | |
| | | |
| |
| Denominator for diluted earnings/(loss) per share: | | | | | | | | | | | | |
| Weighted average number of shares after adjusting for the Share Splits | | | 102,589,760 | | | | 102,269,735 | | | | 103,199,421 | |
| | | |
| | | |
| | | |
| |
| Basic earnings/(loss) per share: | | | | | | | | | | | | |
| Earnings/(loss) from continuing operations | | | (0.83 | ) | | | (0.04 | ) | | | 0.16 | |
| Loss from discontinued operations | | | (0.38 | ) | | | (0.14 | ) | | | (0.01 | ) |
| | | |
| | | |
| | | |
| |
| Earnings/(loss) attributable to common shareholders | | | (1.21 | ) | | | (0.18 | ) | | | 0.15 | |
| | | |
| | | |
| | | |
| |
| Diluted earnings/(loss) per share: | | | | | | | | | | | | |
| Earnings/(loss) from continuing operations | | | (0.83 | ) | | | (0.04 | ) | | | 0.16 | |
| Loss from discontinued operations | | | (0.38 | ) | | | (0.14 | ) | | | (0.01 | ) |
| | | |
| | | |
| | | |
| |
| Earnings/(loss) attributable to common shareholders | | | (1.21 | ) | | | (0.18 | ) | | | 0.15 | |
| | | |
| | | |
| | | |
| |
The computation of diluted earnings/(loss) per share did not assume the conversion of the warrants of the Company because their inclusion would have been antidilutive.
F-46
chinadotcom corporation
NOTES TO CONSOLIDATED FINANCIAL STATEMENTS
(Amounts in thousands, except number of shares, number of options and per share data)
| 20. | | DISCONTINUED OPERATIONS |
The Company makes monthly reviews of all business units and performs analyses on:
(i) the cashflow forecast;
(ii) profitability; and
(iii) viability of the business units.
These reviews are conducted in the context of the overall strategic direction of the Company. If a business unit is non-profitable, has negative cash flows, does not appear to have growth potential or a path to profitability, and is not strategic to the overall Company strategy, the management may decide to close it down. This is done by first notifying staff to stop all sales activities and concentrate on the collection of outstanding accounts receivable.
There are two methods of disposal of discontinued operations:
(i) sales to third parties; and
(ii) liquidation/closure of business.
During the year ended December 31, 2002, the Company discontinued the operations of certain subsidiaries in the software and consulting services and the advertising and marketing activities segments. With the adoption of SFAS 144,Accounting for the Impairment or Disposal of Long-Lived Assets, the operating results of the discontinued operating units were classified as loss from operations of discontinued subsidiaries on the consolidated statement of operations. During the year ended December 31, 2003, the Company further discontinued some of its subsidiaries to realign its operations with changes in its business model. Most of these discontinued operations were grouped in the software and consulting services and the advertising and marketing segments under the new segment classification, while the rest were included in other income.
From August to December 2002, liquidators were appointed to oversee the dissolution of the discontinued subsidiaries. The combined assets and liabilities of the discontinued subsidiaries on the respective dates of liquidation were USD2,019 and USD2,564, respectively, resulting in a net gain on dissolution of USD545, which was included in the gain on dissolution of discontinued subsidiaries for the year ended December 31, 2002.
Since January 2003, the Company has closed down certain unprofitable subsidiaries. The combined assets and liabilities of the discontinued subsidiaries on the respective dates of liquidation were USD7,266 and USD7,936, respectively, resulting in a net gain on dissolution of USD2,127, which was included in the gain on dissolution of discontinued subsidiaries for the year ended December 31, 2003.
The net loss of the subsidiaries classified as discontinued operations for the years ended December 2001, 2002 and 2003 were USD38,857, USD14,681 and USD3,027, respectively. Revenues of the discontinued operations for the years ended December 2001, 2002 and 2003 were USD34,603, USD19,104 and USD2,866, respectively. Pretax loss reported by the discontinued operations for the years ended December 2001, 2002 and 2003 were USD38,682, USD14,634 and USD3,026, respectively.
F-47
chinadotcom corporation
NOTES TO CONSOLIDATED FINANCIAL STATEMENTS
(Amounts in thousands, except number of shares, number of options and per share data)
| 21. | | FINANCIAL INSTRUMENTS |
The carrying amount of the Company’s cash and cash equivalents approximates their fair values because of the short maturity of those instruments. The carrying value of receivables, payables and short-term debt approximates their fair values due to their short maturity. The total fair values of available-for-sale equity securities in listed companies as of December 31, 2002 and 2003 were USD2,050 and USD590, respectively, based on the market values of publicly traded shares as of December 31, 2002 and 2003. The total fair values of the debt securities as of December 31, 2002 and 2003 were USD471,179 and USD313,254, respectively, based on the market values of publicly traded debt securities and the estimated fair values of unlisted debt securities, as determined by the management of the Company having regard to, inter alia, the prices of the most recent reported sales and purchases of the securities as of December 31, 2002 and 2003. The fair value of related party receivables and payables cannot be determined due to the related party nature of the accounts. The carrying amount of the Company’s long-term bank loan approximates its fair value because the interest rate of the bank loan is close to the prevailing bank interest rate.
In October 2002, the Company entered into a promissory note and warrant purchase agreement with Sagent Technology Inc. (“Sagent”), a NASDAQ listed company, whereby the Company paid USD7,000 cash to Sagent for a promissory note and 8,000,000 warrants to purchase Sagent’s common shares for investment purposes. The fair values of the promissory note and the warrants as of December 31, 2002 were USD5,325 and USD2,320, respectively. The amount of the promissory note was included in the loan receivables and the amount of the warrants was included in the other assets as disclosed in the consolidated balance sheet. The Company recognized a USD571 gain in value of the warrants, which is included in the other non-operating gains for the year ended December 31, 2002. The Company determined the estimated fair value amounts of those instruments by using available market information and commonly accepted valuation methodologies. However, considerable judgment is required in interpreting market data to develop the estimates of fair value. Accordingly, the estimates presented herein are not necessarily indicative of the amounts that the Company or holders of the instruments could realize in a current market exchange. The use of different assumptions and/or estimation methodologies may have a material effect on the estimated fair values. The promissory note was settled and the warrants were cancelled during 2003.
F-48
chinadotcom corporation
NOTES TO CONSOLIDATED FINANCIAL STATEMENTS
(Amounts in thousands, except number of shares, number of options and per share data)
| 22. | | CONCENTRATION OF RISKS |
Concentration of credit risk:
The Company is engaged in the provision of software and consulting services, mobile services and applications and advertising and marketing activities to businesses in Hong Kong, Australia, Japan, Korea, Taiwan, Mainland China, Singapore, Europe and North America.
Financial instruments that potentially subject the Company to significant concentrations of credit risk consist principally of cash and cash equivalents, investments and trade accounts receivable.
The Company maintains cash and cash equivalents and investments with various financial institutions in Hong Kong, Australia, Japan, Taiwan, Korea, Mainland China, Singapore, Europe and North America. The Company’s policy is designed to limit exposure to any one institution. The Company performs periodic evaluations of the relative credit standing of those financial institutions that are considered in the Company’s investment strategy. The Company does not require collateral on these financial instruments.
Concentration of credit risk with respect to trade accounts receivable are limited due to the large number of entities comprising the Company’s customer base. The Company generally does not require collateral for trade accounts receivable.
Concentration of business risk:
Revenue has been derived from a number of clients that use the Company’s services. The top 10 customers accounted for 9%, 14% and 28% of the Company’s revenue for the years ended December 31, 2001, 2002 and 2003, respectively.
Current vulnerability due to certain concentrations:
The Company’s operations may be adversely affected by significant political, economic and social uncertainties in the PRC. Although the PRC government has been pursuing economic reform policies for the past 20 years, no assurance can be given that the PRC government will continue to pursue such policies or that such policies may not be significantly altered, especially in the event of a change in leadership, social or political disruption or unforeseen circumstances affecting the PRC’s political, economic and social conditions. There is also no guarantee that the PRC government’s pursuit of economic reforms will be consistent or effective.
The PRC has recently enacted new laws and regulations governing Internet access and the provision of online business, economic and financial information. Current or proposed laws aimed at limiting the use of online services to transmit certain materials could, depending upon their interpretation and application, result in significant potential liability to the Company, as well as additional costs and technological challenges in order to comply with any statutory or regulatory requirements imposed by such legislation. Additional legislation and regulations that may be enacted by the PRC government could have an adverse effect on the Company’s business, financial condition and results of operations.
Some of the Company’s businesses are transacted in Renminbi (“RMB”), which is not freely convertible into foreign currencies. All foreign exchange transactions continue to take place either through the Bank of China or other banks authorized to buy and sell foreign currencies at the exchange rates quoted by the Bank of China. Approval of foreign currency payments by the Bank of China or other institutions requires submitting a payment application form together with suppliers’ invoices, shipping documents and signed contracts.
F-49
chinadotcom corporation
NOTES TO CONSOLIDATED FINANCIAL STATEMENTS
(Amounts in thousands, except number of shares, number of options and per share data)
Pursuant to the Articles of Association of the Company, each Class A common share is entitled to one vote on all matters upon which the Class A common share is entitled to vote. The Board of Directors has the authority, without further action by the shareholders, to issue up to five million preferred shares in one or more series and to fix the designations, powers, preference, privileges and relative participatory, optional or special rights and the qualifications, limitation or restrictions thereof, including dividend rights, conversion rights, voting rights, terms of redemption and liquidation preferences, any or all of which may be greater than the rights of common shares. No preferred shares have been issued.
During the year ended December 31, 2001, 91,426 Class A common shares were issued at prices ranging from USD1.75 to USD6.8125 per share from the exercise of stock options granted to employees.
During the year ended December 31, 2001, 521,589 Class A common shares were issued at a price of USD5.8125 per share as settlement of promissory notes and 273,198 Class A common shares were issued at a price of USD16.3516 per share as settlement of other payables. In addition, 23,084 Class A common shares were redeemed and retired at a price of USD2.35 per share arising from the disposal of an equity investee. The redemption premium was deducted from the additional paid-in capital.
During the year ended December 31, 2002, 296,492 Class A common shares were issued at prices ranging from USD2.03 to USD2.5266 per share from the exercise of stock options granted to employees.
During the year ended December 31, 2002, 1,764,555 Class A common shares were repurchased at prices ranging from USD1.92 to USD3.24 per share. 1,692,001 of the repurchased Class A common shares were retired at prices ranging from USD2.334 to USD2.826 per share. The redemption premium was deducted from the additional paid-in capital.
During the year ended December 31, 2003, 2,591,646 Class A common shares were issued at prices ranging from USD1.89 to USD9.00 per share from the exercise of stock options granted to employees.
During the year ended December 31, 2003, 4,468,560 Class A common shares were repurchased at USD2.50 per share. 2,300,000 of the repurchased Class A common shares were retired at USD2.50 per share. The redemption premium was deducted from the additional paid-in capital.
F-50
chinadotcom corporation
NOTES TO CONSOLIDATED FINANCIAL STATEMENTS
(Amounts in thousands, except number of shares, number of options and per share data)
| 24. | | STOCK-BASED COMPENSATION AND WARRANTS |
(a) Stock options
The Company applies APB 25 in accounting for stock options granted to employees. Accordingly, the compensation expense is recorded for the difference between the fair value of shares at date of grant and the exercise price of the stock option.
Pursuant to the 1999 Stock Option Plan (the “Plan”), options may be granted to employees of and consultants and advisors to the Company and its subsidiaries for the purchase of up to an aggregate of 12 million class A common shares. During 2000, options for the purchase of an additional 8 million class A common shares were made available, which increased the options available for grant to employees of and consultants and advisors to the Company and its subsidiaries for the purchase of class A common shares to 20 million. The Plan is administered by a committee of the Board of Directors, which will determine, at its discretion, the number of shares subject to each option granted and the related exercise price and option period. Incentive stock options, as defined by the U.S. Internal Revenue Code of 1986, as amended, and non-qualified stock options may be granted under the Plan.
A summary of the Company’s stock option activities and related information for the years ended December 31, 2002 and 2003 is as follows:
| | | | | | | | | | | | | | | | | | | | | | | | | |
| | | 2002
| | 2003
|
| | | | | | | | | | | Weighted- | | | | | | | | | | Weighted- |
| | | | | | | | | | | average | | | | | | | | | | average |
| | | Available | | Options | | exercise | | Available | | Options | | exercise |
| | | for grant
| | outstanding
| | price
| | for grant
| | outstanding
| | price
|
| | | (Number) | | (Number) | | USD | | (Number) | | (Number) | | USD |
| Outstanding at the beginning of the year | | | 6,998,268 | | | | 14,065,911 | | | | 6.66 | | | | 9,432,844 | | | | 11,334,843 | | | | 5.94 | |
| Granted | | | (1,648,960 | ) | | | 1,648,960 | | | | 2.44 | | | | (2,217,343 | ) | | | 2,217,343 | | | | 5.40 | |
| Forfeited | | | 4,083,536 | | | | (4,083,536 | ) | | | 7.27 | | | | 2,832,962 | | | | (2,832,962 | ) | | | 7.89 | |
| Exercised | | | — | | | | (296,492 | ) | | | 2.42 | | | | — | | | | (2,591,646 | ) | | | 3.32 | |
| | | |
| | | |
| | | | | | | |
| | | |
| | | | | |
| Outstanding at the end of the year | | | 9,432,844 | | | | 11,334,843 | | | | 5.94 | | | | 10,048,463 | | | | 8,127,578 | | | | 5.94 | |
| | | |
| | | |
| | | | | | | |
| | | |
| | | | | |
| Exercisable at the end of the year | | | | | | | 7,686,104 | | | | | | | | | | | | 5,648,618 | | | | | |
| | | | | | | |
| | | | | | | | | | | |
| | | | | |
| Weighted-average fair value of options granted during the year | | | | | | | 2.00 | | | | | | | | | | | | 4.23 | | | | | |
| | | | | | | |
| | | | | | | | | | | |
| | | | | |
As of December 31, 2003, the Company’s outstanding stock options are exercisable at exercise prices ranging from USD1.89 to USD67.125 per share (inclusive).
F-51
chinadotcom corporation
NOTES TO CONSOLIDATED FINANCIAL STATEMENTS
(Amounts in thousands, except number of shares, number of options and per share data)
| 24. | | STOCK-BASED COMPENSATION AND WARRANTS (continued) |
(a) Stock options (continued)
The following table summarizes information concerning outstanding and exercisable options at December 31, 2003.
| | | | | | | | | | | | | | | | | | | | | |
| | | | | | | Options outstanding
| | Options exercisable
|
| | | | | | | Weighted- | | Weighted- | | | | | | Weighted |
| | | | | | | average | | average | | | | | | average |
| | | | | | | remaining | | exercise | | | | | | exercise |
| Exercise | | Numbers | | contractual | | price | | Numbers | | price |
| price range | | outstanding | | life (in years) | | per share | | exercisable | | per share |
| USD | | | | | | USD | | | | USD |
| 1.89-2.78 | | | 1,419,424 | | | | 8.04 | | | | 2.38 | | | | 926,488 | | | | 2.46 | |
| 2.8-3.375 | | | 1,338,977 | | | | 6.95 | | | | 3.11 | | | | 1,153,521 | | | | 3.13 | |
| 3.504-5 | | | 2,260,787 | | | | 6.08 | | | | 4.96 | | | | 2,174,173 | | | | 4.96 | |
| 5.01-9.76 | | | 2,433,271 | | | | 8.68 | | | | 6.03 | | | | 765,141 | | | | 6.64 | |
| 10.1875-19.125 | | | 399,559 | | | | 5.00 | | | | 14.29 | | | | 363,882 | | | | 14.21 | |
| 21.62-29.9218 | | | 179,760 | | | | 6.40 | | | | 24.43 | | | | 177,068 | | | | 24.42 | |
| 32.125-48.405 | | | 64,080 | | | | 6.15 | | | | 44.92 | | | | 59,484 | | | | 45.03 | |
| 51.875-67.125 | | | 31,720 | | | | 6.25 | | | | 60.04 | | | | 28,861 | | | | 60.08 | |
| | | |
| | | | | | | | | | | |
| | | | | |
| | | | 8,127,578 | | | | | | | | | | | | 5,648,618 | | | | | |
| | | |
| | | | | | | | | | | |
| | | | | |
Pursuant to resolutions adopted by the Board of Directors in December 2000, the vesting of certain of the Company’s options was accelerated such that vesting would be changed from an annual basis to a quarterly basis upon the lapse of 12 months from the date of grant. Based on the historical and expected employee turnover and the expected market price of the Class A common shares, the Company estimated that the number of options the employees will ultimately retain that would have been otherwise forfeited was minimal for the years ended December 31, 2001, 2002 and 2003.
For the year ended December 31, 2001, a total stock compensation expense of USD1,227 was recognized in the financial statements. For the purpose of determining the fair value of the options under SFAS 123 for 2001 as set out in note 4(n), the Company used the Black-Scholes option pricing model based on the United States risk-free interest rates ranging from 3.91% to 6.69%, a weighted-average expected life of the option of five years, assuming volatility factors of the expected market price of the Company’s common shares ranging from 38% to 167% and no dividend yield.
For the year ended December 31, 2002, a total stock compensation expense of USD309 was recognized in the financial statements. For the purpose of determining the fair value of the options under SFAS 123 for 2002 as set out in note 4(n), the Company used the Black-Scholes option pricing model based on the United States risk-free interest rates ranging from 2.65% to 6.69%, a weighted-average expected life of the option of five years, assuming volatility factors of the expected market price of the Company’s common shares ranging from 38% to 167% and no dividend yield.
F-52
chinadotcom corporation
NOTES TO CONSOLIDATED FINANCIAL STATEMENTS
(Amounts in thousands, except number of shares, number of options and per share data)
| 24. | | STOCK-BASED COMPENSATION AND WARRANTS (continued) |
(a) Stock options (continued)
For the year ended December 31, 2003, a total stock compensation expense of USD328 was recognized in the financial statements. For the purpose of determining the fair value of the options under SFAS 123 for 2003 as set out in note 4(n), the Company used the Black-Scholes option pricing model based on the United States risk-free interest rates ranging from 2.08% to 6.69%, a weighted-average expected life of the option of 5 years, assuming volatility factors of the expected market price of the Company’s common share ranging from 38% to 167% and no dividend yield.
In 2001, 95,369 stock options were settled by USD1,383 discretionary cash settlements to the shareholders.
In January 2002, the Company granted to APOL additional stock options to purchase up to 200,000 Class A common shares of the Company with an exercise price of USD2.82 per share and a quarterly vesting schedule over the one-year term of the new services agreement and the right to accelerate existing share options upon a change of control of the Company.
In January 2003, the Company renewed the management services agreement with APOL under the terms of the agreement. In addition, the Company granted to APOL additional stock options to purchase up to 200,000 Class A common shares as of June 3, 2003 with an exercise price of USD4.95 per share, and further stock options to purchase up to 100,000 Class A common shares as of June 16, 2003, with an exercise price of USD5.16 per share. Both grants had a quarterly vesting schedule over the one-year term of the new services agreement and the right to accelerate existing share options upon a change of control of the Company.
(b) 2000 and 2001 Employee Share Purchase Plan
During each of 2000 and 2001, the Company established and implemented an employee share purchase plan, which was qualified as a non-compensatory plan under Section 423 of the U.S. Internal Revenue Code. The plan allows qualified employees to purchase the Company’s Class A common shares during the relevant six-month plan period. Qualifying employees are allowed to purchase up to 500 Class A common shares for each plan period. The maximum number of Class A common shares, par value USD0.00025 per share, issuable under the plan is 500,000, and a maximum of 100,000 shares will be available for issuance for each plan period.
F-53
chinadotcom corporation
NOTES TO CONSOLIDATED FINANCIAL STATEMENTS
(Amounts in thousands, except number of shares, number of options and per share data)
| 24. | | STOCK-BASED COMPENSATION AND WARRANTS (continued) |
(c) Warrants
In connection with the private placement of 6,795,200 Class A common shares of the Company issued to AOL on June 8, 1999, warrants were granted to AOL to purchase, subject to certain conditions, up to 18.5% and 6.5% of the Company’s total outstanding capital at an exercise price of USD5.00 per share and USD42.50 per share, respectively. No such warrants were exercised and both warrants were cancelled in July 2003.
In May 2000, GE Capital Equity Investments Ltd., (“GE”), was granted a warrant under which GE will be entitled to purchase a number of Class A common shares of the Company determined according to the Company’s revenue from services provided to affiliates of General Electric Capital Corporation during 2000 and 2001. The warrants were exercisable during the period between January 5, 2002 and January 4, 2003 at an exercise price of USD39.50 per share. No such warrants were exercised and the warrants expired in January 2003.
In connection with our acquisition of all the issued and outstanding shares of Pacific Connections Limited (“PCL”), a wholly-owned subsidiary of the Company, the Company granted the initial shareholders of PCL an option to acquire 240,000 additional Class A common shares at an exercise price of USD9.00 per share. During the year ended December 31, 2003, 140,000 of these options had been exercised and the remaining options expired in August 2003.
All warrants may not be sold, transferred, assigned, or hypothecated to any person, other than to any limited partnership with the same general partner, or to any company that directly, or indirectly, controls or is controlled by or is under common control with the holder of the warrants, without the prior consent of the Company.
| 25. | | EMPLOYEE BENEFIT PLANS |
IMI, a newly acquired subsidiary of the Company, provides retirement benefits for substantially all employees in the United States and in foreign locations. In the United States, the United Kingdom and the Netherlands, IMI sponsors defined contribution plans. In addition, IMI’s Swedish subsidiary (“IMAB”) has a supplemental defined contribution plan for certain key management employees. Contributions by IMI relating to its defined contribution plans for the post-acquisition period ended December 31, 2003 were USD1,004.
IMAB also participates in several pension plans (non-contributory for employees) which cover substantially all employees of its Swedish operations. The plans are in accordance with a nationally-agreed standard plan, the ITP Plan, and administered by a national organization, Pensionsregisteringsinstitutet (“PRI”). The level of benefits and actuarial assumptions are calculated and established by the national organization and, accordingly, IMAB may not change benefit levels or actuarial assumptions. The Company accounts for pensions in accordance with SFAS 87,Employers’ Accounting for Pensions. IMAB is financing these plans via premiums paid to Alecta, the Swedish National Pension Organization. The pension book reserve will, in the future, only increase with an interest component.
F-54
chinadotcom corporation
NOTES TO CONSOLIDATED FINANCIAL STATEMENTS
(Amounts in thousands, except number of shares, number of options and per share data)
| 25. | | EMPLOYEE BENEFIT PLANS (continued) |
The net periodic benefit cost for IMAB’s defined benefit retirement plan in Sweden includes the following components:
| | | | | |
| | | Post-acquisition |
| | | period ended |
| | | December 31, |
| | | 2003 |
| | | USD |
| Service cost | | | — | |
| Interest cost | | | 61 | |
| | | |
| |
| Net periodic benefit cost | | | 61 | |
| | | |
| |
The following table sets forth the change in the benefit obligation for IMAB’s defined benefit plan in Sweden:
| | | | | |
| | | Post-acquisition |
| | | period ended |
| | | December 31, |
| | | 2003 |
| | | USD |
| Change in benefit obligations | | | | |
| Benefit obligation at date of acquisition | | | 3,608 | |
| Service cost | | | — | |
| Interest cost | | | 61 | |
| Actuarial gains | | | (286 | ) |
| Settlements | | | (895 | ) |
| Effect of foreign currency exchange rate changes | | | 582 | |
| | | |
| |
| Benefit obligation at December 31, 2003 | | | 3,070 | |
| | | |
| |
The following table shows the plans’ funded status and amounts recognized in the consolidated balance sheet:
Actuarial present value of benefit obligation as of December 31, 2003
| | | | | |
| | | USD |
| Unfunded status | | | 3,070 | |
| Out of which long-term liability | | | 2,272 | |
| Out of which short-term liability | | | 798 | |
The following assumptions were used to determine the IMAB’s obligation under the Swedish plan:
| | | | | |
| Discount rate | | | 5.30 | % |
| Rate of increase in salaries | | | 3.00 | % |
| Inflation rate | | | 2.00 | % |
F-55
chinadotcom corporation
NOTES TO CONSOLIDATED FINANCIAL STATEMENTS
(Amounts in thousands, except number of shares, number of options and per share data)
| 26. | | CONTINGENCIES AND COMMITMENTS |
Operating lease commitments
As of December 31, 2003, the Company had future minimum office rental and telephone line lease payments under non-cancelable operating leases as follows:
| | | | | |
| Year ended December 31: | | USD |
| 2004 | | | 5,527 | |
| 2005 | | | 2,724 | |
| 2006 | | | 1,788 | |
| 2007 | | | 1,344 | |
| 2008 | | | 722 | |
| Thereafter | | | 3,507 | |
| | | |
| |
| | | | 15,612 | |
| | | |
| |
Class action lawsuit against the Company
A class action lawsuit was filed in the United States District Court, Southern District of New York on behalf of purchasers of the securities of the Company, between July 12, 1999 and December 6, 2000, inclusive. The complaint charges defendants the Company, Lehman Brothers, Inc. (“Lehman Brothers”), Bear, Stearns & Co., Inc. (“Bear Stearns”), BancBoston Robertson Stephens (“Robertson Stephens”), Merrill Lynch, Pierce Fenner & Smith Inc. (“Merrill Lynch”), Raymond Ch’ien, Peter Yip, Zhou Shun Ao, and David Kim with violations of Sections 11, 12(a) (2) and 15 of the Securities Act of 1933 and Section 10(b) of the Securities Exchange Act of 1934 and Rule 10b-5 promulgated thereunder.
On July 12, 1999, the Company commenced an initial public offering of 4,200 of its shares of common stock at an offering price of USD20.00 per share, not taking into account two separate 1:2 stock splits, (the “chinadotcom IPO”). In connection therewith, the Company filed a registration statement, which incorporated a prospectus (the “Prospectus”), with the Securities and Exchange Commission. The complaint further alleges that the Prospectus was materially false and misleading because it failed to disclose, among other things, that (i) the Underwriter Defendants (Lehman Brothers, Bear Stearns, Robertson Stephens and Merrill Lynch) had solicited and received excessive and undisclosed commissions from certain investors in exchange for which the Underwriter Defendants allocated to those investors material portions of the restricted number of the Company’s shares issued in connection with the chinadotcom IPO; and (ii) the Underwriter Defendants had entered into agreements with customers whereby the Underwriter Defendants agreed to allocate the Company’s shares to those customers in the chinadotcom IPO in exchange for which the customers agreed to purchase the Company’s additional shares in the aftermarket at pre-determined prices.
F-56
chinadotcom corporation
NOTES TO CONSOLIDATED FINANCIAL STATEMENTS
(Amounts in thousands, except number of shares, number of options and per share data)
| 26. | | CONTINGENCIES AND COMMITMENTS (continued) |
Class action lawsuit against the Company (continued)
In June 2003, the plaintiffs announced a proposed settlement with the Company and other issuer defendants. The proposed settlement provides that the insurers of all settling issuers will guarantee that the plaintiffs recover USD1,000,000 from non-settling defendants, including the investment banks that acted as underwriters in those offerings. In the event that the plaintiffs do not recover USD1,000,000, the insurers for the settling issuers will make up the difference. Under the proposed settlement, the maximum amount that could be charged to the Company’s insurance policy in the event that the plaintiffs recovered nothing from the investment banks would be approximately USD3,900. The Company believes that the insurance coverage is sufficient to cover the maximum amount that the Company may be responsible for under the proposed settlement. The independent members of the board of directors of the Company approved the proposed settlement at a meeting held in June 2003. It is possible, however, that the parties may not reach agreement on the final settlement documents or that the United States Federal District Court may not approve the settlement in whole or in part, in which event litigation could continue, and the Company could be liable for significant judgment awards against the Company if a final judgment is rendered against the Company. No provision has been made for any expenses that might arise as a result of the class action lawsuit.
The class action lawsuit against each of Raymond Ch’ien, Peter Yip, Zhou Shun Ao, and David Kim has been dismissed. The management of the Company considers the outcome of any judgment on the lawsuit with respect to the Company to be quite uncertain and any expenditure from the lawsuit is not estimable. Consequently, no provision has been made for any expenses that may arise from the class action lawsuit.
24/7 Real Media, Inc. (“24/7”)
In February 2003, 24/7 filed suit against the Company in the Federal District Court in New York to enforce obligations allegedly owed under the Media Asia Agreement as mentioned in note 17(a). The Company contested these allegations and, in May 2003, obtained an order staying the lawsuit in New York and compelling arbitration of the claims at the International Chamber of Commerce, or the ICC. In July 2003, the Company filed its own request for arbitration with the ICC seeking damages in excess of USD24,000 for the breach of the Media Asia Agreement. In October 2003, 24/7 filed an answer and counterclaim seeking USD2,600 being damages for, among other things, services allegedly unpaid under the same agreement. In December 2003, the Company filed a reply to answer and counterclaims denying these allegations. The arbitration is at an early stage and the arbitration panel is yet to be fully constituted.
Based on the claims made by 24/7, the Company has made certain provisions for potential payables to 24/7 which in management’s view is sufficient based on their assessment of the case.
Others
In addition, the Company is a defendant in various matters of litigation generally arising out of the normal course of business. Although it is difficult to predict the ultimate outcome of these cases, management believes, based on discussions with the legal counsel, that any ultimate liability would not materially affect the Company’s financial position, results of operations or cash flows.
F-57
chinadotcom corporation
NOTES TO CONSOLIDATED FINANCIAL STATEMENTS
(Amounts in thousands, except number of shares, number of options and per share data)
| 27. | | SEGMENTAL INFORMATION |
Description of Products and Services by Segment
The Company has three reportable segments: software and consulting services, mobile services and applications, and advertising and marketing activities. The Company’s software and consulting services segment mainly represents the sale of software products, outsourcing of IT professionals, systems integration, professional consulting, web site design, and the provision of development and integration services. The Company’s mobile services and applications segment is primarily engaged in the provision of mobile services and applications in the PRC. The Company’s advertising and marketing activities segment primarily includes database marketing, online advertising sales and travel related publishing and exhibition organizing activities.
Measurement of Segment Profit or Loss and Segment Assets
The Company evaluates performance and allocates resources based on revenues and income/loss before income taxes. Revenues and income/loss before income taxes for the three reportable segments are reported separately for internal purposes, but selling, general and administrative expenses, other operating expenses, net loss and assets and liabilities are not reported separately for each segment because this information is not produced internally. The accounting policies of the reportable segments are the same as those described in the summary of significant accounting policies.
Factors Management Used to Identify the Enterprise’s Reportable Segments
The Company’s reportable segments are business units that offer different services. The reportable segments are each managed separately. Revenue from segments in the other income category is mainly attributable to publishing and event organizing services. No single component within the revenue segments has ever met the quantitative thresholds for determining reportable segments.
(i) Segmental information by business segment:
| | | | | | | | | | | | | |
| | | Year ended | | Year ended | | Year ended |
| | | December 31, | | December 31, | | December 31, |
| | | 2001 | | 2002 | | 2003 |
| | | USD | | USD | | USD |
| Segment revenues: | | | | | | | | | | | | |
| Software and consulting services | | | 16,643 | | | | 15,505 | | | | 50,699 | |
| Mobile services and applications | | | — | | | | — | | | | 16,876 | |
| Advertising and marketing activities | | | 18,087 | | | | 26,682 | | | | 19,558 | |
| Other income | | | 4,507 | | | | 1,821 | | | | 2,299 | |
| | | |
| | | |
| | | |
| |
| Total consolidated revenues | | | 39,237 | | | | 44,008 | | | | 89,432 | |
| | | |
| | | |
| | | |
| |
F-58
chinadotcom corporation
NOTES TO CONSOLIDATED FINANCIAL STATEMENTS
(Amounts in thousands, except number of shares, number of options and per share data)
| 27. | | SEGMENTAL INFORMATION (continued) |
(i) Segmental information by business segment (continued):
| | | | | | | | | | | | | |
| | | Year ended | | Year ended | | Year ended |
| | | December 31, | | December 31, | | December 31, |
| | | 2001 | | 2002 | | 2003 |
| | | USD | | USD | | USD |
| Segment income/(loss) before income taxes: | | | | | | | | | | | | |
| Software and consulting services | | | (39,921 | ) | | | (2,937 | ) | | | 175 | |
| Mobile services and applications | | | — | | | | — | | | | 10,098 | |
| Advertising and marketing activities | | | (24,420 | ) | | | (8,384 | ) | | | 105 | |
| Other income | | | (10,674 | ) | | | (2,124 | ) | | | (1,371 | ) |
| | | |
| | | |
| | | |
| |
| Total segment income: | | | (75,015 | ) | | | (13,445 | ) | | | 9,007 | |
| Reconciling item: | | | | | | | | | | | | |
| Corporate | | | (25,573 | ) | | | (7,357 | ) | | | (9,199 | ) |
| | | |
| | | |
| | | |
| |
| Total segment income before income taxes: | | | (100,588 | ) | | | (20,802 | ) | | | (192 | ) |
| Reconciling items: | | | | | | | | | | | | |
| Interest income | | | 26,689 | | | | 23,713 | | | | 13,440 | |
| Interest expenses | | | (1,272 | ) | | | (2,463 | ) | | | (1,070 | ) |
| Loss arising from share issuance of a subsidiary | | | (55 | ) | | | — | | | | — | |
| Gain/(loss) on disposal of available-for-sale securities | | | 4,411 | | | | (163 | ) | | | 4,599 | |
| Gain/(loss) on disposal of subsidiaries and cost investments | | | (1,915 | ) | | | (66 | ) | | | 469 | |
| Other non-operating gains | | | — | | | | 508 | | | | 961 | |
| Other non-operating losses | | | (922 | ) | | | (288 | ) | | | (153 | ) |
| Impairment of cost investments and available-for-sale securities | | | (12,260 | ) | | | (5,351 | ) | | | — | |
| Share of income/(losses) in equity investees | | | (2,592 | ) | | | 682 | | | | (115 | ) |
| | | |
| | | |
| | | |
| |
| Total consolidated income/(loss) before income tax | | | (88,504 | ) | | | (4,230 | ) | | | 17,939 | |
| | | |
| | | |
| | | |
| |
| Segment depreciation and amortization expenses: | | | | | | | | | | | | |
| Software and consulting services | | | 1,558 | | | | 1,182 | | | | 2,289 | |
| Mobile services and applications | | | — | | | | — | | | | 1,056 | |
| Advertising and marketing activities | | | 5,368 | | | | 5,873 | | | | 2,686 | |
| Other income | | | 8,279 | | | | 1,732 | | | | 768 | |
| | | |
| | | |
| | | |
| |
| | | | 15,205 | | | | 8,787 | | | | 6,799 | |
| Corporate | | | 3,975 | | | | 1,095 | | | | 383 | |
| | | |
| | | |
| | | |
| |
| Total consolidated depreciation and amortization expenses | | | 19,180 | | | | 9,882 | | | | 7,182 | |
| | | |
| | | |
| | | |
| |
F-59
chinadotcom corporation
NOTES TO CONSOLIDATED FINANCIAL STATEMENTS
(Amounts in thousands, except number of shares, number of options and per share data)
| 27. | | SEGMENTAL INFORMATION (continued) |
(i) Segmental information by business segment (continued):
| | | | | | | | | |
| | | December 31, | | December 31, |
| | | 2002 | | 2003 |
| | | USD | | USD |
| Segment assets: | | | | | | | | |
| Software and consulting services | | | 31,147 | | | | 108,330 | |
| Mobile services and applications | | | — | | | | 66,908 | |
| Advertising and marketing activities | | | 39,123 | | | | 21,174 | |
| Other income | | | 21,964 | | | | 10,425 | |
| | | |
| | | |
| |
| | | | 92,234 | | | | 206,837 | |
| Corporate | | | 488,723 | | | | 339,217 | |
| | | |
| | | |
| |
| Total consolidated assets | | | 580,957 | | | | 546,054 | |
| | | |
| | | |
| |
(ii) Segmental information by geographical segment:
| | | | | | | | | | | | | |
| | | Year ended | | Year ended | | Year ended |
| | | December 31, | | December 31, | | December 31, |
| | | 2001 | | 2002 | | 2003 |
| | | USD | | USD | | USD |
| Segment revenues: | | | | | | | | | | | | |
| Australia | | | 1,711 | | | | 3,003 | | | | 26,818 | |
| Greater China | | | 10,218 | | | | 9,102 | | | | 25,334 | |
| North Asia | | | 10,090 | | | | 19,622 | | | | 12,364 | |
| South Asia | | | 8,775 | | | | 5,468 | | | | 5,867 | |
| Europe | | | 2,911 | | | | 1,750 | | | | 10,149 | |
| North America | | | 5,532 | | | | 5,063 | | | | 8,900 | |
| | | |
| | | |
| | | |
| |
| Total consolidated revenues | | | 39,237 | | | | 44,008 | | | | 89,432 | |
| | | |
| | | |
| | | |
| |
Revenues are attributed to countries based on the location of customers.
F-60
chinadotcom corporation
NOTES TO CONSOLIDATED FINANCIAL STATEMENTS
(Amounts in thousands, except number of shares, number of options and per share data)
| 27. | | SEGMENTAL INFORMATION (continued) |
(ii) Segmental information by geographical segment (continued):
| | | | | | | | | | | | | |
| | | Year ended | | Year ended | | Year ended |
| | | December 31, | | December 31, | | December 31, |
| | | 2001 | | 2002 | | 2003 |
| | | USD | | USD | | USD |
| Segment income/(loss) before income taxes: | | | | | | | | | | | | |
| Australia | | | (1,173 | ) | | | (327 | ) | | | 1,409 | |
| Greater China | | | (92,988 | ) | | | (17,726 | ) | | | (761 | ) |
| North Asia | | | (514 | ) | | | (464 | ) | | | (117 | ) |
| South Asia | | | (1,119 | ) | | | (855 | ) | | | (468 | ) |
| Europe | | | (1,000 | ) | | | (487 | ) | | | 165 | |
| North America | | | (3,794 | ) | | | (943 | ) | | | (420 | ) |
| | | |
| | | |
| | | |
| |
| Total segment income before income taxes | | | (100,588 | ) | | | (20,802 | ) | | | (192 | ) |
| Reconciling items: | | | | | | | | | | | | |
| Interest income | | | 26,689 | | | | 23,713 | | | | 13,440 | |
| Interest expenses | | | (1,272 | ) | | | (2,463 | ) | | | (1,070 | ) |
| Loss arising from share issuance of a subsidiary | | | (55 | ) | | | — | | | | — | |
| Gain/(loss) on disposal of available-for-sale securities | | | 4,411 | | | | (163 | ) | | | 4,599 | |
| Gain/(loss) on disposal of subsidiaries and cost investments | | | (1,915 | ) | | | (66 | ) | | | 469 | |
| Other non-operating gains | | | — | | | | 508 | | | | 961 | |
| Other non-operating losses | | | (922 | ) | | | (288 | ) | | | (153 | ) |
| Impairment of cost investments and available-for-sale securities | | | (12,260 | ) | | | (5,351 | ) | | | — | |
| Share of income/(losses) in equity investees | | | (2,592 | ) | | | 682 | | | | (115 | ) |
| | | |
| | | |
| | | |
| |
| Total consolidated income/(loss) before income tax | | | (88,504 | ) | | | (4,230 | ) | | | 17,939 | |
| | | |
| | | |
| | | |
| |
| | | | | | | | | |
| | | December 31, | | December 31, |
| | | 2002 | | 2003 |
| | | USD | | USD |
| Segment long-lived assets: | | | | | | | | |
| Australia | | | 339 | | | | 1,223 | |
| Greater China | | | 5,140 | | | | 1,486 | |
| North Asia | | | 235 | | | | 49 | |
| South Asia | | | 789 | | | | 152 | |
| Europe | | | 2,738 | | | | 2,823 | |
| North America | | | 134 | | | | 1,477 | |
| | | |
| | | |
| |
| Total consolidated long-lived assets | | | 9,375 | | | | 7,210 | |
| | | |
| | | |
| |
F-61
chinadotcom corporation
NOTES TO CONSOLIDATED FINANCIAL STATEMENTS
(Amounts in thousands, except number of shares, number of options and per share data)
Pursuant to a definitive agreement entered into on September 4, 2003, as amended (the “Ross Agreement”), between Ross Systems Inc. (“Ross”) (NASDAQ: ROSS), the Company and a subsidiary of the Company, the Company proposes to acquire Ross for a total consideration of approximately USD68,115. Under the Ross Agreement, stockholders of Ross have the option to receive either:
| | - | | USD17.00 in cash, or |
| |
| | - | | USD19.00 in a combination of cash and the Company’s common shares |
for each share of Ross’s common stock.
As a result of the amended merger agreement, at the closing of the merger, Ross’s stockholders will receive, for each share of Ross’s common stock, USD5.00 in cash and a number of the Company’s common shares equal to USD14.00 divided by the average closing price of the Company’s common shares for the 10 trading days preceding the second trading day before the closing date. Moreover, if the average price of the Company’s common shares is below USD8.50 per share, the amended merger agreement permits the Company to elect to increase the amount of cash that Ross’s common stockholders will receive. In such case, Ross’s common stockholders still would receive USD19.00 in a combination of cash and the Company’s common shares for each share of Ross’s common stock, but would receive more than USD5.00 in cash per share and less than USD14.00 worth of the Company’s shares for each Ross’s common shares.
On December 8, 2003, the Company signed a definitive agreement to acquire 100% of the outstanding shares of Pivotal Corporation (“Pivotal”) (NASDAQ: PVTL and TSX: PVT) by way of either an all-cash or a cash-and-share transaction. Subsequent to the balance sheet date, on February 25, 2004, the acquisition of Pivotal was completed for a total consideration of approximately USD60,000, which comprised (i) cash of USD35,925, (ii) 1,846,429 of the Company’s Class A common shares, which would result in an approximate 2% increase in the Company’s common shares outstanding, (iii) the assumption of Pivotal stock options of USD481, and (iv) estimated transaction costs of approximately USD550. The Company is in the process of assessing the allocation of the purchase price for Pivotal.
In February 2004, CDC Mobile entered into a Senior Secured Convertible Loan Agreement with Equity Pacific Limited (“EPL”), whereby CDC Mobile agreed to make available to EPL a loan, which is convertible into shares of EPL up to USD3,200. The loan shall be secured by the pledge to CDC Mobile of over 50% of all the shares of each of EPL and Beijing 17 game Network Technology Co. Ltd. In addition, CDC Mobile entered into an Option Agreement with the ultimate beneficiary owners of EPL, whereby CDC Mobile was granted a call option to progressively acquire some or all of the shares of EPL, and the ultimate beneficiary owners of EPL were also granted an option to sell to CDC Mobile the shares of EPL, subject to the terms and conditions of the Option Agreement.
F-62
chinadotcom corporation
NOTES TO CONSOLIDATED FINANCIAL STATEMENTS
(Amounts in thousands, except number of shares, number of options and per share data)
| 28. | | SUBSEQUENT EVENTS (continued) |
In February 2004, CDC International Mobile Limited, a wholly-owned subsidiary of CDC Mobile, signed an agreement to acquire a 100% interest in Group Team Investments Limited (“GTI”), a company incorporated in the British Virgin Islands, subject to customary closing conditions. Pursuant to the corresponding sales and purchase agreement, the total purchase price is subject to certain earnout provisions, whereby a portion of the purchase price is based on the future earnings of GTI and certain entities, which are beneficially owned by GTI and are engaged in the provision of valued-added mobile services to mobile phone subscribers in Mainland China, for the years ending 31 December 2004 and 2005, and is subject to a maximum limit of USD60,000.
In connection with the acquisition, the Company made an initial payment of USD9,600 in April 2004, with remaining consideration, not to exceed USD50,400 to be paid in two instalments in early 2005 and 2006.
F-63
INDEX TO EXHIBITS
| | | |
No.
| | Description
|
| 1.1 | | Conformed copy of the Amended and Restated Memorandum of Association.******* |
| | | |
| 1.2 | | Conformed copy of the Amended and Restated Articles of Association.******* |
| | | |
| 2(a).1 | | 1999 Employee Stock Option Plan, as amended.* |
| | | |
| 2(a).2 | | 2000 Employee Share Purchase Plan.** |
| | | |
| 2(a).3 | | 2001 Employee Share Purchase Plan.***** |
| | | |
| 4.(a).1 | | Amended and Restated Support Services Agreement dated April 1, 2000 by and between China Internet Corporation Limited and chinadotcom corporation.**** |
| | | |
| 4.(a).2 | | Agreement dated March 12, 2001 by and between China Internet Corporation Limited and chinadotcom corporation. **** |
| | | |
| 4.(a).3 | | Agreement dated March 13, 2001 by and between China Internet Corporation Limited and chinadotcom corporation. **** |
| | | |
| 4.(a).4 | | Guarantee Agreement dated April 4, 2001 by chinadotcom corporation in favor of hongkong.com Limited. **** |
| | | |
| 4.(a).5 | | Asset Purchase Agreement dated October 24, 2001 between China Internet Corporation Limited and chinadotcom Strategic, Inc.****** |
| | | |
| 4.(a).6 | | Share Purchase Agreement by and among CDC Australia Limited, Praxa Limited, Mantech International Corporation and Mantech Australia International Inc. dated December 31, 2002. |
| | | |
| 4.(a).7 | | Share Purchase Agreement by and between CDC Mobile Media Corporation, hongkong.com Corporation and Palmweb Inc., dated March 14, 2003.++++++ |
| | | |
| 4.(a).8 | | Agreement and Plan of Merger among chinadotcom corporation, CDC Software Holdings, Inc. and Ross Systems, Inc., dated as of September 4, 2003.+++ |
| | | |
| 4.(a).9 | | Transition and Stock Vesting Agreement among chinadotcom corporation, CDC Software Holdings, Inc., Ross Systems, Inc. and J. Patrick Tinley dated as of September 4, 2003.+++ |
| | | |
| 4.(a).10 | | Transition and Stock Vesting Agreement among chinadotcom corporation, CDC Software Holdings, Inc., Ross Systems, Inc. and Robert B. Webster dated as of September 4, 2003.+++ |
| | | |
| 4.(a).11 | | Series B Preferred Share Purchase Agreement by and between Cayman First Tier and chinadotcom Capital Limited, dated September 8, 2003.++++ |
| | | |
| 4.(a).12 | | Shareholders Agreement by and among Cayman First Tier, Symphony Technology II-A, L.P. and chinadotcom Capital Limited, dated September 8, 2003.++++ |
a).
| | | |
No.
| | Description
|
| 4.(a).13 | | Voting Agreement by and among Cayman First Tier, Symphony Technology II-A, L.P. and chinadotcom Capital Limited, dated September 8, 2003.++++ |
| | | |
| 4.(a).14 | | Put Option Agreement by and among Cayman First Tier, Symphony Technology II-A, L.P. and chinadotcom Capital Limited, dated September 8, 2003.++++ |
| | | |
| 4.(a).15 | | Amended and Restated Memorandum and Articles of Association of Cayman First Tier, adopted of September 4, 2003.++++ |
| | | |
| 4.(a).16 | | Executive Committee Charter of Cayman First Tier, adopted September 4, 2003.++++ |
| | | |
| 4.(a).17 | | Revolving Credit Agreement by and between Cayman First Tier and chinadotcom Capital Limited, dated September 8, 2003.++++ |
| | | |
| 4.(a).18 | | Revolving Credit Agreement by and between Symphony Enterprise Solutions, S.ar.l and and chinadotcom Capital Limited, dated September 8, 2003.++++ |
| | | |
| 4.(a).19 | | Amendment to Agreement and Plan of Merger signed between chinadotcom corporation, CDC Software Holdings, Inc. and Ross Systems, Inc., dated October 3, 2003.+++++ |
| | | |
| 4.(a).20 | | Guaranty dated as of September 8, 2003 from chinadotcom corporation.+++++ |
| | | |
| 4.(a).21 | | Amended and Restated Memorandum and Articles of Association of Cayman First Tier adopted November 14, 2003.y |
| | | |
| 4.(a).22 | | Amended and Restated Executive Committee Charter of Cayman First Tier adopted November 14, 2003.y |
| | | |
| 4.(a).23 | | Second Amendment to the Agreement and Plan of Merger among chinadotcom corporation, CDC Software Holdings, Inc. and Ross Systems, Inc., dated January 7, 2004.yy |
| | | |
| 4.(a).24 | | Arrangement Agreement by and among Pivotal Corporation, chinadotcom corporation, a Cayman Islands corporation and CDC Software Corporation, dated December 6, 2003.yy |
| | | |
| 4.(a).25 | | Notice of Extraordinary General Meeting to be held on February 23, 2004 and Management Information Circular and Notice of Hearing of Petition for Arrangement under the British Columbia Company Act relating to a proposed arrangement involving Pivotal Corporation and Its Common Shareholders and Its Optionholders and CDC Software Corporation, dated January 20, 2004.yy |
| | | |
| 4.(a).26 | | Amended and Restated Arrangement Agreement by and among Pivotal Corporation, chinadotcom corporation, a Cayman Islands corporation and CDC Software Corporation, dated January 19, 2004.yy |
| | | |
| 4.(a).27 | | Third Amendment to the Agreement and Plan of Merger among chinadotcom corporation, CDC Software Holdings, Inc. and Ross Systems, Inc., dated April 29, 2004.+++++++ |
| | | |
| 4.(a).28 | | Amendment to Share Purchase Agreement by and among CDC Australia Limited, Praxa Limited, Mantech International Corporation and Mantech Australia International Inc. dated February 10, 2003. |
| | | |
| 4,(a).29 | | Amendment to Preferred Stockholder Agreement by and among chinadotcom corporation, Ross Systems, Inc. and Benjamin W. Griffith, III dated January 31, 2004.+++++++ |
| | | |
| 4.(b).1 | | Cooperation Agreement on Short Message Services between China Unicom, Sichuan, and Beijing Newpalm Information Technology Co. Ltd.yyy |
| | | |
No.
| | Description
|
| 4.(b).2 | | Monternet SMS Cooperation Agreement.yyy |
| | | |
| 4.(c)1 | | Executive Services Agreement dated April 27, 2001, by and between chinadotcom corporation and Raymond Ch’ien. **** |
| | | |
| 4.(c)2 | | Executive Services Agreement effective as of January 1, 2002, by and between chinadotcom corporation and Asia Pacific Online Limited.****** |
| | | |
| 6. | | Details of how EPS information is calculated can be found in Note 4(o) to our Consolidated Financial Statements. |
| | | |
| 8. | | List of principal subsidiaries of the Company. |
| | | |
| 12.1 | | Certification of Chief Executive Officer required by Rule 13a-14(a) |
| | | |
| 12.2 | | Certification of Chief Financial Officer required by Rule 13a-14(a) |
| | | |
| 13.(a).1 | | Certification of Chief Executive Officer pursuant to 18 U.S.C. Section 1350, as adopted pursuant to Section 906 of the Sarbanes-Oxley Act of 2002 |
| | | |
| 13.(a).2 | | Certification of Chief Financial Officer pursuant to 18 U.S.C. Section 1350, as adopted pursuant to Section 906 of the Sarbanes-Oxley Act of 2002 |
| * | | Incorporated by reference to our registration statement on Form S-8 (File No.: 333-12966) filed with the Commission on December 7, 2000. |
| |
| ** | | Incorporated by reference to our registration statement on Form S-8 (File No.: 333-12958) filed with the Commission on December 7, 2000. |
| |
| *** | | Incorporated by reference to our registration statement on Form F-3 (File No. 333-12674) filed with the Commission on October 3, 2000. |
| |
| **** | | Incorporated by reference to our annual report on Form 20-F (File No. 000-30134) filed with the Commission on May 10, 2001. |
| |
| ***** | | Incorporated by reference to our current report on Form 6-K (File No. 000-30134) filed with the Commission on February 28, 2002. |
| |
| ****** | | Incorporated by reference to our annual report of Form 20-F (File No. 000-30134) filed with the Commission on June 11, 2002. |
| |
| ******* | | Incorporated by reference to our current report on Form 6-K (File No. 000-30134) filed with the Commission on September 18, 2002. |
| |
| + | | Incorporated by reference to our annual report on Form 20-F (File No. 000-30134) filed with the Commission on June 16, 2003. |
| |
| ++ | | Incorporated by reference to our current report on Form 6-K (File No. 000-30134) filed with the Commission on June 16, 2003. |
| |
| +++ | | Incorporated by reference to our current report on Form 6-K (File No. 000-30134) filed with the Commission on September 5, 2003. |
| |
| ++++ | | Incorporated by reference to our current report on Form 6-K (File No. 000-30134) filed with the Commission on September 15, 2003. |
| |
| +++++ | | Incorporated by reference to our registration statement on Form F-4 (File No. 333-109493) filed with the Commission on October 6, 2003. |
| |
| +++++ | | Incorporated by reference to our registration statement on Form F-4 (File No. 333-109493) filed with the Commission on October 6, 2003. |
| |
| ++++++ | | Incorporated by reference to Amendment No. 2 to our registration statement on Form F-4 (File No. 333-109493) filed with the Commission on January 21, 2004. |
| |
| +++++++ | | Incorporated by reference to Amendment No. 4 to our registration statement on Form F-4 (File No. 333-109493) filed with the Commission on May 7, 2004. |
| y | | Incorporated by reference to our current report on Form 6-K (File No. 000-30134) filed with the Commission on December 11, 2003. |
| |
| yy | | Incorporated by reference to our current report on Form 6-K (File No000-30134) filed with the Commission on January 8, 2004. |
| |
| yyy | | Incorporated by reference to our registration statement on Form F-4/A (File No. 333-109493) filed with the Commission on January 21, 2004. |