Table of Contents
SECURITIES AND EXCHANGE COMMISSION
Washington, D.C. 20549
FORM 20-F/A
(Amendment No. 2)
| o | REGISTRATION STATEMENT PURSUANT TO SECTION 12(b) OR 12(g) OF THE SECURITIES EXCHANGE ACT OF 1934 |
OR
| x | ANNUAL REPORT PURSUANT TO SECTION 13 OR 15(d) OF THE SECURITIES EXCHANGE ACT OF 1934 |
| For the fiscal year ended December 31, 2002. |
| Commission file number:000-30134 |
OR
| o | TRANSITION REPORT PURSUANT TO SECTION 13 OR 15(d) OF THE SECURITIES EXCHANGE ACT OF 1934 |
chinadotcom corporation
(Exact name of Registrant as specified in its charter)
Cayman Islands
(Jurisdiction of incorporation or organization)
34/F Citicorp Centre
18 Whitfield Road
Causeway Bay
Hong Kong
telephone: (852) 2893-8200
facsimile: (852) 2893-5245
e-mail: investor-relations@hk.china.com
(Address of principal executive offices)
Securities for which there is a reporting obligation pursuant to Section 15(d) of the Act:
Class A Common Shares
Indicate the number of outstanding shares of each of the Issuer’s class of capital or common stock as of the close of the period covered by this Annual Report:
| Class of shares | Number outstanding as of December 31, 2002 | |||
| Class A Common Shares | 101,296,363 | |||
| Preferred Shares | Nil | |||
Indicate by check mark whether the registrant (1) has filed all reports required to be filed by Section 13 or 15(d) of the Securities Exchange Act of 1934 during the preceding 12 months (or for such shorter period that the registrant was required to file such reports), and (2) has been subject to such filing requirements for the past 90 days.
Yesx Noo
Indicate by check mark which financial statement item the registrant has elected to follow.
Item 17o Item 18x
Table of Contents
EXPLANATORY NOTE
This amendment no. 1 on Form 20-F/A hereby amends chinadotcom’s annual report on Form 20-F for the fiscal year ended December 31, 2002, which was filed on June 11, 2003. This amendment no. 1 is being filed for the purpose of providing additional details to our disclosures in the original report pursuant to comments we received from the Staff of the U.S. Securities and Exchange Commission in conjunction with their review of our Amendment No. 1 to Form F-4, which was filed on October 24, 2003. This amendment no. 1 is not intended to revise other information presented in our annual report on Form 20-F for the fiscal year ended December 31, 2002 as originally filed.
This amendment no. 1 on Form 20-F/A does not reflect events occurring after the filing of the original Form 20-F and does not modify or update the disclosure therein in any way other than as required to reflect the amendments discussed above. As a result, this amendment no. 1 to the annual report on Form 20-F continues to speak as of June 11, 2003.
-2-
Table of Contents
TABLE OF CONTENTS
| EX-8 LIST OF PRINCIPAL SUBSIDIARIES OF THE COMPANY | ||||||||
| EX-12.1 CERTIFICATION OF CEO | ||||||||
| EX-12.2 CERTIFICATION OF CFO | ||||||||
| EX-13.(A).1 CERTIFICATION OF CEO | ||||||||
| EX-13.(A).2 CERTIFICATION OF CFO | ||||||||
Table of Contents
TABLE OF CONTENTS
| Page | ||||||
| Item 1. | Identity Of Directors, Senior Management And Advisors | 3 | ||||
| Item 2. | Offer Statistics And Expected Timetable | 3 | ||||
| Item 3. | Key Information | 4 | ||||
| Item 4. | Information On The Company | 39 | ||||
| Item 5. | Operating And Financial Review And Prospects | 54 | ||||
| Item 6. | Directors, Senior Management And Employees | 75 | ||||
| Item 7. | Major Shareholders And Related Party Transactions | 82 | ||||
| Item 8. | Financial Information | 87 | ||||
| Item 9. | The Offer And Listing | 87 | ||||
| Item 10. | Additional Information | 89 | ||||
| Item 11. | Quantitative And Qualitative Disclosures About Market Risk | 99 | ||||
| Item 12. | Description Of Securities Other Than Equity Securities | 103 | ||||
| Item 13. | Defaults, Dividend Arrearages And Delinquencies | 103 | ||||
| Item 14. | Material Modifications To The Rights Of Security Holders And Use Of Proceeds | 103 | ||||
| Item 15. | Controls and Procedures | 103 | ||||
| Item 16. | [Reserved] | 103 | ||||
| Item 17. | Financial Statements | 104 | ||||
| Item 18. | Financial Statements | 104 | ||||
| Item 19. | Exhibits | 104 | ||||
i
Table of Contents
GENERAL INTRODUCTION
In this Annual Report, except as otherwise specified, all references to “we,” “us,” “our,” “the Company” or “chinadotcom” refer to chinadotcom corporation and its consolidated subsidiaries and their respective operations. Unless otherwise specified, all information contained in this Annual Report, including share and per share data, reflects the two-for-one share splits approved by our shareholders as of each of December 6, 1999 and April 28, 2000, respectively, and effective as of the close of trading on the Nasdaq National Market on December 13, 1999 and May 8, 2000, respectively. All references to GAAP mean the generally accepted accounting principles of the United States. In this Annual Report, reference to “US$” is to United States dollars.
Presentation of Financial Information
chinadotcom was incorporated as China Information Infrastructure Limited under the laws of the Cayman Islands in June 1997 as a wholly-owned subsidiary of China Internet Corporation Limited, or CIC, a company incorporated under the laws of Bermuda. In June 1999, CIC distributed its total interest in chinadotcom to CIC’s shareholders in a reorganization. The transaction involved the distribution of a total of 46,975,972 of chinadotcom’s Class A Common Shares to CIC’s shareholders on a one-for-one basis with respect to each issued and outstanding share of CIC’s capital stock at the time of the distribution. Upon completion of its reorganization, CIC ceased to have any ownership interest in chinadotcom. As part of this corporate reorganization, CIC also transferred certain subsidiaries, portals and related assets, comprising the integrated portal business, which began in early 1996, to chinadotcom. The transfer was accounted for as a reorganization of entities under common control in a manner similar to a pooling of interests. In April 2000, our shareholders voted to change our name to chinadotcom corporation.
The summary consolidated financial data for fiscal years 1998 and 1999 in this Annual Report have been prepared as if the corporate reorganization of chinadotcom referred to above had occurred retroactively. Accordingly, the results of operations and related net assets and liabilities of the operations transferred by CIC to chinadotcom as a part of CIC’s reorganization have been included in the summary consolidated financial data for fiscal years 1998 and 1999. chinadotcom believes that the methods used in the allocation of expenses are reasonable and the statements of operations include all revenues and costs directly and indirectly attributable to the Company. The amounts related to chinadotcom have been determined by segregating amounts related to the operation of chinadotcom from those related to the operations retained by CIC. The determination of these amounts was made by reference to individual records for costs specifically relating to chinadotcom or by allocation based on number of personnel, time spent by personnel or similar references. Management believes the allocated costs are representative of the costs that would have been incurred if chinadotcom had operated on a stand-alone basis.
As of each of December 13, 1999 and May 8, 2000, chinadotcom effected a two-for-one share split. Upon the occurrence of each of these share splits, each issued and outstanding Class A Common Share of chinadotcom was split into two Class A Common Shares of half the previous par value per share. The current par value of our Class A Common Share is US$0.00025 per share. Unless indicated otherwise, the consolidated financial statements and related notes in this Annual Report have been prepared, and the consolidated financial and share information in this Annual Report, including share and per share data, have been presented, as if the two share splits had occurred retroactively.
The consolidated financial statements have been prepared in accordance with GAAP.
Forward-Looking Statements
Included in this Annual Report are forward-looking statements, which can be identified by the use of forward-looking terminology including “may,” “will,” “expect,” “anticipate,” “estimate,” “plan,” “continue,”
1
Table of Contents
“believe” or other similar words. We have made forward-looking statements concerning the following, among others:
| • | our goals and strategies; |
| • | our acquisition and expansion strategy; |
| • | the importance and expected growth of software, Internet and mobile phone applications; |
| • | the pace of change in the software, Internet and mobile phone applications marketplaces; |
| • | the demand for software, Internet and mobile phone applications and services; and |
| • | advertising revenues. |
These statements are forward-looking and reflect management’s current expectations only. They are subject to a number of risks and uncertainties, including but not limited to, the following:
| • | our ability to realize strategic objectives by taking advantage of market opportunities in our geographic markets; |
| • | our ability to make changes in business strategy, development plans and product offerings to respond to the needs of current, new and potential customers, suppliers and strategic partners; |
| • | our ability to integrate operations or new acquisitions in accordance with business strategy; |
| • | the effects of restructurings and our ability to successfully support our operations; |
| • | the potential negative reaction by customers or shareholders to reduced size or market capitalization; |
| • | our ability to recruit and retain qualified, experienced employees; |
| • | our ability to successfully partner with other companies; |
| • | our ability to acquire additional companies and technologies and manage an increasingly broad range of businesses; |
| • | negotiation and resolution of disputes and claims with our former and current shareholders; |
| • | evaluating the reduced importance of material shareholders and strategic investors; |
| • | risks associated with the development and licensing of software generally, including potential delays in software development and technical difficulties that may be encountered in the development or use of our software; |
| • | increased global competition; |
| • | our ability to manage regulatory and litigation risks; |
| • | our ability to rationalize operations in a cost effective manner, particularly as related to certain subsidiaries and employees; |
| • | technological changes and developments; |
| • | general risks of the Internet, marketing and software sectors; and |
| • | the uncertain economic and political climate in Asia, the United States and throughout the rest of the world, and the potential that such climate may deteriorate further, including the recent |
2
Table of Contents
| adverse effects on general economic conditions in Asia as a result of the outbreak of severe acute respiratory syndrome, or SARS. |
We would like to caution you not to place undue reliance on these statements and you should read these statements in conjunction with the risk factors disclosed in Item 3.D. of this Annual Report,Key Information — Risk Factors.
ITEM 1. IDENTITY OF DIRECTORS, SENIOR MANAGEMENT AND ADVISORS
Not applicable.
ITEM 2. OFFER STATISTICS AND EXPECTED TIMETABLE
Not applicable.
3
Table of Contents
ITEM 3. KEY INFORMATION
A. Selected Financial Data
The following selected consolidated financial data of chinadotcom and our subsidiaries should be read in conjunction with the consolidated balance sheets as of December 31, 2001 and 2002 and the related consolidated statements of operations, cash flows and changes in shareholders’ equity for the years ended December 31, 2000, 2001 and 2002 and the notes thereto, or together referred to as the Consolidated Financial Statements, included as Item 18 of this Annual Report,Financial Statements, and the information included in Item 5 of this Annual Report,Operating and Financial Review and Prospects. The Consolidated Financial Statements have been prepared and presented in accordance with GAAP. The following selected consolidated financial data of chinadotcom and our subsidiaries as of and for the years ended December 31, 1998 and 1999, are derived from our audited financial data, which is not included in this Annual Report.
Unless otherwise indicated, share and per share data is expressed as if our two-for-one share splits that were effected as of each of December 13, 1999 and May 8, 2000 had occurred retroactively (see Item 4 of this Annual Report,Information on the Company, and Note 1 to our Consolidated Financial Statements included as Item 18 of this Annual Report,Financial Statements). The selected consolidated financial data for fiscal years 1998 and 1999 present financial results of chinadotcom and our subsidiaries as if our 1999 reorganization had been completed retroactively. The financial data reflect the financial condition and results of operation of chinadotcom and our subsidiaries for such periods and do not necessarily reflect our financial condition as if we had been a stand-alone entity for all periods.
Summary Consolidated Financial Data
| Year ended December 31, | ||||||||||||||||||||
| 1998 | 1999 | 2000 | 2001 | 2002 | ||||||||||||||||
| (in thousands of U.S. dollars except share and per share data) | ||||||||||||||||||||
Income Statement Data:(1) | ||||||||||||||||||||
| Revenues: | ||||||||||||||||||||
| e-business Solutions(2) | 2,689 | 11,045 | 61,327 | 32,591 | 23,003 | |||||||||||||||
| Advertising | 658 | 7,593 | 43,769 | 21,404 | 28,250 | |||||||||||||||
| Sale of IT products(2) | — | 289 | 3,276 | 4,580 | 4,631 | |||||||||||||||
| Other income(2) | 105 | 1,306 | 1,296 | 5,899 | 3,418 | |||||||||||||||
| 3,452 | 20,233 | 109,668 | 64,474 | 59,302 | ||||||||||||||||
| Cost of revenues: | ||||||||||||||||||||
| e-business Solutions(3) | (2,518 | ) | (5,769 | ) | (38,600 | ) | (21,922 | ) | (14,022 | ) | ||||||||||
| Advertising | (220 | ) | (5,232 | ) | (29,109 | ) | (13,508 | ) | (20,045 | ) | ||||||||||
| Sale of IT products(3) | — | (207 | ) | (56 | ) | (3,466 | ) | (3,306 | ) | |||||||||||
| Other income(3) | — | (606 | ) | (1,275 | ) | (2,010 | ) | (1,484 | ) | |||||||||||
| Gross margin | 714 | 8,419 | 40,628 | 23,568 | 20,445 | |||||||||||||||
| Selling, general and administrative expenses | (7,395 | ) | (30,385 | ) | (106,358 | ) | (89,092 | ) | (38,272 | ) | ||||||||||
| Depreciation and amortization expenses | (2,200 | ) | (6,792 | ) | (37,775 | ) | (27,388 | ) | (11,860 | ) | ||||||||||
| Impairment of goodwill and intangible assets | — | — | (43,373 | ) | (40,698 | ) | — | |||||||||||||
| Operating loss | (8,881 | ) | (28,758 | ) | (146,878 | ) | (133,610 | ) | (29,687 | ) | ||||||||||
| Interest income | 58 | 3,826 | 29,934 | 26,809 | 23,927 | |||||||||||||||
| Interest expense | — | — | (949 | ) | (1,474 | ) | (2,629 | ) | ||||||||||||
| Gain/(loss) arising from share issuance of a subsidiary | — | — | 140,031 | (55 | ) | — | ||||||||||||||
| Gain/(loss) on disposal of available-for-sale securities | — | 6,282 | 1,682 | 4,411 | (158 | ) | ||||||||||||||
| Gain/(loss) on disposal of subsidiaries and cost investments | — | — | 13,981 | (1,933 | ) | (117 | ) | |||||||||||||
| Other non-operating gains | — | — | — | — | 1,173 | |||||||||||||||
| Other non-operating losses | — | — | (1,992 | ) | (1,321 | ) | (288 | ) | ||||||||||||
| Impairment of cost investments and available-for-sale securities | — | — | (84,696 | ) | (12,260 | ) | (5,351 | ) | ||||||||||||
| Share of (losses)/income in equity investees(4) | — | (65 | ) | (9,423 | ) | (2,592 | ) | 682 | ||||||||||||
4
Table of Contents
| Year ended December 31, | ||||||||||||||||||||
| 1998 | 1999 | 2000 | 2001 | 2002 | ||||||||||||||||
| (in thousands of U.S. dollars except share and per share data) | ||||||||||||||||||||
| Loss before income taxes | (8,823 | ) | (18,715 | ) | (58,310 | ) | (122,025 | ) | (12,448 | ) | ||||||||||
| Income taxes | — | — | (682 | ) | (148 | ) | (160 | ) | ||||||||||||
| Loss before minority interests | (8,823 | ) | (18,715 | ) | (58,992 | ) | (122,173 | ) | (12,608 | ) | ||||||||||
| Minority interests in losses/(income) of consolidated subsidiaries | 282 | (2 | ) | 553 | 4,010 | 1,036 | ||||||||||||||
| Loss from continuing operations | (8,541 | ) | (18,717 | ) | (58,439 | ) | (118,163 | ) | (11,572 | ) | ||||||||||
| Discontinued operations | ||||||||||||||||||||
| Loss from operations of discontinued subsidiaries, net of related tax benefit of US$42 and tax expense of US$213 for 2000 and 2001, respectively | — | — | (1,363 | ) | (6,222 | ) | (7,204 | ) | ||||||||||||
| Gain on disposal of discontinued subsidiaries | — | — | — | — | 545 | |||||||||||||||
| Net loss | (8,541 | ) | (18,717 | ) | (59,802 | ) | (124,385 | ) | (18,231 | ) | ||||||||||
| Basic and diluted loss per share(5) | (0.18 | ) | (0.26 | ) | (0.61 | ) | (1.21 | ) | (0.18 | ) | ||||||||||
| Weighted average number of shares | 46,996,420 | 71,879,704 | 98,091,541 | 102,589,760 | 102,269,735 | |||||||||||||||
| As of December 31, | ||||||||||||||||||||
| 1998 | 1999 | 2000 | 2001 | 2002 | ||||||||||||||||
| (in thousands of U.S. dollars) | ||||||||||||||||||||
Balance Sheet Data: | ||||||||||||||||||||
| Cash and cash equivalents | 2,323 | 12,913 | 47,483 | 20,820 | 33,153 | |||||||||||||||
| Restricted cash | 3,000 | — | 4,134 | 1,274 | 109 | |||||||||||||||
| Available-for-sale debt securities(6) | — | 111,612 | 242,324 | 346,980 | 320,056 | |||||||||||||||
| Restricted debt securities | — | — | 148,622 | 134,960 | 151,123 | |||||||||||||||
| Available-for-sale equity securities | 5,700 | 5,419 | 10,368 | 2,064 | 2,050 | |||||||||||||||
| Bank loans(7) | — | — | 3,934 | 118,455 | 127,384 | |||||||||||||||
| Working capital | 4,027 | 124,209 | 450,391 | 359,412 | 340,476 | |||||||||||||||
| Total assets | 14,645 | 183,123 | 622,920 | 596,494 | 580,957 | |||||||||||||||
| Total shareholders’ equity | 12,302 | 163,822 | 512,024 | 389,861 | 377,700 | |||||||||||||||
| (1) | During the year ended December 31, 2002, we discontinued the operations of certain subsidiaries in the e-business Solutions and the Advertising segments. With the adoption of SFAS 144, Accounting for the Impairment or Disposal of Long-Lived Assets, the operating results of the discontinued operating units were classified as “loss from operations of discontinued subsidiaries” on the consolidated statements of operations. As a result of SFAS 144, the results of the continuing operations of 1998, 1999, 2000 and 2001 were restated. | |
| (2) | For comparative purposes, due to increasing materiality, figures prior to 2001 have been revised to reflect a new line of services called “Sale of IT products,” adopted during 2001, to account for the sale of information technology products by our various business units. | |
| (3) | For comparative purposes, figures prior to 2000 have been revised to reflect new classifications of costs of revenues adopted during 2000. | |
| (4) | The term “equity investees” refers to our 20% or more owned minority investments other than subsidiaries. | |
| (5) | The computation of diluted loss per share did not assume the conversion of any issued stock options or warrants during the year because their inclusion would have been antidilutive. | |
| (6) | Available-for-sale debt securities includes short-term and long-term debt securities available-for-sale. | |
| (7) | Bank loans include short-term and long-term bank loans. |
5
Table of Contents
B. Capitalization and Indebtedness
Not applicable.
C. Reasons for the Offer and Use of Proceeds
Not applicable.
D. Risk Factors
Risks Relating to chinadotcom
Risks relating to our overall business
Because we have a limited operating history and our business model and strategy are evolving, we lack experience in our new markets and cannot provide any assurance that we will be successful in meeting the needs of customers in these markets
We have a limited operating history and were organized in June 1997 as a wholly-owned subsidiary of China Internet Corporation Limited, or CIC. We were subsequently spun-off from CIC prior to our initial public offering in July 1999, and CIC does not have any continued holdings in chinadotcom. We have historically operated as a pan-Asian integrated Internet company with our business model centered around our e-business Solutions and advertising businesses, including e-marketing services, portal services and other media. Our business model is evolving from a pan-Asian Internet company to a provider of enterprise software and related support services, outsourced software development and support services, advertising, short messaging services for mobile devices and portal services. Our goal is to be a leading integrated enterprise solutions company offering technology, marketing and media services for companies and end users throughout Greater China and the Asia-Pacific region, the United States and the United Kingdom.
Each of our targeted markets is rapidly evolving, and we cannot provide any assurance that we can successfully adapt our business model and strategy to meet the needs of customers in these markets, or cross-sell our core competencies. If we fail to modify our business model or strategy to adapt to these markets, our business could suffer. Changes in our business model and strategy may intensify the risks described in this Annual Report or subject us to new risks.
We have until recently a history of losses and cannot provide any assurances that we can achieve or sustain profitability
Since our corporate organization in June 1997, we have incurred net losses in each of our fiscal years as follows:
| 1998 | 1999 | 2000 | 2001 | 2002 | ||||||||||||||||
| (in thousands of U.S. dollars) | ||||||||||||||||||||
| Net loss | (8,541 | ) | (18,717 | ) | (59,802 | ) | (124,385 | ) | (18,231 | ) | ||||||||||
While we have recorded net profits in each of the fourth quarter of 2002 and first quarter of 2003, we have continued to post losses from operations during these periods. Our operating losses may increase in the future and we may never achieve operating profitability or sustain net profitability. We may continue to incur operating losses and post net losses in the future due to:
6
Table of Contents
| • | additional acquisition activities related to the growth and development of our enterprise software, outsourced software development, short messaging services for mobile devices and portal businesses and services; |
| • | a high level of planned operating expenditures; |
| • | increased sales and marketing costs; |
| • | increased investment activities; |
| • | further decreases in the value of our prior investments, including prior Internet-related acquisitions and our publicly traded, unlisted and other marketable securities; |
| • | greater levels of product development; |
| • | even greater competition; and |
| • | our general business and growth objectives. |
In addition, while we have experienced sequential increases in revenues between the fourth quarter of 2002 and first quarter of 2003, we cannot be certain that revenue growth will continue in the future. We may see a reversal of the recent growth in quarterly revenues due to:
| • | the continued slowdown in the Asian, U.S. and other economic markets; |
| • | the ongoing low level of expenditures in the software, Internet and media markets; |
| • | the potential or actual loss of key clients and key personnel, including those from our software development and outsourcing, e-business Solutions, mobile service and e-marketing services businesses; |
| • | our inability to identify or acquire suitable target companies to implement our business model and strategy and grow our business; |
| • | our decision to exit the low-margin online network advertising business in South Korea which will cause revenues from our advertising and e-marketing businesses to decline; |
| • | our disposal of certain subsidiaries and investments; |
| • | our decision to discontinue certain products and services; and |
| • | the recent adverse effect on general economic conditions in Asia as a result of concerns about the severe acute respiratory syndrome or SARS virus. |
These factors could also adversely affect our ability to sustain profitability. We cannot assure you that we will generate sufficient revenue to sustain profitability. We cannot assure you that we can sustain or increase profitability on a quarterly or annual basis in the future. If revenue does not meet our expectations, or if operating expenses exceed what we anticipate or cannot be reduced accordingly, our business, results of operations and financial condition will be materially and adversely affected.
We have significant fixed operating expenses, which may be difficult to adjust in response to unanticipated fluctuations in revenues, and therefore could have a material adverse effect on operations
A high percentage of our operating expenses, particularly personnel, rent, depreciation and amortization, are fixed in advance of any particular quarter. As a result, an unanticipated decrease in the number or average size of, or an unanticipated delay in the scheduling for, our engagements may cause significant variations in operating results in any particular quarter and could have a material adverse effect on operations for that quarter.
An unanticipated termination or decrease in size or scope of a major engagement, a client’s decision not to proceed with a project we anticipated or the completion during a quarter of several major client engagements could require us to maintain underutilized employees and could have a material adverse effect on our business, results of operations and financial condition.
During 2001 and 2002, our accounts receivable balances remained outstanding longer than would be expected if our credit policies were consistently enforced. While we have recently improved the collections process for accounts receivable, our financial condition and results of operations would be adversely impacted if our judgments regarding the collectibility of accounts receivable proved to be incorrect.
Generally, we offer customers in each of our business segments the following credit terms:
| • | For sales of software products, “30 to 60 days credit from date of delivery of software” or “cash on delivery”; |
| • | For sales of consulting services, “30 to 60 days credit after completion of milestones set forth in the agreement”; and |
| • | For sales in the advertising and marketing activities segment, “cash on delivery”, “14 days after completion of campaign” or “30 days credit”. |
In the software and consulting services segment, during 2001 and 2002, 34.3% and 40.5% of accounts receivables were outstanding greater than 60 days, respectively, aggregating $4.7 million and $2.8 million, respectively. Days sales outstanding in this segment were 301 and 162 days, respectively, during 2001 and 2002.
In the advertising and marketing activities segment, during 2001 and 2002, 50.5% and 52.8% of accounts receivables were outstanding greater than 30 days, respectively, aggregating $5.6 million and $5.7 million, respectively. Days sales outstanding in this segment were 224 and 148 days, respectively, during 2001 and 2002.
7
Table of Contents
As a result, during 2001 and 2002, our accounts receivables balances were outstanding longer than would be expected if our stated credit policies were consistently enforced. We attribute the inconsistency to several factors, including the following:
| • | The general economic downturn commencing in 2000 and continuing through 2002 which impacted in particular the internet industry and internet companies, and caused many of such companies who were our customers to experience cashflow problems and delay payments to suppliers; |
| • | Turnover in a client’s organization whereby the new persons-in-charge did not acknowledge the original project contracts signed with us or accept the work authorized by their predecessors; |
| • | A change of control in the customer’s organization during the project period whereby all payments were withheld and time of payment became uncertain; |
| • | Miscommunication within a client’s organization, such as between the user department and the finance department, which resulted in partial or non-payment; |
| • | A common business practice in China where customers delay payments beyond their due dates; and |
| • | A common business practice in China where if a company is perceived to be “failing” or discontinuing its businesses, then debtors to the company would not settle their outstanding payments, irrespective of any contractual obligations because of a view by the debtor that the company would not have the resources or capacity to be able to collect or effectively enforce collection. |
We have concluded, despite such inconsistencies, that the recorded accounts receivable balances are collectible based on our credit procedures, including assessing customers’ credit risk, establishing credit limits, performing credit checks when warranted, and signing contracts with all customers to establish a legal obligation to pay. In addition, we comply with the revenue recognition criteria relating to collectibility included advertising and marketing activities in SAB 101, for sale of IT products in SOP91-2 paragraph 8, and for consulting services in SOP 81-1 paragraph 23.
While we have improved the collectibility of our accounts receivable and believe that our cash and cash equivalents balance of $[ ] million as of December 31, 2002 should allow us to continue operations despite any continued delays in collecting our accounts receivable, our financial condition and results of operations would be adversely affected in the event that our judgments regarding the collectibility of our accounts receivable proves to be incorrect.
Our strategy of expansion through acquisitions has been and will continue to be costly and may not be effective, and we may realize losses on our investments
As a key component of our business and growth strategy, we have acquired, and intend to continue to acquire, companies and assets that we feel will enhance our business model, revenue base, operations and profitability, particularly relating to our strategy in enterprise software, outsourced software development and mobile services. Our acquisitions have resulted in, and will continue to result in, the use of significant amounts of cash, dilutive issuances of our Class A Common Shares and amortization expenses related to certain intangible assets, each of which could materially and adversely affect our business. As of January 1, 2002, we began to apply SFAS 142 and no longer amortize expenses related to goodwill and other intangible assets with an indefinite life for distinct acquisitions. For an overview of SFAS 142, see Item 5.B of this Annual Report,Operating and Financial Review and Prospects — Impact of Certain Recently Issued Accounting Standards.
We will need to implement effective controls, procedures and policies as we continue to grow through acquisitions. Failure to do so will involve strains on our resources, including diverting management’s attention, increasing transaction costs and reducing employee morale
We have been expanding and broadening our operations rapidly, both in size and scope. Our ability to implement controls, procedures and policies appropriate for a public company in a rapidly evolving market requires an effective planning and management process. We will need to continue to improve our financial, managerial and operational controls and reporting systems, and to expand, train and manage our work force. These acquisitions involve significant strains and risks, including:
| • | the difficulties of integrating, assimilating and managing the operations, technologies, intellectual property, products and personnel of the acquired business; |
| • | the need to implement controls, procedures and policies appropriate for a public company such as ours at the acquired business that prior to acquisition had lacked such controls, procedures and policies, particularly if such acquired business is intended to continue to exist as a separate business unit or is a subsidiary of ours that is not wholly-owned; |
| • | the diversion of management attention from other business concerns both during the period of negotiation through closing and further diversion of such time after closing, as well as a shift of focus from operating the businesses to issues of integration and future products; |
| • | the reduced availability of favorable financing for future acquisitions; |
| • | our inability to manage adequately the currency, interest rate and equity price fluctuations relating to our acquisitions and investments; |
| • | declining employee morale and retention issues for employees in the acquired businesses; |
| • | the risk of being sued by terminated employees and contractors; and |
| • | our lack of familiarity with local market and other conditions and business practices. |
We may not be able to successfully integrate our acquisitions, and failure to do so could have a material adverse effect on our operations and financial condition
We will need to integrate, manage and protect our interests in our acquired businesses successfully, and our failure to do so could have a material adverse effect on our business, results of operations and financial condition. We may experience difficulties in integrating, assimilating and managing the operations, technologies, intellectual property, products and personnel of its acquired businesses. Our acquisitions and investments may also be difficult to integrate in the aggregate and it may need to reorganize or restructure to better achieve our operating goals. This may include having to create or retain separate focused units or entities within each of our areas of emphasis, including enterprise software, outsourced software development and mobile services. We will continue to attempt to achieve what we believe to be the most effective corporate structure to better enhance value and liquidity for our shareholders and better utilize our non-cash assets as consideration for acquisitions or investments. This may include the spin-off or listing of one or more of our units or entities such as occurred with our hongkong.com Corporation, which was listed on the Growth Enterprise Market of The Stock Exchange of Hong Kong, or GEM in March 2000. We continue to hold over 81% of hongkong.com Corporation with the balance of the shares being held by the public. We undertook the
8
Table of Contents
spin-off of a portion of hongkong.com Corporation in order to raise capital to fund future expansion of hongkong.com’s business which at the time focused specifically on the operation of online portals services in Hong Kong under its distinct brandname and to achieve greater brand recognition of its name in the local market it served.
Our continued acquisitions and investments in Asia and other markets may expose us to additional regulatory and political risks which could lead to a material adverse impact on our financial condition
Our expansion throughout Asia and into other markets, could harm our business because we will be exposed to:
| • | adverse changes in regulatory requirements; |
| • | potentially adverse tax and regulatory consequences; |
| • | general export restrictions and export controls relating to encryption technology; |
| • | differences in accounting practices; |
| • | different cultures which may be relatively less accepting of our business; |
| • | difficulties in staffing and managing operations; |
| • | greater legal uncertainty; |
| • | tariffs and other trade barriers; |
| • | changes in the general economic and investment climate affecting valuations and perception of the our business sectors; |
| • | political instability and fluctuations in currency exchange rates; and |
| • | different seasonal trends in business activities, |
any one of which could have a material adverse effect on the success of our business and future growth.
Decrease in the value of our investments may lead to impairment of its goodwill and other intangible assets leading to a material adverse impact on our financial condition
As economic, market and other conditions continue to fluctuate, we have recorded impairment losses for the decrease in value of our investments and have incurred unrealized losses in the fair value of our marketable securities. For the financial years ended December 31, 2001 and 2002, we recognized an impairment loss in an aggregate amount of US$8.1 million and US$0.3 million, respectively, for the decrease in fair value of our less than 20% owned unlisted equity investments, and incurred an unrealized aggregate loss of US$4.2 million and US$5.1 million, respectively, for the decrease in fair value of our marketable securities. On January 1, 2002, we began to apply SFAS 142, which requires that intangible assets with indefinite useful lives must be reviewed annually for impairment, or more frequently if indications of impairment arise. The standard established specific guidance for testing for impairment of goodwill and intangible assets with indefinite useful lives. While we performed the transitional impairment test for goodwill on June 30, 2002 and the annual impairment test on December 31, 2002, and no impairment charge was recorded during 2002, we cannot give you assurances that we will not have to record impairment of our goodwill and intangible assets in the future, depending upon the future performance of and outlook for these assets.
Our results of operations, financial condition, prospects and share price could be adversely and materially affected, particularly if we are unable to adequately hedge our exposure to reduced valuations. For a further discussion of our interest rate risk and equity price risk, see Item 11 of this Annual Report,Quantitative and Qualitative Disclosures About Market Risk—Interest Rate Riskand —Equity Price Risk.
Because we rely on local management for many of our localized businesses our business may be adversely affected if we cannot effectively manage local officers or prevent them from acting or failing to act at our direction
9
Table of Contents
In connection with our strategy to develop our enterprise software business, outsourced software development and service business, and mobile and portal businesses, we may acquire interests in companies in local markets where we have limited experience with these assets and businesses, including enterprise software companies in the United States and Canada, outsourced software developers in the People’s Republic of China, or PRC, and India, and developers of add-on services for mobile devices in Hong Kong and the PRC. As a result, it may be necessary for us to rely on our local management with limited oversight. If we cannot effectively manage our local officers and management, or prevent them from acting or failing to act at our direction, these problems could have a material adverse effect on our business, financial condition, results of operations and share price.
Because some of our directors and officers act in similar capacities for CIC or Xinhua, they may not be able to devote sufficient attention to us or may face conflicts of interest with us
Two of our eight directors also serve as directors for CIC. Our Vice Chairman and Chief Executive Officer also serves as an officer for CIC and beneficially owns a significant percentage of the equity of both chinadotcom and CIC. Affiliated companies of Xinhua News Agency, or Xinhua, a significant shareholder, also own a significant percentage of CIC. Among our directors, one is an executive officer of Xinhua. Because these individuals are or will be required to devote attention to CIC or Xinhua, they may be unable to devote a sufficient amount of attention to chinadotcom. Furthermore, additional conflicts of interest may arise to the extent that future changes in our business model and strategy cause it to compete with CIC, Xinhua and their respective affiliates in similar industries and markets in Greater China and elsewhere in Asia. In June 1999, we entered into an agreement with CIC which limits the ability of those of our directors or officers who are also CIC directors or officers to take advantage of corporate opportunities presented to them as directors or officers of chinadotcom. There is no assurance that this agreement can be enforced effectively if it is violated against our interest.
Some of our shareholders, suppliers, customers and debtors may compete with us or may experience adverse business conditions that could affect us negatively
AOL Time Warner Inc., or AOL, one of our largest shareholders, is also an active investor in the Internet and media markets, as well as companies which develop services delivered via mobile devices. It is possible that conflicts of interest have arisen or will arise as chinadotcom and AOL further compete in similar markets in Greater China and other geographic regions.
In addition, there can be no assurance that despite non-compete and confidentiality arrangements and other fiduciary obligations that may apply, our shareholders or directors have not used or will not use information obtained as a result of association with us to compete against us, directly or indirectly. If such information is used to compete against us, our business, financial or other condition, results of operation and share price could be materially and adversely affected.
Our shares are held by institutional investors, strategic shareholders, suppliers, customers, investees, guarantors and debtors, one or more of whom may from time to time experience further downturns or slowdowns in market, economic, business, operational, sales, financial or other condition that could have a material adverse effect on their business, financial or other condition and share price, as the case may be. If these conditions, competition or other factors cause, or result in the deterioration of our relationships with any of these shareholders, and they sell our shares, or if one or more of our major shareholders change or is expected to change their shareholding in us materially, our financial, business, share price, financial and other condition and prospects could be materially affected in an adverse manner.
We are subject to risks related to our purchase of URLs from CIC, which could materially and adversely impact our business strategy and value of these assets in the event the value paid for the URLs was not reasonable, third
10
Table of Contents
parties bring claims for intellectual property infringement, third party creditors of CIC bring claims of unfair preference in the event CIC is liquidated, or we are required to record an impairment on the value of the URLs
In February 2002 we completed the payment related to the purchase of three Uniform Resource Locators, or URLs, www.china.com, www.hongkong.com and www.taiwan.com, and related intellectual property rights for US$16.8 million from CIC pursuant to an agreement reached with CIC in October 2001.
While we believe that the URLs are of material importance to our business strategy and operations, our acquisition of the URLs involves significant risks, including:
| • | While we relied upon valuations as determined by internationally recognized third party valuation concerns, as well as commercial negotiations with CIC, we cannot guarantee, however, that the purchase price we paid for the URLs is fair, reasonable or market value or that such fair, reasonable and market value price is readily or objectively determinable. |
| • | Under existing intellectual property laws in various countries (such as the United States and Hong Kong), a mark that has location significance or geographical significance such as the URLs cannot be registered as a trademark. As a result, the purchase of the URLs may not be an effective means to resolve our trademark ownership concerns and we may continue to be vulnerable to intellectual property ownership and use risks, such as challenges by third parties of infringement. |
| • | We believe that the URLs will serve an important business purpose for us for a period of 20 years, and as such we have chosen to amortize them on a straight-line basis over a period of 20 years. However, given the unique nature of the URLs and our short operating history, we cannot be assured that this time period will accurately correlate with the actual useful life of the URLs. |
| • | Although as part of the purchase of the URLs, we have made a “bulk sales” notice in Hong Kong to put CIC’s creditors on notice of the transaction, as with any potential liquidation, in the event CIC is liquidated, if the proceeds from the purchase of the URLs are thought to be below fair market value by CIC’s creditors or distributed preferentially to certain of its creditors in a manner that “unfairly prejudices” the other creditors of CIC, its liquidator may set aside the URLs purchase transaction. |
| • | We cannot provide any assurances that under SFAS 144, Accounting for the Impairment or Disposal of Long-Lived Assets, we will not have to record impairment of the value of the URLs, depending upon the future performance of and useful life for these assets. |
Risks relating to treasury management
In an attempt to increase its treasury yield, chinadotcom we have invested in debt securities, which exposes us to interest rate and credit risks and could cause us to lose our interest payments or invested principal
In order to increase the yield from our invested cash pending its use in the conduct of our business, we have increased our leverage and invested in debt securities that expose us to market risks such as credit default and interest rate risk. For a summary of the exposure of our debt securities to market risks associated with our treasury management activities, see Item 11 of this Annual Report,Quantitative and Qualitative Disclosures About Market Risk.
We manage our interest rate risk by maintaining a portfolio of trading and held-to-maturity investments which we believe to have high credit quality and relatively short average maturities. These instruments may include, but are not limited to, money-market instruments, bank time deposits, and variable rate and fixed rate obligations of corporations, government, and government sponsored enterprises such as the Federal National Mortgage Association, or Fannie Mae, in accordance with an investment policy approved by its Board of Directors. These instruments are denominated in U.S. dollars. The fair market value of our debt security investments, as of June 30, 2003, was $350.4 million.
11
Table of Contents
We also hold cash balances in accounts with commercial banks in the United States and foreign countries. These cash balances represent operating balances only and are invested in short-term time deposits of the local bank.
Many of our investments carry interest rate risk. When interest rates fall, the income from our investments in variable-rate securities declines. When interest rate rise, the fair market value of our investments in fixed-rate securities declines. Due in part to these factors, our future investment income may fall short of expectations or we may suffer losses in principal if forced to sell securities, which have declined in market value due to changes in interest rates. We attempt to mitigate risk by holding fixed-rate securities to maturity, but, if our liquidity needs force us to sell fixed-rate securities prior to maturity, we may experience a loss of principal.
We are also exposed to the risk of default by the issuers of our debt securities. We attempt to mitigate credit default risk by purchasing only investment grade securities as categorized by Moody’s Investor Service and Standard and Poor’s. The following chart breaks down our debt securities portfolio into four primary risk categories based on the Standard and Poor’s credit ratings as of June 30, 2003.
| Rating (Standard & Poor’s) | AAA | AA | A | BBB | Total | |||||||||||||||
| Amounts of debt securities outstanding as of June 30, 2003 (in US$ millions) | ||||||||||||||||||||
| Moody’s Investors Service | 330.4 | 0.0 | 0.0 | 20.0 | 350.4 | |||||||||||||||
| Standard & Poor’s | 330.4 | 0.0 | 0.0 | 20.0 | 350.4 | |||||||||||||||
At the end of each quarter, if the end of quarter price is below the original investment cost, the difference is charged to “accumulated other comprehensive income” under the shareholders’ equity section of our consolidated balance sheet. If the fair market value of any of our debt investments remains below its investment cost and is considered “other than temporary,” this decline would then be reflected as an expense under “impairment of cost investments and available-for-sale securities” in our consolidated income statement. Any such adjustment could have a material adverse effect on our business, financial condition, results of operations and share price.
In addition, sharp price movements or volatility shocks may reduce the liquidity of our treasury portfolio and in some circumstances our debt instruments may have no tradeable market. This could prevent us from altering or closing our security positions without incurring substantial losses. Certain of our investments would be subject to the additional risks of trading in foreign debt securities, which may not be regulated as rigorously as similar investments in the United States. Any losses from our investments in treasury instrument could have a material adverse effect on our business, financial condition, results of operations and share price.
Our entry into repurchase facilities with Fortis Bank and DBS Bank exposes us to interest rate, market and credit risks when we borrow funds from these facilities to make other investments
We have entered into repurchase facilities with Fortis Bank nv-sa an AA-rated bank (as rated by Standard & Poor’s) and DBS Bank, an A+ rated bank (as rated by Standard & Poor’s). The Fortis Bank facility allows us to draw up to $250.0 million for a one-year term. The DBS Bank facility allows us to draw up to $150.0 million for a three year term. Each drawdown will be agreed upon with the corresponding bank before execution. Both facilities were established to provide us with a source of capital to give us the flexibility to finance working capital requirements and acquisitions, as well as its treasury management program, without having to liquidate our investment portfolio on short notice.
12
Table of Contents
Under the repurchase facilities, a drawdown requires us to sell debt securities from our portfolio to the bank at an agreed to price, and the bank agrees to sell back to us the same securities at the same purchase price at a later date. In effect, the bank retains title to our securities as collateral during the life of the drawdown; however, the bank has agreed to pay us any income associated with the debt securities sold. In return, we have agreed to pay interest to the bank at a base-rate of Libor plus a fixed 0.20% or 0.35%. This base rate is set on every 3 month, 6 month or 1 year anniversary of the execution of the drawdown, as chinadotcom and the bank may mutually agree.
Use of the repurchase facilities with Fortis Bank and DBS Bank creates the following three primary risks:
| • | The risk associated with increased leverage which includes our obligation to pay back the borrowed funds in a timely manner. Required repayment of the facilities may cause us to liquidate a portion of our treasury portfolio at a time when such liquidation will result in losses on the sale of such debt instruments. |
| • | By setting aside debt securities as collateral under either repurchase facility, we incur the risk that if the banks themselves were to undergo an insolvency event, it could lose all or part of its debt securities set aside at such time with the bank. |
| • | The interest that we pay under the repurchase facilities floats depending upon Libor. Therefore, our future interest expenses with respect to amounts drawn under the repurchase facilities is uncertain because Libor rates may change. For example, if Libor rises extremely rapidly over the next few years chinadotcom’s interest expenses will rise commensurately. |
Further, because we have purchased, as of June 30, 2003 under the repurchase facilities, approximately $50.8 million of debt securities with drawdowns under its repurchase facilities, we are subject to risk associated with investment leverage. Since the base rate (Libor) of our drawdowns are reset periodically, in a rising interest rate environment, we run the risk that our borrowing rate might exceed any interest income that we receive from the debt securities purchased with the proceeds of drawdowns from the repurchase facilities. Any such negative interest rate differential, or “negative carry”, could have a material adverse effect on our financial results.
We rely upon our internal control systems to manage our treasury operations, and our treasury portfolio and returns on our treasury portfolio may be adversely affected if we incur greater risk than otherwise appropriate or downgrades occur in our portfolio
If we do not maintain adequate treasury management control systems, it could have a material adverse effect on our business, results of operations and financial condition. While we continually assess and improve our treasury management systems and policies, there is no assurance that our system of controls and policies will effectively prevent the incurrence of greater risk than is otherwise appropriate for us. Downgrades in our portfolio of investment grade debt securities may have a material adverse effect on our business, results of operations and financial condition. We may decide to outsource all or a portion of the investment management of our portfolio of debt securities to third party professional bond portfolio managers. For a summary of our treasury management program, its effects on our liquidity and capital resources and the material market risks, see Item 4.B. of this Annual Report,Business Overview – Treasury management,Item 5.B of this Annual Report,Operating and Financial Review and Prospects — Liquidity and Capital Resourcesand Item 11 of this Annual Report,Quantitative and Qualitative Disclosures About Market Risk, respectively.
We generally have not outsourced management of our debt investment portfolio to professional portfolio managers. A professional portfolio manager may be able to generate a higher return on our debt investments than our internal treasury staff.
13
Table of Contents
We generally have not outsourced a significant portion of our debt investment portfolio to professional portfolio managers. Professional managers may have broader experience and might enjoy greater resources than available to our internal treasury personnel. These factors might have meant we would have achieved a higher return than these on investments if we had outsourced management of our debt investment portfolio. Our portfolio of securities managed by a third party professional manager includes only $20.0 million invested with the Centauri Fund (currently rated BBB by Standard & Poor’s and Baa2 by Moody’s Investors Service) which is a bond fund. Accordingly, we are exposed to external management risk for this investment, and we rely on the professional skills of the fund manager to deliver our target interest income. The investment in the Centauri Fund is highly illiquid and could be difficult to realize prior to first available redemption in 2006.
Risks relating to our e-business Solutions business
The overall market for our e-business Solutions business remained relatively weak during 2002, and demand may remain weak for some time because of the current economic climate, which could lead to cancellations or delays in business and technology consulting initiatives, adversely affecting our business and growth prospects
The market for e-business Solutions has changed rapidly over the last four years. Since the second half of 2000, many companies have experienced financial difficulties or uncertainty, and canceled or delayed spending on technology initiatives as a result. These companies typically are not demonstrating the same urgency regarding technology initiatives that existed during the economic expansion that stalled in 2000. If large companies continue to cancel or delay their business and technology consulting initiatives because of the current economic climate, or for other reasons, our business, results of operations and financial condition and results of operations may be materially and adversely affected.
A substantial amount of our consulting revenues are billed on a fixed price basis which may be subject to cost overruns if we do not accurately estimate the costs of these engagements or if clients change the scope of a project
A substantial percentage of our consulting engagements are individual, non-recurrent, short-term projects billed on a fixed price basis as distinguished from a method of billing on a time and materials basis. Our failure to obtain new consulting business in any given quarter or estimate accurately the resources and time required for a consulting engagement, to manage client expectations effectively regarding the scope of the services to be delivered for the estimated fees or to complete fixed price engagements within budget, on time and to clients’ satisfaction (particularly if a client changes the scope of the project) could expose us to risks associated with cost overruns and penalties, any of which could have a material adverse effect on our business, results of operations and financial condition. We have been required to commit unanticipated additional resources to complete consulting engagement in the past, which has resulted in losses on those contracts. In addition, we may fix the price for some consulting engagements at an early stage of the process, which could result in a fixed price that turns out to be too low.
Our clients could unexpectedly terminate their contracts for our services which could result in a loss of expected revenues and additional expenses for staff
Some of our e-business Solutions contracts can be cancelled by the client with limited advance notice and without significant penalty. Termination by any client of a contract for our services could result in a loss of expected revenues and additional expenses for redeployment of staff and resources that were allocated to that client’s engagement. We could be required to maintain underutilized employees who were assigned to the terminated contract. The unexpected cancellation or significant reduction in the scope of any of our large projects could have a material adverse effect on our business, results of operations and financial condition.
The service contracts we sign with our customers may expose us to potential liabilities
14
Table of Contents
Our e-business Solutions and advertising businesses have executed services agreements with customers, some of which do not have disclaimers or limitations on liability for special, consequential and incidental damages, or do not have caps or have relatively high caps on the amounts our customers can recover for damages. We do not carry professional indemnity or other insurance covering our exposure to any claims or breaches under the customer contracts. In addition, we do not currently maintain any insurance policy with respect to our exposure to any claims with respect to limitation of liability or professional indemnity. A claim related to breaches under customer contracts could subject us to litigation and give rise to substantial liability for damages, including special, consequential or incidental, that in turn could materially and adversely affect our business and financial condition.
Failure by our third party suppliers to provide us with software and hardware components will affect our ability to operate our business
We depend on third party suppliers of software and hardware components. For our various business units, we rely on components that are sourced from key suppliers, including Best Software, Inc., Cisco Systems, Inc., International Business Machines Corporation, LSI Logic Corporation, Microsoft Corporation, Network Appliance, Inc., Oracle Corporation, Siebel Systems Inc., Sun Microsystems Corporation and Vignette Corporation. Any failure or delay on the part of our suppliers may prevent us from receiving the components, products and support we need to conduct our operations. Our inability to develop alternative sources for the software and hardware we need to operate our business may materially and adversely affect our operating efficiency and results of operations.
Risks relating to our Advertising and Marketing business
We are seeking to re-orient our advertising strategy, and significantly reduced operations in online advertising and e-marketing services. We cannot assure you that we will be successful in generating sufficient revenues or margins from our reoriented advertising strategy to replace revenues and margins from our reduced online advertising and e-marketing services businesses
During 2002, because of low margins, we significantly reduced our operations in online advertising and e-marketing services that involve the planning, sales, electronic delivery, tracking and post-campaign analysis of online banner advertisement campaigns and online direct mailing and sponsorships programs. While our operations have ceased in Australia, Hong Kong, Japan, the PRC, Singapore and Taiwan, we continue to maintain a presence in this sector in South Korea. However, following the expiry in April 2003 of our exclusive service agreement with Daum Communications, a leading South Korean portal company, the revenues from its online advertising and e-marketing services business have contracted. We are seeking to re-orient our advertising strategy away from online advertising and e-marketing services with low margins performed for a fixed fee which relies upon short-term advertising campaigns dependent upon high volume to higher margin database marketing related services used to develop targeted campaigns for clients. In our experience, margins from online advertising and e-marketing services range from 20% to 30% versus margins in database marketing related services which range from 50% to 70%. We cannot assure you that we will be successful in generating sufficient revenues or margins from our database marketing related services to replace revenues and margins from our reduced online advertising and e-marketing services business.
Our ability to generate and maintain significant revenues from online advertising and e-marketing services will depend, among other things, on:
| • | advertisers’ acceptance of the Internet as an effective and sustainable advertising medium; |
| • | the development of a large base of users of its portal network possessing demographic characteristics that are attractive to advertisers; |
15
Table of Contents
| • | availability of adequate and suitable ad serving technology; |
| • | our ability to contract with a diverse group of advertising affiliates with traffic patterns and user demographics that are attractive to advertisers; |
| • | the effectiveness of its advertising delivery, tracking and reporting systems; and |
| • | the effect of the development of Web software that blocks Internet advertisements before they appear on a user’s screen. |
Our strategy to target higher margin database marketing related services, which generated only a very small portion of our advertising revenues in 2002, is subject to numerous risks, may not be successful, and could therefore limit the amount of advertising revenues we can generate
Our re-oriented advertising strategy is to target higher margin database marketing related services utilizing data mining techniques. Data mining involves the process of analyzing significant amounts of data retained in a database to uncover underlying patterns that may indicate trends or relationships, and has become a more important part of customer relationship management as a method to better understand customer behavior and preferences. The uncovered relationship can then be utilized by a client to develop a targeted customer campaign. Database marketing related services generated only a very small portion of our advertising revenues in 2002, and is subject to numerous risks, including the following:
| • | our ability to successfully integrate Layabo Pty, Limited (now renamed Mezzo Business Databases Pty Limited), an Australian database marketing business and owner of the trademark IncNet, which we acquired in March 2002 to help us migrate towards higher margin database marketing related services stylizing data mining techniques; |
| • | our ability to integrate the databases from each of our marketing businesses to build a robust data set to enable effective application of data mining techniques; |
| • | our ability to successfully market services in this business segment outside of Australia where most of the businesses providing these services are currently located; |
| • | our ability to attract larger clients with correspondingly larger marketing budgets due to the limited size and scope of our currently operational base in Australia; |
| • | our ability to compete against other companies in this business segment which may have or develop better quality data sets and related products and services than ours; and |
| • | our ability to successfully migrate, if necessary, our current data sets, products and services to other technology formats in the future. |
Our re-oriented advertising strategy depends upon Mezzo’s ability to maintain up-to-date data sets. If Mezzo fails to maintain its data sets, its services will be less attractive to customers
Mezzo Business Databases Pty Limited is a wholly-owned subsidiary of chinadotcom, and is at the forefront of our re-oriented advertising strategy to target higher margin database marketing related services. We launched Mezzo in September 2001 as a new brand to encompass our advertising activities. Mezzo maintains multiple databases containing information about companies and businesses in Australia and New Zealand, such as standard and proprietary industry codes, sales revenue turnover, number of employees and company contact details. Mezzo maintains and updates the database through information it gathers from publicly available
16
Table of Contents
sources, as well as proprietary telephone inquires. Mezzo provides access to the database to assist clients in developing and refining marketing campaigns. While clients may simply pay a fee to access the database, Mezzo also offers clients analytical services utilizing data mining techniques. In addition, Mezzo will conduct direct marketing activities for clients using information available from the database, such as telemarketing campaigns conducted through an in-house call center, direct mailing campaigns, and management of customer loyalty programs and campaigns.
Our re-oriented advertising strategy depends upon Mezzo’s ability to maintain up-to-date data sets. If Mezzo fails to maintain its data sets, its services will be less attractive to customers. The ability of Mezzo to maintain its data sets can be affected by governmental actions in Australia, as well as actions by third parties to protect their proprietary rights, although Mezzo is not aware of any current prohibitions applicable to it which would prohibit its ability to maintain its data sets. For example:
| • | The Australian government has moved to restrict the use of publicly available telephone data in the Integrated Public Number Database for both consumers and business. While Mezzo believes that such governmental action will not impact Mezzo’s business because such data has not historically been used as a data source, restrictions on the use of such data climinates a potentially cost effective manner to increase the accuracy of telephone contact data in Mezzo’s datasets; and |
| • | A number of other database marketing organizations in Australia which compete with Mezzo rely on digitized versions of the Yellow Pages business telephone directory to generate and maintain their databases. Telstra, which owns the copyright to the Australian Yellow Pages, has recently moved to restrict the publishing and sale of Yellow Pages data by taking legal action against the major publisher of that material in Australia. Mezzo does not believe that actions by Telstra will impact Mezzo’s business because Mezzo does not rely on Yellow Pages material to produce its datasets. |
Privacy concerns may limit or prevent us from selling demographically targeted online advertising in the future
To the extent we collect data derived from user activity on our online advertising network, we cannot be certain that any trade secret, copyright or other protection will be available for this data or that third parties will not assert their rights to the data. We must also keep information regarding Web publishers confidential under our contracts with Web publishers. In addition, various technologies seeking to protect privacy, including the following, have affected or may affect our advertising business:
| • | any limitation on our ability to use cookies, which are bits of information keyed to a specific server, file pathway or directory location that are stored on a user’s hard drive and passed to a Web site’s server through the user’s browser software, could impair our future targeting capabilities; and |
| • | web-browsing software with enhanced privacy preference settings, allowing users to define settings to reject third party cookies automatically, may lower the total pool of users from whom any cookie-based third party ad serving solutions can collect and target ad delivery based on demographic data or data mining techniques. |
In Hong Kong, a company will contravene the Personal Data Ordinance if it collects information on its users, analyzes the information for a profile of the user’s interests and sells or transmits the profiles to third parties for direct marketing purposes without the user’s consent. As part of our future advertisement delivery system, we will be integrating information including a user’s online response rate to advertisements, name, address, age or e-mail address with third party databases to generate a comprehensive demographic profile of the Internet user. The transfer of this information, which provides an individual’s profile, may contravene the Personal Data Ordinance unless the individual expressly consents to the use of this information. Our future inability to obtain demographic profiles from Internet users that do not consent to this use or any contravention
17
Table of Contents
of relevant privacy legislation in our data collection or use or storage may have a material and adverse effect on our business.
If we lose the support of Xinhua News Agency, the ability of our www.china.com portal to penetrate the PRC Internet market may be adversely affected
We conduct our operations in the PRC with the sponsorship and support of Xinhua, the PRC government controlled media organization. During 2003, the operational control of the www.china.com portal was shifted from Xinhua to our own company management. Further transactions or consolidation may occur with respect to our portals. Xinhua, however, maintains editorial control over the www.china.com portal. We have entered into agreements with Xinhua and its affiliates to receive business-related content, consultation as to compliance with PRC regulations and related services that are fundamental to our ability to penetrate the PRC Internet market. Xinhua controls access to all foreign economic information disseminated in the PRC. The loss of Xinhua’s support, or any change in the policies of the PRC government regarding Xinhua and their support for our operations, could have a material adverse effect on the ability of our www.china.com portal to penetrate the PRC Internet market. In addition, our relationship with Xinhua may restrict our ability to provide information over our portal network outside the PRC since information may be considered offensive to Chinese regulatory authorities. These limitations may be a competitive disadvantage.
Risks relating to the sale of IT products and our enterprise software business
Our failure to successfully introduce, market and sell new products and technologies, enhance and improve existing products in a timely manner, and properly position and/or price our products, as well as undetected errors or delays in new products or new versions of a product and/or the failure of anticipated market growth could have a material adverse effect on our business, results of operations or financial position
Our IT and enterprise software products compete in a market characterized by rapid technological advances in hardware and software development, evolving standards in computer hardware and software technology and frequent new product introductions and enhancements. We continually seek to expand and refresh our product offerings to include newer features or products, and enter into agreements allowing integration of third-party technology into its products. The introduction of new products or updated versions of continuing products has inherent risks, including, but not limited to:
| • | product quality, including the possibility of software defects; |
| • | the fit of the new products and features with the customer’s needs; |
| • | the successful adaptation of third-party technology into our products; |
| • | educating our sales, marketing and consulting personnel to work with the new products and features; |
| • | competition from earlier and more established entrants; |
| • | market acceptance of initial product releases; |
| • | marketing effectiveness; and |
| • | the accuracy of assumptions about the nature of customer demand. |
As newer products are deployed, our service and maintenance organizations, along with our partners, will have to rapidly increase their ability to install and service these products, and we must rapidly improve our products’ ease-of-implementation and ease-of-use. The failure to successfully increase these capacities and make
18
Table of Contents
these improvements could result in significantly lower customer satisfaction, which could lead to lower license revenue.
Failure to upgrade older products will adversely affect revenue.
As we or our competition introduce newer products, the market’s demand for our older products declines. Declining demand reduces revenue from additional licenses and reduces maintenance revenue from past purchasers of our software. We must continually upgrade our older products in order for our customers to continue to see value in our maintenance services. If we are unable to provide continued improvements in functionality, or, alternatively, more customers with our older products to our newer products, declining maintenance and new license revenue from older products could have a material adverse effect on our enterprise software business.
If we are unable to develop new and enhanced products that achieve widespread market acceptance, we may be unable to recoup product development costs, and our earnings and revenue may decline
Our future success depends on our ability to address the rapidly changing needs of customers by developing and introducing new products, product updates and services on a timely basis. We must also extend the operation of our products to new platforms and keep pace with technological developments and emerging industry standards. We commit substantial resources to developing new software products and services. If the markets for these new products do not develop as anticipated, or demand for our products and services in these markets does not materialize or occurs slower than we expect, we will have expended substantial resources and capital without realizing sufficient revenue, and our enterprise software business and operating results could be adversely affected.
Our enterprise software revenues and operating results fluctuate significantly from quarter to quarter which may cause volatility in our share price
Many factors have caused and may in the future cause our enterprise software revenue and operating results to fluctuate significantly. Some of these factors are:
| • | the timing of significant orders, delivery and implementation of their products; |
| • | the gain or loss of any significant customer; |
| • | the number, timing and significance of new product announcements and releases by us or our competitors; |
| • | our ability to acquire or develop (independently or through strategic relationships with third parties), introduce and market new and enhanced versions of our products on a timely basis; |
| • | possible delays in the shipment of new products and purchasing delays of current products as our customers anticipate new product releases; |
| • | order cancellations and shipment rescheduling or delays; |
| • | patterns of capital spending and changes in budgeting cycles by our customers; |
| • | market acceptance of new and enhanced versions of our products; |
| • | changes in the pricing and the mix of products and services we sell; |
| • | seasonal variations in our sales cycle; |
19
Table of Contents
| • | the level of product and price competition; |
| • | changes in operating expenses; |
| • | exchange rate fluctuations; |
| • | the timing of any acquisitions and related costs; and |
| • | changes in personnel and related costs. |
In addition, we expect that a substantial portion of our enterprise software revenues will continue to be derived from renewals of maintenance contracts from customers of our software applications. These maintenance contracts typically expire on an annual basis, and the timing of cash collections of related revenues varies from quarter to quarter. In addition, our new license revenue and results of operations may fluctuate significantly on a quarterly and annual basis in the future, as a result of a number of factors, many of which are outside of its control. A sale of a new license generally requires a customer to make a purchase decision that involves a significant commitment of capital. As a result, the sales cycle associated with the new license revenue will vary substantially and will be subject to a number of factors, including customers’ budgetary constraints, timing of budget cycles and concerns about our pricing or introduction of new products.
If China Mobile or China Unicom fails to provide us with access to their mobile networks or their billing and collection systems, our mobile business could be terminated.
Our mobile services and applications revenues, which are derived from our acquisition of Newpalm in the second quarter of 2003, rely exclusively on China Mobile and China Unicom, and their respective provincial affiliates, for access to their customers over their mobile networks and for revenue through their billing and collection systems. Currently, there are no other mobile services providers in China. If China Mobile, China Unicom or any of their affiliates fails to provide us with these services or limits these services, we may be unable to find a reliable and cost-effective replacement in a timely manner and upon acceptable terms, if at all. In this event, our mobile services and applications business would not be viable and could be terminated.
If China Mobile or China Unicom increases its prices for accessing their mobile network or their billing and collection systems, our operating costs could increase.
Our mobile services and applications revenues rely exclusively on China Mobile and China Unicom, and their respective provincial affiliates, for access to our subscribers over their mobile networks and for revenue through their billing and collection systems. We pay the mobile operators for these services pursuant to non-exclusive, short-term, renewable contracts. We cannot assure you that our existing contracts will be offered for renewal in a timely manner and upon acceptable terms, if at all. We have no control over the amount we are charged for these services. China Mobile or China Unicom, or any one of their respective affiliates, may increase the amount they charge us for their services. If this were to happen, our operating costs could increase and our results of operations could be materially and adversely affected.
If China Mobile or China Unicom fails to bill their customers or provide billing confirmations for our mobile services and applications, our revenues could be significantly reduced.
Our mobile services and applications revenues, rely exclusively on China Mobile and China Unicom, and their respective provincial affiliates, to record and bill their customers for our services in the subscribers’ monthly bills. We rely on billing confirmations provided by the mobile operators that reflect the actual services they have billed to their customers to receive payment and recognize revenue. A mobile operator may fail to bill a customer for services we have recorded as having been provided due to technical problems with the mobile operator’s billing system, in which case we would not recognize the revenue associated with such services without confirmation from the mobile operator. The magnitude and frequency of these transmission failures can
20
Table of Contents
vary from month to month, and from operator to operator. For example, for the nine months ended September 30, 2003, the average monthly transmission failure rate ranged from 10% to 30%. We do not expect to recover revenue that is lost as a result of transmission failures. If a mobile operator refuses or otherwise fails to pay us our share of the subscription fees collected from their mobile customers, our revenues could be significantly reduced.
| • | if CMCC, Unicom or another mobile network operator is unwilling to cooperate with chinadotcom, it may not be able to find substitute partners; |
If the PRC government considers our existing licensing structures to be insufficient in meeting compliance requirements with applicable licensing restrictions, or if we fail to comply with changes to these requirements or restrictions, our portal and SMS businesses could be materially adversely affected.
The PRC government regulates access to the Internet by imposing strict licensing requirements on Internet service providers, or ISPs. Generally, the provision of different types of infrastructure telecommunication services and value-added telecommunication services is subject to different licensing regimes in the PRC. In April 2003, a new regulation was promulgated by the Ministry of Information Industry, or the MII, in connection with the categorization of each kind of telecommunication business.
While we believe that our current operation complies with all existing PRC laws, rules and regulations, there are substantial uncertainties regarding the interpretation of current Internet laws and regulations. It is possible the PRC government may take a view contrary to ours because there are no well established precedents or clear judicial interpretations to support our interpretations and views of the laws, rules and regulations. Issues, risks and uncertainties relating to PRC government regulation of China’s Internet sector include:
| • | recently enacted regulations applying to Internet-related services and telecom-related activities. While many aspects of these regulations remain unclear, they purport to limit and require licensing of various aspects of the provision of Internet information services. If these regulations are interpreted to preclude our current ownership structure or business model, our portal and SMS businesses could be severely impaired; and |
| • | the MII has stated that the activities of Internet content providers, or ICPs, are subject to regulation by various PRC government authorities depending on the specific activities conducted by the ICP. Various government authorities have enacted several new laws and regulations that govern these activities. The areas of regulation currently contemplated include: |
| • | online advertising; |
| • | online news reporting; |
| • | online publishing; |
| • | online securities trading; |
| • | online gaming; |
| • | online broadcasting; |
| • | bulletin board service; and |
| • | the provision of industry-specific information (e.g., pharmaceutical products) over the Internet, etc. |
21
Table of Contents
Other aspects of our online operations may be subject to regulation in the future.
In addition to the regulations promulgated by the PRC national government, some local governments, such as the Beijing local government, have also promulgated local rules applicable to Internet companies operating within their respective jurisdictions. These local rules may also create additional barriers in relation to the operation of our business.
If we fail to establish and maintain relationships with content providers and mobile network operators, we may not attract or retain users
We rely on a number of third party relationships to attract traffic and provide content to make our portals more attractive to advertisers and consumers. Most of these arrangements are not exclusive and are short-term or may be terminated at the convenience of the other party. We cannot assure you that our existing relationships will result in sustained business partnerships, successful service offerings, significant traffic or significant revenues. In addition, much of the third party content provided to our portal is also available from other sources or may be provided to other companies. If our competitors present the same or similar content in a superior manner, it would adversely affect our visitor traffic.
We may be held liable for information retrieved from our portal network which may expose us to liability for claims for defamation, infringement of third party intellectual property rights, or violation of censorship laws
Because our services can be used to download and distribute information to others, there is a risk that claims may be made against us for defamation, negligence, copyright or trademark infringement or other claims based on the nature and content of that material, such as violation of censorship laws in the PRC. We do not carry liability insurance to cover potential claims of this type, except for directors’ and officers’ liability insurance, so any imposition of liability could have a material adverse effect on our business, results of operations and financial condition. See “—Political, Economic and Regulatory Risks — PRC regulation of content distributed on the Internet may adversely affect our business” below.
We and Newpalm have attempted to comply with restrictions on foreign investment in the PRC Internet and mobile content sectors imposed by the PRC government. If the PRC government finds that these arrangements do not comply with the relevant foreign investment restrictions or changes its restrictions, our business in the PRC will be adversely affected.
The PRC government regulates access to the Internet by imposing strict licensing requirements and requiring Internet service providers, or ISPs, in the PRC to use the international inbound and outbound Internet backbones. The PRC government may require that we obtain a license for Internet access in the future based on new legislation or otherwise. We cannot provide assurance that we will be able to obtain any necessary license required in the future or that future changes in PRC government policies will not impose additional regulatory requirements on us or our service providers, intensify competition in the PRC information industry or otherwise have a material adverse effect on our business, financial condition and results of operations.
The PRC has recently begun to regulate its Internet sector by making pronouncements or enacting regulations regarding the legality of foreign investment in the PRC Internet sector and the existence and enforcement of content restrictions on the Internet. We believe that our current ownership structure complies with all existing PRC laws, rules and regulations. There are, however, substantial uncertainties regarding the interpretation of current PRC Internet laws and regulations. In addition, new PRC Internet laws and regulations were recently adopted. Accordingly, it is possible that the PRC government will ultimately take a view contrary to ours because there are no well established precedents or clear judicial interpretations to support and approve the interpretations and views of the laws, rules and regulations we have taken.
22
Table of Contents
Issues, risks and uncertainties relating to PRC government regulation of the PRC Internet sector include the following:
| • | the PRC recently enacted regulations applying to Internet-related services and telecom-related activities. While many aspects of these regulations remain unclear, they purport to limit and require licensing of various aspects of the provision of Internet information services. If these regulations are interpreted to be inconsistent with our current structure, our business will be severely impaired; |
| • | under the agreement reached in November 1999 between the PRC and the United States concerning the United States’ support of China’s entry into the World Trade Organization, or WTO, foreign investment in PRC Internet services will be liberalized to allow for 30% foreign ownership in key telecommunication services, including PRC Internet ventures, for the first year after China’s entry into the WTO, 49% in the second year and 50% thereafter. China officially entered the WTO on December 11, 2001. However, the implementation of China’s WTO accession agreements is still subject to various conditions; and |
| • | the Ministry of Information Industry, or MII, has also stated that the activities of Internet content providers, or ICPs, are subject to regulation by various PRC government authorities, depending on the specific activities conducted by the ICP. Various government authorities have stated publicly that they are in the process of preparing new laws and regulations that will govern these activities. The areas of regulation currently include online advertising, online news reporting, online publishing, online securities trading and the provision of industry-specific (e.g., drug-related) information over the Internet. Other aspects of our online operations may be subject to regulation in the future. |
The interpretation and application of existing PRC laws and regulations, the stated positions of the MII and the prospect of new laws or regulations have created substantial uncertainty regarding the legality of existing and future foreign investments in, and the businesses and activities of, PRC Internet companies, including us and Newpalm.
Accordingly, it is possible that the relevant PRC authorities could, at any time, assert that any portion or all of our or Newpalm’s existing or future businesses and ownership structure that involve trust deed arrangements violate existing or future PRC laws, regulations or policies. If we or Newpalm are found to be in violation of any existing or future PRC laws or regulations, the relevant PRC authorities would have broad discretion in dealing with such violation, including, without limitation, the following:
| • | levying fines on us or Newpalm; |
| • | confiscation our or Newpalm’s income; |
| • | revoking our business license or the business license of Newpalm; |
| • | closing the business operations of ourselves or Newpalm in the PRC; |
| • | requiring us to restructure our or Newpalm’s ownership structure, operations or business relationships in the PRC; and |
| • | requiring us or Newpalm to discontinue any portion or all of our Internet or telecommunications business in the PRC. |
Any of these actions would have a material adverse effect on our business, financial condition and results of operations.
We and Newpalm have entered into trust deed arrangements and depend upon these contractual arrangements for the success of our business. These arrangements may not be as effective in providing operational control as direct ownership of these businesses, and may be difficult to enforce
23
Table of Contents
Because the PRC government has imposed restrictions and prohibitions on owning Internet content or telecommunications operations in the PRC, we and Newpalm have entered into trust deed arrangements pursuant to which ICP licenses may be owned legally but held on our behalf through various onshore and offshore arrangements by PRC citizens who may be our directors, officers, employees or other agents. Trust deed arrangements have been entered into to provide services through contractual agreements between the parties. These arrangements may not be as effective in providing control over our Internet content or telecommunications operations as direct ownership of these businesses, although we may take additional measures to increase our ability to exert control, such as entering into comprehensive licensing agreements. If the trustees under our trust deed arrangements which are PRC individuals fail to perform their obligations under these arrangements, we may have to rely on legal remedies under PRC law, Hong Kong law and decisions or arbitral bodies, which we cannot assure you would be effective or sufficient. Also, there can be no assurance that any of these structures adopted or apparently approved, or any structure that we may eventually reorganize into, will or can be approved by the relevant PRC authorities. Furthermore, these arrangements may be viewed as entrenching certain person’s or persons’ in management or other positions with us or transferring certain value to such person or persons, especially if any conflict of interest arose in connection with the arrangements.
Risks relating to our network, intellectual property and personnel
Our computer network is vulnerable to hacking, viruses, spamming and other disruptions which may cause us to lose key clients, expose us to liability for our clients’ losses, or prevent us from securing future business
Inappropriate use of our Internet services or errors or omissions in processing instructions or data available in our computer system or databases could jeopardize the security of confidential information stored in our computer system, which may cause us to lose key clients, expose us to liability for our clients’ losses and prevent us from securing future business, any of which could have a material adverse effect on our business, financial condition, results of operations and share price.
Inappropriate use of the Internet includes attempting to gain unauthorized access to information or systems (commonly known as cracking or hacking) and repeated transmission of unsolicited e-mail messages (commonly known as e-mail bombing or spamming). Our current policies, procedures and configurations for managing our systems, including our computer servers, may not be adequate to protect our facilities and the integrity of our user and customer information. Although we implement security measures to protect our facilities and the integrity of our user and customer information, such measures could be ineffective or circumvented.
Spam
As is typical for many businesses offering online based products and services such as emails, we experience spam attacks on a regular basis. Our systems use filters which identify common words and sentence structures typically used in spamming to block spam attacks. Our network administrators constantly review spam activities as a part of system maintenance, and also consult with outside authorities to learn about the latest techniques spammers use to attack systems which is often used to update our filters. In addition, the email products we offer have their own filtering capabilities which allow users to further refine the emails which should be blocked. We encourage users to notify us of any suspect email activity, and we will terminate user accounts which are detected as engaging in spamming activities. However, our systems continue to experience spam attacks regularly, and there is no assurance that the spam attacks will not become more frequent and materially disrupt our operations.
Viruses
While our computer systems have occasionally experienced problems as a result of viruses, we have not experienced extended system outages as a result of viruses. To protect our systems from viruses, we have
24
Table of Contents
installed in on our networks commercially available antivirus software produced for enterprise networks. We update on a daily basis our library of viruses to be scanned for, and perform anti-virus updating activities upon computers when they log on to our network. In addition, upon receipt of specific information that a new virus is causing difficulties across the computer networks of a number of other companies, our system administrators will send out virus alerts to its users to inform them about the virus activities, including, when applicable, advice not to open emails with specified tag lines or headers. Nonetheless, our efforts to protect our systems from viruses may not be adequate and there is no assurance that we will not experience extended system outages due to viruses in the future.
Hacking
Our computer networks have been the target of sporadic hacking activities over the years, although most hacking activities have been targeted against the gateways our computer systems use to access the Internet which are operated by third parties, rather than directly against our systems. We have set up firewalls using commercially available software to shield its systems from hacker attacks. In addition, we use commercially available software which monitors traffic across our network looking for abnormal activities and traffic which may signal a hacker attack, and also use restricted access lists to restrict to unauthorized traffic on our routers to limit hacker attacks. However, we may continue to be the target of hacking activities, and there is no assurance that the firewalls and software we have implemented will adequately protect our systems from such hacking activities.
Alleviating problems caused by computer viruses or other inappropriate uses or security breaches may require interruptions, delays or cessation in our services, in addition to the outages that occur in our systems from time to time for various reasons, including power interruptions, errors in instructions, equipment inadequacy, capacity and other technical problems. We do not carry errors and omissions or other insurance covering losses or liabilities caused by computer viruses, security breaches or spamming attacks. Compromises or breaches in the security or integrity of our facilities or customer or user information, or inappropriate use of our Internet services, could subject us to litigation and could adversely affect our customer base, business, share price, results of operation and financial condition.
We rely on software and hardware systems that are susceptible to failure, and in the event of service operations or other related problems, our operating efficiency and results of operations may be adversely affected
Any system failure or inadequacy that interrupts our services or increases the response time of our services could reduce user satisfaction, future traffic and our attractiveness to advertisers and consumers. There can be no assurance that our technologies, services and products will not experience interruptions or other related problems, which could affect our operating efficiency and results of operations.
In addition, as our Web pages and traffic increases, there can be no assurance that we will be able to scale our systems proportionately. There also can be no assurance that our ad serving capabilities will be adequate for our business needs or properly track the number of impressions on our advertising affiliates. We also depend on Web browsers, ISPs, and other Web site operators in Greater China and elsewhere that have experienced significant system failures and electrical outages in the past. Our users have experienced difficulties due to system failures that were unrelated to our systems and services.
We have limited backup systems and redundancy and we have experienced system failures and electrical outages that have disrupted our operations. We do not have a disaster recovery plan in the event of damage from fire, natural disasters, power loss, telecommunications failures, break-ins and similar events. We may experience a complete system shut-down if any of these events were to occur. To improve performance and to prevent disruption of our services, we may have to make substantial investments to deploy additional servers or one or more copies of our Web sites to mirror our online resources. Because we carry property insurance with low coverage limits, our coverage may not be adequate to compensate us for our losses. If we do not increase our
25
Table of Contents
capacity and our redundancy, these constraints could have a material adverse effect on our business, results of operations and financial condition.
We may be unable to protect or enforce our own intellectual property rights adequately and may be involved in future litigation over our use of technology rights
As we increasingly develop or acquire intellectual property, including the recent purchase of the URLs, the recent purchase of OpusOne Technologies International Inc., or OpusOne Technologies, which has developed several proprietary enterprise software related applications for use in human resources, payroll administration, attendance tracking and financial accounting, and the development of expresso (our proprietary e-mail direct marketing technology) by in-house developers, our ability to adequately protect our intellectual property rights becomes relatively more important to our business as a whole. We regard the protection of our trademarks, service marks, copyrights, patents, domain names, trade dress and trade secrets as important to our success. We protect our intellectual property rights by relying on a combination of trademark, service mark, copyright, patent, trade dress and trade secret laws and through the domain name dispute resolution system. We also rely on contractual restrictions to protect our proprietary rights in products, services and methodologies.
We enter into confidentiality agreements and assignments of intellectual property with our employees, consultants, resellers and sub-agents, and control access to and distribution of our documentation, source code and other licensed information. In spite of these precautions, it may be possible for such persons to breach such precautions or controls or a third party to copy or otherwise obtain and use our licensed services or technology without authorization, or to develop and apply similar technology independently. In addition, effective copyright, trademark, service mark and trade secret protection is very expensive to maintain, may be unavailable or limited, and the global nature of the markets in which we operate makes it practically impossible to control the ultimate destination of our goods and products. Protection may not be available in every country in which our intellectual property and technology is used. Furthermore, we must also protect our trademarks, patents and domain names in an increasing number of jurisdictions, a process that is expensive and may not be successful in every location. Policing the unauthorized use of our licensed technology is difficult as are the steps necessary to prevent the misappropriation or infringement of our licensed technology. In addition, further litigation may be necessary to enforce our intellectual property rights, to protect our trade secrets or to determine the validity and scope of the proprietary rights of others, which could result in substantial cost to us, divert our resources and have a material adverse effect on our business, results of operations and financial condition.
We currently own, license, resell and distribute via sub-agents intellectual property and technology from third parties. As we continue to develop intellectual property and introduce new products and services that require new technology, we anticipate that we may need to obtain licenses for additional third party technology. We cannot provide assurance that these existing and additional technology licenses will be or will continue to be available to us on commercially reasonable terms, if at all. In addition, it is possible that in the course of using new technology, we or our sub-agents may inadvertently breach the technology rights of third parties and face liability for our breach. Our inability to obtain these technology licenses or avoid breaching third party technology rights could require us to obtain substitute technologies of lower quality or performance standards or at greater cost which could delay or compromise our introduction of new products and services, and could materially and adversely affect our business and financial condition.
We are subject to possible infringement claims, which could be time consuming and costly to defend, divert management’s attention and resources or cause product shipment delays
We expect that software product developers will increasingly be subject to infringement claims as the number of products and competitors in our various industry segments grow and the functionality of products in different industry segments overlaps. Any such claims, with or without merit, could be time consuming and costly to defend, divert management’s attention and resources, cause product shipment delays or require
26
Table of Contents
chinadotcom to enter into royalty or licensing agreements. Such royalty or licensing agreements, if required, may not be available on terms acceptable to us, if at all, and may require the payment of substantial amounts of money. In the event of a successful product infringement claim against us or its failure or inability to license the infringed or similar technology, our business, operating results and financial condition could be materially adversely affected.
We are exposed to product liability claims, which could be time consuming and costly to defend, divert management’s attention and resources or cause product shipment delays
Our enterprise software license agreements with its customers typically contain provisions designed to limit its exposure to potential product liability claims. We carry insurance to protect against such claims. It is possible, however, that the limitation of liability provisions contained in our license agreements may not be effective as a result of U.S. or foreign laws or ordinances enacted in the future or because of judicial decisions, and that liability insurance may not be available, or that coverage for specific claims may be denied. Although we have not experienced any material product liability claims to date, our sale and support of products may entail the risk of such claims. A successful product liability claim brought against us could have a material adverse effect upon its business, operating results and financial condition.
Defects in our enterprise software products could increase our costs, adversely affect our reputation, diminish demand for our products and hurt our operating results
As a result of their complexity, our enterprise software products may contain undetected errors or viruses. Errors in new products or product enhancements might not be detected until after initiating commercial shipments, which could result in additional costs, delays, possible damage to our reputation and could cause diminished demand for our products. This could lead to customer dissatisfaction and reduce the opportunity to renew maintenance or sell new licenses.
We rely on key personnel. In the event we lose the services of key employees, it may be costly and time consuming for us to locate other personnel with the required skills and experience.
Our success depends on the continued efforts of our board members, our senior management and our technical, marketing and sales personnel. These persons may terminate their association or employment with us, or they may be terminated by us, at any time. We do not maintain “key person” life insurance policies. Our loss of the services of key members of senior management or experienced personnel in our key revenue producing businesses, or our inability to attract or retain additional qualified board members, senior managers or personnel in a timely manner, or health, family or other personal problems of key personnel could have a material adverse effect on our business, financial condition, results of operations and share price.
Our success also depends on our ability to attract and retain additional highly qualified management, technical, marketing and sales personnel, although there are no special personnel specific to IMI upon which we depend. The process of hiring employees with the combination of skills and attributes required to implement our business strategy can be extremely competitive and time-consuming. We compete with more established companies with greater resources that offer more attractive compensation or employment conditions for a limited number of qualified individuals. As a result, we may be unable to retain or integrate existing personnel or identify and hire additional qualified personnel. Furthermore, our success depends upon our ability to retain or replace the members, particularly the independent members, of our Board of Directors.
We have relied on stock options to compensate our employees. In the event employees do not consider their options as valuable compensation, we may need to provide additional compensation at additional expense.
We have granted stock options to many of our employees in lieu of additional salary. In August 2001 we cancelled approximately 1.2 million stock options, and in February 2002 we issued 665,000 new stock options
27
Table of Contents
with an exercise price of US$2.87 per share pursuant to our stock option program. However, there remain a significant number of employees and all of our directors and executive officers who did not receive, or were not eligible to participate to receive grants of new stock options who continue to hold stock options that have strike prices that may be far above our current share price. As a result, some of our employees may not consider their options to be valuable compensation, and we may need to provide additional compensation, in the form of additional salary, bonuses or equity, in an effort to retain those existing employees. Our inability to retain our employees, particularly our senior officers, and key sales, technical, marketing and other service personnel in our key revenue producing businesses could have a material adverse effect on our business, financial conditions, results of operations and share price.
Risks Relating to our Class A Common Shares
Our share price could be adversely affected if our major strategic shareholders materially change their holdings in our shares, particularly if the share holdings are not disposed of in an orderly manner
As of September 30, 2003, Xinhua, through a wholly-owned subsidiary, owned 7,362,734 of our common shares, or approximately 7.4% of our total outstanding share capital and has appointed one director to our board. If Xinhua does not dispose of its shareholdings in an orderly manner, or if the market expects Xinhua to dispose of additional shares, this could adversely affect our share price, our business, and financial or other condition. During 2001, Xinhua disposed of 1,411,600 shares of our shares reducing their ownership in our shares from 9.1% as of December 31, 2000 to 7.4% as of March 31, 2003. There is no guarantee that Xinhua will continue to hold our shares going forward for any length of time.
On September 23, 2003, AOL Time Warner, or AOL, which previously held 6.8% of our outstanding share capital, filed a Schedule 13G/A indicating that it ceased to be one of our shareholders following the sale of its entire shareholding in chinadotcom. In addition, in January 2003, New World Infrastructure Limited ceased to be one of our shareholders following the sale of its entire shareholding in the open market, as well as in privately negotiated transactions with us, Asia Pacific Online Limited, or APOL, and its chairman. In this transaction, in January 2003, New World Infrastructure Limited and its wholly-owned subsidiary entered into a binding summary of terms with APOL with respect to its entire holdings of 8,968,560 of chinadotcom common shares. Under the summary of terms, New World agreed to sell 4.5 million shares to APOL at US$2.50 per share and provided APOL with a thirty day option and right of first refusal to purchase the balance of the shares at US$2.50 per share. APOL’s option and right of first refusal on the balance of the shares, however, was subordinated to a right granted to us to purchase such shares at US$2.50 per share which right we elected to exercise. APOL assigned the right to purchase 200,000 of its 4.5 million shares to Dr. Raymond Ch’ien, our Chairman. Later in January 2003, New World Infrastructure Limited executed agreements with each of chinadotcom, APOL and Dr. Ch’ien whereby we purchased 4,468,560 common shares. APOL purchased 4,300,000 common shares, and its chairman purchased 200,000 common shares from New World Infrastructure Limited in January 2003, respectively, each at a price per share of $2.50. APOL is owned by the spouse of Mr. Peter Yip, our chief executive officer, and by a trust established for the benefit of Mr. Yip’s children.
A small group of our existing shareholders control a significant percentage of our common shares, and their interests may differ from other shareholders
APOL has beneficial ownership of approximately 19.0% of our common shares. In addition, Xinhua, Capital Group International, Inc. and Jayhawk Capital Management, L.L.C. have beneficial ownership of approximately 7.4%, 7.1% and 7.0% of our common shares, respectively.
Accordingly, these shareholders, particularly if they act together, will have significant influence in determining the outcome of any corporate transaction or other matter submitted to shareholders for approval, including:
28
Table of Contents
| • | mergers, consolidations and other business combinations which under the law of the Cayman Island requires the approval of at least 75% of the shares voting at the meeting; |
| • | election of directors which under the law of the Cayman Islands requires the approval of a simple majority of the shares voting at the meeting; |
| • | removal of directors which under the law of the Cayman Islands requires the approval of at least 66 2/3% of the shares voting at the meeting; and |
| • | amendments to chinadotcom’s memorandum and articles of association which under the laws of the Cayman Islands requires the approval of at least 66 2/3% of the shares voting at the meeting. |
At the result, these shareholders, if they act together, may be able to effectively prevent a merger, consolidation or other business combination, prevent removal of a director and prevent amendments to our memorandum and articles of association.
Our share price has been, and may continue to be, extremely volatile, which may not be attractive to investors
The trading price of our common shares has been, and is likely to continue to be, extremely volatile. During the period from July 12, 1999, the date we completed our initial public offering, to December 31, 2002, the closing price of our shares ranged from US$1.86 to US$73.4375, adjusted for our two stock splits. From January 1, 2003 to December 31, 2003, the closing price of our shares ranged from a low of US$2.73 per share on March 11, 2003 to a high of US$14.46 per share on July 14, 2003. There is no assurance that our share price will not fall below its historic or yearly low.
The trading price of our Class A Common Shares is subject to significant volatility in response to, among other factors:
| • | investor perceptions of our business, the market performance of our peer companies in the Greater China portal business, and enterprise software businesses in general; |
| • | our significant acquisitions, partnerships, joint ventures or capital commitments; |
| • | trends and developments in all the markets in which we compete; |
| • | variations in our operating results; |
| • | our new product or service offerings; |
| • | changes in our financial estimates by securities analysts; |
| • | technological innovations; |
| • | litigation; |
| • | changes in pricing made by us, our competitors or providers of alternative services; |
| • | the depth and liquidity of the market for our shares; and |
| • | general economic and other factors. |
In addition, the trading price of our common shares has experienced extreme price and volume fluctuations. These fluctuations often have been unrelated or disproportionate to our operating performance. Broad market, political and industry factors may also decrease the price of our common shares, regardless of our operating performance. Securities class-action litigation and regulatory investigations often have been instituted against companies following steep declines in the market price of their securities.
We are currently the subject of a class action lawsuit with respect to its initial public offering allocations which, if finally judicially determined against us, could cause us to be liable for significant judgment awards.
We are currently the subject of multiple class action lawsuits with respect to our initial public offering, or IPO, allocations. On June 26, 2003, the plaintiffs in the consolidated initial public offering class action lawsuits
29
Table of Contents
currently pending against us and over 300 other issuers who went public between 1998 and 2000, announced a proposed settlement with us and the other issuer defendants. The proposed settlement provides that the insurers of all settling issuers will guarantee that the plaintiffs recover $1 billion from non-settling defendants, including the investment banks that acted as underwriters in those offerings. In the event that the plaintiffs do not recover $1 billion, the insurers for the settling issuers will make up the difference. Under the proposed settlement, the maximum amount that could be charged to our insurance policy in the event that the plaintiffs recovered nothing from the investment banks would be approximately $3.9 million. We believe that we have sufficient insurance coverage to cover the maximum amount that it may be responsible for under the proposed settlement. The independent members of our board of directors approved the proposed settlement at a meeting held in June 2003. It is possible, however, that the parties may not reach agreement on the final settlement documents or that the federal district court may not approve the settlement in whole or in part, in which event litigation could continue, and we could be liable for significant judgment awards against us if a final judgment is rendered against us. No provision has been made for any expenses that might arise as a result of the class action lawsuits.
There can also be no assurance that we will not be subjected to additional litigation of a similar form or type in the future. These class action lawsuits and any future litigation or investigations, if initiated against us would result in substantial costs and a diversion of its management’s attention and resources and could have a material adverse affect on our business, results of operation, financial condition and share price.
We may incur significant costs to avoid being considered an investment company under the Investment Company Act of 1940
We may incur significant costs and management time to avoid investment company status under the Investment Company Act of 1940. Based upon an analysis of our assets as at December 31, 2002 and income for the year 2002 and the manner in which we intend to operate our business, we do not believe we will be considered an investment company. The determination of whether we will be an investment company will be based primarily upon the composition and value of our assets, which are subject to change, particularly when market conditions are volatile. As a result, we could inadvertently become an investment company in the future. It is not feasible for us to be regulated as an investment company because application of Investment Company Act regulations are inconsistent with our strategy of actively managing, operating and promoting collaboration among our businesses and network of strategic partners.
We are classified as a passive foreign investment company which will subject our U.S. investors to adverse tax rules
Based upon an analysis of our assets as at December 31, 2002 and income for the year 2002, during 2002, we were a passive foreign investment company, or PFIC, for United States federal income tax purposes. We have substantial passive assets in the form of cash and cash equivalents and treasury instruments, and can provide no assurance that we will not continue to be classified as a PFIC for 2003 or any future tax year. The determination of whether we would continue to be a PFIC would be principally based upon:
| • | the composition of our assets, including goodwill, the amount of which will depend, in part, on our total net assets and the market value of our Class A Common Shares, which is subject to change; and |
| • | the amount and nature of our income from time to time. |
We have limited control over these variables. To the extent we do have control over these variables, we may take steps to reduce the material and adverse effect that our PFIC classification may have on our business, financial condition and results of operations.
Since we are a PFIC, U.S. investors will be subject to adverse United States federal income tax consequences, see Item 10.E. of this Annual Report, "Additional Information — Taxation — Tax Consequences
30
Table of Contents
of U.S. Holders — Passive Foreign Investment Company Status.” U.S. investors are strongly urged to consult their own tax advisors regarding the application of the PFIC rules to their particular circumstances.
The Nasdaq National Market may delist our common shares, and if we are delisted there may not be an active trading market for our common shares
Our ability to remain listed on the Nasdaq National Market will depend on our ability to satisfy applicable Nasdaq criteria including our ability to maintain a minimum bid price of US$1.00. Since our initial public offering and listing on Nasdaq in July 1999, the lowest closing price for our shares was US$1.86 per share on July 23, 2002. On December 31, 2003, the closing price for our shares was US$8.07 per share. If we are unable to continue to satisfy the applicable Nasdaq listing criteria, Nasdaq may begin procedures to remove our common shares from the Nasdaq National Market. If we are delisted from the Nasdaq National Market, an active trading market for our common shares may no longer exist and the price of our common shares will decrease.
Substantial amounts of our common shares are eligible for future sale, which could adversely affect the market price of our shares
Sales of substantial amounts of our Class A Common Shares in the public market could adversely affect the market price for our shares. As of December 31, 2002, we had 101,296,363 Class A Common Shares issued and outstanding, substantially all of which may be sold pursuant to an effective registration statement under the Securities Act or an applicable exemption from registration thereunder, including Rule 144, which permits resales of securities subject to limitations depending on the holding period of such securities.
In addition, as we continue to issue and register shares to fulfill our contractual and acquisition-related obligations, and as our employees and other grantees have been or are granted additional options and warrants to purchase our shares, additional shares will be available-for-sale in the public market. We have also granted options to certain of our shareholders, directors and officers to purchase our shares, the vesting of which options may be accelerated upon a change-of-control event occurring. As a result, additional shares may be available-for-sale in the public market. The availability or perceived availability of additional shares could have a dilutive and negative impact on the market price of our shares.
In connection with AOL’s strategic acquisition of 6,795,200 of our Class A Common Shares prior to our initial public offering in July 1999, we granted AOL two warrants to purchase up to 18.5% and 6.5% of our total outstanding capital at an exercise price of US$5.00 per share and US$42.50 per share, respectively. The first warrant has been exercisable since October 2000 and the second warrant since July 2001. Both warrants will expire in July 2003. To the extent that AOL exercises all or a significant portion of these warrants, our shareholders will experience substantial dilution.
We have also issued other warrants, which may require that we issue additional common shares. In the future, we also may issue additional shares, or warrants to purchase our shares, in connection with acquisitions and our efforts to expand our business. Shareholders could face further dilution from our future share issuances.
Anti-takeover provisions in our charter documents may adversely affect the rights of holders of our common shares
Our memorandum and articles of association include provisions that could limit the ability of others to acquire control of chinadotcom, modify our structure or cause us to engage in change-of-control transactions. These provisions could have the effect of depriving shareholders of an opportunity to sell their shares at a premium over prevailing market prices by discouraging third parties from seeking to obtain control of chinadotcom in a tender offer or similar transaction.
31
Table of Contents
For example, our Board of Directors is divided into three classes, each having a term of three years, with the term of one class expiring each year. This provision would delay the replacement of a majority of our directors and would make changes to the Board of Directors more difficult than if such provision was not in place. In addition, our Board of Directors has the authority, without further action by our shareholders, to issue up to 5,000,000 preferred shares in one or more series and to fix their designations, powers, preferences, privileges, and relative participating, optional or special rights and the qualifications, limitations or restrictions, including dividend rights, conversion rights, voting rights, terms of redemption and liquidation preferences, any or all of which may be greater than the rights associated with our Class A Common Shares. Our Board of Directors, without shareholder approval, may issue preferred shares with voting, conversion or other rights that could adversely affect the voting power and other rights of the holders of our Class A Common Shares. Preferred shares could be issued quickly with terms calculated to delay or prevent a change in control of chinadotcom or make removal of management more difficult. If our Board of Directors issues preferred shares, the price of our Class A Common Shares may fall and the voting and other rights of the holders of our Class A Common Shares may be adversely affected.
Our shareholders may face difficulties in protecting their interests because we are incorporated under Cayman Islands law
Our corporate affairs are governed by our memorandum and articles of association, by the Companies Law and the common law of the Cayman Islands. The rights of shareholders to take action against our directors, actions by minority shareholders and the fiduciary responsibilities of our directors under Cayman Islands law are to a large extent governed by the common law of the Cayman Islands. The common law in the Cayman Islands is derived in part from comparatively limited judicial precedent in the Cayman Islands and from English common law, the decisions of whose courts are of persuasive authority but are not binding on a court in the Cayman Islands. Cayman Islands law in this area may conflict with jurisdictions in the United States. As a result, our public shareholders, may face more difficulties in protecting their interests in the face of actions against the management, directors or our controlling shareholders than would shareholders of a corporation incorporated in a jurisdiction in the United States. For instance a class action lawsuit may not be available to our shareholders as a vehicle for litigating securities matters against us in the Cayman Islands. In addition, shareholder derivative actions may generally not be brought by a minority shareholder in the Cayman Islands.
If you are not a registered shareholder and do not hold greater than 10,000 shares, you may not receive our proxy materials or other corporate communications.
chinadotcom is a Cayman Islands company and as such, we only need to distribute our proxy materials to its registered shareholders. Our proxy materials are delivered to all of our registered shareholders. We offer electronic delivery of proxy materials to our registered shareholders, and we mail proxy materials to each registered owner who has not opted to receive materials electronically. You are a registered shareholder if you have an account with our transfer agent, The Bank of New York, and if you hold a stock certificate evidencing your ownership of our common shares. Although we only need to distribute our proxy materials to registered shareholders under Cayman Islands law, we also distribute proxy materials to beneficial shareholders who hold greater than 10,000 of our shares. In an effort to maintain cost effectiveness, we have, and will continue to, mail the proxy materials to those beneficial shareholders who hold greater than 10,000 of our shares. You are a beneficial shareholder if a brokerage firm, bank trustee or other agent holds your common shares, and your name does not appear anywhere on our records. Rather, the name of the broker, bank or other nominee appears on our records as retained by our transfer agent, The Bank of New York. If you are not a registered shareholder and do not hold greater than 10,000 of our shares, you may not receive our proxy materials or other corporate communications. Therefore, if you are a beneficial shareholder and want to ensure that you do receive proxy materials, you are urged to become a registered owner. If you have questions on how to do so, we encourage you to contact your broker or bank to find out how to do so and you may also contact us.
32
Table of Contents
There is uncertainty as to our shareholders’ ability to enforce civil liabilities in Australia, the Cayman Islands, Hong Kong, South Korea, the PRC and Singapore
We are a Cayman Islands company and a substantial majority of our assets are located outside the United States. A substantial portion of our current operations is conducted in Australia, Hong Kong, South Korea, the PRC and Singapore. In addition, a majority of our directors and officers are nationals and/or residents of countries other than the United States. All or a substantial portion of the assets of these persons are located outside the United States. As a result, it may be difficult for you to effect service of process within the United States upon these persons. In addition, there is uncertainty as to whether the courts of Australia, the Cayman Islands, Hong Kong, South Korea, the PRC, Singapore and other jurisdictions would recognize or enforce judgments of United States courts obtained against us or such persons predicated upon the civil liability provisions of the securities laws of the United States or any state thereof, or be competent to hear original actions brought in Australia, the Cayman Islands, Hong Kong, South Korea, the PRC, Singapore or other jurisdictions against us or such persons predicated upon the securities laws of the United States or any of its states.
Risks Relating to the Greater China and Asian Software, Consulting, Mobile Applications and Marketing Industries
The industries in which we compete are intensely competitive and volatile, which could cause us to experience lower valuations, greater difficulty in obtaining funding, reduced liquidity, risks of consolidation and litigation
The Greater China and Asian technology and internet markets encompassing software, e-business consulting, mobile applications, internet portal and marketing are characterized by intense competition. These markets in North America, Asia and elsewhere have experienced marked downturns resulting in, among other things, lower valuations, greater difficulty in obtaining funding, increased consolidation, reduced liquidity, litigation and other structural problems in these markets. As a result, our competitors may be able to better position themselves to compete in our markets as they further consolidate, deteriorate, change or mature.
In addition, many of our existing competitors, as well as a number of potential new competitors, have longer operating histories in each of our target markets, greater name recognition, larger customer bases and greater financial, technical and marketing resources when compared to us. Any of our present or future competitors may provide products and services that provide significant performance, price, creative or other advantages over those offered by us. We can provide no assurance that we will be able to compete successfully against our current or future competitors, particularly as markets continue to consolidate, deteriorate, change or mature.
e-business Solutions competition. Our competition for strategic expertise, online marketing, technical solution delivery, and general business consultancy problem solving skills include:
| • | computer hardware and service vendors including International Business Machines and Hewlett-Packard Company; |
| • | Internet integrators and Web site design and development companies including Sapient Corporation, Digitas, Inc., Delirium Cybertouch Corporation and Dimension Data Holdings Limited; |
| • | large information technology consulting service providers including Accenture Ltd., Cambridge Technology Partners Inc. and Electronic Data Systems Corporation; and |
| • | local service providers in an individual market. |
Many of these companies are well funded with long operating histories of profitable performance. They possess a number of tangible strengths and advantages including extensive client lists and large numbers of skilled staff, complemented by well-established operating infrastructures. In addition to this, market conditions
33
Table of Contents
are currently extremely challenging. Our revenue streams have been volatile and despite the extended market downturn, the competitive threat has still not evaporated and it remains challenging in most markets. This has resulted in continued price pressure and an intensive level of competition in these markets.
Enterprise software and sale of IT products competition.Our competition in the market for a broad range of sophisticated business applications, including B2B electronic commerce, procurement, collaborative planning, financial, manufacturing, distribution, supply chain management, customer relationship management and human resource management is varied and includes a combination of international and local software providers. Our major competitors include:
| • | enterprise solutions software companies targeting mid-market companies, including Scala Business Solutions NV, Systems Union Group Inc., Exact Corporation, Microsoft Corporation, and local providers such as FlexSystem Holdings Ltd., Kingdee International Software Group Company Limited and UFSoft; |
| • | human resources and payroll solution providers, including PeopleSoft, Inc, SAP AG, and various local providers in Greater China including Cityray Technology (China) Ltd. and UFSoft; |
| • | process manufacturing enterprise resource planning providers, including JD Edwards & Company and QAD, Inc.; |
| • | large information technology consulting and outsourcing service providers including Accenture Ltd., Cambridge Technology Partners Inc., Electronic Data Systems Corporation, Wipro Ltd, and Infosys Technologies; |
| • | customer relationship management providers including Sales Logics and Siebel Systems, Inc.; |
| • | various providers of internet portal and web content applications; and |
| • | providers of business intelligence solutions including Brio Software, Inc., Business Objects SA and Cognos, Inc. |
Many of these companies are well funded with long operating histories of profitable performance. They possess a number of tangible strengths and advantages, including high quality client lists and high numbers of highly qualified staff, complemented by extensive operating infrastructures. The principal competitive factors in the market for enterprise software application software include product reputation, product functionality, performance, quality of customer support, size of installed base, financial stability, hardware and software platforms supported, price, and timeliness of installation.
Advertising competition.With respect to our strategy of moving towards higher margin database marketing related services, we anticipate that we will compete with companies that have developed high quality data sets and related products and services, such as The Dun & Bradstreet Corporation and Axciom. With respect to our online advertising strategy, we compete with a variety of Internet advertising networks, including DoubleClick, Inc. and BMC Software, Inc., for the sale of advertisements to our network of advertising affiliates.
In our overall advertising business, we also compete with content aggregators, companies engaged in advertising sales networks, advertising agencies, and traditional advertising media including print, radio and television.
34
Table of Contents
Portal competition.Our competition for user traffic, ease of use and functionality include Chinese and/or English language based Web search and retrieval companies, including Yahoo!, Inc., Lycos, Inc., Google, Inc., Overture Services, Inc., FindWhat.com, Sina Corporation, Netease.com, Inc., Sohu.com, Inc., Shanghai Online, ChinaByte, AltaVista Co., HotWired Ventures, HotBot, Tom.com Ltd., Apple Daily, Mingpao.com, MSN and Netvigator.com.
We may also encounter increased competition from ISPs, Web site operators and providers of Web browser software, including Netscape Communications Corporation or Microsoft Corporation, that incorporate search and retrieval features in their products. Our competitors may develop Web search, retrieval services, freemail and community services that are equal or superior to those we offer our users and may achieve greater market acceptance than our offerings in the area of performance, ease of use and functionality.
Mobile applications competition.In April 2003, we entered the business of providing mobile value added services through our acquisition of Newpalm. As we pursue our strategy of growing our mobile applications business and generating subscription revenues derived principally from providing value added SMS, we anticipate that we will face competition for subscribers, applications and content from competitors such as Sina Corporation, Sohu.com, Netease, Tom.com, Tencent.com and Linktone Group, Inc., as well as a host of other smaller companies that service the SMS market. We anticipate we will face intense competition in this market as barriers to entry are low in certain areas of this business. In addition, we cannot give assurances that the mobile network operators in the PRC, including CMCC and Unicom, on whom we depend for networks, gateways, billing systems and payment collection will not seek to develop and launch competing services.
Outsourced software development and support services competition. In February 2003, we acquired Praxa Limited which is seeking to develop a China and India-based outsourcing platform which can offer clients outsourced software application development and support services. As our business evolves to place greater emphasis on outsourced software development and support services, we will face competition from many of the large Asia Pacific-based outsourcing firms such as Wipro Ltd and Infosys Technologies Ltd. While these competitors have traditionally focused on servicing the US markets, due to lower demand in the United States they have entered the English-speaking markets in Asia (such as Australia, Singapore and Hong Kong) where we are developing our markets.
Merger and acquisition competition.The significant slowdown in capital markets activity over the past three years has resulted in an increased trend of mergers and acquisitions as a means for companies to expand and realize value. Across the Asia-Pacific region, many of our competitors have greater financial and other resources and brand name recognition when compared to us. These competitors may limit our ability to effect strategic acquisitions or combinations, particularly as our markets consolidate further through local and regional mergers and acquisitions. If we cannot merge or combine with or acquire strategically significant companies on reasonable terms, our ability to compete in our markets may be compromised.
Our entry into the PRC Internet market depends on the establishment of an adequate telecommunications infrastructure in the PRC by the PRC government. In the event of any disruption or failure, we may have no means of accessing alternative networks or services which would adversely affect our business
Unlike Taiwan and Hong Kong, where the telecommunications infrastructure is comparable to U.S. standards and where private companies compete as ISPs, the telecommunications infrastructure in the PRC is not as well developed. In addition, access to the Internet in the PRC is accomplished primarily by means of the government’s backbone of separate national interconnecting networks that connect with the international gateway to the Internet. This gateway is owned and operated by the PRC government and is the only means for the domestic PRC Internet network to connect to the international Internet network. Although private sector ISPs exist in the PRC, almost all access to the Internet is accomplished through ChinaNet, the PRC’s primary commercial network, which is owned and operated by the PRC government. We rely on this backbone and
35
Table of Contents
China Telecom to provide data communications capacity primarily through local telecommunications lines. As a result, we will continue to depend on the PRC government to establish and maintain a reliable Internet infrastructure to reach a broader base of Internet users in the PRC. We will have no means of accessing alternative networks and services in the PRC, on a timely basis or at all, in the event of any disruption or failure. There can be no assurance that the Internet infrastructure in Greater China will support the demands associated with continued growth. If the necessary infrastructure standards or protocols or complementary products, services or facilities are not developed by the PRC government, our business could be materially and adversely affected.
Political, Economic and Regulatory Risks
Increased Sino-U.S. political tension may make our company less attractive to investors and clients and our Web sites more vulnerable to hacking and other disruptions
The relationship between the United States and the PRC is subject to sudden fluctuation and periodic tension. For example, relations may be compromised if the U.S. becomes a more vocal advocate of Taiwan or proceeds to sell certain military weapons and technology to Taiwan. Any weakening of relations between the U.S. and the PRC could have a material adverse effect on our business and could attract hacking or result in other disruptions to our Web sites. Anti-U.S. or anti-PRC sentiment could make our company and our shares less attractive since we are listed in the United States. In addition, changes in political conditions in the PRC and changes in the state of Sino-U.S. relations are difficult to predict and could adversely affect our operations or cause the Greater China market to become less attractive to investors and clients because of our relationship with Xinhua and AOL and because we operate in the PRC.
The economic climate in Asia is volatile and vulnerable, which has affected and may continue to affect, our business through declining spending levels by customers, deferred or uncollectible accounts receivable, and restricted ability to access lines of credit
Beginning in mid-1997, when the Thai baht first depreciated substantially, many countries in Asia experienced significant economic downturns and related difficulties. As a result of the decline in the value of the region’s currencies, many Asian governments and companies had difficulties servicing foreign currency-denominated debt and many corporate borrowers defaulted on their payments. As the economic crisis spread across the region, governments raised interest rates to defend their weakening currencies, which adversely impacted domestic growth rates. In addition, liquidity was substantially reduced as foreign investors curtailed investments in the region and domestic banks restricted additional lending activity. The currency fluctuations, as well as higher interest rates and other factors, have materially and adversely affected the economies of a number of countries in Asia, many of which are still recovering or have yet to recover.
Economic developments in countries outside Asia could materially and adversely affect our business, results of operations and financial condition. For example, the recent volatility of the U.S. stock market and the interest rate environment, the downturn in the high-tech sector, and the slowdown of the U.S. economy have had a negative impact on Asian markets. A further reduction in exports and a further decrease in direct foreign investment could reduce demand for our services, especially in those countries heavily dependent on technology export sales from where we derive significant revenue.
The economic crisis and its effect on the Asian economies has had and may continue to have an adverse impact on our business in the following respects:
| • | spending levels by both Asian and international companies for advertising in the Asian markets may continue to decline; |
| • | spending by companies in Asia for e-business Solutions may continue to decline; |
36
Table of Contents
| • | payments on our accounts receivable may be deferred and may become more difficult to collect or uncollectable; and |
| • | our ability to access lines of credit or other financing may be restricted. |
Recently, general economic conditions in Asia have also been adversely affected as a result of the outbreak of severe acute respiratory syndrome, or SARS, which could have a material adverse effect on our business, financial condition and results of operations.
There are economic risks associated with doing business in the countries in which we primarily operate which could adversely affect our business
PRC.A significant part of our current revenues are, and a significant part of our future revenues are expected to be, derived from the PRC market. The PRC government has been reforming its economic system since the late 1970s. The economy of the PRC has historically been a planned economy subject to governmental plans and quotas and has, in certain aspects, been transitioning to a more market-oriented economy. Although we believe the economic reform and the macroeconomic measures adopted by the PRC government have had a positive effect on the economic development of the PRC, we cannot predict the future direction of these economic reforms or the effects these measures may have on our business, financial position or results of operations. In addition, the PRC economy differs from the economies of most countries belonging to the Organization for Economic Cooperation and Development, or OECD. These differences include:
| • | economic structure; |
| • | level of government involvement in the economy; |
| • | level of development; |
| • | level of capital reinvestment; |
| • | control of foreign exchange; |
| • | growth rates; |
| • | methods of allocation resources; and |
| • | balance of payments position. |
As a result of these differences, our business may not develop in the same way or at the same rate as might be expected if the PRC economy were similar to those of the OECD member countries. Changes in the PRC’s political, economic and social conditions, adjustments in policies of the PRC government or changes in the PRC’s laws and regulations may adversely affect our results of operations and financial condition.
The PRC economy has experienced significant growth in the past decade, but this growth has been uneven across geographic and economic sectors and has recently been slowing. There can be no assurance that such growth will not continue to decrease or that any slow down will not have a negative effect on our business.
Hong Kong.A significant part of our facilities and operations are currently located in Hong Kong. Hong Kong is a Special Administrative Region of the PRC with its own government and legislature. Hong Kong enjoys a high degree of autonomy from the PRC under the principle of one country, two systems. We can give no assurance that Hong Kong will continue to enjoy autonomy from the PRC.
The Hong Kong dollar has remained relatively constant due to the U.S. dollar peg and currency board system that has been in effect in Hong Kong since 1983. However, in early 1999, the Hong Kong dollar was subject to currency speculation and the SAR government substantially supported the market for the Hong Kong dollar, both directly and indirectly through the large-scale purchase of securities listed on the Hong Kong Stock Exchange. We can give no assurance that the historical currency peg of the Hong Kong dollar to the U.S. dollar will be maintained. The historical currency peg could adversely affect our business.
37
Table of Contents
South Korea.A significant part of our revenues are derived from the South Korean market, although we expect such contribution to decline because our South Korean online network advertising business has lost its exclusive service agreement with Daum Communications, a leading South Korean portal company.
Since early 1997, a number of developments have adversely affected the South Korean economy, resulting in severe economic contraction. Despite a strong economic recovery following a severe economic recession from early 1997 to late 1998, our South Korean operations face significant risks because:
| • | slow reform of the chaebol system presents a continuous risk to South Korea’s banking sector; |
| • | increased level of imports erodes positive trade balance and foreign currency reserves; and |
| • | an appreciating South Korean won threatens the competitive position of the export sector. |
In addition, the reform program being implemented by the South Korean government may:
| • | restrict economic growth; |
| • | cause a budget deficit because of a decrease in tax revenues and an increase in government expenditures; |
| • | increase the rate of inflation; |
| • | increase the number of bankruptcies of South Korean companies; and |
| • | increase unemployment. |
Finally, relations with North Korea have been tense over most of Korea’s history. The level of tension between the two Koreas has fluctuated and may increase or change abruptly as a result of current or future events. The occurrence of these events could have a material adverse effect on our business, results of operations and financial condition.
Australia.We anticipate that a more significant part of our future revenues may be derived from the Australian market. The Australian dollar has experienced some volatility against the US dollar. As of January 1, 2002, the Australian dollar traded at US$1.00 = A$1.957, although it had appreciated to US$1.00 = A$1.3001 as of January 15, 2004.
PRC regulation of content distributed on the Internet may adversely affect our business
The PRC has enacted regulations governing Internet access and the distribution of news and other information. The Ministry of Information Industry or the MII has published implementing regulations that subject online information providers to potential liability for content included on their portals and the actions of subscribers and others using their systems, including liability for violation of the PRC laws prohibiting the distribution of content deemed to be socially destabilizing. Because many PRC laws, regulations and legal requirements with regard to the Internet are relatively new and untested, their interpretation and enforcement of what is deemed to be socially destabilizing by PRC authorities may involve significant uncertainty.
Under the PRC’s regulations on telecommunications and Internet information services, Internet information service providers are prohibited from producing, duplicating, releasing or distributing any information which falls within one or more of nine stipulated categories of “undesirable content.” These categories cover any information which:
| • | contravenes the basic principles enshrined in the PRC Constitution; |
| • | endangers the security or unity of the State; |
| • | undermines the State’s religious policies; |
| • | undermines public order or social stability; or |
| • | contains obscene, pornographic, violent or other illegal content or information otherwise prohibited by law. |
38
Table of Contents
In addition, the PRC legal system is a civil law system based on written statutes. Unlike common law systems, it is a system in which decided legal cases have little precedential value. As a result, it is difficult to determine the type of content that may result in liability. We cannot predict the effect of further developments in the PRC legal system, particularly with regard to the Internet and the dissemination of news content, including the creation of new laws, changes to existing laws or the interpretation or enforcement thereof, or the pre-emption of local rules and regulations by national laws.
Violations or perceived violations of PRC laws arising from information displayed, retrieved from or linked to our portals could result in significant penalties, including a temporary or permanent cessation of our business in the PRC. PRC government agencies have announced restrictions on the transmission of state secrets through the Internet. State secrets have been broadly interpreted by PRC governmental authorities in the past. We may be liable under these pronouncements for content and materials posted or transmitted by users on our message boards, virtual communities, chat rooms or e-mails. If the PRC government were to take any action to limit or eliminate the distribution of information through our portal network or to limit or regulate any current or future applications available to users on our portal network, this action could have a material adverse effect on our business, financial condition and results of operations.
A change in currency exchange rates could increase our costs relative to our revenues thereby potentially adversely affecting our financial condition, results of operations and increasing market risk
Substantially all of our revenues, expenses and liabilities are denominated in renminbi, Hong Kong dollars, South Korean won, US dollars and Australian dollars. We also generate revenues, expenses and liabilities in other currencies such as Singapore dollars, British pounds and New Taiwan dollars. However, our quarterly and annual financial results are reported in US dollars. In the future, we may also conduct business in additional foreign countries and generate revenues, expenses and liabilities in other foreign currencies. As a result, we are subject to the effects of exchange rate fluctuations with respect to any of these currencies and the related interest rate fluctuations. We have not entered into agreements or purchase instruments to hedge our exchange rate risks although we may do so in the future.
Restrictions on currency exchange, the PRC may limit our ability to utilize our revenues effectively to fund business activities outside the PRC, which could result in increased costs for capital
Although PRC government policies were introduced in 1996 to allow greater convertibility of the renminbi, significant restrictions still remain. We can provide no assurance that the PRC regulatory authorities will not impose greater restrictions on the convertibility of the renminbi. Because a significant amount of our future revenues may be in the form of renminbi, any future restrictions on currency exchanges may limit our ability to utilize revenue generated in renminbi to fund our business activities outside the PRC.
ITEM 4. INFORMATION ON THE COMPANY
A. History and Development of the Company
We were incorporated in June 1997 as China Information Infrastructure Limited, a company limited by shares under the Companies Law of the Cayman Islands. Our principal executive offices are located at 34/F Citicorp Centre, 18 Whitfield Road, Causeway Bay, Hong Kong. Our contact telephone number in Hong Kong is (852) 2893-8200 and in the United States is (212) 661-2160. We have a website that you may access at http://www.corp.china.com/. Information contained on our website does not constitute part of this Annual Report.
We were organized as a wholly-owned subsidiary of CIC. CIC Holding Limited was incorporated in July 1996 and renamed China Internet Corporation Limited in October 1996 to be the holding company for
39
Table of Contents
Yorking Limited, a Hong Kong corporation, renamed CUC Asia Limited in November 1994 and renamed China Internet Corporation (Hong Kong) Limited, or CIC-HK, in August 1995. Yorking Limited was incorporated in September 1994 to provide computer-based information and communication services to businesses in the PRC. In January 1998, CIC acquired a 51% controlling interest in The Web Connection, a Hong Kong company that engages in e-business Solutions services, in exchange for cash and shares of CIC for an aggregate consideration of US$2.94 million.
CIC established chinadotcom to operate CIC’s Internet portal and related businesses. Subsequent to the incorporation of chinadotcom, the board of directors of CIC authorized the transfer of all material contracts that were relevant to the business operations of chinadotcom from CIC and CIC-HK to chinadotcom, as well as CIC’s equity and beneficial interests in the following subsidiaries:
| • | The Connection Group (BVI) Limited, also known as The Web Connection and rebranded Ion Global (BVI) Ltd. in April 2001, is a British Virgin Islands company that serves as the holding company for our e-business Solutions subsidiaries; |
| • | CIC (Shanghai) Company Limited, a PRC company that engages in Web-based advertising sales in the PRC and serves as the holding company for our other operations in the PRC; and |
| • | China.com Corporation Limited, a Hong Kong company. |
The aggregate value of the assets transferred to chinadotcom was recorded at a historical cost of US$12.7 million.
In June 1999, CIC distributed its entire interest in chinadotcom to CIC’s shareholders. The transaction involved the distribution of a total of 46,975,972 Class A Common Shares to CIC’s shareholders on a one-for-one basis with respect to each issued and outstanding share of CIC’s capital stock at the time of the distribution. Upon completion of that transaction, CIC ceased to have any ownership interest in chinadotcom. A wholly-owned subsidiary of Xinhua and APOL provided a mutual right of first refusal to buy the other party’s shares of chinadotcom owned as of that time in the event either party sought to dispose of its chinadotcom shareholdings. Additionally, APOL received rights to place shares of chinadotcom owned by the Xinhua subsidiary to prospective buyers on behalf of the Xinhua subsidiary in exchange for a commission. New World Infrastructure Limited also provided a right of first refusal to a wholly-owned subsidiary of Xinhua to buy its shares of chinadotcom in the event New World Infrastructure Limited sought to dispose of its shareholdings in chinadotcom.
In July 1999, we completed our IPO of the equivalent of 19,320,000 Class A Common Shares on the Nasdaq National Market at the equivalent of a public offering price of US$5.00 per share. All of the shares registered were sold and net proceeds from the IPO totaled US$85.6 million.
On December 6, 1999, our shareholders approved a two-for-one share split that became effective on December 13, 1999 and split the par value of our shares to US$0.0005 per share.
In January 2000, we completed a second public offering of the equivalent of 9,952,884 Class A Common Shares on the Nasdaq National Market at the equivalent of a public offering price equal to US$42.50 per share. Of the 9,952,884 Class A Common Shares sold, 2,325,000 shares were offered by certain of our shareholders. Then selling shareholders received an aggregate of US$94.1 million in net proceeds for their shares. All of the shares registered were sold and net proceeds from the offering to chinadotcom totaled US$303.9 million.
In March 2000, we listed our then wholly-owned subsidiary hongkong.com Corporation on the Growth Enterprise Market, or GEM, of the Hong Kong Stock Exchange and received net proceeds of approximately US$168.5 million for selling approximately 18% of hongkong.com Corporation. We currently continue to own approximately 81% of hongkong.com Corporation.
40
Table of Contents
In April 2000, our shareholders approved the change of our company name from China.com Corporation to chinadotcom corporation. On April 28, 2000, our shareholders approved a further two-for-one share split that became effective as of May 8, 2000 and split the par value of our shares to US$0.00025 per share.
Our total capital expenditures amounted to US$29.2 million, US$8.3 million and US$5.5 million in 2000, 2001 and 2002, respectively. The primary capital expenditure in each of those years was the purchase of computers, servers and network equipment, and other items related to the expansion of our business network across the Asia Pacific, the United States and the United Kingdom.
We have recorded an operating loss in every year since our inception, although we recorded net profits of US$1.2 million and US$1.3 million in the fourth quarter of 2002 and first quarter of 2003, respectively. We have funded our operations and capital expenditures entirely through funds raised from our shareholders, including private rounds of financing prior to our IPO in July 1999 and a second public offering in January 2000, and interest income derived from those funds. For the foreseeable future we anticipate that we will fund our operations and capital expenditures primarily by applying the cash holdings still available to us from the proceeds of our equity offerings.
Our principal divestitures in 2000 amounted to US$170.8 million, of which our sale of 18% of hongkong.com Corporation in its IPO on GEM resulted in a one time gain of US$140 million. We did not make any principal divestitures in 2001. In 2002, the following chinadotcom subsidiaries either ceased operations, were liquidated or were disposed of, which resulted in a gain of approximately US$1 million: 24/7 Media Singapore Pte Ltd, Ion Global (Taiwan) Ltd, Ion Global (Australia) Pty Ltd, Shanghai Full-Time Internet Corporation, MEZZO Marketing (Taiwan) Ltd, Pandora Interactive Studio Pte Ltd and Travellerzone Limited.
We spent approximately US$5.3 million in connection with two significant acquisition and investment transactions during 2002. The following is a summary of our material and strategic transactions which includes those in which we either paid, committed or received consideration of US$5.0 million or more during the course of such respective transactions. These transactions represent our principal acquisitions and investments during 2002.
41
Table of Contents
| Acquisition, | ||||
| Acquisition or partner | payment or | |||
| company | partnership date | Acquired or partner company’s activities | ||
| URLs from CIC | Via tranches during October 2001 and February 2002 | We acquired from CIC the three URLs, www.china.com, www.hongkong.com and www.taiwan.com, and the related intellectual property rights. | ||
| Layabo Pty. Limited | March 2002 | We acquired Layabo Pty. Limited (now renamed Mezzo Business Databases Pty Limited), an Australian database marketing business and owner of the trademark IncNet. With the acquisition of Layabo Pty. Limited and the prior acquisition of RNR International Marketing Group (Australia) Pty Limited in 2000, we are consolidating our marketing business in Australia under the MEZZO brand. We believe that the acquisition of the IncNet trademark is an important step in re-orienting our advertising strategy from online sales of banner advertisements, direct mailing and sponsorships to higher margin database marketing related services utilizing data mining techniques to develop targeted campaigns for clients. | ||
| OpusOne Technologies International Inc. | March 2002 | We acquired a majority interest in OpusOne Technologies International Inc., the parent of Platinum China Holdings, Inc., a developer and service provider of business management software solutions for state enterprises and multi-national corporations in Greater China. In May 2003, we entered into an agreement to purchase the remaining interest in OpusOne Technologies that we did not otherwise already own. We expect the transaction to close later in 2003. | ||
| Sagent Technology, Inc. | October 2002 | We entered into US$7 million transaction with Sagent, a provider of enterprise business intelligence solutions, involving an asset-based senior secured loan with warrants for Sagent with a view to developing operational initiatives going forward. In March 2003, based upon the occurrence of what we viewed to be certain events of default under the loan, we exercised our rights as a secured lender to enforce our security interest in certain loan collateral and filed a claim for damages against Sagent. In April 2003, we reached a settlement with Sagent pursuant to which our loan was repaid in full, and in addition we received an agreed upon sum in respect of terminated warrants and other rights we had in the company. |
Certain Recent Developments
The following is a summary of our material and strategic acquisitions and investments completed since December 31, 2002 which includes those in which we paid, committed or received consideration of US$5.0 million or more during the course of each transaction:
42
Table of Contents
| Acquisition, | ||||
| Acquisition or partner | payment or | |||
| company | partnership date | Acquired or partner company’s activities | ||
| Praxa Limited | February 2003 | Our subsidiary, CDC Australia Limited, completed the acquisition of Praxa, a leading Australian information technology professional services organization with a 21-year operating history. The acquisition was completed for a purchase price of up to A$11 million (approximately US$6.4 million), subject to clawback provisions based on future performance. | ||
| Newpalm (China) Information Technology Co., Ltd. | April 2003 | We completed the acquisition of Newpalm, a leading short message service mobile software platform developer and application service provider in China, through our mobile applications and portal arm and 81% owned subsidiary, hongkong.com Corporation. Cash consideration of US$14 million was paid with the remaining consideration to be paid on an earn-out basis over the next two years. | ||
| vMoksha Technologies Limited | May 2003 | Our wholly-owned subsidiary, CDC Outsourcing Holdings Ltd., entered into a 51% owned joint venture agreement with vMoksha Technologies Limited, an information technology outsourcing company headquartered in Bangalore, India. The joint venture aims to provide a broad range of outsourcing related services to major software vendors and enterprises in the United States, Europe and the Asia-Pacific region. We expect the transaction to close later in 2003. | ||
| PK Information Systems | August 2003 | Our wholly-owned subsidiary, CDC Australia Ltd., acquired PK Information Systems, an established IT services business in Australia which has specialized capabilities in the areas of .Net application development and business intelligence solutions, with clients mainly in the New South Wales state government sector. | ||
| Industri-Matematik International Corp. | September 2003 | We acquired a 51% stake in the holding company of IMI, an international provider of software to the supply chain management sector principally across Europe and the United States. The acquisition of the controlling stake in IMI was made through the formation of a joint venture between chinadotcom’s CDC Software unit, which holds a 51% interest, and Symphony Technology Group, a Palo Alto, California-based venture capital company which holds the remaining 49% interest. | ||
| Pivotal Corporation (pending) | December 2003 | We announced that we had entered into a definitive agreement to acquire Pivotal by way of either an all-cash or a cash-and-stock transaction. Pivotal is a leading international customer relationship management company that provides a complete set of highly flexible customer relationship management applications and implementation services for mid-sized enterprises, with over 1,600 clients worldwide. The transaction with Pivotal is subject to the final approval by Pivotal’s shareholders, as well as regulatory approval and satisfaction of customary closing conditions. |
As of May 31, 2003, the following chinadotcom subsidiaries had either ceased operations, were liquidated or were disposed of: Netville Co. Ltd, Dai Job.com Inc., eIndia and e2e Business Solutions Limited.
43
Table of Contents
B. Business Overview
We are a leading enterprise software and solutions company offering the following services for companies throughout Greater China and the Asia-Pacific region, the United States and the United Kingdom:
| • | Technology, including implementation and development of packaged enterprise software targeting mid-market manufacturers; |
| • | Outsourcing, including offering economical, high-quality software development services to our enterprise software customer base utilizing programmers located principally in China and India; |
| • | Marketing, including developing targeted advertising campaigns utilizing information gathered from chinadotcom’s proprietary databases; and |
| • | Mobile Applications Services, including offering value added short messaging services to mobile phone subscribers in China. |
Our enterprise software business focuses on key industry groups including manufacturing for export, finance and travel, and in key business areas, including supply chain management, human resource and payroll administration and customer relationship management. We aim to leverage our expertise in its core business areas through alliances and partnerships to help drive innovative client solutions. We currently have operations in more than 10 markets internationally, with over 1,000 employees.
We established a separate software unit, CDC Software Holdings Limited, or CDC Software, in 2002 as a part of our strategy to move up the value curve in the software services and products area. CDC Software focuses on building our intellectual property asset base, establishing partnerships with software vendors and broadening our overall software product offerings in the areas of enterprise solutions and integration. We may pursue CDC Software’s strategy through acquisitions, strategic partnerships, joint ventures, consolidation of our software assets and restructurings or combinations of the foregoing approaches. CDC Software currently has over 1,000 installations and 600 customers in the Asia Pacific region. By integrating our software services and products with our e-business Solutions services, mobile application services, and our media assets network, we offer a comprehensive suite of software and Internet-based products, services and solutions to a diverse clientele of Web-based and other enterprises, Internet users and mobile SMS and applications users.
We have also invested in Internet and related technology and software companies in the pan-Asian region and the United States that we believe add value and depth to our business. We plan to manage our investments actively to enhance our strategic relationships with partners in new technology areas and provide original content for our media assets. In addition, during 2002 we completed the purchase of the three Internet domain names, or URLs, www.china.com, www.hongkong.com and www.taiwan.com, and related intellectual property rights, which we consider fundamental to the core foundation of our overall operations.
We believe that our synergistic, multiple business-line structure, in tandem with our geographical diversity across ten markets in the Asia Pacific region as well as the United States and the United Kingdom, has enabled us to better weather the volatile economic and market turbulence of the past two years. Despite significant restructuring and downsizing during 2001 and 2002, we have maintained our overall scope of service in all areas with the exception of the online network advertising business, which by the end of 2002 had been reduced to the South Korean market.
We have also established CDC Outsourcing, which allows for elements of workflow such as client and project management to be provided in the contracted country, including the United Kingdom, the United States or Australia, with technology and applications sourced from either of chinadotcom’s low-cost, industry standard CMM-certified, or Capability Maturity Model, outsourcing centers in China or India. In May 2003, CDC
44
Table of Contents
Outsourcing announced a 51%-49% joint venture with vMoksha Technologies, or vMoksha, an offshore IT outsourcing company headquartered in Bangalore, India that has experienced recent growth. The intent of this joint venture is to provide a broad range of outsourcing related services to major software vendors and enterprises in the United States, Europe and the Asia-Pacific region. CDC Outsourcing has sales and marketing offices in the United States, the United Kingdom and Australia, while its offshore development will be focused on India and China.
In February 2003, we completed the acquisition of Praxa Limited, or Praxa, an Australian IT outsourcing and professional services organization, focusing on the development of relationships with large organizations that have a need for outsourced application development, management and maintenance. Since Praxa’s incorporation, it has established a client base consisting mainly of large enterprises and government agencies in Australia. In addition, chinadotcom anticipates that Praxa will provide a distribution platform for chinadotcom’s self-developed software products as well as for the range of software solutions that chinadotcom currently delivers across the Asia-Pacific region.
In our Mobile and Portals unit, we operate news, email and consumer service portal Web sites in China, Hong Kong and Taiwan. Through the recent acquisition of Newpalm (China) Information Technology Co. Ltd., or Newpalm,. we offer consumer-based and enterprise-based short message service, or SMS, and mobile application software development services. As of June 2003, Newpalm had over 4.4 million paid subscriptions in China on a platform that works on both the CDMA and GSM systems, with connectivity and service agreements with local mobile network operators in 26 provinces.
We have also invested in Internet and related technology and software companies in the pan-Asian region and the United States that we believe add value and depth to our business. We plan to manage our investments actively to enhance our strategic relationships with partners in new technology areas and provide original content for its media assets. In addition, during 2002 we completed the purchase of the three Internet domain names, or URLs, www.china.com, www.hongkong.com and www.taiwan.com, and related intellectual property rights, which we consider fundamental to our portal operations. We believe that our synergistic, multiple business-line structure, in tandem with our geographical diversity across ten markets in the Asia-Pacific region as well as the United States and the United Kingdom, has enabled us to better weather the volatile economic and market turbulence of the past three years. By integrating our software services and products with our e-Business consulting services services, mobile application services and our media assets network, we offer a comprehensive suite of software and Internet-based products, services and solutions to a diverse clientele of Web-based and other enterprises, Internet users and mobile SMS and application users. Despite significant restructuring and downsizing during 2001 and 2002, we have maintained our overall scope of service in all areas with the exception of the online network advertising business, which by the end of 2002 had been reduced to only the South Korean market.
Subsequent to the year ending December 31, 2002, due to changes in our business model and our shift to enterprise software and related services, in order to present our revenue in a more representative format, we changed our business segmental reporting from “e-business Solutions,” “Advertising,” “Sale of IT Products” and “Other Income” to “Software and Consulting Services,” “Advertising and Marketing Activities” and “Other Income,” respectively, effective from January 1, 2003. From the first quarter of 2003 onwards, all prior periods comparative figures will be adjusted accordingly.
e-business Solutions services
Revenue contributed by e-business Solutions services constituted US$61.3 million or approximately 56% of our total revenues in 2000, US$32.6 million or approximately 51% of our total revenues in 2001 and US$23.0 million or approximately 39% of our total revenues in 2002. Because we have been evolving our business model to a provider of enterprise software and related support services, revenues for e-business Solutions in 2002 included a portion of the revenues we will be characterizing as “software and consulting
45
Table of Contents
services” in future periods. “Software and consulting services” will include fees for professional services provided after the sale of the enterprise software product, as well as revenues for consulting services, training and post-contract support.
e-business Solutions services are primarily offered through our Ion Global unit. Ion Global is engaged in planning, architecting, and delivering e-business Solutions for both Fortune 500 multinational corporations and blue chip pan-Asian clients. We typically assist our clients with the adoption of web-based technologies to help them improve their customer relationship management, enterprise application integration, and/or supply chain management. We focus on helping clients deploy web-based initiatives to either lower costs, increase sales, or increase efficiency. The industries with which we have the most experience are financial services, automotive, travel and transportation, government and consumer goods.
Our e-business Solutions business is organized around four core competencies that, when combined, provide end-to-end Internet integration services for our clients on a global basis across our offices in seven countries. These competencies are:
| • | strategy; |
| • | user experience; |
| • | marketing; and |
| • | technology. |
Geographically, we are mainly focused on the major markets of Asia, including Tokyo, Seoul, Beijing, Shanghai, Hong Kong and Singapore. We also have offices in San Francisco, New Jersey and London. While these non-Asian offices service many local clients in their own markets, we believe our global presence enables us to better understand the issues and develop solutions for our clients in both local and international contexts, and enables us to price our services more competitively. For example, in our contract with the United Kingdom Department of Trade and Industry, work was performed by both our London and Shanghai offices, and we were able to leverage the synergies of having offices worldwide. During 2002, however, we closed local offices of Ion Global in Sydney and Taiwan because competition made it unprofitable to maintain offices in these markets. In addition, during 2003 our e2e business unit ceased operations as it continued to incur losses during the course of 2002 and in early 2003.
Our e-business Solutions clients include many of the world’s leading companies such as Adecco Temporary Staffing Services, BMW South Korea, Cathay Pacific, Citibank, Daimler-Chrysler, Emirate Airlines, General Motors, Haier, Hilton International, Hisense, Johnson & Johnson, KTF (Korea Telecom’s wireless services arm), LG Insurance, L’Oreal, Northwest Airlines, Panasonic China, Samsung Electronics, Sony, Steelcase and Wells Fargo. Clients also include governmental agencies such as the Hong Kong Housing Authority, the United Kingdom Department of Trade and Industry and the United Kingdom Department of Land Registry.
The e-business Solutions market remains highly challenging and has become increasingly competitive. Our revenue streams are largely dependent upon new contracts and, as such, are highly volatile. We believe that a significant source of competition comes from large Asia Pacific-based outsourcing firms such as Wipro Ltd and Infosys Technologies Ltd that had previously focused on servicing the U.S. markets but have recently entered the English-speaking markets in Asia such as Australia, Singapore and Hong Kong. We are seeking to address these competitive issues with our own outsourced software development that we are building through our acquisition of Praxa Limited which is seeking to develop a low cost outsourcing platform in the PRC and India, and our prospective joint venture with vMoksha Technologies Limited, an information technology outsourcing company based in India.
Advertising and e-marketing services
46
Table of Contents
Revenue contributed by our Internet advertising and e-marketing services constituted US$43.8 million or approximately 40% of our total revenues in 2000, US$21.4 million or approximately 33% of our total revenues in 2001 and US$28.3 million or approximately 48% of our total revenues in 2002.
We are seeking to re-orient our advertising strategy from online sales of banner advertisements, direct mailing and sponsorships in which we deliver advertising for a fixed fee based upon short-term advertising dependent upon high volume to more higher margin database marketing related services utilizing data mining techniques to develop targeted campaigns for clients. In September 2001, we launched a new brand for our advertising and e-marketing business, MEZZO Marketing, to encompass all of our advertising segments, including online advertising, online direct marketing, offline direct marketing, database marketing related services utilizing data mining techniques, and other marketing opportunities as they arise.
As an important part of our strategy to begin focus on high-value advertising services, we acquired Layabo Pty. Limited (now renamed Mezzo Business Databases Pty Limited), an Australian database marketing business and owner of the trademark IncNet, in March 2002. With the acquisition of Layabo Pty. Limited and the prior acquisition of RNR International Marketing Group (Australia) Pty Limited in 2000, we are consolidating our marketing business in Australia under the MEZZO brand. Layabo Pty. Limited and RNR International Marketing Group (Australia) Pty Limited have co-located their operations, and are in the process of integrating their respective database marketing and related marketing services activities. Following the acquisition of Layabo Pty. Limited, MEZZO Interactive Pty Limited discontinued its online advertising activities in the Australian market, and now focuses on growing its database marketing business in the areas of traditional direct marketing and e-mail marketing utilizing data mining techniques. Data mining involves a process of analyzing significant amounts of data to uncover patterns and relationships, and has become a more important part of customer relationship management as a method to better understand customer behavior and preferences. While these services constituted only a very small part of our advertising revenues during 2002, we believe they will represent an increasing proportion in future periods, although this business is subject to many risks. See Item 3.D. of this Annual Report,Key Information — Risk Factors — Risks relating to chinadotcom — Although we expect to generate revenue from advertising in the future, this revenue may not be substantial.
During 2002, because of low margins, we significantly reduced our operations in Internet advertising and e-marketing services that involve the planning, sales, electronic delivery, tracking and post-campaign analysis of advertisements on a network of Web sites. While our operations have ceased in Australia, Hong Kong, Japan, the PRC, Singapore and Taiwan, we continue to maintain a presence in this sector in South Korea. However, we expect our South Korean online network advertising business will also contract following the loss of our exclusive service agreement with Daum Communications, a leading South Korean portal company.
Portal services and other media assets
Our portal services and other media assets deliver content, create community and enable commerce across Asia including Greater China. The financial results of these services and assets are reflected primarily in the Advertising revenue segment for 2002.
Each of our Web sites is a portal that acts as a gateway to the Internet. We have been developing our portal network since our inception in June 1997. Our portal network currently provides users with Chinese versions of Greater China content services, online community products, and e-commerce services, and an English version for Hong Kong through our portals located at www.china.com, www.hongkong.com and www.taiwan.com. Each of our portals offers a unique blend of:
| • | content delivery services such as search engines, directories and localized information; |
| • | community products such as e-mail, SMS, web-hosting, newsletters, chat and message boards; and |
| • | e-commerce products such as an online shopping mall and online subscription based products and services. |
47
Table of Contents
With the acquisition in April 2003 of Newpalm, a leading SMS mobile software platform developer and application service provider in China, we are seeking to grow our mobile applications business and generate additional subscription-based revenues over the long term. Growth in the SMS market could generate subscription revenues from value added SMS, such as mobile chatting, dating and friends matching, e-mail, ringtone and logo downloads and other related mobile phone products. Subscription fees are charged on a monthly or per message basis. Pursuant to contractual arrangements between Newpalm and a number of mobile network operators in China which are subsidiaries of CMCC and Unicom, we will be relying on the operators for billing and collection of subscription fees. We pay service fees that range from approximately 10% to 50% of the subscription fees, and are based on contracted rates. Generally,
| • | within 15 to 90 days after the end of each month, Newpalm receives a statement from CMCC and Unicom confirming the amount of subscription charges billed to that operator’s mobile phone users; and |
| • | within 30 to 120 days after delivering a monthly statement to Newpalm, each operator remits the subscription fees, net of its service fees, to Newpalm. |
Sale of IT products and other services
During 2002, our e-business Solutions and Advertising business units also conducted a certain proportion of business involving the sale of hardware and software products. The bulk of these revenues reflected the sale of third party products including software packages from various software vendors. Because we have been evolving our business model to a provider of enterprise software and related support services, revenues for sale of IT products and other services included a portion of the revenues we will be characterizing as “Software and Consulting Services” in future periods. “Software and Consulting Services” will also include sales and licensing fees from distributing the business applications of a number of software companies to the Greater China and Asia market, including content management, portal solutions, financial accounting applications, process manufacturing applications and enterprise resource planning applications.
Software and other investment initiatives
As part of our strategy to increase our overall gross profit margins and our percentage of recurrent or ‘annuity-style’ revenues, we are introducing ‘world class’ software applications to the Greater China market through master distributorship and value-added reseller arrangements and looking to acquire or develop proprietary intellectual property.
We established CDC Software in 2002 to provide the sales, marketing, support and localized infrastructure necessary to enter into a master distributorship and value-added reseller arrangements. CDC Software has since entered into master distributorship arrangements with a number of software companies to distribute business applications to the Greater China market, including arrangements with Vignette to distribute content management and portal solutions, Best Software to distribute financial accounting and process manufacturing applications and Ross Software to distribute enterprise software applications to process manufacturers. We believe the formation of CDC Software is an important step in our strategy to become a provider of enterprise software and related support services and outsourced software development and support services.
In March 2002, we acquired a majority stake in OpusOne Technologies International Inc., a leading provider of business management software solutions in the PRC. In May 2003, we entered into agreement to purchase the remaining interest in OpusOne Technologies that we did not otherwise already own. [We expect the transaction to close later in 2003.] We believe the acquisition of OpusOne Technologies allows us to more quickly enter and gain experience in the enterprise software market because it has developed several proprietary enterprise software related applications, including PowerHRP which is used in human resources and payroll
48
Table of Contents
administration, PowerATS which is an attendance tracking system, PowerESS which is a Web based employee self service application, and PowerBooks which is a financial accounting application. Furthermore, the acquisition of OpusOne Technologies also enhanced our intellectual property portfolio. After establishing CDC Software, the proprietary enterprise software related applications of OpusOne Technologies have become part of CDC Software.
In February 2003, we acquired Praxa Limited, an established company in Australia which specializes in the provision of information technology products and services in the form of outsourcing, application development and support, and system integration in Australia. As a result of the Praxa acquisition, we expect to increase the number of potential clients for a low-cost PRC and India-based outsourcing platform. Praxa is also seeking to develop and to extend the distribution of our own software products into the Australian marketplace.
Treasury management
As of December 31, 2002, we had generated a significant portion of our interest income from our investment of US$471.2 million, of which US$125.0 million was borrowed under our repurchase facilities, in AAA US Agency debt securities. For further information on our repurchase facilities and their related risks, see Item 5.B of this Annual Report,Operating and Financial Review and Prospects — Liquidity and Capital Resourcesand Item 11 of this Annual Report,Quantitative and Qualitative Disclosures About Market Risk, respectively.Our interest income, which was US$23.9 million for 2002, partially offset our operating losses and is a source of liquidity for our working capital needs. The prolonged period of low interest rates in 2002 presented us with the opportunity to continue executing our strategy of reducing our investments in long-term debt and transitioning to shorter-term, callable debt in our anticipation of rising interest rates. We decreased our holdings in long-term Range Accrual Notes from US$260.0 million as at January 1, 2002 to US$62.0 million as of December 31, 2002. As of June 5, 2003, we had eliminated all of our holdings of Range Accrual Notes.
Our quarterly interest income ranged from approximately US$3.9 million to US$7.3 million during 2002, reflecting a yield of approximately 4.8% on our total investment portfolio of US$471.2 million (on a net basis which accounts for the assets and drawdowns relating to the repurchase facility), prior to any unrealized or realized gains or losses from the sale and reinvestment of any of the securities within our portfolio. Yield was approximately 7% in 2001. The drop in yield was due to lower cash levels in 2002, declining interest rates, the implementation of a more conservative investment strategy of buying more highly rated securities for our investment portfolio and a decrease in our holdings of long-term Range Accrual Notes. Yields have dropped further thus far in 2003 due to ongoing interest rate reductions and the continued move into lower yielding but higher credit rating securities.
We invest on the basis of recommendations from international investment banks, as well as information and ratings provided by independent ratings agencies including Moody’s Investors Service and Standard & Poor’s. When purchasing or selling debt securities, our policy is to obtain between three and five competing quotes. Generally, a debt security’s credit quality depends on the issuer’s ability to pay interest on the amount borrowed and repay principal. The lower the credit rating, the greater the risk the issuer will default or fail to meet their payment obligations, as determined by the rating agency. Our investment parameters became more conservative in 2002 as we shifted our investment portfolio from lower rated debt to AAA-rated debt securities of U.S. government sponsored enterprises, such as the Federal Home Loan Bank, or “FHLB”. Our desire to improve the overall credit quality of our portfolio was due to the economic and political instability of 2002. As of April 30, 2003, 93.3% of our debt securities are invested in AAA-rated callable securities of U.S. government sponsored enterprises, excluding cash not yet invested. At present, we hold only one security that is rated lower than AAA. In the event of a downgrade in an investment to below BBB-, as rated by Standard & Poor’s, or Baa3, as rated by Moody’s Investors Service, we will generally implement an orderly sale of the security in order to maintain a relatively conservative stance in our portfolio, although on a case-by-case basis we may decide to retain such debt securities. For a summary of the effects of our treasury management program on our liquidity and capital resources and its material market risks, see Item 3.D. of this Annual Report,Key
49
Table of Contents
Information — Risk Factors — Risks relating to chinadotcom — Attempts to enhance our treasury yield have caused us to increase leverage and may expose us to various market risksand— We rely on our internal control systems to effectively manage our treasury management operations, Item 5.B of this Annual Report,Operating and Financial Review and Prospects — Liquidity and Capital Resourcesand Item 11 of this Annual Report,Quantitative and Qualitative Disclosures About Market Risk.
Goals and Strategy
We have historically operated as a pan-Asian integrated Internet company with our business model centered around our e-business Solutions and advertising businesses, including e-marketing services, portal services and other media. Our business model is evolving from a pan-Asian Internet company to a provider of enterprise software and related support services, outsourced software development and support services, and mobile applications and portal services to end users. Our goal is to be a leading integrated enterprise solutions company offering technology, marketing and media services for companies and end users throughout Greater China and the Asia-Pacific region, the United States and the United Kingdom. In light of the challenging environment in which our businesses operate, we have been and intend to be flexible in fulfilling our goal. With operations in ten markets, the companies under the chinadotcom group have extensive experience in several industry groups including finance, travel and manufacturing, and in key business areas, including e-business strategy, packaged software implementation, marketing, supply chain management and mobile applications. We seek to leverage our expertise in these areas with alliances and partnerships to help develop innovative client solutions. We seek to become the consultant of choice in providing e-business Solutions services to corporations exploring Asia’s Internet market as part of their business strategy and seek to offer premier portal services for Greater China and selected markets in Asia.
Furthermore, we are increasingly seeking to invest in, acquire and develop technology solutions and companies that add value and depth to our products and services, as part of our software and outsourcing strategy. In the post-WTO era, we believe we can capitalize on opportunities in China as enterprises upgrade networks and systems to international standards. We have acquired software products and services with a development center in the PRC during the course of 2002, and have signed various master distribution agreements and value-added reseller agreements with international software companies to expand our channel partnership network. We also recently acquired Praxa Limited, an established company in Australia which specializes in the provision of information technology products and services in the form of outsourcing, application development and support, and system integration in Australia. As a result of the Praxa acquisition, we expect to increase the number of potential clients for a low-cost China and India-based outsourcing platform it is seeking to develop and to extend the distribution of our own software products into the Australian marketplace.
During the course of 2002 we began to exit the low-margin, non-performing online network advertising business. As of May 31, 2003, we only maintain a presence in this sector in South Korea, and we expect the significance of our South Korean online network advertising business will decrease substantially as our software products, services and consulting revenues increase. We will maintain our higher-margin online marketing business, and we will focus on proprietary marketing and data mining services using our existing Australian marketing assets. Our current strategy involves developing and enhancing our existing proprietary marketing databases, extending into recurring subscription based data services and solidifying our existing sales channel relationships.
In our portal operations, we have managed expenses broadly in line with revenues, and we are focusing on improving the contribution from non-advertising revenues. We are also exploring initiatives that include the potential introduction of games and SMS-related content. Our acquisition of Newpalm in April 2003 represents a first step into the market for mobile applications services using SMS-related content.
50
Table of Contents
We believe the Greater China and Asian markets, and Chinese language users globally, represent three of the largest and fastest growing user groups on the Web today. As the Internet gains broader acceptance as a new business medium in Greater China and Asia, we believe online advertising and e-commerce will also experience significant growth. To capitalize on this opportunity, our business strategy is to continue to improve and supplement our Internet products and services, either independently or through strategic alliances, partnerships or acquisitions, and to continue to expand our brand-name recognition throughout Asia.
Effective January 1, 2003, we changed our business segment reporting to reflect more accurately our current business strategy. As a result, our prior business segments will now be presented as “Software and Consulting Services,” “Advertising and Marketing Activities” and “Other Income,” and figures for all prior periods will be restated accordingly.
Markets and Operations
We operate in ten markets across the Asia Pacific, the United States and the United Kingdom. Our primary geographic source of revenues has been the Greater China region, made up of Hong Kong, Taiwan and the PRC, which collectively represented 54%, 39% and 31%, of our total revenue in 2000, 2001 and 2002, respectively. e-business Solutions has been our primary revenue contributor over the last three years, accounting for 56%, 51% and 39% of total revenues in 2000, 2001 and 2002, respectively. The percentage of total revenue generated by e-business Solutions declined in 2002 principally due to our decision to close some non-profitable subsidiaries. Advertising, including advertising revenues from the network of affiliated Web sites and advertising revenues recorded on our portals across Greater China, accounted for 40%, 33% and 48% of total revenues in 2000, 2001 and 2002, respectively. Sale of IT products accounted for 3%, 7% and 8% of total revenues in 2000, 2001 and 2002, respectively. Other revenues, accounted for 1%, 9% and 5% of total revenues in 2000, 2001 and 2002, respectively.
As a material percentage of our business is derived from Greater China, seasonality linked to those markets, particularly the PRC, may affect our business. For example, the PRC, which accounted for 18% of our total revenues in the fourth quarter of 2002, has an extended holiday for the Lunar New Year in the first quarter of each year which affects all our operations in the mainland. Furthermore, it is generally accepted that within the e-marketing and advertising business there is some seasonality, with more activity prior to holidays, such as Christmas and the New Year. This level of activity will vary from market to market depending on the nature and timing of the holiday season. Our e-solutions business also experiences a summer slowdown. Our primary marketing channels are the Internet and traditional media, industry seminars and public relations. We have maintained our standard operational practice in offering services to our client base in the financial year for 2002.
e-business solutions service fees are derived from services provided for the design and development of Internet Web sites, system integration and monthly maintenance and hosting of computer-based information. Projects are generally priced to clients on a project-completion basis, employing a time-sheet with hourly billable charges for different stages of a project, although certain short-term Web design and development engagements are billed on a fixed-price basis. e-business solutions service fees are recognized when services are provided. Professional services and other revenues include revenues from consulting services, training, and post-contract support. Revenues from customer training and education are recognized at the date the services are performed. Revenue from post-contract support, such as unspecified upgrades and telephone support, is recognized ratably over the period the support is provided.
Advertising service fees are derived from the online sales of banner advertisements, direct mailing and sponsorships in which we deliver advertising for a fixed fee on our Web sites and advertising with our affiliates, which comprises third party Web sites and offline advertising campaigns. Online advertising revenue is derived principally from short-term advertising contracts in which we may guarantee a minimum number of impressions to advertisers over a specific period of time for a fixed fee. Advertising service fees from direct mailing are derived from advertisements sent to electronic mail users registered with us, and are recognized when
51
Table of Contents
advertisements are sent. Offline advertising revenue is derived principally from fees for services and production of advertisements.
Sale of IT products revenue is derived principally from the distribution of computer hardware and software products. In instances where the license agreements provide that we will provide the client with ongoing post-contract support and/or rights to upgrades and updates, and our service cannot be separated from the third party software license, revenue from licensing the software is recognized ratably over the period of the application management services agreement.
For a description of the extent to which we depend on patents, licenses, industrial, commercial or financial contracts that are material to our business or profitability, see Item 3.D. of this Annual Report,Key Information — Risk Factors — Risks Relating to chinadotcom.
For description of the material effects of government regulations on our business, see Item 3.D. of this Annual Report,Key Information — Risk Factors — Political, Economic and Regulatory Risks.
C. Organizational Structure
chinadotcom corporation was incorporated in June 1997. As of May 31, 2003, our principal holding company subsidiaries were held as follows:
52
Table of Contents
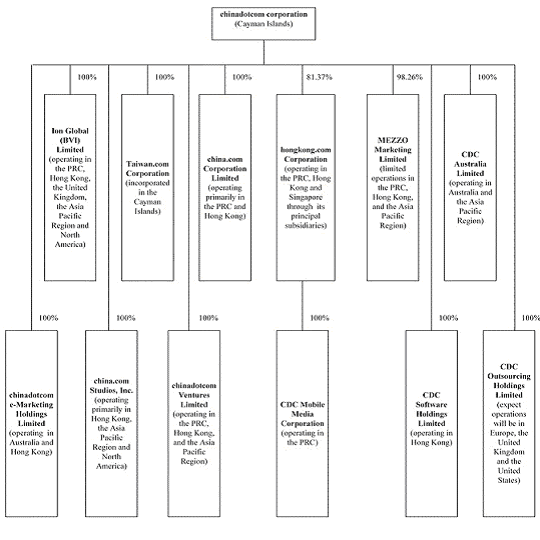
53
Table of Contents
D. Property, Plant and Equipment
Our executive headquarters occupy approximately 26,302 square feet of gross office space under various leasing arrangements at 34/F, Citicorp Centre, 18 Whitfield Road, Causeway Bay, Hong Kong. During 2002, we consolidated our executive headquarters office space and reduced our gross office space from 48,646 to 26,302 square feet. We also lease office and other space, as well as space for our servers, in various locations in Asia, Australia and the United States. The only real estate we own is our building located at 2-4 Old Street, Islington, London, which houses our Ion Global operations in the United Kingdom.
ITEM 5. OPERATING AND FINANCIAL REVIEW AND PROSPECTS
You should read the following discussion of our financial condition and results of operations together with our consolidated financial statements and the related notes included elsewhere in this Annual Report. This discussion contains forward-looking statements that involve risks and uncertainties. Our actual results may differ significantly from those anticipated in these forward-looking statements as a result of factors including, but not limited to, those set forth under Item 3.D. of this Annual Report, Key Information — Risk Factors, and included elsewhere in this Annual Report and Item 11 of this Annual Report, Quantitative and Qualitative Disclosures About Market Risk.
54
Table of Contents
Overview
CIC incorporated chinadotcom as China Information Infrastructure Limited under the laws of the Cayman Islands in June 1997 as a wholly-owned subsidiary of CIC. In June 1999, CIC distributed its total interest in China.com Corporation to CIC’s shareholders in a corporate reorganization. In April 2000, we changed our name from China.com Corporation to chinadotcom corporation. The following discussion reflects our financial condition and results of our operations and our subsidiaries.
We first introduced our products and services through our former parent company in 1996. Initially, these products and services included Web hosting and maintenance. During 1996 and 1997, we derived all of our revenue from our e-business Solutions services, which were referred to as “Web solutions services” in our earlier prospectuses and financial statements. In addition, we developed relationships with content providers to our portal network, hired personnel, hosted conferences for industry participants and engaged in additional marketing activities to develop brand name awareness for our portal network. We also developed relationships with potential advertisers on our portal network and purchased, installed and operated the computer equipment we use in connection with our portal network.
In January 1998, our former parent, CIC acquired a 51% interest in The Web Connection, a Hong Kong based strategic consulting, Web site design and development enterprise, to expand our e-business Solutions services. Since December 31, 1998, we have since completed the acquisition of the remaining 49% of The Web Connection and have made many other acquisitions in the e-business Solutions area, including OpusOne Technologies International Inc. in 2002 and Praxa Limited in 2003. In May 1998, our former parent, CIC commenced its portal network services. Each of these interests and rights has been distributed by CIC to us as of June 1999. In September 2001, we launched a new brand for our e-marketing business, MEZZO Marketing, which represents the broader advertising and marketing based opportunities available in the current market, and a departure from the reliance on the online advertising network line of business. We have sought to build the MEZZO Marketing brand, especially in Australia, with the acquisition of Layabo Pty. Limited in 2002.
In July 1999, we completed our initial public offering and received net proceeds of US$85.6 million. In January 2000, we completed our second public offering and received net proceeds of US$303.9 million. In
55
Table of Contents
March 2000, we completed the initial public offering of our subsidiary, hongkong.com Corporation, on the Growth Enterprise Market of The Stock Exchange of Hong Kong, or GEM, and received net proceeds of US$168.5 million. We have applied a portion of these net proceeds toward further acquisitions and investments in majority or minority interests in companies.
Approximately 39% of our revenue was generated by our e-business Solutions services in 2002, declining from 51% of our revenues in 2001, due primarily to the overall deterioration in market conditions in 2002 across all our major markets, as well as the closure of non-profitable business units. Approximately 48% of our revenue was generated by our advertising business in 2002. Advertising revenue increased to $28.3 million in 2002 from $21.4 million in 2001 due principally to a partial recovery from the difficult market conditions which existed in 2001, as well as the strong performance of the Korean operation during the course of the World Cup Soccer Tournament in mid 2002. The sale of IT products revenue segment was introduced in the fourth quarter of 2001, and in 2002 represented approximately 8% of our revenues. Prior to such time, the sale of IT products was included as other income.
We ceased to provide e-business Solutions and advertising support services to CIC in connection with AOL-branded services in Hong Kong on June 30, 2001. Such termination may materially and adversely change our relationship with AOL, which could have a material adverse effect on our business, results of operation, financial condition and share price. See risk factors disclosed in Item 3.D. of this Annual Report,Key Information — Risk Factors — Risks relating to our Class A Common Shares — We could be adversely affected if our major strategic shareholders materially change their holdings in our shares.
Our selling, general and administrative expenses decreased as a percentage of revenues from 136% during 2001 to 64% in 2002 due primarily to the implementation of cost control measures, as well as the closing of some non-profitable business units during the period. Global headcount has fallen by approximately 50% from its peak at the start of 2001, as we moved to implement an across-the-board integration and rationalization of our business units. During the course of 2001 and 2002, we successfully consolidated our offices in each geographic market in which we operate, and more than halved the overall number of individual office locations. As a result, we realized many of the benefits of such measures in 2002.
Since December 31, 1998, we have made over 68 other acquisitions, including the acquisition of the remaining 49% of The Web Connection (which was subsequently renamed Ion Global) in Hong Kong in 1999 and 2000, acquisition of Pacific Connections Limited in Hong Kong in 1999, XT3 Pty Limited (which was subsequently renamed Ion Global (Australia) Pty Ltd.) in Australia in 2000 and 2001, Coghuff Limited, which owns 100% of Revolution Limited (which was subsequently renamed Ion Global (UK) Limited) in the United Kingdom in 2000, Venex Corporation in Japan in 2000, Wealth Corporation Ltd, which owns Beijing Chinaholiday Network Co. Ltd. and Beijing Tian Jian Rainbow Airline Service Co. in the PRC in 2000 and 2001, the URLs from CIC in Hong Kong in 2001 and 2002, Beijing China-Railway Times Science & Technology Co. Ltd. in the PRC in 2001, Layabo Pty. Limited in 2002, a majority interest in OpusOne Technologies International Inc. in 2002 with an agreement to purchase the remainder in June 2003, Praxa Limited in 2003, and Newpalm (China) Information Technology Co., Ltd. in 2003. As a result of those acquisitions, we recorded substantial goodwill amortization and stock compensation expense in 2000, 2001 and 2002. In 2000, we recorded approximately US$40.2 million of goodwill. Goodwill decreased to US$6.4 million as of December 31, 2001 and increased to US$12.0 million as of December 31, 2002. In 2000 and 2001, following our review of our acquisitions in light of changed and deteriorated market and other conditions, we recorded impairment of goodwill and intangible assets of US$43.4 million and US$40.7 million, respectively. The assessed impairment of goodwill and intangible assets was based on projected discounted cash flows of the entities acquired over the remaining amortization period. In 2002, there was no impairment of goodwill and intangible assets. As market and other conditions continue to change or deteriorate, we may need to provide for further impairment, dependent on the assessed projections of future discounted cashflows from our operating assets.
56
Table of Contents
Our annual revenues for 2002 have decreased from 2001 by 8% from US$64.5 million to US$59.3 million. Our quarterly revenues have varied, and we have incurred significant net losses from inception through 2002. For the financial year ended December 31, 2002 we recorded a net loss of US$18.2 million, although we recorded net profits of US$1.2 million in the fourth quarter of 2002.
As of December 31, 2000, 2001 and 2002, we had an accumulated deficit of US$91.8 million, US$216.2 million and US$234.4 million, respectively. We may continue to incur significant net losses for the next several years partially due to our expansion plans and any acquisitions as we execute our business strategy. We and our prospects must be considered in light of the risks, costs and difficulties frequently encountered by companies in the early stages of development, particularly companies in the new and rapidly evolving Greater China and Asian technology and Internet markets.
Our expense levels are based in part on our expectations as to future revenues and to a large extent are proportional to the size of our operations. As a result of our limited operating history, the recent emergence of the Greater China and Asian technology and Internet markets and the volatility and dynamic nature of the Internet sector generally, we do not have the benefit of internal or industry-based historical financial data for any significant period of time from which we can plan future operating expenses. We may be unable to adjust spending in a timely manner to compensate for unexpected revenue growth or unexpected increases in operating expenses, including selling, general and administrative expenses related to companies we may acquire. Any significant shortfall in relation to our revenue expectations would have an immediate adverse impact on our business, results of operations and financial condition.
Subsequent to the year ending December 31, 2002, due to changes in our business model and our shift to enterprise software and related services, in order to present our revenue in a more representative format, we changed our business segmental reporting from “e-business Solutions,” “Advertising,” “Sale of IT Products” and “Other Income” to “Software and Consulting Services,” “Advertising and Marketing Activities” and “Other Income,” respectively, effective from January 1, 2003. From the first quarter of 2003 onwards, all prior periods comparative figures will be adjusted accordingly.
A. Operating Results
The following table summarizes our historical results of operations as a percentage of total revenues for the years ended December 31, 2000, 2001 and 2002 of US$109.7 million, US$64.5 million and US$59.3 million, respectively.
| Year ended December 31,(1) | ||||||||||||
| 2000 | 2001 | 2002 | ||||||||||
| Revenues: | ||||||||||||
| e-business Solutions(2) | 56 | % | 51 | % | 39 | % | ||||||
| Advertising(3) | 40 | % | 33 | % | 48 | % | ||||||
| Sale of IT products | 3 | % | 7 | % | 8 | % | ||||||
| Other income | 1 | % | 9 | % | 5 | % | ||||||
| Total revenues(4) | 100 | % | 100 | % | 100 | % | ||||||
| Cost of revenues: | ||||||||||||
| e-business Solutions | -35 | % | -34 | % | -24 | % | ||||||
| Advertising | -27 | % | -21 | % | -34 | % | ||||||
| Sale of IT products | 0 | % | -5 | % | -6 | % | ||||||
| Other income | -1 | % | -3 | % | -2 | % | ||||||
| Gross margin | 37 | % | 37 | % | 34 | % | ||||||
| Selling, general and administrative expenses | -97 | % | -138 | % | -65 | % | ||||||
| Depreciation and amortization expenses | -34 | % | -43 | % | -20 | % | ||||||
| Impairment of goodwill and intangible assets | -40 | % | -63 | % | — | |||||||
57
Table of Contents
| Year ended December 31,(1) | ||||||||||||
| 2000 | 2001 | 2002 | ||||||||||
| Operating loss | -134 | % | -207 | % | -51 | % | ||||||
| Interest income | 27 | % | 41 | % | 40 | % | ||||||
| Interest expense | -1 | % | -2 | % | -4 | % | ||||||
| Gain/(loss) arising from share issuance of a subsidiary | 128 | % | 0 | % | 0 | % | ||||||
| Gain on disposal of available-for-sale securities | 2 | % | 7 | % | 0 | % | ||||||
| Gain/(loss) on disposal of subsidiaries and cost investments | 13 | % | -3 | % | 0 | % | ||||||
| Other non-operating gains | 0 | % | 0 | % | 2 | % | ||||||
| Other non-operating losses | -2 | % | -2 | % | 0 | % | ||||||
| Impairment of cost investments and available-for-sale securities | -77 | % | -19 | % | -9 | % | ||||||
| Share of gain/(loss) in equity investees(4) | -9 | % | -4 | % | 1 | % | ||||||
| Loss before income taxes | -53 | % | -189 | % | -21 | % | ||||||
| Income taxes | -1 | % | 0 | % | 0 | % | ||||||
| Loss before minority interests | -54 | % | -189 | % | -21 | % | ||||||
| Minority interests in losses/(income) of consolidated subsidiaries | 0 | % | 6 | % | 1 | % | ||||||
| Loss from continuing operations | -54 | % | -183 | % | -20 | % | ||||||
| Discontinued operations: | ||||||||||||
| Loss from operations of discontinued subsidiaries, net of related tax benefit of US$42 and tax expenses of US$213 for 2000 and 2001 | -1 | % | -10 | % | -12 | % | ||||||
| Gain on disposal of discontinued subsidiaries | 0 | % | 0 | % | 1 | % | ||||||
| Net loss | -55 | % | -193 | % | -31 | % | ||||||
| (1) | During the year ended December 31, 2002, we discontinued the operations of certain subsidiaries in the e-business Solutions and the Advertising segments. With the adoption of SFAS 144, Accounting for the Impairment or Disposal of Long-Lived Assets, the operating results of the discontinued operating units were classified as loss from operations of discontinued subsidiaries on the consolidated statements of operations. As a result of SFAS 144, the results of the continuing operations of 2000 and 2001 were restated. | |
| (2) | Includes revenues from services provided to CIC in connection with AOL-branded services in Hong Kong representing 18%, 0% and 0% of e-business Solutions revenues for 2000, 2001 and 2002, respectively. | |
| (3) | Includes revenues from services provided to CIC in connection with AOL-branded services in Hong Kong representing 17%, 0% and 0% of Advertising revenues for 2000, 2001 and 2002, respectively. | |
| (4) | Includes revenues from CIC representing 16%, 0% and 0% of total revenues, for each of 2000, 2001 and 2002, respectively. |
Financial Year Ended December 31, 2002 compared to Financial Year Ended December 31, 2001
Because we discontinued the operations of certain subsidiaries in the e-business Solutions and advertising segments, certain historical comparative amounts have been reclassified to conform with the current year#146;s presentation. Only the numbers from continuing operations are presented for comparison purposes in the following sections.
Net loss of the subsidiaries classified as discontinued operations for the years ended December 31, 2001 and 2002 were US$6.2 million and US$7.2 million, respectively. Revenues of the discontinued operations for the years ended December 31, 2001 and 2002 were US$11.1 million and US$4.3 million, respectively. Pretax loss reported in discontinued operations for the years ended December 31, 2001 and 2002 were US$6.0 million and US$7.2 million, respectively.
Revenues
58
Table of Contents
e-business Solutions. Services offered through our e-business Solutions services include professional consulting, Web site design, systems integration and online marketing strategy development. Revenues from our e-business Solutions services decreased to US$23.0 million in 2002 from US$32.6 million in 2001. The decline in e-business Solutions services revenue was generally attributable to an overall deterioration in market conditions in 2002 across all our major markets, as well as the closure of non-profitable business units. The continued global economic slowdown in 2002 resulted in a dramatic reduction in the demand for our services and in the ability of companies to budget for and commission such services.
Advertising.Our advertising revenues increased to US$28.3 million in 2002 from US$21.4 million in 2001. This increase was due principally to increased online network advertising revenues from South Korea which experienced a significant increase in demand for marketing services as a result of hosting the 2002 Soccer World Cup, as well as additional revenues resulting from our acquisition of Layabo Pty. Limited and other direct marketing and data mining businesses in Australia.
Sale of IT products.This revenue segment was introduced in the fourth quarter of 2001 as prior to the new segmentation, in 2001 the revenue in our “other income” segment increased to over 10% of total revenues. Revenue from the sale of IT products remained stable at US$4.6 million in 2002 and 2001.
Other income.Revenues from other products and services we offer to our clients, excluding the sale of IT products revenue above, decreased to US$3.4 million in 2002 from US$5.9 million in 2001. The decrease in “other income” was due principally to decreased sales of non-Internet related products and services, in particular to the contribution and performance of Travel Trade Gazette, a Singapore-based trade publication owned by hongkong.com.
Cost of revenues
e-business Solutions.Our cost of e-business Solutions revenues decreased to US$14.0 million in 2002 from US$21.9 million in 2001. As a percentage of revenues, our cost of revenues for our e-business Solutions decreased to 24% in 2002 from 34% in 2001. Cost of revenues for e-business Solutions in 2002 decreased from 2001 due principally to the reduced level of business activity during 2002 together with the closure of non-profitable business units.
Advertising.Our cost of advertising revenues increased to US$20.0 million in 2002 from US$13.5 million in 2001. As a percentage of revenues, our cost of revenues for our advertising services increased to 34% in 2002 from 21% in 2001. Cost of revenues for advertising in 2002 increased from 2001 due principally to the increase in advertising revenues in 2002 particularly from the Korean marketing operation.
Sale of IT products.Our cost of sale of IT products decreased to US$3.3 million in 2002 from US$3.5 million in 2001. As a percentage of revenues, our cost of revenues for our sale of IT products increased to 6% in 2002 from 5% in 2001.
Other income.Our cost of “other income” decreased to US$1.5 million in 2002 from US$2.0 million in 2001. As a percentage of revenues, our cost of revenues for our “other income” decreased to 2% in 2002 from 3% in 2001.
Operating expenses
Selling, general and administrative expenses.Our selling, general and administrative expenses significantly decreased to US$38.3 million in 2002 from US$89.1 million in 2001. As a percentage of revenues, our selling, general and administrative expenses decreased to 65% of revenues in 2002 from 138% of revenues in 2001. This reduction in selling, general and administration expenses was due to effective cost control measures, as well as the closing of some non-profitable business units during the period. The decrease in our
59
Table of Contents
selling, general and administrative expenses was due principally to our decreased headcount, as well as across-the-board cost savings throughout the company.
Depreciation and amortization expense.Our depreciation and amortization expense decreased to US$11.9 million in 2002 from US$27.4 million in 2001. This decrease reflected the decrease in the purchase of property, plant and equipment during the course of the years 2001 and 2002, the lower book value of fixed assets in 2002 due to previous writedowns for impairment in 2001, and the end of the three-year straight line depreciation period for investments in assets made in 1998 and 1999.
Impairment of goodwill and intangible assets.There was no impairment of goodwill and intangible assets in 2002 as compared to US$40.7 million in 2001. SFAS 142 requires that goodwill and intangible assets with indefinite useful lives no longer be amortized; however, these assets must be reviewed at least annually for impairment. Intangible assets with finite useful lives will continue to be amortized over their respective useful lives. The standard also establishes specific guidance for testing for impairment of goodwill and intangible assets with indefinite useful lives. The non-amortization provisions of SFAS 142 were effective immediately for goodwill and intangible assets acquired after June 30, 2001. We adopted the remaining provisions of SFAS 142 effective January 1, 2002. The adoption of SFAS 142 will not have a material impact on our amortization of goodwill and intangible assets as the majority of our goodwill and intangible assets affected by the adoption of SFAS 142 were written off in prior years. Upon adoption of SFAS 142, we were required to perform a transitional impairment test for all recorded goodwill within six months and for intangible assets with indefinite lives within three months and, if necessary, determine the amount of an impairment loss by December 31, 2002. We performed the transitional impairment test for goodwill on June 30, 2002 and the annual impairment test on December 31, 2002. No impairment charge was recorded during 2002.
Interest income
Our interest income decreased to US$23.9 million in 2002 from US$26.8 million in 2001. This decrease was due to several factors, including lower overall prevailing interest rates during 2002, our implementation of a more conservative investment strategy of buying more highly rated debt securities for our investment portfolio with lower yields, and lower cash levels in 2002. The treasury management program in 2002 utilized the Global Master Repurchase Agreement, or Repurchase Agreement, with Fortis Bank, and the Total Return Swap Transaction Agreement, or Swap Agreement, with DBS Bank, to purchase more conservative, lower yielding instruments, such as debt securities of U.S. government sponsored enterprises.
As of December 31, 2002, the total amount drawn under the Repurchase Agreement and the Swap Agreement was US$125.0 million, and as of May 31, 2003, we may borrow up to US$400.0 million under these facilities on such terms as we and the counterparty banks may mutually agree. Except for bank loans of US$115.0 million due in 2003 and US$10.0 million due between 2004 through 2011, these arrangements do not have termination dates, but are reviewed annually for renewal.
Under our Repurchase Agreement, we sold certain debt securities to Fortis Bank at a discounted price, and the bank agreed to sell back to us at that same discounted price the same debt securities at a later date. Either party with a net exposure from the transaction arising from fluctuations in the market value of the debt securities may request the other party to make a cash transfer or transfer of acceptable debt securities at least equal to that net exposure. During the period between the date that we sold the debt securities to the bank and the later date we repurchase such securities, the bank has agreed to pay us any income in respect of the debt securities sold,
60
Table of Contents
and we have agreed to pay interest to the bank at Libor plus a spread per annum based on the discounted price of the debt securities we sold to the bank and the number of days between the date we sold the securities to the bank and the date the bank sells them back to us. At December 31, 2002, the repurchase transactions entered into only allowed the buyer to request the seller to make a cash or acceptable debt securities transfer at least equal to the net exposure.
Under our Swap Agreement with DBS Bank, we transferred securities and financial instruments to the bank in exchange for cash, and concurrently, we agreed to reacquire the securities and financial instruments at a future date for an amount equal to the cash exchanged plus interest. The Swap Agreement permits us to elect for net cash settlement upon termination of the total return swap transaction. During the period between the date we transferred the securities and financial instruments and date we reacquire them, which is three calendar years, the bank has agreed to pay us any income in respect of the securities transferred and we have agreed, in turn, to pay the bank a price differential calculated on the cash exchanged multiplied by Libor plus a spread per annum and the number of days between the date we transferred the securities to the bank and the date we reacquire the securities and financial instruments.
As of December 31, 2002, an aggregate of US$125.0 million was outstanding under our repurchase facilities with US$115 million outstanding under our Repurchase Agreement with Fortis Bank and US$10 million outstanding under our Swap Agreement with DBS Bank. Proceeds from the drawdowns were used to purchase additional debt securities from U.S. government sponsored enterprises that yielded US$3.8 million in interest income in 2002. For a further description of these agreements, see Item 5.B of this Annual Report,Operating and Financial Review and Prospects — Liquidity and Capital Resources.For a summary of certain risks related to these agreements, see Item 11 of this Annual Report,Quantitative and Qualitative Disclosures About Market Risk. Approximately US$151.1 million of our total cash and cash equivalents and debt securities available-for-sale as of December 31, 2002 is effectively set aside as collateral under the Repurchase Agreement and Swap Agreement, and categorized as “restricted debt securities” in our consolidated balance sheet.
The weighted average interest rate on short-term borrowings as of December 31, 2001 and 2002 was 2.2% and 2.1%, respectively.
Interest Expense
Our interest expense increased to US$2.6 million in 2002 from US$1.5 million in 2001. This increase was principally due to increased aggregate borrowings under our repurchase facilities for the purchase of additional investments in high grade debt of U.S. government treasuries, U.S. government sponsored enterprises and other debt obligations.
Other Gains and Losses
There was no gain or loss arising from share issuance of a subsidiary as compared to a loss of US$55,000 in 2001. Our loss on disposal of available-for-sale securities was US$158,000 in 2002 as compared to a US$4.4 million gain in 2001. Our gain or loss on disposal of subsidiaries decreased to a loss of US$117,000 in 2002 from a loss of US$1.9 million in 2001 which included the write-off of balances due from disposed subsidiaries of US$93,000. We recorded other non-operating gains of US$1.2 million in 2002. We recorded other non-operating losses of US$288,000 in 2002. We recorded a gain of US$682,000 from our share of gains in equity investees in 2002 as compared to US$2.6 million loss in 2001.
Impairment of cost investments and available-for-sale securities
We recorded a loss of US$5.4 million for the impairment of cost investments and available-for-sale securities in 2002. This loss was principally the result of impairments on our available-for-sale securities.
61
Table of Contents
Net loss from continuing operations
We recognized a net loss of US$11.6 million in 2002 compared to a net loss of US$118.2 million in 2001.
Financial Year Ended December 31, 2001 compared to Financial Year Ended December 31, 2000
Because we discontinued the operations of certain subsidiaries in the e-business Solutions and advertising segments, certain historical comparative amounts have been reclassified to conform with the current year’s presentation. Only the numbers from continuing operations are presented for comparison purposes in the following sections.
Net loss of the subsidiaries classified as discontinued operations for the years ended December 31, 2000 and 2001 were US$1.4 million and US$6.2 million, respectively. Revenues of the discontinued operations for the years ended December 31, 2000 and 2001 were US$11.6 million and US$11.1 million, respectively. Pretax loss reported in discontinued operations for the years ended December 31, 2000 and 2001 were US$1.4 million and US$6.0 million, respectively.
Revenues
e-business Solutions. Services offered through our e-business Solutions services included professional consulting, Web site design, systems integration and online marketing strategy development. Revenues from our e-business Solutions services decreased to US$32.6 million in 2001 from US$61.3 million in 2000. The decline in e-business Solutions services revenue was generally attributable to an overall deterioration in market conditions in 2001 across all our major markets. The collapse of the Internet bubble in 2000 and the global economic slowdown in 2001 resulted in a dramatic reduction in the demand for our services and in the ability of companies to budget for and commission such services. Our revenues from e-business Solutions also decreased as a result of not booking any revenues for services provided to CIC in 2001 in connection with AOL-branded services in Hong Kong, as compared to US$12.0 million for such services which were booked in 2000. Prior to the introduction of the “sale of IT products” segment, revenues from e-business solutions would have amounted to US$61.3 million in 2000.
Advertising.Our advertising revenues decreased to US$21.4 million in 2001 from US$43.8 million in 2000. This decrease was again due principally to deteriorating market conditions in 2001 which resulted in the loss of revenue from several large online advertising customers, including infoislive and Register.com, amounting to $16.3 million. Our revenues from advertising also decreased as a result of not booking any revenues in 2001 for services provided to CIC in connection with AOL-branded services in Hong Kong, as compared to US$7.9 million booked in 2000.
Sale of IT products.This revenue segment was introduced in the fourth quarter of 2001 as prior to the new segmentation, in 2001 the revenue in our “other income” segment increased to over 10% of total revenues. Revenue from the sale of IT products increased to US$4.6 million in 2001 from US$3.3 million in 2000 when the revenue of non-profitable business units were excluded.
Other income.Revenues from other products and services we offer to our clients, excluding the sale of IT products revenue above, increased to US$5.9 million in 2001 from US$1.3 million in 2000. The increase in “other income” was due principally to increased sales of non-Internet related products and services, in particular to the contribution and performance of Travel Trade Gazette, a Singapore-based trade publication owned by hongkong.com. Prior to the introduction of the “sale of IT products” segment, the “other income” segment amounted to US$4.6 million in 2000.
Cost of revenues
62
Table of Contents
e-business Solutions.Our cost of e-business Solutions revenues decreased to US$21.9 million in 2001 from US$38.6 million in 2000. As a percentage of revenues, our cost of revenues for our e-business Solutions decreased to 34% in 2001 from 35% in 2000. Cost of revenues for e-business Solutions in 2001 decreased from 2000 due principally to the reduced level of business activity during 2001. Prior to the introduction of the “sale of IT products” segment, cost of revenues from e-business Solutions would have amounted to US$38.6 million in 2000.
Advertising.Our cost of advertising revenues decreased to US$13.5 million in 2001 from US$29.1 million in 2000. As a percentage of revenues, our cost of revenues for our advertising services decreased to 21% in 2001 from 27% in 2000. Cost of revenues for advertising in 2001 decreased from 2000 due principally to poorer market conditions in 2001.
Sale of IT products.Our cost of sale of IT products increased to US$3.5 million in 2001 from US$0.1 million in 2000 from the continuing operations.
Other income.Our cost of “other income” increased to US$2.0 million in 2001 from US$1.3 million in 2000. As a percentage of revenues, our cost of revenues for our “other income” increased to 3% in 2001 from 1% in 2000, representing principally the cost of sales relating to Travel Trade Gazette. Prior to the introduction of the “sale of IT products” segment, revenues from the “other income” segment would have amounted to US$5.5 million in 2001, from US$1.3 million in 2000.
Operating expenses
Selling, general and administrative expenses.Our selling, general and administrative expenses decreased to US$89.1 million in 2001 from US$106.4 million in 2000. As a percentage of revenues, our selling, general and administrative expenses increased to 138% of revenues in 2001 from 97% of revenues in 2000. This reduction in selling, general and administrative expenses was due to revenues falling at a more rapid rate than selling, general and administrative expenses during the period. The decrease in our selling, general and administrative expenses was due principally to our decreased headcount as well as across-the-board cost savings throughout the company.
Depreciation and amortization expense.Our depreciation and amortization expense decreased to US$27.4 million in 2001 from US$37.8 million in 2000. The year-over-year decrease was due principally to fewer acquisitions of companies, as well as to the establishment of a lower goodwill base during 2001 due to the write-off of certain investments at the end of 2000 and during 2001. This was partially offset by the purchase of property, plant and equipment during the course of the year 2000, particularly the second half of the year, which increased the level of depreciation expense on a full year basis in 2001.
Impairment of goodwill and intangible assets.Our expenses related to the impairment of goodwill and intangible assets decreased to US$40.7 million in 2001 from US$43.4 million in 2000. This included impairment of US$7.8 million related to the acquisition of Wealth Corporation in the PRC, US$3.2 million related to the acquisition of Coghuff Limited, which owns 100% of Revolution Limited in the UK, US$7.1 million related to the acquisition of Ion Global (Australia) Pty Ltd in Australia, US$6.6 million related to the acquisition of DAE Advertising Inc. in the US, US$7.8 million related to the acquisition of Venex Corporation in Japan, and US$2.77 million related to the impairment of software purchased from PurchasePro.com, Inc, or PurchasePro.com. The US$2.77 million impairment of the PurchasePro.com software was an adjustment made to our previously reported fourth quarter 2001 and full year 2001 results, and was the result of our re-assessment and valuation of this software in light of changed and deteriorated market and other conditions. As a result, our net loss for both fourth quarter 2001 and full year 2001 increased by US$2.77 million as compared to previously reported numbers. Our fourth quarter 2001 net loss was adjusted to US$12.97 million, as compared to the previously reported US$10.2 million loss, while the full year 2001 net loss increased to US$124.4 million from
63
Table of Contents
the previously reported US$121.6 million loss. Including this adjustment, total impairment of goodwill and intangible assets totaled US$40.7 million for the full year 2001.
Interest income
Our interest income decreased to US$26.8 million in 2001 from US$29.9 million in 2000. This decrease was principally due to lower levels of interest income derived from investments in debt obligations as the size of our cash holdings reduced during the course of 2001 versus 2000. The investments in 2000 were composed of more conservative, lower yielding instruments, involving the investment of cash holdings raised through the capital markets in 1999 and 2000 primarily into the debt securities of U.S. government sponsored enterprises, as compared to a more active management program in 2001. The reduction in cash levels in 2001 more than offset the positive benefit of the repurchase facility and the more active treasury management program in 2001.
Our interest income in 2001 included US$0.8 million earned from additional debt instruments which we purchased with the US$100.0 million drawdown amount as of December 31, 2001 under our repurchase facility. For a further description of our repurchase facility, see Item 5.B of this Annual Report,Operating and Financial Review and Prospects — Liquidity and Capital Resources. For a summary of the exposure of certain risks related to our repurchase facility, see Item 11 of this Annual Report,Quantitative and Qualitative Disclosures About Market Risk. Borrowings from our repurchase facility amounted to US$114.9 million as of December 31, 2001, of which we have used US$100.0 million to purchase additional debt instruments. Approximately US$135.0 million or 26.8% of our total cash and cash equivalents and debt securities available-for-sale of US$504.0 million as of December 31, 2001 is effectively set aside as collateral under the repurchase agreement and categorized as “restricted debt securities” in our consolidated balance sheet. Approximately 10.1% and 20.0% of quarterly interest income in the fourth quarter 2001 and first quarter 2002, respectively, was derived from interest income resulting from funds used from the repurchase facility to invest in debt securities.
Interest expense.chinadotcom’s interest expense increased to US$1.3 million in 2001 from US$857,000 in 2000. Increased interest expense of US$529,000 was incurred as a result of draw downs under chinadotcom’s repurchase facilities with Fortis Bank and DBS Bank amounting to US$114 million obtained between October 2001 and December 2001 for the purchase of additional investments in debt obligations. Excluding the interest expense arising on the new bank loans, interest expense fell slightly in 2001 compared with 2000 as a result of lower interest rates.
Gain / (loss) arising from share issuance of a subsidiary
Our gain or loss arising from share issuance of a subsidiary decreased to a loss of US$55,000 in 2001 from a gain of US$140.0 million in 2000 which represented the gain from our sale of 18% of hongkong.com Corporation by way of its initial public offering and listing on the Growth Enterprise Market Stock Exchange of Hong Kong.
Gain on disposal of available-for-sale securities
Our gain on disposal of available-for-sale securities increased to US$4.4 million in 2001 from US$1.7 million in 2000 due principally to greater gain realized from the disposal of treasury instruments.
Gain / (loss) on disposal of subsidiaries and cost investments
64
Table of Contents
Our gain or loss on disposal of subsidiaries decreased to a loss of US$1.9 million in 2001 from a gain of US$14.0 million in 2000 which included the gain of US$2.9 million realized from the sale of 20% of Pacific Connections Ltd. and the gain of US$10.5 million from our sale of 19.9% of MEZZO Marketing to 24/7 Real Media.
Other non-operating losses
Other non-operating losses amounting to $1.3 million represents the expenses the merger and acquisition department of chinadotcom recorded, including $1.1 million representing payroll expense of the merger and acquisition department.
Impairment of cost investments and available-for-sale securities
We recorded a loss of US$12.3 million for the impairment of cost investments and available-for-sale securities in 2001. This loss was principally the result of a US$8.1 million impairment on our interest in certain of our less than 20% owned minority investments, and a US$4.2 million write down of our available-for-sale securities including our holding in Panpac Media.com Limited.
Share of losses in equity investees
We recorded a loss of US$2.6 million for the share of losses in equity method investees in 2001, compared with a loss of US$9.4 million in 2000. The decrease in losses from equity method investees is due to the investment basis being written down to nil due to prior losses. chinadotcom has no financial commitments or guarantees to the investees and therefore has suspended the equity method accounting.
Net loss from continuing operations
We recognized a net loss of US$118.2 million in 2001 compared to a net loss of US$58.4 million in 2000.
Annual Variations
Our historical revenues and operating results have varied substantially from year to year, and we expect this to continue. Factors that cause fluctuations in our operating results include:
| • | marketing expenditures; |
| • | discontinuation of non-performing and non-profitable businesses |
| • | salaries and benefits to our employees; |
| • | interest income from our treasury portfolio; |
| • | mark to market or realized losses and realized gains related to our treasury portfolio; |
| • | administrative expenditures such as legal and other professional services; |
| • | general health of the economy and our sector and the ability of our customers to pay for our services provided; |
| • | level of usage of technology, the Internet and mobile applications in the Greater China and Asia markets; |
| • | demand for Internet advertising in the Greater China and Asia markets; |
| • | demand for Internet and Web site development in the Greater China and Asia markets; |
| • | the amount and timing of capital expenditures and other costs relating the expansion of our operations; |
| • | completion of acquisitions, divestitures, partnerships, joint ventures and other business combinations; |
| • | our ability to record revenue from key clients; and |
| • | the introduction or elimination of products and services by us or our competitors. |
65
Table of Contents
Credit risks:
We provide e-business solutions, advertising and sale of IT products to businesses in Australia, Hong Kong, Japan, South Korea, the PRC, the Republic of China, Singapore, the United Kingdom and the United States. We generally do not require collateral for accounts receivable.
We maintain cash and cash equivalents with various financial institutions in Australia, Hong Kong, Japan, South Korea, the PRC, the Republic of China, Singapore, the United Kingdom and the United States. Our policies are designed to limit exposure to any one institution. We perform periodic evaluations of the relative credit standing of those financial institutions that are considered in our investment strategy.
In connection with our sale of IT products and enterprise software business, we may purchase from vendors and then resell to customers. Typically the payment terms for the third party software are 60 days from the date of invoice, but in some cases payment may be required upon delivery. If the customers do not pay the full amount we invoice, which may occur, such as if the customer files for bankruptcy, we may not collect sufficient funds from customers to cover the original cost of the third party software that we have already purchased, or if we cannot collect funds from our customers in a timely manner which may occur, such as if the customer is experiencing issues with respect to its own collections or other cashflow issues, we may not generate sufficient cashflows to cover the original purchase price of the third-party products.
Business risks:
Our top ten customers accounted for 30%, 9% and 14% of our revenue for the years ended December 31, 2000, 2001 and 2002, respectively. The percentage of revenues generated from our top ten customers increased between 2001 and 2002 due to the addition of several large governmental contracts, including a contract with the Department of Trade and Industry in the United Kingdom. No single customer accounted for 10% or more of the revenues during any of years ended December 31, 2000, 2001 or 2002.
Currency risks:
The functional currency for our operations is the respective currency of the countries in which we operate. There were no material operating trends or effects on liquidity as a result of fluctuations in currency exchange rates. We do not, in the normal course of business, use any types of derivatives to hedge against foreign currency fluctuations, nor do we speculate in foreign currency. However, some of our business is transacted in renminbi, or RMB, which is not freely convertible into foreign currencies. On January 1, 1994, the PRC government abolished the dual rate system and introduced a single rate of exchange as quoted daily by the People’s Bank of China. However, the unification of the exchange rates does not imply the convertibility of RMB into United States dollars or other foreign currencies. All foreign exchange transactions continue to take place either through the Bank of China or other banks authorized to buy and sell foreign currencies at the exchange rates quoted by the People’s Bank of China. Approval of foreign currency payments by the Bank of China or other institutions requires submitting a payment application form together with suppliers’ invoices, shipping documents and signed contracts. This serves to minimize foreign currency translation loss and risks associated with RMB currency fluctuations, although there is a minimal associated cost.
Inflation and changing prices
We do not anticipate any material impact on our net sales and revenues, or on our income from continuing operations as a result of the impact of inflation and changing prices.
B. Liquidity and Capital Resources
66
Table of Contents
Since July 1999, we have financed our operations and met our capital expenditures and commitments from the net proceeds of our private placements, our July 1999 initial public offering, our second public offering in January 2000 and our March 2000 initial public offering for hongkong.com Corporation, as well as the interest income derived from investing such proceeds in debt securities. For a summary of the exposure of our debt securities to various market risks including credit default or investment and interest rate, see Item 11 of this Annual Report,Quantitative and Qualitative Disclosures About Market Risk.
Cash from operating activities
We had positive operating cash flow of US$15.9 million for 2002 compared to a negative operating cash flow of US$17.6 million for 2001. Our shift to positive cash flow from operations was attributable principally to our reduction of net losses from US$124.4 million in 2001 to US$18.2 million in 2002. As described above, the significant reduction in net losses was attributable to many factors, most notably a steep reduction in operating expenses in 2002. Adjustments for certain non-cash items including depreciation, amortization, stock option compensation expense, net investment impairment, net goodwill and intangible asset impairment restructuring costs and other non-cash items, and the effect of changes in working capital and other activities (including US$10.9 million of positive cash flows from deposits, prepayments and other receivables) of US$34.1 million contributed to our 2002 positive operating cash flow of US$15.9 million.
Cash from investing activities
Net cash used in investing activities was US$8.8 million for fiscal year 2002 and US$120.5 million for fiscal year 2001. During 2002, chinadotcom used US$18.9 million to expand its business in the Asia-Pacific region, which included US$5.5 million used for property and equipment and US$4.6 million used for the acquisitions of OpusOne Technologies, IncNet, and Ion Global. In addition, chinadotcom used US$8.8 million to make the final installment payment for the purchase of the URLswww.china.com,www.taiwan.com, andwww.hongkong.com.
Cash provided by financing activities
In 2002, cash provided by our financing activities was approximately US$5.2 million. Cash provided by our financing activities decreased by 95% from approximately US$111.5 million for the financial year ended December 31, 2001. The lower levels of cash provided by financing activities in 2002 was due to a lack of capital markets activity during the year. Cash provided by our financing activities in 2002 was primarily due to the drawdown of US$125.3 million from our bank repurchase facilities, and was offset by repayment of US$116.3 million under our bank repurchase facilities. For a summary of the exposure of certain risks related to our repurchase facility, see Item 11 of this Annual Report,Quantitative And Qualitative Disclosures About Market Risk.
Our financing activities over the last three years include:
| • | US$303.9 million from our sale of the equivalent of 7,626,000 Class A Common Shares in our January 2000 second public offering; |
| • | US$168.5 million from our sale of 18% of our subsidiary, hongkong.com Corporation in its March 2000 initial public offering on GEM; |
| • | US$125.0 million from our bank repurchase facilities in 2002; and |
| • | US$12 million from our bank repurchase facilities in January 2003 which was repaid in February 2003. |
On October 3, 2000, we filed with the Commission, our registration statement on Form F-3 relating to the sale of 3,314,685 Class A Common Shares. We did not receive any proceeds from the sale of those registered shares as they were sold for the account of selling shareholders.
67
Table of Contents
On January 12, 2001, we registered 15 million Class A Common Shares, par value US$0.00025 per share, that may be offered and issued from time to time in connection with acquisition of other businesses, assets or securities. We do not expect to receive any proceeds from the sale of these registered shares as the subsequent sales will be solely to and for the accounts of the selling shareholders, if any.
We currently anticipate the net proceeds from our financing activities to date, including the interest income derived from previous capital raising exercises and the available funds and cash flows generated from our operations, will be sufficient to meet our anticipated needs for working capital, capital expenditures and business expansion in the near future. We may need to raise additional funds, however, in order to:
| • | fund further expansion and acquisitions; |
| • | develop new or enhanced services or products; |
| • | respond to competitive pressures; and/or |
| • | acquire complementary operations, products, business or technologies. |
Commitments, leases and long-term contracts
As of December 31, 2002, we had future minimum office rental and telephone line lease payments under non-cancelable operating leases of US$1.5 million in 2003 and US$0.2 million in 2004.
Liquidity
As of December 31, 2002, we had US$33.3 million in cash, cash equivalents and restricted cash and approximately US$471.2 million mainly invested in available-for-sale debt securities issued by U.S. government sponsored enterprises, international corporations and commercial banking institutions. The US$471.2 million includes U.S. government sponsored enterprises and corporate debt securities with a market value of US$151.1 million which are segregated and secured in accordance with certain repurchase agreements covering such debt securities. All debt securities held by the Company have maturity terms from one to over nine years. At December 31, 2002 and March 31, 2003, all the debt securities (both available-for-sale and those restricted pursuant to our repurchase facility) were carried at market value of US$471.2 million and US$302.1 million, respectively, and unrealized gain of US$3.4 million and US$2.0 million as at December 31, 2001 and March 31, 2002, respectively, were reported as “accumulated other comprehensive income” on our consolidated balance sheet.
Our primary liquidity source is the interest income generated from our cash holdings and debt securities, which can fluctuate according to the composition of our investment portfolio. In addition, we have primary lines of credit with two commercial banks through our repurchase facilities, which as of May 31, 2003 in the aggregate enable us to borrow up to a total of US$400.0 million on such terms as we and the banks may mutually agree. As of December 31, 2002, we have drawn an aggregate amount of US$125.0 million against these lines of credit, US$115.0 million of which are repayable in 2003 and US$10.0 million of which are repayable through 2011. In addition, certain of our operating companies maintain usual and customary lines of credit and over-draft protection accounts with banks to meet their operating needs.
In August 2001, each of us and our subsidiary, hongkong.com Corporation entered into a Global Master Repurchase Agreement with Fortis Bank nv-sa, an AA- rated bank (as rated by Standard & Poor’s) to establish a repurchase facility which enables us to draw down via Fortis Bank, Hong Kong Branch as of May 31, 2003 up to US$250 million in funding for a one year term. The Fortis Bank facility has been renewed for 2002. In addition, another repurchase facility with similar terms was negotiated with DBS Bank, an A+ rated bank (as rated by Standard & Poor’s), allowing us to draw down up to US$150 million for a three-year term. Each drawdown under the DBS Bank facility is to be agreed upon between ourselves and DBS Bank prior to execution. Both facilities were established to provide us with a source of reasonably priced capital to give us flexibility to finance operational working capital requirements, acquisitions, as well as our treasury management program, without
68
Table of Contents
having to liquidate our investment portfolio at short notice. Under these repurchase facilities, any draw down requires us to sell certain debt securities to the bank at a certain price, and the bank agrees to sell back to us the same securities at the same purchase price at a later date. The repurchase dates are set in three or six month intervals for an entire term of one year or three years, depending on which facility is drawn. In effect, the bank retains title to our securities as collateral to enable us to draw down up to a total of US$400 million.
Under our Repurchase Agreement with Fortis Bank, we sold certain of our debt securities to Fortis Bank at a discounted price, and the bank agreed to sell back to us at that same discounted price the same debt securities at a later date. Either party with a net exposure from the transaction arising from fluctuations in the market value of the debt securities may request the other party to make a cash or transfer of acceptable debt securities at least equal to that net exposure. During the period between the date that we sold the debt securities to the bank and the later date it repurchased such securities, the bank has agreed to pay to us any income in respect of the debt securities, and we have agreed to pay interest to the bank at LIBOR plus a spread per annum.
Under our Swap Agreement with DBS Bank, we transferred securities and financial instruments to the bank in exchange for cash, and concurrently, we agreed to reacquire the securities and financial instruments at a future date for an amount equal to the cash exchanged plus an interest factor. The Swap Agreement permits us to elect for net cash settlement upon termination of the total return swap transaction. During the period between the date we transferred the securities and financial instruments and date we reacquire them, which is three calendar years, the bank has agreed to pay to us any income in respect of the securities transferred and we have agreed, in turn, to pay the bank a price differential calculated on the cash exchanged multiplied by LIBOR plus a spread per annum.
During the period after we have sold the debt securities to the bank and before we buy back the same debt securities, we consider such debt securities to be restricted debt securities. As of December 31, 2002, we held US$19.2 million of restricted debt securities under our Repurchase Agreement with Fortis and US$11.9 million of restricted debt securities under our Swap Agreement with DBS.
Capital Expenditures
Our total capital expenditures amounted to US$29.2 million, US$8.3 million and US$5.5 million in 2000, 2001 and 2002, respectively. Our primary capital expenditure in each of those years was the purchase of computers, servers and network equipment, and other items related to the expansion of our business network across the Asia Pacific, the United States and the United Kingdom. We have funded our operations and capital expenditures entirely through funds raised from our shareholders, including private rounds of financing prior to our IPO in July 1999 and a second public offering in January 2000. For the foreseeable future we anticipate that we will fund our operations and capital expenditures primarily by applying the cash holdings still available to us from the proceeds of our equity offerings.
Contractual Obligations and Other Commitments
Total long-term bank loans amounted to US$11.6 million at December 31, 2002, in which there was a mortgage loan of US$1.5 million on a building we purchased in 2001. The mortgage loans will be repaid by installments with the last payment due in 2011. Freehold land and buildings with a carrying amount at December 31, 2002 of US$2.5 million are pledged as collateral to secure these loans. The weighted average interest rates on our long-term bank loans as of December 31, 2002 was 2.1% compared to 4.1% as of December 31, 2001. The decline was attributable to an overall decline in interest rates.
As of December 31, 2002, we had future commitments to purchase additional shareholdings in three subsidiaries for an aggregate of US$1.0 million and additional consideration based on the future revenues, gross margins and/or operating results of the subsidiaries. The commitments shall be settled by cash and/or our shares.
69
Table of Contents
During the year ended December 31, 2002, 1,764,555 Class A Common Shares were repurchased at prices ranging from US$1.92 to US$3.24 per share. 1,692,001 of the repurchased Class A Common Shares were retired at prices ranging from US$2.334 to US$2.826 per share. The redemption premium was deducted from the additional paid-in capital.
Financial Accounting Policies and Estimates
Our discussion and analysis of our financial condition and results of operations are based upon our consolidated financial statements, which have been prepared in accordance with GAAP. The preparation of these financial statements requires us to make estimates and judgments that affect the reported amounts of assets, liabilities, revenues and expenses, and related disclosure of contingent assets and liabilities. On an on-going basis, we evaluate our estimates, including those related to goodwill and intangible assets, investment, revenue recognition, accounts receivable and allowance for doubtful accounts. We base our estimates on historical experience and on various other assumptions that are believed to be reasonable under the circumstances, the results of which form the basis for making judgments about the carrying values of assets and liabilities that are not readily apparent from other sources. Actual results may differ from these estimates under different assumptions or conditions.
We believe the following critical accounting policies affect the more significant judgments and estimates used in the preparation of our consolidated financial statements.
Revenue recognition
We generate revenues from three primary sources:e-business solutions, advertising and sales of IT products. In addition, we generate revenue from the provision of software licenses, professional services and application of management services.
e-business solutions service fees are derived from services provided for the design and development of Internet Web sites, system integration and monthly maintenance and hosting of computer-based information. Projects are generally priced to clients on a project-completion basis, employing a time-sheet with hourly billable charges for different stages of a project, although certain Web design and development engagements which are short-term projects are billed on a fixed-price basis. e-business solutions service fees are recognized when services are provided. Professional services and other revenues include revenues from consulting services, training, and post-contract support. Revenues from customer training and education are recognized at the date the services are performed. Revenue from post-contract support, such as unspecified upgrades and telephone support, is recognized ratably over the period the support is provided.
Advertising service fees are derived from the online sales of banner advertisements, direct mailing and sponsorships in which we deliver advertising for a fixed fee on our Web sites and advertising with our affiliates, which comprises third party Web sites and offline advertising campaigns. Online advertising revenue is derived principally from short-term advertising contracts in which we may guarantee a minimum number of impressions to advertisers over a specific period of time for a fixed fee. Revenues from online banner advertising are recognized ratably in the period in which the advertisement is displayed, provided that we have no significant remaining obligations and collection of the resulting receivable is reasonably assured, at the lesser of the ratio of impressions delivered over total guaranteed impressions or the straight-line basis over the term of contract. Advertising service fees from direct mailing are derived from advertisements sent to electronic mail users registered with us, and are recognized when advertisements are sent. Offline advertising revenue is derived principally from fees for services and production of advertisements. Revenue is realized when the service is performed, in accordance with the terms of the contractual arrangement, and collection is reasonably assured.
Certain of our subsidiaries act as an advertising agent for their customers, and the related revenues are recorded net in the consolidated statement of operations.
70
Table of Contents
We pay affiliated Web sites a percentage of advertising revenue, ranging from 50% to 85%, in exchange for providing advertising space to our network. We become obligated to make payments to such advertising affiliates in the period the advertising is delivered. Such expenses are classified as cost of revenues in the consolidated statements of operations.
Sale of IT products revenue is derived principally from the distribution of computer hardware and software products. Revenue is recognized when the title to the products and risk of ownership are transferred to customers, which occurs principally upon delivery to the customer. In instances where the license agreements provide that we will provide the customer with ongoing post-contract support and/or rights to upgrades and updates, and our service cannot be separated from the third party software license, revenue from licensing the software is recognized ratably over the period of the concurrent application management services agreement. Provisions for discounts and rebates to customers, estimated returns and allowances, and other adjustments are provided for in the same period in which the related sales are recorded.
Goodwill and intangible assets
Goodwill represents the excess of cost over the fair value of net tangible and identifiable intangible assets of acquired businesses. Effective January 1, 2002, we adopted SFAS 142, Goodwill and Other Intangible Assets. In accordance with SFAS 142, we ceased amortizing goodwill and performed a transitional test of goodwill as of January 1, 2002. SFAS 142 requires that goodwill be tested for impairment at the reporting unit level (operating segment or one level below an operating segment) on an annual basis and, in certain circumstances, between annual tests. The test involves a two-step process. The first step involves comparing the fair value of the reporting unit with the reporting unit’s carrying amount, including goodwill. Fair value is primarily determined by computing the future discounted cash flows expected to be generated by the reporting unit. If the carrying value exceeds the fair value, goodwill may be impaired. If this occurs, we perform the second step of the test to determine the amount of impairment loss. Fair value is allocated to the reporting unit’s assets and liabilities in a manner similar to a purchase price allocation in order to determine the implied fair value of the reporting unit’s goodwill. This implied fair value is then compared with the carrying amount of the reporting unit’s goodwill, and if it is less, we would then recognize an impairment loss. Prior to January 1, 2002, goodwill was amortized to expense on a straight-line basis over a period of two to five years. The carrying value of goodwill was reviewed for possible impairment whenever events or changes in circumstances indicated that an impairment might exist. No goodwill impairment losses have been recognized in 2002.
Our intangible assets represent our trademarks, service marks, URLs, software applications and programs, and customer databases. Intangible assets are carried at cost less accumulated amortization. Amortization is computed using the straight-line method over the estimated economic life of the respective assets. We have registered certain trademarks, service marks and domain names with the United States Patent and Trademark Office and in other jurisdictions. We believe the service marks and domain names are of material importance to our business and have an estimated useful life of twenty years. Accordingly, these trademarks, service marks and domain names are amortized on a straight-line basis over a period of twenty years. We have purchased certain software programs and customer databases as a result of acquisitions. We consider the software applications and customer databases will generate revenues for us for three years. Accordingly, these software applications and programs and customer database are amortized on a straight-line basis over a period of three years. We annually review and adjust the carrying value of purchased intangible assets if the facts and circumstances suggest purchased intangible assets may be impaired. If this review indicates purchased intangible assets may not be recoverable, as determined based on the undiscounted cash flows of the acquired entity over the remaining amortization period, the carrying value of intangible assets will be reduced by the estimated shortfall in discounted cash flows.
Investments
71
Table of Contents
Debt and marketable equity investments which represent available-for-sale securities are stated at fair value. Unrealized holding gain or loss, net of tax, on available-for-sale securities is included in a separate component of shareholders’ equity. Realized gains and losses and decline in value judged to be other than temporary on available-for-sale securities are included in gain/loss on disposal of available-for-sale securities and impairment of available-for-sale securities, respectively. The cost of securities sold is based on the first-in, first-out method. Interest and dividends on securities classified as available-for-sale are included in interest income and other income, respectively.
All other investments, for which we do not have the ability to exercise significant influence and there is not a readily determinable market value, are accounted for under the cost method of accounting. Dividends and other distributions of earnings from investees, if any, are included in income when declared. We periodically evaluate the carrying value of our investments accounted for under the cost method of accounting, and declines in value are included in impairment of cost investments.
Accounts receivable and allowance for doubtful accounts
As we have operations in over 10 countries, there are variations in credit terms from country to country and from segment to segment. Within the broad range of credit policies, the credit terms applicable to each of our individual business segments are based on the following general guidelines:
For 2002
| • | For sales of software products, we offer “30 to 60 days credit from date of delivery of software” or “cash on delivery”; |
| • | For sales of consulting services, we offer “30 to 60 days credit after completion of milestones per agreement”; and |
| • | For sales in the advertising and marketing activities business, we offer three standard payment options “cash on delivery”, “14 days after completion of campaign” or “30 days credit”. |
Our general policy for the provision of allowance for doubtful accounts in 2002 and 2003 was as follows:
| Number of days past due | Rate (% of Accounts Receivable) | |||
| Over 90 days | 25 | % | ||
| Over 120 days | 50 | % | ||
| Over 180 days | 100 | % | ||
Accounts receivable are carried at their original amount less an allowance for doubtful accounts. We have adopted credit control policies to ensure that collection of the accounts receivable is probable and that recognition of the related revenue is appropriate. The allowance for doubtful accounts is established based on our credit control policies.
Our accounts receivable balances are in excess of what would be expected if we consistently enforced our credit terms. The reasons for the inconsistency in each segment are as follows:
Software and consulting services:
The 26% and 38% of receivables over 90 days outstanding in 2001 and 2002, respectively, was mainly due to the prevailing practice for customers in China to delay payments beyond their due dates. In addition, the rapid global reversal of spending on technology and internet-related products and services that occurred during the course of 2001 had a severe knock-on effect which reduced economic growth in the markets and for the companies to which we were exposed, particularly in China. As a result, many of the companies that we provided services for were unable to pay or simply delayed payment, or in some instances refused payment, when the time came for collection.
For 2001 and 2002, we made the appropriate provision for allowance for doubtful accounts based on our credit policies as described above.
Advertising and marketing activities:
The 7% and 23% of receivables over 90 days outstanding in 2001 and 2002, respectively, was mainly due to the same factors as described above which affected the collection rates for software and consulting services, namely the prevailing practice for customers in China to delay payments beyond their due dates. In addition, the adverse economic environment in 2002 also affected some customers’ ability to pay on time.
For 2001 and 2002, we made the appropriate provision for allowance for doubtful accounts based on our credit policies as described above.
In each period, we concluded that the recorded accounts receivable balances were collectible and that revenue recognition was appropriate based on the criteria outlined in SAB 101 for advertising and marketing activities, in SOP 91-2 for sales of IT products, and in SOP 81-1 for consulting services. Specifically, in each case where a receivable is recorded and revenue is recognized:
| • | Persuasive evidence of an arrangement existed - evidence of the arrangement is provided by a contract signed by ourselves and the customer. |
| • | Delivery has occurred - delivery occurs when the customer has taken title and assumed the risks and rewards of ownership. Risk of ownership must have passed to the customer. Delivery is considered not to have occurred if there are undelivered elements that are essential to the functionality of the product or services that we have delivered. |
| • | Fee is fixed or determinable – prices for products and services are always pre-determined and included in the terms of the contract. |
| • | Collectibility is reasonably assured – determined by assessing customers’ credit, establishing credit limits, performing credit checks as warranted and signing contracts with all customers to establish a legal obligation to pay, to provide assurances that accounts will be collectible. |
72
Table of Contents
We believe that our assessment of the collectibility of accounts receivable has subsequently proven to be valid, as evidenced by the percentage subsequent settlement received up to April 2004 for balances as at December 31, 2002.
Provision for bad debt expenses were $3.0 million, $3.1 million and $4.3 million for the three years ended December 31, 2000, 2001 and 2002, respectively. Ratio of provision for bad debt expenses to total revenue were 2.46%, 4.04% and 6.75% for the three years ended December 31, 2000, 2001 and 2002, respectively. The increasing ratio of bad debt expenses in the past three years was due to the general economic downturn and the increasing sales in China. Credit assessment work is more difficult to perform accurately in China because of less credit rating in information available as compared to other parts of the world.
Impact of Certain Recently Issued Accounting Standards
In April 2002, the Financial Accounting Standards Board, or FASB, issued SFAS 145,Rescission of FASB Statements No. 4, 44, and 64, Amendment of FASB Statement No. 13, and Technical Corrections. Among other provisions, SFAS 145 rescinds SFAS 4,Reporting Gains and Losses from Extinguishment of Debt. Accordingly, gains or losses from extinguishment of debt shall not be reported as extraordinary items unless the extinguishment qualifies as an extraordinary item under the criteria of Accounting Principles Board, or APB, Opinion No. 30,Reporting the Results of Operations-Reporting the Effects of Disposal of a Segment of a Business, and Extraordinary, Unusual and Infrequently Occurring Events and Transactions. Gains or losses from extinguishment of debt that do not meet the criteria of APB 30 should be reclassified to income from continuing operations in all prior periods presented. We adopted SFAS 145 effective January 1, 2002, and expect the adoption to have no material effect on our results of operations and financial condition.
In June 2002, the FASB issued SFAS 146,Accounting for Costs Associated with Exit or Disposal Activities. SFAS 146 provides guidance related to accounting for costs associated with disposal activities covered by SFAS 144 or with exit or restructuring activities previously covered by Emerging Issues Task Force, or EITF, Issue No. 94-3,Liability Recognition for Certain Employee Termination Benefits and Other Costs to Exit an Activity (including Certain Costs Incurred in a Restructuring). SFAS 146 supersedes EITF Issue No. 94-3 in its entirety. SFAS 146 requires that costs related to exiting an activity or to a restructuring not be recognized until the liability is incurred. SFAS 146 will be applied prospectively to exit or disposal activities that are initiated after December 31, 2002.
In December 2002, the FASB issued SFAS 148,Accounting for Stock-Based Compensation, Transition and Disclosure. SFAS 148 provides alternative methods of transition for a voluntary change to the fair value based method of accounting for stock-based employee compensation. SFAS 148 also requires that disclosures of the pro forma effect of using the fair value method of accounting for stock-based employee compensation be displayed more prominently and in a tabular format. Additionally, SFAS 148 requires disclosure of the pro forma effect in interim financial statements. The transition and annual disclosure requirements of SFAS 148 were effective for us in 2002. We do not expect SFAS 148 to have a material effect on our results of operations or financial condition.
In November 2002, the EITF reached a consensus on Issue No. 00-21,Revenue Arrangements with Multiple Deliverables. EITF 00-21 provides guidance on how to account for arrangements that involve the delivery or performance of multiple products, services and/or rights to use assets. The provisions of EITF 00-21 will apply to revenue arrangements entered into in fiscal periods beginning after June 15, 2003. We are currently evaluating the effect that the adoption of EITF 00-21 will have on our results of operations and financial condition.
In November 2002, the FASB issued FASB Interpretation No. 45, or FIN 45,Guarantor’s Accounting and Disclosure Requirements for Guarantees, Including Indirect Guarantees of Indebtedness of Others. FIN 45 requires that a liability be recorded in the guarantor’s balance sheet upon issuance of a guarantee. In addition, FIN 45 requires disclosures about the guarantees that an entity has issued, including a roll-forward of the entity’s product warranty liabilities. We do not expect the adoption of FIN 45 will have an impact on our consolidated financial position and results of operations.
In January 2003, the FASB issued FASB Interpretation No. 46, or FIN 46,Consolidation of Variable Interest Entities, an Interpretation of ARB No. 51. FIN 46 requires certain variable interest entities to be consolidated by the primary beneficiary of the entity if the equity investors in the entity do not have the characteristics of a controlling financial interest or do not have sufficient equity at risk for the entity to finance its activities without additional subordinated financial support from other parties. FIN 46 is effective for all new variable interest entities created or acquired after January 31, 2003. For variable interest entities created or acquired prior to February 1, 2003, the provisions of FIN 46 must be applied for the first interim or annual period beginning after June 15, 2003. We are currently evaluating the effect that the adoption of FIN 46 will have on our results of operations and financial condition.
C. Research and Development, Patents and Licenses, etc.
We do not have a formal research and development policy, and to date we have not spent significant amounts on company-sponsored research and development activities. In 2002, research and development costs represented less than 1% of our revenues. As part of our overall strategy to develop and introduce more proprietary products to sell across our business lines and service offerings, we anticipate that our research and development costs may increase as a percentage of overall revenues, particularly considering the anticipated cost of software development activities in China. At this time, we do not expect our research and development costs for future years to account for a greater percentage of revenues than currently expected in 2003.
D. Trend Information
The industries in which we compete continued to undergo rapid change over the course of 2002 as competitive models evolved, a trend compounded by continuing subdued investment and business sentiment towards the businesses that we own and operate. Similar to many other companies in related parts of the
73
Table of Contents
technology and Internet industries, we saw a slowdown or reversal in our existing operations throughout the first half of 2002, and then a stabilization during the second half of 2002. We discontinued non-performing and non-profitable operations during the course of 2002, and have taken additional cost cutting measures in order to reduce losses. At the same time, we continue to execute our software strategy to move up the value curve through investments in software-related business and through entering strategic partnerships with leading software vendors. As a result of these actions, we recorded a net profit for the first time since our public offering (with the exception of the one-time non-operating profit recorded in 2000 from the sale of shares in Hongkong.com), of US$1.2 million in the fourth quarter of 2002.
While the first half of 2002 continued to reflect the effects of the regional and global economic slowdown, there were signs by the fourth quarter of 2002 that conditions were beginning to stabilize, as evidenced by a 2% improvement in our revenues for the fourth quarter of 2002 compared to the third quarter of 2002. Looking forward, we will seek to increase the proportion of recurrent revenues in our business by actively seeking out longer-term, ‘annuity’-style projects, as well as by looking to acquire companies that are profitable and have a high percentage of recurrent revenues in their current business mix. We believe such characteristics can be found in some of our recent acquisition activities, such as our recent acquisition of Praxa Limited whose core business is the provision of information technology products and services through outsourcing, application development and support, and system integration in Australia. As a result of the acquisition, we expect to increase the number of potential clients for a low-cost China and India-based outsourcing platform Praxa is seeking to develop, and to extend the distribution of our own software products into the Australian marketplace. We expect the addition of Newpalm, a mobile SMS services and applications provider in the PRC, will contribute to our revenue growth in a rapidly growing sector of the mobile applications market in China, and help contribute to an overall increase in gross margins for the company. We will also look to add investments in companies that feature their own proprietary intellectual property. In this way, we aim to broaden our service offering in the enterprise solutions space by overlaying such acquisitions on our existing software, solutions, implementation and integration capabilities. However, we expect our advertising revenues to decline in future periods as a significant part of our advertising revenues have been derived from our South Korean online network advertising business which has now lost its exclusive service agreement with Daum Communications, a leading South Korean portal company, and revenues from our database marketing related businesses in Australia will require time to grow.
In light of the many risks and uncertainties surrounding chinadotcom, Greater China, Asia and the enterprise software, technology, marketing and media markets, shareholders, investors and prospective investors should keep in mind that we cannot guarantee that the forward-looking statements described in this Annual Report will or can prove true.
74
Table of Contents
ITEM 6. DIRECTORS, SENIOR MANAGEMENT AND EMPLOYEES
A. Directors and Senior Management
The following table sets forth information regarding our directors and executive officers as of each of December 31, 2002 and May 31, 2003:
| Board of Directors | Age* | Position | Class of Directorship | |||||
| Raymond K.F. Ch’ien | 50 | Executive Chairman | III, term to expire in 2005 | |||||
| Peter Yip | 50 | Vice Chairman and Chief Executive Officer | III, term to expire in 2005 | |||||
| Zhou Shun Ao | 53 | Vice Chairman | III, term to expire in 2005 | |||||
| J. Carter Beese, Jr. | 46 | Director | I, term to expire in 2003** | |||||
| Thomas M. Britt, III | 42 | Director | I, term to expire in 2003** | |||||
| Chan Wing-Tak, Douglas | 53 | Director | II, term to expire in 2004 | |||||
| Harry Edelson | 69 | Director | I, term to expire in 2003** | |||||
| William Fung | 53 | Director | II, term to expire in 2004 | |||||
Executive Officers | ||||||||
| Daniel Widdicombe | 36 | Chief Financial Officer | ||||||
| Steven Chan | 35 | Director, Legal and Company Secretary | ||||||
| Rudy Chan | 41 | Chief Executive Officer of hongkong.com Corporation | ||||||
| Herman Cheng | 35 | Principal, Ion Global and Managing Director of Greater China | ||||||
| * | As of December 31, 2002. | |
| ** | Subject to re-election by shareholders at our 2003 annual general meeting. |
The address of each of our executive officers and directors is c/o chinadotcom corporation, 34/F Citicorp Centre, 18 Whitfield Road, Causeway Bay, Hong Kong. The following is a brief biography of each of our directors and executive officers:
Raymond K.F. Ch’ienhas served as Executive Chairman of our Board of Directors since April 2001. Previously, since January 1999, Dr. Ch’ien served as our Chairman. Between October 1996 and March 2001, he was also a member of the Board of Directors of our former parent company CIC. Dr. Ch’ien is Chairman and Executive Committee member of our Hong Kong listed subsidiary, hongkong.com Corporation. Dr. Ch’ien is also currently on the boards of HSBC Holdings plc, the Hongkong and Shanghai Banking Corporation Limited, Inchcape plc, Inmarsat Ventures plc, Convenience Retail Asia Limited, VTech Holdings Ltd., MTR Corporation Limited and The Wharf (Holdings) Limited. He is also non-executive chairman of HSBC Private Equity (Asia) Limited. Dr. Ch’ien is Chairman of the Hong Kong/Japan Business Co-operation Committee and Chairman of the Advisory Committee on Corruption of the Independent Commission Against Corruption. In addition, Dr. Ch’ien is the honorary president and past chairman of the Federation of Hong Kong Industries. He is also President of Hong Chi Association, Hong Kong’s leading non-government organization helping mentally handicapped persons. Dr. Ch’ien was appointed a member of the Executive Council of the Hong Kong SAR and served until July 2002. Dr. Ch’ien received a doctoral degree in economics from the University of Pennsylvania in 1978, was appointed a Justice of the Peace in 1993 and a Commander in the Most Excellent Order of the British Empire in 1994. In 1999, he was awarded the Gold Bauhinia Star medal.
75
Table of Contents
Peter Yipis a Vice Chairman of our Board of Directors. He has been our Chief Executive Officer since January 1999. Mr. Yip is also an Executive Director of our Hong Kong listed subsidiary, hongkong.com Corporation. He has also served as the Vice Chairman of the Board of Directors of CIC since May 1996. Mr. Yip has international experience as an entrepreneur in the media and telecommunications industry. Prior to forming chinadotcom, Mr. Yip founded a systems integration company which eventually was sold to SHL Systemshouse, a company since acquired by MCI. He previously was a senior management consultant at KPMG Consulting and was a Senior Research Fellow at Wharton Applied Research. Mr. Yip received his MBA from the Wharton School and his MSEE and BSEE from the University of Pennsylvania.
Zhou Shun Aohas been a Vice Chairman of our Board of Directors since December 2000. He was our Chief China Officer from January 1999 to December 2000. Mr. Zhou has served for more than 30 years at Xinhua News Agency, and is currently General Manager of the Asia-Pacific Bureau at Xinhua News Agency. He has also served as Executive Deputy General Manager at Xinhua News Agency. He was Deputy Director of Xinhua Department for Business Development, General Manager of China Media Development Corporation and Chairman of the Board of China Global Public Relations Corporation. Mr. Zhou has also served as an Executive Director of our Hong Kong listed subsidiary, hongkong.com Corporation. He has also served as the Chairman of the Board of Directors of CIC since October 1998.
J. Carter Beese, Jr.has served as an independent director since April 1999. He is President of Riggs Capital Partners, a venture capital fund in excess of US$100 million, and the Vice-Chairman of Riggs & Co, both of which are affiliated with Riggs National Corporation. Mr. Beese is also a Senior Advisor to the Center for Strategic and International Studies. Prior to the merger between Bankers Trust and Alex.Brown, Mr. Beese was Chairman of Alex.Brown International. He originally joined Alex.Brown in 1978, became an officer in 1984, and a partner in 1987. In 1992, he was appointed as the U.S. Commissioner of the Securities and Exchange Commission, where he served until November 1994. Mr. Beese currently also serves as director of Aether Systems, Inc. and Riggs National Corporation.
Thomas M. Britt, IIIhas served as an independent director since May 2000. Mr. Britt is the co-founder and Managing Director of IRG Limited, an investment banking boutique focused on the telecommunications, media and technology sectors in Asia. Prior to co-founding IRG in 2000, Mr. Britt was the senior partner of the U.S. Securities Group in the Hong Kong office of Clifford Chance LLP, the world’s largest law firm, and the founding and managing partner of the Hong Kong office of Rogers & Wells LLP, a leading U.S. law firm. Mr. Britt has JD and MBA degrees from New York University and an AB degree from Georgetown University.
Chan Wing-Tak, Douglashas served as a director since January 1999 and is a Non-Executive Director of our Hong Kong listed subsidiary, hongkong.com Corporation. Mr. Chan is currently an executive director of New World China Land Limited, a Hong Kong listed company, the Managing Director of New World Infrastructure Limited., a Hong Kong listed company. Mr. Chan is also the deputy chairman of Pacific Ports Co. Ltd., a Hong Kong listed company. He also served as a director of CIC from September 1997. Mr. Chan holds a Bachelor of Commerce degree from the University of Windsor in Canada, and is a member of the Institute of Chartered Accountants of Ontario, Canada.
Harry Edelsonhas served as a non-executive director of chinadotcom since January 1999. Mr. Edelson also served as a Non-Executive Director of our Hong Kong listed subsidiary, hongkong.com Corporation, from November 1999 until February 2002 when he resigned and as a director of CIC from October 1996 until June 2001 when he resigned. Mr. Edelson is the founding partner of Edelson Technology Partners, a high technology venture capital partnership providing assistance to multinational corporations. Strategic investors in these partnerships include AT&T Corp., Viacom Inc., 3M Company, Ford Motor Company, Colgate-Palmolive Company, Asea Brown Boveri, Reed Elsevier plc and Cincinnati Bell Inc.
William Funghas served as an independent director since June 2001. Dr. Fung is Group Managing Director of Li & Fung Limited, and has held key positions in major trade associations. He is past Chairman of
76
Table of Contents
the Hong Kong General Chamber of Commerce, the Hong Kong Exporters’ Association and the Hong Kong Committee for the Pacific Economic Cooperation Council. Dr. Fung holds a BS in Engineering from Princeton University and an MBA from the Harvard Graduate School of Business. He has been awarded an Honorary Doctorate degree of Business Administration by the Hong Kong University of Science and Technology. Dr. Fung is also non-executive director of Convenience Retail Asia Limited, HSBC Holdings plc, Vtech Holdings Limited and CLP Group Holdings Limited.
Daniel Widdicombehas served as our Chief Financial Officer since December 2000. Prior to joining chinadotcom, Mr. Widdicombe was Chief Financial Officer of I-Quest Corporation. He was also the Managing Director of Telecoms and Internet Equity Research at Bear Stearns Asia Ltd. where he worked as an investment analyst researching and evaluating companies across Asia. He was previously an equity analyst at HSBC James Capel in London and Hong Kong. Mr. Widdicombe is a First Class Honors graduate of Edinburgh University, Scotland.
Steven Chanhas served as our Director, Legal and Company Secretary since May 2001. He advises the management of the company on legal, operational and strategic issues. Mr. Chan previously was a corporate associate with the New York offices of each of Morrison & Foerster LLP and Milbank, Tweed, Hadley & McCloy LLP. He received a JD degree from Boston College Law School and an AB degree from University of California at Berkeley.
Rudy Chanhas served as Chief Executive Officer at our Hong Kong publicly listed unit, hongkong.com Corporation since February 2000. Mr. Chan first joined us as Director of e-commerce in November 1999. Immediately prior to joining us, Mr. Chan was a founding member of Bartercard in Hong Kong. His previous experience includes eight years with Time Inc., and he has served as the Managing Director of Time Inc.’s Asian operations. Mr. Chan received his BS and MBA degrees from the Wharton School at the University of Pennsylvania. He is also a certified public accountant registered with the State of New York.
Herman Chenghas been a Principal with Ion Global since May 1999 and is currently Managing Director of Greater China. He is responsible for helping clients create and manage strategic e-business initiatives and for growing the Hong Kong office. Mr. Cheng has extensive experience in implementing e-business solutions. He joined Ion Global from Accenture (formerly Andersen Consulting), where he was a senior consulting manager in their U.S. and Hong Kong technology practices. Mr. Cheng has over 12 years of hands-on experience in major systems integration projects. He holds an MBA from Butler University and a BS in Electrical Engineering from Purdue University.
B. Compensation
Directors
We paid an aggregate amount of compensation (inclusive of directors’ fees) during 2002 to our directors as a group equal to US$322,592, as well as options to purchase our Class A Common Shares as described below. Directors are reimbursed for all expenses incurred in connection with each Board of Directors meeting and when carrying out their duties as directors of chinadotcom.
In 2002, our Board of Directors established the director compensation structure with respect to our 2002 non-executive directors and Chairman. We pay each non-employee director and the Chairman US$25,000 per year for their respective services, provided they attend at least 60% of the board meetings held each year. We pay members of our Audit Committee US$10,000 per year for their services on the Committee, and we pay US$40,000 to the independent member of our Executive Committee, provided they each attend at least 60% of their respective committee meetings held each year.
During 2002, we granted our director options to purchase a total of 400,000 Class A Common Shares. Under the 2002 director compensation measures approved by our Board of Directors, each non-employee
77
Table of Contents
director who served on our Board of Directors throughout 2002 is to be granted 50,000 stock options with 1/3 to be vested as of the grant date and the future vesting to be dependent upon future attendance by the respective director of not less than 60% of the Board meetings held during the course of the next two years. An additional 50,000 stock options with similar vesting provisions was granted to the independent member of our Executive Committee.
Executive Officers
We paid an aggregate amount of compensation during 2002 to our executive officers as a group equal to US$811,766, as well as options to purchase Class A Common Shares as described below. We have entered into employment agreements with a number of the executive officers named in Item 6.A. of this Annual Report,Directors, Senior Management and Employees — Directors and Senior Management. These arrangements provide for terms of service, salary and additional compensation arrangements, including in some cases housing refunds and other benefits, all of which have been reflected in the 2002 aggregate compensation amount. For certain directors and executive officers, these arrangements also include the right to receive a severance payment equal to three months of their respective salaries if such persons are terminated by us without cause and a right to have their respective stock options accelerated under certain conditions, including a change of control of chinadotcom.
Mandatory Provident Fund
The Mandatory Provident Fund, or MPF, scheme is the standard pension payment required by the Hong Kong government. In the MPF scheme, mandatory contributions are basically calculated on the basis of 10% of an employee’s relevant income, with the employer and employee each paying US$128 per month or up to 5% of the employee’s relevant income. This requirement also applies to our executive officers in compliance with the overall scheme.
1999 Stock Option Plan
Pursuant to our 1999 Stock Option Plan, as amended, options may be granted to directors, executive officers, employees and consultants of chinadotcom corporation and its subsidiaries for the purchase of up to an aggregate of 20 million Class A Common Shares. As of March 31, 2003 under our 1999 Stock Option Plan, we had granted options to directors and employees to purchase approximately 7.9 million Class A Common Shares at a weighted average exercise price of approximately US$5.8856 per share. In addition, our directors and employees had exercised options to purchase approximately 2.3 million Class A Common Shares. Currently, the number of options vested as of March 31, 2003 under our 1999 Stock Option Plan is approximately 4.9 million of our Class A Common Stock. These options generally have a five or ten year term. The 20 million options available under our 1999 Stock Option Plan do not include 1,881,442 of the 2,081,442 options granted to APOL, a company controlled by our Chief Executive Officer. We have granted APOL the right to purchase 1,881,442 and 200,000 of our Class A Common Shares at an exercise price of US$5.00 and US$2.82 per share, respectively.
Our 1999 Stock Option Plan is administered by the Compensation Committee of the Board of Directors, which determines, in its discretion, the number of Class A Common Shares subject to each option granted and the related purchase price and option period.
The 1999 Stock Option Plan requires that each option shall expire on the date specified by the Compensation Committee, but not more than ten years from the date on which the option was granted. Under the Plan, upon the voluntary termination of employment by an option holder or termination of an option holder for cause by chinadotcom, any options granted under the 1999 Stock Option Plan to the option holder generally will terminate. If termination was due to death, retirement or disability, the option holder, or his or her successors, have a period of one year within which to exercise the option holder’s options. If termination was due to any
78
Table of Contents
other reasons, options granted under the 1999 Stock Option Plan may be exercised within three months of the termination. Options granted are nontransferable except by will or as otherwise authorized by the Compensation Committee.
Upon the occurrence of any change in our capital structure, including any merger, liquidation, reorganization, recapitalization, the Compensation Committee may amend the 1999 Stock Option Plan, in a way as to preserve the rights of option holders substantially proportionate to their rights existing prior to the occurrence of such event, as it may feel necessary. Upon the occurrence of a change of control in chinadotcom, the Compensation Committee may amend the 1999 Stock Option Plan as it may deem appropriate provided that such adjustments do not have a substantial adverse impact on the option holder. Unless terminated earlier by action of the Board of Directors, the 1999 Stock Option Plan will terminate on May 17, 2009, the ten-year anniversary of the approval of the Plan by the Board and the shareholders.
Share Option Replacement Program
On August 27, 2001, we cancelled options held by our employees to purchase approximately 1.2 million Class A Common Shares. On February 28, 2002, we issued options to hose same employees to purchase approximately 665,000 Class A Common Shares. The exercise price of the options granted on February 28, 2002 was US$2.87 per share, being the last reported closing price of our Class A Common Shares on February 27, 2002. Our then-current Board of Directors members and executive officers were not eligible to participate in this share option replacement program. Further, our employees, including our executive officers, who received benefits under our bonus scheme as described below were also not able to participate. A total of 490 of our employees participated in this program.
2002 Bonus Scheme
We introduced a performance-based cash bonus scheme in July 2002 to retain and motivate our business unit heads, senior management and top 20% of the full-time general employees of the Company. An aggregate target bonus of approximately US$0.5 million was budgeted for the scheme, but no award had been paid as of March 31, 2003. Four of our executive officers, Mr. Daniel Widdicombe, Mr. Rudy Chan, Mr. Steven Chan and Mr. Herman Cheng, were selected to participate in the bonus scheme.
Options Held by Directors and Officers
As of March 31, 2003, of the approximately 7.9 million options we had granted for the purchase of our Class A Common Shares, our directors and executive officers as a group held options to purchase a total of approximately 3.8 million of our Class A Common Shares. The weighted average exercise price of these options is approximately US$4.8316 per share. The options granted to such directors and executive officers generally vest 25%, 33-1/3% or 50% per year on a quarterly basis over a two, three or four year period, as applicable, commencing either immediately upon grant or on the first anniversary of the relevant grant. As of March 31, 2003, our directors and officers, as a group, held vested options to purchase approximately 2.6 million Class A Common Shares.
Warrants
In connection with AOL’s strategic acquisition of 6,795,200 of our Class A Common Shares prior to our initial public offering in July 1999, we granted AOL two warrants to purchase subject to certain conditions up to 18.5% and 6.5% of our total outstanding capital at an exercise price of US$5.00 per share and US$42.50 per share, respectively. The first of these warrants became exercisable in October 2000 and the second became exercisable in July 2001. Both warrants will expire in July 2003.
In connection with our acquisition of all the issued and outstanding shares of Pacific Connections Limited, we granted the initial shareholders of Pacific Connections Limited an option to acquire an additional
79
Table of Contents
240,000 Class A Common Shares at an exercise price of US$9 per share. The options have not been exercised and expire in August 2009.
No warrants may be sold, transferred, assigned, or hypothecated to any person, other than to any limited partnership with the same general partner, or to any company that directly, or indirectly, controls or is controlled by or is under common control with the holder of the warrants, without our prior consent.
C. Board Practices
Terms of Directors and Executive Officers
Our Board of Directors is divided into three classes, each class generally having a term of three years. Each year the term of one class expires and nominees for membership in that class are eligible to be elected at the relevant annual meeting of shareholders. All directors hold office until the relevant annual meeting of shareholders or until their successors have been duly elected and qualified. Executive officers are elected by and serve at the discretion of the Board of Directors.
Mr. Peter Yip was appointed as Chief Executive Officer of chinadotcom pursuant to a services agreement, as amended, dated July 12, 1999 between chinadotcom and APOL. The services agreement was replaced and approved by the Board of Directors in January 2002. The current services agreement had an initial term of one year with automatic renewal provisions, and the agreement and Mr. Yip’s appointment can be terminated by either APOL or chinadotcom with six months’ notice. The current services agreement was automatically renewed for 2003. For a summary of the terms of Mr. Yip’s services agreement, see Item 7.B of this Annual Report,Major Shareholders and Related Party Transactions — Related Party Transactions. Mr. Yip currently also serves as Vice Chairman and Director of our Board of Directors and his term as director ends in 2005 subject to re-election by shareholders at the 2005 annual shareholder meeting.
Dr. Raymond Ch’ien was appointed as Executive Chairman of our Board of Directors pursuant to a services agreement between chinadotcom and Dr. Ch’ien. The term of Dr. Ch’ien’s services agreement ends as of April 27, 2004 while his term as director ends in 2005 subject to re-election by shareholders at the 2005 annual shareholder meeting. For a summary of the terms of Dr. Ch’ien’s services agreement, see Item 7.B of this Annual Report,Major Shareholders and Related Party Transactions — Related Party Transactions.
No director or executive officer has been the subject of any order, judgment, or decree of any governmental agency or administrator or of any court of competent jurisdiction, revoking or suspending for cause any license, permit or other authority of such person or of any corporation in which he or she is a director or executive officer, to engage in normal business activities of such person or corporation.
There are no family relationships between any of the named directors and executive officers. There are no material arrangements or understandings that exist between any such director or executive officer and chinadotcom pursuant to which any such person was appointed as a director or executive officer of chinadotcom except for the arrangements between chinadotcom and each of Mr. Yip and Dr. Ch’ien.
Committees of the Board of Directors
During 2002, the Board of Directors had four standing committees:
| • | the Executive Committee; |
| • | the Audit Committee; |
| • | the Compensation Committee; and |
| • | the Related Party Transactions Committee the duties of which, since February 2002, have been integrated with the Audit Committee. |
80
Table of Contents
The Executive Committee is authorized during any interim period between quarterly meetings of the full Board of Directors, to act for and in lieu of the full Board of Directors and to approve of any transaction requiring Board approval that does not exceed US$20.0 million in consideration to be paid by chinadotcom, including in the form of up to 1 million Class A Common Shares. Currently, Messrs. Ch’ien, Yip, Zhou and Britt serve on the Executive Committee with Dr. Ch’ien serving as Chairman.
The Audit Committee selects and engages, on our behalf, the independent public accountants to audit our annual financial statements, and will review and approve the planned scope of our annual audit. In addition, since February 2002, the Audit Committee reviews the terms of proposed transactions with related parties in accordance with the terms of our Articles of Association. We have appointed to the Audit Committee each of our directors who qualify as an independent director for purposes of the rules and regulations of the Nasdaq National Market. The Audit Committee operates under a charter that is compliant with the rules and regulations of the Nasdaq National Market. Currently, Messrs. Beese, Britt and Edelson serve on the Audit Committee with Mr. Britt serving as Chairman.
The Compensation Committee establishes remuneration levels for our officers, performs such functions as provided under employee benefit programs and administers the 1999 Stock Option Plan and the 2000 and 2001 Employee Share Purchase Plans. Currently, Messrs. Ch’ien, Edelson and Fung serve on the Compensation Committee with Dr. Ch’ien serving as Chairman.
D. Employees
As of December 31, 2002, we had approximately 952 full-time, part-time and temporary employees, as compared to 1,300 at the beginning of 2002. Of our 952 employees, 371 are in technical, 131 in design and editorial, 115 in sales and business development, 34 in marketing, 64 in finance, 11 in legal, 19 in human resources, 43 in administration and 74 in general and operations management, with the remainder principally consisting of part-time and temporary employees. A significant portion of our reduction in head count was the result of the closing of under-performing subsidiaries. Going forward, we aim to continue to attract, retain and motivate highly qualified technical and management personnel, particularly highly skilled technical personnel and engineers involved in new product development. From time to time, we also employ independent contractors to support our research and development, marketing, sales and support and administrative organizations. Our employees are not represented by any collective bargaining unit, and we have never experienced a work stoppage.
E. Share Ownership
Beneficial ownership of our Class A Common Shares by our directors, senior executive officers and other major shareholders is determined in accordance with the rules of the Commission, and generally includes voting or investment power with respect to those shares. In computing the number of Class A Common Shares beneficially owned by a person, and the percentage ownership of that person, Class A Common Shares subject to options or warrants held by that person that are currently exercisable or will become exercisable within 60 days after March 31, 2003 are deemed beneficially owned and outstanding, but such Class A Common Shares are not deemed outstanding for the purposes of computing the ownership percentage of any other person.
None of our directors or senior executive officers beneficially owned more than 1% of our Class A Common Shares as of March 31, 2003, other than Mr. Peter Yip who is the beneficial owner of approximately 18.8 million, or approximately 19%, of our Class A Common Shares. Mr. Yip’s beneficial ownership under the Commission’s rules is the same as that of his spouse and APOL. APOL is the owner of record of 16,135,686 Class A Common Shares and the beneficial owner of an additional 2,271,442 Class A Common Shares due to exercisable options attributable to APOL and Mr. Yip. Mr. Yip’s spouse owns 442,219 Class A Common Shares. APOL is a company owned by Mr. Yip’s spouse and a trust established for the benefit of Mr. Yip’s children.
81
Table of Contents
ITEM 7. MAJOR SHAREHOLDERS AND RELATED PARTY TRANSACTIONS
A. Major Shareholders
We are a publicly owned corporation, and our shares are owned by U.S. residents and residents of other countries. As of March 31, 2003, we were not directly owned or controlled by another corporation or by any foreign government, and a total of 414 shareholders of record were U.S. residents holding approximately 72.4% of our Class A Common Shares. Holders of our Class A Common Shares do not have different voting rights.
The following table sets forth information concerning each person known by us who own beneficially 5% or more of our Class A Common Shares at March 31, 2003:
| Beneficial Ownership | ||||||||
| Shareholder | Shares | Percent | ||||||
| AOL Time Warner Inc.(1) | 24,820,371 | 25.00 | % | |||||
| Asia Pacific Online Limited(2) | 18,849,347 | 18.99 | % | |||||
| Xinhua News Agency(3) | 7,362,734 | 7.42 | % | |||||
| Capital Group International, Inc.(4)(5) | 7,003,100 | 7.05 | % | |||||
| Jayhawk Capital Management, L.L.C.(5)(6) | 6,942,000 | 6.99 | % | |||||
| (1) | America Online, Inc., a wholly-owned subsidiary of AOL Time Warner Inc. is the owner of record of 6,795,200 Class A Common Shares and the holder of two exercisable warrants to purchase up to 25% of our Class A Common Shares on a fully-diluted basis. | |
| (2) | Asia Pacific Online Limited, or APOL, is owned by the spouse of our Chief Executive Officer and a trust established for the benefit of Mr. Yip’s children. APOL is the owner of record of 16,135,686 Class A Common Shares and the beneficial owner of an additional 2,271,442 Class A Common Shares due to exercisable options attributable to APOL and Mr. Yip. Mr. Yip’s spouse owns 442,219 Class A Common Shares. | |
| (3) | Xinhua News Agency holds our shares through a wholly-owned subsidiary, Golden Tripod Technology Limited. | |
| (4) | Capital Group International, Inc. is the parent holding company of Capital International, Inc., the beneficial owner of 1,502,500 Class A Common Shares. Emerging Markets Growth Fund, Inc. is the beneficial owner of 5,500,600 Class A Common Shares and is advised by Capital International, Inc. | |
| (5) | Information concerning the basic beneficial ownership of our Class A Common Shares for Capital Group International, Inc. and Jayhawk Capital Management, L.L.C. has been derived from publicly available information as of February 10, 2003 and January 16, 2003, respectively. We do not have access to information, other than publicly available information, for such owners of our Class A Common Shares. | |
| (6) | Jayhawk Capital Management, L.L.C. is the beneficial owner of 6,942,000 Class A Common Shares, of which 5,315,000 Class A Common Shares are held by Jayhawk China Fund (Cayman), Ltd., 986,700 Class A Common Shares are held by Jayhawk Institutional Partners, L.P. and 640,300 Class A Common Shares are held by Lucky Henry, L.P. |
New World Infrastructure Limited ceased to be one of our shareholders in January 2003 following the sale of its entire shareholding in December 2002 and January 2003.
82
Table of Contents
B. Related Party Transactions
New World InfrastructureVia tranches during 2000 and 2001, we acquired a majority interest in Wealth Corporation Ltd, a company that indirectly owns Beijing Chinaholiday Network Company and Beijing TianJian Rainbow Airline Service Company, a group of PRC travel companies. The acquisition was based on our strategy of building a Greater China online and off-line travel capability by focusing both on the individual as well as the tour-group markets, which at that time were considered to have a reasonable long-term potential for growth. Total consideration was valued at US$12.0 million, of which US$5.2 million was in paid in cash and the balance was paid with 495,900 of our Class A Common Shares issued at the then market value of US$13.71 per share. The selling shareholders of Wealth Corporation Ltd included our former shareholder, New World Infrastructure Limited, which received approximately 11.3% of the total consideration paid by us to Wealth Corporation Ltd. We were in a dispute with the minority shareholders of Wealth Corporation Ltd, which includes New World Infrastructure Limited, concerning our ability to dilute the minority shareholders’ interests in Wealth Corporation and such minority shareholders’ right to receive further consideration. In November 2002, we entered into an amendment agreement and a share repurchase agreement with the other shareholders of Wealth Corporation Ltd whereby we reduced our stake in Wealth Corporation Ltd to 19.9% in exchange for a cash payment of US$1.0 million from the minority shareholders, including New World Infrastructure Limited.
In January 2003, New World Infrastructure Limited ceased to be one of our shareholders following the sale of its entire shareholding in the open market, as well as in privately negotiated transactions with us, APOL and our Chairman. We purchased 4,468,560 Class A Common Shares, APOL purchased 4,300,000 Class A Common Shares, and our Chairman purchased 200,000 Class A Common Shares from New World Infrastructure Limited in January 2003.
See Item 7.A. of this Annual Report,Major Shareholders and Related Party Transactions — Major shareholders.
24/7 Real Media, Inc.In October 1998, pursuant to the License and Software Agreement, or License Agreement, between ourselves and 24/7 Real Media, Inc. (formerly known as 24/7 Media, Inc.), or 24/7, which was a shareholder of our company in 2001, 24/7 granted us a non-exclusive license to use certain 24/7 software products to serve advertisements on the Internet and an exclusive license to use the “24/7 Media” trademark in the Asian market. We were obligated to pay 24/7 a percentage of certain revenues generated from advertisements on our advertising network. Under the License Agreement, 24/7 served as our exclusive agent for the sale of U.S. based advertisements on our advertising network and we served through a subsidiary as an agent of 24/7 Media Asia for the sale of Asian-based advertisements on 24/7’s U.S. network of advertising affiliates. In August 2000, the License Agreement was superceded by the 24/7 Media-Asia Agreement, or the Media Asia Agreement. In October 2000, as part of the Media Asia Agreement, we sold 19.9% of our shares in 24/7 Media Asia Limited, then a wholly-owned subsidiary, and the agent through which we sold Asian-based advertisements on 24/7’s U.S. network of advertising affiliates, to 24/7 in exchange for 2,500,000 shares of common stock of 24/7 valued at US$4.3125 per share. We continue to own less than 5% of 24/7. In June 2001, we gave 24/7 notice of termination of the Media Asia Agreement, which notice was effective in September 2001.
In June 2001, we demanded from 24/7 Media Asia Limited repayment of a portion of all loans that we had extended to 24/7 Media Asia Limited. The loans consisted of $10,956 made prior to June 30, 2000 and $9,569 made during the period from July 1, 2000 to May 31, 2001. We entered into negotiations with 24/7 Media Asia Limited, and, due to the limited cash resources available at 24/7 Media Asia Limited and a desire by the parties to allow 24/7 Media Asia Limited to keep the proceeds of the remaining $9,569 to enable it to continue to fund its operations, we agreed that 24/7 Media Asia Limited would repay only the loans made prior to June 30, 2000 amounting to $10,956. In January 2002, 24/7 Media Asia Limited completed a rights issue whereby it issued and allotted additional equity shares to all shareholders participating in the rights issue as a
83
Table of Contents
means to settle loans amounting to $10,956. While we participated in this rights issue, 24/7 chose not to participate and, therefore, 24/7’s interest in 24/7 Media Asia Limited was effectively diluted to under 2% while our interest in 24/7 Media Asia Limited increased to approximately 98%. In February 2003, 24/7 filed suit against us in Federal District Court in New York to enforce obligations allegedly owed under the Media Asia Agreement. We contest these allegations and, in May 2003, obtained an order compelling arbitration of the claims.
AOL Time Warner, Inc.In March 2001, we entered into a software license agreement with PurchasePro.com to purchase a non-exclusive, non-transferable and perpetual right to use their Marketplace Software. PurchasePro.com had a strategic relationship with our shareholder AOL which included AOL’s promotion of various PurchasePro.com products. We paid PurchasePro.com through a payment to AOL a fee of US$3.7 million for the license, of which we believe AOL retained a commission. We are dissatisfied with the PurchasePro.com software and we are seeking a remedy for this and other matters from AOL. As a result, in addition to amortization of US$925,000 during the course of 2001, we have recorded an impairment of the US$2.77 million of the remaining intangible asset balance for this software at the end of December 2001.
In other matters involving AOL, we sought the return of US$2.2 million spent by us under a software development agreement among AOL, CIC and us. Under the terms of the software development agreement dated February 1, 2000, we agreed to provide AOL with $2.2 million to finance the development of AOL software which could be utilized in the China market. We entered into the software development agreement in anticipation of a joint venture between AOL and us to develop consumer interactive services for the Chinese market. No joint venture arrangement with AOL was ever entered into, and AOL never delivered a software product to us. In addition, we sought the return of US$3.5 million in connection with an agreement to purchase advertising services from AOL. Under the terms of the agreement dated March 8, 2001, AOL agreed to render ad impressions for us on its web sites for a total fee of approximately $7 million, and we paid $3.5 million, approximately one-half of the amount due, on March 31, 2001. These amounts were expensed under sales, general and administrative in March 2001. We entered into the agreement to purchase advertising services from AOL and made partial payment under the contract as a result of representations from AOL’s representatives that AOL would be more favorably inclined to enter into a joint venture with us to develop consumer interactive services for the Chinese market if we purchased the advertising services, which did not occur following our purchase of and payment for the advertising services. We are cooperating with information requests by the Commission and other government agencies in connection with their investigation of AOL with respect to the PurchasePro.com and advertising services transactions.
On July 28, 2003, AOL and chinadotcom announced that we had reached a settlement including a settlement of all claims between the two companies and their affiliates. The companies also agreed to cancel AOL’s two warrants to acquire additional shares in chinadotcom. The companies currently have no remaining operational, strategic or other agreements. Based solely upon filings with the Commission, on September 11, 2003, AOL disposed of its entire holding of chinadotcom shares. See Item 3.D. of this Annual Report,Key Information — Risk Factors — Risks Relating to chinadotcom — We could be adversely affected if our major strategic shareholders materially change their holdings in our shares.
Golden TripodIn June 2001, we signed contracts with entities affiliated with Xinhua, Golden Tripod (Holdings) Limited, or Golden Tripod, and Xinhua News Agency Shanghai Branch, or Shanghai Xinhua, to acquire 30% of the shares of Xin Hua Asia Pacific TV (H.K.) Center Limited, a company 51% owned by Golden Tripod and 49% owned by Shanghai Xinhua, as well as to form a 50% owned joint venture in the PRC. We paid US$500,000 as a deposit after the contracts had been signed. As certain conditions precedent for the joint venture were not met during the course of 2001 we terminated the transaction and made a bad debt provision for the full deposit amount at the end of the year. We actively sought a refund during the course of 2001 and 2002, and in 2002 US$347,000 was subsequently received from remaining funds in the joint venture, which was used to partially offset the bad debt previously written-off. Additionally, as we continue to reposition our portal services and other media assets to better scale our revenues with costs, we risk worsening our relationship with
84
Table of Contents
Xinhua whose personnel until December 2002 participated in the day to day management of our portal services and certain other media assets in the PRC, and who to date still participate in the editorial oversight of the portal service. These and other developments could result in a material adverse change in our relationship with Xinhua including whether they choose to maintain a director on our Board of Directors, whether they choose to continue to remain active with respect to our operations in the PRC, whether they choose to reduce their holdings in our shares, liabilities, arbitration, litigation, settlement or unfavorable publicity, any of which could divert significant amounts of management time and other corporate resources. See Item 3.D. of this Annual Report,Key Information — Risk Factors — Risks Relating to chinadotcom — We could be adversely affected if our major strategic shareholders materially change their holdings in our shares.For the year ended December 31, 2002, we paid management fees of approximately US$293,000 to our shareholders, Golden Tripod Technology Limited, the wholly-owned subsidiary of Xinhua. These fees included salary and expenses for certain senior officers of our China portal operation, as well as fees for translation and other related expenses.
We held a series of strategic discussions with AOL regarding a potential joint venture for Internet-related services across the Greater China and Asia-Pacific region. During that time, we continued to provide e-business Solutions and advertising services in connection with our support services agreement with CIC, which related to the provision of the AOL-branded Hong Kong services. We did not recognize any revenue incurred from the provision of these services during the first half of 2001 due to the uncertainty of the collectibility of the receivable from CIC. Our Board of Directors determined that it would be in our best interest to continue to fund the AOL-branded Hong Kong services in good faith, through the provision of services to CIC, while these strategic discussions and negotiations with AOL took place. Accordingly, we continued to provide these services without seeking repayment from CIC at the time. We have incurred a total of US$7.7 million in connection with the provision of these support services, and the full amount was recorded as our own selling, general and administrative expenses, including US$5.4 million for 2001, with a view that these expenses were not recoverable. None of these amounts were recorded as revenues. After the AOL-branded Hong Kong service was terminated, in March 2001, we entered into two agreements with CIC under which we agreed not to enforce the immediate repayment, until September 30, 2001, of a total of US$4.0 million owed to us for services provided in connection with the AOL-branded Hong Kong services. The agreements were made on the express condition that CIC or its shareholders provide us with bank letters of credit, or similar guarantees of payment, for the full US$4.0 million. We subsequently received bank letters of credit or similar guarantees of payment for the full US$4.0 million and in October 2001 we demanded and received full payment under those guarantees.
hongkong.comIn each of April and May 2001, we extended guarantee agreements in favor of our majority-owned subsidiary, hongkong.com Corporation in which we agreed to pay hongkong.com fees owed for services provided to CIC in an amount up to HK$7 million, and up to HK$7 million in connection with hongkong.com’s provision of support services for the AOL-branded Hong Kong Services during the first and second quarter of 2001.
Dr. Raymond Ch’ienIn April 2001, we entered into an executive services agreement with our chairman and director Raymond Ch’ien to serve as our Executive Chairman. Under this agreement we have agreed to provide Dr. Ch’ien the following:
| • | options to purchase 400,000 Class A Common Shares, par value US$0.00025 per share, at an exercise price of US$2.74 per share that vest quarterly over three years starting July 27, 2001; |
| • | options to purchase up to 400,000 additional Class A Common Shares at an exercise price of US$2.97 that vest quarterly over three years starting October 13, 2001; |
| • | an annual salary of US$1.00; |
| • | reimbursement of company car expenses, as well as office executive assistant expenses incurred, capped at a maximum amount of US$100,000 per annum; and |
| • | reimbursement of all reasonable travel, entertainment and subscription fees incurred in the performance of his duties as Executive Chairman. |
85
Table of Contents
CICIn June 1999, we entered into a Support Services Agreement with CIC under which we agreed to provide CIC with the services required to operate local online services for America Online, Inc. (“AOL”) in Hong Kong for a fee equal to the cost of providing such services to CIC plus 10%. In April 2000, we signed an Amended and Restated Support Services Agreement with CIC which increased the markup of the provision of software and consulting services and advertising and marketing services while the markup of the provision of personnel services remained at 10%. CIC was our parent company until June 1999 when, concurrently with entry into the Support Services Agreement, CIC distributed its total interest in us to CIC’s shareholders. At the time of entry into the Support Services Agreement, several members the board of directors of CIC also served as members of our board of directors. The following table sets forth the common directors, the date each such director ceased to be a member of CIC’s board of directors of CIC and the date each such director ceased to be a member of our board of directors (as applicable), and the percentage ownership each such director held in CIC and in chinadotcom as of June 1999. While the percentage ownership such directors held in CIC and chinadotcom may have changed since June 1999, unless otherwise indicated, such percentage ownership in CIC and the Company have only decreased as of the subsequent dates of other events described under this Note 17(c).
| Date Ceased as a | Percentage Ownership | |||||||||||
| Date Ceased as a | Director of the | CIC | chinadotcom | |||||||||
| Director | Director of CIC | Company | (as of June 1999) | |||||||||
| Dr. Raymond Ch’ien | March 14, 2001 | continuing director | 4.0 | % | 1.2 | %(1) | ||||||
| Mr. Peter Yip | February 17, 2003 | continuing director | 2.4 | %(1) | 18.7 | %(1) | ||||||
| Mr. Zhou Shun Ao | continuing director | continuing director | (2 | ) | (2 | ) | ||||||
| Mr. Zhong Guo Liang | April 13, 2001 | May 24, 2002 | (2 | ) | (2 | ) | ||||||
| Mr. Douglas Chan | February 18, 2003 | July 17, 2003 | (3 | ) | (3 | ) | ||||||
| Mr. Harry Edelson | June 22, 2001 | June 17, 2003 | 11.3 | %(4) | 3.5 | %(4) | ||||||
| (1) | Includes holdings through Asia Pacific Online Limited, a trust established for the benefit of Mr. Yip’s children owned by the spouse of Mr. Yip. | |
| (2) | Less than 1%. | |
| (3) | Mr. Chan was appointed as a representative of New World Infrastructure Limited (“NWI”), a former strategic shareholder of chinadotcom. As of June 1999, NWI held 67.7% of CIC’s Class A Common Shares, in addition to holdings in CIC’s Series A Convertible Preference Shares. As of June 1999, NWI held 25.9% of chinadotcom’s Class A Common Shares. NWI has since disposed of its entire shareholdings in chinadotcom. | |
| (4) | Held through Edelson Technology Partners. |
For the year ended December 31, 2000, we derived total revenue of USD19,880 from CIC.
Since January 1, 2001, we did not recognize any revenue incurred from the provision of software and consulting services and advertising and marketing services in connection with the Amended and Restated Support Services Agreement due to the uncertainty of the collectibility of the receivable from CIC. We recorded $5,425 incurred in connection with the provision of these services under selling, general and administrative expenses in 2001. In September 2001, we agreed to CIC’s request to waive the legal rights with respect to up to $7,730 owed to us by CIC.
86
Table of Contents
In October 2001, we entered into an Asset Purchase Agreement with CIC to purchase the three URLs, www.china.com, www.hongkong.com and www.taiwan.com, and related intellectual property rights for US$16.8 million and the final payment for the purchase was made in February 2002. A portion of the proceeds was used to repay loans extended to CIC by certain of its shareholders and members of its board, some of whom are also our shareholders, officers and members of our board of directors. We sought third party advice related to accounting, legal and valuation issues when considering the transaction. We obtained releases with respect to registered charges over CIC’s assets, including the URLs from material creditors of CIC which included our affiliates. We obtained legal advice from our outside legal counsel on relevant issues that included the threat to our prior license of the URLs in the event of the liquidation of CIC, the unfair prejudice risk and applicable PRC and other regulations. See Item 3.D. of this Annual Report,Key Information — Risk Factors — Risks relating to chinadotcom — We are subject to risks related to our purchase of the URLs from CICand Item 4.B. of this Annual Report,Business Overview — Software and other investment initiatives.
SportasiaIn November 2001, as part of the liquidation of our equity investee Sportasia Media Limited, we acquired the URL, www.sportasia.com.
Asia Pacific Online LimitedFor the years ended December 31, 2000, 2001 and 2002, we reimbursed $120 per year, to Asia Pacific Online Limited, or APOL, for expenses incurred for the provision of general management services principally consisting of providing the full-time services of Mr. Peter Yip to act as our chief executive officer. APOL is a trust owned by the spouse of Mr. Peter Yip, who is our chief executive officer, for the benefit of Mr. Yip’s children. As of March 31, 2003, APOL had beneficial ownership of approximately 18.99% of our Class A Common Shares. There are no common directors between us and APOL.
In January 2002, we entered into a new services agreement with APOL. Under this agreement, we agreed to provide an annual management fee of $0.001 and reimburse expenses incurred up to $270 annually for the provision of general management services principally consisting of providing the full-time services of Mr. Peter Yip to act as our chief executive officer.
Mr. Yip acted as our chief executive officer in each of 2000, 2001 and 2002.
C. Interests of Experts and Counsel
Not applicable.
ITEM 8. FINANCIAL INFORMATION
We have appended our Consolidated Financial Statements as of and for the year ended December 31, 2002 to our Annual Report, (see pages F-1 to F-45).
ITEM 9. THE OFFER AND LISTING
A. Offer and Listing Details
Our shares have been quoted on the Nasdaq National Market under the symbol “CHINA” since our initial public offering on July 12, 1999. Prior to July 12, 1999, there was no public market for our shares. The following table sets forth, for the years indicated, the high and low closing prices per share as reported on the Nasdaq National Market. On June 10, 2003, the closing price for our Class A Common Shares on the Nasdaq National Market was US$5.148 per share.
87
Table of Contents
| Closing prices(1) | ||||||||
| High | Low | |||||||
| (in US$ per share) | ||||||||
| 2003: | ||||||||
| First quarter | 3.5800 | 2.7300 | ||||||
| Second quarter (through June 10) | 5.4200 | 3.2100 | ||||||
| 2002: | ||||||||
| First quarter | 3.2800 | 2.6300 | ||||||
| Second quarter | 2.7800 | 2.1600 | ||||||
| Third quarter | 2.5400 | 1.8600 | ||||||
| Fourth quarter | 3.0722 | 1.9100 | ||||||
| Annual | 3.2800 | 1.8600 | ||||||
| 2001: | ||||||||
| First quarter | 7.6250 | 2.3125 | ||||||
| Second quarter | 3.5500 | 2.0625 | ||||||
| Third quarter | 4.0000 | 1.8700 | ||||||
| Fourth quarter | 3.0000 | 1.9500 | ||||||
| Annual | 7.6250 | 1.8700 | ||||||
| 2000: | ||||||||
| Annual | 73.4375 | 4.4063 | ||||||
| Past six calendar months: | ||||||||
| 2003: | ||||||||
| June (through June 10) | 5.3200 | 4.9500 | ||||||
| May | 5.4200 | 4.3000 | ||||||
| April | 5.2400 | 3.2100 | ||||||
| March | 3.5040 | 2.7300 | ||||||
| February | 3.3600 | 3.1200 | ||||||
| January | 3.5800 | 2.7700 | ||||||
| 2002: | ||||||||
| December | 2.9000 | 2.2650 | ||||||
| November | 3.0722 | 2.1600 | ||||||
(1) All share prices are adjusted retroactively to reflect the two-for-one share splits effected as of each of December 13, 1999 and May 8, 2000, respectively. Source: Bloomberg.
B. Plan of Distribution
Not applicable.
C. Markets
Our Class A Common Shares have been traded on the Nasdaq National Market in the United States under the symbol “CHINA” since our initial public offering on July 12, 1999. Prior to July 12, 1999, there was no public market for our shares. There can be no assurance we can continue to satisfy the relevant criteria for maintaining our listing on the Nasdaq National Market.
D. Selling Shareholders
Not applicable.
E. Dilution
Not applicable.
88
Table of Contents
F. Expenses of the Issue
Not applicable.
ITEM 10. ADDITIONAL INFORMATION
A. Share Capital
Not Applicable.
B. Memorandum and Articles of Association
We incorporate by reference into this Annual Report the description of our Amended and Restated Articles of Association contained in our Current Report of Foreign Private Issuer on Form 6-K (File No. 000-30134) filed with the Commission on September 18, 2002.
C. Material Contracts
Expansion through Acquisitions and Partnerships
Since January 1999, we have pursued a program of growth and expansion through acquisitions and joint ventures in the Greater China and Asian markets. These transactions have allowed us to increase our headcount, expand our client base and supplement our revenues more quickly than would be possible if we relied on internal growth alone. While this strategy has enabled us to achieve scale quickly, it has also led to significant write-downs and impairments for the diminution in value in certain of our investments, as many of our investments were made at a time when pricing was at considerably inflated levels relative to pricing today. We intend to continue to build our brand and expand our market presence through additional strategic acquisitions and joint ventures using the proceeds of our public offerings and private placements. A brief summary of our material transactions during the past two years is set forth below:
In March 2000, we acquired a 60% interest in DAE Advertising, Inc. (which was subsequently renamed Ion Global (California) Inc.), or Ion Global (California), a full service agency specializing in Asian language advertising in both traditional and interactive media and in implementing global and multilingual web solutions, for US$3.049 million in cash, 92,772 Class A Common Shares valued at US$64.6811 per share and certain options which have since been terminated. In April 2001, we acquired an additional 21% of Ion Global (California) for US$2.307 million in cash. During 2002, we acquired the remaining shares of Ion Global (California) for US$1.5 million in cash.
In May 2000, we granted GE Capital Equity Investments Ltd., or GE, a warrant under which GE was entitled to receive a number of Class A Common Shares determined according to our revenue from services provided to affiliates of General Electric Capital Corporation during 2000 and 2001. The warrants expired unexercised on January 4, 2003.
In June 2000, we acquired a 55% interest in XT3 Pty Limited (which was subsequently renamed Ion Global (Australia) Pty Ltd), an Australian company that provides strategic, information technology and marketing consulting services to companies on their use of Internet technologies for approximately US$6.3 million in cash and US$7.334 million in promissory notes. Pursuant to the share purchase agreement, we agreed to purchase the remaining shares of Ion Global (Australia) over six tranches by 2003 for consideration based on its future audited results. In May 2001 we accelerated the purchase under the share purchase agreement of a further 42.6% interest in Ion Global (Australia) from eight of the minority shareholders for a total of US$7.0 million. This further acquisition brought our total ownership in Ion Global (Australia) to 97.6%. In September
89
Table of Contents
2001 and January 2002, we acquired the remaining 2.4% interest in Ion Global (Australia) for US$0.9 million in cash from the remaining two minority shareholders. Our total ownership in Ion Global (Australia) is now 100%.
In July 2000, we acquired a minority interest in BMC Media.com Limited, an Australian online marketing and advertising network listed on the Australian Stock Exchange for US$5.0 million. We had divested our entire interest in BMC by the end of February 2002.
In August 2000, we acquired a 57% interest in Coghuff Limited, which owns 100% of Revolution Ltd (which was subsequently renamed Ion Global (UK) Limited), an interactive brand development agency company organized under the laws of England and Wales, for US$2.668 million in cash, US$4.32 million in other payables, US$3.369 million in promissory notes and 627,424 Class A Common Shares valued at US$12.3125 per share. Under the share purchase agreement we agreed to purchase the remaining shares of Coghuff in three tranches by 2003 for a consideration based on its future revenues and net profits. Pursuant to the share purchase agreement, in February 2002, we acquired a further 14.3% from the minority shareholder, raising our total ownership in Coghuff Limited to 71.3%.
In October 2001, we entered into an Asset Purchase Agreement with CIC to purchase the three URLs, www.china.com, www.hongkong.com and www.taiwan.com, and related intellectual property rights for US$16.8 million from CIC, and the final payment for the purchase was made in February 2002. For further details, see Item 3.D. of this Annual Report,Key Information — Risk Factors — Risks relating to chinadotcom — We are subject to risks related to our purchase of the URLs from CIC,Item 4.B. of this Annual Report,Information On The Company - - Business Overview — Software and other investment initiativesand Item 7.B of this Annual Report,Major Shareholders and Related Party Transactions — Related Party Transactions.
In March 2002, we acquired Layabo Pty. Limited (now renamed Mezzo Business Databases Pty Limited), an Australian database marketing business and owner of the trademark IncNet. With the acquisition of Layabo Pty. Limited and the prior acquisition of RNR International Marketing Group (Australia) Pty Limited in 2000, we are consolidating our marketing business in Australia under the MEZZO brand. We believe that the acquisition of the IncNet trademark is an important step in re-orienting our advertising strategy from online sales of banner advertisements, direct mailing and sponsorships to higher margin database marketing related services utilizing data mining techniques to develop targeted campaigns for clients.
In March 2002, we acquired a 51% interest in OpusOne Technologies International Inc., the parent of Platinum China Holdings, Inc., a developer and service provider of business management software solutions for state enterprises and multi-national corporations in Greater China. In May 2003, we entered into an agreement to purchase the remaining interest in OpusOne Technologies International Inc. that we did not otherwise already own. We expect the transaction to close later in 2003. In accordance with this transaction, the aggregate purchase price payable cash and shares of chinadotcom is no longer subject to a fixed floor or ceiling amount. Instead, the total consideration will be based upon a set multiple of average net earnings under US GAAP for the three years from 2003 through 2005 inclusive, and paid in installments during that period. The total consideration will therefore be contingent upon the future performance of the business.
In October 2002, we entered into US$7 million transaction with Sagent Technology, Inc., a provider of enterprise business intelligence solutions, involving an asset-based senior secured loan with warrants for Sagent with a view to developing operational initiatives going forward. In March 2003, based upon the occurrence of what we viewed to be certain events of default under the loan, we exercised our rights as a secured lender to enforce our security interest in certain loan collateral and filed a claim for damages against Sagent. In April 2003, we reached a settlement with Sagent pursuant to which our loan was repaid in full, and we received an additional agreed upon sum in respect of terminated warrants and other rights we had in the company.
In February 2003, our subsidiary, CDC Australia Limited, completed the acquisition of Praxa Limited, a leading Australian information technology professional services organization with a 21-year operating history.
90
Table of Contents
The acquisition was completed for a purchase price of up to A$11 million (approximately US$6.4 million), subject to clawback provisions based on future performance.
In April 2003, we completed the acquisition of Newpalm (China) Information Technology Co., Ltd., a leading short message service mobile software platform developer and application service provider in China, through our mobile applications and portal arm and 81%-owned subsidiary, hongkong.com Corporation. Cash consideration of US$14 million was paid with the remaining consideration to be paid on an earn-out basis over the next two years.
In May 2003, our wholly-owned subsidiary, CDC Outsourcing Holdings Ltd., entered into a 51% owned joint venture agreement with vMoksha Technologies Limited, an information technology outsourcing company headquartered in Bangalore, India. The joint venture aims to provide a broad range of outsourcing related services to major software vendors and enterprises in the United States, Europe and the Asia-Pacific region. We expect the transaction to close later in 2003.
Financings
Each of us and our subsidiary, hongkong.com Corporation has entered into a Global Master Repurchase Agreement with Fortis Bank nv-sa, an AA- rated bank (as rated by Standard & Poor’s) to establish a repurchase facility which enables us to draw down via Fortis Bank, Hong Kong Branch as of May 31, 2003 up to US$250 million in funding for a one year term. The Fortis Bank facility has been renewed for 2002. In addition, another repurchase facility with similar terms was negotiated with DBS Bank, an A+ rated bank (as rated by Standard & Poor’s), allowing us to draw down up to US$150 million for a three-year term. Each drawdown under the DBS Bank facility is to be agreed upon between ourselves and DBS Bank prior to execution. Both facilities were established to provide us with a source of reasonably priced capital to give us flexibility to finance operational working capital requirements, acquisitions, as well as our treasury management program, without having to liquidate our investment portfolio at short notice. Under these repurchase facilities, any draw down requires us to sell certain debt securities to the bank at a certain price, and the bank agrees to sell back to us the same securities at the same purchase price at a later date. The repurchase dates are set in three or six month intervals for an entire term of one year or three years, depending on which facility is drawn. In effect, the bank retains title to our securities as collateral to enable us to draw down up to a total of US$400 million. See Item 5.B of this Annual Report,Operating and Financial Review and Prospects — Liquidity and Capital Resourcesand Item 11 of this Annual Report,Quantitative and Qualitative Disclosures About Market Risk.
D. Exchange Controls
General
There are no exchange control restrictions on payments of dividends on our Class A Common Shares or on the conduct of our operations in Hong Kong, where our principal executive offices are located, or the Cayman Islands, where chinadotcom is incorporated. In addition, both Hong Kong and the Cayman Islands are not party to any double tax treaties and no exchange control regulations or currency restrictions exist in these countries.
We are a Cayman Islands company and our affairs are governed by, among other things, the Companies Law of the Cayman Islands. The following is a summary of material differences between the Companies Law and general corporate law in the United States insofar as they relate to the material terms of our Class A Common Shares.
Differences in Corporate Law
The Companies Law of the Cayman Islands is modeled after that of England but does not follow recent United Kingdom statutory enactments and differs from laws applicable to United States corporations and their shareholders. Set forth below is a summary of the significant differences between the provisions of the
91
Table of Contents
Companies Law applicable to chinadotcom and the laws applicable to companies incorporated in the United States and their shareholders.
Mergers and Similar Arrangements.Cayman Islands law does not provide for mergers as that expression is understood under U.S. corporate law. However, there are statutory provisions that facilitate the reconstruction and amalgamation of companies, provided that the arrangement in question is approved by a majority in number of each class of shareholders and creditors with whom the arrangement is to be made, and who must in addition represent three-fourths in value of each such class of shareholders or creditors, as the case may be, that are present and voting either in person or by proxy at a meeting, or meetings convened for that purpose. The convening of the meetings and subsequently the arrangement must be sanctioned by the Grand Court of the Cayman Islands. While a dissenting shareholder would have the right to express to the court the view that the transaction ought not to be approved, the court can be expected to approve the arrangement if it satisfies itself that:
| • | the statutory provisions as to majority vote have been complied with; |
| • | the shareholders have been fairly represented at the meeting in question; |
| • | the arrangement is such as a businessman would reasonably approve; and |
| • | the arrangement is not one that would more properly be sanctioned under some other provision of the Companies Law. |
When a take over offer is made and accepted by holders of 90% of the shares within four months, the offeror may, within a two month period, require the holders of the remaining shares to transfer such shares on the terms of the offer. An objection can be made to the Grand Court of the Cayman Islands but this is unlikely to succeed unless there is evidence of fraud, bad faith or collusion.
If the arrangement and reconstruction is thus approved, the dissenting shareholder would have no rights comparable to appraisal rights, which would otherwise ordinarily be available to dissenting shareholders of United States corporations, providing rights to receive payment in cash for the judicially determined value of the shares.
Shareholders’ Suits.Based solely on our inspection of the Register of Writs and Other Originating process in the Grand Court of the Cayman Islands from the date of our incorporation, except for the petition filed by e-Planet Sdb. Bhd. for US$2.3 million with respect to consideration that it alleges we owe to it, there were no actions or petitions pending against us in the courts of the Cayman Islands as at close of business in the Cayman Islands on April 30, 2003.
The rule inFoss v. Harbottle(and the exceptions thereto which permit a minority shareholder to commence a class action against or derivative actions in the name of the company to challenge:
| • | an act which is ultra vires the company or illegal; |
| • | an act which constitutes a fraud against the minority where the wrongdoers are themselves in control of the company; and |
| • | an action which requires a resolution with a qualified (or special) majority which has not been obtained) has been applied and followed by the courts in the Cayman Islands. |
Indemnification
Cayman Islands law does not limit the extent to which a company’s articles of association may provide for indemnification of officers and directors, except to the extent any such provision may be held by the Cayman Islands courts to be contrary to public policy, such as to provide indemnification against civil fraud or the consequences of committing a crime. Our Articles of Association provide for indemnification of officers and
92
Table of Contents
directors for losses, damages, costs and expenses incurred in their capacities as such, except if they acted in a willfully negligent manner or defaulted in any action against them.
Insofar as indemnification for liabilities arising under the Securities Act may be permitted to directors, officers or persons controlling the registrant pursuant to the foregoing provisions, we have been informed that in the opinion of the Commission such indemnification is against public policy as expressed in the Securities Act and is therefore unenforceable.
Inspection of Books and Records
Holders of the our Class A Common Shares will have no general right under Cayman Islands law to inspect or obtain copies of our list of shareholders or our corporate records. However, we provide our shareholders with annual audited financial statements.
Proxy materials
Under Cayman Islands law, we are only obligated to send proxy materials to “members” which is equivalent to the registered shareholders of record. Our proxy materials are delivered to all of our registered shareholders. We offer electronic delivery of proxy materials to our registered shareholders, and we mail proxy materials to each registered owner who has not opted to receive proxy materials electronically. In an effort to maintain cost effectiveness, we have, and will continue to, mail the proxy materials to those beneficial shareholders who hold greater than a certain number of our shares.
Restrictions on Nonresident or Foreign Shareholders
Under Cayman Islands law there are no limitations on the rights of nonresident or foreign shareholders to hold or vote our Class A Common Shares.
E. Taxation
The following is a summary of the material Cayman Islands and United States Federal income tax consequences of an investment in the Class A Common Shares based upon laws and relevant interpretations thereof in effect as of the date of this Annual Report, all of which are subject to change. This summary does not deal with all possible tax consequences relating to an investment in the Class A Common Shares, such as the tax consequences under state, local and other tax laws.
Cayman Islands Taxation
The Cayman Islands currently levy no taxes on individuals or corporations based upon profits, income, gains or appreciation and there is no taxation in the nature of inheritance tax or estate duty. There are no other taxes likely to be material to us levied by the Government of the Cayman Islands except for stamp duties which may be applicable on instruments executed in, or after execution brought within the jurisdiction of, the Cayman Islands. The Cayman Islands are not party to any double taxation treaties. There are no exchange control regulations or currency restrictions in the Cayman Islands.
United States Federal Income Taxation
The following summary sets forth certain material U.S. Federal income tax consequences of the purchase, ownership and disposition of the Class A Common Shares as a capital asset. This summary is based upon the Internal Revenue Code of 1986, as amended, or the Code, its legislative history, existing and proposed U.S. Treasury regulations promulgated thereunder, published rulings by the U.S. Internal Revenue Service, or the IRS, and court decisions, all in effect as of the date of this Annual Report, all of which authorities are subject to change or differing interpretations, which changes or differing interpretations could apply retroactively. This
93
Table of Contents
summary does not purport to discuss all aspects of U.S. Federal income tax which may be relevant to particular investors, such as financial institutions, insurance companies, dealers or traders in securities or currencies, regulated investment companies, tax-exempt entities, U.S. holders, as defined below, liable for alternative minimum tax, persons holding Class A Common Shares as part of a position in a straddle or as part of a hedging transaction or conversion transaction for U.S. tax purposes, persons that enter into a constructive sale transaction with respect to Class A Common Shares, persons holding 10% or more of our voting shares or U.S. holders whose functional currency as defined in Section 985 of the Code is not the U.S. dollar. In addition, this summary does not discuss any foreign, state or local tax considerations. This summary only applies to original purchasers of Class A Common Shares who purchase Class A Common Shares as capital assets, or property held for investment within the meaning of Section 1221 of the Code.
The term U.S. holder means a beneficial owner of a note or Class A Common Shares who or which is:
| • | a citizen or resident of the United States; |
| • | a corporation or partnership created or organized in or under the laws of the United States or of any political subdivision of the United States; |
| • | an estate the income of which is subject to U.S. Federal income tax regardless of its source; |
| • | a trust if a court within the United States is able to exercise primary supervision over the administration of the trust and one or more U.S. persons have authority to control all substantial decisions of the trust, or the trust elects under U.S. Treasury Regulations to be treated as a U.S. person; or |
| • | any other person who is subject to U.S. Federal income taxation on a net income basis with respect to a Class A Common Share. |
Partners of a partnership holding Class A Common Shares should consult their tax advisor.
Tax Consequences of U.S. Holders
Dividends
Subject to the discussion inPassive Foreign Investment Company Status below, in the event that a U.S. holder receives a distribution, other than pro rata distributions of Class A Common Shares or rights with respect to Class A Common Shares, on the Class A Common Shares, that U.S. holder will be required to include the distribution in gross income as a taxable dividend to the extent such distribution is paid from our current or accumulated earnings and profits as determined for United States Federal income tax purposes. Distributions in excess of our current and accumulated earnings and profits will first be treated, for United States Federal income tax purposes, as a nontaxable return on capital to the extent of the U.S. holder’s basis in the Class A Common Shares and thereafter as gain from the sale or exchange of a capital asset. Dividends paid by us will not be eligible for the corporate dividends received deduction. The amount of any distribution of property other than cash will be the fair market value of such property on the date of distribution.
Dividends will constitute foreign source income for foreign tax credit limitation purposes. The limitation on foreign taxes eligible for credit is calculated separately with respect to specific classes of income. For this purpose, dividends distributed by us with respect to Class A Common Shares will be passive income or, in the case of U.S. holders, financial services income. Special rules apply to individuals whose foreign source income during the taxable year consists entirely of qualified passive income and whose creditable foreign taxes paid or accrued during the taxable year do not exceed US$300 or US$600 in the case of a joint return. Further, in particular circumstances, a U.S. holder that:
| • | has held Class A Common Shares for less than a specified minimum period during which it is not protected from risk of loss; |
| • | is obligated to make payments related to the dividends; or |
94
Table of Contents
| • | holds the Class A Common Shares in arrangements in which the U.S. holder’s expected economic profit, after non-U.S. taxes, is insubstantial |
will not be allowed a foreign tax credit for foreign taxes imposed on dividends paid on Class A Common Shares.
Distributions to a U.S. holder of Class A Common Shares or rights to subscribe for Class A Common Shares that are received as part of a pro rata distribution to all our shareholders should not be subject to United States Federal income tax. The basis of the new Class A Common Shares or rights so received will be determined by allocating the U.S. holder’s basis in the old Class A Common Shares between the old Class A Common Shares and the new Class A Common Shares or rights received, based on their relative fair market values on the date of distribution. However, the basis of the rights will be zero if (i) the fair market value of the rights is less than 15% of the fair market value of the old Class A Common Shares at the time of distribution or (ii) the rights are not exercised and expire.
Dispositions of Shares
Subject to the discussion inPassive Foreign Investment Company Status below, gain or loss realized by a U.S. holder on the sale or other disposition of the Class A Common Shares will be subject to United States Federal income tax as capital gain or loss in an amount equal to the difference between that U.S. holder’s basis in the Class A Common Shares and the amount realized on the disposition. Such capital gain or loss will be long-term capital gain or loss if the U.S. holder has held the Class A Common Shares for more than one year at the time of the sale or exchange. Generally, gain or loss realized by a U.S. holder will be treated as U.S. source gain or loss for U.S. foreign tax credit purposes.
Passive Foreign Investment Company Status
Based upon an analysis of our assets as at December 31, 2002 and income for the year 2002, during 2002, we are a passive foreign investment company, or PFIC, for United States federal income tax purposes. Although we intended to conduct our business activities in a manner to reduce the risk of our classification as a PFIC, we have substantial passive assets in the form of cash and cash equivalents and treasury instruments, and can provide no assurance that we will not continue to be classified as a PFIC for 2002 or any future tax year. The determination of whether we would continue to be a PFIC would be principally based upon:
| • | the composition of our assets, including goodwill, the amount of which will depend, in part, on our total net assets and the market value of our Class A Common Shares, which is subject to change; and |
| • | the amount and nature of our income from time to time. |
We have limited control over these variables. To the extent we do have control over these variables, we may take steps to reduce the material and adverse effect that our PFIC classification may have on our business, financial condition and results of operations.
In general, we will be a PFIC with respect to a U.S. holder if, for any taxable year in which the holder owns Class A Common Shares:
| • | at least 75% of our gross income for such taxable year is passive income; or |
| • | at least 50% of our assets, measured by value on a quarterly average basis, produce or are held for the production of passive income. |
For this purpose, passive income generally includes dividends, interest, rents, royalties, other than certain rents and royalties derived in the active conduct of a trade or business, annuities, gains from assets that produce passive income, net income from notional principal contracts and certain payments with respect to securities loans. If we own, directly or indirectly, at least 25% by value of the stock of another corporation, we
95
Table of Contents
will be treated as owning our proportionate share of the assets of the other corporation and as receiving directly our proportionate share of the other corporation’s income.
Subject to the discussion of the mark to market election and qualified electing fund, or QEF, election below, if we were a PFIC for any taxable year during which the investor held Class A Common Shares, the investor would be subject to special tax rules, regardless of whether we ceased to be a PFIC at a later date, with respect to:
| • | any excess distribution by us to the investor, which means any distributions, possibly including any return of capital distributions, received by the investor on the Class A Common Shares in a taxable year that are greater than 125% of the average annual distributions received by the investor in the three preceding taxable years, or the investor’s holding period for the Class A Common Shares, if shorter; and |
| • | any gain realized on the sale or other disposition, including a pledge, of Class A Common Shares. |
Under these special tax rules:
| • | the excess distribution or gain would be allocated ratably over the U.S. holder’s holding period for the Class A Common Shares; |
| • | the amount allocated to the current taxable year and any taxable year prior to the first taxable year in which we were a PFIC would be treated as ordinary income; |
| • | the amount allocated to each of the other years would be taxed as ordinary income at the highest tax rate in effect for that year; and |
| • | the interest charge applicable to underpayments of tax would be imposed with respect to the resulting tax attributable to each prior year in which we were a PFIC. |
If we are a PFIC in any year, you will be required to make an annual return on Internal Revenue Service, or IRS, Form 8621 regarding distributions received with respect to the Class A Common Shares and any gain realized on the disposition of the Class A Common Shares.
As an alternative to the special rules, a U.S. holder may elect to treat its Class A Common Shares that constitute marketable stock as if those Class A Common Shares were sold and immediately repurchased by the U.S. holder at the close of each taxable year, a mark to market election. If the election is made, the U.S. holder would be required to include as ordinary income the amount of any increase in the market value of the Class A Common Shares since the close of the preceding taxable year, or the beginning of the U.S. holder’s holding period, if such holding period began during the taxable year. Likewise, the U.S. holder would be allowed an ordinary deduction for the amount of any decrease in the market value of the Class A Common Shares since the close of the preceding taxable year, up to the amount of any prior increase in the Class A Common Shares’ market value that has not previously been taken into account in calculating allowable deductions. The U.S. holder’s basis in its Class A Common Shares would be increased by the amount of any ordinary income, and reduced by the amount of any deduction, arising under the mark to market election. In the case of a sale or other disposition of Class A Common Shares as to which a mark to market election is in effect, any gain realized on the sale or other disposition would be treated as ordinary income. Any loss realized on the sale or other disposition would be treated as an ordinary deduction, up to the amount of any prior increase in the Class A Common Shares’ market value that has not previously been taken into account in calculating allowable deductions, and as a capital loss to the extent of any excess. PFIC shares, other than shares held by certain regulated investment companies, are considered marketable only if the foreign exchange or market on which the shares are regularly traded is designated by the U.S. Treasury Department as a qualified foreign exchange or market. Under the Treasury Regulations, the Class A Common Shares would be considered to be regularly traded on a qualified foreign exchange or market if (i) the ordinary shares are traded at least 15 days during each calendar quarter of the relevant calendar year in more than de minimis quantities, and (ii) the foreign exchange
96
Table of Contents
or market on which the ordinary shares are regularly traded is subject to regulation or supervision by a governmental authority of the country in which such exchange or market is located and the exchange has financial disclosure, surveillance and other requirements designed to prevent fraudulent and manipulative practices and remove impediments to the mechanism of a free and open, fair and orderly market and the rules of the exchange effectively promote active trading of listed stocks. We expect that the Class A Common Shares to be marketable within the meaning of the Treasury Regulations.
As a second alternative, a U.S. holder can make a QEF election to include annually its pro rata share of a PFIC’s earnings and net capital gains currently in income each year, regardless of whether or not dividend distributions are actually distributed. This means a U.S. holder could have a tax liability for the earnings or gain without a corresponding receipt of cash. The U.S. holder’s basis in the common stock will be increased to reflect the amount of the taxed but undistributed income. Distributions of income that had previously been taxed will result in a corresponding reduction of basis in the common stock and will not be taxed again as a distribution to the U.S. holder. Each U.S. holder who desires QEF treatment must individually make a QEF election. To make a QEF election you will need to have an annual information statement from the PFIC setting forth the earnings and capital gains for the year. As a PFIC, we would supply the PFIC annual information statement to any shareholder or former shareholder who requests it. In general, a U.S. holder must make a QEF election on or before the due date for filing its income tax return for the first year to which the QEF election will apply. U.S. holders will be permitted to make retroactive elections in particular circumstances, including if the U.S. holder had a reasonable belief that the foreign corporation was not a PFIC and filed a protective election. Investors should consult their tax advisors as to the consequences of making a protective QEF election or other consequences of the QEF election.
We have made our 2002 PFIC annual information statement and other PFIC-related information available under a link entitled “PFIC” on our corporate website which you may access at http://www.corp.china.com/. Information contained on our website does not constitute a part of this Annual Report.
Although we generally will be treated as a PFIC as to any U.S. holder if we are a PFIC for any year during a U.S. holder’s holding period, if we cease to satisfy the requirements for PFIC classification, you may avoid such classification for years after such cessation if (1) you have made a QEF election in the first taxable year in which you own the Class A Common Shares, or (2) you elect to recognize gain based on the realized appreciation in the Class A Common Shares through the close of the tax year in which we cease to be a PFIC.
Transfer Reporting Requirements
Under recently promulgated regulations, a U.S. holder, including a tax exempt entity, that purchases Class A Common Shares for cash will be required to file an IRS Form 926 or similar form with the IRS, if (1) the U.S. holder owned, directly or by attribution, immediately after the transfer at least 10% by vote or value of us, or (2) the purchase, when aggregated with all purchases made by that U.S. holder, or any related person thereto, within the preceding 12 month period, exceeds US$100,000. If a U.S. holder fails to file any such required form, the U.S. holder could be required to pay a penalty equal to 10% of the gross amount paid for the Class A Common Shares, subject to a maximum penalty of US$100,000, except in cases involving intentional disregard. You should consult your tax advisors with respect to this or any other reporting requirement which may apply with respect to their acquisition of the Class A Common Shares.
97
Table of Contents
Backup Withholding and Information Reporting
The relevant paying agents for the shares must comply with information reporting requirements in connection with dividend payments or other taxable distributions made within the U.S. on the Class A Common Shares to a non-corporate U.S. person. In addition, “backup withholding” at the rate of 31% generally will apply to those payments unless the beneficial owner provides an accurate taxpayer identification number on a properly completed IRS Form W-9, certifies its non-U.S. status under penalties of perjury on a properly completely IRS Form W-8BEN, or otherwise certifies that the beneficial owner is not subject to backup withholding.
Payment of the proceeds from sale of the Class A Common Shares to or through a U.S. office of a broker is subject to both U.S. backup withholding and information reporting requirements, unless the beneficial owner provides an accurate taxpayer identification number or establishes an exemption from backup withholding, as described in the preceding paragraph. In general, neither U.S. backup withholding nor information reporting will apply to a payment of sale proceeds made outside the U.S. through an office outside the U.S. of a non-U.S. broker. Special rules may require information reporting in the case of payments of sale proceeds made outside the U.S. through a U.S. broker.
Amounts withheld under the backup withholding rules may be credited against a U.S. Holder’s U.S. federal income tax liability, and a holder may obtain a refund of any excess amounts withheld under the backup withholding rules by filing the appropriate claim for refund with the IRS.
F. Dividends and Paying Agents
Not applicable.
G. Statement by Experts
Not applicable.
H. Documents on Display
Any statement in this Annual Report about any of our contracts or other documents is not necessarily complete. If the contract or document is filed as an exhibit to the registration statement, the contract or document is deemed to modify the description contained in this Annual Report. You should review the exhibits for a complete description of the contract or document.
We are subject to the periodic reporting and other informational requirements of the Securities Exchange Act of 1934, as amended. Under the Exchange Act, we are required to file reports and other information with the Commission. Specifically, we are required to file annually a Form 20-F no later than six months after the close of our fiscal year, which is December 31. Copies of the registration statement, its accompanying exhibits, as well as reports and other information, when filed, may be inspected without charge and may be obtained at prescribed rates at the public reference facilities maintained by the Commission at Judiciary Plaza, 450 Fifth Street, N.W., Washington, D.C. 20549, and at the regional offices of the Securities and Exchange Commission located at Seven World Trade Center, New York, New York 10048 and Citicorp Center, 500 West Madison Street, Suite 1400, Chicago, Illinois 60661. The public may obtain information regarding the Washington, D.C. Public Reference Room by calling the Commission at 1-800-SEC-0330. You may access the Securities and Exchange Commission’s Web site at http://www.sec.gov. Our Class A Common Shares are listed for trading on NASDAQ under the symbol “CHINA.” As a foreign private issuer, we are exempt from the rules under the Exchange Act prescribing the furnishing of proxy statements, and officers, directors and principal shareholders are exempt from the reporting and short-swing profit recovery provisions contained in Section 16 of the Exchange Act.
98
Table of Contents
We furnish our shareholders with annual reports, which include a review of operations and annual audited consolidated financial statements prepared in conformity with United States generally accepted accounting principles in the United States, or GAAP.
I. Subsidiary Information
For a listing of our material subsidiaries, see Item 4.C. of this Annual Report,Information on the Company — Organizational Structure.
ITEM 11. QUANTITATIVE AND QUALITATIVE DISCLOSURES ABOUT MARKET RISK
You should read the following discussion of our Quantitative and Qualitative Disclosures About Market Risk together with our financial condition and results of operations as set forth in Item 5 of this Annual Report, Operating and Financial Review and Prospects and with our consolidated financial statements and the related notes included elsewhere in this Annual Report. This discussion contains forward-looking statements that involve risks and uncertainties. Our actual results may differ significantly from those anticipated in these forward-looking statements as a result of factors included elsewhere in this Annual Report.
During 2002 we continued our active treasury management program, which commenced during 2001 with our Repurchase Agreement with Fortis Bank, by entering into a Total Return Swap Transaction Agreement with DBS Bank. Under these repurchase agreements, we may borrow as of May 31, 2003 up to US$400 million on such terms as we and the banks may mutually agree. As of December 31, 2002, an aggregate of US$125 million was outstanding under our repurchase facilities with US$115 million outstanding under our Repurchase Agreement with Fortis Bank and US$10 million outstanding under our Swap Agreement with DBS Bank. Such borrowed proceeds have been used to invest in debt securities as part of our treasury management program. Approximately US$115.0 million under such facilities are due in 2003.
Our treasury management program and our repurchase facilities are subject to market risk. Further, we are affected by market risks in respect of our shareholdings in publicly listed companies and foreign exchange risk. See Item 4.B. of this Annual Report,Business Overview – Treasury managementand Item 5.B of this Annual Report,Operating and Financial Review and Prospects # Liquidity and Capital Resources.
Credit Default and Investment Risk
When we purchase debt securities as part of our treasury management program, we are subject to risks that can reduce the value of our investments. Historically, the fluctuation in value of our debt portfolio as a whole has not exceeded 5%, although there can be no assurance that the value of our portfolio, or even the mark to market or actual loss, will not exceed 5%, either as a whole or with respect to any individual debt security. The primary factors that can cause significant fluctuations or a decline in the fair market value of our investments include:
| • | the issuer’s actual or perceived credit quality following changes in its debt to equity ratio; |
| • | increased writedowns for goodwill or intangible assets; |
| • | declining revenues or earnings that fall short of expectations; and |
| • | inability to comply with financial instrument covenants. |
These and other indicators could reduce the value of our investments due to:
| • | reduced liquidity; |
| • | ratings downgrades, or a negative outlook by credit agencies; |
99
Table of Contents
| • | a decline in the price of an issuer’s equity or debt securities; or |
| • | an issuer being placed on CreditWatch. |
While all of our current investments in debt securities are investment grade, there can be no assurance that the issuers of those securities will not default on their obligations or their ratings will remain investment grade. A debt security may remain an investment grade instrument, but events such as those listed above could cause the value of that debt security to decline. In such an instance, we would suffer either an actual loss if we were to sell the debt security or a mark to market loss if the fair market value were to be less than our purchase price for six or more consecutive months. As of March 31, 2003, a value of approximately US$2.0 million has been recorded in “accumulated other comprehensive income” in the shareholder’s equity item in our consolidated balance sheet, reflecting an aggregate appreciation in fair market value of our debt portfolio compared to our date of investment. Approximately 11.6% of our debt portfolio is currently trading below investment cost.
We are exposed to the risk of default by the issuers of our debt securities. We can quantify the risk by dividing our debt securities portfolio into the four primary risk categories based on the Standard and Poor’s credit ratings of the debt issuers as of each of December 31, 2002 and April 30, 2003. Even if an issuer did not default, but the market perceives an increased likelihood of a default, we may suffer a principal loss if we sold a debt security of such issuer under unfavorable market circumstances. The table below shows the value of our debt securities as of each of December 31, 2002 and April 30, 2003 as categorized based on ratings assigned to our debt securities by each of Standard & Poor’s and Moody’s Investors Service. The discrepancy in value as between the two rating agencies is due to the fact that certain issuers are “split-rated” as between the respective ratings assessed by Standard & Poor’s and Moody’s Investors Service.
| Rating (Standard & Poor’s) | AAA | AA | A | BBB | Total | |||||||||||||||
| Amounts of debt securities outstanding as of December 31, 2002 | ||||||||||||||||||||
| (in US$ millions) | ||||||||||||||||||||
| Moody’s Investors Service | 407.1 | 35.0 | 0 | 29.1 | 471.2 | |||||||||||||||
| Standard & Poor’s | 407.1 | 35.0 | 9.0 | 20.1 | 471.2 | |||||||||||||||
| Amounts of debt securities outstanding as of April 30, 2003 | ||||||||||||||||||||
| (in US$ millions) | ||||||||||||||||||||
| Moody’s Investors Service | 366.8 | 0 | 0 | 20.0 | 386.8 | |||||||||||||||
| Standard & Poor’s | 366.8 | 0 | 0 | 20.0 | 386.8 | |||||||||||||||
With respect to our US$20.0 million investment in Centauri Fund (currently rated Baa2 by Moody’s Investors Service and BBB by Standard & Poor’s), a bond fund managed by a third party professional manager, we are also exposed to external management risk, and we rely on the professional skills of the fund manager to deliver our target interest income. There can be no assurance that we will achieve our interest income target. Also, our investment in the Centauri Fund is highly illiquid and could be difficult to realize prior to first available redemption in 2006.
Interest Rate Risk
We are exposed to risk related to fluctuations in interest rates, as determined principally by the U.S. Federal Reserve Board changing of short-term interest rates. This is reflected in related changes in U.S.
100
Table of Contents
Treasuries and Libor interest rates and relates to our investment in debt securities issued by the U.S. government, U.S. and foreign investment-grade corporations and by U.S. government sponsored enterprises (such as the Federal National Mortgage Association, or “Fannie Mae,” and the Federal Home Loan Mortgage Corporation, or “Freddie Mac”). As of December 31, 2002, we had invested US$471.2 million in fixed and floating rate debt securities which included US$151.1 million of restricted debt securities set aside as collateral pursuant to US$125.0 million in drawdowns under our repurchase facilities. We value our debt securities according to their fair market value. Debt securities with a fixed rate coupon having relatively long maturities are subject to interest rate expectations, and their values are generally likely to fall if interest rates are expected to increase. This also applies to the fixed-spread portion of our investments in floating rate debt securities, impacting the value of our floating rate securities. Debt securities that use interest rate indices such as Libor as a reference are exposed to any expectation of rising interest rates and may suffer significant mark to market losses in an adverse interest rate environment. If we were to sell such securities under adverse interest rate conditions, we could suffer significant loss of principal. Historically the fluctuation in value of our debt portfolio has not exceeded 5%, although there can be no guarantee that our portfolio will not undergo greater fluctuations in future.
Our future interest income may decline due to a decrease in interest rates or the replacement of existing securities with lower yielding securities, either to shorten the maturity of the portfolio, or to reduce credit risk exposure, or both. In addition, we may receive no coupon from debt investments if interest rates rise over certain predetermined benchmarks as set forth below under— Negative Interest Rate Differential.
If interest rates decrease, it is possible that issuers of debt securities with the right to “call” such instruments might exercise their right to ‘call’ (namely exercise the right to buy back their debt at predetermined dates prior to their maturity date at the original issue price, or ‘par’). If this were to happen our portfolio yield would potentially decrease and we might have to reinvest this portion of the portfolio in new investments at lower interest rates.
The table below groups our investment securities into different risk categories based on their exposure to interest rate fluctuations in terms of the market value of the securities. We have attempted to mitigate interest rate risk during 2002 by reducing securities with interest rate risk categorized as “Medium to High” from US$247.5 million as of December 31, 2001 to US$6.0 million as of December 31, 2002. The remaining US$6.0 million of securities in this category matures in June 2003. We have shifted the majority of our portfolio to debt securities with an interest rate risk categorized as “Low to Medium”.
| Amount Invested as | ||||||
| Interest | of December 31, | |||||
| Rate Risk | Type of Security | 2002 | ||||
| (in US$ millions) | ||||||
| Very Low | Floating notes /Floating rate funds | 20.0 | ||||
| Low | Fixed rate bonds of less than 18 months maturity | 9.1 | ||||
| Low to Medium | Fixed rate bonds with 18 months to 5 years maturity | 279.8 | ||||
| Medium | Floating rate bonds with Libor-linked coupon and | |||||
| fixed rate bonds of longer than 5 years maturity | 156.3 | |||||
| Medium to High | Fixed rate bonds with Libor-linked coupon | 6.0 | ||||
| 471.2 | ||||||
Negative Interest Rate Differential
101
Table of Contents
To enhance our interest income, we have borrowed from our collateralized repurchase facilities to invest in fixed rate AAA-rated debt securities issued by U.S. government sponsored enterprises. As of December 31, 2002, we have borrowed US$125 million from our repurchase facilities for this purpose. Because of the very low interest rate environment, we expect that the debt securities purchased with proceeds from the repurchase facilities will pay a coupon substantially higher than we would otherwise received. However, we may be exposed to the risk of a negative interest rate differential, or ‘negative carry’ situation, if interest rates rise.
Risks Related to the Repurchase Facilities
Use of the repurchase facilities with Fortis Bank and DBS Bank creates the following three primary risks for us:
| • | The risk associated with increased leverage, which includes our ability to pay back the borrowed funds in a timely manner without which may cause us to liquidate a portion of our treasury portfolio at a time where we may need to incur losses on the sale of sufficient debt instruments to repay the borrowing. |
| • | By setting aside debt securities as collateral under either repurchase facility, we incur the risk that if the banks themselves were to undergo an insolvency event, we could lose all or part of our debt securities set aside at such time with the bank. Currently, Fortis’ credit rating is AA- by Standard & Poor’s and Aa3 by Moody’s Investors Service and DBS Bank’s credit rating is A+ by Standard & Poor’s and Aa2 by Moody’s Investors Service. |
| • | The interest that we pay under our repurchase facilities is dependent upon Libor and therefore, our future interest expenses with respect to any amounts drawn down under the repurchase facilities may exceed our expectations due to changes in interest rates. For example, if Libor rises extremely rapidly over the next few years, interest expenses will rise commensurately. |
Equity Price Risk
As of December 31, 2002, we had US$2.1 million invested in shares of publicly listed companies. The table below presents the carrying amounts and fair values of our investment in shares of publicly listed companies, which are held for non-trading purposes. The amount of the carrying value is the same as the fair value because we have marked to market the carrying amount of our investments as at the end of the period.
| December 31, 2001 | December 31, 2002 | |||||||||||||||
| Carrying | Carrying | |||||||||||||||
| amount | Fair value | amount | Fair value | |||||||||||||
| Available-for-sale equity securities (US$ million) | 2.1 | 2.1 | 2.1 | 2.1 | ||||||||||||
Foreign Currency Risk
Approximately 83% of our revenues for the year ended December 31, 2002 was derived from our Asia subsidiaries, which conducted their businesses and also incurred expenses in their local currency. We do not use any derivatives to hedge against foreign currency fluctuations. As exchange rates in these Asian currencies vary, our revenues and operating results, when translated, may be adversely impacted and vary from expectations. The effect of foreign exchange rate fluctuations on our financial results for the year ended December 31, 2002 was not material. All of our debt securities are US-dollar denominated and therefore not subject to foreign currency risk. However, as long as we continue to rely on US-dollar denominated interest income for a significant portion of our cashflows and use this to support our operations, any material depreciation of the US dollar versus currencies of the countries where we have our operations might have a negative effect on our cashflows.
102
Table of Contents
ITEM 12. DESCRIPTION OF SECURITIES OTHER THAN EQUITY SECURITIES
Not applicable.
PART II
ITEM 13. DEFAULTS, DIVIDEND ARREARAGES AND DELINQUENCIES
Not applicable.
ITEM 14. MATERIAL MODIFICATIONS TO THE RIGHTS OF SECURITY HOLDERS AND USE OF PROCEEDS
None.
ITEM 15. CONTROLS AND PROCEDURES
An evaluation of the effectiveness of our disclosure controls and procedures was carried out under the supervision and with the participation of our management, including our Chief Executive Officer, or CEO, and our Chief Financial Officer, or CFO. Based on that evaluation, our CEO and CFO concluded that as of the end of the period covered by this report we maintained disclosure controls and procedures that are effective in providing reasonable assurance that information required to be disclosed in our reports under the Securities Exchange Act of 1934 is recorded, processed, summarized and reported within the time periods specified in the Commission’s rules and forms, and that such information is accumulated and communicated to our management, including our CEO and its CFO, as appropriate, to allow timely decisions regarding required disclosure. Our management necessarily applied its judgment in assessing the costs and benefits of such control and procedures, which, by their nature, can provide only reasonable assurance regarding management’s control objectives. There have been no changes in our internal control over financial reporting that occurred during the period covered by this report that have materially affected, or is reasonably likely to materially affect, our internal control over financial reporting.
In 2003, we hired a Director of Internal Audit who will have responsibilities overseeing several of our management and control processes, including internal control, internal audit and compliance with the laws under the Sarbanes-Oxley Act of 2002 and the rules and regulations of the Commission. In addition, we have instituted policies under which our managing directors, financial controllers and financial managers will need to provide our CEO and CFO monthly certifications with respect to their financial reporting and controls. We have also implemented a “whistle-blower protection” procedure with an independent third party under which staff can make reports on a confidential basis which are then passed directly on to the Director of Internal Audit and the Audit Committee.
ITEM 16. [RESERVED]
103
Table of Contents
PART III
ITEM 17. FINANCIAL STATEMENTS
Not applicable.
ITEM 18. FINANCIAL STATEMENTS
We have appended our Consolidated Financial Statements as of and for the year ended December 31, 2002 to our Annual Report, (see pages F-1 to F-45).
ITEM 19. EXHIBITS
| (a) | Financial Statements. |
| Page | ||||
| Report of the Independent Auditors | F-1 | |||
| Consolidated Balance Sheets as of December 31, 2001 and 2002 | F-2 | |||
| Consolidated Statements of Operations for each of the three years ended December 31, 2000, 2001 and 2002 | F-3 | |||
| Consolidated Statements of Cash Flows for each of the three years ended December 31, 2000, 2001 and 2002 | F-5 | |||
| Consolidated Statements of Changes in Shareholders’ Equity for each of the three years ended December 31, 2000, 2001 and 2002 | F-9 | |||
| Notes to Consolidated Financial Statements | F-10 | |||
| (b) | Exhibits. |
| No. | Description | |
| 1.1 | Conformed copy of the Amended and Restated Memorandum of Association.******* | |
| 1.2 | Conformed copy of the Amended and Restated Articles of Association.******* | |
| 2.1 | 1999 Employee Stock Option Plan, as amended.* | |
| 2.2 | 2000 Employee Share Purchase Plan.** | |
| 2.3 | 2001 Employee Share Purchase Plan.***** | |
| 4.(a).1 | Amended and Restated Support Services Agreement dated April 1, 2000 by and between China Internet Corporation Limited and chinadotcom corporation.**** | |
| 4.(a).2 | Agreement dated March 12, 2001 by and between China Internet Corporation Limited and chinadotcom corporation.**** | |
| 4.(a).3 | Agreement dated March 13, 2001 by and between China Internet Corporation Limited and chinadotcom corporation.**** |
104
Table of Contents
| No. | Description | |
| 4.(a).4 | Guarantee Agreement dated April 4, 2001 by chinadotcom corporation in favor of hongkong.com Limited.**** | |
| 4.(a).5 | Asset Purchase Agreement dated October 24, 2001 between China Internet Corporation Limited and chinadotcom Strategic, Inc.****** | |
| 4.(b).1 | 24/7 Media-Asia Agreement dated August 24, 2000 by and among 24/7 Media, Inc, 24/7 Media-Asia Ltd., Sift, Inc. and China Internet Corporation.*** | |
| 4.(b).2 | Equity Exchange Agreement dated August 24, 2000 by and among chinadotcom corporation, 24/7 Media-Asia Ltd. and 24/7 Media, Inc.*** | |
| 4.(c)1 | Executive Services Agreement dated April 27, 2001, by and between chinadotcom corporation and Raymond Ch’ien.**** | |
| 4.(c)2 | Executive Services Agreement effective as of January 1, 2002, by and between chinadotcom corporation and Asia Pacific Online Limited.****** | |
| 6. | Details of how EPS information is calculated can be found in Note 19 to our Consolidated Financial Statements. | |
| 8. | List of principal subsidiaries of the Company. | |
| 12.1 | Certification of Chief Executive Officer required by Rule 13a-14(a) | |
| 12.2 | Certification of Chief Financial Officer required by Rule 13a-14(a) | |
| 13.(a).1 | Certification of Chief Executive Officer pursuant to 18 U.S.C. Section 1350, as adopted pursuant to Section 906 of the Sarbanes-Oxley Act of 2002 | |
| 13.(a).2 | Certification of Chief Financial Officer pursuant to 18 U.S.C. Section 1350, as adopted pursuant to Section 906 of the Sarbanes-Oxley Act of 2002 |
| * | Incorporated by reference to our registration statement on Form S-8 (File No.: 333-12966) filed with the Commission on December 7, 2000. | |
| ** | Incorporated by reference to our registration statement on Form S-8 (File No.: 333-12958) filed with the Commission on December 7, 2000. | |
| *** | Incorporated by reference to our registration statement on Form F-3 (File No. 333-12674) filed with the Commission on October 3, 2000. | |
| **** | Incorporated by reference to our annual report on Form 20-F (File No. 000-30134) filed with the Commission on May 10, 2001. | |
| ***** | Incorporated by reference to our current report on Form 6-K (File No. 000-30134) filed with the Commission on February 28, 2002. | |
| ****** | Incorporated by reference to our annual report of Form 20-F (File No. 000-30134) filed with the Commission on June 11, 2002. | |
| ******* | Incorporated by reference to our current report on Form 6-K (File No. 000-30134) filed with the Commission on September 18, 2002. |
105
Table of Contents
SIGNATURES
The registrant hereby certifies that it meets all of the requirements for filing on Amendment No. 2 to the Form 20-F and that it has duly caused and authorized the undersigned to sign this Annual Report on its behalf on this 7th day of May, 2004.
| /s/ Raymond K.F. Ch’ien | ||
| Raymond K.F. Ch’ien | ||
| Executive Chairman | ||
| /s/ Peter Yip | ||
| Peter Yip | ||
| Vice Chairman and Chief Executive Officer | ||
| /s/ Daniel Widdicombe | ||
| Daniel Widdicombe | ||
| Chief Financial Officer |
106
Table of Contents
chinadotcom corporation
INDEX TO FINANCIAL STATEMENTS
| Pages | ||||
| Report of the Independent Auditors | F-1 | |||
| Consolidated Balance Sheets as of December 31, 2001 and 2002 | F-2 | |||
| Consolidated Statements of Operations for each of the three years ended December 31, 2000, 2001 and 2002 | F-3 - 4 | |||
| Consolidated Statements of Cash Flows for each of the three years ended December 31, 2000, 2001 and 2002 | F-5 - 6 | |||
| Consolidated Statements of Changes in Shareholders’ Equity for each of the three years ended December 31, 2000, 2001 and 2002 | F-7 - 9 | |||
| Notes to Consolidated Financial Statements | F-10 - 49 | |||
Table of Contents
REPORT OF THE INDEPENDENT AUDITORS
The Board of Directors and Shareholders
chinadotcom corporation
We have audited the accompanying consolidated balance sheets of chinadotcom corporation and subsidiaries as of December 31, 2001 and 2002 and the related consolidated statements of operations, cash flows and shareholders’ equity for each of the three years in the period ended December 31, 2002. These financial statements are the responsibility of the Company’s management. Our responsibility is to express an opinion on these financial statements based on our audits.
We conducted our audits in accordance with auditing standards generally accepted in the United States. Those standards require that we plan and perform the audit to obtain reasonable assurance about whether the financial statements are free of material misstatement. An audit includes examining, on a test basis, evidence supporting the amounts and disclosures in the financial statements. An audit also includes assessing the accounting principles used and significant estimates made by management, as well as evaluating the overall financial statement presentation. We believe that our audits provide a reasonable basis for our opinion.
In our opinion, the financial statements referred to above present fairly, in all material respects, the consolidated financial position of chinadotcom corporation and subsidiaries at December 31, 2001 and 2002, and the consolidated results of their operations and their cash flows for each of the three years in the period ended December 31, 2002, in conformity with accounting principles generally accepted in the United States.
As discussed in note 4(e) of the consolidated financial statements, in 2002 the Company changed its method of accounting for goodwill.
Hong Kong
February 13, 2003
F-1
Table of Contents
chinadotcom corporation
CONSOLIDATED BALANCE SHEETS
(Amounts in thousands of U.S. dollars, except number of shares and per share data)
| December 31, | December 31, | |||||||||||
| Notes | 2001 | 2002 | ||||||||||
| ASSETS | ||||||||||||
| Current assets: | ||||||||||||
| Cash and cash equivalents | 20,820 | 33,153 | ||||||||||
| Restricted cash | 5 | 1,274 | 109 | |||||||||
| Accounts receivable (net of allowance of USD6,538 for 2001 and 4,139 for 2002) | 6 | 21,074 | 15,030 | |||||||||
| Deposits, prepayments and other receivables | 16,746 | 8,363 | ||||||||||
| Available-for-sale debt securities | 7 | 329,952 | 300,056 | |||||||||
| Restricted debt securities | 7 | 134,960 | 139,255 | |||||||||
| Total current assets | 524,826 | 495,966 | ||||||||||
| Property, plant and equipment, net | 9 | 21,288 | 9,375 | |||||||||
| Goodwill | 10 | 6,430 | 12,016 | |||||||||
| Intangible assets | 11 | 17,092 | 16,980 | |||||||||
| Investment in equity investees | 2,668 | 330 | ||||||||||
| Investments under cost method | 2,878 | 387 | ||||||||||
| Available-for-sale debt securities | 7 | 17,028 | 20,000 | |||||||||
| Restricted debt securities | 7 | — | 11,868 | |||||||||
| Available-for-sale equity securities | 12 | 2,064 | 2,050 | |||||||||
| Other assets | 2,220 | 11,985 | ||||||||||
| Total assets | 596,494 | 580,957 | ||||||||||
| LIABILITIES AND SHAREHOLDERS’ EQUITY | ||||||||||||
| Current liabilities: | ||||||||||||
| Accounts payable | 15,082 | 13,662 | ||||||||||
| Other payables | 7,100 | 12,952 | ||||||||||
| Accrued liabilities | 14,099 | 9,064 | ||||||||||
| Short-term bank loans | 13 | 116,820 | 115,650 | |||||||||
| Long-term bank loans, current portion | 14 | 131 | 149 | |||||||||
| Deferred revenue | 932 | 2,693 | ||||||||||
| Tax payable | 1,002 | 636 | ||||||||||
| Amounts due to related companies | 8 | 10,248 | 684 | |||||||||
| Total current liabilities | 165,414 | 155,490 | ||||||||||
| Long-term bank loans, net of current portion | 14 | 1,504 | 11,585 | |||||||||
| Other payables, net of current portion | 2,860 | — | ||||||||||
| Minority interests | 36,855 | 36,182 | ||||||||||
| Shareholders’ equity: | ||||||||||||
| Class A common shares, USD0.00025 par value: | ||||||||||||
| Authorized shares — 800,000,000 shares Issued and outstanding — 102,691,872 shares as of December 31, 2001 and 101,296,363 shares as of December 31, 2002 | 26 | 25 | ||||||||||
| Preferred shares, USD0.001 par value: | ||||||||||||
| Authorized shares — 5,000,000 shares Issued and outstanding — Nil as of December 31, 2001 and 2002 | — | — | ||||||||||
| Additional paid-in capital | 613,460 | 610,340 | ||||||||||
| Treasury stock — 63,564 shares | — | (238 | ) | |||||||||
| Accumulated other comprehensive income | 15 | (7,439 | ) | 1,990 | ||||||||
| Accumulated deficits | (216,186 | ) | (234,417 | ) | ||||||||
| Total shareholders’ equity | 389,861 | 377,700 | ||||||||||
| Total liabilities and shareholders’ equity | 596,494 | 580,957 | ||||||||||
The accompanying notes form an integral part of these consolidated financial statements.
F-2
Table of Contents
chinadotcom corporation
CONSOLIDATED STATEMENTS OF OPERATIONS
(Amounts in thousands of U.S. dollars, except number of shares and per share data)
| Year ended | Year ended | Year ended | ||||||||||||||
| December 31, | December 31, | December 31, | ||||||||||||||
| Notes | 2000 | 2001 | 2002 | |||||||||||||
| Revenues (a) | ||||||||||||||||
| e-business solutions | 61,327 | 32,591 | 23,003 | |||||||||||||
| Advertising | 43,769 | 21,404 | 28,250 | |||||||||||||
| Sale of IT products | 3,276 | 4,580 | 4,631 | |||||||||||||
| Other income | 1,296 | 5,899 | 3,418 | |||||||||||||
| 109,668 | 64,474 | 59,302 | ||||||||||||||
| Less: Cost of revenues | ||||||||||||||||
| e-business solutions | (38,600 | ) | (21,922 | ) | (14,022 | ) | ||||||||||
| Advertising | (29,109 | ) | (13,508 | ) | (20,045 | ) | ||||||||||
| Sale of IT products | (56 | ) | (3,466 | ) | (3,306 | ) | ||||||||||
| Other income | (1,275 | ) | (2,010 | ) | (1,484 | ) | ||||||||||
| Gross margin | 40,628 | 23,568 | 20,445 | |||||||||||||
| Selling, general and administrative expenses (b) | 16 | (106,358 | ) | (89,192 | ) | (38,272 | ) | |||||||||
| Depreciation and amortization expenses | (37,775 | ) | (27,388 | ) | (11,860 | ) | ||||||||||
| Impairment of goodwill and intangible assets | (43,373 | ) | (40,698 | ) | — | |||||||||||
| Operating loss | (146,878 | ) | (133,610 | ) | (29,687 | ) | ||||||||||
| Interest income | 29,934 | 26,809 | 23,927 | |||||||||||||
| Interest expense | (949 | ) | (1,474 | ) | (2,629 | ) | ||||||||||
| Gain/(loss) arising from share issuance of a subsidiary | 140,031 | (55 | ) | — | ||||||||||||
| Gain/(loss) on disposal of available-for-sale securities | 1,682 | 4,411 | (158 | ) | ||||||||||||
| Gain/(loss) on disposal of subsidiaries and cost investments | 13,981 | (1,933 | ) | (117 | ) | |||||||||||
| Other non-operating gains | — | — | 1,173 | |||||||||||||
| Other non-operating losses | (1,992 | ) | (1,321 | ) | (288 | ) | ||||||||||
| Impairment of cost investments and available-for-sale securities | (84,696 | ) | (12,260 | ) | (5,351 | ) | ||||||||||
| Share of (losses)/income in equity investees | (9,423 | ) | (2,592 | ) | 682 | |||||||||||
| Loss before income taxes | (58,310 | ) | (122,025 | ) | (12,448 | ) | ||||||||||
| Income taxes | 18 | (682 | ) | (148 | ) | (160 | ) | |||||||||
| Loss before minority interests | (58,992 | ) | (122,173 | ) | (12,608 | ) | ||||||||||
| Minority interests in losses of consolidated subsidiaries | 553 | 4,010 | 1,036 | |||||||||||||
| Loss from continuing operations | (58,439 | ) | (118,163 | ) | (11,572 | ) | ||||||||||
| Discontinued operations | 20 | |||||||||||||||
| Loss from operations of discontinued subsidiaries, net of related tax benefit of USD42 and tax expense of USD213 for 2000 and 2001, respectively | (1,363 | ) | (6,222 | ) | (7,204 | ) | ||||||||||
| Gain on disposal of discontinued subsidiaries | — | — | 545 | |||||||||||||
| Net loss | 19 | (59,802 | ) | (124,385 | ) | (18,231 | ) | |||||||||
| Basic and diluted loss per share | 19 | (0.61 | ) | (1.21 | ) | (0.18 | ) | |||||||||
F-3
Table of Contents
chinadotcom corporation
CONSOLIDATED STATEMENTS OF OPERATIONS
(Amounts in thousands of U.S. dollars, except number of shares and per share data)
| Year ended | Year ended | Year ended | ||||||||||||||
| December 31, | December 31, | December 31, | ||||||||||||||
| Notes | 2000 | 2001 | 2002 | |||||||||||||
| (a) Revenues from related parties | 17 | |||||||||||||||
| e-business solutions | 13,921 | 60 | — | |||||||||||||
| Advertising | 7,870 | — | — | |||||||||||||
| Other income | — | — | — | |||||||||||||
| (b) Selling, general and administrative expenses to related parties | 17 | (1,200 | ) | (10,106 | ) | (413 | ) | |||||||||
The accompanying notes form an integral part of these consolidated financial statements.
F-4
Table of Contents
chinadotcom corporation
CONSOLIDATED STATEMENTS OF CASH FLOWS
(Amounts in thousands of U.S. dollars, except number of shares and per share data)
| Year ended | Year ended | Year ended | ||||||||||
| December 31, | December 31, | December 31, | ||||||||||
| 2000 | 2001 | 2002 | ||||||||||
| Cash flows from operating activities: | ||||||||||||
| Net loss | (59,802 | ) | (124,385 | ) | (18,231 | ) | ||||||
| Adjustments to reconcile income to net cash provided by operating activities: | ||||||||||||
| Minority interests in income/(loss) of consolidated subsidiaries | (553 | ) | (4,010 | ) | (1,036 | ) | ||||||
| Loss on disposal/write-off of property, plant and equipment | 117 | 3,066 | 1,732 | |||||||||
| Gain on disposal of available-for-sale securities | (1,682 | ) | (4,411 | ) | 158 | |||||||
| (Gain)/loss arising from share issuance of a subsidiary | (140,031 | ) | 55 | — | ||||||||
| (Gain)/loss on disposal of subsidiaries and cost investments | (13,981 | ) | 2,055 | (428 | ) | |||||||
| Amortization of goodwill and intangible assets | 29,690 | 15,323 | 1,183 | |||||||||
| Depreciation | 8,452 | 12,739 | 11,340 | |||||||||
| Stock compensation expense | 5,083 | 1,169 | 309 | |||||||||
| Share of loss in equity investees | 9,423 | 2,592 | (682 | ) | ||||||||
| Impairment of cost investments and available-for-sale securities | 84,696 | 12,260 | 5,351 | |||||||||
| Impairment of goodwill and intangible assets | 43,389 | 40,698 | — | |||||||||
| Gain in value of derivative instruments | — | — | (571 | ) | ||||||||
| Changes in operating assets and liabilities: | ||||||||||||
| Accounts receivable | (19,841 | ) | 10,427 | 7,191 | ||||||||
| Deposits, prepayments and other receivables | (12,931 | ) | (8 | ) | 10,909 | |||||||
| Due from related companies | (17,381 | ) | 21,450 | — | ||||||||
| Other assets | (1,565 | ) | 1,623 | (252 | ) | |||||||
| Accounts payable | 4,008 | (1,468 | ) | (1,107 | ) | |||||||
| Other payables | 2,724 | (5,754 | ) | 4,824 | ||||||||
| Accrued liabilities | 10,438 | 145 | (3,968 | ) | ||||||||
| Deferred revenue | 1,531 | (2,307 | ) | (66 | ) | |||||||
| Due to related companies | 618 | 1,099 | (730 | ) | ||||||||
| Net cash (used in)/provided by operating activities | (67,598 | ) | (17,642 | ) | 15,926 | |||||||
| Cash flows from investing activities: | ||||||||||||
| Acquisition of subsidiaries, net of cash acquired | (17,259 | ) | (15,580 | ) | (4,587 | ) | ||||||
| Acquisition of equity investees | (6,848 | ) | — | — | ||||||||
| Acquisition of property, plant and equipment | (29,228 | ) | (8,250 | ) | (5,471 | ) | ||||||
| Acquisition of cost investments | (21,150 | ) | (398 | ) | — | |||||||
| Acquisition of available-for-sale securities | (2,875,048 | ) | (1,932,249 | ) | (660,599 | ) | ||||||
| Acquisition of intangible assets | — | (12,392 | ) | (8,800 | ) | |||||||
| Advances of loans to equity investees | (4,389 | ) | (179 | ) | — | |||||||
| Purchase of promissory note and warrants | — | — | (7,000 | ) | ||||||||
| Proceeds from disposal of available-for-sale securities | 2,582,685 | 1,843,943 | 675,728 | |||||||||
| Proceeds from disposal of property, plant and equipment | 183 | 138 | 1,386 | |||||||||
| Proceeds/(cash disbursements) from share issuance by/disposal of subsidiaries | 169,835 | 982 | (652 | ) | ||||||||
| Proceeds from disposal of cost investments | 970 | 598 | — | |||||||||
| Restricted cash | (4,134 | ) | 2,860 | 1,165 | ||||||||
| Net cash used in investing activities | (204,383 | ) | (120,527 | ) | (8,830 | ) | ||||||
| Cash flows from financing activities: | ||||||||||||
| Issuance of share capital | 312,438 | 279 | 724 | |||||||||
| Additional minority interests | 217 | — | — | |||||||||
| Additional bank loans | 2,495 | 117,307 | 125,278 | |||||||||
| Repayment of bank loans | — | (2,737 | ) | (116,349 | ) | |||||||
| Purchase of treasury stocks | — | — | (4,416 | ) | ||||||||
| Settlement of promissory notes in relation to acquisitions | (8,599 | ) | (3,343 | ) | — | |||||||
| Net cash provided by in financing activities | 306,551 | 111,506 | 5,237 | |||||||||
| Net increase/(decrease) in cash and cash equivalents | 34,570 | (26,663 | ) | 12,333 | ||||||||
| Cash and cash equivalents at beginning of year | 12,913 | 47,483 | 20,820 | |||||||||
| Cash and cash equivalents at end of year | 47,483 | 20,820 | 33,153 | |||||||||
F-5
Table of Contents
chinadotcom corporation
CONSOLIDATED STATEMENTS OF CASH FLOWS
(Amounts in thousands of U.S. dollars, except number of shares and per share data)
| Year ended | Year ended | Year ended | ||||||||||
| December 31, | December 31, | December 31, | ||||||||||
| 2000 | 2001 | 2002 | ||||||||||
| Interest paid | 954 | 1,495 | 2,632 | |||||||||
| Non-cash activities: | ||||||||||||
| Class A common shares issued for purchases of available-for-sale securities and cost investments | 45,359 | — | — | |||||||||
| Class A common shares issued for acquisitions | 39,095 | — | — | |||||||||
| Class A common shares issued for settlement of other payables | 294 | 4,467 | — | |||||||||
| Class A common shares issued for settlement of promissory notes | 7,492 | 3,033 | — | |||||||||
| Stock options issued/allocated for acquisitions | 1,212 | — | — | |||||||||
| Promissory notes issued and other payables incurred in respect of acquisitions | 38,643 | — | — | |||||||||
| Subsidiary’s ordinary shares issued for acquisitions | — | 1,410 | — | |||||||||
| Subsidiary’s ordinary shares issued for purchase of assets | — | 221 | — | |||||||||
| Repurchase of Class A common shares from disposal of an equity investee | — | 53 | — | |||||||||
| Reissuance of treasury stocks for settlement of employee stock ownership plan obligations | — | — | 24 | |||||||||
The accompanying notes form an integral part of these consolidated financial statements.
F-6
Table of Contents
chinadotcom corporation
CONSOLIDATED STATEMENTS OF CHANGES IN SHAREHOLDERS’ EQUITY
(Amounts in thousands)
| Accumulated | Total | |||||||||||||||||||||||||||||||
| Additional | other | Retained | shareholders’ | |||||||||||||||||||||||||||||
| Number | Common | paid-in | Treasury | Comprehensive | comprehensive | earnings | equity | |||||||||||||||||||||||||
| of | shares | capital | stock | income | income | (deficit) | (deficit) | |||||||||||||||||||||||||
| shares | USD | USD | USD | USD | USD | USD | USD | |||||||||||||||||||||||||
| Balance at January 1, 2000 | 87,374 | 22 | 193,596 | — | — | 2,203 | (31,999 | ) | 163,822 | |||||||||||||||||||||||
| Issuance of shares for cash | 7,626 | 2 | 303,182 | — | — | — | — | 303,184 | ||||||||||||||||||||||||
| Exercise of warrants | 800 | — | 4,000 | — | — | — | — | 4,000 | ||||||||||||||||||||||||
| Exercise of employee stock options | 1,526 | — | 5,254 | — | — | — | — | 5,254 | ||||||||||||||||||||||||
| Issuance of shares for non-cash transactions | 4,502 | 1 | 94,213 | — | — | — | — | 94,214 | ||||||||||||||||||||||||
| Stock options issued/allocated for acquisitions | — | — | 1,212 | — | — | — | — | 1,212 | ||||||||||||||||||||||||
| Stock compensation expenses on options granted | — | — | 3,109 | — | — | — | — | 3,109 | ||||||||||||||||||||||||
| Unrealized loss, net of unrealized gains on available-for-sale securities | — | — | — | — | (44,858 | ) | (44,858 | ) | — | (44,858 | ) | |||||||||||||||||||||
| Other-than-temporary impairment of available-for-sale securities | — | — | — | — | 44,929 | 44,929 | — | 44,929 | ||||||||||||||||||||||||
| Foreign currency translation adjustments | — | — | — | — | (804 | ) | (804 | ) | — | (804 | ) | |||||||||||||||||||||
| Less: reclassification adjustment for gains, net of losses included in net income | — | — | — | — | (2,236 | ) | (2,236 | ) | — | (2,236 | ) | |||||||||||||||||||||
| Net loss for the year ended December 31, 2000 | — | — | — | (59,802 | ) | — | (59,802 | ) | (59,802 | ) | ||||||||||||||||||||||
| Comprehensive income | (62,771 | ) | ||||||||||||||||||||||||||||||
| Balance at December 31, 2000 | 101,828 | 25 | 604,566 | — | (766 | ) | (91,801 | ) | 512,024 | |||||||||||||||||||||||
The accompanying notes form an integral part of these consolidated financial statements.
F-7
Table of Contents
chinadotcom corporation
CONSOLIDATED STATEMENTS OF CHANGES IN SHAREHOLDERS’ EQUITY
(Amounts in thousands)
| Accumulated | Total | |||||||||||||||||||||||||||||||
| Additional | other | Retained | shareholders’ | |||||||||||||||||||||||||||||
| Number | Common | paid-in | Treasury | Comprehensive | comprehensive | earnings | equity | |||||||||||||||||||||||||
| of | shares | capital | stock | income | income | (deficit) | (deficit) | |||||||||||||||||||||||||
| shares | USD | USD | USD | USD | USD | USD | USD | |||||||||||||||||||||||||
| Balance at January 1, 2001 | 101,828 | 25 | 604,566 | — | — | (766 | ) | (91,801 | ) | 512,024 | ||||||||||||||||||||||
| Exercise of employee stock options | 92 | — | 279 | — | — | — | — | 279 | ||||||||||||||||||||||||
| Issuance of shares for non-cash transactions | 795 | 1 | 7,499 | — | — | — | — | 7,500 | ||||||||||||||||||||||||
| Redemption and retirement of shares for non-cash transactions | (23 | ) | — | (53 | ) | — | — | — | — | (53 | ) | |||||||||||||||||||||
| Stock compensation expenses on options granted | — | — | 1,169 | — | — | — | — | 1,169 | ||||||||||||||||||||||||
| Unrealized loss, net of unrealized gains on available-for-sale securities | — | — | — | — | (9,956 | ) | (9,956 | ) | — | (9,956 | ) | |||||||||||||||||||||
| Other-than-temporary impairment of available-for-sale securities | — | — | — | — | 4,216 | 4,216 | — | 4,216 | ||||||||||||||||||||||||
| Minority interests’ share of unrealized loss, net of unrealized gains on available-for-sale securities | — | — | — | — | 337 | 337 | — | 337 | ||||||||||||||||||||||||
| Foreign currency translation adjustments | — | — | — | — | (1,199 | ) | (1,199 | ) | — | (1,199 | ) | |||||||||||||||||||||
| Less: reclassification adjustment for gains, net of losses included in net income | — | — | — | — | (71 | ) | (71 | ) | — | (71 | ) | |||||||||||||||||||||
| Net loss for the year | — | — | — | — | (124,385 | ) | — | (124,385 | ) | (124,385 | ) | |||||||||||||||||||||
| (131,058 | ) | |||||||||||||||||||||||||||||||
| Balance at December 31, 2001 | 102,692 | 26 | 613,460 | — | (7,439 | ) | (216,186 | ) | 389,861 | |||||||||||||||||||||||
The accompanying notes form an integral part of these consolidated financial statements.
F-8
Table of Contents
chinadotcom corporation
CONSOLIDATED STATEMENTS OF CHANGES IN SHAREHOLDERS’ EQUITY
(Amounts in thousands)
| Accumulated | Total | |||||||||||||||||||||||||||||||
| Additional | other | Retained | shareholders’ | |||||||||||||||||||||||||||||
| Number | Common | paid-in | Treasury | Comprehensive | comprehensive | earnings | equity | |||||||||||||||||||||||||
| of | shares | capital | stock | income | income | (deficit) | (deficit) | |||||||||||||||||||||||||
| shares | USD | USD | USD | USD | USD | USD | USD | |||||||||||||||||||||||||
| Balance at January 1, 2002 | 102,692 | 26 | 613,460 | — | — | (7,439 | ) | (216,186 | ) | 389,861 | ||||||||||||||||||||||
| Exercise of employee stock options | 296 | — | 724 | — | — | — | — | 724 | ||||||||||||||||||||||||
| Redemption of shares | — | — | — | (4,416 | ) | — | — | — | (4,416 | ) | ||||||||||||||||||||||
| Retirement of shares | (1,692 | ) | (1 | ) | (4,153 | ) | 4,154 | — | — | — | — | |||||||||||||||||||||
| Reissuance of treasury stock for non-cash transactions | — | — | — | 24 | — | — | — | 24 | ||||||||||||||||||||||||
| Stock compensation expenses on options granted | — | — | 309 | — | — | — | — | 309 | ||||||||||||||||||||||||
| Unrealized loss, net of unrealized gains on available-for-sale securities | — | — | — | — | (1,276 | ) | (1,276 | ) | — | (1,276 | ) | |||||||||||||||||||||
| Other-than-temporary impairment of available-for-sale securities | — | — | — | — | 5,125 | 5,125 | — | 5,125 | ||||||||||||||||||||||||
| Minority interests’ share of unrealized gain, net of unrealized loss on available-for-sale securities | — | — | — | — | (484 | ) | (484 | ) | — | (484 | ) | |||||||||||||||||||||
| Foreign currency translation adjustments | — | — | — | — | 661 | 661 | — | 661 | ||||||||||||||||||||||||
| Less: reclassification adjustment for gains, net of losses included in net income | — | — | — | — | 5,403 | 5,403 | — | 5,403 | ||||||||||||||||||||||||
| Net loss for the year | — | — | — | — | (18,231 | ) | — | (18,231 | ) | (18,231 | ) | |||||||||||||||||||||
| (8,802 | ) | |||||||||||||||||||||||||||||||
| Balance at December 31, 2002 | 101,296 | 25 | 610,340 | (238 | ) | 1,990 | (234,417 | ) | 377,700 | |||||||||||||||||||||||
F-9
Table of Contents
chinadotcom corporation
NOTES TO CONSOLIDATED FINANCIAL STATEMENTS
(Amounts in thousands, except number of shares, number of options and per share data)
| 1. | ORGANIZATION AND BASIS OF PRESENTATION |
chinadotcom corporation is an integrated enterprise solutions company offering technology, marketing and media services for companies throughout Greater China and the Asia-Pacific region, the US and the UK. With operations in 10 markets, the companies under the chinadotcom group have extensive experience in several industry groups including finance, travel and manufacturing, and in key business areas, including e-business strategy, packaged software implementation, precision marketing, and supply chain management. chinadotcom leverages this expertise with alliances and partnerships to help drive innovative client solutions.
The Company was incorporated as China.com Corporation under the laws of the Cayman Islands in June 1997 as a wholly-owned subsidiary of China Internet Corporation Limited (“CIC”), a company incorporated under the laws of Bermuda. In June 1999, CIC distributed its total interest in the Company to CIC’s shareholders (the “Reorganization”). The transaction involved the distribution of a total of 46,975,972 of the Company’s Class A common shares to CIC’s shareholders on a one-for-one basis with respect to each issued and outstanding share of CIC’s capital stock at the time of the distribution. Upon completion of the Reorganization, CIC ceased to have any ownership interest in the Company. As part of such corporate reorganization, CIC transferred certain subsidiaries, portals and related assets, comprising the integrated portal business, which began in early 1996, to the Company. The transfer has been accounted for as a reorganization of entities under common control in a manner similar to a pooling of interests.
As of each of December 13, 1999 and May 8, 2000, the Company effected a two-for-one share split (“Share Split”). Upon the occurrence of each of these share splits, each issued and outstanding Class A common share of the Company was split into two Class A common shares of half the previous par value per share. The consolidated financial statements have been prepared as if the Share Split had occurred retroactively.
In March 2000, hongkong.com Corporation (“hongkong.com”), a wholly-owned e-business solutions and advertising services provider, was listed on the Growth Enterprise Market of the Stock Exchange of Hong Kong Limited and 736,000,000 shares of hongkong.com were issued at USD0.24 per share for a net proceed of USD168,462. As a result, the Company’s shareholding in hongkong.com was diluted to 82%. No deferred tax has been provided for the gain as the future disposal of shares in hongkong.com by the Company will not be taxable in any jurisdiction.
Pursuant to a shareholders’ special resolution passed on April 28, 2000, the name of the Company was changed from China.com Corporation to chinadotcom corporation.
In 2001, hongkong.com issued 5,351,473 shares at USD0.0409 per share amounting to USD219 for the acquisition of property, plant and equipment of Powernet Technology Inc. and 30,207,269 shares at USD0.04635 per share amounting to USD1,400 for the acquisition of Beijing China-Railway Times Science and Technology Company Ltd.. As a result, the Company’s shareholding in hongkong.com was diluted from 82% to 81%. No deferred tax credit was recognized for the loss as the future disposal of shares in hongkong.com by the Company will not be taxable in any jurisdiction.
The consolidated financial statements were prepared in accordance with accounting principles generally accepted in the United States.
F-10
Table of Contents
chinadotcom corporation
NOTES TO CONSOLIDATED FINANCIAL STATEMENTS
(Amounts in thousands, except number of shares, number of options and per share data)
| 2. | BUSINESS COMBINATIONS |
On February 28, 2002, the Company acquired a 51% equity interest in OpusOne Technologies International Inc. (“OpusOne”) through the purchase of outstanding and newly issued common shares of OpusOne. The results of OpusOne’s operations have been included in the consolidated financial statements since the date of acquisition. OpusOne is a developer of business software solutions in the People’s Republic of China (the “PRC”). As a result of the acquisition, the Company is expected to complement and serve to further expand the Company’s portfolio of proprietary software solutions in the PRC market, and is expected to reduce costs and improve operational profitability through economies of scale.
The aggregate initial purchase price was USD8,950 cash for 368,100 issued and outstanding and 300,000 newly issued common shares of OpusOne. The Company paid USD4,488 cash on the date of acquisition. The remaining purchase price will be paid in three yearly installment payments after December 31, 2002 and will be adjusted based on the audited financial statements of OpusOne for each of the fiscal years ending December 31, 2002, 2003 and 2004. The following table summarizes the estimated fair values of the assets acquired and liabilities assumed at the date of acquisition.
At February 28, 2002
| USD | ||||
| Current assets | 1,850 | |||
| Property, plant and equipment, net | 297 | |||
| Intangible assets subject to amortization (3 year useful life): | ||||
| Software applications and programs | 720 | |||
| Other assets | 821 | |||
| Goodwill | 4,764 | |||
| Total assets acquired | 8,452 | |||
| Current liabilities | (3,532 | ) | ||
| Long-term debt | (432 | ) | ||
| Total liabilities assumed | (3,964 | ) | ||
| Net assets acquired | 4,488 | |||
The USD4,764 of goodwill was assigned to the sale of IT product segment. The following unaudited pro forma consolidated financial information reflects the results of the operation of the Company for the years ended December 31, 2001 and 2002, as if the acquisition of the subsidiary had occurred on January 1, 2001. These pro forma results have been prepared for comparative purposes only and do not purport to be indicative of what operating results would have been had the acquisition actually taken place on January 1, 2001, and may not be indicative of future operating results.
F-11
Table of Contents
chinadotcom corporation
NOTES TO CONSOLIDATED FINANCIAL STATEMENTS
(Amounts in thousands, except number of shares, number of options and per share data)
| 2. | BUSINESS COMBINATIONS (continued) |
| December 31, | December 31, | |||||||
| 2001 | 2002 | |||||||
| USD | USD | |||||||
| (unaudited) | (unaudited) | |||||||
| Revenue | 69,003 | 60,398 | ||||||
| Net loss | (129,217 | ) | (18,045 | ) | ||||
| Loss per share | (1.26 | ) | (0.18 | ) | ||||
The difference in pro forma and audited net loss for the year ended December 31, 2001 is primarily due to the inclusion of the results of operations from the beginning to the end of the year, net of the impairment of goodwill and the effect of additional amortization of goodwill and purchased intangible assets in the years ended December 31, 2001. The difference in pro forma and audited net loss for the year ended December 31, 2002 is primarily due to the inclusion of the results of operations from the beginning of the year to the date of acquisition, net of the additional amortization of purchased intangible assets in the year ended December 31, 2002.
| 3. | CHANGES IN PRESENTATION OF COMPARATIVE FINANCIAL STATEMENTS |
Due to the discontinued operation of certain components of the Company, certain comparative amounts have been reclassified to conform with the current year’s presentation.
| 4. | SUMMARY OF SIGNIFICANT ACCOUNTING POLICIES |
| (a) | Principles of consolidation |
The accompanying consolidated financial statements include the accounts of the Company and its majority-owned subsidiaries, after elimination of all material inter-company accounts, transactions and profits.
| (b) | Use of estimates |
The preparation of the financial statements in conformity with accounting principles generally accepted in the United States requires management to make estimates and assumptions that affect the amounts reported in the financial statements and accompanying notes. Actual results could differ from those estimates.
| (c) | Cash and cash equivalents |
The Company considers all highly liquid investments with a maturity of three months or less when purchased to be cash equivalents. Except for the restricted cash disclosed in note 5, none of the Company’s cash is restricted as to withdrawal or use.
F-12
Table of Contents
chinadotcom corporation
NOTES TO CONSOLIDATED FINANCIAL STATEMENTS
(Amounts in thousands, except number of shares, number of options and per share data)
| 4. | SUMMARY OF SIGNIFICANT ACCOUNTING POLICIES (continued) |
| (d) | Property, plant and equipment and depreciation |
Leasehold improvements, furniture and fixtures, office equipment, computer equipment and motor vehicles are stated at cost less accumulated depreciation. Maintenance, repairs and minor renewals are expensed as incurred. Depreciation of leasehold improvements, furniture and fixtures, office equipment, computer equipment and motor vehicles is computed using the straight-line method over the assets’ estimated useful life. No depreciation is provided on freehold land. The principal annual rates used are as follows:
| Buildings | 4% | |
| Leasehold improvements | Over the lesser of the lease term or the useful life | |
| Furniture and fixtures | 20% | |
| Office equipment | 20% | |
| Computer equipment | 33 1/3% | |
| Motor vehicles | 33 1/3% |
| (e) | Goodwill and intangible assets |
Goodwill represents the excess of cost over the fair value of net tangible and identifiable intangible assets of acquired businesses. Effective January 1, 2002, the Company adopted SFAS 142, Goodwill and Other Intangible Assets. In accordance with SFAS 142, the Company ceased amortizing goodwill and performed a transitional test of its goodwill as of January 1, 2002. SFAS 142 requires that goodwill be tested for impairment at the reporting unit level (operating segment or one level below an operating segment) on an annual basis and between annual tests in certain circumstances. The performance of the test involves a two-step process. The first step of the impairment test involves comparing the fair value of the Company’s reporting units with the reporting unit’s carrying amount, including goodwill. Fair value is primarily determined by computing the future discounted cash flows expected to be generated by the reporting unit. If the carrying value exceeds the fair value, goodwill may be impaired. If this occurs, the Company performs the second step of the goodwill impairment test to determine the amount of impairment loss. The fair value of the reporting unit is allocated to its assets and liabilities in a manner similar to a purchase price allocation in order to determine the implied fair value of the reporting unit goodwill. This implied fair value is then compared with the carrying amount of the reporting unit goodwill, and if it is less, the Company would then recognize an impairment loss. Prior to January 1, 2002, goodwill was amortized to expense on a straight-line basis over a period of two to five years. The carrying value of goodwill was reviewed for possible impairment whenever events or changes in circumstances indicated that an impairment might exist. No goodwill impairment losses have been recognized in any of the periods presented herein.
F-13
Table of Contents
chinadotcom corporation
NOTES TO CONSOLIDATED FINANCIAL STATEMENTS
(Amounts in thousands, except number of shares, number of options and per share data)
| 4. | SUMMARY OF SIGNIFICANT ACCOUNTING POLICIES (continued) |
| (e) | Goodwill and intangible assets (continued) |
Intangible assets represent trademarks, service marks, Uniform Resource Locators (“URL”), software applications and programs, and customer database. Intangible assets are carried at cost less accumulated amortization. Amortization is computed using the straight-line method over the estimated economic lives of the respective assets. The Company has certain trademarks, service marks and domain names registered in the United States Patent and Trademark Office and other jurisdictions. The Company believes the service marks and domain names are of material importance to the Company’s business and have an estimated useful life of twenty years. Accordingly, these trademarks, service marks and domain names are amortized on a straight-line basis over a period of twenty years. The Company purchased certain software programs and customer database from acquisition of entities. The Company considers the software applications and customer database will generate revenue for the Company for 3 years. Accordingly, these software applications and programs and customer database are amortized on a straight-line basis over a period of three years. Annually, the Company reviews and adjusts the carrying value of purchased intangible assets if the facts and circumstances suggest purchased intangible assets may be impaired. If this review indicates purchased intangible assets may not be recoverable, as determined based on the undiscounted cash flows of the entity acquired over the remaining amortization period, the carrying value of intangible assets will be reduced by the estimated shortfall in discounted cash flows.
| (f) | Investment |
Debt and marketable equity investments, which represent available-for-sale securities are stated at fair value. Unrealized holding gain or loss, net of tax, on available-for-sale securities is included in a separate component of shareholders’ equity. Realized gains and losses and decline in value judged to be other-than-temporary on available-for-sale securities are included in gain/loss on disposal of available-for-sale securities and impairment of available-for-sale securities, respectively. The cost of securities sold is based on the first-in, first-out method. Interest and dividends on securities classified as available-for-sale are included in interest income and other income, respectively.
All other investments, for which the Company does not have the ability to exercise significant influence and there is not a readily determinable market value, are accounted for under the cost method of accounting. Dividends and other distributions of earnings from investees, if any, are included in income when declared. The Company periodically evaluates the carrying value of its investments accounted for under the cost method of accounting and decline in value is included in impairment of cost of investments.
When determining whether an impairment of investments exists or a decline in value of an available-for-sale security is other-than-temporary, the Company evaluates evidence to support a realizable value in excess of the current market price for securities with readily determinable fair value. Such information may include the investment’s financial performance (including such factors as earnings trends, dividend payments, asset quality and specific events), the near term prospects of the investment, the financial condition and prospects of the investment’s region and industry, and the Company’s investment intent. Typically, a sustained decline in the market value of a quoted security for six months is generally indicative of an other-than-temporary impairment.
| (g) | Investments in equity investees |
F-14
Table of Contents
chinadotcom corporation
NOTES TO CONSOLIDATED FINANCIAL STATEMENTS
(Amounts in thousands, except number of shares, number of options and per share data)
The Company’s investments in equity investees for which its ownership exceeds 20%, but which are not majority-owned, are accounted for using the equity method. Under the equity method, the Company’s proportionate share of each equity investee’s net income or loss and amortization of the Company’s net excess investment over its equity in each equity investee’s net assets is included in “share of losses in equity investees”. Amortization is recorded on a straight-line basis over the estimated useful life of three years.
F-15
Table of Contents
chinadotcom corporation
NOTES TO CONSOLIDATED FINANCIAL STATEMENTS
(Amounts in thousands, except number of shares, number of options and per share data)
| 4. | SUMMARY OF SIGNIFICANT ACCOUNTING POLICIES (continued) |
| (h) | Foreign currency translation |
Foreign currency transactions are translated at the applicable rates of exchange ruling at the transaction dates. Monetary assets and liabilities denominated in foreign currencies at the balance sheet date are translated at the applicable rates of exchange ruling at that date. Exchange differences are dealt with in the income statement.
The functional currency of the Company is the Hong Kong Dollar. The functional currency of the Company’s subsidiaries in the locations outside Hong Kong are the respective local currencies. The financial statements of the Company’s subsidiaries have been translated into United States dollars in accordance with SFAS 52,Foreign Currency Translation. All balance sheet accounts have been translated using the exchange rates in effect at the balance sheet date. Income statement amounts have been translated using the exchange rates in effect during the year.
| (i) | Advertising expenses |
Advertising expenses, net of reimbursements, are charged to the consolidated statement of operations when incurred.
| (j) | Shipping and handling |
Costs related to shipping and handling are included in cost of sales for all periods presented.
| (k) | Revenue recognition |
The Company generates revenues from three primary sources: e-business solutions, advertising and sale of IT products. Revenue is recognized in accordance with accounting principles generally accepted in the United States, or GAAP. The specific literature the Company follows in connection with revenue recognition are the Securities and Exchange Commission’s Staff Accounting Bulletin No. 101 (SAB 101) “Revenue Recognition in Financial Statements”, the American Institute of Certified Public Accountants Statement of Position (SOP) 97-2, “Software Revenue Recognition,” as amended by SOP 98-9 “Modification of SOP 97-2, Software Revenue Recognition, with Respect to Certain Transactions”, and in certain instances, the American Institute of Certified Public Accountants SOP 81-1, “Accounting for Performance of Construction-Type and Certain Production-Type Contracts”. The Company recognizes revenue when it has persuasive evidence of an arrangement, the product has been shipped and the title to the goods is assured, the services have been delivered, the price is fixed or determinable and collectibility is reasonably assured. In addition to these basic criteria, the following are the specific revenue recognition policies followed for each major stream of revenue by reporting segment.
The Company’s e-business solutions segment includes revenues from the design and development of internet web sites, integration of those internet web sites with a customers’ computer systems, and provision of maintenance services related to those internet web sites. e-business solutions revenue is also earned from the outsourcing of information technology consultants to third parties, the provision of implementation and training services, and the provision of maintenance services to
F-16
Table of Contents
chinadotcom corporation
NOTES TO CONSOLIDATED FINANCIAL STATEMENTS
(Amounts in thousands, except number of shares, number of options and per share data)
customers who purchased computer software from the Company. Sales of computer software were classified under the Sales of IT products revenue segment.
The majority of engagements in the software and consulting services segment are for the design, development and integration of internet web sites. These projects are usually fixed price and most have durations of six months or less. Customers enter into contractual arrangements with the Company that specify the required web design features and layout, functionality, implementation services required, expected deliverables, pricing, payment terms and project timetable. Invoicing and payments are usually made throughout the term of the project in accordance with the contractual terms. The majority of projects include acceptance clauses requiring customers’ sign off at the conclusion of the project. The arrangements allow the customer to withhold 10% of the total project cost as a retention until sign off and acceptance is obtained. Historically, the Company has not experienced projects where sign off or acceptance has been withheld by a customer resulting in a material loss on a project. In limited situations, the Company receives change orders from customers in which case each change order request is assessed its impact on the existing arrangement, and contract revenues and costs are only adjusted after both parties agree to the changes. The Company also receives change orders which result in the initiation of a separate project. When a customer fails to make payments in accordance with the terms stipulated in the arrangement, the Company suspends the recognition of revenue.
Revenues from the design and development of internet web sites and the integration of those web sites with clients’ computer systems are recognized using contract accounting. In order to calculate the amount of revenue earned, the Company uses the cost-to-cost percentage-of-completion method whereby amounts recognized are calculated by reference to the hours incurred as a percentage of the total estimated hours to complete the project. The Company uses this input method to calculate revenues because historical experience has demonstrated that it produces a reliable indication of the progress on each engagement. Estimates of total projected contract costs are re-evaluated on a regular basis and, if appropriate, revised. Any adjustments to revenue due to changes in estimates are accounted for in the period of the change in estimate. When estimates indicate that a loss will be incurred on a contract upon completion, a provision for the expected loss is recorded in the period in which the loss becomes evident. Historically, the Company has not experienced material losses on fixed-price contracts. The majority of the Company’s contracts are short term in duration, and use of the completed contract method would not result in a material difference in revenue earned.
The Company provides maintenance services related to internet web sites, the revenues from which are also recorded in its e-business solutions segment. Maintenance services related to internet web sites involves support in connection with non-significant customer requested changes to web site functionality, updates to web site information, and telephone support for web site administrators. Revenues from internet web site maintenance agreements are deferred and recognized ratably over the term of the related agreements which are usually for periods of six months or one year.
Outsourcing of information technology consultants, the revenues from which are recorded in the Company’s e-business solutions segment, involves contractual time and material outsourcing agreements whereby consultants are provided at agreed-upon billing rates for customers to deploy on their own internal projects. Revenues from time and materials outsourcing contracts are recognized as the services are delivered assuming all other basic criteria for revenue recognition have been met.
Revenues related to training services are deferred and recognized as the services are delivered assuming all other basic criteria for revenue recognition have been met. Where training services are sold as part of a multi-element deal, those services are evaluated, on a case-by-case basis, to determine whether they are essential to the functionality of the other elements of the arrangement. In cases where training services are considered essential to the functionality of the other elements of the arrangement, revenue from the total arrangement is deferred and recognized as the training services are delivered.
F-17
Table of Contents
chinadotcom corporation
NOTES TO CONSOLIDATED FINANCIAL STATEMENTS
(Amounts in thousands, except number of shares, number of options and per share data)
Revenues related to maintenance agreements on software products are deferred and recognized ratably over the term of the agreement which is normally one year.
Advertising revenues are derived from the sale of online banner advertising, sponsorships, direct mailings and offline advertising campaigns.
Online banner advertising revenues are derived from short-term advertising contracts (normally less than 90 days) in which customers’ advertisements are placed on web sites for a set period of time or for a set number of impressions. Impressions are defined as the number of times that an advertisement appears on a selected web page. Customers typically identify the web sites they wish their advertisements to be displayed on, and in certain situations, the advertisements are also displayed on the Company’s own or affiliated company web sites. Revenues from online banner advertising are recognized in the period in which the advertisement is displayed at the lesser of the ratio of impressions delivered over total guaranteed impressions or ratably over the term of contract.
Sponsorship revenues are derived from advertisements placed on the Company’s own or affiliated company web sites and are usually for longer display periods than online banner advertisement agreements, but normally do not exceed one year. Sponsorship revenues are recognized ratably over the term of contracts assuming all other basic criteria for revenue recognition have been met.
Direct mailing revenues are derived from targeted advertising campaigns. The Company transmits the advertisements in either electronic or hard copy form to the target profile or market. On occasion, the Company may also assist with the design of the advertisements. Revenues from direct mailing are recognized when the advertisements are sent, assuming all other basic criteria for revenue recognition have been met.
Offline advertising revenues are derived from the production and placement of advertisements in magazines and publications for the travel and tourism industry. Revenues are realized when the advertisements are published assuming all other basic criteria for revenue recognition have been met.
The Company pays web sites for providing advertising space and becomes obligated to make the payment in the period the advertising is delivered. Such expenses are classified as cost of revenues in the consolidated statements of operations.
Certain subsidiaries of the Company act as advertising agents for their customers, and the related revenues derived from these agreements are recorded net in the consolidated statement of operations.
The Company pays affiliated web sites a percentage of advertising revenue, ranging from 50% to 85%, in exchange for providing advertising space to the Company’s network. The Company becomes obligated to make payments to such affiliated web sites in the period the advertising is delivered. Such expenses are classified as cost of revenues in the consolidated statements of operations. The Company records the revenue on a gross basis since it is responsible for fulfillment of the contract, including the selection of the website, arrangement of the ad placement and acceptability of the ad. In addition, the Company assumes the credit risk for the amount billed to the customer and owed to an affiliated web site after the web site performs, regardless of whether the Company fully collects the sales price from the customer.
Revenues in the sale of IT products segment are derived from the sale of computer hardware, software and printers.
The products offered in the sale of IT products revenue segment include railroad ticketing machines and financial software packages. The financial software packages sold include a combination of both hardware and software. The Company allocates the arrangement fee in these multi-element
F-18
Table of Contents
chinadotcom corporation
NOTES TO CONSOLIDATED FINANCIAL STATEMENTS
(Amounts in thousands, except number of shares, number of options and per share data)
deals to each individual element using its fair value as determined by “vendor specific objective evidence”. Vendor specific objective evidence of fair value is determined by the customary price charged for each element when sold separately after the application of any standard approved discount. Where fair value exists for all undelivered elements of the arrangement, the Company applies the “residual” method of accounting and defers revenue allocated to the undelivered elements whilst recognizing the residual revenue allocated to the delivered elements. In the absence of vendor specific objective evidence for any undelivered element, the Company defers the entire arrangement fee and recognizes revenue when all undelivered elements are delivered, assuming all other basic criteria for revenue recognition have been met.
Provisions for discounts and rebates to customers, estimated returns and allowances, and other adjustments are provided for in the same period in which the related revenues are recorded. Such provisions are calculated after considering relevant historical data.
F-19
Table of Contents
chinadotcom corporation
NOTES TO CONSOLIDATED FINANCIAL STATEMENTS
(Amounts in thousands, except number of shares, number of options and per share data)
| 4. | SUMMARY OF SIGNIFICANT ACCOUNTING POLICIES (continued) |
| (k) | Revenue recognition (continued) |
Advertising service fees are derived from the online sales of banner advertisements, direct mailing and sponsorships in which the Company delivers advertising for a fixed fee on the Company’s Web sites and advertising affiliates, which comprises third-party Web sites and offline advertising campaigns. Online advertising revenue is derived principally from short-term advertising contracts in which the Company may guarantee a minimum number of impressions to advertisers over a specific period of time for a fixed fee. Revenues from online banner advertising are recognized ratably in the period in which the advertisement is displayed, provided that no significant Company obligations remain at the lesser of the ratio of impressions delivered over total guaranteed impressions or the straight-line basis over the term of contract, and collection of resulting receivable is reasonably assured. Advertising service fees from direct mailing are derived from advertisement sent to electronic mail users registered with the Company and are recognized when each advertisement is sent. Offline advertising revenue is derived principally from fees for services and production of advertisements. Revenue is realized when the service is performed, in accordance with the terms of the contractual arrangement, and collection is reasonably assured.
Certain subsidiaries of the Company act as an advertising agent for their customers and the related revenues are recorded net in the Consolidated Statement of Operations.
The Company pays affiliated Web sites a percentage of advertising revenue, ranging from 50% to 85%, in exchange for providing advertising space to the Company’s network. The Company becomes obligated to make payments to such advertising affiliates in the period the advertising is delivered. Such expenses are classified as cost of revenues in the consolidated statements of operations.
Sale of IT products revenue is derived principally from the distribution of computer hardware and software products. Revenue is recognized when the title to the products and risk of ownership are transferred to customers, which occurs principally upon delivery to the customer. In instances where the license agreements provide for ongoing post-contract support, rights to upgrades and updates as provided by the Company and the service deliverable cannot be separated from the software license deliverable, revenue from software licenses is recognized ratably over the period of the application management services agreement. Provisions for discounts and rebates to customers, estimated returns and allowances, and other adjustments are provided for in the same period in which the related sales are recorded.
| (l) | Deferred revenue |
Deferred revenue represents cash received or receivable for e-business solutions and advertising services in advance of services being rendered.
| (m) | Income taxes |
Income taxes, if any, are determined under the liability method as required by SFAS No. 109,Accounting for Income Taxes.
F-20
Table of Contents
chinadotcom corporation
NOTES TO CONSOLIDATED FINANCIAL STATEMENTS
(Amounts in thousands, except number of shares, number of options and per share data)
| 4. | SUMMARY OF SIGNIFICANT ACCOUNTING POLICIES (continued) |
| (n) | Stock compensation expenses |
The Company accounts for stock-based employee compensation arrangements in accordance with the provisions of Accounting Principles Board Opinion (“APB”) No. 25,Accounting for Stock Issued to Employees, and complies with the disclosure provisions of SFAS 123,Accounting for Stock-Based Compensation. Under APB 25, compensation cost is recognized over the vesting period based on the difference, if any, on the date of grant between the fair value of the Company’s stock and the amount an employee must pay to acquire the stock. Had the Company determined compensation cost based on the fair value at the grant date for its stock options under SFAS 123, the Company’s net income would have been reduced as indicated below:
| Year ended | Year ended | Year ended | ||||||||||
| December 31, | December 31, | December 31, | ||||||||||
| 2000 | 2001 | 2002 | ||||||||||
| USD | USD | USD | ||||||||||
| Net loss: | ||||||||||||
| As reported | (59,802 | ) | (124,385 | ) | (18,231 | ) | ||||||
| Pro forma | (102,243 | ) | (152,783 | ) | (33,846 | ) | ||||||
| Net loss per share: | ||||||||||||
| As reported | (0.61 | ) | (1.21 | ) | (0.18 | ) | ||||||
| Pro forma | (1.04 | ) | (1.49 | ) | (0.33 | ) | ||||||
| (o) | Earnings per share |
The Company computes earnings per share in accordance with SFAS 128,Earnings per Share. Under the provisions of SFAS 128, basic net income or loss per share is computed by dividing the net income or loss available to common shareholders for the period by the weighted average number of common shares outstanding during the year. Diluted net income or loss per share is computed by dividing the net income or loss for the year by the weighted average number of common and common equivalent shares outstanding during the year. Common equivalent shares, composed of incremental common shares issuable upon the exercise of stock options, are included in diluted net income or loss per share to the extent such shares are dilutive.
Loss per share has been provided for all years assuming that all shares issued as part of the Reorganization had been outstanding for all years.
| (p) | Repurchase agreements |
Debt securities sold under agreements to repurchase are classified as secured borrowings. Agreements with the third party specify the third parties’ rights to request additional collateral. Both parties monitor the fair value of the underlying securities as compared with the related receivable or payable, including accrued interest, and may request a cash transfer at least equal to that net exposure as necessary.
F-21
Table of Contents
chinadotcom corporation
NOTES TO CONSOLIDATED FINANCIAL STATEMENTS
(Amounts in thousands, except number of shares, number of options and per share data)
| 4. | SUMMARY OF SIGNIFICANT ACCOUNTING POLICIES (continued) |
| (q) | Gain on issuances of stock by subsidiaries |
At the time a subsidiary sells its stock to unrelated parties at a price in excess of its book value, the Company’s net investment in that subsidiary increases. If at that time, the subsidiary is not a newly-formed, non-operating entity, nor a research and development, start-up or development stage company, nor is there question as to the subsidiary’s ability to continue in existence, the Company records the increase as a non-operating gain in the Consolidated Statements of Operations. Otherwise, the increase is reflected in “effect of subsidiaries’ equity transactions” in the Company’s Consolidated Statements of Stockholders’ Equity.
| (r) | Derivative instruments |
SFAS 133,Accounting for Derivative Instruments and Hedging Activities, requires all contracts which meet the definition of a derivative to be recognized on the balance sheet as either assets or liabilities and recorded at fair value. Changes in the fair value of derivative financial instruments are either recognized periodically in the income statement or in shareholders’ equity as a component of other comprehensive income depending on the use of the derivative and whether it qualifies for hedge accounting. Changes in fair values of derivatives not qualified as hedges are reported in income. The estimated fair values of derivative instruments are determined at discrete points in time based on the relevant market information. These estimates are calculated with reference to the market rates using industry standard valuation techniques.
| (s) | Impact of recently issued accounting standards |
In April 2002, the FASB issued SFAS 145,Rescission of FASB Statements No. 4, 44, and 64, Amendment of FASB Statement No. 13, and Technical Corrections. Among other provisions, SFAS 145 rescinds SFAS 4,Reporting Gains and Losses from Extinguishment of Debt. Accordingly, gains or losses from extinguishment of debt shall not be reported as extraordinary items unless the extinguishment qualifies as an extraordinary item under the criteria of Accounting Principles Board (“APB”) Opinion No. 30,Reporting the Results of Operations-Reporting the Effects of Disposal of a Segment of a Business, and Extraordinary, Unusual and Infrequently Occurring Events and Transactions. Gains or losses from extinguishment of debt that do not meet the criteria of APB 30 should be reclassified to income from continuing operations in all prior periods presented. The Company adopted SFAS 145 effective January 1, 2002 and expects the adoption to have no material effect on its results of operations and financial condition.
In June 2002, the FASB issued SFAS 146,Accounting for Costs Associated with Exit or Disposal Activities. SFAS 146 provides guidance related to accounting for costs associated with disposal activities covered by SFAS 144 or with exit or restructuring activities previously covered by Emerging Issues Task Force (“EITF”) Issue No. 94-3,Liability Recognition for Certain Employee Termination Benefits and Other Costs to Exit an Activity (including Certain Costs Incurred in a Restructuring). SFAS 146 supercedes EITF Issue No. 94-3 in its entirety. SFAS 146 requires that costs related to exiting an activity or to a restructuring not be recognized until the liability is incurred. SFAS 146 will be applied prospectively to exit or disposal activities that are initiated after December 31, 2002.
F-22
Table of Contents
chinadotcom corporation
NOTES TO CONSOLIDATED FINANCIAL STATEMENTS
(Amounts in thousands, except number of shares, number of options and per share data)
| 4. | SUMMARY OF SIGNIFICANT ACCOUNTING POLICIES (continued) |
| (s) | Impact of recently issued accounting standards (continued) |
In December 2002, the FASB issued SFAS 148,Accounting for Stock-Based Compensation, Transition and Disclosure. SFAS 148 provides alternative methods of transition for a voluntary change to the fair value based method of accounting for stock-based employee compensation. SFAS 148 also requires that disclosures of the pro forma effect of using the fair value method of accounting for stock-based employee compensation be displayed more prominently and in a tabular format. Additionally, SFAS 148 requires disclosure of the pro forma effect in interim financial statements. The transition and annual disclosure requirements of SFAS 148 are effective for the Company in 2002. The Company does not expect SFAS 148 to have a material effect on its results of operations or financial condition.
In November 2002, the EITF reached a consensus on Issue No. 00-21,Revenue Arrangements with Multiple Deliverables. EITF 00-21 provides guidance on how to account for arrangements that involve the delivery or performance of multiple products, services and/or rights to use assets. The provisions of EITF 00-21 will apply to revenue arrangements entered into in fiscal periods beginning after June 15, 2003. The Company is currently evaluating the effect that the adoption of EITF 00-21 will have on its results of operations and financial condition.
In November 2002, the FASB issued FASB Interpretation No. 45 (“FIN 45”),Guarantor’s Accounting and Disclosure Requirements for Guarantees, Including Indirect Guarantees of Indebtedness of Others. FIN 45 requires that a liability be recorded in the guarantor’s balance sheet upon issuance of a guarantee. In addition, FIN 45 requires disclosures about the guarantees that an entity has issued, including a roll-forward of the entity’s product warranty liabilities. The Company does not expect the adoption of FIN 45 will have an impact on its consolidated financial position and results of operations.
In January 2003, the FASB issued FASB Interpretation No. 46 (“FIN 46”),Consolidation of Variable Interest Entities, an Interpretation of ARB No. 51. FIN 46 requires certain variable interest entities to be consolidated by the primary beneficiary of the entity if the equity investors in the entity do not have the characteristics of a controlling financial interest or do not have sufficient equity at risk for the entity to finance its activities without additional subordinated financial support from other parties. FIN 46 is effective for all new variable interest entities created or acquired after January 31, 2003. For variable interest entities created or acquired prior to February 1, 2003, the provisions of FIN 46 must be applied for the first interim or annual period beginning after June 15, 2003. The Company is currently evaluating the effect that the adoption of FIN 46 will have on its results of operations and financial condition.
| 5. | RESTRICTED CASH |
At December 31, 2001 and 2002, cash of USD1,274 and USD109, respectively, were pledged for bank facilities.
F-23
Table of Contents
chinadotcom corporation
NOTES TO CONSOLIDATED FINANCIAL STATEMENTS
(Amounts in thousands, except number of shares, number of options and per share data)
| 6. | ACCOUNTS RECEIVABLE |
| December 31, | December 31, | |||||||
| 2001 | 2002 | |||||||
| USD | USD | |||||||
| Accounts receivable: | ||||||||
| Amounts billed | 25,302 | 17,648 | ||||||
| Unbilled | 2,310 | 1,521 | ||||||
| 27,612 | 19,169 | |||||||
| Allowance for doubtful accounts | (6,538 | ) | (4,139 | ) | ||||
| Net | 21,074 | 15,030 | ||||||
| Allowance for doubtful accounts: | ||||||||
| Balance at beginning of year | 3,488 | 6,538 | ||||||
| Additions | 3,050 | 4,296 | ||||||
| Write-offs net of recoveries | — | (6,695 | ) | |||||
| Balance at end of year | 6,538 | 4,139 | ||||||
| • | With respect to sales in advertising and marketing activities segment, the Company offers three standard payment options “cash or delivery”, “14 days after completion of campaign” or “30 days credit.” | |||
| • | For sales in the software segment, the Company offers “30 to 60 days credit from date of delivery of software” or “cash on delivery” | |||
| • | For sales in the consulting services, the Company offers “net 30 to net 60 days credit after completion of milestones per agreement” | |||
| • | For sales in mobile services and applications, the Company offers “90 days credit from the date of receipt of billing confirmations from the mobile phone operators which usually takes place 1 month after sales occurred.” | |||
| • | Our general policy for the provision of allowance for doubtful accounts I s as follows: | |||
| Period | Rate (% of Accounts Receivable) | |
| Over 90 days | 25% | |
| Over 120 days | 50% | |
| Over 180 days | 100% |
Unbilled receivable of USD2,310 and USD1,521 in 2001 and 2002, respectively, represented recognized sales value of performance relating to e-business solutions services and these amounts had not been billed and were not billable to the customers at the date of the balance sheet. The balances will be billed upon the fulfillment of certain conditions agreed between the parties.
| 7. | AVAILABLE-FOR-SALE DEBT SECURITIES |
| December 31, | December 31, | |||||||
| 2001 | 2002 | |||||||
| USD | USD | |||||||
| Debt obligations issued by corporations and federally supervised private companies: | ||||||||
| Amortized cost | 487,606 | 467,842 | ||||||
| Gross unrealized gain/(loss) | (5,666 | ) | 3,337 | |||||
| Estimated fair value | 481,940 | 471,179 | ||||||
| Restricted debt securities pledged for bank facilities | (134,960 | ) | (151,123 | ) | ||||
| Non-restricted | 346,980 | 320,056 | ||||||
F-24
Table of Contents
chinadotcom corporation
NOTES TO CONSOLIDATED FINANCIAL STATEMENTS
(Amounts in thousands, except number of shares, number of options and per share data)
| 7. | AVAILABLE-FOR-SALE DEBT SECURITIES (continued) |
Non-restricted available-for-sale debt securities consist of:
| Current | 329,952 | 300,056 | ||||||
| Non-current | 17,028 | 20,000 | ||||||
| 346,980 | 320,056 | |||||||
All debt securities held by the Company have maturity terms ranging from one to over ten years. At December 31, 2002, all the debt securities were carried at market value and temporary unrealized gains and losses at December 31, 2002 were reported in other comprehensive income.
Included in debt securities owned as of December 31, 2002 were corporate debt securities with a market value of USD151,123 (2001: USD134,960) which were segregated and secured in accordance with the Global Master Repurchase Agreement and the Total Return Swap Transaction Agreement detailed in note 13.
| 8. | DUE FROM/(TO) RELATED COMPANIES |
The amounts due to related companies as of December 31, 2001 and 2002, were unsecured and interest-free.
| 9. | PROPERTY, PLANT AND EQUIPMENT |
| December 31, | December 31, | |||||||
| 2001 | 2002 | |||||||
| USD | USD | |||||||
| Freehold land | 1,262 | 1,262 | ||||||
| Buildings | 1,262 | 1,262 | ||||||
| Leasehold improvements | 3,306 | 2,579 | ||||||
| Furniture and fixtures | 2,385 | 2,531 | ||||||
| Office equipment | 2,031 | 2,142 | ||||||
| Computer equipment | 33,297 | 29,408 | ||||||
| Motor vehicles | 478 | 488 | ||||||
| 44,021 | 39,672 | |||||||
| Less: Accumulated depreciation | (22,733 | ) | (30,297 | ) | ||||
| 21,288 | 9,375 | |||||||
F-25
Table of Contents
chinadotcom corporation
NOTES TO CONSOLIDATED FINANCIAL STATEMENTS
(Amounts in thousands, except number of shares, number of options and per share data)
10. GOODWILL
The changes in the carrying amount of goodwill for the year ended December 31, 2002, are as follows:
| e-business | Sale of IT | |||||||||||||||
| Solutions | Advertising | products | Total | |||||||||||||
| USD | USD | USD | USD | |||||||||||||
| Balance as of January 1, 2002 | 233 | 4,596 | 1,601 | 6,430 | ||||||||||||
| Goodwill acquired during the year | 233 | 1,295 | 5,044 | 6,572 | ||||||||||||
| Less: Goodwill written off related to sale of business units | (25 | ) | (783 | ) | (178 | ) | (986 | ) | ||||||||
| Less: Impairment of goodwill | — | — | — | — | ||||||||||||
| Balance as of December 31, 2002 | 441 | 5,108 | 6,467 | 12,016 | ||||||||||||
Due to the adoption of SFAS 142 on January 1, 2002, the Company ceased amortizing goodwill. Had SFAS 142 been in effect during the years ended December 31, 2001, and 2000, the Company would not have recorded goodwill amortization expenses of USD15,323 and USD29,690, respectively. The following table summarizes net loss adjusted to exclude goodwill amortization expenses that is no longer subject to amortization:
| Year ended | Year ended | Year ended | ||||||||||
| December 31, | December 31, | December 31, | ||||||||||
| 2000 | 2001 | 2002 | ||||||||||
| USD | USD | USD | ||||||||||
| Reported net loss | (59,802 | ) | (124,385 | ) | (18,231 | ) | ||||||
| Goodwill amortization | 29,690 | 15,323 | — | |||||||||
| Adjusted net loss | (30,112 | ) | (109,062 | ) | (18,231 | ) | ||||||
| Net loss per share | (0.31 | ) | (1.06 | ) | (0.18 | ) | ||||||
The goodwill represents the excess consideration paid for the purchase of subsidiaries over the fair values of the net assets acquired on the date of acquisition adjusted for contingent consideration paid, if any.
F-26
Table of Contents
chinadotcom corporation
NOTES TO CONSOLIDATED FINANCIAL STATEMENTS
(Amounts in thousands, except number of shares, number of options and per share data)
11. INTANGIBLE ASSETS
The following table summarizes the Company’s amortized intangible assets, net, as of December 31:
| 2001 | 2002 | |||||||||||||||||||||||
| Gross | Gross | |||||||||||||||||||||||
| carrying | Accumulated | carrying | Accumulated | |||||||||||||||||||||
| amount | amortization | Net | amount | amortization | Net | |||||||||||||||||||
| USD | USD | USD | USD | USD | USD | |||||||||||||||||||
| Trademarks, service marks and URLs | 17,092 | — | 17,092 | 17,092 | (885 | ) | 16,207 | |||||||||||||||||
| Software applications and programs | — | — | — | 720 | (200 | ) | 520 | |||||||||||||||||
| Customer database | — | — | — | 351 | (98 | ) | 253 | |||||||||||||||||
| 17,092 | — | 17,092 | 18,163 | (1,183 | ) | 16,980 | ||||||||||||||||||
For the year ended December 31, 2002, the Company recognized USD1,183 amortization expense. Based on the current amount of intangible assets subject to amortization, the estimated amortization expense for each of the succeeding five years is as follows:
| Year ended December 31: | USD | |||
| 2003 | 1,245 | |||
| 2004 | 1,245 | |||
| 2005 | 908 | |||
| 2006 | 840 | |||
| 2007 | 840 | |||
12. AVAILABLE-FOR-SALE EQUITY SECURITIES
| December 31, | December 31, | |||||||
| 2001 | 2002 | |||||||
| USD | USD | |||||||
| Cost | 3,894 | 1,875 | ||||||
| Impairment of equity securities included in earnings | (1,756 | ) | — | |||||
| Gross unrealized gain/(loss) | (74 | ) | 175 | |||||
| Market value | 2,064 | 2,050 | ||||||
F-27
Table of Contents
chinadotcom corporation
NOTES TO CONSOLIDATED FINANCIAL STATEMENTS
(Amounts in thousands, except number of shares, number of options and per share data)
13. CREDIT ARRANGEMENTS
Under line of credit arrangements with three banks, including the Global Master Repurchase Agreement (the “Repurchase Agreement”) and the Total Return Swap Transaction Agreement (the “Swap Agreement”) as described below, the Company may borrow up to USD389,176 on such terms as the Company and the banks mutually agree upon. Except for bank loans of USD115,799 due in 2003 and USD11,585 due in 2004 through 2011, these arrangements do not have termination dates but are reviewed annually for renewal. At December 31, 2002, the unused portion of the credit lines was USD261,792.
The Company has entered into the Repurchase Agreement with a bank pursuant to which the Company sold certain debt securities to the bank at a discounted price (the “Purchase Price”) and the bank agreed to sell back to the Company at the Purchase Price at a later date (the “Repurchase Date”). Either party with a net exposure from the transaction arising from the fluctuations in the market value of the securities or other means may request the other party to make a cash or acceptable debt securities transfer at least equal to that net exposure. During the period between the date that the Company sold the debt securities to the bank (the “Purchase Date”) and the Repurchase Date, the bank shall pay to the Company any income in respect of the debt securities and the Company shall pay to the bank an interest calculated at the Purchase Price at LIBOR plus 0.23% per annum and the number of days between the Purchase Date and the Repurchase Date. At December 31, 2002, the repurchase transactions entered into only allowed the buyer to request the seller to make a cash or acceptable debt securities transfer at least equal to the net exposure.
The Company has entered into the Swap Agreement with another bank pursuant to which the Company transferred securities and financial instruments to the bank in exchange for cash and concurrently the Company agreed to reacquire the securities and financial instruments at a future date for an amount equal to the cash exchanged and an interest factor. The Swap Agreement permitted the Company to elect for net cash settlement upon termination of the total return swap transaction. During the period between the Purchase Date and the Repurchase Date of three calendar years, the bank would pay to the Company any income in respect of the securities transferred and the Company would in return pay to the bank a price differential calculated by the Purchase Price multiply by LIBOR plus 0.35% per annum and the number of days between the Purchase Date and the Repurchase Date.
In connection with these credit lines, the Company maintained compensating balances of USD109 in cash, and pledged debt securities and land and buildings with a net book value at December 31, 2002 of USD151,123 and USD2,524, respectively.
The weighted average interest rate on short-term borrowings as of December 31, 2001 and 2002 was 2.2% and 2.1%, respectively.
F-28
Table of Contents
chinadotcom corporation
NOTES TO CONSOLIDATED FINANCIAL STATEMENTS
(Amounts in thousands, except number of shares, number of options and per share data)
14. LONG-TERM BANK LOANS
Long-term bank loans consisted of the following:
| December 31, | December 31 | |||||||
| 2001 | 2002 | |||||||
| USD | USD | |||||||
| LIBOR + 1.75% mortgage loan through 2011 | 818 | 831 | ||||||
| 4.1% mortgage loan through 2011 | 817 | 830 | ||||||
| LIBOR + 0.35% total return swap transaction loan through 2005 | — | 10,073 | ||||||
| 1,635 | 11,734 | |||||||
| Less: Current portion | (131 | ) | (149 | ) | ||||
| 1,504 | 11,585 | |||||||
Maturities of long-term debt for the five years succeeding December 31, 2002 are USD149 in 2003, USD163 in 2004, USD10,249 in 2005, USD189 in 2006, USD204 in 2007 and USD780 thereafter.
The above mortgage loans will be repaid by installments with the last payment due in 2011. Freehold land and buildings with a carrying amount of USD2,524 at December 31, 2001 and 2002 are pledged as collateral to secure these loans.
The above total return swap transaction loan is due in 2005. Debt securities with a fair value of USD11,868 at December 31, 2002 are pledged as collateral to secure the loan.
The weighted average interest rate on long-term bank loans as of December 31, 2001 and 2002 was 4.1% and 2.1%, respectively.
F-29
Table of Contents
chinadotcom corporation
NOTES TO CONSOLIDATED FINANCIAL STATEMENTS
(Amounts in thousands, except number of shares, number of options and per share data)
15. ACCUMULATED OTHER COMPREHENSIVE INCOME
The components of other comprehensive income are as follows:
| Unrealized | ||||||||||||
| appreciation | Foreign | Accumulated | ||||||||||
| of available- | currency | other | ||||||||||
| for-sale | translation | comprehensive | ||||||||||
| securities | adjustments | income | ||||||||||
| USD | USD | USD | ||||||||||
| Balance at December 31, 1999 | 2,236 | (33 | ) | 2,203 | ||||||||
| Unrealized loss, net of unrealized gain of available-for-sale securities | (44,858 | ) | — | (44,858 | ) | |||||||
| Other-than-temporary impairment of available-for-sale securities | 44,929 | — | 44,929 | |||||||||
| Foreign currency translation adjustments | — | (804 | ) | (804 | ) | |||||||
| Less: reclassification adjustment for gains, net of losses included in net income | (2,236 | ) | — | (2,236 | ) | |||||||
| Balance at December 31, 2000 | 71 | (837 | ) | (766 | ) | |||||||
| Unrealized loss, net of unrealized gain of available-for-sale securities | (9,956 | ) | — | (9,956 | ) | |||||||
| Other-than-temporary impairment of available-for-sale securities | 4,216 | — | 4,216 | |||||||||
| Minority interests’ share of unrealized loss, net of unrealized gains of available-for-sale securities | 337 | — | 337 | |||||||||
| Foreign currency translation adjustments | — | (1,199 | ) | (1,199 | ) | |||||||
| Less: reclassification adjustment for gains, net of losses included in net income | (71 | ) | — | (71 | ) | |||||||
| Balance at December 31, 2001 | (5,403 | ) | (2,036 | ) | (7,439 | ) | ||||||
| Unrealized loss, net of unrealized gain of available-for-sale securities | (1,276 | ) | — | (1,276 | ) | |||||||
| Other-than-temporary impairment of available-for-sale securities | 5,125 | — | 5,125 | |||||||||
| Minority interests’ share of unrealized gain, net of unrealized loss of available-for-sale securities | (484 | ) | — | (484 | ) | |||||||
| Foreign currency translation adjustments | — | 661 | 661 | |||||||||
| Less: reclassification adjustment for gains, net of losses included in net income | 5,403 | — | 5,403 | |||||||||
| Balance at December 31, 2002 | 3,365 | (1,375 | ) | 1,990 | ||||||||
F-30
Table of Contents
chinadotcom corporation
NOTES TO CONSOLIDATED FINANCIAL STATEMENTS
(Amounts in thousands, except number of shares, number of options and per share data)
16. SUPPLEMENTARY OPERATIONS STATEMENT INFORMATION
| Year ended | Year ended | Year ended | ||||||||||
| December 31, | December 31, | December 31, | ||||||||||
| 2000 | 2001 | 2002 | ||||||||||
| USD | USD | USD | ||||||||||
| The Company incurred the following expenses: | ||||||||||||
| Rental expenses | 6,974 | 8,100 | 4,198 | |||||||||
| Advertising expenses | 19,647 | 9,110 | 930 | |||||||||
| Defined contribution retirement plans expenses | 58 | 475 | 1,423 | |||||||||
17. RELATED PARTY TRANSACTIONS
The Company had the following transactions with related parties during the year:
| (a) | 24/7 Real Media, Inc. |
Pursuant to the License and Software Agreement (the “Agreement”) entered into by the Company and 24/7 Real Media, Inc. (formerly known as 24/7 Media, Inc. and hereafter referred to as “24/7”), which was a shareholder of the Company as of December 31, 2001 and 2002, on October 23, 1998, 24/7 granted to the Company a non-exclusive license to use certain 24/7 software products to serve advertisements on the Internet and an exclusive license to use the “24/7 Media” trademark in the Asian market.
Under the terms of the agreement with 24/7, the Company was obligated to pay to 24/7 10% of the Company’s net revenues generated from advertisements on the Company’s advertising network. Net revenue included all revenue generated from advertising sales, net of commissions retained or paid to advertising agencies, and service fees paid to advertising affiliates or the Company’s Web sites. Services fees paid to the Company’s Web sites, exclusive of the Company’swww.cww.comportal, was set at 70% of advertising sales while service fees to the advertising affiliates, including the Company’swww.cww.comportal, ranged from 30% to 50% of advertising sales. During the year ended December 31, 2001 and December 31, 2002, payments made under the Agreement amounted to USD800 and nil, respectively.
Where U.S. based advertisements were sold on the Company’s advertising network by 24/7, 24/7 was obligated to pay 70% of the sales revenue, net of commissions retained or paid to advertising agencies, to the Company. 24/7 served as the Company’s exclusive agent for the sale of U.S. based advertisements on the Company’s advertising network.
F-31
Table of Contents
chinadotcom corporation
NOTES TO CONSOLIDATED FINANCIAL STATEMENTS
(Amounts in thousands, except number of shares, number of options and per share data)
17. RELATED PARTY TRANSACTIONS (continued)
| (a) | 24/7 Real Media, Inc. (continued) |
Where Asian-based advertisements were sold on 24/7 U.S. network of advertising affiliates, the Company would pay 70% of such sales revenue, net of commissions retained or paid to advertising agencies, to 24/7. The Company served as 24/7 Media Asia’s exclusive agent for the sale of Asian-based advertisements on 24/7 U.S. network of advertising affiliates.
In August 2000, the Agreement was superceded by the 24/7 Media-Asia Agreement and supplemental related agreements (collectively, the “Media Asia Agreement”). In October 2000, as part of the Media Asia Agreement, the Company sold 19.9% of its shares in 24/7 Media Asia Limited, a then wholly-owned subsidiary, to 24/7 in exchange for 2,500,000 shares of common stock of 24/7 valued at USD4.3125 per share, resulting in a net gain of USD10,417.
In June 2001, the Company gave notice of termination of the Media Asia Agreement to 24/7, which notice was effective September 2001.
In June 2001, the Company demanded from 24/7 Media Asia Limited the repayment of a portion of loans that the Company had extended to 24/7 Media Asia Limited. In January 2002, 24/7 Media Asia Limited completed a rights issue whereby it issued and allotted additional equity shares to all shareholders participating in the rights issue as a means to settle the loan demand. While the Company participated in this rights issue, 24/7 chose not to participate in this rights issue and therefore, 24/7’s interest in 24/7 Media Asia Limited was effectively diluted. The Company’s interest in 24/7 Media Asia Limited increased to approximately 98% while 24/7’s interest declined to under 2%.
| (b) | Equity investees | |||
| The Company derived e-business Solutions revenues from the following equity investees of the Company: | ||||
| Year ended | Year ended | Year ended | ||||||||||
| December 31, | December 31, | December 31, | ||||||||||
| 2000 | 2001 | 2002 | ||||||||||
| USD | USD | USD | ||||||||||
| The Bigstore Asia.com Limited | 250 | — | — | |||||||||
| LJ Digital Inc. | 802 | — | — | |||||||||
| Sportasia Media Limited | 859 | 60 | — | |||||||||
| 1,911 | 60 | — | ||||||||||
In November 2001, the Company acquired the Uniform Resource Locator (the “URL”) of “www.sportasia.com” from Sportasia Media Limited for a consideration of USD39.
F-32
Table of Contents
chinadotcom corporation
NOTES TO CONSOLIDATED FINANCIAL STATEMENTS
(Amounts in thousands, except number of shares, number of options and per share data)
17. RELATED PARTY TRANSACTIONS (continued)
| (c) | CIC |
In June 1999, the Company entered into a Support Services Agreement with CIC, which has certain common directors and shareholders with the Company, under which the Company agreed to provide CIC with the services required for operating the local America Online, Inc. (“AOL”) Hong Kong online services for a fee equal to the cost of providing such services to CIC plus 10% and operating the local Netscape guide and search development services. In April 2000, the Company signed an Amended and Restated Support Services Agreement with CIC which increased the markup of the provision of e-business solutions and advertising services, while the markup of the provision of personnel services remained at 10%. For the year ended December 31, 2000, the Company derived total revenue of USD19,880 from CIC.
Since January 1, 2001, the Company did not recognize any revenue incurred from the provision of e-business solutions and advertising services in connection with the Amended and Restated Support Services Agreement due to the uncertainty of the collectibility of the receivable from CIC. USD5,425 incurred in connection with the provision of these services was recorded under selling, general and administrative expenses in 2001. In September 2001, the Company agreed to CIC’s request to waive the legal rights with respect to up to USD7,730 owed to the Company from CIC.
In October 2001, the Company entered into an Asset Purchase Agreement with CIC to acquire the URLs of “www.china.com”, “www.hongkong.com” and “www.taiwan.com”, and all intellectual property and other proprietary rights in connection with the URLs for a cash consideration of USD16,800. The purchase price of the URLs was determined by reference to valuations performed by independent appraisers and negotiation with CIC.
| (d) | Golden Tripod Limited |
For the years ended December 31, 2000, 2001 and 2002, the Company paid management fees of USD439, USD261 and USD293, respectively, to a shareholder, Golden Tripod Limited, for the provision of general management services to the Company.
| (e) | Asia Pacific Online Limited |
For the years ended December 31, 2000, 2001 and 2002 the Company reimbursed USD120 per year, to Asia Pacific Online Limited (“APOL”), a shareholder of the Company that has common directors with the Company, for expenses incurred for the provision of general management services to the Company.
In January 2002, the Company has entered into a new services agreement with APOL. Under this agreement, the Company agreed to provide an annual management fee of USD0.001 and to reimburse for expenses incurred for the provision of general management services rendered to the Company up to USD270 annually.
F-33
Table of Contents
chinadotcom corporation
NOTES TO CONSOLIDATED FINANCIAL STATEMENTS
(Amounts in thousands, except number of shares, number of options and per share data)
17. RELATED PARTY TRANSACTIONS (continued)
| (f) | New World Infrastructure |
In October 2000, the Company entered into an agreement to acquire a majority interest in Wealth Corporation Ltd., a company that indirectly owned www.chinaholiday.com, a PRC travel b2b portal, from its shareholders. The selling shareholders included New World Infrastructure, a shareholder of the Company, who received 99,180 of the Company’s Class A common shares as consideration for its shares.
In November 2002, the Company entered into an amendment agreement and share repurchase agreement with the other shareholders of Wealth Corporation Ltd. whereby the Company reduced its stake in Wealth Corporation Ltd. to 19.9% for a payment from the other shareholders of US$1,044,589. The purchasing shareholders included New World Infrastructure.
| (g) | AOL Time Warner Inc. |
During 2001, the Company paid advertising fees totaling USD3,500 to AOL Time Warner Inc., a shareholder of the Company, for the provision of Internet advertising services to the Company. In addition, the Company paid AOL Time Warner Inc. USD3,700 for computer software from PurchasePro.com, Inc., a strategic alliance partner of AOL Time Warner Inc.
18. INCOME TAXES
Under the current laws of the Cayman Islands, the Company and its subsidiaries are not subject to tax on income or capital gains, and no Cayman Islands withholding tax is imposed upon payments of dividends by the Company to its shareholders.
The subsidiaries in all geographical regions are governed by the respective local income tax laws with statutory tax rates ranging from 0% to 35%. No deferred tax expenses for operations in all geographical locations were recognized in any periods.
Pre-tax loss from operations for the years ended December 31, 2000, 2001 and 2002 was taxed in the following jurisdictions:
| Year ended | Year ended | Year ended | ||||||||||
| December 31, | December 31, | December 31, | ||||||||||
| 2000 | 2001 | 2002 | ||||||||||
| USD | USD | USD | ||||||||||
| Loss from continuing operations: | ||||||||||||
| United States (“US”) | (1,746 | ) | (3,932 | ) | (1,074 | ) | ||||||
| Non-US | (56,564 | ) | (118,093 | ) | (11,374 | ) | ||||||
| (58,310 | ) | (122,025 | ) | (12,448 | ) | |||||||
| Loss from discontinued operations: | ||||||||||||
| Non-US | (1,405 | ) | (6,009 | ) | (7,204 | ) | ||||||
| Pre-tax loss | (59,715 | ) | (128,034 | ) | (19,652 | ) | ||||||
F-34
Table of Contents
chinadotcom corporation
NOTES TO CONSOLIDATED FINANCIAL STATEMENTS
(Amounts in thousands, except number of shares, number of options and per share data)
18. INCOME TAXES (continued)
Significant components of the provision for income taxes are as follows:
| Year ended | Year ended | Year ended | ||||||||||
| December 31, | December 31, | December 31, | ||||||||||
| 2000 | 2001 | 2002 | ||||||||||
| USD | USD | USD | ||||||||||
| Current: | ||||||||||||
| Tax expense allocated to net income from continuing operations: | ||||||||||||
| US | 156 | — | — | |||||||||
| Non-US | 526 | 148 | 160 | |||||||||
| 682 | 148 | 160 | ||||||||||
| Tax expense/(benefit) allocated to discontinued operations: | ||||||||||||
| Non-US | (42 | ) | 213 | — | ||||||||
| Total current | 640 | 361 | 160 | |||||||||
| Deferred: | ||||||||||||
| US | — | — | — | |||||||||
| Non-US | — | — | — | |||||||||
| Total deferred | — | — | — | |||||||||
| 640 | 361 | 160 | ||||||||||
Deferred tax liabilities and assets are comprised of the following:
| December 31, | December 31, | |||||||
| 2001 | 2002 | |||||||
| USD | USD | |||||||
| Deferred tax liabilities: | ||||||||
| Accelerated depreciation allowances | (686 | ) | (193 | ) | ||||
| Deferred tax assets: | ||||||||
| Net operating loss carryforwards (net of USD2,297 expired or disposed of during the year) (2001: USD2,119) | 34,893 | 34,484 | ||||||
| Others | 3,979 | 5,213 | ||||||
| Total deferred tax assets | 38,872 | 39,697 | ||||||
| Valuation allowance for deferred tax assets | (38,186 | ) | (39,504 | ) | ||||
| Net deferred tax assets | 686 | 193 | ||||||
| Net deferred tax liabilities | — | — | ||||||
F-35
Table of Contents
chinadotcom corporation
NOTES TO CONSOLIDATED FINANCIAL STATEMENTS
(Amounts in thousands, except number of shares, number of options and per share data)
18. INCOME TAXES (continued)
The reconciliation of income taxes computed at the statutory tax rates to the effective income tax provision recorded is as follows:
| Year ended | Year ended | Year ended | ||||||||||
| December 31, | December 31, | December 31, | ||||||||||
| 2000 | 2001 | 2002 | ||||||||||
| USD | USD | USD | ||||||||||
| Income tax benefit computed at the respective statutory rates | (10,979 | ) | (18,700 | ) | (3,793 | ) | ||||||
| Change in tax rates | — | — | 425 | |||||||||
| Non-deductible items | 1,157 | 2,391 | 221 | |||||||||
| Non-taxable items | (3,922 | ) | (3,378 | ) | (308 | ) | ||||||
| Benefit from operating losses not recorded | 14,384 | 20,048 | 3,615 | |||||||||
| Total income taxes | 640 | 361 | 160 | |||||||||
Due to its history of losses, the Company does not believe that sufficient objective, positive evidence currently exists to conclude that the recoverability of its net deferred tax assets is more likely than not. Consequently, the Company has provided a valuation allowance covering 100% of its net deferred tax assets.
At December 31, 2002, the Company had net operating loss carryforwards of approximately USD132,200 for income tax purposes that expire in years 2003 to indefinite.
19. BASIC AND DILUTED LOSS PER SHARE
The following table sets forth the computation of basic and diluted loss per share:
| Year ended | Year ended | Year ended | ||||||||||
| December 31, | December 31, | December 31, | ||||||||||
| 2000 | 2001 | 2002 | ||||||||||
| USD | USD | USD | ||||||||||
| Numerator for basic and diluted loss per share: | ||||||||||||
| Loss from continuing operations | (58,439 | ) | (118,163 | ) | (11,572 | ) | ||||||
| Loss from discontinued operations, net of gain on disposal | (1,363 | ) | (6,222 | ) | (6,659 | ) | ||||||
| Loss attributable to common shareholders | (59,802 | ) | (124,385 | ) | (18,231 | ) | ||||||
| Number | Number | Number | ||||||||||
| Denominator for basic and diluted loss per share: | ||||||||||||
| Weighted average number of shares after adjusting for the Share Splits | 98,091,541 | 102,589,760 | 102,269,735 | |||||||||
F-36
Table of Contents
chinadotcom corporation
NOTES TO CONSOLIDATED FINANCIAL STATEMENTS
(Amounts in thousands, except number of shares, number of options and per share data)
19. BASIC AND DILUTED LOSS PER SHARE (continued)
| Year ended | Year ended | Year ended | ||||||||||
| December 31, | December 31, | December 31, | ||||||||||
| 2000 | 2001 | 2002 | ||||||||||
| USD | USD | USD | ||||||||||
| Basic and diluted loss per share: | ||||||||||||
| Loss from continuing operations | (0.60 | ) | (1.15 | ) | (0.11 | ) | ||||||
| Loss from discontinued operations | (0.01 | ) | (0.06 | ) | (0.07 | ) | ||||||
| Loss attributable to common shareholders | (0.61 | ) | (1.21 | ) | (0.18 | ) | ||||||
The computation of diluted loss per share did not assume the conversion of the stock options and the warrants of the Company during the year because their inclusion would have been antidilutive.
20. DISCONTINUED OPERATIONS
During the year ended December 31, 2002, the Company discontinued the operations of certain subsidiaries in the e-business Solutions and the Advertising segments. With the adoption of SFAS 144,Accounting for the Impairment or Disposal of Long-Lived Assets, the operating results of the discontinued operating units were classified as loss from operations of discontinued subsidiaries on the consolidated statements of operations.
From August to December 2002, liquidators were appointed to oversee the dissolution of the discontinued subsidiaries. The combined assets and liabilities of the discontinued subsidiaries on the respective dates of liquidation were USD2,019 and USD2,564, respectively, resulting in a net gain on disposal of USD545, which was included in the gain on disposal of discontinued subsidiaries for the year ended December 31, 2002.
Net loss of the subsidiaries classified as discontinued operations for the year ended December 2000, 2001 and 2002 were USD1,363, USD6,222 and USD7,204, respectively. Revenue of the discontinued operations for the year ended December 2000, 2001 and 2002 were USD11,571, USD11,061 and USD4,044, respectively. Pretax loss reported in discontinued operations for the year ended December 2000, 2001 and 2002 were 1,405, USD6,009 and USD7,204, respectively.
21. FINANCIAL INSTRUMENTS
The carrying amount of the Company’s cash and cash equivalents approximates their fair values because of the short maturity of those instruments. The carrying value of receivables, payables and short-term debt approximates their market values based on their short-term maturities. The total fair values of the equity securities in listed companies as of December 31, 2001 and 2002 were USD2,064 and USD2,050, respectively based on the market values of publicly traded shares as of December 31, 2001 and 2002. The total fair values of the debt securities as of December 31, 2001 and 2002 were USD481,940 and USD471,179, respectively based on the market values of publicly traded debt securities as of December 31, 2001 and 2002. The fair value of related party receivable and payable cannot be determined due to the related party nature of the accounts.
F-37
Table of Contents
chinadotcom corporation
NOTES TO CONSOLIDATED FINANCIAL STATEMENTS
(Amounts in thousands, except number of shares, number of options and per share data)
21. FINANCIAL INSTRUMENTS (continued)
In October 2002, the Company entered into a promissory note and warrant purchase agreement with Sagent Technology Inc. (“Sagent”), a NASDAQ listed company, whereby the Company paid USD7,000 cash to Sagent for a promissory note and for 8,000,000 warrants to purchase Sagent’s common shares for investment purposes. The fair value of the promissory note and the warrants as of December 31, 2002 were USD5,325 and USD2,320, respectively. These amounts are recorded in other assets on the consolidated balance sheets. The Company recognized a USD571 gain in value of the warrants in other non-operating gains on the consolidated statements of operations for the year ended December 31, 2002. The Company determined the estimated fair value amounts by using available market information and commonly accepted valuation methodologies. However, considerable judgment is required in interpreting market data to develop the estimates of fair value. Accordingly, the estimates presented herein are not necessarily indicative of the amounts that the Company or holders of the instruments could realize in a current market exchange. The use of different assumptions and/or estimation methodologies may have a material effect on the estimated fair values.
22. CONCENTRATION OF RISKS
Concentration of credit risk:
The Company is engaged in the provision of e-business solutions, including Web site development, hosting and maintenance, advertising and sale of IT products to businesses in Hong Kong, Australia, Japan, Korea, the People’s Republic of China (the “PRC”), Singapore, the Republic of China, the United Kingdom and the United States. The Company generally does not require collateral for accounts receivable.
The Company maintains cash and cash equivalents with various financial institutions in Hong Kong, Australia, Japan, Korea, the PRC, Singapore, the Republic of China, the United Kingdom and the United States. The Company’s policy is designed to limit exposure to any one institution. The Company performs periodic evaluations of the relative credit standing of those financial institutions that are considered in the Company’s investment strategy.
Concentration of business risk:
Revenue has been derived from a number of clients that use the Company’s services. The top 10 customers accounted for 30%, 9% and 14% of the revenue for the years ended December 31, 2000, 2001 and 2002, respectively. 16%, nil and nil of the revenue were attributable to CIC for the years ended December 31, 2000, 2001 and 2002, respectively.
Current vulnerability due to certain concentrations:
The Company’s operations may be adversely affected by significant political, economic and social uncertainties in the PRC. Although the PRC government has been pursuing economic reform policies for the past 20 years, no assurance can be given that the PRC government will continue to pursue such policies or that such policies may not be significantly altered, especially in the event of a change in leadership, social or political disruption or unforeseen circumstances affecting the PRC’s political, economic and social conditions. There is also no guarantee that the PRC government’s pursuit of economic reforms will be consistent or effective.
F-38
Table of Contents
chinadotcom corporation
NOTES TO CONSOLIDATED FINANCIAL STATEMENTS
(Amounts in thousands, except number of shares, number of options and per share data)
22. CONCENTRATION OF RISKS (continued)
The PRC has recently enacted new laws and regulations governing Internet access and the provision of online business, economic and financial information. Current or proposed laws aimed at limiting the use of online services to transmit certain materials could, depending upon their interpretation and application, result in significant potential liability to the Company, as well as additional costs and technological challenges in order to comply with any statutory or regulatory requirements imposed by such legislation. Additional legislation and regulations that may be enacted by the PRC government could have an adverse effect on the Company’s business, financial condition and results of operations.
Some of the Company’s business is transacted in Renminbi (“RMB”), which is not freely convertible into foreign currencies. On January 1, 1994, the PRC government abolished the dual rate system and introduced a single rate of exchange as quoted daily by the People’s Bank of China. However, the unification of the exchange rates does not imply the convertibility of RMB into United States dollars or other foreign currencies. All foreign exchange transactions continue to take place either through the Bank of China or other banks authorized to buy and sell foreign currencies at the exchange rates quoted by the Bank of China. Approval of foreign currency payments by the Bank of China or other institutions requires submitting a payment application form together with suppliers’ invoices, shipping documents and signed contracts.
23. SHARE CAPITAL
Pursuant to the Articles of Association of the Company, each Class A common share is entitled to one vote on all matters upon which the Class A common share is entitled to vote. The Board of Directors has the authority, without further action by the shareholders, to issue up to five million preferred shares in one or more series and to fix the designations, powers preference, privileges and relative participatory, optional or special rights and the qualifications, limitation or restrictions thereof, including dividend rights, conversion rights, voting rights, terms of redemption and liquidation preferences, any or all of which may be greater than the rights of common shares. No preferred shares have been issued.
On January 20, 2000, the Company completed its secondary offering of 6,975,000 Class A common shares at an offering price of USD42.5 per share. In January 2000, the underwriters exercised their over-allotment options and purchased an additional 651,000 shares at the offering price of USD42.5 per share. The net proceeds from the secondary offering to the Company were approximately USD303,844.
On July 26, 2000, Lehman Brothers Inc. fully exercised its warrants to purchase 800,000 Class A common shares at an exercise price of USD5 per share of the Company.
During the year ended December 31, 2000, 1,525,757 Class A common shares were issued at prices ranging from USD1.25 to USD11.9688 from the exercise of stock options granted to employees. In addition, 1,854,515 Class A common shares were issued at prices ranging from USD5 to USD64.6811 per share for the acquisitions of its subsidiaries and for the settlement of the contingent considerations relating to certain prior year acquisitions.
F-39
Table of Contents
chinadotcom corporation
NOTES TO CONSOLIDATED FINANCIAL STATEMENTS
(Amounts in thousands, except number of shares, number of options and per share data)
23. SHARE CAPITAL (continued)
During the year ended December 31, 2000, 22,484 Class A common shares were issued at a price of USD53.25 per share for the acquisition of equity investees, 1,504,438 Class A common shares were issued at prices ranging from USD15.625 to USD40.5 per share for the acquisition of available-for-sale equity securities and cost investments, 495,900 Class A common shares were issued at USD13.7124 as a prepayment for the acquisition of a subsidiary, 486,529 Class A common shares were issued at prices from 15.3253 to 17.9375 as the settlement of promissory notes and 20,685 Class A common shares were issued at prices ranging from USD17.10 to USD56.00 as the settlement of other payables.
During the year ended December 31, 2000, 117,599 Class A common shares were issued pursuant to the agreement for the acquisition of the Web Connection at prices ranging from USD7.25 to USD17.625 per share to an employee. Accordingly, a stock compensation expense of approximately USD1,974 was charged to the statement of operations of the Company for the year ended December 31, 2000.
During the year ended December 31, 2001, 91,426 Class A common shares were issued at prices ranging from USD1.75 to USD6.8125 per share from the exercise of stock options granted to employees.
During the year ended December 31, 2001, 521,589 Class A common shares were issued at a price of USD5.8125 per share as settlement of promissory notes and 273,198 Class A common shares were issued at a price of USD16.3516 per share as settlement of other payables. In addition, 23,084 Class A common shares were redeemed and retired at a price of USD2.35 per share arising from the disposal of an equity investee. The redemption premium was deducted from the additional paid-in capital.
During the year ended December 31, 2002, 296,492 Class A common shares were issued at prices ranging from USD2.03 to USD2.5266 per share from the exercise of stock options granted to employees.
During the year ended December 31, 2002, 1,764,555 Class A common shares were repurchased at prices ranging from USD1.92 to USD3.24 per share. 1,692,001 of the repurchased Class A common shares were retired at prices ranging from USD2.334 to USD2.826 per share. The redemption premium was deducted from the additional paid-in capital.
24. STOCK-BASED COMPENSATION AND WARRANTS
| (a) | Stock options |
The Company applies APB 25 in accounting for stock options granted to employees. Accordingly, the compensation expense is recorded for the difference between the fair value of shares at date of grant and the option price.
F-40
Table of Contents
chinadotcom corporation
NOTES TO CONSOLIDATED FINANCIAL STATEMENTS
(Amounts in thousands, except number of shares, number of options and per share data)
24. STOCK-BASED COMPENSATION AND WARRANTS (continued)
| (a) | Stock options (continued) |
Pursuant to the 1999 Stock Option Plan (the “Plan”), options may be granted to employees of and consultants and advisors to the Company and its subsidiaries for the purchase of up to an aggregate of 12 million Class A common shares. During 2000, an additional 8 million Class A common shares options were made available, which increased the options available for grant to employees of and consultants and advisors to the Company and its subsidiaries for the purchase of Class A common shares to 20 million. The Plan is administered by a committee of the Board of Directors, which will determine, in its discretion, the number of shares subject to each option granted and the related purchase price and option period. Incentive stock options, as defined by the U.S. Internal Revenue Code of 1986, as amended, and non-qualified stock options may be granted under the Plan.
A summary of the Company’s stock option activity, and related information for the years ended December 31, is as follows:
| 2001 | 2002 | |||||||||||||||||||||||
| Weighted- | Weighted- | |||||||||||||||||||||||
| average | average | |||||||||||||||||||||||
| Available | Options | exercise | Available | Options | exercise | |||||||||||||||||||
| for grant | outstanding | price | for grant | outstanding | price | |||||||||||||||||||
| (Number) | (Number) | USD | (Number) | (Number) | USD | |||||||||||||||||||
| Outstanding at the beginning of the year | 4,726,108 | 16,429,577 | 11.36 | 6,998,268 | 14,065,911 | 6.66 | ||||||||||||||||||
| Granted | (5,740,965 | ) | 5,740,965 | 2.88 | (1,648,960 | ) | 1,648,960 | 2.44 | ||||||||||||||||
| Forfeited | 8,013,125 | (8,013,125 | ) | 13.63 | 4,083,536 | (4,083,536 | ) | 7.89 | ||||||||||||||||
| Exercised | — | (91,426 | ) | 3.05 | — | (296,492 | ) | 2.42 | ||||||||||||||||
| Outstanding at the end of the year | 6,998,268 | 14,065,991 | 6.66 | 9,432,844 | 11,334,843 | 5.94 | ||||||||||||||||||
| Exercisable at the end of the year | 6,177,211 | 7,686,104 | ||||||||||||||||||||||
| Weighted-average fair value of options granted during the year | 2.53 | 2.00 | ||||||||||||||||||||||
The Company’s stock options are exercisable at exercise prices ranging between USD1.86 to USD73.4375 per share (inclusive).
F-41
Table of Contents
chinadotcom corporation
NOTES TO CONSOLIDATED FINANCIAL STATEMENTS
(Amounts in thousands, except number of shares, number of options and per share data)
24. STOCK-BASED COMPENSATION AND WARRANTS (continued)
| (a) | Stock options (continued) |
The following table summarizes information concerning outstanding and exercisable options at December 31, 2002.
| Options outstanding | Options exercisable | |||||||||||||||||||
| Weighted | Weighted | Weighted | ||||||||||||||||||
| average | average | average | ||||||||||||||||||
| remaining | exercise | exercise | ||||||||||||||||||
| Exercise | Numbers | contractual | price | Numbers | price | |||||||||||||||
| price range | outstanding | life (in years) | per share | exercisable | per share | |||||||||||||||
| USD | USD | USD | ||||||||||||||||||
| $1.86-2.7 | 2,926,473 | 8.88 | 2.32 | 1,302,837 | 2.43 | |||||||||||||||
| $2.71-3.375 | 3,356,159 | 7.57 | 3.13 | 2,362,626 | 3.20 | |||||||||||||||
| $3.55-5 | 2,366,922 | 6.77 | 4.83 | 2,266,287 | 4.86 | |||||||||||||||
| $5.0625-9.62 | 1,442,413 | 7.63 | 7.28 | 899,234 | 7.39 | |||||||||||||||
| $10.1875-19.5469 | 792,010 | 7.19 | 14.50 | 524,695 | 14.34 | |||||||||||||||
| $20.4375-29.9219 | 214,851 | 7.38 | 24.84 | 183,470 | 24.59 | |||||||||||||||
| $30.2625-39.5 | 55,180 | 7.08 | 36.29 | 36,418 | 36.35 | |||||||||||||||
| $40.5-48.405 | 76,080 | 7.11 | 46.07 | 51,788 | 46.12 | |||||||||||||||
| $51-58.5625 | 90,680 | 7.24 | 52.76 | 49,163 | 53.03 | |||||||||||||||
| $60.75-73.4375 | 14,075 | 7.16 | 65.87 | 9,586 | 65.81 | |||||||||||||||
| 11,334,843 | 7,686,104 | |||||||||||||||||||
Pursuant to resolutions adopted by the Board of Directors in December 2000, the vesting of certain of the Company’s options were accelerated such that vesting would be changed from an annual basis to a quarterly basis upon the lapse of twelve months from the date of grant. Based on the historical and expected employee turnover and the expected market price of the Class A common shares, the Company estimated that the number of options the employees will ultimately retain that would have been otherwise forfeited was minimal for the year ended December 31, 2001 and 2002.
The Company applies APB 25 in accounting for stock options granted to employees. Accordingly, the compensation expense is recorded for the difference between the fair value of shares at date of grant and the option price. For the year ended December 31, 2000, a total stock compensation expense of USD5,083 was recognized in the financial statements. For the purpose of determining the fair value of the options under SFAS 123, the Company used the Black-Scholes model based on the United States risk-free interest rate ranging from 5.17% to 6.69%, a weighted average expected option life of 5 years, assuming volatility factors of the expected price of the Company’s common stock ranging from 38% to 167% and no dividends.
F-42
Table of Contents
chinadotcom corporation
NOTES TO CONSOLIDATED FINANCIAL STATEMENTS
(Amounts in thousands, except number of shares, number of options and per share data)
24. STOCK-BASED COMPENSATION AND WARRANTS (continued)
| (a) | Stock options (continued) |
For the year ended December 31, 2001, a total stock compensation expense of USD2,552 was recognized in the financial statements. For the purpose of determining the fair value of the options under SFAS 123, the Company used the Black-Scholes model based on the United States risk-free interest rate ranging from 3.91% to 6.69%, a weighted average expected option life of 5 years, assuming volatility factors of the expected price of the Company’s common stock ranging from 38% to 167% and no dividends.
For the year ended December 31, 2002, a total stock compensation expense of USD309 was recognized in the financial statements. For the purpose of determining the fair value of the options under SFAS 123, the Company used the Black-Scholes model based on the United States risk-free interest rate ranging from 2.65% to 6.69%, a weighted average expected option life of 5 years, assuming volatility factors of the expected price of the Company’s common stock ranging from 38% to 167% and no dividends. Had the Company determined compensation cost based on the fair value at the grant date for its stock options under SFAS 123, the Company’s net income would have been reduced as indicated below:
| Year ended | Year ended | Year ended | ||||||||||
| December 31, | December 31, | December 31, | ||||||||||
| 2000 | 2001 | 2002 | ||||||||||
| USD | USD | USD | ||||||||||
| Net loss: | ||||||||||||
| As reported | (59,802 | ) | (124,385 | ) | (18,231 | ) | ||||||
| Pro forma | (102,243 | ) | (152,783 | ) | (33,846 | ) | ||||||
| Net loss per share: | ||||||||||||
| As reported | (0.61 | ) | (1.21 | ) | (0.18 | ) | ||||||
| Pro forma | (1.04 | ) | (1.49 | ) | (0.33 | ) | ||||||
During 2000, 104,469 of the Company’s options with exercise prices ranging from USD2.21 to USD28.58 per share were issued in connection with the acquisition of investments in DAE and XT3.
In 2001, 95,369 options were settled by USD1,383 discretionary cash settlements to the shareholder.
In January 2002, the Company granted to APOL additional stock options to purchase up to 200,000 Class A common shares as of January 1, 2002 with an exercise price of USD2.82 per share and a quarterly vesting schedule over the one-year term of the new services agreement and the right to accelerate existing share options upon a change of control of the Company.
F-43
Table of Contents
chinadotcom corporation
NOTES TO CONSOLIDATED FINANCIAL STATEMENTS
(Amounts in thousands, except number of shares, number of options and per share data)
24. STOCK-BASED COMPENSATION AND WARRANTS (continued)
| (b) | 2000 and 2001 Employee Share Purchase Plan |
During each of 2000 and 2001, the Company established and implemented an employee share purchase plan, which was qualified as a non-compensatory plan under Section 423 of the Internal Revenue Code. The plan allows qualified employees to purchase the Company’s Class A common shares during the relevant six-month plan period. Qualifying employees are allowed to purchase up to 500 Class A common shares for each plan period. The maximum number of Class A common shares, par value US$0.00025 per share, issuable under the plan is 500,000, and a maximum of 100,000 shares will be available for issuance for each plan period.
| (c) | Warrants |
In connection with the private placement of 6,795,200 Class A common shares issued to AOL on June 8, 1999, warrants were granted to AOL to purchase, subject to certain conditions, up to 18.5% and 6.5% of the Company’s total outstanding capital at an exercise price of USD5.00 per share and USD42.50 per share, respectively. The first and the second of these warrants became exercisable in October 2000 and in July 2001, respectively. Both warrants will expire in July 2003. At December 31, 2002, these warrants were not exercised.
On June 22, 1999, 800,000 warrants were granted to Lehman Brothers Inc., the private placement agent of the Company, as compensation for private placements completed from April to June 1999. On July 26, 2000, these warrants were fully exercised at an exercise price of USD5 per share.
In May 2000, GE Capital Equity Investments Ltd., (“GE”), was granted a warrant under which GE will be entitled to purchase a number of Class A common shares determined according to the Company’s revenue from services provided to affiliates of General Electric Capital Corporation during 2000 and 2001. The warrants are exercisable during the period between January 5, 2002 and January 4, 2003 at an exercise price of USD39.5 per share. As of December 31, 2002, no warrant was exercised.
All warrants may not be sold, transferred, assigned, or hypothecated to any person, other than to any limited partnership with the same general partner, or to any company that directly, or indirectly, controls or is controlled by or is under common control with the holder of the warrants, without the prior consent of the Company.
F-44
Table of Contents
chinadotcom corporation
NOTES TO CONSOLIDATED FINANCIAL STATEMENTS
(Amounts in thousands, except number of shares, number of options and per share data)
25. CONTINGENCIES AND COMMITMENTS
Operating lease commitments
As of December 31, 2002, the Company had future minimum office rental and telephone line lease payments under non-cancelable operating leases as follows:
| Year ended December 31: | USD | |||
| 2003 | 1,544 | |||
| 2004 | 224 | |||
| 1,768 | ||||
As of December 31, 2002, the Company had future commitments to purchase additional shareholdings in three subsidiaries for an aggregate of USD986 and additional consideration based on the future revenues, gross margins and/or operating results of the subsidiaries. The commitments shall be settled by cash and/or shares of the Company.
Class action lawsuit against chinadotcom
A class action lawsuit was filed in the United States District Court, Southern District of New York on behalf of purchasers of the securities of chinadotcom, between July 12, 1999 and December 6, 2000, inclusive. The complaint charges defendants chinadotcom, Lehman Brothers, Inc. (“Lehman Brothers”), Bear, Stearns & Co., Inc. (“Bear Stearns”), BancBoston Robertson Stephens (“Robertson Stephens”), Merrill Lynch, Pierce Fenner & Smith Inc. (“Merrill Lynch”), Raymond Ch’ien, Peter Yip, Zhou Shun Ao, and David Kim with violations of Sections 11, 12(a) (2) and 15 of the Securities Act of 1933 and Section 10(b) of the Securities Exchange Act of 1934 and Rule 10b-5 promulgated thereunder.
On or about July 12, 1999, chinadotcom commenced an initial public offering of 4.2 million of its shares of common stock at an offering price of US$20 per share (the “chinadotcom IPO”). In connection therewith, chinadotcom filed a registration statement, which incorporated a prospectus (the “Prospectus”), with the SEC. The complaint further alleges that the Prospectus was materially false and misleading because it failed to disclose, among other things, that (i) the Underwriter Defendants (Lehman Brothers, Bear Stearns, Robertson Stephens and Merrill Lynch) had solicited and received excessive and undisclosed commissions from certain investors in exchange for which the Underwriter Defendants allocated to those investors material portions of the restricted number of chinadotcom shares issued in connection with the chinadotcom IPO; and (ii) the Underwriter Defendants had entered into agreements with customers whereby the Underwriter Defendants agreed to allocate chinadotcom shares to those customers in the chinadotcom IPO in exchange for which the customers agreed to purchase additional chinadotcom shares in the aftermarket at pre-determined prices.
F-45
Table of Contents
chinadotcom corporation
NOTES TO CONSOLIDATED FINANCIAL STATEMENTS
(Amounts in thousands, except number of shares, number of options and per share data)
25. CONTINGENCIES AND COMMITMENTS (continued)
Class action lawsuit against chinadotcom (continued)
The class action lawsuit against each of Raymond Ch’ien, Peter Yip, Zhou Shun Ao, and David Kim has been dismissed. The management considered the outcome of any judgment on the lawsuit with respect to the Company as quite uncertain and any expenditure from the lawsuit is not estimable. Consequently, no provision has been made for any expenses that may arise on the class action lawsuit.
Panpac Media.com Limited (“Panpac”) Lawsuit
In February 2000, the Company acquired a minority interest in Panpac, a publisher listed in Singapore Stock Exchange in exchange for 593,224 Class A common shares of the Company pursuant to the Equity Exchange and Option Agreement (the “Agreement”) between Panpac and a subsidiary of the Company. In February 2003, Panpac served such subsidiary of the Company with a writ with respect to a breach of contract claim under the Agreement. The Company is contesting this lawsuit and has filed a defense to this writ. The management considered the outcome of the judgment on and the expenditures from the lawsuit to be quite uncertain. Therefore, no provision was made for any losses that may arise on the Panpac lawsuit.
e-Asia Sdn. Bhd. (“e-Asia”) Lawsuit
Mezzo Marketing Limited (“Mezzo”), a subsidiary of the Company, entered into a sales and purchase agreement (the “e-Asia Agreement”) with Khoo Sin Aik and e-Planet Sdn Bhd.(“e-Planet”) to acquire up to 100% (equal to 250,000 shares) of e-Asia Sdn. Bhd. (“e-Asia”) on November 2, 1999. On November 30, 1999, Mezzo acquired 60% of e-Asia in the form of 22,644 Class A common shares of the Company for a consideration of USD1,268. The agreement further stated that provided that certain performance targets were achieved by e-Asia, Mezzo would acquire the remaining 40% of e-Asia through the issuance of the Company’s shares as well as provide contingent consideration in Company’s shares if certain revenue criteria are met by e-Asia. e-Planet filed a petition in Cayman Islands against the Company for an amount of USD2,340 on October 15, 2002 with respect to the Company share consideration that it alleges it is owed under the e-Asia Agreement.
In addition, the Company is a defendant in various matters of litigation generally arising out of the normal course of business. Although it is difficult to predict the ultimate outcome of these cases, management believes, based on discussions with counsel, that any ultimate liability would not materially affect the Company’s financial position, result of operations or cash flows.
F-46
Table of Contents
chinadotcom corporation
NOTES TO CONSOLIDATED FINANCIAL STATEMENTS
(Amounts in thousands, except number of shares, number of options and per share data)
26. SEGMENTAL INFORMATION
| Description of Products and Services by Segment |
The Company has three reportable segments: e-business Solutions services, advertising services and sales of IT products. The Company’s e-business Solutions services mainly represent Web site design, hosting and maintenance services and Internet strategy consultancy services for companies seeking to utilize the Internet to facilitate their business processes online. The Company’s advertising services involve the provision of online advertising through the sale of advertisements for the network of Web sites, electronically delivering such advertisements and tracking the number of such advertisements delivered, and offline advertising and marketing services. The Company’s sale of IT products mainly represents the distribution of computer hardware and software products.
| Measurement of Segment Profit or Loss and Segment Assets |
The Company evaluates performance and allocates resources based on revenues and gross margins from operations. Revenues and gross margins for the three reportable segments are reported separately for internal purposes, but selling, general and administrative expenses, other operating expenses, net loss and assets and liabilities are not reported separately for each segment because this information is not produced internally. The accounting policies of the reportable segments are the same as those described in the summary of significant accounting policies.
| Factors Management Used to Identify the Enterprise’s Reportable Segments |
The Company’s reportable segments are business units that offer different services. The reportable segments are each managed separately. Revenue from segments in the other category is mainly attributable to publishing and event organizing services. Neither of these segments has ever met the quantitative thresholds for determining reportable segments.
| Year ended | Year ended | Year ended | ||||||||||
| December 31, | December 31, | December 31, | ||||||||||
| 2000 | 2001 | 2002 | ||||||||||
| USD | USD | USD | ||||||||||
| Revenues by segment | ||||||||||||
| e-business Solutions | 61,327 | 32,591 | 23,003 | |||||||||
| Advertising | 43,769 | 5,641 | 28,250 | |||||||||
| Sale of IT products | 3,276 | 4,580 | 4,631 | |||||||||
| Other income | 1,296 | 5,899 | 3,418 | |||||||||
| 109,668 | 64,474 | 59,302 | ||||||||||
| Long-lived assets by segment | ||||||||||||
| e-business Solutions | 52,125 | 13,131 | 7,522 | |||||||||
| Advertising | 7,408 | 5,641 | 5,977 | |||||||||
| Sale of IT products | 727 | 2,138 | 7,148 | |||||||||
| Other income | 10,095 | 6,808 | 1,517 | |||||||||
| Corporate | — | 17,092 | 16,207 | |||||||||
| 70,355 | 44,810 | 38,371 | ||||||||||
F-47
Table of Contents
chinadotcom corporation
NOTES TO CONSOLIDATED FINANCIAL STATEMENTS
(Amounts in thousands, except number of shares, number of options and per share data)
26. SEGMENTAL INFORMATION (continued)
| Geographic information is provided below: |
| Year ended | Year ended | Year ended | ||||||||||
| December 31, | December 31, | December 31, | ||||||||||
| 2000 | 2001 | 2002 | ||||||||||
| USD | USD | USD | ||||||||||
| Revenue: | ||||||||||||
| Australia | 728 | 1,711 | 3,003 | |||||||||
| Greater China | 59,691 | 25,027 | 18,150 | |||||||||
| North Asia | 31,163 | 18,976 | 25,449 | |||||||||
| South Asia | 7,406 | 9,918 | 5,702 | |||||||||
| United Kingdom | 2,247 | 2,911 | 1,750 | |||||||||
| United States | 8,433 | 5,931 | 5,248 | |||||||||
| Total revenue | 109,668 | 64,474 | 59,302 | |||||||||
| Long-lived assets: | ||||||||||||
| Australia | 1,122 | 974 | 339 | |||||||||
| Greater China | 65,871 | 39,586 | 34,136 | |||||||||
| North Asia | 1,673 | 498 | 235 | |||||||||
| South Asia | 1,032 | 855 | 789 | |||||||||
| United Kingdom | 206 | 2,633 | 2,738 | |||||||||
| United States | 451 | 264 | 134 | |||||||||
| Total long-lived assets | 70,355 | 44,810 | 38,371 | |||||||||
27. SUBSEQUENT EVENTS
On February 12, 2003, the Company acquired 100 percent of the outstanding common shares of Praxa Limited (“Praxa”). The results of Praxa’s operations will be included in the consolidated financial statements since that date. Praxa’s core business is the provision of information technology products and services in the form of outsourcing, application development and support, and system integration in Australia and Asia. As a result of the acquisition, the Company is expected to increase the number of potential clients for its low-cost China-based outsourcing platform and to extend the distribution of the Company’s own software products into the Australian marketplace.
The aggregate purchase price at maximum was approximately USD6,400 (AUD11,000) cash for 6,304,478 common shares of Praxa. The Company paid USD3,490 (AUD60,000) cash on the date of acquisition. The remaining USD2,910 (AUD5,000) payment of the maximum acquisition price is dependent on Praxa achieving earnings targets for the year ended December 31, 2003 and will be adjusted in accordance with terms stipulated in the share purchase agreement. An amount of USD2,327 (AUD4,000) has been placed in escrow until June 30, 2004 and a further USD582 (AUD1,000) until October 31, 2004 as security deposit.
F-48
Table of Contents
chinadotcom corporation
NOTES TO CONSOLIDATED FINANCIAL STATEMENTS
(Amounts in thousands, except number of shares, number of options and per share data)
27. SUBSEQUENT EVENTS (continued)
The following table summarizes the estimated fair values of the assets acquired and liabilities assumed at the date of acquisition. The Company is in the process of obtaining third-party valuations of certain intangible assets; thus, the allocation of the purchase price is subject to refinement.
| At February 12, 2003 | USD | |||
| Current assets | 4,935 | |||
| Property, plant and equipment, net | 985 | |||
| Other assets | 863 | |||
| Goodwill | 5,117 | |||
| Total assets acquired | 11,900 | |||
| Current liabilities | (5,938 | ) | ||
| Long-term debt | (2,472 | ) | ||
| Total liabilities assumed | (8,410 | ) | ||
| Net assets acquired | 3,490 | |||
The USD5,117 (AUD8,795) of goodwill was assigned to Sale of IT products segment in total. Of that total amount, USD1,627 (AUD2,795) is expected to be deductible for tax purposes.
F-49
Table of Contents
INDEX TO EXHIBITS
| No. | Description | Page | ||
| 1.1 | Conformed copy of the Amended and Restated Memorandum of Association.******* | |||
| 1.2 | Conformed copy of the Amended and Restated Articles of Association.******* | |||
| 2.1 | 1999 Employee Stock Option Plan, as amended.* | |||
| 2.2 | 2000 Employee Share Purchase Plan.** | |||
| 2.3 | 2001 Employee Share Purchase Plan.***** | |||
| 4.(a).1 | Amended and Restated Support Services Agreement dated April 1, 2000 by and between China Internet Corporation Limited and chinadotcom corporation.**** | |||
| 4.(a).2 | Agreement dated March 12, 2001 by and between China Internet Corporation Limited and chinadotcom corporation.**** | |||
| 4.(a).3 | Agreement dated March 13, 2001 by and between China Internet Corporation Limited and chinadotcom corporation.**** | |||
| 4.(a).4 | Guarantee Agreement dated April 4, 2001 by chinadotcom corporation in favor of hongkong.com Limited.**** | |||
| 4.(a).5 | Asset Purchase Agreement dated October 24, 2001 between China Internet Corporation Limited and chinadotcom Strategic, Inc.****** | |||
| 4.(b).1 | 24/7 Media-Asia Agreement dated August 24, 2000 by and among 24/7 Media, Inc, 24/7 Media-Asia Ltd., Sift, Inc. and China Internet Corporation.*** | |||
| 4.(b).2 | Equity Exchange Agreement dated August 24, 2000 by and among chinadotcom corporation, 24/7 Media-Asia Ltd. and 24/7 Media, Inc.*** | |||
| 4.(c)1 | Executive Services Agreement dated April 27, 2001, by and between chinadotcom corporation and Raymond Ch’ien.**** | |||
| 4.(c)2 | Executive Services Agreement effective as of January 1, 2002, by and between chinadotcom corporation and Asia Pacific Online Limited.****** | |||
| 6 | Details of how EPS information is calculated can be found in Note 19 to our Consolidated Financial Statements. | |||
| 8 | List of principal subsidiaries of the Company. | |||
| 12.1 | Certification of Chief Executive Officer required by Rule 13a-14(a) | |||
| 12.2 | Certification of Chief Financial Officer required by Rule 13a-14(a) | |||
| 13.(a).1 | Certification of Chief Executive Officer pursuant to 18 U.S.C. Section 1350, as adopted pursuant to Section 906 of the Sarbanes-Oxley Act of 2002 | |||
| 13.(a).2 | Certification of Chief Financial Officer pursuant to 18 U.S.C. Section 1350, as adopted pursuant to Section 906 of the Sarbanes-Oxley Act of 2002 |
| * | Incorporated by reference to our registration statement on Form S-8 (File No.: 333-12966) filed with the Commission on December 7, 2000. |
Table of Contents
| ** | Incorporated by reference to our registration statement on Form S-8 (File No.: 333-12958) filed with the Commission on December 7, 2000. | |
| *** | Incorporated by reference to our registration statement on Form F-3 (File No. 333-12674) filed with the Commission on October 3, 2000. | |
| **** | Incorporated by reference to our annual report on Form 20-F (File No. 000-30134) filed with the Commission on May 10, 2001. | |
| ***** | Incorporated by reference to our current report on Form 6-K (File No. 000-30134) filed with the Commission on February 28, 2002. | |
| ****** | Incorporated by reference to our annual report of Form 20-F (File No. 000-30134) filed with the Commission on June 11, 2002. | |
| ******* | Incorporated by reference to our current report on Form 6-K (File No. 000-30134) filed with the Commission on September 18, 2002. |