UNITED STATES
SECURITIES AND EXCHANGE COMMISSION
WASHINGTON, D.C. 20549
FORM 10-Q
x QUARTERLY REPORT PURSUANT TO SECTION 13 OR 15(d) OF THE SECURITIES EXCHANGE ACT OF 1934
For the quarterly period ended June 30, 2009
or
o TRANSITION REPORT PURSUANT TO SECTION 13 OR 15(d) OF THE SECURITIES EXCHANGE ACT OF 1934
For the transition period from ____ to _____
Commission File Number: 000-28767
China 3C Group
(Exact name of registrant as specified in its charter)
| Nevada | 88-0403070 |
| (State or other jurisdiction of incorporation or organization) | (I.R.S. Employer Identification No.) |
368 HuShu Nan Road
HangZhou City, Zhejiang Province, China 310014
(Address of principal executive offices) (Zip Code)
086-0571-88381700
(Registrant’s telephone number, including area code)
(Former name, former address and former fiscal year, if changed since last report)
Indicate by check whether the registrant (1) has filed all reports required to be filed by Section 13 or 15(d) of the Securities Exchange Act of 1934 during the preceding 12 months (or for such shorter period that the registrant was required to file such reports), and (2) has been subject to such filing requirements for the past 90 days: Yes x No o
Indicate by check mark whether the registrant has submitted electronically and posted on its corporate Web site, if any, every Interactive Data File required to be submitted and posted pursuant to Rule 405 of Regulation S-T (§232.405 of this chapter) during the preceding 12 months (or for such shorter period that the registrant was required to submit and post such files). Yes o No o
Indicate by check mark whether the registrant is a large accelerated filer, an accelerated filer, a non-accelerated filer, or a smaller reporting company. See the definitions of “large accelerated filer,” “accelerated filer” and “smaller reporting company” in Rule 12b-2 of the Exchange Act.
Large accelerated filer o Accelerated filer x Non-accelerated filer (Do not check if a smaller reporting company) o Smaller reporting company o
Indicate by check mark whether the registrant is a shell company (as defined in Rule 12b-2 of the Exchange Act). Yes o No x
As of August 12, 2009 the registrant had 53,931,327 shares of common stock outstanding.
TABLE OF CONTENTS
| | PAGE |
| PART I. FINANCIAL INFORMATION | |
| | |
| Item 1. Financial Statements: | |
| | |
| Consolidated Balance Sheets as of June 30, 2009 (Unaudited) and December 31, 2008 | 1 |
| | |
| Consolidated Statements of Income for the Six Months Ended June 30, 2009 and 2008 (Unaudited) | 2 |
| | |
| Consolidated Statements of Income for the Three Months Ended June 30, 2009 and 2008 (Unaudited) | 3 |
| | |
| Consolidated Statements of Cash Flows for the Six Months Ended June 30, 2009 and 2008 (Unaudited) | 4 |
| | |
| Notes to Consolidated Financial Statements | 5 |
| | |
| Item 2. Management’s Discussion and Analysis of Financial Condition and Results of Operations | 20 |
| | |
| Item 3. Quantitative and Qualitative Disclosure About Market Risk | 27 |
| | |
| Item 4. Controls and Procedures | 28 |
| | |
| PART II. OTHER INFORMATION | |
| | |
| Item 1. Legal Proceedings | 29 |
| | |
| Item 1A. Risk Factors | 29 |
| | |
| Item 2. Unregistered Sales of Equity Securities and Use of Proceeds | 29 |
| | |
| Item 3. Defaults Upon Senior Securities | 29 |
| | |
| Item 4. Submission of Matters to a Vote of Security Holders | 29 |
| | |
| Item 5. Other Information | 29 |
| | |
| Item 6. Exhibits | 29 |
| | |
| Signatures | 30 |
PART I. FINANCIAL INFORMATION
Item 1. Financial Statements
CHINA 3C GROUP AND SUBSIDIARIES
CONSOLIDATED BALANCE SHEETS
| | | June 30, | | | December 31, | |
| | | 2009 | | | 2008 | |
| | | (Unaudited) | | | (Audited) | |
| ASSETS | | | | | | |
| | | | | | | |
| Current assets: | | | | | | |
| Cash and cash equivalents | | $ | 25,448,256 | | | $ | 32,157,831 | |
| Accounts receivable, net | | | 24,481,068 | | | | 23,724,587 | |
| Inventories | | | 9,377,825 | | | | 8,971,352 | |
| Advances to suppliers | | | 2,337,541 | | | | 2,491,518 | |
| Prepaid expenses and other current assets | | | 27,161 | | | | 87,773 | |
| Total current assets | | | 61,671,851 | | | | 67,433,061 | |
| Property, plant and equipment, net | | | 55,513 | | | | 64,100 | |
| Goodwill | | | 20,348,278 | | | | 20,348,278 | |
| Deposit for acquisition of subsidiary | | | 14,609,631 | | | | 7,318,501 | |
| Refundable deposits | | | 26,796 | | | | 32,076 | |
| Total assets | | $ | 96,712,069 | | | $ | 95,196,016 | |
| | | | | | | | | |
| LIABILITIES AND STOCKHOLDERS' EQUITY | | | | | | | | |
| | | | | | | | | |
| Current liabilities: | | | | | | | | |
| Accounts payable and accrued expenses | | $ | 4,457,112 | | | $ | 5,417,327 | |
| Income tax payable | | | 391,887 | | | | 2,140,624 | |
| Total liabilities | | | 4,848,999 | | | | 7,557,951 | |
| | | | | | | | | |
| Stockholders' equity | | | | | | | | |
| Common stock, $0.001 par value, 100,000,000 million shares authorized, 53,931,327 and 52,673,938 issued and outstanding as of June 30, 2009 and December 31, 2008, respectively | | | 53,931 | | | | 52,674 | |
| Additional paid-in capital | | | 19,464,519 | | | | 19,465,776 | |
| Subscription receivable | | | (50,000 | ) | | | (50,000 | ) |
| Statutory reserve | | | 11,109,379 | | | | 11,109,379 | |
| Other comprehensive income | | | 5,143,453 | | | | 5,272,104 | |
| Retained earnings | | | 56,141,788 | | | | 51,788,132 | |
| Total stockholders' equity | | | 91,863,070 | | | | 87,638,065 | |
| Total liabilities and stockholders' equity | | $ | 96,712,069 | | | $ | 95,196,016 | |
The accompanying notes are an integral part of these consolidated financial statements.
CHINA 3C GROUP AND SUBSIDIARIES
CONSOLIDATED STATEMENTS OF INCOME AND COMPREHENSIVE INCOME
FOR THE SIX MONTHS ENDED JUNE 30, 2009 and 2008 (UNAUDITED)
| | | 2009 | | | 2008 | |
| Net sales | | $ | 128,537,496 | | | $ | 146,668,847 | |
| Cost of sales | | | 112,458,293 | | | | 123,246,750 | |
| Gross profit | | | 16,079,203 | | | | 23,422,097 | |
| Selling, general and administrative expenses | | | 10,235,495 | | | | 6,312,088 | |
| Income from operations | | | 5,843,708 | | | | 17,110,009 | |
| | | | | | | | | |
| Other (income) expense | | | | | | | | |
| Interest income | | | (54,072 | ) | | | (65,567 | ) |
| Gain on disposal | | | - | | | | (2,161 | ) |
| Other income | | | (162,786 | ) | | | (311,929 | ) |
| Other expense | | | 115,852 | | | | - | |
| Total other (income) expense | | | (101,006 | ) | | | (379,657 | ) |
| | | | | | | | | |
| Income before income taxes | | | 5,944,714 | | | | 17,489,666 | |
| Provision for income taxes | | | 1,591,058 | | | | 4,164,627 | |
| Net income | | | 4,353,656 | | | | 13,325,039 | |
| Foreign currency translation adjustments | | | (128,651 | ) | | | 2,822,640 | |
| Comprehensive income | | $ | 4,225,005 | | | $ | 16,147,679 | |
| | | | | | | | | |
| Net income available to common shareholders per share: | | | | | | | | |
| Basic | | $ | 0.08 | | | $ | 0.25 | |
| Diluted | | $ | 0.08 | | | $ | 0.25 | |
| | | | | | | | | |
| Weighted average shares outstanding: | | | | | | | | |
| Basic | | | 53,682,309 | | | | 52,673,938 | |
| Diluted | | | 53,682,309 | | | | 53,073,938 | |
The accompanying notes are an integral part of these consolidated financial statements.
CHINA 3C GROUP AND SUBSIDIARIES
CONSOLIDATED STATEMENTS OF INCOME AND COMPREHENSIVE INCOME
FOR THE THREE MONTHS ENDED JUNE 30, 2009 and 2008 (UNAUDITED)
| | | 2009 | | | 2008 | |
| Net sales | | $ | 51,125,936 | | | $ | 78,515,392 | |
| Cost of sales | | | 45,105,462 | | | | 65,639,675 | |
| Gross profit | | | 6,020,474 | | | | 12,875,717 | |
| Selling, general and administrative expenses | | | 4,749,219 | | | | 3,326,044 | |
| Income from operations | | | 1,271,255 | | | | 9,549,673 | |
| | | | | | | | | |
| Other (income) expense | | | | | | | | |
| Interest income | | | (24,964 | ) | | | (29,472 | ) |
| Gain on disposal | | | - | | | | (2,161 | ) |
| Other income | | | (14,659 | ) | | | (324,743 | ) |
| Other expense | | | 4,630 | | | | - | |
| Total other (income) expense | | | (34,993 | ) | | | (356,376 | ) |
| | | | | | | | | |
| Income before income taxes | | | 1,306,248 | | | | 9,906,049 | |
| Provision for income taxes | | | 392,167 | | | | 2,354,054 | |
| Net income | | | 914,081 | | | | 7,551,995 | |
| Foreign currency translation adjustments | | | 7,923 | | | | 1,222,591 | |
| Comprehensive income | | $ | 922,004 | | | $ | 8,774,586 | |
| | | | | | | | | |
| Net income available to common shareholders per share: | | | | | | | | |
| Basic | | $ | 0.02 | | | $ | 0.14 | |
| Diluted | | $ | 0.02 | | | $ | 0.14 | |
| | | | | | | | | |
| Weighted average shares outstanding: | | | | | | | | |
| Basic | | | 53,931,327 | | | | 52,673,938 | |
| Diluted | | | 53,931,327 | | | | 53,073,938 | |
The accompanying notes are an integral part of these consolidated financial statements.
CHINA 3C GROUP AND SUBSIDIARIES
CONSOLIDATED STATEMENTS OF CASH FLOWS
FOR THE SIX MONTHS ENDED JUNE, 2009 and 2008 (UNAUDITED)
| | | 2009 | | | 2008 | |
| | | | | | | |
| CASH FLOW FROM OPERATING ACTIVITIES | | | | | | |
| Net income | | $ | 4,353,656 | | | $ | 13,325,040 | |
| Adjustments to reconcile net income to net cash provided by (used in ) operating activities: | | | | | | | | |
| Depreciation | | | 13,300 | | | | 20,069 | |
| Gain on asset disposition | | | - | | | | (2,161 | ) |
| Provision for bad debts | | | 3,305 | | | | 17,445 | |
| Stock based compensation | | | - | | | | 226,293 | |
| (Increase) / decrease in assets: | | | | | | | | |
| Accounts receivable | | | (801,418 | ) | | | (11,039,822 | ) |
| Other receivable | | | 25,731 | | | | - | |
| Inventories | | | (423,551 | ) | | | (6,265,805 | ) |
| Prepaid expenses and other current assets | | | 34,775 | | | | 9,291 | |
| Refundable deposits | | | 5,208 | | | | (4,078 | ) |
| Advance to suppliers | | | 149,424 | | | | 94,151 | |
| (Increase) / decrease in current liabilities: | | | | | | | | |
| Accounts payable and accrued expenses | | | (893,234 | ) | | | 2,101,789 | |
| Income tax payable | | | (1,745,979 | ) | | | (255,625 | ) |
| Net cash provided by (used in) operating activities | | | 721,217 | | | | (1,773,413 | ) |
| | | | | | | | | |
| CASH FLOW FROM INVESTING ACTIVITIES | | | | | | | | |
| Purchase of property and equipment | | | (4,196 | ) | | | (10,650 | ) |
| Proceeds from asset sales | | | - | | | | 2,447 | |
| Deposit for acquisition of subsidiary | | | (7,291,130 | ) | | | - | |
| Net cash used in investing activities | | | (7,295,326 | ) | | | (8,203 | ) |
| | | | | | | | | |
| Effect of exchange rate changes on cash and cash equivalents | | | (135,466 | ) | | | 2,822,640 | |
| | | | | | | | | |
| Net increase (decrease) in cash | | | (6,709,575 | ) | | | 1,041,024 | |
| Cash, beginning of period | | | 32,157,831 | | | | 24,952,614 | |
| Cash, end of period | | $ | 25,448,256 | | | $ | 25,993,638 | |
| | | | | | | | | |
| Supplemental disclosure of cash flow information: | | | | | | | | |
| Interest paid | | $ | - | | | $ | - | |
| Income taxes paid | | $ | 3,339,755 | | | $ | 4,420,252 | |
The accompanying notes are an integral part of these consolidated financial statements.
CHINA 3C GROUP AND SUBSIDIARIES
NOTES TO CONDENSED CONSOLIDATED FINANCIAL STATEMENTS
JUNE 30, 2009
Note 1 - ORGANIZATION
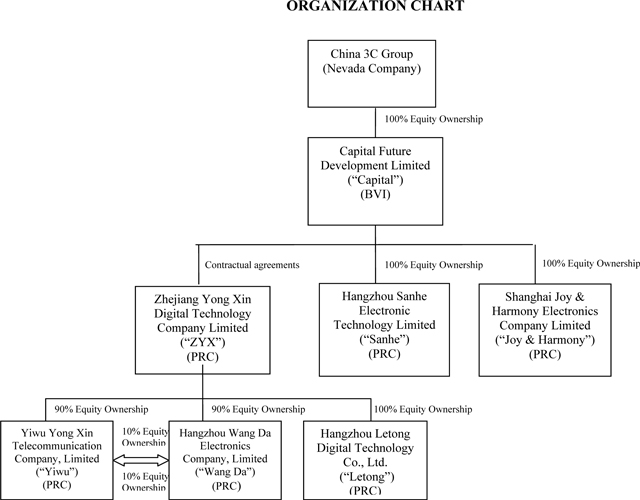
China 3C Group (the “Company”) was incorporated on August 20, 1998 under the laws of the State of Nevada. Capital Future Developments Limited - BVI (“Capital”) was incorporated on July 22, 2004 under the laws of the British Virgin Islands. Zhejiang Yong Xin Digital Technology Company Limited (“Zhejiang”), Yiwu Yong Xin Communication Limited (“Yiwu”), Hangzhou Wang Da Electronics Company Limited (“Wang Da”), Hangzhou Sanhe Electronic Technology Limited (“Sanhe”), and Shanghai Joy & Harmony Electronics Company Limited (“Joy & Harmony”) were incorporated under the laws of Peoples Republic of China (“PRC”) on July 11, 2005, July 18, 1997, March, 30, 1998, April 12, 2004, and August 20, 2003, respectively. On March 10, 2009 Zhejiang set up a new operating entity, Hangzhou Letong Digital Technology Co., Ltd. (“Letong”) to establish an electronic retail franchise operation for China 3C Group.
On December 21, 2005, Capital became a wholly- owned subsidiary of China 3C Group through a reverse merger (“Merger Transaction”). China 3C Group acquired all of the issued and outstanding capital stock of Capital pursuant to a Merger Agreement dated at December 21, 2005 by and among China 3C Group, XY Acquisition Corporation, Capital and the shareholders of Capital (the “Merger Agreement”). Pursuant to the Merger Agreement, Capital became a wholly owned subsidiary of China 3C Group and, in exchange for the Capital shares, China 3C Group issued 35,000,000 shares of its common stock to the shareholders of Capital, representing 93% of the issued and outstanding capital stock of China 3C Group at that time and a cash consideration of $500,000.
On August 3, 2006, Capital completed the acquisition of a 100% interest in Sanhe for a cash and stock transaction valued at approximately $8,750,000. The consideration consisted of 915,751 newly issued shares of the Company’s common stock and $5,000,000 in cash.
On November 28, 2006, Capital completed the acquisition of a 100% interest in Joy & Harmony for a cash and stock transaction valued at approximately $18,500,000. The consideration consisted of 2,723,110 shares of the Company’s common stock and $7,500,000 in cash.
On August 15, 2007, the Company changed its ownership structure. As a result, instead of Capital owning 100% of Zhejiang, Capital entered into contractual agreements with Zhejiang whereby Capital owns a 100% interest in the revenues of Zhejiang. Capital does not have an equity interest in Zhejiang, but enjoys all the economic benefits. Under this structure, Zhejiang is now a wholly foreign owned enterprise of Capital. The contractual agreements give Capital and its equity owners an obligation, and having ability to absorb, any losses, and rights to receive returns. Capital will be unable to make significant decisions about the activities of Zhejiang and cannot carry out its principal activities without financial support. These characteristics as defined in Financial Accounting Standards Board (“FASB”) Interpretation 46, Consolidation of Variable Interest Entities (VIEs), qualifies the business operations of Zhejiang to be consolidated with Capital and ultimately with China 3C Group. Zhejiang owns 90% of the issued and outstanding capital stock of each of Wang Da and Yiwu.
The Company is engaged in the business of resale and distribution of third party products and generates approximately 100% of our revenue from resale of items such as mobile phones, facsimile machines, DVD players, stereos, speakers, MP3 and MP4 players, iPods, electronic dictionaries, CD players, radio Walkmans and audio systems.
On December 19, 2008, China 3C Group’s subsidiaries, Zhejiang and Yiwu entered into an acquisition agreement (the “Jinhua Agreement”) with Jinhua Baofa Logistic Ltd., a company organized under the laws of the People’s Republic of China (“Jinhua”) and the shareholders of Jinhua, who own 100% of the equity interest in Jinhua in the aggregate. Pursuant to the Jinhua Agreement Zhejiang will acquire 90% and Yiwu will acquire 10% of the entire equity interests in Jinhua from the shareholders of Jinhua for a total purchase price of RMB 120,000,000 payable as follows: (i) RMB 50,000,000, within 10 business days after the execution of the Jinhua Agreement; (ii) RMB 50,000,000 within 10 business days following the completion of the audit of Jinhua’s financial statements for the fiscal year ending December 31, 2008, in accordance with generally accepted accounting principles in the U.S. (the “Audit”), which Audit shall be completed no later than March 31, 2009; and (iii) the remaining RMB 20,000,000 no later than three months after the completion of Jinhua’s Audit. The source of the cash used for the purchase of 100% of the equity of Jinhua was from working capital of China 3C Group.
Jinhua was founded in 2001 and is a well-known transportation logistics company in Eastern China and has been a long time transportation provider for China 3C Group. Jinhua has approximately 280 customers and operates a fleet of more than 70 trucks and transports freight including electronics, machinery and equipment, metal products, chemical materials, garments and handicraft goods, in more than 20 cities in Eastern China. Its transportation service covers many of the most developed cities in the Eastern China region such as Shanghai, Hangzhou and Nanjing.
On April 4, 2009, Zhejiang and Yiwu entered into an amendment to the Jinhua Agreement (the “Amended Agreement”) with the shareholders of Jinhua. The Amended Agreement changed from March 31, 2009 to June 30, 2009 the date by which the parties have agreed that the Audit is required to be completed. In the event that the audit is not completed by June 30, 2009, the Agreement may be terminated.
On July 6, 2009, Zhejiang and Yiwu completed the acquisition of Jinhua from the shareholders of Jinhua. The final installment of RMB 20,000,000 (approximately US $2,900,000) will be paid within 10 days of the filing of the amendment to the current report on Form 8-K dated July 6, 2009, which filing is expected to be made by the Company not later than 71 calendar days after July 6, 2009.
Note 2 - SUMMARY OF SIGNIFICANT ACCOUNTING POLICIES
Basis of Presentation
The accompanying consolidated financial statements have been prepared in conformity with accounting principles generally accepted in the United States of America (“US GAAP”). The Company’s functional currency is the Chinese Renminbi, however the accompanying consolidated financial statements have been translated and presented in United States Dollars.
Principles of Consolidation
The consolidated financial statements include the accounts of China 3C Group and its wholly owned subsidiaries Capital, Wang Da, Yiwu, Joy & Harmony, and Sanhe and variable interest entity Zhejiang, collectively referred to as the Company. All material intercompany accounts, transactions and profits have been eliminated in consolidation.
Currency Translation
The accounts of Zhejiang, Wang Da, Yiwu, Sanhe, and Joy & Harmony were maintained, and its financial statements were expressed, in Chinese Yuan Renminbi (“CNY”). Such financial statements were translated into U.S. Dollars (“USD”) in accordance with Statement of Financial Accounts Standards (“SFAS”) No. 52, “Foreign Currency Translation,” with the CNY as the functional currency. According to SFAS No. 52, all monetary assets and liabilities were translated at the ending exchange rate, non-monetary assets and stockholders’ equity are translated at the historical rates and income statement items are translated at the average exchange rate for the period. The resulting translation adjustments are reported as other comprehensive income in accordance with SFAS No. 130, “Reporting Comprehensive Income,” as a component of shareholders’ equity. Transaction gains and losses are reflected in the condensed consolidated income and comprehensive income statement.
Use of Estimates
The preparation of financial statements in conformity with US GAAP requires management to make estimates and assumptions that affect the reported amounts of assets and liabilities and disclosure of contingent assets and liabilities at the date of the financial statements and the reported amounts of revenues and expenses during the reporting period. Actual results could differ from those estimates.
Risks and Uncertainties
The Company is subject to substantial risks from, among other things, intense competition associated with the industry in general, other risks associated with financing, liquidity requirements, rapidly changing customer requirements, limited operating history, foreign currency exchange rates and the volatility of public markets.
Contingencies
Certain conditions may exist as of the date the financial statements are issued, which could result in a loss to the Company but which will only be resolved when one or more future events occur or fail to occur. The Company’s management assesses such contingent liabilities, and such assessment inherently involves an exercise of judgment. In assessing loss contingencies related to legal proceedings that are pending against the Company or unasserted claims that may result in such proceedings, the Company’s management evaluates the perceived merits of any legal proceedings or unasserted claims as well as the perceived merits of the amount of relief sought or expected to be sought.
If the assessment of a contingency indicates that it is probable that a material loss has been incurred and the amount of the liability can be estimated, then the estimated liability is accrued in the Company’s financial statements. If the assessment indicates that a potential material loss contingency is not probable but is reasonably possible, or is probable but cannot be estimated, then the nature of the contingent liability, together with an estimate of the range of possible loss if determinable and material would be disclosed.
Loss contingencies considered to be remote by management are generally not disclosed unless they involve guarantees, in which case the guarantee would be disclosed.
Accounts Receivable
The Company maintains reserves for potential credit losses on accounts receivable. Management reviews the composition of accounts receivable and analyzes historical bad debts, customer concentrations, customer credit worthiness, current economic trends and changes in customer payment patterns to evaluate the adequacy of these reserves. Terms of the sales vary. Reserves are recorded primarily on a specific identification basis. Allowance for doubtful debts was $365,363 (unaudited) and $365,318 as of June 30, 2009 and December 31, 2008, respectively.
Inventories
Inventories are valued at the lower of cost (determined on a weighted average basis) or market. Management compares the cost of inventories with the market value and allowance is made for writing down their inventories to market value, if lower. As of June 30, 2009 and December 31, 2008, inventory consisted entirely of finished goods valued at $9,377,825 (unaudited) and $8,971,352, respectively.
Property, Plant & Equipment, net
Property, plant and equipment are stated at cost. Expenditures for maintenance and repairs are charged to earnings as incurred; additions, renewals and betterments are capitalized. When property and equipment are retired or otherwise disposed of, the related cost and accumulated depreciation are removed from the respective accounts, and any gain or loss is included in operations. Depreciation of property and equipment is provided using the straight-line method for substantially all assets with estimated lives of:
| Automotive | 5 years |
| Office Equipment | 5 years |
As of June 30, 2009 and December 31, 2008, property and equipment consisted of the following:
| | | 2009 | | | 2008 | |
| | | (Unaudited) | | | | |
| Automotive | | $ | 134,060 | | | $ | 132,627 | |
| Office equipment | | | 119,980 | | | | 116,700 | |
| Sub Total | | | 254,040 | | | | 249,327 | |
| Less: accumulated depreciation | | | (198,527 | ) | | | (185,227 | ) |
| Total | | $ | 55,513 | | | $ | 64,100 | |
Long-Lived Assets
The Company periodically evaluates the carrying value of long-lived assets to be held and used in accordance with SFAS No. 144, “Accounting for the Impairment or Disposal of Long-Lived Assets” (“SFAS 144”). SFAS 144 requires impairment losses to be recorded on long-lived assets used in operations when indicators of impairment are present and the undiscounted cash flows estimated to be generated by those assets are less than the assets’ carrying amounts. In that event, a loss is recognized based on the amount by which the carrying amount exceeds the fair market value of the long-lived assets. Losses on long-lived assets to be disposed of are determined in a similar manner, except that fair market values are reduced for the cost of disposal. Based on its review, the Company believes that, as of June 30, 2009 and December 31, 2008, there were no significant impairments of its long-lived assets.
Fair Value of Financial Instruments
SFAS No. 107, “Disclosures about Fair Value of Financial Instruments,” requires the Company to disclose estimated fair values of financial instruments. The carrying amounts reported in the statements of financial position for current assets and current liabilities qualifying as financial instruments are a reasonable estimate of fair value.
Revenue Recognition
In accordance with Securities and Exchange Commission (“SEC”) Staff Accounting Bulletin (“SAB”) 104, the Company recognizes revenues when there is persuasive evidence of an arrangement, product delivery and acceptance have occurred, the sales price is fixed and determinable, and collectability of the resulting receivable is reasonably assured.
The Company records revenues when title and the risk of loss pass to the customer. Generally, these conditions occur on the date the customer takes delivery of the product. Revenue is generated from sales of consumer and business products through two main revenue streams:
| | 1. | Retail. Approximately 69%, 68%, 69% and 66% of the Company's revenue comes from sales to individual customers at outlets installed inside department stores etc. (i.e. store in store model) during the three and six months ended June 30, 2009 and 2008, respectively and is mainly achieved through two broad categories: |
| | a. | Purchase contracts. The terms for sales by purchase contracts have changed from 30 days to 45 days from the transfer of goods to the customer during the three months ended June 30, 2009. Under this method, the Company delivers goods to places designated by the customers and receives confirmation of delivery. At that time, ownership and all risks associated to the goods are transferred to the customers and payment is made within 45 days. The Company relieves its inventory and recognizes revenue upon receipt of confirmation from the customer. |
| | b. | Point of sale transfer of ownership. Under this method, the Company’s products are placed in third party stores and sold by the Company’s sales people. Upon purchase of the item by the customer, the Company relieves its inventory and recognizes revenue related to that item. |
| | 2. | Wholesale. Approximately 31% and 32%, 31% and 34% of the Company's revenue comes from wholesale during the three and six months ended June 30, 2009 and 2008, respectively. Recognition of wholesale income is based on the contract terms. During the three months ended June 30, 2009, the main contract terms on wholesale changed from 10 days to 15 days after receipt of goods and that ownership and all risks associated with the goods are transferred to the customers on the date of goods received. |
Sales revenue is therefore recognized on the following basis:
| | a. | For goods sold under sales and purchase contracts, revenue is recognized when goods are received by customers. |
| | b. | For goods at customer outlets which the Company’s sales people operate, and inventory of goods is under joint control by the customers and the Company, revenue is recognized at the point of sale to the end buyer. |
During public holidays or department store celebration periods, we provide certain sales incentives to retail customers to increase sales, such as gift giving and price reductions. These are the only temporary incentives during the specified periods. Sales made to our retail customers as a result of incentives are immaterial as a percentage of total sales revenue.
| | a. | Revenue is recognized at the date of goods are received by wholesale customers. We operate our wholesale business by selling large volume orders to second-tier distributors and large department stores. Revenues from wholesale are recognized as net sales after confirmation with distributors. Net sales already take into account revenue dilution as they exclude inventory credit, discount fro early payment, product obsolescence and return of products and other allowances. Net sales also take into account the return of products in accordance with relevant laws and regulations in China. |
Return policies
Our return policy complies with China’s laws and regulations on consumer’s rights and product quality. In accordance with Chinese law, consumers can return or exchange used products within seven days only if the goods do not meet safety and health requirements, endanger a person’s property, or do not meet the advertised performance. If the conditions and requirements as set out in the relevant laws and regulations are met, the retail stores are entitled to accept a return of the goods from the consumer. In such cases, the Company shall accept the returns unconditionally. Goods returned will be redirected to the production factory or supplier who shall bear all losses on the returns in accordance the laws and regulations. Consumer returns or exchanges of products that have not been used, where the packaging has not been damaged, are honored if such return or exchange is within seven days. If a consumer returns a product, the Company must refund the invoice price to the consumer. The Company will then be responsible for returning the goods to the production factory or supplier. At that time the Company can recover the price based on the purchase and sale contract with the producer or supplier. However, when goods are returned, the Company loses the gross margin that it records when revenue is recognized, regardless of whether the production factory or supplier takes the product back or not.
The return rights granted to wholesale customers are similar to the rights granted to retail customers. Once wholesale customers purchase the products, they follow the same return policy as retail customers. We do not honor any return from wholesale customers other than if the products don’t meet laws and regulations or quality requirements. If the wholesale customers have a high inventory level or product obsolescence caused by lower market demands or other operational issues, the wholesale customers bear their own losses. When a wholesale customer returns products, the Company will return the products to the suppliers or manufacturers. A sales return and allowance is recorded at the sales price. Meanwhile, a purchase return and allowance entry is recorded at the invoice price because the suppliers or manufacturers bear the losses. The net effect is that the Company derecognizes the gross profit when a return takes place, but does not record any loss on the cost of the returned item back to the supplier or manufacturer.
In light of the aforesaid PRC laws and regulations and the Company's arrangements with suppliers, we do not provide an accrual for any estimated losses on subsequent sale of the return of products. As a result we do not engage in assessing levels of inventory in the distribution channel, product obsolescence and/or introductions of new products, as none of those factors have any impact on us with respect to estimating losses on subsequent sale of returned goods. Third party market research report and consumer demand study is not used to make estimates of goods returned.
Cost of Sales
Cost of sales consists of actual product cost, which is the purchase price of the product less any discounts. Cost of sales excludes freight charges, purchase and delivery costs, internal transfer, freight charges and the other costs of the Company’s distribution network, which are identified in general and administrative expenses.
General and Administrative Expenses
General and administrative expenses are comprised principally of payroll and benefits costs for retail and corporate employees, occupancy costs of corporate facilities, lease expenses, management fees, traveling expenses and other operating and administrative expenses, including freight charges, purchase and delivery costs, internal transfer freight charges and other distribution costs.
Shipping and handling fees
The Company follows Emerging Issues Task Force (“EITF”) No. 00-10, Accounting for Shipping and Handling Fees and Costs. The Company does not charge its customers for shipping and handling. The Company classifies shipping and handling fees as part of General and administrative expenses. During the three and six months ended June 30, 2009 and 2008, the Company incurred shipping and handling fees and costs of $59,532, $49,595, $103,300 and $119,407, respectively.
Vendor Discounts
The Company has negotiated preferred pricing arrangements with certain vendors on certain products. These arrangements are not contingent on any levels of volume and are considered vendor discounts as opposed to rebates. The Company records these discounts along with the purchase of the discounted items, resulting in lower inventory cost and a corresponding lower cost of sales as the products are sold.
Management fees paid to the department stores under “store in store” model
Under the “store in store” business operation model, the Company may pay management fees to the department stores, which are in the form of service charges or “selling at an allowance (discount)”. The management fees are accounted for (1) in the form of service charges which are reflected in general and administrative expenses, or (2) in the form of “selling at an allowance (discount)”, as a deduction of sales, which means, the expenses are directly deducted at a certain percentage on sales. Such management fees accounted for general and administrative expenses were $244,389, $388,536, $729,909 and $606,936 during the three and six months ended June 30, 2009 and 2008 respectively. Management fees accounted for deductions of sales were $1,880,521, $2,503,044, $4,245,455 and $4,613,438 in sales for the three and six months ended June 30, 2009 and 2008, respectively.
Share Based Payment
In December 2002, the FASB issued SFAS No. 148, “Accounting for Stock-Based Compensation-Transition and Disclosure-an amendment of SFAS 123.” This statement amended SFAS 123, “Accounting for Stock-Based Compensation,” to provide alternative methods of transition for a voluntary charge to the fair value based method of accounting for stock-based employee compensation. In addition, this statement amended the disclosure requirements of SFAS No. 123 to require prominent disclosures in both annual and interim financial statements about the method of accounting for stock-based employee compensation and the effect of the method used on reported results.
Advertising
Advertising expenses consist primarily of costs of promotion for corporate image and product marketing and costs of direct advertising. The Company expenses all advertising costs as incurred. Advertising expense was $71,462, $89,192, $128,298 and $196,545 for the three and six months ended June 30, 2009 and 2008.
Other Income
Other income was $162,786 and $311,929, $14,659 and $326,904 for the six and three months ended June 30, 2009 and 2008. Other income consists of the following:
| | | Six months ended June 30, | |
| | | 2009 | | | 2008 | |
| Advertising service income | | $ | 103,220 | | | $ | 235,261 | |
| Repair service income | | | 29,415 | | | | - | |
| Commission income from China Unicom | | | 30,151 | | | | 76,668 | |
| Total other income | | $ | 162,786 | | | $ | 311,929 | |
| | | Three months ended June 30, | |
| | | 2009 | | | 2008 | |
| Advertising service income | | $ | - | | | $ | 246,555 | |
| Repair service income | | | 14,659 | | | | | |
| Commission income from China Unicom | | | - | | | | 80,349 | |
| Total other income | | $ | 14,659 | | | $ | 326,904 | |
Advertising service income is the fee we receive from electronic product manufacturers when we advertise their products in our retail locations. Commission income from China Unicom is derived from the sales of China Unicom’s wireless service and products, i.e. rechargeable mobile phone cards.
Income Taxes
The Company utilizes SFAS No. 109, “Accounting for Income Taxes,” which requires recognition of deferred tax assets and liabilities for the expected future tax consequences of events that have been included in the financial statements or tax returns. Under this method, deferred income taxes are recognized for the tax consequences in future years of differences between the tax bases of assets and liabilities and their financial reporting amounts at each period end based on enacted tax laws and statutory tax rates applicable to the periods in which the differences are expected to affect taxable income. Valuation allowances are established, when necessary, to reduce deferred tax assets to the amount expected to be realized.
Basic and Diluted Earnings per Share
Earnings per share are calculated in accordance with SFAS No. 128, “Earnings per Share.” Basic earnings per share is based upon the weighted average number of common shares outstanding. Diluted earnings per share is based on the assumption that all dilutive convertible shares and stock options were converted or exercised. Dilution is computed by applying the treasury stock method. Under this method, options and warrants are assumed to be exercised at the beginning of the period (or at the time of issuance, if later), and as if funds obtained thereby were used to purchase common stock at the average market price during the period. If convertible shares and stock options are anti-dilutive, the impact of conversion is not included in the diluted net income per share. Excluded from the calculation of diluted earnings per share for the three and six months ended June 30, 2009 was 50,000 options, as they were not dilutive.
Statement of Cash Flows
In accordance with SFAS No. 95, “Statement of Cash Flows,” cash flows from the Company’s operations are calculated based upon the functional currency, in our case the CNY. As a result, amounts related to changes in assets and liabilities reported on the statement of cash flows will not necessarily agree with the changes in the corresponding balances on the balance sheet.
Concentration of Credit Risk
Financial instruments that potentially subject the Company to concentrations of credit risk are cash, accounts receivable and other receivables arising from its normal business activities. The Company places its cash in what it believes to be credit-worthy financial institutions. The Company has a diversified customer base, most of which are in China. The Company controls credit risk related to accounts receivable through credit approvals, credit limits and monitoring procedures. The Company routinely assesses the financial strength of its customers and, based upon factors surrounding the credit risk, establishes an allowance, if required, for uncollectible accounts and, as a consequence, believes that its accounts receivable credit risk exposure beyond such allowance is limited.
Segment Reporting
SFAS No. 131, “Disclosure about Segments of an Enterprise and Related Information,” requires use of the “management approach” model for segment reporting. The management approach model is based on the way a company’s management organizes segments within the company for making operating decisions and assessing performance. Reportable segments are based on products and services, geography, legal structure, management structure, or any other manner in which management disaggregates a company. The Company operates in four segments (see Note 13).
Recent Accounting Pronouncements
In February 2007, the Financial Accounting Standards Board (“FASB”) issued SFAS No. 159, “The Fair Value Option for Financial Assets and Financial Liabilities - Including an Amendment of FASB Statement No. 115.” This statement permits entities to choose to measure many financial instruments and certain other items at fair value. This statement is expected to expand the use of fair value measurement, which is consistent with the Board’s long-term measurement objectives for accounting for financial instruments. This statement was effective as of the beginning of an entity’s first fiscal year that begins after November 15, 2007. The adoption of this statement had no effect on the Company’s consolidated financial statements.
In December 2007, FASB issued SFAS No. 141 (Revised 2007), “Business Combinations” (“SFAS 141(R)”). SFAS 141(R) changes how a reporting enterprise accounts for the acquisition of a business. SFAS 141(R) requires an acquiring entity to recognize all the assets acquired and liabilities assumed in a transaction at the acquisition-date fair value, with limited exceptions, and applies to a wider range of transactions or events. SFAS��141(R) is effective for fiscal years beginning on or after December 15, 2008 and early adoption and retrospective application is prohibited. Effective January 1, 2009, the Company adopted SFAS 141(R). The adoption of SFAS 141(R) had no impact on the Company’s condensed consolidated financial statements but will have a material impact on future acquisitions. We will account for future business acquisitions in accordance with these standards.
In December 2007, the FASB issued SFAS No. 160, “Non-controlling Interests in Consolidated Financial Statements” (“SFAS 160”). This Statement amends ARB 51 to establish accounting and reporting standards for the non-controlling (minority) interest in a subsidiary and for the deconsolidation of a subsidiary. It clarifies that a non-controlling interest in a subsidiary is an ownership interest in the consolidated entity that should be reported as equity in the consolidated financial statements. The Company adopted SFAS 160 on January 1, 2009. The adoption of this statement had no effect on the Company’s consolidated financial statements.
In March 2008, the FASB issued SFAS No. 161, “Disclosures about Derivative Instruments and Hedging Activities.” The Standard is intended to improve financial reporting about derivative instruments and hedging activities by requiring enhanced disclosures to enable investors to better understand their effects on an entity’s financial position, financial performance, and cash flows. It is effective for financial statements issued for fiscal years and interim periods beginning after November 15, 2008, with early application encouraged. The Standard also improves transparency about the location and amounts of derivative instruments in an entity’s financial statements; how derivative instruments and related hedged items are accounted for under Statement 133; and how derivative instruments and related hedged items affect its financial position, financial performance, and cash flows. The Company adopted SFAS 161 on January 1, 2009. The adoption of this statement had no effect on the Company’s consolidated financial statements.
In May 2008, the FASB issued FASB Staff Position (“FSP”) APB 14-1, “Accounting for Convertible Debt Instruments That May Be Settled in Cash upon Conversion (Including Partial Cash Settlement)” (“FSP APB 14-1”).. FSP APB 14-1 clarifies that convertible debt instruments that may be settled in cash upon either mandatory or optional conversion (including partial cash settlement) are not addressed by paragraph 12 of APB Opinion No. 14, Accounting for Convertible Debt and Debt issued with Stock Purchase Warrants. Additionally, FSP APB 14-1 specifies that issuers of such instruments should separately account for the liability and equity components in a manner that will reflect the entity’s non-convertible debt borrowing rate when interest cost is recognized in subsequent periods. FSP APB 14-1 is effective for financial statements issued for fiscal years beginning after December 15, 2008, and interim periods within those fiscal years. The Company adopted FSP APB 14-1 beginning in the first quarter of 2009, and this standard must be applied on a retroactive basis. This Statement did not have an effect on the Company’s consolidated financial statements.
On May 8, 2008, the FASB issued SFAS No. 162, “The Hierarchy of Generally Accepted Accounting Principles,” (“SFAS 162”) which will provide framework for selecting accounting principles to be used in preparing financial statements that are presented in conformity with US GAAP for nongovernmental entities. With the issuance of SFAS No. 162, the GAAP hierarchy for nongovernmental entities will move from auditing literature to accounting literature. Management does not expect that this Statement will have an effect on the Company’s consolidated financial statements.
On June 16, 2008, the FASB issued final Staff Position (FSP) No. EITF 03-6-1, “Determining Whether Instruments Granted in Share-Based Payment Transactions Are Participating Securities” (“EITF 03-6-1”) to address the question of whether instruments granted in share-based payment transactions are participating securities prior to vesting. As provided in the FSP, unvested share-based payment awards that contain rights to dividend payments should be included in earnings per share calculations. The guidance will be effective commencing in the year ended December 31, 2009. We are currently evaluating the requirements of EITF 03-6-1 as well as the impact of the adoption on our condensed consolidated financial statements.
In June 2008, the FASB ratified Emerging Issues Task Force Issue No. 07-5, “Determining Whether an Instrument (or Embedded Feature) is Indexed to an Entity’s Own Stock” (“EITF 07-5”). EITF 07-5 mandates a two-step process for evaluating whether an equity-linked financial instrument or embedded feature is indexed to the entity’s own stock. Warrants that a company issues that contain a strike price adjustment feature, upon the adoption of EITF 07-5, are no longer being considered indexed to the company’s own stock. Accordingly, adoption of EITF 07-5 will change the current classification (from equity to liability) and the related accounting for such warrants outstanding at that date. EITF 07-5 is effective for fiscal years beginning after December 15, 2008, and interim periods within those fiscal years. This Statement did not have an effect on the Company’s consolidated financial statements.
In April 2009, the FASB issued FSP SFAS 107-1 and Accounting Principles Board Opinion (“APB”) 28-1, “Interim Disclosures about Fair Value of Financial Instruments” (“FSP 107-1”), which will require that the fair value disclosures required for all financial instruments within the scope of SFAS 107, "Disclosures about Fair Value of Financial Instruments", be included in interim financial statements. This FSP also requires entities to disclose the method and significant assumptions used to estimate the fair value of financial instruments on an interim and annual basis and to highlight any changes from prior periods. FSP 107-1 will be effective for interim periods ending after June 15, 2009. The adoption of FSP 107-1 is not expected to have a material affect on the Company’s consolidated financial statements.
In May 2009, the FASB issued SFAS No. 165, "Subsequent Events" ("SFAS 165"). SFAS 165 is intended to establish general standards of accounting for and disclosures of events that occur after the balance sheet date but before financial statements are issued or are available to be issued. It requires the disclosure of the date through which an entity has evaluated subsequent events and the basis for selecting that date, that is, whether that date represents the date the financial statements were issued or were available to be issued. SFAS 165 is effective for interim or annual financial periods ending after June 15, 2009. We are in the process of evaluating the effect of the adoption of SFAS 165 will have on our financial statements.
In June 2009, the FASB issued SFAS No. 166, a revision to SFAS No. 140, “Accounting for Transfers and Servicing of Financial Assets and Extinguishments of Liabilities” (“SFAS 166”), which will require more information about transfers of financial assets and where companies have continuing exposure to the risks related to transferred financial assets. SFAS 166 is effective at the start of a company’s first fiscal year beginning after November 15, 2009, or January 1, 2010 for companies reporting earnings on a calendar-year basis. The adoption of this statement is not expected to have a material effect on the Company's financial statements.
In June 2009, the FASB issued SFAS No. 167, a revision to FASB Interpretation No. 46(R), “Consolidation of Variable Interest Entities” (“SFAS 167”), which will change how a company determines when an entity that is insufficiently capitalized or is not controlled through voting (or similar rights) should be consolidated. Under SFAS 167, determining whether a company is required to consolidate an entity will be based on, among other things, an entity's purpose and design and a company's ability to direct the activities of the entity that most significantly impact the entity's economic performance. SFAS 167 is effective at the start of a company’s first fiscal year beginning after November 15, 2009, or January 1, 2010 for companies reporting earnings on a calendar-year basis. We are in the process of evaluating the effect, if any, the adoption of SFAS No. 167 will have on our financial statements.
In June 2009, the FASB issued SFAS No. 168, The FASB Accounting Standards Codification and the Hierarchy of Generally Accepted Accounting” (“SFAS 168”). SFAS 168 represents the last numbered standard to be issued by FASB under the old (pre-Codification) numbering system, and amends the GAAP hierarchy. On July 1, FASB will launch new FASB’s Codification (full name: the FASB Accounting Standards Codification TM.) The Codification will supersede existing GAAP for nongovernmental entities; governmental entities will continue to follow standards issued by FASB's sister organization, the Governmental Accounting Standards Board (GASB).
Note 3 – ADVANCES TO SUPPLIERS
Advances to suppliers represent advance payments to suppliers for the purchase of inventory. As of June 30, 2009 and December 31, 2008, the Company paid $2,337,541 (unaudited) and $2,491,518, respectively, as advances to suppliers.
Note 4 – DEPOSIT FOR ACQUISITION OF SUBSIDIARY
On December 19, 2008, China 3C Group’s subsidiaries, Zhejiang and Yiwu entered into an acquisition agreement (the “Jinhua Agreement”) with Jinhua Baofa Logistic Ltd. (“Jinhua”), a company organized under the laws of the People’s Republic of China and the shareholders of Jinhua, who own 100% of Jinhua. Pursuant to the Jinhua Agreement Zhejiang will acquire 90% and Yiwu will acquire 10% of the equity interests in Jinhua from the shareholders of the equity interest in Jinhua for a total purchase price of RMB 120,000,000 (approximately $17.6 million) payable as follows: (i) RMB 50,000,000, within 10 business days after the execution of the Jinhua Agreement; (ii) RMB 50,000,000 within 10 business days following the completion of the audit of Jinhua’s financial statements for the fiscal year ending December 31, 2008, in accordance with US GAAP (the “Audit”), which Audit shall be completed no later than March 31, 2009 (subsequently extended to June 30, 2009); and (iii) the remaining RMB 20,000,000 no later than three months after the completion of Jinhua’s Audit.
As of June 30, 2009, China 3C Group paid $14,609,631 (RMB 100,000,000) to Jinhua as a deposit for the acquisition.
Jinhua was founded in 2001 and is a well-known transportation logistics company in Eastern China and has been a long time transportation provider for China 3C Group. Jinhua has approximately 280 customers and operates a fleet of more than 70 trucks and transports freight including electronics, machinery and equipment, metal products, chemical materials, garments and handicraft goods, in more than 20 cities in Eastern China. Its transportation service covers many of the most developed cities in the Eastern China region such as Shanghai, Hangzhou and Nanjing.
Note 5– ACCOUNTS PAYABLE AND ACCRUED EXPENSES
Accounts payable and accrued expenses as of June 30, 2009 (unaudited) and December 31, 2008 consist of the following:
| | | 2009 | | | 2008 | |
| Accounts payable | | $ | 2,726,939 | | | $ | 2,753,728 | |
| Accrued expenses and other payable | | | 1,597,566 | | | | 1,839,807 | |
| VAT tax payable | | | 132,607 | | | | 823,793 | |
| Total | | $ | 4,457,112 | | | $ | 5,417,327 | |
Note 6 - COMMON STOCK
The Company appointed Joseph Levinson to serve as a member of the Company’s Board of Directors on May 7, 2007. Joseph Levinson resigned as a member of the Company’s Board of Directors on January 27, 2009. There were no disagreements between Mr. Levinson and the Company on any matter related to the Company’s operations, policies or practices which resulted in his resignation. Pursuant to the Agreement dated May 3, 2007 the Company agreed to issue to Mr. Levinson, as compensation for his services, a monthly grant of 1,000 shares of the Company’s common stock. The Company has issued 20,000 shares in total to M. Levinson representing the 1,000 share per month payments. In addition, the Company agreed to grant Mr. Levinson the following awards under the 2005 Plan: (i) an initial annual grant of a stock option to purchase 300,000 shares of the Company’s common Stock, with an exercise price of $6.15 per share (the “2007 Stock Option”); and (ii) a subsequent annual grant of a stock option to purchase an additional 300,000 shares of the Company’s common stock, with an exercise price of $1.82 (the “2008 Stock Option”). It was later determined that due to the expiration of the China 3C 2005 Equity Incentive Plan on December 31, 2006, the 2007 Stock Option and the 2008 Stock Option could not be validly granted. Pursuant to the terms of the Compensation Agreement dated as of November 27, 2008 between Mr. Levinson and the Company, Mr. Levinson acknowledged that the 2007 Stock Option and the 2008 Stock Option were not and could not be granted and, in consideration for his services as a Director accepted the issuance of 125,000 shares of the Company’s common stock.
On January 15, 2009, the Company’s Board of Directors adopted the China 3C Group, Inc. 2008 Omnibus Securities and Incentive Plan (the “2008 Plan”). The 2008 Plan provides for the granting of distribution equivalent rights, incentive stock options, non-qualified stock options, performance share awards, performance unit awards, restricted stock awards, stock appreciation rights, tandem stock appreciation rights, unrestricted stock awards or any combination of the foregoing, as may be best suited to the circumstances of the particular employee, director or consultant. Under the 2008 Plan 2,000,000 shares of the Company’s common stock are available for issuance for awards. Each award shall remain exercisable for a term of ten (10) years from the date of its grant. The price at which a share of common stock may be purchased upon exercise of an option shall not be less than the closing sales price of the common stock on the date such option is granted. The 2008 Plan shall continue in effect, unless sooner terminated, until the tenth anniversary of the date on which it is adopted by the Board. During the three and six months ended June 30, 2009, the Company issued 1,093,272 shares of common stocks and recognized $81,084 compensation expenses under the 2008 Plan. As of June 30, 2009, there was $891,928 of unrecognized compensation expense related to the nonvested stocks. The cost is expected to be recognized over a three year period.
Note 7 - STOCK WARRANTS, OPTIONS, AND COMPENSATION
The Company appointed Kenneth T. Berents to serve as a member of the Company’s Board of Directors on December 8, 2006. Under the Board of Directors Agreement between the Company and Mr. Berents, dated December 8, 2006, the Company agreed to issue to Mr. Berents as a compensation for his services under the 2005 Plan, an initial grant of a stock option to purchase 50,000 shares of the Company’s common stock upon execution of the Board of Directors Agreement and an option to purchase 30,000 shares of the Company’s common stock on each anniversary of the Board of Directors Agreement , provided Mr. Berents is a member of the Board of Directors at such time. It was later determined that due to the expiration of the 2005 Plan on December 31, 2006 the grants of stock options to Mr. Berents could not be validly granted. In order to meet its obligations under the Board of Directors Agreement, the Company entered into the following agreements with Mr. Berents (i) Stock Option Agreement - Director Non-Qualified Stock Option dated as of December 1, 2008 and effective as of January 15, 2009 for the issuance of 50,000 shares of the Company’s common stock, with an exercise price of $4.29 per share under the Company’s 2008 Plan to Mr. Berents, (ii) Stock Option Agreement - - Director Non-Qualified Stock Option dated as of December 1, 2008 and effective as of January 15, 2009 for the issuance of 30,000 shares of the Company’s common stock, with an exercise price of $4.27 per share under the Company’s 2008 Plan to Mr. Berents, and (iii) Stock Option Agreement - Director Non-Qualified Stock Option dated as of December 1, 2008 and effective as of January 15, 2009 for the issuance of 30,000 shares of the Company’s common stock, with an exercise price of $0.90 per share under the Company’s 2008 Plan to Mr. Berents.
The Company appointed Todd L. Mavis to serve as a member of the Company’s Board of Directors on January 2, 2007. Mr. Mavis resigned as a member of the Board of Directors effective as of December 17, 2007. There were no disagreements between Mr. Mavis and the Company on any matter related to the Company’s operations, policies or practices which resulted in his resignation. As a compensation for his services, the Company agreed to issue to Mr. Mavis under the 2005 Plan, an initial annual grant of a stock option to purchase 50,000 shares of the Company’s common stock, with an exercise price of $3.80 per share (the “Mavis Stock Option”). Under the Board of Directors Agreement between the Company and Mr. Mavis, dated January 2, 2007, in the event that Mr. Mavis is no longer a member of the Board of Directors, his exercise period for all vested options is twenty-four months from the anniversary date of his departure from the Board of Directors. It was later determined that due to the expiration of the 2005 Plan on December 31, 2006 the Mavis Stock Option could not be validly granted. Pursuant to the terms of the Stock Option Agreement with Todd L. Mavis dated as of April 21, 2009 between Mr. Mavis and the Company, Mr. Mavis was granted an option to purchase 50,000 shares of the Company’s common stock (the “New Mavis Stock Option”), for an exercise price per share of common stock equal to $3.46. All or any part of the New Mavis Stock Option may be exercised by Mr. Mavis, no later than December 17, 2009.
Stock options— All options issued have a ten-year life and were fully vested upon issuance. The option holder has no voting or dividend rights. The grant price was equal the market price at the date of grant. The Company records the expense of the stock options over the related vesting period. The options were valued using the Black-Scholes option-pricing model at the date of grant stock option pricing.
The expected term represents the estimated average period of time that the options remain outstanding. The expected volatility is based on the historical volatility of the Company’s stock price. No dividend payouts were assumed, as the Company has no plans to declare dividends during the expected term of the stock options. The risk-free rate of return reflects the weighted average interest rate offered for zero coupon treasury bonds over the expected term of the options. Based upon this calculation and pursuant to EITF 96-18, the company recorded expenses of $226,293 and $108,736 for the six and three months ending June 30, 2008, respectively and none for 2009.
The Company did not grant any options during the six months ended June 30, 2009 and 2008.
Note 8 - COMPENSATED ABSENCES
Regulation 45 of the labor laws in the People’s Republic of China (PRC) entitles employees to annual vacation leave after 1 year of service. In general all leave must be utilized annually, with proper notification, any unutilized leave is cancelled.
Note 9 - INCOME TAXES
The Company, through its subsidiaries, Zhejiang, Wang Da, Sanhe, Joy & Harmony and Yiwu, is governed by the Income Tax Laws of the PRC. Operations in the United States of America have incurred net accumulated operating losses of approximately $2,457,892 as of June 30, 2009 for income tax purposes. However, a 100% allowance has been recorded on the deferred tax asset of approximately $836,000 due to uncertainty of its realization.
Pursuant to the PRC Income Tax Laws, from January 1, 2008, the Enterprise Income Tax is at a statutory rate of 25%.
The following is a reconciliation of income tax expense for the six months ended June 30, 2009 and 2008:
| 2009 | | U.S. | | | State | | | International | | | Total | |
| Current | | $ | - | | | $ | - | | | $ | 1,591,058 | | | $ | 1,591,058 | |
| Deferred | | | - | | | | - | | | | - | | | | - | |
| Total | | $ | - | | | $ | - | | | $ | 1,591,058 | | | $ | 1,591,058 | |
| 2008 | | U.S. | | | State | | | International | | | Total | |
| Current | | $ | - | | | $ | - | | | $ | 4,164,627 | | | $ | 4,164,627 | |
| Deferred | | | - | | | | - | | | | - | | | | - | |
| Total | | $ | - | | | $ | - | | | $ | 4,164,627 | | | $ | 4,164,627 | |
The following is a reconciliation of income tax expense for the three months ended June 30, 2009 and 2008:
| 2009 | | U.S. | | | State | | | International | | | Total | |
| Current | | $ | - | | | $ | - | | | $ | 228,520 | | | $ | 228,520 | |
| Deferred | | | - | | | | - | | | | - | | | | - | |
| Total | | $ | - | | | $ | - | | | $ | 228,520 | | | $ | 228,520 | |
| 2008 | | U.S. | | | State | | | International | | | Total | |
| Current | | $ | - | | | $ | - | | | $ | 1,887,999 | | | $ | 1,887,999 | |
| Deferred | | | - | | | | - | | | | - | | | | - | |
| Total | | $ | - | | | $ | - | | | $ | 1,887,999 | | | $ | 1,887,999 | |
Reconciliation of the differences between the statutory U.S. Federal income tax rate and the effective rate is as follows:
| | | For the six months ended June 30, | |
| | | 2009 | | | 2008 | |
| US statutory tax rate | | | 34.0 | % | | | 34.0 | % |
| Tax rate difference | | | (9.0 | %) | | | (9.0 | %) |
| Increase in valuation allowance | | | 1.8 | % | | | (1.2 | %) |
| Effective rate | | | 26.8 | % | | | 23.8 | % |
| | | For the three months ended June 30, | |
| | | 2009 | | | 2008 | |
| US statutory tax rate | | | 34.0 | % | | | 34.0 | % |
| Tax rate difference | | | (9.0 | %) | | | (9.0 | %) |
| Increase in valuation allowance | | | 5.0 | % | | | (1.2 | %) |
| Effective rate | | | 30.0 | % | | | 23.8 | % |
Note 10 - COMMITMENTS
The Company leases office facilities under operating leases that terminate through 2011. Rent expense for the three and six months ended June 30, 2009 and 2008 was $68,018, $62,203, $119,192 and $125,002, respectively. The future minimum obligations under these agreements are as follows by years as of June 30, 2009:
| 2010 | | $ | 310,000 | |
| 2011 | | | 103,000 | |
| 2012 | | | 75,000 | |
Note 11 - STATUTORY RESERVE
In accordance with the laws and regulations of the PRC, a wholly-owned Foreign Invested Enterprise’s income, after the payment of the PRC income taxes, shall be allocated to the statutory surplus reserves and statutory public welfare fund. Prior to January 1, 2006, the proportion of allocation for reserve was 10 percent of the profit after tax to the surplus reserve fund and additional 5-10 percent to the public affair fund. The public welfare fund reserve was limited to 50 percent of the registered capital. Effective January 1, 2006, there is now only one fund requirement. The reserve is 10 percent of income after tax, not to exceed 50 percent of registered capital.
Statutory reserve funds are restricted for set off against losses, expansion of production and operation or increase in register capital of the respective company. Statutory public welfare fund is restricted to the capital expenditures for the collective welfare of employees. These reserves are not transferable to the Company in the form of cash dividends, loans or advances. These reserves are therefore not available for distribution except in liquidation. As of June 30, 2009 and December 31, 2008, the Company had allocated $11,109,379 to these non-distributable reserve funds.
Note 12 - OTHER COMPREHENSIVE INCOME
The detail of other comprehensive income as included in stockholders’ equity at June 30, 2009 (unaudited) and December 31, 2008 are as follows:
| | | Foreign | |
| | | Currency | |
| | | Translation | |
| | | Adjustment | |
| Balance at December 31, 2007 | | $ | 1,872,334 | |
| Change for 2008 | | | 3,399,770 | |
| Balance at December 31, 2008 | | | 5,272,104 | |
| Change for six months ended June 30, 2009 | | | (128,651 | ) |
| Balance at June 30, 2009 | | $ | 5,143,453 | |
Note 13 - CURRENT VULNERABILITY DUE TO CERTAIN RISK FACTORS
The Company’s operations are carried out in the PRC. Accordingly, the Company’s business, financial condition and results of operations may be influenced by the political, economic and legal environments in the PRC, by the general state of the PRC’s economy. The Company’s business may be influenced by changes in governmental policies with respect to laws and regulations, anti-inflationary measures, currency conversion and remittance abroad, and rates and methods of taxation, among other things.
Note 14 - MAJOR CUSTOMERS AND CREDIT RISK
During the six and three months ended June 30, 2009 and 2008, no customer accounted for more than 10% of the Company’s sales or accounts receivable. At June 30, 2009 one (1) vendor comprised approximately 21.67% of the Company’s accounts payable. At June 30, 2008 four (4) vendors comprised more than 57% of the Company’s accounts payable.
Note 15 - SEGMENT INFORMATION
We separately operate and prepare accounting and other financial reports to management for four major business organizations (Wang Da, Sanhe, Yiwu and Joy & Harmony). Each of the operating companies has different product groups. Wang Da sells mainly mobile phones, Sanhe sells mainly home appliances, Yiwu sells mainly office communication products, and Joy & Harmony sells mainly consumer electronics. All segments are accounted for using the same principles as described in Note 2.
We identified four reportable segments required by SFAS 131: (1) mobile phones, (2) home electronics, (3) office communication products, and (4) consumer electronics.
The following tables present summarized information by segment (in thousands):
| | | Six Months Ended June 30, 2009 | |
| | | Mobile | | | Home | | | Communication | | | Consumer | | | | | | | |
| | | Phones | | | Electronics | | | Products | | | Electronics | | | Other | | | Total | |
| Sales, net | | $ | 39,912 | | | $ | 30,996 | | | $ | 26,389 | | | $ | 31,241 | | | $ | - | | | $ | 128,538 | |
| Cost of sales | | | 35,449 | | | | 25,159 | | | | 23,928 | | | | 27,922 | | | | - | | | | 112,458 | |
| Gross profit | | | 4,463 | | | | 5,838 | | | | 2,459 | | | | 3,319 | | | | - | | | | 16,079 | |
| Income from operations | | | 1,204 | | | | 1,902 | | | | 422 | | | | 1,748 | | | | 567 | | | | 5,843 | |
| Total assets | | $ | 14,695 | | | $ | 16,712 | | | $ | 15,123 | | | $ | 16,344 | | | $ | 33,838 | | | $ | 96,712 | |
| | | Six Months Ended June 30, 2008 | |
| | | Mobile | | | Home | | | Communication | | | Consumer | | | | | | | |
| | | Phones | | | Electronics | | | Products | | | Electronics | | | Other | | | Total | |
| Sales, net | | $ | 47,310 | | | $ | 35,538 | | | $ | 30,148 | | | $ | 33,673 | | | $ | - | | | | 146,669 | |
| Cost of sales | | | 39,998 | | | | 29,049 | | | | 25,397 | | | | 28,803 | | | | - | | | | 123,247 | |
| Gross profit | | | 7,313 | | | | 6,489 | | | | 4,750 | | | | 4,870 | | | | - | | | | 23,422 | |
| Income from operations | | | 4,918 | | | | 4,263 | | | | 3,412 | | | | 3,757 | | | | 760 | | | | 17,110 | |
| Total assets | | $ | 22,326 | | | $ | 21,739 | | | $ | 16,418 | | | $ | 19,251 | | | $ | 1,456 | | | $ | 81,190 | |
| | | Three Months Ended June 30, 2009 | |
| | | Mobile | | | Home | | | Communication | | | Consumer | | | | | | | |
| | | Phones | | | Electronics | | | Products | | | Electronics | | | Other | | | Total | |
| Sales, net | | $ | 14,168 | | | $ | 14,403 | | | $ | 10,587 | | | $ | 11,968 | | | $ | - | | | $ | 51,126 | |
| Cost of sales | | | 12,665 | | | | 11,815 | | | | 9,824 | | | | 10,801 | | | | - | | | | 45,105 | |
| Gross profit | | | 1,504 | | | | 2,589 | | | | 762 | | | | 1,165 | | | | - | | | | 6,020 | |
| Income from operations | | | 88 | | | | 764 | | | | (80 | ) | | | 469 | | | | 30 | | | | 1,271 | |
| Total assets | | $ | 14,695 | | | $ | 16,712 | | | $ | 15,123 | | | $ | 16,344 | | | $ | 33,838 | | | $ | 96,712 | |
| | | Three Months Ended June 30, 2008 | |
| | | Mobile | | | Home | | | Communication | | | Consumer | | | | | | | |
| | | Phones | | | Electronics | | | Products | | | Electronics | | | Other | | | Total | |
| Sales, net | | $ | 25,528 | | | $ | 18,648 | | | $ | 17,030 | | | $ | 17,309 | | | $ | - | | | $ | 78,515 | |
| Cost of sales | | | 21,770 | | | | 15,137 | | | | 14,112 | | | | 14,621 | | | | - | | | | 65,640 | |
| Gross profit | | | 3,759 | | | | 3,511 | | | | 2,918 | | | | 2,688 | | | | - | | | | 12,876 | |
| Income from operations | | | 2,371 | | | | 2,399 | | | | 2,222 | | | | 2,097 | | | | 461 | | | | 9,550 | |
| Total assets | | $ | 22,326 | | | $ | 21,739 | | | $ | 16,418 | | | $ | 19,251 | | | $ | 1,456 | | | $ | 81,190 | |
Forward Looking Statements
We have included, and from time–to-time may make in our public filings, press releases or other public statements, certain statements, including, without limitation, those under “Management’s Discussion and Analysis of Financial Condition and Results of Operations” in Item 2. In some cases, these statements are identifiable through the use of words such as “anticipate”, “believe”, “estimate”, “expect”, “intend”, “plan”, “project”, “target”, “can”, “could”, “may”, “should”, “will”, “would”, and similar expressions. You are cautioned not to place undue reliance on these forward-looking statements. In addition, our management may make forward-looking statements to analysts, investors, representatives of the media and others. These forward-looking statements are not historical facts and represent only our beliefs regarding future events, many of which, by their nature, are inherently uncertain and beyond our control.
The following discussion should be read in conjunction with the Consolidated Financial Statements and Notes thereto appearing elsewhere in this Form 10-Q. The following discussion contains forward-looking statements. Our actual results may differ significantly from those projected in the forward-looking statements. Factors that may cause future results to differ materially from those projected in the forward-looking statements include, but are not limited to, those discussed in “Risk Factors” and elsewhere in this Form 10-Q.
Item 2. Management’s Discussion and Analysis of Financial Condition and Results of Operations.
Overview
China 3C Group was incorporated on August, 20, 1998 under the laws of the State of Nevada. Capital Future Developments Limited (“CFDL”) was incorporated on July 22, 2004 under the laws of the British Virgin Islands. Zhejiang Yong Xin Digital Technology Co., Ltd. (“Zhejiang”), Yiwu Yong Xin Communication Ltd. (“Yiwu”), Hangzhou Wandga Electronics Co., Ltd. (“Wang Da”), Hangzhou Sanhe Electronic Technology, Limited (“Sanhe”), and Shanghai Joy & Harmony Electronic Development Co., Ltd. (“SJHE”) were incorporated under the laws of Peoples Republic of China on July 11, 2005, July 18, 1997, March 30, 1998, April 12, 2004, and August 25, 2003, respectively. China 3C Group owns 100% of CFDL and CFDL own 100% of the capital stock of SJHE and Sanhe. Until August 14, 2007, when it made the change to its ownership structure described in the next paragraph in order to comply with certain requirements of PRC law, CFDL owned 100% of the capital stock of Zhenjiang. Zhejiang owns 90% and Yiwu owns 10% of Wang Da. Zhejiang owns 90% and Wang Da owns 10% of Yiwu. On March 10, 2009 Zhejiang set up a new operating entity, Hangzhou Letong Digital Technology Co., Ltd. (“Letong”) to establish an electronic retail franchise operation for China 3C Group. On July 6, 2009, the Company completed the acquisition of Jinhua Boafa Logistic, Ltd. Collectively the eight corporations are referred to herein as the Company.
On December 21, 2005 CFDL became a wholly owned subsidiary of China 3C Group through a merger with a wholly owned subsidiary of the Company (“Merger Transaction”). China 3C Group acquired all of the issued and outstanding capital stock of CFDL pursuant to a Merger Agreement dated at December 21, 2005 by and among China 3C Group, XY Acquisition Corporation, CFDL and the shareholders of CFDL (the “Merger Agreement”). Pursuant to the Merger Agreement, CFDL became a wholly owned subsidiary of China 3C Group and, in exchange for the CFDL shares, China 3C Group issued 35,000,000 shares of its common stock to the shareholders of CFDL, representing 93% of the issued and outstanding capital stock of China 3C Group at that time and a cash consideration of $500,000. On August 15, 2007, in order to comply with the requirements of PRC law, the Company recapitalized its ownership structure. As a result, instead of CFDL owning 100% of Zhejiang as previously was the case, CFDL entered into contractual agreements with Zhejiang whereby CFDL owns a 100% interest in the revenues of Zhejiang. CFDL does not have an equity interest in Zhejiang, but is deemed to have all the economic benefits and liabilities by contract. Under this structure, Zhejiang is now a wholly foreign owned enterprise (WOFE) of CFDL. The contractual agreements give CFDL and its’ equity owners an obligation to absorb, any losses, and rights to receive revenue. CFDL will be unable to make significant decisions about the activities of Zhejiang and can not carry out its principal activities without financial support. These characteristics as defined in Financial Accounting Standards Board (FASB) interpretation 46, Consolidation of Variable Interest Entities (VIEs), qualifies the business operations of (Zhejiang) to be consolidated with (CFDL) and ultimately with China 3C Group.
As a result of the Merger Agreement, the reorganization was treated as an acquisition by the accounting acquiree that is being accounted for as a recapitalization and as a reverse merger by the legal acquirer for accounting purposes. Pursuant to the recapitalization, all capital stock shares and amounts and per share data have been retroactively restated. Accordingly, the financial statements include the following:
(1) The balance sheet consists of the net assets of the accounting acquirer at historical cost and the net assets of the legal acquirer at historical cost.
(2) The statements of operations include the operations of the accounting acquirer for the period presented and the operations of the legal acquirer from the date of the merger.
Pursuant to a share exchange agreement, dated August 3, 2006, we issued 915,751 shares of restricted common stock, to the former shareholders of Hangzhou Sanhe Electronic Technology Ltd. The shares were valued at $3,750,000, which was the fair value of the shares at the date of exchange agreement. This amount is included in the cost of net assets and goodwill purchased.
Pursuant to a share exchange agreement, dated November 28, 2006, we issued 2,723,110 shares of newly issued shares of Common Stock to the former shareholders of Shanghai Joy & Harmony Electronics Company Limited. The shares were valued at $11,000,000, which was the fair value of the shares at the date of exchange agreement. This amount is included in the cost of net assets and goodwill purchased.
On December 19, 2008, China 3C Group’s subsidiaries, Zhejiang and Yiwu entered into an acquisition agreement (the “Jinhua Agreement”) with Jinhua Baofa Logistic Ltd., a company organized under the laws of the People’s Republic of China (“Jinhua”) and the shareholders of Jinhua, who own 100% of the equity interest in Jinhua in the aggregate. Pursuant to the Jinhua Agreement Zhejiang will acquire 90% and Yiwu will acquire 10% of the entire equity interests in Jinhua from the shareholders of Jinhua for a total purchase price of RMB 120,000,000 payable as follows: (i) RMB 50,000,000, within 10 business days after the execution of the Jinhua Agreement; (ii) RMB 50,000,000 within 10 business days following the completion of the audit of Jinhua’s financial statements for the fiscal year ending December 31, 2008, in accordance with generally accepted accounting principles in the U.S. (the “Audit”), which Audit shall be completed no later than March 31, 2009; and (iii) the remaining RMB 20,000,000 no later than three months after the completion of Jinhua’s Audit. The source of the cash used for the purchase of 100% of the equity of Jinhua was from working capital of China 3C Group.
Jinhua was founded in 2001 and is a well-known transportation logistics company in Eastern China and has been a long time transportation provider for China 3C Group. Jinhua has approximately 280 customers and operates a fleet of more than 70 trucks and transports freight including electronics, machinery and equipment, metal products, chemical materials, garments and handicraft goods, in more than 20 cities in Eastern China. Its transportation service covers many of the most developed cities in the Eastern China region such as Shanghai, Hangzhou and Nanjing.
On April 4, 2009, Zhejiang and Yiwu entered into an amendment to the Jinhua Agreement (the “Amended Agreement”) with the shareholders of Jinhua. The Amended Agreement changed from March 31, 2009 to June 30, 2009 the date by which the parties have agreed that the Audit is required to be completed. In the event that the audit is not completed by June 30, 2009, the Agreement may be terminated.
On July 6, 2009, Zhejiang and Yiwu completed the acquisition of Jinhua from the shareholders of Jinhua. The final installment of RMB 20,000,000 (approximately US $2,900,000) will be paid within 10 days of the filing of the amendment to the current report on Form 8-K dated July 6, 2009, which filing is expected to be made by the Company not later than 71 calendar days after July 6, 2009.
The Company is engaged in the resale and distribution of mobile phones, facsimile machines, DVD players, stereos, speakers, MP3 and MP4 players, iPods, electronic dictionaries, CD players, radios, Walkmans, and audio systems. We sell and distribute these products through retail stores and secondary distributors.
Result of Operations
For the Six and Three Months Ended June 30, 2009 and 2008
Reportable Operating Segments
The Company reports financial and operating information in the following four segments:
a) Yiwu Yong Xin Telecommunication Company, Limited or “Yiwu”
b) Hangzhou Wang Da Electronics Company, Limited or “Wang Da”
c) Hangzhou Sanhe Electronic Technology Limited or “Sanhe”
d) Shanghai Joy & Harmony Electronics Company Limited or “SJHE”
a) Yiwu Yong Xin Telecommunication Company Limited or “Yiwu”
Yiwu focuses on the selling, circulation and modern logistics of fax machines and cord phone products.
All amounts, except percentages of revenues, are in thousands of U.S. dollars.
| | | Six months ended June 30, | | | Percentage | |
| Yiwu | | 2009 | | | 2008 | | | Change | |
| Revenue | | $ | 26,389 | | | $ | 30,469 | | | | (13.39) | % |
| Gross Profit | | $ | 2,459 | | | $ | 4,798 | | | | (48.84) | % |
| Gross Margin | | | 9.32 | % | | | 15.75 | % | | | (6.43) | % |
| Operating Income | | $ | 422 | | | $ | 3,412 | | | | (87.63) | % |
| | | Three months ended June 30, | | | Percentage | |
| Yiwu | | 2009 | | | 2008 | | | Change | |
| Revenue | | $ | 10,587 | | | $ | 17,030 | | | | (37.83) | % |
| Gross Profit | | $ | 762 | | | $ | 2,918 | | | | (73.89) | % |
| Gross Margin | | | 7.20 | % | | | 17.13 | % | | | (9.93) | % |
| Operating Income | | $ | (80) | | | $ | 2,222 | | | | (103.60) | % |
For the six months ended June 30, 2009, Yiwu generated revenue of $26,389, a decrease of $4,080 or 13.39% compared to $30,469 for the six months ended June 30, 2008. Gross profit decreased $2,339 or 48.84% from $4,798 for the six months ended June 30, 2008 to $2,459 for the six months ended June 30, 2009. Operating income was $422 for the six months ended June 30, 2009, a decrease of $2,990 or 87.63% compared to $3,412 for the six months ended June 30, 2008.
For the three months ended June 30, 2009, Yiwu generated revenue of $10,587, a decrease of $6,443 or 37.83% compared to $17,030 for the three months ended June 30, 2008. Gross profit decreased $2,156 or 73.89% from $2,918 for the three months ended June 30, 2008 to $762 for the three months ended June 30, 2009. Operating loss was $(80) for the three months ended June 30, 2009, a decrease of $2,302 or 103.6% compared to operating income of $2,222 for the three months ended June 30, 2008.
Such decrease in revenue was primarily due to weaker demand for office equipment as well as lower unit sales price. Many small and medium-sized companies in China were less likely to purchase or upgrade new office equipment in the current economic environment.
Gross margin decreased 6.43% and 9.93%, respectively during the six and three months ended June 30, 2009. The decrease was a result of lower unit sales price of fax machines and telephones due to a more competitive sales market.
b) Hangzhou Wang Da Electronics Company Limited or “Wang Da”
Wang Da focuses on the selling, circulation and modern logistics of cell phones, cell phones products, and digital products, including digital cameras, digital camcorders, PDAs, flash disks, and removable hard disks.
All amounts, except percentages of revenues, are in thousands of U.S. dollars.
| | | Six months ended June 30, | | | Percentage | |
| Wang Da | | 2009 | | | 2008 | | | Change | |
| Revenue | | $ | 39,912 | | | $ | 47,777 | | | | (16.46) | % |
| Gross Profit | | $ | 4,463 | | | $ | 7,275 | | | | (38.65) | % |
| Gross Margin | | | 11.18 | % | | | 15.23 | % | | | (4.05) | % |
| Operating Income | | $ | 1,204 | | | $ | 4,918 | | | | (75.52) | % |
| | | Three months ended June 30, | | | Percentage | |
| Wang Da | | 2009 | | | 2008 | | | Change | |
| Revenue | | $ | 14,168 | | | $ | 25,528 | | | | (44.50) | % |
| Gross Profit | | $ | 1,503 | | | $ | 3,759 | | | | (60.03) | % |
| Gross Margin | | | 10.61 | % | | | 14.73 | % | | | (4.12) | % |
| Operating Income | | $ | 88 | | | $ | 2,371 | | | | (96.29) | % |
For the six months ended June 30, 2009, Wan Da generated revenue of $39,912, a decrease of $7,865 or 16.46% compared to $47,777 for the six months ended June 30, 2008. Gross profit decreased $2,812 or 38.65% from $7,275 for the six months ended June 30, 2008 to $4,463 for the six months ended June 30, 2009. Operating income was $1,204 for the six months ended June 30, 2009, a decrease of $3,714 or 75.52% compared to $4,918 for the six months ended June 30, 2008.
For the three months ended June 30, 2009, Wan Da generated revenue of $14,168, a decrease of $11,360 or 44.5% compared to $25,528 for the three months ended June 30, 2008. Gross profit decreased $2,256 or 60.03% from $3,759 for the three months ended June 30, 2008 to $1,503 for the three months ended June 30, 2009. Operating income was $88 for the three months ended June 30, 2009, a decrease of $2,283 or 96.29% compared to $2,371 for the three months ended June 30, 2008.
During the second quarter 2009, China started testing its 3G network. Because the 3G network is still in the trial period, the network coverage is yet to be complete and the cost of wireless service is relatively higher than before. In addition, the costs of 3G phones are also higher than the old models. The introduction of 3G phones caused lower demand for the old model mobile phones. Meanwhile, customers are waiting to upgrade to 3G phones until the 3G network is complete. These factors led to decreased sales revenue during the six months ended June 30, 2009. The revenue decrease was also attributed to the closing of 8 store in stores during the second quarter of 2009.
Gross margin decreased 4.05% and 4.12%, respectively during the six and three months ended June 30, 2009. The decrease was due to the fact that old model mobile phones are selling at a lower unit price as a result of the introduction of 3G phones.
c) Hangzhou Sanhe Electronic Technology Limited or “Sanhe”
Sanhe focuses on the selling, circulation and modern logistics of home electronics, including DVD players, audio systems, speakers, televisions and air conditioners.
All amounts, except percentages of revenues, are in thousands of U.S. dollars.
| | | Six months ended June 30, | | | Percentage | |
| Sanhe | | 2009 | | | 2008 | | | Change | |
| Revenue | | $ | 30,996 | | | $ | 35,138 | | | | (11.79) | % |
| Gross Profit | | $ | 5,838 | | | $ | 6,484 | | | | (9.96) | % |
| Gross Margin | | | 18.83 | % | | | 18.45 | % | | | 0.38 | % |
| Operating Income | | $ | 1,902 | | | $ | 4,263 | | | | (55.38) | % |
| | | Three months ended June 30, | | | Percentage | |
| Sanhe | | 2009 | | | 2008 | | | Change | |
| Revenue | | $ | 14,403 | | | $ | 18,648 | | | | (22.76) | % |
| Gross Profit | | $ | 2,589 | | | $ | 3,511 | | | | (26.26) | % |
| Gross Margin | | | 17.98 | % | | | 18.83 | % | | | (0.85) | % |
| Operating Income | | $ | 764 | | | $ | 2,399 | | | | (68.15) | % |
For the six months ended June 30, 2009, Sanhe generated revenue of $30,996, a decrease of $4,142 or 11.79% compared to $35,138 for the six months ended June 30, 2008. Gross profit decreased $646 or 9.96% from $6,484 for the six months ended June 30, 2008 to $5,838 for the six months ended June 30, 2009. Operating income was $1,902 for the six months ended June 30, 2009, a decrease of $2,361 or 55.38% compared to $4,263 for the six months ended June 30, 2008.
For the three months ended June 30, 2009, Sanhe generated revenue of $14,403, a decrease of $4,245 or 22.76% compared to $18,648 for the three months ended June 30, 2008. Gross profit decreased $922 or 26.26% from $3,511 for the three months ended June 30, 2008 to $2,589 for the three months ended June 30, 2009. Operating income was $764 for the three months ended June 30, 2009, a decrease of $1,635 or 68.15% compared to operating income of $2,399 for the three months ended June 30, 2008.
Second quarter has been a slow season for home electronics. The decrease in revenue was primarily due to weaker demand for home electronics during the second quarter 2009. Part of the decline in revenue was also attributed to the cancellation of the Chinese May 1st public holiday in 2009.
Gross margin increased 0.38% during the six months ended June 30, 2009 and decreased 0.85% during the three months ended June 30, 2009. The decrease in gross margin was a result of lower unit sales price of home electronics due to a more competitive sales market.
d) Shanghai Joy & Harmony Electronics Company Limited or “SJHE”
SJHE focuses on the selling, circulation and modern logistics of consumer electronics, including MP3 players, MP4 players, iPod, electronic dictionary, radios, and Walkman.
All amounts, except percentages of revenues, are in thousands of U.S. dollars.
| | | Six months ended June 30, | | | Percentage | |
| SJHE | | 2009 | | | 2008 | | | Change | |
| Revenue | | $ | 31,241 | | | $ | 33,285 | | | | (6.14) | % |
| Gross Profit | | $ | 3,319 | | | $ | 4,866 | | | | (31.79) | % |
| Gross Margin | | | 10.62% | % | | | 14.62 | % | | | (3.00) | % |
| Operating Income | | $ | 1,748 | | | $ | 3,757 | | | | (46.53) | % |
| | | Three months ended June 30, | | | Percentage | |
| SJHE | | 2009 | | | 2008 | | | Change | |
| Revenue | | $ | 11,968 | | | $ | 17,309 | | | | (30.86) | % |
| Gross Profit | | $ | 1,166 | | | $ | 2,688 | | | | (56.62) | % |
| Gross Margin | | | 9.74 | % | | | 15.53 | % | | | (5.79) | % |
| Operating Income | | $ | 469 | | | $ | 2,097 | | | | (77.63) | % |
For the six months ended June 30, 2009, SJHE generated revenue of $31,241, a decrease of $2,044 or 6.14% compared to $33,285 for the six months ended June 30, 2008. Gross profit decreased $1,547 or 31.79% from $4,866 for the six months ended June 30, 2008 to $3,319 for the six months ended June 30, 2009. Operating income was $1,748 for the six months ended June 30, 2009, a decrease of $2,009 or 46.53% compared to $3,757 for the six months ended June 30, 2008.
For the three months ended June 30, 2009, SJHE generated revenue of $11,968, a decrease of $5,341 or 30.86% compared to $17,309 for the three months ended June 30, 2008. Gross profit decreased $1,522 or 56.62% from $2,688 for the three months ended June 30, 2008 to $1,166 for the three months ended June 30, 2009. Operating income was $469 for the three months ended June 30, 2009, a decrease of $1,628 or 77.63% compared to $2,097 for the three months ended June 30, 2008.
Gross margin decreased 3.00% and 5.79% during the six and three months ended June 30, 2009, respectively. The decrease in gross margin was a result of lower unit sales price of consumer electronics due to a more competitive sales market.
Net Sales
Net sales for the six months ended June 30, 2009 decreased by 12.36%, to $128,537 as compared to $146,669 for the six months ended June 30, 2008. Net sales for the three months ended June 30, 2009 decreased by 34.88%, to $51,126 as compared to $78,515 for the three months ended June 30, 2008. Management believes that the lower sales were a result of various factors including a slowdown in the retail markets in general, weaker demand for consumer and business electronics due to the global financial conditions as well as the pressure of increased competition within the markets in which we operate.
Cost of Sales
Cost of sales for the six months ended June 30, 2009 totaled $112,458 as compared to $123,246 for the six months ended June 30, 2008, a decrease of 8.75%. Cost of sales for the three months ended June 30, 2008 totaled $45,105 as compared to $65,640 for the three months ended June 30, 2008, a decrease of 31.28%. The decreased cost of sales for the six months was a direct result of the decrease in the number of sales during the same period.
Gross Profit Margin
Gross profit margin for the six months ended June 30, 2009 was 12.51% as compared to 15.97% for the six months ended June 30, 2008. Gross profit margin for the three months ended June 30, 2009 was 11.78% as compared to 16.40% for the three months ended June 30, 2008. The lower gross profit margin was primarily due to the decreased unit sales prices of consumer and business electronics in the competitive market in China. While the unit sales prices decreased, the purchase price remained flat.
General and Administrative Expenses
General and administrative expenses for the six months ended June 30, 2009 totaled $10,235 or approximately 7.96% of net sales, as compared to $6,312 or approximately 4.30% of net sales for the six months ended June 30, 2008, an increase of 62.16%. General and administrative expenses for the three months ended June 30, 2009 totaled $4,749 or approximately 9.29% of net sales, as compared to $3,326,044 or approximately 4.24% of net sales for the three months ended June 30, 2008, an increase of 42.79%. The increase in general and administrative expenses was primarily due to an increase in base salary for all staff, increase in public expenses as well as increased management fees paid to department stores. Other factors include an increase in marketing expenses and additional expenses incurred to upgrade the sales counters in retail stores to enhance the business image during first quarter 2009.
Income from Operations
Income from operations for the six months ended June 30, 2009 was $5,844 or 4.55% of net sales as compared to income from operations of $17,110 or 11.67% of net sales for the six months ended June 30, 2008, a decrease of 65.85%. Income from operations for the three months ended June 30, 2008 was $1,271 or 2.49% of net sales as compared to income from operations of $9,550 or 12.16%of net sales for the three months ended June 30, 2008, a decrease of 86.69%. Lower sales, lower gross margin as well as increased operating expenses were the key factors for the decrease in income from operations during the three and six months ended June 30, 2009.
Provision for Income Taxes
The provision for income taxes for the six months ended June 30, 2009 was $1,591 compared to $4,164 for the six months ended June 30, 2008. The provision for income taxes for the three months ended June 30, 2009 was $392 compared to $2,354 for the three months ended June 30, 2008. The decrease was attributed to the decrease in taxable income.
Net Income
Net income was $4,354 or 3.39% of net sales for the six months ended June 30, 2009 compared to $13,325 or 9.09% of net sales for the six months ended June 30, 2008, a decrease of 67.33%. Net income was $915 or 1.79% of net sales for the three months ended June 30, 2009 compared to $7,552 or 9.62% of net sales for the three months ended June 30, 2008, a decrease of 87.90%. Decreased sales revenue, lower gross margin and high operating expenses were the critical factors which contributed to the decrease in net income.
Liquidity and Capital Resources
Operations and liquidity needs are funded primarily through cash flows from operations. Cash and cash equivalents were $25,448 at June 30, 2009, compared to $25,994 at June 30, 2008, and compared to $32,158 at December 31, 2008.
We believe that the funds available to us are adequate to meet our operating needs for the remainder of 2009.
| | | Six months ended | |
| | | June 30, 2009 | | | June 30, 2008 | |
| Net cash (used in) provided by operating activities | | $ | 721 | | | $ | (1,774 | ) |
| Net cash (used in) investing activities | | $ | (7,295 | ) | | $ | (8 | ) |
| Effect of exchange rate change on cash and cash equivalents | | $ | (135 | ) | | $ | 2,823 | |
| Net increase (decrease) in cash and cash equivalents | | $ | (6,710 | ) | | $ | 1,041 | |
| Cash and cash equivalents at beginning of period | | $ | 32,158 | | | $ | 24,953 | |
| Cash and cash equivalents at end period | | $ | 25,448 | | | $ | 25,994 | |
Operating Activities
Net cash generated from operating activities was $721 for the six months ended June 30, 2009 compared to net cash used in operating activities of $(1,774) for the six months ended June 30, 2008, approximately a 141% increase. The increase was mainly attributable to several factors, including (i) net income of $4,353; (ii) decrease in advance to suppliers of $149; (iii) decrease in prepaid expenses and other current assets of $34, offset by the increase in inventory of $424 and accounts receivable of $801 and decrease in income taxes payable of $1,746 and accounts payable and accrued expenses of $893 in the six months ended June 30, 2009.
| | | Six months ended | |
| | | | June 30, 2009 | | | | June 30, 2008 | |
| a) Increase in inventory | | $ | 424 | | | $ | 6,266 | |
| | | | | | | | | |
| b) Increase in Accounts Receivable | | $ | 801 | | | $ | 11,040 | |
| | | | | | | | | |
| c) Increase in inventory and accounts receivables as a whole a) + b) | | $ | 1,224 | | | $ | 17,306 | |
During the six months ended June 30, 2008, inventory increased significantly as a result of the unprecedented snow storm during the first quarter 2008. There was a shortage of inventory available to our stores. This shortage had a negative impact on our first quarter sales for 2008. As a precautionary measure, the Company decided to increase its level of inventory in order to maintain an adequate level for all stores in the event of other unexpected incidents.
During the six months ended June 30, 2008, our accounts receivable balance increased due to a slow down in accounts receivable turnover, which was partly due to the impact of a slowdown in the global economy, In response to the poor market condition, the Company changed the contract terms for our retail department store customers, where we maintain a store in-store model, to extend the period for repayment from 15 days to 30 days. The extension of repayment terms led to the increase in the balance of accounts receivable at June 30, 2008.
During the six months ended June 30, 2009, the Company has changed its contract terms for retail department from 30 days to 45 days and wholesale department from 10 days to 15 days. This led to the increase of balance of accounts receivable at June 30, 2009. Inventory turnover slowed down slightly during the six months ended June 30, 2009, which caused the slight increase of inventory of $424 compared to December 31, 2008.
Investing Activities
| | | Six months ended | |
| | | June 30, 2009 | | | June 30, 2008 | |
| Net cash used investment activities | | $ | (7,295 | ) | | $ | (8 | ) |
Net cash used in investing activities increased from $8 during the six months ended June 30, 2008 to $7,295 during the six months ended June 30, 2009, due to the deposit payment for the acquisition of Jinhua. Pursuant to the acquisition agreement, the Company paid for the second installment payment of $7,291 during the six months ended Jun 30, 2009.
The Company’s activities focused on the distribution of products. As a result, investments in fixed assets were moderate and hence there is little effect to the utilization of cash over the six months ended June 30, 2008.
Financing Activities
The Company did not carry out any financing activities during the six months ended June 30, 2009 and 2008.
| | | Six months ended | |
| | | June 30, 2009 | | | June 30, 2008 | |
| Net change in cash and cash equivalents | | $ | (6,710 | ) | | $ | 1,041 | |
| | | Six months ended | |
| | | June 30, 2009 | | | June 30, 2008 | |
| Cash and cash equivalent at June 30, 2009 and 2008 | | $ | 25,448 | | | $ | 25,994 | |
With effective internal control systems in place the Company maintained healthy net cash flows over period and achieved a healthy cash position of $25,448 at June 30, 2009 and $25,994 at June 30, 2008.
Capital Expenditures
Total capital expenditures for the first six months of 2009 were $4 for purchase of fixed assets compared to $11 for the first six months of 2008.
Working Capital Requirements
Historically operations and short term financing have been sufficient to meet our cash needs. We believe that we will be able to generate revenues from sales to provide the necessary cash flow to meet anticipated working capital requirements. However, our actual working capital needs for the long and short term will depend upon numerous factors, including operating results, competition, and the availability of credit facilities, none of which can be predicted with certainty. Future expansion will be limited by the availability of financing products and raising capital.
Off-Balance Sheet Arrangements
We have never entered into any off-balance sheet financing arrangements and have never established any special purpose entities. We have not guaranteed any debt or commitments of other entities or entered into any options on non-financial assets.
Item 3. Quantitative and Qualitative Disclosures About Market Risk.
Foreign Currency Exchange Rate Risk
Our financial statements are expressed in U.S. dollars but the functional currency of our operating subsidiaries is RMB. The value of stockholders’ investment in our stock will be affected by the foreign exchange rate between U.S. dollars and RMB. To the extent we hold assets denominated in U.S. dollars any appreciation of the RMB against the U.S. dollar could result in a change to our statement of operations and a reduction in the value of our U.S. dollar denominated assets. On the other hand, a decline in the value of RMB against the U.S. dollar could reduce the U.S. dollar equivalent amounts of our financial results, the value of stockholders’ investment in our company and the dividends we may pay in the future, if any, all of which may have a material adverse effect on the price of our stock.
Our exposure to foreign exchange risk primarily relates to currency gains or losses resulting from timing differences between signing of sales contracts and settling of these contracts. Furthermore, we translate monetary assets and liabilities denominated in other currencies into RMB, the functional currency of our operating business. Our results of operations and cash flow are translated at average exchange rates during the period, and assets and liabilities are translated at the foreign exchange rate at the end of the period. Translation adjustments resulting from this process are included in accumulated other comprehensive income in our statement of shareholders’ equity. We have not used any forward contracts, currency options or borrowings to hedge our exposure to foreign currency exchange risk. We cannot predict the impact of future exchange rate fluctuations on our results of operations and may incur net foreign currency losses in the future.
Interest Rate Risk
Changes in interest rates may affect the interest paid (or earned) and therefore affect our cash flows and results of operations. However, we do not believe that this interest rate change risk is significant.
Inflation
Inflation has not had a material impact on the Company’s business in recent years.
Currency Exchange Fluctuations
All of the Company’s revenues are denominated in Chinese Renminbi, as are expenses. The value of the RMB-to-U.S. dollar and other currencies may fluctuate and is affected by, among other things, changes in political and economic conditions. Since 1994, the conversion of Renminbi into foreign currencies, including U.S. dollars, has been based on rates set by the People’s Bank of China, which are set daily based on the previous day’s inter-bank foreign exchange market rates and current exchange rates on the world financial markets. Since 1994, the official exchange rate for the conversion of Renminbi to U.S. dollars had generally been stable and the Renminbi had appreciated slightly against the U.S. dollar. However, on July 21, 2005, the Chinese government changed its policy of pegging the value of Chinese Renminbi to the U.S. dollar. Under the new policy, Chinese Renminbi may fluctuate within a narrow and managed band against a basket of certain foreign currencies. Recently there has been increased political pressure on the Chinese government to decouple the Renminbi from the United States dollar. At the recent quarterly regular meeting of People’s Bank of China, its Currency Policy Committee affirmed the effects of the reform on Chinese Renminbi exchange rate. In February 2006, the new currency rate system began operating. The currency rate of Renminbi has become more flexible while basically maintaining stable and the expectation for a larger appreciation range is shrinking. The Company has never engaged in currency hedging operations and has no present intention to do so.
Concentration of Credit Risk
Credit risk represents the accounting loss that would be recognized at the reporting date if counterparties failed to perform as contracted. Concentrations of credit risk (whether on or off balance sheet) that arise from financial instruments exist for groups of customers or counterparties when they have similar economic characteristics that would cause their ability to meet contractual obligations to be similarly affected by changes in economic or other conditions as described below:
| | · | The Company’s business is characterized by rapid technological change, new product and service development, and evolving industry standards and regulations. Inherent in the Company’s business are various risks and uncertainties, including the impact from the volatility of the stock market, limited operating history, uncertain profitability and the ability to raise additional capital. |
| | · | All of the Company’s revenue is derived from China. Changes in laws and regulations, or their interpretation, or the imposition of confiscatory taxation, restrictions on currency conversion, devaluations of currency or the nationalization or other expropriation of private enterprises could have a material adverse effect on our business, results of operations and financial condition. |
| | · | If the Company is unable to derive any revenues from China, it would have a significant, financially disruptive effect on the normal operations of the Company. |
Seasonality and Quarterly Fluctuations
Our businesses experience fluctuations in quarterly performance. Traditionally, the first quarter from January to March has a higher number of sales reflected by our electronics business due to the New Year holidays in China occurring during that period.
Item 4. Controls and Procedures.
Evaluation of Disclosure Controls and Procedures
Under the supervision and with the participation of our management, including our principal executive officer and principal financial officer, we conducted an evaluation of our disclosure controls and procedures as of June 30, 2009, as such term is defined in Rules 13a-15(e) and 15d-15(e) under the Exchange Act. Based on this evaluation, our principal executive officer and principal financial officer have concluded that during the period covered by this report, the Company’s disclosure controls and procedures were effective as of such date to ensure that information required to be disclosed by us in our Exchange Act reports is recorded, processed, summarized, and reported within the time periods specified in the SEC’s rules and forms, and that such information is accumulated and communicated to our management, including our principal executive officer and principal financial officer, or persons performing similar functions, as appropriate, to allow timely decisions regarding required disclosures.
Changes in Internal Control over Financial Reporting
There was no change in our internal control over financial reporting that occurred during the second fiscal quarter of 2009 covered by this Quarterly Report on Form 10-Q that has materially affected, or is reasonably likely to materially affect, our internal control over financial reporting.
The Company strives to continue to enhance its internal control over financial reporting and has hired new accounting staff who are familiar with US GAAP to assist with the financial reporting during the second quarter of 2009 and during future quarters.
PART II. OTHER INFORMATION
Item 1. Legal Proceedings.
Neither the Company nor its property is a party to any pending legal proceeding. The Company’s management does not believe that there are any proceedings to which any director, officer, or affiliate of the Company, any owner of record of beneficially held or owner of more than five percent (5%) of the Company’s common stock, or any associate of any such director, officer, affiliate of the Company, or security holder is a party adverse to the Company, or has a material interest adverse to the Company.
Item 1A. Risk Factors.
None.
Item 2. Unregistered Sales of Equity Securities and Use of Proceeds.
None.
Item 3. Defaults Upon Senior Securities.
Not Applicable.
Item 4. Submission of Matters to a Vote of Security Holders.
None.
Item 5. Other Information.
None.
Item 6. Exhibits.
| Exhibit No. | | Document Description |
| 2.1 | | Amendment to Acquisition Agreement dated April 4, 2009 by and among Zhejiang Yong Xing Digital Technology Co. Ltd., Yiwu Yong Xin Communication Ltd. and the shareholders of Jinhua Baofa Logistic Ltd., incorporated by reference from the Registrant’s Current Report filed with the SEC on Form 8-K on April 9, 2009. |
| | | |
| 10.1 | | Letter Agreement dated June 16, 2009 between China 3C Group and Jian Zhang, incorporated by reference from the Registrant’s Current Report filed with the SEC on Form 8-K on June 22, 2009. |
| | | |
| 31.1 | | Certification of the Principal Executive Officer pursuant to Rule 13A-14(A)/15D-14(A) of the Securities Exchange Act of 1934, as adopted pursuant to Section 302 of the Sarbanes-Oxley Act of 2002. |
| | | |
| 31.2 | | Certification of the Principal Accounting and Financial Officer pursuant to Rule 13A-14(A)/15D-14(A) of the Securities Exchange Act of 1934, as adopted pursuant to Section 302 of the Sarbanes-Oxley Act of 2002. |
| | | |
| 32.1 | | Certification of the Principal Executive Officer pursuant to 18 U.S.C. 1350 (Section 906 of the Sarbanes-Oxley Act of 2002). |
| | | |
| 32.2 | | Certification of the Principal Accounting and Financial Officer pursuant to 18 U.S.C. 1350 (Section 906 of the Sarbanes-Oxley Act of 2002). |
SIGNATURES
Pursuant to the requirements of the Securities Exchange Act of 1934, the registrant has duly caused this report to be signed on
its behalf by the undersigned thereunto duly authorized.
| | CHINA 3C GROUP |
| | | |
| Date: August 14, 2009 | By: | /s/ Zhenggang Wang |
| | Name: Zhenggang Wang |
| | Title: Chief Executive Officer and Chairman |
| | (Principal Executive Officer) |
Exhibit Index
| Exhibit No. | | Document Description |
| 2.1 | | Amendment to Acquisition Agreement dated April 4, 2009 by and among Zhejiang Yong Xing Digital Technology Co. Ltd., Yiwu Yong Xin Communication Ltd. and the shareholders of Jinhua Baofa Logistic Ltd., incorporated by reference from the Registrant’s Current Report filed with the SEC on Form 8-K on April 9, 2009. |
| | | |
| 10.1 | | Letter Agreement dated June 16, 2009 between China 3C Group and Jian Zhang, incorporated by reference from the Registrant’s Current Report filed with the SEC on Form 8-K on June 22, 2009. |
| | | |
| 31.1 | | Certification of the Principal Executive Officer pursuant to Rule 13A-14(A)/15D-14(A) of the Securities Exchange Act of 1934, as adopted pursuant to Section 302 of the Sarbanes-Oxley Act of 2002. |
| | | |
| 31.2 | | Certification of the Principal Accounting and Financial Officer pursuant to Rule 13A-14(A)/15D-14(A) of the Securities Exchange Act of 1934, as adopted pursuant to Section 302 of the Sarbanes-Oxley Act of 2002. |
| | | |
| 32.1 | | Certification of the Principal Executive Officer pursuant to 18 U.S.C. 1350 (Section 906 of the Sarbanes-Oxley Act of 2002). |
| | | |
| 32.2 | | Certification of the Principal Accounting and Financial Officer pursuant to 18 U.S.C. 1350 (Section 906 of the Sarbanes-Oxley Act of 2002). |