UNITED STATES
SECURITIES AND EXCHANGE COMMISSION
WASHINGTON, D.C. 20549
FORM 10-Q
QUARTERLY REPORT PURSUANT TO SECTION 13 OR 15(d) OF THE SECURITIES EXCHANGE ACT OF 1934
For the quarterly period ended June 30, 2010
or
TRANSITION REPORT PURSUANT TO SECTION 13 OR 15(d) OF THE SECURITIES EXCHANGE ACT OF 1934
For the transition period from ____ to _____
Commission File Number: 000-28767
China 3C Group
(Exact name of registrant as specified in its charter)
| Nevada | 88-0403070 |
| (State or other jurisdiction of incorporation or organization) | (I.R.S. Employer Identification No.) |
368 HuShu Nan Road
HangZhou City, Zhejiang Province, China 310014
(Address of Principal Executive Offices) (Zip Code)
086-0571-88381700
(Registrant’s telephone number, including area code)
______________________________________________________________________
(Former name, former address and former fiscal year, if changed since last report)
Indicate by check whether the issuer (1) has filed all reports required to be filed by Section 13 or 15(d) of the Securities Exchange Act of 1934 during the preceding 12 months (or for such shorter period that the registrant was required to file such reports), and (2) has been subject to such filing requirements for the past 90 days: Yes x No
Indicate by check mark whether the registrant has submitted electronically and posted on its corporate Web site, if any, every Interactive Data File required to be submitted and posted pursuant to Rule 405 of Regulation S-T (§232.405 of this chapter) during the preceding 12 months (or for such shorter period that the registrant was required to submit and post such files). Yes No
Indicate by check mark whether the registrant is a large accelerated filer, an accelerated filer, a non-accelerated filer, or a smaller reporting company. See the definitions of “large accelerated filer,” “accelerated filer” and “smaller reporting company” in Rule 12b-2 of the Exchange Act.
| Large accelerated filer | | Accelerated filer | | Non-accelerated filer x (Do not check if a smaller reporting company) | | Smaller reporting company |
Indicate by check mark whether the registrant is a shell company (as defined in Rule 12b-2 of the Exchange Act). Yes No x
As of August 12, 2010, the registrant had 54,831,327 shares of common stock outstanding.
TABLE OF CONTENTS
| | PAGE |
| PART I. FINANCIAL INFORMATION | |
| | |
| Item 1. Financial Statements: | |
| | |
| Consolidated Balance Sheets as of June 30, 2010 (Unaudited) and December 31, 2009 | 1 |
| | |
| Consolidated Statements of Operations and Comprehensive Income (Loss) for the Six Months Ended June 30, 2010 and 2009 (Unaudited) | 2 |
| | |
| Consolidated Statements of Operations and Comprehensive Income (Loss) for the Three Months Ended June 30, 2010 and 2009 (Unaudited) | 3 |
| | |
| Consolidated Statements of Cash Flows for the Six Months Ended June 30, 2010 and 2009 (Unaudited) | 4 |
| | |
| Notes to Consolidated Financial Statements | 5 |
| | |
| Item 2. Management’s Discussion and Analysis of Financial Condition and Results of Operations | 22 |
| | |
| Item 3. Quantitative and Qualitative Disclosure About Market Risk | 34 |
| | |
| Item 4T. Controls and Procedures | 36 |
| | |
| PART II. OTHER INFORMATION | |
| | |
| Item 1. Legal Proceedings | 36 |
| | |
| Item 1A. Risk Factors | 36 |
| | |
| Item 2. Unregistered Sales of Equity Securities and Use of Proceeds | 37 |
| | |
| Item 3. Defaults Upon Senior Securities | 37 |
| | |
| Item 4. (Removed and Reserved) | 37 |
| | |
| Item 5. Other Information | 37 |
| | |
| Item 6. Exhibits | 37 |
| | |
| Signatures | 37 |
PART I. FINANCIAL INFORMATION
Item 1. Financial Statements
CHINA 3C GROUP AND SUBSIDIARIES
CONSOLIDATED BALANCE SHEETS
(in thousands)
| | | June 30, | | | December 31, | |
| | | 2010 | | | 2009 | |
| | | (Unaudited) | | | (Audited) | |
| ASSETS | | | | | | |
| | | | | | | |
| Current assets: | | | | | | |
| Cash and cash equivalents | | $ | 29,123 | | | $ | 29,908 | |
| Accounts receivable, net | | | 15,547 | | | | 18,232 | |
| Inventories | | | 6,785 | | | | 6,764 | |
| Advances to suppliers | | | 2,484 | | | | 2,370 | |
| Tax receivable | | | 1,162 | | | | 1,157 | |
| Prepaid expenses and other current assets | | | 246 | | | | 294 | |
| Total current assets | | | 55,347 | | | | 58,725 | |
| | | | | | | | | |
| Property, plant and equipment, net | | | 250 | | | | 279 | |
| Intangible asset, net | | | 13,861 | | | | 14,557 | |
| Goodwill | | | 20,820 | | | | 20,820 | |
| Refundable deposits | | | 11 | | | | 15 | |
| Total assets | | $ | 90,289 | | | $ | 94,396 | |
| | | | | | | | | |
| LIABILITIES AND STOCKHOLDERS' EQUITY | | | | | | | | |
| | | | | | | | | |
| Current liabilities: | | | | | | | | |
| Accounts payable and accrued expenses | | $ | 6,058 | | | $ | 6,838 | |
| Income tax payable | | | 987 | | | | 938 | |
| Total liabilities | | | 7,045 | | | | 7,776 | |
| | | | | | | | | |
| Stockholders' equity | | | | | | | | |
| Common stock, $0.001 par value, 100,000,000 million shares authorized, 54,831,327 issued and outstanding as of June 30, 2010 and December 31, 2009, respectively | | | 55 | | | | 55 | |
| Additional paid-in capital | | | 20,002 | | | | 19,751 | |
| Subscription receivable | | | (50 | ) | | | (50 | ) |
| Statutory reserve | | | 11,535 | | | | 11,535 | |
| Other comprehensive income | | | 5,149 | | | | 5,180 | |
| Retained earnings | | | 46,553 | | | | 50,149 | |
| Total stockholders' equity | | | 83,244 | | | | 86,620 | |
| Total liabilities and stockholders' equity | | $ | 90,289 | | | $ | 94,396 | |
The accompanying notes are an integral part of these consolidated financial statements.
CHINA 3C GROUP AND SUBSIDIARIES
CONSOLIDATED STATEMENTS OF OPERATIONS AND COMPREHENSIVE INCOME (LOSS)
SIX MONTHS ENDED JUNE 30, 2010 and 2009 (UNAUDITED)
(in thousands)
| | | 2010 | | | 2009 | |
| Net sales | | $ | 78,226 | | | $ | 128,537 | |
| Cost of sales | | | 70,939 | | | | 112,458 | |
| Gross profit | | | 7,287 | | | | 16,079 | |
| Selling, general and administrative expenses | | | 10,702 | | | | 10,235 | |
| Income (loss) from operations | | | (3,415) | | | | 5,844 | |
| | | | | | | | | |
| Other (income) expense | | | | | | | | |
| Interest income | | | (47 | ) | | | (54 | ) |
| Other income | | | (7 | ) | | | (163 | ) |
| Other expense | | | 44 | | | | 116 | |
| Total other (income) expense | | | (10 | ) | | | (101 | ) |
| | | | | | | | | |
| Income (loss) before income taxes | | | (3,405) | | | | 5,945 | |
| Provision for income taxes | | | 190 | | | | 1,591 | |
| Net income (loss) | | | (3,595) | | | | 4,354 | |
| Foreign currency translation adjustments | | | 48 | | | | (129) | |
| Comprehensive income (loss) | | $ | (3,547) | | | $ | 4,225 | |
| | | | | | | | | |
| Net income (loss) available to common shareholders per share: | | | | | | | | |
| Basic | | $ | (0.07) | | | $ | 0.08 | |
| Diluted | | $ | (0.07) | | | $ | 0.08 | |
| | | | | | | | | |
| Weighted average shares outstanding: | | | | | | | | |
| Basic | | | 54,831,327 | | | | 53,682,309 | |
| Diluted | | | 54,831,327 | | | | 53,682,309 | |
The accompanying notes are an integral part of these consolidated financial statements.
CHINA 3C GROUP AND SUBSIDIARIES
CONSOLIDATED STATEMENTS OF OPERATIONS AND COMPREHENSIVE INCOME (LOSS)
THREE MONTHS ENDED JUNE 30, 2010 and 2009 (UNAUDITED)
(in thousands)
| | | 2010 | | | 2009 | |
| Net sales | | $ | 37,428 | | | $ | 51,126 | |
| Cost of sales | | | 33,506 | | | | 45,105 | |
| Gross profit | | | 3,922 | | | | 6,021 | |
| Selling, general and administrative expenses | | | 5,488 | | | | 4,750 | |
| Income (loss) from operations | | | (1,566) | | | | 1,271 | |
| | | | | | | | | |
| Other (income) expense | | | | | | | | |
| Interest income | | | (22 | ) | | | (25 | ) |
| Other income | | | (3 | ) | | | (15 | ) |
| Other expense | | | 44 | | | | 5 | |
| Total other (income) expense | | | 19 | | | | (35 | ) |
| | | | | | | | | |
| Income (loss) before income taxes | | | (1,585) | | | | 1,306 | |
| Provision for income taxes | | | 83 | | | | 392 | |
| Net income (loss) | | | (1,668) | | | | 914 | |
| Foreign currency translation adjustments | | | 40 | | | | 8 | |
| Comprehensive income (loss) | | $ | (1,628) | | | $ | 922 | |
| | | | | | | | | |
| Net income (loss) available to common shareholders per share: | | | | | | | | |
| Basic | | $ | (0.03) | | | $ | 0.02 | |
| Diluted | | $ | (0.03) | | | $ | 0.02 | |
| | | | | | | | | |
| Weighted average shares outstanding: | | | | | | | | |
| Basic | | | 54,831,327 | | | | 53,931,327 | |
| Diluted | | | 54,831,327 | | | | 53,931,327 | |
The accompanying notes are an integral part of these consolidated financial statements.
CHINA 3C GROUP AND SUBSIDIARIES
CONSOLIDATED STATEMENTS OF CASH FLOWS
FOR THE SIX MONTHS ENDED JUNE, 2010 and 2009 (UNAUDITED)
(in thousands)
| | | 2010 | | | 2009 | |
| | | | | | | |
| CASH FLOW FROM OPERATING ACTIVITIES | | | | | | |
| Net income (loss) | | $ | (3,595 | ) | | $ | 4,354 | |
| Adjustments to reconcile net income (loss) to net cash provided by (used in) operating activities: | | | | | | | | |
| Depreciation | | | 11 | | | | 13 | |
| Amortization of intangible assets | | | 702 | | | | - | |
| Provision for bad debts | | | | | | | 3, | |
| Stock based compensation | | | 251 | | | | - | |
| (Increase) / decrease in assets: | | | | | | | | |
| Accounts receivable | | | 2,751 | | | | (801 | ) |
| Other receivable | | | 13 | | | | 26 | |
| Inventories | | | 7 | | | | (424 | ) |
| Prepaid expenses and other current assets | | | 36 | | | | 35 | |
| Refundable deposits | | | 5 | | | | 5 | |
| Advance to suppliers | | | (103 | ) | | | 149 | |
| (Increase) / decrease in current liabilities: | | | | | | | | |
| Advance from customers | | | 23 | | | | - | |
| Accounts payable and accrued expenses | | | (771 | ) | | | (893 | ) |
| Income tax payable | | | 45 | | | | (1,746 | ) |
| Net cash (used in) provided by operating activities | | | (625 | ) | | | 721 | |
| | | | | | | | | |
| CASH FLOW FROM INVESTING ACTIVITIES | | | | | | | | |
| Purchase of property and equipment | | | (18 | ) | | | (4 | ) |
| Deposit for acquisition of subsidiary | | | - | | | | (7,291 | ) |
| Net cash used in investing activities | | | (18 | ) | | | (7,295 | ) |
| | | | | | | | | |
| Effect of exchange rate changes on cash and cash equivalents | | | (142 | ) | | | (136 | ) |
| | | | | | | | | |
| Net decrease in cash | | | (785 | ) | | | (6,710 | ) |
| Cash, beginning of period | | | 29,908 | | | | 32,158 | |
| Cash, end of period | | $ | 29,123 | | | $ | 25,448 | |
| | | | | | | | | |
| Supplemental disclosure of cash flow information: | | | | | | | | |
| Interest paid | | $ | - | | | $ | - | |
| Income taxes paid | | $ | 74 | | | $ | 3,340 | |
The accompanying notes are an integral part of these consolidated financial statements.
CHINA 3C GROUP AND SUBSIDIARIES
NOTES TO CONDENSED CONSOLIDATED FINANCIAL STATEMENTS
JUNE 30, 2010
(UNAUDITED)
Note 1 - ORGANIZATION
China 3C Group (the “Company” or “China 3C”) was incorporated on August 20, 1998 under the laws of the State of Nevada. Capital Future Developments Limited - BVI (“Capital”) was incorporated on July 22, 2004 under the laws of the British Virgin Islands. Zhejiang Yong Xin Digital Technology Company Limited (“Zhejiang”), Yiwu Yong Xin Communication Limited (“Yiwu”), Hangzhou Wang Da Electronics Company Limited (“Wang Da”), Hangzhou Sanhe Electronic Technology Limited (“Sanhe”), and Shanghai Joy & Harmony Electronics Company Limited (“Joy & Harmony”), Jinhua Baofa Logistic Ltd (“Jinhua”) were incorporated under the laws of Peoples Republic of China (“PRC”) on July 11, 2005, July 18, 1997, March, 30, 1998, April 12, 2004, August 20, 2003 and December 27, 2001, respectively. All dollar amounts are in thousands, unless otherwise indicated.
On December 21, 2005, Capital became a wholly owned subsidiary of China 3C Group through a reverse merger (“Merger Transaction”). China 3C Group acquired all of the issued and outstanding capital stock of Capital pursuant to a Merger Agreement dated December 21, 2005 by and among China 3C Group, XY Acquisition Corporation, Capital and the shareholders of Capital (the “Merger Agreement”). Pursuant to the Merger Agreement, Capital became a wholly owned subsidiary of China 3C Group and, in exchange for the Capital shares, China 3C Group issued 35,000,000 shares of its common stock to the shareholders of Capital, representing 93% of the issued and outstanding capital stock of China 3C Group at that time and cash of $500.
On August 3, 2006, Capital completed the acquisition of a 100% interest in Sanhe for a cash and stock transaction valued at approximately $8,750. The consideration consisted of 915,751 newly issued shares of the Company’s common stock and $5,000 in cash.
On November 28, 2006, Capital completed the acquisition of a 100% interest in Joy & Harmony for a cash and stock transaction valued at approximately $18,500. The consideration consisted of 2,723,110 shares of the Company’s common stock and $7,500 in cash.
On August 15, 2007, the Company changed its ownership structure. As a result, instead of Capital owning 100% of Zhejiang, Capital entered into contractual agreements with Zhejiang whereby Capital owns a 100% interest in the revenues of Zhejiang. Capital does not have an equity interest in Zhejiang, but enjoys all the economic benefits. Under this structure, Zhejiang is now a wholly foreign owned enterprise of Capital. The contractual agreements give Capital and its equity owners an obligation, and having ability to absorb, any losses, and rights to receive returns. Capital will be unable to make significant decisions about the activities of Zhejiang and cannot carry out its principal activities without financial support. These characteristics as defined in the Financial Accounting Standards Board (“FASB”) Accounting Standards Codification (“ASC”) Topic 810, Consolidation of Variable Interest Entities (VIEs), qualify the business operations of Zhejiang to be consolidated with Capital and ultimately with China 3C.
On July 6, 2009, China 3C and its subsidiary Zhejiang and Yiwu purchased 100% interest of Jinhua for RMB 120 million (approximately $17,500) in cash. Zhejiang acquired 90% and Yiwu acquired 10% of the entire equity interests in Jinhua.
The purchase price and related allocation to the estimated fair values of the assets acquired and liabilities assumed, after proportionately allocating the goodwill resulting from the transaction in accordance with FASB ASC Topic 805 “Business Combinations” is as follows:
| Cash paid for acquisition of Jinhua | | $ | 17,508 | |
| | | | | |
| Assets acquired: | | | | |
| Cash | | $ | 2,406 | |
| Accounts receivable, net | | | 715 | |
| Other receivables, net | | | 60 | |
| Prepaid expenses | | | 133 | |
| Property, plant and equipment | | | 216 | |
| Intangible asset - transportation network | | | 15,182 | |
| Goodwill | | | 472 | |
| Assets acquired | | | 19,184 | |
| | | | | |
| Liabilities assumed: | | | | |
| Accounts payable | | | 315 | |
| Accrued expenses and other payables | | | 547 | |
| Income taxes payable | | | - | |
| Due to shareholders | | | 814 | |
| Liabilities assumed | | | 1,676 | |
| | | | | |
| Net assets acquired | | $ | 17,508 | |
Following the acquisition of Jinhua, the Company began providing logistic service to businesses in addition to its traditional business of resale and distribution of third party products such as mobile phones, facsimile machines, DVD players, stereos, speakers, MP3 and MP4 players, iPods, electronic dictionaries, CD players, radio Walkmans and audio systems.
Note 2 - SUMMARY OF SIGNIFICANT ACCOUNTING POLICIES
Basis of Presentation
The accompanying consolidated financial statements were prepared in conformity with accounting principles generally accepted in the United States of America (“US GAAP”). The Company’s functional currency is the Chinese Renminbi, however, the accompanying consolidated financial statements have been translated and presented in United States Dollars.
Principles of Consolidation
The consolidated financial statements include the accounts of China 3C Group and its wholly owned subsidiaries Capital, Wang Da, Yiwu, Joy & Harmony, Sanhe and Jinhua and variable interest entity Zhejiang, collectively referred to as the Company. All material intercompany accounts, transactions and profits were eliminated in consolidation.
Currency Translation
The accounts of Zhejiang, Wang Da, Yiwu, Sanhe, Joy & Harmony and Jinhua were maintained, and its financial statements were expressed, in Chinese Yuan Renminbi (“RMB”). Such financial statements were translated into U.S. Dollars (“USD”) in accordance with FASB ASC Topic 830-10, “Foreign Currency Translation,” with the RMB as the functional currency. According to FASB ASC Topic 830-10, assets and liabilities were translated at the ending exchange rate, stockholders’ equity is translated at the historical rates and income statement items are translated at the average exchange rate for the period. The resulting translation adjustments are reported as other comprehensive income in accordance with FASB ASC Topic 220, “Reporting Comprehensive Income,” as a component of shareholders’ equity. Transaction gains and losses are reflected in the consolidated income (loss) and comprehensive income (loss) statement.
Use of Estimates
The preparation of financial statements in conformity with US GAAP requires management to make estimates and assumptions that affect the reported amounts of assets and liabilities and disclosure of contingent assets and liabilities at the date of the financial statements and the reported amounts of revenues and expenses during the reporting period. Actual results could differ from those estimates.
Risks and Uncertainties
The Company is subject to substantial risks from, among other things, intense competition associated with the industry in general, other risks associated with financing, liquidity requirements, rapidly changing customer requirements, limited operating history, foreign currency exchange rates and the volatility of public markets.
Contingencies
Certain conditions may exist as of the date the financial statements are issued, which could result in a loss to the Company but which will only be resolved when one or more future events occur or fail to occur. The Company’s management assesses such contingent liabilities, and such assessment inherently involves an exercise of judgment. In assessing loss contingencies related to legal proceedings that are pending against the Company or unasserted claims that may result in such proceedings, the Company’s management evaluates the perceived merits of any legal proceedings or unasserted claims as well as the perceived merits of the amount of relief sought or expected to be sought.
If the assessment of a contingency indicates that it is probable that a material loss has been incurred and the amount of the liability can be estimated, then the estimated liability is accrued in the Company’s financial statements. If the assessment indicates that a potential material loss contingency is not probable but is reasonably possible, or is probable but cannot be estimated, then the nature of the contingent liability, together with an estimate of the range of possible loss if determinable and material would be disclosed.
Loss contingencies considered to be remote by management are generally not disclosed unless they involve guarantees, in which case the guarantee would be disclosed.
Accounts Receivable
The Company maintains reserves for potential credit losses on accounts receivable. Management reviews the composition of accounts receivable and analyzes historical bad debts, customer concentrations, customer credit worthiness, current economic trends and changes in customer payment patterns to evaluate the adequacy of these reserves. Terms of the sales vary. Reserves are recorded primarily on a specific identification basis. Allowance for doubtful debts was $403 (unaudited) and $404 as of June 30, 2010 and December 31, 2009, respectively.
Inventories
Inventories are valued at the lower of cost (determined on a weighted average basis) or market. Management compares the cost of inventories with the market value and allowance is made for writing down their inventories to market value, if lower. As of June 30, 2010 and December 31, 2009, inventory consisted entirely of finished goods valued at $6,786 (unaudited) and $6,764, respectively.
Property, Plant & Equipment, net
Property, plant and equipment are stated at cost. Expenditures for maintenance and repairs are charged to earnings as incurred; additions, renewals and betterments are capitalized. When property and equipment are retired or otherwise disposed of, the related cost and accumulated depreciation are removed from the respective accounts, and any gain or loss is included in operations. Depreciation of property and equipment is provided using the straight-line method for substantially all assets with estimated lives of:
| Automotive | 5 years |
| Office Equipment | 5 years |
As of June 30, 2010 and December 31, 2009, property and equipment consisted of the following:
| | | 2010 | | | 2009 | |
| | | (Unaudited) | | | | |
| Automotive | | $ | 836 | | | $ | 877 | |
| Office equipment | | | 132 | | | | 132 | |
| Leasehold improvement | | | 67 | | | | 67 | |
| Plant and Equipment | | | 3 | | | | 3 | |
| Sub Total | | | 1,038 | | | | 1,079 | |
| Less: accumulated depreciation | | | (788 | ) | | | (800 | ) |
| Total | | $ | 250 | | | $ | 279 | |
Long-Lived Assets
The Company periodically evaluates the carrying value of long-lived assets to be held and used in accordance with FASB ASC Topic 360 “Property, Plant and Equipment” requires impairment losses to be recorded on long-lived assets used in operations when indicators of impairment are present and the undiscounted cash flows estimated to be generated by those assets are less than the assets’ carrying amounts. In that event, a loss is recognized based on the amount by which the carrying amount exceeds the fair market value of the long-lived assets. Losses on long-lived assets to be disposed of are determined in a similar manner, except that fair market values are reduced for the cost of disposal. Based on its review, the Company believes that, as of June 30, 2010 (unaudited) and December 31, 2009, there were no significant impairments of its long-lived assets.
Fair Value of Financial Instruments
FASB ASC Topic 825 “Financial Instruments” requires that the Company disclose estimated fair values of financial instruments. The carrying amounts reported in the statements of financial position for current assets and current liabilities qualifying as financial instruments are a reasonable estimate of fair value.
Revenue Recognition
In accordance with Securities and Exchange Commission (“SEC”) Staff Accounting Bulletin (“SAB”) 104, the Company recognizes revenues when there is persuasive evidence of an arrangement, product delivery and acceptance have occurred, the sales price is fixed and determinable, and collectability of the resulting receivable is reasonably assured.
The Company records revenues when title and the risk of loss pass to the customer. Generally, these conditions occur on the date the customer takes delivery of the product. Revenue is generated from sales of China 3C products through two main revenue streams:
| | 1. | Retail. 68.7%, 69.0%, 68.6% and 69.1% of the Company’s revenue comes from sales to individual customers at outlets installed inside department stores etc. (i.e. store in store model) during the three and six months ended June 30, 2010 and 2009, respectively and is mainly achieved through two broad categories: |
| | a. | Purchase contracts. The terms for sales by purchase contracts were 45 days from the transfer of goods to the customer in 2010 and 30 days in 2009. Under this method, the Company delivers goods to places designated by the customers and receives confirmation of delivery. At that time, ownership and all risks associated to the goods are transferred to the customers and payment is made within the terms. The Company relieves its inventory and recognizes revenue upon receipt of confirmation from the customer. |
| | b. | Point of sale transfer of ownership. Under this method, the Company’s products are placed in third party stores and sold by the Company’s sales people. Upon purchase of the item by the customer, the Company relieves its inventory and recognizes revenue related to that item. |
| | 2. | Wholesale. 31.3% , 31.0%, 31.4% and 30.9% of the Company’s revenue comes from wholesale during the three and six months ended June 30, 2010 and 2009, respectively. Recognition of wholesale income is based on the contract terms. The main contract terms on wholesale were 15 days after receipt of goods in 2010 and 10 days in 2009 and that ownership and all risks associated with the goods are transferred to the customers on the date of goods received. |
Sales revenue is therefore recognized on the following basis:
| | a. | For goods sold under sales and purchase contracts, revenue is recognized when goods are received by customers. |
| | b. | For goods at customer outlets which the Company’s sales people operate, and inventory of goods is under joint control by the customers and the Company, revenue is recognized at the point of sale to the end buyer. |
During public holidays or department store celebration periods, we provide certain sales incentives to retail customers to increase sales, such as gift giving and price reductions. These are the only temporary incentives during the specified periods. Sales made to our retail customers as a result of incentives are immaterial as a percentage of total sales revenue.
| | a. | Revenue is recognized at the date the goods are received by the wholesale customers. We operate our wholesale business by selling large volume orders to second-tier distributors and large department stores. Revenues from wholesale are recognized as net sales after confirmation with distributors. Net sales already take into account revenue dilution as they exclude inventory credit, discount from early payment, product obsolescence and return of products and other allowances. Net sales also take into account the return of products in accordance with relevant laws and regulations in China. |
Return policies
Our return policy complies with China’s laws and regulations on consumer’s rights and product quality. In accordance with Chinese law, consumers can return or exchange used products within seven days only if the goods do not meet safety and health requirements, endanger a person’s property, or do not meet the advertised performance. If the conditions and requirements as set out in the relevant laws and regulations are met, the retail stores are entitled to accept a return of the goods from the consumer. In such cases, the Company shall accept the returns unconditionally. Goods returned will be redirected to the production factory or supplier who shall bear all losses on the returns in accordance the laws and regulations. Consumer returns or exchanges of products that have not been used, where the packaging has not been damaged, are honored if such return or exchange is within seven days. If a consumer returns a product, the Company must refund the invoice price to the consumer. The Company will then be responsible for returning the goods to the production factory or supplier. At that time the Company can recover the price based on the purchase and sale contract with the producer or supplier. However, when goods are returned, the Company loses the gross margin that it records when revenue is recognized, regardless of whether the production factory or supplier takes the product back or not.
The return rights granted to wholesale customers are similar to the rights granted to retail customers. Once wholesale customers purchase the products, they follow the same return policy as retail customers. We do not honor any return from wholesale customers other than if the products don’t meet laws and regulations or quality requirements. If the wholesale customers have a high inventory level or product obsolescence caused by lower market demands or other operational issues, the wholesale customers bear their own losses. When a wholesale customer returns products, the Company will return the products to the suppliers or manufacturers. A sales return and allowance is recorded at the sales price. Meanwhile, a purchase return and allowance entry is recorded at the invoice price because the suppliers or manufacturers bear the losses. The net effect is that the Company derecognizes the gross profit when a return takes place, but does not record any loss on the cost of the returned item back to the supplier or manufacturer.
In light of the aforesaid PRC laws and regulations and the Company’s arrangements with suppliers, we do not provide an accrual for any estimated losses on subsequent sale of the return of products. As a result we do not engage in assessing levels of inventory in the distribution channel, product obsolescence and/or introductions of new products, as none of those factors have any impact on us with respect to estimating losses on subsequent sale of returned goods. Third party market research report and consumer demand study is not used to make estimates of goods returned.
Cost of Sales
Cost of sales consists of actual product cost, which is the purchase price of the product less any discounts. Cost of sales excludes freight charges, purchase and delivery costs, internal transfer, freight charges and the other costs of the Company’s distribution network, which are identified in general and administrative expenses.
General and Administrative Expenses
General and administrative expenses are comprised principally of payroll and benefits costs for retail and corporate employees, occupancy costs of corporate facilities, lease expenses, management fees, traveling expenses and other operating and administrative expenses, including freight charges, purchase and delivery costs, internal transfer freight charges and other distribution costs.
Shipping and handling fees
The Company follows FASB ASC Topic 605-45, “Handling Costs, Shipping Costs”. The Company does not charge its customers for shipping and handling. The Company classifies shipping and handling fees as part of general and administrative expenses. During the three and six months ended June 30, 2010 and 2009, the Company incurred shipping and handling fees and costs of $56, $60, $107 and $103, respectively.
Vendor Discounts
The Company negotiated preferred pricing arrangements with certain vendors on certain products. These arrangements are not contingent on any levels of volume and are considered vendor discounts as opposed to rebates. The Company records these discounts along with the purchase of the discounted items, resulting in lower inventory cost and a corresponding lower cost of sales as the products are sold.
Management fees paid to the department stores under “store in store” model
Under the “store in store” business operation model, the Company may pay management fees to the department stores, which are in the form of service charges or “selling at an allowance (discount)”. The management fees are accounted for (1) in the form of service charges which are reflected in general and administrative expenses, or (2) in the form of “selling at an allowance (discount)”, as a deduction of sales, which means, the expenses are directly deducted at a certain percentage on sales. Such management fees accounted for general and administrative expenses were $290, $244, $426 and $730 during the three and six months ended June 30, 2010 and 2009 respectively. Management fees accounted for deductions of sales were $1,299, $1,880, $2,559 and $4,245 in sales for the three and six months ended June 30, 2010 and 2009, respectively.
Share Based Payment
The Company adopted FASB ASC Topic 718-10, “Stock Compensation”, which addresses the accounting for transactions in which an entity exchanges its equity instruments for goods or services, with a primary focus on transactions in which an entity obtains employee services in share-based payment transactions. FASB ASC Topic 718-10 requires measurement of the cost of employee services received in exchange for an award of equity instruments based on the grant-date fair value of the award (with limited exceptions). Incremental compensation costs arising from subsequent modifications of awards after the grant date must be recognized.
Advertising
Advertising expenses consist primarily of costs of promotion for corporate image and product marketing and costs of direct advertising. The Company expenses all advertising costs as incurred. Advertising expense was $114, $71, $200 and $128 for the three and six months ended June 30, 2010 and 2009.
Other Income
Other income was $3 and $15, $7 and $163 for the three and six months ended June 30, 2010 and 2009. Other income consists of the following:
| | | Six months ended June 30, | |
| | | 2010 | | | 2009 | |
| Advertising service income | | $ | - | | | $ | 101 | |
| Repair service income | | | - | | | | 29 | |
| Commission income from China Unicom | | | - | | | | 30 | |
| Other | | | 7 | | | | - | |
| Total other income | | $ | 7 | | | $ | 163 | |
| | | Three months ended June 30, | |
| | | 2010 | | | 2009 | |
| Repair service income | | $ | - | | | $ | 15 | |
| Other | | | 3 | | | | - | |
| Total other income | | $ | 3 | | | $ | 15 | |
Advertising service income is the fee we receive from electronic product manufacturers when we advertise their products in our retail locations. Commission income from China Unicom is derived from the sales of China Unicom’s wireless service and products, i.e. rechargeable mobile phone cards.
Income Taxes
The Company utilizes FASB ASC Topic 740 “Income Taxes”. Deferred income taxes are recognized for the tax consequences in future years of differences between the tax bases of assets and liabilities and their financial reporting amounts at each period end based on enacted tax laws and statutory tax rates applicable to the periods in which the differences are expected to affect taxable income. Valuation allowances are established, when necessary, to reduce deferred tax assets to the amount expected to be realized.
Basic and Diluted Earnings (Loss) per Share
Earnings (loss) per share are calculated in accordance with FASB ASC Topic 260, “Earnings per Share”. Basic earnings (loss) per share is based upon the weighted average number of common shares outstanding. Diluted earnings (losses) per share is based on the assumption that all dilutive convertible shares and stock options were converted or exercised. Dilution is computed by applying the treasury stock method. Under this method, options and warrants are assumed to be exercised at the beginning of the period (or at the time of issuance, if later), and as if funds obtained thereby were used to purchase common stock at the average market price during the period. If convertible shares and stock options are anti-dilutive, the impact of conversion is not included in the diluted net income per share. Excluded from the calculation of diluted earnings per share for the three and six months ended June 30, 2010 was 100,000 options, as they were not dilutive. Excluded from the calculation of diluted earnings per share for the three and six months ended June 30, 2009 was 50,000 options, as they were not dilutive.
Statement of Cash Flows
In accordance with FASB ASC Topic 230 “Statement of Cash Flows”, cash flows from the Company’s operations are calculated based upon the functional currency, in our case the RMB. As a result, amounts related to changes in assets and liabilities reported on the statement of cash flows will not necessarily agree with the changes in the corresponding balances on the balance sheet.
Concentration of Credit Risk
Financial instruments that potentially subject the Company to concentrations of credit risk are cash, accounts receivable, advances to suppliers and other receivables arising from its normal business activities. The Company places its cash in what it believes to be credit-worthy financial institutions. The Company has a diversified customer base, most of which is in China. The Company controls credit risk related to accounts receivable through credit approvals, credit limits and monitoring procedures. The Company routinely assesses the financial strength of its customers and, based upon factors surrounding the credit risk, establishes an allowance, if required, for uncollectible accounts and, as a consequence, believes that its accounts receivable credit risk exposure beyond such allowance is limited.
Segment Reporting
FASB ASC Topic 280, “Segment Reporting” requires use of the “management approach” model for segment reporting. The management approach model is based on the way a company’s management organizes segments within the company for making operating decisions and assessing performance. Reportable segments are based on products and services, geography, legal structure, management structure, or any other manner in which management disaggregates a company. The Company operates in five segments during 2010 (see Note 14).
Recent Accounting Pronouncements
FASB ASC Topic 805 “Business Combinations” addresses the accounting and disclosure for identifiable assets acquired, liabilities assumed, and noncontrolling interests in a business combination. FASB ASC Topic 805 requires an acquiring entity to recognize all the assets acquired and liabilities assumed in a transaction at the acquisition-date fair value, with limited exceptions, and applies to a wider range of transactions or events. FASB ASC Topic 805 is effective for fiscal years beginning on or after December 15, 2008 and early adoption and retrospective application is prohibited. The Company adopted FASB ASC Topic 805 on January 1, 2009. The Company accounted for the acquisition of Jinhua in accordance with these standards.
FASB ASC Topic 810 “Consolidation” establishes accounting and reporting standards for the non-controlling (minority) interest in a subsidiary and for the deconsolidation of a subsidiary. It clarifies that a non-controlling interest in a subsidiary is an ownership interest in the consolidated entity that should be reported as equity in the consolidated financial statements. The Company adopted FASB ASC Topic 810 on January 1, 2009. The adoption of this statement had no effect on the Company’s consolidated financial statements.
FASB ASC Topic 815 “Derivatives and Hedging” is intended to improve financial reporting about derivative instruments and hedging activities by requiring enhanced disclosures to enable investors to better understand their effects on an entity’s financial position, financial performance, and cash flows. It is effective for financial statements issued for fiscal years and interim periods beginning after November 15, 2008, with early application encouraged. The Standard also improves transparency about the location and amounts of derivative instruments in an entity’s financial statements; how derivative instruments and related hedged items are accounted for under Statement 133; and how derivative instruments and related hedged items affect its financial position, financial performance, and cash flows. The Company adopted FASB ASC Topic 815 on January 1, 2009. The adoption of this statement had no effect on the Company’s consolidated financial statements.
FASB ASC Topic 825 “Financial Instruments” requires that the fair value disclosures required for all financial instruments within the scope of FASB ASC Topic 825-10, “Disclosures about Fair Value of Financial Instruments”, be included in interim financial statements. This FSP also requires entities to disclose the method and significant assumptions used to estimate the fair value of financial instruments on an interim and annual basis and to highlight any changes from prior periods. FASB ASC Topic 825 was effective for interim periods ending after June 15, 2009. The adoption of FASB ASC Topic 825 did not have a material effect on the Company’s consolidated financial statements.
FASB ASC Topic 860 “Transfers and servicing” requires more information about transfers of financial assets and where companies have continuing exposure to the risks related to transferred financial assets. FASB ASC Topic 860 is effective at the start of a company’s first fiscal year beginning after November 15, 2009, or January 1, 2010 for companies reporting earnings on a calendar-year basis. The adoption of this statement did not have a material effect on the Company’s financial statements.
Revisions under FASB ASC Topic 810 “Consolidation”, revises how a company determines when an entity that is insufficiently capitalized or is not controlled through voting (or similar rights) should be consolidated. Under FASB ASC Topic 810, determining whether a company is required to consolidate an entity will be based on, among other things, an entity’s purpose and design and a company’s ability to direct the activities of the entity that most significantly impact the entity’s economic performance. FASB ASC Topic 810 is effective at the start of a company’s first fiscal year beginning after November 15, 2009, or January 1, 2010 for companies reporting earnings on a calendar-year basis. The adoption of FASB ASC Topic 810 did not have any impact on our financial statements.
In June 2009, the FASB issued Accounting Standards Update “ASU” 2009-1. The FASB approved its Codification ASC as the single source of authoritative United States accounting and reporting standards applicable for all non-governmental entities, with the exception of the SEC and its staff. The Codification is effective for interim or annual financial periods ending after September 15, 2009 and impacts our financial statements as all future references to authoritative accounting literature will be referenced in accordance with the Codification. There have been no changes to the content of our financial statements or disclosures as a result of implementing the Codification.
In April 2010, FASB issued ASU 2010-13, Compensation – Stock Compensation (Topic 718): Effect of Denominating the Exercise Price of a Share-Based Payment Award in the Currency of the Market in Which the Underlying Equity Security Trades. ASU 2010-13 provides guidance on the classification of a share-based payment award as either equity or a liability. A share-based payment that contains a condition that is not a market, performance, or service condition is required to be classified as a liability. ASU 2010-13 is effective for fiscal years, and interim periods within those fiscal years, beginning on or after December 15, 2010 and is not expected to have a significant impact on the Company’s financial statements.
In April 2010, the FASB issued ASU 20-10-17, “Revenue Recognition—Milestone Method (Topic 605): Milestone Method of Revenue Recognition” or ASU 2010-17. This Update provides guidance on the recognition of revenue under the milestone method, which allows a vendor to adopt an accounting policy to recognize all of the arrangement consideration that is contingent on the achievement of a substantive milestone (milestone consideration) in the period the milestone is achieved. The pronouncement is effective on a prospective basis for milestones achieved in fiscal years and interim periods within those years, beginning on or after June 15, 2010. The adoption of this ASU does not have a material impact on the Company’s consolidated financial statements.
Note 3 – ADVANCES TO SUPPLIERS
Advances to suppliers represent advance payments to suppliers for the purchase of inventory. As of June 30, 2010 and December 31, 2009, the Company had $2,484 (unaudited) and $2,370, respectively, as advances to suppliers.
Note 4– ACCOUNTS PAYABLE AND ACCRUED EXPENSES
Accounts payable and accrued expenses as of June 30, 2010 (unaudited) and December 31, 2009 consist of the following:
| | | 2010 | | | 2009 | |
| Accounts payable | | $ | 3,785 | | | $ | 3,729 | |
| Accrued expenses and other payable | | | 2,111 | | | | 2,874 | |
| VAT tax payable | | | 139 | | | | 235 | |
| Advance from customers | | | 23 | | | | - | |
| Total | | $ | 6,058 | | | $ | 6,838 | |
Note 5 - COMMON STOCK
On January 15, 2009, the Company’s of Directors (“BOD”) adopted the China 3C Group, Inc. 2008 Omnibus Securities and Incentive Plan (the “2008 Plan”). The 2008 Plan provides for the granting of distribution equivalent rights, incentive stock options, non-qualified stock options, performance share awards, performance unit awards, restricted stock awards, stock appreciation rights, tandem stock appreciation rights, unrestricted stock awards or any combination of the foregoing, as may be best suited to the circumstances of the particular employee, director or consultant. Under the 2008 Plan 2,000,000 shares of the Company’s common stock are available for issuance for awards. Each award shall remain exercisable for a term of ten (10) years from the date of its grant. The price at which a share of common stock may be purchased upon exercise of an option shall not be less than the closing sales price of the common stock on the date such option is granted. The 2008 Plan shall continue in effect, unless sooner terminated, until the tenth anniversary of the date on which it is adopted by the BOD.
In April and October 2009, the Company issued 1,997,272 shares of common stock under the 2008 Plan. The cost is expected to be recognized over a three year period. $250 and $125 was recognized as stock based compensation expense during the six and three months ended June 30, 2010.
Note 6 - STOCK WARRANTS, OPTIONS, AND COMPENSATION
Stock options— Options issued have a ten-year life and were fully vested upon issuance. The option holder has no voting or dividend rights. The grant price was equal the market price at the date of grant. The Company records the expense of the stock options over the related vesting period. The options were valued using the Black-Scholes option-pricing model at the date of grant stock option pricing.
Outstanding options by exercise price consisted of the following as of June 30, 2010.
| Options Outstanding | | | Options Exercisable | |
| Exercise Price | | | Number of Shares | | | Weighted Average Remaining Life (Years) | | | Weighted Average Exercise Price | | | Number of Shares | | | Weighted Average Exercise Price | |
| $ | 3.80 | | | | 50,000 | | | | 0.50 | | | $ | 3.80 | | | | 50,000 | | | $ | 3.80 | |
| | 4.16 | | | | 50,000 | | | | 7.50 | | | | 4.16 | | | | 50,000 | | | | 4.16 | |
Note 7 - COMPENSATED ABSENCES
Regulation 45 of the labor laws in the PRC entitles employees to annual vacation leave after 1 year of service. In general all leave must be utilized annually, with proper notification, any unutilized leave is cancelled.
Note 8 - INCOME TAXES
The Company, through its subsidiaries, Zhejiang, Wang Da, Sanhe, Joy & Harmony, Yiwu and Jinhua is governed by the Income Tax Laws of the PRC.
The US entity, China 3C Group is subject to the US federal income tax at 34%. The US entity has incurred net accumulated operating losses of approximately $3,168 as of June 30, 2010 for income tax purposes. The US entity does not conduct any operations and only incurs public expenses every year. Therefore, it is more likely than not that all of the Company’s deferred tax assets will not be realized. A 100% allowance was recorded on the deferred tax asset of approximately $1,077 as of June 30, 2010.
The Company’s policy is to recognize interest and penalties accrued on any unrecognized tax benefits as a component of income tax expense. The Company did not have any accrued interest or penalties associated with any unrecognized tax benefits, nor was any interest expense recognized during the three and six months ended June 30, 2010 and 2009.
Pursuant to the PRC Income Tax Laws, from January 1, 2008, the Enterprise Income Tax (“EIT) is calculated against the net income in a fiscal year at a statutory rate of 25%.
The following details a reconciliation of income tax expense for the six months ended June 30, 2010 and 2009:
| 2010 | | U.S. | | | State | | | International | | | Total | |
| Current | | $ | - | | | $ | - | | | $ | 190 | | | $ | 190 | |
| Deferred | | | - | | | | - | | | | - | | | | - | |
| Total | | $ | - | | | $ | - | | | $ | 190 | | | $ | 190 | |
| 2009 | | U.S. | | | State | | | International | | | Total | |
| Current | | $ | - | | | $ | - | | | $ | 1,591 | | | $ | 1,591 | |
| Deferred | | | - | | | | - | | | | - | | | | - | |
| Total | | $ | - | | | $ | - | | | $ | 1,591 | | | $ | 1,591 | |
During the six months ended June 30, 2010, Wan Da, Sanhe, Joy & Harmony and Yiwu had operating losses and therefore no income tax expenses. Zhejiang and Jinhua were the only subsidiaries that reported an operating income during the six months ended June 30, 2010 and incurred income tax expense of $190.
The following details a reconciliation of income tax expense for the three months ended June 30, 2010 and 2009:
| 2010 | | U.S. | | | State | | | International | | | Total | |
| Current | | $ | - | | | $ | - | | | $ | 83 | | | | 83 | |
| Deferred | | | - | | | | - | | | | - | | | | - | |
| Total | | $ | - | | | $ | - | | | $ | 83 | | | | 83 | |
| 2009 | | U.S. | | | State | | | International | | | Total | |
| Current | | $ | - | | | $ | - | | | $ | 392 | | | $ | 392 | |
| Deferred | | | - | | | | - | | | | - | | | | - | |
| Total | | $ | - | | | $ | - | | | $ | 392 | | | $ | 392 | |
During the three months ended June 30, 2010, Wang Da, Sanhe, Joy & Harmony and Yiwu had operating losses and therefore no income tax expenses. Zhejiang and Jinhua were the only subsidiaries that reported an operating income during the three months ended June 30, 2010 and incurred income tax expense of $83.
Reconciliation of the differences between the statutory U.S. Federal income tax rate and the effective rate is as follows:
| | | Six months ended June 30, | |
| | | 2010 | | | 2009 | |
| US statutory tax rate | | | (34.0 | %) | | | 34.0 | % |
| Tax rate difference | | | 9.0 | % | | | (9.0 | %) |
| Increase in valuation allowance | | | 19.4 | % | | | 1.8 | % |
| Effective rate | | | (5.6 | %) | | | 26.8 | % |
| | | Three months ended June 30, | |
| | | 2010 | | | 2009 | |
| US statutory tax rate | | | (34.0 | %) | | | 34.0 | % |
| Tax rate difference | | | 9.0 | % | | | (9.0 | %) |
| Increase in valuation allowance | | | 19.8 | % | | | 5.0 | % |
| Effective rate | | | (5.2 | %) | | | 30.0 | % |
Foreign pretax earnings approximated $(960) and $(2,345) for the three and six months ended June 30, 2010, respectively. Pretax earnings of a foreign subsidiary are subject to U.S. taxation when effectively repatriated. The Company provides income taxes on the undistributed earnings of non-U.S. subsidiaries except to the extent that such earnings are indefinitely invested outside the United States. At June 30, 2010, $60,608 of accumulated undistributed earnings of non-U.S. subsidiaries was indefinitely invested. At the existing U.S. federal income tax rate, additional taxes of approximately $5,455 would have to be provided if such earnings were remitted currently.
Note 9 - COMMITMENTS
The Company leases office facilities under operating leases that terminate through 2014. Rent expense for the three and six months ended June 30, 2010 and 2009 was $119, $68, $255 and $119, respectively. The future minimum obligations under these agreements are as follows by years as of June 30, 2010:
| 2011 | | $ | 442 | |
| 2012 | | | 38 | |
| 2013 | | | 16 | |
| | | $ | 496 | |
Note 10 - STATUTORY RESERVE
In accordance with the laws and regulations of the PRC, a wholly-owned Foreign Invested Enterprise’s income, after the payment of PRC income taxes, shall be allocated to the statutory surplus reserves and statutory public welfare fund. Prior to January 1, 2006, the allocation was 10 percent of the profit after tax to the surplus reserve fund and additional 5-10 percent to the public affair fund. The public welfare fund reserve was limited to 50 percent of the registered capital. Effective January 1, 2006, there is now only one fund requirement. The reserve is 10 percent of income after tax, not to exceed 50 percent of registered capital.
Statutory reserve funds are restricted for set off against losses, expansion of production and operation or increase in register capital of the respective company. Statutory public welfare fund is restricted to the capital expenditures for the collective welfare of employees. These reserves are not transferable to the Company in the form of cash dividends, loans or advances. These reserves are therefore not available for distribution except in liquidation. As of June 30, 2010 , the Company had allocated $11,535 to these non-distributable reserve funds.
Note 11 - OTHER COMPREHENSIVE INCOME
The detail of other comprehensive income, all of which arose from foreign currency translation, as included in stockholders’ equity at June 30, 2010 (unaudited) and December 31, 2009 are as follows:
| Balance at December 31, 2008 | | $ | 5,272 | |
| Change for 2009 | | | (92 | ) |
| Balance at December 31, 2009 | | | 5,180 | |
| Change for six months ended June 30, 2010 | | | (31 | ) |
| Balance at June 30, 2010 | | $ | 5,149 | |
Note 12 - CURRENT VULNERABILITY DUE TO CERTAIN RISK FACTORS
The Company’s operations are carried out in the PRC. Accordingly, the Company’s business, financial condition and results of operations may be influenced by the political, economic and legal environments in the PRC, by the general state of the PRC’s economy. The Company’s business may be influenced by changes in governmental policies with respect to laws and regulations, anti-inflationary measures, currency conversion and remittance abroad, and rates and methods of taxation, among other things.
Note 13 - MAJOR CUSTOMERS AND CREDIT RISK
During the three and six months ended June 30, 2010 and 2009, no customer accounted for more than 10% of the Company’s sales or accounts receivable and no vendor accounted for more than 10% of the Company’s purchase. At June 30, 2009 one (1) vendor comprised approximately 21.67% of the Company’s accounts payable.
Note 14 - SEGMENT INFORMATION
We separately operate and prepare accounting and other financial reports to management for five major business organizations (Wang Da, Sanhe, Yiwu, Joy & Harmony and Jinhua). Each operating company has different products and service. Wang Da sells mainly mobile phones, Sanhe sells mainly home appliances, Yiwu sells mainly office communication products, Joy & Harmony sells mainly consumer electronics and Jinhua provides transportation logistics to businesses. All segments are accounted for using the same principles as described in Note 2.
We identified five reportable segments required by FASB ASC Topic 280: (1) mobile phones, (2) home electronics, (3) office communication products, (4) consumer electronics and (5) logistics.
The following tables present summarized information by segment:
| | | Six Months Ended June 30, 2010 |
| | | Mobile | | | Home | | | Communication | | | Consumer | | | | | | | | | | |
| | | Phones | | | Electronics | | | Products | | | Electronics | | | Logistics | | | Other | | | Total | |
| Sales, net | | $ | 21,244 | | | $ | 21,998 | | | $ | 10,563 | | | $ | 18,532 | | | $ | 5,516 | | | $ | 382 | | | $ | 78,226 | |
| Cost of sales | | | 19,534 | | | | 19,403 | | | | 9,666 | | | | 17,674 | | | | 4,322 | | | | 340 | | | | 70,939 | |
| Gross profit | | | 1,710 | | | | 2,595 | | | | 897 | | | | 849 | | | | 1,194 | | | | 42 | | | | 7,287 | |
| Income (loss) from operations | | | (825) | | | | (873) | | | | (486) | | | | (628) | | | | 448 | | | | (1,051) | | | | (3,415) | |
| | | Six Months Ended June 30, 2009 | |
| | | Mobile | | | Home | | | Communication | | | Consumer | | | | | | | |
| | | Phones | | | Electronics | | | Products | | | Electronics | | | Other | | | Total | |
| Sales, net | | $ | 39,912 | | | $ | 30,996 | | | $ | 26,388 | | | $ | 31,241 | | | $ | - | | | $ | 128,537 | |
| Cost of sales | | | 35,449 | | | | 25,159 | | | | 23,928 | | | | 27,922 | | | | - | | | | 112,458 | |
| Gross profit | | | 4,463 | | | | 5,837 | | | | 2,460 | | | | 3,319 | | | | - | | | | 16,079 | |
| Income from operations | | | 1,204 | | | | 1,903 | | | | 422 | | | | 1,748 | | | | 567 | | | | 5,844 | |
| | | Three Months Ended June 30, 2010 | |
| | | Mobile | | | Home | | | Communication | | | Consumer | | | | | | | | | | |
| | | Phones | | | Electronics | | | Products | | | Electronics | | | Logistics | | | Other | | | Total | |
| Sales, net | | $ | 10,745 | | | $ | 10,686 | | | $ | 4,385 | | | $ | 8,589 | | | $ | 2,875 | | | $ | 148 | | | $ | 37,428 | |
| Cost of sales | | | 9,803 | | | | 9,326 | | | | 3,995 | | | | 7,978 | | | | 2,277 | | | | 127 | | | | 33,506 | |
| Gross profit | | | 942 | | | | 1,360 | | | | 390 | | | | 611 | | | | 598 | | | | 21 | | | | 3,922 | |
| Income (loss) from operations | | | (379) | | | | (357) | | | | (276) | | | | (120) | | | | 198 | | | | (632) | | | | (1,566) | |
| | | Three Months Ended June 30, 2009 | |
| | | Mobile | | | Home | | | Communication | | | Consumer | | | | | | | |
| | | Phones | | | Electronics | | | Products | | | Electronics | | | Other | | | Total | |
| Sales, net | | $ | 14,168 | | | $ | 14,403 | | | $ | 10,587 | | | $ | 11,968 | | | $ | - | | | $ | 51,126 | |
| Cost of sales | | | 12,665 | | | | 11,815 | | | | 9,824 | | | | 10,801 | | | | - | | | | 45,105 | |
| Gross profit | | | 1,503 | | | | 2,588 | | | | 763 | | | | 1,167 | | | | - | | | | 6,021 | |
| Income (loss) from operations | | | 88 | | | | 764 | | | | (80 | ) | | | 469 | | | | 30 | | | | 1,271 | |
Total assets by segment as of June 30, 2010 and December 31, 2009 are as follows:
| | | Mobile | | | Home | | | Communication | | | Consumer | | | | | | | | | | |
| | | Phones | | | Electronics | | | Products | | | Electronics | | | Logistics | | | Other | | | Total | |
| June 30, 2010 | | $ | 12,889 | | | $ | 10,373 | | | $ | 11,537 | | | $ | 15,346 | | | $ | 4,912 | | | $ | 35,232 | | | $ | 90,289 | |
| December 31, 2009 | | $ | 13,761 | | | $ | 11,525 | | | $ | 12,353 | | | $ | 15,777 | | | $ | 4,776 | | | $ | 36,204 | | | $ | 94,396 | |
Item 2. Management’s Discussion and Analysis of Financial Condition and Results of Operations.
Forward Looking Statements
We have included, and from time–to-time may make in our public filings, press releases or other public statements, certain statements, including, without limitation, those under “Management’s Discussion and Analysis of Financial Condition and Results of Operations” in Item 2. In some cases, these statements are identifiable through the use of words such as “anticipate”, “believe”, “estimate”, “expect”, “intend”, “plan”, “project”, “target”, “can”, “could”, “may”, “should”, “will”, “would”, and similar expressions. You are cautioned not to place undue reliance on these forward-looking statements. In addition, our management may make forward-looking statements to analysts, investors, representatives of the media and others. These forward-looking statements are not historical facts and represent only our beliefs regarding future events, many of which, by their nature, are inherently uncertain and beyond our control.
The following discussion should be read in conjunction with the Consolidated Financial Statements and Notes thereto appearing elsewhere in this Form 10-Q. The following discussion contains forward-looking statements. Our actual results may differ significantly from those projected in the forward-looking statements. Factors that may cause future results to differ materially from those projected in the forward-looking statements include, but are not limited to, those discussed in “Risk Factors” and elsewhere in this Form 10-Q.
Overview (All dollar amounts in thousands)
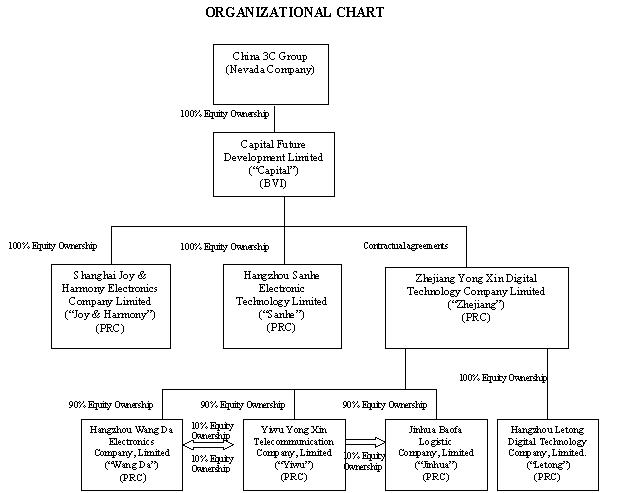
China 3C Group (“China 3C”) was incorporated on August, 20, 1998 under the laws of the State of Nevada. Capital Future Developments Limited (“CFDL”) was incorporated on July 22, 2004 under the laws of the British Virgin Islands. Zhejiang Yong Xin Digital Technology Company Limited (“Zhejiang”), Yiwu Yong Xin Communication Limited (“Yiwu”), Hangzhou Wandda Electronics Company Limited (“Wang Da”), Hangzhou Sanhe Electronic Technology, Limited (“Sanhe”), and Shanghai Joy & Harmony Electronic Development Company Limited (“Joy & Harmony”) were incorporated under the laws of the Peoples Republic of China (“PRC” or “China”) on July 11, 2005, July 18, 1997, March 30, 1998, April 12, 2004, and August 25, 2003, respectively. China 3C Group owns 100% of CFDL and CFDL own 100% of the capital stock of Joy & Harmony and Sanhe. Until August 14, 2007, when it made the change to its ownership structure described in the next paragraph in order to comply with certain requirements of PRC law, CFDL owned 100% of the capital stock of Zhenjiang. Zhejiang owns 90% and Yiwu owns 10% of Wang Da. Zhejiang owns 90% and Wang Da owns 10% of Yiwu. On March 10, 2009 Zhejiang set up a new operating entity, Hangzhou Letong Digital Technology Co., Ltd. (“Letong”) to establish an electronic retail franchise operation for China 3C Group. On July 6, 2009, Zhejiang and Yiwu completed acquisition of Jinhua Baofa Logistic Ltd (“Jinhua”). Jinhua was incorporated under the laws of PRC on December 27, 2001.
References to “we,” “us,” “our,” or the “Company” refer collectively to the nine corporations described above.
On December 21, 2005, CFDL became a wholly owned subsidiary of China 3C through a merger with a wholly owned subsidiary of the Company (the “Merger Transaction”). China 3C acquired all of the issued and outstanding capital stock of CFDL pursuant to a Merger Agreement dated at December 21, 2005 by and among China 3C, XY Acquisition Corporation, CFDL and the shareholders of CFDL (the “Merger Agreement”). Pursuant to the Merger Agreement, CFDL became a wholly owned subsidiary of China 3C and, in exchange for the CFDL shares, China 3C issued 35,000,000 shares of its common stock to the shareholders of CFDL, representing 93% of the issued and outstanding capital stock of China 3C at that time and cash of $500. On August 15, 2007, in order to comply with the requirements of PRC law, the Company recapitalized its ownership structure. As a result, instead of CFDL owning 100% of Zhejiang as previously was the case, CFDL entered into contractual agreements with Zhejiang whereby CFDL owns a 100% interest in the revenues of Zhejiang. CFDL does not have an equity interest in Zhejiang, but is deemed to have all the economic benefits and liabilities by contract. Under this structure, Zhejiang is now a wholly foreign owned enterprise (WOFE) of CFDL. The contractual agreements give CFDL and its equity owners an obligation to absorb any losses, and rights to receive revenue. CFDL will be unable to make significant decisions about the activities of Zhejiang and can not carry out its principal activities without financial support. These characteristics as defined in FASB ASC Topic 810, Consolidation of Variable Interest Entities (VIEs), qualifies the business operations of Zhejiang to be consolidated with CFDL and ultimately with China 3C.
As a result of the Merger Agreement, the reorganization was treated as an acquisition by the accounting acquiree that is being accounted for as a recapitalization and as a reverse merger by the legal acquirer for accounting purposes. Pursuant to the recapitalization, all capital stock shares and amounts and per share data have been retroactively restated. Accordingly, the financial statements include the following:
(1) The balance sheet consists of the net assets of the accounting acquirer at historical cost and the net assets of the legal acquirer at historical cost.
(2) The statements of operations include the operations of the accounting acquirer for the period presented and the operations of the legal acquirer from the date of the merger.
Pursuant to a share exchange agreement, dated August 3, 2006, we issued 915,751 shares of restricted common stock to the former shareholders of Sanhe, valued at $3,750, which was the fair value of the shares at the date of the share exchange agreement. This amount is included in the cost of net assets and goodwill purchased.
Pursuant to a share exchange agreement, dated November 28, 2006, we issued 2,723,110 shares of newly issued shares of common stock to the former shareholders of Joy & Harmony, valued at $11,000, which was the fair value of the shares at the date of exchange agreement. This amount is included in the cost of net assets and goodwill purchased.
On July 6, 2009, China 3C’s subsidiaries, Zhejiang and Yiwu completed acquisition of Jinhua, a company organized under the laws of the PRC. Zhejiang acquired 90% and Yiwu acquired 10% of the entire equity interests in Jinhua from the shareholders of Jinhua for a total purchase price of RMB 120,000,000 (approximately $17,500) in cash.
The Company is engaged in the business of resale and distribution of third party products and generates approximately 100% of its revenue from resale of items such as mobile phones, facsimile machines, DVD players, stereos, speakers, MP3 and MP4 players, iPod, electronic dictionaries, CD players, radios, Walkmans, and audio systems. We sell and distribute products through retail stores and secondary distributors. We operate most of our retail operations through our “store in store” model. Under this model, the Company leases space in major department stores and retailers. Leasing costs can vary based on a percentage of sales, or can be fixed. For the year ended December 31, 2009, all of our stores in stores leases were variable based on sales.
In 2009, Zhejiang started establishing direct electronic retail stores and franchise operation. As of June 30, 2010, the Company has three franchise stores and three direct retail stores in operation, all of which are located in Zhejiang province. For the three and six months ended June 30, 2010, the direct stores and franchise stores had sales revenue of $148 and $382. The direct store and franchise operation is still in the early stage and does not represent a significant part of our business as of June 30, 2010.
In July 2009, the Company acquired Jinhua and started providing transportation service to business in Eastern China.
Result of Operations
Results of Operations for the Three and Six Months Ended June 30, 2010 and 2009
Reportable Operating Segments
The Company reports financial and operating information in the following five segments:
| a) | Yiwu Yong Xin Telecommunication Company, Limited or “Yiwu” |
| b) | Hangzhou Wang Da Electronics Company, Limited or “Wang Da” |
| c) | Hangzhou Sanhe Electronic Technology Limited or “Sanhe” |
| d) | Shanghai Joy & Harmony Electronics Company Limited or “Joy & Harmony” |
| e) | Jinhua Baofa Logistic Limited or “Jinhua” |
a) Yiwu Yong Xin Telecommunication Company Limited or “Yiwu”
Yiwu focuses on the selling, circulation and modern logistics of fax machines and cord phone products.
| | | Six months ended June 30, | | | Percentage | |
| Yiwu | | 2010 | | | 2009 | | | Change | |
| Revenue | | $ | 10,563 | | | $ | 26,389 | | | | (59.97) | % |
| Gross Profit | | $ | 897 | | | $ | 2,459 | | | | (63.52) | % |
| Gross Margin | | | 8.49 | % | | | 9.32 | % | | | (0.83) | % |
| Operating (Loss)/Income | | $ | (486) | | | $ | 422 | | | | (215.17) | % |
| | | Three months ended June 30, | | | Percentage | |
| Yiwu | | 2010 | | | 2009 | | | Change | |
| Revenue | | $ | 4,385 | | | $ | 10,587 | | | | (58.58) | % |
| Gross Profit | | $ | 390 | | | $ | 762 | | | | (48.82) | % |
| Gross Margin | | | 8.89 | % | | | 7.19 | % | | | 1.70 | % |
| Operating Loss | | $ | (276) | | | $ | (80 | ) | | | 245 | % |
For the six months ended June 30, 2010, Yiwu generated revenue of $10,563, a decrease of $15,826 or 59.97% compared to $26,389 for the six months ended June 30, 2009. Gross profit decreased $1,562 or 63.52% from $2,459 for the six months ended June 30, 2009 to $897 for the six months ended June 30, 2010. Operating loss was $(486) for the six months ended June 30, 2010, a decrease of $908 or 215.17% compared to operating income of $422 for the six months ended June 30, 2009.
For the three months ended June 30, 2010, Yiwu generated revenue of $4,385, a decrease of $6,202 or 58.58% compared to $10,587 for the three months ended June 30, 2009. Gross profit decreased $372 or 48.82% from $762 for the three months ended June 30, 2009 to $390 for the three months ended June 30, 2010. Operating loss was $(276) for the three months ended June 30, 2010, a decrease of $196 or 245% compared to operating loss of $(80) for the three months ended June 30, 2009.
Such decrease in revenue was primarily due to weaker demand for office equipment. Many small and medium-sized companies in China were less likely to purchase or upgrade new office equipment in the current economic environment. Growing competition in the fax machine and telephone markets also led to lower unit sales prices which resulted in lower sales revenue.
Gross margin decreased 0.83% during the six months ended June 30, 2010 compared to June 30, 2009. The decrease was a result of lower unit sales price of fax machines and telephones due to a more competitive sales market. Gross margin increased 1.70% during the three months ended June 30, 2010 compared to the same period in 2009. The increase was a result of change in revenue mix. We had more sales in telephones than fax machines in 2010, which led to higher gross margin.
b) Hangzhou Wang Da Electronics Company Limited or “Wang Da”
Wang Da focuses on the selling, circulation and modern logistics of cell phones, cell phones products, and digital products, including digital cameras, digital camcorders, PDAs, flash disks, and removable hard disks.
| | | Six months ended June 30, | | | Percentage | |
| Wang Da | | 2010 | | | 2009 | | | Change | |
| Revenue | | $ | 21,244 | | | $ | 39,912 | | | | (46.77) | % |
| Gross Profit | | $ | 1,710 | | | $ | 4,463 | | | | (61.68) | % |
| Gross Margin | | | 8.05 | % | | | 11.18 | % | | | (3.13) | % |
| Operating (Loss)/Income | | $ | (825) | | | $ | 1,204 | | | | (168.52) | % |
| | | Three months ended June 30, | | | Percentage | |
| Wang Da | | 2010 | | | 2009 | | | Change | |
| Revenue | | $ | 10,745 | | | $ | 14,168 | | | | (24.16) | % |
| Gross Profit | | $ | 942 | | | $ | 1,503 | | | | (37.33) | % |
| Gross Margin | | | 8.77 | % | | | 10.61 | % | | | (1.84) | % |
| Operating (Loss)/Income | | $ | (379) | | | $ | 88 | | | | (530.68) | % |
For the six months ended June 30, 2010, Wang Da generated revenue of $21,244, a decrease of $18,668 or 46.77% compared to $39,912 for the six months ended June 30, 2009. Gross profit decreased $2,753 or 61.68% from $4,463 for the six months ended June 30, 2009 to $1,710 for the six months ended June 30, 2010. Operating loss was $(825) for the six months ended June 30, 2010, a decrease of $2,029 or 168.52% compared to operating income of $1,204 for the six months ended June 30, 2009.
For the three months ended June 30, 2010, Wang Da generated revenue of $10,745, a decrease of $3,423 or 24.16% compared to $14,168 for the three months ended June 30, 2009. Gross profit decreased $561 or 37.33% from $1,503 for the three months ended June 30, 2009 to $942 for the three months ended June 30, 2010. Operating loss was $(379) for the three months ended June 30, 2010, a decrease of $467 or 530.68% compared to operating income of $88 for the three months ended June 30, 2009.
The decrease in revenue was primarily due to the high competition from government-owned large telecommunication service providers. Telecommunication service providers started to open their direct operating stores to sell communication products and also launched promotions such as “free phone with service contract”.
Gross margin decreased 3.13% and 1.84%, respectively during the six and three months ended June 30, 2010. The decrease in gross profit and gross margin was due to the decrease in demand of domestic cell phones, which had a higher gross margin than brand name cell phones.
c) Hangzhou Sanhe Electronic Technology Limited or “Sanhe”
Sanhe focuses on the selling, circulation and modern logistics of home electronics, including DVD players, audio systems, speakers, televisions and air conditioners.
| | | Six months ended June 30, | | | Percentage | |
| Sanhe | | 2010 | | | 2009 | | | Change | |
| Revenue | | $ | 21,998 | | | $ | 30,996 | | | | (29.03) | % |
| Gross Profit | | $ | 2,595 | | | $ | 5,838 | | | | (55.55) | % |
| Gross Margin | | | 11.80 | % | | | 18.83 | % | | | (7.03) | % |
| Operating (Loss)/Income | | $ | (873) | | | $ | 1,902 | | | | (145.90) | % |
| | | Three months ended June 30, | | | Percentage | |
| Sanhe | | 2010 | | | 2009 | | | Change | |
| Revenue | | $ | 10,686 | | | $ | 14,403 | | | | (25.81) | % |
| Gross Profit | | $ | 1,361 | | | $ | 2,589 | | | | (47.47) | % |
| Gross Margin | | | 12.74 | % | | | 17.98 | % | | | (5.25) | % |
| Operating (Loss)/Income | | $ | (357) | | | $ | 764 | | | | (146.73) | % |
For the six months ended June 30, 2010, Sanhe generated revenue of $21,998, a decrease of $8.998 or 29.03% compared to $30,996 for the six months ended June 30, 2009. Gross profit decreased $3,243 or 55.55% from $5,838 for the six months ended June 30, 2009 to $2,595 for the six months ended June 30, 2010. Operating loss was $873 for the six months ended June 30, 2010, a decrease of $2,775 or 145.90% compared to operating income of $1,902 for the six months ended June 30, 2009.
For the three months ended June 30, 2010, Sanhe generated revenue of $10,686, a decrease of $3,717 or 25.81% compared to $14,403 for the three months ended June 30, 2009. Gross profit decreased $1,228 or 47.47% from $2,589 for the three months ended June 30, 2009 to $1,361 for the three months ended June 30, 2010. Operating loss was $(357) for the three months ended June 30, 2010, a decrease of $1,121 or 146.73% compared to operating income of $764 for the three months ended June 30, 2009.
The decrease in revenue was a result of decline in market demand of DVD players and speakers. Higher competitions also led to lower sales volume and lower unit sales price, which resulted in lower revenue.
Gross margin decreased 7.03% during the six months ended June 30, 2010 and decreased 5.25% during the three months ended June 30, 2010. The decrease was a result of higher sales volume of televisions compared to higher sales in DVD players and speakers in 2009, which have higher gross margin compared to other home electronics products.
d) Shanghai Joy & Harmony Electronics Company Limited or “Joy & Harmony”
Joy & Harmony focuses on the selling, circulation and modern logistics of consumer electronics, including MP3 players, MP4 players, iPod, electronic dictionary, radios, and Walkman.
| | | Six months ended June 30, | | | Percentage | |
| Joy & Harmony | | 2010 | | | 2009 | | | Change | |
| Revenue | | $ | 18,532 | | | $ | 31,241 | | | | (40.68) | % |
| Gross Profit | | $ | 849 | | | $ | 3,319 | | | | (74.42) | % |
| Gross Margin | | | 4.58 | % | | | 10.62 | % | | | (6.04) | % |
| Operating (Loss)/Income | | $ | (628) | | | $ | 1,748 | | | | (135.93) | % |
| | | Three months ended June 30, | | | Percentage | |
| Joy & Harmony | | 2010 | | | 2009 | | | Change | |
| Revenue | | $ | 8,589 | | | $ | 11,968 | | | | (28.23) | % |
| Gross Profit | | $ | 611 | | | $ | 1,166 | | | | (47.60) | % |
| Gross Margin | | | 7.11 | % | | | 9.74 | % | | | (2.63) | % |
| Operating (Loss)/Income | | $ | (120) | | | $ | 469 | | | | (125.59) | % |
For the six months ended June 30, 2010, Joy & Harmony generated revenue of $18,532, a decrease of $12,709 or 40.68% compared to $31,241 for the six months ended June 30, 2009. Gross profit decreased $2,470 or 74.42% from $3,319 for the six months ended June 30, 2009 to $849 for the six months ended June 30, 2010. Operating loss was $628 for the six months ended June 30, 2010, a decrease of $2,376 or 135.93% compared to operating income of $1,748 for the six months ended June 30, 2009.
For the three months ended June 30, 2010, Joy & Harmony generated revenue of $8,589, a decrease of $3,379 or 28.23% compared to $11,968 for the three months ended June 30, 2009. Gross profit decreased $555 or 47.60% from $1,166 for the three months ended June 30, 2009 to $611 for the three months ended June 30, 2010. Operating loss was $(120) for the three months ended June 30, 2010, a decrease of $589 or 125.59% compared to operating income of $469 for the three months ended June 30, 2009.
Gross margin decreased 6.04% and 2.63% during the six and three months ended June 30, 2010, respectively.
Many small domestic electronics manufacturers closed down in the first two quarters of 2010 and large manufacturers raised the price of consumer electronics. Therefore, the cost for Joy & Harmony increased, which led to a significant decline in gross margin. The closedown of many small electronics manufacturers also caused some of our products to discontinue which led to lower sales revenue. Operating income decreased primarily due to decreased gross margin and increased operating expenses, which includes an increase in base salary for all staff, an increase in marketing expenses and management fees paid to the department stores.
e) Jinhua Baofa Logistic Limited or “Jinhua”
Jinhua provides transportation service to business and transports freight, including electronics, machinery and equipment, metal products, chemical materials, garments and handicraft goods, in more than 20 cities in Eastern China. Its transportation services cover many of the most developed cities in Eastern China such as Shanghai, Hangzhou and Nanjing.
China 3C acquired Jinhua on July 6, 2009. Therefore, the consolidated statement of income (loss) and comprehensive income (loss) of China 3C for the period ended June 30, 2009 did not include Jinhua’s operating results.
| Jinhua | | Six months ended June 30, 2010 | |
| Revenue | | $ | 5,516 | |
| Gross Profit | | $ | 1,194 | |
| Gross Margin | | | 21.65 | % |
| Operating Income | | $ | 448 | |
| Jinhua | | Three months ended June 30, 2010 | |
| Revenue | | $ | 2,875 | |
| Gross Profit | | $ | 598 | |
| Gross Margin | | | 20.80 | % |
| Operating Income | | $ | 198 | |
Net Sales
Net sales for the six months ended June 30, 2010 decreased by 39.14%, to $78,226 compared to $128,537 for the six months ended June 30, 2009. Net sales for the three months ended June 30, 2010 decreased by 26.79%, to $37,428 as compared to $51,126 for the three months ended June 30, 2009. Management believes that the lower sales were a result of various factors including a slowdown in the retail markets in general, weaker demand for consumer and business electronics as well as the pressure of increased competition within the markets in which we operate.
Cost of Sales
Cost of sales for the six months ended June 30, 2010 was $70,939 compared to $112,458 for the six months ended June 30, 2009, a decrease of 36.92%. Cost of sales for the three months ended June 30, 2010 was $33,506 as compared to $45,105 for the three months ended June 30, 2009, a decrease of 25.72%. The decreased cost of sales for the six months was a direct result of the decrease in sales during the same period.
Gross Profit Margin
Gross profit margin for the six months ended June 30, 2010 was 9.32% compared to12.51% for the six months ended June 30, 2009. Gross profit margin for the three months ended June 30, 2010 was 10.48% as compared to 11.78% for the three months ended June 30, 2009. The lower gross profit margin was primarily due to the decreased unit sales prices of consumer and business electronics in the competitive market in China. While the unit sales prices decreased, the purchase price increased.
General and Administrative Expenses
General and administrative expenses for the six months ended June 30, 2010 were $10,702 or 13.68% of net sales, compared to $10,235 or 7.96% of net sales for the six months ended June 30, 2009, an increase of 4.56%. General and administrative expenses for the three months ended June 30, 2010 were $5,488 or 14.66% of net sales, compared to $4,750 or 9.29% of net sales for the three months ended June 30, 2009, an increase of 15.54%. The increase in general and administrative expenses was primarily due to an increase in base salary for all staff, increase in public expenses as well as increased marketing expenses and management fees paid to department stores.
Income (loss) from Operations
Operating loss for the six months ended June 30, 2010 was $(3,415) or (4.37)% of net sales compared to income from operations of $5,844 or 4.55% of net sales for the six months ended June 30, 2009, a decrease of 158.44%. Operating loss for the three months ended June 30, 2010 was $(1,566) or 4.18% of net sales compared to income from operations of $1,271 or 2.49% of net sales for the three months ended June 30, 2009, a decrease of 223.21%. Lower sales, lower gross margin as well as increased operating expenses were the key factors for the decrease in income from operations during the three and six months ended June 30, 2010.
Provision for Income Taxes
The provision for income taxes for the six months ended June 30, 2010 was $190 compared to $1,591 for the six months ended June 30, 2009. The provision for income taxes for the three months ended June 30, 2010 was $83 compared to $392 for the three months ended June 30, 2009. The decrease in income tax expenses was due to Yiwu, Wang Da, Joy & Harmony and Sanhe having net losses in the first two quarters of 2010 and therefore not having income tax expenses. Jinhua and Zhejiang were the only two subsidiaries having operating income and the amount was not significant.
Net (Loss) / Income
Net loss was $(3,595) or (4.60)% of net sales for the six months ended June 30, 2010 compared to net income of $4,354 or 3.39% of net sales for the six months ended June 30, 2009, a decrease of 182.57%. Net loss was $(1,668) or (4.46)% of net sales for the three months ended June 30, 2010 compared to net income of $914 or 1.78% of net sales for the three months ended June 30, 2009, a decrease of 282.49%. Decreased sales revenue, lower gross margin and higher operating expenses were the critical factors which contributed to the decrease in net income.
Liquidity and Capital Resources
Operations and liquidity needs are funded primarily through cash flows from operations. Cash and cash equivalents were $29,123 at June 30, 2010, compared to $25,448 at June 30, 2009, and compared to $29,908 at December 31, 2009.
We believe the funds available to us are adequate to meet our operating needs for the remainder of 2010.
| | | Six months ended June 30, | |
| | | 2010 | | | 2009 | |
| Net cash (used in) provided by operating activities | | $ | (625) | | | $ | 721 | |
| Net cash used in investing activities | | $ | (18 | ) | | $ | (7,295 | ) |
| Effect of exchange rate change on cash and cash equivalents | | $ | (142 | ) | | $ | (136 | ) |
| Net decrease in cash and cash equivalents | | $ | (785 | ) | | $ | (6,710 | ) |
| Cash and cash equivalents at beginning of period | | $ | 29,908 | | | $ | 32,158 | |
| Cash and cash equivalents at end period | | $ | 29,123 | | | $ | 25,448 | |
Operating Activities
Net cash used in operating activities was $625 for the six months ended June 30, 2010 compared to net cash generated from operating activities of $721 for the six months ended June 30, 2009, approximately a 186.69% decrease. The decrease was mainly attributable to several factors, including (i) net loss of $(3,595); (ii) decrease in advance to suppliers of $103; (iii) decrease in accounts payable and accrued expenses of $771, offset by the decrease in accounts receivable of $2,751 in the six months ended June 30, 2010.
| | | Six months ended June 30, | |
| | | 2010 | | | 2009 | | | Percentage Change | |
| | | | | | | | | | |
| Sales Net | | $ | 78,226 | | | $ | 128,537 | | | | (39.14 | )% |
| | | | | | | | | | | | | |
| Accounts receivable | | $ | 15,547 | | | $ | 18,232 | | | | (14.73 | )% |
Accounts receivable did not decrease in line with the decrease in sales due to the terms of payment changed from 30 days to 45 days on retail and from 10 days to 15 days on wholesale. Management monitors and periodically assesses the collectability of accounts receivable to ensure the receivables are reasonably assured. Collection of debt is based on the terms of legal binding documents. Our account receivable department has periodically reviewed the allowance for doubtful accounts. The estimate of bad debt allowance is based on the aging of the receivables, the credit history and credit quality of the customers, the term of the contracts as well as the balance outstanding. If an account receivable item is considered highly probable that it is uncollectible, then it will be charged to bad debt immediately in that period.
Investing Activities
| | | Six months ended June 30, | |
| | | 2010 | | | 2009 | |
| Net cash used investment activities | | $ | (18 | ) | | $ | (7,295 | ) |
Net cash used in investing activities was $7,295 during the six months ended June 30, 2009 due to the deposit payment for the acquisition of Jinhua.
The Company’s activities focused on the distribution of electronic products and logistic service. As a result, investments in fixed assets were moderate and hence there is little effect to the utilization of cash over the six months ended June 30, 2010.
Financing Activities
The Company did not carry out any financing activities during the six months ended June 30, 2010 and 2009.
| | | Six months ended June 30, | |
| | | 2010 | | | 2009 | |
| Net change in cash and cash equivalents | | $ | (785 | ) | | $ | (6,710 | ) |
| | | Six months ended June 30, | |
| | | 2010 | | | 2009 | |
| Cash and cash equivalent at June 30, 2010 and 2009 | | $ | 29,123 | | | $ | 25,448 | |
Capital Expenditures
Total capital expenditures for the first six months of 2010 were $18 for purchase of fixed assets compared to $4 for the first six months of 2009. The increase is due to acquisition of a motor vehicle in second quarter 2010.
Working Capital Requirements
Historically operations and short term financing have been sufficient to meet our cash needs. We believe we will be able to generate revenues from sales and raise capital through private placement offerings of our equity securities to provide the necessary cash flow to meet anticipated working capital requirements. However, our working capital needs for the long and short term will depend upon numerous factors, including operating results, competition, and the availability of credit facilities, none of which can be predicted with certainty. Future expansion will be limited by the availability of financing products and raising capital.
Off-Balance Sheet Arrangements
We have never entered into any off-balance sheet financing arrangements and have never established any special purpose entities. We have not guaranteed any debt or commitments of other entities or entered into any options on non-financial assets.
Critical Accounting Policies
Our discussion and analysis of our financial condition and results of operations is based upon our consolidated financial statements, which have been prepared in accordance with accounting principles generally accepted in the United States. The preparation of these consolidated financial statements requires us to make estimates, judgments and assumptions that affect the reported amounts of assets, liabilities, revenues and expenses, and the related disclosure of contingent assets and liabilities. We base our estimates on historical experience and on various other assumptions that we believe are reasonable under the circumstances, the results of which form the basis for making judgments about the carrying values of assets and liabilities that are not readily apparent from other sources. Actual results may differ from these estimates.
An accounting policy is considered to be critical if it requires an accounting estimate to be made based on assumptions about matters that are highly uncertain at the time the estimates are made, and if different estimates that reasonably could have been used, or changes in the accounting estimates that are reasonably likely to occur, could materially impact the consolidated financial statements. We believe the following critical accounting policies reflect the more significant estimates and assumptions used in the preparation of the consolidated financial statements.
Revenue Recognition
Our revenues are generated from sales of electronics products. All of our revenue transactions contain standard business terms and conditions. We determine the appropriate accounting for these transactions after considering (1) whether a contract exists; (2) when to recognize revenue on the deliverables; and (3) whether all elements of the contract have been fulfilled and delivered. In addition, our revenue recognition policy requires an assessment as to whether collection is reasonably assured, which inherently requires us to evaluate the creditworthiness of our customers. Changes in judgments on these assumptions and estimates could materially impact the timing or amount of revenue recognition.
Please refer to Note 2 in the footnotes to the financial statements for detailed description of our revenue recognition policy.
After Sales Service
The after-sales services we provide to our customers are primarily repair and maintenance. If a customer buys a product from us and needs repairs, we can usually arrange to have the manufacturer repair the product. In certain cases, clerks in our stores are able to make the repairs directly.
Tabular Disclosure of Contractual Obligations
The following table sets forth our contractual obligations as of June 30, 2010.
| | | Payment Due by Period | |
| | | | | | Less than 1 | | | | | | | | | More than | |
| Contractual Obligations | | Total | | | year | | | 1-3 years | | | 3-5 years | | | 5 years | |
| Operating lease obligations | | $ | 307 | | | | 244 | | | | 53 | | | | 10 | | | $ | - | |
| Advertising obligations | | | 198 | | | | 198 | | | | - | | | | - | | | | - | |
| Total contractual obligations | | $ | 505 | | | | 442 | | | | 53 | | | | 10 | | | $ | - | |
Item 3. Quantitative and Qualitative Disclosures About Market Risk.
Foreign Currency Exchange Rate Risk
Fluctuations in the rate of exchange between the U.S. dollar and foreign currencies, primarily the Chinese Renminbi, could adversely affect our financial results. During the second quarter ended June 30, 2010, all of our sales were denominated in foreign currencies. We expect that foreign currencies will continue to represent a similarly significant percentage of our sales in the future. Selling, marketing and administrative costs related to these sales are largely denominated in the same respective currency, thereby mitigating our transaction risk exposure. We therefore believe that the risk of a significant impact on our operating income from foreign currency fluctuations is not substantial. However, for sales not denominated in U.S. dollars, if there is an increase in the rate at which a foreign currency is exchanged for U.S. dollars, it will require more of the foreign currency to equal a specified amount of U.S. dollars than before the rate increase. In such cases and if we price our products in the foreign currency, we will receive less in US. dollars than we did before the rate increase went into effect. If we price our products in U.S. dollars and competitors price their products in local currency, an increase in the relative strength of the U.S. dollar could result in our price not being competitive in a market where business is transacted in the local currency.
All of our sales denominated in foreign currencies are denominated in the Chinese Renminbi. Our principal exchange rate risk therefore exists between the U.S. dollar and this currency. Fluctuations from the beginning to the end of any given reporting period result in the re-measurement of our foreign currency-denominated receivables and payables, generating currency transaction gains or losses that impact our non-operating income/expense levels in the respective period and are reported in other (income) expense, net in our consolidated financial statements. We do not currently hedge our exposure to foreign currency exchange rate fluctuations. We may, however, hedge such exposure to foreign currency exchange rate fluctuations in the future.
Interest Rate Risk
Changes in interest rates may affect the interest paid (or earned) and therefore affect our cash flows and results of operations. However, we do not believe that this interest rate change risk is significant.
Inflation
Inflation has not had a material impact on the Company’s business for the Company’s three most recent fiscal years.
Currency Exchange Fluctuations
All of the Company’s revenues are denominated in Chinese Renminbi, while its expenses are denominated primarily in Chinese Renminbi (“RMB”). The value of the RMB-to-U.S. dollar and other currencies may fluctuate and is affected by, among other things, changes in political and economic conditions. Since 1994, the conversion of Renminbi into foreign currencies, including U.S. dollars, has been based on rates set by the People’s Bank of China (“PBOC”), which are set daily based on the previous day’s inter-bank foreign exchange market rates and current exchange rates on the world financial markets. Since 1994, the official exchange rate for the conversion of Renminbi to U.S. dollars had generally been stable and the Renminbi had appreciated slightly against the U.S. dollar. However, on July 21, 2005, the Chinese government changed its policy of pegging the value of Chinese Renminbi to the U.S. dollar. Under the new policy, Chinese Renminbi may fluctuate within a narrow and managed band against a basket of certain foreign currencies. Recently there has been increased political pressure on the Chinese government to decouple the Renminbi from the United States dollar. At the recent quarterly regular meeting of PBOC, its Currency Policy Committee affirmed the effects of the reform on Chinese Renminbi exchange rate. Since February 2006, the new currency rate system has been operated; the currency rate of Renminbi has become more flexible while basically maintaining stable and the expectation for a larger appreciation range is shrinking. The Company has never engaged in currency hedging operations and has no present intention to do so.
Concentration of Credit Risk
Credit risk represents the accounting loss that would be recognized at the reporting date if counterparties failed completely to perform as contracted. Concentrations of credit risk (whether on or off balance sheet) that arise from financial instruments exist for groups of customers or counterparties when they have similar economic characteristics that would cause their ability to meet contractual obligations to be similarly affected by changes in economic or other conditions as described below:
| | | The Company’s business is characterized by rapid technological change, new product and service development, and evolving industry standards and regulations. Inherent in the Company’s business are various risks and uncertainties, including the impact from the volatility of the stock market, limited operating history, uncertain profitability and the ability to raise additional capital. |
| | | All of the Company’s revenue is derived from Asia and Greater China. Changes in laws and regulations, or their interpretation, or the imposition of confiscatory taxation, restrictions on currency conversion, devaluations of currency or the nationalization or other expropriation of private enterprises could have a material adverse effect on our business, results of operations and financial condition. |
| | | If the Company is unable to derive any revenues from Greater China, it would have a significant, financially disruptive effect on the normal operations of the Company. |
Item 4T. Controls and Procedures.
Evaluation of Disclosure Controls and Procedures
Under the supervision and with the participation of our management, including our principal executive officer and principal financial officer, we conducted an evaluation of our disclosure controls and procedures as of June 30, 2010, as such term is defined in Rules 13a-15(e) and 15d-15(e) under the Exchange Act. Based on this evaluation, our principal executive officer and principal financial officer have concluded that during the period covered by this report, the Company’s disclosure controls and procedures were effective as of such date to ensure that information required to be disclosed by us in our Exchange Act reports is recorded, processed, summarized, and reported within the time periods specified in the SEC’s rules and forms, and that such information is accumulated and communicated to our management, including our principal executive officer and principal financial officer, or persons performing similar functions, as appropriate, to allow timely decisions regarding required disclosures.
Changes in Internal Control over Financial Reporting
There was no change in our internal control over financial reporting that occurred during the first two fiscal quarters of 2010 covered by this Quarterly Report on Form 10-Q that has materially affected, or is reasonably likely to materially affect, our internal control over financial reporting
PART II. OTHER INFORMATION
Item 1. Legal Proceedings.
Neither the Company nor its property is a party to any pending legal proceeding. The Company’s management does not believe that there are any proceedings to which any director, officer, or affiliate of the Company, any owner of record of beneficially held or owner of more than five percent (5%) of the Company’s common stock, or any associate of any such director, officer, affiliate of the Company, or security holder is a party adverse to the Company, or has a material interest adverse to the Company.
Item 1A. Risk Factors.
None.
Item 2. Unregistered Sales of Equity Securities and Use of Proceeds.
None.
Item 3. Defaults Upon Senior Securities.
Not Applicable.
Item 4. (Removed and Reserved).
Item 5. Other Information.
None.
Item 6. Exhibits.
| Exhibit No. | | Document Description |
| 10.1 | | Separation and Release Agreement dated August 6, 2010 by and between China 3C Group and Kenneth Berents (1) |
| | | |
| 31.1 | | Certification of the Chief Executive Officer pursuant to Rule 13A-14(A)/15D-14(A) of the Securities Exchange Act of 1934, as adopted pursuant to Section 302 of the Sarbanes-Oxley Act of 2002. |
| | | |
| 31.2 | | Certification of the Chief Financial Officer pursuant to Rule 13A-14(A)/15D-14(A) of the Securities Exchange Act of 1934, as adopted pursuant to Section 302 of the Sarbanes-Oxley Act of 2002. |
| | | |
| 32.1 | | Certification of the Chief Executive Officer and Chief Financial Officer pursuant to 18 U.S.C. 1350 (Section 906 of the Sarbanes-Oxley Act of 2002). |
(1) Incorporated by reference from the Registrant’s Current Report filed with the SEC on Form 8-K on August 12, 2010.
SIGNATURES
Pursuant to the requirements of the Securities Exchange Act of 1934, the registrant has duly caused this report to be signed on its behalf by the undersigned thereunto duly authorized.
| | CHINA 3C GROUP |
| | | |
| Date: August 16, 2010 | By: | /s/ Zhenggang Wang |
| | Name: Zhenggang Wang |
| | Title: Chief Executive Officer and Chairman |
| | (Principal Executive Officer) |
| | |
| | | |
| Date: August 16, 2010 | By: | /s/ Jian Zhang |
| | Name: Jian Zhang |
| | Title: Chief Financial Officer (Principal Accounting and Financial Officer) |
| | |
Exhibit Index
| Exhibit No. | | Document Description |
| 10.1 | | Separation and Release Agreement dated August 6, 2010 by and between China 3C Group and Kenneth Berents (1) |
| | | |
| 31.1 | | Certification of the Chief Executive Officer pursuant to Rule 13A-14(A)/15D-14(A) of the Securities Exchange Act of 1934, as adopted pursuant to Section 302 of the Sarbanes-Oxley Act of 2002. |
| | | |
| 31.2 | | Certification of the Chief Financial Officer pursuant to Rule 13A-14(A)/15D-14(A) of the Securities Exchange Act of 1934, as adopted pursuant to Section 302 of the Sarbanes-Oxley Act of 2002. |
| | | |
| 32.1 | | Certification of the Chief Executive Officer and Chief Financial Officer pursuant to 18 U.S.C. 1350 (Section 906 of the Sarbanes-Oxley Act of 2002). |
(1) Incorporated by reference from the Registrant’s Current Report filed with the SEC on Form 8-K on August 12, 2010.