China 3C Group
368 HuShu Nan Road
HangZhou City, Zhejiang Province, China 310014
May 16, 2012
Andrew D. Mew
Accounting Branch Chief
Division of Corporate Finance
Securities and Exchange Commission
100 F Street, N.E.
Washington, D.C. 20549
| Re: | China 3C Group (the “Company” or “China 3C”) |
Form 10-K for the Fiscal Year Ended December 31, 2010
Filed May 18, 2011
Amendment No. 1 to Form 10-K for Fiscal Year Ended December 31, 2010
Filed March 23, 2012
File No. 000-28767
Dear Mr. Mew:
We hereby provide responses to comments issued in a letter dated April 3, 2012 (the “Staff’s Letter”) regarding the Company’s Annual Report on Form 10-K, filed on May 18, 2011, as amended on March 23, 2012 (the “Form 10-K/A”). The discussion below reflects our responses to the Staff’s Letter on a point by point basis.
Form 10-K/Amendment No. 1 for the Fiscal Year Ended December 31, 2010
General
1. We note your Amendment No.1 to Form 10-K for the Fiscal Year Ended December 31,
2010 filed on March 23, 2012. Please address the following additional comments.
| · | Please revise the explanatory note on the cover page to further explain the nature of the various revisions and restatements. |
| · | Please label the columns of the income statements on page F-4 and the various affected footnote amounts such as those within the segment financial information footnote as “restated”. Please also label other similarly affected amounts as such throughout MD&A section and elsewhere, as applicable, in the filing. |
| · | Please provide a separate restatement footnote providing the “as reported” and “as restated” amounts of the affected line items within the income statements and the segment financial information footnote as well as the nature of their restatements. |
| · | Please file amendments to FY 2011 Forms 10-Q to restate their corresponding financial statements for the similar accounting errors as we previously requested. |
| · | Given the significance of the restatements on the affected income statement line items and the gross profit margins, we believe you should file an Item 4.02 of Form 8-K as soon as possible to disclose that your previously issued financial statements cannot be relied upon or explain to us why you are not required to do so. |
COMPANY RESPONSE: We are submitting Amendment No. 2 to the Form 10-K/A for the year ended December 31, 2010 (“Form 10-K/A”), Amendment No. 1 to the Form 10-Q for the period ended March 31, 2011, Amendment No. 1 to the Form 10-Q for the period ended June 30, 2011, and Amendment No. 1 to the Form 10-Q for the period ended September 30, 2011 (“Form 10-Q/As”) with this response letter for the Staff’s review as Annex A, Annex B, Annex C and Annex D, respectively. We have incorporated the Staff’s requested disclosure and revisions as instructed by the Staff’s Letter therein. To avoid filing multiple amendments, we will await for the Staff to complete its review before the Company makes its filing of Form 10-K/A and Form 10-Q/As on Edgar.
The Company will file a Form 8-K under Item 4.02 to disclose that its previously issued financial statements cannot be relied upon.
Financial Statements and Notes
Note 13. Segment Information, page F-23
2. Please reconcile for us the FY 2010 loss from operations amounts as disclosed here
within the Home Electronic, Consumer Electronics and Logistics reportable segments to those you disclosed in MD&A from pages 20 to 22 or revise.
COMPANY RESPONSE: Please see the Company’s response to Comment No. 1.
[Signature Page Follows]
| 2 |
Your prompt attention to this filing would be greatly appreciated. Should you have any questions concerning any of the foregoing please contact Angela Dowd, legal counsel to the Company, at 212-407-4097.
Sincerely,
| /s/ Weiping Wang |
| Weiping Wang |
| Chief Financial Officer |
| 3 |
Annex A
UNITED STATES
SECURITIES AND EXCHANGE COMMISSION
WASHINGTON, D.C. 20549
FORM 10-K/A
(Amendment No. 2)
(Mark One)
| x | ANNUAL REPORT PURSUANT TO SECTION 13 OR 15(d) OF THE SECURITIES EXCHANGE ACT OF 1934 |
For the fiscal year endedDecember 31, 2010
OR
| ¨ | TRANSITION REPORT PURSUANT TO SECTION 13 OR 15(d) OF THE SECURITIES EXCHANGE ACT OF 1934 |
For the transition period from ____________ to ____________
Commission file number 000-28767
CHINA 3C GROUP
(Exact name of registrant as specified in its charter)
| Nevada | 88-0403070 | |
(State or Other Jurisdiction of Incorporation or Organization) | (I.R.S. Employer Identification No.) |
368 HuShu Nan Road
HangZhou City, Zhejiang Province, China 310014
(Address of Principal Executive Offices) (Zip Code)
Registrant’s telephone number, including area code: 086-0571-88381700
Securities registered pursuant to Section 12(b) of the Act: None
Securities registered pursuant to Section 12(g) of the Act:
Common Stock, $0.001 par value
Title of class
Indicate by check mark if the registrant is a well-known seasoned issuer, as defined in Rule 405 of the Securities Act. Yes ¨ No x
Indicate by check mark if the registrant is not required to file reports pursuant to Section 13 or Section 15(d) of the Act. Yes ¨ No x
Indicate by check mark whether the registrant: (1) has filed all reports required to be filed by Section 13 or 15(d) of the Securities Exchange Act of 1934 during the preceding 12 months (or for such shorter period that the registrant was required to file such reports), and (2) has been subject to such filing requirements for the past 90 days. Yes x No ¨
Indicate by check mark whether the registrant has submitted electronically and posted on its corporate Web site, if any, every Interactive Data File required to be submitted and posted pursuant to Rule 405 of Regulation S-T (§ 232.405 of this chapter) during the preceding 12 months (or for such shorter period that the registrant was required to submit and post such files). Yes ¨ No ¨
Indicate by check mark if disclosure of delinquent filers pursuant to Item 405 of Regulation S-K (§229.405 of this chapter) is not contained herein, and will not be contained, to the best of registrant’s knowledge, in definitive proxy or information statements incorporated by reference in Part III of this Form 10-K or any amendment to this Form 10-K. x
Indicate by check mark whether the registrant is a large accelerated filer, an accelerated filer, a non-accelerated filer, or a smaller reporting company. See the definitions of “large accelerated filer,” “accelerated filer” and “smaller reporting company” in Rule 12b-2 of the Exchange Act.
| Large accelerated filer ¨ | Accelerated filer ¨ |
Non-accelerated filer ¨ (Do not check if a smaller reporting company) | Smaller reporting company x |
Indicate by check mark whether the registrant is a shell company (as defined in Rule 12b-2 of the Exchange Act). Yes ¨No x
The aggregate market value of the 44,861,327 shares of voting and non-voting common equity stock held by non-affiliates of the registrant was approximately $13,458,398 as of June 30, 2010, the last business day of the registrant’s most recently completed second fiscal quarter, based on the last sale price of the registrant’s common stock on such date of $0.30 per share, as reported on the OTC Bulletin Board.
As of May 17, 2011, there were 58,511,327 shares of the registrant’s common stock outstanding.
Documents incorporated by reference: None.
EXPLANATORY NOTE
This Amendment No. 2 to our Annual Report on Form 10-K/A ("Form 10-K/A") is being filed to amend our Annual Report on 10-K for the year ended December 31, 2010 ("Form 10-K"), which was originally filed with the Securities and Exchange Commission (the "SEC") on May 18, 2011, as amended on March 23, 2012. We are filing this Amendment No. 2 to include disclosure consistent with comments received by the SEC. We are amending and restating Items 1, 7, 8, 9 and 15 in this Form 10-K/A.
Below is a summary of these errors and the related corrections:
| · | The Company amended Item 1 to clarify the fact that Capital did not sell its equity ownership in Zhejiang upon executing the contractual agreements in 2007. Capital remains as the owner of 100% equity of Zhejiang through shareholding entrustment agreements. |
| · | The Company reclassified fees paid to department stores from a contra revenue account to selling, general and administrative expenses. The amount of $9,740, $10,505 and $12,687 were previously classified in contra-revenue account as a deduction to net sales for the year ended December 31, 2010, 2009 and 2008. The Company moved the amount to selling expenses, and it is reported as selling, general and administrative expenses in the statement of operations and comprehensive loss. The reclassification caused a $9,740 increase in net sales from $148,354 to $158,094 and a corresponding increase of $9,740 in Selling, general and administrative expenses from $32,523 to $42,263 in 2010; a $10,505 increase in net sales from $208,489 to $218,994 and a corresponding increase of $10,505 in Selling, general and administrative expenses from $21,621 to $32,126 in 2009; a $12,687 increase in net sales from $310,644 to $323,331 and a corresponding increase of $12,687 in Selling, general and administrative expenses from $14,132 to $26,819 in 2008. The gross profit increased $9,740, $10,505 and $12,687 respectively in 2010, 2009 and 2008. The loss from operations and net loss remained unchanged. The impact of the restatement was limited to the presentation of the consolidated statements of operations and comprehensive income (loss). The consolidated balance sheets, the consolidated statements of stockholders’ equity and the related consolidated statements of cash flows remained unaffected. See changes in Item 15. |
| · | The restatement above also affected the disclosure of segment reporting. As a result, we have amended Note 13 - SEGMENT INFORMATION and ITEM 7. MANAGEMENT’S DISCUSSION AND ANALYSIS OF FINANCIAL CONDITION AND RESULTS OF OPERATIONS. |
| · | The Company amended Item 9 revising our conclusions on the effectiveness of disclosure controls and procedures and internal control over financial reporting to “ineffective.” |
In addition, as required by Rule 12b-15 of the Securities Exchange Act of 1934, this Amendment No. 2 contains new certifications by our Chief Executive Officer and our Chief Financial Officer, filed as exhibits hereto.
CHINA 3C GROUP
Table of Contents
| PAGE | |||
| PART I | 4 | ||
| Item 1 | Business | 4 | |
| PART II | 13 | ||
| Item 7 | Management’s Discussion and Analysis of Financial Condition and Results of Operations | 13 | |
| Item 8 | Financial Statements and Supplementary Data | 32 | |
| Item 9 | Changes in and Disagreements with Accountants on Accounting and Financial Disclosure | 32 | |
| Item 9A(T) | Controls and Procedures | 32 | |
| Item 9B | Other Information | ||
| PART IV | 34 | ||
| Item 15 | Exhibits, Financial Statement Schedules | 34 | |
| Index to Consolidated Financial Statements | F-1 |
| 2 |
Forward Looking Statements
We have included and from time to time may make in our public filings, press releases or other public statements, certain statements, including, without limitation, those under ��Management’s Discussion and Analysis of Financial Condition and Results of Operations” in Part II, Item 7. In some cases these statements are identifiable through the use of words such as “anticipate,” “believe,” “estimate,” “expect,” “intend,” “plan,” “project,” “target,” “can,” “could,” “may,” “should,” “will,” “would” and similar expressions. You are cautioned not to place undue reliance on these forward-looking statements. In addition, our management may make forward-looking statements to analysts, investors, representatives of the media and others. These forward-looking statements are not historical facts and represent only our beliefs regarding future events, many of which, by their nature, are inherently uncertain and beyond our control.
| 3 |
PART I
ITEM 1. BUSINESS
Overview
China 3C Group (including our subsidiaries unless the context indicates otherwise, the “Company”, “China 3C,” “China 3C Group,” “we,” or “us”) was incorporated on August 20, 1998 under the laws of the State of Nevada. Before July 2009, we were only engaged in the resale and distribution of third party products and generated 100% of our revenue from resale of items such as mobile phones, facsimile machines, DVD players, stereos, speakers, MP3 and MP4 players, iPods, electronic dictionaries, CD players, radio Walkmans and audio systems. On July 6, 2009, we acquired Jinhua Baofa Logistic Ltd. (“Jinhua”). At that point, we started providing transportation logistics services to businesses in Eastern China.
In 2007 we began operating under a “store in store” business model. As of December 31, 2010 we established and operated 821 “stores in stores.” We operate under the brand names Hangzhou Wang Da, Yiwu YongXin, Shanghai Joy & Harmony and Hangzhou Sanhe. The “store in store” business operation model resulted in expanded marketing channels, thus, positively stimulated the growth of sales in 2007 and 2008. However, starting in 2009, we had declining sales under the “stores in stores” model due to increased competition from direct stores and large department stores as well as the impact of the economic slow down. Therefore, we decided to open direct stores and franchises. As of December 31, 2010, Zhejiang has three direct and two franchise stores in operation.
On July 6, 2009, China 3C and its subsidiary Zhejiang (as defined below) and Yiwu (as defined below) acquired 100% of Jinhua. Jinhua provides transportation logistics services to businesses.
Under the stores in stores model, we distribute our products mainly via so-called concessionaire agreements with larger department stores, supermarkets, large electronics retail stores, and other retailers. The retail distribution of many products in China, including those we sell, is conducted through the concessionaire model. Under this model, companies such as China 3C own their own outlets within larger stores and in so doing assume responsibility for most financial and operational aspects of those outlets including capital cost, inventory, wages, selection, pricing, and general management. Our retail partners are compensated via margin they earn on the products we sell. This model is similar to that employed by many department stores in the US. However, this model is different from the model found at large electronic retailers like Best Buy and general retailers like Wal-Mart. We have found that many investors are curious as to why the model in China differs from the one found in the US. We believe the main reasons are:
| ¨ | We decrease the financial risk for our retail partners by assuming responsibility for the inventory and capital expense associated with distributing our products. |
| ¨ | We decrease operational risk for our retail partners by hiring and managing employees and handling logistics issues such as wholesale purchase and delivery and returns and after-sales service. |
| ¨ | We decrease merchandising risk for our retail partners by bringing product expertise and specific market knowledge that is difficult for large retailers to develop on their own across a broad range of product categories. |
| 4 |
| ¨ | China’s size, regional differences, logistical difficulties, managerial challenges, underdeveloped credit markets, and rapid growth rate increases risk for all retailers and drive the need to mitigate risk which is why our retail partners rely on us. |
Organizational Structure
(All dollar amounts in thousands)
China 3C was incorporated on August, 20, 1998 under the laws of the State of Nevada. Capital Future Developments Limited (“CFDL”) was incorporated on July 22, 2004 under the laws of the British Virgin Islands. Zhejiang Yong Xin Digital Technology Company Limited (“Zhejiang”), Yiwu Yong Xin Communication Limited (“Yiwu”), Hangzhou Wandda Electronics Company Limited (“Wang Da”), Hangzhou Sanhe Electronic Technology, Limited (“Sanhe”), and Shanghai Joy & Harmony Electronic Development Company Limited (“Joy & Harmony”) were incorporated under the laws of the Peoples Republic of China (“PRC” or “China”) on July 11, 2005, July 18, 1997, March 30, 1998, April 12, 2004, and August 25, 2003, respectively. China 3C owns 100% of CFDL and CFDL own 100% of the capital stock of Joy & Harmony and Sanhe. Until August 14, 2007, when it made the change to its ownership structure described in the next paragraph in order to comply with certain requirements of PRC law, CFDL owned 100% of the capital stock of Zhenjiang. Zhejiang owns 90% and Yiwu owns 10% of Wang Da. Zhejiang owns 90% and Wang Da owns 10% of Yiwu. On March 10, 2009 Zhejiang set up a new operating entity, Hangzhou Letong Digital Technology Co., Ltd. (“Letong”) to establish an electronic retail franchise operation for China 3C Group. On July 6, 2009, Zhejiang and Yiwu acquired Jinhua. Jinhua was incorporated under the laws of PRC on December 27, 2001.
On December 21, 2005, CFDL became a wholly owned subsidiary of China 3C through a merger with a wholly owned subsidiary of the Company (the “Merger Transaction”). China 3C acquired all of the issued and outstanding capital stock of CFDL pursuant to a Merger Agreement dated at December 21, 2005 by and among China 3C, XY Acquisition Corporation, CFDL and the shareholders of CFDL (the “Merger Agreement”). Pursuant to the Merger Agreement, CFDL became a wholly owned subsidiary of China 3C and, for the CFDL shares, China 3C issued 35,000,000 shares of its common stock to the shareholders of CFDL, representing 93% of the issued and outstanding capital stock of China 3C at that time and cash of $500.
On August 3, 2006, Capital acquired a 100% interest in Sanhe for a cash and stock transaction valued at approximately $8,750. The consideration consisted of 915,751 newly issued shares of the Company’s common stock and $5,000 in cash.
On November 28, 2006, Capital acquired a 100% interest in Joy & Harmony for a cash and stock transaction valued at approximately $18,500. The consideration consisted of 2,723,110 shares of the Company’s common stock and $7,500 in cash.
On August 15, 2007, we executed a series of contractual agreements between Capital and Zhejiang. The contractual agreements give Capital and its equity owners an obligation, and having ability to absorb, any losses, and rights to receive returns; however, these contractual agreements did not change the equity ownership of Zhejiang. We did not dispose Capital’s actual equity ownership of Zhejiang when we execute the contractual agreements. Capital entered into share-holding entrustment agreements with five individuals: Zhenggang Wang, Yimin Zhang, Huiyi Lv, Xiaochun Wang and Zhongsheng Bao to hold 35%, 20%, 20%, 15% and 10%, respectively, of the equity interest of Zhejiang on behalf of Capital on November 21, 2005. The entrustment agreements confirm that CFDL is the actual owner of Zhejiang. CFDL enjoys the actual shareholder’s rights and has the right to obtain any benefits received by the nominal holders. Zhenggang Wang is the CEO and shareholder of China 3C Group. Yimin Zhang, Huiyi Lv, Xiaochun Wang and Zhongsheng Bao have no other relationship with China 3C Group. No consideration was given to these individuals who held the equity of Zhejiang on behalf of CFDL.
| 5 |
On July 6, 2009, China 3C’s subsidiaries, Zhejiang and Yiwu acquired Jinhua, a company organized under the laws of the PRC. Zhejiang acquired 90% and Yiwu acquired 10% of the entire equity interests in Jinhua from the shareholders of Jinhua for a purchase price of RMB 120,000,000 ($17,500) in cash.
Yiwu, Wangda, Sanhe, Joy & Harmony are engaged in the business of resale and distribution of third party products and generate approximately 100% of their revenue from resale of items such as mobile phones, facsimile machines, DVD players, stereos, speakers, MP3 and MP4 players, iPod, electronic dictionaries, CD players, radios, Walkmans, and audio systems. We sell and distribute products through retail stores and secondary distributors. We operate most of our retail operations through our “store in store” model. Under this model, the Company leases space in major department stores and retailers. Leasing costs can vary based on a percentage of sales, or can be fixed. In 2010, 2009 and 2008, all of our stores in stores leases were variable based on sales.
In 2009, Zhejiang started establishing direct electronic retail stores and franchise operation.
Following the acquisition of Jinhua, the Company began providing logistic service to businesses in addition to its traditional business of resale and distribution of third party products such as mobile phones, facsimile machines, DVD players, stereos, speakers, MP3 and MP4 players, iPods, electronic dictionaries, CD players, radio Walkmans and audio systems.
Our corporate structure as of December 31, 2010 is as follows:
| 6 |

Our Business
Information About Our Segments
During fiscal 2010, we operated in five reportable segments:
| a. | Yiwu Yong Xin Telecommunication Company, Limited, or “Yiwu,” focuses on the selling, circulation and modern logistics of fax machines and cord phone products. |
| b. | Hangzhou Wang Da Electronics Company, Limited, or “Wang Da,” focuses on the selling, circulation and modern logistics of cell phones, cell phones products, and digital products, including digital cameras, digital camcorders, PDAs, flash disks, and removable hard disks. |
| 7 |
| c. | Hangzhou Sanhe Electronic Technology Limited “Sanhe,” focuses on the selling, circulation and modern logistics of home electronics, including DVD players, audio systems, speakers, televisions and air conditioners. |
| d. | Shanghai Joy & Harmony Electronics Company Limited or “Joy & Harmony,” focuses on the selling, circulation and modern logistics of consumer electronics, including MP3 players, MP4 players, iPod, electronic dictionary, radios, and Walkmans. |
| e. | Jinhua Baofa Logistic Company Litmited or “Jinhua” provides transportation logistics services to businesses. Jinhua operates primarily in Eastern China and covers many of the most developed cities in the Eastern China such as Shanghai, Hangzhou and Nanjing |
Financial information about our segments is included in Item 7, Management's Discussion and Analysis of Financial Condition and Results of Operations, and Note 13, Segment Information, of the Notes to Consolidated Financial Statements, included in Item 8, Financial Statements and Supplementary Data, of this Annual Report on Form 10-K.
Yiwu Yong Xin Telecommunication Company, Limited (“Yiwu”)
Yiwu is an authorized sales agent, focusing on the selling, circulation and modern logistics of fax machines and cord phone products in China. Yiwu mainly distributes Philips fax machines and China’s local brands Feng Da and CJT fax machines. Yiwu sells its products through retail “stores in stores” in major department stores throughout the Huadong Region of China (consisting of the Chinese provinces of Zhejiang, Jiangsu and Anhui). Yiwu had 211 retail locations in 2010. Yiwu contributed 12.6% of the Company’s revenue in 2010.
The five largest suppliers and customers of Yiwu for 2010 are as follows:
| Top 5 suppliers | Top 5 customers | |
| Yiwu are Fengda Technology Company Limited | Zhejiang Suning Appliance Company Limited | |
| Ninbo Zhongxun Electronics Company Limited | Shanghai Suning Appliance Company Limited | |
| Shanghai Zhongfang Electronics Company Limited | Suning Appliance Company Limited | |
| Hangzhou Senruida Trade Company Limited | Yongle China Appliance Company Limited | |
| Shanghai Hongyi Office Supplies Company Limited | Shanghai GOME Electrical Appliances Limited |
The top five suppliers contributed 84.2% of purchases of Yiwu in 2010 and the top five customers contributed 32.9% of revenue of Yiwu in 2010.
Yiwu has a diverse customer base and, the loss of any single customer is not expected to have a material adverse affect on its business and operations. Yiwu did not spend a material amount of money on research and development in 2010.
| 8 |
The main competitors of Yiwu are Hangzhou Xinfeng Office Equipment Co, Ltd., Hangzhou Sihai Office Equipment Co, Ltd. and Shanghai Xunbo Office Equipment Co, Ltd.
Hangzhou Wang Da Electronics Company, Limited (“Wang Da”)
Wang Da is an authorized sales agent focusing on the selling, circulation and modern logistics of cell phones, cell phone products, IT products (including notebook or laptop computers), and digital products (including digital cameras, digital camcorders, MP3 players, PDAs, flash disks, and removable hard disks) in China. Wang Da mainly distributes its products through retail “stores in stores” located in major department stores throughout the “Huadong” region of China (consisting of the Chinese provinces of Zhejiang, Jiangsu and Anhui). Wang Da had 215 retail locations in 2010. Wang Da contributed 28.5% of the Company’s revenue in 2010.
The five largest suppliers and customers for Wang Da in 2010 are as follows:
| Top 5 suppliers | Top 5 customers | |
| Shenzhen Tianyin Telecommunication Company Limited | Zhejiang Suning Appliance Company Limited | |
| Hangzhou Weihua Telecommunication Company Limited | Shanghai Jiadeli Supermarket Group | |
| Hangzhou Tianchen Digital Telecommunication Company Limited | Shanghai Guangda Comunication Terminal Products Sales Company Limited | |
| Hangzhou Liandong Telecommunication Equipment Company Limited | Suzhou Meijia Supermarket Group | |
| Shanghai Post&Telecom Appliances Company (Hangzhou) | Huarun Vanguard Supermarket (Zhejiang) Company Limited |
The five largest suppliers contributed 60.9% of the purchases of Wang Da in 2010 and the five largest customers contributed 15.7% of revenue of Wang Da in 2010.
Wang Da has a diverse customer base and the loss of any single customer is not expected to have a material adverse affect on the Company’s business and operations. Wang Da did not spend a material amount of money on research and development and did not have a significant backlog as of December 31, 2010.
The main competitors of Wang Da include Telephone World, Hangzhou Yindun, Shanghai Guangda, Changjiang Tianyin and Hangzhou Zhenghua. Additionally, there are Ningbo Haishu and Zhongyu. Wang Da has many years of experiences in mobile phone sales. Wang Da has a wide distribution network in Zhejiang, Shanghai, Jiangsu and other regions. These competitors use a variety of business models such as “store in stores”, free standing stores and distribution channels. The competitors have smaller scale of operation and smaller distribution regions compared to Wang Da. Therefore, these competitors typically have only a fraction of our sales.
Hangzhou Sanhe Electronic Technology Limited (“Sanhe”)
Sanhe is a home electronics retail chain in Eastern China, headquartered in HangZhou City. In 2010, it had 210 retail “store in stores” in Shanghai City, Zhejiang Province and Jiangsu Province. Sanhe specializes in the sale of home electronics, including air conditioners, audio systems, speakers, DVD players and TV. Sanhe contributed 27.7% of the Company’s revenue in 2010.
| 9 |
The five largest suppliers and customers for Sanhe in 2010 are as follows:
| Top 5 suppliers | Top 5 customers | |
| Hangzhou Xietong Trade Company Limited | Lianhua Supermarket Group | |
| Zhejiang Zhuocheng Digital Electronics Company Limited | Hangzhou Lianhua Huashang Group | |
| Shanghai Haier Industrial and Trade Company | Shanghai Lotus Supercenter | |
| Shenzhen Chuangwei-RGB Electronics Company | Jiangsu Times Supermarket Company Limited | |
| TCL Electronics Company Limited | Huarun Vanguard Supermarket (Zhejiang) Company Limited |
The five largest suppliers contributed 68.8% of the purchases of Sanhe in 2010 and the top five customers contributed 31.9% of revenue of Sanhe in 2010.
Sanhe has a diverse customer base and, the loss of any one customer would not likely have an adverse effect on the Company’s sales. The Company did not spend a material amount of money on research and development, and did not have a significant backlog as of December 31, 2010.
The main competitors of Sanhe include Hangzhou Meidi, Hangzhou Danong, Nanjing Mingci, Shanghai Feitong and Jiangshu Huayi. Sanhe has many years of experience in the sale of home electronics which has allowed it to build good relationships with brand name companies such as TCL, Skyworth, Meidi, Longdi and Galanz. In addition, Sanhe has the competitive advantage of maintaining an extensive distribution network.
Shanghai Joy & Harmony Electronics Company Limited (“Joy & Harmony”)
Joy & Harmony is a consumer electronics retail chain in Eastern China. It had 196 retail locations in Shanghai City and Jiangsu Province in 2010. Joy & Harmony specializes in the sale of consumer electronics, including MP3 players, MP4 players, iPods, electronic dictionaries, CD players, radios, Walkmans, audio systems and speakers. The company is the authorized sales agent for well-known manufacturers in China, including Tecsun Radio and Changhong ZARVA. Joy & Harmony contributed 23.5% of the Company’s revenue in 2010.
The five largest suppliers and customers for Joy & Harmony in 2010 are as follows:
| Top 5 suppliers | Top 5 customers | |
| SONY (China) Company Limited (Shanghai) | Shanghai Xinzehui Digital Technology Company Limited | |
| Shanghai Ganshun Trade Company Limited | Shanghai Sanmen Tesco Company Limited | |
| Huaqi Information Digital Technology Company Limited (Shanghai) | Shanghai Jiading Tesco Company Limited | |
| Shanghai Caitong Digital Technology Company Limited | Shanghai Jinshan Tesco Company Limited | |
| Shanghai Bohui Electronics Company Limited | Suzhou Auchan Supermarket Company Limited |
| 10 |
The five largest suppliers contributed 65.2% of the purchases of Joy & Harmony in 2010and the top five customers contributed 3.7% of revenue of Joy & Harmony in 2010.
As a retailer with hundreds of locations, the Company is not reliant on any one customer or on a few customers. The loss of any one customer would not likely have an adverse effect on Joy & Harmony’s sales. Joy & Harmony did not have any material backlog of orders at December 31, 2010. Joy & Harmony did not spend a material amount of money on research and development in 2010.
The main competitors of Joy & Harmony include Zhejiang Yifeng Technology Co., Ltd, Shanghai Yuanmai Trade Co, Ltd and Shanghai Like Digital Technology Co, Ltd. Joy & Harmony has a large number of retail locations compared to its competitors. In addition, Joy & Harmony has built good relationships with suppliers of well-known brands such as Apple, Sony, Meizu, Tecsun and Aigo.
Jinhua Baofa Logistic Litmited (“Jinhua”)
Jinhua has been in operation since 2001. Jinhua transports electronics, machinery and equipment, metal products, chemical materials, garments and handcrafted goods for businesses in the Eastern China region in which China 3C operates, such as Shanghai, Hangzhou and Nanjing. Jinhua contributed 7.2% of revenue to the Company in 2010.
The five largest vendors and customers for Jinhua in 2010 are as follows:
| Top 5 suppliers | Top 5 customers | |
| Zhejiang Sheng Tong Logistic Company Limited | Xiamen Shida Transportation Company Limited | |
| Hangzhou Shenzhou Transportation Company Limited | Guangzhou Shuntong Transportation Company Limited | |
| Shanghai Sheng Hui Transportation Company Limited | Wuhan Tianda Express Company Limited | |
| Shanghai Hong Wei Transportation Company Limited | Fuzhou Zhilian Logistics Company Limited | |
| Jiaxingshi Guohong Vehicle Transportation Company Limited | Suzhou Auchan Supermarket Company Limited Zhuhai Zhijie Express Company Limited |
The five largest vendors contributed to 34.0% of direct cost of Jinhua in 2010 and the top five customers contributed 8.3% of revenue of Jinhua in 2010.
The main competitors of Jinhua include Hangzhou Hongrun Transportation Co., Ltd, Hangzhou Tianzhao Logistics Co., Ltd, Hangzhou Huishen Logistics Co., Ltd, Terry Logistics Group Co., Ltd, Shanghai Yanfu Logistics Co., Ltd, Shanghai Zhicheng Logistics Co., Ltd and Shanghai Jiaje Express Co., Ltd.
| 11 |
Intellectual Property
We consider our logos important to our business. We applied to register 10 logos with the State Administration of Industry and Commerce in China in 2007 and are currently awaiting the administration’s approval.
Seasonality and Quarterly Fluctuations
Our businesses experience fluctuations in quarterly performance. Traditionally, the first quarter has a greater amount of sales reflected by our electronics business due to the New Year holidays in China occurring during that period. Nevertheless, at times, China can experience particularly inclement weather in January and February which can disrupt the Company’s supply chain management systems. As our business model is to operate only on several days of inventory, the effects of such weather disruptions can be severe in certain years.
Working Capital
We fund our business operations through a combination of available cash and equivalents, short-term investments and cash flows generated from operations. We believe our currently available working capital, primarily cash from operations, is adequate to execute our current business plan.
Customers
We do not have a significant concentration of sales to any individual customer and, therefore, the loss of any one customer would not have a material impact on our business. No single customer has accounted for 10% or more of our total revenue in 2010 and 2009.
Backlog
We do not have a material amount of backlog orders.
Government Contracts
No material portion of our business is subject to renegotiation of profits or termination of contracts or subcontracts at the election of the Chinese government.
Competition
We compete against other consumer electronics retailers and wholesalers. We compete principally on the basis of product assortment and availability and value pricing, customer service; store location and convenience and after-sales services. We believe our broad product assortment, competitive pricing and convenient store locations differentiate us from most competitors. Our stores compete by emphasizing a complete product and service solution and value pricing. In addition, our trained and knowledgeable sales and service staffs allow us to tailor the offerings to meet the needs of our customers.
Research and Development
We have not engaged in any material research and development activities during the past two fiscal years.
Environmental Matters
We are subject to China’s National Environmental Protection Law, as well as a number of other national and local laws and regulations regulating air, water and noise pollution and setting pollutant discharge standards. We believe that all our operations are in material compliance with all applicable environmental laws. We did not incur any costs to comply with environmental laws in 2010 and 2009.
| 12 |
Employees
The Company currently has 2,271 employees, all of which are full time employees located in China. Zhejiang has 52 employees, Yiwu has 297 employees, Wang Da has 525 employees, Sanhe has 521 employees, Joy & Harmony has 352 employees and Jinhua has 524 employees.
The Company has no collective bargaining agreements with any unions.
Part II
ITEM 7. MANAGEMENT’S DISCUSSION AND ANALYSIS OF FINANCIAL CONDITION AND RESULTS OF OPERATIONS
The following discussion should be read in conjunction with the Consolidated Financial Statements and Notes thereto appearing elsewhere in this Form 10-K. The following discussion contains forward-looking statements. Our actual results may differ significantly from those projected in the forward-looking statements. Factors that may cause future results to differ materially from those projected in the forward-looking statements include, but are not limited to, those discussed in “Risk Factors” and elsewhere in this Form 10-K/A.
Overview (All dollar amounts in thousands)
China 3C owns 100% of CFDL and CFDL own 100% of the capital stock of Joy & Harmony and Sanhe. Until August 14, 2007, when it made the change to its ownership structure described in the next paragraph in order to comply with certain requirements of PRC law, CFDL owned 100% of the capital stock of Zhenjiang. Zhejiang owns 90% and Yiwu owns 10% of Wang Da. Zhejiang owns 90% and Wang Da owns 10% of Yiwu. On March 10, 2009 Zhejiang set up a new operating entity, Hangzhou Letong Digital Technology Co., Ltd. (“Letong”) to establish an electronic retail franchise operation for China 3C Group. On July 6, 2009, Zhejiang and Yiwu completed the acquisition of Jinhua Baofa Logistic Ltd (“Jinhua”). Jinhua was incorporated under the laws of PRC on December 27, 2001.
On December 21, 2005, CFDL became a wholly owned subsidiary of China 3C through a merger with a wholly owned subsidiary of the Company (the “Merger Transaction”). China 3C acquired all of the issued and outstanding capital stock of CFDL pursuant to a the Merger Agreement dated at December 21, 2005 by and among China 3C, XY Acquisition Corporation, CFDL and the shareholders of CFDL (the “Merger Agreement”). Pursuant to the Merger Agreement, CFDL became a wholly owned subsidiary of China 3C and, in exchange for the CFDL shares, China 3C issued 35,000,000 shares of its common stock to the shareholders of CFDL, representing 93% of the issued and outstanding capital stock of China 3C at that time and cash of $500. On August 15, 2007, we executed a series of contractual agreements between Capital and Zhejiang. The contractual agreements give Capital and its equity owners an obligation, and having ability to absorb, any losses, and rights to receive returns; however, these contractual agreements did not change the equity ownership of Zhejiang. We did not dispose Capital’s actual equity ownership of Zhejiang when we execute the contractual agreements. Capital entered into share-holding entrustment agreements with five individuals: Zhenggang Wang, Yimin Zhang, Huiyi Lv,Xiaochun Wang and Zhongsheng Bao to hold 35%, 20%, 20%, 15% and 10%, respectively, of the equity interest of Zhejiang on behalf of Capital on November 21, 2005. The entrustment agreements confirm that CFDL is the actual owner of Zhejiang. CFDL enjoys the actual shareholder rights and has the right to obtain any benefits received by the nominal holders. Zhenggang Wang is the CEO and shareholder of China 3C Group. Yimin Zhang, Huiyi Lv, Xiaochun Wang and Zhongsheng Bao have no other relationship with China 3C Group. No consideration was given to these individuals who held the equity of Zhejiang on behalf of CFDL.
As a result of the Merger Agreement, the reorganization was treated as an acquisition by the accounting acquiree that is being accounted for as a recapitalization and as a reverse merger by the legal acquirer for accounting purposes. Pursuant to the recapitalization, all capital stock shares and amounts and per share data have been retroactively restated. Accordingly, the financial statements include the following:
| 13 |
(1) The balance sheet consists of the net assets of the accounting acquirer at historical cost and the net assets of the legal acquirer at historical cost.
(2) The statements of operations include the operations of the accounting acquirer for the period presented and the operations of the legal acquirer from the date of the merger.
Pursuant to a share exchange agreement, dated August 3, 2006, we issued 915,751 shares of restricted common stock to the former shareholders of Sanhe, valued at $3,750, which was the fair value of the shares at the date of the share exchange agreement. This amount is included in the cost of net assets and goodwill purchased.
Pursuant to a share exchange agreement, dated November 28, 2006, we issued 2,723,110 shares of newly issued shares of common stock to the former shareholders of Joy & Harmony, valued at $11,000, which was the fair value of the shares at the date of exchange agreement. This amount is included in the cost of net assets and goodwill purchased.
On July 6, 2009, China 3C’s subsidiaries, Zhejiang and Yiwu completed acquisition of Jinhua, a company organized under the laws of the PRC. Zhejiang acquired 90% and Yiwu acquired 10% of the entire equity interests in Jinhua from the shareholders of Jinhua for a purchase price of RMB 120,000 ($17,500) in cash.
Yiwu, Wangda, Sanhe, Joy & Harmony are engaged in the business of resale and distribution of third party products and generates approximately 100% of its revenue from resale of items such as mobile phones, facsimile machines, DVD players, stereos, speakers, MP3 and MP4 players, iPod, electronic dictionaries, CD players, radios, Walkmans, and audio systems. We sell and distribute products through retail stores and secondary distributors. We operate most of our retail operations through our “store in store” model. Under this model, the Company leases space in major department stores and retailers. Leasing costs can vary based on a percentage of sales, or can be fixed. In 2010 and 2009, all of our stores in stores leases were variable based on sales.
In 2009, Zhejiang started establishing direct electronic retail stores and franchise operation. As of December 31, 2010, the Company has two franchise stores and three direct retail stores in operation, all of which are located in Zhejiang province. For the years ended December 31, 2010 and 2009, the direct stores and franchise stores had revenue of $138 and $258. The direct store and franchise operation is still in the early stage and does not represent a significant part of our business as of December 31, 2010.
Following the acquisition of Jinhua, the Company began providing logistic service to businesses in addition to its traditional business of resale and distribution of third party products such as mobile phones, facsimile machines, DVD players, stereos, speakers, MP3 and MP4 players, iPods, electronic dictionaries, CD players, radio Walkmans and audio systems.
Results of Operations
Year Ended December 31, 2010 compared to Year Ended December 31, 2009
Reportable Operating Segments
The Company reports financial and operating information in the following five segments:
| a) | Yiwu Yong Xin Telecommunication Company, Limited or “Yiwu” |
| b) | Hangzhou Wang Da Electronics Company, Limited or “Wang Da” |
| 14 |
| c) | Hangzhou Sanhe Electronic Technology Limited or “Sanhe” |
| d) | Shanghai Joy & Harmony Electronics Company Limited or “Joy & Harmony” |
| e) | Jinhua Baofa Logistic Limited or “Jinhua” |
| a) | Yiwu Yong Xin Telecommunication Company, Limited or “Yiwu” |
Yiwu focuses on the selling, circulation and modern logistics of fax machines and cord phone products.
All amounts, except percentage of revenues, in thousands of US dollars.
| Year Ended December 31, | Percentage | |||||||||||
| Yiwu | 2010 | 2009 | Change | |||||||||
| Revenue (restated) | $ | 20,251 | $ | 44,375 | (54.4 | )% | ||||||
| Gross Profit (restated) | $ | 2,328 | $ | 5,129 | (54.6 | )% | ||||||
| Gross Margin (restated) | 11.5 | % | 11.6 | % | (0.1 | )% | ||||||
| Operating (Loss) | $ | (2,456 | ) | $ | (612 | ) | (301.3 | )% | ||||
For the year ended December 31, 2010, Yiwu generated revenue of $20,251, a decrease of $24,124 or 54.4% compared to $44,375 for the year ended December 31, 2009. Gross profit decreased $2,801 or 54.6% from $5,129 for the year ended 2009 to $2,328 for the year ended 2010. Such decrease in revenue was primarily due to the shrinking market in office communication products. The decrease in revenue was also a result of closing 73 stores in stores in 2010. Operating losses was $2,456 in 2010; operating loss increased $1,844 or 301.3% compared to $612 in 2009. The increase in operating losses was primarily a result of higher labor cost and management fees paid to department stores as a percentage of sales.
Gross profit margin decreased from 11.6% in 2009 to 11.5% in 2010, a decrease of 0.1%. Such decrease is primarily due to the more competitive fax machines and telephone market in China compared to 2009. To maintain market share, we had to launch more promotions which negatively affected our gross margin. In addition, purchase rebate paid to suppliers, accounted for as an addition to cost of sales, as a percentage of sales increased in 2010, which led to lower gross margin of Yiwu.
| b) | Hangzhou Wang Da Electronics Company, Limited or “Wang Da” |
Wang Da focuses on the selling, circulation and modern logistics of cell phones, cell phones products, and digital products, including digital cameras, digital camcorders, PDAs, flash disks, and removable hard disks.
All amounts, except percentage of revenues, in thousands of US dollars.
| Year Ended December 31, | Percentage | |||||||||||
| Wang Da | 2010 | 2009 | Change | |||||||||
| Revenue (restated) | $ | 43,801 | $ | 58,744 | (25.4 | )% | ||||||
| Gross Profit (restated) | $ | 3,728 | $ | 6,600 | (43.5 | )% | ||||||
| Gross Margin (restated) | 8.5 | % | 11.2 | % | (2.7 | )% | ||||||
| Operating (Loss) | $ | (3,156 | ) | $ | (262 | ) | (1,104.6 | )% | ||||
For the year ended December 31, 2010, Wang Da generated revenue of $43,801, a decrease of $14,943 or 25.4% compared to $58,744 for the year ended December 31, 2009. Gross profit decreased $2,872 or 43.5% from $6,600 for the year ended 2009 to $3,728 for the year ended 2010. The decrease in revenue was primarily due to increased competition from government-owned large telecommunication service providers. Telecommunication service providers opened their direct operating stores to sell communication products. The number of electronics stores opened in the same area where Wang Da’s stores are located has increased in 2010. These government-owned companies also launched promotions such as “free phone with service contract” which drove the Wang Da’s revenue further down. Operating losses was $3,156 in 2010, increased $2,894 or 1,104.6% compared to operating loss of $262 in 2009. The increase in operating losses was primarily a result of higher labor cost and management fees paid to department stores as a percentage of sales.
| 15 |
Gross profit margin decreased from 11.2% in 2009 to 8.5% in 2010. The decrease was due to lower unit price of old model mobile phones as a result of the introduction of the 3G phones.
| c) | Hangzhou Sanhe Electronic Technology Limited or “Sanhe” |
Sanhe focuses on the selling, circulation and modern logistics of home electronics, including DVD players, audio systems, speakers, televisions and air conditioners.
All amounts, except percentage of revenues, in thousands of US dollars.
| Year Ended December 31, | Percentage | |||||||||||
| Sanhe | 2010 | 2009 | Change | |||||||||
| Revenue (restated) | $ | 42,427 | $ | 53,385 | (20.5 | )% | ||||||
| Gross Profit (restated) | $ | 4,426 | $ | 8,627 | (48.7 | )% | ||||||
| Gross Margin (restated) | 10.4 | % | 16.2 | % | (5.8 | )% | ||||||
| Operating (Loss) | $ | (5,469 | ) | $ | (741 | ) | (638.1 | )% | ||||
For the year ended December 31, 2010, Sanhe generated revenue of $42,427, a decrease of $10,958 or 20.5% compared to $53,385for the year ended December 31, 2009. Gross profit decreased $4,201 or 48.7% from $8,627 for the year ended 2009 to $4,426 for the year ended 2010. The decrease in revenue was primarily due to the shrinking market in DVD players and small home electronics as well as the closing of 11 stores in 2010. Operating losses was $5,469 in 2010, increased $4,728 or 638.1% compared to $741 in 2009. The increase in operating losses was primarily a result of non-cash goodwill impairment charge of $1,347, higher labor cost and management fees paid to department stores as a percentage of sales.
Gross profit margin decreased from 16.2% in 2009 to 10.4% in 2010. The decrease in gross profit and operation income was primarily due to the change in sales revenue mix. Due to the lesser sales of DVD players and other small home electronics, we increased sales volume of TV sets, which has a lower margin, to maintain the market share. Therefore, gross margin for Sanhe decreased in 2010.
Goodwill Impairment
We recorded non-cash goodwill impairment charge of $1,347 for the year ended December 31, 2010 to reduce the carrying amount of Sanhe’s goodwill to its estimated fair value based upon the impairment test conducted during the fourth quarter of 2010. For further discussion of goodwill impairment charges see Note 2 – “SUMMARY OF SIGNIFICANT ACCOUNTING POLICIES – Impairment of Goodwill” to the Consolidated Financial Statements.
| d) | Shanghai Joy & Harmony Electronics Company Limited or “Joy & Harmony” |
Joy & Harmony focuses on the selling, circulation and modern logistics of consumer electronics, including MP3 players, MP4 players, iPod, electronic dictionary, radios, and Walkman.
| 16 |
All amounts, except percentage of revenues, in thousands of US dollars.
| Year Ended December 31, | Percentage | |||||||||||
| Joy & Harmony | 2010 | 2009 | Change | |||||||||
| Revenue (restated) | $ | 40,247 | $ | 56,660 | (29.0 | )% | ||||||
| Gross Profit (restated) | $ | 5,460 | $ | 9,421 | (42.0 | )% | ||||||
| Gross Margin (restated) | 13.6 | % | 16.6 | % | (3.0 | )% | ||||||
| Operating Income (Loss) | $ | (11,395 | ) | $ | 1,012 | (1,226.0 | )% | |||||
For the year ended December 31, 2010, Joy & Harmony generated revenue of $40,247, a decrease of $16,413 or 29.0% compared to $56,660 for the year ended December 31, 2009. Gross profit decreased $3,961 or 42.0% from $9,421 for the year ended 2009 to $5,460 for the year ended 2010. The decrease in revenue was primarily due to a more competitive consumer electronics market as well as closing of 22 stores in 2010. The number of electronics stores located in the area where Joy & Harmony’s stores are located has increased in 2010. In addition, many small manufacturers closed down and large manufacturers raised the price of consumer electronics, which forced Joy & Harmony to discontinue some of its products. This caused sales to decline. Operating losses was $11,395 in 2010, a decrease of $12,407 or 1,226.0% compared to operating income of $1,012 in 2009, the decrease was primarily due to the non-cash goodwill impairment loss of $8,243 and an increase in management fees paid to department stores.
Gross profit margin decreased from 16.6% in 2009 to 13.6% in 2010. The global financial crisis caused many small electronics manufacturers to exit the market and large manufacturers to raise the price of consumer electronics. Therefore, the cost for Joy & Harmony increased, which led to a significant decline in gross margin.
Goodwill Impairment
We recorded non-cash goodwill impairment charge of $8,243 for the year ended December 31, 2010 to reduce the carrying amount of Joy & Harmony’s goodwill to its estimated fair value based upon the impairment test conducted during the fourth quarter of 2010. For further discussion of goodwill impairment charges see Note 2 – “SUMMARY OF SIGNIFICANT ACCOUNTING POLICIES – Impairment of Goodwill” to the Consolidated Financial Statements.
| e) | Jinhua Baofa Logistic Limited or “Jinhua” |
Jinhua provides transportation service to business and transports freight, including electronics, machinery and equipment, metal products, chemical materials, garments and handicraft goods, in more than 20 cities in Eastern China. Its transportation services cover many of the most developed cities in Eastern China such as Shanghai, Hangzhou and Nanjing.
China 3C acquired Jinhua on July 6, 2009. Therefore, the consolidated statement of income (loss) and comprehensive income (loss) of China 3C for the year ended December 31, 2009 includes Jinhua’s operating results from the date of acquisition to December 31, 2009.
All amounts, except percentages of revenues, are in thousands of US dollars.
| Jinhua | Year Ended December 31, 2010 | For the period from July 1 to December 31, 2009 | ||||||
| Revenue | $ | 10,691 | $ | 5,573 | ||||
| Gross Profit | $ | 1,402 | $ | 1,713 | ||||
| Gross Margin | 13.1 | % | 30.7 | % | ||||
| Operating Income (Loss) | $ | (1,448 | ) | $ | 1,098 | |||
Gross margin decreased 17.6% from 30.7% in 2009 to 13.1% in 2010 primarily due to the increased fuel cost. Operating income decreased primarily due to decreased gross margin. Higher operating expenses, in particular, also caused operating income to decrease. The labor cost of Jinhua increased 30% or $1,080 in 2010 due to the mandated government policy as well as higher inflation.
| 17 |
Net sales
Net sales for 2010 totaled $158,094 (restated), a year-over-year decrease of $60,900 or 27.8% compared to $218,994 (restated) for 2009. The decrease was attributable to the closing of 107 stores in stores in 2010 as well as the increased competition in the electronics market in China.
Percentage of sales
In 2010, the Company earned 68.8% of its sales from its retail operations and 31.2% from its wholesale operations compared to 68.9% from retail operations and 31.1% from wholesale in 2009.
Percentage of sales from retail and wholesale operations for each segment is as follows:
| Yiwu | Wang Da | Sanhe | Joy & Harmony | Total | ||||||||||||||||
| Retail | 66.2 | % | 68.3 | % | 70.1 | % | 70.6 | % | 68.8 | % | ||||||||||
| Wholesale | 33.8 | % | 31.7 | % | 29.9 | % | 29.4 | % | 31.2 | % | ||||||||||
Cost of Sales
Cost of sales for 2010 totaled $140,668, or 89.0% of net sales compared to $187,476, or 85.6% for 2009. The decrease in the cost of sales was a result of the decrease in sales. The cost of sales as a percentage increased during 2010 primarily due to increased costs of electronics products. The increase in purchase rebate paid to supplier, accounted for as an addition to cost of sales, also contributed to the increase in cost of sales.
Top Ten Suppliers of Each of Our Subsidiaries in 2010
| Yiwu | Wang Da | Sanhe | Joy & Harmony | Jinhua | |||||
| 1 | Fengda Technology Company Limited | Shenzhen Tianyin Telecommunication Company Limited | Hangzhou Xietong Trade Company Limited | SONY(China) Company Limited (Shanghai) | Zhejiang Sheng Tong Logistic Company Limited | ||||
| 2 | Ninbo Zhongxun Electronics Company Limited | Hangzhou Weihua Telecommunication Company Limited | Zhejiang Zhuocheng Digital Electronics Company Limited | Shanghai Ganshun Trade Company Limited | Hangzhou Shenzhou Transportation Company Limited | ||||
| 3 | Shanghai Zhongfang Electronics Company Limited | Hangzhou Tianchen Digital Telecommunication Company Limited | Shanghai Haier Industrial and Trade Company | Huaqi Information Digital Technology Company Limited (Shanghai) | Shanghai Sheng Hui Transportation Company Limited | ||||
| 4 | Hangzhou Senruida Trade Company Limited | Hangzhou Liandong Telecommunication Equipment Company Limited | Shenzhen Chuangwei-RGB Electronics Company | Shanghai Caitong Digital Technology Company Limited | Shanghai Hong Wei Transportation Company Limited |
| 18 |
| 5 | Shanghai Hongyi Office Supplies Company Limited | Shanghai Post&Telecom Appliances Company (Hangzhou) | TCL Electronics Company Limited
| Shanghai Bohui Electronics Company Limited | Jiaxingshi Guohong Vehicle Transportation Company Limited | ||||
| 6 | Shanghai Guangdian Equipment Company Limited | Hangzhou Qiuxin Internet Equipment Company Limited | Qingdao Haixin Electronics Limited Hangzhou branch | Shanghai Yiqike Industrial and Trade Company Limited | Guangzhou Shuntong Transportation Company Limited | ||||
| 7 | Yiwu Wantong Telecom Equipment Company Limited | Shenzhen Liansheng Technology Company Limited | Shenzhen Asicer Electronics Company Limited | Shanghai Tande Electronics Technology Company Limited | Shanghai Shenghui Transportation Company Limited | ||||
| 8 | Jiaxing Yage Electronics Company Limited | Hangzhou Jiuxin Telecommunication Appliances Company Limited | Dongguang Lebang Electronics Limited | Shenzhen Dejing Electronics Company Limited | Hefei Yuan Shun Da Transportation Company Limited | ||||
| 9 | Shanghai Huoke Electronics Company Limited | Hangzhou Fuyin Trade Company Limited | Zhejiang Saixin Technology Limited | Chongqing Zhaohua Digital Technology Company Limited | Zhuhai Zhijie Transportation Company Limited | ||||
| 10 | Shanghai Rongduo Business Company Limited | Shenzhen Jinfeng Datong Technology Company Limited | Zhongshan Longdi Electronics Limited | Dongguan Gemei Technology Company Limited | Sanming Yunlin Vehicle Transportation Company Limited |
| 19 |
Gross Profit Margin
Gross profit margin in 2010 decreased to 11.0% compared to 14.4% in 2009. The gross profit margin decrease was mainly attributed to the fact that many small manufacturers of computers, communication and consumer products exited the market and large manufacturers raised the cost of goods due to the global economic slowdown. In addition, the increased competition led the Company to launch more promotional sales to attract customers. These events caused gross margin to decrease. The decrease in gross margin was also due to the increase in sales rebate paid to suppliers.
Because the Company does not include the costs for its distribution network in cost of sales, its gross profit and gross profit as a percentage of net sales (“gross profit margin”) may not be comparable to those of other retailers that may include distribution costs in cost of sales and in gross profit and gross margin.
General and Administrative Expenses
General and administrative expenses for 2010 totaled $42,263 (restated), or 26.7% of net sales, compared to $32,126(restated), or 14.7% of net sales for 2009. General and administration expense increased 31.6% primarily due to a 16.4% increase in labor cost, increase in management fees paid to department stores and goodwill impairment of $9,591 charged in 2010.
Income (Loss) from Operations
Operating loss for 2010 was $24,837, or (16.7)% of net sales compared to $608, or (0.3)% of net sales for 2009. Declined sales and gross margin and increased general and administration expenses led to the decline in income from operations.
Provision for income taxes
Provision for income taxes for 2010 was $52, representing year-over-year decrease of 92.7% compared to $714 for 2009. The decrease in income tax expenses was due to Yiwu, Wang Da and Sanhe and Joy & Harmony having net losses in 2010 and therefore not having income tax expenses. Zhejiang was the only subsidiary having net income but the tax expense was not significant. Although Jinhua had net losses, Jinhua paid a small amount of income taxes based on the simplified tax system.
Net Income (loss)
Net loss was $(24,927) or (16.8)% of net sales for 2010 compared to $1,213 or (0.6) % of net sales for 2009. Net income decreased primarily due to a decrease in sales and gross margin and an increase in general administration expenses.
Foreign currency translation adjustments
The impact of foreign translation from our accounts in RMB to US dollar on China 3C’s operating results was not material. During the translation process, the assets and liabilities of all PRC subsidiaries are translated into US dollars at period-end exchange rates. The revenues and expenses are translated into US dollars at average exchange rates of the periods. Resulting translation adjustments are recorded as a component of accumulated other comprehensive income within stockholders’ equity.
| 2010 | 2009 | |||||||
| RMB/US$ exchange rate at year end | 0.15170 | 0.14626 | ||||||
| Average RMB/US$ exchange rate for the years | 0.14792 | 0.14618 | ||||||
Transaction gains or losses arising from exchange rate fluctuation on transactions denominated in a currency other than the functional currency were included in the consolidated results of operations. As a result of the translation, China 3C recorded a foreign currency gain of $1,526 in 2010 and loss of $92 thousand in 2009, which is a separate line item on the Statements of Operations.
| 20 |
Year Ended December 31, 2009 compared to Year Ended December 31, 2008
The Company reports financial and operating information in the following five segments:
| a) | Yiwu Yong Xin Telecommunication Company, Limited or “Yiwu” |
| b) | Hangzhou Wang Da Electronics Company, Limited or “Wang Da” |
| c) | Hangzhou Sanhe Electronic Technology Limited or “Sanhe” |
| d) | Shanghai Joy & Harmony Electronics Company Limited or “Joy & Harmony” |
| e) | Jinhua Baofa Logistic Limited or “Jinhua” |
| a) | Yiwu Yong Xin Telecommunication Company, Limited or “Yiwu” |
Yiwu focuses on the selling, circulation and modern logistics of fax machines and cord phone products.
All amounts, except percentage of revenues, in thousands of US dollars.
| Year Ended December 31, | Percentage | |||||||||||
| Yiwu | 2009 | 2008 | Change | |||||||||
| Revenue | $ | 44,375 | $ | 63,370 | (30.0 | )% | ||||||
| Gross Profit | $ | 5,129 | $ | 9,978 | (48.6 | )% | ||||||
| Gross Margin | 11.6 | % | 15.8 | % | (4.2 | )% | ||||||
| Operating Income (Loss) | $ | (612 | ) | $ | 7,615 | (108.0 | )% | |||||
For the year ended December 31, 2009, Yiwu generated revenue of $44,375, a decrease of $18,995 or 30.0% compared to $63,370 for the year ended December 31, 2008. Gross profit decreased $4,849 or 48.6% from $9,978 for the year ended 2008 to $5,129 for the year ended 2009. Operating losses was $612 in 2009, a decrease of $8,227 or 108.0% compared to operating income of $7,615 in 2008. Such decrease in revenue was primarily due to the shrinking market in office communication products. The decrease in revenue was also a result of closing 23 stores in stores in 2009.
Gross profit margin decreased from 15.8% in 2008 to 11.6% in 2009, a decrease of 4.2%. Such decrease is primarily due to of the more competitive fax machines and telephone market in China as compared to 2008. In order to maintain market shares, we had to launch more promotions which negatively affected the gross margin. In addition, sales rebate paid to suppliers as a percentage of sales increased in 2009, which led to lower gross margin of Yiwu.
| b) | Hangzhou Wang Da Electronics Company, Limited or “Wang Da” |
Wang Da focuses on the selling, circulation and modern logistics of cell phones, cell phones products, and digital products, including digital cameras, digital camcorders, PDAs, flash disks, and removable hard disks.
| 21 |
All amounts, except percentage of revenues, in thousands of US dollars.
| Year Ended December 31, | Percentage | |||||||||||
| Wang Da | 2009 | 2008 | Change | |||||||||
| Revenue | $ | 58,744 | $ | 102,935 | (42.9 | )% | ||||||
| Gross Profit | $ | 6,600 | $ | 16,313 | (59.5 | )% | ||||||
| Gross Margin | 11.2 | % | 15.9 | % | (4.7 | )% | ||||||
| Operating Income (Loss) | $ | (262 | ) | $ | 11,527 | (102.3 | )% | |||||
For the year ended December 31, 2009, Wang Da generated revenue of $58,744, a decrease of $44,191 or 42.9% compared to $102,935 for the year ended December 31, 2008. Gross profit decreased $9,713 or 59.5% from $16,313 for the year ended 2008 to $6,600 for the year ended 2009. Operating losses was $262 in 2009, a decrease of $8,227 or 102.3% compared to operating income of $11,527 in 2008. The decrease in revenue was primarily due to the high competition from government-owned large telecommunication service providers. Telecommunication service providers started to open their direct operating stores to sell communication products and also launched promotions such as “free phone with service contract” in 2009. In addition, the introduction of 3G phones caused lower demand for the old model mobile phones. Meanwhile, the 3G network is still in the trial period, customers are waiting to upgrade to 3G phones until the 3G network is complete. The decrease in revenue was also attributed to the closing of 42 stores in stores in 2009.
Gross profit margin decreased from 15.9% in 2008 to 11.2% in 2009. The decrease was due to lower unit price of old model mobile phones as a result of the introduction of the 3G phones.
| c) | Hangzhou Sanhe Electronic Technology Limited or “Sanhe” |
Sanhe focuses on the selling, circulation and modern logistics of home electronics, including DVD players, audio systems, speakers, televisions and air conditioners.
All amounts, except percentage of revenues, in thousands of US dollars.
| Year Ended December 31, | Percentage | |||||||||||
| Sanhe | 2009 | 2008 | Change | |||||||||
| Revenue | $ | 53,385 | $ | 70,243 | (24.0 | )% | ||||||
| Gross Profit | $ | 8,627 | $ | 12,444 | (30.7 | )% | ||||||
| Gross Margin | 16.2 | % | 17.7 | % | (1.5 | )% | ||||||
| Operating Income (Loss) | $ | (741 | ) | $ | 7,509 | (109.9 | )% | |||||
For the year ended December 31, 2009, Sanhe generated revenue of $53,385, a decrease of $16,858 or 24.0% compared to $70,243 for the year ended December 31, 2008. Gross profit decreased $3,817 or 30.7% from $12,444 for the year ended 2008 to $8,627 for the year ended 2009. Operating losses was $741 in 2009, a decrease of $8,250 or 109.9% compared to operating income of $7,509 in 2008. The increase in revenue was primarily due to the shrinking market in DVD players and small home electronics as well as the closing of 24 stores in 2009.
Gross profit margin decreased from 17.7% in 2008 to 16.2% in 2009. The decrease in gross profit and operating income was primarily due to the change in sales revenue mix. In 2009, due to the lesser sales of DVD players and other small home electronics, sales volume of TV sets, which has a lower margin, comparatively increased. Therefore, gross margin for Sanhe decreased in 2009.
| d) | Shanghai Joy & Harmony Electronics Company Limited or “Joy & Harmony” |
Joy & Harmony focuses on the selling, circulation and modern logistics of consumer electronics, including MP3 players, MP4 players, iPod, electronic dictionary, radios, and Walkman.
| 22 |
All amounts, except percentage of revenues, in thousands of US dollars.
| Year Ended December 31, | Percentage | |||||||||||
| Joy & Harmony | 2009 | 2008 | Change | |||||||||
| Revenue | $ | 56,660 | $ | 74,096 | (23.5 | )% | ||||||
| Gross Profit | $ | 9,421 | $ | 9,906 | (57.1 | )% | ||||||
| Gross Margin | 16.6 | % | 13.4 | % | 3.2 | % | ||||||
| Operating Income | $ | 1,012 | $ | 7,406 | (86.3 | )% | ||||||
For the year ended December 31, 2009, Joy & Harmony generated revenue of $56,660, a decrease of $17,436 or 23.5% compared to $74,096 for the year ended December 31, 2008. Gross profit decreased $485 or 4.9% from $9,906 for the year ended 2008 to $9,421 for the year ended 2009. Operating income was $1,012 in 2009, a decrease of $6,394 or 86.3% compared to $7,406 in 2008. The decrease in revenue was primarily due to closing of 12 stores in 2009. In addition, manufacturers have been introducing new products at a slower rate and the old products currently on the market have become out-dated. This has caused the unit price of consumer electronics to drop and sales to decline.
Gross profit margin increased from 13.4% in 2008 to 16.6% in 2009.
| e) | Jinhua Baofa Logistic Limited or “Jinhua” |
Jinhua provides transportation service to business and transports freight, including electronics, machinery and equipment, metal products, chemical materials, garments and handicraft goods, in more than 20 cities in Eastern China. Its transportation services cover many of the most developed cities in Eastern China such as Shanghai, Hangzhou and Nanjing.
China 3C acquired Jinhua on July 6, 2009. Therefore, the consolidated statement of income (loss) and comprehensive income (loss) of China 3C for the year ended December 31, 2009 includes Jinhua’s operating results from the date of acquisition to December 31, 2009.
All amounts, except percentages of revenues, are in thousands of US dollars.
| Jinhua | For the period from July 1 to December 31, 2009 | |||
| Revenue | $ | 5,573 | ||
| Gross Profit | $ | 1,713 | ||
| Gross Margin | 30.7 | % | ||
| Operating Income | $ | 1,098 | ||
Net sales
Net sales for 2009 totaled $218,994, representing a year-over-year decrease of 29.5% compared to $310,645 for 2008. The decrease was attributable to the closing of 101 stores in stores in 2009 as well as the negative effect of global economic slowdown.
Percentage of sales
In 2009, the Company earned 68.9% of its sales from its retail operations and 31.1% from its wholesale operations compared to 68.7% from retail operations and 31.3% from wholesale in 2008.
Percentage of sales from retail operations and wholesale operations for each segment is as follows:
| Yiwu | Wang Da | Sanhe | Joy & Harmony | |||||||||||||
| Retail | 68.7 | % | 69.9 | % | 67.6 | % | 69.7 | % | ||||||||
| Wholesale | 31.3 | % | 30.1 | % | 32.4 | % | 30.3 | % | ||||||||
| 23 |
Cost of Sales
Cost of sales for 2009 totaled $187,476, or 85.6% of net sales compared to $262,003, or 84.3% for 2008. The decrease in the cost of sales was a direct result of the corresponding decrease in sales. The cost of sales as a percentage increased during 2009 primarily due to increased costs of electronics products as well as increase in sales rebate paid to suppliers.
Top Ten Suppliers of Each of Our Subsidiaries in 2009
| Yiwu | Wang Da | Sanhe | Joy & Harmony | Jinhua | |||||
| 1 | Fengda Technology Company Limited | Shanghai Post & Telecom Appliances Co - Hangzhou | Zhejiang Zhuocheng Digital Electronics Company Limited | Shanghai Ganshun Trade Company Limited | Zhejiang Sheng Tong Logistic Company Limited | ||||
| 2 | Hangzhou Shenruida Trade Company Limited | Shenzhen Tianyin Telecommunication Company Limited | Hangzhou Xietong Trade Co., Limited | Huaqi Information Digital Technology Company Limited (aigo) – Shanghai | Shanghai Hong Wei Transportation Company Limited | ||||
| 3 | Shanghai Zhongfang Electronics Company Limited | Hangzhou Tianchen Digital Telecommunication Company Limited | Shanghai Haier Industrial and Trade Company | SONY- Shanghai Company Limited | Hangzhou Shenzhou Transportation Company Limited | ||||
| 4 | Wenzhou Jingwei Company | Hangzhou Qiuxin Internet Equipment Company Limited | Zhejiang Saixin Technology Limited | Shanghai Jingming Technology Company Limited | Jiaxingshi Guohong Vehicle Transportation Company Limited | ||||
| 5 | Ninbo Zhongxun Electronics Company Limited | Hangzhou Weihua Telecommunication Company Limited | Shenzhen Chuangwei-RGB Electronics Company | Shanghai China-tex Electronic System Company Limited | Shanghai Sheng Hui Transportation Company Limited | ||||
| 6 | Shanghai Hongyi Office Supplies Company Limited | Hangzhou Chaoyue Telecommunication Company Limited | TCL Electronics Company Limited
| Shanghai Caitong Digital Technology Company Limited | Guangzhou Shuntong Transportation Company Limited | ||||
| 7 | Shanghai Guangdian Equipment Company Limited | Shenzhen Liansheng Technology Company Limited | Qingdao Haixin Electronics Limited Hangzhou branch | Beijing Broadcom Information Technology Company Limited | Shanghai Shenghui Transportation Company Limited |
| 24 |
| 8 | Yiwu Wantong Telecom Equipment Company Limited | Hangzhou Huayu Telecommunication Appliances Company Limited | Dongguang Lebang Electronics Limited | Chongqing Zhaohua Digital Technology Company Limited | Hefei Yuan Shun Da Transportation Company Limited | ||||
| 9 | Shanghai Rongduo Business Company Limited | Shenzhen Jinfeng Datong Technology Company Limited | Zhongshan Longdi Electronics Limited | Shanghai Jinling Network Equipment Company Limited | Zhuhai Zhijie Transportation Company Limited | ||||
| 10 | Shanghai Huoke Electronics Company Limited | Shenzhen Jiepulin Company Limited | Shenzhen Aosike Electronics Company Limited | Shenzhen Dejing Electronics Company Limited | Sanming Yunlin Vehicle Transportation Company Limited |
Gross Profit Margin
Gross profit margin in 2009 decreased to 14.4% compared to 15.7% in 2008. The gross profit margin decrease was mainly attributed to the fact that many small manufacturers of computers, communication and consumer products exited the market and current manufacturers raised the cost of goods due to the global economic slowdown. The decrease in gross margin was also due to the increase in sales rebate paid to suppliers.
Because the Company does not include the costs related to its distribution network in cost of sales, its gross profit and gross profit as a percentage of net sales (“gross profit margin”) may not be comparable to those of other retailers that may include all costs related to their distribution network in cost of sales and in the calculation of gross profit and gross margin.
General and Administrative Expenses
General and administrative (“G&A”) expenses for 2009 totaled $32,126, or 14.7% of net sales, compared to $14,132, or 4.6% of net sales for 2008. G&A expenses as a percentage of net sales increased 10.1% due to salary increase of $4,600 in 2009 compared to 2008, additional $1,116 G&A expenses due to acquisition of Jinhua, increase in management fee and additional expenses in relation to the new direct stores and franchise stores.
Income (Loss) from Operations
Operating loss for 2009 was $608, or (0.3)% of net sales compared to Operating income of $34,509, or 11.1% of net sales for 2008, a decrease of 101.8%. Declined sales and gross margin and increased G&A expenses led to the decline in income from operations.
| 25 |
Provision for income taxes
Provision for income taxes for 2009 was $714, representing year-over-year decrease of 91.7% compared to $8,611 for 2008. The decrease in income tax expenses was due to Yiwu, Wang Da and Sanhe having net losses in 2009 and therefore not having income tax expenses. In addition, Joy & Harmony’s income from operations also declined in 2009 compared to 2008, therefore, had a lesser income tax expense. Although we added one subsidiary - Jinhua in 2009, Jinhua’s income tax expense was not significant.
Net Income (loss)
Net loss was $1,213 or (0.6) % of net sales for 2009 compared to $26,834 net income or 8.6% of net sales for 2008. Net income decreased primarily due to sales decline and increase in general administration expenses.
Retail locations
The following table reflects a roll forward during the fiscal years ended December 31, 2008, 2009 and 2010 of our retail locations during each year (i.e. number of stores opened, number of stores closed and number of stores open at the end of the period). “Store in store” refers to the sales counter where the Company’s products are displayed for sale within large-scale supermarket stores, department stores and other operation sites for the Company. At present, we have “store in stores” in four main areas, Shanghai, Zhejiang, Jiangsu and Anhui. The Company’s retail locations are all “store in store” locations in 2008, 2009 and 2010 with the exception of 3 director stores and 2 franchise stores.
| Wang Da | Yiwu | Sanhe | Joy & Harmony | Total | ||||||||||||||||
| Locations at Jan. 1, 2008 | 237 | 274 | 211 | 186 | 908 | |||||||||||||||
| Opened during year 2008 | 37 | 34 | 24 | 43 | 138 | |||||||||||||||
| Closed during year 2008 | (18 | ) | (13 | ) | (1 | ) | - | (32 | ) | |||||||||||
| Locations at Dec. 31, 2008 | 256 | 295 | 234 | 229 | 1014 | |||||||||||||||
| Opened during year 2009 | - | 1 | - | 1 | 2 | |||||||||||||||
| Closed during year 2009 | (23 | ) | (42 | ) | (24 | ) | (12 | ) | (101 | ) | ||||||||||
| Locations at Dec. 31, 2009 | 233 | 254 | 210 | 218 | 915 | |||||||||||||||
| Opened during year 2010 | 11 | 2 | - | - | 13 | |||||||||||||||
| Closed during year 2010 | (73 | ) | (1 | ) | (11 | ) | (22 | ) | (107 | ) | ||||||||||
| Locations at Dec. 31, 2010 | 171 | 255 | 199 | 196 | 821 | |||||||||||||||
The following table reflects the square footage of each store space during the fiscal years ended December 31, 2008, 2009 and 2010.
| (In square feet) | Wang Da | Yiwu | Sanhe | Joy & Harmony | Total | |||||||||||||||
| Areas at Jan. 1, 2008 | 26,928 | 40,708 | 29,295 | 21,001 | 117,932 | |||||||||||||||
| Opened during year 2008 | 5,698 | 5,270 | 3,888 | 6,020 | 20,876 | |||||||||||||||
| Closed during year 2008 | (1,890 | ) | (1,724 | ) | (112 | ) | - | (3,726 | ) | |||||||||||
| Areas at Dec. 31, 2008 | 30,736 | 44,254 | 33,071 | 27,021 | 135,082 | |||||||||||||||
| Opened during year 2009 | - | 210 | - | 142 | 352 | |||||||||||||||
| Closed during year 2009 | (3,105 | ) | (4,704 | ) | (2,832 | ) | (1,368 | ) | (12,009 | ) | ||||||||||
| Areas at Dec. 31, 2009 | 27,631 | 39,760 | 30,239 | 25,795 | 123,425 | |||||||||||||||
| Opened during year 2010 | 860 | 2,258 | - | - | 3,118 | |||||||||||||||
| Closed during year 2010 | (93 | ) | (9,555 | ) | (1,131 | ) | (2,272 | ) | (13,051 | ) | ||||||||||
| Areas at Dec. 31, 2010 | 28,398 | 32,463 | 29,108 | 23,523 | 113,492 | |||||||||||||||
| 26 |
The following table reflects net sales per square foot for the fiscal years ended December 31, 2008, 2009 and 2010.
| (In US dollars) | Wang Da | Yiwu | Sanhe | Joy & Harmony | Average | |||||||||||||||
| 2008 | 1,910 | 812 | 1,301 | 1,802 | 1,467 | |||||||||||||||
| 2009 | 2,079 | 1,058 | 1,709 | 1,996 | 1,710 | |||||||||||||||
| 2010 | 1,489 | 577 | 1,410 | 1,485 | 905 | |||||||||||||||
The following table reflects the amount of comparable or same store sales for each period (i.e. the change in sales from stores that were open for each of the fiscal years presented). A “comparable store” is defined as the same “store in store,” for which sales of that “store in store” is compared in the same month or same quarter of different years, such as the comparison of the sales occurring during March 2008 and March 2009 in the same “store in store.”
| (In US dollars) | Wang Da | Yiwu | Sanhe | Joy & Harmony | Average | |||||||||||||||
| 2008 | 21,700 | 11,900 | 17,300 | 20,400 | 18,900 | |||||||||||||||
| 2009 | 14,878 | 9,464 | 13,880 | 15,221 | 13,122 | |||||||||||||||
| 2010 | 10,219 | 4,510 | 7,563 | 9,789 | 7,723 | |||||||||||||||
In assessing whether stores are “comparable”, it is based on whether:
(1) stores are in the same address;
(2) relatively same business area (e.g. if the business area of a store has changed in no more than 30%, it is regarded as having same business area; if the change in business area is more than 30%, the change in business area will be regarded as too significant as to be comparable;
(3) relatively same business layout (e.g. if the layout of sales counter in a store remains unchanged over time, then that store would be regarded as a comparable store; if there is significant change in layout of a sales counter in a store, that store will not be regarded as a comparable store);
(4) stores with same product mix would be regarded as comparable; if there is significant change in product mix in a store, that store will not be regarded as a comparable store;
(5) with respect to net sales per square foot each year and how we treat changes in square footage, this depends on the materiality of the impact on sales per square foot as a result of an increase or decrease in square footage. By way of example only, if a store with an area of 130 square feet had sales of $14,000 per month in 2006, which results in approximately $108 in sales per square foot. In 2007, if the same store increased the area of operation to 140 square feet and had sales of $16,000 per month that would result in approximately $114 in sales per square foot. We would deem the $6 increase in sales per square foot to be immaterial. Accordingly, in this case, we will use the area of 130 square feet to compare same store sales, and the additional 10 square feet will be ignored in the calculation of same store sales.
| 27 |
We consider changes in store square footage of more than 30% to be material. Stores that undergo such changes will not be accounted for as “comparable stores” because the change is too significant.
(6) with respect to net sales per square foot each year and how we treat relocated stores, if a “store in store” is relocated to a different retail location, which we would refer to as a different operating environment, during the period, then that “store in store” will not be used in the same store comparison. However, if the “store in store” is relocated to another location within the same retail location (or same operating environment) then the “store in store” sales will be used in the calculation of the same store comparison; and
(7) with respect to net sales per square foot each year and how we treat closed stores, we treat a closed “store in store” the same way we treat a “store in store” relocated to different retail location. A closed “store in store” is not used in the same store comparison.
Opened and closed “stores in stores” are primarily recognized based on the duration of the agreements with the shopping centers, as well as the sale and profits of a “store in store.” Prior to opening a new “store in store” we are usually approached by a large-scale department store or supermarket that offers us the opportunity to open a “store in store.” Our decision is based on our study of the population traffic flow, the department store and supermarkets themselves, and the level of expected profitability of a potential “store in store.” Following our inspection, we sign contracts with the department store and supermarkets, which specifically address the terms and conditions of opening, closing and relocating the “stores in stores.”
QUARTERLY RESULTS OF OPERATIONS
Our businesses experience fluctuations in quarterly performance. Traditionally, the first quarter from January to March has a higher number of sales reflected by our electronics business due to the New Year holidays in China occurring during that period. Nevertheless, at times, China can experience particularly inclement weather in January and February which can serious disrupt the Company’s supply chain management systems. As our business model is to operate only on several days of inventory, the effects of such weather disruptions may be severe in certain years.
The following table sets forth, for the periods presented, our unaudited quarterly results of operations for the eight quarters ended December 31, 2010. The data has been derived from our consolidated financial statements and, in our management’s opinion, they have been prepared on substantially the same basis as the audited consolidated financial statements and include all adjustments, consisting only of normal recurring adjustments, necessary for a fair statement of the financial results for the periods presented. This information should be read in conjunction with the annual consolidated financial statements included elsewhere in this Form 10-K. The operating results in any quarter are not necessarily indicative of the results that may be expected for any future period.
(amounts in thousands of US dollars)
| Three Months Ended | ||||||||||||||||||||||||||||||||
| 12/31/2010 | 9/30/2010 | 6/30/2010 | 3/31/2010 | 12/31/2009 | 9/30/2009 | 6/30/2009 | 3/31/2009 | |||||||||||||||||||||||||
| Sales, net (restated) | $ | 39,928 | $ | 37,380 | $ | 38,727 | 42,058 | $ | 40,925 | $ | 45,286 | $ | 53,006 | $ | 79,777 | |||||||||||||||||
| Cost of sales | 36,004 | 33,725 | 33,506 | 37,433 | 35,075 | 39,942 | 45,106 | 67,353 | ||||||||||||||||||||||||
| Gross profit (loss) (restated) | 3,924 | 3,655 | 5,221 | 4,625 | 5,850 | 5,344 | 7,900 | 12,424 | ||||||||||||||||||||||||
| General and administrative expenses (restated) | 22,855 | 6,146 | 6,787 | 6,474 | 10,694 | 6,952 | 6,629 | 7,851 | ||||||||||||||||||||||||
| Income (loss) from operations | (18,931 | ) | (2,491 | ) | (1,566 | ) | (1,849 | ) | (4,844 | ) | (1,608 | ) | 1,271 | 4,573 | ||||||||||||||||||
| Other Income (Expense) | ||||||||||||||||||||||||||||||||
| Interest income | 31 | 24 | 22 | 25 | 26 | 29 | 25 | 29 | ||||||||||||||||||||||||
| Other income (expense) | (28 | ) | (75 | ) | (41 | ) | 4 | (20 | ) | (27 | ) | 10 | 37 | |||||||||||||||||||
| Total Other Income (Expense) | 3 | (51 | ) | (19 | ) | 29 | 6 | 2 | 35 | 66 | ||||||||||||||||||||||
| Income (loss) before income taxes | (18,928 | ) | (2,542 | ) | (1,585 | ) | (1,820 | ) | (4,838 | ) | (1,606 | ) | 1,306 | 4,639 | ||||||||||||||||||
| Provision for income taxes | (202 | ) | 64 | 83 | 107 | (1,021 | ) | 144 | 392 | 1,199 | ||||||||||||||||||||||
| Net income (loss) | $ | (18,726 | ) | $ | (2,606 | ) | $ | (1,668 | ) | (1,927 | ) | $ | (3,817 | ) | $ | (1,750 | ) | $ | 914 | $ | 3,440 | |||||||||||
| Net income (loss) per share: | ||||||||||||||||||||||||||||||||
| Basic & diluted | $ | (0.34 | ) | $ | (0.05 | ) | $ | (0.03 | ) | (0.04 | ) | $ | (0.07 | ) | $ | (0.03 | ) | $ | 0.02 | $ | 0.07 | |||||||||||
| Weighted average number of shares outstanding: | ||||||||||||||||||||||||||||||||
| Basic | 54,831 | 54,831 | 54,831 | 54,831 | 54,831 | 53,931 | 53,931 | 52,834 | ||||||||||||||||||||||||
| Diluted | 54,831 | 54,831 | 54,831 | 54,831 | 54,831 | 53,931 | 53,931 | 52,834 | ||||||||||||||||||||||||
| 28 |
Liquidity and Capital Resources (amounts in thousands of US dollars)
Cash has historically been generated from operations. Operations and liquidity needs are funded primarily through cash flows from operations and short-term borrowings.
Cash and equivalents were $26,249 at December 31, 2010 and current assets totaled $48,551. The Company’s current liabilities were $9,411 at December 31, 2010. Working capital at December 31, 2010 was $39,140. During 2010, net cash used in operating activities was $4,698.
Cash and cash equivalents were $29,908 at December 31, 2009 and current assets totaled $58,725 at December 31, 2009. The Company’s total current liabilities were $7,776 at December 31, 2009. Working capital at December 31, 2009 was $50,949. During 2009, net cash provided by operating activities was $7,112.
The Company does not have any debt as of December 31, 2010.
The Wholly Foreign Owned Enterprise Law (1986), as amended and The Wholly Foreign Owned Enterprise Law Implementing Rules (1990), as amended, contain the principal regulations governing dividend distributions by wholly foreign owned enterprises. Under these regulations, wholly foreign owned enterprises, such as Zhejiang, Yiwu, Wang Da, Sanhe and Joy & Harmony may pay dividends only out of their accumulated profits, if any, determined in accordance with PRC accounting standards and regulations. Additionally, Zhejiang, Yiwu, Wang Da, Sanhe and Joy & Harmony are required to set aside a certain amount of any accumulated profits each year (a minimum of 10%, and up to an aggregate amount equal to half of its registered capital), to fund certain reserve funds. These reserves are not distributable as cash dividends except in the event of liquidation and cannot be used for working capital purposes. The PRC government also imposes controls on the conversion of RMB into foreign currencies and the remittance of currencies out of the PRC. The Company’s two operating subsidiaries in China paid $525,460 in dividends during 2005, however, we do not intend to pay dividends on our common stock in the foreseeable future. If we ever determine to pay a dividend, we may experience difficulties in completing the administrative procedures necessary to obtain and remit foreign currency for the payment of such dividends from the profits of Zhejiang, Yiwu, Wang Da, Sanhe and Joy & Harmony and Jinhua.
In summary, our cash flows were (in thousands):
| Year Ended December 31, | ||||||||||||
| 2010 | 2009 | 2008 | ||||||||||
| Net cash provided (used) by operating activities | $ | (4,698 | ) | $ | 7,112 | $ | 12,690 | |||||
| Net cash used in investing activities | (22 | ) | (8,590 | ) | (7,327 | ) | ||||||
| Effect of exchange rate change on cash and equivalents | 1,061 | (772 | ) | 1,842 | ||||||||
| Net increase in cash and equivalents | (3,659 | ) | (2,250 | ) | 7,205 | |||||||
| Cash and equivalents at beginning of year | 29,908 | 32,158 | 24,953 | |||||||||
| Cash and equivalents at end of year | $ | 26,249 | $ | 29,908 | $ | 32,158 | ||||||
| 29 |
Operating Activities
Net cash used in operating activities was $4,698 in 2010 compared to net cash generated from operating activities of $7,112 in 2009. This decrease was mainly attributable to (i) an increase in net losses of $23,714 from $(1,213) in 2009 to $(24,927) in 2010, (ii) increase in inventories of $261, offset by the decrease in accounts receivable of $7,688 and increase in accounts payable of $1,545 in 2010.
Net cash generated from operating activities decreased to $7,112 in 2009 from $12,690 in 2008. This decrease was mainly attributable to the $1,213 net losses incurred in 2009 compared to $26,834 net income in 2008.
| 2010 | 2009 | 2008 | ||||||||||
| Net cash (used in) provided by operating activities | $ | (4,698 | ) | $ | 7,112 | $ | 12,690 | |||||
While net sales decreased 28.8% from 2009, accounts receivable decreased 39.5%. The Company still maintains a healthy accounts receivable turnover. The collection of debt is based on the terms of legal binding documents. The Company has not changed its policy on reserving for bad debt and has not found any abnormal increases in bad debt.
Investing activities
| 2010 | 2009 | 2008 | ||||||||||
| Net cash used in investment activities | $ | (22 | ) | $ | (8,590 | ) | $ | (7,327 | ) | |||
Net cash used in investing activities in 2010 was nominal. Net cash used in investing activities was $8,590 in 2009 and $7,327 in 2008 as a result of the acquisition of Jinhua. On December 19, 2008, Zhejiang and Yiwu entered into an agreement to acquire Jinhua. Pursuant to the acquisition agreement, Zhejiang and Yiwu were required to pay RMB 50,000 thousand within 10 business days after the execution of the agreement to Jinhua’s shareholders. Therefore, China 3C made a purchase deposit of $7,319 to the shareholders of Jinhua in 2008. In July 2009, China 3C completed the acquisition of Jinhua and therefore paid $7,784 to Jinhua. In 2009, China 3C also made $806 investment in fixed assets to open new direct stores.
Financing Activities
There was no cash used in financing activities in 2010, 2009 and 2008.
| Financing activities | 2010 | 2009 | 2008 | |||||||||
| Net cash (used) in financing activities | $ | - | $ | - | $ | - |
Net change in cash and equivalents
| 2010 | 2009 | 2008 | ||||||||||
| Net change in cash and equivalents | $ | (3,659 | ) | $ | (2,250 | ) | $ | 7,205 | ||||
Cash and equivalents
| 2010 | 2009 | 2008 | ||||||||||
| Cash and equivalents | $ | 26,249 | $ | 29,908 | $ | 32,158 | ||||||
| 30 |
Cash and equivalents as of December 31, 2010 and 2009 were solely bank accounts in US and China. Specifically, cash and equivalents for each subsidiary as of December 31, 2010 and 2009 included:
(all amounts are denominated in thousands)
| Name of Entities | Region | Currency | 2010 | 2009 | |||||
| China 3C Group | US entity | USD | 4 | - | |||||
| Capital | BVI entity | USD | - | - | |||||
| Zhejiang | Chinese entity | RMB | 1,781 | 5,180 | |||||
| Yiwu | Chinese entity | RMB | 40,568 | 28,437 | |||||
| Sanhe | Chinese entity | RMB | 38,066 | 42,867 | |||||
| Wangda | Chinese entity | RMB | 25,406 | 43,956 | |||||
| Joy & Harmony | Chinese entity | RMB | 43,369 | 60,709 | |||||
| Jinhua | Chinese entity | RMB | 23,809 | 23,335 |
Cash equivalents held in the PRC subsidiaries are not freely transferrable outside the country. The amounts not freely transferable as of December 31, 2010 and 2009 were RMB 172,999 (or $26,244) and RMB 204,484 (or $29,908).
Capital Expenditures
Capital expenditures for purchase of fixed assets during 2010, 2009 and 2008 were $22, $806 and $11, respectively. The higher level of capital expenditures in 2009 was due to the new business plan of opening new direct stores and franchise stores. Direct stores and franchise stores have higher capital requirements than “stores in stores”.
Working Capital Requirements
Historically operations and short term financing have been sufficient to meet our cash needs. We believe we will be able to generate revenues from sales and raise capital through private placement offerings of our equity securities to provide the necessary cash flow to meet anticipated working capital requirements. However, our actual working capital needs for the long and short term will depend upon numerous factors, including operating results, competition, and the availability of credit facilities, none of which can be predicted with certainty. Future expansion will be limited by the availability of financing products and raising capital.
Off-Balance Sheet Arrangements
We have never entered into any off-balance sheet financing arrangements and have never established any special purpose entities. We have not guaranteed any debt or commitments of other entities or entered into any options on non-financial assets.
Critical Accounting Policies
Our discussion and analysis of our financial condition and results of operations is based upon our consolidated financial statements, which have been prepared in accordance with accounting principles generally accepted in the United States. The preparation of these consolidated financial statements requires us to make estimates, judgments and assumptions that affect the reported amounts of assets, liabilities, revenues and expenses, and the related disclosure of contingent assets and liabilities. We base our estimates on historical experience and on various other assumptions that we believe are reasonable under the circumstances, the results of which form the basis for making judgments about the carrying values of assets and liabilities that are not readily apparent from other sources. Actual results may differ from these estimates.
| 31 |
An accounting policy is considered to be critical if it requires an accounting estimate to be made based on assumptions about matters that are highly uncertain at the time the estimates are made, and if different estimates that reasonably could have been used, or changes in the accounting estimates that are reasonably likely to occur, could materially impact the consolidated financial statements. We believe the following critical accounting policies reflect the more significant estimates and assumptions used in the preparation of the consolidated financial statements.
Revenue Recognition
Our revenues are generated from sales of electronics products. All of our revenue transactions contain standard business terms and conditions. We determine the appropriate accounting for these transactions after considering (1) whether a contract exists; (2) when to recognize revenue on the deliverables; (3) whether all elements of the contract have been fulfilled and delivered; and (4) whether collection is reasonably assured, which inherently requires us to evaluate the creditworthiness of our customers. Changes in judgments on these assumptions and estimates could materially impact the timing or amount of revenue recognition.
Please refer to Note 2 in the footnotes to the financial statements for detailed description of our revenue recognition policy.
After Sales Service
The after-sales services that we provide to our customers are primarily repair and maintenance. If a customer buys a product from us and needs repairs, we can usually arrange to have the manufacturer repair the product. In certain cases, clerks in our stores are able to make the repairs directly.
Tabular Disclosure of Contractual Obligations
The following table sets forth our contractual obligations as of December 31, 2010.
(amounts in thousands of US dollars):
| Payment Due by Period | ||||||||||||||||
| Less than 1 | ||||||||||||||||
| Contractual Obligations | Total | year | 1-3 years | 3-5 years | ||||||||||||
| Operating lease obligations | $ | 257 | $ | 176 | $ | 65 | $ | 16 | ||||||||
| Advertising obligations | 102 | 102 | - | - | ||||||||||||
| Total contractual obligations | $ | 359 | $ | 278 | $ | 65 | $ | 16 | ||||||||
ITEM 8. FINANCIAL STATEMENTS AND SUPPLEMENTARY DATA
The financial statements of the Company are included following the signature page to this Form 10-K/A.
ITEM 9A. CONTROLS AND PROCEDURES
Evaluation of Disclosure Controls and Procedures
Under the supervision and with the participation of our management, including our principal executive officer and principal financial officer, we conducted an evaluation of our disclosure controls and procedures as of December 31, 2010, as such term is defined in Rules 13a-15(e) and 15d-15(e) under the Exchange Act. Based on this evaluation, our principal executive officer and principal financial officer have concluded that as of December 31, 2010 , the Company’s disclosure controls and procedures were not effective due to the material weakness in our internal controls identified below.
| 32 |
Disclosure controls and procedures are designed to provide that information required to be disclosed by us in reports that we file or submit under the Exchange Act is accumulated, recorded, processed, summarized, communicated to our management, including our principal executive officer and principal financial officer and reported within the time periods specified in Securities and Exchange Commission rules and forms.
Management’s Report on Internal Control over Financial Reporting
Our management is responsible for establishing and maintaining adequate internal control over financial reporting, as such term is defined in Exchange Act Rules 13a-15(f) and 15d-15(f). Internal control over financial reporting refers to the process designed by, or under the supervision of, our principal executive and principal financial officers, and effected by the Board of Directors, management and other personnel, to provide reasonable assurance regarding the reliability of financial reporting and the preparation of financial statements for external purposes in accordance with generally accepted accounting principles and includes those policies and procedures that:
1. Pertain to the maintenance of records that in reasonable detail accurately and fairly reflect the transactions and dispositions of our assets;
2. Provide reasonable assurance that transactions are recorded as necessary to permit preparation of financial statements in accordance with generally accepted accounting principles, and that our receipts and expenditures are being made only in accordance with authorization of our management and directors; and
3. Provide reasonable assurance regarding prevention or timely detection of unauthorized acquisitions, use or disposition of our assets that could have a material effect on the financial statements.
Under the supervision and with the participation of our management, including our principal executive officer and principal financial officer, we conducted an evaluation of the effectiveness of our internal control over financial reporting based on the framework in Internal Control - Integrated Framework issued by the Committee of Sponsoring Organizations of the Treadway Commission. Based on our evaluation, and due to the material weakness described below, management concluded that our internal control over financial reporting was not effective as of December 31, 2010.
Our management identified the following material weakness: the ability of the Company to record transactions and provide disclosures in accordance with US GAAP. The current staff in our accounting department are inexperienced in US GAAP. They need substantial training to meet the demands of a US public company. The accounting skills and understanding necessary to fulfill the requirements of US GAAP-based reporting, including the preparation of financial statements and consolidation, are inadequate.
All internal control systems, no matter how well designed, have inherent limitations. Therefore, even those systems determined to be effective can provide only reasonable assurance with respect to financial statement preparation and presentation. Because of its inherent limitations, internal control over financial reporting may not prevent or detect misstatements. Projections of any evaluation of effectiveness to future periods are subject to the risk that controls may become inadequate because of changes in conditions or that the degree of compliance with the policies or procedures may deteriorate.
Remediation Initiative
We intend to provide additional training in US GAAP and disclosure requirements under US securities law to our staff, in particular, to our key accounting personnel.
| 33 |
Attestation Report of the Independent Registered Public Accounting Firm
This Annual Report on Form 10-K/A does not include an attestation report of our registered public accounting firm, Goldman Kurland and Mohidin, LLP, regarding internal control over financial reporting because we are a non-accelerated filer. Our management’s report was not subject to attestation by our registered public accounting firm pursuant to the rules of the Securities and Exchange Commission that permit us to provide only our management’s report in this Annual Report.
Changes in Internal Control over Financial Reporting
Other than the changes relating to the material weakness described above, there were no changes in our internal control over financial reporting that occurred during the fourth fiscal quarter of the fiscal year covered by this Annual Report on Form 10-K/A that have materially affected, or are reasonably likely to materially affect, our internal control over financial reporting.
PART IV
ITEM 15. EXHIBITS, FINANCIAL STATEMENT SCHEDULES
(a) The following are filed with this Annual Report:
(1) The financial statements listed on the Financial Statements Table of Contents.
(2) Not applicable.
(3) The exhibits referred to below, which include the following managerial contracts or compensatory plans or arrangements:
• China 3C Group 2011 Restricted Stock Plan
(b) The exhibits listed on the Exhibit Index are filed as part of this Annual Report.
(c) Not applicable.
EXHIBIT INDEX
Exhibit No | Document Description | |
| 3.1 | Amended and Restated Articles of Incorporation of the Registrant (11) | |
| 3.2 | By-laws of the Registrant (1 ) | |
| 4.1 | China 3C Group Amended 2005 Equity Incentive Plan. (2 ) | |
| 4.2 | China 3C Group 2011 Restricted Stock Plan | |
| 10.1 | Stock Purchase Agreement, dated as of October 17, 2005, by and among Sun Oil & Gas, Inc., EH&P Investments, John D. Swain, Fred Holcapek, PH Holding Group, Ma Cheng Ji, Zhou Wei, Zeng Xiu Lan, Gu Xiao Dong, Jacksonville Management Limited, Colin Wilson, Alliance Capital Management, Inc., Hanzhong Fang and China US Bridge Capital, Limited (3) | |
| 10.2 | Consulting Services Agreement dated as of November 1, 2005 between Capital Development Limited and Zhejiang Yong Xing Digital Technology Company Limited (4 ) | |
| 10.3 | Operating Agreement dated as of November 1, 2005 between Capital Development Limited and Zhejiang Yong Xing Digital Technology Company Limited (4 ) | |
| 10.4 | Proxy and Voting Agreement dated as of November 1, 2005 between Capital Development Limited and Zhejiang Yong Xing Digital Technology Company Limited (4 ) | |
| 10.5 | Option Agreement dated as of November 1, 2005 between Capital Development Limited and Zhejiang Yong Xing Digital Technology Company Limited (4 ) |
| 34 |
| 10.6 | Equity Pledge Agreement dated as of November 1, 2005 between Capital Development Limited and Zhejiang Yong Xing Digital Technology Company Limited (4 ) | |
| 10.7 | Subscription Agreement, dated as of December 20, 2005, between the Registrant and Huiqi Xu. (5 ) | |
| 10.8 | Consulting Agreement, dated as of December 20, 2005, among the Registrant, Wen-An Chen and Huoqing Yang. (5 ) | |
| 10.9 | Guarantee Contract between the Registrant and Shenzhen Shiji Ruicheng Guaranty and Investment Company Limited, dated as of December 21, 2005. (6 ) | |
| 10.10 | Agreement and Plan of Merger, dated as of December 21, 2005, among the Registrant, YX Acquisition Corporation, Capital Future Development Limited, Zhenggang Wang, Yimin Zhang, Weiyi Lv, Xiaochun Wang, Zhongsheng Bao, Simple (Hongkong) Investment & Management Company Limited, First Capital Limited, Shenzhen Dingyi Investment & Consulting Limited and China US Bridge Capital Limited. (6 ) | |
| 10.11 | Form of Promissory Note dated December 21, 2005. (6 ) | |
| 10.12 | Share Exchange Agreement, dated as of November 28, 2006, among China 3C Group, Capital Future Development Limited (“CFDL”), Shanghai Joy & Harmony Electronics Company Limited, and the shareholders of CFDL. (7 ) | |
| 10.13 | Form of Securities Purchase Agreement, dated July 13, 2007, by and among the Registrant and certain subscribers (8 ) | |
| 10.14 | Letter of Intent for Strategic Partnership, dated November 22, 2007, between the Registrant’s subsidiary Zhejiang Yongxin Technology Limited and Hangzhou Xituo Network Technology Company (9 ) | |
| 10.15 | Consignment Agreement, dated January 2, 2008, between the Registrant’s subsidiary Hangzhou Shan He Electric Company Limited and Hangzhou Lotour Digital Products Business Company Limited (10 ) | |
| 16 | Consignment Agreement, dated January 3, 2008, between the Registrant’s subsidiary Hangzhou Wang Da Electric Company Limited and Hangzhou Lotour Digital Products Business Company Limited (10 ) | |
| 10.17 | Acquisition Agreement dated December 19, 2008 by and among Zhejiang Yong Xing Digital Technology Company Limited, Yiwu Yong Xin Communication Limited Jinhua Baofa Logistic Limited and the shareholders of Jinhua Baofa Logistic Limited (12) | |
| 10.18 | Amendment to Acquisition Agreement dated April 4, 2009 by and among Zhejiang Yong Xing Digital Technology Company Limited, Yiwu Yong Xin Communication Limited and the shareholders of Jinhua Baofa Logistic Limited (13) | |
| 10.19 | Compensation Agreement, dated November 27, 2009, between China 3C Group and Joseph Levinson (14) | |
| 10.20 | Board of Directors Agreement, dated December 8, 2006, among China 3C Group and Kenneth T. Berents (15) | |
| 10.21 | China 3C Group 2008 Omnibus Securities and Incentive Plan (16) | |
| 10.22 | Stock Option Agreement Director Non-Qualified Stock Option, dated December 1, 2008 and effective as of January 15, 2009, between China 3C Group and Kenneth Berents (16) | |
| 10.23 | Stock Option Agreement Director Non-Qualified Stock Option, dated December 1, 2008 and effective as of January 15, 2009, between China 3C Group and Kenneth Berents (16) | |
| 10.24 | Stock Option Agreement Director Non-Qualified Stock Option, dated December 1, 2008 and effective as of January 15, 2009, between China 3C Group and Kenneth Berents (16) |
| 35 |
| 10.25 | Stock Option Agreement with Todd L. Mavis, dated April 21, 2009, between China 3C Group and Todd L. Mavis (16) | |
| 10.26 | Agreement dated May 3, 2007 between China 3C Group and Joseph Levinson (16) | |
| 10.27 | Letter Agreement dated June 16, 2009 between China 3C Group and Jian Zhang (17) | |
| 14.1 | Code of Business Conduct and Ethics (11) | |
| 21.1 | List of Subsidiaries (18) | |
| 23.1 | Consent of Goldman Parks Kurland Mohidin LLP, an independent registered public accounting firm, filed herewith. | |
| 31.1 | Certification of Principal Executive Officer pursuant to Rule 13A-14(A)/15D-14(A) of the Securities Exchange Act of 1934, as adopted pursuant to Section 302 of the Sarbanes-Oxley Act of 2002, filed herewith. | |
| 31.2 | Certification of the Principal Accounting and Financial Officer pursuant to Rule 13A-14(A)/15D-14(A) of the Securities Exchange Act of 1934, as adopted pursuant to Section 302 of the Sarbanes-Oxley Act of 2002, filed herewith. | |
| 32.1 | Certification of Principal Executive Officer Pursuant to 18 U.S.C. 1350 (Section 906 of the Sarbanes-Oxley Act of 2002), filed herewith. | |
| 32.2 | Certification of Principal Accounting and Financial Officer Pursuant to 18 U.S.C. 1350 (Section 906 of the Sarbanes-Oxley Act of 2002), filed herewith. |
| (1) | Incorporated by reference from the Registrant’s Current Report filed with the SEC on Form 8-K on January 3, 2007. |
| (2) | Incorporated by reference from the Registrant’s Registration Statement on Form S-8 (File No. 333-141173) dated March 9, 2007. |
| (3) | Incorporated by reference from the Registrant’s Current Report filed with the SEC on Form 8-K on October 21, 2005. |
| (4) | Incorporated by reference from the Registrant’s Current Report filed with the SEC on Form 8-K on September 11, 2007. |
| (5) | Incorporated by reference from the Registrant’s Current Report filed with the SEC on Form 8-K on December 20, 2005. |
| (6) | Incorporated by reference from the Registrant’s Current Report filed with the SEC on Form 8-K on December 22, 2005. |
| (7) | Incorporated by reference from the Registrant’s Current Report filed with the SEC on Form 8-K on December 11, 2006. |
| (8) | Incorporated by reference from the Registrant’s Current Report filed with the SEC on Form 8-K on July 17, 2007. |
| (9) | Incorporated by reference from the Registrant’s Current Report filed with the SEC on Form 8-K on November 28, 2007. |
| (10) | Incorporated by reference from the Registrant’s Current Report filed with the SEC on Form 8-K on January 17, 2008. |
| (11) | Incorporated by reference from the Registrant’s Annual Report filed with the SEC on Form 10-K on March 27, 2008. |
| 36 |
| (12) | Incorporated by reference from the Registrant’s Current Report filed with the SEC on Form 8-K on December 29, 2008. |
| (13) | Incorporated by reference from the Registrant’s Current Report filed with the SEC on Form 8-K on April 9, 2009. |
| (14) | Incorporated by reference from the Registrant’s Annual Report filed with the SEC on Form 10-K on April 16, 2009. |
| (15) | Incorporated by reference from the Registrant’s Current Report filed with the SEC on Form 8-K on December 14, 2006. |
| (16) | Incorporated by reference from the Registrant’s Registration Statement on Form S-8 (File No. 333-159200) dated May 13, 2009. |
| (17) | Incorporated by reference from the Registrant’s Current Report filed with the SEC on Form 8-K on June 22, 2009. |
| (18) | Incorporated by reference from the Registrant’s Annual Report filed with the SEC on Form 10-K on April 15, 2010. |
SIGNATURES
Pursuant to the requirements of Section 13 or 15(d) of the Securities and Exchange Act of 1934, the Company has duly caused this report to be signed on its behalf by the undersigned, thereunto duly authorized, on this ____ day of May 2012.
| CHINA 3C GROUP | |||
| Zhenggang Wang | |||
| Chief Executive Officer and Chairman | |||
| (Principal Executive Officer) | |||
Pursuant to the requirements of the Securities Exchange Act of 1934, this amended report has been signed below by the following persons on behalf of the Company and in the capacities indicated below and on the dates indicated.
| Signatures | Title | Date | ||
| May ___, , 2012 | ||||
| Zhenggang Wang | Chief Executive Officer and | |||
| Chairman (Principal Executive | ||||
| Officer) | ||||
| Xinchuan Kong | President | May ___,, 2012 | ||
| Weiping Wang | Chief Financial Officer (Principal | May ___,, 2012 | ||
| Accounting and Financial Officer) | ||||
| Chenghua Zhu | Director | May ___,, 2012 | ||
| Mingjun Zhu | Director | May ___,, 2012 | ||
| Rongjin Weng | Director | May ___,, 2012 | ||
| Wei Kang Gu | Director | May ___,, 2012 |
| 37 |
CHINA 3C GROUP AND SUBSIDIARIES
CONSOLIDATED FINANCIAL STATEMENTS
DECEMBER 31, 2010
TABLE OF CONTENTS
| Report of Independent Registered Public Accounting Firm | F-2 |
| Consolidated Balance Sheets | F-3 |
| Consolidated Statements of Operations and Comprehensive Income (Loss) | F-4 |
| Consolidated Statements of Stockholders’ Equity | F-5 |
| Consolidated Statements of Cash Flows | F-6 |
| Notes to Consolidated Financial Statements | F-7 |
| F-1 |
REPORT OF INDEPENDENT REGISTERED PUBLIC ACCOUNTING FIRM
To the Board of Directors
China 3C Group
We have audited the accompanying consolidated balance sheets of China 3C Group and subsidiaries (the “Company”) as of December 31, 2010 and 2009, and the related consolidated statements of operations and comprehensive income, stockholders’ equity and cash flows for the years ended December 31, 2010, 2009 and 2008. These financial statements are the responsibility of the Company’s management. Our responsibility is to express an opinion on these financial statements based on our audits.
We conducted our audits in accordance with the standards of the Public Company Accounting Oversight Board (United States). Those standards require that we plan and perform the audit to obtain reasonable assurance about whether the financial statements are free of material misstatement. The Company is not required to have, nor were we engaged to perform, an audit of internal control over financial reporting. Our audits included consideration of internal control over financial reporting as a basis for designing audit procedures that are appropriate in the circumstances, but not for the purpose of expressing an opinion on the effectiveness of the Company’s internal control over financial reporting. Accordingly, we express no such opinion. An audit includes examining, on a test basis, evidence supporting the amounts and disclosures in the financial statements. An audit also includes assessing the accounting principles used and significant estimates made by management, as well as evaluating the overall financial statement presentation. We believe that our audits provide a reasonable basis for our opinion.
In our opinion, based on our audits, the consolidated financial statements referred to above present fairly, in all material respects, the consolidated financial position of China 3C Group and subsidiaries as of December 31, 2010 and 2009, and the results of their operations and their cash flows for the years ended December 31, 2010, 2009 and 2008 in conformity with the U.S. generally accepted accounting principles.
Goldman Kurland and Mohidin, LLP
Encino, California
May 18, 2011
Except for Notes 1, 2, 5, 7 and 13, for which the date is March 14, 2012.
| F-2 |
CHINA 3C GROUP
CONSOLIDATED BALANCE SHEETS
(in thousands)
| December 31, | December 31, | |||||||
| 2010 | 2009 | |||||||
| ASSETS | ||||||||
| Current assets: | ||||||||
| Cash and equivalents | $ | 26,249 | $ | 29,908 | ||||
| Accounts receivable, net | 11,026 | 18,232 | ||||||
| Inventories | 7,284 | 6,764 | ||||||
| Advances to suppliers | 2,201 | 2,370 | ||||||
| Tax receivable | 1,200 | 1,157 | ||||||
| Prepaid expenses and other current assets | 591 | 294 | ||||||
| Total current assets | 48,551 | 58,725 | ||||||
| Property, plant and equipment, net | 191 | 279 | ||||||
| Goodwill | 11,229 | 20,820 | ||||||
| Intangible asset, net | 13,153 | 14,557 | ||||||
| Refundable deposits | 7 | 15 | ||||||
| Total assets | $ | 73,131 | $ | 94,396 | ||||
| LIABILITIES AND STOCKHOLDERS' EQUITY | ||||||||
| Current liabilities: | ||||||||
| Accounts payable and accrued expenses | $ | 8,675 | $ | 6,838 | ||||
| Income tax payable | 736 | 938 | ||||||
| Total liabilities | 9,411 | 7,776 | ||||||
| Stockholders' equity | ||||||||
| Common stock, $0.001 par value, 100,000,000 million shares authorized, 54,831,327 issued and outstanding as of December 31, 2010 and 2009, respectively | 55 | 55 | ||||||
| Additional paid-in capital | 20,252 | 19,751 | ||||||
| Subscription receivable | (50 | ) | (50 | ) | ||||
| Statutory reserve | 11,543 | 11,535 | ||||||
| Other comprehensive income | 6,706 | 5,180 | ||||||
| Retained earnings | 25,214 | 50,149 | ||||||
| Total stockholders' equity | 63,720 | 86,620 | ||||||
| Total liabilities and stockholders' equity | $ | 73,131 | $ | 94,396 | ||||
The accompanying notes are an integral part of these consolidated financial statements.
| F-3 |
CHINA 3C GROUP
CONSOLIDATED STATEMENTS OF OPERATIONS AND COMPREHENSIVE INCOME (LOSS)
(in thousands, except share amounts)
| 2010 | 2009 | 2008 | ||||||||||
| (Restated) | (Restated) | (Restated) | ||||||||||
| Net sales | $ | 158,094 | $ | 218,994 | $ | 323,331 | ||||||
| Cost of sales | 140,668 | 187,476 | 262,003 | |||||||||
| Gross profit | 17,426 | 31,518 | 61,328 | |||||||||
| Selling, general and administrative expenses | 42,263 | 32,126 | 26,819 | |||||||||
| Income from operations | (24,837 | ) | (608 | ) | 34,509 | |||||||
| Other (income) expense | ||||||||||||
| Interest income | (102 | ) | (109 | ) | (146 | ) | ||||||
| Other income | (5 | ) | (163 | ) | (1,150 | ) | ||||||
| Other expense | 145 | 163 | 360 | |||||||||
| Total other (income) expense | 38 | (109 | ) | (936 | ) | |||||||
| Income (loss) before income taxes | (24,875 | ) | (499 | ) | 35,445 | |||||||
| Provision for income taxes | 52 | 714 | 8,611 | |||||||||
| Net income (loss) | $ | (24,927 | ) | $ | (1,213 | ) | $ | 26,834 | ||||
| Foreign currency translation adjustments | 1,526 | (92 | ) | 3,400 | ||||||||
| Comprehensive income (loss) | $ | (23,401 | ) | $ | (1,305 | ) | $ | 30,234 | ||||
| Net income (loss) available to common shareholders per share: | ||||||||||||
| Basic and Diluted | $ | (0.45 | ) | $ | (0.02 | ) | $ | 0.51 | ||||
| Weighted average shares outstanding: | ||||||||||||
| Basic and Diluted | 54,831,327 | 53,867,890 | 52,673,938 | |||||||||
The accompanying notes are an integral part of these consolidated financial statements.
| F-4 |
CHINA 3C GROUP AND SUBSIDIARIES
CONSOLIDATED STATEMENTS OF STOCKHOLDERS’ EQUITY
YEARS ENDED DECEMBER 31, 2010, 2009 and 2008
(in thousands)
| Additional | Other | Total | ||||||||||||||||||||||||||||||
| Common Stock | Paid-In | Subscription | Statutory | Comprehensive | Retained | Stockholders' | ||||||||||||||||||||||||||
| Shares | Amount | Capital | Receivable | Reserve | Income | Earnings | Equity | |||||||||||||||||||||||||
| Balance at December 31, 2007 | 52,674 | $ | 53 | $ | 19,466 | $ | (50 | ) | $ | 7,234 | $ | 1,872 | $ | 28,829 | $ | 57,404 | ||||||||||||||||
| Foreign currency translation adjustments | - | - | - | - | - | 3,400 | - | 3,400 | ||||||||||||||||||||||||
| Transfer to statutory reserve | - | - | - | - | 3,875 | - | (3,875 | ) | - | |||||||||||||||||||||||
| Net income | - | - | - | - | - | - | 26,834 | 26,834 | ||||||||||||||||||||||||
| Balance at December 31, 2008 | 52,674 | 53 | 19,466 | (50 | ) | 11,109 | 5,272 | 51,788 | 87,638 | |||||||||||||||||||||||
| Foreign currency translation adjustments | - | - | - | - | - | (92 | ) | - | (92 | ) | ||||||||||||||||||||||
| Issuance of common stock for compensation | 1,997 | 2 | 285 | - | - | - | - | 287 | ||||||||||||||||||||||||
| Issuance of common stock in consideration of the cancelled stock options | 160 | - | - | - | - | - | - | - | ||||||||||||||||||||||||
| Transfer to statutory reserve | - | - | - | - | 426 | - | (426 | ) | - | |||||||||||||||||||||||
| Net income | - | - | - | - | - | - | (1,213 | ) | (1,213 | ) | ||||||||||||||||||||||
| Balance at December 31, 2009 | 54,831 | 55 | 19,751 | (50 | ) | 11,535 | 5,180 | 50,149 | 86,620 | |||||||||||||||||||||||
| Foreign currency translation adjustments | - | - | - | - | - | 1,526 | - | 1,526 | ||||||||||||||||||||||||
| Issuance of common stock for compensation | - | - | 501 | - | - | - | - | 501 | ||||||||||||||||||||||||
| Transfer to statutory reserve | - | - | - | - | 8 | - | (8 | ) | - | |||||||||||||||||||||||
| Net loss | - | - | - | - | - | - | (24,927 | ) | (24,927 | ) | ||||||||||||||||||||||
| Balance at December 31, 2010 | 54,831 | $ | 55 | $ | 20,252 | $ | (50 | ) | $ | 11,543 | $ | 6,706 | $ | 25,214 | $ | 63,720 | ||||||||||||||||
The accompanying notes are an integral part of these consolidated financial statements.
| F-5 |
CHINA 3C GROUP
CONSOLIDATED STATEMENTS OF CASH FLOWS
(in thousands)
| 2010 | 2009 | 2008 | ||||||||||
| Operating activities: | ||||||||||||
| Net income (loss) | $ | (24,927 | ) | $ | (1,213 | ) | $ | 26,834 | ||||
| Adjustments to reconcile net loss to net cash provided by (used in) operating activities: | ||||||||||||
| Depreciation | 11 | 614 | 36 | |||||||||
| Amortization of intangible assets | 1,405 | 698 | - | |||||||||
| Goodwill impairment | 9,591 | - | - | |||||||||
| Stock based compensation | 501 | 287 | 337 | |||||||||
| Gain on asset disposition | - | - | (2 | ) | ||||||||
| Provision for bad debts | - | - | 262 | |||||||||
| (Increase)/decrease in assets | ||||||||||||
| Accounts receivable | 7,688 | 5,472 | (14,630 | ) | ||||||||
| Tax receivable | - | (1,157 | ) | - | ||||||||
| Other receivable | (138 | ) | (64 | ) | - | |||||||
| Inventories | (261 | ) | 2,199 | (1,732 | ) | |||||||
| Prepaid expenses and other current assets | (142 | ) | (142 | ) | (4 | ) | ||||||
| Advance to suppliers | 251 | 119 | 247 | |||||||||
| Refundable deposits | 9 | 17 | 11 | |||||||||
| (Increase) / decrease in current liabilities | ||||||||||||
| Accounts payable and accrued expenses | 1,545 | 1,482 | 1,867 | |||||||||
| Income tax payable | (231 | ) | (1,200 | ) | (536 | ) | ||||||
| Net cash provided (used) by operating activities | (4,698 | ) | 7,112 | 12,690 | ||||||||
| CASH FLOW FROM INVESTING ACTIVITIES: | ||||||||||||
| Purchase of property and equipment | - | (806 | ) | (11 | ) | |||||||
| Proceeds from asset sales | (22 | ) | - | 2 | ||||||||
| Payments for acquisition of subsidiary | - | (7,784 | ) | (7,318 | ) | |||||||
| Net cash (used in) investing activities | (22 | ) | (8,590 | ) | (7,327 | ) | ||||||
| Effect of exchange rate changes on cash and cash equivalents | 1,061 | (772 | ) | 1,842 | ||||||||
| Net increase (decrease) in cash | (3,659 | ) | (2,250 | ) | 7,205 | |||||||
| Cash, beginning of year | 29,908 | 32,158 | 24,953 | |||||||||
| Cash, end of year | $ | 26,249 | $ | 29,908 | $ | 32,158 | ||||||
| Supplemental disclosure of cash flow information: | ||||||||||||
| Income taxes paid | $ | 254 | $ | 3,073 | $ | 9,155 | ||||||
| Interest paid | $ | - | $ | - | $ | - | ||||||
The accompanying notes are an integral part of these consolidated financial statements.
| F-6 |
CHINA 3C GROUP AND SUBSIDIARIES
NOTES TO CONSOLIDATED FINANCIAL STATEMENTS
DECEMBER 31, 2010 AND 2009
Note 1 -ORGANIZATION
China 3C Group (the “Company” or “China 3C”) was incorporated on August 20, 1998 under the laws of the State of Nevada. Capital Future Developments Limited - BVI (“Capital”) was incorporated on July 22, 2004 under the laws of the British Virgin Islands (“BVI”). Zhejiang Yong Xin Digital Technology Company Limited (“Zhejiang”), Yiwu Yong Xin Communication Limited (“Yiwu”), Hangzhou Wang Da Electronics Company Limited (“Wang Da”), Hangzhou Sanhe Electronic Technology Limited (“Sanhe”), and Shanghai Joy & Harmony Electronics Company Limited (“Joy & Harmony”), Jinhua Baofa Logistic Ltd (“Jinhua”) were incorporated under the laws of Peoples Republic of China (“PRC”) on July 11, 2005, July 18, 1997, March, 30, 1998, April 12, 2004, August 20, 2003 and December 27, 2001, respectively. All dollar amounts are in thousands, unless otherwise indicated.
On December 21, 2005, Capital became a wholly owned subsidiary of China 3C Group through a reverse merger (“Merger Transaction”). China 3C Group acquired all of the issued and outstanding capital stock of Capital pursuant to a Merger Agreement dated December 21, 2005 by and among China 3C Group, XY Acquisition Corporation, Capital and the shareholders of Capital (the “Merger Agreement”). Pursuant to the Merger Agreement, Capital became a wholly owned subsidiary of China 3C Group and, in exchange for the Capital shares, China 3C Group issued 35,000,000 shares of its common stock to the shareholders of Capital, representing 93% of the issued and outstanding capital stock of China 3C Group at that time and cash of $500.
On August 3, 2006, Capital completed the acquisition of a 100% interest in Sanhe for a cash and stock transaction valued at $8,750. The consideration consisted of 915,751 newly issued shares of the Company’s common stock and $5,000 in cash.
On November 28, 2006, Capital completed the acquisition of a 100% interest in Joy & Harmony for a cash and stock transaction valued at $18,500. The consideration consisted of 2,723,110 shares of the Company’s common stock and $7,500 in cash.
On August 15, 2007, we executed a series of contractual agreements between Capital and Zhejiang. The contractual agreements give Capital and its equity owners an obligation, and having ability to absorb, any losses, and rights to receive returns; however, these contractual agreements did not change the equity ownership of Zhejiang. We did not dispose Capital’s actual equity ownership of Zhejiang when we execute the contractual agreements. Capital entered into share-holding entrustment agreements with five individuals - Zhenggang Wang, Yimin Zhang, Huiyi Lv, Xiaochun Wang and Zhongsheng Bao to hold 35%, 20%, 20%, 15% and 10%, respectively, of the equity interest of Zhejiang on behalf of Capital on November 21, 2005. The entrustment agreements confirm that CFDL is the actual owner of Zhejiang. CFDL enjoys the actual shareholder’s rights and has the right to obtain any benefits received by the nominal holders. Zhenggang Wang is the CEO and shareholder of China 3C Group. Yimin Zhang, Huiyi Lv, Xiaochun Wang and Zhongsheng Bao have no other relationship with China 3C Group. No consideration was given to these individuals who held the equity of Zhejiang on behalf of CFDL.
On July 6, 2009, China 3C and its subsidiary Zhejiang and Yiwu purchased 100% of Jinhua for RMB 120 million (approximately $17,500) in cash. Zhejiang acquired 90% and Yiwu acquired 10% of the equity interests in Jinhua.
The purchase price and related allocation to the estimated fair values of the assets acquired and liabilities assumed, after proportionately allocating the goodwill resulting from the transaction in accordance with ASC 805 “Business Combinations” is as follows:
| F-7 |
| Cash paid for acquisition of Jinhua | $ | 17,508 | ||
| Assets acquired : | ||||
| Cash | $ | 2,406 | ||
| Accounts receivable, net | 715 | |||
| Other receivables, net | 60 | |||
| Prepaid expenses | 133 | |||
| Property, plant and equipment | 216 | |||
| Intangible asset - transportation network | 15,182 | |||
| Goodwill | 472 | |||
| Assets acquired | 19,184 | |||
| Liabilities assumed: | ||||
| Accounts payable | 315 | |||
| Accrued expenses and other payables | 547 | |||
| Due to shareholders | 814 | |||
| Liabilities assumed | 1,676 | |||
| Net assets acquired | $ | 17,508 |
Following the acquisition of Jinhua, the Company began providing logistic service to businesses in addition to its traditional business of resale and distribution of third party products such as mobile phones, facsimile machines, DVD players, stereos, speakers, MP3 and MP4 players, iPods, electronic dictionaries, CD players, radio Walkmans and audio systems.
| F-8 |
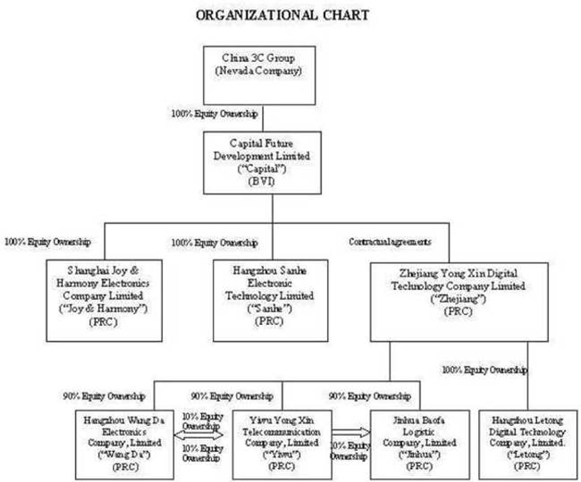
Note 2 -SUMMARY OF SIGNIFICANT ACCOUNTING POLICIES
Basis of Presentation
The accompanying consolidated financial statements were prepared in conformity with accounting principles generally accepted in the United States of America (“US GAAP”). The Company’s subsidiaries – Wang Da, Yiwu, Joy & Harmony, Sanhe, Jinhua and Zhejiang’s functional currency is the Chinese Renminbi (“RMB”), however, the accompanying consolidated financial statements have been translated and presented in United States Dollars (“$”, or “USD”). China 3C Group is the parent company that was incorporated on August 20, 1998 under the laws of the State of Nevada. The parent company does not have operations; therefore, it does not have sales. The main activities of China 3C Group were incurring public company expenses. China 3C Group pays all of its expenses in USD. Therefore, we believe China 3C Group’s functional currency is USD. Capital was incorporated on July 22, 2004 under the laws of the British Virgin Islands (“BVI”). Capital is a holding company and it does not have operations. As a result, we determined that China 3C Group, and Capital’s functional currency is USD.
| F-9 |
Principles of Consolidation
The consolidated financial statements include the accounts of China 3C Group and its wholly owned subsidiaries Capital, Wang Da, Yiwu, Joy & Harmony, Sanhe and Jinhua and variable interest entity Zhejiang, collectively referred to as the Company. All material intercompany accounts, transactions and profits were eliminated in consolidation.
Currency Translation
The accounts of Zhejiang, Wang Da, Yiwu, Sanhe, Joy & Harmony and Jinhua were maintained, and its financial statements were expressed, in Chinese Yuan Renminbi (“RMB”). Such financial statements were translated into USD in accordance with FASB ASC Topic 830-10, “Foreign Currency Translation,” with the RMB as the functional currency. According to FASB ASC Topic 830-10, assets and liabilities were translated at the ending exchange rate, stockholders’ equity is translated at the historical rates and income statement items are translated at the average exchange rate for the period. The resulting translation adjustments are reported as other comprehensive income in accordance with FASB ASC Topic 220, “Reporting Comprehensive Income,” as a component of shareholders’ equity. Transaction gains and losses are reflected in the consolidated income (loss) and comprehensive income (loss) statement.
Use of Estimates
The preparation of financial statements in conformity with US GAAP requires management to make estimates and assumptions that affect the reported amounts of assets and liabilities and disclosure of contingent assets and liabilities at the date of the financial statements and the reported amounts of revenues and expenses during the reporting period. Actual results could differ from those estimates.
Risks and Uncertainties
The Company is subject to substantial risks from, among other things, intense competition associated with the industry in general, other risks associated with financing, liquidity requirements, rapidly changing customer requirements, limited operating history, foreign currency exchange rates and the volatility of public markets.
Contingencies
Certain conditions may exist as of the date the financial statements are issued, which could result in a loss to the Company but which will only be resolved when one or more future events occur or fail to occur. The Company’s management assesses such contingent liabilities, and such assessment inherently involves an exercise of judgment. In assessing loss contingencies related to legal proceedings that are pending against the Company or unasserted claims that may result in such proceedings, the Company’s management evaluates the perceived merits of any legal proceedings or unasserted claims as well as the perceived merits of the amount of relief sought or expected to be sought.
If the assessment of a contingency indicates that it is probable that a material loss has been incurred and the amount of the liability can be estimated, then the estimated liability is accrued in the Company’s financial statements. If the assessment indicates that a potential material loss contingency is not probable but is reasonably possible, or is probable but cannot be estimated, then the nature of the contingent liability, together with an estimate of the range of possible loss if determinable and material would be disclosed.
Loss contingencies considered to be remote by management are generally not disclosed unless they involve guarantees, in which case the guarantee would be disclosed.
| F-10 |
Accounts Receivable
The Company maintains reserves for potential credit losses on accounts receivable. Management reviews the composition of accounts receivable and analyzes historical bad debts, customer concentrations, customer credit worthiness, current economic trends and changes in customer payment patterns to evaluate the adequacy of these reserves. Terms of the sales vary. Reserves are recorded primarily on a specific identification basis. Allowances for doubtful debts were $441 and $404 as of December 31, 2010 and 2009, respectively.
| Additions | ||||||||||||||||||||
| Description | Balance at January 1, | (1) Charged to expenses | (2) Charged to other comprehensive loss | Deductions | Balance at December 31, | |||||||||||||||
| Allowance for doubtful receivables 2010 | $ | 404 | $ | 37 | $ | - | - | $ | 441 | |||||||||||
| Allowance for doubtful receivables 2009 | $ | 365 | $ | 37 | $ | 84 | (82 | ) | $ | 404 | ||||||||||
Inventories
Inventories are valued at the lower of cost (determined on a weighted average basis) or market. Management compares the cost of inventories with the market value and allowance is made for writing down their inventories to market value, if lower. As of December 31, 2010 and 2009, inventory consisted entirely of finished goods valued at $7,284 and $6,764, respectively.
Property, Plant & Equipment
Property, plant and equipment are stated at cost. Expenditures for maintenance and repairs are charged to earnings as incurred; additions, renewals and betterments are capitalized. When property and equipment are retired or otherwise disposed of, the related cost and accumulated depreciation are removed from the respective accounts, and any gain or loss is included in operations. Depreciation of property and equipment is provided using the straight-line method for substantially all assets with estimated lives of:
| Automotive | 5 years |
| Office Equipment | 5 years |
As of December 31, 2010 and 2009, property and equipment consisted of the following:
| 2010 | 2009 | |||||||
| Automotive | $ | 738 | $ | 877 | ||||
| Office equipment | 195 | 132 | ||||||
| Leasehold improvement | 65 | 67 | ||||||
| Plant and Equipment | 3 | 3 | ||||||
| Sub Total | 1,001 | 1,079 | ||||||
| Less: accumulated depreciation | (810 | ) | (800 | ) | ||||
| Total | $ | 191 | $ | 279 | ||||
| F-11 |
The Company periodically evaluates the carrying value of long-lived assets to be held and used in accordance with ASC 360 “Property, Plant and Equipment” requires impairment losses to be recorded on long-lived assets used in operations when indicators of impairment are present and the undiscounted cash flows estimated to be generated by those assets are less than the assets’ carrying amounts. In that event, a loss is recognized based on the amount by which the carrying amount exceeds the fair market value of the long-lived assets. Losses on long-lived assets to be disposed of are determined in a similar manner, except that fair market values are reduced for the cost of disposal. Based on its review, the Company believes that, as of December 31, 2010 and 2009, there were no significant impairments of its long-lived assets.
Fair Value of Financial Instruments
ASC 825 “Financial Instruments” requires that the Company disclose estimated fair values of financial instruments. The carrying amounts reported in the statements of financial position for current assets and current liabilities qualifying as financial instruments are a reasonable estimate of fair value.
Impairment of Goodwill
In accordance with ASC 350,we test goodwill at the reporting unit level for impairment on an annual basis. Reporting units are determined based on the Company's operating segments. In performing the impairment test, we utilize the two-step approach prescribed under ASC 350. Step 1 requires a comparison of the carrying value of each reporting unit to its estimated fair value. We use the income approach for Step 1 to estimate the fair value of our reporting units. The Step 1 impairment analysis indicated that the carrying value of the net assets of Sanhe and Joy & Harmony exceeded the estimated fair value of the reporting unit.
As a result, we were required to perform Step 2 of the goodwill impairment test to determine the amount, if any, of goodwill impairment charges for Sanhe and Joy & Harmony. Step 2 of the goodwill impairment test compares the implied fair value of a reporting unit’s goodwill to its carrying value.. If the carrying value of the goodwill of a reporting unit exceeds the fair value of that goodwill, an impairment loss is recognized in an amount equal to the excess. We completed Step 2 and determined that a goodwill impairment charge in the amount of $1,347 and $8,243 were required for Sanhe and Joy & Harmony, respectively. The resulting goodwill impairment charge is reflected in operatings expenses in our consolidated statements of operations. Impairment charges related to goodwill have no impact on our cash balances.
The estimate of fair value of our reporting units requires significant judgment. We based our fair value estimates on assumptions that we believe to be reasonable but that are unpredictable and inherently uncertain, including estimates of future growth rates, estimate of future discounted cash flows and operating margins and assumptions about the overall economic climate and the competitive environment for our business units. There can be no assurance that our estimates and assumptions made for purposes of our goodwill testing as of the time of testing will prove to be accurate predictions of the future.
Revenue Recognition
In accordance with Securities and Exchange Commission (“SEC”) Staff Accounting Bulletin (“SAB”) 104, the Company recognizes revenues when there is persuasive evidence of an arrangement, product delivery and acceptance have occurred, the sales price is fixed and determinable, and collectability of the resulting receivable is reasonably assured.
The Company records revenues when title and the risk of loss pass to the customer. Generally, these conditions occur on the date the customer takes delivery of the product. Revenue is generated from sales of China 3C products through two main revenue streams:
| 1. | Retail. Approximately 68.8% , 68.9% and 68.7%of the Company's revenue comes from sales to individual customers at outlets installed inside department stores etc. (i.e. store in store model) during 2010, 2009 and 2008, respectively and is mainly achieved through two broad categories: |
| F-12 |
| a. | Purchase contracts. Sales by purchase contracts have terms of thirty days from the transfer of goods to the customer. Under this method, the Company delivers goods to places designated by the customers and receives confirmation of delivery. At that time, ownership and all risks associated to the goods are transferred to the customers and payment is made within 30 days. The Company relieves its inventory and recognizes revenue upon receipt of confirmation from the customer. |
| b. | Point of sale transfer of ownership. Under this method, the Company’s products are placed in third party stores and sold by the Company’s sales people. Upon purchase of the item by the customer, the Company relieves its inventory and recognizes revenue related to that item. |
| 2. | Wholesale. Approximately 31.2%, 31.1% and 31.3% of the Company's revenue comes from wholesale during 2010, 2009 and 2008, respectively. Recognition of income in wholesales is based on the contract terms. In 2009, the main contract terms on wholesale agreed that payments be paid 15 days after receipt of goods and that ownership and all risks associated with the goods are transferred to the customers on the date of goods received and payments will be made 15 days therefrom. |
Sales revenue is therefore recognized on the following basis:
| 1. | Store in store model: |
| a. | For goods sold under sales and purchase contracts, revenue is recognized when goods are received by customers. |
| b. | For goods at customer outlets which the Company’s sales people operate, and inventory of goods is under joint control by the customers and the Company, revenue is recognized at the point of sale to the end buyer. China 3C has title and owns the inventory under joint control. Such joint controlled inventory has been properly included in reported inventory balance of China 3C’s financial statements. |
During public holidays or department store celebration periods, we provide certain sales incentives to retail customers to increase sales, such as gift giving and price reductions. These are the only temporary incentives during the specified periods. Sales made to our retail customers as a result of incentives are immaterial as a percentage of total sales revenue.
| 2. | Wholesales: |
| a. | Revenue is recognized at the date of goods are received by wholesale customers. We operate our wholesale business by selling large volume orders to second-tier distributors and large department stores. Revenues from wholesale are recognized as net sales after confirmation with distributors. Net sales already take into account revenue dilution as they exclude inventory credit, discount fro early payment, product obsolescence and return of products and other allowances. Net sales also take into account the return of products in accordance with relevant laws and regulations in China. |
| F-13 |
Return policies
Our return policy complies with China’s laws and regulations on consumer’s rights and product quality. In accordance with Chinese law, consumers can return or exchange used products within seven days only if the goods do not meet safety and health requirements, endanger a person’s property, or do not meet the advertised performance. If the conditions and requirements as set out in the relevant laws and regulations are met, the retail stores are entitled to accept a return of the goods from the consumer. In such cases, the Company shall accept the returns unconditionally. Goods returned will be redirected to the production factory or supplier who shall bear all losses on the returns in accordance the laws and regulations. Consumer returns or exchanges of products that have not been used, where the packaging has not been damaged, are honored if such return or exchange is within seven days. If a consumer returns a product, the Company must refund the invoice price to the consumer. The Company will then be responsible for returning the goods to the production factory or supplier. At that time the Company can recover the price based on the purchase and sale contract with the producer or supplier. However, when goods are returned, the Company loses the gross margin that it records when revenue is recognized, regardless of whether the production factory or supplier takes the product back or not.
The return rights granted to wholesale customers are similar to the rights granted to retail customers. Once wholesale customers purchase the products, they follow the same return policy as retail customers. We do not honor any return from wholesale customers other than if the products don’t meet laws and regulations or quality requirements. If the wholesale customers have a high inventory level or product obsolescence caused by lower market demands or other operational issues, the wholesale customers bear their own losses. When a wholesale customer returns products, the Company will return the products to the suppliers or manufacturers. A sales return and allowance is recorded at the sales price. Meanwhile, a purchase return and allowance entry is recorded at the invoice price because the suppliers or manufacturers bear the losses. The net effect is that the Company derecognizes the gross profit when a return takes place, but does not record any loss on the cost of the returned item back to the supplier or manufacturer.
In light of the aforesaid PRC laws and regulations and the Company's arrangements with suppliers, we do not provide an accrual for any estimated losses on subsequent sale of the return of products. As a result we do not engage in assessing levels of inventory in the distribution channel, product obsolescence and/or introductions of new products, as none of those factors have any impact on us with respect to estimating losses on subsequent sale of returned goods. Goods return policy strictly complies with the laws and regulations in China on consumer rights and product quality requirements. If the conditions and requirements as set out in the relevant laws and regulations are met, customers are able to return the goods unconditionally. In such cases, the Company shall accept the returns unconditionally. Goods returned will be redirected back to the manufacturers or suppliers who shall meet all losses on returns in accordance the laws and regulations. The Company will only be responsible for assisting the process of execution of goods return. The Company shall not bear any loss from goods returned.
Unlike the US retail market, sellers do not accept returns caused by any change in the sales market or change in customers’ preferences in China. Therefore, the Company generally does not honor any return except for a product defect. As such, situations relating to return of goods from overstock in distribution channels, product obsolescence and over-budgeted goods from launching of new products will not exist.
As a result, we do not provide any accrual on subsequent return of goods sold.
The reported sales do not include estimate of returns due to defects for the period presented because we do not offer customers the right to return in China. We do not allow the customers to return the products for cash refunds, credit, or exchange for other products through general rights of return. If the products are defective, manufacturers are directly responsible for the defects. China 3C Group, as a distributor, only assists customers in returning the defective products to manufacturers. The manufacturers send replacement products to customers directly.
| F-14 |
Cost of Sales
Cost of sales consists of actual product cost, which is the purchase price of the product less any discounts. Cost of sales excludes freight charges, purchase and delivery costs, internal transfer, freight charges and the other costs of the Company’s distribution network, which are identified in general and administrative expenses.
General and Administrative Expenses
General and administrative expenses are comprised principally of payroll and benefits costs for retail and corporate employees, occupancy costs of corporate facilities, lease expenses, management fees, traveling expenses and other operating and administrative expenses, including freight charges, purchase and delivery costs, internal transfer freight charges and other distribution costs.
Shipping and handling fees
The Company follows ASC 605-45, “Handling Costs, Shipping Costs”. The Company does not charge its customers for shipping and handling. The Company classifies shipping and handling fees as part of General and administrative expenses which were $228, $226 and $244 for 2010, 2009 and 2008, respectively.
Vendor Discounts
The Company has negotiated preferred pricing arrangements with certain vendors on certain products. These arrangements are not contingent on any levels of volume and are considered vendor discounts as opposed to rebates. The Company records these discounts along with the purchase of the discounted items, resulting in lower inventory cost and a corresponding lower cost of sales as the products are sold.
Management fees paid to the department stores under “store in store” model
Under the “store in store” business operation model, the Company may pay management fees to the department stores, which are in the form of service charges. The management fees are reflected in general and administrative expenses. Such management fees were $11,129 and $11,623 in general and administrative expenses for 2010 and 2009, respectively.
Share Based Payment
The Company adopted ASC 718-10, “Stock Compensation”, which addresses the accounting for transactions in which an entity exchanges its equity instruments for goods or services, with a primary focus on transactions in which an entity obtains employee services in share-based payment transactions. ASC 718-10 is a revision to SFAS No. 123, “Accounting for Stock-Based Compensation,” ASC 718-10 requires measurement of the cost of employee services received in exchange for an award of equity instruments based on the grant-date fair value of the award (with limited exceptions). Incremental compensation costs arising from subsequent modifications of awards after the grant date must be recognized.
Advertising
Advertising expenses consist primarily of costs of promotion for corporate image and product marketing and costs of direct advertising. The Company expenses all advertising costs as incurred. Advertising expense was $491 and $405 for 2010 and 2009, respectively.
Other Income
Other income was $5, $163 and $1,150 for the years ended December 31, 2010, 2009 and 2008. Other income consists of the following: Other income was $5, $163 and $1,150 for the years ended December 31, 2010, 2009 and 2008. Other income consists of the following:
| 2010 | 2009 | 2008 | ||||||||||
| Advertising service income | $ | - | $ | 103 | $ | 649 | ||||||
| Repair service income | - | 30 | 29 | |||||||||
| Commission income from China Unicom | - | 30 | 470 | |||||||||
| Gain on disposal of PPE | 5 | - | 2 | |||||||||
| Total other income | $ | 5 | $ | 163 | $ | 1,150 | ||||||
| F-15 |
Advertising service income is the service fee we received from electronic product manufacturers when we advertise their products in our retail locations. Commission income from China Unicom is related to the sales of China Unicom’s wireless service and products, i.e. rechargeable mobile phone cards.
Income Taxes
The Company utilizes ASC 740 “Income Taxes”. Deferred income taxes are recognized for the tax consequences in future years of differences between the tax bases of assets and liabilities and their financial reporting amounts at each period end based on enacted tax laws and statutory tax rates applicable to the periods in which the differences are expected to affect taxable income. Valuation allowances are established, when necessary, to reduce deferred tax assets to the amount expected to be realized.
Basic and Diluted Earnings per Share
Earnings (loss) per share are calculated in accordance with ASC 260, “Earnings per Share”. Basic earnings (loss) per share is based upon the weighted average number of common shares outstanding. Diluted earnings (losses) per share is based on the assumption that all dilutive convertible shares and stock options were converted or exercised. Dilution is computed by applying the treasury stock method. Under this method, options and warrants are assumed to be exercised at the beginning of the period (or at the time of issuance, if later), and as if funds obtained thereby were used to purchase common stock at the average market price during the period. If convertible shares and stock options are anti-dilutive, the impact of conversion is not included in the diluted net income per share. Excluded from the calculation of diluted earnings per share for 2010 and 2009 were 50,000 and 100,000, respectively, as they were not dilutive.
Statement of Cash Flows
In accordance with FASB ASC Topic 230 “Statement of Cash Flows”, cash flows from the Company’s operations are calculated based upon the functional currency, in our case the RMB. As a result, amounts related to changes in assets and liabilities reported on the statement of cash flows will not necessarily agree with the changes in the corresponding balances on the balance sheet.
Concentration of Credit Risk
Financial instruments that potentially subject the Company to concentrations of credit risk are cash, accounts receivable, advances to suppliers and other receivables arising from its normal business activities. The Company places its cash in what it believes to be credit-worthy financial institutions. The Company has a diversified customer base, most of which is in China. The Company controls credit risk related to accounts receivable through credit approvals, credit limits and monitoring procedures. The Company routinely assesses the financial strength of its customers and, based upon factors surrounding the credit risk, establishes an allowance, if required, for uncollectible accounts and, as a consequence, believes that its accounts receivable credit risk exposure beyond such allowance is limited.
Segment Reporting
FASB ASC Topic 280, “Segment Reporting” requires use of the “management approach” model for segment reporting. The management approach model is based on the way a company’s management organizes segments within the company for making operating decisions and assessing performance. Reportable segments are based on products and services, geography, legal structure, management structure, or any other manner in which management disaggregates a company. The Company operated in four segments before the acquisition of Jinhua in July 2009. Since the acquisition of Jinhua, the Company operates in five segments (see Note 13).
| F-16 |
Recent Accounting Pronouncements
FASB ASC Topic 805 “Business Combinations” addresses the accounting and disclosure for identifiable assets acquired, liabilities assumed, and noncontrolling interests in a business combination. FASB ASC Topic 805 requires an acquiring entity to recognize all the assets acquired and liabilities assumed in a transaction at the acquisition-date fair value, with limited exceptions, and applies to a wider range of transactions or events. FASB ASC Topic 805 is effective for fiscal years beginning on or after December 15, 2008 and early adoption and retrospective application is prohibited. The Company adopted FASB ASC Topic 805 on January 1, 2009. The Company accounted for the acquisition of Jinhua in accordance with these standards.
FASB ASC Topic 810 “Consolidation” establishes accounting and reporting standards for the non-controlling (minority) interest in a subsidiary and for the deconsolidation of a subsidiary. It clarifies that a non-controlling interest in a subsidiary is an ownership interest in the consolidated entity that should be reported as equity in the consolidated financial statements. The Company adopted FASB ASC Topic 810 on January 1, 2009. The adoption of this statement had no effect on the Company’s consolidated financial statements.
FASB ASC Topic 815 “Derivatives and Hedging” is intended to improve financial reporting about derivative instruments and hedging activities by requiring enhanced disclosures to enable investors to better understand their effects on an entity’s financial position, financial performance, and cash flows. It is effective for financial statements issued for fiscal years and interim periods beginning after November 15, 2008, with early application encouraged. The Standard also improves transparency about the location and amounts of derivative instruments in an entity’s financial statements; how derivative instruments and related hedged items are accounted for under Statement 133; and how derivative instruments and related hedged items affect its financial position, financial performance, and cash flows. The Company adopted FASB ASC Topic 815 on January 1, 2009. The adoption of this statement had no effect on the Company’s consolidated financial statements.
FASB ASC Topic 825 “Financial Instruments” requires that the fair value disclosures required for all financial instruments within the scope of FASB ASC Topic 825-10, “Disclosures about Fair Value of Financial Instruments”, be included in interim financial statements. This FSP also requires entities to disclose the method and significant assumptions used to estimate the fair value of financial instruments on an interim and annual basis and to highlight any changes from prior periods. FASB ASC Topic 825 was effective for interim periods ending after June 15, 2009. The adoption of FASB ASC Topic 825 had no material effect on the Company’s consolidated financial statements.
FASB ASC Topic 860 “Transfers and servicing” requires more information about transfers of financial assets and where companies have continuing exposure to the risks related to transferred financial assets. FASB ASC Topic 860 is effective at the start of a company’s first fiscal year beginning after November 15, 2009, or January 1, 2010 for companies reporting earnings on a calendar-year basis. The adoption of this statement had no material effect on the Company’s financial statements.
Revisions under FASB ASC Topic 810 “Consolidation”, revises how a company determines when an entity that is insufficiently capitalized or is not controlled through voting (or similar rights) should be consolidated. Under FASB ASC Topic 810, determining whether a company is required to consolidate an entity will be based on, among other things, an entity’s purpose and design and a company’s ability to direct the activities of the entity that most significantly impact the entity’s economic performance. FASB ASC Topic 810 is effective at the start of a company’s first fiscal year beginning after November 15, 2009, or January 1, 2010 for companies reporting earnings on a calendar-year basis. The adoption of FASB ASC Topic 810 had no impact on our financial statements.
| F-17 |
In June 2009, the FASB issued Accounting Standards Update “ASU” 2009-1. The FASB approved its Codification ASC as the single source of authoritative United States accounting and reporting standards applicable for all non-governmental entities, with the exception of the SEC and its staff. The Codification is effective for interim or annual financial periods ending after September 15, 2009 and impacts our financial statements as all future references to authoritative accounting literature will be referenced in accordance with the Codification. There were no changes to the content of our financial statements or disclosures as a result of implementing the Codification.
In April 2010, FASB issued ASU 2010-13,Compensation – Stock Compensation (Topic 718): Effect of Denominating the Exercise Price of a Share-Based Payment Award in the Currency of the Market in Which the Underlying Equity Security Trades. ASU 2010-13 provides guidance on the classification of a share-based payment award as either equity or a liability. A share-based payment that contains a condition that is not a market, performance, or service condition is required to be classified as a liability. ASU 2010-13 is effective for fiscal years, and interim periods within those fiscal years, beginning on or after December 15, 2010. The adoption of this statement did not have a significant impact on the Company’s financial statements.
In April 2010, the FASB issued ASU 2010-17, “Revenue Recognition—Milestone Method (Topic 605): Milestone Method of Revenue Recognition”.This Update provides guidance on the recognition of revenue under the milestone method, which allows a vendor to adopt an accounting policy to recognize all of the arrangement consideration that is contingent on the achievement of a substantive milestone (milestone consideration) in the period the milestone is achieved. The pronouncement is effective on a prospective basis for milestones achieved in fiscal years and interim periods within those years, beginning on or after June 15, 2010. The adoption of this ASU did not have a material impact on the Company’s consolidated financial statements.
In July 2010, the FASB issued ASU 2010-20, “Receivables (Topic 310): Disclosures about the Credit Quality of Financing Receivables and the Allowance for Credit Losses”.The amendments in this Update are to provide financial statement users with greater transparency about an entity’s allowance for credit losses and the credit quality of its financing receivables. The disclosures about activity that occurs during the reporting period are effective for interim and annual reporting periods beginning on or after December 15, 2010. The adoption of this statement did not have a significant impact on the Company’s financial statements.
Note 3 –ADVANCES TO SUPPLIERS
Advances to suppliers represent advance payments to suppliers for the purchase of inventory. As of December 31, 2010 and 2009, the Company had paid $2,201 and $2,370, respectively, as advances to suppliers.
Note 4 -COMMON STOCK
On January 15, 2009, the Company’s Board of Directors (“BOD”) adopted the China 3C Group, Inc. 2008 Omnibus Securities and Incentive Plan (the “2008 Plan”). The 2008 Plan provides for the granting of distribution equivalent rights, incentive stock options, non-qualified stock options, performance share awards, performance unit awards, restricted stock awards, stock appreciation rights, tandem stock appreciation rights, unrestricted stock awards or any combination of the foregoing, as may be best suited to the circumstances of the particular employee, director or consultant. Under the 2008 Plan 2,000,000 shares of the Company’s common stock are available for issuance for awards. Each award shall remain exercisable for a term of ten (10) years from the date of its grant. The price at which a share of common stock may be purchased upon exercise of an option shall not be less than the closing sales price of the common stock on the date such option is granted. The 2008 Plan shall continue in effect, unless sooner terminated, until the tenth anniversary of the date on which it is adopted by the BOD.
| F-18 |
In April and October 2009, the Company issued 1,997,272 shares of common stock under the 2008 Plan. The cost is expected to be recognized over a three year period. $501 and $287 was recognized as stock based compensation expense during 2010 and 2009. There was $715 unrecognized compensation expenses related to the nonvested stocks as of December 31, 2010.
Note 5 -STOCK WARRANTS, OPTIONS, AND COMPENSATION
Stock options— Options issued have a ten-year life and were fully vested upon issuance. The option holder has no voting or dividend rights. The grant price was the market price at the date of grant. The Company records the expense of the stock options over the related vesting period. The options were valued using the Black-Scholes option-pricing model at the date of grant stock option pricing.
The following summarizes the option activities for the year ended 2010, 2009 and 2008.
| Options | Weighted-Average Exercise Price | Weighted- Average Remaining Contractual Life (Years) | Aggregate Intrinsic Value | |||||||||||||
| Outstanding at January 1, 2008 | 400,000 | $ | 5.61 | 8.13 | $ | - | ||||||||||
| Granted | - | - | - | - | ||||||||||||
| Exercised | - | - | - | - | ||||||||||||
| Forfeited | - | - | - | - | ||||||||||||
| Outstanding at December 31, 2008 | 400,000 | $ | 5.61 | 8.13 | $ | - | ||||||||||
| Granted | - | - | - | - | ||||||||||||
| Exercised | - | - | - | - | ||||||||||||
| Forfeited | (300,000 | ) | 6.15 | 6 | - | |||||||||||
| Outstanding at December 31, 2009 | 100,000 | $ | 5.61 | 7.13 | $ | - | ||||||||||
| Granted | - | - | - | - | ||||||||||||
| Exercised | - | - | - | - | ||||||||||||
| Forfeited | (50,000 | ) | - | - | - | |||||||||||
| Outstanding at December 31, 2010 | 50,000 | $ | 4.16 | 7.13 | $ | - | ||||||||||
Outstanding options by exercise price consisted of the following as of December 31, 2010.
| Options Outstanding | Options Exercisable | |||||||||||||||||||||
| Exercise Price | Number of Shares | Weighted Average Remaining Life (Years) | Weighted Average Exercise Price | Number of Shares | Weighted Average Exercise Price | |||||||||||||||||
| $ | 4.16 | 50,000 | 7.0 | $ | 4.16 | 50,000 | $ | 4.16 | ||||||||||||||
During the three years ended December 31, 2008, 2009 and 2010, the Company did not issue any stock options. The 50,000 stock options outstanding as of December 31, 2010 were issued in 2007 to our former director Mr. Kenneth Berents, which has a 10 year term and vested immediately upon issuance.
The company estimates the fair value of stock options at grant date using the Black-Scholes valuation model, consistent with the provisions of ASC 718-10 “Stock Compensation”. Key inputs and assumptions used to estimate the fair value of stock options include the grant price of the award, the expected option term, volatility of the company’s stock, the risk-free rate and the company’s dividend yield.
| F-19 |
The following table presents the weighted-average assumptions used in the valuation at the grant date and the resulting weighted average fair value per option granted:
| Term: | 10 years | |||
| Expected volatility: | 130 | % | ||
| Risk-free interest rate | 2 | % | ||
| Dividend yield | 0 | % | ||
| Weighted-average grant date fair value: | $ | 4.5 |
Note 6 -COMPENSATED ABSENCES
Regulation 45 of the labor laws in the PRC entitles employees to annual vacation leave after 1 year of service. In general all leave must be utilized annually, with proper notification, any unutilized leave is cancelled.
Note 7 -INCOME TAXES
The Company’s policy is to recognize interest and penalties accrued on any unrecognized tax benefits as a component of income tax expense. The Company did not have any accrued interest or penalties associated with any unrecognized tax benefits, nor were any interest expense recognized during 2010, 2009 and 2008.
Under ASC 740-10-25, evaluation of a tax position is a two-step process. The first step is to determine whether it is more-likely-than-not that a tax position will be sustained upon examination, including the resolution of any related appeals or litigation based on the technical merits of that position. The second step is to measure a tax position that meets the more-likely-than-not threshold to determine the amount of benefit to be recognized in the financial statements.
The US entity, China 3C Group is subject to the US federal income tax at a rate of 34%. The US entity does not conduct any operations and only incurs public company expenses every year, such as legal fees, accounting fees, investor relations expenses and filing fees. In the process of applying step one, we determined it is more likely than not that all of the Company’s deferred tax assets will not be realized. As of December 31, 2010, the US entity has incurred net accumulated operating losses of approximately $3,848 for income tax purposes. As a result, $1,308 of valuation allowance was recorded to reduce the deferred tax asset to zero. The net change in valuation allowance was $172 in 2010 and $349 in 2009 for the US entity.
The PRC subsidiaries, Sanhe, Wangda, Joy& Harmony, Yiwu, Zhejiang are subject to the PRC income tax at a rate of 25%. Jinhua is subject to PRC income tax using simplified tax system. In 2010, the PRC subsidiaries incurred an adjusted net operating loss of $23,869. In the process of applying step one, management believes these subsidiaries will continue to incur losses in the near future due to high market competition, slowing market demand, rising labor and fuel costs. We believe it is more likely than not that the subsidiaries will not be able to benefit from the deferred tax assets in association with the operating losses. The net change in valuation allowance was $5,990 in 2010 and $240 in 2009 for the PRC subsidiaries.
| F-20 |
The components of deferred income tax assets and liabilities as of December 31, 2010, 2009 and 2008 are as follows:
| 2010 | 2009 | 2008 | ||||||||||
| Deferred tax assets: | ||||||||||||
| U.S. net operating losses | $ | 172 | $ | 349 | $ | 226 | ||||||
| PRC net operating losses | 5,990 | 240 | - | |||||||||
| Total deferred tax assets | 6,162 | 589 | 226 | |||||||||
| Less valuation allowance | (6,162 | ) | (589 | ) | (226 | ) | ||||||
| $ | - | $ | - | $ | - | |||||||
Reconciliation of the differences between the statutory US Federal income tax rate and the effective rate is as follows for 2010, 2009 and 2008.
| 2010 | 2009 | 2008 | ||||||||||
| (Credit) tax at US Statutory Rate | (34.0 | )% | (34.0 | )% | 34.0 | % | ||||||
| Tax rate difference | 8.6 | % | 9.0 | % | (9.0 | )% | ||||||
| Non deductible expense-impairment loss | 9.6 | - | - | |||||||||
| Other | 0.1 | - | - | |||||||||
| Valuation allowance | 15.5 | % | (118.1 | )% | (1.0 | )% | ||||||
| Effective rate | 0.2 | % | (143.1 | )% | 24.0 | % | ||||||
The large fluctuation in the valuation allowance from (118.1)% in 2009 to 15.5% in 2010 is due to multiple reasons. First, the Company’s consolidated net loss before income taxes in 2010 was $24,875, compared to the net loss of $499 in 2009. Second, the Company had several subsidiaries with taxable income and corresponding income tax provisions in 2009, causing the valuation account to be rather high. Finally, in 2010, the Company had impaired goodwill of $9,591 which is not deductible for tax purposes and did not have an increasing effect on the valuation.
Note 8 -COMMITMENTS
The Company leases various office facilities under operating leases that terminate through 2011. Rent expense for 2010, 2009 and 2008 was $500, $518 and $274, respectively. The future minimum obligations under these agreements are as follows by years as of December 31, 2010:
| 2011 | $ | 176 | ||
| 2012 | 53 | |||
| 2013 | 12 |
In addition, as of December 31, 2010, the Company is committed to pay $102 under various advertising agreements expiring within one year.
Note 9 -STATUTORY RESERVE
In accordance with the laws and regulations of the PRC, a wholly-owned Foreign Invested Enterprise’s income, after the payment of the PRC income taxes, shall be allocated to the statutory surplus reserves and statutory public welfare fund. Prior to January 1, 2006, the proportion of allocation for reserve was 10 percent of the profit after tax to the surplus reserve fund and additional 5-10 percent to the public affair fund. The public welfare fund reserve was limited to 50 percent of the registered capital. Effective January 1, 2006, there is now only one fund requirement. The reserve is 10 percent of income after tax, not to exceed 50 percent of registered capital.
| F-21 |
Statutory reserve funds are restricted for set off against losses, expansion of production and operation or increase in register capital of the respective company. Statutory public welfare fund is restricted to the capital expenditures for the collective welfare of employees. These reserves are not transferable to the Company in the form of cash dividends, loans or advances. These reserves are therefore not available for distribution except in liquidation. As of December 31, 2010, 2009 and 2008, the Company had allocated $11,543, $11,535 and $11,109 to these non-distributable reserve funds.
Note 10 -OTHER COMPREHENSIVE INCOME
The detail of other comprehensive income as included in stockholders’ equity for 2010, 2009 and 2008 are as follows:
| Foreign Currency Translation Adjustment | Total Accumulated Other Comprehensive Income | |||||||
| Balance at January 1, 2008 | $ | 1,872 | $ | 1,872 | ||||
| Change for 2008 | 3,400 | 3,400 | ||||||
| Balance at December 31, 2008 | $ | 5,272 | $ | 5,272 | ||||
| Change for 2009 | (92 | ) | (92 | ) | ||||
| Balance at December 31, 2009 | $ | 5,180 | $ | 5,180 | ||||
| Change for 2010 | 1,526 | 1,526 | ||||||
| Balance at December 31, 2010 | $ | 6,706 | $ | 6,706 | ||||
Note 11-CURRENT VULNERABILITY DUE TO CERTAIN RISK FACTORS
The Company’s operations are carried out in the PRC. Accordingly, the Company’s business, financial condition and results of operations may be influenced by the political, economic and legal environments in the PRC, by the general state of the PRC’s economy. The Company’s business may be influenced by changes in governmental policies with respect to laws and regulations, anti-inflationary measures, currency conversion and remittance abroad, and rates and methods of taxation, among other things.
Note 12 -MAJOR CUSTOMERS AND CREDIT RISK
During 2010 and 2009, no customer accounted for more than 10% of the Company’s sales. As of December 31, 2010 and 2009, the Company had no individual customers or vendors that comprised more than 10% of the Company’s accounts receivable or accounts payable.
| F-22 |
Note 13 - SEGMENT INFORMATION
We separately operate and prepare accounting and other financial reports to management for five major business organizations (Wang Da, Sanhe, Yiwu, Joy & Harmony and Jinhua). Each of the individual operating companies corresponds to different product groups. Wang Da is mainly operating mobile phones, Sanhe is mainly operating home appliances, Yiwu is mainly operating office communication products, and Joy & Harmony is mainly operating consumer electronics. Jinhua provides logistics to businesses in Eastern China. “Other” segment includes China 3C (the US holding company), Capital and Zhejiang; China 3C and Capital have no operations except for incurring public company expenses. Zhejiang started operation of direct stores and franchise stores in 2009. Since the direct stores and franchise stores are in trial operation, revenue generated from such stores and gross profits are nominal, Zhejiang’s operation is reported in “Other” segment. All segments are accounted for using the same principals as described in Note 2.
We have identified five reportable segments required by ASC 280: (1) mobile phone, (2) home electronics, (3) office communication product, (4) consumer electronics and (5) Logistics.
The following tables present summarized information by segment (in thousands):
| Year Ended December 31, 2010 | ||||||||||||||||||||||||||||
| Mobile | Home | Communication | Consumer | |||||||||||||||||||||||||
| Phones | Electronics | Products | Electronics | Logistics | Other | Total | ||||||||||||||||||||||
| Sales, net (restated) | $ | 43,801 | $ | 42,427 | $ | 20,251 | $ | 40,247 | $ | 10,691 | $ | 677 | $ | 158,094 | ||||||||||||||
| Cost of sales | 40,073 | 38,001 | 17,923 | 34,787 | 9,289 | 595 | 140,668 | |||||||||||||||||||||
| Gross profit (restated) | 3,728 | 4,426 | 2,328 | 5,460 | 1,402 | 82 | 17,426 | |||||||||||||||||||||
| Loss from operations (restated) | (3,156 | ) | (5,469 | ) | (2,456 | ) | (11,395 | ) | (1,448 | ) | (913 | ) | (24,837 | ) | ||||||||||||||
| Total assets | 10,993 | 14,988 | 9,967 | 18,536 | 15,837 | 2,810 | 73,131 | |||||||||||||||||||||
| Year Ended December 31, 2009 | ||||||||||||||||||||||||||||
| Mobile | Home | Communication | Consumer | |||||||||||||||||||||||||
| Phones | Electronics | Products | Electronics | Logistics | Other | Total | ||||||||||||||||||||||
| Sales, net (restated) | $ | 58,744 | $ | 53,385 | $ | 44,375 | $ | 56,660 | $ | 5,573 | $ | 257 | $ | 218,994 | ||||||||||||||
| Cost of sales | 52,144 | 44,758 | 39,246 | 47,239 | 3,860 | 229 | 187,476 | |||||||||||||||||||||
| Gross profit (restated) | 6,600 | 8,627 | 5,129 | 9,421 | 1,713 | 28 | 31,518 | |||||||||||||||||||||
| Income (loss) from operations (restated) | (262 | ) | (741 | ) | (612 | ) | 1,012 | 408 | (413 | ) | (608 | ) | ||||||||||||||||
| Total assets | 13,761 | 17,379 | 12,353 | 30,271 | 19,268 | 1,364 | 94,396 | |||||||||||||||||||||
In 2010, the enterprise-wide revenue derived from each group of products was as follows:
| Ÿ | Mobile phones was $43,801. |
| Ÿ | Office equipments was $20,251, including fax machine $14,017, telephones $3,531, printers $1,864 and other accessories $839. |
| Ÿ | Home electronics was $42,427, including DVD players $5,704, Stereo $3,457, TV $15,564 and other small home electronics $ 17,702. |
| Ÿ | Consumer electronics was $40,247, including MP3/MP4 $33,653, Radio $1,148, CD player $1,555, GPS $2,859 and other products $1,032. |
| Ÿ | Logistics was $10, 691. |
| Ÿ | Other was $677. |
In 2009, the enterprise-wide revenue derived from each group of products was as follows:
| Ÿ | Mobile phones was $58,744. |
| Ÿ | Office equipments was $ 44,375, including fax machine $22,997, telephones $10,599, printers $5,294 and other accessories $5,485. |
| F-23 |
| Ÿ | Home electronics was $53,385, including DVD players $9,817, Stereo $5,372, TV $16,738 and other small home electronics $ 21,458. |
| Ÿ | Consumer electronics was $56,660, including MP3/MP4 $44,919, Radio $1,690, CD player $3,633, GPS $4,073 and other products $2,345. |
| Ÿ | Logistics was $5,573. |
| Ÿ | Other was $257. |
Note 14 - RESTATEMENT OF CONSOLIDATED STATEMENTS OF OPERATIONS AND COMPREHENSIVE INCOME (LOSS)
China 3C operates most of its retail operations through “store in store” model. Under this model, the Company leases space in major department stores and retailers. The Company does not pay the department stores fixed leasing costs. Instead, China 3C deducts a percentage of sales each month as compensation to the department stores. China 3C records such costs as “sales discount” as a deduction from net sales.
In response to the SEC comments of December 19, 2011, the Company reviewed “sales discount” and determined they should be reclassified as management fees. As a result, we reclassified “sales discount” from a contra revenue account to management fees as part of the selling, general and administrative expenses. $9,740, $10,505 and $12,687 were previously classified in contra-revenue account as a deduction to net sales for the year ended December 31, 2010, 2009 and 2008. The Company moved the amount to selling expenses, and it is reported as selling, general and administrative expenses in the statement of operations and comprehensive income (loss). The reclassification caused a $9,740 increase in net sales from $148,354 to $158,094 and a corresponding increase of $9,740 in Selling, general and administrative expenses from $32,523 to $42,263 a $10,505 increase in net sales from $208,489 to $218,994 and a corresponding increase of $10,505 in Selling, general and administrative expenses from $21,621 to $32,126 in 2009; a $12,687 increase in net sales from $310,644 to $323,331 and a corresponding increase of $12,687 in Selling, general and administrative expenses from $14,132 to $26,819 in 2008. The gross profit increased $9,740, $10,505 and $12,687 respectively in 2010, 2009 and 2008. The loss from operations and net loss remained unchanged. The impact of the restatement was limited to the presentation of the consolidated statements of operations and comprehensive income (loss). The consolidated balance sheets, the consolidated statements of stockholders’ equity and the related consolidated statements of cash flows remained unaffected.
The table below summarizes the restatement changes to the consolidated statements of operations and comprehensive income (loss):
| 2010 | 2010 | |||||||||||
| (as reported) | (as restated) | Change | ||||||||||
| Net sales | $ | 148,354 | $ | 158,094 | $ | 9,740 | ||||||
| Gross profit | 7,686 | 17,426 | 9,740 | |||||||||
| Selling, general and administrative expenses | 32,523 | 42,263 | 9,740 | |||||||||
| 2009 | 2009 | |||||||||||
| (as reported) | (as restated) | Change | ||||||||||
| Net sales | $ | 208,489 | $ | 218,994 | $ | 10,505 | ||||||
| Gross profit | 21,013 | 31,518 | 10,505 | |||||||||
| Selling, general and administrative expenses | 21,621 | 32,126 | 10,505 | |||||||||
| 2008 | 2008 | |||||||||||
| (as reported) | (as restated) | Change | ||||||||||
| Net sales | $ | 310,644 | $ | 323,331 | $ | 12,687 | ||||||
| Gross profit | 48,641 | 61,328 | 12,687 | |||||||||
| Selling, general and administrative expenses | 14,132 | 26,819 | 12,687 | |||||||||
| F-24 |
Exhibit 31.1
CERTIFICATION
I, Zhenggang Wang, certify that:
1. I have reviewed this Annual Report on Form 10-K/A of China 3C Group and its subsidiaries;
2. Based on my knowledge, this report does not contain any untrue statement of a material fact or omit to state a material fact necessary to make the statements made, in light of the circumstances under which such statements were made, not misleading with respect to the period covered by this report;
3. Based on my knowledge, the financial statements, and other financial information included in this report, fairly present in all material respects the financial condition, results of operations and cash flows of the registrant as of, and for, the periods presented in this report;
4. The registrant’s other certifying officer and I are responsible for establishing and maintaining disclosure controls and procedures (as defined in Exchange Act Rules 13a-15(e) and 15d-15(e)) and internal control over financial reporting (as defined in Exchange Act Rules 13a-15(f) and 15d-15(f)) for the registrant and have:
(a) Designed such disclosure controls and procedures, or caused such disclosure controls and procedures to be designed under our supervision, to ensure that material information relating to the registrant, including its consolidated subsidiaries, is made known to us by others within those entities, particularly during the period in which this report is being prepared;
(b) Designed such internal control over financial reporting, or caused such internal control over financial reporting to be designed under our supervision, to provide reasonable assurance regarding the reliability of financial reporting and the preparation of financial statements for external purposes in accordance with generally accepted accounting principles;
(c) Evaluated the effectiveness of the registrant’s disclosure controls and procedures and presented in this report our conclusions about the effectiveness of the disclosure controls and procedures, as of the end of the period covered by this report based on such evaluation;
(d) Disclosed in this report any change in the registrant’s internal control over financial reporting that occurred during the registrant’s most recent fiscal quarter (the registrant’s fourth fiscal quarter in the case of an annual report) that has materially affected, or is reasonably likely to materially affect, the registrant’s internal control over financial reporting; and
5. The registrant’s other certifying officer and I have disclosed, based on our most recent evaluation of internal control over financial reporting, to the registrant’s auditors and the audit committee of the registrant’s board of directors (or persons performing the equivalent functions):
(a) All significant deficiencies and material weaknesses in the design or operation of internal control over financial reporting which are reasonably likely to adversely affect the registrant’s ability to record, process, summarize and report financial information; and
(b) Any fraud, whether or not material, that involves management or other employees who have a significant role in the registrant’s internal control over financial reporting.
| Dated: May ___, 2012 | By: | |
| Name: | Zhenggang Wang | |
| Title: | Chief Executive Officer and Chairman (Principal Executive Officer) |
Exhibit 31.2
CERTIFICATION
I, Weiping Wang certify that:
1. I have reviewed this Annual Report on Form 10-K/A of China 3C Group and its subsidiaries;
2. Based on my knowledge, this report does not contain any untrue statement of a material fact or omit to state a material fact necessary to make the statements made, in light of the circumstances under which such statements were made, not misleading with respect to the period covered by this report;
3. Based on my knowledge, the financial statements, and other financial information included in this report, fairly present in all material respects the financial condition, results of operations and cash flows of the registrant as of, and for, the periods presented in this report;
4. The registrant’s other certifying officer and I are responsible for establishing and maintaining disclosure controls and procedures (as defined in Exchange Act Rules 13a-15(e) and 15d-15(e)) and internal control over financial reporting (as defined in Exchange Act Rules 13a-15(f) and 15d-15(f)) for the registrant and have:
(a) Designed such disclosure controls and procedures, or caused such disclosure controls and procedures to be designed under our supervision, to ensure that material information relating to the registrant, including its consolidated subsidiaries, is made known to us by others within those entities, particularly during the period in which this report is being prepared;
(b) Designed such internal control over financial reporting, or caused such internal control over financial reporting to be designed under our supervision, to provide reasonable assurance regarding the reliability of financial reporting and the preparation of financial statements for external purposes in accordance with generally accepted accounting principles;
(c) Evaluated the effectiveness of the registrant’s disclosure controls and procedures and presented in this report our conclusions about the effectiveness of the disclosure controls and procedures, as of the end of the period covered by this report based on such evaluation;
(d) Disclosed in this report any change in the registrant’s internal control over financial reporting that occurred during the registrant’s most recent fiscal quarter (the registrant’s fourth fiscal quarter in the case of an annual report) that has materially affected, or is reasonably likely to materially affect, the registrant’s internal control over financial reporting; and
5. The registrant’s other certifying officer and I have disclosed, based on our most recent evaluation of internal control over financial reporting, to the registrant’s auditors and the audit committee of the registrant’s board of directors (or persons performing the equivalent functions):
(a) All significant deficiencies and material weaknesses in the design or operation of internal control over financial reporting which are reasonably likely to adversely affect the registrant’s ability to record, process, summarize and report financial information; and
(b) Any fraud, whether or not material, that involves management or other employees who have a significant role in the registrant’s internal control over financial reporting.
| Dated: May ___, 2012 | By: | |
| Name: | Weiping Wang | |
| Title: | Chief Financial Officer (Principal Accounting and Financial Officer) |
Exhibit 32.1
WRITTEN STATEMENT PURSUANT TO 18 USC. SECTION 1350
In connection with the Annual Report of China 3C Group and its subsidiaries (the “Company”) on Form 10-K/A for the year ended December 31, 2010 as filed with the Securities and Exchange Commission on the date hereof (the “Report”), the undersigned, Zhenggang Wang, Chief Executive Officer of the Company certifies, pursuant to 18 USC. Section 1350, as adopted pursuant to Section 906 of the Sarbanes-Oxley Act of 2002, that:
(1) The Report fully complies with the requirements of Section 13a-14(b) or 15d-14(b) of the Securities Exchange Act of 1934; and
(2) The information contained in the Report fairly presents, in all material respects, the financial condition and results of operations of the Company.
| Dated: May ___, 2012 | By: | |
| Name: | Zhenggang Wang | |
| Title: | Chief Executive Officer and Chairman (Principal Executive Officer) |
Exhibit 32.2
WRITTEN STATEMENT PURSUANT TO 18 USC. SECTION 1350
In connection with the Annual Report of China 3C Group and its subsidiaries (the “Company”) on Form 10-K/A for the period ended December 31, 2010 as filed with the Securities and Exchange Commission on the date hereof (the “Report”), the undersigned, Jian Zhang, Chief Financial Officer of the Company certifies, pursuant to 18 USC. Section 1350, as adopted pursuant to Section 906 of the Sarbanes-Oxley Act of 2002, that:
(1) The Report fully complies with the requirements of Section 13a-14(b) or 15d-14(b) of the Securities Exchange Act of 1934; and
(2) The information contained in the Report fairly presents, in all material respects, the financial condition and results of operations of the Company.
| Dated: May ___, 2012 | By: | |
| Name: | Weiping Wang | |
| Title: | Chief Financial Officer (Principal Accounting and Financial Officer) |
Annex B
UNITED STATES
SECURITIES AND EXCHANGE COMMISSION
WASHINGTON, D.C. 20549
FORM 10-Q/A
(Amendment No. 1)
QUARTERLY REPORT PURSUANT TO SECTION 13 OR 15(d) OF THE SECURITIES EXCHANGE ACT OF 1934
For the quarterly period ended March 31, 2011
or
TRANSITION REPORT PURSUANT TO SECTION 13 OR 15(d) OF THE SECURITIES EXCHANGE ACT OF 1934
For the transition period from ____ to _____
Commission File Number: 000-28767
China 3C Group
(Exact name of registrant as specified in its charter)
| Nevada | 88-0403070 |
(State or other jurisdiction of incorporation or organization) | (I.R.S. Employer Identification No.) |
368 HuShu Nan Road
HangZhou City, Zhejiang Province, China 310014
(Address of Principal Executive Offices) (Zip Code)
086-0571-88381700
(Registrant’s telephone number, including area code)
(Former name, former address and former fiscal year, if changed since last report)
Indicate by check whether the issuer (1) has filed all reports required to be filed by Section 13 or 15(d) of the Securities Exchange Act of 1934 during the preceding 12 months (or for such shorter period that the registrant was required to file such reports), and (2) has been subject to such filing requirements for the past 90 days:
Yes x No¨
Indicate by check mark whether the registrant has submitted electronically and posted on its corporate Web site, if any, every Interactive Data File required to be submitted and posted pursuant to Rule 405 of Regulation S-T (§232.405 of this chapter) during the preceding 12 months (or for such shorter period that the registrant was required to submit and post such files). Yes¨ No¨
Indicate by check mark whether the registrant is a large accelerated filer, an accelerated filer, a non-accelerated filer, or a smaller reporting company. See the definitions of “large accelerated filer,” “accelerated filer” and “smaller reporting company” in Rule 12b-2 of the Exchange Act.
Large accelerated filer¨ | Accelerated filer¨ | Non-accelerated filer x (Do not check if a smaller reporting company) | Smaller reporting company¨ |
Indicate by check mark whether the registrant is a shell company (as defined in Rule No 12b-2 of the Exchange Act). Yes ¨ No x
As of June 20, 2011, the registrant had 58,511,327 shares of common stock outstanding.
EXPLANATORY NOTE
This Amendment No. 1 to our Quarterly Report on Form 10-Q/A ("Form 10-Q/A") is being filed to amend our Quarterly Report on 10-Q for the period ended March 31, 2011 ("Form 10-Q"), which was originally filed with the Securities and Exchange Commission (the "SEC") on June 11, 2011. We are filing this amendment to include disclosure consistent with comments received by the SEC. We are amending and restating Items 1, 2, and 4 in this Form 10-Q/A.
Below is a summary of these errors and the related corrections:
| · | The Company reclassified fees paid to department stores from a contra revenue account to selling, general and administrative expenses. The amount of $1,206 and $1,260 were previously classified in contra-revenue account as a deduction to net sales for the three months ended March 31, 2011 and 2010. The Company moved the amount to selling expenses, and it is reported as selling, general and administrative expenses in the statement of operations and comprehensive loss. The reclassification caused a $1,206 increase in net sales from $37,887 to $39,093 and a corresponding increase of $1,206 in Selling, general and administrative expenses from $6,065 to $7,271 in the first quarter 2011; a $1,260 increase in net sales from $40,798 to $42,058 and a corresponding increase of $1,260 in Selling, general and administrative expenses from $5,214 to $6,474 in the first quarter 2010. The gross profit increased $1,206 and $1,260 respectively in the first quarter 2011 and 2010. The loss from operations and net loss remained unchanged. The impact of the restatement was limited to the presentation of the consolidated statements of operations and comprehensive income (loss). The consolidated balance sheets, the consolidated statements of stockholders’ equity and the related consolidated statements of cash flows remained unaffected. See changes in Item 1. |
| · | The Company amended Item 1 and 2 to clarify the fact that Capital did not sell its equity ownership in Zhejiang upon executing the contractual agreements in 2007. Capital remains as the owner of 100% equity of Zhejiang through shareholding entrustment agreements. |
| · | The restatement above also affected the disclosure of segment reporting. As a result, we have amended Item 1, Note 15 - SEGMENT INFORMATION and Item 2. MANAGEMENT’S DISCUSSION AND ANALYSIS OF FINANCIAL CONDITION AND RESULTS OF OPERATIONS. |
| · | The Company amended Item 4 revising our conclusions on the effectiveness of disclosure controls and procedures to “ineffective.” |
In addition, this Form 10-Q/A contains new certifications by our Chief Executive Officer and our Chief Financial Officer, filed as exhibits hereto.
TABLE OF CONTENTS
| PAGE | ||
| PART I. FINANCIAL INFORMATION | 3 | |
| Item 1. Financial Statements | 3 | |
| Consolidated Balance Sheets as of March 31, 2011 (Unaudited) and December 31, 2010 | 3 | |
| Consolidated Statements of Operations and Comprehensive Loss for the Three Months Ended March 31, 2011 and 2010 (Unaudited) | 4 | |
| Consolidated Statements of Cash Flows for the Three Months Ended March 31, 2011 and 2010 (Unaudited) | 5 | |
| Notes to Consolidated Financial Statements | 6 | |
| Item 2. Management’s Discussion and Analysis of Financial Condition and Results of Operations | 20 | |
| Item 4. Controls and Procedures | 27 | |
| PART II. OTHER INFORMATION | 28 | |
| Item 6. Exhibits | 28 | |
| Signatures | 28 |
| 2 |
PART I. FINANCIAL INFORMATION
Item 1. Financial Statements
CHINA 3C GROUP AND SUBSIDIARIES
CONSOLIDATED BALANCE SHEETS
(in thousands)
| March 31, | December 31, | |||||||
| 2011 | 2010 | |||||||
| (Unaudited) | (Audited) | |||||||
| ASSETS | ||||||||
| Current assets: | ||||||||
| Cash and equivalents | $ | 18,381 | $ | 26,249 | ||||
| Accounts receivable, net | 13,100 | 11,026 | ||||||
| Inventories | 7,571 | 7,284 | ||||||
| Advances to suppliers | 2,214 | 2,201 | ||||||
| Taxes receivable | 1,208 | 1,200 | ||||||
| Prepaid expenses and other current assets | 271 | 591 | ||||||
| Total current assets | 42,745 | 48,551 | ||||||
| Property, plant and equipment, net | 167 | 191 | ||||||
| Intangible asset, net | 13,146 | 13,153 | ||||||
| Goodwill | 11,229 | 11,229 | ||||||
| Refundable deposits | 5 | 7 | ||||||
| Total assets | $ | 67,292 | $ | 73,131 | ||||
| LIABILITIES AND STOCKHOLDERS' EQUITY | ||||||||
| Current liabilities: | ||||||||
| Accounts payable | $ | 4,180 | $ | 4,139 | ||||
| Accrued expenses | 1,648 | 4,536 | ||||||
| Income tax payable | 770 | 736 | ||||||
| Total liabilities | 6,598 | 9,411 | ||||||
| Stockholders' equity | ||||||||
| Common stock, $0.001 par value, 100,000,000 million shares authorized, 58,511,327 and 54,831,327 issued and outstanding as of March 31, 2011 and December 31, 2010, respectively | 59 | 55 | ||||||
| Additional paid-in capital | 21,203 | 20,252 | ||||||
| Subscription receivable | (50 | ) | (50 | ) | ||||
| Statutory reserve | 11,543 | 11,543 | ||||||
| Other comprehensive income | 6,952 | 6,706 | ||||||
| Retained earnings | 20,987 | 25,214 | ||||||
| Total stockholders' equity | 60,694 | 63,720 | ||||||
| Total liabilities and stockholders' equity | $ | 67,292 | $ | 73,131 | ||||
The accompanying notes are an integral part of these consolidated financial statements.
| 3 |
CHINA 3C GROUP AND SUBSIDIARIES
CONSOLIDATED STATEMENTS OF OPERATIONS AND COMPREHENSIVE LOSS
THREE MONTHS ENDED MARCH 31, 2011 and 2010 (UNAUDITED)
(in thousands)
2011 (restated) | 2010 (restated) | |||||||
| Net sales | $ | 39,093 | $ | 42,058 | ||||
| Cost of sales | 36,063 | 37,433 | ||||||
| Gross profit | 3,030 | 4,625 | ||||||
| Selling, general and administrative expenses | 7,271 | 6,474 | ||||||
| Loss from operations | (4,241 | ) | (1,849 | ) | ||||
| Other (income) expense | ||||||||
| Interest income | (20 | ) | (25 | ) | ||||
| Other income | (1 | ) | (4 | ) | ||||
| Other expense | 149 | - | ||||||
| Total other (income) expense | 128 | (29 | ) | |||||
| Loss before income taxes | (4,369 | ) | (1,820 | ) | ||||
| Provision for income taxes | 90 | 107 | ||||||
| Net loss | $ | (4,459 | ) | $ | (1,927 | ) | ||
| Foreign currency translation adjustments | 246 | 8 | ||||||
| Comprehensive loss | $ | (4,213 | ) | $ | (1,919 | ) | ||
| Net loss available to common shareholders per share: | ||||||||
| Basic and Diluted | $ | (0.08 | ) | $ | (0.04 | ) | ||
| Weighted average shares outstanding: | ||||||||
| Basic and Diluted | 58,511,327 | 53,374,016 | ||||||
The accompanying notes are an integral part of these consolidated financial statements.
| 4 |
CHINA 3C GROUP AND SUBSIDIARIES
CONSOLIDATED STATEMENTS OF CASH FLOWS
THREE MONTHS ENDED MARCH 31, 2011 and 2010 (UNAUDITED)
(in thousands)
| 2011 | 2010 | |||||||
| CASH FLOWS FROM OPERATING ACTIVITIES | ||||||||
| Net loss | $ | (4,459 | ) | $ | (1,927 | ) | ||
| Adjustments to reconcile net loss to net cash used in operating activities: | ||||||||
| Depreciation | 24 | 29 | ||||||
| Amortization of intangible assets | 351 | 345 | ||||||
| Stock based compensation | 609 | 125 | ||||||
| (Increase) / decrease in assets: | ||||||||
| Accounts receivable | (1,997 | ) | 254 | |||||
| Other receivables | 129 | 13 | ||||||
| Inventories | (240 | ) | (862 | ) | ||||
| Prepaid expenses and other current assets | 194 | 35 | ||||||
| Refundable deposits | 2 | 3 | ||||||
| Advance to suppliers | 2 | 96 | ||||||
| (Increase) / decrease in current liabilities: | ||||||||
| Advance from customers | - | 23 | ||||||
| Accounts payable | 15 | 154 | ||||||
| Accrued expenses | (2,906 | ) | (927 | ) | ||||
| Income tax payable | 28 | 34 | ||||||
| Net cash used in operating activities | (8,248 | ) | (2,605 | ) | ||||
| Effect of exchange rate changes on cash and equivalents | 380 | (47 | ) | |||||
| Net decrease in cash | (7,868 | ) | (2,652 | ) | ||||
| Cash and equivalents, beginning of period | 26,249 | 29,908 | ||||||
| Cash and equivalents, end of period | $ | 18,381 | $ | 27,256 | ||||
| Supplemental disclosure of cash flow information: | ||||||||
| Interest paid | $ | - | $ | - | ||||
| Income taxes paid | $ | 57 | $ | 69 | ||||
The accompanying notes are an integral part of these consolidated financial statements.
| 5 |
CHINA 3C GROUP AND SUBSIDIARIES
NOTES TO CONSOLIDATED FINANCIAL STATEMENTS
MARCH 31, 2011 (UNAUDITED)
Note 1 -ORGANIZATION
China 3C Group (the “Company” or “China 3C”) was incorporated on August 20, 1998 under the laws of the State of Nevada. Capital Future Developments Limited - BVI (“Capital”) was incorporated on July 22, 2004 under the laws of the British Virgin Islands (“BVI”). Zhejiang Yong Xin Digital Technology Company Limited (“Zhejiang”), Yiwu Yong Xin Communication Limited (“Yiwu”), Hangzhou Wang Da Electronics Company Limited (“Wang Da”), Hangzhou Sanhe Electronic Technology Limited (“Sanhe”), and Shanghai Joy & Harmony Electronics Company Limited (“Joy & Harmony”), Jinhua Baofa Logistic Ltd (“Jinhua”) were incorporated under the laws of Peoples Republic of China (“PRC”) on July 11, 2005, July 18, 1997, March, 30, 1998, April 12, 2004, August 20, 2003 and December 27, 2001, respectively. All dollar amounts are in thousands, unless otherwise indicated.
On December 21, 2005, Capital became a wholly owned subsidiary of China 3C through a reverse merger (the “Merger Transaction”). China 3C acquired all of the issued and outstanding capital stock of Capital pursuant to a Merger Agreement dated December 21, 2005 by and among China 3C , XY Acquisition Corporation, Capital and the shareholders of Capital (the “Merger Agreement”). Pursuant to the Merger Agreement, Capital became a wholly owned subsidiary of China 3C and, in exchange for the Capital shares, China 3C issued 35,000,000 shares of its common stock to the shareholders of Capital, representing 93% of the issued and outstanding capital stock of China 3C at that time and cash of $500.
On August 3, 2006, Capital completed the acquisition of 100% of the equity of Sanhe in exchange for a combination of cash and stock transaction valued at $8,750 in aggregate (consisted of 915,751 newly issued shares of the Company’s common stock and $5,000 in cash).
On November 28, 2006, Capital completed the acquisition of 100% of the equity of Joy & Harmony in exchange for a combination of cash and stock valued at $18,500 in aggregate (consisted of 2,723,110 shares of the Company’s common stock and $7,500 in cash).
On August 15, 2007, we executed a series of contractual agreements between Capital and Zhejiang. The contractual agreements give Capital and its equity owners an obligation, and having ability to absorb, any losses, and rights to receive returns; however, these contractual agreements did not change the equity ownership of Zhejiang. We did not dispose Capital’s actual equity ownership of Zhejiang when we execute the contractual agreements. Capital entered into share-holding entrustment agreements with five individuals - Zhenggang Wang, Yimin Zhang, Huiyi Lv, Xiaochun Wang and Zhongsheng Bao to hold 35%, 20%, 20%, 15% and 10%, respectively, of the equity interest of Zhejiang on behalf of Capital on November 21, 2005. The entrustment agreements confirm that Capital is the actual owner of Zhejiang. Capital enjoys the actual shareholder’s rights and has the right to obtain any benefits received by the nominal holders. Zhenggang Wang is the CEO and shareholder of China 3C Group. Yimin Zhang, Huiyi Lv, Xiaochun Wang and Zhongsheng Bao have no other relationship with China 3C Group. No consideration was given to these individuals who held the equity of Zhejiang on behalf of Capital.
On July 6, 2009, China 3C and its subsidiary Zhejiang and Yiwu purchased 100% of Jinhua for RMB 120 million (approximately $17,500) in cash. Zhejiang acquired 90% and Yiwu acquired 10% of the equity interests in Jinhua.
Following the acquisition of Jinhua, the Company began providing logistic service to businesses in addition to its traditional business of resale and distribution of third party products such as mobile phones, facsimile machines, DVD players, stereos, speakers, MP3 and MP4 players, iPods, electronic dictionaries, CD players, radios and audio systems.
| 6 |
ORGANIZATIONAL CHART

Note 2 -SUMMARY OF SIGNIFICANT ACCOUNTING POLICIES
Basis of Presentation
The accompanying consolidated financial statements were prepared in conformity with accounting principles generally accepted in the United States of America (“US GAAP”). The Company’s functional currency is the Chinese Renminbi (“RMB”), however, the accompanying consolidated financial statements have been translated and presented in United States Dollars (“$”, or “USD”).
Principles of Consolidation
The consolidated financial statements include the accounts of China 3C and its wholly owned subsidiaries Capital, Wang Da, Yiwu, Joy & Harmony, Sanhe and Jinhua and variable interest entity Zhejiang, collectively referred to as the Company, unless the context indicates otherwise. All material intercompany accounts, transactions and profits were eliminated in consolidation.
| 7 |
Reclassifications
Certain prior period amounts were reclassified to conform to current period presentation, none of which changed total assets, liabilities, stockholder’s equity, net loss, or net loss per share.
Currency Translation
The accounts of Zhejiang, Wang Da, Yiwu, Sanhe, Joy & Harmony and Jinhua were maintained, and its financial statements were expressed, in RMB. Such financial statements were translated into USD in accordance with FASB ASC 830-10, “Foreign Currency Translation,” with the RMB as the functional currency. According to FASB ASC Topic 830-10, assets and liabilities were translated at the ending exchange rate, stockholders’ equity is translated at the historical rates and income statement items are translated at the average exchange rate for the period. The resulting translation adjustments are reported as other comprehensive income in accordance with FASB ASC Topic 220, “Reporting Comprehensive Income,” as a component of shareholders’ equity. Transaction gains and losses are reflected in the consolidated income (loss) and comprehensive income (loss) statement.
Use of Estimates
The preparation of financial statements in conformity with US GAAP requires management to make estimates and assumptions that affect the reported amounts of assets and liabilities and disclosure of contingent assets and liabilities at the date of the financial statements and the reported amounts of revenues and expenses during the reporting period. Actual results could differ from those estimates.
Risks and Uncertainties
The Company is subject to substantial risks from, among other things, intense competition associated with the industry in general, other risks associated with financing, liquidity requirements, rapidly changing customer requirements, limited operating history, foreign currency exchange rates and the volatility of public markets.
Contingencies
Certain conditions may exist as of the date the financial statements are issued, which could result in a loss to the Company but which will only be resolved when one or more future events occur or fail to occur. The Company’s management assesses such contingent liabilities, and such assessment inherently involves an exercise of judgment. In assessing loss contingencies related to legal proceedings that are pending against the Company or unasserted claims that may result in such proceedings, the Company’s management evaluates the perceived merits of any legal proceedings or unasserted claims as well as the perceived merits of the amount of relief sought or expected to be sought.
If the assessment of a contingency indicates that it is probable that a material loss has been incurred and the amount of the liability can be estimated, then the estimated liability is accrued in the Company’s financial statements. If the assessment indicates that a potential material loss contingency is not probable but is reasonably possible, or is probable but cannot be estimated, then the nature of the contingent liability, together with an estimate of the range of possible loss if determinable and material would be disclosed.
Loss contingencies considered to be remote by management are generally not disclosed unless they involve guarantees, in which case the guarantee would be disclosed.
| 8 |
Accounts Receivable
The Company maintains reserves for potential credit losses on accounts receivable. Management reviews the composition of accounts receivable and analyzes historical bad debts, customer concentrations, customer credit worthiness, current economic trends and changes in customer payment patterns to evaluate the adequacy of these reserves. Terms of the sales vary. Reserves are recorded primarily on a specific identification basis. Allowance for doubtful debts was $589 (unaudited) and $441 as of March 31, 2011 and December 31, 2010, respectively.
Inventories
Inventories are valued at the lower of cost (determined on a weighted average basis) or market value. Management compares the cost of inventories with the market value and allowance is made for writing down their inventories to market value, if lower. As of March 31, 2011 and December 31, 2010, inventory consisted entirely of finished goods valued at $7,571 (unaudited) and $7,284, respectively.
Property, Plant and Equipment, net
Property, plant and equipment are stated at cost. Expenditures for maintenance and repairs are charged to earnings as incurred; additions, renewals and betterments are capitalized. When property and equipment are retired or otherwise disposed of, the related cost and accumulated depreciation are removed from the respective accounts, and any gain or loss is included in operations. Depreciation of property and equipment is provided using the straight-line method for substantially all assets with estimated lives of:
| Automotive | 5 years |
| Office Equipment | 5 years |
As of March 31, 2011 and December 31, 2010, property and equipment consisted of the following:
| 2011 | 2010 | |||||||
| (Unaudited) | ||||||||
| Automotive | $ | 738 | $ | 738 | ||||
| Office equipment | 195 | 195 | ||||||
| Leasehold improvement | 65 | 65 | ||||||
| Plant and Equipment | 3 | 3 | ||||||
| Sub Total | 1,001 | 1,001 | ||||||
| Less: accumulated depreciation | (834 | ) | (810 | ) | ||||
| Total | $ | 167 | $ | 191 | ||||
Long-Lived Assets
The Company periodically evaluates the carrying value of long-lived assets to be held and used in accordance with FASB ASC 360 “Property, Plant and Equipment”, which requires impairment losses to be recorded on long-lived assets used in operations when indicators of impairment are present and the undiscounted cash flows estimated to be generated by those assets are less than the assets’ carrying amounts. In that event, a loss is recognized based on the amount by which the carrying amount exceeds the fair market value of the long-lived assets. Losses on long-lived assets to be disposed of are determined in a similar manner, except that fair market values are reduced for the cost of disposal. Based on its review, the Company believes that, as of March 31, 2011 (unaudited) and December 31, 2010, there were no significant impairments of its long-lived assets.
| 9 |
Fair Value of Financial Instruments
FASB ASC Topic 825 “Financial Instruments” requires that the Company disclose estimated fair values of financial instruments. The carrying amounts reported in the statements of financial position for current assets and current liabilities qualifying as financial instruments are a reasonable estimate of fair value.
Impairment of Goodwill
In accordance with ASC 350,we test goodwill at the reporting unit level for impairment on an annual basis. Reporting units are determined based on the Company's operating segments.
Revenue Recognition
In accordance with Securities and Exchange Commission (“SEC”) Staff Accounting Bulletin (“SAB”) 104, the Company recognizes revenues when there is persuasive evidence of an arrangement, product delivery and acceptance have occurred, the sales price is fixed and determinable, and collectability of the resulting receivable is reasonably assured.
The Company records revenues when title and the risk of loss pass to the customer. Generally, these conditions occur on the date the customer takes delivery of the product. Revenue is generated from sales of China 3C products through two main revenue streams:
| 1. | Retail. 68.7% and 69.2% of the Company's revenue came from sales to individual customers at outlets installed inside department stores etc. (i.e. store in store model) during the first three months of 2011 and 2010, respectively, and was mainly achieved through two broad categories: |
| a. | Purchase contracts. Sales by purchase contracts have terms of thirty days from the transfer of goods to the customer. Under this method, the Company delivers goods to places designated by the customers and receives confirmation of delivery. At that time, ownership and all risks associated to the goods are transferred to the customers and payment is made within 30 days. The Company relieves its inventory and recognizes revenue upon receipt of confirmation from the customer. |
| b. | Point of sale transfer of ownership. Under this method, the Company’s products are placed in third party stores and sold by the Company’s sales people. Upon purchase of the item by the customer, the Company relieves its inventory and recognizes revenue related to that item. |
| 2. | Wholesale. 31.3% and 30.8% of the Company's revenue came from wholesale during the first three months of 2011 and 2010, respectively. Recognition of income in wholesales is based on the contract terms. The main contract terms on wholesale agreed that payments be paid 15 days after receipt of goods and that ownership and all risks associated with the goods are transferred to the customers on the date of goods received and payments will be made 15 days therefrom. |
Sales revenue is therefore recognized on the following basis:
| 1. | Store in store model: |
| a. | For goods sold under sales and purchase contracts, revenue is recognized when goods are received by customers. |
| 10 |
| b. | For goods at customer outlets which the Company’s sales people operate, and inventory of goods is under joint control by the customers and the Company, revenue is recognized at the point of sale to the end buyer. |
During public holidays or department store celebration periods, we provide certain sales incentives to retail customers to increase sales, such as gift giving and price reductions. These are the only temporary incentives during the specified periods. Sales made to our retail customers as a result of incentives are immaterial as a percentage of total sales revenue.
| 2. | Wholesale: |
| a. | Revenue is recognized at the date of goods are received by wholesale customers. We operate our wholesale business by selling large volume orders to second-tier distributors and large department stores. Revenues from wholesale are recognized as net sales after confirmation with distributors. Net sales already take into account revenue dilution as they exclude inventory credit, discount for early payment, product obsolescence and return of products and other allowances. Net sales also take into account the return of products in accordance with relevant laws and regulations in China. |
Return policies
Our return policy complies with China’s laws and regulations on consumer’s rights and product quality. In accordance with Chinese law, consumers can return or exchange used products within seven days only if the goods do not meet safety and health requirements, endanger a person’s property, or do not meet the advertised performance. If the conditions and requirements as set out in the relevant laws and regulations are met, the retail stores are entitled to accept a return of the goods from the consumer. In such cases, the Company shall accept the returns unconditionally. Goods returned will be redirected to the production factory or supplier who shall bear all losses on the returns in accordance the laws and regulations. Consumer returns or exchanges of products that have not been used, where the packaging has not been damaged, are honored if such return or exchange is within seven days. If a consumer returns a product, the Company must refund the invoice price to the consumer. The Company will then be responsible for returning the goods to the production factory or supplier. At that time the Company can recover the price based on the purchase and sale contract with the producer or supplier. However, when goods are returned, the Company loses the gross profit margin that it records when revenue is recognized, regardless of whether the production factory or supplier takes the product back or not.
The return rights granted to wholesale customers are similar to the rights granted to retail customers. Once wholesale customers purchase the products, they follow the same return policy as retail customers. We do not honor any return from wholesale customers other than if the products don’t meet laws and regulations or quality requirements. If the wholesale customers have a high inventory level or product obsolescence caused by lower market demands or other operational issues, the wholesale customers bear their own losses. When a wholesale customer returns products, the Company will return the products to the suppliers or manufacturers. A sales return and allowance is recorded at the sales price. Meanwhile, a purchase return and allowance entry is recorded at the invoice price because the suppliers or manufacturers bear the losses. The net effect is that the Company derecognizes the gross profit when a return takes place, but does not record any loss on the cost of the returned item back to the supplier or manufacturer.
In light of the aforesaid PRC laws and regulations and the Company's arrangements with suppliers, we do not provide an accrual for any estimated losses on subsequent sale of the return of products. As a result we do not engage in assessing levels of inventory in the distribution channel, product obsolescence and/or introductions of new products, as none of those factors have any impact on us with respect to estimating losses on subsequent sale of returned goods. Third party market research report and consumer demand study is not used to make estimates of goods returned.
| 11 |
Cost of Sales
Cost of sales consists of actual product cost, which is the purchase price of the product less any discounts. Cost of sales excludes freight charges, purchase and delivery costs, internal transfer, freight charges and the other costs of the Company’s distribution network, which are identified in general and administrative expenses.
General and Administrative Expenses
General and administrative expenses are comprised principally of payroll and benefits costs for retail and corporate employees, occupancy costs of corporate facilities, lease expenses, management fees, traveling expenses and other operating and administrative expenses, including freight charges, purchase and delivery costs, internal transfer freight charges and other distribution costs.
Shipping and handling fees
The Company follows FASB ASC 605-45, “Handling Costs, Shipping Costs”. The Company does not charge its customers for shipping and handling. The Company classifies shipping and handling fees as part of General and administrative expenses. During the three months ended March 31, 2011 and 2010, the Company incurred shipping and handling fees and costs of $53 and $51, respectively.
Vendor Discounts
The Company has negotiated preferred pricing arrangements with certain vendors on certain products. These arrangements are not contingent on any levels of volume and are considered vendor discounts as opposed to rebates. The Company records these discounts along with the purchase of the discounted items, resulting in lower inventory cost and a corresponding lower cost of sales as the products are sold.
Management fees paid to the department stores under “store in store” model
Under the “store in store” business operation model, the Company may pay management fees to the department stores, which are in the form of service charges. The management fees are reflected in general and administrative expenses. Such management fees were $1,467 and $1,396 in general and administrative expenses during the three months ended March 31, 2011 and 2010, respectively.
Share Based Payment
The Company follows FASB ASC 718-10, “Stock Compensation”, which addresses the accounting for transactions in which an entity exchanges its equity instruments for goods or services, with a primary focus on transactions in which an entity obtains employee services in share-based payment transactions. ASC 718-10 requires measurement of the cost of employee services received in exchange for an award of equity instruments based on the grant-date fair value of the award (with limited exceptions). Incremental compensation costs arising from subsequent modifications of awards after the grant date must be recognized.
Advertising
Advertising expenses consist primarily of costs of promotion for corporate image and product marketing and costs of direct advertising. The Company expenses all advertising costs as incurred. Advertising expense was $123 and $86 for the three months ended March 31, 2011 and 2010, respectively.
| 12 |
Income Taxes
The Company utilizes FASB ASC Topic 740 “Income Taxes”. Deferred income taxes are recognized for the tax consequences in future years of differences between the tax bases of assets and liabilities and their financial reporting amounts at each period end based on enacted tax laws and statutory tax rates applicable to the periods in which the differences are expected to affect taxable income. Valuation allowances are established, when necessary, to reduce deferred tax assets to the amount expected to be realized.
Basic and Diluted (Loss) per Share
(Loss) per share are calculated in accordance with FASB ASC Topic 260, “Earnings per Share”. Basic earnings (loss) per share are based upon the weighted average number of common shares outstanding. Diluted earnings (losses) per share are based on the assumption that all dilutive convertible shares and stock options were converted or exercised. Dilution is computed by applying the treasury stock method. Under this method, options and warrants are assumed to be exercised at the beginning of the period (or at the time of issuance, if later), and as if funds obtained thereby were used to purchase common stock at the average market price during the period. If convertible shares and stock options are anti-dilutive, the impact of conversion is not included in the diluted net income (loss) per share. Excluded from the calculation of diluted (loss) per share for the three months ended March 31, 2011 and 2010 was 50,000 and 100,000 options, as they were not dilutive.
Statement of Cash Flows
In accordance with FASB ASC Topic 230 “Statement of Cash Flows”, cash flows from the Company’s operations are calculated based upon the functional currency, in our case the RMB. As a result, amounts related to changes in assets and liabilities reported on the statement of cash flows will not necessarily agree with the changes in the corresponding balances on the balance sheet.
Concentration of Credit Risk
Financial instruments that potentially subject the Company to concentrations of credit risk are cash, accounts receivable, advances to suppliers and other receivables arising from its normal business activities. The Company places its cash in what it believes to be credit-worthy financial institutions. The Company has a diversified customer base, most of which is in China. The Company controls credit risk related to accounts receivable through credit approvals, credit limits and monitoring procedures. The Company routinely assesses the financial strength of its customers and, based upon factors surrounding the credit risk, establishes an allowance, if required, for uncollectible accounts and, as a consequence, believes that its accounts receivable credit risk exposure beyond such allowance is limited.
Segment Reporting
FASB ASC Topic 280, “Segment Reporting” requires use of the “management approach” model for segment reporting. The management approach model is based on the way a company’s management organizes segments within the company for making operating decisions and assessing performance. Reportable segments are based on products and services, geography, legal structure, management structure, or any other manner in which management disaggregates a company. The Company operated in four segments before the acquisition of Jinhua in July 2009. Since the acquisition of Jinhua, the Company operates in five segments (see Note 14).
Recent Accounting Pronouncements
FASB ASC Topic 860 “Transfers and Servicing” requires more information about transfers of financial assets and where companies have continuing exposure to the risks related to transferred financial assets. ASC 860 is effective at the start of a company’s first fiscal year beginning after November 15, 2009, or January 1, 2010 for companies reporting earnings on a calendar-year basis. The adoption of this statement had no material effect on the Company’s financial statements.
| 13 |
Revisions under FASB ASC Topic 810 “Consolidation”, revises how a company determines when an entity that is insufficiently capitalized or is not controlled through voting (or similar rights) should be consolidated. Under ASC 810, determining whether a company is required to consolidate an entity will be based on, among other things, an entity’s purpose and design and a company’s ability to direct the activities of the entity that most significantly impact the entity’s economic performance. ASC 810 is effective at the start of a company’s first fiscal year beginning after November 15, 2009, or January 1, 2010 for companies reporting earnings on a calendar-year basis. The adoption of ASC 810 had no impact on our financial statements.
In June 2009, the FASB issued Accounting Standards Update “ASU” 2009-1. The FASB approved its Codification ASC as the single source of authoritative United States accounting and reporting standards applicable for all non-governmental entities, with the exception of the SEC and its staff. The Codification is effective for interim or annual financial periods ending after September 15, 2009 and impacts our financial statements as all future references to authoritative accounting literature will be referenced in accordance with the Codification. There were no changes to the content of our financial statements or disclosures as a result of implementing the Codification.
In April 2010, FASB issued ASU 2010-13,Compensation – Stock Compensation (Topic 718): Effect of Denominating the Exercise Price of a Share-Based Payment Award in the Currency of the Market in Which the Underlying Equity Security Trades. ASU 2010-13 provides guidance on the classification of a share-based payment award as either equity or a liability. A share-based payment that contains a condition that is not a market, performance, or service condition is required to be classified as a liability. ASU 2010-13 is effective for fiscal years, and interim periods within those fiscal years, beginning on or after December 15, 2010. The adoption of this statement did not have a significant impact on the Company’s financial statements.
In April 2010, the FASB issued ASU 2010-17, “Revenue Recognition—Milestone Method (Topic 605): Milestone Method of Revenue Recognition”.This Update provides guidance on the recognition of revenue under the milestone method, which allows a vendor to adopt an accounting policy to recognize all of the arrangement consideration that is contingent on the achievement of a substantive milestone (milestone consideration) in the period the milestone is achieved. The pronouncement is effective on a prospective basis for milestones achieved in fiscal years and interim periods within those years, beginning on or after June 15, 2010. The adoption of this ASU did not have a material impact on the Company’s consolidated financial statements.
In July 2010, the FASB issued ASU 2010-20, “Receivables (Topic 310): Disclosures about the Credit Quality of Financing Receivables and the Allowance for Credit Losses”.The amendments in this Update are to provide financial statement users with greater transparency about an entity’s allowance for credit losses and the credit quality of its financing receivables. The disclosures about activity that occurs during the reporting period are effective for interim and annual reporting periods beginning on or after December 15, 2010. The adoption of this statement did not have a significant impact on the Company’s financial statements.
Note 3 –ADVANCES TO SUPPLIERS
Advances to suppliers represent advance payments to suppliers for the purchase of inventory.
Note 4–ACCRUED EXPENSES
Accrued expenses as of March 31, 2011 (unaudited) and December 31, 2010 consist of the following:
| 14 |
| 2011 | 2010 | |||||||
| Accrued expenses and other payables | $ | 1,713 | $ | 4,512 | ||||
| VAT tax payable (receivable) | (89 | ) | 24 | |||||
| Advance from customers | 24 | - | ||||||
| Total | $ | 1,648 | $ | 4,536 | ||||
Note 5 -COMMON STOCK
On January 17, 2011, China 3C entered into a Registered Trademark Transfer Agreement to purchase the registered trademark, “Lotour.” The registered term of the trademark expires on July 6, 2020. The total consideration for the purchase of the trademark was RMB 2,280,000 (approximately $346), which was paid in the form of 1.08 million shares of the Company’s common stock, using a price of $0.32 per share.
On January 20, 2011, Zhejiang entered into a Design and Development Engagement Agreement to design and develop an electronic book product under the brand name “Lotour.” The total consideration for the design and development of the electronic book product is RMB 3,160,000 (approximately $480), which was paid in the form of 1.6 million shares of the Company’s common stock, using a price of $0.30 per share. The term of the Development Agreement is from January 20, 2011 to July 19, 2011.
Note 6 -STOCK WARRANTS, OPTIONS, AND COMPENSATION
Stock options— Options issued have a ten-year life and were fully vested upon issuance. The option holder has no voting or dividend rights. The grant price was the market price at the date of grant. The Company records the expense of the stock options over the related vesting period. The options were valued using the Black-Scholes option-pricing model at the date of grant stock option pricing.
Outstanding options by exercise price consisted of the following as of March 31, 2011.
| Options Outstanding | Options Exercisable | |||||||||||||||||||||
| Exercise Price | Number of Shares | Weighted Average Remaining Life (Years) | Weighted Average Exercise Price | Number of Shares | Weighted Average Exercise Price | |||||||||||||||||
| $ | 4.16 | 50,000 | 7.25 | $ | 4.16 | 50,000 | $ | 4.16 | ||||||||||||||
Note 7 -COMPENSATED ABSENCES
Regulation 45 of the labor laws in the PRC entitles employees to annual vacation leave after 1 year of service. In general all leave must be utilized annually, with proper notification. Any unutilized leave is cancelled.
Note 8 -INCOME TAXES
The Company, through its subsidiaries, Zhejiang, Wang Da, Sanhe, Joy & Harmony, Yiwu and Jinhua is governed by the Income Tax Laws of the PRC.
China 3C, which is a U.S. entity, is subject to the US Federal income tax at 34%. China 3C has incurred net accumulated operating losses of approximately $3,941 as of March 31, 2011 for income tax purposes. China 3C does not conduct any operations and only incurs expenses related to the public entity such as legal, accounting and investor relations, etc. Therefore, it is more likely than not that all of the Company’s deferred tax assets will not be realized. A 100% allowance was recorded on the deferred tax asset of approximately $1,340 as of March 31, 2011.
| 15 |
The Company’s policy is to recognize interest and penalties accrued on any unrecognized tax benefits as a component of income tax expense. The Company did not have any accrued interest or penalty associated with any unrecognized tax benefits, nor was any interest expense recognized during the three months ended March 31, 2011 and 2010.
Pursuant to the PRC Income Tax Laws, from January 1, 2008, the Enterprise Income Tax (“EIT”) is calculated against the net income in a fiscal year at a statutory rate of 25%.
The following details a reconciliation of income tax expense for the three months ended March 31, 2011 and 2010:
| 2011 | U.S. | State | International | Total | ||||||||||||
| Current | $ | - | $ | - | $ | 90 | $ | 90 | ||||||||
| Deferred | - | - | - | - | ||||||||||||
| Total | $ | - | $ | - | $ | 90 | $ | 90 | ||||||||
| 2010 | U.S. | State | International | Total | ||||||||||||
| Current | $ | - | $ | - | $ | 107 | $ | 107 | ||||||||
| Deferred | - | - | - | - | ||||||||||||
| Total | $ | - | $ | - | $ | 107 | $ | 107 | ||||||||
During the three months ended March 31, 2011, Wang Da, Sanhe, Joy & Harmony and Yiwu had operating losses and therefore no income tax expense. Yongxin was the only subsidiary having operating income and therefore had nominal income tax expenses of $71. Jinhua also incurred income tax expenses of $19 since it uses simplified tax, which imposes taxes on sales instead of operating income.
Reconciliation of the differences between the statutory US Federal income tax rate and the effective rate for the three months ended March 31, 2011 and 2010 is as follows:
| 2011 | 2010 | |||||||
| (Credit) tax at US statutory rate | (34.0 | )% | (34.0 | )% | ||||
| Tax rate difference | 7.6 | % | 9.0 | % | ||||
| Other | 1.6 | % | - | |||||
| Valuation allowance | 26.9 | % | 30.9 | % | ||||
| Effective rate | 2.1 | % | 5.9 | % | ||||
Note 9 -COMMITMENTS
The Company leases office facilities under operating leases that terminate through 2014. Rent expense for the three months ended March 31, 2011 and 2010 was $127 and $136, respectively. The future minimum obligations under these agreements are as follows by years as of March 31, 2011:
| 2012 | $ | 190 | ||
| 2013 | 74 | |||
| 2014 | 12 | |||
| $ | 276 |
| 16 |
Note 10 -STATUTORY RESERVE
In accordance with the laws and regulations of the PRC, a WFOE’s income, after the payment of the PRC income taxes, shall be allocated to the statutory surplus reserves and statutory public welfare fund. Prior to January 1, 2006, the proportion of allocation for reserve was 10 percent of the profit after tax to the surplus reserve fund and additional 5-10 percent to the public affair fund. The public welfare fund reserve was limited to 50 percent of the registered capital. Effective January 1, 2006, there is now only one fund requirement. The reserve is 10 percent of income after tax, not to exceed 50 percent of registered capital.
Statutory reserve funds are restricted for set off against losses, expansion of production and operation or increase in register capital of the respective company. Statutory public welfare fund is restricted to the capital expenditures for the collective welfare of employees. These reserves are not transferable to the Company in the form of cash dividends, loans or advances. These reserves are therefore not available for distribution except in liquidation. As of March 31, 2011, the Company had allocated $11,543 to these non-distributable reserve funds.
Note 11 -OTHER COMPREHENSIVE INCOME
The detail of other comprehensive income, all of which arose from foreign currency translation, as included in stockholders’ equity at March 31, 2011 (unaudited) and December 31, 2010 are as follows:
| Foreign Currency Translation Adjustment | Total Accumulated Other Comprehensive Income | |||||||
| Balance at January 1, 2009 | $ | 5,272 | $ | 5,272 | ||||
| Change for 2009 | (92 | ) | (92 | ) | ||||
| Balance at December 31, 2009 | $ | 5,180 | $ | 5,180 | ||||
| Change for 2010 | 1,526 | 1,526 | ||||||
| Balance at December 31, 2010 | $ | 6,706 | $ | 6,706 | ||||
| Change for three months ended March 31, 2011 | 246 | 246 | ||||||
| Balance at March 31, 2011 | $ | 6,952 | $ | 6,952 | ||||
Note 12 -CURRENT VULNERABILITY DUE TO CERTAIN RISK FACTORS
The Company’s operations are in the PRC. Accordingly, the Company’s business, financial condition and results of operations may be influenced by the political, economic and legal environments in the PRC, by the general state of the PRC’s economy. The Company’s business may be influenced by changes in governmental policies with respect to laws and regulations, anti-inflationary measures, currency conversion and remittance abroad, and rates and methods of taxation, among other things.
Note 13 -MAJOR CUSTOMERS AND CREDIT RISK
During the three months ended March 31, 2011 and 2010, no single customer accounted for more than 10% of the Company’s sales or accounts receivable and no single vendor accounted for more than 10% of the Company’s purchases.
| 17 |
Note 14 - SEGMENT INFORMATION
We separately operate and prepare accounting and other financial reports to management for five major business organizations: Wang Da, Sanhe, Yiwu, Joy & Harmony and Jinhua. Each operating company has different products and service. Wang Da sells mainly mobile phones, Sanhe sells mainly home appliances, Yiwu sells mainly office communication products, Joy & Harmony sells mainly consumer electronics and Jinhua provides transportation logistics to businesses. All segments are accounted for using the same principles as described in Note 2.
We identified five reportable segments required by FASB ASC Topic 280: (1) mobile phones, (2) home electronics, (3) office communication products, (4) consumer electronics and (5) logistics.
The following tables present summarized information by segment:
| Three Months Ended March 31, 2011 | ||||||||||||||||||||||||||||
| Mobile Phones | Home Electronics | Communication Products | Consumer Electronics | Logistics | Other | Total | ||||||||||||||||||||||
| Sales, net (restated) | $ | 11,586 | $ | 10,848 | $ | 4,243 | $ | 10,011 | $ | 2,202 | $ | 203 | $ | 39,093 | ||||||||||||||
| Cost of sales | 10,798 | 9,984 | 3,844 | 8,962 | 2,294 | 181 | 36,063 | |||||||||||||||||||||
| Gross profit (restated) | 788 | 864 | 399 | 1,049 | (92 | ) | 22 | 3,030 | ||||||||||||||||||||
| Income from operations (restated) | (745 | ) | (969 | ) | (345 | ) | (772 | ) | (441 | ) | (969 | ) | (4,241) | |||||||||||||||
| Three Months Ended March 31, 2010 | ||||||||||||||||||||||||||||
| Mobile Phones | Home Electronics | Communication Products | Consumer Electronics | Logistics | Other | Total | ||||||||||||||||||||||
| Sales, net (restated) | $ | 10,606 | $ | 11,367 | $ | 6,315 | $ | 10,895 | $ | 2,641 | $ | 234 | $ | 42,058 | ||||||||||||||
| Cost of sales | 9,731 | 10,077 | 5,671 | 9,696 | 2,045 | 213 | 37,433 | |||||||||||||||||||||
| Gross profit (restated) | 875 | 1,290 | 644 | 1,199 | 596 | 21 | 4,625 | |||||||||||||||||||||
Income from operations (restated) | (446 | ) | (516 | ) | (210 | ) | (508 | ) | 250 | (419 | ) | (1,849 | ) | |||||||||||||||
Total assets by segment as of March 31, 2011 (unaudited) and December 31, 2010 are as follows:
| Mobile Phones | Home Electronics | Communication Products | Consumer Electronics | Logistics | Other | Total | ||||||||||||||||||||||
| 2011 | $ | 10,103 | $ | 13,866 | $ | 9,566 | $ | 16,005 | $ | 16,723 | $ | 743 | $ | 67,292 | ||||||||||||||
| 2010 | $ | 10,993 | 14,988 | 9,967 | 18,536 | 15,837 | 2,810 | 73,131 | ||||||||||||||||||||
Note 15 - RESTATEMENT OF CONSOLIDATED STATEMENTS OF OPERATIONS AND COMPREHENSIVE INCOME (LOSS)
China 3C operates most of its retail operations through “store in store” model. Under this model, the Company leases space in major department stores and retailers. The Company does not pay the department stores fixed leasing costs. Instead, China 3C deducts a percentage of sales each month as compensation to the department stores. China 3C records such costs as “sales discount” as a deduction from net sales.
| 18 |
In response to the SEC comments of December 19, 2011, the Company reviewed “sales discount” and determined they should be reclassified as management fees. As a result, we reclassified “sales discount” from a contra revenue account to management fees as part of the selling, general and administrative expenses. The amount of $1,206 and $1,260 were previously classified in contra-revenue account as a deduction to net sales for the three months ended March 31, 2011 and 2010. The Company moved the amount to selling expenses, and it is reported as selling, general and administrative expenses in the statement of operations and comprehensive loss. The reclassification caused a $1,206 increase in net sales from $37,887 to $39,093 and a corresponding increase of $1,206 in Selling, general and administrative expenses from $6,065 to $7,271 in the first quarter 2011; a $1,260 increase in net sales from $40,798 to $42,058 and a corresponding increase of $1,260 in Selling, general and administrative expenses from $5,214 to $6,474 in the first quarter 2010. The gross profit increased $1,206 and $1,260 respectively in the first quarter 2011 and 2010. The loss from operations and net loss remained unchanged. The impact of the restatement was limited to the presentation of the consolidated statements of operations and comprehensive income (loss). The consolidated balance sheets, the consolidated statements of stockholders’ equity and the related consolidated statements of cash flows remained unaffected.
The table below summarizes the restatement changes to the consolidated statements of operations and comprehensive income (loss):
| Three months ended March 31, 2010 | ||||||||||||
| (as reported) | (as restated) | Change | ||||||||||
| Net sales | $ | 40,798 | $ | 42,058 | $ | 1,260 | ||||||
| Gross profit | 3,365 | 4,625 | 1,260 | |||||||||
| Selling, general and administrative expenses | 5,214 | 6,474 | 1,260 | |||||||||
| Three months ended March 31, 2011 | ||||||||||||
| (as reported) | (as restated) | Change | ||||||||||
| Net sales | $ | 37,887 | $ | 39,093 | $ | 1,206 | ||||||
| Gross profit | 1,824 | 3,030 | 1,206 | |||||||||
| Selling, general and administrative expenses | 6,065 | 7,271 | 1,206 | |||||||||
| 19 |
Item 2. Management’s Discussion and Analysis of Financial Condition and Results of Operations.
Forward Looking Statements
We have included and from time to time may make in our public filings, press releases or other public statements, certain statements, including, without limitation, those under “Management’s Discussion and Analysis of Financial Condition and Results of Operations” in Part II, Item 7. In some cases these statements are identifiable through the use of words such as “anticipate,” “believe,” “estimate,” “expect,” “intend,” “plan,” “project,” “target,” “can,” “could,” “may,” “should,” “will,” “would” and similar expressions. You are cautioned not to place undue reliance on these forward-looking statements. In addition, our management may make forward-looking statements to analysts, investors, representatives of the media and others. These forward-looking statements are not historical facts and represent only our beliefs regarding future events, many of which, by their nature, are inherently uncertain and beyond our control.
The following discussion should be read in conjunction with the Consolidated Financial Statements and Notes thereto appearing elsewhere in this Form 10-Q. The following discussion contains forward-looking statements. Our actual results may differ significantly from those projected in the forward-looking statements. Factors that may cause future results to differ materially from those projected in the forward-looking statements include, but are not limited to, those discussed in “Risk Factors” and elsewhere in this Form 10-Q.
Overview (All dollar amounts in thousands)
China 3C Group (including its subsidiaries unless the context indicates otherwise, “China 3C,” the “Company,” “we,” “us,” or “our”) was incorporated on August, 20, 1998 under the laws of the State of Nevada. Capital Future Developments Limited (“Capital”) was incorporated on July 22, 2004 under the laws of the British Virgin Islands. Zhejiang Yong Xin Digital Technology Company Limited (“Zhejiang”), Yiwu Yong Xin Communication Limited (“Yiwu”), Hangzhou Wandda Electronics Company Limited (“Wang Da”), Hangzhou Sanhe Electronic Technology, Limited (“Sanhe”), and Shanghai Joy & Harmony Electronic Development Company Limited (“Joy & Harmony”) were incorporated under the laws of the Peoples Republic of China (“PRC” or “China”) on July 11, 2005, July 18, 1997, March 30, 1998, April 12, 2004, and August 25, 2003, respectively. China 3C owns 100% of Capital and Capital own 100% of the capital stock of Joy & Harmony and Sanhe. Until August 14, 2007, when it made the change to its ownership structure described in the next paragraph in order to comply with certain requirements of PRC law, Capital owned 100% of the capital stock of Zhenjiang. Zhejiang owns 90% and Yiwu owns 10% of Wang Da. Zhejiang owns 90% and Wang Da owns 10% of Yiwu. On March 10, 2009 Zhejiang set up a new operating entity, Hangzhou Letong Digital Technology Co., Ltd. (“Letong”) to establish an electronic retail franchise operation for China 3C Group. On July 6, 2009, Zhejiang and Yiwu acquired Jinhua Baofa Logistic Limited (“Jinhua”). Jinhua was incorporated under the laws of PRC on December 27, 2001.
On December 21, 2005, Capital became a wholly owned subsidiary of China 3C through a merger with a wholly owned subsidiary of the Company (the “Merger Transaction”). China 3C acquired all of the issued and outstanding capital stock of Capital pursuant to a Merger Agreement dated at December 21, 2005 by and among China 3C, XY Acquisition Corporation, Capital and the shareholders of Capital (the “Merger Agreement”). Pursuant to the Merger Agreement, Capital became a wholly owned subsidiary of China 3C and, for the Capital shares, China 3C issued 35,000,000 shares of its common stock to the shareholders of Capital, representing 93% of the issued and outstanding capital stock of China 3C at that time and cash of $500. On August 15, 2007, we executed a series of contractual agreements between CFDL and Zhejiang. The contractual agreements give CFDL and its equity owners an obligation, and having ability to absorb, any losses, and rights to receive returns; however, these contractual agreements did not change the equity ownership of Zhejiang. We did not dispose CFDL’s actual equity ownership of Zhejiang when we execute the contractual agreements. CFDL entered into share-holding entrustment agreements with five individuals - Zhenggang Wang, Yimin Zhang, Huiyi Lv, Xiaochun Wang and Zhongsheng Bao to hold 35%, 20%, 20%, 15% and 10%, respectively, of the equity interest of Zhejiang on behalf of CFDL on November 21, 2005. The entrustment agreements confirm that CFDL is the actual owner of Zhejiang. CFDL enjoys the actual shareholder’s rights and has the right to obtain any benefits received by the nominal holders. Zhenggang Wang is the CEO and shareholder of China 3C Group. Yimin Zhang, Huiyi Lv, Xiaochun Wang and Zhongsheng Bao have no other relationship with China 3C Group. No consideration was given to these individuals who held the equity of Zhejiang on behalf of CFDL.
| 20 |
On August 3, 2006, Capital completed the acquisition of 100% of the equity of Sanhe in exchange for a combination of cash and stock transaction valued at $8,750 in aggregate (consisted of 915,751 newly issued shares of the Company’s common stock and $5,000 in cash).
On November 28, 2006, Capital completed the acquisition of 100% of the equity of Joy & Harmony in exchange for a combination of cash and stock valued at $18,500 in aggregate (consisted of 2,723,110 shares of the Company’s common stock and $7,500 in cash).
On July 6, 2009, Zhejiang and Yiwu acquired Jinhua, a company organized under the laws of the PRC. Zhejiang acquired 90% and Yiwu acquired 10% of the entire equity interests in Jinhua from the shareholders of Jinhua for RMB 120,000,000 (approximately $17,500) in cash.
Yiwu, Wangda, Sanhe and Joy & Harmony are engaged in the resale and distribution of third party products and generate approximately 100% of their revenue from resale of items such as mobile phones, facsimile machines, DVD players, stereos, speakers, MP3 and MP4 players, iPod, electronic dictionaries, CD players, radios, and audio systems. We sell and distribute products through retail stores and secondary distributors. We operate most of our retail operations through our “store in store” model. Under this model, the Company leases space in major department stores and retailers. Leasing costs can vary based on a percentage of sales, or can be fixed. In the three months ended March 31, 2011 and 2010, all of our stores in stores leases were variable based on sales.
In 2009, Zhejiang started establishing direct electronic retail stores and franchise operation. As of March 31, 2011, there are three direct stores and two franchise stores in operation.
Following the acquisition of Jinhua, the Company began providing logistical services to businesses in addition to its traditional business of resale and distribution of third party products such as mobile phones, facsimile machines, DVD players, stereos, speakers, MP3 and MP4 players, iPods, electronic dictionaries, CD players, radios and audio systems.
Results of Operations for the Three months Ended March 31, 2011 and 2010
Reportable Operating Segments
The Company reports financial and operating information in the following five segments:
| a) | Yiwu |
| b) | Wang Da |
| c) | Sanhe |
| d) | Joy & Harmony |
| e) | Jinhua |
| 21 |
| a) | Yiwu |
Yiwu focuses on the selling, circulation and modern logistics of fax machines and cord phone products.
| Three months ended March 31, | Percentage | |||||||||||
| Yiwu | 2011 (restated) | 2010 (restated) | Change (restated) | |||||||||
| Revenue | $ | 4,243 | $ | 6,315 | (32.8 | )% | ||||||
| Gross Profit | 399 | 644 | (38.0 | )% | ||||||||
| Gross Profit Margin | 9.4 | % | 10.2 | % | (0.8 | )% | ||||||
| Operating Loss | (345 | ) | (210 | ) | (64.3 | )% | ||||||
For the three months ended March 31, 2011, Yiwu generated revenue of $4,243, a decrease of $2,072 or 32.8% compared to $6,315 for the three months ended March 31, 2010. The decrease was a result of lower market demand for office appliances such as fax machines and telephones.
Gross profit decreased $245 or 38.0% from $644 for the three months ended March 31, 2010 to $399 for the three months ended March 31, 2011. Gross profit margin decreased 0.8% from 10.2% in the three months ended March 31, 2010 to 9.4% in the three months ended March 31, 2011. The decrease was a result of increased promotion events in the first quarter of 2011 to maintain market share. Lower gross profit margin was also due to shrinking demand. Since market demand decreased, Yiwu did not have the bargaining power to increase unit sales price as much as the increase in purchase costs of office appliances.
Operating loss was $345 for the three months ended March 31, 2011, an increase of $135 or 64.3% compared to $210 for the three months ended March 31, 2010. Operating loss increased primarily due to decreased gross profit, an increase in labor cost and management fees paid to department stores.
| b) | Wang Da |
Wang Da focuses on the selling, circulation and modern logistics of cell phones, cell phones products, and digital products, including digital cameras, digital camcorders, PDAs, flash disks, and removable hard disks.
| Three months ended March 31, | Percentage | |||||||||||
| Wang Da | 2011 (restated) | 2010 (restated) | Change (restated) | |||||||||
| Revenue | $ | 11,586 | $ | 10,606 | 9.2 | % | ||||||
| Gross Profit | 788 | 875 | (9.9 | )% | ||||||||
| Gross Profit Margin | 6.9 | % | 8.25 | % | (1.4 | )% | ||||||
| Operating Loss | (745 | ) | (446 | ) | (67.0 | )% | ||||||
For the three months ended March 31, 2011, Wang Da generated revenue of $11,586, an increase of $980 or 9.2% compared to $10,606 for the three months ended March 31, 2010. The increase in revenue was primarily due to a higher percentage of sales from international brands such as Nokia and Motorola, which usually have a higher unit price compared to domestic brands.
Gross profit decreased $87 or 9.9% from $875 for the three months ended March 31, 2010 to $788 for the three months ended March 31, 2011. Gross profit margin decreased from 8.3% in the three months ended March 31, 2010 to 6.9% in the three months ended March 31, 2011, a decrease of 1.4%. The decrease in gross profit and gross profit margin was due to the decrease in demand of domestic cell phones, which had a higher gross profit margin than brand name cell phones. Most domestic cell phones do not offer data service compared to brand name cell phones such as Nokia, Motorola and Samsung, which caused the demand for domestic cell phones to decrease.
| 22 |
Operating loss was $745 for the three months ended March 31, 2011, a decrease of $299 or 67.0% compared to $446 for the three months ended March 31, 2010. Operating income decreased primarily due to decreased gross profit and increased operating expenses including an increase in base salary for all staff and an increase in management fees paid to the department stores.
| c) | Sanhe |
Sanhe focuses on the selling, circulation and modern logistics of home electronics, including DVD players, audio systems, speakers, televisions and air conditioners.
| Three months ended March 31, | Percentage | |||||||||||
| Sanhe | 2011 (restated) | 2010 (restated) | Change (restated) | |||||||||
| Revenue | $ | 10,848 | $ | 11,367 | (4.6 | )% | ||||||
| Gross Profit | 864 | 1,290 | (33.0 | )% | ||||||||
| Gross Profit Margin | 8.0 | % | 11.4 | % | (3.4 | )% | ||||||
| Operating Loss | (969 | ) | (516 | ) | (87.8 | )% | ||||||
For the three months ended March 31, 2011, Sanhe generated revenue of $10,848, a decrease of $519 or 4.1% compared to $11,367 for the three months ended March 31, 2010. The decrease was a result of decline in market demand of DVD players and speakers.
Gross profit decreased $426 or 30.0% from $1,290 for the three months ended March 31, 2010 to $864 for the three months ended March 31, 2011. Gross profit margin decreased from 11.4% in 2010 to 8.0% in 2011, a decrease of 3.4%. The decrease was a result of higher sales volume of televisions in the first quarter of 2011 compared to higher sales in DVD players and speakers in the first quarter of 2010, which have higher gross profit margin compared to other home electronics products.
Operating loss was $969 for the three months ended March 31, 2011, an increase of $453 or 87.8% compared to $516 for the three months ended March 31, 2010. Operating loss increased primarily due to decreased gross profit and increased operating expenses including an increase in base salary for all staff and an increase in management fees paid to the department stores.
| d) | Joy & Harmony |
Joy & Harmony focuses on the selling, circulation and modern logistics of consumer electronics, including MP3 players, MP4 players, iPods, electronic dictionaries, and radios.
| Three months ended March 31, | Percentage | |||||||||||
| Joy & Harmony | 2011 (restated) | 2010 (restated) | Change (restated) | |||||||||
| Revenue | $ | 10,011 | $ | 10,895 | (8.1 | )% | ||||||
| Gross Profit | 1,049 | 1,199 | (12.5 | )% | ||||||||
| Gross Profit Margin | 10.5 | % | 11.0 | % | (0.5 | )% | ||||||
| Operating Loss | (772 | ) | (508 | ) | (52.0 | )% | ||||||
For the three months ended March 31, 2011, Joy & Harmony generated revenue of $10,011, a decrease of $884 or 8.1% compared to $10,895 for the three months ended March 31, 2010. Gross profit decreased $150 or 12.5% from $1,199 for the three months ended March 31, 2010 to $1,049 for the three months ended March 31, 2011. Gross profit margin decreased from 11.0% in 2010 to 10.5% in 2011, a decrease of 0.5%. The decrease in revenue was due to a lower demand for small digital products such as MP3 and MP4. The decrease in gross profit margin was primarily due to a higher percentage of sales from international brands, which usually have lower profit margin than domestic brands.
| 23 |
Operating loss was $772 for the three months ended March 31, 2011, an increase of $264 or 52.0% compared to $508 for the three months ended March 31, 2010. Operating loss increased primarily due to decreased gross profit and increased operating expenses including an increase in base salary for all staff and management fees paid to the department stores.
| e) | Jinhua |
Jinhua provides transportation service to business and transports freight, including electronics, machinery and equipment, metal products, chemical materials, garments and handicraft goods, in more than 20 cities in Eastern China. Its transportation services cover many of the most developed cities in Eastern China such as Shanghai, Hangzhou and Nanjing.
| Three months ended March 31, | Percentage | |||||||||||
| Jinhua | 2011 | 2010 | Change | |||||||||
| Revenue | $ | 2,202 | $ | 2,641 | (16.6 | )% | ||||||
| Gross Profit | (92 | ) | 596 | (115.4 | )% | |||||||
| Gross Profit Margin | (4.2 | )% | 22.6 | % | (26.7 | )% | ||||||
| Operating (Loss)/Income | (441 | ) | 250 | (276.4 | )% | |||||||
Revenue decreased from $2,641 for the three months ended March 31, 2010 to $2,202 for the three months ended March 31, 2011. Gross profit margin decreased 26.7% from 22.6% for the three months ended March 31, 2010 to (4.2)% for the three months ended March 31, 2011. The logistics industry is experiencing a downturn. While the fuel cost and labor cost continue to rise, and toll rates remain high, the price for transportation did not increase accordingly. Therefore, revenue and gross profit margin decreased. Operating income decreased primarily due to decreased gross profit margin. Higher operating expenses, labor cost in particular, also caused operating income to decrease.
Net Sales
Net sales for the three months ended March 31, 2011 decreased by 7.0%, to $39,093 (restated) compared to $42,058 (restated) for the three months ended March 31, 2010. Management believes the sales decrease was a result of various factors including a slowdown in the retail markets in general, weaker demand for consumer and business electronics as well as the pressure of increased competitions from supermarkets, internet commerce as well as increased TV shopping networks.
Cost of Sales
Cost of sales for the three months ended March 31, 2011 was $36,063 compared to $37,433 for the three months ended March 31, 2010, a decrease of 3.7%. The decreased cost of sales for the three months was a result of the decrease in sales from the comparable period. In addition, higher fuel cost and higher cost of consumer electronics also contributed to the increased cost of sales.
Gross Profit Margin
Gross profit margin for the three months ended March 31, 2011 was 7.8% (restated) compared to 11.0% (restated) for the three months ended March 31, 2010. The lower gross profit margin was primarily due to the decreased unit sales prices of consumer and business electronics in the competitive market in China. In addition, international brand name electronics represented a higher percentage of sales in the first three months of 2011 compared to 2010. The increased sales of brand name electronics led to lower gross profit margin since brand name electronics have lower gross profit margins compared to domestic products.. For the logistics segment, the decrease in gross profit margin was primarily due to increased fuel cost.
| 24 |
General and Administrative Expenses
General and administrative expenses for the three months ended March 31, 2011 were $7,271 (restated) or 18.6% of net sales, compared to $6,474 (restated) or 15.4% of net sales for the three months ended March 31, 2010, an increase of 3.2% of sales. The increase in general and administrative expenses for the first quarter was primarily due to an increase in labor cost.
Loss from Operations
Operating loss for the three months ended March 31, 2011 was $4,241 or 10.8% of net sales compared to $1,849 or 4.4% of net sales for the three months ended March 31, 2010, an increase of 129.3%. Lower sales, lower gross profit margin as well as increased operating expenses were the key factors for the increase in loss from operations during the three months ended March 31, 2011 compared to 2010.
Provision for Income Taxes
The provision for income taxes for the three months ended March 31, 2011 was $90 compared to $107 for the three months ended March 31, 2010. Income tax expense was not significant due to Yiwu, Wang Da, Joy & Harmony and Sanhe having losses in the three months of 2011 and 2010. Zhejiang was the only subsidiary having operating income and the amount was not significant in the three months of 2011 and 2010. In addition, although Jinhua had operating lossess, Jinhua still incurred nominal income tax expenses because Jinhua uses simplified tax system.
Net Loss
Net loss was $4,459 or 11.4% of net sales for the three months ended March 31, 2011 compared to $1,927 or 4.6% of net sales for the three months ended March 31, 2010, an increase of 131.4%. Decreased sales revenue, lower gross profit margin and higher operating expenses were the critical factors which contributed to the decrease in net income.
Liquidity and Capital Resources
Operations and liquidity needs are funded primarily through cash flows from operations. Cash and equivalents were $18,381 at March 31, 2011, compared to $27,256 at March 31, 2010, and compared to $26,249 at December 31, 2010.
We believe the funds available to us are adequate to meet our operating needs for the remainder of 2011.
Our cash flows for the three month periods are summarized as follows:
| Three months ended March 31, | ||||||||
| 2011 | 2010 | |||||||
| Net cash (used in) operating activities | $ | (8,248 | ) | $ | (2,605 | ) | ||
| Effect of exchange rate change on cash and equivalents | 380 | (47 | ) | |||||
| Net decrease in cash and equivalents | (7,868 | ) | (2,652 | ) | ||||
| Cash and equivalents at beginning of period | 26,249 | 29,908 | ||||||
| Cash and equivalents at end period | $ | 18,381 | $ | 27,256 | ||||
Operating Activities
Net cash used in operating activities was $8,248 for the three months ended March 31, 2011 compared to $2,605 for the three months ended March 31, 2010, a 216.7% increase. The increase was mainly attributable to several factors, including (i) net loss of $4,459; (ii) increase in accounts receivable of $1,997, (iii) decrease in accounts payable and accrued expenses of $2,891,offset by the decrease in prepaid expenses and other current asset of $194 in the three months ended March 31, 2011, and add back stock compensation of $609.
| 25 |
| Three months ended March 31, | ||||||||||||
| 2011 | 2010 | Percentage Change | ||||||||||
| Sales, Net | $ | 39,093 | $ | 42,058 | (7.0 | )% | ||||||
| Accounts receivable | $ | 13,100 | $ | 17,981 | (27.1 | )% | ||||||
Accounts receivable decreased 27.1% in the first quarter of 2011 while sales decreased 7.0%. Management monitors and periodically assesses the collectability of accounts receivable to ensure the allowance for bad debt account is reasonably estimated. Collection of debt is based on the terms of legal binding documents. Our account receivable department has periodically reviewed the allowance for doubtful accounts. The bad debt allowance is based on the aging of receivables, credit history and credit quality of the customers, the term of the contracts as well as the balance outstanding. If an account receivable item is considered probable to be uncollectible, it will be charged to bad debts immediately.
Capital Expenditures
We did not have any capital expenditure for the first three months of 2011 and 2010.
Working Capital Requirements
Historically operations and short term financing have been sufficient to meet our cash needs. We believe we will be able to generate revenues from sales and raise capital through private placement offerings of our equity securities to provide the necessary cash flow to meet anticipated working capital requirements. However, our working capital needs for the long and short term will depend upon numerous factors, including operating results, competition, and the availability of credit facilities, none of which can be predicted with certainty. Future expansion will be limited by the availability of financing products and raising capital.
Off-Balance Sheet Arrangements
We have never entered into any off-balance sheet arrangements and have never established any special purpose entities. We have not guaranteed any debt or commitments of other entities or entered into any options on non-financial assets.
Critical Accounting Policies
Our discussion and analysis of our financial condition and results of operations is based upon our consolidated financial statements, which have been prepared in accordance with accounting principles generally accepted in the United States. The preparation of these consolidated financial statements requires us to make estimates, judgments and assumptions that affect the reported amounts of assets, liabilities, revenues and expenses, and the related disclosure of contingent assets and liabilities. We base our estimates on historical experience and on various other assumptions that we believe are reasonable under the circumstances, the results of which form the basis for making judgments about the carrying values of assets and liabilities that are not readily apparent from other sources. Actual results may differ from these estimates.
| 26 |
An accounting policy is considered to be critical if it requires an accounting estimate to be made based on assumptions about matters that are highly uncertain at the time the estimates are made, and if different estimates that reasonably could have been used, or changes in the accounting estimates that are reasonably likely to occur, could materially impact the consolidated financial statements. We believe the following critical accounting policies reflect the more significant estimates and assumptions used in the preparation of the consolidated financial statements.
Revenue Recognition
Our revenues are generated from sales of electronics products. All of our revenue transactions contain standard business terms and conditions. We determine the appropriate accounting for these transactions after considering (1) whether a contract exists; (2) when to recognize revenue on the deliverables; and (3) whether all elements of the contract have been fulfilled and delivered. In addition, our revenue recognition policy requires an assessment as to whether collection is reasonably assured, which inherently requires us to evaluate the creditworthiness of our customers. Changes in judgments on these assumptions and estimates could materially impact the timing or amount of revenue recognition.
Please refer to Note 2 in the footnotes to the financial statements for detailed description of our revenue recognition policy.
Inflation
Neither inflation nor changing prices has had a material impact on the Company’s net sales, revenues or continuing operations during the past three fiscal years.
After Sales Service
The after-sales services we provide to our customers are primarily repair and maintenance. If a customer buys a product from us and needs repairs, we can usually arrange to have the manufacturer repair the product. In certain cases, clerks in our stores are able to make the repairs directly.
Tabular Disclosure of Contractual Obligations
The following table sets forth our contractual obligations as of March 31, 2011:
| Payment Due by Period | ||||||||||||||||||||
| Contractual Obligations | Total | Less than 1 year | 1-3 years | 3-5 years | More than 5 years | |||||||||||||||
| Operating lease obligations | $ | 278 | $ | 190 | $ | 87 | $ | 1 | $ | - | ||||||||||
Item 4. Controls and Procedures.
Evaluation of Disclosure Controls and Procedures
Under the supervision and with the participation of our management, including our principal executive officer and principal financial officer, our management conducted an evaluation of our disclosure controls and procedures as of March 31, 2011, as such term is defined in Rules 13a-15(e) and 15d-15(e) under the Exchange Act. Based on this evaluation, our principal executive officer and principal financial officer concluded that, as of such date, the Company’s disclosure controls and procedures were were not effective due to: the current staff in our accounting department are inexperienced in US GAAP. They need substantial training to meet the demands of a US public company. The accounting skills and understanding necessary to fulfill the requirements of US GAAP-based reporting, including the preparation of financial statements and consolidation, are inadequate.
| 27 |
Disclosure controls and procedures are designed to provide that information required to be disclosed by us in reports that we file or submit under the Exchange Act is accumulated, recorded, processed, summarized, communicated to our management, including our principal executive officer and principal financial officer and reported within the time periods specified in Securities and Exchange Commission rules and forms.
Changes in Internal Control over Financial Reporting
Other than the changes relating to the material weakness described above, there was no change in our internal control over financial reporting that occurred during the first quarter of 2011 covered by this Quarterly Report on Form 10-Q/A that has materially affected, or is reasonably likely to materially affect, our internal control over financial reporting.
PART II. OTHER INFORMATION
Item 6. Exhibits.
| Exhibit No. | Document Description | |
| 31.1 | Certification of the Chief Executive Officer pursuant to Rule 13A-14(A)/15D-14(A) of the Securities Exchange Act of 1934, as adopted pursuant to Section 302 of the Sarbanes-Oxley Act of 2002. | |
| 31.2 | Certification of the Chief Financial Officer pursuant to Rule 13A-14(A)/15D-14(A) of the Securities Exchange Act of 1934, as adopted pursuant to Section 302 of the Sarbanes-Oxley Act of 2002. | |
| 32.1 | Certification of the Chief Executive Officer and Chief Financial Officer pursuant to 18 U.S.C. 1350 (Section 906 of the Sarbanes-Oxley Act of 2002). |
SIGNATURES
Pursuant to the requirements of the Securities Exchange Act of 1934, the registrant has duly caused this report to be signed on its behalf by the undersigned thereunto duly authorized.
| CHINA 3C GROUP | ||
| Date: May , 2012 | By: | /s/ |
| Name: Zhenggang Wang | ||
| Title: Chief Executive Officer and Chairman | ||
| (Principal Executive Officer) | ||
| Date: May , 2012 | By: | /s/ |
| Name: Weiping Wang | ||
| Title: Chief Financial Officer (Principal Accounting and Financial Officer) | ||
| 28 |
EXHIBIT INDEX
| Exhibit No. | Document Description | |
| 31.1 | Certification of the Chief Executive Officer pursuant to Rule 13A-14(A)/15D-14(A) of the Securities Exchange Act of 1934, as adopted pursuant to Section 302 of the Sarbanes-Oxley Act of 2002. | |
| 31.2 | Certification of the Chief Financial Officer pursuant to Rule 13A-14(A)/15D-14(A) of the Securities Exchange Act of 1934, as adopted pursuant to Section 302 of the Sarbanes-Oxley Act of 2002. | |
| 32.1 | Certification of the Chief Executive Officer and Chief Financial Officer pursuant to 18 U.S.C. 1350 (Section 906 of the Sarbanes-Oxley Act of 2002). |
| 29 |
Exhibit 31.1
Certification of Chief Executive Officer Pursuant to
Securities Exchange Act Rules 13a-14(a) and 15d-14(a)
as Adopted Pursuant to Section 302 of the Sarbanes-Oxley Act of 2002
I, Zhenggang Wang, certify that:
1. I have reviewed this quarterly report on Form 10-Q/A of China 3C Group;
2. Based on my knowledge, this report does not contain any untrue statement of a material fact or omit to state a material fact necessary to make the statements made, in light of the circumstances under which such statements were made, not misleading with respect to the period covered by this report;
3. Based on my knowledge, the financial statements, and other financial information included in this report, fairly present in all material respects the financial condition, results of operations and cash flows of the registrant as of, and for, the periods presented in this report;
4. The registrant’s other certifying officer and I are responsible for establishing and maintaining disclosure controls and procedures (as defined in Exchange Act Rules 13a-15(e) and 15d-15(e)) and internal control over financial reporting (as defined in Exchange Act Rules 13a-15(f) and 15d-15(f)) for the registrant and have:
(a) Designed such disclosure controls and procedures, or caused such disclosure controls and procedures to be designed under our supervision, to ensure that material information relating to the registrant, including its consolidated subsidiaries, is made known to us by others within those entities, particularly during the period in which this report is being prepared;
(b) Designed such internal control over financial reporting, or caused such internal control over financial reporting to be designed under our supervision, to provide reasonable assurance regarding the reliability of financial reporting and the preparation of financial statements for external purposes in accordance with generally accepted accounting principles;
(c) Evaluated the effectiveness of the registrant’s disclosure controls and procedures and presented in this report our conclusions about the effectiveness of the disclosure controls and procedures, as of the end of the period covered by this report based on such evaluation; and
(d) Disclosed in this report any change in the registrant’s internal control over financial reporting that occurred during the registrant’s most recent fiscal quarter (the registrant’s fourth fiscal quarter in the case of an annual report) that has materially affected, or is reasonably likely to materially affect, the registrant’s internal control over financial reporting; and
5. The registrant’s other certifying officer and I have disclosed, based on our most recent evaluation of internal control over financial reporting, to the registrant’s auditors and the audit committee of the registrant’s board of directors (or persons performing the equivalent functions):
(a) All significant deficiencies and material weaknesses in the design or operation of internal control over financial reporting which are reasonably likely to adversely affect the registrant’s ability to record, process, summarize and report financial information; and
(b) Any fraud, whether or not material, that involves management or other employees who have a significant role in the registrant’s internal control over financial reporting.
| May ___, 2012 | ||
| Zhenggang Wang, Chief Executive Officer and Chairman | ||
| (Principal Executive Officer) | ||
Exhibit 31.2
Certification of Chief Financial Officer Pursuant to
Securities Exchange Act Rules 13a-14(a) and 15d-14(a)
as Adopted Pursuant to Section 302 of the Sarbanes-Oxley Act of 2002
I, Weiping Wang, certify that:
1. I have reviewed this quarterly report on Form 10-Q/A of China 3C Group;
2. Based on my knowledge, this report does not contain any untrue statement of a material fact or omit to state a material fact necessary to make the statements made, in light of the circumstances under which such statements were made, not misleading with respect to the period covered by this report;
3. Based on my knowledge, the financial statements, and other financial information included in this report, fairly present in all material respects the financial condition, results of operations and cash flows of the registrant as of, and for, the periods presented in this report;
4. The registrant’s other certifying officer and I are responsible for establishing and maintaining disclosure controls and procedures (as defined in Exchange Act Rules 13a-15(e) and 15d-15(e)) and internal control over financial reporting (as defined in Exchange Act Rules 13a-15(f) and 15d-15(f)) for the registrant and have:
(a) Designed such disclosure controls and procedures, or caused such disclosure controls and procedures to be designed under our supervision, to ensure that material information relating to the registrant, including its consolidated subsidiaries, is made known to us by others within those entities, particularly during the period in which this report is being prepared;
(b) Designed such internal control over financial reporting, or caused such internal control over financial reporting to be designed under our supervision, to provide reasonable assurance regarding the reliability of financial reporting and the preparation of financial statements for external purposes in accordance with generally accepted accounting principles;
(c) Evaluated the effectiveness of the registrant’s disclosure controls and procedures and presented in this report our conclusions about the effectiveness of the disclosure controls and procedures, as of the end of the period covered by this report based on such evaluation; and
(d) Disclosed in this report any change in the registrant’s internal control over financial reporting that occurred during the registrant’s most recent fiscal quarter (the registrant’s fourth fiscal quarter in the case of an annual report) that has materially affected, or is reasonably likely to materially affect, the registrant’s internal control over financial reporting; and
5. The registrant’s other certifying officer and I have disclosed, based on our most recent evaluation of internal control over financial reporting, to the registrant’s auditors and the audit committee of the registrant’s board of directors (or persons performing the equivalent functions):
(a) All significant deficiencies and material weaknesses in the design or operation of internal control over financial reporting which are reasonably likely to adversely affect the registrant’s ability to record, process, summarize and report financial information; and
(b) Any fraud, whether or not material, that involves management or other employees who have a significant role in the registrant’s internal control over financial reporting.
| May ___, 2012 | ||
| Weiping Wang, Chief Financial Officer | ||
| (Principal Financial and Accounting Officer) | ||
Exhibit 32.1
CERTIFICATION PURSUANT TO 18 U.S.C. SECTION 1350,
AS ADOPTED PURSUANT TO SECTION 906
OF THE SARBANES-OXLEY ACT OF 2002
In connection with the Quarterly Report of China 3C Group (the “Company”) on Form 10-Q/A for the period ended March 31, 2011 as filed with the Securities and Exchange Commission on the date hereof (the “Report”), each of the undersigned officers of the Company hereby certifies, pursuant to 18 U.S.C. § 1350, as adopted pursuant to § 906 of the Sarbanes-Oxley Act of 2002, that:
1. The Report fully complies with the requirements of Section 13(a) or 15(d) of the Securities Exchange Act of 1934; and
2. Information contained in the Report fairly presents, in all material respects, the financial condition and results of operations of the Company.
| May ___, 2012 | ||
| Zhenggang Wang, Chief Executive Officer and Chairman | ||
| (Principal Executive Officer) | ||
| May ___, 2012 | ||
| Weiping Wang, Chief Financial Officer | ||
| (Principal Financial and Accounting Officer) | ||
Annex C
UNITED STATES
SECURITIES AND EXCHANGE COMMISSION
WASHINGTON, D.C. 20549
FORM 10-Q/A
(Amendment No. 1)
QUARTERLY REPORT PURSUANT TO SECTION 13 OR 15(d) OF THE SECURITIES EXCHANGE ACT OF 1934
For the quarterly period ended June 30, 2011
or
TRANSITION REPORT PURSUANT TO SECTION 13 OR 15(d) OF THE SECURITIES EXCHANGE ACT OF 1934
For the transition period from ____ to _____
Commission File Number: 000-28767
China 3C Group
(Exact name of registrant as specified in its charter)
| Nevada | 88-0403070 |
(State or other jurisdiction of incorporation or organization) | (I.R.S. Employer Identification No.) |
368 HuShu Nan Road
HangZhou City, Zhejiang Province, China 310014
(Address of Principal Executive Offices) (Zip Code)
086-0571-88381700
(Registrant’s telephone number, including area code)
(Former name, former address and former fiscal year, if changed since last report)
Indicate by check whether the issuer (1) has filed all reports required to be filed by Section 13 or 15(d) of the Securities Exchange Act of 1934 during the preceding 12 months (or for such shorter period that the registrant was required to file such reports), and (2) has been subject to such filing requirements for the past 90 days:
Yes x No¨
Indicate by check mark whether the registrant has submitted electronically and posted on its corporate Web site, if any, every Interactive Data File required to be submitted and posted pursuant to Rule 405 of Regulation S-T (§232.405 of this chapter) during the preceding 12 months (or for such shorter period that the registrant was required to submit and post such files). Yesx No¨
Indicate by check mark whether the registrant is a large accelerated filer, an accelerated filer, a non-accelerated filer, or a smaller reporting company. See the definitions of “large accelerated filer,” “accelerated filer” and “smaller reporting company” in Rule 12b-2 of the Exchange Act.
Large accelerated filer¨ | Accelerated filer¨ | Non-accelerated filer ¨ (Do not check if a smaller reporting company) | Smaller reporting companyx |
Indicate by check mark whether the registrant is a shell company (as defined in Rule No 12b-2 of the Exchange Act). Yes ¨ No x
As of August 15, 2011, the registrant had 58,511,327 shares of common stock outstanding.
EXPLANATORY NOTE
This Amendment No. 1 to our Quarterly Report on Form 10-Q/A ("Form 10-Q/A") is being filed to amend our Quarterly Report on 10-Q for the period ended June 30, 2010 ("Form 10-Q"), which was originally filed with the Securities and Exchange Commission (the "SEC") on August 17, 2010. We are filing this amendment to include disclosure consistent with comments received by the SEC. We are amending and restating Items 1, 2, and 4 in this Form 10-Q/A.
Below is a summary of these errors and the related corrections:
| · | The Company reclassified fees paid to department stores from a contra revenue account to selling, general and administrative expenses. The amount of $1,076 and $1,299 were previously classified in contra-revenue account as a deduction to net sales for the three months ended June 30, 2011 and 2010. The Company moved the amount to selling expenses, and it is reported as selling, general and administrative expenses in the statement of operations and comprehensive loss. The reclassification caused a $1,076 increase in net sales from $33,588 to $34,664 and a corresponding increase of $1,076 in Selling, general and administrative expenses from $6,939 to $8,015 in the second quarter 2011; a $1,299 increase in net sales from $37,428 to $38,727 and a corresponding increase of $1,299 in Selling, general and administrative expenses from $5,488 to $6,787 in the second quarter 2010. The gross profit increased $1,076 and $1,299 respectively in the second quarter 2011 and 2010. The loss from operations and net loss remained unchanged. The impact of the restatement was limited to the presentation of the consolidated statements of operations and comprehensive income (loss). The consolidated balance sheets, the consolidated statements of stockholders’ equity and the related consolidated statements of cash flows remained unaffected. See changes in Item 1. |
| · | The Company amended Item 1 and 2 to clarify the fact that Capital did not sell its equity ownership in Zhejiang upon executing the contractual agreements in 2007. Capital remains as the owner of 100% equity of Zhejiang through shareholding entrustment agreements. |
| · | The restatement above also affected the disclosure of segment reporting. As a result, we have amended Item 1, Note 14 - SEGMENT INFORMATION and Item 2. MANAGEMENT’S DISCUSSION AND ANALYSIS OF FINANCIAL CONDITION AND RESULTS OF OPERATIONS. |
| · | The Company amended Item 4 revising our conclusions on the effectiveness of disclosure controls and procedures to “ineffective.” |
In addition, this Form 10-Q/A contains new certifications by our Chief Executive Officer and our Chief Financial Officer, filed as exhibits hereto.
TABLE OF CONTENTS
| PAGE | ||
| PART I. FINANCIAL INFORMATION | 3 | |
| Item 1. Financial Statements | 3 | |
| Consolidated Balance Sheets as of June 30, 2011 (Unaudited) and December 31, 2010 | 3 | |
| Consolidated Statements of Operations and Comprehensive Loss for the Six Months Ended June 30, 2011 and 2010 (Unaudited) | 4 | |
| Consolidated Statements of Operations and Comprehensive Loss for the Three Months Ended June 30, 2011 and 2010 (Unaudited) | 5 | |
| Consolidated Statements of Cash Flows for the Six Months Ended June 30, 2011 and 2010 (Unaudited) | 6 | |
| Notes to Consolidated Financial Statements | 7 | |
| Item 2. Management’s Discussion and Analysis of Financial Condition and Results of Operations | 22 | |
| Item 4. Controls and Procedures | 32 | |
| PART II. OTHER INFORMATION | 32 | |
| Item 6. Exhibits | 32 | |
| Signatures | 33 |
| 2 |
PART I. FINANCIAL INFORMATION
Item 1. Financial Statements
CHINA 3C GROUP AND SUBSIDIARIES
CONSOLIDATED BALANCE SHEETS
(in thousands)
| June 30, | December 31, | |||||||
| 2011 | 2010 | |||||||
| (Unaudited) | ||||||||
| ASSETS | ||||||||
| Current assets: | ||||||||
| Cash and equivalents | $ | 17,330 | $ | 26,249 | ||||
| Accounts receivable, net | 10,991 | 11,026 | ||||||
| Inventories | 7,245 | 7,284 | ||||||
| Advances to suppliers | 2,243 | 2,201 | ||||||
| Taxes receivable | 127 | 1,200 | ||||||
| Prepaid expenses and other current assets | 644 | 591 | ||||||
| Total current assets | 38,580 | 48,551 | ||||||
| Property, plant and equipment, net | 118 | 191 | ||||||
| Intangible asset, net | 12,767 | 13,153 | ||||||
| Goodwill | 11,229 | 11,229 | ||||||
| Refundable deposits | 15 | 7 | ||||||
| Total assets | $ | 62,709 | $ | 73,131 | ||||
| LIABILITIES AND STOCKHOLDERS' EQUITY | ||||||||
| Current liabilities: | ||||||||
| Accounts payable | $ | 4,588 | $ | 4,139 | ||||
| Accrued expenses | 1,827 | 4,536 | ||||||
| Income tax payable | 745 | 736 | ||||||
| Total liabilities | 7,160 | 9,411 | ||||||
| Stockholders' equity | ||||||||
| Common stock, $0.001 par value, 100,000,000 million shares authorized, 58,511,327 and 54,831,327 issued and outstanding as of June 30, 2011 and December 31, 2010, respectively | 59 | 55 | ||||||
| Additional paid-in capital | 21,344 | 20,252 | ||||||
| Subscription receivable | (50 | ) | (50 | ) | ||||
| Statutory reserve | 11,543 | 11,543 | ||||||
| Other comprehensive income | 7,401 | 6,706 | ||||||
| Retained earnings | 15,252 | 25,214 | ||||||
| Total stockholders' equity | 55,549 | 63,720 | ||||||
| Total liabilities and stockholders' equity | $ | 62,709 | $ | 73,131 | ||||
The accompanying notes are an integral part of these consolidated financial statements.
| 3 |
CHINA 3C GROUP AND SUBSIDIARIES
CONSOLIDATED STATEMENTS OF OPERATIONS AND COMPREHENSIVE LOSS
SIX MONTHS ENDED JUNE 30, 2011 and 2010 (UNAUDITED)
(in thousands)
| 2011 (restated) | 2010 (restated) | |||||||
| Net sales | $ | 73,757 | $ | 80,785 | ||||
| Cost of sales | 68,368 | 70,939 | ||||||
| Gross profit | 5,389 | 9,846 | ||||||
| Selling, general and administrative expenses | 15,287 | 13,261 | ||||||
| Loss from operations | (9,898 | ) | (3,415 | ) | ||||
| Other (income) expense | ||||||||
| Interest income | (37 | ) | (47 | ) | ||||
| Other income | (2 | ) | (7 | ) | ||||
| Other expense | 205 | 44 | ||||||
| Total other (income) expense | 166 | (10 | ) | |||||
| Loss before income taxes | (10,064 | ) | (3,405 | ) | ||||
| Provision for income taxes | 129 | 190 | ||||||
| Net loss | (10,193 | ) | (3,595 | ) | ||||
| Foreign currency translation adjustments | 694 | 48 | ||||||
| Comprehensive loss | $ | (9,499 | ) | $ | (3,547 | ) | ||
| Net loss available to common shareholders per share: | ||||||||
| Basic and Diluted | $ | (0.18 | ) | $ | (0.07 | ) | ||
| Weighted average shares outstanding: | ||||||||
| Basic and Diluted | 57,678,399 | 54,831,327 | ||||||
The accompanying notes are an integral part of these consolidated financial statements.
| 4 |
CHINA 3C GROUP AND SUBSIDIARIES
CONSOLIDATED STATEMENTS OF OPERATIONS AND COMPREHENSIVE LOSS
THREE MONTHS ENDED JUNE 30, 2011 and 2010 (UNAUDITED)
(in thousands)
| 2011 (restated) | 2010 (restated) | |||||||
| Net sales | $ | 34,664 | $ | 38,727 | ||||
| Cost of sales | 32,305 | 33,506 | ||||||
| Gross profit | 2,359 | 5,221 | ||||||
| Selling, general and administrative expenses | 8,015 | 6,787 | ||||||
| Loss from operations | (5,656 | ) | (1,566 | ) | ||||
| Other (income) expense | ||||||||
| Interest income | (16 | ) | (22 | ) | ||||
| Other income | (1 | ) | (3 | ) | ||||
| Other expense | 57 | 44 | ||||||
| Total other (income) expense | 40 | 19 | ||||||
| Loss before income taxes | (5,696 | ) | (1,585 | ) | ||||
| Provision for income taxes | 38 | 83 | ||||||
| Net loss | (5,734 | ) | (1,668 | ) | ||||
| Foreign currency translation adjustments | 449 | 40 | ||||||
| Comprehensive loss | $ | (5,285 | ) | $ | (1,628 | ) | ||
| Net loss available to common shareholders per share: | ||||||||
| Basic and Diluted | $ | (0.10 | ) | $ | (0.03 | ) | ||
| Weighted average shares outstanding: | ||||||||
| Basic and Diluted | 58,511,327 | 54,831,327 | ||||||
The accompanying notes are an integral part of these consolidated financial statements.
| 5 |
CHINA 3C GROUP AND SUBSIDIARIES
CONSOLIDATED STATEMENTS OF CASH FLOWS
SIX MONTHS ENDED JUNE 30, 2011 and 2010 (UNAUDITED)
(in thousands)
| 2011 | 2010 | |||||||
| CASH FLOWS FROM OPERATING ACTIVITIES | ||||||||
| Net loss | $ | (10,193 | ) | $ | (3,595 | ) | ||
| Adjustments to reconcile net loss to net cash used in operating activities: | ||||||||
| Depreciation | 47 | 11 | ||||||
| Amortization of intangible assets | 703 | 702 | ||||||
| Stock based compensation | 746 | 251 | ||||||
| (Increase) / decrease in assets: | ||||||||
| Accounts receivable | 251 | 2,751 | ||||||
| Taxes receivable | 1,089 | - | ||||||
| Inventories | 182 | 7 | ||||||
| Prepaid expenses and other current assets | (41 | ) | 49 | |||||
| Refundable deposits | (7 | ) | 5 | |||||
| Advance to suppliers | 2 | (103 | ) | |||||
| (Increase) / decrease in current liabilities: | ||||||||
| Advance from customers | - | 23 | ||||||
| Accounts payable | 365 | 348 | ||||||
| Accrued expenses | (2,778 | ) | (1,119 | ) | ||||
| Income tax payable | (6 | ) | 45 | |||||
| Net cash used in operating activities | (9,640 | ) | (625 | ) | ||||
| CASH FLOW FROM INVESTING ACTIVITIES | ||||||||
| Purchase of property and equipment | (2 | ) | (18 | ) | ||||
| Net cash used in investing activities | (2 | ) | (18 | ) | ||||
| Effect of exchange rate changes on cash and equivalents | 723 | (142 | ) | |||||
| Net decrease in cash | (8,919 | ) | (785 | ) | ||||
| Cash and equivalents, beginning of period | 26,249 | 29,908 | ||||||
| Cash and equivalents, end of period | $ | 17,330 | $ | 29,123 | ||||
| Supplemental disclosure of cash flow information: | ||||||||
| Income taxes paid | $ | 120 | $ | 74 | ||||
| Interest paid | $ | - | $ | - | ||||
The accompanying notes are an integral part of these consolidated financial statements.
| 6 |
CHINA 3C GROUP AND SUBSIDIARIES
NOTES TO CONSOLIDATED FINANCIAL STATEMENTS
JUNE 30, 2011 (UNAUDITED)
Note 1 -ORGANIZATION
China 3C Group (including its subsidiaries unless the context indicates otherwise, the “Company,” “China 3C,” “we,” “us,” or “our”) was incorporated on August 20, 1998 under the laws of the State of Nevada. Capital Future Developments Limited - BVI (“Capital”) was incorporated on July 22, 2004 under the laws of the British Virgin Islands (“BVI”). Zhejiang Yong Xin Digital Technology Company Limited (“Zhejiang”), Yiwu Yong Xin Communication Limited (“Yiwu”), Hangzhou Wang Da Electronics Company Limited (“Wang Da”), Hangzhou Sanhe Electronic Technology Limited (“Sanhe”), and Shanghai Joy & Harmony Electronics Company Limited (“Joy & Harmony”), Jinhua Baofa Logistic Ltd (“Jinhua”) were incorporated under the laws of Peoples Republic of China (“PRC”) on July 11, 2005, July 18, 1997, March, 30, 1998, April 12, 2004, August 20, 2003 and December 27, 2001, respectively. All dollar amounts are in thousands, unless otherwise indicated.
On December 21, 2005, Capital became a wholly owned subsidiary of China 3C through a reverse merger (the “Merger Transaction”). China 3C acquired all of the issued and outstanding capital stock of Capital pursuant to a Merger Agreement dated December 21, 2005 by and among China 3C, XY Acquisition Corporation, Capital and the shareholders of Capital (the “Merger Agreement”). Pursuant to the Merger Agreement, Capital became a wholly owned subsidiary of China 3C and, in exchange for the Capital shares, China 3C issued 35,000,000 shares of its common stock to the shareholders of Capital, representing 93% of the issued and outstanding capital stock of China 3C at that time and cash of $500.
On August 3, 2006, Capital completed the acquisition of 100% of the equity of Sanhe in exchange for a combination of cash and stock transaction valued at $8,750 (consisting of 915,751 newly issued shares of the Company’s common stock and $5,000 in cash).
On November 28, 2006, Capital completed the acquisition of 100% of the equity of Joy & Harmony in exchange for a combination of cash and stock valued at $18,500 (consisting of 2,723,110 shares of the Company’s common stock and $7,500 in cash).
On August 15, 2007, we executed a series of contractual agreements between Capital and Zhejiang. The contractual agreements give Capital and its equity owners an obligation, and having ability to absorb, any losses, and rights to receive returns; however, these contractual agreements did not change the equity ownership of Zhejiang. We did not dispose Capital’s actual equity ownership of Zhejiang when we execute the contractual agreements. Capital entered into share-holding entrustment agreements with five individuals - Zhenggang Wang, Yimin Zhang, Huiyi Lv, Xiaochun Wang and Zhongsheng Bao to hold 35%, 20%, 20%, 15% and 10%, respectively, of the equity interest of Zhejiang on behalf of Capital on November 21, 2005. The entrustment agreements confirm that Capital is the actual owner of Zhejiang. Capital enjoys the actual shareholder’s rights and has the right to obtain any benefits received by the nominal holders. Zhenggang Wang is the CEO and shareholder of China 3C Group. Yimin Zhang, Huiyi Lv, Xiaochun Wang and Zhongsheng Bao have no other relationship with China 3C Group. No consideration was given to these individuals who held the equity of Zhejiang on behalf of Capital.
On July 6, 2009, China 3C and its subsidiary Zhejiang and Yiwu purchased 100% of Jinhua for RMB 120 million ($17,500) in cash. Zhejiang acquired 90% and Yiwu acquired 10% of the equity interests in Jinhua.
Following the acquisition of Jinhua, the Company began providing logistic service to businesses in addition to its traditional business of resale and distribution of third party products such as mobile phones, facsimile machines, DVD players, stereos, speakers, MP3 and MP4 players, iPods, electronic dictionaries, CD players, radios and audio systems.
| 7 |
ORGANIZATIONAL CHART
Note 2 -SUMMARY OF SIGNIFICANT ACCOUNTING POLICIES
Basis of Presentation
The accompanying consolidated financial statements were prepared in conformity with accounting principles generally accepted in the United States of America (“US GAAP”). The Company’s functional currency is the Chinese Renminbi (“RMB”), however, the accompanying consolidated financial statements have been translated and presented in United States Dollars (“$” or “USD”).
Principles of Consolidation
The consolidated financial statements include the accounts of China 3C and its wholly owned subsidiaries Capital, Wang Da, Yiwu, Joy & Harmony, Sanhe and Jinhua and variable interest entity Zhejiang, collectively referred to as the Company, unless the context indicates otherwise. All material intercompany accounts, transactions and profits were eliminated in consolidation.
| 8 |
Reclassifications
Certain prior period amounts were reclassified to conform to current period presentation, none of which changed total assets, liabilities, stockholder’s equity, net loss, or net loss per share.
Currency Translation
The accounts of Zhejiang, Wang Da, Yiwu, Sanhe, Joy & Harmony and Jinhua were maintained, and its financial statements were expressed, in RMB. Such financial statements were translated into USD in accordance with FASB ASC 830-10, “Foreign Currency Translation,” with the RMB as the functional currency. According to FASB ASC Topic 830-10, assets and liabilities were translated at the ending exchange rate, stockholders’ equity is translated at the historical rates and income statement items are translated at the average exchange rate for the period. The resulting translation adjustments are reported as other comprehensive income in accordance with FASB ASC Topic 220, “Reporting Comprehensive Income,” as a component of shareholders’ equity. Transaction gains and losses are reflected in the consolidated income (loss) and comprehensive income (loss) statement.
Use of Estimates
The preparation of financial statements in conformity with US GAAP requires management to make estimates and assumptions that affect the reported amounts of assets and liabilities and disclosure of contingent assets and liabilities at the date of the financial statements and the reported amounts of revenues and expenses during the reporting period. Actual results could differ from those estimates.
Risks and Uncertainties
The Company is subject to substantial risks from, among other things, intense competition associated with the industry in general, other risks associated with financing, liquidity requirements, rapidly changing customer requirements, limited operating history, foreign currency exchange rates and the volatility of public markets.
Contingencies
Certain conditions may exist as of the date the financial statements are issued, which could result in a loss to the Company but which will only be resolved when one or more future events occur or fail to occur. The Company’s management assesses such contingent liabilities, and such assessment inherently involves an exercise of judgment. In assessing loss contingencies related to legal proceedings that are pending against the Company or unasserted claims that may result in such proceedings, the Company’s management evaluates the perceived merits of any legal proceedings or unasserted claims as well as the perceived merits of the amount of relief sought or expected to be sought.
If the assessment of a contingency indicates that it is probable that a material loss has been incurred and the amount of the liability can be estimated, then the estimated liability is accrued in the Company’s financial statements. If the assessment indicates that a potential material loss contingency is not probable but is reasonably possible, or is probable but cannot be estimated, then the nature of the contingent liability, together with an estimate of the range of possible loss if determinable and material would be disclosed.
Loss contingencies considered to be remote by management are generally not disclosed unless they involve guarantees, in which case the guarantee would be disclosed.
| 9 |
Accounts Receivable
The Company maintains reserves for potential credit losses on accounts receivable. Management reviews the composition of accounts receivable and analyzes historical bad debts, customer concentrations, customer credit worthiness, current economic trends and changes in customer payment patterns to evaluate the adequacy of these reserves. Terms of the sales vary. Reserves are recorded primarily on a specific identification basis.
Inventories
Inventories are valued at the lower of cost (determined on a weighted average basis) or market value. Management compares the cost of inventories with the market value and allowance is made for writing down their inventories to market value, if lower. As of June 30, 2011 and December 31, 2010, inventory consisted entirely of finished goods valued at $7,245 and $7,284, respectively.
Property, Plant and Equipment, net
Property, plant and equipment are stated at cost. Expenditures for maintenance and repairs are charged to earnings as incurred; additions, renewals and betterments are capitalized. When property and equipment are retired or otherwise disposed of, the related cost and accumulated depreciation are removed from the respective accounts, and any gain or loss is included in operations. Depreciation of property and equipment is provided using the straight-line method for substantially all assets with estimated lives of:
| Automotive | 5 years |
| Office Equipment | 5 years |
As of June 30, 2011 and December 31, 2010, property and equipment consisted of the following:
| 2011 | 2010 | |||||||
| Automotive | $ | 706 | $ | 738 | ||||
| Office equipment | 196 | 195 | ||||||
| Leasehold improvements | 3 | 65 | ||||||
| Plant and Equipment | - | 3 | ||||||
| Sub Total | 905 | 1,001 | ||||||
| Less: accumulated depreciation | (787 | ) | (810 | ) | ||||
| Total | $ | 118 | $ | 191 | ||||
Long-Lived Assets
The Company periodically evaluates the carrying value of long-lived assets to be held and used in accordance with FASB ASC 360 “Property, Plant and Equipment”, which requires impairment losses to be recorded on long-lived assets used in operations when indicators of impairment are present and the undiscounted cash flows estimated to be generated by those assets are less than the assets’ carrying amounts. In that event, a loss is recognized based on the amount by which the carrying amount exceeds the fair market value of the long-lived assets. Losses on long-lived assets to be disposed of are determined in a similar manner, except that fair market values are reduced for the cost of disposal. Based on its review, the Company believes that, as of June 30, 2011 and December 31, 2010, there were no significant impairments of its long-lived assets.
Fair Value of Financial Instruments
FASB ASC Topic 825 “Financial Instruments” requires that the Company disclose estimated fair values of financial instruments. The carrying amounts reported in the statements of financial position for current assets and current liabilities qualifying as financial instruments are a reasonable estimate of fair value.
| 10 |
Impairment of Goodwill
In accordance with ASC 350,we test goodwill at the reporting unit level for impairment on an annual basis. Reporting units are determined based on the Company's operating segments.
Revenue Recognition
In accordance with Securities and Exchange Commission (“SEC”) Staff Accounting Bulletin (“SAB”) 104, the Company recognizes revenues when there is persuasive evidence of an arrangement, product delivery and acceptance have occurred, the sales price is fixed and determinable, and collectability of the resulting receivable is reasonably assured.
The Company records revenues when title and the risk of loss pass to the customer. Generally, these conditions occur on the date the customer takes delivery of the product. Revenue is generated from sales of China 3C products through two main revenue streams:
| 1. | Retail. 69.6%, 68.7%, 69.2% , 68.6% of the Company's revenue came from sales to individual customers at outlets installed inside department stores etc. (i.e., store in store model) during the three and six months ended June 30, 2011 and 2010, respectively, and was mainly achieved through two broad categories: |
| a. | Purchase contracts. Sales by purchase contracts have terms of thirty days from the transfer of goods to the customer. Under this method, the Company delivers goods to places designated by the customers and receives confirmation of delivery. At that time, ownership and all risks associated to the goods are transferred to the customers and payment is made within 30 days. The Company relieves its inventory and recognizes revenue upon receipt of confirmation from the customer. |
| b. | Point of sale transfer of ownership. Under this method, the Company’s products are placed in third party stores and sold by the Company’s sales people. Upon purchase of the item by the customer, the Company relieves its inventory and recognizes revenue related to that item. |
| 2. | Wholesale. 30.4%, 31.3%, 30.8%, 31.4% of the Company's revenue came from wholesale during the three and six months ended June 30, 2011 and 2010, respectively. Recognition of income in wholesales is based on the contract terms. The main contract terms on wholesale agreed that payments be paid 15 days after receipt of goods and that ownership and all risks associated with the goods are transferred to the customers on the date of goods received and payments will be made 15 days therefrom. |
Sales revenue is therefore recognized on the following basis:
| 1. | Store in store model: |
| a. | For goods sold under sales and purchase contracts, revenue is recognized when goods are received by customers. |
| b. | For goods at customer outlets which the Company’s sales people operate, and inventory of goods is under joint control by the customers and the Company, revenue is recognized at the point of sale to the end buyer. |
| 11 |
During public holidays or department store celebration periods, we provide certain sales incentives to retail customers to increase sales, such as gift giving and price reductions. These are the only temporary incentives during the specified periods. Sales made to our retail customers as a result of incentives are immaterial as a percentage of total sales revenue.
| 2. | Wholesale: |
| a. | Revenue is recognized at the date of goods are received by wholesale customers. We operate our wholesale business by selling large volume orders to second-tier distributors and large department stores. Revenues from wholesale are recognized as net sales after confirmation with distributors. Net sales already take into account revenue dilution as they exclude inventory credit, discount for early payment, product obsolescence and return of products and other allowances. Net sales also take into account the return of products in accordance with relevant laws and regulations in China. |
Return policies
Our return policy complies with China’s laws and regulations on consumer’s rights and product quality. In accordance with Chinese law, consumers can return or exchange used products within seven days only if the goods do not meet safety and health requirements, endanger a person’s property, or do not meet the advertised performance. If the conditions and requirements as set out in the relevant laws and regulations are met, the retail stores are entitled to accept a return of the goods from the consumer. In such cases, the Company shall accept the returns unconditionally. Goods returned will be redirected to the production factory or supplier who shall bear all losses on the returns in accordance the laws and regulations. Consumer returns or exchanges of products that have not been used, where the packaging has not been damaged, are honored if such return or exchange is within seven days. If a consumer returns a product, the Company must refund the invoice price to the consumer. The Company will then be responsible for returning the goods to the production factory or supplier. At that time the Company can recover the price based on the purchase and sale contract with the producer or supplier. However, when goods are returned, the Company loses the profit margin that it records when revenue is recognized, regardless of whether the production factory or supplier takes the product back or not.
The return rights granted to wholesale customers are similar to the rights granted to retail customers. Once wholesale customers purchase products, they follow the same return policy as retail customers. We do not honor returns from wholesale customers except for products which don’t meet laws and regulations or quality requirements. If our wholesale customers have a high inventory level or product obsolescence caused by lower market demands or other operational issues, the wholesale customers bear their own losses. When a wholesale customer returns products, the Company will return the products to the suppliers or manufacturers. A sales return and allowance is recorded at the sales price. Meanwhile, a purchase return and allowance entry is recorded at the invoice price because the suppliers or manufacturers bear the losses. The net effect is that the Company derecognizes the gross profit when a return takes place, but does not record any loss on the cost of the returned item back to the supplier or manufacturer.
In light of the aforesaid PRC laws and regulations and the Company's arrangements with suppliers, we do not provide an accrual for any estimated losses on subsequent sale of the return of products. As a result we do not assess levels of inventory in the distribution channel, product obsolescence and/or introductions of new products, as none of those factors have any impact on us with respect to estimating losses on subsequent sale of returned goods. Third party market research report and consumer demand study is not used to make estimates of goods returned.
| 12 |
Cost of Sales
Cost of sales consists of actual product cost, which is the purchase price of the product less any discounts. Cost of sales excludes freight charges, purchase and delivery costs, internal transfer, freight charges and the other costs of the Company’s distribution network, which are identified in general and administrative expenses.
General and Administrative Expenses
General and administrative expenses are comprised principally of payroll and benefits costs for retail and corporate employees, occupancy costs of corporate facilities, lease expenses, management fees, traveling expenses and other operating and administrative expenses, including freight charges, purchase and delivery costs, internal transfer freight charges and other distribution costs.
Shipping and handling fees
The Company follows FASB ASC 605-45, “Handling Costs, Shipping Costs”. The Company does not charge its customers for shipping and handling. The Company classifies shipping and handling fees as part of General and administrative expenses. During the three and six months ended June 30, 2011 and 2010, the Company incurred shipping and handling fees and costs of $63, $56, $116 and $107, respectively.
Vendor Discounts
The Company has preferred pricing arrangements with vendors on certain products. These arrangements are not contingent on any levels of volume and are considered vendor discounts as opposed to rebates. The Company records these discounts along with the purchase of the discounted items, resulting in lower inventory cost and a corresponding lower cost of sales as the products are sold.
Management fees paid to the department stores under “store in store” model
Under the “store in store” business operation model, the Company may pay management fees to the department stores, which are in the form of service charges. The management fees are reflected in general and administrative expenses. Such management fees were $1,519, $2,986, $1,589 and $2,124 in selling, general and administrative expenses during the three and six months ended June 30, 2011 and 2010 respectively.
Share Based Payment
The Company follows FASB ASC 718-10, “Stock Compensation”, which addresses the accounting for transactions in which an entity exchanges its equity instruments for goods or services, with a primary focus on transactions in which an entity obtains employee services in share-based payment transactions. ASC 718-10 requires measurement of the cost of employee services received in exchange for an award of equity instruments based on the grant-date fair value of the award (with limited exceptions). Incremental compensation costs arising from subsequent modifications of awards after the grant date must be recognized.
Advertising
Advertising expenses consist primarily of costs of promotion for corporate image and product marketing and costs of direct advertising. The Company expenses all advertising costs as incurred. Advertising expense was $517, $114, $640 and $200 for the three and six months ended June 30, 2011 and 2010.
Income Taxes
The Company utilizes FASB ASC Topic 740 “Income Taxes”. Deferred income taxes are recognized for the tax consequences in future years of differences between the tax bases of assets and liabilities and their financial reporting amounts at each period end based on enacted tax laws and statutory tax rates applicable to the periods in which the differences are expected to affect taxable income. Valuation allowances are established, when necessary, to reduce deferred tax assets to the amount expected to be realized.
| 13 |
Basic and Diluted (Loss) per Share
(Loss) per share is calculated in accordance with FASB ASC Topic 260, “Earnings per Share”. Basic earnings (loss) per share are based upon the weighted average number of common shares outstanding. Diluted earnings (losses) per share are based on the assumption that all dilutive convertible shares and stock options were converted or exercised. Dilution is computed by applying the treasury stock method. Under this method, options and warrants are assumed to be exercised at the beginning of the period (or at the time of issuance, if later), and as if funds obtained thereby were used to purchase common stock at the average market price during the period. If convertible shares and stock options are anti-dilutive, the impact of conversion is not included in the diluted net income (loss) per share. Excluded from the calculation of diluted (loss) per share for the three and six months ended June 30, 2011 and 2010 was 50,000 and 100,000 options, as they were not dilutive.
Statement of Cash Flows
In accordance with FASB ASC Topic 230 “Statement of Cash Flows”, cash flows from the Company’s operations are calculated based upon the functional currency, in our case the RMB. As a result, amounts related to changes in assets and liabilities reported on the statement of cash flows will not necessarily agree with the changes in the corresponding balances on the balance sheet.
Concentration of Credit Risk
Financial instruments that potentially subject the Company to concentrations of credit risk are cash, accounts receivable, advances to suppliers and other receivables arising from its normal business activities. The Company places its cash in what it believes to be credit-worthy financial institutions. The Company has a diversified customer base, most of which is in China. The Company controls credit risk related to accounts receivable through credit approvals, credit limits and monitoring procedures. The Company routinely assesses the financial strength of its customers and, based upon factors surrounding the credit risk, establishes an allowance, if required, for uncollectible accounts and, as a consequence, believes that its accounts receivable credit risk exposure beyond such allowance is limited.
Segment Reporting
FASB ASC Topic 280, “Segment Reporting” requires use of the “management approach” model for segment reporting. The management approach model is based on the way a company’s management organizes segments within the company for making operating decisions and assessing performance. Reportable segments are based on products and services, geography, legal structure, management structure, or any other manner in which management disaggregates a company. The Company operated in four segments before the acquisition of Jinhua in July 2009. Since the acquisition of Jinhua, the Company operates in five segments (see Note 14).
Recent Accounting Pronouncements
FASB ASC Topic 860 “Transfers and Servicing” requires more information about transfers of financial assets and where companies have continuing exposure to the risks related to transferred financial assets. ASC 860 is effective at the start of a company’s first fiscal year beginning after November 15, 2009, or January 1, 2010 for companies reporting earnings on a calendar-year basis. The adoption of this statement had no material effect on the Company’s financial statements.
| 14 |
Revisions under FASB ASC Topic 810 “Consolidation”, revises how a company determines when an entity that is insufficiently capitalized or is not controlled through voting (or similar rights) should be consolidated. Under ASC 810, determining whether a company is required to consolidate an entity will be based on, among other things, an entity’s purpose and design and a company’s ability to direct the activities of the entity that most significantly impact the entity’s economic performance. ASC 810 is effective at the start of a company’s first fiscal year beginning after November 15, 2009, or January 1, 2010 for companies reporting earnings on a calendar-year basis. The adoption of ASC 810 had no impact on our financial statements.
In April 2010, FASB issued ASU 2010-13,Compensation – Stock Compensation (Topic 718): Effect of Denominating the Exercise Price of a Share-Based Payment Award in the Currency of the Market in Which the Underlying Equity Security Trades. ASU 2010-13 provides guidance on the classification of a share-based payment award as either equity or a liability. A share-based payment that contains a condition that is not a market, performance, or service condition is required to be classified as a liability. ASU 2010-13 is effective for fiscal years, and interim periods within those fiscal years, beginning on or after December 15, 2010. The adoption of this statement did not have a significant impact on the Company’s financial statements.
In April 2010, the FASB issued ASU 2010-17, “Revenue Recognition—Milestone Method (Topic 605): Milestone Method of Revenue Recognition”.This Update provides guidance on the recognition of revenue under the milestone method, which allows a vendor to adopt an accounting policy to recognize all of the arrangement consideration that is contingent on the achievement of a substantive milestone (milestone consideration) in the period the milestone is achieved. The pronouncement is effective on a prospective basis for milestones achieved in fiscal years and interim periods within those years, beginning on or after June 15, 2010. The adoption of this ASU did not have a material impact on the Company’s consolidated financial statements.
In July 2010, the FASB issued ASU 2010-20, “Receivables (Topic 310): Disclosures about the Credit Quality of Financing Receivables and the Allowance for Credit Losses”.The amendments in this Update are to provide financial statement users with greater transparency about an entity’s allowance for credit losses and the credit quality of its financing receivables. The disclosures about activity that occurs during the reporting period are effective for interim and annual reporting periods beginning on or after December 15, 2010. The adoption of this statement did not have a significant impact on the Company’s financial statements.
In December 2010, the FASB issued ASU 2010-29, “Business Combinations” (Topic 805): Disclosure of Supplementary Pro Forma Information for Business Combinations”. This ASU specifies that when financial statements are presented, the revenue and earnings of the combined entity should be disclosed as though the business combination that occurred during the current year had occurred as of the beginning of the comparable prior annual reporting period only. ASU 2010-29 is effective for business combinations with acquisition dates on or after January 1, 2011. The adoption of this statement did not have an impact on the Company’s consolidated financial statements.
In June 2011, FASB issued ASU 2011-05, Comprehensive Income (ASC Topic 220): Presentation of Comprehensive Income. Under the amendments in this update, an entity has the option to present the total of comprehensive income, the components of net income and the components of other comprehensive income either in a single continuous statement of comprehensive income or in two separate but consecutive statements. Under both options, an entity is required to present each component of net income along with total net income, each component of other comprehensive income along with a total for other comprehensive income and a total amount for comprehensive income. In a single continuous statement, the entity is required to present the components of net income and total net income, the components of other comprehensive income and a total for other comprehensive income, along with the total of comprehensive income in that statement. In the two-statement approach, an entity is required to present components of net income and total net income in the statement of net income. The statement of other comprehensive income should immediately follow the statement of net income and include the components of other comprehensive income and a total for other comprehensive income, along with a total for comprehensive income. In addition, the entity is required to present on the face of the financial statements reclassification adjustments for items that are reclassified from other comprehensive income to net income in the statement(s) where the components of net income and the components of other comprehensive income are presented. The amendments in this update should be applied retrospectively and are effective for fiscal years, and interim periods within those years, beginning after December 15, 2011. The Company is currently assessing the impact of adopting this statement on the Company’s financial statements.
| 15 |
Note 3 –ADVANCES TO SUPPLIERS
Advances to suppliers represent advance payments to suppliers for the purchase of inventory. As of June 30, 2011, we paid $2,243 advance payments to 14 suppliers, of which one supplier received $310 and ten suppliers received $155 each. The remaining three suppliers received $383 in total.
Note 4–ACCRUED EXPENSES
Accrued expenses as of June 30, 2011 and December 31, 2010 consist of the following:
| 2011 | 2010 | |||||||
| Accrued expenses and other payables | $ | 1,757 | $ | 4,512 | ||||
| VAT tax payable | 70 | 24 | ||||||
| Total | $ | 1,827 | $ | 4,536 | ||||
Accrued expenses include accrued salaries, staff welfare, accrued advertising expenses and rent expenses. Other payables include social insurance payable and miscellaneous tax payable.
Note 5 -COMMON STOCK
On January 17, 2011, China 3C entered into a Registered Trademark Transfer Agreement to purchase the registered trademark, “Lotour.” The term of the trademark expires on July 6, 2020. The consideration for the trademark was RMB 2,280,000 ($346), which was paid in the form of 1.08 million shares of the Company’s common stock, at $0.32 per share.
On January 20, 2011, Zhejiang entered into a Design and Development Engagement Agreement to design and develop an electronic book product under the brand name “Lotour.” The total consideration for the design and development of the electronic book product is RMB 3,160,000 ($480), which was paid in the form of 1.6 million shares of the Company’s common stock, at $0.30 per share. The term of the Development Agreement was from January 20, 2011 to July 19, 2011, at which date, the design and development agreement was completed and the “Lotour” electronic book started trial production.
Note 6 -STOCK WARRANTS, OPTIONS, AND COMPENSATION
Stock options— Options issued have a ten-year life and were fully vested upon issuance. The option holder has no voting or dividend rights. The grant price was the market price at the date of grant. The Company records the expense of the stock options over the related vesting period. The options were valued using the Black-Scholes option-pricing model at the date of grant stock option pricing.
Outstanding options by exercise price consisted of the following as of June 30, 2011.
| 16 |
| Options Outstanding | Options Exercisable | |||||||||||||||||||||
| Exercise Price | Number of Shares | Weighted Average Remaining Life (Years) | Weighted Average Exercise Price | Number of Shares | Weighted Average Exercise Price | |||||||||||||||||
| $ | 4.16 | 50,000 | 6.25 | $ | 4.16 | 50,000 | $ | 4.16 | ||||||||||||||
Note 7 -COMPENSATED ABSENCES
Regulation 45 of the labor laws in the PRC entitles employees to annual vacation leave after 1 year of service. In general all leave must be utilized annually, with proper notification. Any unutilized leave is cancelled.
Note 8 -INCOME TAXES
The Company, through its subsidiaries, Zhejiang, Wang Da, Sanhe, Joy & Harmony, Yiwu and Jinhua is governed by the Income Tax Laws of the PRC.
China 3C, which is a U.S. entity, is subject to the U.S. Federal income tax at 34%. China 3C has incurred net operating losses of $3,527 as of June 30, 2011 for income tax purposes. China 3C does not conduct any operations and only incurs expenses related to the public entity such as legal, accounting and investor relations, etc. Therefore, it is more likely than not that all of the Company’s deferred tax assets will not be realized. A 100% allowance was recorded on the deferred tax asset of $1,199 as of June 30, 2011.
The Company’s policy is to recognize interest and penalties accrued on any unrecognized tax benefits as a component of income tax expense. The Company did not have any accrued interest or penalty associated with any unrecognized tax benefits, nor was any interest expense recognized during the three and six months ended June 30, 2011 and 2010.
Pursuant to the PRC Income Tax Laws, from January 1, 2008, the Enterprise Income Tax (“EIT”) is calculated against the net income in a fiscal year at a statutory rate of 25%.
The following details a reconciliation of income tax expense for the six months ended June 30, 2011 and 2010:
| 2011 | U.S. | State | International | Total | ||||||||||||
| Current | $ | - | $ | - | $ | 129 | $ | 129 | ||||||||
| Deferred | - | - | - | - | ||||||||||||
| Total | $ | - | $ | - | $ | 129 | $ | 129 | ||||||||
| 2010 | U.S. | State | International | Total | ||||||||||||
| Current | $ | - | $ | - | $ | 190 | $ | 190 | ||||||||
| Deferred | - | - | - | - | ||||||||||||
| Total | $ | - | $ | - | $ | 190 | $ | 190 | ||||||||
The following details a reconciliation of income tax expense for the three months ended June 30, 2011 and 2010:
| 2011 | U.S. | State | International | Total | ||||||||||||
| Current | $ | - | $ | - | $ | 38 | $ | 38 | ||||||||
| Deferred | - | - | - | - | ||||||||||||
| Total | $ | - | $ | - | $ | 38 | $ | 38 | ||||||||
| 17 |
| 2010 | U.S. | State | International | Total | ||||||||||||
| Current | $ | - | $ | - | $ | 83 | $ | 83 | ||||||||
| Deferred | - | - | - | - | ||||||||||||
| Total | $ | - | $ | - | $ | 83 | $ | 83 | ||||||||
During the three and six months ended June 30, 2011, all subsidiaries had operating losses. Jinhua was the only subsidiary that incurred income tax expenses of $38 since it uses simplified tax, which imposes taxes on sales instead of operating income.
Reconciliation of the differences between the statutory U.S. Federal income tax rate and the effective rate is as follows:
| Three Months Ended June 30, | 2011 | 2010 | ||||||
| (Credit) tax at US statutory rate | (34.0 | )% | (34.0 | )% | ||||
| Tax rate difference | 8.7 | % | 9.0 | % | ||||
| Other | 0.7 | % | - | |||||
| Valuation allowance | 25.3 | % | 19.4 | % | ||||
| Effective rate | 0.7 | % | (5.6 | )% | ||||
| Six Months Ended June 30, | 2011 | 2010 | ||||||
| (Credit) tax at US statutory rate | (34.0 | )% | (34.0 | )% | ||||
| Tax rate difference | 8.2 | % | 9.0 | % | ||||
| Other | 1.1 | % | - | |||||
| Valuation allowance | 26.0 | % | 19.8 | % | ||||
| Effective rate | 1.3 | % | (5.2 | )% | ||||
Note 9 -COMMITMENTS
The Company leases office facilities under operating leases that terminate through 2014. Rent expense for the three and six months ended June 30, 2011 and 2010 was $120, $119, $247 and $255, respectively. The future minimum obligations under these agreements are as follows, by years, as of June 30, 2011:
| 2012 | $ | 366 | ||
| 2013 | 25 | |||
| 2014 | 27 | |||
| $ | 419 |
Note 10 -STATUTORY RESERVE
In accordance with the laws and regulations of the PRC, a WFOE’s income, after the payment of the PRC income taxes, shall be allocated to the statutory surplus reserves and statutory public welfare fund. Prior to January 1, 2006, the proportion of allocation for reserve was 10 percent of the profit after tax to the surplus reserve fund and additional 5-10 percent to the public affair fund. The public welfare fund reserve was limited to 50 percent of the registered capital. Effective January 1, 2006, there is now only one fund requirement. The reserve is 10 percent of income after tax, not to exceed 50 percent of registered capital.
| 18 |
Statutory reserve funds are restricted for set off against losses, expansion of production and operation or increase in register capital of the respective company. Statutory public welfare fund is restricted to the capital expenditures for the collective welfare of employees. These reserves are not transferable to the Company in the form of cash dividends, loans or advances. These reserves are therefore not available for distribution except in liquidation. As of June 30, 2011, the Company had allocated $11,543 to these non-distributable reserve funds.
Note 11 -OTHER COMPREHENSIVE INCOME
The detail of other comprehensive income, all of which arose from foreign currency translation, as included in stockholders’ equity at June 30, 2011 and December 31, 2010 are as follows:
| Foreign Currency Translation Adjustment | Total Accumulated Other Comprehensive Income | |||||||
| Balance at January 1, 2009 | $ | 5,272 | $ | 5,272 | ||||
| Change for 2009 | (92 | ) | (92 | ) | ||||
| Balance at December 31, 2009 | 5,180 | 5,180 | ||||||
| Change for 2010 | 1,526 | 1,526 | ||||||
| Balance at December 31, 2010 | 6,706 | 6,706 | ||||||
| Change for six months ended June 30, 2011 | 695 | 695 | ||||||
| Balance at June 30, 2011 | $ | 7,401 | $ | 7,401 | ||||
Note 12 -CURRENT VULNERABILITY DUE TO CERTAIN RISK FACTORS
The Company’s operations are in the PRC. Accordingly, the Company’s business, financial condition and results of operations may be influenced by the political, economic and legal environments in the PRC, by the general state of the PRC’s economy. The Company’s business may be influenced by changes in governmental policies with respect to laws and regulations, anti-inflationary measures, currency conversion and remittance abroad, and rates and methods of taxation, among other things.
Note 13 -MAJOR CUSTOMERS AND VENDORS
During the three and six months ended June 30, 2011 and 2010, no single customer accounted for more than 10% of the Company’s sales or accounts receivable and no single vendor accounted for more than 10% of the Company’s purchases.
Note 14 - SEGMENT INFORMATION
We separately operate and prepare accounting and other financial reports to management for five major business organizations: Wang Da, Sanhe, Yiwu, Joy & Harmony and Jinhua. Each operating company has different products and services. Wang Da sells mainly mobile phones, Sanhe sells mainly home appliances, Yiwu sells mainly office communication products, Joy & Harmony sells mainly consumer electronics and Jinhua provides transportation logistics to businesses. All segments are accounted for using the same principles as described in Note 2.
We identified five reportable segments required by FASB ASC Topic 280: (1) mobile phones, (2) home electronics, (3) office communication products, (4) consumer electronics and (5) logistics.
| 19 |
The following tables present summarized information by segment:
| Six Months Ended June 30, 2011 | ||||||||||||||||||||||||||||
| Mobile | Home | Communication | Consumer | |||||||||||||||||||||||||
| Phones | Electronics | Products | Electronics | Logistics | Other | Total | ||||||||||||||||||||||
| Sales, net (restated) | $ | 21,746 | $ | 21,223 | $ | 7,612 | $ | 18,152 | $ | 4,387 | $ | 276 | $ | 73,756 | ||||||||||||||
| Cost of sales (restated) | 20,371 | 19,596 | 6,844 | 16,428 | 4,869 | 260 | 68,368 | |||||||||||||||||||||
| Gross profit (restated) | 1,375 | 1,627 | 767 | 2,084 | (482 | ) | 16 | 5,387 | ||||||||||||||||||||
| Income (loss) from operations (restated) | (1,773 | ) | (2,304 | ) | (850 | ) | (2,040 | ) | (1,308 | ) | (1,623 | ) | (9,898 | ) | ||||||||||||||
| Six Months Ended June 30, 2010 | ||||||||||||||||||||||||||||
| Mobile | Home | Communication | Consumer | |||||||||||||||||||||||||
| Phones | Electronics | Products | Electronics | Logistics | Other | Total | ||||||||||||||||||||||
| Sales, net (restated) | $ | 21,451 | $ | 22,053 | $ | 10,953 | $ | 20,430 | $ | 5,516 | $ | 382 | $ | 80,785 | ||||||||||||||
| Cost of sales (restated) | 19,534 | 19,403 | 9,666 | 17,674 | 4,322 | 340 | 70,939 | |||||||||||||||||||||
| Gross profit (restated) | 1,917 | 2,595 | 1,287 | 2,756 | 1,194 | 42 | 9,846 | |||||||||||||||||||||
| Income (loss) from operations (restated) | (825 | ) | (873 | ) | (486 | ) | (628 | ) | 448 | (1,051 | ) | (3,415 | ) | |||||||||||||||
| Three Months Ended June 30, 2011 | ||||||||||||||||||||||||||||
| Mobile | Home | Communication | Consumer | |||||||||||||||||||||||||
| Phones | Electronics | Products | Electronics | Logistics | Other | Total | ||||||||||||||||||||||
| Sales, net (restated) | $ | 10,160 | $ | 10,375 | $ | 3,369 | $ | 8,501 | $ | 2,185 | $ | 74 | $ | 34,664 | ||||||||||||||
| Cost of sales (restated) | 9,573 | 9,612 | 3,000 | 7,466 | 2,575 | 79 | 32,305 | |||||||||||||||||||||
| Gross profit (loss) (restated) | 587 | 763 | 368 | 1,035 | (390 | ) | (5 | ) | 2,358 | |||||||||||||||||||
| Loss from operations (restated) | (1,028 | ) | (1,335 | ) | (505 | ) | (1,268 | ) | (867 | ) | (653 | ) | (5,656 | ) | ||||||||||||||
| Three Months Ended June 30, 2010 | ||||||||||||||||||||||||||||
| Mobile | Home | Communication | Consumer | |||||||||||||||||||||||||
| Phones | Electronics | Products | Electronics | Logistics | Other | Total | ||||||||||||||||||||||
| Sales, net (restated) | $ | 10,845 | $ | 10,686 | $ | 4,638 | $ | 9,535 | $ | 2,875 | $ | 148 | $ | 38,727 | ||||||||||||||
| Cost of sales (restated) | 9,803 | 9,326 | 3,995 | 7,978 | 2,277 | 127 | 33,506 | |||||||||||||||||||||
| Gross profit (restated) | 1,042 | 1,360 | 643 | 1,557 | 598 | 21 | 5,221 | |||||||||||||||||||||
| Income (loss) from operations (restated) | (379 | ) | (357 | ) | (276 | ) | (120 | ) | 198 | (632 | ) | (1,566 | ) | |||||||||||||||
Total assets by segment as of June 30, 2011 and December 31, 2010 are as follows:
| Mobile | Home | Communication | Consumer | |||||||||||||||||||||||||
| Phones | Electronics | Products | Electronics | Logistics | Other | Total | ||||||||||||||||||||||
| 2011 | $ | 11,210 | $ | 14,279 | $ | 7,643 | $ | 13,274 | $ | 15,469 | $ | 834 | $ | 62,709 | ||||||||||||||
| 2010 | $ | 10,993 | 14,988 | 9,967 | 18,536 | 15,837 | 2,810 | 73,131 | ||||||||||||||||||||
| 20 |
Note 15 - RESTATEMENT OF CONSOLIDATED STATEMENTS OF OPERATIONS AND COMPREHENSIVE INCOME (LOSS)
China 3C operates most of its retail operations through “store in store” model. Under this model, the Company leases space in major department stores and retailers. The Company does not pay the department stores fixed leasing costs. Instead, China 3C deducts a percentage of sales each month as compensation to the department stores. China 3C records such costs as “sales discount” as a deduction from net sales.
In response to the SEC comments of December 19, 2011, the Company reviewed “sales discount” and determined they should be reclassified as management fees. As a result, we reclassified “sales discount” from a contra revenue account to management fees as part of the selling, general and administrative expenses. The amount of $1,076 and $1,299 were previously classified in contra-revenue account as a deduction to net sales for the three months ended June 30, 2011 and 2010. The Company moved the amount to selling expenses, and it is reported as selling, general and administrative expenses in the statement of operations and comprehensive loss. The reclassification caused a $1,076 increase in net sales from $33,588 to $34,664 and a corresponding increase of $1,076 in Selling, general and administrative expenses from $6,939 to $8,015 in the second quarter 2011; a $1,299 increase in net sales from $37,428 to $38,727 and a corresponding increase of $1,299 in Selling, general and administrative expenses from $5,488 to $6,787 in the second quarter 2010. The gross profit increased $1,076 and $1,299 respectively in the second quarter 2011 and 2010. The loss from operations and net loss remained unchanged. The impact of the restatement was limited to the presentation of the consolidated statements of operations and comprehensive income (loss). The consolidated balance sheets, the consolidated statements of stockholders’ equity and the related consolidated statements of cash flows remained unaffected.
The table below summarizes the restatement changes to the consolidated statements of operations and comprehensive income (loss):
| Three months ended June 30, 2010 | ||||||||||||
| (as reported) | (as restated) | Change | ||||||||||
| Net sales | $ | 37,428 | $ | 38,727 | $ | 1,299 | ||||||
| Gross profit | 3,922 | 5,221 | 1,299 | |||||||||
| Selling, general and administrative expenses | 5,488 | 6,787 | 1,299 | |||||||||
| Three months ended June 30, 2011 | ||||||||||||
| (as reported) | (as restated) | Change | ||||||||||
| Net sales | $ | 33,588 | $ | 34,664 | $ | 1,076 | ||||||
| Gross profit | 1,283 | 2,359 | 1,076 | |||||||||
| Selling, general and administrative expenses | 6,939 | 8,015 | 1,076 | |||||||||
| 21 |
| Six months ended June 30, 2010 | ||||||||||||
| (as reported) | (as restated) | Change | ||||||||||
| Net sales | $ | 78,226 | $ | 80,785 | $ | 2,559 | ||||||
| Gross profit | 7,287 | 9,846 | 2,559 | |||||||||
| Selling, general and administrative expenses | 10,702 | 13,261 | 2,559 | |||||||||
| Six months ended June 30, 2009 | ||||||||||||
| (as reported) | (as restated) | Change | ||||||||||
| Net sales | $ | 71,474 | $ | 73,757 | $ | 2,283 | ||||||
| Gross profit | 3,106 | 5,389 | 2,283 | |||||||||
| Selling, general and administrative expenses | 13,004 | 15,287 | 2,283 | |||||||||
Item 2. Management’s Discussion and Analysis of Financial Condition and Results of Operations.
Forward Looking Statements
We have included and from time to time may make in our public filings, press releases or other public statements, certain statements, including, without limitation, those under “Management’s Discussion and Analysis of Financial Condition and Results of Operations”. In some cases these statements are identifiable through the use of words such as “anticipate,” “believe,” “estimate,” “expect,” “intend,” “plan,” “project,” “target,” “can,” “could,” “may,” “should,” “will,” “would” and similar expressions. You are cautioned not to place undue reliance on these forward-looking statements. In addition, our management may make forward-looking statements to analysts, investors, representatives of the media and others. These forward-looking statements are not historical facts and represent only our beliefs regarding future events, many of which, by their nature, are inherently uncertain and beyond our control.
The following discussion should be read in conjunction with the Consolidated Financial Statements and Notes thereto appearing elsewhere in this Form 10-Q. The following discussion contains forward-looking statements. Our actual results may differ significantly from those projected in the forward-looking statements. Factors that may cause future results to differ materially from those projected in the forward-looking statements include, but are not limited to, those discussed in “Risk Factors” in our Annual Report on Form 10-K for the year ended December 31, 2010 and elsewhere in this Form 10-Q.
| 22 |
Overview (All dollar amounts in thousands)
China 3C Group (including its subsidiaries unless the context indicates otherwise, “China 3C,” the “Company,” “we,” “us,” or “our”) was incorporated on August 20, 1998 under the laws of the State of Nevada. Capital Future Developments Limited (“Capital”) was incorporated on July 22, 2004 under the laws of the British Virgin Islands. Zhejiang Yong Xin Digital Technology Company Limited (“Zhejiang”), Yiwu Yong Xin Communication Limited (“Yiwu”), Hangzhou Wandda Electronics Company Limited (“Wang Da”), Hangzhou Sanhe Electronic Technology, Limited (“Sanhe”), and Shanghai Joy & Harmony Electronic Development Company Limited (“Joy & Harmony”) were incorporated under the laws of the Peoples Republic of China (“PRC” or “China”) on July 11, 2005, July 18, 1997, March 30, 1998, April 12, 2004, and August 25, 2003, respectively. China 3C owns 100% of Capital and Capital own 100% of the capital stock of Joy & Harmony and Sanhe. Until August 14, 2007, when it made the change to its ownership structure described in the next paragraph in order to comply with certain requirements of PRC law, Capital owned 100% of the capital stock of Zhenjiang. Zhejiang owns 90% and Yiwu owns 10% of Wang Da. Zhejiang owns 90% and Wang Da owns 10% of Yiwu. On March 10, 2009 Zhejiang set up a new operating entity, Hangzhou Letong Digital Technology Co., Ltd. (“Letong”) to establish an electronic retail franchise operation for China 3C Group. On July 6, 2009, Zhejiang and Yiwu acquired Jinhua Baofa Logistic Limited (“Jinhua”). Jinhua was incorporated under the laws of PRC on December 27, 2001.
On December 21, 2005, Capital became a wholly owned subsidiary of China 3C through a merger with a wholly owned subsidiary of the Company (the “Merger Transaction”). China 3C acquired all of the issued and outstanding capital stock of Capital pursuant to a Merger Agreement dated at December 21, 2005 by and among China 3C, XY Acquisition Corporation, Capital and the shareholders of Capital (the “Merger Agreement”). Pursuant to the Merger Agreement, Capital became a wholly owned subsidiary of China 3C and, for the Capital shares, China 3C issued 35,000,000 shares of its common stock to the shareholders of Capital, representing 93% of the issued and outstanding capital stock of China 3C at that time and cash of $500. On August 15, 2007, we executed a series of contractual agreements between Capital and Zhejiang. The contractual agreements give Capital and its equity owners an obligation, and having ability to absorb, any losses, and rights to receive returns; however, these contractual agreements did not change the equity ownership of Zhejiang. We did not dispose Capital’s actual equity ownership of Zhejiang when we execute the contractual agreements. Capital entered into share-holding entrustment agreements with five individuals - Zhenggang Wang, Yimin Zhang, Huiyi Lv, Xiaochun Wang and Zhongsheng Bao to hold 35%, 20%, 20%, 15% and 10%, respectively, of the equity interest of Zhejiang on behalf of Capital on November 21, 2005. The entrustment agreements confirm that Capital is the actual owner of Zhejiang. Capital enjoys the actual shareholder’s rights and has the right to obtain any benefits received by the nominal holders. Zhenggang Wang is the CEO and shareholder of China 3C Group. Yimin Zhang, Huiyi Lv, Xiaochun Wang and Zhongsheng Bao have no other relationship with China 3C Group. No consideration was given to these individuals who held the equity of Zhejiang on behalf of Capital.
On August 3, 2006, Capital completed the acquisition of 100% of the equity of Sanhe in exchange for a combination of cash and stock transaction valued at $8,750 (consisting of 915,751 newly issued shares of the Company’s common stock and $5,000 in cash).
On November 28, 2006, Capital completed the acquisition of 100% of the equity of Joy & Harmony in exchange for a combination of cash and stock valued at $18,500 (consisting of 2,723,110 shares of the Company’s common stock and $7,500 in cash).
On July 6, 2009, Zhejiang and Yiwu acquired Jinhua, a company organized under the laws of the PRC. Zhejiang acquired 90% and Yiwu acquired 10% of the entire equity interests in Jinhua from the shareholders of Jinhua for RMB 120,000,000 ($17,500) in cash.
Yiwu, Wangda, Sanhe and Joy & Harmony are engaged in the resale and distribution of third party products and generate approximately 100% of their revenue from resale of items such as mobile phones, facsimile machines, DVD players, stereos, speakers, MP3 and MP4 players, iPod, electronic dictionaries, CD players, radios, and audio systems. We sell and distribute products through retail stores and secondary distributors. We operate most of our retail operations through our “store in store” model. Under this model, the Company leases space in major department stores and retailers. Leasing costs can vary based on a percentage of sales, or can be fixed. In the three and six months ended June 30, 2011 and 2010, all of our stores in stores leases were variable based on sales.
| 23 |
In 2009, Zhejiang started establishing direct electronic retail stores and franchise operation. As of June 30, 2011, there are three direct stores and two franchise stores in operation.
Following the acquisition of Jinhua, the Company began providing logistical services to businesses in addition to its traditional business of resale and distribution of third party products such as mobile phones, facsimile machines, DVD players, stereos, speakers, MP3 and MP4 players, iPods, electronic dictionaries, CD players, radios and audio systems.
Results of Operations for the Three and Six months Ended June 30, 2011 and 2010
Reportable Operating Segments
The Company reports financial and operating information in the following five segments:
| a) | Yiwu |
| b) | Wang Da |
| c) | Sanhe |
| d) | Joy & Harmony |
| e) | Jinhua |
| a) | Yiwu |
Yiwu focuses on the selling, circulation and modern logistics of fax machines and cord phone products.
| Six months ended June 30, | Percentage | |||||||||||
| Yiwu | 2011 (restated) | 2010 (restated) | Change | |||||||||
| Revenue | $ | 7,612 | $ | 10,953 | (30.5 | )% | ||||||
| Gross Profit | 767 | 1,287 | (40.4 | )% | ||||||||
| Gross Profit Margin | 10.1 | % | 11.8 | % | (1.7 | )% | ||||||
| Operating Loss | (850 | ) | (486 | )) | (74.9 | )% | ||||||
| Three months ended June 30, | Percentage | |||||||||||
| Yiwu | 2011 (restated) | 2010 (restated) | Change | |||||||||
| Revenue | $ | 3,369 | $ | 4,638 | (27.4 | )% | ||||||
| Gross Profit | 368 | 643 | (42.8 | )% | ||||||||
| Gross Profit Margin | 10.9 | % | 13.9 | % | (3.0 | )% | ||||||
| Operating Loss | (505 | ) | (276 | ) | (83.0 | )% | ||||||
For the six months ended June 30, 2011, Yiwu generated revenue of $7,612, a decrease of $3,341 or 30.5% compared to $10,953 for the six months ended June 30, 2010. Gross profit decreased $520 or 40.4% from $1,287 for the six months ended June 30, 2010 to $767 for the six months ended June 30, 2011. Profit margin decreased 1.7% from 11.8% in the six months ended June 30, 2010 to 10.1% in the six months ended June 30, 2011.
| 24 |
For the three months ended June 30, 2011, Yiwu generated revenue of $3,369, a decrease of $1,269or 27.4% compared to $4,638 for the three months ended June 30, 2010. Gross profit decreased $275 or 42.8% from $643 for the three months ended June 30, 2010 to $368 for the three months ended June 30, 2011. Gross profit margin decreased 3.0% from 13.9% in the three months ended June 30, 2010 to 10.9% in the three months ended June 30, 2011.
The decrease in revenue was a result of lower market demand for office appliances such as fax machines and telephones. Lower profit margin was also due to shrinking demand as well as increased promotional events in 2011 to maintain market share. Since market demand decreased, Yiwu did not have the bargaining power to increase unit sales price as much as the increase in purchase costs of office appliances.
Operating loss was $850 and $505 for the six and three months ended June 30, 2011, an increase of $364 and $229 compared to $486 and $276 for the six and three months ended June 30, 2010. Operating loss increased primarily due to decreased gross profit, an increase in labor cost and management fees paid to department stores.
| b) | Wang Da |
Wang Da focuses on the selling, circulation and modern logistics of cell phones, cell phones products, and digital products, including digital cameras, digital camcorders, PDAs, flash disks, and removable hard disks.
| Six months ended June 30, | Percentage | |||||||||||
| Wang Da | 2011 (restated) | 2010 (restated) | Change | |||||||||
| Revenue | $ | 21,746 | $ | 21,451 | 1.4 | % | ||||||
| Gross Profit | 1,375 | 1,917 | (28.3 | )% | ||||||||
| Gross Profit Margin | 6.3 | % | 8.9 | % | (2.6 | )% | ||||||
| Operating Loss | (1,773 | ) | (825 | ) | (114.9 | )% | ||||||
| Three months ended June 30, | Percentage | |||||||||||
| Wang Da | 2011 (restated) | 2010 (restated) | Change | |||||||||
| Revenue | $ | 10,160 | $ | 10,845 | (6.3 | )% | ||||||
| Gross Profit | 587 | 1,042 | (43.7 | )% | ||||||||
| Gross Profit Margin | 5.8 | % | 9.6 | % | (3.8 | )% | ||||||
| Operating Loss | (1,028 | ) | (379 | ) | (171.2 | )% | ||||||
For the six months ended June 30, 2011, Wang Da generated revenue of $21,746, an increase of $295 or 1.4% compared to $21,451 for the six months ended June 30, 2010. Gross profit decreased $542 or 28.3% from $1,917 for the six months ended June 30, 2010 to $1,375 for the six months ended June 30, 2011. Gross profit margin decreased from 8.9% in the six months ended June 30, 2010 to 6.3% in the six months ended June 30, 2011, a decrease of 2.6%.
For the three months ended June 30, 2011, Wang Da generated revenue of $10,160, a decrease of $685 or 6.3% compared to $10,845 for the three months ended June 30, 2010. Gross profit decreased $455 or 43.7% from $1,042 for the three months ended June 30, 2010 to $587 for the three months ended June 30, 2011. Gross profit margin decreased from 9.6% in the three months ended June 30, 2010 to 5.8% in the three months ended June 30, 2011, a decrease of 3.8%.
| 25 |
The increase in revenue was primarily due to a higher amount of sales from international brands such as Nokia and Motorola, which usually have a higher unit price compared to domestic brands. The decrease in gross profit and gross profit margin was due to the decrease in demand for domestic cell phones, which had a higher gross profit margin than brand name cell phones such as Nokia, Motorola and Samsung.
Operating loss was $1,773 and $1,028 for the six and three months ended June 30, 2011, an increase of $948 and $649 compared to $825 and $379 for the six and three months ended June 30, 2010. Operating loss increased primarily due to decreased gross profit, an increase in labor cost and management fees paid to department stores.
| c) | Sanhe |
Sanhe focuses on the selling, circulation and modern logistics of home electronics, including DVD players, audio systems, speakers, televisions and air conditioners.
| Six months ended June 30, | Percentage | |||||||||||
| Sanhe | 2011 (restated) | 2010 (restated) | Change | |||||||||
| Revenue | $ | 21,223 | $ | 22,053 | (3.8 | )% | ||||||
| Gross Profit | 1,627 | 2,650 | (38.6 | )% | ||||||||
| Gross Profit Margin | 7.7 | % | 12.0 | % | (4.3 | )% | ||||||
| Operating Loss | (2,304 | ) | (873 | ) | (163.9 | )% | ||||||
| Three months ended June 30, | Percentage | |||||||||||
| Sanhe | 2011 (restated) | 2010 (restated) | Change | |||||||||
| Revenue | $ | 10,375 | $ | 10,686 | (2.9 | )% | ||||||
| Gross Profit | 763 | 1,360 | (43.9 | )% | ||||||||
| Gross Profit Margin | 7.4 | % | 12.7 | % | (5.3 | )% | ||||||
| Operating Loss | (1,335 | ) | (357 | ) | (273.9 | )% | ||||||
For the six months ended June 30, 2011, Sanhe generated revenue of $21,223, a decrease of $830 or 3.8% compared to $22,053 for the six months ended June 30, 2010. Gross profit decreased $1,023 or 38.6% from $2,650 for the six months ended June 30, 2010 to $1,627 for the six months ended June 30, 2011. Gross profit margin decreased from 12.0% in 2010 to 7.7% in 2011, a decrease of 4.3%.
For the three months ended June 30, 2011, Sanhe generated revenue of $10,375, a decrease of $311 or 2.9% compared to $10,686 for the three months ended June 30, 2010. The decrease was a result of decline in market demand of DVD players and speakers. Gross profit decreased $599 or 43.9% from $1,360 for the three months ended June 30, 2010 to $763 for the three months ended June 30, 2011. Gross profit margin decreased from 12.7% in 2010 to 7.4% in 2011, a decrease of 5.3%. The decrease was a result of higher sales of televisions in the first quarter of 2011 compared to higher sales in DVD players and speakers in the first quarter of 2010, which have higher profit margin compared to other home electronics products.
Operating loss was $2,304 and $1,335 for the six and three months ended June 30, 2011, an increase of $1,431 and $978 compared to $873 and $357 for the six and three months ended June 30, 2010. Operating loss increased primarily due to decreased gross profit, an increase in labor cost and management fees paid to department stores.
| d) | Joy & Harmony |
Joy & Harmony focuses on the selling, circulation and modern logistics of consumer electronics, including MP3 players, MP4 players, iPods, electronic dictionaries, and radios.
| 26 |
| Six months ended June 30, | Percentage | |||||||||||
| Joy & Harmony | 2011 (restated) | 2010 (restated) | Change | |||||||||
| Revenue | $ | 18,512 | $ | 20,430 | (9.4 | )% | ||||||
| Gross Profit | 2,084 | 2,756 | (24.4 | )% | ||||||||
| Gross Profit Margin | 11.3 | % | 13.5 | % | (2.2 | )% | ||||||
| Operating Loss | (2,040 | ) | (628 | ) | (224.8 | )% | ||||||
| Three months ended June 30, | Percentage | |||||||||||
| Joy & Harmony | 2011 (restated) | 2010 (restated) | Change | |||||||||
| Revenue | $ | 8,501 | $ | 9,535 | (10.8 | )% | ||||||
| Gross Profit | 1,035 | 1,557 | (33.5 | )% | ||||||||
| Gross Profit Margin | 12.2 | % | 16.3 | % | (4.2 | )% | ||||||
| Operating Loss | (1,268 | ) | (120 | ) | (956.7 | )% | ||||||
For the six months ended June 30, 2011, Joy & Harmony generated revenue of $18,512, a decrease of $1,918 or 9.4% compared to $20,430 for the six months ended June 30, 2010. Gross profit decreased $672 or 24.4% from $2,756 for the six months ended June 30, 2010 to $2,084 for the six months ended June 30, 2011. Gross profit margin decreased from 13.5% in 2010 to 11.3% in 2011, a decrease of 2.2%.
For the three months ended June 30, 2011, Joy & Harmony generated revenue of $8,501, a decrease of $690 or 10.8% compared to $9,535 for the three months ended June 30, 2010. Gross profit decreased $522 or 33.5% from $1,557 for the three months ended June 30, 2010 to $1,035 for the three months ended June 30, 2011. Gross profit margin decreased from 16.3% in 2010 to 12.2% in 2011, a decrease of 4.2%.
The decrease in revenue was due to a lower demand for small digital products such as MP3 and MP4. The decrease in gross profit margin was primarily due to a higher percentage of sales from international brands, which usually have lower profit margin than domestic brands.
Operating loss was $2,040 and $1,268 for the six and three months ended June 30, 2011, an increase of $1,412 and $1,148 compared to $628 and $120 for the six and three months ended June 30, 2010. Operating loss increased primarily due to decreased gross profit and increased operating expenses including an increase in base salary for all staff and management fees paid to the department stores. In addition, Joy & Harmony incurred additional promotional expenses to market the new E-book reader under the brand “Lotour”. These promotional expenses of $537 also contributed to the increase in operating loss.
| e) | Jinhua |
Jinhua provides transportation service to business and transports freight, including electronics, machinery and equipment, metal products, chemical materials, garments and handicraft goods, in more than 20 cities in Eastern China. Its transportation services cover many of the most developed cities in Eastern China such as Shanghai, Hangzhou and Nanjing.
| Six months ended June 30, | Percentage | |||||||||||
| Jinhua | 2011 | 2010 | Change | |||||||||
| Revenue | $ | 4,387 | $ | 5,516 | (20.5 | )% | ||||||
| Gross Profit | (482 | ) | 1,194 | (140.4 | )% | |||||||
| Gross Profit Margin | (11.0 | )% | 21.7 | % | (32.7 | )% | ||||||
| Operating (Loss)/Income | (1,308 | ) | 448 | (392.0 | )% | |||||||
| 27 |
| Three months ended June 30, | Percentage | |||||||||||
| Jinhua | 2011 | 2010 | Change | |||||||||
| Revenue | $ | 2,185 | $ | 2,875 | (24.0 | )% | ||||||
| Gross Profit | (390 | ) | 598 | (165.2 | )% | |||||||
| Gross Profit Margin | (17.8 | )% | 20.8 | % | (38.6 | )% | ||||||
| Operating (Loss)/Income | (867 | ) | 198 | (537.9 | )% | |||||||
For the six months ended June 30, 2011, Jinhua generated revenue of $4,387, a decrease of $1,129 or 20.5% compared to $5,516 for the six months ended June 30, 2010. Gross profit decreased $1,676 or 140.4% from $1,194 for the six months ended June 30, 2010 to $(482) for the six months ended June 30, 2010. Gross profit margin decreased from 21.7% in 2010 to (11.0)% in 2011, a decrease of 32.7%.
For the three months ended June 30, 2011, revenue decreased from $2,875 for the three months ended June 30, 2010 to $2,185, a decrease of $690 or 24.0%. Gross profit decreased $988 or 165.2% from $598 for the three months ended June 30, 2010 to $(390) for the three months ended June 30, 2011. Gross profit margin decreased 38.6% from 20.8% for the three months ended June 30, 2010 to (17.8)% for the three months ended June 30, 2011.
The logistics industry is experiencing a downturn. While fuel and labor costs continue to rise, and toll rates remain high, the price for transportation did not increase accordingly. Therefore, revenue and gross profit margin decreased. Operating income decreased primarily due to decreased gross profit margin. Higher operating expenses, labor cost in particular, also caused operating income to decrease.
Net Sales
Net sales for the six months ended June 30, 2011 decreased by 8.7%, to $73,757 (restated) compared to $80,785 (restated) for the six months ended June 30, 2010. Net sales for the three months ended June 30, 2011 decreased by 10.5%, to $34,664 (restated) compared to $38,727 (restated) for the three months ended June 30, 2010. Management believes the sales decrease was a result of various factors including a slowdown in the retail markets in general, weaker demand for consumer and business electronics as well as the pressure of increased competitions from supermarkets, internet commerce and increased TV shopping networks.
Cost of Sales
Cost of sales for the six months ended June 30, 2011 was $68,368 compared to $70,939 for the six months ended June 30, 2010, a decrease of 3.6%. Cost of sales for the three months ended June 30, 2011 was $32,305 compared to $33,506 for the three months ended June 30, 2010, a decrease of 3.6%. The decreased cost of sales for the three months was a result of the decrease in sales from the comparable period. In addition, higher fuel cost and higher cost of consumer electronics also contributed to the increased cost of sales.
Gross Profit Margin
Gross profit margin for the six months ended June 30, 2011 was 7.3% (restated) compared to 12.2% (restated) for the six months ended June 30, 2010. Gross profit margin for the three months ended June 30, 2011 was 6.8% (restated) compared to 13.5% (restated) for the three months ended June 30, 2010. The lower gross profit margin was primarily due to the decreased unit sales prices of consumer and business electronics in the competitive market in China. In addition, international brand name electronics represented a higher percentage of sales in the first six months of 2011 compared to 2010. The increased sales of brand name electronics led to lower gross profit margin since brand name electronics have lower gross profit margins compared to domestic products. For the logistics segment, the decrease in gross profit margin was primarily due to increased fuel cost.
| 28 |
General and Administrative Expenses
General and administrative expenses for the six months ended June 30, 2011 were $15,287 (restated) or 20.7% of net sales, compared to $13,261 (restated) or 16.4% of net sales for the six months ended June 30, 2010, an increase of 15.3%. General and administrative expenses for the three months ended June 30, 2011 were $8,015 (restated) or 23.1% of net sales, compared to $6,787 (restated) or 17.5% of net sales for the three months ended June 30, 2010, an increase of 18.1%. The increase in general and administrative expenses for the three and six months ended June 30, 2011 was primarily due to an increase in labor cost and an increase in advertising and promotional expenses to market “Lotour” E-book reader.
Loss from Operations
Operating loss for the six months ended June 30, 2011 was $9,898 or 13.4% of net sales compared to $3,415 or 4.2% of net sales for the six months ended June 30, 2010, a decrease of 189.8%. Operating loss for the three months ended June 30, 2011 was $5,656 or 16.3% of net sales compared to $1,566 or 4.0% of net sales for the three months ended June 30, 2010, a decrease of 261.2%. Lower sales, lower gross profit margin as well as increased operating expenses were the key factors for the increase in loss from operations during the three and six months ended June 30, 2011 compared to 2010.
Provision for Income Taxes
The provision for income taxes for the six months ended June 30, 2011 was $129 compared to $190 for the six months ended June 30, 2010. The provision for income taxes for the three months ended June 30, 2011 was $38 compared to $83 for the three months ended June 30, 2010. Income tax expense was not significant due to all subsidiaries of China 3C having losses in the three and six months ended June 30, 2011. Jinhua was the only subsidiary that incurred nominal income tax expenses because Jinhua uses simplified tax system, which imposes taxes on sales instead of operating income.
Net Loss
Net loss was $10,193 or 14.8% of net sales for the six months ended June 30, 2011 compared to $3,595 or 4.5% of net sales for the six months ended June 30, 2010, a decrease of 183.5%. Net loss was $5,734 or 16.5% of net sales for the three months ended June 30, 2011 compared to $1,668 or 4.3% of net sales for the three months ended June 30, 2010, a decrease of 243.8%. Decreased sales revenue, lower gross profit margin and higher operating expenses were the critical factors which contributed to the decrease in net income.
Liquidity and Capital Resources
Operations and liquidity needs are funded primarily through cash flows from operations. Cash and equivalents were $17,330 at June 30, 2011, compared to $29,123 at June 30, 2010, and $26,249 at December 31, 2010.
We believe the funds available to us are adequate to meet our operating needs for the remainder of 2011.
Our cash flows for the six month periods are summarized as follows:
| 2011 | 2010 | |||||||
| Net cash (used in) operating activities | $ | (9,640 | ) | $ | (625 | ) | ||
| Net cash (used in) investing activities | (2 | ) | (18 | ) | ||||
| Effect of exchange rate change on cash and equivalents | 723 | (142 | ) | |||||
| Net decrease in cash and equivalents | (8,919 | ) | (785 | ) | ||||
| Cash and equivalents at beginning of period | 26,249 | 29,908 | ||||||
| Cash and equivalents at end period | $ | 17,330 | $ | 29,123 | ||||
| 29 |
Operating Activities
Net cash used in operating activities was $9,640 for the six months ended June 30, 2011 compared to $625 for the six months ended June 30, 2010, a 1442.4% increase. The increase was mainly attributable to several factors, including (i) net loss of $10,193; (ii) decrease in accrued expenses of $2,778, offset by the decrease in tax receivable of $1,089 in the six months ended June 30, 2011, and add back stock compensation of $746 and amortization expense of $703.
| Six months ended June 30, | ||||||||||||
| 2011 | 2010 | Percentage Change | ||||||||||
| Sales, Net | $ | 73,757 | $ | 80,785 | (8.7 | )% | ||||||
| Accounts receivable | $ | 10,991 | $ | 15,547 | (29.3 | )% | ||||||
Accounts receivable decreased 29.3% in the first six months of 2011 while sales decreased 8.7%. Management monitors and periodically assesses the collectability of accounts receivable to ensure the allowance for bad debt account is reasonably estimated. Collection of debt is based on the terms of legal binding documents. Our account receivable department has periodically reviewed the allowance for doubtful accounts. The bad debt allowance is based on the aging of receivables, credit history and credit quality of the customers, the term of the contracts as well as the balance outstanding. If an account receivable item is considered probable to be uncollectible, it will be charged to bad debts immediately.
Capital Expenditures
We did not have any capital expenditures for the first six months of 2011 or 2010.
Working Capital Requirements
Historically operations and short term financing have been sufficient to meet our cash needs. We believe we will be able to generate revenues from sales and raise capital through private placement offerings of our equity securities to provide the necessary cash flow to meet anticipated working capital requirements. However, our working capital needs for the long and short term will depend upon numerous factors, including operating results, competition, and the availability of credit facilities, none of which can be predicted with certainty. Future expansion will be limited by the availability of financing products and raising capital.
Off-Balance Sheet Arrangements
We have never entered into any off-balance sheet arrangements and have never established any special purpose entities. We have not guaranteed any debt or commitments of other entities or entered into any options on non-financial assets.
Critical Accounting Policies
Our discussion and analysis of our financial condition and results of operations is based upon our consolidated financial statements, which were prepared in accordance with accounting principles generally accepted in the United States. The preparation of these consolidated financial statements requires us to make estimates, judgments and assumptions that affect the reported amounts of assets, liabilities, revenues and expenses, and the related disclosure of contingent assets and liabilities. We base our estimates on historical experience and on various other assumptions that we believe are reasonable under the circumstances, the results of which form the basis for making judgments about the carrying values of assets and liabilities that are not readily apparent from other sources. Actual results may differ from these estimates.
| 30 |
An accounting policy is considered to be critical if it requires an accounting estimate to be made based on assumptions about matters that are highly uncertain at the time the estimates are made, and if different estimates that reasonably could have been used, or changes in the accounting estimates that are reasonably likely to occur, could materially impact the consolidated financial statements. We believe the following critical accounting policies reflect the more significant estimates and assumptions used in the preparation of the consolidated financial statements.
Revenue Recognition
Our revenues are generated from sales of electronics products. All of our revenue transactions contain standard business terms and conditions. We determine the appropriate accounting for these transactions after considering (1) whether a contract exists; (2) when to recognize revenue on the deliverables; and (3) whether all elements of the contract have been fulfilled and delivered. In addition, our revenue recognition policy requires an assessment as to whether collection is reasonably assured, which inherently requires us to evaluate the creditworthiness of our customers. Changes in judgments on these assumptions and estimates could materially impact the timing or amount of revenue recognition.
Please refer to Note 2 in the footnotes to the financial statements for detailed description of our revenue recognition policy.
Inflation
Neither inflation nor changing prices has had a material impact on the Company’s net sales, revenues or income from continuing operations during the past three fiscal years.
After Sales Service
The after-sales services we provide to our customers are primarily repair and maintenance. If a customer buys a product from us and needs repairs, we typically arrange to have the manufacturer repair the product. In certain cases, clerks in our stores are able to make the repairs directly.
Tabular Disclosure of Contractual Obligations
The following table sets forth our contractual obligations as of June 30, 2011:
| Payment Due by Period | ||||||||||||||||||||
| Less than 1 | More than | |||||||||||||||||||
| Contractual Obligations | Total | year | 1-3 years | 3-5 years | 5 years | |||||||||||||||
| Operating lease obligations | $ | 419 | $ | 366 | $ | 53 | $ | - | $ | - | ||||||||||
| Advertising obligations | 348 | 348 | - | - | - | |||||||||||||||
| Total contractual obligations | $ | 767 | $ | 714 | $ | 53 | $ | - | $ | - | ||||||||||
| 31 |
Item 4. Controls and Procedures.
Evaluation of Disclosure Controls and Procedures
Under the supervision and with the participation of our management, including our principal executive officer and principal financial officer, our management conducted an evaluation of our disclosure controls and procedures as of June 30, 2011, as such term is defined in Rules 13a-15(e) and 15d-15(e) under the Exchange Act. Based on this evaluation, our principal executive officer and principal financial officer concluded that, as of such date, the Company’s disclosure controls and procedures were not effective due to: the current staff in our accounting department are inexperienced in US GAAP. They need substantial training to meet the demands of a US public company. The accounting skills and understanding necessary to fulfill the requirements of US GAAP-based reporting, including the preparation of financial statements and consolidation, are inadequate.
Disclosure controls and procedures are designed to provide that information required to be disclosed by us in reports that we file or submit under the Exchange Act is accumulated, recorded, processed, summarized, communicated to our management, including our principal executive officer and principal financial officer and reported within the time periods specified in Securities and Exchange Commission rules and forms.
Changes in Internal Control over Financial Reporting
Other than the changes relating to the material weakness described above, there was no change in our internal control over financial reporting that occurred during the second quarter of 2011 covered by this Quarterly Report on Form 10-Q/A that has materially affected, or is reasonably likely to materially affect, our internal control over financial reporting.
PART II. OTHER INFORMATION
Item 6. Exhibits.
| Exhibit No. | Document Description | |
| 31.1 | Certification of the Chief Executive Officer pursuant to Rule 13A-14(A)/15D-14(A) of the Securities Exchange Act of 1934, as adopted pursuant to Section 302 of the Sarbanes-Oxley Act of 2002. | |
| 31.2 | Certification of the Chief Financial Officer pursuant to Rule 13A-14(A)/15D-14(A) of the Securities Exchange Act of 1934, as adopted pursuant to Section 302 of the Sarbanes-Oxley Act of 2002. | |
| 32.1 | Certification of the Chief Executive Officer and Chief Financial Officer pursuant to 18 U.S.C. 1350 (Section 906 of the Sarbanes-Oxley Act of 2002). | |
| 101 | The following financial statements from China 3C Group’s Quarterly Report on Form 10-Q for the quarterly period ended June 30, 2011 formatted in XBRL (eXtensible Business Reporting Language): (i) the Consolidated Balance Sheets (unaudited); (ii) the Consolidated Statements of Operations and Comprehensive Loss (unaudited); (iii) the Consolidated Statements of Cash Flows (unaudited); and, (iv) the Notes to Consolidated Financial Statements, tagged as blocks of text. |
| 32 |
SIGNATURES
Pursuant to the requirements of the Securities Exchange Act of 1934, the registrant has duly caused this report to be signed on its behalf by the undersigned thereunto duly authorized.
| CHINA 3C GROUP | ||
| Date: May ___, 2012 | By: | /s/ |
| Name: Zhenggang Wang | ||
| Title: Chief Executive Officer and Chairman | ||
| (Principal Executive Officer) | ||
| Date: May ___, 2012 | By: | /s/ |
| Name: Weiping Wang | ||
Title: Chief Financial Officer (Principal Accounting and Financial Officer) | ||
EXHIBIT INDEX
| Exhibit No. | Document Description | |
| 31.1 | Certification of the Chief Executive Officer pursuant to Rule 13A-14(A)/15D-14(A) of the Securities Exchange Act of 1934, as adopted pursuant to Section 302 of the Sarbanes-Oxley Act of 2002. | |
| 31.2 | Certification of the Chief Financial Officer pursuant to Rule 13A-14(A)/15D-14(A) of the Securities Exchange Act of 1934, as adopted pursuant to Section 302 of the Sarbanes-Oxley Act of 2002. | |
| 32.1 | Certification of the Chief Executive Officer and Chief Financial Officer pursuant to 18 U.S.C. 1350 (Section 906 of the Sarbanes-Oxley Act of 2002). | |
| 101 | The following financial statements from China 3C Group’s Quarterly Report on Form 10-Q for the quarterly period ended June 30, 2011 formatted in XBRL (eXtensible Business Reporting Language): (i) the Consolidated Balance Sheets (unaudited); (ii) the Consolidated Statements of Operations and Comprehensive Loss (unaudited); (iii) the Consolidated Statements of Cash Flows (unaudited); and, (iv) the Notes to Consolidated Financial Statements, tagged as blocks of text. |
| 33 |
Exhibit 31.1
Certification of Chief Executive Officer Pursuant to
Securities Exchange Act Rules 13a-14(a) and 15d-14(a)
as Adopted Pursuant to Section 302 of the Sarbanes-Oxley Act of 2002
I, Zhenggang Wang, certify that:
1. I have reviewed this quarterly report on Form 10-Q/A of China 3C Group;
2. Based on my knowledge, this report does not contain any untrue statement of a material fact or omit to state a material fact necessary to make the statements made, in light of the circumstances under which such statements were made, not misleading with respect to the period covered by this report;
3. Based on my knowledge, the financial statements, and other financial information included in this report, fairly present in all material respects the financial condition, results of operations and cash flows of the registrant as of, and for, the periods presented in this report;
4. The registrant’s other certifying officer and I are responsible for establishing and maintaining disclosure controls and procedures (as defined in Exchange Act Rules 13a-15(e) and 15d-15(e)) and internal control over financial reporting (as defined in Exchange Act Rules 13a-15(f) and 15d-15(f)) for the registrant and have:
(a) Designed such disclosure controls and procedures, or caused such disclosure controls and procedures to be designed under our supervision, to ensure that material information relating to the registrant, including its consolidated subsidiaries, is made known to us by others within those entities, particularly during the period in which this report is being prepared;
(b) Designed such internal control over financial reporting, or caused such internal control over financial reporting to be designed under our supervision, to provide reasonable assurance regarding the reliability of financial reporting and the preparation of financial statements for external purposes in accordance with generally accepted accounting principles;
(c) Evaluated the effectiveness of the registrant’s disclosure controls and procedures and presented in this report our conclusions about the effectiveness of the disclosure controls and procedures, as of the end of the period covered by this report based on such evaluation; and
(d) Disclosed in this report any change in the registrant’s internal control over financial reporting that occurred during the registrant’s most recent fiscal quarter (the registrant’s fourth fiscal quarter in the case of an annual report) that has materially affected, or is reasonably likely to materially affect, the registrant’s internal control over financial reporting; and
5. The registrant’s other certifying officer and I have disclosed, based on our most recent evaluation of internal control over financial reporting, to the registrant’s auditors and the audit committee of the registrant’s board of directors (or persons performing the equivalent functions):
(a) All significant deficiencies and material weaknesses in the design or operation of internal control over financial reporting which are reasonably likely to adversely affect the registrant’s ability to record, process, summarize and report financial information; and
(b) Any fraud, whether or not material, that involves management or other employees who have a significant role in the registrant’s internal control over financial reporting.
| May ___, 2012 | ||
| Zhenggang Wang, Chief Executive Officer and Chairman | ||
| (Principal Executive Officer) | ||
Exhibit 31.2
Certification of Chief Financial Officer Pursuant to
Securities Exchange Act Rules 13a-14(a) and 15d-14(a)
as Adopted Pursuant to Section 302 of the Sarbanes-Oxley Act of 2002
I, Weiping Wang, certify that:
1. I have reviewed this quarterly report on Form 10-Q/A of China 3C Group;
2. Based on my knowledge, this report does not contain any untrue statement of a material fact or omit to state a material fact necessary to make the statements made, in light of the circumstances under which such statements were made, not misleading with respect to the period covered by this report;
3. Based on my knowledge, the financial statements, and other financial information included in this report, fairly present in all material respects the financial condition, results of operations and cash flows of the registrant as of, and for, the periods presented in this report;
4. The registrant’s other certifying officer and I are responsible for establishing and maintaining disclosure controls and procedures (as defined in Exchange Act Rules 13a-15(e) and 15d-15(e)) and internal control over financial reporting (as defined in Exchange Act Rules 13a-15(f) and 15d-15(f)) for the registrant and have:
(a) Designed such disclosure controls and procedures, or caused such disclosure controls and procedures to be designed under our supervision, to ensure that material information relating to the registrant, including its consolidated subsidiaries, is made known to us by others within those entities, particularly during the period in which this report is being prepared;
(b) Designed such internal control over financial reporting, or caused such internal control over financial reporting to be designed under our supervision, to provide reasonable assurance regarding the reliability of financial reporting and the preparation of financial statements for external purposes in accordance with generally accepted accounting principles;
(c) Evaluated the effectiveness of the registrant’s disclosure controls and procedures and presented in this report our conclusions about the effectiveness of the disclosure controls and procedures, as of the end of the period covered by this report based on such evaluation; and
(d) Disclosed in this report any change in the registrant’s internal control over financial reporting that occurred during the registrant’s most recent fiscal quarter (the registrant’s fourth fiscal quarter in the case of an annual report) that has materially affected, or is reasonably likely to materially affect, the registrant’s internal control over financial reporting; and
5. The registrant’s other certifying officer and I have disclosed, based on our most recent evaluation of internal control over financial reporting, to the registrant’s auditors and the audit committee of the registrant’s board of directors (or persons performing the equivalent functions):
(a) All significant deficiencies and material weaknesses in the design or operation of internal control over financial reporting which are reasonably likely to adversely affect the registrant’s ability to record, process, summarize and report financial information; and
(b) Any fraud, whether or not material, that involves management or other employees who have a significant role in the registrant’s internal control over financial reporting.
| May ___, 2012 | ||
| Weiping Wang, Chief Financial Officer | ||
| (Principal Financial and Accounting Officer) |
Exhibit 32.1
CERTIFICATION PURSUANT TO 18 U.S.C. SECTION 1350,
AS ADOPTED PURSUANT TO SECTION 906
OF THE SARBANES-OXLEY ACT OF 2002
In connection with the Quarterly Report of China 3C Group (the “Company”) on Form 10-Q/A for the period ended June 30, 2011 as filed with the Securities and Exchange Commission on the date hereof (the “Report”), each of the undersigned officers of the Company hereby certifies, pursuant to 18 U.S.C. § 1350, as adopted pursuant to § 906 of the Sarbanes-Oxley Act of 2002, that:
1. The Report fully complies with the requirements of Section 13(a) or 15(d) of the Securities Exchange Act of 1934; and
2. Information contained in the Report fairly presents, in all material respects, the financial condition and results of operations of the Company.
| May ___, 2012 | ||
| Zhenggang Wang, Chief Executive Officer and Chairman | ||
| (Principal Executive Officer) | ||
| May ___, 2012 | ||
| Weiping Wang, Chief Financial Officer | ||
| (Principal Financial and Accounting Officer) | ||
Annex D
UNITED STATES
SECURITIES AND EXCHANGE COMMISSION
WASHINGTON, D.C. 20549
FORM 10-Q/A
(Amendment No. 1)
QUARTERLY REPORT PURSUANT TO SECTION 13 OR 15(d) OF THE SECURITIES EXCHANGE ACT OF 1934
For the quarterly period ended September 30, 2011
or
TRANSITION REPORT PURSUANT TO SECTION 13 OR 15(d) OF THE SECURITIES EXCHANGE ACT OF 1934
For the transition period from ____ to _____
Commission File Number: 000-28767
China 3C Group
(Exact name of registrant as specified in its charter)
| Nevada | 88-0403070 |
(State or other jurisdiction of incorporation or organization) | (I.R.S. Employer Identification No.) |
368 HuShu Nan Road
HangZhou City, Zhejiang Province, China 310014
(Address of Principal Executive Offices) (Zip Code)
086-0571-88381700
(Registrant’s telephone number, including area code)
(Former name, former address and former fiscal year, if changed since last report)
Indicate by check whether the issuer (1) has filed all reports required to be filed by Section 13 or 15(d) of the Securities Exchange Act of 1934 during the preceding 12 months (or for such shorter period that the registrant was required to file such reports), and (2) has been subject to such filing requirements for the past 90 days:
Yes x No¨
Indicate by check mark whether the registrant has submitted electronically and posted on its corporate Web site, if any, every Interactive Data File required to be submitted and posted pursuant to Rule 405 of Regulation S-T (§232.405 of this chapter) during the preceding 12 months (or for such shorter period that the registrant was required to submit and post such files). Yesx No¨
Indicate by check mark whether the registrant is a large accelerated filer, an accelerated filer, a non-accelerated filer, or a smaller reporting company. See the definitions of “large accelerated filer,” “accelerated filer” and “smaller reporting company” in Rule 12b-2 of the Exchange Act.
Large accelerated filer ¨ | Accelerated filer ¨ | Non-accelerated filer ¨ (Do not check if a smaller reporting company) | Smaller reporting company x |
Indicate by check mark whether the registrant is a shell company (as defined in Rule No 12b-2 of the Exchange Act). Yes ¨ No x
As of November 20, 2011, the registrant had 58,911,327 shares of common stock outstanding.
EXPLANATORY NOTE
This Amendment No. 1 to our Quarterly Report on Form 10-Q/A ("Form 10-Q/A") is being filed to amend our Quarterly Report on 10-Q for the period ended September 30, 2011 ("Form 10-Q"), which was originally filed with the Securities and Exchange Commission (the "SEC") on November 21, 2011. We are filing this amendment to include disclosure consistent with comments received by the SEC. We are amending and restating Items 1, 2, and 4 in this Form 10-Q/A.
Below is a summary of these errors and the related corrections:
| · | The Company reclassified fees paid to department stores from a contra revenue account to selling, general and administrative expenses. The amount of $758 and $1,072 were previously classified in contra-revenue account as a deduction to net sales for the three months ended September 30, 2011 and 2010. The Company moved the amount to selling expenses, and it is reported as selling, general and administrative expenses in the statement of operations and comprehensive loss. The reclassification caused a $758 increase in net sales from $28,543 to $29,301 and a corresponding increase of $758 in Selling, general and administrative expenses from $7,421 to $8,179 in the third quarter 2011; a $1,072 increase in net sales from $36,308 to $37,380 and a corresponding increase of $1,072 in Selling, general and administrative expenses from $5,074 to $6,146 in the third quarter 2010; The gross profit increased $758 and $1,072 respectively in the third quarter 2011 and 2010. The loss from operations and net loss remained unchanged. The impact of the restatement was limited to the presentation of the consolidated statements of operations and comprehensive income (loss). The consolidated balance sheets, the consolidated statements of stockholders’ equity and the related consolidated statements of cash flows remained unaffected. See changes in Item 1. |
| · | The Company amended Item 1 and 2 to clarify the fact that Capital did not sell its equity ownership in Zhejiang upon executing the contractual agreements in 2007. Capital remains as the owner of 100% equity of Zhejiang through shareholding entrustment agreements. |
| · | The restatement above also affected the disclosure of segment reporting. As a result, we have amended Item 1, Note 14 - SEGMENT INFORMATION and Item 2. MANAGEMENT’S DISCUSSION AND ANALYSIS OF FINANCIAL CONDITION AND RESULTS OF OPERATIONS. |
| · | The Company amended Item 4 revising our conclusions on the effectiveness of disclosure controls and procedures to “ineffective.” |
In addition, this Form 10-Q/A contains new certifications by our Chief Executive Officer and our Chief Financial Officer, filed as exhibits hereto.
TABLE OF CONTENTS
| PAGE | ||
| PART I. FINANCIAL INFORMATION | 3 | |
| Item 1. Financial Statements | 3 | |
| Consolidated Balance Sheets as of September 30, 2011 (Unaudited) and December 31, 2010 | 3 | |
| Consolidated Statements of Operations and Comprehensive Loss for the Nine Months Ended September 30, 2011 and 2010 (Unaudited) | 4 | |
| Consolidated Statements of Operations and Comprehensive Loss for the Three Months Ended September 30, 2011 and 2010 (Unaudited) | 5 | |
| Consolidated Statements of Cash Flows for the Nine Months Ended September 30, 2011 and 2010 (Unaudited) | 6 | |
| Notes to Consolidated Financial Statements | 7 | |
| Item 2. Management’s Discussion and Analysis of Financial Condition and Results of Operations | 23 | |
| Item 4. Controls and Procedures | 34 | |
| PART II. OTHER INFORMATION | 34 | |
| Item 6. Exhibits | 34 | |
| Signatures | 34 |
| 2 |
PART I. FINANCIAL INFORMATION
Item 1. Financial Statements
CHINA 3C GROUP AND SUBSIDIARIES
CONSOLIDATED BALANCE SHEETS
(in thousands)
| September 30, | December 31, | |||||||
| 2011 | 2010 | |||||||
| (Unaudited) | ||||||||
| ASSETS | ||||||||
| Current assets: | ||||||||
| Cash and equivalents | $ | 10,256 | $ | 26,249 | ||||
| Accounts receivable, net | 12,371 | 11,026 | ||||||
| Inventories | 7,144 | 7,284 | ||||||
| Advances to suppliers | 2,282 | 2,201 | ||||||
| Taxes receivable | - | 1,200 | ||||||
| Prepaid expenses and other current assets | 215 | 591 | ||||||
| Total current assets | 32,268 | 48,551 | ||||||
| Property, plant and equipment, net | 480 | 191 | ||||||
| Intangible asset, net | 12,423 | 13,153 | ||||||
| Goodwill | - | 11,229 | ||||||
| Refundable deposits | 25 | 7 | ||||||
| Total assets | $ | 45,196 | $ | 73,131 | ||||
| LIABILITIES AND STOCKHOLDERS' EQUITY | ||||||||
| Current liabilities: | ||||||||
| Accounts payable | $ | 4,809 | $ | 4,139 | ||||
| Accrued expenses | 2,241 | 4,536 | ||||||
| Income tax payable | - | 736 | ||||||
| Total liabilities | 7,050 | 9,411 | ||||||
| Stockholders' equity | ||||||||
| Common stock, $0.001 par value, 100,000,000 million shares authorized, 58,911,327 and 54,831,327 issued and outstanding as of September 30, 2011 and December 31, 2010, respectively | 59 | 55 | ||||||
| Additional paid-in capital | 21,485 | 20,252 | ||||||
| Subscription receivable | (50 | ) | (50 | ) | ||||
| Statutory reserve | 11,543 | 11,543 | ||||||
| Other comprehensive income | 7,881 | 6,706 | ||||||
| Accumulated deficit | (2,772 | ) | 25,214 | |||||
| Total stockholders' equity | 38,146 | 63,720 | ||||||
| Total liabilities and stockholders' equity | $ | 45,196 | $ | 73,131 | ||||
The accompanying notes are an integral part of these consolidated financial statements.
| 3 |
CHINA 3C GROUP AND SUBSIDIARIES
CONSOLIDATED STATEMENTS OF OPERATIONS AND COMPREHENSIVE LOSS
NINE MONTHS ENDED SEPTEMBER 30, 2011 and 2010 (UNAUDITED)
(in thousands)
| 2011 (restated) | 2010 (restated) | |||||||
| Net sales | $ | 103,058 | $ | 118,165 | ||||
| Cost of sales | 97,224 | 104,664 | ||||||
| Gross profit | 5,834 | 13,501 | ||||||
| Selling, general and administrative expenses | 23,466 | 19,407 | ||||||
| Goodwill impairment | 11,229 | - | ||||||
| Loss from operations | (28,861 | ) | (5,906 | ) | ||||
| Other (income) expense | ||||||||
| Interest income | (55 | ) | (71 | ) | ||||
| Other income | (324 | ) | (7 | ) | ||||
| Other expense | 65 | 119 | ||||||
| Total other (income) expense | (314 | ) | 41 | |||||
| Loss before income taxes | (28,547 | ) | (5,947 | ) | ||||
| Provision for income taxes | 152 | 254 | ||||||
| Net loss | (28,699 | ) | (6,201 | ) | ||||
| Foreign currency translation adjustment | 1,175 | (10 | ) | |||||
| Comprehensive loss | $ | (27,524 | ) | $ | (6,211 | ) | ||
| Net loss available to common shareholders per share: | ||||||||
| Basic and Diluted | $ | (0.50 | ) | $ | (0.11 | ) | ||
| Weighted average shares outstanding: | ||||||||
| Basic and Diluted | 57,896,822 | 54,831,327 | ||||||
The accompanying notes are an integral part of these consolidated financial statements.
| 4 |
CHINA 3C GROUP AND SUBSIDIARIES
CONSOLIDATED STATEMENTS OF OPERATIONS AND COMPREHENSIVE LOSS
THREE MONTHS ENDED SEPTEMBER 30, 2011 and 2010 (UNAUDITED)
(in thousands)
| 2011 (restated) | 2010 (restated) | |||||||
| Net sales | $ | 29,301 | $ | 37,380 | ||||
| Cost of sales | 28,856 | 33,725 | ||||||
| Gross profit | 445 | 3,655 | ||||||
| Selling, general and administrative expenses | 8,179 | 6,146 | ||||||
| Goodwill impairment | 11,229 | - | ||||||
| Loss from operations | (18,963 | ) | (2,491 | ) | ||||
| Other (income) expense | ||||||||
| Interest income | (19 | ) | (24 | ) | ||||
| Other income | (462 | ) | - | |||||
| Other expense | - | 75 | ||||||
| Total other (income) expense | (481 | ) | 51 | |||||
| Loss before income taxes | (18,482 | ) | (2,542 | ) | ||||
| Provision for income taxes | 23 | 64 | ||||||
| Net loss | (18,505 | ) | (2,606 | ) | ||||
| Foreign currency translation adjustments | 481 | (184 | ) | |||||
| Comprehensive loss | $ | (18,024 | ) | $ | (2,790 | ) | ||
| Net loss available to common shareholders per share: | ||||||||
| Basic and Diluted | $ | (0.32 | ) | $ | (0.05 | ) | ||
| Weighted average shares outstanding: | ||||||||
| Basic and Diluted | 58,585,240 | 54,831,327 | ||||||
The accompanying notes are an integral part of these consolidated financial statements.
| 5 |
CHINA 3C GROUP AND SUBSIDIARIES
CONSOLIDATED STATEMENTS OF CASH FLOWS
NINE MONTHS ENDED SEPTEMBER 30, 2011 and 2010 (UNAUDITED)
(in thousands)
| 2011 | 2010 | |||||||
| CASH FLOWS FROM OPERATING ACTIVITIES | ||||||||
| Net loss | $ | (28,699 | ) | $ | (6,201 | ) | ||
| Adjustments to reconcile net loss to net cash used in operating activities: | ||||||||
| Depreciation | 109 | 14 | ||||||
| Amortization of intangible assets | 1,048 | 1,047 | ||||||
| Goodwill impairment | 11,229 | - | ||||||
| Stock based compensation | 892 | 376 | ||||||
| (Increase) / decrease in assets: | ||||||||
| Accounts receivable | (926 | ) | 3,943 | |||||
| Taxes receivable | 1,234 | - | ||||||
| Inventories | 408 | 298 | ||||||
| Prepaid expenses and other current assets | 206 | 29 | ||||||
| Refundable deposits | (17 | ) | 6 | |||||
| Advance to suppliers | 2 | 87 | ||||||
| Other receivables | 189 | 1 | ||||||
| (Increase) / decrease in current liabilities: | ||||||||
| Advance from customers | - | 24 | ||||||
| Accounts payable | 511 | 32 | ||||||
| Accrued expenses | (3,268 | ) | (1,087 | ) | ||||
| Income tax payable | (71 | ) | 40 | |||||
| Net cash used in operating activities | (17,153 | ) | (1,391 | ) | ||||
| CASH FLOW FROM INVESTING ACTIVITIES | ||||||||
| Purchase of property and equipment | (427 | ) | (18 | ) | ||||
| Net cash used in investing activities | (427 | ) | (18 | ) | ||||
| Effect of exchange rate changes on cash and equivalents | 1,587 | 624 | ||||||
| Net decrease in cash | (15,993 | ) | (785 | ) | ||||
| Cash and equivalents, beginning of period | 26,249 | 29,908 | ||||||
| Cash and equivalents, end of period | $ | 10,256 | $ | 29,123 | ||||
| Supplemental disclosure of cash flow information: | ||||||||
| Income taxes paid | $ | 888 | $ | 844 | ||||
| Interest paid | $ | - | $ | - | ||||
The accompanying notes are an integral part of these consolidated financial statements.
| 6 |
CHINA 3C GROUP AND SUBSIDIARIES
NOTES TO CONSOLIDATED FINANCIAL STATEMENTS
SEPTEMBER 30, 2011 AND 2010 (UNAUDITED) AND DECEMBER 31, 2010 (AUDITED)
Note 1 -ORGANIZATION
China 3C Group (including its subsidiaries unless the context indicates otherwise, the “Company,” “China 3C,” “we,” “us,” or “our”) was incorporated on August 20, 1998 under the laws of the State of Nevada. Capital Future Developments Limited - BVI (“Capital”) was incorporated on July 22, 2004 under the laws of the British Virgin Islands (“BVI”). Zhejiang Yong Xin Digital Technology Company Limited (“Zhejiang”), Yiwu Yong Xin Communication Limited (“Yiwu”), Hangzhou Wang Da Electronics Company Limited (“Wang Da”), Hangzhou Sanhe Electronic Technology Limited (“Sanhe”), and Shanghai Joy & Harmony Electronics Company Limited (“Joy & Harmony”), Jinhua Baofa Logistic Ltd (“Jinhua”) were incorporated under the laws of Peoples Republic of China (“PRC”) on July 11, 2005, July 18, 1997, March, 30, 1998, April 12, 2004, August 20, 2003 and December 27, 2001, respectively. All dollar amounts are in thousands, unless otherwise indicated.
On December 21, 2005, Capital became a wholly owned subsidiary of China 3C through a reverse merger (the “Merger Transaction”). China 3C acquired all of the issued and outstanding capital stock of Capital pursuant to a Merger Agreement dated December 21, 2005 by and among China 3C, XY Acquisition Corporation, Capital and the shareholders of Capital (the “Merger Agreement”). Pursuant to the Merger Agreement, Capital became a wholly owned subsidiary of China 3C and, in exchange for the Capital shares, China 3C issued 35,000,000 shares of its common stock to the shareholders of Capital, representing 93% of the issued and outstanding capital stock of China 3C at that time and cash of $500.
On August 3, 2006, Capital completed the acquisition of 100% of the equity of Sanhe for a combination of cash and stock valued at $8,750 (consisting of 915,751 newly issued shares of the Company’s common stock and $5,000 in cash).
On November 28, 2006, Capital completed the acquisition of 100% of the equity of Joy & Harmony for a combination of cash and stock valued at $18,500 (consisting of 2,723,110 shares of the Company’s common stock and $7,500 in cash).
On August 15, 2007, we executed a series of contractual agreements between Capital and Zhejiang. The contractual agreements give Capital and its equity owners an obligation, and having ability to absorb, any losses, and rights to receive returns; however, these contractual agreements did not change the equity ownership of Zhejiang. We did not dispose Capital’s actual equity ownership of Zhejiang when we execute the contractual agreements. Capital entered into share-holding entrustment agreements with five individuals - Zhenggang Wang, Yimin Zhang, Huiyi Lv, Xiaochun Wang and Zhongsheng Bao to hold 35%, 20%, 20%, 15% and 10%, respectively, of the equity interest of Zhejiang on behalf of Capital on November 21, 2005. The entrustment agreements confirm that Capital is the actual owner of Zhejiang. Capital enjoys the actual shareholder’s rights and has the right to obtain any benefits received by the nominal holders. Zhenggang Wang is the CEO and shareholder of China 3C Group. Yimin Zhang, Huiyi Lv, Xiaochun Wang and Zhongsheng Bao have no other relationship with China 3C Group. No consideration was given to these individuals who held the equity of Zhejiang on behalf of Capital.
On July 6, 2009, China 3C and its subsidiary Zhejiang and Yiwu purchased 100% of Jinhua for RMB 120 million ($17,500) in cash. Zhejiang acquired 90% and Yiwu acquired 10% of the equity interests in Jinhua.
| 7 |
Following the acquisition of Jinhua, the Company began providing logistical services to businesses in addition to its traditional business of resale and distribution of third party products such as mobile phones, facsimile machines, DVD players, stereos, speakers, MP3 and MP4 players, iPods, electronic dictionaries, CD players, radios and audio systems.
ORGANIZATIONAL CHART
Note 2 -SUMMARY OF SIGNIFICANT ACCOUNTING POLICIES
Basis of Presentation
The accompanying consolidated financial statements were prepared in conformity with accounting principles generally accepted in the United States of America (“US GAAP”). The Company’s functional currency is the Chinese Renminbi (“RMB”), however, the accompanying consolidated financial statements have been translated and presented in United States Dollars (“$”, or “USD”).
| 8 |
Principles of Consolidation
The consolidated financial statements include the accounts of China 3C and its wholly owned subsidiaries Capital, Wang Da, Yiwu, Joy & Harmony, Sanhe and Jinhua and variable interest entity Zhejiang, collectively referred to as the Company, unless the context indicates otherwise. All material intercompany accounts, transactions and profits were eliminated in consolidation.
Reclassifications
Certain prior period amounts were reclassified to conform to current period presentation, none of which changed total assets, liabilities, stockholder’s equity, net loss, or net loss per share.
Currency Translation
The accounts of Zhejiang, Wang Da, Yiwu, Sanhe, Joy & Harmony and Jinhua were maintained, and its financial statements were expressed, in RMB. Such financial statements were translated into USD in accordance with FASB ASC 830-10, “Foreign Currency Translation,” with the RMB as the functional currency. According to FASB ASC Topic 830-10, assets and liabilities were translated at the ending exchange rate, stockholders’ equity is translated at the historical rates and income statement items are translated at the average exchange rate for the period. The resulting translation adjustments are reported as other comprehensive income in accordance with FASB ASC Topic 220, “Reporting Comprehensive Income,” as a component of shareholders’ equity. Transaction gains and losses are reflected in the consolidated operations and comprehensive loss statements.
Use of Estimates
The preparation of financial statements in conformity with US GAAP requires management to make estimates and assumptions that affect the reported amounts of assets and liabilities and disclosure of contingent assets and liabilities at the date of the financial statements and the reported amounts of revenues and expenses during the reporting period. Actual results could differ from those estimates.
Risks and Uncertainties
The Company is subject to substantial risks from, among other things, intense competition associated with the industry in general, other risks associated with financing, liquidity requirements, rapidly changing customer requirements, limited operating history, foreign currency exchange rates and the volatility of public markets.
Contingencies
Certain conditions may exist as of the date the financial statements are issued, which could result in a loss to the Company but which will only be resolved when one or more future events occur or fail to occur. The Company’s management assesses such contingent liabilities, and such assessment inherently involves an exercise of judgment. In assessing loss contingencies related to legal proceedings that are pending against the Company or unasserted claims that may result in such proceedings, the Company’s management evaluates the perceived merits of any legal proceedings or unasserted claims as well as the perceived merits of the amount of relief sought or expected to be sought.
| 9 |
If the assessment of a contingency indicates that it is probable that a material loss has been incurred and the amount of the liability can be estimated, then the estimated liability is accrued in the Company’s financial statements. If the assessment indicates that a potential material loss contingency is not probable but is reasonably possible, or is probable but cannot be estimated, then the nature of the contingent liability, together with an estimate of the range of possible loss if determinable and material would be disclosed.
Loss contingencies considered to be remote by management are generally not disclosed unless they involve guarantees, in which case the guarantee would be disclosed.
Accounts Receivable
The Company maintains reserves for potential credit losses on accounts receivable. Management reviews the composition of accounts receivable and analyzes historical bad debts, customer concentrations, customer credit worthiness, current economic trends and changes in customer payment patterns to evaluate the adequacy of these reserves. Terms of the sales vary. Reserves are recorded primarily on a specific identification basis.
Inventories
Inventories are valued at the lower of cost (determined on a weighted average basis) or market value. Management compares the cost of inventories with the market value and allowance is made for writing down their inventories to market value, if lower. As of September 30, 2011 and December 31, 2010, inventory consisted entirely of finished goods valued at $7,144 and $7,284, respectively.
Property, Plant and Equipment, net
Property, plant and equipment are stated at cost. Expenditures for maintenance and repairs are expensed as incurred; additions, renewals and betterments are capitalized. When property and equipment are retired or otherwise disposed of, the related cost and accumulated depreciation are removed from the respective accounts, and any gain or loss is included in operations. Depreciation of property and equipment is provided using the straight-line method for substantially all assets with estimated lives of:
| Automotive | 5 years |
| Office Equipment | 5 years |
As of September 30, 2011 and December 31, 2010, property and equipment consisted of the following:
| 2011 | 2010 | |||||||
| Automotive | $ | 733 | $ | 738 | ||||
| Office equipment | 594 | 195 | ||||||
| Leasehold improvements | - | 65 | ||||||
| Plant and Equipment | 3 | 3 | ||||||
| Sub Total | 1,330 | 1,001 | ||||||
| Less: accumulated depreciation | (850 | ) | (810 | ) | ||||
| Total | $ | 480 | $ | 191 | ||||
| 10 |
Long-Lived Assets
The Company periodically evaluates the carrying value of long-lived assets to be held and used in accordance with FASB ASC 360 “Property, Plant and Equipment”, which requires impairment losses to be recorded on long-lived assets used in operations when indicators of impairment are present and the undiscounted cash flows estimated to be generated by those assets are less than the assets’ carrying amounts. In that event, a loss is recognized based on the amount by which the carrying amount exceeds the fair market value of the long-lived assets. Losses on long-lived assets to be disposed of are determined in a similar manner, except that fair market values are reduced for the cost of disposal. Based on its review, the Company believes that, as of September 30, 2011 and December 31, 2010, there were no significant impairments of its long-lived assets.
Fair Value of Financial Instruments
FASB ASC Topic 825 “Financial Instruments” requires that the Company disclose estimated fair values of financial instruments. The carrying amounts reported in the statements of financial position for current assets and current liabilities qualifying as financial instruments are a reasonable estimate of fair value.
Impairment of Goodwill
Goodwill is the excess of purchase price over the fair value of the identifiable assets and liabilities acquired as a result of the Company’s acquisitions of interests in its subsidiaries. Under FASB ASC Topic 350, goodwill is no longer amortized, but tested for impairment upon first adoption and annually, thereafter, or more frequently if events or changes in circumstances indicate that it might be impaired. Impairment testing is performed at a reporting unit level. An impairment loss generally would be recognized when the carrying amount of the reporting unit exceeds its fair value, with the fair value of the reporting unit determined using discounted cash flow (“DCF”) analysis. A number of significant assumptions and estimates are involved in the application of the DCF analysis to forecast operating cash flows, including the discount rate, the internal rate of return, and projections of realizations and costs to produce. Management considers historical experience and all available information at the time the fair values of its reporting units are estimated. At September 30, 2011, the Company determined and recorded $4,507, $6,250 and $472 impairment charges to goodwill of Sanhe, Joy & Harmony and Jinhua, respectively, due to the continuous slow-down of sales of the Company’s products, increased competition and higher operating costs. All three of these subsidiaries incurred net losses for the nine months ended September 30, 2011, and the Company expects continuous losses for the foreseeable future.
Revenue Recognition
In accordance with Securities and Exchange Commission (“SEC”) Staff Accounting Bulletin (“SAB”) 104, the Company recognizes revenues when there is persuasive evidence of an arrangement, product delivery and acceptance have occurred, the sales price is fixed and determinable, and collectability of the resulting receivable is reasonably assured.
The Company records revenues when title and the risk of loss pass to the customer. Generally, these conditions occur on the date the customer takes delivery of the product. Revenue is generated from sales of China 3C products through two main revenue streams:
| 1. | Retail. 67.5%, 69.3%, 68.6% , 69.0% of the Company's revenue came from sales to individual customers at outlets installed inside department stores etc. (i.e., store in store model) during the three and nine months ended September 30, 2011 and 2010, respectively, and was mainly achieved through two broad categories: |
| 11 |
| a. | Purchase contracts. Sales by purchase contracts have terms of thirty days from the transfer of goods to the customer. Under this method, the Company delivers goods to places designated by the customers and receives confirmation of delivery. At that time, ownership and all risks associated to the goods are transferred to the customers and payment is made within 30 days. The Company relieves its inventory and recognizes revenue upon receipt of confirmation from the customer. |
| b. | Point of sale transfer of ownership. Under this method, the Company’s products are placed in third party stores and sold by the Company’s sales people. Upon purchase of the item by the customer, the Company relieves its inventory and recognizes revenue related to that item. |
| 2. | Wholesale. 32.5%, 30.7%, 31.4%, 31.0% of the Company's revenue came from wholesale during the three and nine months ended September 30, 2011 and 2010, respectively. Recognition of income in wholesales is based on the contract terms. The main contract terms on wholesale agreed that payments be paid 15 days after receipt of goods and that ownership and all risks associated with the goods are transferred to the customers on the date of goods received and payments will be made 15 days later. |
Sales revenue is therefore recognized on the following basis:
| 1. | Store in store model: |
| a. | For goods sold under sales and purchase contracts, revenue is recognized when goods are received by customers. |
| b. | For goods at customer outlets which the Company’s sales people operate, and inventory of goods is under joint control by the customers and the Company, revenue is recognized at the point of sale to the end buyer. |
During public holidays or department store celebration periods, we provide sales incentives to retail customers to increase sales, such as gift giving and price reductions. These are the only temporary incentives during the specified periods. Sales made to our retail customers as a result of incentives are immaterial as a percentage of total sales revenue.
| 2. | Wholesale: |
| a. | Revenue is recognized at the date of goods are received by wholesale customers. We operate our wholesale business by selling large volume orders to second-tier distributors and large department stores. Revenues from wholesale are recognized as net sales after confirmation with distributors. Net sales already take into account revenue dilution as they exclude inventory credit, discount for early payment, product obsolescence and return of products and other allowances. Net sales also take into account the return of products in accordance with relevant laws and regulations in China. |
| 12 |
Return policies
Our return policy complies with China’s laws and regulations on consumer’s rights and product quality. In accordance with Chinese law, consumers can return or exchange used products within seven days only if the goods do not meet safety and health requirements, endanger a person’s property, or do not meet the advertised performance. If the conditions and requirements as set out in the relevant laws and regulations are met, the retail stores are entitled to accept a return of the goods from the consumer. In such cases, the Company shall accept the returns unconditionally. Goods returned will be redirected to the production factory or supplier who shall bear all losses on the returns in accordance the laws and regulations. Consumer returns or exchanges of products that have not been used, where the packaging has not been damaged, are honored if such return or exchange is within seven days. If a consumer returns a product, the Company must refund the invoice price to the consumer. The Company will then be responsible for returning the goods to the production factory or supplier. At that time the Company can recover the price based on the purchase and sale contract with the producer or supplier. However, when goods are returned, the Company loses the profit margin that it records when revenue is recognized, regardless of whether the production factory or supplier takes the product back or not.
The return rights granted to wholesale customers are similar to the rights granted to retail customers. Once wholesale customers purchase products, they follow the same return policy as retail customers. We do not honor returns from wholesale customers except for products which don’t meet laws and regulations or quality requirements. If our wholesale customers have a high inventory level or product obsolescence caused by lower market demands or other operational issues, the wholesale customers bear their own losses. When a wholesale customer returns products, the Company will return the products to the suppliers or manufacturers. A sales return and allowance is recorded at the sales price. Meanwhile, a purchase return and allowance is recorded at the invoice price because the suppliers or manufacturers bear the losses. The net effect is that the Company derecognizes the gross profit when a return takes place, but does not record any loss on the cost of the returned item back to the supplier or manufacturer.
In light of the aforesaid PRC laws and regulations and the Company's arrangements with suppliers, we do not provide an accrual for any estimated losses on subsequent sale of the return of products. As a result we do not assess levels of inventory in the distribution channel, product obsolescence and/or introductions of new products, as none of those factors have any impact on us with respect to estimating losses on subsequent sale of returned goods. Third party market research report and consumer demand study is not used to make estimates of goods returned.
Cost of Sales
Cost of sales consists of actual product cost, which is the purchase price of the product less any discounts. Cost of sales excludes freight charges, purchase and delivery costs, internal transfer, freight charges and the other costs of the Company’s distribution network, which are identified in general and administrative expenses.
General and Administrative Expenses
General and administrative expenses are comprised principally of payroll and benefits costs for retail and corporate employees, occupancy costs of corporate facilities, lease expenses, management fees, traveling expenses and other operating and administrative expenses, including freight charges, purchase and delivery costs, internal transfer freight charges and other distribution costs.
Shipping and handling fees
The Company follows FASB ASC 605-45, “Handling Costs, Shipping Costs”. The Company does not charge its customers for shipping and handling. The Company classifies shipping and handling fees as part of General and administrative expenses. During the three and nine months ended September 30, 2011 and 2010, the Company incurred shipping and handling fees and costs of $70, $68, $186 and $175, respectively.
| 13 |
Vendor Discounts
The Company has preferred pricing arrangements with vendors on certain products. These arrangements are not contingent on any levels of volume and are considered vendor discounts as opposed to rebates. The Company records these discounts along with the purchase of the discounted items, resulting in lower inventory cost and a corresponding lower cost of sales as the products are sold.
Management fees paid to the department stores under “store in store” model
Under the “store in store” business operation model, the Company may pay management fees to the department stores, which are in the form of service charges. The management fees are reflected in general and administrative expenses. Such management fees were $1,050, $1,297, $4,036 and $4,282 in selling, general and administrative expenses during the three and nine months ended September 30, 2011 and 2010 respectively.
Share Based Payment
The Company follows FASB ASC 718-10, “Stock Compensation”, which addresses the accounting for transactions in which an entity exchanges its equity instruments for goods or services, with a primary focus on transactions in which an entity obtains employee services in share-based payment transactions. ASC 718-10 requires measurement of the cost of employee services received in exchange for an award of equity instruments based on the grant-date fair value of the award (with limited exceptions). Incremental compensation costs arising from subsequent modifications of awards after the grant date must be recognized.
Advertising
Advertising expenses consist primarily of costs of promotion for corporate image and product marketing and costs of direct advertising. The Company expenses advertising costs as incurred. Advertising expense was $98, $1,645, $298 and $2,285 for the three and nine months ended September 30, 2011 and 2010, respectively.
Income Taxes
The Company utilizes FASB ASC Topic 740 “Income Taxes”. Deferred income taxes are recognized for the tax consequences in future years of differences between the tax bases of assets and liabilities and their financial reporting amounts at each period end based on enacted tax laws and statutory tax rates applicable to the periods in which the differences are expected to affect taxable income. Valuation allowances are established, when necessary, to reduce deferred tax assets to the amount expected to be realized.
Basic and Diluted (Loss) per Share
(Loss) per share is calculated in accordance with FASB ASC Topic 260, “Earnings per Share”. Basic earnings (loss) per share are based upon the weighted average number of common shares outstanding. Diluted earnings (losses) per share are based on the assumption that all dilutive convertible shares and stock options were converted or exercised. Dilution is computed by applying the treasury stock method. Under this method, options and warrants are assumed to be exercised at the beginning of the period (or at the time of issuance, if later), and as if funds obtained thereby were used to purchase common stock at the average market price during the period. If convertible shares and stock options are anti-dilutive, the impact of conversion is not included in the diluted net income (loss) per share. Excluded from the calculation of diluted (loss) per share for the three and nine months ended September 30, 2011 and 2010 was 50,000 and 100,000 options, as they were not dilutive.
| 14 |
Statement of Cash Flows
In accordance with FASB ASC Topic 230 “Statement of Cash Flows”, cash flows from the Company’s operations are calculated based upon the functional currency, in our case the RMB. As a result, amounts related to changes in assets and liabilities reported on the statement of cash flows will not necessarily agree with the changes in the corresponding balances on the balance sheet.
Concentration of Credit Risk
Financial instruments that potentially subject the Company to concentrations of credit risk are cash, accounts receivable, advances to suppliers and other receivables arising from its normal business activities. The Company places its cash in what it believes to be credit-worthy financial institutions. The Company has a diversified customer base, most of which is in China. The Company controls credit risk related to accounts receivable through credit approvals, credit limits and monitoring procedures. The Company routinely assesses the financial strength of its customers and, based upon factors surrounding the credit risk, establishes an allowance, if required, for uncollectible accounts and, as a consequence, believes that its accounts receivable credit risk exposure beyond such allowance is limited.
Segment Reporting
FASB ASC Topic 280, “Segment Reporting” requires use of the “management approach” model for segment reporting. The management approach model is based on the way a company’s management organizes segments within the company for making operating decisions and assessing performance. Reportable segments are based on products and services, geography, legal structure, management structure, or any other manner in which management disaggregates a company. Since the acquisition of Jinhua in July 2009, the Company operates in five segments (see Note 14).
Recent Accounting Pronouncements
FASB ASC Topic 860 “Transfers and Servicing” requires more information about transfers of financial assets and where companies have continuing exposure to the risks related to transferred financial assets. ASC 860 was effective at the start of a company’s first fiscal year beginning after November 15, 2009, or January 1, 2010 for companies reporting earnings on a calendar-year basis. The adoption of this statement had no material effect on the Company’s financial statements.
Revisions under FASB ASC Topic 810 “Consolidation”, revises how a company determines when an entity that is insufficiently capitalized or is not controlled through voting (or similar rights) should be consolidated. Under ASC 810, determining whether a company is required to consolidate an entity will be based on, among other things, an entity’s purpose and design and a company’s ability to direct the activities of the entity that most significantly impact the entity’s economic performance. ASC 810 is effective at the start of a company’s first fiscal year beginning after November 15, 2009, or January 1, 2010 for companies reporting earnings on a calendar-year basis. The adoption of ASC 810 had no impact on our financial statements.
In April 2010, FASB issued ASU 2010-13,Compensation – Stock Compensation (Topic 718): Effect of Denominating the Exercise Price of a Share-Based Payment Award in the Currency of the Market in Which the Underlying Equity Security Trades. ASU 2010-13 provides guidance on the classification of a share-based payment award as either equity or a liability. A share-based payment that contains a condition that is not a market, performance, or service condition is required to be classified as a liability. ASU 2010-13 is effective for fiscal years, and interim periods within those fiscal years, beginning on or after December 15, 2010. The adoption of this statement had no significant impact on the Company’s financial statements.
| 15 |
In April 2010, the FASB issued ASU 2010-17, “Revenue Recognition—Milestone Method (Topic 605): Milestone Method of Revenue Recognition”.This Update provides guidance on the recognition of revenue under the milestone method, which allows a vendor to adopt an accounting policy to recognize all of the arrangement consideration that is contingent on the achievement of a substantive milestone (milestone consideration) in the period the milestone is achieved. The pronouncement is effective on a prospective basis for milestones achieved in fiscal years and interim periods within those years, beginning on or after June 15, 2010. The adoption of this ASU had no material impact on the Company’s consolidated financial statements.
In July 2010, the FASB issued ASU 2010-20, “Receivables (Topic 310): Disclosures about the Credit Quality of Financing Receivables and the Allowance for Credit Losses”.The amendments in this Update are to provide financial statement users with greater transparency about an entity’s allowance for credit losses and the credit quality of its financing receivables. The disclosures about activity that occurs during the reporting period are effective for interim and annual reporting periods beginning on or after December 15, 2010. The adoption of this statement had no significant impact on the Company’s financial statements.
In December 2010, the FASB issued ASU 2010-29, “Business Combinations” (Topic 805): Disclosure of Supplementary Pro Forma Information for Business Combinations”. This ASU specifies that when financial statements are presented, the revenue and earnings of the combined entity should be disclosed as though the business combination that occurred during the current year had occurred as of the beginning of the comparable prior annual reporting period only. ASU 2010-29 is effective for business combinations with acquisition dates on or after January 1, 2011. The adoption of this statement had no impact on the Company’s consolidated financial statements.
In June 2011, FASB issued ASU 2011-05, Comprehensive Income (ASC Topic 220): Presentation of Comprehensive Income. Under the amendments in this update, an entity has the option to present the total of comprehensive income, the components of net income and the components of other comprehensive income either in a single continuous statement of comprehensive income or in two separate but consecutive statements. Under both options, an entity is required to present each component of net income along with total net income, each component of other comprehensive income along with a total for other comprehensive income and a total amount for comprehensive income. In a single continuous statement, the entity is required to present the components of net income and total net income, the components of other comprehensive income and a total for other comprehensive income, along with the total of comprehensive income in that statement. In the two-statement approach, an entity is required to present components of net income and total net income in the statement of net income. The statement of other comprehensive income should immediately follow the statement of net income and include the components of other comprehensive income and a total for other comprehensive income, along with a total for comprehensive income. In addition, the entity is required to present on the face of the financial statements reclassification adjustments for items that are reclassified from other comprehensive income to net income in the statement(s) where the components of net income and the components of other comprehensive income are presented. The amendments in this update should be applied retrospectively and are effective for fiscal years, and interim periods within those years, beginning after December 15, 2011. The Company is currently assessing the impact of adopting this statement on our financial statements.
Note 3 –ADVANCES TO SUPPLIERS
Advances to suppliers represent advance payments to suppliers for the purchase of inventory. As of September 30, 2011, we paid $2,282 in advance payments to 14 suppliers, of which one supplier received $312 and ten suppliers received $156 each. The remaining three suppliers received $390 in total. As of September 30, 2010, we paid $2,331 in advance payments. The five largest suppliers received $1,075, of which one supplier received $299, one received $179 and three received $149 each.
| 16 |
Note 4–ACCRUED EXPENSES
Accrued expenses as of September 30, 2011 and December 31, 2010 consist of the following:
| 2011 | 2010 | |||||||
| Accrued expenses and other payables | $ | 1,550 | $ | 4,512 | ||||
| VAT tax payable | 692 | 24 | ||||||
| Total | $ | 2,242 | $ | 4,536 | ||||
Accrued expenses include accrued salaries, staff welfare, accrued advertising and rent. Other payables include social insurance and miscellaneous tax payables.
Note 5 -COMMON STOCK
On January 17, 2011, China 3C entered into a Registered Trademark Transfer Agreement to purchase the registered trademark, “Lotour.” The trademark expires July 6, 2020. The consideration for the trademark was RMB 2,280,000 ($346), which was paid in the form of 1.08 million shares of the Company’s common stock, valued at $0.32 per share.
On January 20, 2011, Zhejiang entered into a Design and Development Engagement Agreement to design and develop an electronic book product under the brand name “Lotour.” The total consideration for the design and development of the electronic book product is RMB 3,160,000 ($480), which was paid in the form of 1.6 million shares of the Company’s common stock, valued at $0.30 per share. The term of the Development Agreement was from January 20, 2011 to July 19, 2011, at which date, the design and development agreement was completed and the “Lotour” electronic book started trial production.
Note 6 -STOCK WARRANTS, OPTIONS, AND COMPENSATION
Stock options— Options issued have a ten-year life and were fully vested upon issuance. The option holder has no voting or dividend rights. The grant price was the market price at the date of grant. The Company records the expense of the stock options over the related vesting period. The options were valued using the Black-Scholes option-pricing model at the date of grant stock option pricing.
Outstanding options by exercise price consisted of the following as of September 30, 2011.
| Options Outstanding | Options Exercisable | |||||||||||||||||||||
| Exercise Price | Number of Shares | Weighted Average Remaining Life (Years) | Weighted Average Exercise Price | Number of Shares | Weighted Average Exercise Price | |||||||||||||||||
| $ | 4.16 | 50,000 | 6.00 | $ | 4.16 | 50,000 | $ | 4.16 | ||||||||||||||
Note 7 -COMPENSATED ABSENCES
Regulation 45 of the labor laws in the PRC entitles employees to annual vacation leave after 1 year of service. In general all leave must be utilized annually, with proper notification. Any unutilized leave is cancelled. As of September 30, 2011and December 31, 2010, there was no accrued unutilized leave.
| 17 |
Note 8 -INCOME TAXES
The Company, through its subsidiaries, Zhejiang, Wang Da, Sanhe, Joy & Harmony, Yiwu and Jinhua is subject to the Income Tax Laws of the PRC.
China 3C, which is a U.S. entity, is subject to the US Federal income tax at the rate of 34%. China 3C has incurred net operating losses of $3,597 as of September 30, 2011 for income tax purposes. China 3C does not conduct any operations and only incurs expenses related to the public entity such as legal, accounting and investor relations, etc. Therefore, it is more likely than not that all of the Company’s deferred tax assets will not be realized. A 100% allowance was recorded on the deferred tax asset of $1,223 as of September 30, 2011.
The Company’s policy is to recognize interest and penalties accrued on any unrecognized tax benefits as a component of income tax expense. The Company did not have any accrued interest or penalty associated with any unrecognized tax benefits, nor was any interest expense recognized during the three and nine months ended September 30, 2011 and 2010.
Pursuant to the PRC Income Tax Laws, from January 1, 2008, the Enterprise Income Tax (“EIT”) is calculated against net income in a fiscal year at a statutory rate of 25%.
The following details a reconciliation of income tax expense for the nine months ended September 30, 2011 and 2010:
| 2011 | U.S. | State | International | Total | ||||||||||||
| Current | $ | - | $ | - | $ | 152 | $ | 152 | ||||||||
| Deferred | - | - | - | - | ||||||||||||
| Total | $ | - | $ | - | $ | 152 | $ | 152 | ||||||||
| 2010 | U.S. | State | International | Total | ||||||||||||
| Current | $ | - | $ | - | $ | 254 | $ | 254 | ||||||||
| Deferred | - | - | - | - | ||||||||||||
| Total | $ | - | $ | - | $ | 254 | $ | 254 | ||||||||
The following details a reconciliation of income tax expense for the three months ended September 30, 2011 and 2010:
| 2011 | U.S. | State | International | Total | ||||||||||||
| Current | $ | - | $ | - | $ | 23 | $ | 23 | ||||||||
| Deferred | - | - | - | - | ||||||||||||
| Total | $ | - | $ | - | $ | 23 | $ | 23 | ||||||||
| 2010 | U.S. | State | International | Total | ||||||||||||
| Current | $ | - | $ | - | $ | 64 | $ | 64 | ||||||||
| Deferred | - | - | - | - | ||||||||||||
| Total | $ | - | $ | - | $ | 64 | $ | 64 | ||||||||
| 18 |
During the three months ended September 30, 2011, all subsidiaries except for Zhejiang had operating losses. Jinhua was the only subsidiary that incurred income tax expenses of $43 since it uses simplified tax, which imposes taxes on sales instead of operating income. Zhejiang had a tax refund of $20 as a result of accumulated losses for the nine months ended September 30, 2011.
Reconciliation of the differences between the statutory U.S. Federal income tax rate and the effective rate is as follows:
| Three Months Ended September 30, | 2011 | 2010 | ||||||
| (Credit) tax at US statutory rate | (34.0 | )% | (34.0 | )% | ||||
| Tax rate difference | 8.9 | % | 9.0 | % | ||||
| Other | 0.1 | % | - | |||||
| Valuation allowance | 25.1 | % | 22.5 | % | ||||
| Effective rate | 0.1 | % | (2.5 | )% | ||||
| Nine Months Ended September 30, | 2011 | 2010 | ||||||
| (Credit) tax at US statutory rate | (34.0 | )% | (34.0 | )% | ||||
| Tax rate difference | 8.6 | % | 9.0 | % | ||||
| Other | 0.5 | % | - | |||||
| Valuation allowance | 25.4 | % | 20.7 | % | ||||
| Effective rate | 0.5 | % | (4.3 | )% | ||||
Note 9 -COMMITMENTS
The Company leases office facilities under operating leases. Rent expense for the three and nine months ended September 30, 2011 and 2010 was $152, $104, $399 and $359, respectively. The future minimum obligations are as follows, by years, as of September 30, 2011:
| Operating lease obligations | Advertising obligations | E-book contract obligations | ||||||||||
| 2012 | $ | 232 | 318 | 87 | ||||||||
| 2013 | 68 | - | - | |||||||||
| $ | 300 | 318 | 87 | |||||||||
Note 10 -STATUTORY RESERVE
In accordance with the laws and regulations of the PRC, a WFOE’s income, after the payment of the PRC income taxes, shall be allocated to the statutory surplus reserves and statutory public welfare fund. Prior to January 1, 2006, the proportion of allocation for reserve was 10% of the profit after tax to the surplus reserve fund and additional 5-10 percent to the public affair fund. The public welfare fund reserve was limited to 50% of the registered capital. Effective January 1, 2006, there is now only one fund requirement. The reserve is 10% of income after tax, not to exceed 50% of registered capital.
| 19 |
Statutory reserve funds are restricted for set off against losses, expansion of production and operation or increase in register capital of the respective company. Statutory public welfare fund is restricted to the capital expenditures for the collective welfare of employees. These reserves are not transferable to the Company in the form of cash dividends, loans or advances. These reserves are therefore not available for distribution except in liquidation. As of September 30, 2011, the Company had allocated $11,543 to these non-distributable reserve funds.
Note 11 -OTHER COMPREHENSIVE INCOME
The detail of other comprehensive income, all of which arose from foreign currency translation, as included in stockholders’ equity at September 30, 2011 and December 31, 2010 are as follows:
| Balance at December 31, 2009 | $ | 5,180 | ||
| Change for 2010 | 1,526 | |||
| Balance at December 31, 2010 | 6,706 | |||
| Change for nine months ended September 30, 2011 | 1,175 | |||
| Balance at September 30, 2011 | $ | 7,881 |
Note 12 -CURRENT VULNERABILITY DUE TO CERTAIN RISK FACTORS
The Company’s operations are in the PRC. Accordingly, the Company’s business, financial condition and results of operations may be influenced by the political, economic and legal environments in the PRC, by the general state of the PRC’s economy. The Company’s business may be influenced by changes in governmental policies with respect to laws and regulations, anti-inflationary measures, currency conversion and remittance abroad, and rates and methods of taxation, among other things.
Note 13 -MAJOR CUSTOMERS AND VENDORS
During the three and nine months ended September 30, 2011 and 2010, no single customer accounted for more than 10% of the Company’s sales or accounts receivable and no single vendor accounted for more than 10% of the Company’s purchases.
Note 14 - SEGMENT INFORMATION
We separately operate and prepare accounting and other financial reports to management for five business organizations: Wang Da, Sanhe, Yiwu, Joy & Harmony and Jinhua. Each operating company has different products and services. Wang Da sells mainly mobile phones, Sanhe sells mainly home appliances, Yiwu sells mainly office communication products, Joy & Harmony sells mainly consumer electronics and Jinhua provides transportation logistics to businesses. All segments are accounted for using the same principles as described in Note 2.
We identified five reportable segments required by FASB ASC Topic 280: (1) mobile phones, (2) home electronics, (3) office communication products, (4) consumer electronics and (5) logistics.
| 20 |
The following tables present summarized information by segment:
| Nine Months Ended September 30, 2011 | ||||||||||||||||||||||||||||
| Mobile | Home | Communication | Consumer | |||||||||||||||||||||||||
| Phones | Electronics | Products | Electronics | Logistics | Other | Total | ||||||||||||||||||||||
Sales, net (restated) | $ | 30,204 | $ | 29,964 | $ | 10,731 | $ | 25,683 | $ | 6,107 | $ | 369 | $ | 103,058 | ||||||||||||||
| Cost of sales | 28,592 | 27,914 | 9,793 | 23,139 | 7,430 | 356 | 97,224 | |||||||||||||||||||||
Gross profit (loss) (restated) | 1,612 | 2,050 | 938 | 2,544 | (1,323 | ) | 13 | 5,834 | ||||||||||||||||||||
Income (loss) from operations (restated) | (9,087 | ) | (8,093 | ) | (1,390 | ) | (5,234 | ) | (2,515 | ) | (2,542 | ) | (28,861 | ) | ||||||||||||||
| Nine months Ended September 30, 2010 | ||||||||||||||||||||||||||||
| Mobile | Home | Communication | Consumer | |||||||||||||||||||||||||
| Phones | Electronics | Products | Electronics | Logistics | Other | Total | ||||||||||||||||||||||
Sales, net (restated) | $ | 31,762 | $ | 32,322 | $ | 15,813 | $ | 29,681 | $ | 8,084 | $ | 503 | $ | 118,165 | ||||||||||||||
| Cost of sales | 28,990 | 28,643 | 14,079 | 25,888 | 6,620 | 444 | 104,664 | |||||||||||||||||||||
Gross profit (restated) | 2,772 | 3,679 | 1,734 | 3,793 | 1,464 | 59 | 13,501 | |||||||||||||||||||||
Income (loss) from operations (restated) | (1,322 | ) | (1,438 | ) | (801 | ) | (1,175 | ) | 346 | (1,516 | ) | (5,906 | ) | |||||||||||||||
| Three Months Ended September 30, 2011 | ||||||||||||||||||||||||||||
| Mobile | Home | Communication | Consumer | |||||||||||||||||||||||||
| Phones | Electronics | Products | Electronics | Logistics | Other | Total | ||||||||||||||||||||||
Sales, net (restated) | $ | 8,458 | $ | 8,741 | $ | 3,119 | $ | 7,171 | $ | 1,720 | $ | 92 | $ | 29,301 | ||||||||||||||
| Cost of sales | 8,221 | 8,318 | 2,949 | 6,711 | 2,561 | 96 | 28,856 | |||||||||||||||||||||
Gross profit (loss) (restated) | 237 | 423 | 170 | 460 | (841 | ) | (4 | ) | 445 | |||||||||||||||||||
(Loss) from operations (restated) | (7,314 | ) | (5,789 | ) | (540 | ) | (3,194 | ) | (1,207 | ) | (919 | ) | (18,963 | ) | ||||||||||||||
| Three Months Ended September 30, 2010 | ||||||||||||||||||||||||||||
| Mobile | Home | Communication | Consumer | |||||||||||||||||||||||||
| Phones | Electronics | Products | Electronics | Logistics | Other | Total | ||||||||||||||||||||||
Sales, net (restated) | $ | 10,311 | $ | 10,269 | $ | 4,860 | $ | 9,251 | $ | 2,568 | $ | 121 | $ | 37,380 | ||||||||||||||
| Cost of sales | 9,456 | 9,240 | 4,413 | 8,214 | 2,298 | 104 | 33,725 | |||||||||||||||||||||
Gross profit (restated) | 855 | 1,029 | 447 | 1,037 | 270 | 17 | 3,655 | |||||||||||||||||||||
Loss from operations (restated) | (497 | ) | (565 | ) | (315 | ) | (547 | ) | (102 | ) | (465 | ) | (2,491 | ) | ||||||||||||||
| 21 |
Total assets by segment as of September 30, 2011 and December 31, 2010 are as follows:
| Mobile | Home | Communication | Consumer | |||||||||||||||||||||||||
| Phones | Electronics | Products | Electronics | Logistics | Other | Total | ||||||||||||||||||||||
| 2011 (restated) | $ | 7,043 | $ | 8,491 | $ | 10,065 | $ | 5,254 | $ | 13,496 | $ | 847 | $ | 45,196 | ||||||||||||||
| 2010 (restated) | $ | 10,993 | 14,988 | 9,967 | 18,536 | 15,837 | 2,810 | 73,131 | ||||||||||||||||||||
Note 15 - RESTATEMENT OF CONSOLIDATED STATEMENTS OF OPERATIONS AND COMPREHENSIVE INCOME (LOSS)
China 3C operates most of its retail operations through “store in store” model. Under this model, the Company leases space in major department stores and retailers. The Company does not pay the department stores fixed leasing costs. Instead, China 3C deducts a percentage of sales each month as compensation to the department stores. China 3C records such costs as “sales discount” as a deduction from net sales.
In response to the SEC comments of December 19, 2011, the Company reviewed “sales discount” and determined they should be reclassified as management fees. As a result, we reclassified “sales discount” from a contra revenue account to management fees as part of the selling, general and administrative expenses. The amount of $758 and $1,072 were previously classified in contra-revenue account as a deduction to net sales for the three months ended September 30, 2011 and 2010. The Company moved the amount to selling expenses, and it is reported as selling, general and administrative expenses in the statement of operations and comprehensive loss. The reclassification caused a $758 increase in net sales from $28,543 to $29,301 and a corresponding increase of $758 in Selling, general and administrative expenses from $7,421 to $8,179 in the third quarter 2011; a $1,072 increase in net sales from $36,308 to $37,380 and a corresponding increase of $1,072 in Selling, general and administrative expenses from $5,074 to $6,146 in the third quarter 2010; The gross profit increased $758 and $1,072 respectively in the third quarter 2011 and 2010. The loss from operations and net loss remained unchanged. The impact of the restatement was limited to the presentation of the consolidated statements of operations and comprehensive income (loss). The consolidated balance sheets, the consolidated statements of stockholders’ equity and the related consolidated statements of cash flows remained unaffected.
The table below summarizes the restatement changes to the consolidated statements of operations and comprehensive income (loss):
| Three months ended September 30, 2010 | ||||||||||||
| (as reported) | (as restated) | Change | ||||||||||
| Net sales | $ | 36,308 | 37,380 | $ | 1,072 | |||||||
| Gross profit | 2,583 | 3,655 | 1,072 | |||||||||
| Selling, general and administrative expenses | 5,074 | 6,146 | 1,072 | |||||||||
| Three months ended September 30, 2011 | ||||||||||||
| (as reported) | (as restated) | Change | ||||||||||
| Net sales | $ | 28,543 | $ | 29,301 | $ | 758 | ||||||
| Gross profit | (313 | ) | 445 | 758 | ||||||||
| Selling, general and administrative expenses | 7,421 | 8,179 | 758 | |||||||||
| Nine months ended September 30, 2010 | ||||||||||||
| (as reported) | (as restated) | Change | ||||||||||
| Net sales | $ | 114,534 | $ | 118,165 | $ | 3,631 | ||||||
| Gross profit | 9,870 | 13,501 | 3,631 | |||||||||
| Selling, general and administrative expenses | 15,776 | 19,407 | 3,631 | |||||||||
| 22 |
| Nine months ended September 30, 2011 | ||||||||||||
| (as reported) | (as restated) | Change | ||||||||||
| Net sales | $ | 100,017 | $ | 103,058 | $ | 3,041 | ||||||
| Gross profit | 2,793 | 5,834 | 3,041 | |||||||||
| Selling, general and administrative expenses | 20,425 | 23,466 | 3,041 | |||||||||
Item 2. Management’s Discussion and Analysis of Financial Condition and Results of Operations.
Forward Looking Statements
We have included and from time to time may make in our public filings, press releases or other public statements, certain statements, including, without limitation, those under “Management’s Discussion and Analysis of Financial Condition and Results of Operations”. In some cases, these statements are identifiable through the use of words such as “anticipate,” “believe,” “estimate,” “expect,” “intend,” “plan,” “project,” “target,” “can,” “could,” “may,” “should,” “will,” “would” and similar expressions. You are cautioned not to place undue reliance on these forward-looking statements. In addition, our management may make forward-looking statements to analysts, investors, representatives of the media and others. These forward-looking statements are not historical facts and represent only our beliefs regarding future events, many of which, by their nature, are inherently uncertain and beyond our control.
The following discussion should be read in conjunction with the Consolidated Financial Statements and Notes thereto appearing elsewhere in this Form 10-Q. The following discussion contains forward-looking statements. Our actual results may differ significantly from those projected in the forward-looking statements. Factors that may cause future results to differ materially from those projected in the forward-looking statements include, but are not limited to, those discussed in “Risk Factors” in our Annual Report on Form 10-K for the year ended December 31, 2010 and elsewhere in this Form 10-Q.
Overview (All dollar amounts in thousands)
China 3C Group (including its subsidiaries unless the context indicates otherwise, “China 3C,” the “Company,” “we,” “us,” or “our”) was incorporated on August 20, 1998 under the laws of the State of Nevada. Capital Future Developments Limited (“Capital”) was incorporated on July 22, 2004 under the laws of the British Virgin Islands. Zhejiang Yong Xin Digital Technology Company Limited (“Zhejiang”), Yiwu Yong Xin Communication Limited (“Yiwu”), Hangzhou Wandda Electronics Company Limited (“Wang Da”), Hangzhou Sanhe Electronic Technology, Limited (“Sanhe”), and Shanghai Joy & Harmony Electronic Development Company Limited (“Joy & Harmony”) were incorporated under the laws of the Peoples Republic of China (“PRC” or “China”) on July 11, 2005, July 18, 1997, March 30, 1998, April 12, 2004, and August 25, 2003, respectively. China 3C owns 100% of Capital and Capital own 100% of the capital stock of Joy & Harmony and Sanhe. Until August 14, 2007, when it made the change to its ownership structure described in the next paragraph in order to comply with certain requirements of PRC law, Capital owned 100% of the capital stock of Zhenjiang. Zhejiang owns 90% and Yiwu owns 10% of Wang Da. Zhejiang owns 90% and Wang Da owns 10% of Yiwu. On March 10, 2009 Zhejiang set up a new operating entity, Hangzhou Letong Digital Technology Co., Ltd. (“Letong”) to establish an electronic retail franchise operation for China 3C Group. On July 6, 2009, Zhejiang and Yiwu acquired Jinhua Baofa Logistic Limited (“Jinhua”). Jinhua was incorporated under the laws of PRC on December 27, 2001.
| 23 |
On December 21, 2005, Capital became a wholly owned subsidiary of China 3C through a merger with a wholly owned subsidiary of the Company (the “Merger Transaction”). China 3C acquired all of the issued and outstanding capital stock of Capital pursuant to a Merger Agreement dated at December 21, 2005 by and among China 3C, XY Acquisition Corporation, Capital and the shareholders of Capital (the “Merger Agreement”). Pursuant to the Merger Agreement, Capital became a wholly owned subsidiary of China 3C and, for the Capital shares, China 3C issued 35,000,000 shares of its common stock to the shareholders of Capital, representing 93% of the issued and outstanding capital stock of China 3C at that time and cash of $500. On August 15, 2007, we executed a series of contractual agreements between Capital and Zhejiang. The contractual agreements give Capital and its equity owners an obligation, and having ability to absorb, any losses, and rights to receive returns; however, these contractual agreements did not change the equity ownership of Zhejiang. We did not dispose Capital’s actual equity ownership of Zhejiang when we execute the contractual agreements. Capital entered into share-holding entrustment agreements with five individuals - Zhenggang Wang, Yimin Zhang, Huiyi Lv, Xiaochun Wang and Zhongsheng Bao to hold 35%, 20%, 20%, 15% and 10%, respectively, of the equity interest of Zhejiang on behalf of Capital on November 21, 2005. The entrustment agreements confirm that Capital is the actual owner of Zhejiang. Capital enjoys the actual shareholder’s rights and has the right to obtain any benefits received by the nominal holders. Zhenggang Wang is the CEO and shareholder of China 3C Group. Yimin Zhang, Huiyi Lv, Xiaochun Wang and Zhongsheng Bao have no other relationship with China 3C Group. No consideration was given to these individuals who held the equity of Zhejiang on behalf of Capital.
On August 3, 2006, Capital completed the acquisition of 100% of the equity of Sanhe for a combination of cash and stock valued at $8,750 (consisting of 915,751 newly issued shares of the Company’s common stock and $5,000 in cash).
On November 28, 2006, Capital completed the acquisition of 100% of the equity of Joy & Harmony for a combination of cash and stock valued at $18,500 (consisting of 2,723,110 shares of the Company’s common stock and $7,500 in cash).
On July 6, 2009, Zhejiang and Yiwu acquired Jinhua, a company organized under the laws of the PRC. Zhejiang acquired 90% and Yiwu acquired 10% of the entire equity interests in Jinhua from the shareholders of Jinhua for RMB 120,000,000 ($17,500) in cash.
Yiwu, Wangda, Sanhe and Joy & Harmony are engaged in the resale and distribution of third party products and generate 100% of their revenue from resale of items such as mobile phones, facsimile machines, DVD players, stereos, speakers, MP3 and MP4 players, iPod, electronic dictionaries, CD players, radios and audio systems. We sell and distribute products through retail stores and secondary distributors. We operate most of our retail operations through our “store in store” model. Under this model, the Company leases space in major department stores and retailers. Leasing costs can vary based on a percentage of sales, or can be fixed. In the three and nine months ended September 30, 2011 and 2010, all of our stores in stores leases were variable based on sales.
Following the acquisition of Jinhua, the Company began providing logistical services to businesses in addition to its traditional business of resale and distribution of third party products such as mobile phones, facsimile machines, DVD players, stereos, speakers, MP3 and MP4 players, iPods, electronic dictionaries, CD players, radios and audio systems.
In 2009, Zhejiang started establishing direct electronic retail stores and franchise operation. Zhejiang opened three direct stores and two franchise stores during the trial operating period. As of September 30, 2011, all 5 stores were closed due to the intense competition from larger electronics department stores such as Gomei and Suning. The 5 stores accumulated total deficit of $302 in 2010 and $295 for the nine months ended September 30, 2011.
| 24 |
Results of Operations for the Three and Nine Months Ended September 30, 2011 and 2010
Reportable Operating Segments
The Company reports financial and operating information in the following five segments:
| a) | Yiwu |
| b) | Wang Da |
| c) | Sanhe |
| d) | Joy & Harmony |
| e) | Jinhua |
| a) | Yiwu |
Yiwu focuses on the selling, circulation and modern logistics of fax machines and cord phone products.
| Nine months ended September 30, | ||||||||||||
| Yiwu | 2011 (restated) | 2010 (restated) | Percentage Change | |||||||||
| Revenue | $ | 10,731 | $ | 15,813 | (32.1 | )% | ||||||
| Gross Profit | 938 | 1,734 | (45.9 | )% | ||||||||
| Profit Margin | 8.7 | % | 11.0 | % | (2.3 | )% | ||||||
| Operating Loss | (1,390 | ) | (801 | ) | (73.5 | )% | ||||||
| Three months ended September 30, | ||||||||||||
| Yiwu | 2011 (restated) | 2010 (restated) | Percentage Change | |||||||||
| Revenue | $ | 3,119 | $ | 4,860 | (35.8 | )% | ||||||
| Gross Profit | 170 | 447 | (62.0 | )% | ||||||||
| Profit Margin | 5.5 | % | 9.2 | % | (3.7 | )% | ||||||
| Operating Loss | (540 | ) | (315 | ) | (71.4 | )% | ||||||
For the nine months ended September 30, 2011, Yiwu generated revenue of $10,731, a decrease of $5,082 or 32.1% compared to $15,813 for the nine months ended September 30, 2010. Gross profit decreased $796 or 45.9% from $1,734 for the nine months ended September 30, 2010 to $938 for the nine months ended September 30, 2011. Profit margin decreased 2.3% from 11.0% in the nine months ended September 30, 2010 to 8.7% in the nine months ended September 30, 2011.
For the three months ended September 30, 2011, Yiwu generated revenue of $3,119, a decrease of $1,741 or 35.8% compared to $4,860 for the three months ended September 30, 2010. Gross profit decreased $277 or 62.0% from $447 for the three months ended September 30, 2010 to $170 for the three months ended September 30, 2011. Profit margin decreased 3.7% from 9.2% in the three months ended September 30, 2010 to 5.5% in the three months ended September 30, 2011.
| 25 |
The decrease in revenue was a result of lower market demand for office appliances such as fax machines and telephones. Lower profit margin was also due to shrinking demand as well as increased promotional events in 2011 to maintain market share. Since market demand decreased, Yiwu did not have the bargaining power to increase unit sales price as much as the increase in purchase costs of office appliances.
Operating loss was $1,390 and $540 for the nine and three months ended September 30, 2011, an increase of $589 and $225 compared to $801 and $315 for the nine and three months ended September 30, 2010. Operating loss increased primarily due to decreased gross profit, increase in labor cost and management fees paid to department stores.
| b) | Wang Da |
Wang Da focuses on the selling, circulation and modern logistics of cell phones, cell phones products, and digital products, including digital cameras, digital camcorders, PDAs, flash disks, and removable hard disks.
| Nine months ended September 30, | ||||||||||||
| Wang Da | 2011 (restated) | 2010 (restated) | Percentage Change | |||||||||
| Revenue | $ | 30,204 | $ | 31,762 | (4.9 | )% | ||||||
| Gross Profit | 1,612 | 2,772 | (41.8 | )% | ||||||||
| Profit Margin | 5.3 | % | 8.7 | % | (3.4 | )% | ||||||
| Operating Loss | (2,837 | ) | (1,322 | ) | (114.6 | )% | ||||||
| Three months ended September 30, | ||||||||||||
| Wang Da | 2011 (restated) | 2010 (restated) | Percentage Change | |||||||||
| Revenue | $ | 8,458 | $ | 10,311 | (18.0 | )% | ||||||
| Gross Profit | 237 | 855 | (72.3 | )% | ||||||||
| Profit Margin | 2.8 | % | 8.3 | % | (5.5 | )% | ||||||
| Operating Loss | (1,064 | ) | (497 | ) | (114.1 | )% | ||||||
For the nine months ended September 30, 2011, Wang Da generated revenue of $30,204, a decrease of $1,558 or 4.9% compared to $31,762 for the nine months ended September 30, 2010. Gross profit decreased $1,160 or 20.5% from $2,772 for the nine months ended September 30, 2010 to $1,612 for the nine months ended September 30, 2011. Profit margin decreased from 8.7% in the nine months ended September 30, 2010 to 5.3% in the nine months ended September 30, 2011, a decrease of 3.4%.
For the three months ended September 30, 2011, Wang Da generated revenue of $8,458, a decrease of $1,853 or 18.0% compared to $10,311 for the three months ended September 30, 2010. The decrease in revenue was primarily attributable to the decline in demand for domestic cell phones. While the global cellular market rapidly upgraded to smart phones, domestic cell phones failed to keep up the pace. Failure to introduce high quality domestic smart phones caused the demand for domestic phones to decline. Therefore, revenue decreased for Wang Da. Gross profit decreased $618 or 72.3% from $855 for the three months ended September 30, 2010 to $237 for the three months ended September 30, 2011. Profit margin decreased from 8.3% in the three months ended September 30, 2010 to 2.8% in the three months ended September 30, 2011, a decrease of 5.5%. The decrease of gross profit and profit margin was primarily attributable to the decrease in demand for domestic cell phones which had higher profit margin than international brands such as Nokia, Motorola and Samsung.
| 26 |
Operating loss was $2,837 and $1,064 for the nine and three months ended September 30, 2011, an increase of $1,515 and $567 compared to $1,322 and $497 for the nine and three months ended September 30, 2010. Operating loss increased primarily due to decreased gross profit, an increase in labor cost and management fees paid to department stores.
| c) | Sanhe |
Sanhe focuses on the selling, circulation and modern logistics of home electronics, including DVD players, audio systems, speakers, televisions and air conditioners.
| Nine months ended September 30, | ||||||||||||
| Sanhe | 2011 (restated) | 2010 (restated) | Percentage Change | |||||||||
| Revenue | $ | 29,964 | $ | 32,322 | (7.3 | )% | ||||||
| Gross Profit | 2,050 | 3,679 | (44.3 | )% | ||||||||
| Profit Margin | 6.8 | % | 11.4 | % | (4.6 | )% | ||||||
| Operating Loss | (8,093 | ) | (1,438 | ) | (462.8 | )% | ||||||
| Three months ended September 30, | ||||||||||||
| Sanhe | 2011 (restated) | 2010 (restated) | Percentage Change | |||||||||
| Revenue | $ | 8,741 | $ | 10,269 | (14.9 | )% | ||||||
| Gross Profit | 423 | 1,029 | (58.9 | )% | ||||||||
| Profit Margin | 4.8 | % | 10.0 | % | (5.2 | )% | ||||||
| Operating Loss | (5,789 | ) | (565 | ) | (924.6 | )% | ||||||
For the nine months ended September 30, 2011, Sanhe generated revenue of $29,964, a decrease of $2,358 or 7.3% compared to $32,322 for the nine months ended September 30, 2010. Gross profit decreased $1,629 or 44.3% from $3,679 for the nine months ended September 30, 2010 to $2,050 for the nine months ended September 30, 2011. Profit margin decreased from 11.4% in 2010 to 6.8% in 2011, a decrease of 4.6%.
For the three months ended September 30, 2011, Sanhe generated revenue of $8,741, a decrease of $1,528 or 14.9% compared to $10,269 for the three months ended September 30, 2010. Gross profit decreased $606 or 58.9% from $1,029 for the three months ended September 30, 2010 to $423 for the three months ended September 30, 2011. Profit margin decreased from 10.0% in 2010 to 4.8% in 2011, a decrease of 5.2%.
The decrease in revenue was a result of decline in market demand of DVD players and speakers. The decrease in gross profit and profit margin was a result of higher sales of televisions in the first nine months of 2011 compared to higher sales in DVD players and speakers in the same period of 2010, which have higher profit margin compared to other home electronics products.
Operating loss was $8,093 and $5,789 for the nine and three months ended September 30, 2011, an increase of $6,665 and $5,224 compared to $1,438 and $565 for the nine and three months ended September 30, 2010. Operating loss increased primarily due to decreased gross profit, increase in labor cost and management fees paid to department stores as well as $4,507 in goodwill impairment.
| 27 |
| d) | Joy & Harmony |
Joy & Harmony focuses on the selling, circulation and modern logistics of consumer electronics, including MP3 players, MP4 players, iPods, electronic dictionaries, and radios.
| Nine months ended September 30, | ||||||||||||
| Joy & Harmony | 2011 (restated) | 2010 (restated) | Percentage Change | |||||||||
| Revenue | $ | 25,683 | $ | 29,681 | (13.5 | )% | ||||||
| Gross Profit | 2,544 | 3,793 | (32.9 | )% | ||||||||
| Profit Margin | 9.9 | % | 12.8 | % | (2.9 | )% | ||||||
| Operating Loss | (11,484 | ) | (1,175 | ) | (877.4 | )% | ||||||
| Three months ended September 30, | ||||||||||||
| Joy & Harmony | 2011 (restated) | 2010 (restated) | Percentage Change | |||||||||
| Revenue | $ | 7,171 | $ | 9,251 | (22.5 | )% | ||||||
| Gross (Loss)/Profit | 460 | 1,037 | (55.6 | )% | ||||||||
| Profit Margin | 6.4 | % | 11.2 | % | (4.8 | )% | ||||||
| Operating Loss | (9,444 | ) | (547 | ) | (1,626.5 | )% | ||||||
For the nine months ended September 30, 2011, Joy & Harmony generated revenue of $25,683, a decrease of $3,998 or 13.5% compared to $29,681 for the nine months ended September 30, 2010. Gross profit decreased $1,249 or 32.9% from $3,793 for the nine months ended September 30, 2010 to $2,544 for the nine months ended September 30, 2011. Profit margin decreased from 12.8% in 2010 to 9.9% in 2011, a decrease of 2.9%.
For the three months ended September 30, 2011, Joy & Harmony generated revenue of $7,171, a decrease of $2,080 or 22.5% compared to $9,251 for the three months ended September 30, 2010. Gross profit decreased $577 or 55.6% from $1,037 for the three months ended September 30, 2010 to $460 for the three months ended September 30, 2011. Profit margin decreased from 11.2% in 2010 to 6.4% in 2011, a decrease of 4.8%.
The decrease in revenue was due to a lower demand for small digital products such as MP3 and MP4. The decrease in profit margin was primarily due to a higher percentage of sales from international brands, which usually have lower profit margin than domestic brands. In addition, the high percentage of sales rebate paid to department stores led to the further decreases of gross profit. As a result of the low profit margin and high sales rebate, Joy & Harmony had gross loss for the three months ended September 30, 2011.
Operating loss was $11,484 and $9,444 for the nine and three months ended September 30, 2011, an increase of $10,309 and $8,897 compared to $1,175 and $547 for the nine and three months ended September 30, 2010. Operating loss increased primarily due to decreased gross profit and increased operating expenses including an increase in labor cost of $578 or 41.6% for the nine months ended September 30, 2011 compared to the same period in 2010, and an increase in promotional expenses of $1,711 to market the new E-book reader under the brand “Lotour”. In addition, Joy & Harmony incurred $6,250 in goodwill impairment.
| e) | Jinhua |
Jinhua provides transportation service to business and transports freight, including electronics, machinery and equipment, metal products, chemical materials, garments and handicraft goods, in more than 20 cities in Eastern China. Its transportation services cover many of the most developed cities in Eastern China such as Shanghai, Hangzhou and Nanjing.
| 28 |
| Nine months ended September 30, | Percentage | |||||||||||
| Jinhua | 2011 | 2010 | Change | |||||||||
| Revenue | $ | 6,107 | $ | 8,084 | (24.5 | )% | ||||||
| Gross (Loss)/Profit | (1,323 | ) | 1,464 | (190.4 | )% | |||||||
| Profit Margin | (21.7 | )% | 18.1 | % | (39.8 | )% | ||||||
| Operating (Loss)/Income | (2,515 | ) | 346 | (826.9 | )% | |||||||
| Three months ended September 30, | Percentage | |||||||||||
| Jinhua | 2011 | 2010 | Change | |||||||||
| Revenue | $ | 1,720 | $ | 2,568 | (33.0 | )% | ||||||
| Gross Profit/(Loss) | (841 | ) | 270 | (411.5 | )% | |||||||
| Profit Margin | (48.9 | )% | 10.5 | % | (59.4 | )% | ||||||
| Operating (Loss) | (1,207 | ) | (102 | ) | (1,083.3 | )% | ||||||
For the nine months ended September 30, 2011, Jinhua generated revenue of $6,107, a decrease of $1,977 or 24.5% compared to $8,084 for the nine months ended September 30, 2010. Gross profit decreased $2,787 or 190.4% from $1,464 for the nine months ended September 30, 2010 to $(1,323) for the nine months ended September 30, 2010. Profit margin decreased from 18.1% in 2010 to (21.7)% in 2011, a decrease of 39.8%. Operating loss was $2,515 for the nine months ended September 30, 2010, a decrease of $2,861 or 826.9% compared to operating income of $346 for the nine months ended September 30, 2010.
For the three months ended September 30, 2011, revenue decreased from $2,568 for the three months ended September 30, 2011 to $1,720, a decrease of $848 or 33.0%. Gross profit decreased $1,111 or 411.5% from $270 for the three months ended September 30, 2010 to $(841) for the three months ended September 30, 2011. Profit margin decreased 59.4% from 10.5% for the three months ended September 30, 2010 to (48.9)% for the three months ended September 30, 2011. Operating loss was $1,207 for the three months ended September 30, 2011, an increase of $1,105 or 1,083.3% compared to $102 for the three months ended September 30, 2010.
The logistics industry is experiencing a downturn. While fuel and labor costs continue to rise, and toll rates remain high, the price for transportation did not increase accordingly. Therefore, revenue and profit margin decreased. Operating income decreased primarily due to decreased gross profit. Higher operating expenses, labor cost in particular, also caused operating income to decrease. Jinhua also incurred an impairment of goodwill of $472 in the third quarter of 2011.
For the three months ended September 30, 2011, revenue and gross profit decreased substantially. The decrease was a result of land expropriation in the area in Yiwu where Jinhua’s distribution center located. The expropriation affected Jinhua’s normal operation which led to lower revenue in the third quarter of 2011. Currently Jinhua is searching for a new distribution center to solve the issue.
Net Sales
Net sales for the nine months ended September 30, 2011 decreased by 12.8% to $103,058 compared to $118,165 for the nine months ended September 30, 2010. Net sales for the three months ended September 30, 2011 decreased by 21.6%, to $29,301 compared to $37,380 for the three months ended September 30, 2010. Management believes the sales decrease was a result of various factors including a slowdown in the retail markets in general, weaker demand for consumer and business electronics as well as the pressure of increased competitions from supermarkets, internet commerce and increased TV shopping networks.
| 29 |
Cost of Sales
Cost of sales (“COS”) for the nine months ended September 30, 2011 was $97,224 compared to $104,664 for the nine months ended September 30, 2010, a decrease of 7.1%. COS for the three months ended September 30, 2011 was $28,856 compared to $33,725 for the three months ended September 30, 2010, a decrease of 14.4%. The decreased COS for the three months was a result of the decrease in sales from the comparable period. In addition, higher fuel cost and higher cost of consumer electronics also contributed to the increased COS.
Profit Margin
Profit margin for the nine months ended September 30, 2011 was 5.7% compared to 11.4% for the nine months ended September 30, 2010. Profit margin for the three months ended September 30, 2011 was 1.5% compared to 9.8% for the three months ended September 30, 2010. The lower profit margin was primarily due to the decreased unit sales prices of consumer and business electronics in the competitive market in China. In addition, international brand name electronics represented a higher percentage of sales in the first nine months of 2011 compared to 2010. The increased sales of brand name electronics led to lower profit margin since brand name electronics have lower profit margins compared to domestic products. A higher percentage of sales rebate paid to department stores also caused profit margin to decrease. For the logistics segment, the decrease in profit margin was primarily due to increased fuel cost.
General and Administrative Expenses
General and administrative expenses for the nine months ended September 30, 2011 were $23,466 or 22.8% of net sales, compared to $19,407 or 16.4% of net sales for the nine months ended September 30, 2010, an increase of 20.9%. General and administrative expenses for the three months ended September 30, 2011 were $8,179 or 27.9% of net sales, compared to $6,146 or 16.4% of net sales for the three months ended September 30, 2010, an increase of 33.1%. The increase in general and administrative expenses for the three and nine months ended September 30, 2011 was primarily due to an increase in labor cost of $1,187 and an increase in advertising and promotional expenses of $1,711 to market “Lotour” E-book reader for the nine months ended September 30, 2011.
Goodwill impairment
During the third quarter of 2011, Sanhe, Joy & Harmony and Jinhua all incurred net losses, and the Company expects continuous losses for the foreseeable future. As a result, Sanhe, Joy & Harmony and Jinhua recognized goodwill impairment loss of $4,507, $6,250 and $472, respectively. The total amount of $11,229 of goodwill impairment was recorded in the income statement as a separate line item.
Loss from Operations
Operating loss for the nine months ended September 30, 2011 was $28,861 or (28.0)% of net sales compared to $5,906 or (5.0)% of net sales for the nine months ended September 30, 2010, a decrease of 388.7%. Operating loss for the three months ended September 30, 2011 was $18,963 or (64.7)% of net sales compared to $2,491 or (6.7)% of net sales for the three months ended September 30, 2010, a decrease of 661.3%. Lower sales, lower profit margin, increased operating expenses and impairment of goodwill of $11,229 were the key factors for the increase in loss from operations during the three and nine months ended September 30, 2011 compared to 2010.
| 30 |
Provision for Income Taxes
The provision for income taxes for the nine months ended September 30, 2011 was $152 compared to $254 for the nine months ended September 30, 2010. The provision for income taxes for the three months ended September 30, 2011 was $23 compared to $64 for the three months ended September 30, 2010. Income tax expense was not significant due to all subsidiaries of China 3C having losses in the three and nine months ended September 30, 2011. Jinhua was the only subsidiary that incurred nominal income tax expenses because Jinhua uses simplified tax system, which imposes taxes on sales instead of operating income.
Net Loss
Net loss was $28,699 or 27.8% of net sales for the nine months ended September 30, 2011 compared to $6,201 or 5.2% of net sales for the nine months ended September 30, 2010, an increase of 362.8%. Net loss was $18,505 or 63.2% of net sales for the three months ended September 30, 2011 compared to $2,606 or 7.0% of net sales for the three months ended September 30, 2010, an increase of 610.0%. Decreased sales revenue, lower profit margin, higher operating expenses and impairment of goodwill were the critical factors which contributed to the decrease in net income.
Liquidity and Capital Resources
Operations and liquidity needs are funded primarily through cash flows from operations. Cash and equivalents were $10,256 at September 30, 2011, compared to $29,123 at September 30, 2010, and $26,249 at December 31, 2010.
We believe the funds available to us are adequate to meet our operating needs for the remainder of 2011.
Our cash flows for the nine month periods are summarized as follows:
| Nine months ended September 30, | ||||||||
| 2011 | 2010 | |||||||
| Net cash (used in) operating activities | $ | (17,153 | ) | $ | (1,391 | ) | ||
| Net cash (used in) investing activities | (427 | ) | (18 | ) | ||||
| Effect of exchange rate change on cash and equivalents | 1,587 | 624 | ) | |||||
| Net decrease in cash and equivalents | (15,993 | ) | (785 | ) | ||||
| Cash and equivalents at beginning of period | 26,249 | 29,908 | ||||||
| Cash and equivalents at end period | $ | 10,256 | $ | 29,123 | ||||
Operating Activities
Net cash used in operating activities was $16,673 for the nine months ended September 30, 2011 compared to $1,391 for the nine months ended September 30, 2010, a 1,098.6% increase. The increase was mainly attributable to several factors, including (i) net loss of $28,699; (ii) increase in accounts receivable of $926; (iii) decrease in accrued expenses of $2,788, offset by the decrease in tax receivable of $1,234 and increase in accounts payable of $511 in the nine months ended September 30, 2011, and add back stock compensation of $892, amortization expense of $1,048 and goodwill impairment of $11,229.
| 31 |
| Nine months ended September 30, | ||||||||||||
| 2011 | 2010 | Percentage Change | ||||||||||
| Sales, Net | $ | 100,017 | $ | 114,534 | (12.7 | )% | ||||||
| September 30, 2011 | December 31, 2010 | |||||||||||
| (Unaudited) | ||||||||||||
| Accounts receivable | $ | 12,371 | $ | 14,619 | (15.4 | )% | ||||||
Accounts receivable decreased 15.4% in the first nine months of 2011 while sales decreased 12.7%. The change in accounts receivable is in line with the change in sales. Management monitors and periodically assesses the collectability of accounts receivable to ensure the allowance for bad debt account is reasonably estimated. Collection of debt is based on the terms of legal binding documents. Our account receivable department has periodically reviewed the allowance for doubtful accounts. The bad debt allowance is based on the aging of receivables, credit history and credit quality of the customers, the term of the contracts as well as the balance outstanding. If an account receivable item is considered probable to be uncollectible, it will be charged to bad debts immediately.
Capital Expenditures
We did not have any material capital expenditures for the first nine months of 2010. In the first nine months of 2011, we purchased a mold custom designed for the “Lotour” brand E-book for $421 and office equipment for $6.
Working Capital Requirements
Historically operations and short term financing have been sufficient to meet our cash needs. We believe we will be able to generate revenues from sales and raise capital through private placement offerings of our equity securities to provide the necessary cash flow to meet anticipated working capital requirements. However, our working capital needs for the long and short term will depend upon numerous factors, including operating results, competition, and the availability of credit facilities, none of which can be predicted with certainty. Future expansion will be limited by the availability of financing products and raising capital.
Off-Balance Sheet Arrangements
We have never entered into any off-balance sheet arrangements and have never established any special purpose entities. We have not guaranteed any debt or commitments of other entities or entered into any options on non-financial assets.
Critical Accounting Policies
Our discussion and analysis of our financial condition and results of operations is based upon our consolidated financial statements, which were prepared in accordance with accounting principles generally accepted in the United States. The preparation of these consolidated financial statements requires us to make estimates, judgments and assumptions that affect the reported amounts of assets, liabilities, revenues and expenses, and the related disclosure of contingent assets and liabilities. We base our estimates on historical experience and on various other assumptions that we believe are reasonable under the circumstances, the results of which form the basis for making judgments about the carrying values of assets and liabilities that are not readily apparent from other sources. Actual results may differ from these estimates.
| 32 |
An accounting policy is considered to be critical if it requires an accounting estimate to be made based on assumptions about matters that are highly uncertain at the time the estimates are made, and if different estimates that reasonably could have been used, or changes in the accounting estimates that are reasonably likely to occur, could materially impact the consolidated financial statements. We believe the following critical accounting policies reflect the more significant estimates and assumptions used in the preparation of the consolidated financial statements.
Revenue Recognition
Our revenues are generated from sales of electronics products. All of our revenue transactions contain standard business terms and conditions. We determine the appropriate accounting for these transactions after considering (1) whether a contract exists; (2) when to recognize revenue on the deliverables; and (3) whether all elements of the contract have been fulfilled and delivered. In addition, our revenue recognition policy requires an assessment as to whether collection is reasonably assured, which inherently requires us to evaluate the creditworthiness of our customers. Changes in judgments on these assumptions and estimates could materially impact the timing or amount of revenue recognition.
Please refer to Note 2 in the footnotes to the financial statements for detailed description of our revenue recognition policy.
Inflation
Neither inflation nor changing prices has had a material impact on the Company’s net sales, revenues or income from continuing operations during the past three fiscal years.
After Sales Service
The after-sales services we provide to our customers are primarily repair and maintenance. If a customer buys a product from us and needs repairs, we typically arrange to have the manufacturer repair the product. In certain cases, clerks in our stores are able to make the repairs directly.
Tabular Disclosure of Contractual Obligations
The following table sets forth our contractual obligations as of September 30, 2011:
| Payment Due by Period | ||||||||||||
| Less than 1 | ||||||||||||
| Contractual Obligations | Total | year | 1-3 years | |||||||||
| Operating lease obligations | $ | 299,263 | $ | 231,674 | $ | 67,589 | ||||||
| Advertising obligations | 318,278 | 318,278 | - | |||||||||
| E-Book contract obligations | 87,214 | 87,214 | - | |||||||||
| Total contractual obligations | $ | 704,755 | $ | 637,166 | $ | 67,589 | ||||||
| 33 |
Item 4. Controls and Procedures.
Evaluation of Disclosure Controls and Procedures
Under the supervision and with the participation of our management, including our principal executive officer and principal financial officer, our management conducted an evaluation of our disclosure controls and procedures as of September 30, 2011, as such term is defined in Rules 13a-15(e) and 15d-15(e) under the Exchange Act. Based on this evaluation, our principal executive officer and principal financial officer concluded that, as of such date, the Company’s disclosure controls and procedures were were not effective due to: the current staff in our accounting department are inexperienced in US GAAP. They need substantial training to meet the demands of a US public company. The accounting skills and understanding necessary to fulfill the requirements of US GAAP-based reporting, including the preparation of financial statements and consolidation, are inadequate.
Disclosure controls and procedures are designed to provide that information required to be disclosed by us in reports that we file or submit under the Exchange Act is accumulated, recorded, processed, summarized, communicated to our management, including our principal executive officer and principal financial officer and reported within the time periods specified in Securities and Exchange Commission rules and forms.
Changes in Internal Control over Financial Reporting
Other than the changes relating to the material weakness described above, there was no change in our internal control over financial reporting that occurred during the third quarter of 2011 covered by this Quarterly Report on Form 10-Q/A that has materially affected, or is reasonably likely to materially affect, our internal control over financial reporting.
PART II. OTHER INFORMATION
Item 6. Exhibits.
Exhibit No. | Document Description | |
| 31.1 | Certification of the Chief Executive Officer pursuant to Rule 13A-14(A)/15D-14(A) of the Securities Exchange Act of 1934, as adopted pursuant to Section 302 of the Sarbanes-Oxley Act of 2002. | |
| 31.2 | Certification of the Chief Financial Officer pursuant to Rule 13A-14(A)/15D-14(A) of the Securities Exchange Act of 1934, as adopted pursuant to Section 302 of the Sarbanes-Oxley Act of 2002. | |
| 32.1 | Certification of the Chief Executive Officer and Chief Financial Officer pursuant to 18 U.S.C. 1350 (Section 906 of the Sarbanes-Oxley Act of 2002). |
The following financial statements from China 3C Group’s Quarterly Report on Form 10-Q for the quarterly period ended September 30, 2011 formatted in XBRL (eXtensible Business Reporting Language): (i) the Consolidated Balance Sheets (unaudited); (ii) the Consolidated Statements of Operations and Comprehensive Loss (unaudited); (iii) the Consolidated Statements of Cash Flows (unaudited); and, (iv) the Notes to Consolidated Financial Statements, tagged as blocks of text.
SIGNATURES
Pursuant to the requirements of the Securities Exchange Act of 1934, the registrant has duly caused this report to be signed on its behalf by the undersigned thereunto duly authorized.
| CHINA 3C GROUP | ||
| Date: May ___, 2012 | By: | /s/ |
| Name: Zhenggang Wang | ||
| Title: Chief Executive Officer and Chairman | ||
| (Principal Executive Officer) | ||
| 34 |
| Date: May ___, 2012 | By: | /s/ |
| Name: Weiping Wang | ||
| Title: Chief Financial Officer (Principal Accounting and Financial Officer) | ||
EXHIBIT INDEX
Exhibit | Document Description | |
| 31.1 | Certification of the Chief Executive Officer pursuant to Rule 13A-14(A)/15D-14(A) of the Securities Exchange Act of 1934, as adopted pursuant to Section 302 of the Sarbanes-Oxley Act of 2002. | |
| 31.2 | Certification of the Chief Financial Officer pursuant to Rule 13A-14(A)/15D-14(A) of the Securities Exchange Act of 1934, as adopted pursuant to Section 302 of the Sarbanes-Oxley Act of 2002. | |
| 32.1 | Certification of the Chief Executive Officer and Chief Financial Officer pursuant to 18 U.S.C. 1350 (Section 906 of the Sarbanes-Oxley Act of 2002). |
The following financial statements from China 3C Group’s Quarterly Report on Form 10-Q for the quarterly period ended September 30, 2011 formatted in XBRL (eXtensible Business Reporting Language): (i) the Consolidated Balance Sheets (unaudited); (ii) the Consolidated Statements of Operations and Comprehensive Loss (unaudited); (iii) the Consolidated Statements of Cash Flows (unaudited); and, (iv) the Notes to Consolidated Financial Statements, tagged as blocks of text.
| 35 |
Exhibit 31.1
Certification of Chief Executive Officer Pursuant to
Securities Exchange Act Rules 13a-14(a) and 15d-14(a)
as Adopted Pursuant to Section 302 of the Sarbanes-Oxley Act of 2002
I, Zhenggang Wang, certify that:
1. I have reviewed this quarterly report on Form 10-Q/A of China 3C Group;
2. Based on my knowledge, this report does not contain any untrue statement of a material fact or omit to state a material fact necessary to make the statements made, in light of the circumstances under which such statements were made, not misleading with respect to the period covered by this report;
3. Based on my knowledge, the financial statements, and other financial information included in this report, fairly present in all material respects the financial condition, results of operations and cash flows of the registrant as of, and for, the periods presented in this report;
4. The registrant’s other certifying officer and I are responsible for establishing and maintaining disclosure controls and procedures (as defined in Exchange Act Rules 13a-15(e) and 15d-15(e)) and internal control over financial reporting (as defined in Exchange Act Rules 13a-15(f) and 15d-15(f)) for the registrant and have:
(a) Designed such disclosure controls and procedures, or caused such disclosure controls and procedures to be designed under our supervision, to ensure that material information relating to the registrant, including its consolidated subsidiaries, is made known to us by others within those entities, particularly during the period in which this report is being prepared;
(b) Designed such internal control over financial reporting, or caused such internal control over financial reporting to be designed under our supervision, to provide reasonable assurance regarding the reliability of financial reporting and the preparation of financial statements for external purposes in accordance with generally accepted accounting principles;
(c) Evaluated the effectiveness of the registrant’s disclosure controls and procedures and presented in this report our conclusions about the effectiveness of the disclosure controls and procedures, as of the end of the period covered by this report based on such evaluation; and
(d) Disclosed in this report any change in the registrant’s internal control over financial reporting that occurred during the registrant’s most recent fiscal quarter (the registrant’s fourth fiscal quarter in the case of an annual report) that has materially affected, or is reasonably likely to materially affect, the registrant’s internal control over financial reporting; and
5. The registrant’s other certifying officer and I have disclosed, based on our most recent evaluation of internal control over financial reporting, to the registrant’s auditors and the audit committee of the registrant’s board of directors (or persons performing the equivalent functions):
(a) All significant deficiencies and material weaknesses in the design or operation of internal control over financial reporting which are reasonably likely to adversely affect the registrant’s ability to record, process, summarize and report financial information; and
(b) Any fraud, whether or not material, that involves management or other employees who have a significant role in the registrant’s internal control over financial reporting.
| May ___, 2012 | ||
| Zhenggang Wang, Chief Executive Officer and Chairman | ||
| (Principal Executive Officer) | ||
Exhibit 31.2
Certification of Chief Financial Officer Pursuant to
Securities Exchange Act Rules 13a-14(a) and 15d-14(a)
as Adopted Pursuant to Section 302 of the Sarbanes-Oxley Act of 2002
I, Weiping Wang, certify that:
1. I have reviewed this quarterly report on Form 10-Q/A of China 3C Group;
2. Based on my knowledge, this report does not contain any untrue statement of a material fact or omit to state a material fact necessary to make the statements made, in light of the circumstances under which such statements were made, not misleading with respect to the period covered by this report;
3. Based on my knowledge, the financial statements, and other financial information included in this report, fairly present in all material respects the financial condition, results of operations and cash flows of the registrant as of, and for, the periods presented in this report;
4. The registrant’s other certifying officer and I are responsible for establishing and maintaining disclosure controls and procedures (as defined in Exchange Act Rules 13a-15(e) and 15d-15(e)) and internal control over financial reporting (as defined in Exchange Act Rules 13a-15(f) and 15d-15(f)) for the registrant and have:
(a) Designed such disclosure controls and procedures, or caused such disclosure controls and procedures to be designed under our supervision, to ensure that material information relating to the registrant, including its consolidated subsidiaries, is made known to us by others within those entities, particularly during the period in which this report is being prepared;
(b) Designed such internal control over financial reporting, or caused such internal control over financial reporting to be designed under our supervision, to provide reasonable assurance regarding the reliability of financial reporting and the preparation of financial statements for external purposes in accordance with generally accepted accounting principles;
(c) Evaluated the effectiveness of the registrant’s disclosure controls and procedures and presented in this report our conclusions about the effectiveness of the disclosure controls and procedures, as of the end of the period covered by this report based on such evaluation; and
(d) Disclosed in this report any change in the registrant’s internal control over financial reporting that occurred during the registrant’s most recent fiscal quarter (the registrant’s fourth fiscal quarter in the case of an annual report) that has materially affected, or is reasonably likely to materially affect, the registrant’s internal control over financial reporting; and
5. The registrant’s other certifying officer and I have disclosed, based on our most recent evaluation of internal control over financial reporting, to the registrant’s auditors and the audit committee of the registrant’s board of directors (or persons performing the equivalent functions):
(a) All significant deficiencies and material weaknesses in the design or operation of internal control over financial reporting which are reasonably likely to adversely affect the registrant’s ability to record, process, summarize and report financial information; and
(b) Any fraud, whether or not material, that involves management or other employees who have a significant role in the registrant’s internal control over financial reporting.
| May ___, 2012 | ||
| Weiping Wang, Chief Financial Officer | ||
| (Principal Financial and Accounting Officer) |
Exhibit 32.1
CERTIFICATION PURSUANT TO 18 U.S.C. SECTION 1350,
AS ADOPTED PURSUANT TO SECTION 906
OF THE SARBANES-OXLEY ACT OF 2002
In connection with the Quarterly Report of China 3C Group (the “Company”) on Form 10-Q/A for the period ended September 30, 2011 as filed with the Securities and Exchange Commission on the date hereof (the “Report”), each of the undersigned officers of the Company hereby certifies, pursuant to 18 U.S.C. § 1350, as adopted pursuant to § 906 of the Sarbanes-Oxley Act of 2002, that:
1. The Report fully complies with the requirements of Section 13(a) or 15(d) of the Securities Exchange Act of 1934; and
2. Information contained in the Report fairly presents, in all material respects, the financial condition and results of operations of the Company.
| May ___, 2012 | ||
| Zhenggang Wang, Chief Executive Officer and Chairman | ||
| (Principal Executive Officer) | ||
| May ___, 2012 | ||
| Weiping Wang, Chief Financial Officer | ||
| (Principal Financial and Accounting Officer) | ||