
© 2023 Texas Capital Bank Member FDIC July 20, 2023 Q2-2023 Earnings

2 Forward-Looking Statements This communication contains “forward-looking statements” within the meaning of and pursuant to the Private Securities Litigation Reform Act of 1995 regarding, among other things, TCBI’s financial condition, results of operations, business plans and future performance. These statements are not historical in nature and may often be identified by the use of words such as “believes,” “projects,” “expects,” “may,” “estimates,” “should,” “plans,” “targets,” “intends” “could,” “would,” “anticipates,” “potential,” “confident,” “optimistic” or the negative thereof, or other variations thereon, or comparable terminology, or by discussions of strategy, objectives, estimates, trends, guidance, expectations and future plans. Because forward-looking statements relate to future results and occurrences, they are subject to inherent and various uncertainties, risks, and changes in circumstances that are difficult to predict, may change over time, are based on management’s expectations and assumptions at the time the statements are made and are not guarantees of future results. Numerous risks and other factors, many of which are beyond management’s control, could cause actual results to differ materially from future results expressed or implied by such forward-looking statements. While there can be no assurance that any list of risks is complete, important risks and other factors that could cause actual results to differ materially from those contemplated by forward- looking statements include, but are not limited to, credit quality and risk, the unpredictability of economic and business conditions that may impact TCBI or its customers, recent adverse developments in the banking industry highlighted by high-profile bank failures and the potential impact of such developments on customer confidence, liquidity and regulatory responses to these developments, the Company’s ability to effective manage its liquidity risk and any growth plans and the availability of capital and funding, the Company’s ability to effectively manage information technology systems, cyber incidents or other failures, disruptions or security breaches, interest rates, including the impact of rising rates on the Company’s securities portfolio and funding costs, commercial and residential real estate values, adverse or unexpected economic conditions, including inflation, recession, the threat of recession, and market conditions in Texas, the United States or globally, including governmental and consumer responses to those economic and market conditions, fund availability, accounting estimates and risk management processes, the transition away from the London Interbank Offered Rate (LIBOR), legislative and regulatory changes, enforcement actions and regulatory examinations and investigations, ratings or interpretations, business strategy execution, the failure to identify, attract and retain key personnel, and other employees, increased or expanded competition from banks and other financial service providers in TCBI’s markets, the failure to maintain adequate regulatory capital, environmental liability associated with properties related to TCBI’s lending activities, and severe weather, natural disasters, acts of war, terrorism, global conflict, or other external events, climate change and related legislative and regulatory initiatives as well as the risks more fully described in TCBI’s most recent Annual Report on Form 10-K, Quarterly Reports on Form 10-Q and in its other documents and filings with the SEC. The information contained in this communication speaks only as of its date. Except to the extent required by applicable law or regulation, we disclaim any obligation to update such factors or to publicly announce the results of any revisions to any of the forward-looking statements included herein to reflect future events or developments.

3 Foundational Tenants of Value Creation in Place Financial Priorities Described 9/1/2021 Building Tangible Book Value // Reinvesting organically generated capital to improve client relevance and create a more valuable franchise Investment // Re-aligning the expense base to directly support the business and investing aggressively to take advantage of market opportunities that we are uniquely positioned to serve Revenue Growth // Growing top- line revenue as a result of expanded banking capabilities for best-in-class clients in our Texas and national markets Flagship Results Proactive, disciplined engagement with the best clients in our markets to provide the talent, products, and offerings they need through their entire life-cycles Structurally higher, more sustainable earnings driving greater performance and lower annual variability Consistent communication, enhanced accountability, and a bias for action ensure execution and delivery Commitment to financial resilience allowing us to serve clients, access markets, and support communities through all cycles Higher quality earnings and a lower cost of capital drive a significant expansion in incremental shareholder returns

4 12.2% 12.4% 9.3% 10.7% 16.4% 16.2% 12.8% 13.2% 0.0% 2.0% 4.0% 6.0% 8.0% 10.0% 12.0% 14.0% 16.0% 18.0% TCBI Q2 2023 G-SIBs Cat II-IV Peers CET1 Ratio Total Capital Ratio Financially Resilient Balance Sheet On-hand cash liquidity is $2.8 billion, or 10% of total assets Cash & Securities of $7.1 billion constitutes 24% of total assets Substantially more liquidity than needed to cover all uninsured deposits Uninsured deposits were $9.4 billion, or 40% of total deposits at period end Cash was 30% of uninsured deposits, in-line with large U.S. financial services firms5 Cash and contingent liquidity is 165% of uninsured deposits and 67% of all deposits Peer leading capital levels: CET1 of 12.2%, ranked 4th relative to all large U.S. financial services firms5 Tangible common equity as a percent of tangible assets6 of 9.6%, ranked 1st relative to all large U.S. financial services firms5 Total Capital ratio of 16.4%, ranked 3rd relative to all large U.S. financial services firms5 Adherence to a thru-cycle CRE strategy resulting in a manageable concentration of 137% of capital7 for Q2 2023 compared to 243% for peers3 Composition of Liquid Assets Cash & Contingent Liquidity % of Deposits CET1 Ratio & Total Capital Ratio Tangible Common Equity / Tangible Assets6 Peer Medians Peers3Cat II – IV2G-SIBs1TCBI Q2 2023 21%23%41%40%Cash & Equivalents 54%41%12%47%AFS Securities 20%22%26%13%HTM Securities 2%3%22%0%Trading Account & Other Securities 5%7%25%10%Cash & Equivalents / Total Assets 20%22%34%15%Securities / Total Assets 26%28%59%24%Cash & Securities / Total Assets 9.6% 6.4% 5.7% 7.1% 0.0% 2.0% 4.0% 6.0% 8.0% 10.0% 12.0% TCBI G-SIBs Cat II-IV Peers 2Q231Q23($M) 7,492 5,812 FHLB Borrowing Capacity 5,285 5,881 Other Short-Term Borrowing Capacities4 12,777 11,693 Total Contingent Funding 2,847 3,650 Cash & Equivalents $15,624 $15,343 Total Cash & Contingent Funding 67%69%Cash & Contingent Funding / Total Deposits 165%153%Cash & Contingent Funding / Uninsured Deposits 1 2 3 1 2 3

5 2021 Strategic Performance Drivers Where We Are Going Where We Started Where We Are Going Where We Started 2025 YTD 2023 FY 2022 FY 2021 FY 2020Performance Metrics2025 YTD 2023 FY 2022 FY 2021 FY 2020Income Statement >1.10%0.74%1.04%0.67%0.18%Return on Average Assets~10%8.4%2.9%2.7%2.2%Investment Banking and Trading Income (% of Total Revenue) >12.5%7.2%11.4%8.4%2.1%Return on Average Tangible Common Equity10~5%2.7%2.4%2.5%1.4%Treasury Product Fees8 (% of Total Revenue) >1.10%0.74%0.55%0.69%0.33%Adj. Return on Average Assets1115%–20% 15.1%28.5%15.2%19.3%Non-Interest Income (% of Total Revenue) >12.5%7.2%5.8%8.7%4.2%Adj. Return on Average Tangible Common Equity1015%–20%15.1%10.3%13.4%11.2%Adj. Non-Interest Income9 (% of Adj. Total Revenue9) >10%12.18%13.0%11.1%9.4%CET1Balance Sheet >20%30%30%38%29%Average Cash & Securities (% of Total Average Assets) <15%8%16%27%36%Average Indexed Deposits (% of Total Deposits) Treasury Solutions Private Wealth Investment Banking Gross payment revenue growth accelerated and is up 8% QoQ and 12% YoY; market-driven pricing pressures limiting near-term pull-through to treasury product fees 5+ products and services introduced or enhanced in Q2 Continued strong client adoption; YoY AUM grew 37% while client base increased 13% Client-focused platform build nearing completion improving both experience and scalability Third consecutive record quarter; 47% QoQ revenue growth included the Firm’s first closed sell-side advisory Broad contributions across the platform including Capital Solutions, Syndications and Sales & Trading YoY GrowthQ2 ‘23Q1 ‘23Q4 ‘22Q3 ‘22Q2 ‘22Financial Performance 37%$3.5$3.3$3.0$2.6$2.6Assets Under Management ($B) (2%)$7.4$7.3$7.0$7.4$7.6Treasury Product Fees8 ($M) (8%)$3.7$3.4$3.4$3.6$4.1Wealth Management & Trust Fee Income ($M) 147%$27.5$18.8$11.9$7.8$11.1Investment Banking & Trading Income ($M) 70%$38.6$29.5$22.4$18.9$22.8Income from Areas of Focus ($M)

6 Financial Performance // Income Statement Adjusted (Non-GAAP)11 Financial Highlights ($M) Q2 2023Q1 2023Q2 2022YTD-202320222022 $232.0$235.3$205.5467.3$875.8$875.8Net Interest Income 46.037.426.283.4101.0349.5Non-Interest Revenue 278.0272.7231.8550.7976.81,225.3Total Revenue 181.6194.0164.3375.7680.1727.5Non-Interest Expense 96.478.767.5175.1296.6497.8PPNR12 7.028.022.035.066.066.0Provision for Credit Losses 20.712.111.332.853.999.3Income Tax Expense 68.738.734.2107.3176.8332.5Net Income 4.34.34.38.617.317.3Preferred Stock Dividends 64.334.329.898.7159.5315.2Net Income to Common Performance Metrics 0.95%0.53%0.44%0.74%0.55%1.04%Return on Average Assets 1.33%1.09%0.86%1.21%0.93%1.55%PPNR12 / Average Assets 65%71%71%68%70%59%Efficiency Ratio13 9.17%5.06%4.35%7.15%5.73%11.33%Return on Average Common Equity $1.33$0.70$0.59$2.02$3.13$6.18Earnings Per Share 2022Non-GAAP Adjustments11 ($M) 349.5Non-Interest Revenue 248.5Gain on Sale of BDCF 101.0Non-interest Revenue, Adjusted 727.5Non-Interest Expense 29.6Transaction Costs 9.8Restructuring Expenses 8.0Charitable Contribution 680.1Non-Interest Expense, Adjusted
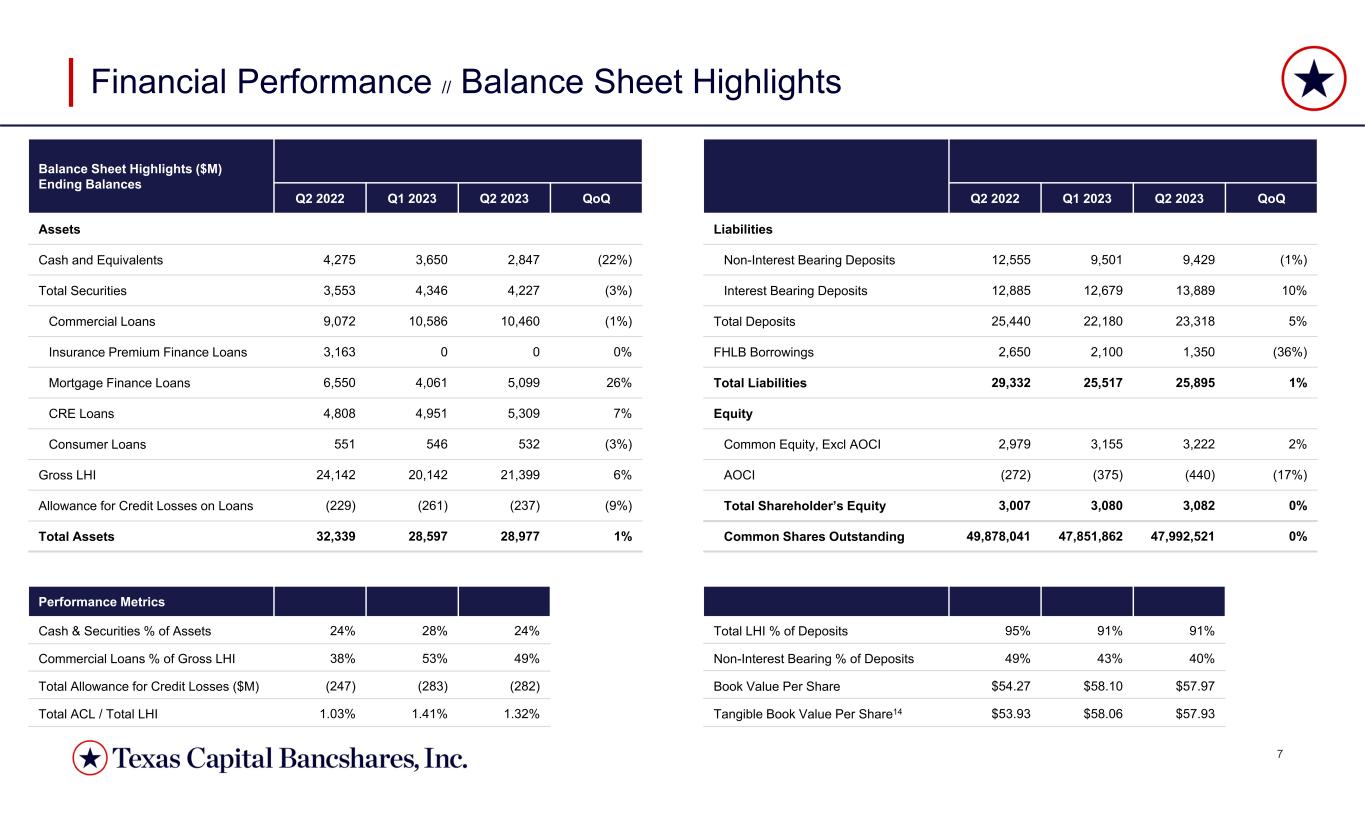
7 Balance Sheet Highlights ($M) Ending Balances QoQQ2 2023Q1 2023Q2 2022 Assets (22%)2,8473,6504,275Cash and Equivalents (3%)4,2274,3463,553Total Securities (1%)10,46010,5869,072Commercial Loans 0%003,163Insurance Premium Finance Loans 26%5,0994,0616,550Mortgage Finance Loans 7%5,3094,9514,808CRE Loans (3%)532546551Consumer Loans 6%21,39920,14224,142Gross LHI (9%)(237)(261)(229)Allowance for Credit Losses on Loans 1%28,97728,59732,339Total Assets Financial Performance // Balance Sheet Highlights Performance Metrics 24%28%24%Cash & Securities % of Assets 49%53%38%Commercial Loans % of Gross LHI (282)(283)(247)Total Allowance for Credit Losses ($M) 1.32%1.41%1.03%Total ACL / Total LHI QoQQ2 2023Q1 2023Q2 2022 Liabilities (1%)9,4299,50112,555Non-Interest Bearing Deposits 10%13,88912,67912,885Interest Bearing Deposits 5%23,31822,18025,440Total Deposits (36%)1,3502,1002,650FHLB Borrowings 1%25,89525,51729,332Total Liabilities Equity 2%3,2223,1552,979Common Equity, Excl AOCI (17%)(440)(375)(272)AOCI 0%3,0823,0803,007Total Shareholder’s Equity 0%47,992,521 47,851,862 49,878,041 Common Shares Outstanding 91%91%95%Total LHI % of Deposits 40%43%49%Non-Interest Bearing % of Deposits $57.97$58.10$54.27Book Value Per Share $57.93$58.06$53.93Tangible Book Value Per Share14
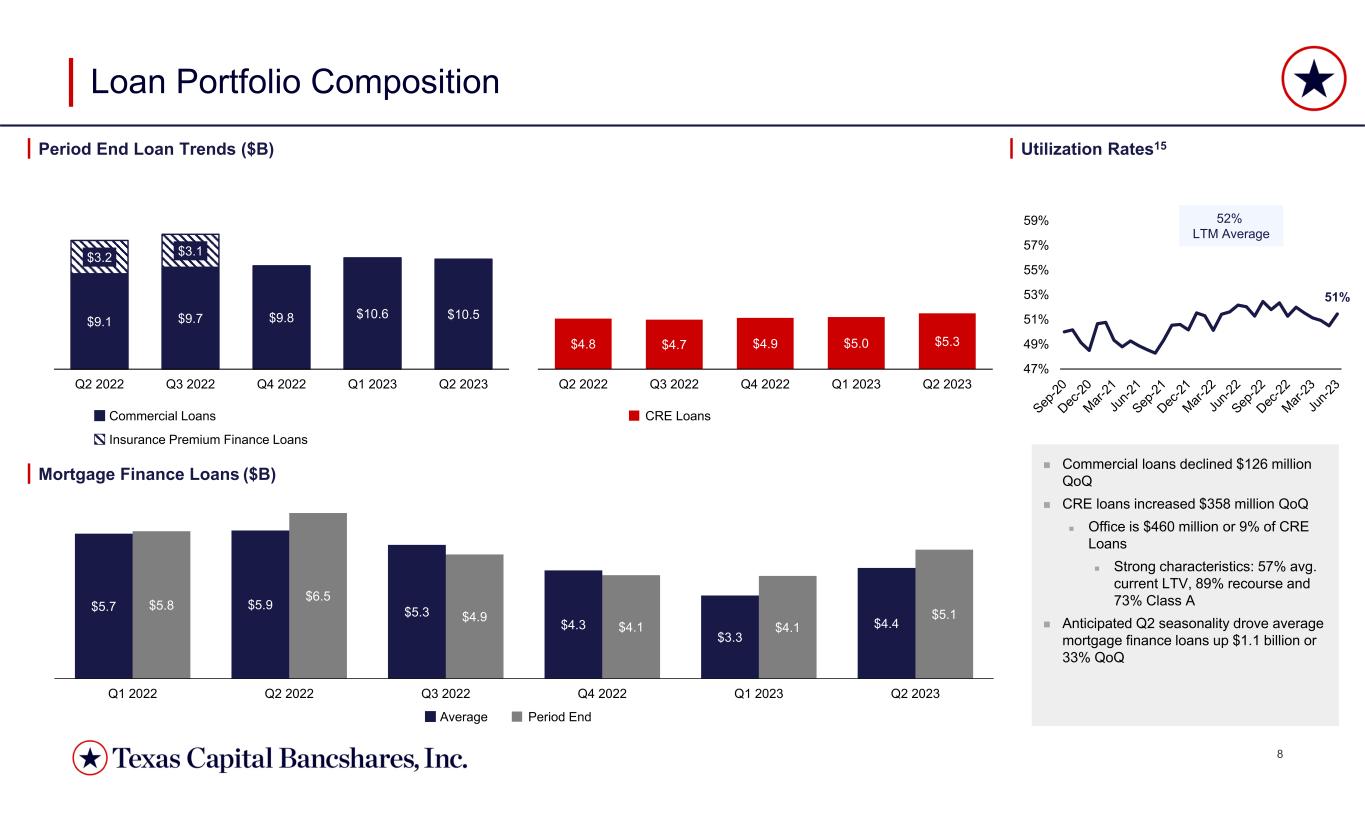
8 $5.7 $5.9 $5.3 $4.3 $3.3 $4.4 $5.8 $6.5 $4.9 $4.1 $4.1 $5.1 Q1 2022 Q2 2022 Q3 2022 Q4 2022 Q1 2023 Q2 2023 $4.8 $4.7 $4.9 $5.0 $5.3 Q2 2022 Q3 2022 Q4 2022 Q1 2023 Q2 2023 Loan Portfolio Composition Period End Loan Trends ($B) Utilization Rates15 Commercial Loans Insurance Premium Finance Loans CRE Loans $9.1 $9.7 $9.8 $10.6 $10.5 $3.2 $3.1 Q2 2022 Q3 2022 Q4 2022 Q1 2023 Q2 2023 Commercial loans declined $126 million QoQ CRE loans increased $358 million QoQ Office is $460 million or 9% of CRE Loans Strong characteristics: 57% avg. current LTV, 89% recourse and 73% Class A Anticipated Q2 seasonality drove average mortgage finance loans up $1.1 billion or 33% QoQ Mortgage Finance Loans ($B) 51% 47% 49% 51% 53% 55% 57% 59% 52% LTM Average Average Period End
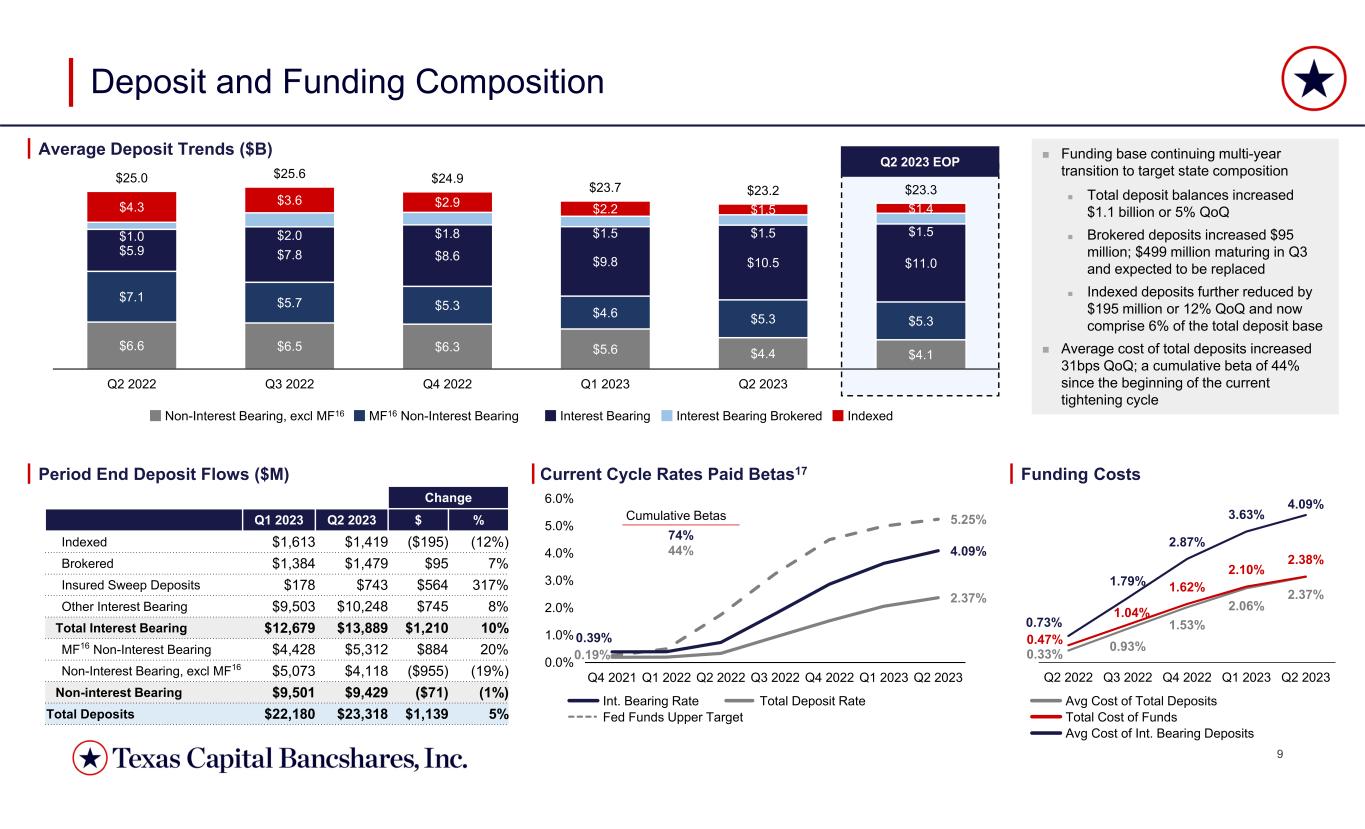
9 0.33% 0.93% 1.53% 2.06% 2.37% 0.47% 1.04% 1.62% 2.10% 2.38% 0.73% 1.79% 2.87% 3.63% 4.09% Q2 2022 Q3 2022 Q4 2022 Q1 2023 Q2 2023 Q2 2023 EOP $6.6 $6.5 $6.3 $5.6 $4.4 $4.1 $7.1 $5.7 $5.3 $4.6 $5.3 $5.3 $5.9 $7.8 $8.6 $9.8 $10.5 $11.0 $1.0 $2.0 $1.8 $1.5 $1.5 $1.5 $4.3 $3.6 $2.9 $2.2 $1.5 $1.4 $25.0 $25.6 $24.9 $23.7 $23.2 $23.3 Q2 2022 Q3 2022 Q4 2022 Q1 2023 Q2 2023 Deposit and Funding Composition Funding base continuing multi-year transition to target state composition Total deposit balances increased $1.1 billion or 5% QoQ Brokered deposits increased $95 million; $499 million maturing in Q3 and expected to be replaced Indexed deposits further reduced by $195 million or 12% QoQ and now comprise 6% of the total deposit base Average cost of total deposits increased 31bps QoQ; a cumulative beta of 44% since the beginning of the current tightening cycle Average Deposit Trends ($B) Period End Deposit Flows ($M) Funding CostsCurrent Cycle Rates Paid Betas17 Non-Interest Bearing, excl MF16 MF16 Non-Interest Bearing Interest Bearing Interest Bearing Brokered Indexed Change %$Q2 2023Q1 2023 (12%)($195)$1,419$1,613Indexed 7%$95$1,479$1,384Brokered 317%$564$743$178Insured Sweep Deposits 8%$745$10,248$9,503Other Interest Bearing 10%$1,210$13,889$12,679Total Interest Bearing 20%$884$5,312$4,428MF16 Non-Interest Bearing (19%)($955)$4,118$5,073Non-Interest Bearing, excl MF16 (1%)($71)$9,429$9,501Non-interest Bearing 5%$1,139$23,318$22,180Total Deposits Int. Bearing Rate Total Deposit Rate Fed Funds Upper Target Total Cost of Funds Avg Cost of Int. Bearing Deposits Avg Cost of Total Deposits 5.25% 0.39% 4.09% 0.19% 2.37% 0.0% 1.0% 2.0% 3.0% 4.0% 5.0% 6.0% Q4 2021 Q1 2022 Q2 2022 Q3 2022 Q4 2022 Q1 2023 Q2 2023 Cumulative Betas 74% 44%
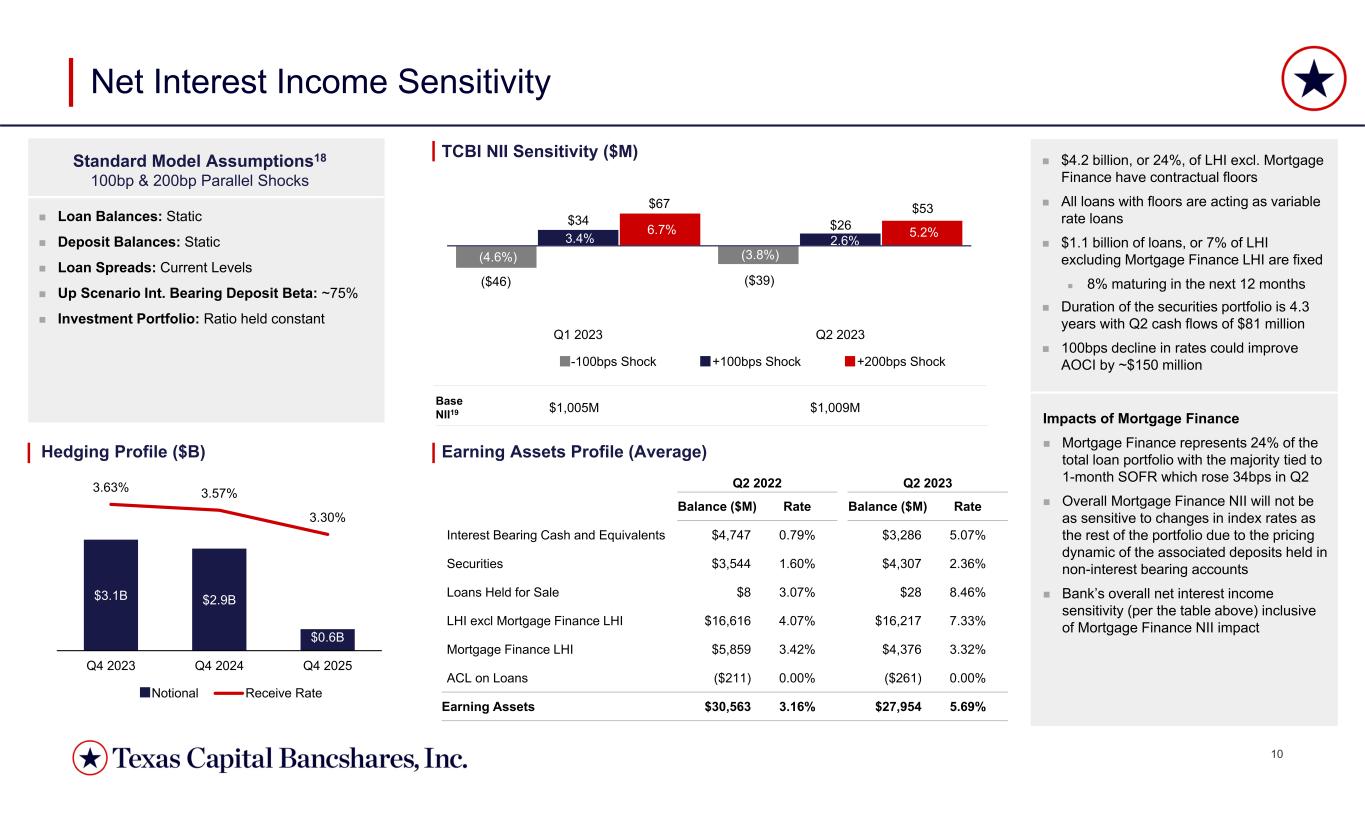
10 (4.6%) (3.8%) 3.4% 2.6% 6.7% 5.2% (15.0%) (10.0%) (5.0%) 0.0% 5.0% 10.0% 15.0% Q1 2023 Q2 2023 -100bps Shock +100bps Shock +200bps Shock $3.1B $2.9B $0.6B 3.63% 3.57% 3.30% Q4 2023 Q4 2024 Q4 2025 Notional Receive Rate Net Interest Income Sensitivity Standard Model Assumptions18 100bp & 200bp Parallel Shocks Loan Balances: Static Deposit Balances: Static Loan Spreads: Current Levels Up Scenario Int. Bearing Deposit Beta: ~75% Investment Portfolio: Ratio held constant Hedging Profile ($B) TCBI NII Sensitivity ($M) $1,009M$1,005MBase NII19 $67 $34 ($46) $53 $26 ($39) Earning Assets Profile (Average) Q2 2023Q2 2022 RateBalance ($M)RateBalance ($M) 5.07%$3,2860.79%$4,747Interest Bearing Cash and Equivalents 2.36%$4,3071.60%$3,544Securities 8.46%$283.07%$8Loans Held for Sale 7.33%$16,2174.07%$16,616LHI excl Mortgage Finance LHI 3.32%$4,3763.42%$5,859Mortgage Finance LHI 0.00%($261)0.00%($211)ACL on Loans 5.69%$27,9543.16%$30,563Earning Assets $4.2 billion, or 24%, of LHI excl. Mortgage Finance have contractual floors All loans with floors are acting as variable rate loans $1.1 billion of loans, or 7% of LHI excluding Mortgage Finance LHI are fixed 8% maturing in the next 12 months Duration of the securities portfolio is 4.3 years with Q2 cash flows of $81 million 100bps decline in rates could improve AOCI by ~$150 million Impacts of Mortgage Finance Mortgage Finance represents 24% of the total loan portfolio with the majority tied to 1-month SOFR which rose 34bps in Q2 Overall Mortgage Finance NII will not be as sensitive to changes in index rates as the rest of the portfolio due to the pricing dynamic of the associated deposits held in non-interest bearing accounts Bank’s overall net interest income sensitivity (per the table above) inclusive of Mortgage Finance NII impact

11 $205.5 $239.1 $247.6 $235.3 $232.0 2.68% 3.05% 3.26% 3.33% 3.29% Q2 2022 Q3 2022 Q4 2022 Q1 2023 Q2 2023 Net Interest Income Net Interest Margin Q2-2023 Earnings Overview Net Interest Margin ($M)Net Interest Income ($M) Non-Interest Income ($M) Fee Income Detail ($M) Non-Interest Expense ($M) 17%14%11%10%11%% of Adj Revenue11 Non-Interest Income Gain on Sale of Insur. Prem. Finance11 $26.2 $25.3 $29.2 $37.4 $46.0 Q2 2022 Q3 2022 Q4 2022 Q1 2023 Q2 2023 $248.5 $6.1 $5.0 $5.2 Deposit Service Charges Investment Banking and Trading Wealth Management $4.1 $3.4 $3.7 $11.1 $18.8 $27.5 Q2 2022 Q2 2023Q1 2023 $103.4 $115.1 $100.9 $128.7 $113.0 $60.9 $65.2 $81.4 $65.3 $68.6 $16.7 $30.8 Q2 2022 Q3 2022 Q4 2022 Q1 2023 Q2 2023 Salaries & Benefits Non-Recurring Items11Other NIE $164.3 $197.0 $213.1 $194.0 63% 58% 47% 66% 37% 34% 39% 34% 8% 14% 62% 38% $181.6 $235.3 $26.1 $8.8 $0.6 ($18.7) ($17.3) ($2.8) $232.0 Q1 2023 Loan Volume Loan Yield Loan Fees Investment Securities & Cash Deposits Borrowings Q2 2023
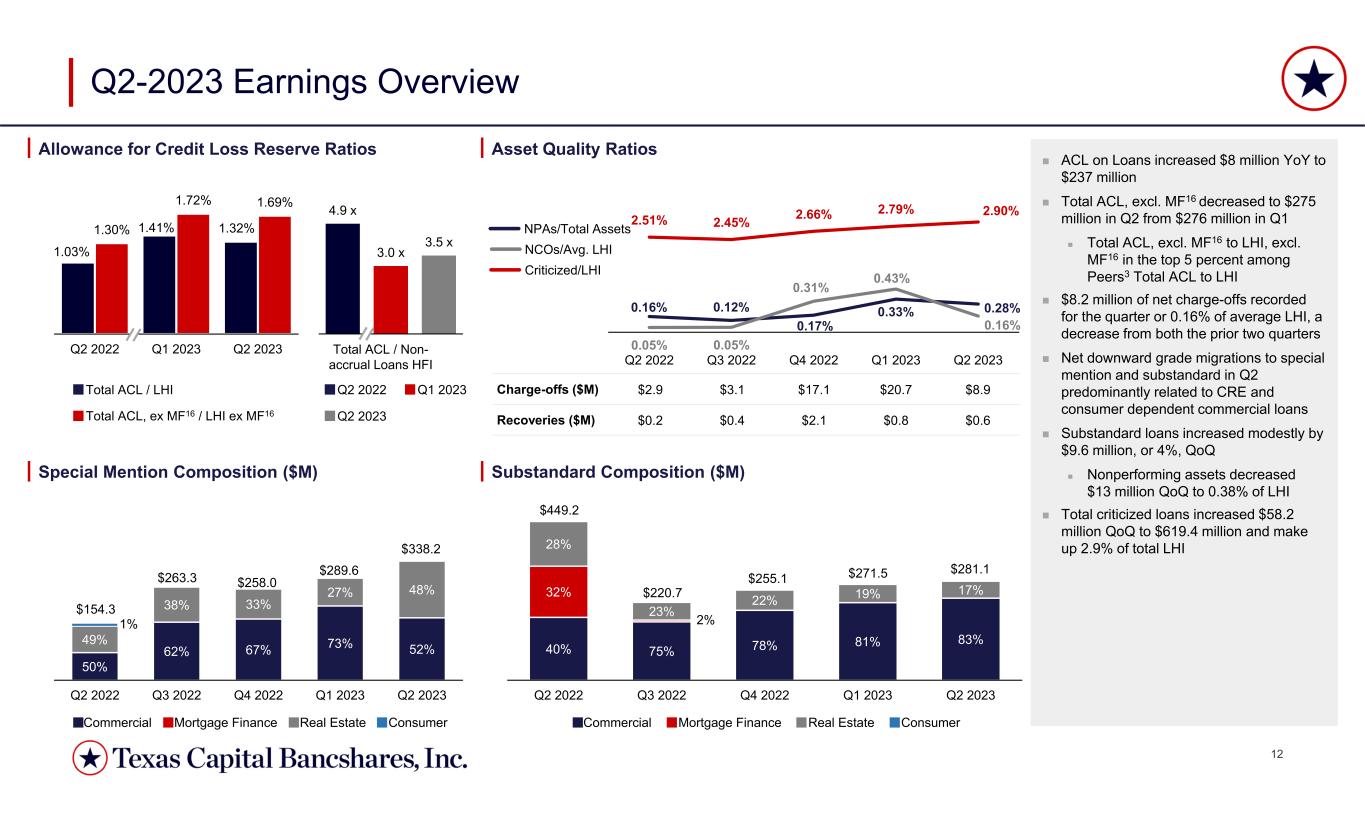
12 1.03% 1.41% 1.32% 1.30% 1.72% 1.69% 0.00% 0.05% 0.10% 0.15% 0.20% 0.25% 0.30% 0.35% 0.40% 0.45% 0.50% 0.55% 0.60% 0.65% 0.70% 0.75% 0.80% 0.85% 0.90% 0.95% 1.00% 1.05% 1.10% 1.15% 1.20% 1.25% 1.30% 1.35% 1.40% 1.45% 1.50% 1.55% 1.60% 1.65% 1.70% 1.75% 1.80% 1.85% Q2 2022 Q1 2023 Q2 2023 0.16% 0.12% 0.17% 0.33% 0.28% 0.05% 0.05% 0.31% 0.43% 0.16% 2.51% 2.45% 2.66% 2.79% 2.90% Q2 2022 Q3 2022 Q4 2022 Q1 2023 Q2 2023 Q2-2023 Earnings Overview Allowance for Credit Loss Reserve Ratios Asset Quality Ratios Special Mention Composition ($M) Substandard Composition ($M) 50% 62% 67% 73% 52% 49% 38% 33% 27% 48% Q2 2022 Q3 2022 Q4 2022 Q1 2023 Q2 2023 Commercial Mortgage Finance Real Estate Consumer 1% $154.3 $263.3 $258.0 $289.6 $338.2 40% 75% 78% 81% 83% 32% 2% 28% 23% 22% 19% 17% Q2 2022 Q3 2022 Q4 2022 Q1 2023 Q2 2023 Commercial Mortgage Finance Real Estate Consumer $449.2 $220.7 $255.1 $271.5 $281.1 $8.9$20.7$17.1$3.1$2.9Charge-offs ($M) $0.6$0.8$2.1$0.4$0.2Recoveries ($M) NPAs/Total Assets Criticized/LHI NCOs/Avg. LHI Q2 2022 Q1 2023 Q2 2023 4.9 x 3.0 x 3.5 x – 1.0 x 2.0 x 3.0 x 4.0 x 5.0 x 6.0 x 7.0 x 8.0 x Q2 2022 Q1 2023 Q2 2023 Total ACL / Non- accrual Loans HFI ACL on Loans increased $8 million YoY to $237 million Total ACL, excl. MF16 decreased to $275 million in Q2 from $276 million in Q1 Total ACL, excl. MF16 to LHI, excl. MF16 in the top 5 percent among Peers3 Total ACL to LHI $8.2 million of net charge-offs recorded for the quarter or 0.16% of average LHI, a decrease from both the prior two quarters Net downward grade migrations to special mention and substandard in Q2 predominantly related to CRE and consumer dependent commercial loans Substandard loans increased modestly by $9.6 million, or 4%, QoQ Nonperforming assets decreased $13 million QoQ to 0.38% of LHI Total criticized loans increased $58.2 million QoQ to $619.4 million and make up 2.9% of total LHI Total ACL / LHI Total ACL, ex MF16 / LHI ex MF16
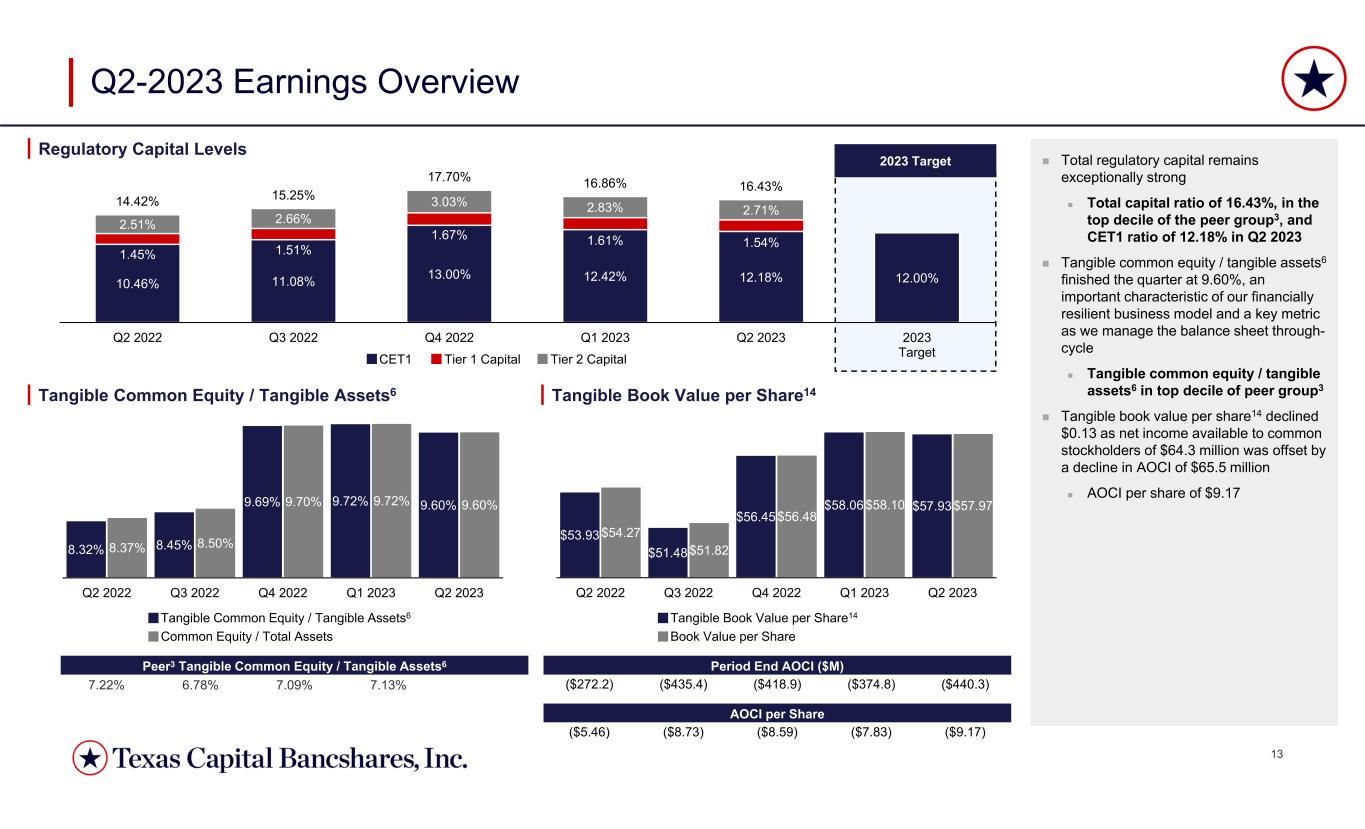
13 2023 Target 10.46% 11.08% 13.00% 12.42% 12.18% 12.00% 1.45% 1.51% 1.67% 1.61% 1.54% 2.51% 2.66% 3.03% 2.83% 2.71% 14.42% 15.25% 17.70% 16.86% 16.43% Q2 2022 Q3 2022 Q4 2022 Q1 2023 Q2 2023 2023 Target $53.93 $51.48 $56.45 $58.06 $57.93 $54.27 $51.82 $56.48 $58.10 $57.97 Q2 2022 Q3 2022 Q4 2022 Q1 2023 Q2 2023 8.32% 8.45% 9.69% 9.72% 9.60% 8.37% 8.50% 9.70% 9.72% 9.60% Q2 2022 Q3 2022 Q4 2022 Q1 2023 Q2 2023 Q2-2023 Earnings Overview Total regulatory capital remains exceptionally strong Total capital ratio of 16.43%, in the top decile of the peer group3, and CET1 ratio of 12.18% in Q2 2023 Tangible common equity / tangible assets6 finished the quarter at 9.60%, an important characteristic of our financially resilient business model and a key metric as we manage the balance sheet through- cycle Tangible common equity / tangible assets6 in top decile of peer group3 Tangible book value per share14 declined $0.13 as net income available to common stockholders of $64.3 million was offset by a decline in AOCI of $65.5 million AOCI per share of $9.17 Regulatory Capital Levels Tangible Common Equity / Tangible Assets6 Tangible Book Value per Share14 Period End AOCI ($M) ($440.3)($374.8)($418.9)($435.4)($272.2) AOCI per Share ($9.17)($7.83)($8.59)($8.73)($5.46) Tangible Common Equity / Tangible Assets6 Common Equity / Total Assets Peer3 Tangible Common Equity / Tangible Assets6 7.13%7.09%6.78%7.22% Tangible Book Value per Share14 Book Value per Share CET1 Tier 2 CapitalTier 1 Capital

14 Full Year 2023 Guidance FY 2022 Adjusted (Non-GAAP11) Low double-digit % growth$976.8 Total Revenue, Adjusted11 Mid single-digit % growth$680.1Non-Interest Expense, Adjusted11 Maintain--Quarterly Operating Leverage (YoY Growth in Quarterly PPNR12) >20%30%Cash & Total Securities (% of Total Assets) >12% >10%13.0%2023 CET1 Target Medium Term CET1 Target $18.5M 2H 2023FDIC Special Assessment21 Full Year 2023 Guidance Forward curve20 assumes a peak Fed Funds of 5.50% in Q3 2023 and a 2023 exit rate of 5.50% Assumes tax rate of 25% in 2023 Revenue and non-interest expense growth guidance excludes 2022 non-recurring items Non-interest expense, adjusted11 guidance excludes estimated FDIC special assessment21 of $18.5 million pre-tax in 2H 2023 Guidance Commentary
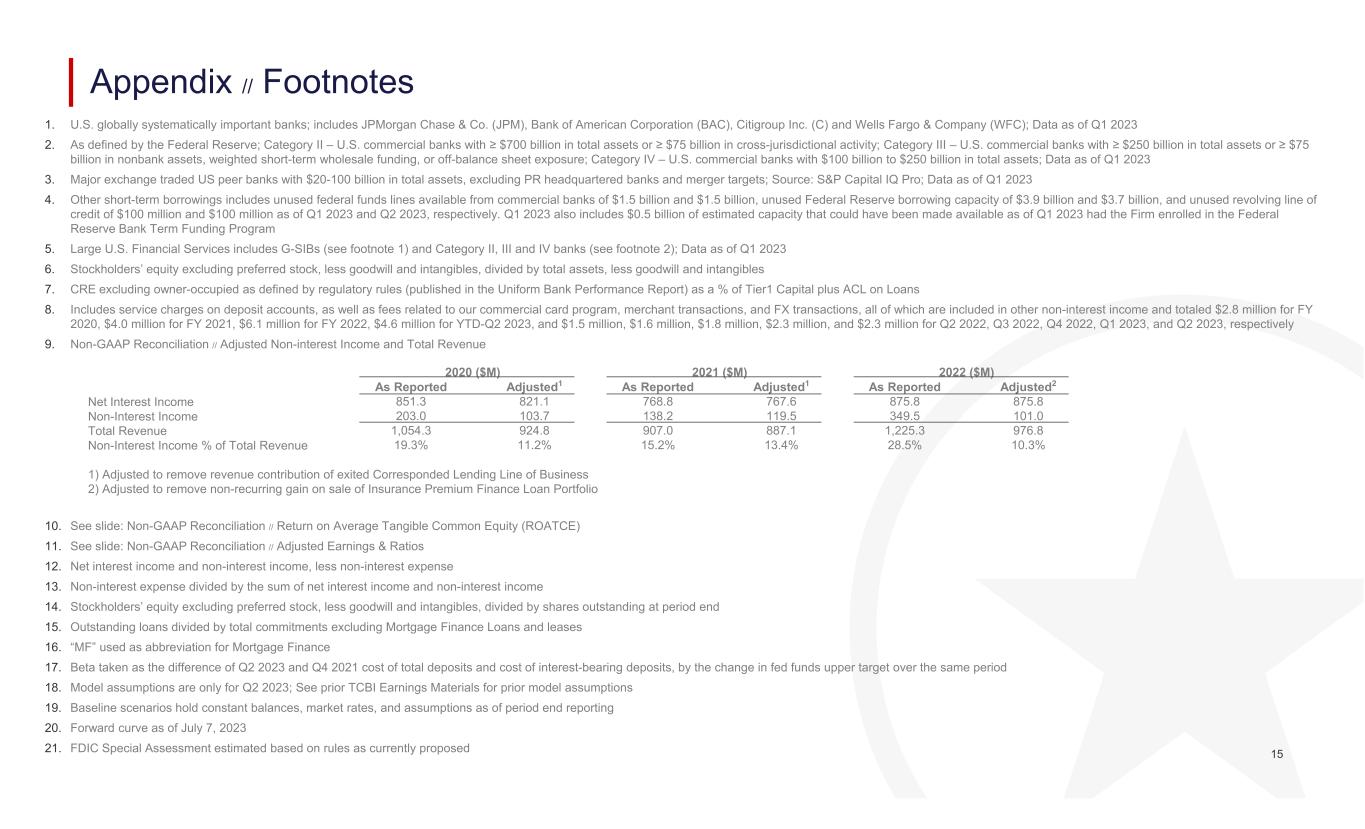
15 1. U.S. globally systematically important banks; includes JPMorgan Chase & Co. (JPM), Bank of American Corporation (BAC), Citigroup Inc. (C) and Wells Fargo & Company (WFC); Data as of Q1 2023 2. As defined by the Federal Reserve; Category II – U.S. commercial banks with ≥ $700 billion in total assets or ≥ $75 billion in cross-jurisdictional activity; Category III – U.S. commercial banks with ≥ $250 billion in total assets or ≥ $75 billion in nonbank assets, weighted short-term wholesale funding, or off-balance sheet exposure; Category IV – U.S. commercial banks with $100 billion to $250 billion in total assets; Data as of Q1 2023 3. Major exchange traded US peer banks with $20-100 billion in total assets, excluding PR headquartered banks and merger targets; Source: S&P Capital IQ Pro; Data as of Q1 2023 4. Other short-term borrowings includes unused federal funds lines available from commercial banks of $1.5 billion and $1.5 billion, unused Federal Reserve borrowing capacity of $3.9 billion and $3.7 billion, and unused revolving line of credit of $100 million and $100 million as of Q1 2023 and Q2 2023, respectively. Q1 2023 also includes $0.5 billion of estimated capacity that could have been made available as of Q1 2023 had the Firm enrolled in the Federal Reserve Bank Term Funding Program 5. Large U.S. Financial Services includes G-SIBs (see footnote 1) and Category II, III and IV banks (see footnote 2); Data as of Q1 2023 6. Stockholders’ equity excluding preferred stock, less goodwill and intangibles, divided by total assets, less goodwill and intangibles 7. CRE excluding owner-occupied as defined by regulatory rules (published in the Uniform Bank Performance Report) as a % of Tier1 Capital plus ACL on Loans 8. Includes service charges on deposit accounts, as well as fees related to our commercial card program, merchant transactions, and FX transactions, all of which are included in other non-interest income and totaled $2.8 million for FY 2020, $4.0 million for FY 2021, $6.1 million for FY 2022, $4.6 million for YTD-Q2 2023, and $1.5 million, $1.6 million, $1.8 million, $2.3 million, and $2.3 million for Q2 2022, Q3 2022, Q4 2022, Q1 2023, and Q2 2023, respectively 9. Non-GAAP Reconciliation // Adjusted Non-interest Income and Total Revenue 10. See slide: Non-GAAP Reconciliation // Return on Average Tangible Common Equity (ROATCE) 11. See slide: Non-GAAP Reconciliation // Adjusted Earnings & Ratios 12. Net interest income and non-interest income, less non-interest expense 13. Non-interest expense divided by the sum of net interest income and non-interest income 14. Stockholders’ equity excluding preferred stock, less goodwill and intangibles, divided by shares outstanding at period end 15. Outstanding loans divided by total commitments excluding Mortgage Finance Loans and leases 16. “MF” used as abbreviation for Mortgage Finance 17. Beta taken as the difference of Q2 2023 and Q4 2021 cost of total deposits and cost of interest-bearing deposits, by the change in fed funds upper target over the same period 18. Model assumptions are only for Q2 2023; See prior TCBI Earnings Materials for prior model assumptions 19. Baseline scenarios hold constant balances, market rates, and assumptions as of period end reporting 20. Forward curve as of July 7, 2023 21. FDIC Special Assessment estimated based on rules as currently proposed Appendix // Footnotes 2022 ($M)2021 ($M)2020 ($M) Adjusted2As ReportedAdjusted1As ReportedAdjusted1As Reported 875.8875.8767.6768.8821.1851.3Net Interest Income 101.0349.5119.5138.2103.7203.0Non-Interest Income 976.81,225.3887.1907.0924.81,054.3Total Revenue 10.3%28.5%13.4%15.2%11.2%19.3%Non-Interest Income % of Total Revenue 1) Adjusted to remove revenue contribution of exited Corresponded Lending Line of Business 2) Adjusted to remove non-recurring gain on sale of Insurance Premium Finance Loan Portfolio
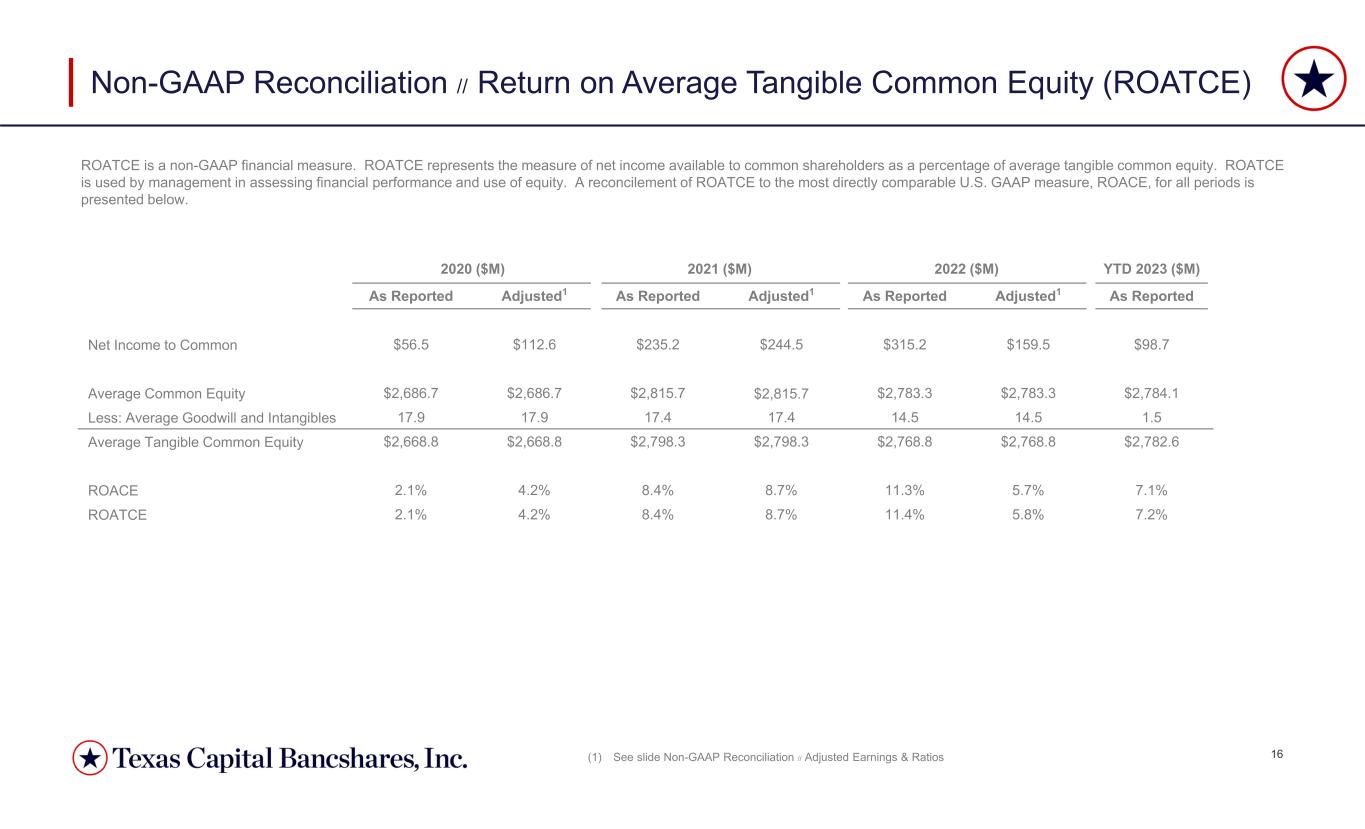
16 Non-GAAP Reconciliation // Return on Average Tangible Common Equity (ROATCE) ROATCE is a non-GAAP financial measure. ROATCE represents the measure of net income available to common shareholders as a percentage of average tangible common equity. ROATCE is used by management in assessing financial performance and use of equity. A reconcilement of ROATCE to the most directly comparable U.S. GAAP measure, ROACE, for all periods is presented below. (1) See slide Non-GAAP Reconciliation // Adjusted Earnings & Ratios YTD 2023 ($M)2022 ($M)2021 ($M)2020 ($M) As ReportedAdjusted1As ReportedAdjusted1As ReportedAdjusted1As Reported $98.7$159.5$315.2$244.5$235.2$112.6$56.5Net Income to Common $2,784.1$2,783.3$2,783.3$2,815.7$2,815.7$2,686.7$2,686.7Average Common Equity 1.514.514.517.417.417.917.9Less: Average Goodwill and Intangibles $2,782.6$2,768.8$2,768.8$2,798.3$2,798.3$2,668.8$2,668.8Average Tangible Common Equity 7.1%5.7%11.3%8.7%8.4%4.2%2.1%ROACE 7.2%5.8%11.4%8.7%8.4%4.2%2.1%ROATCE

17 Non-GAAP Reconciliation // Adjusted Earnings & Ratios Adjusted line items are non-GAAP financial measures that management believes aids in the discussion of results. A reconcilement of these adjusted items to the most directly comparable U.S. GAAP measures for all periods is presented below. Periods not presented below did not have adjustments. 202220212020Q4 2022Q3 2022($M, Except per Share) $875.8 $768.8 $851.3 $247.6 $239.1 Net Interest Income 349.5 138.2 203.0 277.7 25.3 Non-Interest Revenue Adjustments for Non-Recurring Items: (248.5)0.0 0.0 (248.5)0.0 Gain on Sale of Insur. Prem. Finance 101.0 138.2 203.0 29.2 25.3 Non-Interest Revenue, Adjusted 727.5 599.0 704.4 213.1 197.0 Non-Interest Expense Adjustments: 0.0 (12.0)(36.0)0.0 0.0 Software Write-offs (29.6)0.0 (17.8)(13.0)(16.7)Transaction Costs (9.8)0.0 (18.0)(9.8)0.0 Restructuring Expenses (8.0)0.0 0.0 (8.0)0.0 Charitable Contribution 680.1 587.0 632.6 182.3 180.4 Non-Interest Expense, Adjusted 497.8 308.1 349.9 312.2 67.4 PPNR12 296.6 320.0 421.7 94.4 84.0 PPNR12, Adjusted 66.0 (30.0)258.0 34.0 12.0 Provision for Credit Losses 99.3 84.1 25.7 60.9 13.9 Income Tax Expenses (45.4)2.7 15.6 (49.2)3.8 Tax Impact of Adjustments Above 53.9 86.8 41.3 11.8 17.7 Income Tax Expense, Adjusted 332.5 253.9 66.3 217.3 41.4 Net Income 176.8 263.2 122.4 48.6 54.3 Net Income, Adjusted 17.3 18.7 9.8 4.3 4.3 Preferred Stock Dividends 315.2 235.2 56.5 212.9 37.1 Net Income to Common 159.5 244.5 112.6 44.3 50.0 Net Income to Common, Adjusted $32,049.8 $38,140.3 $37,516.2 $30,738.4 $31,813.9 Average Assets 1.04%0.67%0.18%2.80%0.52%Return on Average Assets 0.55%0.69%0.33%0.63%0.68%Return on Average Assets, Adjusted 1.55%0.81%0.93%4.03%0.84%PPNR12 / Average Assets 0.93%0.84%1.12%1.22%1.05%PPNR12, Adjusted / Average Assets $2,783.3 $2,815.7 $2,686.7 $2,755.8 $2,745.0 Average Common Equity 11.33%8.35%2.10%30.66%5.36%Return on Average Common Equity 5.73%8.68%4.19%6.38%7.23%Return on Average Common Equity, Adjusted 51,046,742 51,140,974 50,582,979 50,282,663 50,417,884 Diluted Common Shares $6.18$4.60$1.12$4.23$0.74Earnings per Share $3.13$4.78$2.23$0.88$0.99Earnings per Share, Adjusted


