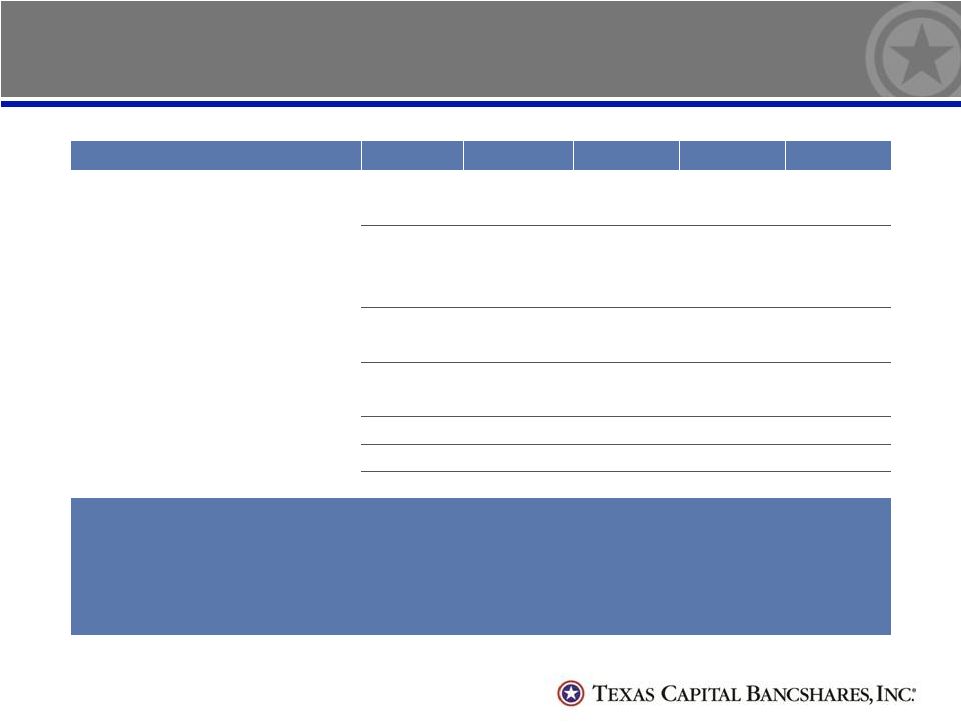
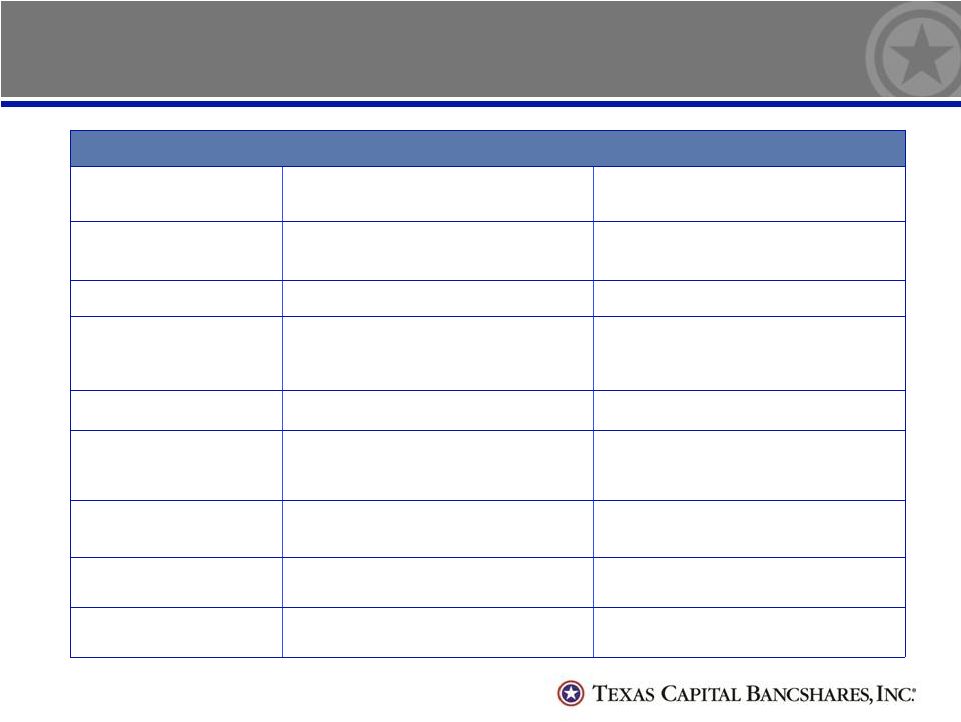
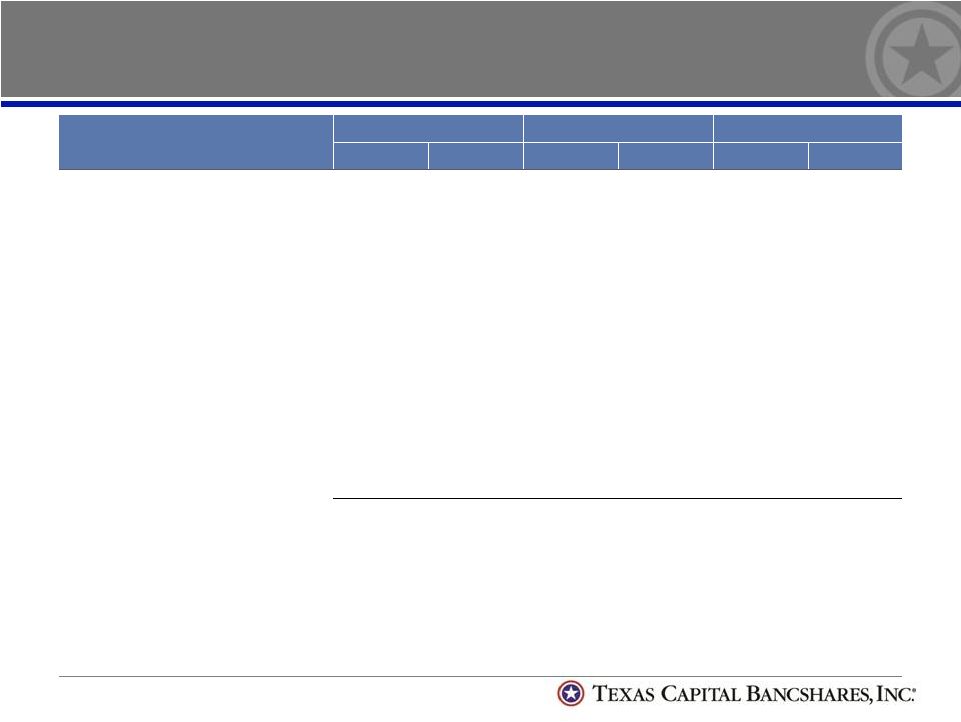
Average Balances, Yields & Rates - Quarterly 16 (in thousands) Q3 2014 Q2 2014 Q3 2013 Avg. Bal. Yield Rate Avg. Bal. Yield Rate Avg. Bal. Yield Rate Assets Securities $ 46,413 3.86% $ 50,487 4.00% $ 71,717 4.25% Fed funds sold & liquidity investments 388,855 .25% 198,058 .22% 167,613 .19% Loans held for investment, mortgage finance 3,452,782 3.13% 2,822,560 3.30% 2,362,118 3.79% Loans held for investment 9,423,259 4.52% 8,984,230 4.51% 7,731,901 4.72% Total loans, net of reserve 12,784,614 4.18% 11,716,685 4.25% 10,014,468 4.53% Total earning assets 13,219,882 4.06% 11,965,230 4.19% 10,253,798 4.46% Total assets $13,629,609 $12,362,168 $10,637,766 Liabilities and Stockholders’ Equity Total interest bearing deposits $ 6,856,542 .27% $ 6,326,034 .27% $ 5,612,874 .26% Other borrowings 309,868 .20% 666,405 .18% 539,767 .20% Subordinated notes 286,000 5.88% 286,000 5.95% 111,000 6.54% Long-term debt 113,406 2.19% 113,406 2.19% 113,406 2.23% Total interest bearing liabilities 7,565,816 .50% 7,391,845 .51% 6,377,047 .40% Demand deposits 4,669,772 3,629,941 3,124,602 Stockholders’ equity 1,276,603 1,241,787 1,046,477 Total liabilities and stockholders’ equity $13,629,609 .28% $12,362,168 .31% $10,637,766 .24% Net interest margin 3.77% 3.87% 4.21% Total deposits and borrowed funds $11,836,182 .16% $10,622,380 .17% $ 9,277,243 .17% Loan spread 4.02% 4.08% 4.36% |