|
Exhibit 99.1 
|
Sterne Agee
Financial Institutions Investor Conference
February 12, 2015 Keith Cargill, President and CEO
Peter Bartholow, Chief Operating Officer and CFO
|
|
Certain matters discussed on this call may contain “forward-looking statements” as defined in federal securities laws, which are subject to risks and uncertainties and are based on Texas Capital’s current estimates or expectations of future events or future results. These statements are not historical in nature and can generally be identified by such words as “believe,” “expect,” “estimate,” “anticipate,” “plan,” “may,” “will,” “intend” and similar expressions. A number of factors, many of which are beyond Texas Capital’s control, could cause actual results to differ materially from future results expressed or implied by our forward-looking statements. These risks and uncertainties include the risk of adverse impacts from general economic conditions, the effects of recent declines in oil and gas prices on our customers, competition, changes in interest rates and exposure to regulatory and legislative changes. These and other factors that could cause results to differ materially from those described in the forward-looking statements, as well as a discussion of the risks and uncertainties that may affect Texas Capital’s business, can be found in our Annual Report on Form 10-K and other filings made by Texas Capital with the Securities and Exchange Commission. Forward-looking statements speak only as of the date of this call. Texas Capital is under no obligation, and expressly disclaims any obligation, to update, alter or revise its forward-looking statements, whether as a result of new information, future events or otherwise.
2
Overview and Strategy
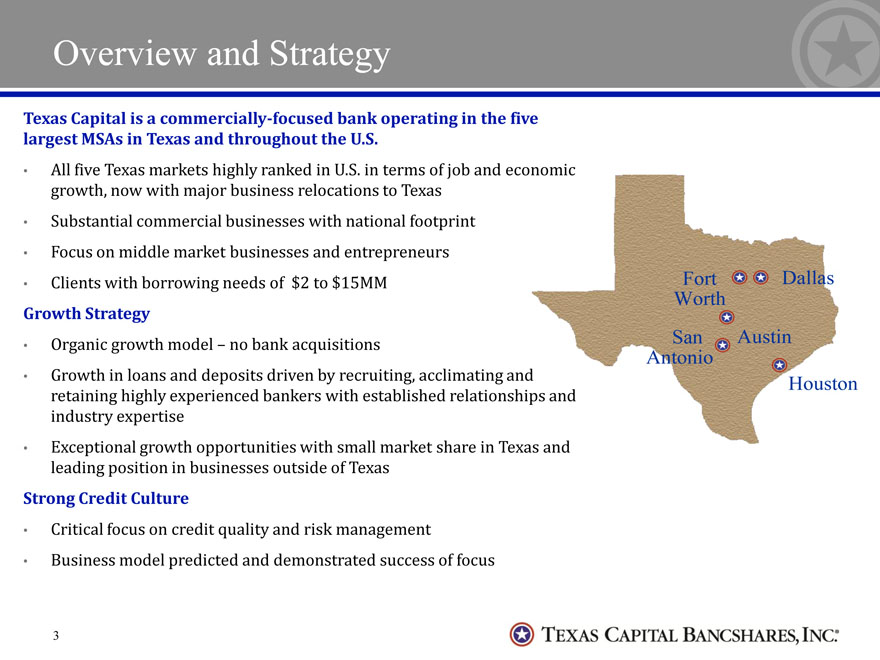
Texas Capital is a commercially-focused bank operating in the five largest MSAs in Texas and throughout the U.S.
All five Texas markets highly ranked in U.S. in terms of job and economic growth, now with major business relocations to Texas
Substantial commercial businesses with national footprint
Focus on middle market businesses and entrepreneurs
Clients with borrowing needs of $2 to $15MM Fort Dallas
Growth Strategy
Organic growth model – no bank acquisitions
Growth in loans and deposits driven by recruiting, acclimating and retaining highly experienced bankers with established relationships and industry expertise
Exceptional growth opportunities with small market share in Texas and leading position in businesses outside of Texas
Strong Credit Culture
Critical focus on credit quality and risk management
Business model predicted and demonstrated success of focus
3
Opening Remarks & Financial Highlights
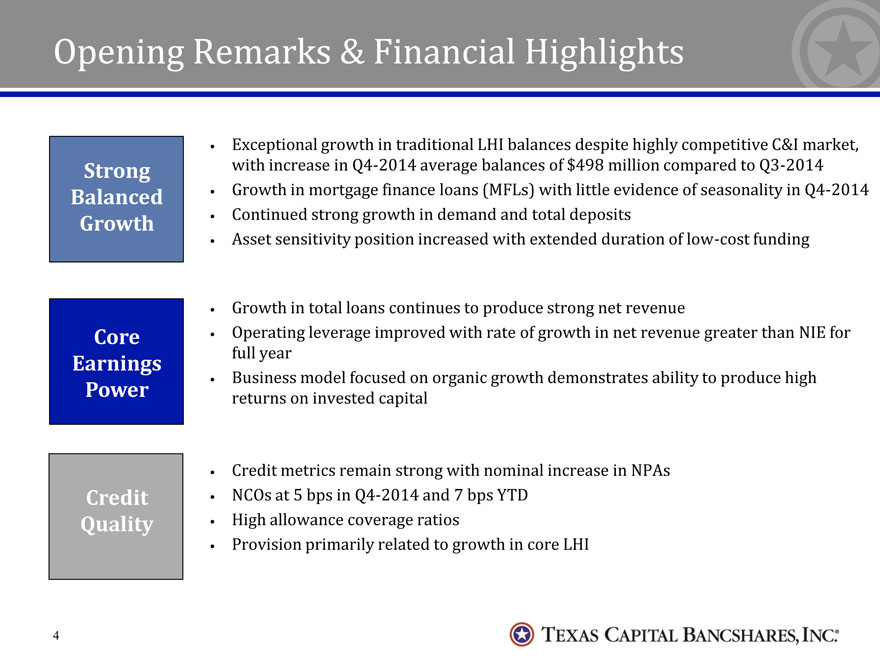
Strong Balanced Growth
Exceptional growth in traditional LHI balances despite highly competitive C&I market, with increase in Q4-2014 average balances of $498 million compared to Q3-2014
Growth in mortgage finance loans (MFLs) with little evidence of seasonality in Q4-2014
Continued strong growth in demand and total deposits
Asset sensitivity position increased with extended duration of low-cost funding
Core Earnings Power
Growth in total loans continues to produce strong net revenue
Operating leverage improved with rate of growth in net revenue greater than NIE for full year
Business model focused on organic growth demonstrates ability to produce high returns on invested capital
Credit Quality
Credit metrics remain strong with nominal increase in NPAs
NCOs at 5 bps in Q4-2014 and 7 bps YTD
High allowance coverage ratios
Provision primarily related to growth in core LHI
4
Energy Commentary
TCBI has deep experience in energy lending
Executives, lenders, credit policy and engineers have more than three decades of experience
All lending authority rests with Credit Policy, not the line of business and most exposures require approval of the Chief Credit and Chief Risk Officer and the Chief Lending Officer
Engineering team reports to Credit Policy and is responsible for review of credits independent of the line of business
Since our inception there have been five corrections in energy commodity prices, with no significant consequences
Cumulative energy losses < $300,000 in 15 years
Outstanding loans in energy portfolio 6% of total loans
Exposure to oil service less than 1% of total loans
Service exposure generally limited to production, not the higher risk drilling and completion
Energy Portfolio Review
We have completed review of our portfolio and see no significant exposure to loan losses, assuming prices comparable to the forward strip of oil and natural gas prices
Anticipate potential for some downgrades
Nothing currently expected that would drive significant allocation of loan loss reserves
The ability to control the borrowing base and require loan pay-down or pledge of additional collateral provides protection against credit exposure if commodity prices decline
Price decks are dynamic, but our underwriting standards have not changed since inception
Average credit line is approximately 60% funded
Agreements generally provide unilateral discretion to reduce borrowing bases as necessary
Over 90% of oil-weighted outstandings are hedged
Hedged prices are much higher than lifting costs, providing significant cash flow to reduce debt
In combination with hedges, collateral comprised of long-lived reserves provides capacity to absorb commodity price swings
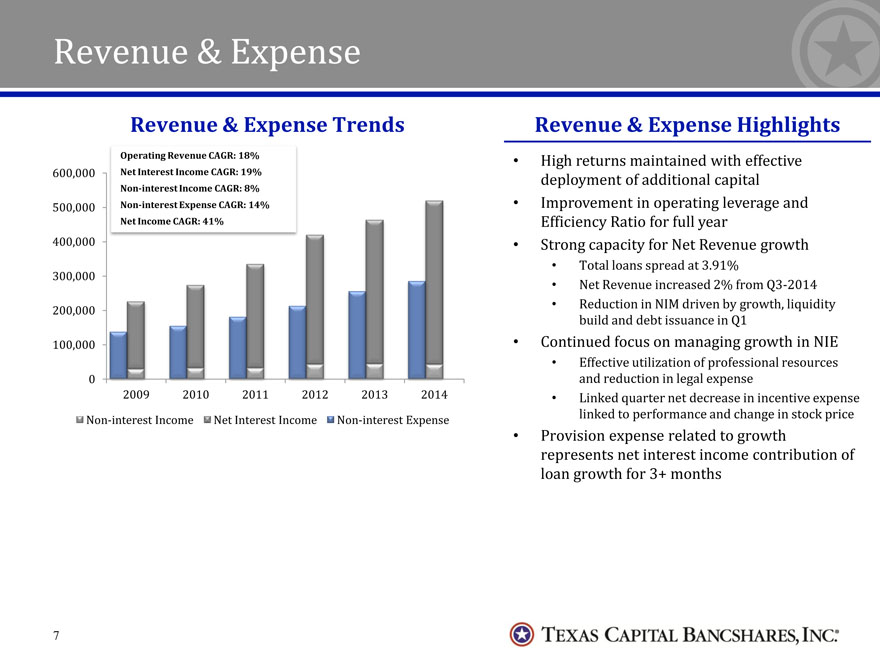
Revenue & Expense
Operating Revenue CAGR: 18%
Net Interest Income CAGR: 19%
Non-interest Income CAGR: 8%
Non-interest Expense CAGR: 14%
Net Income CAGR: 41%
0 100,000 200,000 300,000
400,000 500,000 600,000
2009 2010
2011
2012
2013
2014
Non-interest Income
Net Interest Income
Non-interest Expense
High returns maintained with effective deployment of additional capital
Improvement in operating leverage and Efficiency Ratio for full year
Strong capacity for Net Revenue growth
Total loans spread at 3.91%
Net Revenue increased 2% from Q3-2014
Reduction in NIM driven by growth, liquidity build and debt issuance in Q1
Continued focus on managing growth in NIE
Effective utilization of professional resources and reduction in legal expense
Linked quarter net decrease in incentive expense linked to performance and change in stock price
Provision expense related to growth represents net interest income contribution of loan growth for 3+ months
Revenue & Expense Highlights
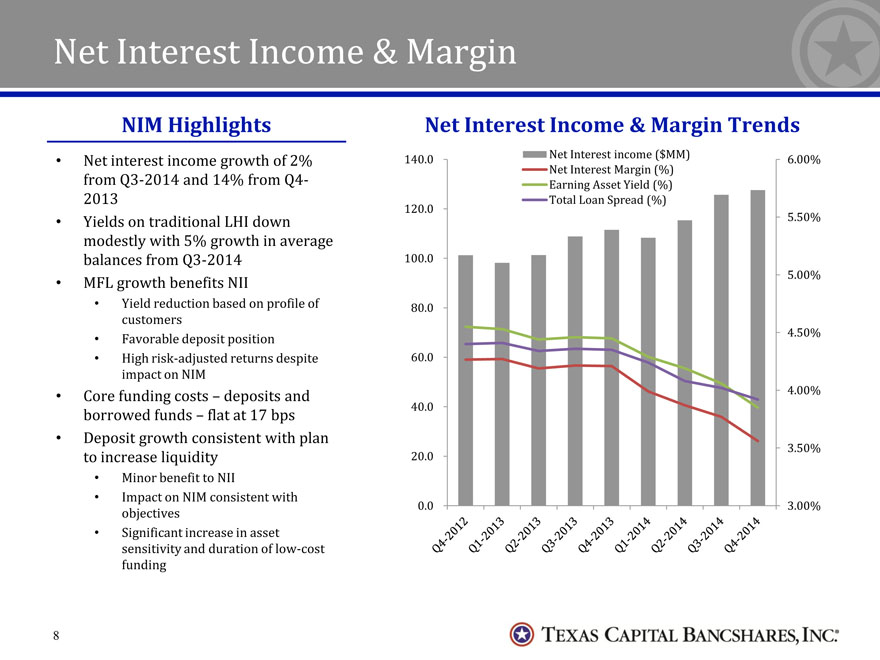
Net Interest Income & Margin
NIM Highlights
Net interest income growth of 2% from Q3-2014 and 14% from Q4-2013
Yields on traditional LHI down modestly with 5% growth in average balances from Q3-2014
MFL growth benefits NII
Yield reduction based on profile of customers
Favorable deposit position
High risk-adjusted returns despite impact on NIM
Core funding costs – deposits and borrowed funds – flat at 17 bps
Deposit growth consistent with plan to increase liquidity
Minor benefit to NII
Impact on NIM consistent with objectives
Significant increase in asset sensitivity and duration of low-cost funding
Net Interest Income & Margin Trends
Net Interest income ($MM) Net Interest Margin (%) Earning Asset Yield (%) Total Loan Spread (%)
0.0 20.0 40.0 60.0
80.0
100.0
120.0 140.0
3.00% 3.50% 4.00% 4.50%
5.00%
5.50%
6.00%
8
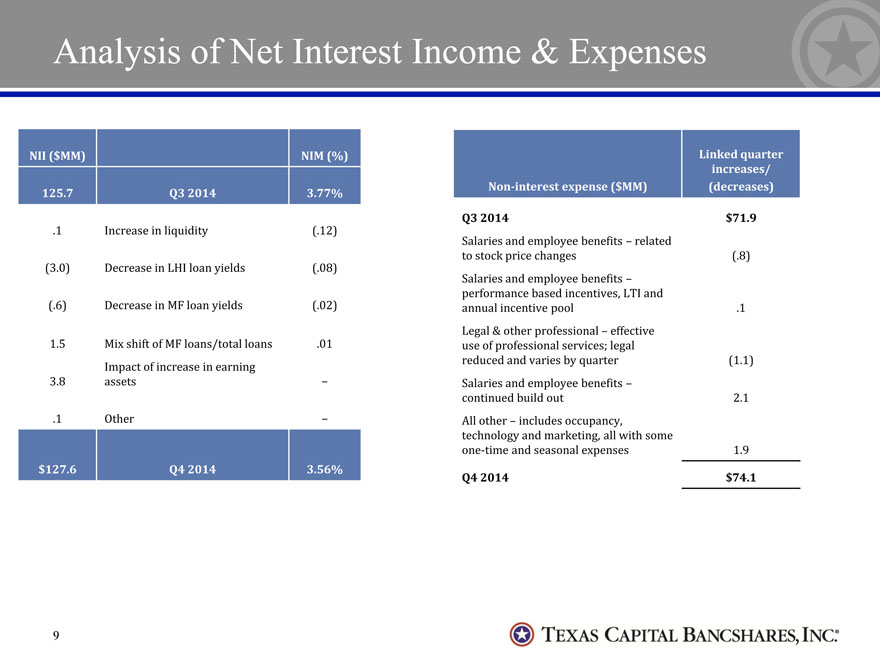
Analysis of Net Interest Income & Expenses
NII ($MM) NIM (%)
125.7 Q3 2014 3.77%
.1 Increase in liquidity (.12)
(3.0) Decrease in LHI loan yields (.08)
(.6) Decrease in MF loan yields (.02)
1.5 Mix shift of MF loans/total loans .01
3.8 Impact of increase in earning assets –
.1 Other –
$127.6 Q4 2014 3.56%
Non-interest expense ($MM) Linked quarter increases/
(decreases)
Q3 2014 $71.9
Salaries and employee benefits – related to stock price changes (.8)
Salaries and employee benefits – performance based incentives, LTI and annual incentive pool .1
Legal & other professional – effective use of professional services; legal reduced and varies by quarter (1.1)
Salaries and employee benefits – continued build out 2.1
All other – includes occupancy, technology and marketing, all with some one-time and seasonal expenses 1.9
Q4 2014 $74.1
9
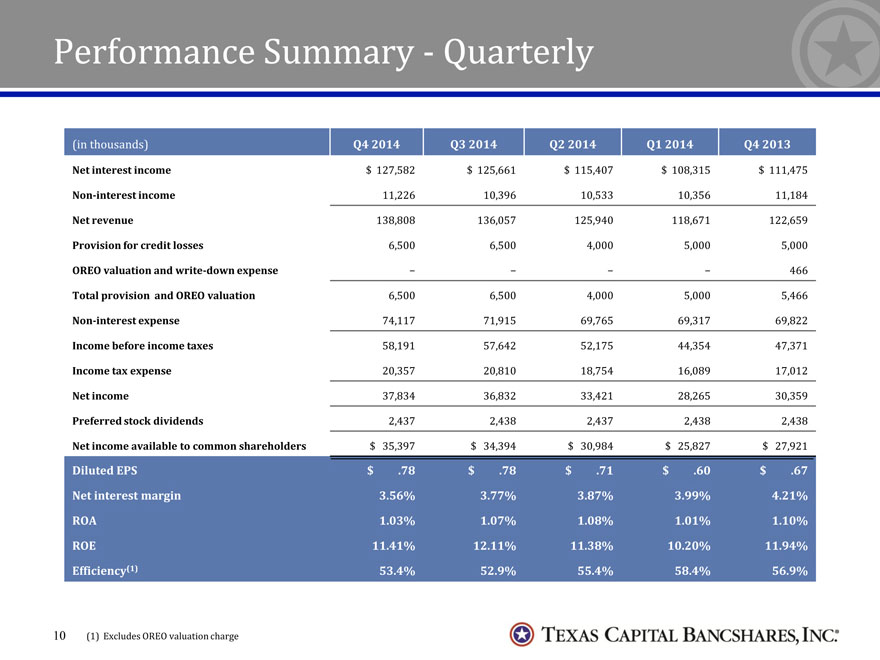
Performance Summary—Quarterly
(in thousands) Q4 2014 Q3 2014 Q2 2014 Q1 2014 Q4 2013
Net interest income $ 127,582 $ 125,661 $ 115,407 $ 108,315 $ 111,475
Non-interest income 11,226 10,396 10,533 10,356 11,184
Net revenue 138,808 136,057 125,940 118,671 122,659
Provision for credit losses 6,500 6,500 4,000 5,000 5,000
OREO valuation and write-down expense — — 466
Total provision and OREO valuation 6,500 6,500 4,000 5,000 5,466
Non-interest expense 74,117 71,915 69,765 69,317 69,822
Income before income taxes 58,191 57,642 52,175 44,354 47,371
Income tax expense 20,357 20,810 18,754 16,089 17,012
Net income 37,834 36,832 33,421 28,265 30,359
Preferred stock dividends 2,437 2,438 2,437 2,438 2,438
Net income available to common shareholders $ 35,397 $ 34,394 $ 30,984 $ 25,827 $ 27,921
Diluted EPS $ .78 $ .78 $ .71 $ .60 $ .67
Net interest margin 3.56% 3.77% 3.87% 3.99% 4.21%
ROA 1.03% 1.07% 1.08% 1.01% 1.10%
ROE 11.41% 12.11% 11.38% 10.20% 11.94%
Efficiency(1) 53.4% 52.9% 55.4% 58.4% 56.9%
10 (1) Excludes OREO valuation charge
Performance Summary—Annual
(in thousands) 2014 2013 2012 2011 2010
Net interest income $ 476,965 $ 419,513 $ 376,879 $ 302,937 $ 241,674
Non-interest income 42,511 44,024 43,040 32,232 32,263
Net revenue 519,476 463,537 419,919 335,169 273,937
Provision for credit losses 22,000 19,000 11,500 28,500 53,500
OREO valuation and write-down expense—920 6,883 6,798 8,504
Total provision and OREO valuation 22,000 19,920 18,383 35,298 62,004
Non-interest expense 285,114 255,809 212,998 181,529 155,120
Income before income taxes 212,362 187,808 188,538 118,342 56,813
Income tax expense 76,010 66,757 67,866 42,366 19,626
Net income 136,352 121,051 120,672 75,976 37,187
Preferred stock dividends 9,750 7,394 —— —
Net income available to common shareholders $ 126,602 $ 113,657 $ 120,672 $ 75,976 $ 31,187
Diluted EPS $ 2.88 $ 2.72 $ 3.01 $ 1.99 $ 1.00
Net interest margin 3.78% 4.22% 4.41% 4.68% 4.28%
ROA 1.05% 1.17% 1.35% 1.12% .63%
ROE 11.31% 12.82% 16.93% 13.39% 7.23%
Efficiency(1) 54.9% 55.2% 49.8% 54.1% 56.6%
11 (1) Excludes OREO valuation charge
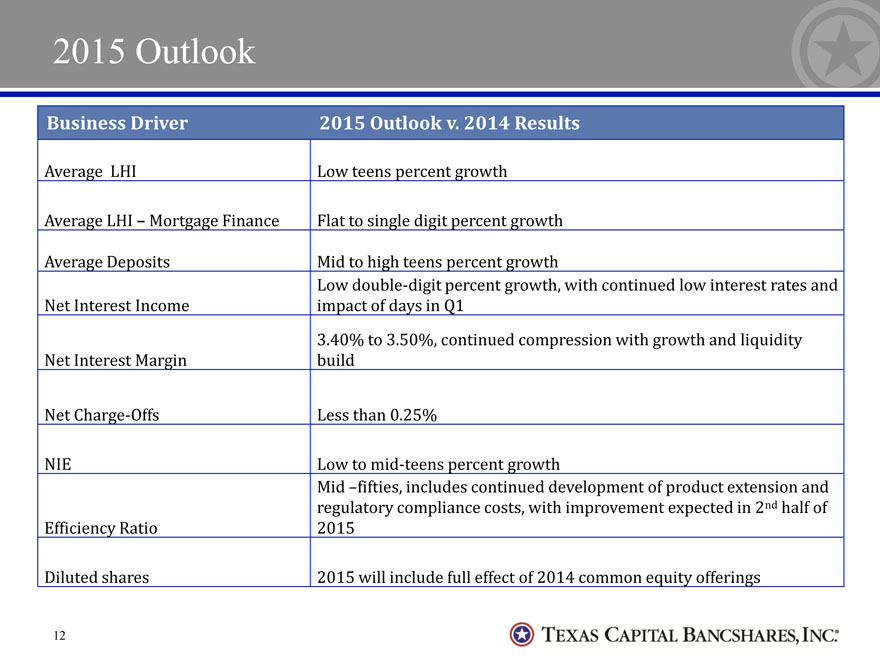
2015 Outlook
Business Driver 2015 Outlook v. 2014 Results
Average LHI Low teens percent growth
Average LHI – Mortgage Finance Flat to single digit percent growth
Average Deposits Mid to high teens percent growth
Low double-digit percent growth, with continued low interest rates and Net Interest Income impact of days in Q1 3.40% to 3.50%, continued compression with growth and liquidity Net Interest Margin build
Net Charge-Offs Less than 0.25%
NIE Low to mid-teens percent growth
Mid –fifties, includes continued development of product extension and regulatory compliance costs, with improvement expected in 2nd half of Efficiency Ratio 2015
Diluted shares 2015 will include full effect of 2014 common equity offerings
12
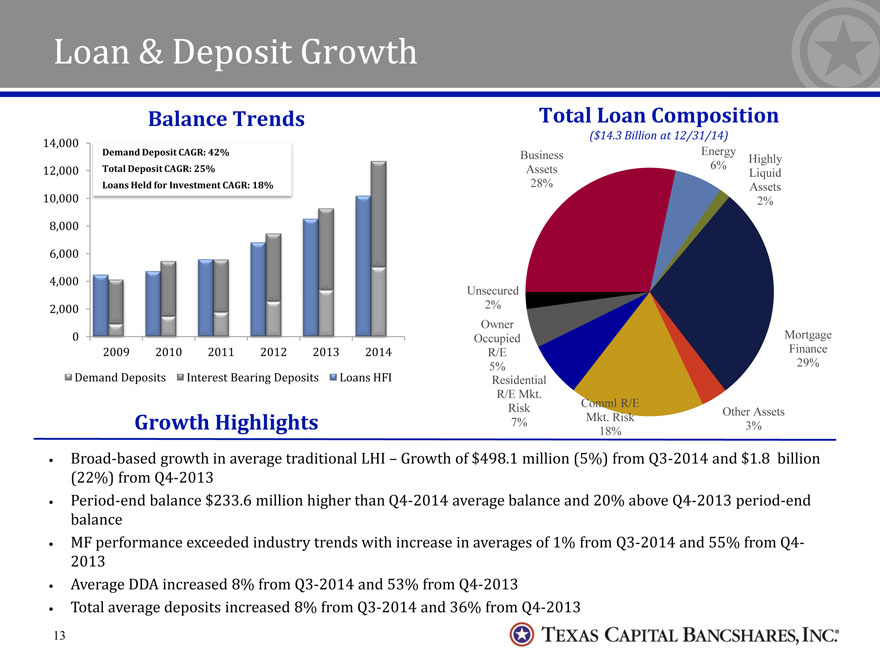
Loan & Deposit Growth
Balance Trends
Demand Deposit CAGR: 42%
Total Deposit CAGR: 25%
Loans Held for Investment CAGR: 18%
14,000
12,000
10,000
8,000
6,000
4,000
2,000
0
2009
2010 2011 2012
2013
2014
Demand Deposits Interest Bearing Deposits Loans HFI
Total Loan Composition ($14.3 Billion at 12/31/14)
Business Assets 28%
Energy 6%
Highly Liquid Assets 2%
Unsecured 2%
Owner Occupied R/E 5%
Residential R/E Mkt. Risk 7%
Comml R/E Mkt. Risk 18%
Other Assets 3%
Mortgage Finance 29%
Growth Highlights
Broad-based growth in average traditional LHI – Growth of $498.1 million (5%) from Q3-2014 and $1.8 billion (22%) from Q4-2013
Period-end balance $233.6 million higher than Q4-2014 average balance and 20% above Q4-2013 period-end balance
MF performance exceeded industry trends with increase in averages of 1% from Q3-2014 and 55% from Q4-2013
Average DDA increased 8% from Q3-2014 and 53% from Q4-2013
Total average deposits increased 8% from Q3-2014 and 36% from Q4-2013
13
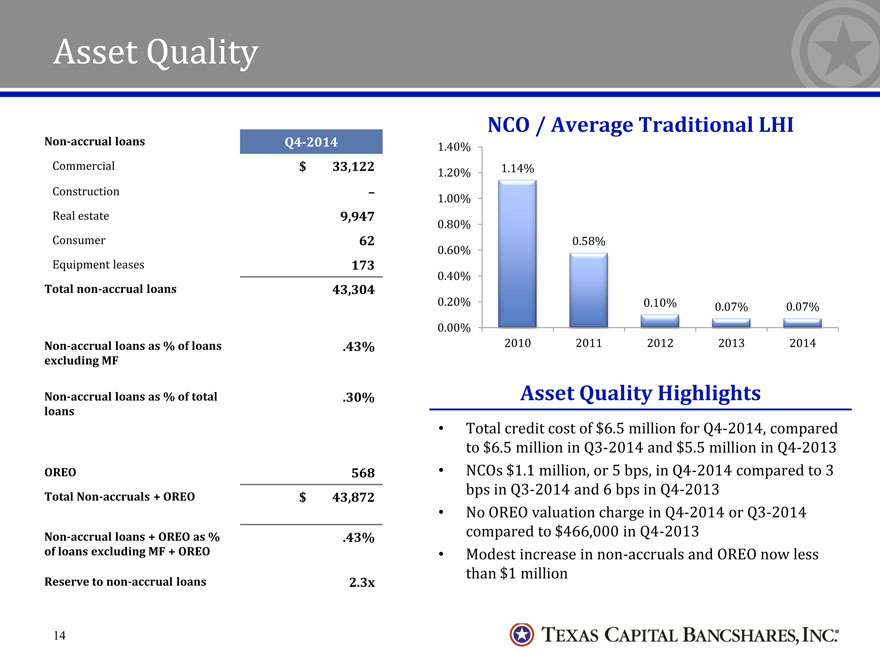
ASSET QUALITY
NON-ACCRUALLOANS Q4-2014
COMMERCIAL $ 33,122
CONSTRUCTION –
REALESTATE 9,947
CONSUMER 62
EQUIPMENTLEASES 173
TOTALNON-ACCRUALLOANS 43,304
NON-ACCRUALLOANSAS %OFLOANSEXCLUDING MF .43%
NON-ACCRUALLOANSAS %OFTOTALLOANS .30%
OREO 568
TOTAL NON-ACCRUALS + OREO $ 43,872
NON-ACCRUALLOANS + OREOAS %OFLOANSEXCLUDING MF + OREO .43%
RESERVETONON-ACCRUALLOANS 2.3X
NCO / AVERAGE TRADITIONAL LHI
1.14% 0.58%
0.10%
0.07%
0.07%
0.00% 0.20%
0.40%
0.60%
0.80% 1.00%
1.20%
1.40%
2010 2011 2012
2013 2014
ASSET QUALITY HIGHLIGHTS
TOTALCREDITCOSTOF $6.5MILLIONFOR Q4-2014,COMPAREDTO $6.5MILLIONIN Q3-2014AND $5.5MILLIONIN Q4-2013
NCOS $1.1MILLION,OR 5BPS,IN Q4-2014COMPAREDTO 3BPSIN Q3-2014AND 6BPSIN Q4-2013
NO OREOVALUATIONCHARGEIN Q4-2014OR Q3-2014COMPAREDTO $466,000IN Q4-2013
MODESTINCREASEINNON-ACCRUALSAND OREONOWLESSTHAN $1MILLION
14
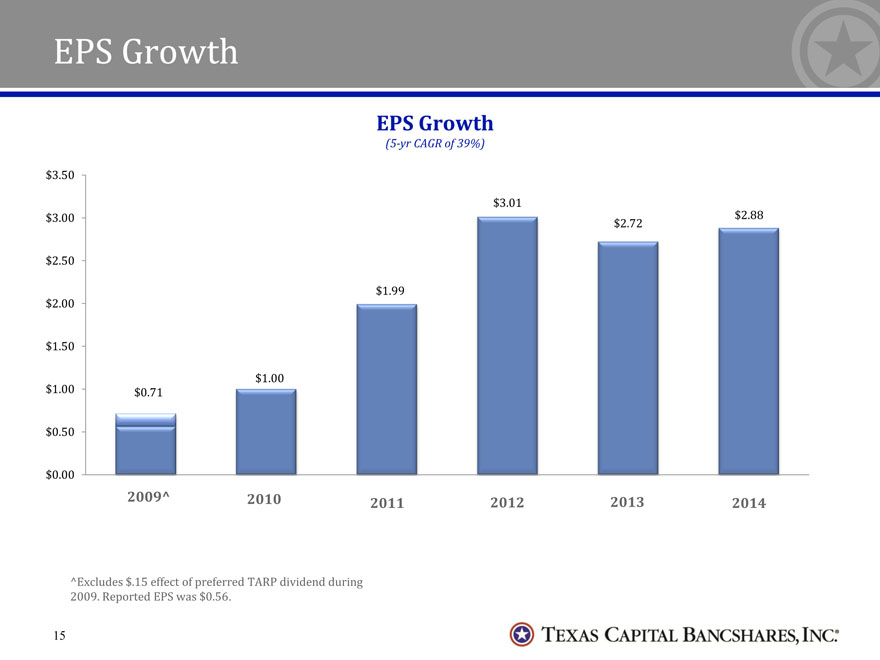
EPS Growth
EPS Growth
(5-yr CAGR of 39%)
$3.50
$3.01
$3.00 $2.88
$2.72
$2.50
$1.99
$2.00
$1.50
$1.00
$1.00 $0.71
$0.50
$0.00
2009^ 2010 2011 2012 2013 2014
^Excludes $.15 effect of preferred TARP dividend during
2009. Reported EPS was $0.56.
15
Closing Comments
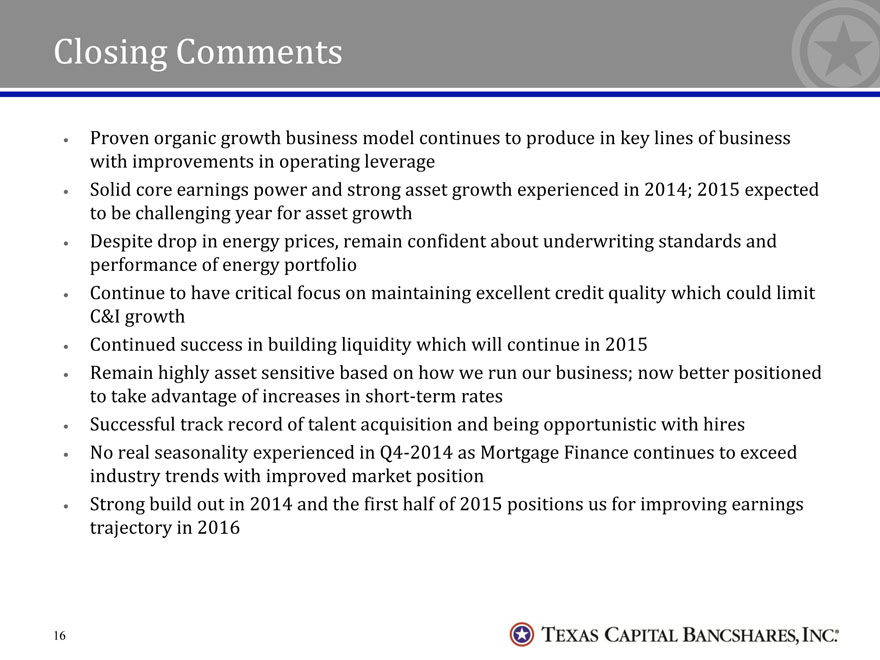
Proven organic growth business model continues to produce in key lines of business with improvements in operating leverage
Solid core earnings power and strong asset growth experienced in 2014; 2015 expected to be challenging year for asset growth
Despite drop in energy prices, remain confident about underwriting standards and performance of energy portfolio
Continue to have critical focus on maintaining excellent credit quality which could limit C&I growth
Continued success in building liquidity which will continue in 2015
Remain highly asset sensitive based on how we run our business; now better positioned to take advantage of increases in short-term rates
Successful track record of talent acquisition and being opportunistic with hires
No real seasonality experienced in Q4-2014 as Mortgage Finance continues to exceed industry trends with improved market position
Strong build out in 2014 and the first half of 2015 positions us for improving earnings trajectory in 2016
16
Q&A
17
Appendix
18
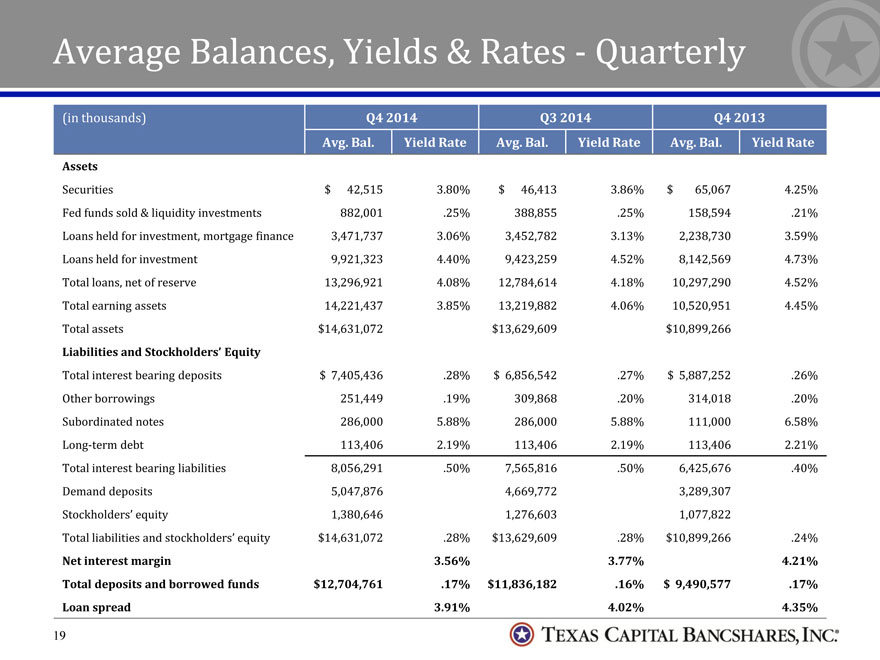
Average Balances, Yields & Rates—Quarterly
(in thousands) Q4 2014 Q3 2014 Q4 2013 Avg. Bal. Yield Rate Avg. Bal. Yield Rate Avg. Bal. Yield Rate
Assets
Securities $ 42,515 3.80% $ 46,413 3.86% $ 65,067 4.25%
Fed funds sold & liquidity investments 882,001 .25% 388,855 .25% 158,594 .21%
Loans held for investment, mortgage finance 3,471,737 3.06% 3,452,782 3.13% 2,238,730 3.59%
Loans held for investment 9,921,323 4.40% 9,423,259 4.52% 8,142,569 4.73%
Total loans, net of reserve 13,296,921 4.08% 12,784,614 4.18% 10,297,290 4.52%
Total earning assets 14,221,437 3.85% 13,219,882 4.06% 10,520,951 4.45%
Total assets $14,631,072 $13,629,609 $10,899,266
Liabilities and Stockholders’ Equity
Total interest bearing deposits $ 7,405,436 .28% $ 6,856,542 .27% $ 5,887,252 .26%
Other borrowings 251,449 .19% 309,868 .20% 314,018 .20%
Subordinated notes 286,000 5.88% 286,000 5.88% 111,000 6.58%
Long-term debt 113,406 2.19% 113,406 2.19% 113,406 2.21%
Total interest bearing liabilities 8,056,291 .50% 7,565,816 .50% 6,425,676 .40%
Demand deposits 5,047,876 4,669,772 3,289,307 Stockholders’ equity 1,380,646 1,276,603 1,077,822
Total liabilities and stockholders’ equity $14,631,072 .28% $13,629,609 .28% $10,899,266 .24%
Net interest margin 3.56% 3.77% 4.21%
Total deposits and borrowed funds $12,704,761 .17% $11,836,182 .16% $ 9,490,577 .17%
Loan spread 3.91% 4.02% 4.35%
19
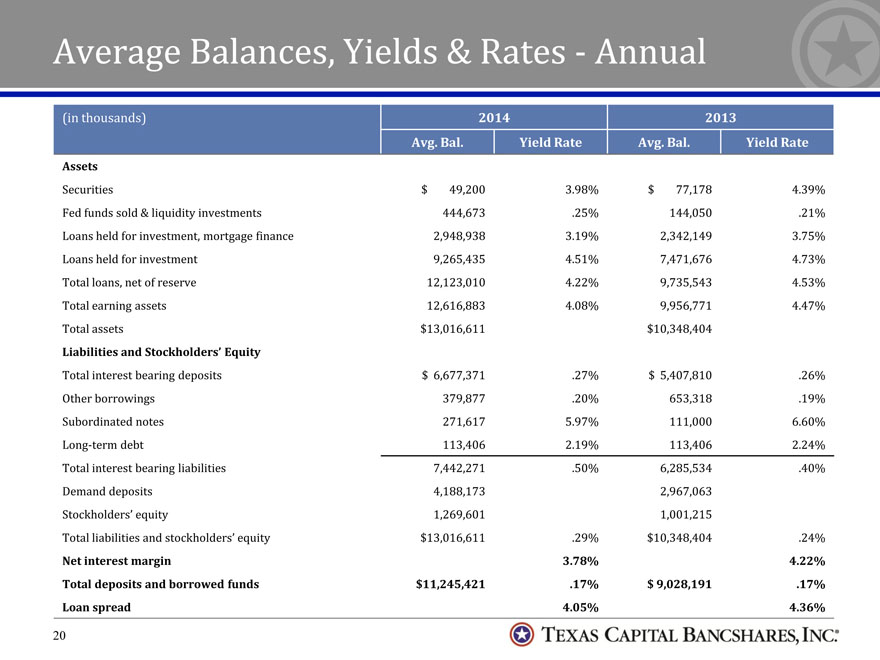
Average Balances, Yields & Rates—Annual
(in thousands) 2014 2013
Avg. Bal. Yield Rate Avg. Bal. Yield Rate
Assets
Securities $ 49,200 3.98% $ 77,178 4.39%
Fed funds sold & liquidity investments 444,673 .25% 144,050 .21%
Loans held for investment, mortgage finance 2,948,938 3.19% 2,342,149 3.75%
Loans held for investment 9,265,435 4.51% 7,471,676 4.73%
Total loans, net of reserve 12,123,010 4.22% 9,735,543 4.53%
Total earning assets 12,616,883 4.08% 9,956,771 4.47%
Total assets $13,016,611 $10,348,404
Liabilities and Stockholders’ Equity
Total interest bearing deposits $ 6,677,371 .27% $ 5,407,810 .26%
Other borrowings 379,877 .20% 653,318 .19%
Subordinated notes 271,617 5.97% 111,000 6.60%
Long-term debt 113,406 2.19% 113,406 2.24%
Total interest bearing liabilities 7,442,271 .50% 6,285,534 .40%
Demand deposits 4,188,173 2,967,063
Stockholders’ equity 1,269,601 1,001,215
Total liabilities and stockholders’ equity $13,016,611 .29% $10,348,404 .24%
Net interest margin 3.78% 4.22%
Total deposits and borrowed funds $11,245,421 .17% $ 9,028,191 .17%
Loan spread 4.05% 4.36%
20
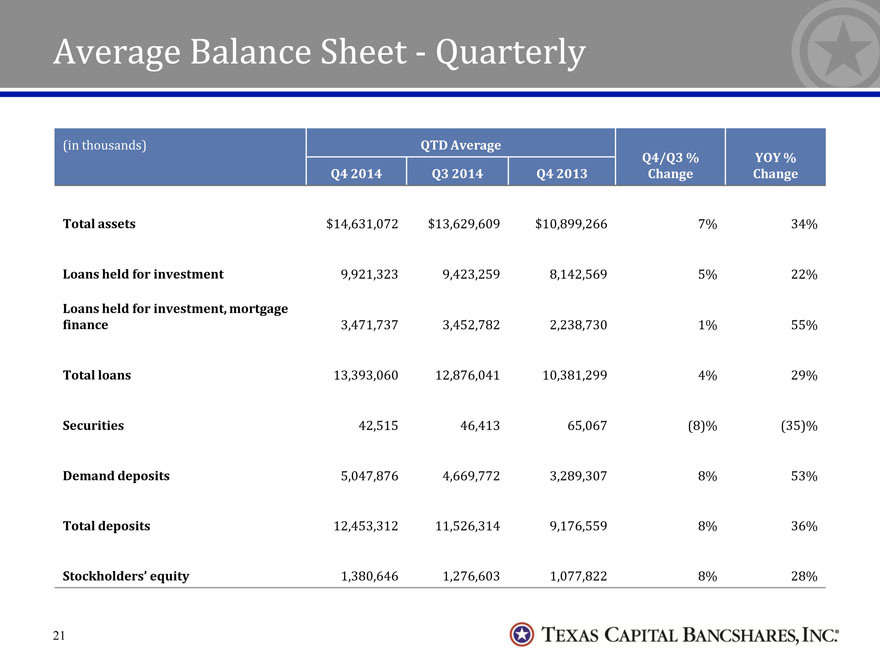
Average Balance Sheet—Quarterly
(in thousands) QTD Average Q4/Q3 % YOY % Q4 2014 Q3 2014 Q4 2013 Change Change
Total assets $14,631,072 $13,629,609 $10,899,266 7% 34%
Loans held for investment 9,921,323 9,423,259 8,142,569 5% 22%
Loans held for investment, mortgage finance 3,471,737 3,452,782 2,238,730 1% 55%
Total loans 13,393,060 12,876,041 10,381,299 4% 29%
Securities 42,515 46,413 65,067 (8)% (35)%
Demand deposits 5,047,876 4,669,772 3,289,307 8% 53%
Total deposits 12,453,312 11,526,314 9,176,559 8% 36%
Stockholders’ equity 1,380,646 1,276,603 1,077,822 8% 28%
21
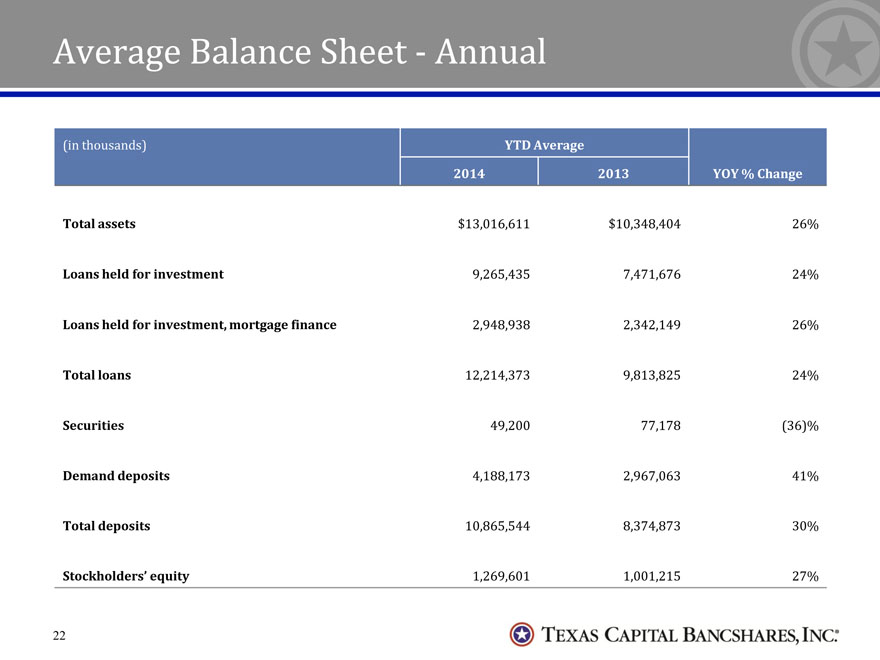
Average Balance Sheet—Annual
(in thousands) YTD Average
2014 2013 YOY % Change
Total assets $13,016,611 $10,348,404 26%
Loans held for investment 9,265,435 7,471,676 24%
Loans held for investment, mortgage finance 2,948,938 2,342,149 26%
Total loans 12,214,373 9,813,825 24%
Securities 49,200 77,178 (36)%
Demand deposits 4,188,173 2,967,063 41%
Total deposits 10,865,544 8,374,873 30%
Stockholders’ equity 1,269,601 1,001,215 27%
22
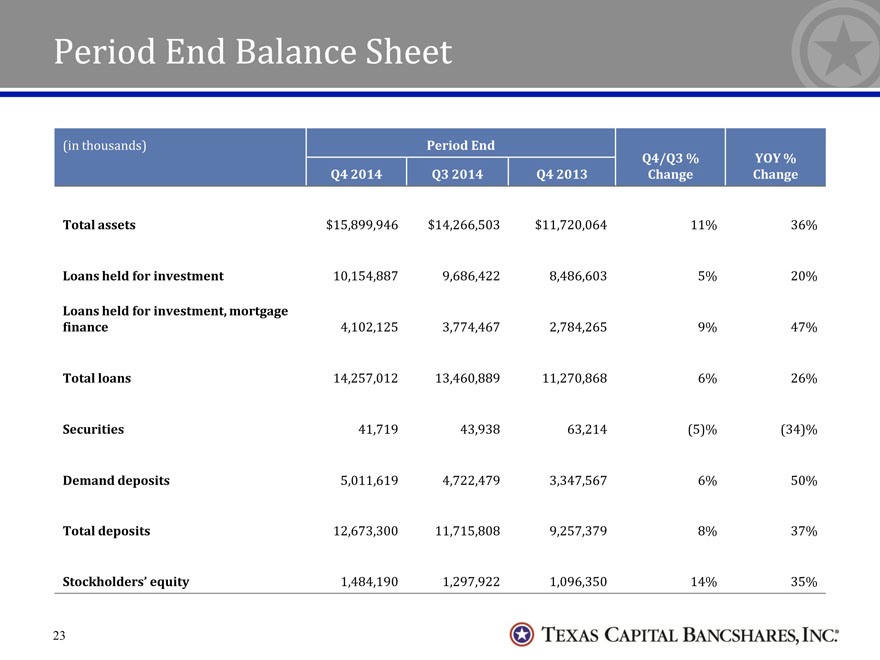
Period End Balance Sheet
(in thousands) Period End Q4/Q3 % YOY % Q4 2014 Q3 2014 Q4 2013 Change Change
Total assets $15,899,946 $14,266,503 $11,720,064 11% 36%
Loans held for investment 10,154,887 9,686,422 8,486,603 5% 20%
Loans held for investment, mortgage finance 4,102,125 3,774,467 2,784,265 9% 47%
Total loans 14,257,012 13,460,889 11,270,868 6% 26%
Securities 41,719 43,938 63,214 (5)% (34)%
Demand deposits 5,011,619 4,722,479 3,347,567 6% 50%
Total deposits 12,673,300 11,715,808 9,257,379 8% 37%
Stockholders’ equity 1,484,190 1,297,922 1,096,350 14% 35%
23