UNITED STATES
SECURITIES AND EXCHANGE COMMISSION
Washington, D.C. 20549
FORM N-CSR
CERTIFIED SHAREHOLDER REPORT OF REGISTERED
MANAGEMENT INVESTMENT COMPANIES
Investment Company Act file number 811-09223
Pioneer Series Trust XIV
(Exact name of registrant as specified in charter)
60 State Street, Boston, MA 02109
(Address of principal executive offices) (ZIP code)
Terrence J. Cullen, Amundi Asset Management, Inc.,
60 State Street, Boston, MA 02109
(Name and address of agent for service)
Registrant’s telephone number, including area code: (617) 742-7825
Date of fiscal year end: September 30, 2021
Date of reporting period: October 1, 2020 through March 31, 2021
Form N-CSR is to be used by management investment companies to file reports with the Commission not later than 10 days after the transmission to stockholders of any report that is required to be transmitted to stockholders under Rule 30e-1 under the Investment Company Act of 1940 (17 CFR 270.30e-1). The Commission may use the information provided on Form N-CSR in its regulatory, disclosure review, inspection, and policymaking roles.
A registrant is required to disclose the information specified by Form N-CSR, and the Commission will make this information public. A registrant is not required to respond to the collection of information contained in Form N-CSR unless the Form displays a currently valid Office of Management and Budget (“OMB”) control number. Please direct comments concerning the accuracy of the information collection burden estimate and any suggestions for reducing the burden to Secretary, Securities and Exchange Commission, 450 Fifth Street, NW, Washington, DC 20549-0609. The OMB has reviewed this collection of information under the clearance requirements of 44 U.S.C. ss. 3507.
Pioneer Strategic Income Fund
Semiannual Report | March 31, 2021
| A: PSRAX | C: PSRCX | K: STRKX | R: STIRX | Y: STRYX |
Paper copies of the Fund’s shareholder reports are no longer sent by mail, unless you specifically request paper copies of the reports from the Fund or from your financial intermediary, such as a broker-dealer, bank or insurance company. Instead, the reports are available on the Fund’s website, and you will be notified by mail each time a report is posted and provided with a website link to access the report.
You may elect to receive all future reports in paper free of charge. If you invest directly with the Fund, you can inform the Fund that you wish to continue receiving paper copies of your shareholder reports by calling 1-800-225-6292. If you invest through a financial intermediary, you can contact your financial intermediary to request that you continue to receive paper copies of your shareholder reports. Your election to receive reports in paper will apply to all funds held in your account if you invest through your financial intermediary or all funds held within the Pioneer Fund complex if you invest directly.
visit us: www.amundi.com/us
| 2 | |
| 4 | |
| 11 | |
| 12 | |
| 13 | |
| 18 | |
| 20 | |
| 91 | |
| 100 | |
| 123 |
Pioneer Strategic Income Fund | Semiannual Report | 3/31/21 1
The first few months of 2021 have brought some better news on the COVID-19 global pandemic front, as the deployment of the first approved COVID-19 vaccines is well underway, with expectations for widespread vaccine distribution by the middle of the year. In general, COVID-19 cases and related hospitalizations have been on the decline in the US, despite a few problematic “hot spots” in some states, and that has had a positive effect on overall market sentiment.
While there may finally be a light visible at the end of the pandemic tunnel, the long-term impact on the global economy from COVID-19, while currently unknown, is likely to be considerable. It is clear that several industries have already felt greater effects than others, and the markets, which do not thrive on uncertainty, have been volatile. With that said, in the first few months of 2021, equity markets and other so-called “riskier” assets, such as high-yield bonds, have outperformed investments regarded as less risky, such as government debt. In addition, we’ve witnessed the long-awaited rebound in the performance of cyclical stocks, or stocks of companies with greater exposure to the ebbs and flows of the economic cycle, as investors have appeared to embrace the potential for a more widespread reopening of the economy in the coming months. Additional fiscal stimulus from the US government in recent months has also helped provide some market momentum.
However, despite the dramatic market rebound since its March 2020 low point, volatility has remained elevated, with momentum rising and falling on seemingly every bit of positive or negative news about the virus. In addition, the recent US Presidential and Congressional elections have resulted in a power shift in Washington, DC, and that most likely portends some changes in fiscal policy above and beyond just additional pandemic-related stimulus. That, too, could lead to increased market volatility as investors analyze the various tax and spending plans, and wait to see what proposed policy alterations actually become law.
With the advent of COVID-19 in early 2020, we implemented our business continuity plan according to the new COVID-19 guidelines, and most of our employees have been working remotely since March 2020. To date, our operating environment has faced no interruption. I am proud of the careful planning that has taken place and confident we can maintain this environment for as long as is prudent. History in the making for a company that first opened its doors way back in 1928.
2 Pioneer Strategic Income Fund | Semiannual Report | 3/31/21
Since 1928, Amundi US’s investment process has been built on a foundation of fundamental research and active management, principles which have guided our investment decisions for more than 90 years. We believe active management – that is, making active investment decisions – can help mitigate the risks during periods of market volatility. As 2020 has reminded us, investment risk can arise from a number of factors in today’s global economy, including slower or stagnating growth, changing U.S. Federal Reserve policy, oil price shocks, political and geopolitical factors and, unfortunately, major public health concerns such as a viral pandemic.
At Amundi US, active management begins with our own fundamental, bottom-up research process. Our team of dedicated research analysts and portfolio managers analyzes each security under consideration, communicating directly with the management teams of the companies issuing the securities and working together to identify those securities that best meet our investment criteria for our family of funds. Our risk management approach begins with each and every security, as we strive to carefully understand the potential opportunity, while considering any and all risk factors.
Today, as investors, we have many options. It is our view that active management can serve shareholders well, not only when markets are thriving, but also during periods of market stress.
As you consider your long-term investment goals, we encourage you to work with your financial professional to develop an investment plan that paves the way for you to pursue both your short-term and long-term goals.
We remain confident that the current crisis, like others in human history, will pass, and we greatly appreciate the trust you have placed in us and look forward to continuing to serve you in the future.
Sincerely,

Lisa M. Jones
Head of the Americas, President and CEO of US
Amundi Asset Management US, Inc.
May 2021
Head of the Americas, President and CEO of US
Amundi Asset Management US, Inc.
May 2021
Any information in this shareowner report regarding market or economic trends or the factors influencing the Fund’s historical or future performance are statements of opinion as of the date of this report. Past performance is no guarantee of future results.
Pioneer Strategic Income Fund | Semiannual Report | 3/31/21 3
In the following interview, Andrew Feltus and Jonathan Scott discuss the factors that affected the performance of Pioneer Strategic Income Fund during the six-month period ended March 31, 2021. Mr. Feltus, CFA, Managing Director, Co-Director of High Yield, and a portfolio manager at Amundi Asset Management US, Inc. (Amundi US), and Mr. Scott, a vice president and a portfolio manager at Amundi US, are responsible for the day-to-day management of the Fund, along with Brad Komenda*, Deputy Director of Investment-Grade Corporates, a senior vice president, and a portfolio manager at Amundi US, and Kenneth J. Taubes, Executive Vice President, Chief Investment Officer, US, and a portfolio manager at Amundi US.
Q How did the Fund perform during the six-month period ended March 31, 2021?
A Pioneer Strategic Income Fund’s Class A shares returned 4.50% at net asset value during the six-month period ended March 31, 2021, while the Fund’s benchmark, the Bloomberg Barclays US Universal Index (the Bloomberg Barclays Index), returned -1.80%. During the same period, the average return of the 373 mutual funds in Morningstar’s Multisector Bond Funds category was 3.91%.
Q How would you describe the market environment for fixed-income investments during the six-month period ended March 31, 2021?
A On the heels of a strong summer for so-called riskier assets in 2020, macroeconomic uncertainty reared its head entering the six-month period last October, with a focus on heightened risks revolving around three key areas: the contentious negotiations among US lawmakers over additional stimulus legislation, the ongoing COVID-19 pandemic, and the November US elections. A partisan dispute over when to appoint Supreme Court Justice Ginsburg’s replacement further hardened both parties’ negotiating positions and lowered the odds of passage of a broad fiscal-support package in Washington prior to the November election. At the same time, a notable uptick in European COVID-19 cases reignited fears that the US remained at risk for another wave of infections and a corresponding round of renewed or expanded economic lockdowns in response. Finally, investors’ concerns mounted over the potential for a protracted dispute over the presidential election results.
After some sluggishness, the US economic outlook received two “shots in the arm” during December, as a pair of COVID-19 vaccines received emergency-use authorization from the US Food and Drug Administration
* Effective February 1, 2021, Brad Komenda became a Portfolio Manager on the Fund.
4 Pioneer Strategic Income Fund | Semiannual Report | 3/31/21
(FDA), and lawmakers in Washington finally reached agreement on a $900 billion fiscal assistance package, the third US-government stimulus effort since the onset of the pandemic. Markets viewed the rollout of the vaccines as the proverbial “light at the end of the tunnel” for the pandemic, betting that distribution of the vaccines would help alleviate the public-health uncertainty and bring forward the timing of a return to what could be regarded as economic normalcy. The additional stimulus measures from the government were viewed as offering much needed support for many individuals and businesses.
As 2021 got underway, investors elected to focus their attention on those positive developments and looked beyond regional “surges” in COVID-19 cases, as well as select data that suggested a slowing in the rate of economic recovery. By late January, political uncertainty had been removed as a new administration and Democrat-controlled House and Senate took office and almost immediately began discussions about even more fiscal stimulus, which resulted in passage of a $1.9 trillion COVID-19 relief package soon after. Meanwhile, increased vaccine distributions and a gradual decline in COVID-19 cases and hospitalizations as the period progressed also boosted market sentiment. In response, riskier assets rallied and Treasury yields moved higher into the end of March.
In sector terms, returns of corporate bonds over the six-month period were led by issuers in sectors that had felt the biggest negative effects of the COVID-19 crisis, as investors anticipated an economic reopening driven by widespread vaccinations, with energy and air transportation bonds – two of the biggest “reopening” sectors – leading the way. In contrast, issuers in sectors viewed as “up in quality,” or that had been relatively insulated from the effects of COVID-19, underperformed for the six-month period. Those sectors included telecommunications and food & drug retail. With respect to ratings, lower-quality bonds outperformed higher-quality bonds over the period.
The negative six-month return of the Fund’s benchmark, the Bloomberg Barclays Index, owed largely to the notable rise in Treasury yields. Within corporates, high-yield issues dramatically outperformed their more interest-rate-sensitive counterparts in the investment-grade segment. Securitized assets, such as mortgage-backed securities (MBS) and asset-backed securities (ABS), turned in modestly negative performance for the six-month period, while exceeding the returns of investment-grade corporates.
Pioneer Strategic Income Fund | Semiannual Report | 3/31/21 5
Q What factors affected the Fund’s performance relative to the benchmark Bloomberg Barclays Index during the six-month period ended March 31, 2021?
A As a multisector fixed-income portfolio, we have managed the Fund in a way that seeks to deliver strong returns, while experiencing volatility similar to the benchmark, by investing across a diversified* range of investment-grade and non-investment-grade global fixed-income asset classes. We seek to add relative value to the Fund’s performance versus the benchmark through both sector allocation and security selection, focusing on “spread” sectors that trade at a yield advantage relative to US Treasuries. (Spread sectors are defined as non-governmental fixed-income market sectors that offer higher yields, at greater risk, than governmental investments.) Such sectors include corporate bonds, agency MBS, other securitized assets, and emerging markets issues, which have typically offered higher risk-adjusted returns than Treasuries as well as greater security selection opportunities. Taking a dynamic approach to sector allocation, we strive to increase the Fund’s risk profile when we believe markets are offering proper compensation for taking on additional risk, and reducing the risk profile if we feel values available in the markets are less attractive.
The Fund’s short-US-duration position versus the Bloomberg Barclays Index, as well as a short-duration position in the German Bund, aided benchmark-relative performance as yields rose over the six-month period. The Fund’s US-duration position was the largest positive contributor to relative performance, in fact, as the US yield curve steepened significantly. (Duration is a measure of the sensitivity of the price, or the value of principal, of a fixed-income investment to a change in interest rates, expressed as a number of years.)
Sector allocation also contributed positively to the Fund’s benchmark-relative performance over the six-month period. A modest portfolio allocation to Treasury inflation-protected securities (TIPS) benefited relative returns as the asset class fared well due to rising inflation expectations. Meanwhile, a significant underweight to US Treasuries proved beneficial for the Fund’s relative results as interest rates rose (bond prices typically move in the opposite direction of rates). The Fund’s allocation to non-agency residential MBS (RMBS) was another positive contributor to benchmark-relative returns, boosted by the portfolio’s exposure to strong-performing credit-risk-transfer securities (CRTs), as CRTs rose in value on strong home-price appreciation over the six-month period.
* Diversification does not assure a profit nor protect against loss.
6 Pioneer Strategic Income Fund | Semiannual Report | 3/31/21
Security selection aided the Fund’s relative performance for the period, highlighted by holdings of industrials and, to a lesser extent, financials within the portfolio’s allocation to corporate bonds. The Fund’s industrials holdings fared well due to the strong performance of commodity-related issues, particularly within the energy industry, as well as good performance by issuers in sectors that had experienced the most severe effects of the COVID-19 crisis, including airlines. Financials holdings benefited from the strong performance of both surplus notes of US insurers and the convertible preferred issues of European banks. Outside of corporates, the Fund’s agency RMBS performance reflected the strong results from the portfolio’s TBA (to be announced) exposures. (A TBA serves as a contract to purchase or sell an MBS on a specific date, but it does not include information regarding the pool number, number of pools, or the exact amount that will be included in the transaction.)
The Fund’s currency exposures were the only key detractor from benchmark-relative performance for the period, with returns hurt primarily by an allocation to the Swedish krona and a position in the euro, as the near-term outlook for the euro zone dimmed in the wake of increased pandemic-related lockdowns, and as China reined in its credit growth.
Q Did the Fund have any investments in derivative securities during the six-month period ended March 31, 2021?
A Yes, the Fund had investments in multiple types of derivatives: Treasury futures, index futures, credit-default swaps, options, and forward foreign currency contracts (“currency forwards”). The exposure to Treasury futures was part of our strategy to maintain a shorter-than-benchmark duration in the portfolio (discussed earlier). We used the investments in credit-default swaps to manage the Fund’s exposure to credit-sensitive sectors; the swaps had a negative effect on relative returns. The Fund’s exposure to currency forwards was a technique used to manage the risks in the portfolio’s non-US dollar (USD) currencies; the tactic had a mixed impact on benchmark-relative results as the hedges helped performance, while long exposures detracted from returns.
Q Did the Fund’s distributions** (or yield) to shareholders change during the six-month period ended March 31, 2021?
A The Fund’s dividend yield declined over the six months as spreads narrowed for credit-oriented areas of the market. (Credit spreads are commonly defined as the differences in yield between Treasuries and other types of fixed-income securities with similar maturities.)
** Distributions/dividends are not guaranteed.
Pioneer Strategic Income Fund | Semiannual Report | 3/31/21 7
Q What is your investment outlook?
A The US Federal Reserve (Fed) has continued to message that it is willing to keep monetary policy accommodative for an extended period of time. While “an extended period of time” seems to be a purposefully vague duration, public comments from members of the Federal Open Market Committee (FOMC) have suggested that they could be thinking the “extended period” equals at least one year. Since the Fed has indicated that it will ignore this year’s expected rise in inflation as merely transitory, the attention of both investors and policymakers could turn to 2022 inflation measures. If the FOMC, as suggested, waits for a full year with Core PCE (personal consumption) inflation at more than 2% before tightening monetary policy, rate hikes could be off the table until 2023, in our opinion. That would be consistent with the Fed’s own “dot” projections. (The Fed’s “dot” plot/projection is a quarterly chart summarizing the outlook for the federal funds rate for each of the FOMC’s members.)
Market pricing, however, has reflected a somewhat faster pace for rate hikes, due in part to the possibility that the markets may not “buy” the Fed’s new operating framework. However, we feel it is important to understand that actual market pricing has reflected a combination of possible outcomes rather than single-point forecasts.
While we believe inflation is likely to be lower in 2022 than in 2021, the balance of inflation risks has been skewed to the upside, given massive debt-financed US fiscal stimulus and the prospect of government policies –such as a minimum wage hike, easier unionization, and generous unemployment benefits – that could potentially boost wage growth.
Given the additional fiscal stimulus package and a more-rapid US economic reopening, we have revised up our base-case 2021 US gross domestic product (GDP) growth forecast. The demand-driven growth dynamic could be positive for corporate fundamentals and consumer balance sheets. In turn, solid issuer fundamentals and still-elevated investor cash balances (earning close to 0% yield) may support further spread-asset performance.
We believe higher US Treasury yields present a risk to broad-market performance, to the extent that tighter financial conditions could start to weigh on economic activity. By our estimates, a 10-year US Treasury yield in the 2.50% to 3.00% area may likely become problematic for
8 Pioneer Strategic Income Fund | Semiannual Report | 3/31/21
certain market segments and for economic growth. We currently regard the risk of such a move as remote; however, we have been monitoring the situation closely, as strong monthly economic data further out on the horizon may push yields marginally higher in the coming months.
While we could see the USD rally in the near term, reflecting a more positive economic outlook in the US given a successful vaccination program and rebounding growth, we think the USD could depreciate in the intermediate term. Such a depreciation could reflect the negative impact of increasing fiscal deficits and the potential for non-US yields to rise, thus reducing yield differentials. We continue to hold select Fund positions in emerging markets currencies and countries.
Please refer to the Schedule of Investments on pages 20–90 for a full listing of Fund securities.
All investments are subject to risk, including the possible loss of principal. In the past several years, financial markets have experienced increased volatility and heightened uncertainty. The market prices of securities may go up or down, sometimes rapidly or unpredictably, due to general market conditions, such as real or perceived adverse economic, political, or regulatory conditions, recessions, inflation, changes in interest or currency rates, lack of liquidity in the bond markets, the spread of infectious illness or other public health issues or adverse investor sentiment. These conditions may continue, recur, worsen or spread.
Investments in high-yield or lower-rated securities are subject to greater-than-average price volatility, illiquidity and possibility of default.
The Fund’s investments, payment obligations and financing terms may be based on floating rates, such as LIBOR (London Interbank Offered Rate). Plans are underway to phase out the use of LIBOR. There remains uncertainty regarding the nature of any replacement rate and the impact of the transition from LIBOR on the Fund, issuers of instruments in which the Fund invests, and financial markets generally.
When interest rates rise, the prices of fixed-income securities held by the Fund will generally fall. Conversely, when interest rates fall, the prices of fixed-income securities held by the Fund will generally rise.
Investments in the Fund are subject to possible loss due to the financial failure of issuers of underlying securities and their inability to meet their debt obligations.
Pioneer Strategic Income Fund | Semiannual Report | 3/31/21 9
Prepayment risk is the chance that an issuer may exercise its right to prepay its security, if falling interest rates prompt the issuer to do so. Forced to reinvest the unanticipated proceeds at lower interest rates, the Fund would experience a decline in income and lose the opportunity for additional price appreciation.
The securities issued by U.S. government-sponsored entities (e.g., FNMA, Freddie Mac) are neither guaranteed nor issued by the U.S. government.
The Fund may invest in mortgage-backed securities, which during times of fluctuating interest rates may increase or decrease more than other fixed-income securities. Mortgage-backed securities are also subject to prepayments.
The Fund may invest in insurance-linked securities. The return of principal and the payment of interest on insurance-linked securities are contingent on the non-occurrence of a predefined “trigger” event that leads to physical or economic loss, such as a hurricane or an aerospace catastrophe. Insurance-linked securities may expose the Fund to other risks, including, but not limited to, issuer (credit) default, adverse regulatory or jurisdictional interpretations and adverse tax consequences.
Investing in foreign and/or emerging markets securities involves risks relating to interest rates, currency exchange rates, economic, and political conditions.
At times, the Fund’s investments may represent industries or industry sectors that are interrelated or have common risks, making the Fund more susceptible to any economic, political, or regulatory developments or other risks affecting those industries and sectors.
These risks may increase share price volatility.
Before investing, consider the product’s investment objectives, risks, charges and expenses. Contact your financial professional or Amundi Asset Management US, Inc., for a prospectus or summary prospectus containing this information. Read it carefully.
Any information in this shareholder report regarding market or economic trends or the factors influencing the Fund’s historical or future performance are statements of opinion as of the date of this report. Past performance is no guarantee of future results.
10 Pioneer Strategic Income Fund | Semiannual Report | 3/31/21

| 10 Largest Holdings | ||
(As a percentage of total investments)* | ||
| 1. | Wells Fargo & Co., 7.5% | 1.99% |
| 2. | Fannie Mae, 2.5%, 5/1/51 (TBA) | 1.97 |
| 3. | U.S. Treasury Bills, 4/13/21 | 1.77 |
| 4. | U.S. Treasury Inflation Indexed Bonds, 1.0%, 2/15/49 | 1.72 |
| 5. | U.S. Treasury Bills, 4/1/21 | 1.66 |
| 6. | Fannie Mae, 2.0%, 5/1/51 (TBA) | 1.44 |
| 7. | Fannie Mae, 4.5%, 4/1/51 (TBA) | 1.03 |
| 8. | Stichting AK Rabobank Certificaten, 2.188% | 0.95 |
| 9. | Cenovus Energy, Inc., 6.75%, 11/15/39 | 0.77 |
| 10. | Mexican Bonos, 8.5%, 5/31/29 | 0.75 |
* | Excludes temporary cash investments and all derivative contracts except for options purchased. The Fund is actively managed, and current holdings may be different. The holdings listed should not be considered recommendations to buy or sell any securities. |
Pioneer Strategic Income Fund | Semiannual Report | 3/31/21 11
| Net Asset Value per Share | ||||
| Class | 3/31/21 | 9/30/20 | ||
A | $11.19 | $10.91 | ||
C | $10.95 | $10.67 | ||
K | $11.21 | $10.92 | ||
R | $11.38 | $11.09 | ||
Y | $11.19 | $10.91 | ||
| Distributions per Share: 10/1/20–3/31/21 | ||||
| Net Investment | Short-Term | Long-Term | Tax Return | |
| Class | Income | Capital Gains | Capital Gains | of Capital |
A | $0.2110 | $ — | $ — | $ — |
C | $0.1668 | $ — | $ — | $ — |
K | $0.2350 | $ — | $ — | $ — |
R | $0.1928 | $ — | $ — | $ — |
Y | $0.2284 | $ — | $ — | $ — |
Index Definitions
The Bloomberg Barclays U.S. Universal Index is an unmanaged index that represents the union of the U.S. Aggregate Index, the U.S. High Yield Corporate Index, the 144A Index, the Eurodollar Index, the Emerging Markets Index, the non-ERISA portion of the CMBS Index, and the CMBS High Yield Index. Municipal debt, private placements and non-dollar-denominated issues are excluded. Index returns are calculated monthly, assume reinvestment of dividends and, unlike Fund returns, do not reflect any fees, expenses or sales charges. It is not possible to invest directly in an index.
The index defined here pertains to the “Value of $10,000 Investment” and “Value of $5 Million Investment” charts on pages 13–17.
12 Pioneer Strategic Income Fund | Semiannual Report | 3/31/21
| Class A Shares |
Investment Returns
The mountain chart on the right shows the change in value of a $10,000 investment made in Class A shares of Pioneer Strategic Income Fund at public offering price during the periods shown, compared to that of the Bloomberg Barclays U.S. Universal Index.
| Average Annual Total Returns | |||
(As of March 31, 2021) | |||
| Bloomberg | |||
| Net | Public | Barclays | |
| Asset | Offering | U.S. | |
| Value | Price | Universal | |
| Period | (NAV) | (POP) | Index |
10 years | 4.29% | 3.81% | 3.77% |
5 years | 4.93 | 3.97 | 3.59 |
1 year | 21.01 | 15.56 | 2.95 |
| Expense Ratio | |||
(Per prospectus dated February 1, 2021) | |||
| Gross | |||
1.06% | |||

Call 1-800-225-6292 or visit www.amundi.com/us for the most recent month-end performance results. Current performance may be lower or higher than the performance data quoted.
The performance data quoted represents past performance, which is no guarantee of future results. Investment return and principal value will fluctuate, and shares, when redeemed, may be worth more or less than their original cost.
NAV results represent the percent change in net asset value per share. NAV returns would have been lower had sales charges been reflected. POP returns reflect deduction of maximum 4.50% sales charge. All results are historical and assume the reinvestment of dividends and capital gains. Other share classes are available for which performance and expenses will differ.
Performance results reflect any applicable expense waivers in effect during the periods shown. Without such waivers Fund performance would be lower. Waivers may not be in effect for all funds. Certain fee waivers are contractual through a specified period. Otherwise, fee waivers can be rescinded at any time. See the prospectus and financial statements for more information.
The performance table and graph do not reflect the deduction of fees and taxes that a shareowner would pay on Fund distributions or the redemption of Fund shares.
Please refer to the financial highlights for a more current expense ratio.
Pioneer Strategic Income Fund | Semiannual Report | 3/31/21 13
Performance Update | 3/31/21 | Class C Shares |
Investment Returns
The mountain chart on the right shows the change in value of a $10,000 investment made in Class C shares of Pioneer Strategic Income Fund during the periods shown, compared to that of the Bloomberg Barclays U.S. Universal Index.
| Average Annual Total Returns | |||
(As of March 31, 2021) | |||
| Bloomberg | |||
| Barclays | |||
| U.S. | |||
| If | If | Universal | |
| Period | Held | Redeemed | Index |
10 years | 3.59% | 3.59% | 3.77% |
5 years | 4.26 | 4.26 | 3.59 |
1 year | 20.50 | 20.50 | 2.95 |
| Expense Ratio | |||
(Per prospectus dated February 1, 2021) | |||
| Gross | |||
1.73% | |||

Call 1-800-225-6292 or visit www.amundi.com/us for the most recent month-end performance results. Current performance may be lower or higher than the performance data quoted.
The performance data quoted represents past performance, which is no guarantee of future results. Investment return and principal value will fluctuate, and shares, when redeemed, may be worth more or less than their original cost.
Class C shares held for less than one year are also subject to a 1% contingent deferred sales charge (CDSC). “If Held” results represent the percent change in net asset value per share. “If Redeemed” returns would have been lower had sales charges been reflected. All results are historical and assume the reinvestment of dividends and capital gains. Other share classes are available for which performance and expenses will differ.
Performance results reflect any applicable expense waivers in effect during the periods shown. Without such waivers Fund performance would be lower. Waivers may not be in effect for all funds. Certain fee waivers are contractual through a specified period. Otherwise, fee waivers can be rescinded at any time. See the prospectus and financial statements for more information.
The performance table and graph do not reflect the deduction of fees and taxes that a shareowner would pay on Fund distributions or the redemption of Fund shares.
Please refer to the financial highlights for a more current expense ratio.
14 Pioneer Strategic Income Fund | Semiannual Report | 3/31/21
Performance Update | 3/31/21 | Class K Shares |
Investment Returns
The mountain chart on the right shows the change in value of a $5 million investment made in Class K shares of Pioneer Strategic Income Fund during the periods shown, compared to that of the Bloomberg Barclays U.S. Universal Index.
| Average Annual Total Returns | ||
(As of March 31, 2021) | ||
| Bloomberg | ||
| Net | Barclays | |
| Asset | U.S. | |
| Value | Universal | |
| Period | (NAV) | Index |
10 years | 4.68% | 3.77% |
5 years | 5.39 | 3.59 |
1 year | 22.52 | 2.95 |
| Expense Ratio | ||
(Per prospectus dated February 1, 2021) | ||
| Gross | ||
0.62% | ||

Call 1-800-225-6292 or visit www.amundi.com/us for the most recent month-end performance results. Current performance may be lower or higher than the performance data quoted.
The performance data quoted represents past performance, which is no guarantee of future results. Investment return and principal value will fluctuate, and shares, when redeemed, may be worth more or less than their original cost.
The performance shown for Class K shares for the period prior to the commencement of operations of Class K shares on December 20, 2012, is the net asset value performance of the Fund’s Class A shares, which has not been restated to reflect any differences in expenses, including Rule 12b-1 fees applicable to Class A shares. Since fees for Class A shares generally are higher than those of Class K shares, the performance of Class K shares prior to their inception would have been higher than the performance shown. For the period beginning December 20, 2012, the actual performance of Class K shares is reflected. Class K shares are not subject to sales charges and are available for limited groups of eligible investors, including institutional investors. All results are historical and assume the reinvestment of dividends and capital gains. Other share classes are available for which performance and expenses will differ.
Performance results reflect any applicable expense waivers in effect during the periods shown. Without such waivers Fund performance would be lower. Waivers may not be in effect for all funds. Certain fee waivers are contractual through a specified period. Otherwise, fee waivers can be rescinded at any time. See the prospectus and financial statements for more information.
The performance table and graph do not reflect the deduction of fees and taxes that a shareowner would pay on Fund distributions or the redemption of Fund shares.
Please refer to the financial highlights for a more current expense ratio.
Pioneer Strategic Income Fund | Semiannual Report | 3/31/21 15
Performance Update | 3/31/21 | Class R Shares |
Investment Returns
The mountain chart on the right shows the change in value of a $10,000 investment made in Class R shares of Pioneer Strategic Income Fund during the periods shown, compared to that of the Bloomberg Barclays U.S. Universal Index.
| Average Annual Total Returns | ||
(As of March 31, 2021) | ||
| Bloomberg | ||
| Net | Barclays | |
| Asset | U.S. | |
| Value | Universal | |
| Period | (NAV) | Index |
10 years | 3.95% | 3.77% |
5 years | 4.61 | 3.59 |
1 year | 19.28 | 2.95 |
| Expense Ratio | ||
(Per prospectus dated February 1, 2021) | ||
| Gross | ||
1.40% | ||

Call 1-800-225-6292 or visit www.amundi.com/us for the most recent month-end performance results. Current performance may be lower or higher than the performance data quoted.
The performance data quoted represents past performance, which is no guarantee of future results. Investment return and principal value will fluctuate, and shares, when redeemed, may be worth more or less than their original cost.
Class R shares are not subject to sales charges and are available for limited groups of eligible investors, including institutional investors. All results are historical and assume the reinvestment of dividends and capital gains. Other share classes are available for which performance and expenses will differ.
Performance results reflect any applicable expense waivers in effect during the periods shown. Without such waivers Fund performance would be lower. Waivers may not be in effect for all funds. Certain fee waivers are contractual through a specified period. Otherwise, fee waivers can be rescinded at any time. See the prospectus and financial statements for more information.
The performance table and graph do not reflect the deduction of fees and taxes that a shareowner would pay on Fund distributions or the redemption of Fund shares.
Please refer to the financial highlights for a more current expense ratio.
16 Pioneer Strategic Income Fund | Semiannual Report | 3/31/21
Performance Update | 3/31/21 | Class Y Shares |
Investment Returns
The mountain chart on the right shows the change in value of a $5 million investment made in Class Y shares of Pioneer Strategic Income Fund during the periods shown, compared to that of the Bloomberg Barclays U.S. Universal Index.
| Average Annual Total Returns | ||
(As of March 31, 2021) | ||
| Bloomberg | ||
| Net | Barclays | |
| Asset | U.S. | |
| Value | Universal | |
| Period | (NAV) | Index |
10 years | 4.62% | 3.77% |
5 years | 5.29 | 3.59 |
1 year | 21.90 | 2.95 |
| Expense Ratio | ||
(Per prospectus dated February 1, 2021) | ||
| Gross | ||
0.74% | ||

Call 1-800-225-6292 or visit www.amundi.com/us for the most recent month-end performance results. Current performance may be lower or higher than the performance data quoted.
The performance data quoted represents past performance, which is no guarantee of future results. Investment return and principal value will fluctuate, and shares, when redeemed, may be worth more or less than their original cost.
Class Y shares are not subject to sales charges and are available for limited groups of eligible investors, including institutional investors. All results are historical and assume the reinvestment of dividends and capital gains. Other share classes are available for which performance and expenses will differ.
Performance results reflect any applicable expense waivers in effect during the periods shown. Without such waivers Fund performance would be lower. Waivers may not be in effect for all funds. Certain fee waivers are contractual through a specified period. Otherwise, fee waivers can be rescinded at any time. See the prospectus and financial statements for more information.
The performance table and graph do not reflect the deduction of fees and taxes that a shareowner would pay on Fund distributions or the redemption of Fund shares.
Please refer to the financial highlights for a more current expense ratio.
Pioneer Strategic Income Fund | Semiannual Report | 3/31/21 17
As a shareowner in the Fund, you incur two types of costs:
(1) | ongoing costs, including management fees, distribution and/or service (12b-1) fees, and other Fund expenses; and |
(2) | transaction costs, including sales charges (loads) on purchase payments. |
This example is intended to help you understand your ongoing expenses (in dollars) of investing in the Fund and to compare these costs with the ongoing costs of investing in other mutual funds. The example is based on an investment of $1,000 at the beginning of the Fund’s latest six-month period and held throughout the six months.
Using the Tables
Actual Expenses
The first table below provides information about actual account values and actual expenses. You may use the information in this table, together with the amount you invested, to estimate the expenses that you paid over the period as follows:
(1) | Divide your account value by $1,000 |
Example: an $8,600 account value ÷ $1,000 = 8.6 | |
(2) | Multiply the result in (1) above by the corresponding share class’s number in the third row under the heading entitled “Expenses Paid During Period” to estimate the expenses you paid on your account during this period. |
Expenses Paid on a $1,000 Investment in Pioneer Strategic Income Fund
Based on actual returns from October 1, 2020 through March 31, 2021.
| Share Class | A | C | K | R | Y |
Beginning Account | $1,000.00 | $1,000.00 | $1,000.00 | $1,000.00 | $1,000.00 |
Value on 10/1/20 | |||||
Ending Account Value | $1,045.00 | $1,041.90 | $1,048.10 | $1,043.50 | $1,046.70 |
(after expenses) | |||||
on 3/31/21 | |||||
Expenses Paid | $5.35 | $8.86 | $3.22 | $6.83 | $3.72 |
During Period* |
* | Expenses are equal to the Fund’s annualized expense ratio of 1.05%, 1.74%, 0.63%, 1.34%, and 0.73% for Class A, Class C, Class K, Class R and Class Y respectively, multiplied by the average account value over the period, multiplied by 182/365 (to reflect the one-half year period). |
18 Pioneer Strategic Income Fund | Semiannual Report | 3/31/21
Hypothetical Example for Comparison Purposes
The table below provides information about hypothetical account values and hypothetical expenses based on the Fund’s actual expense ratio and an assumed rate of return of 5% per year before expenses, which is not the Fund’s actual return. The hypothetical account values and expenses may not be used to estimate the actual ending account balance or expenses you paid for the period.
You may use this information to compare the ongoing costs of investing in the Fund and other funds. To do so, compare this 5% hypothetical example with the 5% hypothetical examples that appear in the shareholder reports of the other funds.
Please note that the expenses shown in the tables are meant to highlight your ongoing costs only and do not reflect any transaction costs, such as sales charges (loads) that are charged at the time of the transaction. Therefore, the table below is useful in comparing ongoing costs only and will not help you determine the relative total costs of owning different funds. In addition, if these transaction costs were included, your costs would have been higher.
Expenses Paid on a $1,000 Investment in Pioneer Strategic Income Fund
Based on a hypothetical 5% return per year before expenses, reflecting the period from October 1, 2020 through March 31, 2021.
| Share Class | A | C | K | R | Y |
Beginning Account | $1,000.00 | $1,000.00 | $1,000.00 | $1,000.00 | $1,000.00 |
Value on 10/1/20 | |||||
Ending Account Value | $1,019.70 | $1,016.26 | $1,021.79 | $1,018.25 | $1,021.29 |
(after expenses) | |||||
on 3/31/21 | |||||
Expenses Paid | $5.29 | $8.75 | $3.18 | $6.74 | $3.68 |
During Period* |
* | Expenses are equal to the Fund’s annualized expense ratio of 1.05%, 1.74%, 0.63%, 1.34%, and 0.73% for Class A, Class C, Class K, Class R and Class Y respectively, multiplied by the average account value over the period, multiplied by 182/365 (to reflect the one-half year period). |
Pioneer Strategic Income Fund | Semiannual Report | 3/31/21 19
(unaudited)
| Shares | Value | ||
| UNAFFILIATED ISSUERS — 101.0% | |||
| COMMON STOCKS — 0.0%† of Net Assets | |||
| Auto Components — 0.0%† | |||
| 1,316 | Lear Corp. | $ 238,525 | |
| Total Auto Components | $ 238,525 | ||
| Household Durables — 0.0%† | |||
| 1,018,282(a) | Desarrolladora Homex SAB de CV | $ 1,545 | |
| Total Household Durables | $ 1,545 | ||
| Oil, Gas & Consumable Fuels — 0.0%† | |||
| 9,565,478^(a) | Ascent CNR Corp. | $ 286,965 | |
| 2,013 | Frontera Energy Corp. | 10,266 | |
| Total Oil, Gas & Consumable Fuels | $ 297,231 | ||
| Paper & Forest Products — 0.0%† | |||
| 162,828 | Emerald Plantation Holdings, Ltd. | $ 6,513 | |
| Total Paper & Forest Products | $ 6,513 | ||
| Specialty Retail — 0.0%† | |||
| 111,548+^(a) | Targus Cayman SubCo., Ltd. | $ 170,668 | |
| Total Specialty Retail | $ 170,668 | ||
| TOTAL COMMON STOCKS | |||
(Cost $1,215,239) | $ 714,482 | ||
| CONVERTIBLE PREFERRED STOCKS — 2.4% of | |||
| Net Assets | |||
| Banks — 2.4% | |||
| 12,114(b) | Bank of America Corp., 7.25% | $ 16,935,372 | |
| 63,511(b) | Wells Fargo & Co., 7.5% | 90,021,126 | |
| Total Banks | $ 106,956,498 | ||
| TOTAL CONVERTIBLE PREFERRED STOCKS | |||
(Cost $101,849,668) | $ 106,956,498 | ||
| PREFERRED STOCK — 0.1% of Net Assets | |||
| Equity Real Estate Investment Trusts (REITs) — 0.1% | |||
| 3,250(b) | Firstar Realty LLC, 8.875% (144A) | $ 3,461,250 | |
| Total Equity Real Estate Investment Trusts (REITs) | $ 3,461,250 | ||
| TOTAL PREFERRED STOCK | |||
(Cost $4,200,625) | $ 3,461,250 |
The accompanying notes are an integral part of these financial statements.
20 Pioneer Strategic Income Fund | Semiannual Report | 3/31/21
| Principal | |||
| Amount | |||
| USD ($) | Value | ||
| ASSET BACKED SECURITIES — 9.9% of | |||
| Net Assets | |||
| 500,000 | 321 Henderson Receivables III LLC, Series 2008-1A, | ||
| Class C, 9.36%, 1/15/48 (144A) | $ 589,158 | ||
| 500,000 | 321 Henderson Receivables III LLC, Series 2008-1A, | ||
| Class D, 10.81%, 1/15/50 (144A) | 575,270 | ||
| 4,000,000(c) | 522 Funding CLO, Ltd., Series 2019-4A, Class E, 7.224% | ||
| (3 Month USD LIBOR + 700 bps), 4/20/30 (144A) | 3,882,968 | ||
| 6,188,811 | A10 Bridge Asset Financing LLC, Series 2019-B, | ||
| Class A1, 3.085%, 8/15/40 (144A) | 6,242,758 | ||
| 3,500,000 | A10 Bridge Asset Financing LLC, Series 2019-B, Class D, | ||
| 4.523%, 8/15/40 (144A) | 3,471,629 | ||
| 1,164,392 | Accelerated Assets LLC, Series 2018-1, Class B, 4.51%, | ||
| 12/2/33 (144A) | 1,202,458 | ||
| 1,646,027 | Accelerated Assets LLC, Series 2018-1, Class C, 6.65%, | ||
| 12/2/33 (144A) | 1,732,684 | ||
| 568,478 | Access Point Funding I LLC, Series 2017-A, Class B, | ||
| 3.97%, 4/15/29 (144A) | 569,596 | ||
| 1,750,000(c) | AIG CLO, Ltd., Series 2019-2A, Class E, 7.468% (3 Month | ||
| USD LIBOR + 725 bps), 10/25/32 (144A) | 1,715,660 | ||
| 750,000 | Amur Equipment Finance Receivables V LLC, | ||
| Series 2018-1A, Class E, 5.36%, 4/22/24 (144A) | 758,591 | ||
| 899,999 | Amur Equipment Finance Receivables V LLC, | ||
| Series 2018-1A, Class F, 7.3%, 5/20/26 (144A) | 911,678 | ||
| 1,513,000 | Amur Equipment Finance Receivables VI LLC, | ||
| Series 2018-2A, Class E, 5.45%, 11/20/23 (144A) | 1,523,415 | ||
| 3,000,000 | Amur Equipment Finance Receivables VII LLC, | ||
| Series 2019-1A, Class E, 4.47%, 3/20/25 (144A) | 3,010,867 | ||
| 2,000,000(c) | Apidos CLO XXXII, Series 2019-32A, Class E, 6.974% | ||
| (3 Month USD LIBOR + 675 bps), 1/20/33 (144A) | 1,986,754 | ||
| 5,000,000(c) | Assurant CLO, Ltd., Series 2019-5A, Class E, 7.581% | ||
| (3 Month USD LIBOR + 734 bps), 1/15/33 (144A) | 4,995,055 | ||
| 300,000 | Avid Automobile Receivables Trust, Series 2018-1, | ||
| Class C, 5.13%, 2/18/25 (144A) | 300,289 | ||
| 2,040,000 | Avid Automobile Receivables Trust, Series 2019-1, | ||
| Class D, 4.03%, 7/15/26 (144A) | 2,074,495 | ||
| 1,500,000(c) | Battalion CLO VII, Ltd., Series 2014-7A, Class CRR, | ||
| 3.153% (3 Month USD LIBOR + 293 bps), | |||
| 7/17/28 (144A) | 1,500,214 | ||
| 2,000,000(c) | Battalion CLO VII, Ltd., Series 2014-7A, Class ERR, | ||
| 8.803% (3 Month USD LIBOR + 858 bps), | |||
| 7/17/28 (144A) | 1,937,090 | ||
| 3,295,000(c) | Battalion CLO IX, Ltd., Series 2015-9A, Class ER, 6.491% | ||
| (3 Month USD LIBOR + 625 bps), 7/15/31 (144A) | 3,232,659 | ||
| 1,500,000(c) | BDS, Ltd., Series 2020-FL5, Class C, 2.158% (1 Month | ||
| USD LIBOR + 205 bps), 2/16/37 (144A) | 1,498,129 |
The accompanying notes are an integral part of these financial statements.
Pioneer Strategic Income Fund | Semiannual Report | 3/31/21 21
Schedule of Investments | 3/31/21
(unaudited) (continued)
| Principal | ||||
| Amount | ||||
USD ($) | Value | |||
| ASSET BACKED SECURITIES — (continued) | ||||
| 1,600,000(c) | Benefit Street Partners CLO XIX, Ltd., Series 2019-19A, | |||
Class D, 4.041% (3 Month USD LIBOR + | ||||
380 bps), 1/15/33 (144A) | $ 1,605,346 | |||
| 4,000,000(c) | Benefit Street Partners CLO XIX, Ltd., Series 2019-19A, | |||
Class E, 7.261% (3 Month USD LIBOR + | ||||
702 bps), 1/15/33 (144A) | 3,999,816 | |||
| 3,000,000(c) | Carlyle US CLO, Ltd., Series 2019-4A, Class C, 4.241% | |||
(3 Month USD LIBOR + 400 bps), 1/15/33 (144A) | 3,017,460 | |||
| 2,750,000 | Carvana Auto Receivables Trust, Series 2019-4A, Class E, | |||
4.7%, 10/15/26 (144A) | 2,899,803 | |||
| 4,250,000(c) | Catskill Park CLO, Ltd., Series 2017-1A, Class D, 6.224% | |||
(3 Month USD LIBOR + 600 bps), 4/20/29 (144A) | 4,126,401 | |||
| 121,605 | Commonbond Student Loan Trust, Series 2017-BGS, | |||
Class C, 4.44%, 9/25/42 (144A) | 127,221 | |||
| 1,388,087 | Conn’s Receivables Funding LLC, Series 2019-A, Class C, | |||
5.29%, 10/16/23 (144A) | 1,378,048 | |||
| 6,150,000 | Conn’s Receivables Funding LLC, Series 2019-B, Class C, | |||
4.6%, 6/17/24 (144A) | 6,169,444 | |||
| 3,155,000 | Continental Credit Card ABS LLC, Series 2019-1A, | |||
Class C, 6.16%, 8/15/26 (144A) | 3,311,058 | |||
| 1,000,000 | Crossroads Asset Trust, Series 2021-A, Class E, 5.48%, | |||
1/20/28 (144A) | 996,260 | |||
| 2,300,000 | DataBank Issuer, Series 2021-1A, Class C, 4.43%, | |||
2/27/51 (144A) | 2,318,494 | |||
| 3,291,771 | Diamond Resorts Owner Trust, Series 2019-1A, Class C, | |||
4.02%, 2/20/32 (144A) | 3,277,841 | |||
| 21,512 | Drug Royalty III LP 1, Series 2017-1A, Class A2, 3.6%, | |||
4/15/27 (144A) | 21,549 | |||
| 5,000,000(c) | Dryden 78 CLO, Ltd., Series 2020-78A, Class E, 6.823% | |||
(3 Month USD LIBOR + 660 bps), 4/17/33 (144A) | 5,007,405 | |||
| 6,000,000 | ExteNet LLC, Series 2019-1A, Class C, 5.219%, | |||
7/26/49 (144A) | 6,262,339 | |||
| 1,250,000 | Fair Square Issuance Trust, Series 2020-AA, Class C, | |||
5.4%, 9/20/24 (144A) | 1,274,809 | |||
| 4,100,000 | Fair Square Issuance Trust, Series 2020-AA, Class D, | |||
6.86%, 9/20/24 (144A) | 4,175,454 | |||
| 7,913,896 | Finance of America Structured Securities Trust, Series | |||
2019-A, Class JR2, 2.0%, 3/25/69 | 8,497,019 | |||
| 6,989,069 | Finance of America Structured Securities Trust, Series | |||
2019-JR3, Class JR2, 2.0%, 9/25/69 | 7,411,396 | |||
| 2,250,000(c) | First Eagle BSL CLO, Ltd., Series 2019-1A, Class C, | |||
4.574% (3 Month USD LIBOR + 435 bps), 1/20/33 (144A) | 2,257,348 | |||
| 3,000,000(c) | First Eagle BSL CLO, Ltd., Series 2019-1A, Class D, | |||
7.924% (3 Month USD LIBOR + 770 bps), 1/20/33 (144A) | 2,945,517 | |||
| 3,300,000(c) | Fort Washington CLO, Series 2019-1A, Class E, 7.474% | |||
(3 Month USD LIBOR + 725 bps), 10/20/32 (144A) | 3,302,336 | |||
The accompanying notes are an integral part of these financial statements.
22 Pioneer Strategic Income Fund | Semiannual Report | 3/31/21
| Principal | ||||
| Amount | ||||
| USD ($) | Value | |||
| ASSET BACKED SECURITIES — (continued) | ||||
| 5,500,000 | Four Seas LP, Series 2017-1A, Class A2, 5.927%, | |||
8/28/27 (144A) | $ 4,816,480 | |||
| 1,000,000 | Foursight Capital Automobile Receivables Trust, Series | |||
2018-2, Class F, 6.48%, 6/15/26 (144A) | 1,056,185 | |||
| 179,764(d) | Gold Key Resorts LLC, Series 2014-A, Class C, 5.87%, | |||
3/17/31 (144A) | 182,031 | |||
| 5,022,000(c) | Goldentree Loan Management US CLO 2, Ltd., | |||
Series 2017-2A, Class E, 4.924% (3 Month USD LIBOR + | ||||
470 bps), 11/28/30 (144A) | 4,575,675 | |||
| 5,230,000(c) | Goldentree Loan Management US CLO 6, Ltd., | |||
Series 2019-6A, Class D, 4.074% (3 Month USD LIBOR + | ||||
385 bps), 1/20/33 (144A) | 5,279,743 | |||
| 1,250,000(c) | Gulf Stream Meridian 3 Ltd., Series 2021-IIIA, Class D, | |||
6.911% (3 Month USD LIBOR + 675 bps), 4/15/34 (144A) | 1,225,182 | |||
| 3,393,000 | Hardee’s Funding LLC, Series 2018-1A, Class A2II, | |||
4.959%, 6/20/48 (144A) | 3,566,382 | |||
| 3,000,000(c) | Harriman Park CLO, Ltd., Series 2020-1A, Class D, 3.864% | |||
(3 Month USD LIBOR + 364 bps), 4/20/31 (144A) | 3,001,206 | |||
| 2,000,000 | Hertz Fleet Lease Funding LP, Series 2018-1, Class E, | |||
5.55%, 5/10/32 (144A) | 2,021,097 | |||
| 8,526,000 | HOA Funding LLC, Series 2014-1A, Class A2, 4.846%, | |||
8/20/44 (144A) | 8,429,912 | |||
| 707,100 | Home Partners of America Trust, Series 2019-1, Class F, | |||
4.101%, 9/17/39 (144A) | 717,910 | |||
| 2,250,000(c) | ICG US CLO Ltd., Series 2021-1A, Class E, 6.443% | |||
(3 Month USD LIBOR + 633 bps), 4/17/34 (144A) | 2,154,159 | |||
| 3,721,696 | Icon Brand Holdings LLC, Series 2012-1A, Class A, | |||
4.229%, 1/25/43 (144A) | 1,844,264 | |||
| 729,884 | JG Wentworth XXII LLC, Series 2010-3A, Class A, 3.82%, | |||
12/15/48 (144A) | 763,761 | |||
| 5,000,000(c) | Kayne CLO 7, Ltd., Series 2020-7A, Class E, 6.723% | |||
(3 Month USD LIBOR + 650 bps), 4/17/33 (144A) | 5,018,670 | |||
| 5,000,000(c) | Madison Park Funding XXII, Ltd., Series 2016-22A, | |||
Class ER, 6.941% (3 Month USD LIBOR + | ||||
670 bps), 1/15/33 (144A) | 4,940,275 | |||
| 7,000,000(c) | Madison Park Funding XXXVI, Ltd., Series 2019-36A, | |||
Class E, 7.491% (3 Month USD LIBOR + | ||||
725 bps), 1/15/33 (144A) | 7,001,848 | |||
| 1,250,000 | Marlette Funding Trust, Series 2019-1A, Class C, 4.42%, | |||
4/16/29 (144A) | 1,288,678 | |||
| 7,750,000 | Mercury Financial Credit Card Master Trust, Series | |||
2021-1A, Class B, 2.33%, 3/20/26 (144A) | 7,761,465 | |||
| 2,974,557(d) | Mill City Mortgage Loan Trust, Series 2017-3, Class B2, | |||
3.25%, 1/25/61 (144A) | 2,954,206 | |||
| 2,196,686(d) | Mill City Mortgage Loan Trust, Series 2018-2, Class B1, | |||
3.75%, 5/25/58 (144A) | 2,202,918 | |||
The accompanying notes are an integral part of these financial statements.
Pioneer Strategic Income Fund | Semiannual Report | 3/31/21 23
Schedule of Investments | 3/31/21
(unaudited) (continued)
| Principal | |||
| Amount | |||
| USD ($) | Value | ||
| ASSET BACKED SECURITIES — (continued) | |||
| 5,712,821(d) | Mill City Mortgage Loan Trust, Series 2018-3, Class M3, | ||
| 3.25%, 8/25/58 (144A) | $ 5,810,972 | ||
| 4,926,066 | Mosaic Solar Loan Trust, Series 2019-2A, Class D, 6.18%, | ||
| 9/20/40 (144A) | 4,804,207 | ||
| 4,005,000 | Mosaic Solar Loan Trust, Series 2021-1A, Class D, 3.71%, | ||
| 12/20/46 (144A) | 3,930,184 | ||
| 5,829,000(d) | Nationstar HECM Loan Trust, Series 2019-1A, Class M4, | ||
| 5.804%, 6/25/29 (144A) | 5,827,968 | ||
| 5,000,000(c) | Neuberger Berman CLO XVII, Ltd., Series 2014-17A, | ||
| Class ER2, 7.422% (3 Month USD LIBOR + | |||
| 720 bps), 4/22/29 (144A) | 4,932,360 | ||
| 4,500,000(c) | Newark BSL CLO 1, Ltd., Series 2016-1A, Class DR, | ||
6.463% (3 Month USD LIBOR + 625 bps), | |||
| 12/21/29 (144A) | 4,416,548 | ||
| 748,435(c) | Newtek Small Business Loan Trust, Series 2017-1, | ||
| Class B, 3.109% (1 Month USD LIBOR + 300 bps), | |||
| 2/25/43 (144A) | 682,938 | ||
| 4,360,000 | NMEF Funding LLC, Series 2019-A, Class D, 4.39%, | ||
| 8/17/26 (144A) | 4,465,640 | ||
| 1,100,000 | NMEF Funding LLC, Series 2021-A, Class D, 5.78%, | ||
| 12/15/27 (144A) | 1,095,892 | ||
| 2,000,000(c) | Octagon Investment Partners XXI, Ltd., Series 2014-1A, | ||
Class DRR, 7.194% (3 Month USD LIBOR + | |||
| 700 bps), 2/14/31 (144A) | 1,979,560 | ||
| 1,119,000 | Octane Receivables Trust, Series 2020-1A, Class D, | ||
| 5.45%, 3/20/28 (144A) | 1,139,361 | ||
| 3,946,692 | Orange Lake Timeshare Trust, Series 2019-A, Class D, | ||
| 4.93%, 4/9/38 (144A) | 3,987,840 | ||
| 5,600,000(c) | Palmer Square Loan Funding, Ltd., Series 2020-1A, | ||
| Class D, 5.032% (3 Month USD LIBOR + | |||
| 485 bps), 2/20/28 (144A) | 5,349,170 | ||
| 4,300,000 | PG Receivables Finance, Series 2020-1, Class C, 5.44%, | ||
| 7/20/25 (144A) | 4,318,813 | ||
| 4,770,000 | Progress Residential Trust, Series 2018-SFR3, Class F, | ||
| 5.368%, 10/17/35 (144A) | 4,822,151 | ||
| 5,000,000(c) | Race Point VIII CLO, Ltd., Series 2013-8A, Class DR2, | ||
3.682% (3 Month USD LIBOR + 350 bps), 2/20/30 (144A) | 5,000,735 | ||
| 2,200,000 | Republic Finance Issuance Trust, Series 2019-A, Class B, | ||
| 3.93%, 11/22/27 (144A) | 2,247,926 | ||
| 3,000,000 | Republic Finance Issuance Trust, Series 2019-A, Class C, | ||
| 5.1%, 11/22/27 (144A) | 3,037,780 | ||
| 1,500,000 | Rosy, Series 2018-1, Class A1, 6.25%, 12/15/25 (144A) | 1,425,000 | |
| 7,234,468 | SCF Equipment Leasing LLC, Series 2019-1A, Class E, | ||
| 5.49%, 4/20/30 (144A) | 7,090,122 | ||
| 3,107,011 | Sierra Timeshare Receivables Funding LLC, Series | ||
| 2019-1A, Class D, 4.75%, 1/20/36 (144A) | 3,155,872 |
The accompanying notes are an integral part of these financial statements.
24 Pioneer Strategic Income Fund | Semiannual Report | 3/31/21
| Principal | |||
| Amount | |||
| USD ($) | Value | ||
| ASSET BACKED SECURITIES — (continued) | |||
| 2,888,400 | Sierra Timeshare Receivables Funding LLC, | ||
| Series 2020-2A, Class D, 6.59%, 7/20/37 (144A) | $ 3,048,395 | ||
| 4,000,000 | Sierra Timeshare Receivables Funding LLC, | ||
| Series 2021-1A, Class D, 3.17%, 11/20/37 (144A) | 3,997,009 | ||
| 3,500,000(c) | Signal Peak CLO 2 LLC, Series 2015-1A, Class DR2, | ||
3.074% (3 Month USD LIBOR + 285 bps), 4/20/29 (144A) | 3,440,160 | ||
| 5,000,000 | Small Business Lending Trust, Series 2019-A, Class C, | ||
| 4.31%, 7/15/26 (144A) | 4,939,022 | ||
| 4,750,000(c) | Sound Point CLO XXI, Ltd., Series 2018-3A, Class C, | ||
| 3.515% (3 Month USD LIBOR + 330 bps), | |||
| 10/26/31 (144A) | 4,598,998 | ||
| 1,200,000(c) | Sound Point CLO XXV, Ltd., Series 2019-4A, Class D, | ||
| 4.351% (3 Month USD LIBOR + 411 bps), | |||
| 1/15/33 (144A) | 1,207,076 | ||
| 7,000,000(c) | Sound Point CLO XXV, Ltd., Series 2019-4A, Class E, | ||
| 7.861% (3 Month USD LIBOR + 762 bps), | |||
| 1/15/33 (144A) | 7,032,018 | ||
| 3,000,000(c) | Sound Point CLO XXVIII Ltd., Series 2020-3A, Class E, | ||
| 7.155% (3 Month USD LIBOR + 690 bps), | |||
| 1/25/32 (144A) | 2,942,208 | ||
| 2,200,000(c) | Symphony CLO XXII, Ltd., Series 2020-22A, Class C, | ||
| 2.373% (3 Month USD LIBOR + 215 bps), | |||
| 4/18/33 (144A) | 2,186,947 | ||
| 6,600,000(c) | Symphony CLO XXII, Ltd., Series 2020-22A, Class D, | ||
| 3.373% (3 Month USD LIBOR + 315 bps), | |||
| 4/18/33 (144A) | 6,560,169 | ||
| 986,000 | Tidewater Auto Receivables Trust, Series 2018-AA, | ||
| Class E, 5.48%, 10/15/26 (144A) | 1,005,649 | ||
| 11,300,000(d) | Towd Point Mortgage Trust, Series 2015-2, Class 1B3, | ||
| 3.504%, 11/25/60 (144A) | 11,057,890 | ||
| 13,841,000(d) | Towd Point Mortgage Trust, Series 2015-6, Class B1, | ||
| 3.89%, 4/25/55 (144A) | 14,647,984 | ||
| 5,148,000(d) | Towd Point Mortgage Trust, Series 2016-3, Class B1, | ||
| 4.099%, 4/25/56 (144A) | 5,512,347 | ||
| 3,100,000(d) | Towd Point Mortgage Trust, Series 2016-5, Class B2, | ||
| 3.672%, 10/25/56 (144A) | 3,093,723 | ||
| 4,102,000(d) | Towd Point Mortgage Trust, Series 2017-1, Class B2, | ||
| 3.821%, 10/25/56 (144A) | 4,283,773 | ||
| 9,175,000(d) | Towd Point Mortgage Trust, Series 2017-2, Class B2, | ||
| 4.148%, 4/25/57 (144A) | 9,613,951 | ||
| 11,800,000(d) | Towd Point Mortgage Trust, Series 2017-4, Class B1, | ||
| 3.496%, 6/25/57 (144A) | 12,003,950 | ||
| 2,725,000(d) | Towd Point Mortgage Trust, Series 2017-6, Class M2, | ||
| 3.25%, 10/25/57 (144A) | 2,788,089 | ||
| 4,750,000(d) | Towd Point Mortgage Trust, Series 2018-1, Class B1, | ||
| 3.772%, 1/25/58 (144A) | 4,909,999 |
The accompanying notes are an integral part of these financial statements.
Pioneer Strategic Income Fund | Semiannual Report | 3/31/21 25
Schedule of Investments | 3/31/21
(unaudited) (continued)
| Principal | ||||
| Amount | ||||
| USD ($) | Value | |||
| ASSET BACKED SECURITIES — (continued) | ||||
| 8,000,000(d) | Towd Point Mortgage Trust, Series 2018-3, Class M1, | |||
| 3.875%, 5/25/58 (144A) | $ 8,304,774 | |||
| 7,500,000(d) | Towd Point Mortgage Trust, Series 2018-3, Class M2, | |||
| 3.875%, 5/25/58 (144A) | 7,454,237 | |||
| 6,500,000(d) | Towd Point Mortgage Trust, Series 2019-3, Class M2E, | |||
| 3.0%, 2/25/59 (144A) | 6,403,248 | |||
| 5,970,000(d) | Towd Point Mortgage Trust, Series 2019-4, Class B1B, | |||
| 3.5%, 10/25/59 (144A) | 5,719,966 | |||
| 3,750,000(d) | Towd Point Mortgage Trust, Series 2019-4, Class M2B, | |||
| 3.25%, 10/25/59 (144A) | 3,667,548 | |||
| 5,750,000(d) | Towd Point Mortgage Trust, Series 2020-2, Class M1B, | |||
| 3.0%, 4/25/60 (144A) | 5,659,926 | |||
| 2,580,000 | Tricon American Homes Trust, Series 2017-SFR2, | |||
| Class E, 4.216%, 1/17/36 (144A) | 2,648,614 | |||
| 4,250,000 | Tricon American Homes Trust, Series 2020-SFR2, | |||
| Class E1, 2.73%, 11/17/39 (144A) | 4,145,656 | |||
| 2,400,000 | United Auto Credit Securitization Trust, Series 2018-2, | |||
| Class F, 6.82%, 6/10/25 (144A) | 2,401,612 | |||
| 4,250,000 | United Auto Credit Securitization Trust, Series 2019-1, | |||
| Class F, 6.05%, 1/12/26 (144A) | 4,342,154 | |||
| 1,000,000 | Upstart Securitization Trust, Series 2021-1, Class C, | |||
| 4.06%, 3/20/31 (144A) | 997,189 | |||
| 4,975,000(c) | Westcott Park CLO, Ltd., Series 2016-1A, Class ER, | |||
6.624% (3 Month USD LIBOR + 640 bps), 7/20/28 (144A) | 4,925,076 | |||
| 3,039,959 | Westgate Resorts LLC, Series 2018-1A, Class C, 4.1%, | |||
| 12/20/31 (144A) | 3,018,505 | |||
| 3,286,497 | Westgate Resorts LLC, Series 2020-1A, Class C, 6.213%, | |||
| 3/20/34 (144A) | 3,464,764 | |||
| 4,000,000(c) | Whitebox CLO II, Ltd., Series 2020-2A, Class E, 8.092% | |||
| (3 Month USD LIBOR + 785 bps), 10/24/31 (144A) | 3,999,468 | |||
| 568,098 | WRG Debt Funding II LLC, Series 2017-1, Class A, 4.458%, | |||
| 3/15/26 (144A) | 562,795 | |||
| 705,881 | WRG Debt Funding II LLC, Series 2017-1, Class B, 5.926%, | |||
3/15/26 (144A) | 705,930 | |||
| TOTAL ASSET BACKED SECURITIES | ||||
(Cost $445,385,804) | $ 445,707,686 | |||
| COLLATERALIZED MORTGAGE OBLIGATIONS — | ||||
| 14.3% of Net Assets | ||||
| 2,500,000 | American Homes 4 Rent Trust, Series 2014-SFR2, | |||
| Class D, 5.149%, 10/17/36 (144A) | $ 2,696,463 | |||
| 5,000,000 | American Homes 4 Rent Trust, Series 2014-SFR3, | |||
| Class C, 4.596%, 12/17/36 (144A) | 5,351,617 | |||
The accompanying notes are an integral part of these financial statements.
26 Pioneer Strategic Income Fund | Semiannual Report | 3/31/21
| Principal | |||
| Amount | |||
| USD ($) | Value | ||
| COLLATERALIZED MORTGAGE OBLIGATIONS — | |||
| (continued) | |||
| 4,100,000 | American Homes 4 Rent Trust, Series 2014-SFR3, | ||
Class D, 5.04%, 12/17/36 (144A) | $ 4,414,526 | ||
| 2,950,000 | American Homes 4 Rent Trust, Series 2015-SFR1, | ||
Class C, 4.11%, 4/17/52 (144A) | 3,110,604 | ||
| 4,629,000(d) | Angel Oak Mortgage Trust I LLC, Series 2019-1, Class B1, | ||
5.4%, 11/25/48 (144A) | 4,856,307 | ||
| 4,460,000(d) | Angel Oak Mortgage Trust I LLC, Series 2019-2, Class B1, | ||
5.016%, 3/25/49 (144A) | 4,544,935 | ||
| 1,054,000(d) | B2R Mortgage Trust, Series 2015-1, Class D, 4.831%, | ||
5/15/48 (144A) | 1,023,565 | ||
| 4,400,000(d) | Bayview Koitere Fund Trust, Series 2017-SPL3, Class B1, | ||
4.25%, 11/28/53 (144A) | 4,669,290 | ||
| 4,670,000(d) | Bayview Opportunity Master Fund IVa Trust, | ||
Series 2017-SPL5, Class B1, 4.0%, 6/28/57 (144A) | 4,925,421 | ||
| 2,120,000(c) | Bellemeade Re, Ltd., Series 2019-1A, Class B1, 4.109% | ||
(1 Month USD LIBOR + 400 bps), 3/25/29 (144A) | 2,119,996 | ||
| 3,550,000(c) | Bellemeade Re, Ltd., Series 2019-1A, Class M2, 2.809% | ||
(1 Month USD LIBOR + 270 bps), 3/25/29 (144A) | 3,522,234 | ||
| 3,910,000(c) | Bellemeade Re, Ltd., Series 2019-2A, Class B1, 4.209% | ||
(1 Month USD LIBOR + 410 bps), 4/25/29 (144A) | 3,803,218 | ||
| 5,350,000(c) | Bellemeade Re, Ltd., Series 2019-2A, Class M2, 3.209% | ||
(1 Month USD LIBOR + 310 bps), 4/25/29 (144A) | 5,387,388 | ||
| 840,000(c) | Bellemeade Re, Ltd., Series 2020-3A, Class B1, 6.459% | ||
(1 Month USD LIBOR + 635 bps), 10/25/30 (144A) | 860,561 | ||
| 3,630,000(c) | Bellemeade Re, Ltd., Series 2020-3A, Class M2, 4.959% | ||
(1 Month USD LIBOR + 485 bps), 10/25/30 (144A) | 3,741,722 | ||
| 1,450,000(c) | Bellemeade Re, Ltd., Series 2020-4A, Class B1, 5.109% | ||
(1 Month USD LIBOR + 500 bps), 6/25/30 (144A) | 1,474,945 | ||
| 4,350,000(d) | Brean Asset Backed Securities Trust, Series 2021-RM1, | ||
Class A, 1.4%, 10/25/63 (144A) | 4,147,283 | ||
| 3,055,277(d) | Cascade Funding Mortgage Trust, Series 2019-RM3, | ||
Class C, 4.0%, 6/25/69 (144A) | 3,071,040 | ||
| 2,150,000 | Cascade MH Asset Trust, Series 2021-MH1, Class B1, | ||
4.573%, 2/25/46 (144A) | 2,125,836 | ||
| 4,000,000(d) | Cascade MH Asset Trust, Series 2021-MH1, Class B3, | ||
7.595%, 2/25/46 (144A) | 3,576,694 | ||
| 1,000,000(d) | CFMT LLC, Series 2021-HB5, Class M4, 5.683%, | ||
2/25/31 (144A) | 993,363 | ||
| 9,507,417(c) | Chase Mortgage Finance Corp., Series 2020-CL1, | ||
Class M3, 3.459% (1 Month USD LIBOR + 335 bps), | |||
10/25/57 (144A) | 9,731,188 | ||
| 6,000,000(d) | CIM Trust, Series 2019-R5, Class M3, 3.5%, | ||
9/25/59 (144A) | 6,121,318 | ||
| 4,100,000(d) | CIM Trust, Series 2020-R2, Class M3, 3.0%, | ||
10/25/59 (144A) | 3,995,073 |
The accompanying notes are an integral part of these financial statements.
Pioneer Strategic Income Fund | Semiannual Report | 3/31/21 27
Schedule of Investments | 3/31/21
(unaudited) (continued)
| Principal | |||
| Amount | |||
| USD ($) | Value | ||
| COLLATERALIZED MORTGAGE OBLIGATIONS — | |||
| (continued) | |||
| 4,000,000(e) | Colony American Finance, Ltd., Series 2016-1, Class D, | ||
5.972%, 6/15/48 (144A) | $ 4,097,982 | ||
| 4,100,000(c) | Connecticut Avenue Securities Trust, Series 2019-HRP1, | ||
Class B1, 9.359% (1 Month USD LIBOR + | |||
925 bps), 11/25/39 (144A) | 4,110,298 | ||
| 4,240,000(c) | Connecticut Avenue Securities Trust, Series 2019-R03, | ||
Class 1B1, 4.209% (1 Month USD LIBOR + | |||
410 bps), 9/25/31 (144A) | 4,298,409 | ||
| 3,920,000(c) | Connecticut Avenue Securities Trust, Series 2020-SBT1, | ||
Class 1M2, 3.759% (1 Month USD LIBOR + | |||
365 bps), 2/25/40 (144A) | 3,924,869 | ||
| 4,940,000(c) | Connecticut Avenue Securities Trust, Series 2020-SBT1, | ||
Class 2M2, 3.759% (1 Month USD LIBOR + | |||
365 bps), 2/25/40 (144A) | 4,962,329 | ||
| 779,097(d) | CSFB Mortgage-Backed Pass-Through Certificates, | ||
Series 2003-17, Class B1, 5.5%, 6/25/33 | 349,318 | ||
| 8,493,203(d) | CSMC Trust, Series 2018-J1, Class B3, 3.629%, 2/25/48 | ||
(144A) | 8,458,866 | ||
| 2,638,958(d) | CSMC Trust, Series 2021-RPL2, Class M3, 3.524%, | ||
1/25/60 (144A) | 2,618,126 | ||
| 11,200,000(c) | Eagle Re, Ltd., Series 2019-1, Class B1, 4.609% (1 Month | ||
USD LIBOR + 450 bps), 4/25/29 (144A) | 11,190,944 | ||
| 8,922,000(c) | Eagle Re, Ltd., Series 2020-2, Class B1, 7.109% (1 Month | ||
USD LIBOR + 700 bps), 10/25/30 (144A) | 8,951,389 | ||
| 4,420,000(c) | Fannie Mae Connecticut Avenue Securities, Series | ||
2018-C03, Class 1B1, 3.859% (1 Month USD LIBOR + | |||
375 bps), 10/25/30 | 4,475,052 | ||
| 13,933,130(c)(f) | Federal Home Loan Mortgage Corp. REMICS, Series | ||
4087, Class SB, 5.924% (1 Month USD LIBOR + | |||
603 bps), 7/15/42 | 2,867,940 | ||
| 7,774,824(c)(f) | Federal Home Loan Mortgage Corp. REMICS, Series | ||
4091, Class SH, 6.444% (1 Month USD LIBOR + | |||
655 bps), 8/15/42 | 1,629,664 | ||
| 513,808 | Federal National Mortgage Association REMICs, Series | ||
2009-36, Class HX, 4.5%, 6/25/29 | 542,017 | ||
| 5,699,124(c)(f) | Federal National Mortgage Association REMICs, Series | ||
2012-14, Class SP, 6.441% (1 Month USD LIBOR | |||
+ 655 bps), 8/25/41 | 860,901 | ||
| 4,507,764(c)(f) | Federal National Mortgage Association REMICs, Series | ||
2018-43, Class SM, 6.091% (1 Month USD LIBOR | |||
+ 620 bps), 6/25/48 | 786,731 | ||
| 6,560,653(c)(f) | Federal National Mortgage Association REMICs, Series | ||
2019-33, Class S, 5.941% (1 Month USD LIBOR + | |||
605 bps), 7/25/49 | 1,239,071 | ||
| 4,860,812(c)(f) | Federal National Mortgage Association REMICs, Series | ||
2019-41, Class PS, 5.941% (1 Month USD LIBOR | |||
+ 605 bps), 8/25/49 | 673,459 |
The accompanying notes are an integral part of these financial statements.
28 Pioneer Strategic Income Fund | Semiannual Report | 3/31/21
| Principal | |||
| Amount | |||
| USD ($) | Value | ||
| COLLATERALIZED MORTGAGE OBLIGATIONS — | |||
| (continued) | |||
| 4,373,248(c)(f) | Federal National Mortgage Association REMICs, Series | ||
2019-41, Class SM, 5.941% (1 Month USD LIBOR | |||
+ 605 bps), 8/25/49 | $ 717,892 | ||
| 8,375,415 | Finance of America Structured Securities Trust, Series | ||
2018-A, Class JR2, 1.646%, 12/26/68 (144A) | 8,916,255 | ||
| 9,904,488 | Finance of America Structured Securities Trust, Series | ||
2019-JR2, 2.0%, 6/25/69 (144A) | 10,657,716 | ||
| 10,390,953 | Finance of America Structured Securities Trust, Series | ||
2019-JR4, Class JR2, 2.0%, 11/25/69 (144A) | 10,730,164 | ||
| 7,374,308 | Finance of America Structured Securities Trust, Series | ||
2020-JR2, Class JR2, 0.0%, 5/25/50 (144A) | 7,538,940 | ||
| 1,500,000(c) | Freddie Mac Stacr, Series 2019-HQA3, Class B1, 3.109% | ||
(1 Month USD LIBOR + 300 bps), 9/25/49 (144A) | 1,473,507 | ||
| 3,900,000(c) | Freddie Mac Stacr Remic Trust, Series 2020-DNA2, | ||
Class B1, 2.609% (1 Month USD LIBOR + | |||
250 bps), 2/25/50 (144A) | 3,803,069 | ||
| 2,930,000(c) | Freddie Mac Stacr Remic Trust, Series 2020-DNA3, | ||
Class B1, 5.209% (1 Month USD LIBOR + | |||
510 bps), 6/25/50 (144A) | 3,023,151 | ||
| 6,630,000(c) | Freddie Mac Stacr Remic Trust, Series 2020-DNA4, | ||
Class B1, 6.109% (1 Month USD LIBOR + | |||
600 bps), 8/25/50 (144A) | 6,978,284 | ||
| 4,120,000(c) | Freddie Mac Stacr Remic Trust, Series 2020-DNA4, | ||
Class B2, 10.109% (1 Month USD LIBOR + | |||
1,000 bps), 8/25/50 (144A) | 4,791,016 | ||
| 4,510,000(c) | Freddie Mac Stacr Remic Trust, Series 2020-DNA5, | ||
Class B1, 4.817% (SOFR30A + | |||
480 bps), 10/25/50 (144A) | 4,682,065 | ||
| 7,060,000(c) | Freddie Mac Stacr Remic Trust, Series 2020-DNA5, | ||
Class B2, 11.517% (SOFR30A + | |||
1,150 bps), 10/25/50 (144A) | 8,401,930 | ||
| 2,910,000(c) | Freddie Mac Stacr Remic Trust, Series 2020-DNA6, | ||
Class B1, 3.017% (SOFR30A + | |||
300 bps), 12/25/50 (144A) | 2,864,704 | ||
| 2,630,000(c) | Freddie Mac Stacr Remic Trust, Series 2020-DNA6, | ||
Class B2, 5.667% (SOFR30A + | |||
565 bps), 12/25/50 (144A) | 2,551,066 | ||
| 6,060,000(c) | Freddie Mac Stacr Remic Trust, Series 2020-HQA2, | ||
Class M2, 3.209% (1 Month USD LIBOR + | |||
310 bps), 3/25/50 (144A) | 6,128,058 | ||
| 2,670,000(c) | Freddie Mac Stacr Remic Trust, Series 2020-HQA3, | ||
Class B2, 10.109% (1 Month USD LIBOR + | |||
1,000 bps), 7/25/50 (144A) | 3,021,701 | ||
| 3,190,000(c) | Freddie Mac Stacr Remic Trust, Series 2020-HQA4, | ||
Class B1, 5.359% (1 Month USD LIBOR + | |||
525 bps), 9/25/50 (144A) | 3,317,667 |
The accompanying notes are an integral part of these financial statements.
Pioneer Strategic Income Fund | Semiannual Report | 3/31/21 29
Schedule of Investments | 3/31/21
(unaudited) (continued)
| Principal | |||
| Amount | |||
| USD ($) | Value | ||
| COLLATERALIZED MORTGAGE OBLIGATIONS — | |||
| (continued) | |||
| 2,650,000(c) | Freddie Mac Stacr Remic Trust, Series 2020-HQA4, | ||
Class B2, 9.509% (1 Month USD LIBOR + | |||
940 bps), 9/25/50 (144A) | $ 2,940,722 | ||
| 7,950,000(c) | Freddie Mac Stacr Remic Trust, Series 2021-DNA1, | ||
Class B1, 2.667% (SOFR30A + | |||
265 bps), 1/25/51 (144A) | 7,612,135 | ||
| 7,700,000(c) | Freddie Mac Stacr Remic Trust, Series 2021-DNA1, | ||
Class B2, 4.767% (SOFR30A + | |||
475 bps), 1/25/51 (144A) | 7,185,698 | ||
| 7,500,000(c) | Freddie Mac Stacr Remic Trust, Series 2021-HQA1, | ||
Class B2, 5.017% (SOFR30A + | |||
500 bps), 8/25/33 (144A) | 7,051,760 | ||
| 4,580,000(c) | Freddie Mac Stacr Trust, Series 2018-HQA2, Class M2, | ||
2.409% (1 Month USD LIBOR + 230 bps), | |||
10/25/48 (144A) | 4,579,997 | ||
| 8,080,000(c) | Freddie Mac Stacr Trust, Series 2019-DNA2, Class B2, | ||
10.609% (1 Month USD LIBOR + | |||
1,050 bps), 3/25/49 (144A) | 9,074,402 | ||
| 3,000,000(c) | Freddie Mac Stacr Trust, Series 2019-HQA1, Class B1, | ||
4.509% (1 Month USD LIBOR + 440 bps), | |||
2/25/49 (144A) | 3,071,220 | ||
| 6,700,000(c) | Freddie Mac Stacr Trust, Series 2019-HQA1, Class B2, | ||
12.359% (1 Month USD LIBOR + | |||
1,225 bps), 2/25/49 (144A) | 7,727,712 | ||
| 5,530,748(c) | Freddie Mac Stacr Trust, Series 2019-HQA1, Class M2, | ||
2.459% (1 Month USD LIBOR + 235 bps), | |||
2/25/49 (144A) | 5,540,303 | ||
| 3,740,000(c) | Freddie Mac Stacr Trust, Series 2019-HQA2, Class B1, | ||
4.209% (1 Month USD LIBOR + 410 bps), | |||
4/25/49 (144A) | 3,791,504 | ||
| 2,880,000(c) | Freddie Mac Stacr Trust, Series 2019-HQA2, Class B2, | ||
11.359% (1 Month USD LIBOR + | |||
1,125 bps), 4/25/49 (144A) | 3,224,249 | ||
| 1,561,603(c) | Freddie Mac Stacr Trust, Series 2019-HQA2, Class M2, | ||
2.159% (1 Month USD LIBOR + 205 bps), | |||
4/25/49 (144A) | 1,557,694 | ||
| 5,510,000(c) | Freddie Mac Stacr Trust, Series 2019-HRP1, Class B1, | ||
4.159% (1 Month USD LIBOR + 405 bps), | |||
2/25/49 (144A) | 5,503,986 | ||
| 3,630,000(c) | Freddie Mac Structured Agency Credit Risk Debt Notes, | ||
Series 2017-HRP1, Class B1D, 2.609% (1 Month USD | |||
LIBOR + 250 bps), 12/25/42 | 3,428,599 | ||
| 5,750,000(c) | Freddie Mac Structured Agency Credit Risk Debt Notes, | ||
Series 2020-HQA5, Class B1, 4.017% (SOFR30A + | |||
400 bps), 11/25/50 (144A) | 5,886,759 |
The accompanying notes are an integral part of these financial statements.
30 Pioneer Strategic Income Fund | Semiannual Report | 3/31/21
| Principal | |||
| Amount | |||
| USD ($) | Value | ||
| COLLATERALIZED MORTGAGE OBLIGATIONS — | |||
| (continued) | |||
| 6,250,000(c) | Freddie Mac Structured Agency Credit Risk Debt Notes, | ||
Series 2020-HQA5, Class B2, 7.417% (SOFR30A + | |||
740 bps), 11/25/50 (144A) | $ 6,810,701 | ||
| 6,980,000(c) | Freddie Mac Structured Agency Credit Risk Debt Notes, | ||
Series 2021-DNA2, Class B1, 3.417% (SOFR30A + | |||
340 bps), 8/25/33 (144A) | 6,910,203 | ||
| 4,490,000(d) | GCAT Trust, Series 2019-RPL1, Class B1, 3.75%, | ||
10/25/68 (144A) | 4,321,172 | ||
| 171,915 | Global Mortgage Securitization, Ltd., Series 2004-A, | ||
Class B2, 5.25%, 11/25/32 (144A) | 4,266 | ||
| 1,975,115 | Government National Mortgage Association, | ||
Series 2009-83, Class EB, 4.5%, 9/20/39 | 2,223,788 | ||
| 854,472 | Government National Mortgage Association, | ||
Series 2012-130, Class PA, 3.0%, 4/20/41 | 872,501 | ||
| 15,451,517(c)(f) | Government National Mortgage Association, | ||
Series 2019-90, Class SA, 3.189% (1 Month USD | |||
LIBOR + 330 bps), 7/20/49 | 1,249,563 | ||
| 3,841,812(c)(f) | Government National Mortgage Association, | ||
Series 2019-103, Class SB, 5.939% (1 Month USD | |||
LIBOR + 605 bps), 8/20/49 | 713,489 | ||
| 28,463,657(f) | Government National Mortgage Association, | ||
Series 2019-110, Class PI, 3.5%, 9/20/49 | 2,547,973 | ||
| 33,268,646(c)(f) | Government National Mortgage Association, | ||
Series 2019-117, Class SB, 3.309% (1 Month USD | |||
LIBOR + 342 bps), 9/20/49 | 2,784,120 | ||
| 33,278,867(c)(f) | Government National Mortgage Association, | ||
Series 2019-121, Class SA, 3.239% (1 Month USD | |||
LIBOR + 335 bps), 10/20/49 | 3,056,983 | ||
| 48,487,376(f) | Government National Mortgage Association, | ||
Series 2019-128, Class IB, 3.5%, 10/20/49 | 6,806,459 | ||
| 69,827,896(f) | Government National Mortgage Association, | ||
Series 2019-128, Class ID, 3.5%, 10/20/49 | 6,333,663 | ||
| 21,051,557(f) | Government National Mortgage Association, | ||
Series 2019-159, Class CI, 3.5%, 12/20/49 | 2,930,442 | ||
| 8,386,472(f) | Government National Mortgage Association, | ||
Series 2020-7, Class CI, 3.5%, 1/20/50 | 1,311,848 | ||
| 26,469,489(c)(f) | Government National Mortgage Association, | ||
Series 2020-9, Class SA, 3.239% (1 Month USD | |||
LIBOR + 335 bps), 1/20/50 | 2,167,163 | ||
| 3,368,179(f) | Government National Mortgage Association, | ||
Series 2020-15, Class IM, 3.5%, 2/20/50 | 537,831 | ||
| 2,473,381(d) | GS Mortage-Backed Securities Trust, | ||
Series 2020-PJ1, Class B1, 3.701%, 5/25/50 (144A) | 2,615,320 | ||
| 2,927,078(d) | GS Mortage-Backed Securities Trust, | ||
Series 2020-PJ1, Class B2, 3.701%, 5/25/50 (144A) | 3,012,181 |
The accompanying notes are an integral part of these financial statements.
Pioneer Strategic Income Fund | Semiannual Report | 3/31/21 31
Schedule of Investments | 3/31/21
(unaudited) (continued)
| Principal | |||
| Amount | |||
| USD ($) | Value | ||
| COLLATERALIZED MORTGAGE OBLIGATIONS — | |||
| (continued) | |||
| 1,908,213(d) | GS Mortgage-Backed Securities Corp. Trust, | ||
| Series 2019-PJ1, Class B2, 4.309%, 8/25/49 (144A) | $ 1,934,795 | ||
| 2,509,833(d) | GS Mortgage-Backed Securities Corp. Trust, | ||
| Series 2019-PJ3, Class B4, 4.096%, 3/25/50 (144A) | 2,606,144 | ||
| 1,490,000(d) | GS Mortgage-Backed Securities Corp. Trust, | ||
| Series 2019-PJ3, Class B5, 4.096%, 3/25/50 (144A) | 1,393,537 | ||
| 3,458,673(d) | GS Mortgage-Backed Securities Corp. Trust, | ||
| Series 2021-PJ1, Class A4, 2.5%, 6/25/51 (144A) | 3,483,696 | ||
| 5,500,000(d) | GS Mortgage-Backed Securities Corp. Trust, | ||
| Series 2021-RPL1, Class M1, 2.25%, 12/25/60 (144A) | 5,232,443 | ||
| 4,321,039(d) | GS Mortgage-Backed Securities Trust, Series 2021-PJ2, | ||
| Class A4, 2.5%, 7/25/51 (144A) | 4,349,854 | ||
| 1,700,000(c) | Home Partners of America Trust, Series 2017-1, Class E, | ||
| 2.758% (1 Month USD LIBOR + 265 bps), 7/17/34 (144A) | 1,701,909 | ||
| 1,220,000(c) | Home Re, Ltd., Series 2020-1, Class B1, 7.109% (1 Month | ||
| USD LIBOR + 700 bps), 10/25/30 (144A) | 1,281,983 | ||
| 2,870,000(c) | Home Re, Ltd., Series 2020-1, Class M2, 5.359% (1 Month | ||
| USD LIBOR + 525 bps), 10/25/30 (144A) | 2,962,204 | ||
| 2,403,310(d) | JP Morgan Mortgage Trust, Series 2014-1, Class B4, | ||
| 3.704%, 1/25/44 (144A) | 2,459,424 | ||
| 3,582,778(d) | JP Morgan Mortgage Trust, Series 2019-2, Class B4, | ||
| 4.624%, 8/25/49 (144A) | 3,632,431 | ||
| 7,610,364(d) | JP Morgan Mortgage Trust, Series 2019-LTV3, Class B2, | ||
| 4.542%, 3/25/50 (144A) | 7,871,180 | ||
| 3,917,346(d) | JP Morgan Mortgage Trust, Series 2020-3, Class B1A, | ||
| 3.049%, 8/25/50 (144A) | 4,052,015 | ||
| 5,883,509(d) | JP Morgan Mortgage Trust, Series 2020-LTV1, Class B4, | ||
| 4.399%, 6/25/50 (144A) | 6,077,353 | ||
| 6,612,539(d) | JP Morgan Mortgage Trust, Series 2021-1, Class A15, | ||
| 2.5%, 6/25/51 (144A) | 6,671,430 | ||
| 7,861,574(d) | JP Morgan Mortgage Trust, Series 2021-1, Class A3, | ||
| 2.5%, 6/25/51 (144A) | 7,951,243 | ||
| 15,000,000 | JP Morgan Mortgage Trust, Series 2021-4, Class A15, | ||
| 2.5%, 8/25/51 | 15,128,906 | ||
| 2,000,000 | JP Morgan Mortgage Trust, Series 2021-4, Class A3, | ||
| 2.5%, 8/25/51 | 2,030,938 | ||
| 14,830,158(d) | JP Morgan Mortgage Trust, Series 2021-3, Class A15, | ||
| 2.5%, 7/1/51 (144A) | 14,980,773 | ||
| 3,456,240(c) | JP Morgan Wealth Management, Series 2021-CL1, Class | ||
| M3, 1.817% (SOFR30A + 180 bps), 3/25/51 (144A) | 3,456,238 | ||
| 1,557,742(c) | JP Morgan Wealth Management, Series 2021-CL1, Class | ||
| M4, 2.767% (SOFR30A + 275 bps), 3/25/51 (144A) | 1,557,740 | ||
| 1,340,207 | La Hipotecaria El Salvadorian Mortgage Trust, Series | ||
| 2016-1A, Class A, 3.358%, 1/15/46 (144A) | 1,433,183 |
The accompanying notes are an integral part of these financial statements.
32 Pioneer Strategic Income Fund | Semiannual Report | 3/31/21
| Principal | |||
| Amount | |||
| USD ($) | Value | ||
| COLLATERALIZED MORTGAGE OBLIGATIONS — | |||
| (continued) | |||
| 2,399,453 | La Hipotecaria Mortgage Trust, Series 2019-2A, | ||
Class BBB, 4.75%, 9/29/46 (144A) | $ 2,459,439 | ||
| 479,112(c) | La Hipotecaria Panamanian Mortgage Trust, | ||
Series 2010-1GA, Class A, 2.75% (Panamanian | |||
Mortgage Reference Rate + -300 bps), 9/8/39 (144A) | 494,683 | ||
| 6,145,000(d) | Mill City Mortgage Loan Trust, Series 2019-GS1, | ||
Class M3, 3.25%, 7/25/59 (144A) | 6,205,988 | ||
| 9,496,000(d) | Mill City Mortgage Loan Trust, Series 2019-GS2, | ||
Class M3, 3.25%, 8/25/59 (144A) | 9,538,796 | ||
| 2,558,489(d) | Morgan Stanley Residential Mortgage Loan Trust | ||
2014-1, Series 2020-1, Class B3, 3.065%, | |||
12/25/50 (144A) | 2,289,684 | ||
| 4,809,574(c) | New Residential Mortgage Loan Trust, Series 2018-4A, | ||
Class B1, 1.159% (1 Month USD LIBOR + 105 bps), | |||
1/25/48 (144A) | 4,699,094 | ||
| 8,400,000(d) | New Residential Mortgage Loan Trust, Series | ||
2019-RPL2, Class M2, 3.75%, 2/25/59 (144A) | 8,575,943 | ||
| 20,603,950(d) | New Residential Mortgage Loan Trust, Series | ||
2020-RPL1, Class B1, 3.913%, 11/25/59 (144A) | 19,651,909 | ||
| 6,500,000(d) | New Residential Mortgage Loan Trust, Series | ||
2020-RPL1, Class M2, 3.5%, 11/25/59 (144A) | 6,538,214 | ||
| 1,000,000(c) | Oaktown Re II, Ltd., Series 2018-1A, Class B1, 4.159% | ||
(1 Month USD LIBOR + 405 bps), 7/25/28 (144A) | 998,126 | ||
| 4,070,000(c) | Oaktown Re II, Ltd., Series 2018-1A, Class M2, 2.959% | ||
(1 Month USD LIBOR + 285 bps), 7/25/28 (144A) | 4,099,876 | ||
| 2,630,000(c) | Oaktown Re V, Ltd., Series 2020-2A, Class M2, 5.359% | ||
(1 Month USD LIBOR + 525 bps), 10/25/30 (144A) | 2,679,683 | ||
| 3,174,088(d) | Provident Funding Mortgage Trust, Series 2020-1, | ||
Class B1, 3.309%, 2/25/50 (144A) | 3,226,140 | ||
| 4,400,000(d) | Provident Funding Mortgage Trust, Series 2021-1, | ||
Class A5, 2.5%, 4/25/51 (144A) | 4,413,750 | ||
| 3,000,000(d) | Provident Funding Mortgage Trust, Series 2021-1, | ||
Class B1, 2.376%, 4/25/51 (144A) | 2,888,445 | ||
| 3,470,000(c) | Radnor Re, Ltd., Series 2019-1, Class B1, 4.559% | ||
(1 Month USD LIBOR + 445 bps), 2/25/29 (144A) | 3,491,071 | ||
| 870,000(c) | Radnor Re, Ltd., Series 2020-2, Class B1, 7.709% | ||
(1 Month USD LIBOR + 760 bps), 10/25/30 (144A) | 888,210 | ||
| 2,540,000(c) | Radnor Re, Ltd., Series 2020-2, Class M1C, 4.709% | ||
(1 Month USD LIBOR + 460 bps), 10/25/30 (144A) | 2,588,099 | ||
| 2,909 | RALI Trust, Series 2003-QS14, Class A1, 5.0%, 7/25/18 | 2,618 | |
| 1,185,000(d) | RMF Buyout Issuance Trust, Series 2020-1, Class M5, | ||
6.0%, 2/25/30 (144A) | 1,151,378 | ||
| 2,596,850(d) | Sequoia Mortgage Trust, Series 2013-2, Class B4, | ||
3.644%, 2/25/43 | 2,624,910 |
The accompanying notes are an integral part of these financial statements.
Pioneer Strategic Income Fund | Semiannual Report | 3/31/21 33
Schedule of Investments | 3/31/21
(unaudited) (continued)
| Principal | |||
| Amount | |||
| USD ($) | Value | ||
| COLLATERALIZED MORTGAGE OBLIGATIONS — | |||
| (continued) | |||
| 6,689,261(d) | Sequoia Mortgage Trust, Series 2018-CH4, Class B1B, | ||
| 5.033%, 10/25/48 (144A) | $ 6,892,689 | ||
| 3,235,800(d) | Sequoia Mortgage Trust, Series 2021-1, Class B3, | ||
| 2.673%, 3/25/51 (144A) | 3,116,810 | ||
| 1,219,000(d) | Sequoia Mortgage Trust, Series 2021-2, Class B4, | ||
| 2.558%, 4/25/51 (144A) | 872,109 | ||
| 4,541,885(c) | STACR Trust, Series 2018-DNA3, Class B1, 4.009% | ||
| (1 Month USD LIBOR + 390 bps), 9/25/48 (144A) | 4,610,129 | ||
| 4,550,000(c) | STACR Trust, Series 2018-HRP2, Class B1, 4.309% | ||
| (1 Month USD LIBOR + 420 bps), 2/25/47 (144A) | 4,627,895 | ||
| 5,000,000(d) | Towd Point HE Trust HE1, Series 2021-HE1, Class M2, | ||
| 2.5%, 2/25/63 (144A) | 5,038,139 | ||
| 15,100,000(d) | Towd Point Mortgage Trust, Series 2019-4, Class M1, | ||
| 3.5%, 10/25/59 (144A) | 15,518,836 | ||
| 830,000(c) | Traingle Re, Ltd., Series 2020-1, Class B1, 7.859% | ||
| (1 Month USD LIBOR + 775 bps), 10/25/30 (144A) | 855,197 | ||
| 2,290,000(c) | Traingle Re, Ltd., Series 2020-1, Class M2, 5.709% | ||
| (1 Month USD LIBOR + 560 bps), 10/25/30 (144A) | 2,359,586 | ||
| 1,830,000(c) | Traingle Re, Ltd., Series 2021-1, Class B1, 4.607% | ||
| (1 Month USD LIBOR + 450 bps), 8/25/33 (144A) | 1,829,995 | ||
| 3,370,000(c) | Traingle Re, Ltd., Series 2021-1, Class M1C, 3.507% | ||
| (1 Month USD LIBOR + 340 bps), 8/25/33 (144A) | 3,369,995 | ||
| 11,400,000(c) | Traingle Re, Ltd., Series 2021-1, Class M2, 4.007% | ||
| (1 Month USD LIBOR + 390 bps), 8/25/33 (144A) | 11,399,978 | ||
| 1,200,000(d) | Verus Securitization Trust, Series 2020-2, Class B1, | ||
| 5.36%, 5/25/60 (144A) | 1,257,324 | ||
| 250,000(d) | Verus Securitization Trust, Series 2020-INV1, Class B1, | ||
| 5.75%, 3/25/60 (144A) | 260,275 | ||
| 340,000(d) | Verus Securitization Trust, Series 2020-INV1, Class B2, | ||
| 6.0%, 3/25/60 (144A) | 345,982 | ||
| 800,000(d) | Visio Trust, Series 2019-2, Class B1, 3.91%, | ||
| 11/25/54 (144A) | 791,322 | ||
| 1,467,677(d) | Wells Fargo Mortgage Backed Securities, Series 2020-4, | ||
| Class B3, 3.256%, 7/25/50 (144A) | 1,329,073 | ||
| 1,356,636(d) | WinWater Mortgage Loan Trust, Series 2015-2, Class B4, | ||
3.91%, 2/20/45 (144A) | 1,398,519 | ||
| TOTAL COLLATERALIZED MORTGAGE OBLIGATIONS | |||
(Cost $656,154,408) | $ 638,914,871 | ||
| COMMERCIAL MORTGAGE-BACKED | |||
| SECURITIES — 6.6% of Net Assets | |||
| 5,800,000(c) | Alen Mortgage Trust, Series 2021-ACEN, Class E, 4.106% | ||
| (1 Month USD LIBOR + 400 bps), 4/15/34 (144A) | $ 5,801,731 | ||
| 7,686,294(e)(f) | Bayview Commercial Asset Trust, Series 2007-2A, | ||
| Class IO, 0.0%, 7/25/37 (144A) | 1 |
The accompanying notes are an integral part of these financial statements.
34 Pioneer Strategic Income Fund | Semiannual Report | 3/31/21
| Principal | |||
| Amount | |||
| USD ($) | Value | ||
| COMMERCIAL MORTGAGE-BACKED | |||
| SECURITIES — (continued) | |||
| 4,500,000 | Benchmark Mortgage Trust, Series 2018-B5, Class A3, | ||
3.944%, 7/15/51 | $ 5,023,796 | ||
| 2,025,000(d) | Benchmark Mortgage Trust, Series 2020-IG3, Class B, | ||
3.289%, 9/15/48 (144A) | 2,081,064 | ||
| 5,000,000(c) | BTH-13 Mortgage Backed Securities Trust, | ||
Series 2018-13, Class A, 2.62% (1 Month USD LIBOR + | |||
250 bps), 8/18/21 (144A) | 4,991,761 | ||
| 3,810,000 | CD Mortgage Trust, Series 2018-CD7, Class A3, | ||
4.013%, 8/15/51 | 4,251,129 | ||
| 4,250,000 | CFCRE Commercial Mortgage Trust, Series 2016-C3, | ||
Class A2, 3.597%, 1/10/48 | 4,615,220 | ||
| 2,500,000 | CFCRE Commercial Mortgage Trust, Series 2018-TAN, | ||
Class D, 6.099%, 2/15/33 (144A) | 2,606,874 | ||
| 719,000(c) | CGDB Commercial Mortgage Trust, Series 2019-MOB, | ||
Class E, 2.106% (1 Month USD LIBOR + | |||
200 bps), 11/15/36 (144A) | 711,788 | ||
| 1,500,000(c) | CGDB Commercial Mortgage Trust, Series 2019-MOB, | ||
Class F, 2.656% (1 Month USD LIBOR + | |||
255 bps), 11/15/36 (144A) | 1,477,482 | ||
| 3,700,000(c) | CGDB Commercial Mortgage Trust, Series 2019-MOB, | ||
Class G, 3.098% (1 Month USD LIBOR + | |||
299 bps), 11/15/36 (144A) | 3,542,636 | ||
| 9,593,083(c) | CHC Commercial Mortgage Trust, Series 2019-CHC, | ||
Class E, 2.456% (1 Month USD LIBOR + 235 bps), | |||
6/15/34 (144A) | 9,233,388 | ||
| 1,750,000(d) | Citigroup Commercial Mortgage Trust, Series 2017-P8, | ||
Class C, 4.267%, 9/15/50 | 1,868,009 | ||
| 3,500,000 | Citigroup Commercial Mortgage Trust, Series 2018-B2, | ||
Class A3, 3.744%, 3/10/51 | 3,816,807 | ||
| 2,470,000(c) | CLNY Trust, Series 2019-IKPR, Class E, 2.827% (1 Month | ||
USD LIBOR + 272 bps), 11/15/38 (144A) | 2,371,224 | ||
| 5,897,943(c) | Cold Storage Trust, Series 2020-ICE5, Class D, 2.206% | ||
(1 Month USD LIBOR + 210 bps), 11/15/37 (144A) | 5,905,343 | ||
| 3,421,622 | COMM Mortgage Trust, Series 2012-CR4, Class AM, | ||
3.251%, 10/15/45 | 3,457,972 | ||
| 2,531,000(d) | COMM Mortgage Trust, Series 2013-CR11, Class C, | ||
5.12%, 8/10/50 (144A) | 2,587,649 | ||
| 2,484,000(d) | COMM Mortgage Trust, Series 2015-CR24, Class D, | ||
3.463%, 8/10/48 | 2,234,999 | ||
| 5,227,225(d) | COMM Mortgage Trust, Series 2015-DC1, Class B, | ||
4.035%, 2/10/48 | 5,461,401 | ||
| 2,319,784 | COMM Mortgage Trust, Series 2016-CR28, Class AHR, | ||
3.651%, 2/10/49 | 2,484,531 | ||
| 2,411,000 | COMM Mortgage Trust, Series 2019-GC44, Class D, | ||
2.5%, 8/15/57 (144A) | 2,053,984 |
The accompanying notes are an integral part of these financial statements.
Pioneer Strategic Income Fund | Semiannual Report | 3/31/21 35
Schedule of Investments | 3/31/21
(unaudited) (continued)
| Principal | |||
| Amount | |||
| USD ($) | Value | ||
| COMMERCIAL MORTGAGE-BACKED | |||
| SECURITIES — (continued) | |||
| 7,650,000(d) | COMM Mortgage Trust, Series 2020-CBM, Class E, | ||
3.633%, 2/10/37 (144A) | $ 7,232,222 | ||
| 4,412,000(d) | COMM Mortgage Trust, Series 2020-CBM, Class F, | ||
3.633%, 2/10/37 (144A) | 4,082,947 | ||
| 3,750,000 | COMM Mortgage Trust, Series 2020-CX, Class A, | ||
2.173%, 11/10/46 (144A) | 3,651,515 | ||
| 7,000,000(c) | Credit Suisse Mortgage Capital Certificates, Series | ||
2019-ICE4, Class E, 2.256% (1 Month USD LIBOR | |||
+ 215 bps), 5/15/36 (144A) | 7,010,648 | ||
| 4,083,017(d) | CSAIL Commercial Mortgage Trust, Series 2015-C1, | ||
Class C, 4.264%, 4/15/50 | 4,011,997 | ||
| 2,680,000(d) | CSAIL Commercial Mortgage Trust, Series 2015-C4, | ||
Class D, 3.563%, 11/15/48 | 2,701,051 | ||
| 1,500,000(d) | CSAIL Commercial Mortgage Trust, Series 2016-C6, | ||
Class D, 4.953%, 1/15/49 (144A) | 1,292,989 | ||
| 4,106,000 | DBGS Mortgage Trust, Series 2018-C1, Class 7EB, | ||
5.237%, 9/15/31 (144A) | 4,279,878 | ||
| 2,750,000(c) | Freddie Mac Multifamily Structured Credit Risk, Series | ||
2021-MN1, Class M2, 3.767% (SOFR30A + 375 bps), | |||
1/25/51 (144A) | 2,868,071 | ||
| 2,000,000(d) | FREMF Mortgage Trust, Series 2016-K52, Class B, | ||
3.925%, 1/25/49 (144A) | 2,177,298 | ||
| 2,340,000(d) | FREMF Mortgage Trust, Series 2017-K66, Class B, | ||
4.035%, 7/25/27 (144A) | 2,554,603 | ||
| 4,500,000(d) | FREMF Mortgage Trust, Series 2017-KW02, Class B, | ||
3.784%, 12/25/26 (144A) | 4,433,069 | ||
| 2,800,000(d) | FREMF Mortgage Trust, Series 2017-KW03, Class B, | ||
4.061%, 7/25/27 (144A) | 2,953,909 | ||
| 2,300,000(d) | FREMF Mortgage Trust, Series 2018-K154, Class B, | ||
4.021%, 11/25/32 (144A) | 2,004,373 | ||
| 1,875,000(d) | FREMF Mortgage Trust, Series 2018-K157, Class B, | ||
4.307%, 8/25/33 (144A) | 1,898,503 | ||
| 3,534,000(d) | FREMF Mortgage Trust, Series 2018-KBX1, Class B, | ||
3.576%, 1/25/26 (144A) | 3,611,803 | ||
| 6,364,000(d) | FREMF Mortgage Trust, Series 2018-KHG1, Class B, | ||
3.812%, 12/25/27 (144A) | 6,508,017 | ||
| 3,100,000(d) | FREMF Mortgage Trust, Series 2018-KW06, Class B, | ||
4.225%, 6/25/28 (144A) | 3,121,937 | ||
| 975,000(d) | FREMF Mortgage Trust, Series 2018-KW07, Class B, | ||
4.081%, 10/25/31 (144A) | 964,560 | ||
| 2,900,000(d) | FREMF Mortgage Trust, Series 2019-K88, Class C, | ||
4.38%, 2/25/52 (144A) | 3,136,032 | ||
| 8,720,042(d) | FREMF Mortgage Trust, Series 2019-KJ24, Class B, | ||
7.6%, 10/25/27 (144A) | 7,492,320 |
The accompanying notes are an integral part of these financial statements.
36 Pioneer Strategic Income Fund | Semiannual Report | 3/31/21
| Principal | |||
| Amount | |||
| USD ($) | Value | ||
| COMMERCIAL MORTGAGE-BACKED | |||
| SECURITIES — (continued) | |||
| 8,500,000(c) | FREMF Mortgage Trust, Series 2019-KS12, Class C, | ||
| 7.019% (1 Month USD LIBOR + 690 bps), 8/25/29 | $ 6,885,000 | ||
| 3,900,000(d) | FREMF Mortgage Trust, Series 2020-K106, Class B, | ||
| 3.585%, 3/25/53 (144A) | 4,112,029 | ||
| 4,987,027(c) | FREMF Mortgage Trust, Series 2020-KF74, Class C, | ||
| 6.349% (1 Month USD LIBOR + 623 bps), 1/25/27 (144A) | 4,925,382 | ||
| 6,500,000(c) | FREMF Mortgage Trust, Series 2020-KF83, Class C, | ||
| 9.119% (1 Month USD LIBOR + 900 bps), 7/25/30 (144A) | 6,600,060 | ||
| 25,089,533(d)(f) | FRESB Mortgage Trust, Series 2020-SB79, Class X1, | ||
| 1.236%, 7/25/40 | 1,731,030 | ||
| 10,000,000(g) | FREMF Mortgage Trust, Series 2021-KG05, Class C, | ||
| 0.0%, 1/25/31 (144A) | 4,967,403 | ||
| 123,332,856(f) | FREMF Mortgage Trust, Series 2021-KG05, Class X2A, | ||
| 0.1%, 1/25/31 (144A) | 810,174 | ||
| 10,000,000(f) | FREMF Mortgage Trust, Series 2021-KG05, Class X2B, | ||
| 0.1%, 1/25/31 (144A) | 67,120 | ||
| 6,000,000(c) | GS Mortgage Securities Corp. Trust, Series 2020-DUNE, | ||
| Class E, 2.606% (1 Month USD LIBOR + | |||
| 250 bps), 12/15/36 (144A) | 5,596,627 | ||
| 5,200,000(c) | GS Mortgage Securities Corp. Trust, Series 2020-DUNE, | ||
| Class G, 4.106% (1 Month USD LIBOR + | |||
| 400 bps), 12/15/36 (144A) | 4,459,861 | ||
| 3,750,000(d) | JP Morgan Chase Commercial Mortgage Securities Trust, | ||
| Series 2015-JP1, Class C, 4.731%, 1/15/49 | 4,100,672 | ||
| 4,750,000 | JP Morgan Chase Commercial Mortgage Securities Trust, | ||
| Series 2018-WPT, Class BFX, 4.549%, 7/5/33 (144A) | 5,015,431 | ||
| 3,750,000(c) | JP Morgan Chase Commercial Mortgage Securities Trust, | ||
| Series 2019-BKWD, Class E, 2.706% (1 Month USD | |||
| LIBOR + 260 bps), 9/15/29 (144A) | 3,712,256 | ||
| 3,590,000(c) | JP Morgan Chase Commercial Mortgage Securities Trust, | ||
| Series 2019-MFP, Class D, 1.766% (1 Month USD LIBOR | |||
| + 166 bps), 7/15/36 (144A) | 3,553,964 | ||
| 1,500,000(c) | JP Morgan Chase Commercial Mortgage Securities Trust, | ||
| Series 2019-MFP, Class E, 2.266% (1 Month USD LIBOR | |||
| + 216 bps), 7/15/36 (144A) | 1,481,653 | ||
| 11,650,000(d) | JP Morgan Chase Commercial Mortgage Securities Trust, | ||
| Series 2020-LOOP, Class F, 3.861%, 12/5/38 (144A) | 10,673,848 | ||
| 4,250,000 | JPMDB Commercial Mortgage Securities Trust, | ||
| Series 2018-C8, Class AS, 4.421%, 6/15/51 | 4,834,265 | ||
| 5,600,000 | Key Commercial Mortgage Securities Trust, | ||
| Series 2019-S2, Class A3, 3.469%, 6/15/52 (144A) | 5,814,295 | ||
| 3,100,000(c) | KNDL Mortgage Trust, Series 2019-KNSQ, Class F, 2.106% | ||
| (1 Month USD LIBOR + 200 bps), 5/15/36 (144A) | 2,980,280 | ||
| 4,000,000(d) | Morgan Stanley Bank of America Merrill Lynch Trust, | ||
| Series 2015-C20, Class C, 4.463%, 2/15/48 | 4,261,259 |
The accompanying notes are an integral part of these financial statements.
Pioneer Strategic Income Fund | Semiannual Report | 3/31/21 37
Schedule of Investments | 3/31/21
(unaudited) (continued)
| Principal | |||
| Amount | |||
| USD ($) | Value | ||
| COMMERCIAL MORTGAGE-BACKED | |||
| SECURITIES — (continued) | |||
| 1,625,000 | Morgan Stanley Bank of America Merrill Lynch Trust, | ||
Series 2017-C33, Class D, 3.356%, 5/15/50 (144A) | $ 1,486,096 | ||
| 3,350,000 | Morgan Stanley Capital I Trust, Series 2014-150E, | ||
Class AS, 4.012%, 9/9/32 (144A) | 3,564,110 | ||
| 2,140,000 | Morgan Stanley Capital I Trust, Series 2016-UBS9, | ||
Class D, 3.0%, 3/15/49 (144A) | 1,989,271 | ||
| 2,000,000(d) | Morgan Stanley Capital I Trust, Series 2018-MP, | ||
Class A, 4.276%, 7/11/40 (144A) | 2,150,332 | ||
| 8,400,000(c) | Multifamily Connecticut Avenue Securities Trust, Series | ||
2019-01, Class M10, 3.359% (1 Month USD LIBOR | |||
+ 325 bps), 10/15/49 (144A) | 8,345,339 | ||
| 1,030,000(d) | Natixis Commercial Mortgage Securities Trust, Series | ||
2019-FAME, Class D, 4.398%, 8/15/36 (144A) | 916,716 | ||
| 5,540,000 | Palisades Center Trust, Series 2016-PLSD, Class A, | ||
2.713%, 4/13/33 (144A) | 5,118,168 | ||
| 4,450,000(c) | Ready Capital Mortgage Financing LLC, Series | ||
2019-FL3, Class D, 3.009% (1 Month USD LIBOR + | |||
290 bps), 3/25/34 (144A) | 4,045,770 | ||
| 2,659,000(d) | Ready Capital Mortgage Trust, Series 2019-5, Class C, | ||
5.054%, 2/25/52 (144A) | 2,747,014 | ||
| 5,400,000(d) | Ready Capital Mortgage Trust, Series 2019-5, Class E, | ||
5.416%, 2/25/52 (144A) | 4,764,206 | ||
| 2,403,000(d) | ReadyCap Commercial Mortgage Trust, Series 2019-6, | ||
Class C, 4.127%, 10/25/52 (144A) | 2,370,441 | ||
| 2,875,000(d) | ReadyCap Commercial Mortgage Trust, Series 2019-6, | ||
Class D, 4.766%, 10/25/52 (144A) | 2,858,969 | ||
| 1,786,952(c) | SLIDE, Series 2018-FUN, Class E, 2.406% (1 Month USD | ||
LIBOR + 230 bps), 6/15/31 (144A) | 1,723,983 | ||
| 67,584,000(d)(f) | UBS Commercial Mortgage Trust, Series 2018-C9, | ||
Class XB, 0.326%, 3/15/51 | 1,641,730 | ||
| 3,912,000(d) | UBS-Barclays Commercial Mortgage Trust, Series | ||
2013-C6, Class B, 3.875%, 4/10/46 (144A) | 3,950,134 | ||
| 450,000 | Wells Fargo Commercial Mortgage Trust, Series | ||
2020-C58, Class AS, 2.398%, 7/15/53 | 438,711 | ||
| 2,400,000(c) | XCALI Mortgage Trust, Series 2020-5, Class A, 4.25% | ||
(1 Month USD LIBOR + 325 bps), 10/15/23 (144A) | 2,410,072 | ||
| 5,200,000(c) | X-Caliber Funding LLC, Series 2021-CT2, Class A, 3.25% | ||
(1 Month USD LIBOR + 225 bps), 4/6/23 (144A) | 5,200,000 | ||
| TOTAL COMMERCIAL MORTGAGE-BACKED SECURITIES | |||
(Cost $301,880,873) | $ 296,870,202 |
The accompanying notes are an integral part of these financial statements.
38 Pioneer Strategic Income Fund | Semiannual Report | 3/31/21
| Principal | |||
| Amount | |||
| USD ($) | Value | ||
| CONVERTIBLE CORPORATE BONDS — 0.6% of | |||
| Net Assets | |||
| Airlines — 0.3% | |||
| 7,755,000 | Air Canada, 4.0%, 7/1/25 (144A) | $ 12,223,819 | |
| Total Airlines | $ 12,223,819 | ||
| Biotechnology — 0.1% | |||
| 4,823,000 | Insmed, Inc., 1.75%, 1/15/25 | $ 5,368,481 | |
| Total Biotechnology | $ 5,368,481 | ||
| Entertainment — 0.1% | |||
| 2,648,000(g) | DraftKings, Inc., 3/15/28 (144A) | $ 2,620,196 | |
| 1,892,000 | IMAX Corp., 0.5%, 4/1/26 (144A) | 1,870,810 | |
| Total Entertainment | $ 4,491,006 | ||
| Mining — 0.1% | |||
| 3,575,000 | Ivanhoe Mines Ltd., 2.5%, 4/15/26 (144A) | $ 3,663,837 | |
| Total Mining | $ 3,663,837 | ||
| Pharmaceuticals — 0.0%† | |||
| 7,025,000 | Tricida, Inc., 3.5%, 5/15/27 (144A) | $ 2,759,934 | |
| Total Pharmaceuticals | $ 2,759,934 | ||
| TOTAL CONVERTIBLE CORPORATE BONDS | |||
(Cost $26,601,972) | $ 28,507,077 | ||
| CORPORATE BONDS — 38.8% of Net Assets | |||
| Advertising — 0.1% | |||
| 5,830,000 | Outfront Media Capital LLC/Outfront Media Capital | ||
| Corp., 6.25%, 6/15/25 (144A) | $ 6,165,226 | ||
| Total Advertising | $ 6,165,226 | ||
| Aerospace & Defense — 1.0% | |||
| 25,979,000 | Boeing Co., 3.75%, 2/1/50 | $ 24,951,256 | |
| 9,700,000 | Boeing Co., 5.805%, 5/1/50 | 12,231,772 | |
| 5,255,000 | Howmet Aerospace, Inc., 6.875%, 5/1/25 | 6,089,231 | |
| Total Aerospace & Defense | $ 43,272,259 | ||
| Agriculture — 0.2% | |||
| 7,305,000 | Amaggi Luxembourg International S.a.r.l., 5.25%, | ||
| 1/28/28 (144A) | $ 7,470,823 | ||
| Total Agriculture | $ 7,470,823 | ||
| Airlines — 1.3% | |||
| 12,976,644 | Alaska Airlines 2020-1 Class A Pass Through Trust, | ||
| 4.8%, 8/15/27 (144A) | $ 14,202,938 | ||
| 2,340,000 | American Airlines, Inc./Aadvantage Loyalty IP, Ltd., | ||
| 5.5%, 4/20/26 (144A) | 2,439,450 |
The accompanying notes are an integral part of these financial statements.
Pioneer Strategic Income Fund | Semiannual Report | 3/31/21 39
Schedule of Investments | 3/31/21
(unaudited) (continued)
| Principal | |||
| Amount | |||
| USD ($) | Value | ||
| Airlines — (continued) | |||
| 1,955,000 | American Airlines, Inc./Aadvantage Loyalty IP, Ltd., | ||
| 5.75%, 4/20/29 (144A) | $ 2,083,639 | ||
| 5,688,676 | British Airways 2019-1 Class A Pass Through Trust, | ||
| 3.35%, 6/15/29 (144A) | 5,479,767 | ||
| 5,268,537 | British Airways 2019-1 Class AA Pass Through Trust, | ||
| 3.3%, 12/15/32 (144A) | 5,245,538 | ||
| 2,934,234 | British Airways 2020-1 Class A Pass Through Trust, | ||
| 4.25%, 11/15/32 (144A) | 3,072,634 | ||
| 4,488,541 | British Airways 2020-1 Class B Pass Through Trust, | ||
| 8.375%, 11/15/28 (144A) | 5,107,234 | ||
| 5,705,000 | Gol Finance SA, 8.0%, 6/30/26 (144A) | 5,533,850 | |
| 5,359,513 | JetBlue 2019-1 Class AA Pass Through Trust, 2.75%, | ||
| 5/15/32 | 5,381,493 | ||
| 2,087,000 | JetBlue 2020-1 Class A Pass Through Trust, 4.0%, | ||
| 11/15/32 | 2,249,973 | ||
| 8,145,000 | Mileage Plus Holdings LLC/Mileage Plus Intellectual | ||
| Property Assets, Ltd., 6.5%, 6/20/27 (144A) | 8,918,775 | ||
| Total Airlines | $ 59,715,291 | ||
| Auto Manufacturers – 1.2% | |||
| 4,312,000 | Ford Motor Co., 5.291%, 12/8/46 | $ 4,533,076 | |
| 15,325,000 | Ford Motor Credit Co. LLC, 3.815%, 11/2/27 | 15,497,406 | |
| 4,875,000 | Ford Motor Credit Co. LLC, 5.584%, 3/18/24 | 5,261,539 | |
| 16,702,000 | General Motors Co., 6.6%, 4/1/36 | 21,658,768 | |
| 6,535,000 | Nissan Motor Co. Ltd., 4.81%, 9/17/30 (144A) | 7,162,708 | |
| Total Auto Manufacturers | $ 54,113,497 | ||
| Banks — 5.6% | |||
| ARS 78,000,000(c) | Banco de la Ciudad de Buenos Aires, 38.043% | ||
(BADLARPP + 399 bps), 12/5/22 | $ 825,205 | ||
| 4,608,000(b)(d) | Banco Mercantil del Norte SA, 6.75% (5 Year CMT | ||
Index + 497 bps) (144A) | 4,803,840 | ||
| 4,720,000(b)(d) | Banco Mercantil del Norte SA, 8.375% (5 Year CMT | ||
Index + 776 bps) (144A) | 5,503,284 | ||
| 2,915,000(d) | Banco Nacional de Comercio Exterior SNC, 3.8% | ||
(5 Year CMT Index + 300 bps), 8/11/26 (144A) | 2,907,742 | ||
| 4,240,000 | Banco Santander Mexico SA Institucion de Banca Multiple | ||
Grupo Financiero Santand, 5.375%, 4/17/25 (144A) | 4,760,672 | ||
| 9,150,000(b)(d) | Barclays Plc, 7.75% (5 Year USD Swap Rate + 484 bps) | 9,984,480 | |
| 4,625,000(b)(d) | Barclays Plc, 8.0% (5 Year CMT Index + 567 bps) | 5,133,750 | |
| 9,709,000(b)(d) | BNP Paribas SA, 6.625% (5 Year USD Swap Rate + | ||
415 bps) (144A) | 10,597,859 | ||
| 5,413,000(b)(d) | Citigroup, Inc., 4.7% (SOFRRATE + 323 bps) | 5,450,891 | |
| 8,307,000(b)(d) | Credit Suisse Group AG, 5.1% (5 Year CMT Index + | ||
329 bps) (144A) | 8,007,948 |
The accompanying notes are an integral part of these financial statements.
40 Pioneer Strategic Income Fund | Semiannual Report | 3/31/21
| Principal | ||||
| Amount | ||||
| USD ($) | Value | |||
| Banks — (continued) | ||||
| 2,405,000(b)(d) | Credit Suisse Group AG, 5.25% (5 Year CMT Index + | |||
489 bps) (144A) | $ 2,429,050 | |||
| 3,915,000(b)(d) | Credit Suisse Group AG, 6.375% (5 Year CMT Index + | |||
482 bps) (144A) | 4,169,475 | |||
| 23,240,000(b)(d) | Danske Bank AS, 6.125% (USD Swap Rate + 390 bps) | 24,909,562 | ||
KZT | 1,923,750,000 | Development Bank of Kazakhstan JSC, 10.75%, 2/12/25 | 4,615,003 | |
| 3,842,000 | Freedom Mortgage Corp., 8.25%, 4/15/25 (144A) | 4,000,482 | ||
| 1,060,000(b)(d) | ING Groep NV, 5.75% (5 Year CMT Index + 434 bps) | 1,156,195 | ||
| 5,649,000(b)(d) | ING Groep NV, 6.5% (5 Year USD Swap Rate + 445 bps) | 6,259,939 | ||
| 6,150,000 | Intesa Sanpaolo S.p.A., 4.7%, 9/23/49 (144A) | 6,863,664 | ||
EUR | 5,560,000(b)(d) | Intesa Sanpaolo S.p.A., 7.75% (5 Year EUR Swap | ||
Rate + 719 bps) | 7,979,435 | |||
| 2,965,000(b)(d) | JPMorgan Chase & Co., 4.6% (SOFRRATE + 313 bps) | 2,999,394 | ||
| 8,084,000(b)(d) | JPMorgan Chase & Co., 5.0% (SOFRRATE + 338 bps) | 8,356,835 | ||
| 14,375,000(b)(d) | Natwest Group Plc, 8.625% (5 Year USD Swap | |||
Rate + 760 bps) | 14,716,406 | |||
IDR | 15,039,758,000^ | PT Bakrie & Brothers Tbk, 0.0%, 12/22/22 | 51,772 | |
| 3,895,000 | QNB Finansbank AS, 4.875%, 5/19/22 (144A) | 3,895,000 | ||
| 4,635,000(b)(d) | Societe Generale SA, 5.375% (5 Year CMT Index + | |||
451 bps) (144A) | 4,768,256 | |||
| 10,677,000(b)(d) | Societe Generale SA, 7.375% (5 Year USD Swap Rate + | |||
624 bps) (144A) | 10,906,555 | |||
EUR | 28,280,100(b)(e) | Stichting AK Rabobank Certificaten, 2.188% | 42,946,147 | |
| 3,000,000(d) | Turkiye Garanti Bankasi AS, 6.125% (5 Year USD Swap | |||
Rate + 422 bps), 5/24/27 (144A) | 2,877,120 | |||
| 10,450,000(b)(d) | UBS Group AG, 7.0% (5 Year USD Swap Rate + | |||
434 bps) (144A) | 11,478,176 | |||
| 7,340,000(d) | UniCredit S.p.A., 2.569% (1 Year CMT Index + | |||
230 bps), 9/22/26 (144A) | 7,366,341 | |||
| 8,500,000(d) | UniCredit S.p.A., 5.459% (5 Year CMT Index + | |||
475 bps), 6/30/35 (144A) | 9,003,659 | |||
| 9,395,000(d) | UniCredit S.p.A., 7.296% (5 Year USD 1100 Run ICE | |||
Swap Rate + 491 bps), 4/2/34 (144A) | 11,067,874 | |||
| 2,200,000 | Vnesheconombank Via VEB Finance Plc, 5.942%, | |||
11/21/23 (144A) | 2,415,160 | |||
| Total Banks | $ 253,207,171 | |||
| Beverages — 0.2% | ||||
| 6,176,000 | Bacardi, Ltd., 5.3%, 5/15/48 (144A) | $ 7,574,217 | ||
| Total Beverages | $ 7,574,217 | |||
| Biotechnology — 0.0%† | ||||
EUR | 985,000 | Cidron Aida Finco Sarl, 5.0%, 4/1/28 (144A) | $ 1,168,116 | |
| Total Biotechnology | $ 1,168,116 | |||
The accompanying notes are an integral part of these financial statements.
Pioneer Strategic Income Fund | Semiannual Report | 3/31/21 41
Schedule of Investments | 3/31/21
(unaudited) (continued)
| Principal | ||||
| Amount | ||||
| USD ($) | Value | |||
| Building Materials — 0.3% | ||||
| 5,970,000 | Cemex SAB de CV, 5.45%, 11/19/29 (144A) | $ 6,540,135 | ||
| 6,575,000 | Standard Industries, Inc., 4.375%, 7/15/30 (144A) | 6,634,175 | ||
| 950,000 | Standard Industries, Inc., 5.0%, 2/15/27 (144A) | 990,375 | ||
| 495,000 | Summit Materials LLC/Summit Materials Finance | |||
Corp., 5.25%, 1/15/29 (144A) | 517,765 | |||
| Total Building Materials | $ 14,682,450 | |||
| Chemicals — 0.9% | ||||
EUR | 3,150,000 | INEOS Finance Plc, 2.875%, 5/1/26 (144A) | $ 3,730,908 | |
| 3,665,000 | Ingevity Corp., 3.875%, 11/1/28 (144A) | 3,555,050 | ||
| 2,566,000 | NOVA Chemicals Corp., 5.25%, 6/1/27 (144A) | 2,692,684 | ||
EUR | 2,450,000 | OCI NV, 3.125%, 11/1/24 (144A) | 2,941,782 | |
| 1,458,000 | OCI NV, 4.625%, 10/15/25 (144A) | 1,507,208 | ||
| 2,497,000 | OCI NV, 5.25%, 11/1/24 (144A) | 2,596,880 | ||
| 5,275,000 | Olin Corp., 5.0%, 2/1/30 | 5,525,483 | ||
| 710,000 | Olin Corp., 5.625%, 8/1/29 | 765,788 | ||
| 5,055,000 | Trinseo Materials Operating SCA/Trinseo Materials | |||
Finance, Inc., 5.125%, 4/1/29 (144A) | 5,212,969 | |||
| 5,060,000 | Tronox, Inc., 4.625%, 3/15/29 (144A) | 5,066,325 | ||
| 4,340,000 | Tronox, Inc., 6.5%, 5/1/25 (144A) | 4,654,650 | ||
| Total Chemicals | $ 38,249,727 | |||
| Commercial Services — 1.0% | ||||
| 5,196,000 | Allied Universal Holdco LLC/Allied Universal Finance | |||
Corp., 6.625%, 7/15/26 (144A) | $ 5,510,254 | |||
| 4,735,000 | Brink’s Co., 5.5%, 7/15/25 (144A) | 5,001,344 | ||
| 5,375,000 | Garda World Security Corp., 4.625%, 2/15/27 (144A) | 5,375,000 | ||
| 4,042,000 | Garda World Security Corp., 9.5%, 11/1/27 (144A) | 4,473,968 | ||
| 3,795,000 | Prime Security Services Borrower LLC/Prime | |||
Finance, Inc., 5.75%, 4/15/26 (144A) | 4,095,659 | |||
| 10,716,000 | Prime Security Services Borrower LLC/Prime | |||
Finance, Inc., 6.25%, 1/15/28 (144A) | 11,155,249 | |||
MXN | 79,625,000 | Red de Carreteras de Occidente SAB de CV, 9.0%, | ||
6/10/28 (144A) | 4,114,752 | |||
| 4,035,000 | Sotheby’s, 7.375%, 10/15/27 (144A) | 4,363,287 | ||
| Total Commercial Services | $ 44,089,513 | |||
| Computers — 0.1% | ||||
| 2,415,000 | NCR Corp., 5.0%, 10/1/28 (144A) | $ 2,439,150 | ||
| 1,215,000 | NCR Corp., 5.25%, 10/1/30 (144A) | 1,230,339 | ||
| 490,000 | NCR Corp., 8.125%, 4/15/25 (144A) | 537,163 | ||
| Total Computers | $ 4,206,652 | |||
The accompanying notes are an integral part of these financial statements.
42 Pioneer Strategic Income Fund | Semiannual Report | 3/31/21
| Principal | ||||
| Amount | ||||
| USD ($) | Value | |||
| Cosmetics/Personal Care — 0.1% | ||||
| 5,445,000 | Edgewell Personal Care Co., 5.5%, 6/1/28 (144A) | $ 5,749,920 | ||
| Total Cosmetics/Personal Care | $ 5,749,920 | |||
| Diversified Financial Services — 1.3% | ||||
| 7,310,000 | Air Lease Corp., 3.125%, 12/1/30 | $ 7,282,951 | ||
| 9,395,000 | Alliance Data Systems Corp., 7.0%, 1/15/26 (144A) | 10,054,529 | ||
| 1,071,000 | Avolon Holdings Funding, Ltd., 3.95%, 7/1/24 (144A) | 1,119,415 | ||
| 9,010,000 | Credito Real SAB de CV SOFOM ER, 8.0%, | |||
1/21/28 (144A) | 9,109,160 | |||
| 17,245,453 | Global Aircraft Leasing Co., Ltd., 6.5%, 9/15/24 (144A) | 16,538,390 | ||
| KZT | 868,000,000 | International Finance Corp., 0.0%, 2/3/23 | 2,038,079 | |
| 2,745,000 | Nationstar Mortgage Holdings, Inc., 5.125%, | |||
12/15/30 (144A) | 2,697,539 | |||
| 3,495,000 | Nationstar Mortgage Holdings, Inc., 5.5%, | |||
8/15/28 (144A) | 3,509,155 | |||
| 1,180,000 | Nationstar Mortgage Holdings, Inc., 6.0%, | |||
1/15/27 (144A) | 1,224,250 | |||
| 4,060,000 | United Wholesale Mortgage LLC, 5.5%, 4/15/29 (144A) | 4,054,925 | ||
| Total Diversified Financial Services | $ 57,628,393 | |||
| Electric — 1.7% | ||||
| 3,625,000 | Adani Electricity Mumbai, Ltd., 3.949%, | |||
2/12/30 (144A) | $ 3,652,115 | |||
| 4,084,275 | Adani Renewable Energy RJ, Ltd./Kodangal Solar | |||
Parks Pvt, Ltd./Wardha Solar Maharash, 4.625%, | ||||
10/15/39 (144A) | 4,206,803 | |||
| 4,439,000 | Adani Transmission, Ltd., 4.25%, 5/21/36 (144A) | 4,578,473 | ||
| 1,605,000 | Calpine Corp., 4.625%, 2/1/29 (144A) | 1,563,735 | ||
| 1,605,000 | Calpine Corp., 5.0%, 2/1/31 (144A) | 1,564,554 | ||
| 4,030,000 | Clearway Energy Operating LLC, 3.75%, 2/15/31 (144A) | 3,865,137 | ||
EUR | 3,240,000 | ContourGlobal Power Holdings SA, 2.75%, | ||
1/1/26 (144A) | 3,801,159 | |||
EUR | 1,635,000 | ContourGlobal Power Holdings SA, 3.125%, | ||
1/1/28 (144A) | 1,928,339 | |||
| 7,765,000(d) | Enel S.p.A., 8.75% (5 Year USD Swap Rate + 588 bps), | |||
9/24/73 (144A) | 9,026,813 | |||
| 2,336,000 | NextEra Energy Operating Partners LP, 4.5%, | |||
9/15/27 (144A) | 2,525,800 | |||
| 1,645,000 | NRG Energy, Inc., 3.375%, 2/15/29 (144A) | 1,605,931 | ||
| 2,285,000 | NRG Energy, Inc., 3.625%, 2/15/31 (144A) | 2,227,875 | ||
| 20,059,000 | NRG Energy, Inc., 4.45%, 6/15/29 (144A) | 21,780,273 | ||
| 905,000 | Pattern Energy Operations LP/Pattern Energy | |||
Operations, Inc., 4.5%, 8/15/28 (144A) | 919,706 | |||
| 6,490,000 | Puget Energy, Inc., 4.1%, 6/15/30 | 7,028,599 | ||
| 2,867,000 | Talen Energy Supply LLC, 6.625%, 1/15/28 (144A) | 2,863,961 | ||
The accompanying notes are an integral part of these financial statements.
Pioneer Strategic Income Fund | Semiannual Report | 3/31/21 43
Schedule of Investments | 3/31/21
(unaudited) (continued)
| Principal | |||
| Amount | |||
| USD ($) | Value | ||
| Electric — (continued) | |||
| 1,769,000 | Talen Energy Supply LLC, 7.625%, 6/1/28 (144A) | $ 1,791,113 | |
| 1,913,000 | Vistra Operations Co. LLC, 4.3%, 7/15/29 (144A) | 2,020,493 | |
| Total Electric | $ 76,950,879 | ||
| Electrical Components & Equipment — 0.3%† | |||
| EUR 7,865,000 | Belden, Inc., 3.375%, 7/15/27 (144A) | $ 9,360,897 | |
| 2,664,000 | Energizer Holdings, Inc., 4.75%, 6/15/28 (144A) | 2,747,250 | |
| 1,700,000 | WESCO Distribution, Inc., 7.25%, 6/15/28 (144A) | 1,902,300 | |
| Total Electrical Components & Equipment | $ 14,010,447 | ||
| Electronics — 0.1% | |||
| 2,460,000 | Sensata Technologies BV, 4.0%, 4/15/29 (144A) | $ 2,504,354 | |
| 1,850,000 | Sensata Technologies, Inc., 3.75%, 2/15/31 (144A) | 1,823,989 | |
| 1,500,000 | TTM Technologies, Inc., 4.0%, 3/1/29 (144A) | 1,479,375 | |
| Total Electronics | $ 5,807,718 | ||
| Energy-Alternate Sources — 0.1% | |||
| 748,917 | Alta Wind Holdings LLC, 7.0%, 6/30/35 (144A) | $ 853,991 | |
| 2,095,000 | TerraForm Power Operating LLC, 4.75%, | ||
1/15/30 (144A) | 2,175,260 | ||
| Total Energy-Alternate Sources | $ 3,029,251 | ||
| Engineering & Construction — 0.5% | |||
| 1,930,000 | Arcosa, Inc., 4.375%, 4/15/29 (144A) | $ 1,930,000 | |
| 6,138,000 | Dycom Industries, Inc., 4.5%, 4/15/29 (144A) | 6,147,453 | |
| 3,915,000 | KBR, Inc., 4.75%, 9/30/28 (144A) | 3,976,661 | |
| 7,985,000 | PowerTeam Services LLC, 9.033%, 12/4/25 (144A) | 8,865,745 | |
| Total Engineering & Construction | $ 20,919,859 | ||
| Entertainment — 0.5% | |||
| 4,060,000 | Caesars Entertainment, Inc., 6.25%, 7/1/25 (144A) | $ 4,319,028 | |
| 890,000 | International Game Technology Plc, 4.125%, | ||
4/15/26 (144A) | 914,546 | ||
| 5,571,000 | International Game Technology Plc, 6.5%, | ||
2/15/25 (144A) | 6,100,245 | ||
| 3,400,000 | Resorts World Las Vegas LLC/RWLV Capital, Inc., | ||
4.625%, 4/6/31 (144A) | 3,393,947 | ||
| 1,735,000 | Scientific Games International, Inc., 7.0%, | ||
5/15/28 (144A) | 1,854,039 | ||
| 1,735,000 | Scientific Games International, Inc., 7.25%, | ||
11/15/29 (144A) | 1,882,475 | ||
| 3,636,000 | Scientific Games International, Inc., 8.25%, | ||
3/15/26 (144A) | 3,899,610 | ||
| Total Entertainment | $ 22,363,890 |
The accompanying notes are an integral part of these financial statements.
44 Pioneer Strategic Income Fund | Semiannual Report | 3/31/21
| Principal | ||||
| Amount | ||||
| USD ($) | Value | |||
| Environmental Control — 0.3% | ||||
| 4,020,000 | Covanta Holding Corp., 5.0%, 9/1/30 | $ 4,060,200 | ||
| 6,132,000 | Covanta Holding Corp., 6.0%, 1/1/27 | 6,400,275 | ||
| 1,605,000 | GFL Environmental, Inc., 4.0%, 8/1/28 (144A) | 1,552,838 | ||
| 3,075,000 | Tervita Corp., 11.0%, 12/1/25 (144A) | 3,490,125 | ||
| Total Environmental Control | $ 15,503,438 | |||
| Food — 0.9% | ||||
| 4,185,000 | Albertsons Cos., Inc./Safeway, Inc./New Albertsons | |||
LP/Albertsons LLC, 3.5%, 3/15/29 (144A) | $ 3,982,613 | |||
| 3,230,000 | Albertsons Cos., Inc./Safeway, Inc./New Albertsons | |||
LP/Albertsons LLC, 4.875%, 2/15/30 (144A) | 3,320,440 | |||
GBP | 5,520,000 | Bellis Acquisition Co. PLC, 3.25%, 2/16/26 (144A) | 7,635,188 | |
| 2,250,000 | JBS USA LUX SA/JBS USA Finance, Inc., 6.75%, | |||
2/15/28 (144A) | 2,472,863 | |||
| 3,583,000 | JBS USA LUX SA/JBS USA Food Co./JBS USA | |||
Finance, Inc., 5.5%, 1/15/30 (144A) | 3,965,467 | |||
| 2,485,000 | JBS USA LUX SA/JBS USA Food Co./JBS USA | |||
Finance, Inc., 6.5%, 4/15/29 (144A) | 2,806,808 | |||
| 6,485,000 | Minerva Luxembourg SA, 4.375%, 3/18/31 (144A) | 6,339,088 | ||
| 7,401,000 | Minerva Luxembourg SA, 5.875%, 1/19/28 (144A) | 7,847,317 | ||
| 2,900,000 | Pilgrim’s Pride Corp., 5.875%, 9/30/27 (144A) | 3,107,930 | ||
| 847,000 | Smithfield Foods, Inc., 5.2%, 4/1/29 (144A) | 971,267 | ||
| Total Food | $ 42,448,981 | |||
| Forest Products & Paper — 0.4% | ||||
| 3,770,000 | Clearwater Paper Corp., 4.75%, 8/15/28 (144A) | $ 3,798,275 | ||
| 4,901,000 | International Paper Co., 7.3%, 11/15/39 | 7,308,026 | ||
| 3,004,000 | Inversiones CMPC SA, 3.85%, 1/13/30 (144A) | 3,190,248 | ||
EUR | 1,950,000 | Spa Holdings, 3.625%, 2/4/28 | 2,311,919 | |
| Total Forest Products & Paper | $ 16,608,468 | |||
| Gas — 0.1% | ||||
| 2,195,000 | Promigas SA ESP/Gases del Pacifico SAC, 3.75%, | |||
10/16/29 (144A) | $ 2,211,463 | |||
| Total Gas | $ 2,211,463 | |||
| Hand/Machine Tools — 0.1% | ||||
| 4,396,000 | Kennametal, Inc., 2.8%, 3/1/31 | $ 4,296,255 | ||
| Total Hand/Machine Tools | $ 4,296,255 | |||
| Healthcare-Services — 0.7% | ||||
| 4,195,000 | Auna SAA, 6.5%, 11/20/25 (144A) | $ 4,472,961 | ||
| 8,657,000 | HCA, Inc., 3.5%, 9/1/30 | 8,756,942 | ||
EUR | 2,272,000 | IQVIA, Inc., 2.25%, 1/15/28 (144A) | 2,668,691 | |
EUR | 4,725,000 | IQVIA, Inc., 2.25%, 3/15/29 (144A) | 5,537,550 | |
The accompanying notes are an integral part of these financial statements.
Pioneer Strategic Income Fund | Semiannual Report | 3/31/21 45
Schedule of Investments | 3/31/21
(unaudited) (continued)
| Principal | ||||
| Amount | ||||
| USD ($) | Value | |||
| Healthcare-Services — (continued) | ||||
| 2,225,000 | Legacy LifePoint Health LLC, 6.75%, 4/15/25 (144A) | $ 2,364,062 | ||
| 1,090,000 | ModivCare, Inc., 5.875%, 11/15/25 (144A) | 1,147,225 | ||
| 1,685,000 | Molina Healthcare, Inc., 4.375%, 6/15/28 (144A) | 1,733,798 | ||
| 1,572,000 | RegionalCare Hospital Partners Holdings, Inc./LifePoint | |||
| Health, Inc., 9.75%, 12/1/26 (144A) | 1,701,690 | |||
| 3,421,000 | US Renal Care, Inc., 10.625%, 7/15/27 (144A) | 3,763,100 | ||
| Total Healthcare-Services | $ 32,146,019 | |||
| Home Builders — 0.1% | ||||
| 1,657,000 | KB Home, 6.875%, 6/15/27 | $ 1,940,993 | ||
| 2,710,000 | Meritage Homes Corp., 6.0%, 6/1/25 | 3,038,588 | ||
| Total Home Builders | $ 4,979,581 | |||
| Home Furnishings — 0.1% | ||||
| 4,300,000 | Tempur Sealy International, Inc., 4.0%, 4/15/29 (144A) | $ 4,278,500 | ||
| Total Home Furnishings | $ 4,278,500 | |||
| Household Products/Wares — 0.0%† | ||||
| 1,130,000 | Central Garden & Pet Co., 4.125%, 10/15/30 | $ 1,141,300 | ||
| Total Household Products/Wares | $ 1,141,300 | |||
| Housewares — 0.1% | ||||
| 775,000 | CD&R Smokey Buyer, Inc., 6.75%, 7/15/25 (144A) | $ 831,187 | ||
| 4,500,000 | Scotts Miracle-Gro Co., 4.0%, 4/1/31 (144A) | 4,437,000 | ||
| Total Housewares | $ 5,268,187 | |||
| Insurance — 1.6% | ||||
| 7,650,000(d) | Farmers Exchange Capital III, 5.454% (3 Month USD | |||
| LIBOR + 345 bps), 10/15/54 (144A) | $ 9,266,310 | |||
| 13,080,000(d) | Farmers Insurance Exchange, 4.747% (3 Month USD | |||
| LIBOR + 323 bps), 11/1/57 (144A) | 13,588,180 | |||
EUR | 2,650,000(d) | Liberty Mutual Group, Inc., 3.625% (5 Year EUR Swap | ||
| Rate + 370 bps), 5/23/59 (144A) | 3,167,229 | |||
| 22,651,000 | Liberty Mutual Insurance Co., 7.697%, 10/15/97 (144A) | 32,619,537 | ||
| 3,800,000 | Liberty Mutual Insurance Co., 8.5%, 5/15/25 (144A) | 4,608,525 | ||
| 7,580,000 | 7,933,607 | |||
| Total Insurance | $ 71,183,388 | |||
| Internet — 0.8% | ||||
| 3,550,000 | ANGI Group LLC, 3.875%, 8/15/28 (144A) | $ 3,550,000 | ||
| 14,366,000 | Expedia Group, Inc., 3.25%, 2/15/30 | 14,468,859 | ||
| 7,725,000 | Expedia Group, Inc., 3.8%, 2/15/28 | 8,177,856 | ||
EUR | 6,515,000 | Netflix, Inc., 3.625%, 6/15/30 (144A) | 8,931,339 | |
| Total Internet | $ 35,128,054 | |||
The accompanying notes are an integral part of these financial statements.
46 Pioneer Strategic Income Fund | Semiannual Report | 3/31/21
| Principal | ||||
| Amount | ||||
| USD ($) | Value | |||
| Iron & Steel — 0.0%† | ||||
| 1,985,000 | Cleveland-Cliffs, Inc., 6.75%, 3/15/26 (144A) | $ 2,158,687 | ||
| 774,000 | Cleveland-Cliffs, Inc., 9.875%, 10/17/25 (144A) | 906,779 | ||
| 2,675,000 | Metinvest BV, 7.65%, 10/1/27 (144A) | 2,874,964 | ||
| Total Iron & Steel | $ 5,940,430 | |||
| Leisure Time — 0.5% | ||||
| 560,000 | Carnival Corp., 7.625%, 3/1/26 (144A) | $ 601,608 | ||
EUR | 660,000 | Carnival Corp., 7.625%, 3/1/26 (144A) | 836,709 | |
| 1,605,000 | NCL Corp., Ltd., 5.875%, 3/15/26 (144A) | 1,626,491 | ||
| 1,130,000 | NCL Finance, Ltd., 6.125%, 3/15/28 (144A) | 1,151,188 | ||
| 5,295,000 | Royal Caribbean Cruises, Ltd., 5.5%, 4/1/28 (144A) | 5,325,446 | ||
| 300,000 | Viking Ocean Cruises Ship VII, Ltd., 5.625%, | |||
| 2/15/29 (144A) | 303,090 | |||
| 10,582,000 | VOC Escrow, Ltd., 5.0%, 2/15/28 (144A) | 10,453,640 | ||
| Total Leisure Time | $ 20,298,172 | |||
| Lodging — 0.9% | ||||
| 3,115,000 | Genting New York LLC/GENNY Capital, Inc., | |||
| 3.3%, 2/15/26 | ||||
| (144A) | $ 3,108,280 | |||
| 2,335,000 | Hilton Domestic Operating Co., Inc., 3.625%, | |||
| 2/15/32 (144A) | 2,266,351 | |||
| 4,040,000 | Hilton Domestic Operating Co., Inc., 3.75%, | |||
| 5/1/29 (144A) | 3,999,600 | |||
| 3,860,000 | Hilton Domestic Operating Co., Inc., 4.0%, 5/1/31 (144A) | 3,860,000 | ||
| 555,000 | Hilton Domestic Operating Co., Inc., 5.75%, | |||
| 5/1/28 (144A) | 597,330 | |||
| 18,320,000 | Marriott International, Inc., 3.5%, 10/15/32 | 18,927,036 | ||
| 2,659,000 | Marriott International, Inc., 4.625%, 6/15/30 | 2,972,647 | ||
| 4,500,000 | Sands China Ltd., 4.375%, 6/18/30 | 4,770,675 | ||
| Total Lodging | $ 40,501,919 | |||
| Machinery-Diversified — 0.1% | ||||
EUR | 3,950,000 | Sofima Holding SPA, 3.75%, 1/15/28 (144A) | $ 4,661,116 | |
| Total Machinery-Diversified | $ 4,661,116 | |||
| Media — 0.6% | ||||
| 6,000,000 | CCO Holdings LLC/CCO Holdings Capital Corp., | |||
| 4.75%, 3/1/30 (144A) | $ 6,217,500 | |||
| 6,200,000 | CSC Holdings LLC, 4.625%, 12/1/30 (144A) | 6,098,413 | ||
| 1,345,000 | CSC Holdings LLC, 5.5%, 4/15/27 (144A) | 1,412,721 | ||
| 3,311,000 | Diamond Sports Group LLC/Diamond Sports | |||
| Finance Co., 6.625%, | ||||
| 8/15/27 (144A) | 1,738,275 | |||
The accompanying notes are an integral part of these financial statements.
Pioneer Strategic Income Fund | Semiannual Report | 3/31/21 47
Schedule of Investments | 3/31/21
(unaudited) (continued)
| Principal | |||
| Amount | |||
| USD ($) | Value | ||
| Media — (continued) | |||
| 1,630,000 | Entercom Media Corp., 6.75%, 3/31/29 (144A) | $ 1,694,263 | |
| 7,835,000 | Gray Television, Inc., 7.0%, 5/15/27 (144A) | 8,520,562 | |
| 2,025,000 | Sinclair Television Group, Inc., 4.125%, 12/1/30 (144A) | 1,949,062 | |
| Total Media | $ 27,630,796 | ||
| Mining — 1.6% | |||
| 3,200,000 | Alcoa Nederland Holding BV, 4.125%, 3/31/29 (144A) | $ 3,227,328 | |
| 3,405,000 | AngloGold Ashanti Holdings Plc, 3.75%, 10/1/30 | 3,440,215 | |
| 3,755,000 | Coeur Mining, Inc., 5.125%, 2/15/29 (144A) | 3,589,592 | |
| 2,065,000 | Constellium SE, 3.75%, 4/15/29 (144A) | 1,974,305 | |
| 6,744,000 | First Quantum Minerals, Ltd., 7.25%, 4/1/23 (144A) | 6,862,020 | |
| 13,650,000 | FMG Resources August 2006 Pty Ltd., 4.375%, | ||
| 4/1/31 (144A) | 13,905,937 | ||
| 15,215,000 | Freeport-McMoRan, Inc., 5.45%, 3/15/43 | 18,267,738 | |
| 1,735,000 | Hudbay Minerals, Inc., 4.5%, 4/1/26 (144A) | 1,803,203 | |
| 4,720,000 | IAMGOLD Corp., 5.75%, 10/15/28 (144A) | 4,780,416 | |
| 3,579,000 | Joseph T Ryerson & Son, Inc., 8.5%, 8/1/28 (144A) | 4,008,480 | |
| EUR 1,825,000 | Novelis Sheet Ingot GmbH, 3.375%, 4/15/29 (144A) | 2,204,768 | |
| 1,797,000 | Rusal Capital, DAC, 4.85%, 2/1/23 (144A) | 1,811,376 | |
| 3,550,000 | Rusal Capital, DAC, 5.125%, 2/2/22 (144A) | 3,574,886 | |
| Total Mining | $ 69,450,264 | ||
| Miscellaneous Manufacturers — 0.4% | |||
| 5,765,000 | General Electric Co., 4.25%, 5/1/40 | $ 6,356,489 | |
| 6,525,000 | General Electric Co., 4.35%, 5/1/50 | 7,215,444 | |
| 3,040,000 | Hillenbrand, Inc., 3.75%, 3/1/31 | 2,976,282 | |
| Total Miscellaneous Manufacturers | $ 16,548,215 | ||
| Multi-National — 1.2% | |||
| 12,922,000 | Africa Finance Corp., 4.375%, 4/17/26 (144A) | $ 13,987,290 | |
| 4,880,000 | African Export-Import Bank, 3.994%, 9/21/29 (144A) | 5,117,910 | |
| 8,430,000 | Banque Ouest Africaine de Developpement, 4.7%, | ||
| 10/22/31 (144A) | 8,987,830 | ||
| 2,860,000 | Banque Ouest Africaine de Developpement, 5.0%, | ||
| 7/27/27 (144A) | 3,158,870 | ||
| IDR 189,000,300,000 | European Bank for Reconstruction & Development, | ||
| 6.45%, 12/13/22 | 13,291,828 | ||
| IDR 113,010,000,000 | Inter-American Development Bank, 7.875%, 3/14/23 | 8,158,505 | |
| Total Multi-National | $ 52,702,233 | ||
| Oil & Gas — 2.3% | |||
| 28,023,000 | Cenovus Energy, Inc., 6.75%, 11/15/39 | $ 34,882,711 | |
| 1,080,000 | EQT Corp., 5.0%, 1/15/29 | 1,155,600 |
The accompanying notes are an integral part of these financial statements.
48 Pioneer Strategic Income Fund | Semiannual Report | 3/31/21
| Principal | ||||
| Amount | ||||
| USD ($) | Value | |||
| Oil & Gas — (continued) | ||||
| 2,880,000 | Hilcorp Energy I LP/Hilcorp Finance Co., 6.0%, | |||
2/1/31 (144A) | $ 2,923,200 | |||
| 3,955,000 | Indigo Natural Resources LLC, 5.375%, 2/1/29 (144A) | 3,896,506 | ||
| 905,000 | MEG Energy Corp., 5.875%, 2/1/29 (144A) | 907,262 | ||
| 895,000 | MEG Energy Corp., 6.5%, 1/15/25 (144A) | 924,490 | ||
| 3,815,000 | MEG Energy Corp., 7.125%, 2/1/27 (144A) | 3,996,212 | ||
| 5,110,000 | Murphy Oil Corp., 6.375%, 7/15/28 | 5,116,388 | ||
| 8,985,000 | Neptune Energy Bondco PLC, 6.625%, 5/15/25 (144A) | 9,018,694 | ||
| 9,125,000 | Occidental Petroleum Corp., 4.4%, 4/15/46 | 7,733,438 | ||
| 3,095,000 | PBF Holding Co. LLC/PBF Finance Corp., 9.25%, | |||
5/15/25 (144A) | 3,155,894 | |||
| 4,667,000 | Petroleos Mexicanos, 5.35%, 2/12/28 | 4,538,191 | ||
| 2,455,000 | Petroleos Mexicanos, 6.875%, 10/16/25 (144A) | 2,663,430 | ||
| 2,814,000 | Precision Drilling Corp., 7.125%, 1/15/26 (144A) | 2,732,281 | ||
| 3,065,000 | Shelf Drilling Holdings, Ltd., 8.875%, 11/15/24 (144A) | 3,065,000 | ||
| 10,067,000 | Valero Energy Corp., 6.625%, 6/15/37 | 13,073,385 | ||
| 4,020,000 | YPF SA, 6.95%, 7/21/27 (144A) | 2,460,562 | ||
ARS | 22,175,000 | YPF SA, 16.5%, 5/9/22 (144A) | 197,679 | |
| Total Oil & Gas | $ 102,440,923 | |||
| Packaging & Containers — 0.5% | ||||
| 10,125,000 | Ball Corp., 2.875%, 8/15/30 | $ 9,752,906 | ||
| 7,630,000 | Greif, Inc., 6.5%, 3/1/27 (144A) | 8,040,113 | ||
| 6,145,000 | TriMas Corp., 4.125%, 4/15/29 (144A) | 6,145,000 | ||
| Total Packaging & Containers | $ 23,938,019 | |||
| Pharmaceuticals — 0.9% | ||||
| 1,831,000 | Bausch Health Americas, Inc., 8.5%, 1/31/27 (144A) | $ 2,031,266 | ||
| 1,720,000 | Bausch Health Cos., Inc., 5.0%, 1/30/28 (144A) | 1,753,024 | ||
| 5,250,000 | Cardinal Health, Inc., 4.9%, 9/15/45 | 6,006,253 | ||
| 4,251,540 | CVS Pass-Through Trust, 5.773%, 1/10/33 (144A) | 4,943,427 | ||
| 654,161 | CVS Pass-Through Trust, 6.036%, 12/10/28 | 763,084 | ||
| 847,994 | CVS Pass-Through Trust, 8.353%, 7/10/31 (144A) | 1,096,137 | ||
| 2,424,000 | Par Pharmaceutical, Inc., 7.5%, 4/1/27 (144A) | 2,577,197 | ||
EUR | 340,000 | Teva Pharmaceutical Finance Netherlands II BV, | ||
6.0%, 1/31/25 | 438,590 | |||
| 13,628,000 | Teva Pharmaceutical Finance Netherlands III BV, | |||
3.15%, 10/1/26 | 13,031,775 | |||
| 7,500,000 | Teva Pharmaceutical Finance Netherlands III BV, | |||
6.75%, 3/1/28 | 8,426,250 | |||
| Total Pharmaceuticals | $ 41,067,003 | |||
The accompanying notes are an integral part of these financial statements.
Pioneer Strategic Income Fund | Semiannual Report | 3/31/21 49
Schedule of Investments | 3/31/21
(unaudited) (continued)
| Principal | ||||
| Amount | ||||
| USD ($) | Value | |||
| Pipelines — 3.6% | ||||
| 6,395,000 | Cheniere Energy Partners LP, 4.0%, 3/1/31 (144A) | $ 6,506,912 | ||
| 2,905,000 | DCP Midstream Operating LP, 3.875%, 3/15/23 | 3,031,077 | ||
| 5,495,000 | DCP Midstream Operating LP, 5.6%, 4/1/44 | 5,495,000 | ||
| 1,415,000 | Enable Midstream Partners LP, 4.15%, 9/15/29 | 1,470,514 | ||
| 7,140,000 | Enable Midstream Partners LP, 4.4%, 3/15/27 | 7,713,821 | ||
| 13,625,000 | Enable Midstream Partners LP, 4.95%, 5/15/28 | 15,011,866 | ||
| 4,555,000 | Energy Transfer Operating LP, 6.0%, 6/15/48 | 5,166,595 | ||
| 1,262,000 | Energy Transfer Operating LP, 6.125%, 12/15/45 | 1,440,976 | ||
| 1,694,000(b)(d) | Energy Transfer Operating LP, 6.625% (3 Month USD | |||
| LIBOR + 416 bps) | 1,499,190 | |||
| 32,377,000(b)(d) | Energy Transfer Operating LP, 7.125% (5 Year CMT | |||
| Index + 531 bps) | 31,544,911 | |||
| 796,000 | EnLink Midstream LLC, 5.375%, 6/1/29 | 744,260 | ||
| 15,145,000 | EnLink Midstream Partners LP, 5.45%, 6/1/47 | 12,216,260 | ||
| 3,862,000 | EnLink Midstream Partners LP, 5.6%, 4/1/44 | 3,205,460 | ||
| 3,600,000 | Hess Midstream Operations LP, 5.125%, 6/15/28 (144A) | 3,639,600 | ||
| 4,224,000 | Midwest Connector Capital Co. LLC, 4.625%, | |||
| 4/1/29 (144A) | 4,280,816 | |||
| 9,425,000 | ONEOK, Inc., 6.875%, 9/30/28 | 11,553,832 | ||
| 4,405,000(b)(d) | Plains All American Pipeline LP, 6.125% (3 Month USD | |||
| LIBOR + 411 bps) | 3,579,327 | |||
| 4,405,000 | Plains All American Pipeline LP/PAA Finance Corp., | |||
| 4.9%, 2/15/45 | 4,313,161 | |||
| 4,525,000 | Sunoco Logistics Partners Operations LP, 5.4%, 10/1/47 | 4,831,539 | ||
| 3,715,000 | Sunoco Logistics Partners Operations LP, 6.1%, 2/15/42 | 4,172,258 | ||
| 5,253,000 | Williams Cos., Inc., 5.75%, 6/24/44 | 6,428,894 | ||
| 8,175,000 | Williams Cos., Inc., 7.5%, 1/15/31 | 10,811,941 | ||
| 8,690,000 | Williams Cos., Inc., 7.75%, 6/15/31 | 11,435,702 | ||
| Total Pipelines | $ 160,093,912 | |||
| Real Estate — 0.3% | ||||
| 13,000,000(b)(d) | AT Securities BV, 5.25% (5 Year USD Swap Rate + | |||
| 355 bps) | $ 13,666,250 | |||
| Total Real Estate | $ 13,666,250 | |||
| REITs — 1.7% | ||||
| 6,505,000 | Corporate Office Properties LP, 2.75%, 4/15/31 | $ 6,285,329 | ||
| 4,800,000 | GLP Capital LP/GLP Financing II, Inc., 4.0%, 1/15/30 | 4,993,200 | ||
| 4,185,000 | Highwoods Realty LP, 4.125%, 3/15/28 | 4,525,806 | ||
| 6,656,000 | Iron Mountain, Inc., 4.5%, 2/15/31 (144A) | 6,580,122 | ||
| 12,750,000 | iStar, Inc., 4.25%, 8/1/25 | 12,837,975 | ||
| 3,345,000 | iStar, Inc., 4.75%, 10/1/24 | 3,480,155 | ||
GBP | 6,460,000 | MPT Operating Partnership LP/MPT Finance Corp., | ||
| 2.5%, 3/24/26 | 8,940,635 | |||
The accompanying notes are an integral part of these financial statements.
50 Pioneer Strategic Income Fund | Semiannual Report | 3/31/21
| Principal | |||
| Amount | |||
| USD ($) | Value | ||
| REITs — (continued) | |||
| 6,440,000 | MPT Operating Partnership LP/MPT Finance Corp., | ||
| 3.5%, 3/15/31 | $ 6,315,461 | ||
| 9,521,000 | MPT Operating Partnership LP/MPT Finance Corp., | ||
| 4.625%, 8/1/29 | 10,016,378 | ||
| 8,337,000 | Uniti Group LP/Uniti Fiber Holdings, Inc./CSL | ||
| Capital LLC, 7.875%, 2/15/25 (144A) | 9,020,634 | ||
| 2,975,000 | Uniti Group LP/Uniti Group Finance, Inc./CSL | ||
| Capital LLC, 6.5%, 2/15/29 (144A) | 2,957,150 | ||
| 892,000 | VICI Properties LP/VICI Note Co., Inc., 4.125%, | ||
| 8/15/30 (144A) | 899,760 | ||
| Total REITs | $ 76,852,605 | ||
| Retail — 0.6% | |||
| 465,000 | Asbury Automotive Group, Inc., 4.5%, 3/1/28 | $ 475,653 | |
| 435,000 | Asbury Automotive Group, Inc., 4.75%, 3/1/30 | 448,050 | |
| 9,241,000 | Beacon Roofing Supply, Inc., 4.875%, 11/1/25 (144A) | 9,448,922 | |
| 1,865,000 | Macy’s Retail Holdings LLC, 5.875%, 4/1/29 (144A) | 1,912,474 | |
| 2,980,000 | Penske Automotive Group, Inc., 3.5%, 9/1/25 | 3,050,179 | |
| 250,000 | PetSmart, Inc./PetSmart Finance Corp., 4.75%, | ||
| 2/15/28 (144A) | 256,203 | ||
| 9,865,000 | QVC, Inc., 4.375%, 9/1/28 | 9,943,180 | |
| 1,350,000 | QVC, Inc., 4.75%, 2/15/27 | 1,397,250 | |
| Total Retail | $ 26,931,911 | ||
| Telecommunications — 1.6% | |||
| 475,000 | Altice France SA, 5.125%, 1/15/29 (144A) | $ 480,938 | |
| 9,874,000 | Altice France SA, 5.5%, 1/15/28 (144A) | 10,133,192 | |
| 4,600,000 | CommScope Technologies LLC, 5.0%, 3/15/27 (144A) | 4,556,898 | |
| 1,976,217 | Digicel Holdings Bermuda, Ltd./Digicel International | ||
| Finance, Ltd., 8.0%, 12/31/26 (144A) | 1,907,049 | ||
| 4,950,371 | Digicel Holdings Bermuda, Ltd./Digicel International | ||
| Finance, Ltd., 8.75%, 5/25/24 (144A) | 5,105,070 | ||
| 1,240,000 | Level 3 Financing, Inc., 3.75%, 7/15/29 (144A) | 1,213,526 | |
| 5,900,000 | Level 3 Financing, Inc., 4.625%, 9/15/27 (144A) | 6,072,103 | |
| 4,235,000 | LogMeIn, Inc., 5.5%, 9/1/27 (144A) | 4,433,537 | |
| 3,010,000 | Lumen Technologies, Inc., 4.0%, 2/15/27 (144A) | 3,074,504 | |
| 4,250,000 | Lumen Technologies, Inc., 4.5%, 1/15/29 (144A) | 4,145,025 | |
| 1,346,400 | Millicom International Cellular SA, 6.25%, 3/25/29 (144A) | 1,497,170 | |
| 4,425,000 | MTN Mauritius Investment, Ltd., 6.5%, 10/13/26 (144A) | 4,944,938 | |
| 4,910,000 | Plantronics, Inc., 4.75%, 3/1/29 (144A) | 4,824,075 | |
| 4,430,000 | T-Mobile USA, Inc., 2.875%, 2/15/31 | 4,281,595 | |
| 10,140,000 | Verizon Communications, Inc., 3.55%, 3/22/51 | 10,095,098 | |
| 3,745,000 | Windstream Escrow LLC/Windstream Escrow Finance | ||
| Corp., 7.75%, 8/15/28 (144A) | 3,805,856 | ||
| Total Telecommunications | $ 70,570,574 |
The accompanying notes are an integral part of these financial statements.
Pioneer Strategic Income Fund | Semiannual Report | 3/31/21 51
Schedule of Investments | 3/31/21
(unaudited) (continued)
| Principal | |||
| Amount | |||
| USD ($) | Value | ||
| Transportation — 0.3% | |||
| 4,910,000 | Hidrovias International Finance SARL, 4.95%, | ||
| 2/8/31 (144A) | $ 4,910,000 | ||
| 6,290,000 | Western Global Airlines LLC, 10.375%, 8/15/25 (144A) | 7,076,250 | |
| Total Transportation | $ 11,986,250 | ||
| TOTAL CORPORATE BONDS | |||
(Cost $1,658,240,358) | $1,740,849,525 | ||
| FOREIGN GOVERNMENT BONDS — 5.0% of | |||
| Net Assets | |||
| Argentina — 0.2% | |||
| 5,955,800(e) | Argentine Republic Government International | ||
| Bond, 0.125%, 7/9/35 | $ 1,777,866 | ||
| 351,880 | Argentine Republic Government International Bond, | ||
| 1.0%, 7/9/29 | 126,564 | ||
| 8,500,000 | Ciudad Autonoma De Buenos Aires, 7.5%, 6/1/27 (144A) | 6,630,085 | |
| 484,980 | Province of Salta Argentina, 9.5%, 3/16/22 (144A) | 429,207 | |
| Total Argentina | $ 8,963,722 | ||
| Bahamas — 0.1% | |||
| 5,815,000 | Bahamas Government International Bond, 8.95%, | ||
| 10/15/32 (144A) | $ 6,192,975 | ||
| Total Bahamas | $ 6,192,975 | ||
| Bahrain — 0.3% | |||
| 7,000,000 | Bahrain Government International Bond, 5.625%, | ||
| 9/30/31 (144A) | $ 6,904,030 | ||
| 5,010,000 | Bahrain Government International Bond, 7.0%, | ||
| 10/12/28 (144A) | 5,580,459 | ||
| Total Bahrain | $ 12,484,489 | ||
| Colombia — 0.1% | |||
| 4,800,000 | Colombia Government International Bond, | ||
| 3.125%, 4/15/31 | $ 4,694,832 | ||
| Total Colombia | $ 4,694,832 | ||
| Dominican Republic — 0.3% | |||
| 11,136,000 | Dominican Republic International Bond, 4.875%, | ||
| 9/23/32 (144A) | $ 11,358,720 | ||
| Total Dominican Republic | $ 11,358,720 | ||
| Egypt — 0.7% | |||
| EGP 197,044,000 | Egypt Government Bond, 15.7%, 11/7/27 | $ 13,127,049 | |
| EUR 5,000,000 | Egypt Government International Bond, 4.75%, | ||
| 4/11/25 (144A) | 6,075,629 | ||
| 2,520,000 | Egypt Government International Bond, 5.875%, | ||
| 2/16/31 (144A) | 2,358,972 |
The accompanying notes are an integral part of these financial statements.
52 Pioneer Strategic Income Fund | Semiannual Report | 3/31/21
| Principal | ||||
| Amount | ||||
| USD ($) | Value | |||
| Egypt — (continued) | ||||
| 5,560,000 | Egypt Government International Bond, 7.053%, | |||
| 1/15/32 (144A) | $ 5,480,414 | |||
| 2,000,000 | Egypt Government International Bond, 8.875%, | |||
| 5/29/50 (144A) | 2,039,448 | |||
| Total Egypt | $ 29,081,512 | |||
| Ghana — 0.4% | ||||
| 4,780,000 | Ghana Government International Bond, 7.875%, | |||
| 2/11/35 (144A) | $ 4,439,568 | |||
GHS | 73,100,000 | Republic of Ghana Government Bonds, 20.75%, 1/16/23 | 13,386,803 | |
| Total Ghana | $ 17,826,371 | |||
| Indonesia — 0.3% | ||||
IDR | 219,632,000,000 | Indonesia Treasury Bond, 6.125%, 5/15/28 | $ 14,644,805 | |
| Total Indonesia | $ 14,644,805 | |||
| Ivory Coast — 0.4% | ||||
EUR | 8,965,000 | Ivory Coast Government International Bond, | ||
| 4.875%, 1/30/32 (144A) | $ 10,241,593 | |||
EUR | 3,270,000 | Ivory Coast Government International Bond, | ||
| 5.875%, 10/17/31 (144A) | 4,045,639 | |||
| 2,500,000 | Ivory Coast Government International Bond, | |||
| 6.125%, 6/15/33 (144A) | 2,553,550 | |||
| Total Ivory Coast | $ 16,840,782 | |||
| Mexico — 0.9% | ||||
| MXN 620,140,000 | Mexican Bonos, 8.5%, 5/31/29 | $ 34,048,003 | ||
| 3,210,000 | Mexico Government International Bond, 3.9%, 4/27/25 | 3,526,634 | ||
| 4,200,000 | Mexico Government International Bond, 5.0%, 4/27/51 | 4,532,556 | ||
| Total Mexico | $ 42,107,193 | |||
| Morocco — 0.2% | ||||
| 8,625,000 | Morocco Government International Bond, 4.0%, | |||
| 12/15/50 (144A) | $ 7,635,264 | |||
| Total Morocco | $ 7,635,264 | |||
| Oman — 0.1% | ||||
| 3,550,000 | Oman Government International Bond, 6.25%, | |||
| 1/25/31 (144A) | $ 3,709,750 | |||
| 1,910,000 | Oman Government International Bond, 6.75%, | |||
| 10/28/27 (144A) | 2,106,730 | |||
| Total Oman | $ 5,816,480 | |||
| Peru — 0.1% | ||||
| 2,175,000 | Peruvian Government International Bond, 2.783%, 1/23/31 | $ 2,172,847 | ||
| Total Peru | $ 2,172,847 | |||
The accompanying notes are an integral part of these financial statements.
Pioneer Strategic Income Fund | Semiannual Report | 3/31/21 53
Schedule of Investments | 3/31/21
(unaudited) (continued)
| Principal | ||||
| Amount | ||||
| USD ($) | Value | |||
| Philippines — 0.2% | ||||
EUR | 2,650,000 | Philippine Government International Bond, | $ 3,108,588 | |
| 0.7%, 2/3/29 | ||||
| 3,071,000 | Philippine Government International Bond, | |||
| 2.95%, 5/5/45 | 2,869,627 | |||
| 2,420,000 | Philippine Government International Bond, | |||
| 5.0%, 1/13/37 | 2,970,650 | |||
| Total Philippines | $ 8,948,865 | |||
| TRINIDAD — 0.1% | ||||
| 4,440,000 | Trinidad & Tobago Government International Bond, | |||
| 4.5%, 6/26/30 (144A) | $ 4,484,444 | |||
| Total TRINIDAD | $ 4,484,444 | |||
| Ukraine — 0.3% | ||||
EUR | 4,490,000 | Ukraine Government International Bond, 4.375%, | ||
| 1/27/30 (144A) | $ 4,821,190 | |||
| 9,575,000 | Ukraine Government International Bond, 7.375%, | |||
| 9/25/32 (144A) | 9,623,449 | |||
| Total Ukraine | $ 14,444,639 | |||
| Uruguay — 0.2% | ||||
UYU | 476,113,000 | Uruguay Government International Bond, 9.875%, | ||
| 6/20/22 (144A) | $ 11,126,399 | |||
| Total Uruguay | $ 11,126,399 | |||
| Uzbekistan — 0.1% | ||||
UZS | 33,340,000,000 | Republic of Uzbekistan Bond, 14.5%, 11/25/23 (144A) | $ 3,177,994 | |
| Total Uzbekistan | $ 3,177,994 | |||
| TOTAL FOREIGN GOVERNMENT BONDS | ||||
(Cost $230,042,515) | $ 222,002,333 | |||
| INSURANCE-LINKED SECURITIES — 3.0% of | ||||
| Net Assets# | ||||
| Event-Linked Bonds — 0.8% | ||||
| Earthquakes – California — 0.1% | ||||
| 1,800,000(c) | Ursa Re, 5.765% (3 Month U.S. Treasury Bill + | |||
| 575 bps), 12/10/22 (144A) | $ 1,822,680 | |||
| 3,000,000(c) | Ursa Re II., 3.765% (3 Month U.S. Treasury Bill + | |||
| 375 bps), 12/7/23 (144A) | 3,066,300 | |||
| $ 4,888,980 | ||||
| Earthquakes – Mexico — 0.0%† | ||||
| 250,000(c) | International Bank for Reconstruction & Development, | |||
| 3.604% (3 Month USD LIBOR + 350 bps), | ||||
3/13/24 (144A) | $ 252,750 | |||
The accompanying notes are an integral part of these financial statements.
54 Pioneer Strategic Income Fund | Semiannual Report | 3/31/21
| Principal | |||
| Amount | |||
| USD ($) | Value | ||
| Earthquakes – U.S. — 0.0%† | |||
| 1,000,000(c) | Acorn Re, 2.773% (3 Month USD LIBOR + 275 bps), | ||
11/10/21 (144A) | $ 1,007,000 | ||
| Health – U.S. — 0.0%† | |||
| 1,500,000(c) | Vitality Re X, 1.765% (3 Month U.S. Treasury Bill + | ||
175 bps), 1/10/23 (144A) | $ 1,492,500 | ||
| Inland Flood – U.S. — 0.1% | |||
| 1,000,000(c) | FloodSmart Re Ltd., 13.015% (3 Month U.S. Treasury | ||
Bill + 1,300 bps), 3/1/24 (144A) | $ 998,700 | ||
| 750,000(c) | FloodSmart Re Ltd., 14.515% (3 Month U.S. Treasury | ||
Bill + 1,450 bps), 2/27/23 (144A) | 757,500 | ||
| $ 1,756,200 | |||
| Multiperil – Europe — 0.1% | |||
| EUR 1,500,000(c) | Lion II Re, DAC, 3.57% (3 Month EURIBOR + | ||
357 bps), 7/15/21 (144A) | $ 1,766,086 | ||
| Multiperil – Florida — 0.0%† | |||
| 250,000(c) | Sanders Re II, 5.515% (3 Month U.S. Treasury Bill + | ||
550 bps), 6/7/23 (144A) | $ 255,000 | ||
| Multiperil – U.S. — 0.2% | |||
| 900,000(c) | Easton Re Pte, 4.015% (3 Month U.S. Treasury Bill + | ||
400 bps), 1/8/24 (144A) | $ 905,850 | ||
| 1,500,000(c) | Four Lakes Re, 7.015% (3 Month U.S. Treasury Bill + | ||
700 bps), 1/5/24 (144A) | 1,491,150 | ||
| 1,500,000(c) | Four Lakes Re, 9.515% (3 Month U.S. Treasury Bill + | ||
950 bps), 1/5/24 (144A) | 1,479,750 | ||
| 500,000(c) | Herbie Re, 9.015% (3 Month U.S. Treasury Bill + | ||
900 bps), 1/8/25 (144A) | 527,900 | ||
| 1,500,000(c) | Residential Reinsurance 2020, 6.265% (3 Month U.S. | ||
Treasury Bill + 625 bps), 12/6/24 (144A) | 1,520,250 | ||
| 1,250,000(c) | Residential Reinsurance 2020 Ltd., 8.265% (3 Month U.S. | ||
Treasury Bill + 825 bps), 12/6/24 (144A) | 1,257,125 | ||
| 250,000(c) | Sanders Re, 2.93% (6 Month USD LIBOR + 293 bps), | ||
12/6/21 (144A) | 249,275 | ||
| 750,000(c) | Sussex Capital UK Pcc, 7.765% (3 Month U.S. Treasury | ||
Bill + 775 bps), 1/8/25 (144A) | 764,250 | ||
| $ 8,195,550 | |||
| Multiperil – U.S. & Canada — 0.0%† | |||
| 1,000,000(c) | Hypatia, Ltd., 9.763% (3 Month U.S. Treasury Bill + | ||
975 bps), 6/7/23 (144A) | $ 1,064,000 | ||
| 500,000(c) | Mona Lisa Re, 8.015% (3 Month U.S. Treasury Bill + | ||
800 bps), 1/9/23 (144A) | 509,000 | ||
| $ 1,573,000 |
The accompanying notes are an integral part of these financial statements.
Pioneer Strategic Income Fund | Semiannual Report | 3/31/21 55
Schedule of Investments | 3/31/21
(unaudited) (continued)
| Principal | |||
| Amount | |||
| USD ($) | Value | ||
| Multiperil – U.S. Regional — 0.1% | |||
| 1,750,000(c) | First Coast Re 2017-1 Ltd., 4.19% (3 Month U.S. | ||
Treasury Bill + 419 bps), 6/7/21 (144A) | $ 1,755,075 | ||
| 2,600,000(c) | Longpoint Re III, 2.765% (3 Month U.S. Treasury Bill + | ||
275 bps), 6/1/22 (144A) | 2,607,020 | ||
| $ 4,362,095 | |||
| Multiperil – Worldwide — 0.0%† | |||
| 500,000(c) | Northshore Re II, 5.765% (3 Month U.S. Treasury Bill + | ||
575 bps), 1/8/24 (144A) | $ 512,000 | ||
| Pandemic – U.S. — 0.0%† | |||
| 500,000(c) | Vitality Re XI, 1.815% (3 Month U.S. Treasury Bill + | ||
180 bps), 1/9/24 (144A) | $ 487,250 | ||
| Windstorm – Texas — 0.0%† | |||
| 1,250,000(c) | Alamo Re, 3.415% (3 Month U.S. Treasury Bill + | ||
340 bps), 6/7/21 (144A) | $ 1,251,500 | ||
| Windstorm – U.S. — 0.0%† | |||
| 750,000(c) | Bonanza Re, 4.765% (3 Month U.S. Treasury Bill + | ||
475 bps), 12/23/24 (144A) | $ 756,600 | ||
| Windstorm – U.S. Regional — 0.2% | |||
| 1,250,000(g) | Matterhorn Re, 12/7/21 (144A) | $ 1,165,375 | |
| 1,500,000(c) | Matterhorn Re, 4.386% (3 Month USD LIBOR + | ||
425 bps), 12/7/22 (144A) | 1,504,350 | ||
| 2,000,000(c) | Matterhorn Re, 5.636% (3 Month USD LIBOR + | ||
550 bps), 12/7/22 (144A) | 2,008,000 | ||
| 250,000(c) | Matterhorn Re, 7.015% (3 Month U.S. Treasury Bill + | ||
700 bps), 12/7/21 (144A) | 255,325 | ||
| 1,250,000(c) | Matterhorn Re, 10.015% (3 Month U.S. Treasury Bill + | ||
1,000 bps), 12/7/21 (144A) | 1,289,375 | ||
| $ 6,222,425 | |||
| Total Event-Linked Bonds | $ 34,778,936 |
| Face | |||
| Amount | |||
| USD ($) | |||
| Collateralized Reinsurance — 0.5% | |||
| Multiperil – Massachusetts — 0.1% | |||
| 2,600,000+(a)(h) | Denning Re, 7/31/24 | $ 2,602,604 | |
| Multiperil – U.S. — 0.2% | |||
| 6,000,000+(a)(h) | Ballybunion Re, 2/28/22 | $ 6,270,334 | |
| 2,831,231+(h) | Ballybunion Re 2020-3, 7/31/24 | 2,831,231 | |
| 600,000+(h) | Dingle Re 2019, 2/1/22 | 12,315 | |
| 550,000+(a)(h) | Dingle Re 2020, 12/31/21 | 568,971 | |
| 1,150,000+(a)(h) | Port Royal Re 2019, 5/31/21 | 1,201,482 | |
| $ 10,884,333 |
The accompanying notes are an integral part of these financial statements.
56 Pioneer Strategic Income Fund | Semiannual Report | 3/31/21
| Face | |||
| Amount | |||
| USD ($) | Value | ||
| Multiperil – U.S. Regional — 0.0%† | |||
| 2,000,000+(a)(h) | Ailsa Re 2019, 6/30/21 | $ 2,120,344 | |
| Multiperil – Worldwide — 0.1% | |||
140,000+(a)(g)(h) Limestone Re, 3/1/23 (144A) | |||
| 480,000+(a)(h) | Limestone Re, 3/1/24 (144A) | $ 228,830 | |
| 12,000+(g)(h) | Limestone Re 2016-1, 8/31/21 | 1,000 | |
| 86,000+(h) | Limestone Re 2016-1, 8/31/21 | 7,164 | |
| 20,000+(h) | Limestone Re 2019-B, 9/9/22 (144A) | — | |
| 1,020,000+(a)(h) | Limestone Re 2020-1, Series A, 3/1/24 (144A) | 266,424 | |
| 1,110,000+(a)(h) | Limestone Re 2020-2, 10/1/24 | 1,199,133 | |
| 250,000+(h) | Merion Re 2021-1, 12/31/24 | 223,892 | |
| 600,000+(a)(h) | Old Head Re 2021, 12/31/24 | 491,918 | |
| 500,000+(h) | Pine Valley Re 2021, 12/31/24 | 472,010 | |
| 4,500,000+(a)(g)(h) | Resilience Re, 4/6/21 | 450 | |
| 850,864+(a)(h) | Seminole Re 2018, 1/15/21 | 21,023 | |
| 608,616+(a)(h) | Walton Health Re 2018, 6/15/21 | 191,181 | |
| 300,000+(a)(h) | Walton Health Re 2019, 6/30/21 | 252,101 | |
| $ 3,480,502 | |||
| Windstorm – Florida — 0.0%† | |||
| 2,250,000+(h) | Cedar Re 2020, 6/30/24 | $ 67,531 | |
| 1,750,000+(a)(h) | Formby Re 2018, 2/28/22 | 243,588 | |
| 2,200,000+(a)(h) | Portrush Re 2017, 6/15/21 | 1,403,820 | |
| $ 1,714,939 | |||
| Windstorm – North Carolina — 0.0%† | |||
| 2,000,000+(h) | Isosceles Re 2020, 4/30/22 | $ 26,000 | |
| Windstorm – U.S. Multistate — 0.0%† | |||
| 1,500,000+(h) | White Heron Re 2020, 6/30/24 | $ 57,900 | |
| Windstorm – U.S. Regional — 0.1% | |||
| 1,000,000+(h) | Liphook Re 2020, 6/30/24 | $ 1,029,778 | |
| 1,250,000+(a)(h) | Oakmont Re 2017, 4/30/21 | 36,750 | |
| 2,000,000+(a)(h) | Oakmont Re 2020, 4/30/24 | 1,597,209 | |
| $ 2,663,737 | |||
| Total Collateralized Reinsurance | $ 23,550,359 | ||
| Reinsurance Sidecars — 1.7% | |||
| Multiperil – U.S. — 0.1% | |||
| 10,188,000+(a)(h) | Carnoustie Re 2017, 11/30/21 | $ 1,342,778 | |
| 1,000,000+(h) | Carnoustie Re 2019, 12/31/22 | 1,900 | |
| 1,750,000+(a)(h) | Carnoustie Re 2020, 12/31/23 | 285,600 | |
| 1,390,289+(a)(h) | Carnoustie Re 2021, 12/31/24 | 1,413,981 | |
| 2,800,000+(a)(h) | Castle Stuart Re 2018, 12/1/21 | 87,498 |
The accompanying notes are an integral part of these financial statements.
Pioneer Strategic Income Fund | Semiannual Report | 3/31/21 57
Schedule of Investments | 3/31/21
(unaudited) (continued)
| Face | |||
| Amount | |||
| USD ($) | Value | ||
| Multiperil – U.S — (continued) | |||
| 3,000,000+(a)(i) | Harambee Re 2018, 12/31/21 | $ 10,800 | |
| 5,000,000+(i) | Harambee Re 2019, 12/31/22 | 42,000 | |
| 3,000,000+(a)(i) | Harambee Re 2020, 12/31/23 | 322,200 | |
| $ 3,506,757 | |||
| Multiperil – Worldwide — 1.6% | |||
| 2,201+(h) | Alturas Re 2019-1, 3/10/23 (144A) | $ 10,065 | |
| 33,410+(i) | Alturas Re 2019-2, 3/10/22 | 88,734 | |
| 357,085+(a)(h) | Alturas Re 2020-1B, 3/10/23 (144A) | 163,474 | |
| 360,465+(i) | Alturas Re 2020-2, 3/10/23 | 451,951 | |
| 250,000+(a)(i) | Alturas Re 2020-3, 9/30/24 | 249,500 | |
| 2,639,535+(a)(h) | Alturas Re 2021-2, 12/31/24 | 2,611,028 | |
| 4,000,000+(a)(h) | Bantry Re 2016, 3/31/21 | 322,400 | |
| 3,000,000+(a)(h) | Bantry Re 2017, 3/31/22 | 175,323 | |
| 2,500,000+(a)(h) | Bantry Re 2018, 12/31/21 | 28,500 | |
| 4,000,000+(a)(h) | Bantry Re 2019, 12/31/22 | 135,855 | |
| 3,821,406+(a)(h) | Bantry Re 2020, 12/31/20 | 558,690 | |
| 3,932,000+(a)(h) | Bantry Re 2021, 12/31/24 | 4,018,262 | |
| 3,605,000+(a)(h) | Berwick Re 2017-1, 2/1/22 | 119,325 | |
| 13,924,181+(a)(h) | Berwick Re 2018-1, 12/31/21 | 1,337,865 | |
| 9,947,951+(a)(h) | Berwick Re 2019-1, 12/31/22 | 1,188,780 | |
| 2,000,000+(h) | Berwick Re 2020-1, 12/31/23 | 200 | |
| 3,000,000+(a)(h) | Berwick Re 2021-1, 12/31/24 | 3,050,100 | |
| 1,750,000+(i) | Blue Lotus Re, 12/31/21 | 53,725 | |
| 73,625+(g)(h) | Eden Re II, 3/22/23 (144A) | 425,930 | |
| 700,000+(a)(g)(h) | Eden Re II, 3/22/24 (144A) | 849,310 | |
| 155,000+(g)(h) | Eden Re II, 3/22/22 (144A) | 126,329 | |
| 232,500+(g)(h) | Eden Re II, 3/22/22 (144A) | 183,624 | |
| 6,300,000+(a)(g) | Eden Re II, Series B, 3/21/25 (144A) | 6,076,350 | |
| 6,500,000+(a)(h) | Gleneagles Re 2016, 11/30/21 | 202,800 | |
| 1,500,000+(a)(h) | Gleneagles Re 2018, 12/31/21 | 177,450 | |
| 1,156,688+(h) | Gleneagles Re 2019, 12/31/22 | 25,849 | |
| 1,270,798+(a)(h) | Gleneagles Re 2020, 12/31/23 | 180,199 | |
| 1,250,000+(a)(h) | Gleneagles Re 2021, 12/31/24 | 1,279,922 | |
| 2,737,878+(a)(h) | Gullane Re 2018, 12/31/21 | 466,706 | |
| 5,000,000+(a)(h) | Gullane Re 2021, 12/31/24 | 5,097,057 | |
| 7,000+(h) | Limestone Re 2018, 3/1/22 | 1 | |
| 500,000+(i) | Lion Rock Re 2019, 1/31/22 | 20,250 | |
| 500,000+(h) | Lion Rock Re 2020, 1/31/22 | 19,900 | |
| 500,000+(a)(i) | Lion Rock Re 2021, 12/31/24 | 531,800 | |
| 6,000,000+(a)(i) | Lorenz Re 2018, 7/1/21 | 64,200 |
The accompanying notes are an integral part of these financial statements.
58 Pioneer Strategic Income Fund | Semiannual Report | 3/31/21
| Face | |||
| Amount | |||
| USD ($) | Value | ||
| Multiperil – Worldwide — (continued) | |||
| 2,545,246+(a)(i) | Lorenz Re 2019, 6/30/22 | $ 119,627 | |
| 1,282,713+(a)(i) | Lorenz Re 2020, 6/30/23 | 1,329,275 | |
| 1,717,287+(a)(i) | Lorenz Re 2020, 6/30/23 | 1,779,625 | |
| 8,500,000+(a)(h) | Merion Re 2018-2, 12/31/21 | 1,406,750 | |
| 9,000,000+(a)(h) | Merion Re 2021-2, 12/31/24 | 9,215,329 | |
| 6,150,000+(h) | Pangaea Re 2016-2, 11/30/21 | 10,967 | |
| 4,750,000+(a)(h) | Pangaea Re 2018-1, 12/31/21 | 100,009 | |
| 7,100,000+(a)(h) | Pangaea Re 2018-3, 7/1/22 | 147,278 | |
| 3,891,425+(a)(h) | Pangaea Re 2019-1, 2/1/23 | 81,087 | |
| 5,220,725+(a)(h) | Pangaea Re 2019-3, 7/1/23 | 187,794 | |
| 3,850,570+(h) | Pangaea Re 2020-1, 2/1/24 | 81,717 | |
| 4,500,000+(a)(h) | Pangaea Re 2020-1, 12/31/24 | 4,594,785 | |
| 3,500,000+(a)(h) | Pangaea Re 2020-3, 7/1/24 | 3,794,547 | |
| 1,000,000+(a)(h) | Phoenix One Re, ¼/27 | 1,007,700 | |
| 1,800,000+(a)(g)(h) | Sector Re V, 12/1/23 (144A) | 422,027 | |
| 155,997+(a)(g)(h) | Sector Re V, 12/1/24 (144A) | 370,441 | |
| 540,000+(a)(g)(h) | Sector Re V, 3/1/25 (144A) | 642,359 | |
| 1,696,451+(a)(g)(h) | Sector Re V, 3/1/25 (144A) | 1,840,735 | |
| 2,753,972+(a)(g) | Sector Re V, 12/1/25 (144A) | 2,675,344 | |
| 710,000+(a)(g)(h) | Sector Re V, Ltd., 3/1/25 (144A) | 844,584 | |
| 540,031+(a)(g)(h) | Sector Re V, Series 8, Class D, 12/1/23 (144A) | 141,370 | |
| 360,000+(a)(g)(h) | Sector Re V, Series 9, Class A, 3/1/24 (144A) | 202,796 | |
| 150,000+(a)(g)(h) | Sector Re V, Series 9, Class C, 12/1/24 (144A) | 356,200 | |
| 3,608+(g)(h) | Sector Re V, Series 9, Class G, 3/1/24 (144A) | 60,171 | |
| 5,855,000+(a)(h) | St. Andrews Re 2017-1, 2/1/22 | 396,969 | |
| 2,606,976+(a)(h) | St. Andrews Re 2017-4, 6/1/21 | 256,526 | |
| 3,609,700+(h) | Sussex Re 2020-1, 12/31/22 | 240,406 | |
| 1,000,000+(a) | Sussex Re 2021-1, 12/31/24 | 996,000 | |
| 1,000,000+(a)(i) | Thopas Re 2018, 12/31/21 | 6,300 | |
| 3,000,000+(a)(i) | Thopas Re 2019, 12/31/22 | 125,400 | |
| 4,000,000+(i) | Thopas Re 2020, 12/31/23 | 13,200 | |
| 5,000,000+(a) | Thopas Re 2021, 12/31/24 | 5,002,500 | |
| 3,000,000+(a)(h) | Versutus Re 2018, 12/31/21 | 9,900 | |
| 2,647,642+(h) | Versutus Re 2019-A, 12/31/21 | 49,246 | |
| 852,358+(h) | Versutus Re 2019-B, 12/31/21 | 15,854 | |
| 1,250,000+(a)(i) | Viribus Re 2018, 12/31/21 | — | |
| 3,650,000+(a)(i) | Viribus Re 2019, 12/31/22 | 150,745 | |
| 4,139,570+(a)(i) | Viribus Re 2020, 12/31/23 | 23,596 |
The accompanying notes are an integral part of these financial statements.
Pioneer Strategic Income Fund | Semiannual Report | 3/31/21 59
Schedule of Investments | 3/31/21
(unaudited) (continued)
| Face | |||
| Amount | |||
| USD ($) | Value | ||
| Multiperil – Worldwide — (continued) | |||
| 3,717,666+(a)(i) | Viribus Re 2021, 12/31/24 | $ 3,890,166 | |
| 1,826,168+(a)(h) | Woburn Re 2018, 12/31/21 | 134,042 | |
| 3,539,362+(a)(h) | Woburn Re 2019, 12/31/22 | 1,046,589 | |
| $ 74,061,410 | |||
| Total Reinsurance Sidecars | $ 77,568,167 | ||
| TOTAL INSURANCE-LINKED SECURITIES | |||
(Cost $136,651,355) | $ 135,897,462 |
| Principal | |||
| Amount | |||
| USD ($) | |||
| MUNICIPAL BOND — 0.1% of Net Assets(j) | |||
| Municipal Higher Education — 0.1% | |||
| 2,300,000 | Trustees of Amherst College, 3.794%, 11/1/42 | $ 2,396,443 | |
| Total Municipal Higher Education | $ 2,396,443 | ||
| TOTAL MUNICIPAL BOND | |||
(Cost $2,300,000) | $ 2,396,443 | ||
| SENIOR SECURED FLOATING RATE LOAN | |||
| INTERESTS — 1.1% of Net Assets*(c) | |||
| Aerospace & Defense — 0.1% | |||
| 3,036,667 | Grupo Aeroméxico, SAB. De C.V., DIP Tranche 1 | ||
| Term Loan, 9.0% (LIBOR + 800 bps), 12/31/21 | $ 3,093,604 | ||
| 340,987 | United Airlines, Inc., Refinanced Term Loan, 1.865% | ||
| (LIBOR + 175 bps), 4/1/24 | 332,037 | ||
| Total Aerospace & Defense | $ 3,425,641 | ||
| Airlines — 0.0%† | |||
| 713,888 | Grupo Aeroméxico, SAB. De C.V., DIP Tranche 2 | ||
| Term Loan, 15.5% (LIBOR + 1,450 bps), 12/31/21 | $ 732,627 | ||
| Total Airlines | $ 732,627 | ||
| Automobile — 0.1% | |||
| 2,530,890 | Navistar, Inc., Tranche B Term Loan, 3.62% (LIBOR + | ||
| 350 bps), 11/6/24 | $ 2,535,003 | ||
| Total Automobile | $ 2,535,003 | ||
| Buildings & Real Estate — 0.0%† | |||
| 2,018,536 | WireCo WorldGroup, Inc. (WireCo WorldGroup | ||
| Finance LP), First Lien Initial Term Loan, 6.0% (LIBOR + | |||
| 500 bps), 9/29/23 | $ 1,974,381 | ||
| Total Buildings & Real Estate | $ 1,974,381 |
The accompanying notes are an integral part of these financial statements.
60 Pioneer Strategic Income Fund | Semiannual Report | 3/31/21
| Principal | |||
| Amount | |||
| USD ($) | Value | ||
| Computers & Electronics — 0.0%† | |||
| 1,399,501 | Energy Acquisition LP (aka Electrical Components | ||
International), First Lien Initial Term Loan, | |||
| 4.359% (LIBOR + 425 bps), 6/26/25 | $ 1,369,543 | ||
| Total Computers & Electronics | $ 1,369,543 | ||
| Diversified & Conglomerate Manufacturing — 0.0%† | |||
| 1,278,838 | Pelican Products, Inc., First Lien Term Loan, 4.5% | ||
| (LIBOR + 350 bps), 5/1/25 | $ 1,266,848 | ||
| Total Diversified & Conglomerate Manufacturing | $ 1,266,848 | ||
| Electronics — 0.2% | |||
| 7,761,580 | Scientific Games International, Inc., Initial Term B-5 | ||
| Loan, 2.859% (LIBOR + 275 bps), 8/14/24 | $ 7,621,871 | ||
| Total Electronics | $ 7,621,871 | ||
| Entertainment & Leisure — 0.1% | |||
| 3,790,658 | Sabre GLBL, Inc., 2018 Other Term B Loan, 2.109% | ||
| (LIBOR + 200 bps), 2/22/24 | $ 3,746,591 | ||
| Total Entertainment & Leisure | $ 3,746,591 | ||
| Finance — 0.2% | |||
| 11,320,000(k) | Bank of Industry, Ltd. (LIBOR + 600 bps), 3/15/21 | $ 11,206,800 | |
| Total Finance | $ 11,206,800 | ||
| Healthcare, Education & Childcare — 0.1% | |||
| 3,072,101 | Alliance HealthCare Services, Inc., First Lien Initial Term | ||
| Loan, 5.5% (LIBOR + 450 bps), 10/24/23 | $ 2,880,095 | ||
| 445,700 | KUEHG Corp. (fka KC MergerSub, Inc.) (aka KinderCare), | ||
| Term B-3 Loan, 4.75% (LIBOR + 375 bps), 2/21/25 | 436,786 | ||
| Total Healthcare, Education & Childcare | $ 3,316,881 | ||
| Insurance — 0.2% | |||
| 6,841,994 | Confie Seguros Holding II Co., Term B Loan, 5.75% | ||
| (LIBOR + 475 bps), 4/19/22 | $ 6,761,970 | ||
| Total Insurance | $ 6,761,970 | ||
| Leisure & Entertainment — 0.1% | |||
| 2,711,800 | Fitness International LLC, Term B Loan, 4.25% (LIBOR + | ||
| 325 bps), 4/18/25 | $ 2,505,365 | ||
| Total Leisure & Entertainment | $ 2,505,365 | ||
| Retail — 0.0%† | |||
| 1,375,500 | Staples, Inc., 2019 Refinancing New Term B-2 Loan, | ||
| 4.705% (LIBOR + 450 bps), 9/12/24 | $ 1,360,885 | ||
| Total Retail | $ 1,360,885 | ||
| TOTAL SENIOR SECURED FLOATING RATE | |||
| LOAN INTERESTS | |||
(Cost $48,204,658) | $ 47,824,406 |
The accompanying notes are an integral part of these financial statements.
Pioneer Strategic Income Fund | Semiannual Report | 3/31/21 61
Schedule of Investments | 3/31/21
(unaudited) (continued)
| Principal | |||
| Amount | |||
| USD ($) | Value | ||
| U.S. GOVERNMENT AND AGENCY | |||
| OBLIGATIONS — 19.1% of Net Assets | |||
| 11,000,000 | Fannie Mae, 1.5%, 4/1/36 (TBA) | $ 11,046,406 | |
| 10,000,000 | Fannie Mae, 1.5%, 5/1/36 (TBA) | 10,026,354 | |
| 13,800,000 | Fannie Mae, 2.0%, 4/1/36 (TBA) | 14,158,477 | |
| 33,000,000 | Fannie Mae, 2.0%, 4/1/51 (TBA) | 32,902,676 | |
| 65,300,000 | Fannie Mae, 2.0%, 5/1/51 (TBA) | 64,987,529 | |
| 87,000,000 | Fannie Mae, 2.5%, 5/1/51 (TBA) | 89,027,168 | |
| 217,326 | Fannie Mae, 3.0%, 9/1/39 | 226,303 | |
| 142,739 | Fannie Mae, 3.0%, 10/1/39 | 149,066 | |
| 2,262,427 | Fannie Mae, 3.0%, 1/1/40 | 2,358,779 | |
| 1,021,033 | Fannie Mae, 3.0%, 2/1/40 | 1,063,642 | |
| 655,872 | Fannie Mae, 3.0%, 4/1/40 | 685,323 | |
| 763,572 | Fannie Mae, 3.0%, 7/1/45 | 803,884 | |
| 89,214 | Fannie Mae, 3.0%, 5/1/46 | 94,375 | |
| 115,605 | Fannie Mae, 3.0%, 10/1/46 | 123,207 | |
| 195,375 | Fannie Mae, 3.0%, 11/1/46 | 204,506 | |
| 277,786 | Fannie Mae, 3.0%, 11/1/46 | 290,030 | |
| 55,598 | Fannie Mae, 3.0%, 1/1/47 | 58,922 | |
| 61,581 | Fannie Mae, 3.0%, 3/1/47 | 65,329 | |
| 456,879 | Fannie Mae, 3.0%, 3/1/47 | 478,209 | |
| 12,000,000 | Fannie Mae, 3.0%, 4/1/48 (TBA) | 12,498,984 | |
| 2,668,690 | Fannie Mae, 3.0%, 5/1/48 | 2,843,711 | |
| 28,800,000 | Fannie Mae, 3.0%, 5/1/49 (TBA) | 30,003,187 | |
| 342,358 | Fannie Mae, 3.0%, 7/1/49 | 363,201 | |
| 2,850,819 | Fannie Mae, 3.0%, 8/1/49 | 2,972,365 | |
| 634,502 | Fannie Mae, 3.0%, 9/1/49 | 661,596 | |
| 2,016,717 | Fannie Mae, 3.0%, 9/1/49 | 2,103,832 | |
| 4,462,031 | Fannie Mae, 3.0%, 9/1/49 | 4,669,616 | |
| 387,291 | Fannie Mae, 3.0%, 10/1/49 | 403,988 | |
| 166,667 | Fannie Mae, 3.0%, 1/1/50 | 173,899 | |
| 75,456 | Fannie Mae, 3.0%, 3/1/50 | 78,766 | |
| 1,172,089 | Fannie Mae, 3.0%, 6/1/50 | 1,221,046 | |
| 2,412,292 | Fannie Mae, 3.5%, 7/1/42 | 2,613,933 | |
| 4,887,382 | Fannie Mae, 3.5%, 6/1/45 | 5,258,542 | |
| 1,514,423 | Fannie Mae, 3.5%, 9/1/45 | 1,644,351 | |
| 6,335,942 | Fannie Mae, 3.5%, 9/1/45 | 6,919,044 | |
| 1,058,656 | Fannie Mae, 3.5%, 6/1/46 | 1,144,529 | |
| 857,084 | Fannie Mae, 3.5%, 9/1/46 | 930,812 | |
| 417,286 | Fannie Mae, 3.5%, 10/1/46 | 448,209 | |
| 208,997 | Fannie Mae, 3.5%, 7/1/47 | 222,980 | |
| 23,000,000 | Fannie Mae, 3.5%, 4/1/48 (TBA) | 24,287,461 |
The accompanying notes are an integral part of these financial statements.
62 Pioneer Strategic Income Fund | Semiannual Report | 3/31/21
| Principal | |||
| Amount | |||
| USD ($) | Value | ||
| U.S. GOVERNMENT AND AGENCY | |||
| OBLIGATIONS— (continued) | |||
| 1,097,164 | Fannie Mae, 3.5%, 4/1/50 | $ 1,158,860 | |
| 5,058 | Fannie Mae, 4.0%, 12/1/23 | 5,412 | |
| 5,514 | Fannie Mae, 4.0%, 12/1/30 | 5,968 | |
| 397,933 | Fannie Mae, 4.0%, 9/1/37 | 436,497 | |
| 5,607,147 | Fannie Mae, 4.0%, 10/1/40 | 6,249,314 | |
| 2,378,512 | Fannie Mae, 4.0%, 12/1/40 | 2,650,909 | |
| 4,000 | Fannie Mae, 4.0%, 11/1/41 | 4,400 | |
| 845,887 | Fannie Mae, 4.0%, 11/1/41 | 936,399 | |
| 28,656 | Fannie Mae, 4.0%, 12/1/41 | 31,332 | |
| 1,273,352 | Fannie Mae, 4.0%, 12/1/41 | 1,409,356 | |
| 6,389,446 | Fannie Mae, 4.0%, 12/1/41 | 7,073,523 | |
| 748,372 | Fannie Mae, 4.0%, 1/1/42 | 820,719 | |
| 2,332,132 | Fannie Mae, 4.0%, 1/1/42 | 2,569,969 | |
| 820,991 | Fannie Mae, 4.0%, 2/1/42 | 903,266 | |
| 1,682,716 | Fannie Mae, 4.0%, 2/1/42 | 1,862,837 | |
| 103,578 | Fannie Mae, 4.0%, 4/1/42 | 111,070 | |
| 1,504,413 | Fannie Mae, 4.0%, 4/1/42 | 1,665,385 | |
| 2,420,325 | Fannie Mae, 4.0%, 4/1/42 | 2,679,497 | |
| 147,456 | Fannie Mae, 4.0%, 5/1/42 | 163,275 | |
| 2,415,025 | Fannie Mae, 4.0%, 5/1/42 | 2,649,251 | |
| 145,276 | Fannie Mae, 4.0%, 6/1/42 | 158,268 | |
| 78,618 | Fannie Mae, 4.0%, 7/1/42 | 87,052 | |
| 4,099,041 | Fannie Mae, 4.0%, 8/1/42 | 4,514,587 | |
| 142,307 | Fannie Mae, 4.0%, 10/1/42 | 157,574 | |
| 159,482 | Fannie Mae, 4.0%, 11/1/42 | 171,000 | |
| 1,482,773 | Fannie Mae, 4.0%, 8/1/43 | 1,641,665 | |
| 813,249 | Fannie Mae, 4.0%, 11/1/43 | 901,663 | |
| 967,957 | Fannie Mae, 4.0%, 2/1/44 | 1,071,516 | |
| 53,002 | Fannie Mae, 4.0%, 6/1/44 | 56,861 | |
| 229,055 | Fannie Mae, 4.0%, 10/1/44 | 246,427 | |
| 124,798 | Fannie Mae, 4.0%, 11/1/44 | 133,844 | |
| 34,221 | Fannie Mae, 4.0%, 6/1/45 | 36,985 | |
| 148,305 | Fannie Mae, 4.0%, 7/1/45 | 164,204 | |
| 2,498,226 | Fannie Mae, 4.0%, 4/1/47 | 2,723,502 | |
| 3,090,215 | Fannie Mae, 4.0%, 4/1/47 | 3,356,615 | |
| 248,229 | Fannie Mae, 4.0%, 6/1/47 | 268,922 | |
| 951,506 | Fannie Mae, 4.0%, 6/1/47 | 1,039,168 | |
| 1,817,030 | Fannie Mae, 4.0%, 7/1/47 | 1,977,327 | |
| 109,230 | Fannie Mae, 4.0%, 6/1/49 | 120,383 | |
| 2,025,532 | Fannie Mae, 4.5%, 11/1/40 | 2,271,467 |
The accompanying notes are an integral part of these financial statements.
Pioneer Strategic Income Fund | Semiannual Report | 3/31/21 63
Schedule of Investments | 3/31/21
(unaudited) (continued)
| Principal | |||
| Amount | |||
| USD ($) | Value | ||
| U.S. GOVERNMENT AND AGENCY | |||
| OBLIGATIONS— (continued) | |||
| 5,510,042 | Fannie Mae, 4.5%, 12/1/40 | $ 6,205,385 | |
| 239,931 | Fannie Mae, 4.5%, 3/1/41 | 267,208 | |
| 5,236 | Fannie Mae, 4.5%, 4/1/41 | 5,830 | |
| 2,757,700 | Fannie Mae, 4.5%, 5/1/41 | 3,109,013 | |
| 1,160,021 | Fannie Mae, 4.5%, 7/1/41 | 1,307,806 | |
| 4,669,143 | Fannie Mae, 4.5%, 8/1/41 | 5,200,003 | |
| 304,930 | Fannie Mae, 4.5%, 9/1/41 | 343,770 | |
| 1,710,924 | Fannie Mae, 4.5%, 9/1/43 | 1,905,972 | |
| 498,985 | Fannie Mae, 4.5%, 1/1/47 | 553,190 | |
| 43,000,000 | Fannie Mae, 4.5%, 4/1/49 (TBA) | 46,809,531 | |
| 11,472 | Fannie Mae, 5.0%, 2/1/22 | 12,035 | |
| 660 | Fannie Mae, 5.0%, 4/1/22 | 692 | |
| 2,588 | Fannie Mae, 5.0%, 6/1/22 | 2,715 | |
| 3,356 | Fannie Mae, 5.0%, 6/1/22 | 3,521 | |
| 1,495,562 | Fannie Mae, 5.0%, 6/1/35 | 1,737,703 | |
| 375,081 | Fannie Mae, 5.0%, 7/1/35 | 432,929 | |
| 956,132 | Fannie Mae, 5.0%, 7/1/35 | 1,112,098 | |
| 492,069 | Fannie Mae, 5.0%, 8/1/35 | 571,936 | |
| 165,700 | Fannie Mae, 5.0%, 5/1/38 | 192,805 | |
| 518,314 | Fannie Mae, 5.0%, 1/1/39 | 601,785 | |
| 144,010 | Fannie Mae, 5.0%, 7/1/39 | 167,318 | |
| 324,544 | Fannie Mae, 5.0%, 7/1/39 | 377,341 | |
| 331,996 | Fannie Mae, 5.0%, 7/1/39 | 385,445 | |
| 111,475 | Fannie Mae, 5.0%, 6/1/40 | 129,669 | |
| 897,252 | Fannie Mae, 5.0%, 6/1/40 | 1,044,093 | |
| 638,187 | Fannie Mae, 5.0%, 7/1/40 | 727,006 | |
| 292,357 | Fannie Mae, 5.0%, 10/1/40 | 340,064 | |
| 156,045 | Fannie Mae, 5.0%, 5/1/41 | 178,895 | |
| 160,174 | Fannie Mae, 5.0%, 7/1/41 | 185,900 | |
| 133,791 | Fannie Mae, 5.0%, 12/1/41 | 148,701 | |
| 3,772,070 | Fannie Mae, 5.0%, 9/1/43 | 4,240,198 | |
| 11,438,948 | Fannie Mae, 5.0%, 11/1/44 | 13,296,353 | |
| 5,821 | Fannie Mae, 5.5%, 5/1/33 | 6,514 | |
| 6,080 | Fannie Mae, 5.5%, 6/1/33 | 6,991 | |
| 22,283 | Fannie Mae, 5.5%, 7/1/33 | 25,898 | |
| 42,208 | Fannie Mae, 5.5%, 4/1/34 | 48,805 | |
| 6,769 | Fannie Mae, 5.5%, 10/1/35 | 7,891 | |
| 57,624 | Fannie Mae, 5.5%, 12/1/35 | 67,437 | |
| 36,260 | Fannie Mae, 5.5%, 3/1/36 | 41,851 | |
| 71,882 | Fannie Mae, 5.5%, 4/1/36 | 80,317 |
The accompanying notes are an integral part of these financial statements.
64 Pioneer Strategic Income Fund | Semiannual Report | 3/31/21
| Principal | |||
| Amount | |||
| USD ($) | Value | ||
| U.S. GOVERNMENT AND AGENCY | |||
| OBLIGATIONS— (continued) | |||
| 596 | Fannie Mae, 6.0%, 3/1/32 | $ 707 | |
| 975 | Fannie Mae, 6.0%, 10/1/32 | 1,164 | |
| 3,304 | Fannie Mae, 6.0%, 11/1/32 | 3,717 | |
| 25,071 | Fannie Mae, 6.0%, 12/1/32 | 28,497 | |
| 4,788 | Fannie Mae, 6.0%, 1/1/33 | 5,720 | |
| 2,511 | Fannie Mae, 6.0%, 3/1/33 | 3,000 | |
| 15,896 | Fannie Mae, 6.0%, 5/1/33 | 17,923 | |
| 35,999 | Fannie Mae, 6.0%, 12/1/33 | 43,013 | |
| 32,432 | Fannie Mae, 6.0%, 1/1/34 | 38,751 | |
| 132,360 | Fannie Mae, 6.0%, 6/1/37 | 156,554 | |
| 59,946 | Fannie Mae, 6.0%, 12/1/37 | 71,539 | |
| 94,764 | Fannie Mae, 6.0%, 4/1/38 | 112,682 | |
| 56,674 | Fannie Mae, 6.0%, 7/1/38 | 64,854 | |
| 116 | Fannie Mae, 6.5%, 4/1/29 | 130 | |
| 503 | Fannie Mae, 6.5%, 5/1/31 | 565 | |
| 157 | Fannie Mae, 6.5%, 6/1/31 | 177 | |
| 323 | Fannie Mae, 6.5%, 2/1/32 | 371 | |
| 1,778 | Fannie Mae, 6.5%, 3/1/32 | 1,995 | |
| 979 | Fannie Mae, 6.5%, 8/1/32 | 1,115 | |
| 10,574 | Fannie Mae, 6.5%, 10/1/32 | 11,869 | |
| 374 | Fannie Mae, 7.0%, 5/1/28 | 424 | |
| 192 | Fannie Mae, 7.0%, 2/1/29 | 222 | |
| 275 | Fannie Mae, 7.0%, 7/1/31 | 283 | |
| 332 | Fannie Mae, 7.5%, 1/1/28 | 359 | |
| 884,384 | Federal Home Loan Mortgage Corp., 3.0%, 4/1/40 | 921,636 | |
| 629,335 | Federal Home Loan Mortgage Corp., 3.0%, 4/1/43 | 669,408 | |
| 2,564,779 | Federal Home Loan Mortgage Corp., 3.0%, 2/1/47 | 2,751,599 | |
| 714,473 | Federal Home Loan Mortgage Corp., 3.0%, 4/1/47 | 758,441 | |
| 138,251 | Federal Home Loan Mortgage Corp., 3.0%, 11/1/47 | 146,680 | |
| 3,375,620 | Federal Home Loan Mortgage Corp., 4.0%, 10/1/42 | 3,738,585 | |
| 1,482,915 | Federal Home Loan Mortgage Corp., 4.0%, 4/1/47 | 1,616,980 | |
| 1,892,812 | Federal Home Loan Mortgage Corp., 4.0%, 4/1/47 | 2,060,048 | |
| 283,398 | Federal Home Loan Mortgage Corp., 4.0%, 5/1/49 | 303,997 | |
| 154,262 | Federal Home Loan Mortgage Corp., 4.5%, 10/1/35 | 171,964 | |
| 508,331 | Federal Home Loan Mortgage Corp., 4.5%, 7/1/40 | 570,403 | |
| 304,430 | Federal Home Loan Mortgage Corp., 4.5%, 11/1/40 | 341,604 | |
| 14,457 | Federal Home Loan Mortgage Corp., 4.5%, 9/1/43 | 15,974 | |
| 222,404 | Federal Home Loan Mortgage Corp., 4.5%, 10/1/43 | 251,139 | |
| 787,397 | Federal Home Loan Mortgage Corp., 4.5%, 11/1/43 | 886,768 | |
| 8,542 | Federal Home Loan Mortgage Corp., 4.5%, 3/1/44 | 9,487 |
The accompanying notes are an integral part of these financial statements.
Pioneer Strategic Income Fund | Semiannual Report | 3/31/21 65
Schedule of Investments | 3/31/21
(unaudited) (continued)
| Principal | |||
| Amount | |||
| USD ($) | Value | ||
| U.S. GOVERNMENT AND AGENCY | |||
| OBLIGATIONS— (continued) | |||
| 29,353 | Federal Home Loan Mortgage Corp., 4.5%, 5/1/44 | $ 32,658 | |
| 2,381 | Federal Home Loan Mortgage Corp., 5.0%, 12/1/21 | 2,498 | |
| 24,510 | Federal Home Loan Mortgage Corp., 5.0%, 4/1/23 | 25,741 | |
| 12,192 | Federal Home Loan Mortgage Corp., 5.0%, 5/1/34 | 14,182 | |
| 17,725 | Federal Home Loan Mortgage Corp., 5.0%, 11/1/34 | 20,629 | |
| 69,865 | Federal Home Loan Mortgage Corp., 5.0%, 12/1/34 | 81,049 | |
| 59,489 | Federal Home Loan Mortgage Corp., 5.0%, 7/1/35 | 69,238 | |
| 122,457 | Federal Home Loan Mortgage Corp., 5.0%, 9/1/38 | 142,443 | |
| 177,743 | Federal Home Loan Mortgage Corp., 5.0%, 9/1/38 | 206,773 | |
| 6,269 | Federal Home Loan Mortgage Corp., 5.0%, 10/1/38 | 7,293 | |
| 817 | Federal Home Loan Mortgage Corp., 5.0%, 5/1/39 | 951 | |
| 2,771,458 | Federal Home Loan Mortgage Corp., 5.0%, 11/1/39 | 3,226,176 | |
| 1,528 | Federal Home Loan Mortgage Corp., 5.0%, 12/1/39 | 1,779 | |
| 1,250,126 | Federal Home Loan Mortgage Corp., 5.5%, 6/1/41 | 1,467,767 | |
| 19,172 | Federal Home Loan Mortgage Corp., 6.0%, 1/1/33 | 21,552 | |
| 2,321 | Federal Home Loan Mortgage Corp., 6.0%, 3/1/33 | 2,609 | |
| 12,334 | Federal Home Loan Mortgage Corp., 6.0%, 3/1/33 | 13,868 | |
| 29,222 | Federal Home Loan Mortgage Corp., 6.0%, 1/1/34 | 34,928 | |
| 51,616 | Federal Home Loan Mortgage Corp., 6.0%, 6/1/35 | 58,063 | |
| 26,301 | Federal Home Loan Mortgage Corp., 6.0%, 12/1/36 | 30,661 | |
| 2,342 | Federal Home Loan Mortgage Corp., 6.0%, 10/1/37 | 2,720 | |
| 65,246 | Federal Home Loan Mortgage Corp., 6.0%, 12/1/37 | 77,677 | |
| 1,841 | Federal Home Loan Mortgage Corp., 6.5%, 9/1/32 | 2,067 | |
| 463,153 | Freddie Mac Pool, 3.0%, 12/1/37 | 482,345 | |
| 1,913,328 | Freddie Mac Pool, 3.0%, 10/1/39 | 1,995,993 | |
| 408,725 | Freddie Mac Pool, 3.0%, 11/1/39 | 426,844 | |
| 1,526,083 | Freddie Mac Pool, 3.0%, 2/1/40 | 1,592,019 | |
| 1,327,113 | Freddie Mac Pool, 3.0%, 3/1/40 | 1,383,197 | |
| 13,000,000 | Government National Mortgage Association, | ||
2.0%, 12/30/99 (TBA) | 13,119,082 | ||
| 19,000,000 | Government National Mortgage Association, | ||
2.5%, 12/30/99 (TBA) | 19,590,410 | ||
| 817,652 | Government National Mortgage Association I, | ||
3.5%, 10/15/42 | 874,705 | ||
| 3,220 | Government National Mortgage Association I, | ||
4.0%, 3/15/39 | 3,505 | ||
| 4,841 | Government National Mortgage Association I, | ||
4.0%, 4/15/39 | 5,316 | ||
| 6,039 | Government National Mortgage Association I, | ||
4.0%, 4/15/39 | 6,580 |
The accompanying notes are an integral part of these financial statements.
66 Pioneer Strategic Income Fund | Semiannual Report | 3/31/21
| Principal | ||||
| Amount | ||||
| USD ($) | Value | |||
| U.S. GOVERNMENT AND AGENCY | ||||
| OBLIGATIONS— (continued) | ||||
| 7,677 | Government National Mortgage Association I, | |||
4.0%, 7/15/39 | $ 8,402 | |||
| 5,650 | Government National Mortgage Association I, | |||
4.0%, 1/15/40 | 6,168 | |||
| 108,225 | Government National Mortgage Association I, | |||
4.0%, 4/15/40 | 119,256 | |||
| 180,736 | Government National Mortgage Association I, | |||
4.0%, 7/15/40 | 198,106 | |||
| 58,851 | Government National Mortgage Association I, | |||
4.0%, 8/15/40 | 64,398 | |||
| 115,031 | Government National Mortgage Association I, | |||
4.0%, 8/15/40 | 126,086 | |||
| 29,915 | Government National Mortgage Association I, | |||
4.0%, 9/15/40 | 33,124 | |||
| 6,993 | Government National Mortgage Association I, | |||
4.0%, 10/15/40 | 7,747 | |||
| 11,485 | Government National Mortgage Association I, | |||
4.0%, 10/15/40 | 12,682 | |||
| 36,336 | Government National Mortgage Association I, | |||
4.0%, 10/15/40 | 40,179 | |||
| 4,288 | Government National Mortgage Association I, | |||
4.0%, 11/15/40 | 4,700 | |||
| 32,012 | Government National Mortgage Association I, | |||
4.0%, 11/15/40 | 34,661 | |||
| 140,864 | Government National Mortgage Association I, | |||
4.0%, 11/15/40 | 156,032 | |||
| 162,187 | Government National Mortgage Association I, | |||
4.0%, 11/15/40 | 177,776 | |||
| 4,361 | Government National Mortgage Association I, | |||
4.0%, 12/15/40 | 4,818 | |||
| 5,399 | Government National Mortgage Association I, | |||
4.0%, 12/15/40 | 5,981 | |||
| 97,263 | Government National Mortgage Association I, | |||
4.0%, 12/15/40 | 104,132 | |||
| 480,019 | Government National Mortgage Association I, | |||
4.0%, 12/15/40 | 529,481 | |||
| 4,264 | Government National Mortgage Association I, | |||
4.0%, 1/15/41 | 4,724 | |||
| 23,622 | Government National Mortgage Association I, | |||
4.0%, 1/15/41 | 26,157 | |||
| 43,627 | Government National Mortgage Association I, | |||
4.0%, 1/15/41 | 48,171 | |||
| 9,603 | Government National Mortgage Association I, | |||
4.0%, 2/15/41 | 10,526 | |||
The accompanying notes are an integral part of these financial statements.
Pioneer Strategic Income Fund | Semiannual Report | 3/31/21 67
Schedule of Investments | 3/31/21
(unaudited) (continued)
| Principal | |||
| Amount | |||
| USD ($) | Value | ||
| U.S. GOVERNMENT AND AGENCY | |||
| OBLIGATIONS— (continued) | |||
| 449,378 | Government National Mortgage Association I, | ||
4.0%, 2/15/41 | $ 492,572 | ||
| 41,162 | Government National Mortgage Association I, | ||
4.0%, 3/15/41 | 45,579 | ||
| 7,314 | Government National Mortgage Association I, | ||
4.0%, 4/15/41 | 8,103 | ||
| 4,930 | Government National Mortgage Association I, | ||
4.0%, 5/15/41 | 5,283 | ||
| 40,470 | Government National Mortgage Association I, | ||
4.0%, 5/15/41 | 44,732 | ||
| 1,967 | Government National Mortgage Association I, | ||
4.0%, 6/15/41 | 2,132 | ||
| 3,054 | Government National Mortgage Association I, | ||
4.0%, 6/15/41 | 3,272 | ||
| 1,054,844 | Government National Mortgage Association I, | ||
4.0%, 6/15/41 | 1,168,060 | ||
| 4,625 | Government National Mortgage Association I, | ||
4.0%, 7/15/41 | 4,971 | ||
| 10,257 | Government National Mortgage Association I, | ||
4.0%, 7/15/41 | 11,348 | ||
| 25,497 | Government National Mortgage Association I, | ||
4.0%, 7/15/41 | 28,253 | ||
| 59,375 | Government National Mortgage Association I, | ||
4.0%, 7/15/41 | 65,747 | ||
| 99,197 | Government National Mortgage Association I, | ||
4.0%, 7/15/41 | 109,843 | ||
| 114,935 | Government National Mortgage Association I, | ||
4.0%, 7/15/41 | 127,272 | ||
| 5,678 | Government National Mortgage Association I, | ||
4.0%, 8/15/41 | 6,214 | ||
| 8,963 | Government National Mortgage Association I, | ||
4.0%, 8/15/41 | 9,628 | ||
| 45,774 | Government National Mortgage Association I, | ||
4.0%, 8/15/41 | 50,693 | ||
| 3,300 | Government National Mortgage Association I, | ||
4.0%, 9/15/41 | 3,551 | ||
| 4,022 | Government National Mortgage Association I, | ||
4.0%, 9/15/41 | 4,447 | ||
| 6,200 | Government National Mortgage Association I, | ||
4.0%, 9/15/41 | 6,692 | ||
| 6,832 | Government National Mortgage Association I, | ||
4.0%, 9/15/41 | 7,567 | ||
| 20,480 | Government National Mortgage Association I, | ||
4.0%, 9/15/41 | 22,625 |
The accompanying notes are an integral part of these financial statements.
68 Pioneer Strategic Income Fund | Semiannual Report | 3/31/21
| Principal | ||||
| Amount | ||||
| USD ($) | Value | |||
| U.S. GOVERNMENT AND AGENCY | ||||
| OBLIGATIONS— (continued) | ||||
| 34,238 | Government National Mortgage Association I, | |||
4.0%, 9/15/41 | $ 37,896 | |||
| 171,649 | Government National Mortgage Association I, | |||
4.0%, 9/15/41 | 189,622 | |||
| 306,137 | Government National Mortgage Association I, | |||
4.0%, 9/15/41 | 337,278 | |||
| 2,101 | Government National Mortgage Association I, | |||
4.0%, 10/15/41 | 2,299 | |||
| 4,594 | Government National Mortgage Association I, | |||
4.0%, 10/15/41 | 4,938 | |||
| 6,080 | Government National Mortgage Association I, | |||
4.0%, 10/15/41 | 6,512 | |||
| 6,632 | Government National Mortgage Association I, | |||
4.0%, 10/15/41 | 7,269 | |||
| 11,053 | Government National Mortgage Association I, | |||
4.0%, 10/15/41 | 11,833 | |||
| 2,282 | Government National Mortgage Association I, | |||
4.0%, 11/15/41 | 2,440 | |||
| 5,223 | Government National Mortgage Association I, | |||
4.0%, 11/15/41 | 5,786 | |||
| 14,208 | Government National Mortgage Association I, | |||
4.0%, 11/15/41 | 15,742 | |||
| 90,071 | Government National Mortgage Association I, | |||
4.0%, 11/15/41 | 97,065 | |||
| 6,178 | Government National Mortgage Association I, | |||
4.0%, 12/15/41 | 6,841 | |||
| 9,500 | Government National Mortgage Association I, | |||
4.0%, 12/15/41 | 10,526 | |||
| 12,904 | Government National Mortgage Association I, | |||
4.0%, 12/15/41 | 13,789 | |||
| 17,095 | Government National Mortgage Association I, | |||
4.0%, 1/15/42 | 18,299 | |||
| 574,256 | Government National Mortgage Association I, | |||
4.0%, 1/15/42 | 629,460 | |||
| 2,043 | Government National Mortgage Association I, | |||
4.0%, 2/15/42 | 2,190 | |||
| 3,865 | Government National Mortgage Association I, | |||
4.0%, 2/15/42 | 4,280 | |||
| 8,720 | Government National Mortgage Association I, | |||
4.0%, 2/15/42 | 9,656 | |||
| 27,934 | Government National Mortgage Association I, | |||
4.0%, 2/15/42 | 30,019 | |||
| 95,061 | Government National Mortgage Association I, | |||
4.0%, 2/15/42 | 105,199 | |||
The accompanying notes are an integral part of these financial statements.
Pioneer Strategic Income Fund | Semiannual Report | 3/31/21 69
Schedule of Investments | 3/31/21
(unaudited) (continued)
| Principal | |||
| Amount | |||
| USD ($) | Value | ||
| U.S. GOVERNMENT AND AGENCY | |||
| OBLIGATIONS— (continued) | |||
| 963,271 | Government National Mortgage Association I, | ||
4.0%, 5/15/42 | $ 1,066,953 | ||
| 41,695 | Government National Mortgage Association I, | ||
4.0%, 6/15/42 | 46,171 | ||
| 59,088 | Government National Mortgage Association I, | ||
4.0%, 6/15/42 | 63,764 | ||
| 63,980 | Government National Mortgage Association I, | ||
4.0%, 6/15/42 | 70,849 | ||
| 7,993 | Government National Mortgage Association I, | ||
4.0%, 10/15/42 | 8,751 | ||
| 4,567 | Government National Mortgage Association I, | ||
4.0%, 11/15/42 | 4,889 | ||
| 5,627 | Government National Mortgage Association I, | ||
4.0%, 4/15/43 | 6,032 | ||
| 721,217 | Government National Mortgage Association I, | ||
4.0%, 4/15/43 | 794,612 | ||
| 4,123 | Government National Mortgage Association I, | ||
4.0%, 5/15/43 | 4,569 | ||
| 17,404 | Government National Mortgage Association I, | ||
4.0%, 5/15/43 | 18,653 | ||
| 121,163 | Government National Mortgage Association I, | ||
4.0%, 5/15/43 | 130,816 | ||
| 42,795 | Government National Mortgage Association I, | ||
4.0%, 6/15/43 | 45,962 | ||
| 17,340 | Government National Mortgage Association I, | ||
4.0%, 7/15/43 | 18,557 | ||
| 11,310 | Government National Mortgage Association I, | ||
4.0%, 8/15/43 | 12,108 | ||
| 276,298 | Government National Mortgage Association I, | ||
4.0%, 8/15/43 | 305,235 | ||
| 6,285 | Government National Mortgage Association I, | ||
4.0%, 9/15/43 | 6,878 | ||
| 69,542 | Government National Mortgage Association I, | ||
4.0%, 9/15/43 | 74,970 | ||
| 2,004 | Government National Mortgage Association I, | ||
4.0%, 10/15/43 | 2,149 | ||
| 12,594 | Government National Mortgage Association I, | ||
4.0%, 11/15/43 | 13,905 | ||
| 72,554 | Government National Mortgage Association I, | ||
4.0%, 2/15/44 | 77,991 | ||
| 45,525 | Government National Mortgage Association I, | ||
4.0%, 3/15/44 | 50,363 | ||
| 53,399 | Government National Mortgage Association I, | ||
4.0%, 3/15/44 | 58,435 |
The accompanying notes are an integral part of these financial statements.
70 Pioneer Strategic Income Fund | Semiannual Report | 3/31/21
| Principal | |||
| Amount | |||
| USD ($) | Value | ||
| U.S. GOVERNMENT AND AGENCY | |||
| OBLIGATIONS— (continued) | |||
| 64,847 | Government National Mortgage Association I, | ||
4.0%, 3/15/44 | $ 69,445 | ||
| 99,334 | Government National Mortgage Association I, | ||
4.0%, 3/15/44 | 110,036 | ||
| 370,552 | Government National Mortgage Association I, | ||
4.0%, 3/15/44 | 404,998 | ||
| 948,077 | Government National Mortgage Association I, | ||
4.0%, 3/15/44 | 1,050,326 | ||
| 1,912,633 | Government National Mortgage Association I, | ||
4.0%, 3/15/44 | 2,107,293 | ||
| 4,449 | Government National Mortgage Association I, | ||
4.0%, 4/15/44 | 4,869 | ||
| 72,205 | Government National Mortgage Association I, | ||
4.0%, 4/15/44 | 79,352 | ||
| 340,244 | Government National Mortgage Association I, | ||
4.0%, 4/15/44 | 376,780 | ||
| 630,664 | Government National Mortgage Association I, | ||
4.0%, 4/15/44 | 691,318 | ||
| 151,547 | Government National Mortgage Association I, | ||
4.0%, 5/15/44 | 167,349 | ||
| 40,993 | Government National Mortgage Association I, | ||
4.0%, 8/15/44 | 43,980 | ||
| 63,703 | Government National Mortgage Association I, | ||
4.0%, 8/15/44 | 68,343 | ||
| 131,964 | Government National Mortgage Association I, | ||
4.0%, 8/15/44 | 144,411 | ||
| 571,335 | Government National Mortgage Association I, | ||
4.0%, 8/15/44 | 630,556 | ||
| 620,368 | Government National Mortgage Association I, | ||
4.0%, 8/15/44 | 687,233 | ||
| 4,817 | Government National Mortgage Association I, | ||
4.0%, 9/15/44 | 5,281 | ||
| 56,976 | Government National Mortgage Association I, | ||
4.0%, 9/15/44 | 61,611 | ||
| 107,733 | Government National Mortgage Association I, | ||
4.0%, 9/15/44 | 119,302 | ||
| 125,709 | Government National Mortgage Association I, | ||
4.0%, 9/15/44 | 135,625 | ||
| 141,453 | Government National Mortgage Association I, | ||
4.0%, 9/15/44 | 156,093 | ||
| 171,523 | Government National Mortgage Association I, | ||
4.0%, 9/15/44 | 188,098 | ||
| 174,307 | Government National Mortgage Association I, | ||
4.0%, 9/15/44 | 187,479 |
The accompanying notes are an integral part of these financial statements.
Pioneer Strategic Income Fund | Semiannual Report | 3/31/21 71
Schedule of Investments | 3/31/21
(unaudited) (continued)
| Principal | |||
| Amount | |||
| USD ($) | Value | ||
| U.S. GOVERNMENT AND AGENCY | |||
| OBLIGATIONS— (continued) | |||
| 460,771 | Government National Mortgage Association I, | ||
4.0%, 9/15/44 | $ 507,857 | ||
| 538,906 | Government National Mortgage Association I, | ||
4.0%, 9/15/44 | 583,809 | ||
| 930,070 | Government National Mortgage Association I, | ||
4.0%, 9/15/44 | 1,030,377 | ||
| 1,100,037 | Government National Mortgage Association I, | ||
4.0%, 9/15/44 | 1,212,394 | ||
| 1,480,964 | Government National Mortgage Association I, | ||
4.0%, 9/15/44 | 1,640,476 | ||
| 2,183,326 | Government National Mortgage Association I, | ||
4.0%, 9/15/44 | 2,417,790 | ||
| 31,260 | Government National Mortgage Association I, | ||
4.0%, 10/15/44 | 33,726 | ||
| 37,717 | Government National Mortgage Association I, | ||
4.0%, 10/15/44 | 40,432 | ||
| 204,071 | Government National Mortgage Association I, | ||
4.0%, 10/15/44 | 218,847 | ||
| 12,185 | Government National Mortgage Association I, | ||
4.0%, 11/15/44 | 13,425 | ||
| 20,712 | Government National Mortgage Association I, | ||
4.0%, 11/15/44 | 22,943 | ||
| 32,957 | Government National Mortgage Association I, | ||
4.0%, 11/15/44 | 35,350 | ||
| 102,785 | Government National Mortgage Association I, | ||
4.0%, 11/15/44 | 110,581 | ||
| 3,926 | Government National Mortgage Association I, | ||
4.0%, 12/15/44 | 4,215 | ||
| 52,469 | Government National Mortgage Association I, | ||
4.0%, 12/15/44 | 57,766 | ||
| 55,377 | Government National Mortgage Association I, | ||
4.0%, 12/15/44 | 60,702 | ||
| 138,482 | Government National Mortgage Association I, | ||
4.0%, 12/15/44 | 148,224 | ||
| 187,135 | Government National Mortgage Association I, | ||
4.0%, 12/15/44 | 202,770 | ||
| 397,510 | Government National Mortgage Association I, | ||
4.0%, 12/15/44 | 440,343 | ||
| 61,259 | Government National Mortgage Association I, | ||
4.0%, 1/15/45 | 65,577 | ||
| 358,217 | Government National Mortgage Association I, | ||
4.0%, 1/15/45 | 396,686 |
The accompanying notes are an integral part of these financial statements.
72 Pioneer Strategic Income Fund | Semiannual Report | 3/31/21
| Principal | |||
| Amount | |||
| USD ($) | Value | ||
| U.S. GOVERNMENT AND AGENCY | |||
| OBLIGATIONS— (continued) | |||
| 471,467 | Government National Mortgage Association I, | ||
4.0%, 1/15/45 | $ 507,345 | ||
| 635,752 | Government National Mortgage Association I, | ||
4.0%, 1/15/45 | 694,583 | ||
| 58,208 | Government National Mortgage Association I, | ||
4.0%, 2/15/45 | 62,299 | ||
| 73,842 | Government National Mortgage Association I, | ||
4.0%, 2/15/45 | 79,281 | ||
| 110,709 | Government National Mortgage Association I, | ||
4.0%, 2/15/45 | 122,322 | ||
| 182,336 | Government National Mortgage Association I, | ||
4.0%, 2/15/45 | 197,419 | ||
| 281,192 | Government National Mortgage Association I, | ||
4.0%, 2/15/45 | 301,515 | ||
| 613,874 | Government National Mortgage Association I, | ||
4.0%, 2/15/45 | 674,692 | ||
| 161,100 | Government National Mortgage Association I, | ||
4.0%, 3/15/45 | 172,440 | ||
| 118,667 | Government National Mortgage Association I, | ||
4.0%, 4/15/45 | 127,139 | ||
| 87,039 | Government National Mortgage Association I, | ||
4.0%, 5/15/45 | 96,267 | ||
| 32,243 | Government National Mortgage Association I, | ||
4.0%, 7/15/45 | 35,610 | ||
| 130,247 | Government National Mortgage Association I, | ||
4.0%, 9/15/45 | 143,638 | ||
| 90,782 | Government National Mortgage Association I, | ||
4.5%, 9/15/33 | 102,062 | ||
| 79,746 | Government National Mortgage Association I, | ||
4.5%, 10/15/33 | 89,960 | ||
| 45,998 | Government National Mortgage Association I, | ||
4.5%, 4/15/35 | 51,607 | ||
| 714,719 | Government National Mortgage Association I, | ||
4.5%, 3/15/38 | 800,685 | ||
| 289,797 | Government National Mortgage Association I, | ||
4.5%, 1/15/40 | 328,943 | ||
| 387,708 | Government National Mortgage Association I, | ||
4.5%, 6/15/40 | 435,066 | ||
| 150,915 | Government National Mortgage Association I, | ||
4.5%, 9/15/40 | 170,531 | ||
| 728,456 | Government National Mortgage Association I, | ||
4.5%, 11/15/40 | 821,472 |
The accompanying notes are an integral part of these financial statements.
Pioneer Strategic Income Fund | Semiannual Report | 3/31/21 73
Schedule of Investments | 3/31/21
(unaudited) (continued)
| Principal | |||
| Amount | |||
| USD ($) | Value | ||
| U.S. GOVERNMENT AND AGENCY | |||
| OBLIGATIONS— (continued) | |||
| 233,672 | Government National Mortgage Association I, | ||
4.5%, 6/15/41 | $ 260,657 | ||
| 856,234 | Government National Mortgage Association I, | ||
4.5%, 6/15/41 | 967,324 | ||
| 249,229 | Government National Mortgage Association I, | ||
4.5%, 7/15/41 | 280,844 | ||
| 461,107 | Government National Mortgage Association I, | ||
4.5%, 8/15/41 | 517,429 | ||
| 241,969 | Government National Mortgage Association I, | ||
5.0%, 9/15/33 | 281,746 | ||
| 54,217 | Government National Mortgage Association I, | ||
5.125%, 10/15/38 | 61,065 | ||
| 39,316 | Government National Mortgage Association I, | ||
5.5%, 7/15/33 | 45,387 | ||
| 75,794 | Government National Mortgage Association I, | ||
5.5%, 1/15/34 | 87,868 | ||
| 57,947 | Government National Mortgage Association I, | ||
5.5%, 4/15/34 | 67,103 | ||
| 101,138 | Government National Mortgage Association I, | ||
5.5%, 7/15/34 | 117,210 | ||
| 97,769 | Government National Mortgage Association I, | ||
5.5%, 10/15/34 | 110,122 | ||
| 68,428 | Government National Mortgage Association I, | ||
5.5%, 1/15/35 | 78,976 | ||
| 82,821 | Government National Mortgage Association I, | ||
5.5%, 2/15/35 | 91,986 | ||
| 149,230 | Government National Mortgage Association I, | ||
5.5%, 2/15/35 | 174,073 | ||
| 47,474 | Government National Mortgage Association I, | ||
5.5%, 6/15/35 | 54,974 | ||
| 26,324 | Government National Mortgage Association I, | ||
5.5%, 12/15/35 | 29,246 | ||
| 5 | Government National Mortgage Association I, | ||
5.5%, 2/15/37 | 6 | ||
| 12,665 | Government National Mortgage Association I, | ||
5.5%, 3/15/37 | 14,088 | ||
| 48,948 | Government National Mortgage Association I, | ||
5.5%, 3/15/37 | 54,318 | ||
| 17,850 | Government National Mortgage Association I, | ||
5.75%, 10/15/38 | 20,060 | ||
| 135,055 | Government National Mortgage Association I, | ||
5.75%, 10/15/38 | 150,822 | ||
| 60,758 | Government National Mortgage Association I, | ||
6.0%, 8/15/32 | 72,822 |
The accompanying notes are an integral part of these financial statements.
74 Pioneer Strategic Income Fund | Semiannual Report | 3/31/21
| Principal | ||||
| Amount | ||||
| USD ($) | Value | |||
| U.S. GOVERNMENT AND AGENCY | ||||
| OBLIGATIONS— (continued) | ||||
| 43,168 | Government National Mortgage Association I, | |||
6.0%, 1/15/33 | $ 51,719 | |||
| 32,818 | Government National Mortgage Association I, | |||
6.0%, 2/15/33 | 39,385 | |||
| 62,835 | Government National Mortgage Association I, | |||
6.0%, 2/15/33 | 75,144 | |||
| 2,384 | Government National Mortgage Association I, | |||
6.0%, 3/15/33 | 2,686 | |||
| 20,843 | Government National Mortgage Association I, | |||
6.0%, 3/15/33 | 24,737 | |||
| 45,438 | Government National Mortgage Association I, | |||
6.0%, 3/15/33 | 54,179 | |||
| 7,477 | Government National Mortgage Association I, | |||
6.0%, 5/15/33 | 8,387 | |||
| 72,532 | Government National Mortgage Association I, | |||
6.0%, 5/15/33 | 83,171 | |||
| 121,722 | Government National Mortgage Association I, | |||
6.0%, 5/15/33 | 136,940 | |||
| 38,466 | Government National Mortgage Association I, | |||
6.0%, 6/15/33 | 46,150 | |||
| 89,617 | Government National Mortgage Association I, | |||
6.0%, 6/15/33 | 105,925 | |||
| 30,482 | Government National Mortgage Association I, | |||
6.0%, 7/15/33 | 34,633 | |||
| 70,865 | Government National Mortgage Association I, | |||
6.0%, 7/15/33 | 82,652 | |||
| 6,835 | Government National Mortgage Association I, | |||
6.0%, 9/15/33 | 7,679 | |||
| 18,916 | Government National Mortgage Association I, | |||
6.0%, 9/15/33 | 21,249 | |||
| 100,798 | Government National Mortgage Association I, | |||
6.0%, 11/15/33 | 113,505 | |||
| 25,982 | Government National Mortgage Association I, | |||
6.0%, 1/15/34 | 31,118 | |||
| 151,912 | Government National Mortgage Association I, | |||
6.0%, 10/15/37 | 180,786 | |||
| 189,167 | Government National Mortgage Association I, | |||
6.0%, 7/15/38 | 226,921 | |||
| 5,164 | Government National Mortgage Association I, | |||
6.5%, 1/15/29 | 5,766 | |||
| 671 | Government National Mortgage Association I, | |||
6.5%, 5/15/29 | 775 | |||
| 559 | Government National Mortgage Association I, | |||
6.5%, 10/15/31 | 624 | |||
The accompanying notes are an integral part of these financial statements.
Pioneer Strategic Income Fund | Semiannual Report | 3/31/21 75
Schedule of Investments | 3/31/21
(unaudited) (continued)
| Principal | ||||
| Amount | ||||
| USD ($) | Value | |||
| U.S. GOVERNMENT AND AGENCY | �� | |||
| OBLIGATIONS— (continued) | ||||
| 1,096 | Government National Mortgage Association I, | |||
6.5%, 10/15/31 | $ 1,224 | |||
| 165 | Government National Mortgage Association I, | |||
6.5%, 12/15/31 | 193 | |||
| 1,292 | Government National Mortgage Association I, | |||
6.5%, 2/15/32 | 1,520 | |||
| 696 | Government National Mortgage Association I, | |||
6.5%, 3/15/32 | 819 | |||
| 3,001 | Government National Mortgage Association I, | |||
6.5%, 5/15/32 | 3,351 | |||
| 2,542 | Government National Mortgage Association I, | |||
6.5%, 6/15/32 | 2,839 | |||
| 2,599 | Government National Mortgage Association I, | |||
6.5%, 6/15/32 | 2,924 | |||
| 2,442 | Government National Mortgage Association I, | |||
6.5%, 7/15/32 | 2,727 | |||
| 3,836 | Government National Mortgage Association I, | |||
6.5%, 7/15/32 | 4,323 | |||
| 1,547 | Government National Mortgage Association I, | |||
6.5%, 8/15/32 | 1,749 | |||
| 1,588 | Government National Mortgage Association I, | |||
6.5%, 8/15/32 | 1,787 | |||
| 13,309 | Government National Mortgage Association I, | |||
6.5%, 8/15/32 | 15,140 | |||
| 16,808 | Government National Mortgage Association I, | |||
6.5%, 9/15/32 | 18,769 | |||
| 29,878 | Government National Mortgage Association I, | |||
6.5%, 9/15/32 | 33,364 | |||
| 10,110 | Government National Mortgage Association I, | |||
6.5%, 10/15/32 | 11,290 | |||
| 23,205 | Government National Mortgage Association I, | |||
6.5%, 11/15/32 | 27,480 | |||
| 19,638 | Government National Mortgage Association I, | |||
6.5%, 7/15/35 | 22,746 | |||
| 129 | Government National Mortgage Association I, | |||
7.0%, 5/15/29 | 143 | |||
| 289 | Government National Mortgage Association I, | |||
7.0%, 5/15/29 | 324 | |||
| 2,253 | Government National Mortgage Association I, | |||
7.0%, 8/15/29 | 2,260 | |||
| 186 | Government National Mortgage Association I, | |||
7.0%, 5/15/31 | 187 | |||
| 648,328 | Government National Mortgage Association II, | |||
3.5%, 4/20/45 | 700,436 | |||
The accompanying notes are an integral part of these financial statements.
76 Pioneer Strategic Income Fund | Semiannual Report | 3/31/21
| Principal | |||
| Amount | |||
| USD ($) | Value | ||
| U.S. GOVERNMENT AND AGENCY | |||
| OBLIGATIONS— (continued) | |||
| 1,023,447 | Government National Mortgage Association II, | ||
3.5%, 4/20/45 | $ 1,110,619 | ||
| 1,433,250 | Government National Mortgage Association II, | ||
3.5%, 4/20/45 | 1,554,087 | ||
| 1,699,383 | Government National Mortgage Association II, | ||
3.5%, 3/20/46 | 1,861,291 | ||
| 4,235,201 | Government National Mortgage Association II, | ||
4.0%, 10/20/46 | 4,627,184 | ||
| 1,443,717 | Government National Mortgage Association II, | ||
4.0%, 2/20/48 | 1,597,934 | ||
| 1,764,485 | Government National Mortgage Association II, | ||
4.0%, 4/20/48 | 1,952,976 | ||
| 260,422 | Government National Mortgage Association II, | ||
4.5%, 12/20/34 | 292,199 | ||
| 212,689 | Government National Mortgage Association II, | ||
4.5%, 1/20/35 | 238,619 | ||
| 193,137 | Government National Mortgage Association II, | ||
4.5%, 3/20/35 | 216,652 | ||
| 1,740,678 | Government National Mortgage Association II, | ||
4.5%, 9/20/41 | 1,951,942 | ||
| 2,530,969 | Government National Mortgage Association II, | ||
4.5%, 9/20/44 | 2,729,882 | ||
| 1,133,382 | Government National Mortgage Association II, | ||
4.5%, 10/20/44 | 1,270,669 | ||
| 2,391,720 | Government National Mortgage Association II, | ||
4.5%, 11/20/44 | 2,681,726 | ||
| 57,008 | Government National Mortgage Association II, | ||
5.5%, 3/20/34 | 66,629 | ||
| 2,056 | Government National Mortgage Association II, | ||
5.5%, 10/20/37 | 2,276 | ||
| 23,322 | Government National Mortgage Association II, | ||
6.0%, 5/20/32 | 26,727 | ||
| 83,028 | Government National Mortgage Association II, | ||
6.0%, 10/20/33 | 97,787 | ||
| 106 | Government National Mortgage Association II, | ||
6.5%, 1/20/28 | 119 | ||
| 2,130 | Government National Mortgage Association II, | ||
| �� | 7.0%, 1/20/29 | 2,435 | |
| 75,000,000(g) | U.S. Treasury Bills, 4/1/21 | 75,000,000 | |
| 80,000,000(g) | U.S. Treasury Bills, 4/13/21 | 79,999,866 | |
| 27,136,612 | U.S. Treasury Inflation Indexed Bonds, 0.25%, 2/15/50 | 28,153,175 | |
| 62,521,492 | U.S. Treasury Inflation Indexed Bonds, 1.0%, 2/15/49 | 77,765,990 | |
| TOTAL U.S. GOVERNMENT AND AGENCY OBLIGATIONS | |||
(Cost $839,273,980) | $ 857,447,804 |
The accompanying notes are an integral part of these financial statements.
Pioneer Strategic Income Fund | Semiannual Report | 3/31/21 77
Schedule of Investments | 3/31/21
(unaudited) (continued)
| Shares | Value | |||
| RIGHTS/WARRANTS — 0.0%† of Net Assets | ||||
| Oil, Gas & Consumable Fuels — 0.0%† | ||||
| 365(a)(l) | Alpha Metallurgical Resources, Inc. | $ 840 | ||
| 1,880,020(m) | ANR, Inc., 3/31/23 | 8,272 | ||
| Total Oil, Gas & Consumable Fuels | $ 9,112 | |||
| TOTAL RIGHTS/WARRANTS | ||||
(Cost $234,627) | $ 9,112 | |||
| Number of | Strike | Expiration | |||||
| Contracts | Description | Counterparty | Amount | Price | Date | Value | |
| OVER THE COUNTER (OTC) CALL OPTIONS | |||||||
| PURCHASED — 0.0% | |||||||
| 209,523^(n) | Desarrolladora | Bank of | MXN — | MXN 0.01(o) | 10/23/22 | $ — | |
| Homex | New York | ||||||
| SAB de CV | Mellon Corp. | ||||||
| 209,523^(p) | Desarrolladora | Bank of | MXN — | MXN 0.01(o) | 10/23/22 | $ — | |
Homex | New York | ||||||
| SAB de CV | Mellon Corp. | ||||||
| $ — | |||||||
| TOTAL OVER THE COUNTER (OTC) CALL OPTIONS | |||||||
| PURCHASED | |||||||
| (Premiums paid $0) | $ — | ||||||
| OVER THE COUNTER (OTC) CURRENCY PUT | |||||||
| OPTIONS PURCHASED — 0.0%† | |||||||
| 18,995,500 | Put EUR | Bank of | EUR314,365 | EUR1.11 | 6/4/21 | $ 7,418 | |
| Call USD | America NA | ||||||
| 37,650,000 | Put EUR | JPMorgan | EUR244,341 | EUR1.15 | 5/17/21 | 92,984 | |
| Call USD | Chase Bank NA | ||||||
| $ 100,402 | |||||||
| TOTAL OVER THE COUNTER (OTC) CURRENCY PUT | |
| OPTIONS PURCHASED | |
(Premiums paid $558,706) | $ 100,402 |
| TOTAL OPTIONS PURCHASED | |
(Premiums paid $558,706) | $ 100,402 |
| TOTAL INVESTMENTS IN UNAFFILIATED ISSUERS — 101.0% | |
(Cost $4,452,794,788) | $4,527,659,553 |
The accompanying notes are an integral part of these financial statements.
78 Pioneer Strategic Income Fund | Semiannual Report | 3/31/21
| Number of | Strike | Expiration | ||||
| Contracts | Description | Counterparty | Amount | Price | Date | Value |
| OVER THE COUNTER (OTC) CURRENCY CALL | ||||||
| OPTIONS WRITTEN — (0.0)%† | ||||||
| (18,995,500) | Call EUR | Bank of | EUR314,365 | EUR1.17 | 6/4/21 | $ ( 241,695) |
| Put USD | America NA | |||||
| (37,650,000) | Call EUR | JPMorgan | EUR244,341 | EUR1.24 | 5/17/21 | ( 3,444) |
| Put USD | Chase Bank NA | |||||
| $ ( 245,139) | ||||||
| TOTAL OVER THE COUNTER (OTC) CURRENCY CALL | ||||||
| OPTIONS WRITTEN | ||||||
(Premiums received $(558,706)) | $ (245,139 | |||||
| OTHER ASSETS AND LIABILITIES — (1.0)% | $ ( 44,032,592) | |||||
| NET ASSETS — 100.0% | $4,483,381,822 | |||||
bps Basis Points.
BADLARPP Argentine Deposit Rate Badlar Private Banks 30-35 Days.
CMT Constant Maturity Treasury Index.
EURIBOR Euro Interbank Offered Rate.
FRESB Freddie Mac Multifamily SB Certificates.
FREMF Freddie Mac Multifamily Fixed-Rate Mortgage Loans.
ICE Intercontinental Exchange.
LIBOR London Interbank Offered Rate.
REIT Real Estate Investment Trust.
REMICS Real Estate Mortgage Investment Conduits.
SOFRRATE Secured Overnight Financing Rate.
(144A) Security is exempt from registration under Rule 144A of the Securities Act of 1933. Such securities may be resold normally to qualified institutional buyers in a transaction exempt from registration. At March 31, 2021, the value of these securities amounted to $2,414,630,632, or 53.9% of net assets.
(TBA) “To Be Announced” Securities.
† Amount rounds to less than 0.1%.
* Senior secured floating rate loan interests in which the Fund invests generally pay interest at rates that are periodically redetermined by reference to a base lending rate plus a premium. These base lending rates are generally (i) the lending rate offered by one or more major European banks, such as LIBOR, (ii) the prime rate offered by one or more major United States banks, (iii) the rate of a certificate of deposit or (iv) other base lending rates used by commercial lenders. The interest rate shown is the rate accruing at March 31, 2021.
+ Security that used significant unobservable inputs to determine its value.
^ Security is valued using fair value methods (other than supplied by independent pricing services).
The accompanying notes are an integral part of these financial statements.
Pioneer Strategic Income Fund | Semiannual Report | 3/31/21 79
Schedule of Investments | 3/31/21
(unaudited) (continued)
(a) Non-income producing security.
(b) Security is perpetual in nature and has no stated maturity date.
(c) Floating rate note. Coupon rate, reference index and spread shown at March 31, 2021.
(d) The interest rate is subject to change periodically. The interest rate and/or reference index and spread shown at March 31, 2021.
(e) Debt obligation initially issued at one coupon which converts to a higher coupon at a specific date. The rate shown is the rate at March 31, 2021.
(f) Security represents the interest-only portion payments on a pool of underlying mortgages or mortgage-backed securities.
(g) Security issued with a zero coupon. Income is recognized through accretion of discount. (h) Issued as participation notes.
(i) Issued as preference shares.
(j) Consists of Revenue Bonds unless otherwise indicated.
(k) This term loan will settle after March 31, 2021, at which time the interest rate will be determined.
(l) Alpha Metallurgical Resources, Inc. warrants are exercisable into 365 shares. (m) ANR, Inc., 3/31/23 warrants are exercisable into 1,880,020 shares.
(n) Option does not become effective until underlying company’s outstanding common shares reach a market capitalization of MXN 12.5 billion.
(o) Strike price is 1 Mexican Peso (MXN).
(p) Option does not become effective until underlying company’s outstanding common shares reach a market capitalization of MXN 15.5 billion.
# Securities are restricted as to resale.
| Restricted Securities | Acquisition date | Cost | Value |
Acorn Re | 7/3/2018 | $ 999,240 | $ 1,007,000 |
Ailsa Re 2019 | 6/4/2019 | 2,000,000 | 2,120,344 |
Alamo Re | 3/24/2021 | 1,253,092 | 1,251,500 |
Alturas Re 2019-1 | 12/20/2018 | 2,201 | 10,065 |
Alturas Re 2019-2 | 12/19/2018 | 33,410 | 88,734 |
Alturas Re 2020-1B | 1/1/2020 | 357,085 | 163,474 |
Alturas Re 2020-2 | 1/1/2020 | 360,465 | 451,951 |
Alturas Re 2020-3 | 7/1/2020 | 250,000 | 249,500 |
Alturas Re 2021-2 | 2/16/2021 | 2,639,535 | 2,611,028 |
Ballybunion Re | 12/31/2019 | 6,016,157 | 6,270,334 |
Ballybunion Re 2020-3 | 1/21/2021 | 2,837,136 | 2,831,231 |
Bantry Re 2016 | 2/6/2019 | 322,400 | 322,400 |
Bantry Re 2017 | 2/6/2019 | 175,392 | 175,323 |
Bantry Re 2018 | 2/6/2019 | 28,446 | 28,500 |
Bantry Re 2019 | 2/1/2019 | — | 135,855 |
Bantry Re 2020 | 2/4/2020 | 212,369 | 558,690 |
Bantry Re 2021 | 1/11/2021 | 3,932,000 | 4,018,262 |
Berwick Re 2017-1 | 1/5/2017 | 119,551 | 119,325 |
Berwick Re 2018-1 | 1/10/2018 | 2,296,058 | 1,337,865 |
The accompanying notes are an integral part of these financial statements.
80 Pioneer Strategic Income Fund | Semiannual Report | 3/31/21
| Restricted Securities | Acquisition date | Cost | Value |
Berwick Re 2019-1 | 12/31/2018 | $1,188,696 | $ 1,188,780 |
Berwick Re 2020-1 | 9/24/2020 | — | 200 |
Berwick Re 2021-1 | 12/28/2020 | 3,000,000 | 3,050,100 |
Blue Lotus Re | 12/20/2017 | — | 53,725 |
Bonanza Re | 12/15/2020 | 750,000 | 756,600 |
Carnoustie Re 2017 | 1/5/2017 | 2,422,271 | 1,342,778 |
Carnoustie Re 2019 | 12/31/2018 | — | 1,900 |
Carnoustie Re 2020 | 7/16/2020 | 127,996 | 285,600 |
Carnoustie Re 2021 | 1/25/2021 | 1,390,289 | 1,413,981 |
Castle Stuart Re 2018 | 12/20/2017 | 651,513 | 87,498 |
Cedar Re 2020 | 7/31/2020 | — | 67,531 |
Denning Re | 11/9/2020 | 2,545,707 | 2,602,604 |
Dingle Re 2019 | 3/4/2019 | — | 12,315 |
Dingle Re 2020 | 2/13/2020 | 512,325 | 568,971 |
Easton Re Pte | 12/15/2020 | 900,000 | 905,850 |
Eden Re II | 12/15/2017 | 9,263 | 126,329 |
Eden Re II | 1/23/2018 | 5,374 | 183,624 |
Eden Re II | 12/23/2019 | 700,000 | 849,310 |
Eden Re II | 1/22/2019 | 8,633 | 425,930 |
Eden Re II, Series B | 1/25/2021 | 6,300,000 | 6,076,350 |
First Coast Re 2017-1 Ltd. | 3/26/2021 | 1,757,137 | 1,755,075 |
FloodSmart Re Ltd. | 2/16/2021 | 1,000,000 | 998,700 |
FloodSmart Re Ltd. | 2/9/2021 | 759,251 | 757,500 |
Formby Re 2018 | 7/9/2018 | 193,072 | 243,588 |
Four Lakes Re | 11/5/2020 | 1,500,000 | 1,491,150 |
Four Lakes Re | 11/5/2020 | 1,500,000 | 1,479,750 |
Gleneagles Re 2016 | 1/14/2016 | — | 202,800 |
Gleneagles Re 2018 | 12/27/2017 | 120,409 | 177,450 |
Gleneagles Re 2019 | 12/31/2018 | — | 25,849 |
Gleneagles Re 2020 | 6/24/2020 | 63,194 | 180,199 |
Gleneagles Re 2021 | 1/13/2021 | 1,250,000 | 1,279,922 |
Gullane Re 2018 | 3/26/2018 | 282,712 | 466,706 |
Gullane Re 2021 | 1/13/2021 | 5,000,000 | 5,097,057 |
Harambee Re 2018 | 12/19/2017 | 152,586 | 10,800 |
Harambee Re 2019 | 12/20/2018 | — | 42,000 |
Harambee Re 2020 | 2/27/2020 | 122,594 | 322,200 |
Herbie Re | 10/19/2020 | 500,000 | 527,900 |
Hypatia, Ltd. | 7/10/2020 | 1,000,000 | 1,064,000 |
International Bank for | |||
| Reconstruction & Development | 2/28/2020 | 250,000 | 252,750 |
Isosceles Re 2020 | 6/8/2020 | — | 26,000 |
Limestone Re | 6/20/2018 | 103,587 | 228,830 |
Limestone Re | 12/15/2016 | 71,990 | 125,376 |
Limestone Re 2016-1 | 12/15/2016 | 990 | 1,000 |
The accompanying notes are an integral part of these financial statements.
Pioneer Strategic Income Fund | Semiannual Report | 3/31/21 81
Schedule of Investments | 3/31/21
(unaudited) (continued)
| Restricted Securities | Acquisition date | Cost | Value |
Limestone Re 2016-1 | 12/15/2016 | $ 7,096 | $ 7,164 |
Limestone Re 2018 | 6/20/2018 | 7,000 | 1 |
Limestone Re 2019-B | 12/15/2016 | 11,622 | — |
Limestone Re 2020-1 | 12/27/2019 | 152,979 | 266,424 |
Limestone Re 2020-2 | 6/20/2018 | 1,110,000 | 1,199,133 |
Lion II Re, DAC | 6/21/2017 | 1,671,525 | 1,766,086 |
Lion Rock Re 2019 | 12/17/2018 | — | 20,250 |
Lion Rock Re 2020 | 3/27/2020 | — | 19,900 |
Lion Rock Re 2021 | 3/1/2021 | 500,000 | 531,800 |
Liphook Re 2020 | 7/14/2020 | 939,839 | 1,029,778 |
Longpoint Re III | 5/17/2018 | 2,600,000 | 2,607,020 |
Lorenz Re 2018 | 6/26/2018 | 1,361,342 | 64,200 |
Lorenz Re 2019 | 7/10/2019 | 811,591 | 119,627 |
Lorenz Re 2020 | 8/12/2020 | 1,717,287 | 1,779,625 |
Lorenz Re 2020 | 8/11/2020 | 1,282,713 | 1,329,275 |
Matterhorn Re | 6/25/2020 | 1,165,220 | 1,165,375 |
Matterhorn Re | 4/30/2020 | 250,000 | 255,325 |
Matterhorn Re | 11/24/2020 | 1,500,000 | 1,504,350 |
Matterhorn Re | 6/25/2020 | 1,250,000 | 1,289,375 |
Matterhorn Re | 11/24/2020 | 2,000,000 | 2,008,000 |
Merion Re 2018-2 | 12/28/2017 | 349,793 | 1,406,750 |
Merion Re 2021-1 | 1/8/2021 | 216,277 | 223,892 |
Merion Re 2021-2 | 12/28/2020 | 9,000,000 | 9,215,329 |
Mona Lisa Re | 12/30/2019 | 500,000 | 509,000 |
Northshore Re II | 12/2/2020 | 500,000 | 512,000 |
Oakmont Re 2017 | 5/10/2017 | — | 36,750 |
Oakmont Re 2020 | 12/3/2020 | 1,367,741 | 1,597,209 |
Old Head Re 2021 | 1/22/2021 | 455,564 | 491,918 |
Pangaea Re 2016-2 | 5/31/2016 | — | 10,967 |
Pangaea Re 2018-1 | 12/26/2017 | 679,284 | 100,009 |
Pangaea Re 2018-3 | 5/31/2018 | 1,710,113 | 147,278 |
Pangaea Re 2019-1 | 1/9/2019 | 40,855 | 81,087 |
Pangaea Re 2019-3 | 7/25/2019 | 156,622 | 187,794 |
Pangaea Re 2020-1 | 1/21/2020 | — | 81,717 |
Pangaea Re 2020-1 | 1/19/2021 | 4,500,000 | 4,594,785 |
Pangaea Re 2020-3 | 9/15/2020 | 3,500,000 | 3,794,547 |
Phoenix One Re | 12/21/2020 | 1,000,000 | 1,007,700 |
Pine Valley Re 2021 | 12/30/2020 | 467,165 | 472,010 |
Port Royal Re 2019 | 5/20/2019 | 1,058,755 | 1,201,482 |
Portrush Re 2017 | 6/12/2017 | 1,687,366 | 1,403,820 |
Residential Reinsurance 2020 | 10/30/2020 | 1,500,000 | 1,520,250 |
Residential Reinsurance 2020 Ltd. | 10/30/2020 | 1,250,000 | 1,257,125 |
The accompanying notes are an integral part of these financial statements.
82 Pioneer Strategic Income Fund | Semiannual Report | 3/31/21
| Restricted Securities | Acquisition date | Cost | Value |
Resilience Re | 4/13/2017 | $ 14,703 | $ 450 |
Sanders Re | 6/12/2020 | 244,371 | 249,275 |
Sanders Re II, Ltd. | 5/20/2020 | 250,000 | 255,000 |
Sector Re V | 4/29/2020 | 1,696,451 | 1,840,735 |
Sector Re V | 1/1/2020 | 155,997 | 370,441 |
Sector Re V | 4/29/2020 | 540,000 | 642,359 |
Sector Re V | 12/4/2018 | 684,151 | 422,027 |
Sector Re V | 12/21/2020 | 2,753,972 | 2,675,344 |
Sector Re V, Ltd. | 4/24/2020 | 710,000 | 844,584 |
Sector Re V, Series 8, Class D | 12/14/2018 | 220,006 | 141,370 |
Sector Re V, Series 9, Class A | 4/23/2019 | 360,000 | 202,796 |
Sector Re V, Series 9, Class C | 12/4/2019 | 150,000 | 356,200 |
Sector Re V, Series 9, Class G | 5/1/2019 | 3,608 | 60,171 |
Seminole Re 2018 | 1/2/2018 | 7,257 | 21,023 |
St. Andrews Re 2017-1 | 1/5/2017 | 396,667 | 396,969 |
St. Andrews Re 2017-4 | 3/31/2017 | — | 256,526 |
Sussex Capital UK Pcc Ltd. | 12/7/2020 | 750,000 | 764,250 |
Sussex Re 2020-1 | 1/21/2020 | — | 240,406 |
Sussex Re 2021-1 | 1/26/2021 | 1,000,000 | 996,000 |
Thopas Re 2018 | 12/12/2017 | 135,766 | 6,300 |
Thopas Re 2019 | 12/21/2018 | 113,674 | 125,400 |
Thopas Re 2020 | 12/30/2019 | — | 13,200 |
Thopas Re 2021 | 12/30/2020 | 5,000,000 | 5,002,500 |
Ursa Re | 11/20/2019 | 1,800,000 | 1,822,680 |
Ursa Re II Ltd. | 10/8/2020 | 3,000,000 | 3,066,300 |
Versutus Re 2018 | 1/31/2018 | 19,037 | 9,900 |
Versutus Re 2019-A | 1/28/2019 | — | 49,246 |
Versutus Re 2019-B | 12/24/2018 | — | 15,854 |
Viribus Re 2018 | 12/22/2017 | 101,938 | — |
Viribus Re 2019 | 12/27/2018 | — | 150,745 |
Viribus Re 2020 | 3/12/2020 | 421,904 | 23,596 |
Viribus Re 2021 | 2/1/2021 | 3,717,666 | 3,890,166 |
Vitality Re X | 2/3/2020 | 1,498,908 | 1,492,500 |
Vitality Re XI | 1/31/2020 | 496,973 | 487,250 |
Walton Health Re 2018 | 6/25/2018 | 401,162 | 191,181 |
Walton Health Re 2019 | 7/18/2019 | 185,097 | 252,101 |
White Heron Re 2020 | 7/21/2020 | — | 57,900 |
Woburn Re 2018 | 3/20/2018 | 646,261 | 134,042 |
Woburn Re 2019 | 1/30/2019 | 923,911 | 1,046,589 |
| Total Restricted Securities | $135,897,462 | ||
| % of Net assets | 3.0% |
The accompanying notes are an integral part of these financial statements.
Pioneer Strategic Income Fund | Semiannual Report | 3/31/21 83
Schedule of Investments | 3/31/21
(unaudited) (continued)
| FORWARD FOREIGN CURRENCY EXCHANGE CONTRACTS | ||||||
| Unrealized | ||||||
| Currency | In | Currency | Settlement | Appreciation | ||
| Purchased | Exchange for | Sold | Deliver | Counterparty | Date | (Depreciation) |
| EUR | 17,520,000 | USD | (21,228,411) | Bank of | 4/28/21 | $ (672,920) |
| America NA | ||||||
| EUR | 11,800,000 | USD | (13,992,255) | Bank of | 6/25/21 | (130,222) |
| America NA | ||||||
| SEK | 550,489,630 | USD | (66,423,848) | Bank of | 4/29/21 | (3,371,325) |
| America NA | ||||||
| EUR | 8,470,000 | USD | (10,262,125) | Bank of | 4/28/21 | (324,624) |
| New York | ||||||
| Mellon Corp. | ||||||
| PLN | 42,510,000 | EUR | (9,477,346) | Bank of | 5/24/21 | (365,627) |
| New York | ||||||
| Mellon Corp. | ||||||
| USD | 7,701,802 | GBP | (5,519,999) | Bank of | 5/24/21 | 94,379 |
| New York | ||||||
| Mellon Corp. | ||||||
| USD | 19,474,855 | MXN | (393,347,000) | Bank of | 4/29/21 | 279,588 |
| New York | ||||||
| Mellon Corp. | ||||||
| USD | 3,055,356 | EUR | (2,600,000) | Brown Brothers | 6/25/21 | 1,010 |
| Harriman & Co. | ||||||
| USD | 24,299,645 | SEK | (200,000,000) | Brown Brothers | 4/29/21 | 1,391,848 |
| Harriman & Co. | ||||||
| EUR | 2,319,356 | NOK | (23,550,000) | Citibank NA | 4/6/21 | (31,852) |
| EGP | 88,658,254 | USD | (5,541,141) | Goldman Sachs | 5/26/21 | 24,192 |
| International | ||||||
| MXN | 47,000,000 | USD | (2,257,322) | Goldman Sachs | 4/29/21 | 36,270 |
| International | ||||||
| CZK | 243,205,000 | USD | (11,344,649) | HSBC Bank | 4/29/21 | (418,287) |
| USA NA | ||||||
| EUR | 25,000,000 | USD | (30,509,233) | HSBC Bank | 4/28/21 | (1,177,767) |
| USA NA | ||||||
| INR | 1,640,000,000 | USD | (22,175,048) | HSBC Bank | 4/30/21 | 168,005 |
| USA NA | ||||||
| NOK | 207,511,411 | EUR | (19,784,330) | HSBC Bank | 4/6/21 | 1,046,137 |
| USA NA | ||||||
| NOK | 347,582,322 | USD | (40,373,076) | HSBC Bank | 5/4/21 | 242,532 |
| USA NA | ||||||
| PEN | 80,225,000 | USD | (21,955,728) | HSBC Bank | 5/26/21 | (529,942) |
| USA NA | ||||||
| SGD | 30,238,341 | USD | (22,713,172) | HSBC Bank | 6/4/21 | (241,209) |
| USA NA | ||||||
| IDR | 120,000,000,000 | USD | (8,265,032) | JPMorgan | 5/28/21 | (37,824) |
| Chase Bank NA | ||||||
| SEK | 231,334,943 | EUR | (22,702,949) | JPMorgan | 6/2/21 | (151,652) |
| Chase Bank NA |
The accompanying notes are an integral part of these financial statements.
84 Pioneer Strategic Income Fund | Semiannual Report | 3/31/21
| Unrealized | ||||||
| Currency | In | Currency | Settlement | Appreciation | ||
| Purchased | Exchange for | Sold | Deliver | Counterparty | Date | (Depreciation) |
AUD | 63,343,623 | USD | (50,079,247) | State Street | 5/26/21 | $ (1,917,578) |
| Bank & Trust Co. | ||||||
EUR | 1,915,000 | USD | (2,287,421) | State Street | 5/24/21 | (39,359) |
| Bank & Trust Co. | ||||||
KRW | 26,325,549,644 | USD | (23,388,223) | State Street | 6/4/21 | (59,483) |
| Bank & Trust Co. | ||||||
USD | 3,736,315 | EUR | (3,100,000) | State Street . | 4/28/21 | 99,213 |
| Bank & Trust Co. | ||||||
USD | 40,547,609 | EUR | (33,270,000) | State Street | 5/24/21 | 1,491,208 |
| Bank & Trust Co. | ||||||
USD | 8,914,429 | GBP | (6,460,000) | State Street | 5/24/21 | 11,538 |
Bank & Trust Co. | ||||||
| TOTAL FORWARD FOREIGN CURRENCY EXCHANGE CONTRACTS | $(4,583,751) | |||||
FUTURES CONTRACTS
FIXED INCOME INDEX FUTURES CONTRACTS
| Number of | |||||
| Contracts | Expiration | Notional | Market | Unrealized | |
| Long | Description | Date | Amount | Value | (Depreciation) |
| 623 | U.S. 2 Year | 6/30/21 | $ 137,638,937 | $ 137,512,648 | $ (126,289) |
Note (CBT) | |||||
| 315 | U.S. 10 Year | 6/21/21 | 41,628,500 | 41,245,313 | (383,187) |
Note (CBT) | |||||
| 508 | U.S. 10 Year | 6/21/21 | 73,269,438 | 72,993,250 | (276,188) |
Ultra | |||||
| 1,074 | U.S. Ultra | 6/21/21 | 205,293,415 | 194,628,938 | (10,664,477) |
Bond (CBT) | |||||
| $ 457,830,290 | $ 446,380,149 | $ (11,450,141) |
| Number of | Unrealized | ||||
| Contracts | Expiration | Notional | Market | Appreciation | |
| Short | Description | Date | Amount | Value | (Depreciation) |
| 987 | Euro-Bobl | 6/8/21 | $(156,279,556) | $(156,349,003) | $ (69,447) |
| 2,187 | Euro-Bund | 6/8/21 | (439,765,114) | (439,280,930) | 484,184 |
| 46 | U.S. 5 Year | 6/30/21 | (5,748,140) | (5,676,328) | 71,812 |
Note (CBT) | |||||
| 1,230 | U.S. Long | 6/21/21 | (198,750,704) | (190,150,313) | 8,600,391 |
Bond (CBT) | |||||
| $(800,543,514) | $(791,456,574) | $ 9,086,940 | |||
| TOTAL FUTURES CONTRACTS | $(342,713,224) | $(345,076,425) | $(2,363,201) | ||
The accompanying notes are an integral part of these financial statements.
Pioneer Strategic Income Fund | Semiannual Report | 3/31/21 85
Schedule of Investments | 3/31/21
(unaudited) (continued)
SWAP CONTRACTS
CENTRALLY CLEARED CREDIT DEFAULT SWAP CONTRACT — SELL PROTECTION
| Annual | |||||||
| Notional | Reference | Pay/ | Fixed | Expiration | Premiums | Unrealized | Market |
Amount ($)(1) | Obligation/Index | Receive(2) | Rate | Date | (Received) | Appreciation | Value |
| 2,460,000 | Markit CDX North | Receive | 5.00% | 12/20/25 | $(16,058) | $243,320 | $227,262 |
America High Yield | |||||||
Index Series 35 | |||||||
| TOTAL CENTRALLY CLEARED CREDIT DEFAULT | |||||||
| SWAP CONTRACT – SELL PROTECTION | $(16,058) | $243,320 | $227,262 | ||||
OVER THE COUNTER (OTC) CREDIT DEFAULT SWAP CONTRACTS — SELL PROTECTION
| Reference | Annual | |||||||
| Notional | Obligation/ | Pay/ | Fixed | Expiration | Premiums | Unrealized | Market | |
Amount ($)(1) | Counterparty | Index | Receive(2) | Rate | Date | Paid | Appreciation | Value |
| 7,280,000 | JPMorgan | Delta Air | Receive | 5.00% | 12/20/25 | $ 453,760 | $ 265,451 | $ 719,211 |
Chase | Lines, Inc. | |||||||
Bank NA | ||||||||
| 7,280,000 | JPMorgan | United | Receive | 5.00% | 12/20/25 | (275,022) | 600,683 | 325,661 |
Chase | Airlines | |||||||
Bank NA | Holdings, Inc. | |||||||
| 1,455,000 | JPMorgan | United | Receive | 5.00% | 12/20/25 | (58,402) | 123,490 | 65,088 |
Chase | Airlines | |||||||
Bank NA | Holdings, Inc. | |||||||
| 2,425,000 | JPMorgan | United | Receive | 5.00% | 12/20/25 | (94,306) | 203,458 | 109,152 |
Chase | Airlines | |||||||
Bank NA | Holdings, Inc. | |||||||
| 4,860,000 | JPMorgan | United | Receive | 5.00% | 12/20/25 | (213,300) | 430,705 | 217,405 |
Chase | Airlines | |||||||
Bank NA | Holdings, Inc. | |||||||
| 2,000,000 | JPMorgan | United | Receive | 5.00% | 12/20/25 | (105,278) | 194,745 | 89,467 |
Chase | Airlines | |||||||
Bank NA | Holdings, Inc. | |||||||
| TOTAL OVER THE COUNTER (OTC) CREDIT DEFAULT | ||||||||
| SWAP CONTRACTS - SELL PROTECTION | $(292,548) | $1,818,532 | $1,525,984 | |||||
OVER THE COUNTER (OTC) TOTAL RETURN SWAP CONTRACT — SELL PROTECTION
| Reference | Annual | Premiums | ||||||
| Notional | Obligation/ | Pay/ | Fixed | Expiration | Paid/ | Unrealized | Market | |
Amount ($)(1) | Counterparty | Index | Receive(2) | Rate | Date | (Received) | Appreciation | Value |
| 293,603,090 | JPMorgan | China | Receive | 5.00% | 11/19/30 | $45,128,743 | $ 194,147 | $45,322,890 |
Chase | Government | |||||||
Bank NA | Bond | |||||||
| TOTAL OVER THE COUNTER (OTC) TOTAL RETURN SWAP | ||||||||
| CONTRACT — SELL PROTECTION | $45,128,743 | $ 194,147 | $45,322,890 | |||||
| TOTAL SWAP CONTRACTS | $44,820,137 | $ 2,255,999 | $47,076,136 | |||||
(1) The notional amount is the maximum amount that a seller of credit protection would be obligated to pay upon occurrence of a credit event.
(2) Receives quarterly.
The accompanying notes are an integral part of these financial statements.
86 Pioneer Strategic Income Fund | Semiannual Report | 3/31/21
Principal amounts are denominated in U.S. dollars (“USD”) unless otherwise noted.
ARS — Argentine Peso
AUD — Australian Dollar
CNY — China Yuan Renminbi
CZK — Czech Koruna
EGP — Egyptian Pound
EUR — Euro
GBP — Great British Pound
GHS — Ghanian Cedi
IDR — Indonesian Rupiah
INR — Indian Rupee
KRW — Korean Won
KZT — Kazakhstan Tenge
MXN — Mexican Peso
NOK — Norwegian Krone
PEN — Peruvian Sol
PLN — Polish Zloty
SEK — Swedish Krona
SGD — Singapore Dollar
UYU — Uruguayan Peso
UZS — Uzbekistan Som
Purchases and sales of securities (excluding temporary cash investments) for the six months ended March 31, 2021 were as follows:
| Purchases | Sales | |
Long-Term U.S. Government Securities | $ 276,966,824 | $ 319,578,570 |
Other Long-Term Securities | $1,124,164,230 | $1,329,991,972 |
The Fund is permitted to engage in purchase and sale transactions (“cross trades”) with certain funds and accounts for which Amundi Asset Management US, Inc. (the “Adviser”) serves as the Fund’s investment adviser, as set forth in Rule 17a-7 under the Investment Company Act of 1940, pursuant to procedures adopted by the Board of Trustees. Under these procedures, cross trades are effected at current market prices. During the six months ended March 31, 2021, the Fund did not engage in any cross trade activity.
At March 31, 2021, the net unrealized appreciation on investments based on cost for federal tax purposes of $4,508,785,346 was as follows:
| Aggregate gross unrealized appreciation for all investments in which | |
| there is an excess of value over tax cost | $ 198,447,385 |
| Aggregate gross unrealized depreciation for all investments in which | |
| there is an excess of tax cost over value | (139,689,133) |
| Net unrealized appreciation | $ 58,758,252 |
The accompanying notes are an integral part of these financial statements.
Pioneer Strategic Income Fund | Semiannual Report | 3/31/21 87
Schedule of Investments | 3/31/21
(unaudited) (continued)
Various inputs are used in determining the value of the Fund’s investments. These inputs are summarized in the three broad levels below.
Level 1 – unadjusted quoted prices in active markets for identical securities.
Level 2 – other significant observable inputs (including quoted prices for similar securities, interest rates, prepayment speeds, credit risks, etc.). See Notes to Financial Statements—Note 1A.
Level 3 – significant unobservable inputs (including the Fund’s own assumptions in determining fair value of investments). See Notes to Financial Statements — Note 1A.
The following is a summary of the inputs used as of March 31, 2021, in valuing the Fund’s investments:
| Level 1 | Level 2 | Level 3 | Total | |||||||||||||
Common Stocks | ||||||||||||||||
| Oil, Gas & Consumable | ||||||||||||||||
| Fuels | $ | 10,266 | $ | 286,965 | $ | — | $ | 297,231 | ||||||||
| Paper & Forest Products | — | 6,513 | — | 6,513 | ||||||||||||
| Specialty Retail | — | — | 170,668 | 170,668 | ||||||||||||
| All Other Common Stocks | 240,070 | — | — | 240,070 | ||||||||||||
Convertible Preferred | ||||||||||||||||
| Stocks | 106,956,498 | — | — | 106,956,498 | ||||||||||||
Preferred Stock | — | 3,461,250 | — | 3,461,250 | ||||||||||||
Asset Backed Securities | — | 445,707,686 | — | 445,707,686 | ||||||||||||
Collateralized Mortgage | ||||||||||||||||
| Obligations | — | 638,914,871 | — | 638,914,871 | ||||||||||||
Commercial Mortgage- | ||||||||||||||||
| Backed Securities | — | 296,870,202 | — | 296,870,202 | ||||||||||||
Convertible Corporate | ||||||||||||||||
| Bonds | — | 28,507,077 | — | 28,507,077 | ||||||||||||
Corporate Bonds | — | 1,740,849,525 | — | 1,740,849,525 | ||||||||||||
Foreign Government | ||||||||||||||||
| Bonds | — | 222,002,333 | — | 222,002,333 | ||||||||||||
Insurance-Linked | ||||||||||||||||
| Securities | �� | |||||||||||||||
| Collateralized | ||||||||||||||||
| Reinsurance | ||||||||||||||||
| Multiperil – | ||||||||||||||||
| Massachusetts | — | — | 2,602,604 | 2,602,604 | ||||||||||||
| Multiperil - U.S. | — | — | 10,884,333 | 10,884,333 | ||||||||||||
| Multiperil - | ||||||||||||||||
| U.S. Regional | — | — | 2,120,344 | 2,120,344 | ||||||||||||
| Multiperil - | ||||||||||||||||
| Worldwide | — | — | 3,480,502 | 3,480,502 | ||||||||||||
| Windstorm - Florida | — | — | 1,714,939 | 1,714,939 | ||||||||||||
| Windstorm - | ||||||||||||||||
| North Carolina | — | — | 26,000 | 26,000 | ||||||||||||
| Windstorm - | ||||||||||||||||
| U.S. Multistate | — | — | 57,900 | 57,900 | ||||||||||||
| Windstorm - | ||||||||||||||||
| U.S. Regional | — | — | 2,663,737 | 2,663,737 | ||||||||||||
The accompanying notes are an integral part of these financial statements.
88 Pioneer Strategic Income Fund | Semiannual Report | 3/31/21
| Level 1 | Level 2 | Level 3 | Total | |||||||||||||
| Reinsurance Sidecars | ||||||||||||||||
Multiperil - U.S. | $ | — | $ | — | $ | 3,506,757 | $ | 3,506,757 | ||||||||
| Multiperil - Worldwide | — | — | 74,061,410 | 74,061,410 | ||||||||||||
| All Other Insurance- | ||||||||||||||||
Linked Securities | — | 34,778,936 | — | 34,778,936 | ||||||||||||
| Municipal Bond | — | 2,396,443 | — | 2,396,443 | ||||||||||||
| Senior Secured Floating | ||||||||||||||||
| Rate Loan | ||||||||||||||||
| Interests | — | 47,824,406 | — | 47,824,406 | ||||||||||||
| U.S. Government and | ||||||||||||||||
| Agency Obligations | — | 857,447,804 | — | 857,447,804 | ||||||||||||
| Rights/Warrants | — | 9,112 | — | 9,112 | ||||||||||||
| Over The Counter | ||||||||||||||||
| (OTC) Call Option | ||||||||||||||||
| Purchased | — | — | * | — | — | * | ||||||||||
| Over The Counter | ||||||||||||||||
| (OTC) Currency Put | ||||||||||||||||
Option Purchased | — | 100,402 | — | 100,402 | ||||||||||||
| Total Investments | ||||||||||||||||
| in Securities | $ | 107,206,834 | $ | 4,319,163,525 | $ | 101,289,194 | $ | 4,527,659,553 | ||||||||
| Other Financial Instruments | ||||||||||||||||
| Over The Counter (OTC) | ||||||||||||||||
| Currency Call | ||||||||||||||||
| Option Written | $ | — | $ | (245,139 | ) | $ | — | $ | (245,139 | ) | ||||||
| Net unrealized | ||||||||||||||||
| depreciation on forward | ||||||||||||||||
| foreign currency | ||||||||||||||||
| exchange contracts | — | (4,583,751 | ) | — | (4,583,751 | ) | ||||||||||
| Net unrealized | ||||||||||||||||
| depreciation on | ||||||||||||||||
| futures contracts | (2,363,201 | ) | — | — | (2,363,201 | ) | ||||||||||
Swap contracts, at value | — | 47,076,136 | — | 47,076,136 | ||||||||||||
| Total Other | ||||||||||||||||
| Financial Instruments | $ | (2,363,201 | ) | $ | 42,247,246 | $ | — | $ | 39,884,045 | |||||||
* Securities valued at $0. |
The accompanying notes are an integral part of these financial statements.
Pioneer Strategic Income Fund | Semiannual Report | 3/31/21 89
Schedule of Investments | 3/31/21
(unaudited) (continued)
The following is a reconciliation of assets valued using significant unobservable inputs (Level 3):
| Insurance- | ||||||||||||
| Common | Linked | |||||||||||
| Stocks | Securities | Total | ||||||||||
Balance as of 9/30/20 | $ | 434,207 | $ | 115,767,812 | $ | 116,202,019 | ||||||
Realized gain (loss)(1) | — | (274,395 | ) | (274,395 | ) | |||||||
Changed in unrealized appreciation (depreciation)(2) | 23,425 | (296,290 | ) | (272,865 | ) | |||||||
Accrued discounts/premiums | — | 11,009 | 11,009 | |||||||||
Purchases | — | 59,315,198 | 59,315,198 | |||||||||
Sales | — | (71,660,115 | ) | (71,660,115 | ) | |||||||
Transfers in to Level 3* | — | — | — | |||||||||
Transfers out of Level 3* | (286,964 | ) | (1,744,693 | ) | (2,031,657 | ) | ||||||
| Balance as of 3/31/21 | $ | 170,668 | $ | 101,118,526 | $ | 101,289,194 | ||||||
(1) Realized gain (loss) on these securities is included in the realized gain (loss) from investments on the Statement of Operations.
(2) Unrealized appreciation (depreciation) on these securities is included in the change in unrealized appreciation (depreciation) from investments on the Statement of Operations.
* Transfers are calculated on the beginning of period values. During the six months ended March 31, 2021 investments having aggregate value of $2,031,657 were transferred out of Level 3 to Level 2, as there were significant observable inputs available to determine their value. There were no other transfers in or out of Level 3.
Net change in unrealized appreciation (depreciation) of Level 3 investments still held and considered | |
Level 3 at March 31, 2021: | $106,850 |
The accompanying notes are an integral part of these financial statements.
90 Pioneer Strategic Income Fund | Semiannual Report | 3/31/21
(unaudited)
| ASSETS: | ||||
| Investments in unaffiliated issuers, at value (cost $4,452,794,788) | $ | 4,527,659,553 | ||
| Cash | 240,203,668 | |||
| Foreign currencies, at value (cost $2,714,653) | 2,995,059 | |||
| Futures collateral | 886,262 | |||
| Swaps collateral | 801,658 | |||
| Due from broker for futures | 21,190,714 | |||
| Variation margin for centrally cleared swap contracts | 9,967 | |||
| Swap contracts, at value (net premiums paid $44,820,137) | 47,076,136 | |||
| Receivables — | ||||
| Investment securities sold | 258,284,245 | |||
| Fund shares sold | 7,652,274 | |||
| Dividends | 219,566 | |||
| Interest | 33,403,450 | |||
| Other assets | 132,017 | |||
| Total assets | $ | 5,140,514,569 | ||
| LIABILITIES: | ||||
| Payables — | ||||
| Investment securities purchased | $ | 636,350,313 | ||
| Fund shares repurchased | 7,094,701 | |||
| Distributions | 1,792,465 | |||
| Swaps collateral | 582,256 | |||
| Due to broker for swaps | 227,311 | |||
| Variation margin for futures contracts | 1,789,430 | |||
| Written options outstanding (net premiums received $(558,706)) | 245,139 | |||
| Net unrealized depreciation on forward foreign currency exchange contracts | 4,583,751 | |||
| Net unrealized depreciation on futures contracts | 2,363,201 | |||
| Reserve for repatriation taxes | 424,907 | |||
| Due to affiliates | 411,288 | |||
| Accrued expenses | 1,267,985 | |||
| Total liabilities | $ | 657,132,747 | ||
| NET ASSETS: | ||||
| Paid-in capital | $ | 4,350,946,574 | ||
| Distributable earnings | 132,435,248 | |||
| Net assets | $ | 4,483,381,822 | ||
| NET ASSET VALUE PER SHARE: | ||||
No par value (unlimited number of shares authorized) | ||||
| Class A (based on $851,893,403/76,114,928 shares) | $ | 11.19 | ||
| Class C (based on $125,526,051/11,463,332 shares) | $ | 10.95 | ||
| Class K (based on $440,808,477/39,331,023 shares) | $ | 11.21 | ||
| Class R (based on $98,290,932/8,633,626 shares) | $ | 11.38 | ||
| Class Y (based on $2,966,862,959/265,165,374 shares) | $ | 11.19 | ||
| MAXIMUM OFFERING PRICE PER SHARE: | ||||
| Class A (based on $11.19 net asset value per share/100%-4.50% | ||||
| maximum sales charge) | $ | 11.72 | ||
The accompanying notes are an integral part of these financial statements.
Pioneer Strategic Income Fund | Semiannual Report | 3/31/21 91
Statement of Operations (unaudited)
FOR THE SIX MONTHS ENDED 3/31/21
| INVESTMENT INCOME: | ||||||||
| Interest from unaffiliated issuers (net of foreign taxes | ||||||||
| withheld $287,618) | $ | 93,023,384 | ||||||
| Dividends from unaffiliated issuers | 5,184,033 | |||||||
| Total investment income | $ | 98,207,417 | ||||||
| EXPENSES: | ||||||||
| Management fees | $ | 12,630,746 | ||||||
| Administrative expense | 595,835 | |||||||
| Transfer agent fees | ||||||||
| Class A | 683,940 | |||||||
| Class C | 80,738 | |||||||
| Class K | 3,620 | |||||||
| Class R | 107,248 | |||||||
| Class Y | 1,526,114 | |||||||
| Distribution fees | ||||||||
| Class A | 1,052,246 | |||||||
| Class C | 762,089 | |||||||
| Class R | 254,888 | |||||||
| Shareowner communications expense | 127,683 | |||||||
| Custodian fees | 173,128 | |||||||
| Registration fees | 54,036 | |||||||
| Professional fees | 225,994 | |||||||
| Printing expense | 34,628 | |||||||
| Pricing fees | 86,662 | |||||||
| Trustees’ fees | 107,538 | |||||||
| Insurance expense | 3,733 | |||||||
| Miscellaneous | 114,724 | |||||||
| Total expenses | $ | 18,625,590 | ||||||
| Net investment income | $ | 79,581,827 | ||||||
| REALIZED AND UNREALIZED GAIN (LOSS) ON INVESTMENTS: | ||||||||
| Net realized gain (loss) on: | ||||||||
| Investments in unaffiliated issuers | $ | 68,038,613 | ||||||
| Short sales | 510,426 | |||||||
| Written options | 1,505,990 | |||||||
| Forward foreign currency exchange contracts | 12,499,947 | |||||||
| Futures contracts | 6,395,717 | |||||||
| Swap contracts | 13,863,122 | |||||||
| Other assets and liabilities denominated in foreign currencies | (745,422 | ) | $ | 102,068,393 | ||||
| Change in net unrealized appreciation (depreciation) on: | ||||||||
| Investments in unaffiliated issuers (net of foreign capital | ||||||||
| gains tax of $(58,875)) | $ | 29,969,462 | ||||||
| Written options | 240,546 | |||||||
| Forward foreign currency exchange contracts | (1,900,074 | ) | ||||||
| Futures contracts | (1,106,678 | ) | ||||||
| Swap contracts | (8,481,168 | ) | ||||||
| Unfunded loan commitments | 303 | |||||||
| Other assets and liabilities denominated in | ||||||||
| foreign currencies | 547,327 | $ | 19,269,718 | |||||
| Net realized and unrealized gain (loss) on investments | $ | 121,338,111 | ||||||
| Net increase in net assets resulting from operations | $ | 200,919,938 | ||||||
The accompanying notes are an integral part of these financial statements.
92 Pioneer Strategic Income Fund | Semiannual Report | 3/31/21
Statements of Changes in Net Assets
| Six Months | ||||||||
| Ended | Year | |||||||
| 3/31/21 | Ended | |||||||
| (unaudited) | 9/30/20 | |||||||
| FROM OPERATIONS: | ||||||||
Net investment income (loss) | $ | 79,581,827 | $ | 169,344,286 | ||||
Net realized gain (loss) on investments | 102,068,393 | 41,266,796 | ||||||
Change in net unrealized appreciation (depreciation) | ||||||||
| on investments | 19,269,718 | (90,617,652 | ) | |||||
| Net increase in net assets resulting from operations | $ | 200,919,938 | $ | 119,993,430 | ||||
| DISTRIBUTIONS TO SHAREOWNERS: | ||||||||
| Class A ($0.21 and $0.34 per share, respectively) | $ | (15,871,747 | ) | $ | (24,660,237 | ) | ||
| Class C ($0.17 and $0.27 per share, respectively) | (2,285,233 | ) | (6,454,194 | ) | ||||
| Class K ($0.24 and $0.39 per share, respectively) | (9,162,911 | ) | (14,676,179 | ) | ||||
| Class R ($0.19 and $0.31 per share, respectively) | (1,721,744 | ) | (3,330,824 | ) | ||||
| Class Y ($0.23 and $0.38 per share, respectively) | (60,411,887 | ) | (103,573,428 | ) | ||||
| Total distributions to shareowners | $ | (89,453,522 | ) | $ | (152,694,862 | ) | ||
| FROM FUND SHARE TRANSACTIONS: | ||||||||
Net proceeds from sales of shares | $ | 700,950,059 | $ | 1,322,110,291 | ||||
Reinvestment of distributions | 74,106,175 | 125,813,471 | ||||||
Cost of shares repurchased | (803,100,676 | ) | (1,674,309,428 | ) | ||||
| Net decrease in net assets resulting from Fund | ||||||||
| share transactions | $ | (28,044,442 | ) | $ | (226,385,666 | ) | ||
| Net increase (decrease) in net assets | $ | 83,421,974 | $ | (259,087,098 | ) | |||
| NET ASSETS: | ||||||||
Beginning of period | $ | 4,399,959,848 | $ | 4,659,046,946 | ||||
End of period | $ | 4,483,381,822 | $ | 4,399,959,848 | ||||
The accompanying notes are an integral part of these financial statements.
Pioneer Strategic Income Fund | Semiannual Report | 3/31/21 93
Statements of Changes in Net Assets
(continued)
| Six Months | Six Months | |||||||||||||||
| Ended | Ended | Year | Year | |||||||||||||
| 3/31/21 | 3/31/21 | Ended | Ended | |||||||||||||
| Shares | Amount | 9/30/20 | 9/30/20 | |||||||||||||
(unaudited) | (unaudited) | Shares | Amount | |||||||||||||
| Class A | ||||||||||||||||
Shares sold | 10,344,681 | $ | 116,747,605 | 17,894,552 | $ | 191,819,073 | ||||||||||
Reinvestment of distributions | 1,164,969 | 13,125,064 | 1,974,424 | 21,080,155 | ||||||||||||
Less shares repurchased | (8,721,890 | ) | (98,104,870 | ) | (20,261,286 | ) | (214,492,936 | ) | ||||||||
| Net increase (decrease) | 2,787,760 | $ | 31,767,799 | (392,310 | ) | $ | (1,593,708 | ) | ||||||||
| Class C | ||||||||||||||||
Shares sold | 694,990 | $ | 7,666,931 | 1,954,802 | $ | 20,476,627 | ||||||||||
Reinvestment of distributions | 190,721 | 2,099,409 | 482,311 | 5,039,074 | ||||||||||||
Less shares repurchased | (6,817,335 | ) | (75,310,491 | ) | (14,297,915 | ) | (149,756,299 | ) | ||||||||
| Net decrease | (5,931,624 | ) | $ | (65,544,151 | ) | (11,860,802 | ) | $ | (124,240,598 | ) | ||||||
| Class K | ||||||||||||||||
Shares sold | 10,628,040 | $ | 120,610,312 | 15,342,569 | $ | 163,693,231 | ||||||||||
Reinvestment of distributions | 734,727 | 8,284,156 | 1,195,696 | 12,789,793 | ||||||||||||
Less shares repurchased | (9,982,468 | ) | (112,456,742 | ) | (15,414,913 | ) | (162,058,515 | ) | ||||||||
| Net increase | 1,380,299 | $ | 16,437,726 | 1,123,352 | $ | 14,424,509 | ||||||||||
| Class R | ||||||||||||||||
Shares sold | 912,621 | $ | 10,459,742 | 2,167,102 | $ | 23,612,372 | ||||||||||
Reinvestment of distributions | 149,039 | 1,707,044 | 297,936 | 3,235,307 | ||||||||||||
Less shares repurchased | (1,766,670 | ) | (20,187,358 | ) | (4,970,929 | ) | (53,871,495 | ) | ||||||||
| Net decrease | (705,010 | ) | $ | (8,020,572 | ) | (2,505,891 | ) | $ | (27,023,816 | ) | ||||||
| Class Y | ||||||||||||||||
Shares sold | 39,509,466 | $ | 445,465,469 | 86,449,522 | $ | 922,508,988 | ||||||||||
Reinvestment of distributions | 4,342,944 | 48,890,502 | 7,836,310 | 83,669,142 | ||||||||||||
Less shares repurchased | (44,251,685 | ) | (497,041,215 | ) | (105,061,141 | ) | (1,094,130,183 | ) | ||||||||
| Net decrease | (399,275 | ) | $ | (2,685,244 | ) | (10,775,309 | ) | $ | (87,952,053 | ) | ||||||
The accompanying notes are an integral part of these financial statements.
94 Pioneer Strategic Income Fund | Semiannual Report | 3/31/21
Financial Highlights
| Six Months | ||||||||||||||||||||||||
| Ended | Year | Year | Year | Year | Year | |||||||||||||||||||
| 3/31/21 | Ended | Ended | Ended | Ended | Ended | |||||||||||||||||||
| (unaudited) | 9/30/20 | 9/30/19 | 9/30/18 | 9/30/17 | 9/30/16* | |||||||||||||||||||
| Class A | ||||||||||||||||||||||||
Net asset value, beginning of period | $ | 10.91 | $ | 10.89 | $ | 10.42 | $ | 10.82 | $ | 10.76 | $ | 10.36 | ||||||||||||
Increase (decrease) from investment operations: | ||||||||||||||||||||||||
| Net investment income (loss) (a) | $ | 0.19 | $ | 0.38 | $ | 0.36 | $ | 0.35 | $ | 0.37 | $ | 0.40 | ||||||||||||
| Net realized and unrealized gain (loss) on investments | 0.30 | (0.02 | ) | 0.42 | (0.42 | ) | 0.04 | 0.36 | ||||||||||||||||
| Net increase (decrease) from investment operations | $ | 0.49 | $ | 0.36 | $ | 0.78 | $ | (0.07 | ) | $ | 0.41 | $ | 0.76 | |||||||||||
Distributions to shareowners: | ||||||||||||||||||||||||
| Net investment income | $ | (0.21 | ) | $ | (0.34 | ) | $ | (0.27 | ) | $ | (0.31 | ) | $ | (0.33 | ) | $ | (0.36 | ) | ||||||
| Tax return of capital | — | — | (0.04 | ) | (0.02 | ) | (0.02 | ) | — | |||||||||||||||
| Total distributions | $ | (0.21 | ) | $ | (0.34 | ) | $ | (0.31 | ) | $ | (0.33 | ) | $ | (0.35 | ) | $ | (0.36 | ) | ||||||
| Net increase (decrease) in net asset value | $ | 0.28 | $ | 0.02 | $ | 0.47 | $ | (0.40 | ) | $ | 0.06 | $ | 0.40 | |||||||||||
Net asset value, end of period | $ | 11.19 | $ | 10.91 | $ | 10.89 | $ | 10.42 | $ | 10.82 | $ | 10.76 | ||||||||||||
| Total return (b) | 4.50 | %(c) | 3.44 | % | 7.64 | % | (0.67 | )% | 3.90 | % | 7.50 | % | ||||||||||||
Ratio of net expenses to average net assets | 1.05 | %(d) | 1.06 | % | 1.10 | % | 1.03 | % | 1.06 | % | 1.04 | % | ||||||||||||
Ratio of net investment income (loss) to average net assets | 3.31 | %(d) | 3.59 | % | 3.39 | % | 3.28 | % | 3.41 | % | 3.80 | % | ||||||||||||
Portfolio turnover rate | 34 | %(c) | 69 | % | 53 | % | 44 | % | 52 | % | 43 | % | ||||||||||||
Net assets, end of period (in thousands) | $ | 851,893 | $ | 799,974 | $ | 803,174 | $ | 861,517 | $ | 1,038,090 | $ | 1,289,783 | ||||||||||||
* | The Fund was audited by an independent registered public accounting firm other than Ernst & Young LLP. |
(a) | The per-share data presented above is based on the average shares outstanding for the period presented. |
(b) | Assumes initial investment at net asset value at the beginning of each period, reinvestment of all distributions, the complete redemption of the investment at net asset value at the end of each period and no sales charges. Total return would be reduced if sales charges were taken into account. |
(c) | Not annualized. |
(d) | Annualized. |
The accompanying notes are an integral part of these financial statements.
Pioneer Strategic Income Fund | Semiannual Report | 3/31/21 95
Financial Highlights (continued)
| Six Months | ||||||||||||||||||||||||
| Ended | Year | Year | Year | Year | Year | |||||||||||||||||||
| 3/31/21 | Ended | Ended | Ended | Ended | Ended | |||||||||||||||||||
| (unaudited) | 9/30/20 | 9/30/19 | 9/30/18 | 9/30/17 | 9/30/16* | |||||||||||||||||||
| Class C | ||||||||||||||||||||||||
Net asset value, beginning of period | $ | 10.67 | $ | 10.66 | $ | 10.20 | $ | 10.59 | $ | 10.53 | $ | 10.13 | ||||||||||||
Increase (decrease) from investment operations: | ||||||||||||||||||||||||
| Net investment income (loss) (a) | $ | 0.14 | $ | 0.30 | $ | 0.28 | $ | 0.27 | $ | 0.29 | $ | 0.32 | ||||||||||||
| Net realized and unrealized gain (loss) on investments | 0.31 | (0.02 | ) | 0.42 | (0.41 | ) | 0.04 | 0.36 | ||||||||||||||||
| Net increase (decrease) from investment operations | $ | 0.45 | $ | 0.28 | $ | 0.70 | $ | (0.14 | ) | $ | 0.33 | $ | 0.68 | |||||||||||
Distributions to shareowners: | ||||||||||||||||||||||||
| Net investment income | $ | (0.17 | ) | $ | (0.27 | ) | $ | (0.20 | ) | $ | (0.23 | ) | $ | (0.25 | ) | $ | (0.28 | ) | ||||||
| Tax return of capital | — | — | (0.04 | ) | (0.02 | ) | (0.02 | ) | — | |||||||||||||||
| Total distributions | $ | (0.17 | ) | $ | (0.27 | ) | $ | (0.24 | ) | $ | (0.25 | ) | $ | (0.27 | ) | $ | (0.28 | ) | ||||||
| Net increase (decrease) in net asset value | $ | 0.28 | $ | 0.01 | $ | 0.46 | $ | (0.39 | ) | $ | 0.06 | $ | 0.40 | |||||||||||
Net asset value, end of period | $ | 10.95 | $ | 10.67 | $ | 10.66 | $ | 10.20 | $ | 10.59 | $ | 10.53 | ||||||||||||
| Total return (b) | 4.19 | %(c) | 2.67 | % | 6.96 | % | (1.30 | )% | 3.23 | % | 6.88 | % | ||||||||||||
Ratio of net expenses to average net assets | 1.74 | %(d) | 1.73 | % | 1.74 | % | 1.69 | % | 1.72 | % | 1.72 | % | ||||||||||||
Ratio of net investment income (loss) to average net assets | 2.63 | %(d) | 2.89 | % | 2.75 | % | 2.62 | % | 2.75 | % | 3.12 | % | ||||||||||||
Portfolio turnover rate | 34 | %(c) | 69 | % | 53 | % | 44 | % | 52 | % | 43 | % | ||||||||||||
Net assets, end of period (in thousands) | $ | 125,526 | $ | 185,623 | $ | 311,801 | $ | 466,033 | $ | 697,820 | $ | 913,048 | ||||||||||||
* | The Fund was audited by an independent registered public accounting firm other than Ernst & Young LLP. |
(a) | The per-share data presented above is based on the average shares outstanding for the period presented. |
(b) | Assumes initial investment at net asset value at the beginning of each period, reinvestment of all distributions, the complete redemption of the investment at net asset value at the end of each period and no sales charges. Total return would be reduced if sales charges were taken into account. |
(c) | Not annualized. |
(d) | Annualized. |
The accompanying notes are an integral part of these financial statements.
96 Pioneer Strategic Income Fund | Semiannual Report | 3/31/21
| Six Months | ||||||||||||||||||||||||
| Ended | Year | Year | Year | Year | Year | |||||||||||||||||||
| 3/31/21 | Ended | Ended | Ended | Ended | Ended | |||||||||||||||||||
| (unaudited) | 9/30/20 | 9/30/19 | 9/30/18 | 9/30/17 | 9/30/16* | |||||||||||||||||||
| Class K | ||||||||||||||||||||||||
Net asset value, beginning of period | $ | 10.92 | $ | 10.92 | $ | 10.44 | $ | 10.84 | $ | 10.78 | $ | 10.38 | ||||||||||||
Increase (decrease) from investment operations: | ||||||||||||||||||||||||
| Net investment income (loss) (a) | $ | 0.21 | $ | 0.43 | $ | 0.41 | $ | 0.39 | $ | 0.41 | $ | 0.44 | ||||||||||||
| Net realized and unrealized gain (loss) on investments | 0.32 | (0.04 | ) | 0.43 | (0.41 | ) | 0.05 | 0.37 | ||||||||||||||||
| Net increase (decrease) from investment operations | $ | 0.53 | $ | 0.39 | $ | 0.84 | $ | (0.02 | ) | $ | 0.46 | $ | 0.81 | |||||||||||
Distributions to shareowners: | ||||||||||||||||||||||||
| Net investment income | $ | (0.24 | ) | $ | (0.39 | ) | $ | (0.32 | ) | $ | (0.36 | ) | $ | (0.38 | ) | $ | (0.41 | ) | ||||||
| Tax return of capital | — | — | (0.04 | ) | (0.02 | ) | (0.02 | ) | — | |||||||||||||||
| Total distributions | $ | (0.24 | ) | $ | (0.39 | ) | $ | (0.36 | ) | $ | (0.38 | ) | $ | (0.40 | ) | $ | (0.41 | ) | ||||||
| Net increase (decrease) in net asset value | $ | 0.29 | $ | — | $ | 0.48 | $ | (0.40 | ) | $ | 0.06 | $ | 0.40 | |||||||||||
Net asset value, end of period | $ | 11.21 | $ | 10.92 | $ | 10.92 | $ | 10.44 | $ | 10.84 | $ | 10.78 | ||||||||||||
| Total return (b) | 4.81 | %(c) | 3.73 | % | 8.19 | % | (0.23 | )% | 4.36 | % | 7.96 | % | ||||||||||||
Ratio of net expenses to average net assets | 0.63 | %(d) | 0.62 | % | 0.63 | % | 0.62 | % | 0.62 | % | 0.62 | % | ||||||||||||
Ratio of net investment income (loss) to average net assets | 3.74 | %(d) | 4.02 | % | 3.86 | % | 3.70 | % | 3.83 | % | 4.20 | % | ||||||||||||
Portfolio turnover rate | 34 | %(c) | 69 | % | 53 | % | 44 | % | 52 | % | 43 | % | ||||||||||||
Net assets, end of period (in thousands) | $ | 440,808 | $ | 414,610 | $ | 402,042 | $ | 379,474 | $ | 400,888 | $ | 267,495 | ||||||||||||
* | The Fund was audited by an independent registered public accounting firm other than Ernst & Young LLP. |
(a) | The per-share data presented above is based on the average shares outstanding for the period presented. |
(b) | Assumes initial investment at net asset value at the beginning of each period, reinvestment of all distributions and the complete redemption of the investment at net asset value at the end of each period. |
(c) | Not annualized. |
(d) | Annualized. |
The accompanying notes are an integral part of these financial statements.
Pioneer Strategic Income Fund | Semiannual Report | 3/31/21 97
Financial Highlights (continued)
| Six Months | ||||||||||||||||||||||||
| Ended | Year | Year | Year | Year | Year | |||||||||||||||||||
| 3/31/21 | Ended | Ended | Ended | Ended | Ended | |||||||||||||||||||
| (unaudited) | 9/30/20 | 9/30/19 | 9/30/18 | 9/30/17 | 9/30/16* | |||||||||||||||||||
| Class R | ||||||||||||||||||||||||
Net asset value, beginning of period | $ | 11.09 | $ | 11.08 | $ | 10.59 | $ | 11.00 | $ | 10.93 | $ | 10.52 | ||||||||||||
Increase (decrease) from investment operations: | ||||||||||||||||||||||||
| Net investment income (loss) (a) | $ | 0.17 | $ | 0.35 | $ | 0.33 | $ | 0.32 | $ | 0.33 | $ | 0.37 | ||||||||||||
| Net realized and unrealized gain (loss) on investments | 0.31 | (0.03 | ) | 0.44 | (0.43 | ) | 0.05 | 0.37 | ||||||||||||||||
| Net increase (decrease) from investment operations | $ | 0.48 | $ | 0.32 | $ | 0.77 | $ | (0.11 | ) | $ | 0.38 | $ | 0.74 | |||||||||||
Distributions to shareowners: | ||||||||||||||||||||||||
| Net investment income | $ | (0.19 | ) | $ | (0.31 | ) | $ | (0.24 | ) | $ | (0.28 | ) | $ | (0.29 | ) | $ | (0.33 | ) | ||||||
| Tax return of capital | — | — | (0.04 | ) | (0.02 | ) | (0.02 | ) | — | |||||||||||||||
| Total distributions | $ | (0.19 | ) | $ | (0.31 | ) | $ | (0.28 | ) | $ | (0.30 | ) | $ | (0.31 | ) | $ | (0.33 | ) | ||||||
| Net increase (decrease) in net asset value | $ | 0.29 | $ | 0.01 | $ | 0.49 | $ | (0.41 | ) | $ | 0.07 | $ | 0.41 | |||||||||||
Net asset value, end of period | $ | 11.38 | $ | 11.09 | $ | 11.08 | $ | 10.59 | $ | 11.00 | $ | 10.93 | ||||||||||||
| Total return (b) | 4.35 | %(c) | 3.03 | % | 7.43 | % | (1.02 | )% | 3.57 | % | 7.17 | % | ||||||||||||
Ratio of net expenses to average net assets | 1.34 | %(d) | 1.40 | % | 1.39 | % | 1.34 | % | 1.41 | % | 1.35 | % | ||||||||||||
Ratio of net investment income (loss) to average net assets | 3.02 | %(d) | 3.23 | % | 3.10 | % | 2.97 | % | 3.05 | % | 3.49 | % | ||||||||||||
Portfolio turnover rate | 34 | %(c) | 69 | % | 53 | % | 44 | % | 52 | % | 43 | % | ||||||||||||
Net assets, end of period (in thousands) | $ | 98,291 | $ | 103,539 | $ | 131,214 | $ | 168,043 | $ | 223,372 | $ | 232,545 | ||||||||||||
* | The Fund was audited by an independent registered public accounting firm other than Ernst & Young LLP. |
(a) | The per-share data presented above is based on the average shares outstanding for the period presented. |
(b) | Assumes initial investment at net asset value at the beginning of each period, reinvestment of all distributions and the complete redemption of the investment at net asset value at the end of each period. |
(c) | Not annualized. |
(d) | Annualized. |
The accompanying notes are an integral part of these financial statements.
98 Pioneer Strategic Income Fund | Semiannual Report | 3/31/21
| Six Months | ||||||||||||||||||||||||
| Ended | Year | Year | Year | Year | Year | |||||||||||||||||||
| 3/31/21 | Ended | Ended | Ended | Ended | Ended | |||||||||||||||||||
| (unaudited) | 9/30/20 | 9/30/19 | 9/30/18 | 9/30/17 | 9/30/16* | |||||||||||||||||||
| Class Y | ||||||||||||||||||||||||
Net asset value, beginning of period | $ | 10.91 | $ | 10.90 | $ | 10.42 | $ | 10.82 | $ | 10.76 | $ | 10.36 | ||||||||||||
Increase (decrease) from investment operations: | ||||||||||||||||||||||||
| Net investment income (loss) (a) | $ | 0.20 | $ | 0.42 | $ | 0.40 | $ | 0.38 | $ | 0.40 | $ | 0.43 | ||||||||||||
| Net realized and unrealized gain (loss) on investments | 0.31 | (0.03 | ) | 0.42 | (0.42 | ) | 0.05 | 0.36 | ||||||||||||||||
| Net increase (decrease) from investment operations | $ | 0.51 | $ | 0.39 | $ | 0.82 | $ | (0.04 | ) | $ | 0.45 | $ | 0.79 | |||||||||||
Distributions to shareowners: | ||||||||||||||||||||||||
| Net investment income | $ | (0.23 | ) | $ | (0.38 | ) | $ | (0.30 | ) | $ | (0.34 | ) | $ | (0.37 | ) | $ | (0.39 | ) | ||||||
| Tax return of capital | — | — | (0.04 | ) | (0.02 | ) | (0.02 | ) | — | |||||||||||||||
| Total distributions | $ | (0.23 | ) | $ | (0.38 | ) | $ | (0.34 | ) | $ | (0.36 | ) | $ | (0.39 | ) | $ | (0.39 | ) | ||||||
| Net increase (decrease) in net asset value | $ | 0.28 | $ | 0.01 | $ | 0.48 | $ | (0.40 | ) | $ | 0.06 | $ | 0.40 | |||||||||||
Net asset value, end of period | $ | 11.19 | $ | 10.91 | $ | 10.90 | $ | 10.42 | $ | 10.82 | $ | 10.76 | ||||||||||||
| Total return (b) | 4.67 | %(c) | 3.71 | % | 8.09 | % | (0.34 | )% | 4.23 | % | 7.84 | % | ||||||||||||
Ratio of net expenses to average net assets | 0.73 | %(d) | 0.74 | % | 0.73 | % | 0.72 | % | 0.74 | % | 0.73 | % | ||||||||||||
Ratio of net investment income (loss) to average net assets | 3.63 | %(d) | 3.91 | % | 3.75 | % | 3.60 | % | 3.72 | % | 4.11 | % | ||||||||||||
Portfolio turnover rate | 34 | %(c) | 69 | % | 53 | % | 44 | % | 52 | % | 43 | % | ||||||||||||
Net assets, end of period (in thousands) | $ | 2,966,863 | $ | 2,896,168 | $ | 3,010,817 | $ | 3,208,774 | $ | 3,560,072 | $ | 3,512,802 | ||||||||||||
* | The Fund was audited by an independent registered public accounting firm other than Ernst & Young LLP. |
(a) | The per-share data presented above is based on the average shares outstanding for the period presented. |
(b) | Assumes initial investment at net asset value at the beginning of each period, reinvestment of all distributions and the complete redemption of the investment at net asset value at the end of each period. |
(c) | Not annualized. |
(d) | Annualized. |
The accompanying notes are an integral part of these financial statements.
Pioneer Strategic Income Fund | Semiannual Report | 3/31/21 99
(unaudited)
1. Organization and Significant Accounting Policies
Pioneer Strategic Income Fund (the “Fund”) is one of five portfolios comprising Pioneer Series Trust XIV (formerly known as Pioneer Strategic Income Fund), a Delaware statutory trust. The Fund is registered under the Investment Company Act of 1940 as a diversified, open-end management investment company. The investment objective of the Fund is to produce a high level of current income.
The Fund offers five classes of shares designated as Class A, Class C, Class K, Class R and Class Y shares. Each class of shares represents an interest in the same portfolio of investments of the Fund and has identical rights (based on relative net asset values) to assets and liquidation proceeds. Share classes can bear different rates of class-specific fees and expenses, such as transfer agent and distribution fees. Differences in class-specific fees and expenses will result in differences in net investment income and, therefore, the payment of different dividends from net investment income earned by each class. The Amended and Restated Declaration of Trust of the Fund gives the Board of Trustees the flexibility to specify either per-share voting or dollar-weighted voting when submitting matters for shareowner approval. Under per-share voting, each share of a class of the Fund is entitled to one vote. Under dollar-weighted voting, a shareowner’s voting power is determined not by the number of shares owned, but by the dollar value of the shares on the record date. Each share class has exclusive voting rights with respect to matters affecting only that class, including with respect to the distribution plan for that class. There is no distribution plan for Class K and Class Y shares.
Amundi Asset Management US, Inc., an indirect, wholly owned subsidiary of Amundi and Amundi’s wholly owned subsidiary, Amundi USA, Inc., serves as the Fund’s investment adviser (the “Adviser”). Prior to January 1, 2021, the Adviser was named Amundi Pioneer Asset Management, Inc. Amundi Distributor US, Inc., an affiliate of Amundi Asset Management US, Inc., serves as the Fund’s distributor (the “Distributor”).
In August 2018, the Financial Accounting Standards Board (FASB) issued Accounting Standards Update 2018-13 “Disclosure Framework - Changes to the Disclosure Requirements for Fair Value Measurement” (“ASU 2018-13”) which modifies disclosure requirements for fair value measurements, principally for Level 3 securities and transfers between levels of the fair value hierarchy. ASU 2018-13 is effective for fiscal years beginning after December 15, 2019 and for interim periods within those fiscal years. The
100 Pioneer Strategic Income Fund | Semiannual Report | 3/31/21
Fund has adopted ASU 2018-13 for the six months ended March 31, 2021. The impact to the Fund’s adoption was limited to changes in the Fund’s disclosures regarding fair value, primarily those disclosures related to transfers between levels of the fair value hierarchy and disclosure of the range and weighted average used to develop significant unobservable inputs for Level 3 fair value investments, when applicable.
In March 2020, FASB issued an Accounting Standard Update, ASU 2020-04, Reference Rate Reform (Topic 848) — Facilitation of the Effects of Reference Rate Reform on Financial Reporting (“ASU 2020-04”), which provides optional, temporary relief with respect to the financial reporting of contracts subject to certain types of modifications due to the planned discontinuation of the London Interbank Offered Rate (“LIBOR”) and other LIBOR-based reference rates at the end of 2021. The temporary relief provided by ASU 2020-04 is effective for certain reference rate-related contract modifications that occur during the period from March 12, 2020 through December 31, 2022. Management is evaluating the impact of ASU 2020-04 on the Fund’s investments, derivatives, debt and other contracts, if applicable, that will undergo reference rate-related modifications as a result of the reference rate reform.
The Fund is an investment company and follows investment company accounting and reporting guidance under U.S. Generally Accepted Accounting Principles (“U.S. GAAP”). U.S. GAAP requires the management of the Fund to make estimates and assumptions that affect the reported amounts of assets and liabilities, the disclosure of contingent assets and liabilities at the date of the financial statements, and the reported amounts of income, expenses and gain or loss on investments during the reporting period. Actual results could differ from those estimates.
The following is a summary of significant accounting policies followed by the Fund in the preparation of its financial statements:
A. Security Valuation
The net asset value of the Fund is computed once daily, on each day the New York Stock Exchange (“NYSE”) is open, as of the close of regular trading on the NYSE.
Fixed-income securities are valued by using prices supplied by independent pricing services, which consider such factors as market prices, market events, quotations from one or more brokers, Treasury spreads, yields, maturities and ratings, or may use a pricing matrix or other fair value methods or techniques to provide an estimated value of the security or instrument. A pricing matrix is a means of valuing a debt security on the basis of current market prices for other debt securities, historical trading
Pioneer Strategic Income Fund | Semiannual Report | 3/31/21 101
patterns in the market for fixed-income securities and/or other factors. Non-U.S. debt securities that are listed on an exchange will be valued at the bid price obtained from an independent third party pricing service. When independent third party pricing services are unable to supply prices, or when prices or market quotations are considered to be unreliable, the value of that security may be determined using quotations from one or more broker-dealers.
Loan interests are valued in accordance with guidelines established by the Board of Trustees at the mean between the last available bid and asked prices from one or more brokers or dealers as obtained from Loan Pricing Corporation, an independent third party pricing service. If price information is not available from Loan Pricing Corporation, or if the price information is deemed to be unreliable, price information will be obtained from an alternative pricing service. If no reliable price quotes are available from either the primary or alternative pricing service, broker quotes will be solicited.
Event-linked bonds are valued at the bid price obtained from an independent third party pricing service. Other insurance-linked securities (including reinsurance sidecars, collateralized reinsurance and industry loss warranties) may be valued at the bid price obtained from an independent pricing service, or through a third party using a pricing matrix, insurance industry valuation models, or other fair value methods or techniques to provide an estimated value of the instrument.
Equity securities that have traded on an exchange are valued by using the last sale price on the principal exchange where they are traded. Equity securities that have not traded on the date of valuation, or securities for which sale prices are not available, generally are valued using the mean between the last bid and asked prices or, if both last bid and asked prices are not available, at the last quoted bid price. Last sale and bid and asked prices are provided by independent third party pricing services. In the case of equity securities not traded on an exchange, prices are typically determined by independent third party pricing services using a variety of techniques and methods.
The value of foreign securities is translated into U.S. dollars based on foreign currency exchange rate quotations supplied by a third party pricing source. Trading in non-U.S. equity securities is substantially completed each day at various times prior to the close of the NYSE. The values of such securities used in computing the net asset value of the Fund’s shares are determined as of such times. The Fund may use a fair value model developed by an independent pricing service to value non-U.S. equity securities.
102 Pioneer Strategic Income Fund | Semiannual Report | 3/31/21
Options contracts are generally valued at the mean between the last bid and ask prices on the principal exchange where they are traded. Over-the-counter (“OTC”) options and options on swaps (“swaptions”) are valued using prices supplied by independent pricing services, which consider such factors as market prices, market events, quotations from one or more brokers, Treasury spreads, yields, maturities and ratings, or may use a pricing matrix or other fair value methods or techniques to provide an estimated value of the security or instrument.
Forward foreign currency exchange contracts are valued daily using the foreign exchange rate or, for longer term forward contract positions, the spot currency rate and the forward points on a daily basis, in each case provided by a third party pricing service. Contracts whose forward settlement date falls between two quoted days are valued by interpolation.
Futures contracts are generally valued at the closing settlement price established by the exchange on which they are traded.
Swap contracts, including interest rate swaps, caps and floors (other than centrally cleared swap contracts), are valued at the dealer quotations obtained from reputable International Swap Dealers Association members. Centrally cleared swaps are valued at the daily settlement price provided by the central clearing counterparty.
Securities or loan interests for which independent pricing services or broker-dealers are unable to supply prices or for which market prices and/or quotations are not readily available or are considered to be unreliable are valued by a fair valuation team comprised of certain personnel of the Adviser pursuant to procedures adopted by the Fund’s Board of Trustees. The Adviser’s fair valuation team uses fair value methods approved by the Valuation Committee of the Board of Trustees. The Adviser’s fair valuation team is responsible for monitoring developments that may impact fair valued securities and for discussing and assessing fair values on an ongoing basis, and at least quarterly, with the Valuation Committee of the Board of Trustees.
Inputs used when applying fair value methods to value a security may include credit ratings, the financial condition of the company, current market conditions and comparable securities. The Fund may use fair value methods if it is determined that a significant event has occurred after the close of the exchange or market on which the security trades and prior to the determination of the Fund’s net asset value. Examples of a significant event might include political or economic news, corporate restructurings, natural disasters, terrorist activity or trading halts. Thus, the valuation of the Fund’s securities may differ significantly from exchange prices, and such differences could be material.
Pioneer Strategic Income Fund | Semiannual Report | 3/31/21 103
At March 31, 2021, five securities were valued using fair value methods (in addition to securities valued using prices supplied by independent pricing services, broker-dealers or using a third party insurance pricing model) representing 0.01% of net assets. The value of these fair valued securities was $509,405.
B. Investment Income and Transactions
Dividend income is recorded on the ex-dividend date, except that certain dividends from foreign securities where the ex-dividend date may have passed are recorded as soon as the Fund becomes aware of the ex-dividend data in the exercise of reasonable diligence.
Interest income, including interest on income-bearing cash accounts, is recorded on the accrual basis. Dividend and interest income are reported net of unrecoverable foreign taxes withheld at the applicable country rates and net of income accrued on defaulted securities.
Interest and dividend income payable by delivery of additional shares is reclassified as PIK (payment-in-kind) income upon receipt and is included in interest and dividend income, respectively.
Principal amounts of mortgage-backed securities are adjusted for monthly paydowns. Premiums and discounts related to certain mortgage-backed securities are amortized or accreted in proportion to the monthly paydowns. All discounts/premiums on purchase prices of debt securities are accreted/amortized for financial reporting purposes over the life of the respective securities, and such accretion/amortization is included in interest income.
Security transactions are recorded as of trade date. Gains and losses on sales of investments are calculated on the identified cost method for both financial reporting and federal income tax purposes.
C. Foreign Currency Translation
The books and records of the Fund are maintained in U.S. dollars. Amounts denominated in foreign currencies are translated into U.S. dollars using current exchange rates.
Net realized gains and losses on foreign currency transactions, if any, represent, among other things, the net realized gains and losses on foreign currency exchange contracts, disposition of foreign currencies and the difference between the amount of income accrued and the U.S. dollars actually received. Further, the effects of changes in foreign currency exchange rates on investments are not segregated on the Statement of
104 Pioneer Strategic Income Fund | Semiannual Report | 3/31/21
Operations from the effects of changes in the market prices of those securities, but are included with the net realized and unrealized gain or loss on investments.
D. Federal Income Taxes
It is the Fund’s policy to comply with the requirements of the Internal Revenue Code applicable to regulated investment companies and to distribute all of its net taxable income and net realized capital gains, if any, to its shareowners. Therefore, no provision for federal income taxes is required. As of September 30, 2020, the Fund did not accrue any interest or penalties with respect to uncertain tax positions, which, if applicable, would be recorded as an income tax expense on the Statement of Operations. Tax returns filed within the prior three years remain subject to examination by federal and state tax authorities.
In determining the daily net asset value, the Fund estimates the reserve for the repatriation of taxes, if any, associated with its investments in certain countries. The estimated reserve for capital gains is based on the net unrealized appreciation on certain portfolio securities, the holding period of such securities and the related tax rates, tax loss carryforwards (if applicable) and other such factors. As of March 31, 2021, the Fund had accrued $424,907 in reserve for repatriation taxes related to capital gains.
The amount and character of income and capital gain distributions to shareowners are determined in accordance with federal income tax rules, which may differ from U.S. GAAP. Distributions in excess of net investment income or net realized gains are temporary over distributions for financial statement purposes resulting from differences in the recognition or classification of income or distributions for financial statement and tax purposes. Capital accounts within the financial statements are adjusted for permanent book/tax differences to reflect tax character, but are not adjusted for temporary differences.
The tax character of current year distributions payable will be determined at the end of the current taxable year. The tax character of distributions paid during the year ended September 30, 2020 was as follows:
| 2020 | |
| Distributions paid from: | |
| Ordinary income | $152,694,862 |
| Tax return of capital | — |
| Total | $152,694,862 |
Pioneer Strategic Income Fund | Semiannual Report | 3/31/21 105
The following shows the components of distributable earnings (losses) on a federal income tax basis at September 30, 2020:
| 2020 | |
| Distributable earnings: | |
| Current year dividend payable | $ (1,792,429) |
| Capital loss carryforward | (27,545,927) |
| Undistributed ordinary income | 14,354,034 |
| Net unrealized appreciation | 35,953,154 |
| Total | $ 20,968,832 |
The difference between book-basis and tax-basis net unrealized appreciation is attributable to the tax deferral of losses on wash sales, adjustments relating to catastrophe bonds and credit default swaps, the mark to market on forward foreign currency exchange contracts, futures contracts, credit default swaps, interest on defaulted bonds.
E. Fund Shares
The Fund records sales and repurchases of its shares as of trade date. The Distributor earned $23,106 in underwriting commissions on the sale of Class A shares during the six months ended March 31, 2021.
F. Class Allocations
Income, common expenses and realized and unrealized gains and losses are calculated at the Fund level and allocated daily to each class of shares based on its respective percentage of adjusted net assets at the beginning of the day.
Distribution fees are calculated based on the average daily net asset value attributable to Class A, Class C and Class R shares of the Fund, respectively (see Note 5). Class K and Class Y shares do not pay distribution fees. All expenses and fees paid to the Fund’s transfer agent for its services are allocated among the classes of shares based on the number of accounts in each class and the ratable allocation of related out-of-pocket expenses (see Note 4).
The Fund declares as daily dividends substantially all of its net investment income. All dividends are paid on a monthly basis. Short-term capital gain distributions, if any, may be declared with the daily dividends. Distributions to shareowners are recorded as of the ex-dividend date. Distributions paid by the Fund with respect to each class of shares are calculated in the same manner and at the same time, except that net investment income dividends to Class A, Class C, Class K, Class R and Class Y shares can reflect different transfer agent and distribution expense rates.
106 Pioneer Strategic Income Fund | Semiannual Report | 3/31/21
G. Risks
The value of securities held by the Fund may go up or down, sometimes rapidly or unpredictably, due to general market conditions, such as real or perceived adverse economic, political or regulatory conditions, recessions, the spread of infectious illness or other public health issues, inflation, changes in interest rates, lack of liquidity in the bond markets or adverse investor sentiment. In the past several years, financial markets have experienced increased volatility, depressed valuations, decreased liquidity and heightened uncertainty. These conditions may continue, recur, worsen or spread. A general rise in interest rates could adversely affect the price and liquidity of fixed-income securities and could also result in increased redemptions from the Fund.
At times, the Fund’s investments may represent industries or industry sectors that are interrelated or have common risks, making the Fund more susceptible to any economic, political, or regulatory developments or other risks affecting those industries and sectors. The Fund’s investments in foreign markets and countries with limited developing markets may subject the Fund to a greater degree of risk than investments in a developed market. These risks include disruptive political or economic conditions and the imposition of adverse governmental laws or currency exchange restrictions.
The Fund invests in below-investment-grade (high-yield) debt securities and preferred stocks. Some of these high-yield securities may be convertible into equity securities of the issuer. Debt securities rated below-investment-grade are commonly referred to as “junk bonds” and are considered speculative. These securities involve greater risk of loss, are subject to greater price volatility, and are less liquid, especially during periods of economic uncertainty or change, than higher rated debt securities.
The Fund’s investments, payment obligations and financing terms may be based on floating rates, such as LIBOR (London Interbank Offered Rate). Plans are underway to phase out the use of LIBOR. The UK Financial Conduct Authority (“FCA”) and LIBOR’s administrator, ICE Benchmark Administration (“IBA”), have announced that most LIBOR rates will no longer be published after the end of 2021 and a majority of U.S. dollar LIBOR rates will no longer be published after June 30, 2023. It is possible that the FCA may compel the IBA to publish a subset of LIBOR settings after these dates on a “synthetic” basis, but any such publications would be considered non-representative of the underlying markets. There remains uncertainty regarding the nature of any replacement rate and the impact of the transition from LIBOR on the fund, issuers of instruments in which the fund invests, and financial markets generally.
Pioneer Strategic Income Fund | Semiannual Report | 3/31/21 107
With the increased use of technologies such as the Internet to conduct business, the Fund is susceptible to operational, information security and related risks. While the Fund’s Adviser has established business continuity plans in the event of, and risk management systems to prevent, limit or mitigate, such cyber-attacks, there are inherent limitations in such plans and systems, including the possibility that certain risks have not been identified. Furthermore, the Fund cannot control the cybersecurity plans and systems put in place by service providers to the Fund such as Brown Brothers Harriman & Co., the Fund’s custodian and accounting agent, and DST Asset Manager Solutions, Inc., the Fund’s transfer agent. In addition, many beneficial owners of Fund shares hold them through accounts at broker-dealers, retirement platforms and other financial market participants over which neither the Fund nor the Adviser exercises control. Each of these may in turn rely on service providers to them, which are also subject to the risk of cyber-attacks. Cybersecurity failures or breaches at the Adviser or the Fund’s service providers or intermediaries have the ability to cause disruptions and impact business operations, potentially resulting in financial losses, interference with the Fund’s ability to calculate its net asset value, impediments to trading, the inability of Fund shareowners to effect share purchases, redemptions or exchanges or receive distributions, loss of or unauthorized access to private shareowner information and violations of applicable privacy and other laws, regulatory fines, penalties, reputational damage, or additional compliance costs. Such costs and losses may not be covered under any insurance. In addition, maintaining vigilance against cyber-attacks may involve substantial costs over time, and system enhancements may themselves be subject to cyber-attacks.
COVID-19
The respiratory illness COVID-19 caused by a novel coronavirus has resulted in a global pandemic and major disruption to economies and markets around the world, including the United States. Global financial markets have experienced extreme volatility and severe losses, and trading in many instruments has been disrupted. Liquidity for many instruments has been greatly reduced for periods of time. Some interest rates are very low and in some cases yields are negative. Some sectors of the economy and individual issuers have experienced particularly large losses. These circumstances may continue for an extended period of time, and may continue to affect adversely the value and liquidity of the Fund’s investments. The ultimate economic fallout from the pandemic, and the long-term impact on economies, markets, industries and individual issuers, are not known. Governments and central banks, including the Federal Reserve in the U.S., have taken extraordinary and unprecedented actions to support local and
108 Pioneer Strategic Income Fund | Semiannual Report | 3/31/21
global economies and the financial markets. These actions have resulted in significant expansion of public debt, including in the U.S. The impact of these measures, and whether they will be effective to mitigate the economic and market disruption, will not be known for some time. The consequences of high public debt, including its future impact on the economy and securities markets, likewise may not be known for some time.
The Fund’s prospectus contains unaudited information regarding the Fund’s principal risks. Please refer to that document when considering the Fund’s principal risks.
H. Restricted Securities
Restricted Securities are subject to legal or contractual restrictions on resale. Restricted securities generally are resold in transactions exempt from registration under the Securities Act of 1933. Private placement securities are generally considered to be restricted except for those securities traded between qualified institutional investors under the provisions of Rule 144A of the Securities Act of 1933.
Disposal of restricted investments may involve negotiations and expenses, and prompt sale at an acceptable price may be difficult to achieve. Restricted investments held by the Fund at March 31, 2021 are listed in the Schedule of Investments.
I. Insurance-Linked Securities (“ILS”)
The Fund invests in ILS. The Fund could lose a portion or all of the principal it has invested in an ILS, and the right to additional interest or dividend payments with respect to the security, upon the occurrence of one or more trigger events, as defined within the terms of an insurance-linked security. Trigger events, generally, are hurricanes, earthquakes, or other natural events of a specific size or magnitude that occur in a designated geographic region during a specified time period, and/or that involve losses or other metrics that exceed a specific amount. There is no way to accurately predict whether a trigger event will occur, and accordingly, ILS carry significant risk. The Fund is entitled to receive principal, and interest and/or dividend payments so long as no trigger event occurs of the description and magnitude specified by the instrument. In addition to the specified trigger events, ILS may expose the Fund to other risks, including but not limited to issuer (credit) default, adverse regulatory or jurisdictional interpretations and adverse tax consequences.
The Fund’s investments in ILS may include event-linked bonds. ILS also may include special purpose vehicles (“SPVs”) or similar instruments structured to comprise a portion of a reinsurer’s catastrophe-oriented business, known as quota share instruments (sometimes referred to as
Pioneer Strategic Income Fund | Semiannual Report | 3/31/21 109
reinsurance sidecars), or to provide reinsurance relating to specific risks to insurance or reinsurance companies through a collateralized instrument, known as collateralized reinsurance. Structured reinsurance investments also may include industry loss warranties (“ILWs”). A traditional ILW takes the form of a bilateral reinsurance contract, but there are also products that take the form of derivatives, collateralized structures, or exchange-traded instruments.
Where the ILS are based on the performance of underlying reinsurance contracts, the Fund has limited transparency into the individual underlying contracts, and therefore must rely upon the risk assessment and sound underwriting practices of the issuer. Accordingly, it may be more difficult for the Adviser to fully evaluate the underlying risk profile of the Fund’s structured reinsurance investments, and therefore the Fund’s assets are placed at greater risk of loss than if the Adviser had more complete information. Structured reinsurance instruments generally will be considered illiquid securities by the Fund. These securities may be difficult to purchase, sell or unwind. Illiquid securities also may be difficult to value. If the Fund is forced to sell an illiquid asset, the Fund may be forced to sell at a loss.
J. Purchased Options
The Fund may purchase put and call options to seek to increase total return. Purchased call and put options entitle the Fund to buy and sell a specified number of shares or units of a particular security, currency or index at a specified price at a specific date or within a specific period of time. Upon the purchase of a call or put option, the premium paid by the Fund is included on the Statement of Assets and Liabilities as an investment. All premiums are marked-to-market daily, and any unrealized appreciation or depreciation is recorded on the Fund’s Statement of Operations. As the purchaser of an index option, the Fund has the right to receive a cash payment equal to any depreciation in the value of the index below the strike price of the option (in the case of a put) or equal to any appreciation in the value of the index over the strike price of the option (in the case of a call) as of the valuation date of the option. Premiums paid for purchased call and put options which have expired are treated as realized losses on investments on the Statement of Operations. Upon the exercise or closing of a purchased put option, the premium is offset against the proceeds on the sale of the underlying security or financial instrument in order to determine the realized gain or loss on investments. Upon the exercise or closing of a purchased call option, the premium is added to the cost of the security or financial instrument. The risk associated with purchasing options is limited to the premium originally paid.
110 Pioneer Strategic Income Fund | Semiannual Report | 3/31/21
The average market value of purchased options contracts open during the six months ended March 31, 2021, was $295,241. Open purchased options at March 31, 2021, are listed in the Schedule of Investments.
K. Option Writing
The Fund may write put and covered call options to seek to increase total return. When an option is written, the Fund receives a premium and becomes obligated to purchase or sell the underlying security at a fixed price, upon the exercise of the option. When the Fund writes an option, an amount equal to the premium received by the Fund is recorded as “Written options outstanding” on the Statement of Assets and Liabilities and is subsequently adjusted to the current value of the option written. Premiums received from writing options that expire unexercised are treated by the Fund on the expiration date as realized gains from investments on the Statement of Operations. The difference between the premium and the amount paid on effecting a closing purchase transaction, including brokerage commissions, is also treated as a realized gain on the Statement of Operations, or, if the premium is less than the amount paid for the closing purchase transaction, as a realized loss on the Statement of Operations. If a call option is exercised, the premium is added to the proceeds from the sale of the underlying security in determining whether the Fund has realized a gain or loss. The Fund as writer of an option bears the market risk of an unfavorable change in the price of the security underlying the written option.
The average market value of written options for the six months ended March 31, 2021, was $(1,495,830). Open written options contracts at March 31, 2021, are listed in the Schedule of Investments.
L. Forward Foreign Currency Exchange Contracts
The Fund may enter into forward foreign currency exchange contracts (“contracts”) for the purchase or sale of a specific foreign currency at a fixed price on a future date. All contracts are marked-to-market daily at the applicable exchange rates, and any resulting unrealized appreciation or depreciation is recorded in the Fund’s financial statements. The Fund records realized gains and losses at the time a contract is offset by entry into a closing transaction or extinguished by delivery of the currency. Risks may arise upon entering into these contracts from the potential inability of counterparties to meet the terms of the contract and from unanticipated movements in the value of foreign currencies relative to the U.S. dollar (see Note 8).
During the six months ended March 31, 2021, the Fund had entered into various forward foreign currency exchange contracts that obligated the Fund to deliver or take delivery of currencies at specified future maturity
Pioneer Strategic Income Fund | Semiannual Report | 3/31/21 111
dates. Alternatively, prior to the settlement date of a forward foreign currency exchange contract, the Fund may close out such contract by entering into an offsetting contract.
The average market value of forward foreign currency exchange contracts open during the six months ended March 31, 2021, was $259,925,024. Open forward foreign currency exchange contracts outstanding at March 31, 2021, are listed in the Schedule of Investments.
M. Futures Contracts
The Fund may enter into futures transactions in order to attempt to hedge against changes in interest rates, securities prices and currency exchange rates or to seek to increase total return. Futures contracts are types of derivatives. All futures contracts entered into by the Fund are traded on a futures exchange. Upon entering into a futures contract, the Fund is required to deposit with a broker an amount of cash or securities equal to the minimum “initial margin” requirements of the associated futures exchange. The amount of cash deposited with the broker as collateral at March 31, 2021, is recorded as “Futures collateral” on the Statement of Assets and Liabilities.
Subsequent payments for futures contracts (“variation margin”) are paid or received by the Fund, depending on the daily fluctuation in the value of the contracts, and are recorded by the Fund as unrealized appreciation or depreciation. Cash received from or paid to the broker related to previous margin movement is held in a segregated account at the broker and is recorded as either “Due from broker for futures” or “Due to broker for futures” on the Statement of Assets and Liabilities. When the contract is closed, the Fund realizes a gain or loss equal to the difference between the opening and closing value of the contract as well as any fluctuation in foreign currency exchange rates where applicable. Futures contracts are subject to market risk, interest rate risk and currency exchange rate risk. Changes in value of the contracts may not directly correlate to the changes in value of the underlying securities. With futures, there is reduced counterparty credit risk to the Fund since futures are exchange-traded and the exchange’s clearinghouse, as counterparty to all exchange-traded futures, guarantees the futures against default.
The average market value of futures contracts open during the six months ended March 31, 2021, was $(482,556,588). Open futures contracts outstanding at March 31, 2021, are listed in the Schedule of Investments.
112 Pioneer Strategic Income Fund | Semiannual Report | 3/31/21
N. Credit Default Swap Contracts
A credit default swap is a contract between a buyer of protection and a seller of protection against a pre-defined credit event or an underlying reference obligation, which may be a single security or a basket or index of securities. The Fund may buy or sell credit default swap contracts to seek to increase the Fund’s income, or to attempt to hedge the risk of default on portfolio securities. A credit default swap index is used to hedge risk or take a position on a basket of credit entities or indices.
As a seller of protection, the Fund would be required to pay the notional (or other agreed-upon) value of the referenced debt obligation to the counterparty in the event of a default by a U.S. or foreign corporate issuer of a debt obligation, which would likely result in a loss to the Fund. In return, the Fund would receive from the counterparty a periodic stream of payments during the term of the contract, provided that no event of default occurred. The maximum exposure of loss to the seller would be the notional value of the credit default swaps outstanding. If no default occurs, the Fund would keep the stream of payments and would have no payment obligation. The Fund may also buy credit default swap contracts in order to hedge against the risk of default of debt securities, in which case the Fund would function as the counterparty referenced above.
As a buyer of protection, the Fund makes an upfront or periodic payment to the protection seller in exchange for the right to receive a contingent payment. An upfront payment made by the Fund, as the protection buyer, is recorded within the “Swap contracts, at value” line item on the Statement of Assets and Liabilities. Periodic payments received or paid by the Fund are recorded as realized gains or losses on the Statement of Operations.
Credit default swap contracts are marked-to-market daily using valuations supplied by independent sources, and the change in value, if any, is recorded within the “Swap contracts, at value” line item on the Statement of Assets and Liabilities. Payments received or made as a result of a credit event or upon termination of the contract are recognized, net of the appropriate amount of the upfront payment, as realized gains or losses on the Statement of Operations.
Credit default swap contracts involving the sale of protection may involve greater risks than if the Fund had invested in the referenced debt instrument directly. Credit default swap contracts are subject to general market risk, liquidity risk, counterparty risk and credit risk. If the Fund is a protection buyer and no credit event occurs, it will lose its investment. If the Fund is a protection seller and a credit event occurs, the value of the referenced debt instrument received by the Fund, together with the periodic
Pioneer Strategic Income Fund | Semiannual Report | 3/31/21 113
payments received, may be less than the amount the Fund pays to the protection buyer, resulting in a loss to the Fund. In addition, obligations under sell protection credit default swaps may be partially offset by net amounts received from settlement of buy protection credit default swaps entered into by the Fund for the same reference obligation with the same counterparty.
Certain swap contracts that are cleared through a central clearinghouse are referred to as centrally cleared swaps. All payments made or received by the Fund are pursuant to a centrally cleared swap contract with the central clearing party rather than the original counterparty. Upon entering into a centrally cleared swap contract, the Fund is required to make an initial margin deposit, either in cash or in securities. The daily change in value on open centrally cleared contracts is recorded as “Variation margin for centrally cleared swap contracts” on the Statement of Assets and Liabilities. Cash received from or paid to the broker related to previous margin movement is held in a segregated account at the broker and is recorded as either “Due from broker for swaps” or “Due to broker for swaps” on the Statement of Assets and Liabilities. The amount of cash deposited with a broker as collateral at March 31, 2021, is recorded as “Swaps collateral” on the Statement of Assets and Liabilities.
The average market value of credit default swap contracts open during the six months ended March 31, 2021, was $2,152,579. Open credit default swap contracts at March 31, 2021, are listed in the Schedule of Investments.
O. Total Return Swap Contracts
The Fund may enter into futures transactions in order to attempt to hedge against changes in interest rates, securities prices and currency exchange rates or to seek to increase total return. Futures contracts are types of derivatives. All futures contracts entered into by the Fund are traded on a futures exchange. Upon entering into a futures contract, the Fund is required to deposit with a broker an amount of cash or securities equal to the minimum “initial margin” requirements of the associated futures exchange. The amount of cash deposited with the broker as collateral at October 31, 2020, is recorded as “Futures collateral” on the Statement of Assets and Liabilities. The Fund may enter into a total return swap contracts to attempt to manage and/or gain exposure to a security or market. Pursuant to a total return swap contracts, the Fund negotiates with a counterparty to exchange a periodic stream of payments. One party makes payments based on the total return of a reference asset (such as a security or a basket of securities or securities index), and in return receives fixed or floating rate interest payments. The total return of the reference
114 Pioneer Strategic Income Fund | Semiannual Report | 3/31/21
asset typically includes appreciation or depreciation on the reference asset, plus any interest or dividend payments. To the extent that the total return of the reference asset exceeds or falls short of the offsetting interest rate obligation, the Fund will receive a payment from or make a payment to the counterparty.
Total return swap contracts are marked-to-market daily using valuations supplied by independent sources, and the change in value, if any, is recorded within “Swap contracts, at value” on the Statement of Assets and Liabilities. Payments received or made are recorded as realized gains or losses on Statement of Operations. Total return swap contracts are subject to counterparty risk and unanticipated movements in value of exchange interest rates, securities or the index.
The average market value of total return swap contracts open during the six months ended March 31, 2021, was $6,398,345. Open total return swap contracts at March 31, 2021, are listed in the Schedule of Investments.
2. Management Agreement
The Adviser manages the Fund’s portfolio. Management fees are calculated daily and paid monthly at the annual rate of 0.60% of the Fund’s average daily net assets up to $1 billion, 0.55% on the next $9 billion and 0.50% on assets over $10 billion. For the six months ended March 31, 2021, the effective management fee was equivalent to 0.56% (annualized) of the Fund’s average daily net assets.
In addition, under the management and administration agreements, certain other services and costs, including accounting, regulatory reporting and insurance premiums, are paid by the Fund as administrative reimbursements. Included in “Due to affiliates” reflected on the Statement of Assets and Liabilities is $350,717 in management fees, administrative costs and certain other reimbursements payable to the Adviser at March 31, 2021.
3. Compensation of Trustees and Officers
The Fund pays an annual fee to its Trustees. The Adviser reimburses the Fund for fees paid to the Interested Trustees. The Fund does not pay any salary or other compensation to its officers. For the six months ended March 31, 2021, the Fund paid $107,538 in Trustees’ compensation, which is reflected on the Statement of Operations as Trustees’ fees. At March 31, 2021, the Fund had a payable for Trustees’ fees on its Statement of Assets and Liabilities of $0.
Pioneer Strategic Income Fund | Semiannual Report | 3/31/21 115
4. Transfer Agent
DST Asset Manager Solutions, Inc. serves as the transfer agent to the Fund at negotiated rates. Transfer agent fees and payables shown on the Statement of Operations and the Statement of Assets and Liabilities, respectively, include sub-transfer agent expenses incurred through the Fund’s omnibus relationship contracts.
In addition, the Fund reimbursed the transfer agent for out-of-pocket expenses incurred by the transfer agent related to shareowner communications activities such as proxy and statement mailings, and outgoing phone calls. For the six months ended March 31, 2021, such out-of-pocket expenses by class of shares were as follows:
| Shareowner Communications: | |
Class A | $ 59,084 |
Class C | 9,684 |
Class K | 4,788 |
Class R | 2,246 |
Class Y | 51,881 |
| Total | $127,683 |
5. Distribution and Service Plans
The Fund has adopted a distribution plan (the “Plan”) pursuant to Rule 12b-1 of the Investment Company Act of 1940 with respect to its Class A, Class C and Class R shares. Pursuant to the Plan, the Fund pays the Distributor 0.25% of the average daily net assets attributable to Class A shares as compensation for personal services and/or account maintenance services or distribution services with regard to Class A shares. Pursuant to the Plan, the Fund also pays the Distributor 1.00% of the average daily net assets attributable to Class C shares. The fee for Class C shares consists of a 0.25% service fee and a 0.75% distribution fee paid as compensation for personal services and/or account maintenance services or distribution services with regard to Class C shares. Pursuant to the Plan, the Fund further pays the Distributor 0.50% of the average daily net assets attributable to Class R shares for distribution services. Included in “Due to affiliates” reflected on the Statement of Assets and Liabilities is $60,571 in distribution fees payable to the Distributor at March 31, 2021.
The Fund also has adopted a separate service plan for Class R shares (the “Service Plan”). The Service Plan authorizes the Fund to pay securities dealers, plan administrators or other service organizations that agree to provide certain services to retirement plans or plan participants holding shares of the Fund a service fee of up to 0.25% of the Fund’s average daily net assets attributable to Class R shares held by such plans.
116 Pioneer Strategic Income Fund | Semiannual Report | 3/31/21
In addition, redemptions of Class A and Class C shares may be subject to a contingent deferred sales charge (“CDSC”). A CDSC of 1.00% may be imposed on redemptions of certain net asset value purchases of Class A shares within 12 months of purchase. Redemptions of Class C shares within 12 months of purchase are subject to a CDSC of 1.00%, based on the lower of cost or market value of shares being redeemed. Shares purchased as part of an exchange remain subject to any CDSC that applied to the original purchase of those shares. There is no CDSC for Class K, Class R and Class Y shares. Proceeds from the CDSCs are paid to the Distributor. For the six months ended March 31, 2021, CDSCs in the amount of $4,659 were paid to the Distributor.
6. Line of Credit Facility
The Fund, along with certain other funds in the Pioneer Family of Funds (the “Funds”), participates in a committed, unsecured revolving line of credit (“credit facility”). Borrowings are used solely for temporary or emergency purposes. The Fund may borrow up to the lesser of the amount available under the credit facility or the limits set for borrowing by the Fund’s prospectus and the 1940 Act. Effective February 4, 2021, the Fund participates in a facility in the amount of $450 million. Prior to February 4, 2021, the Fund participated in a facility in the amount of $300 million. Under such facility, depending on the type of loan, interest on borrowings is payable at the London Interbank Offered Rate (“LIBOR”) plus a credit spread. The Fund also pays both an upfront fee and an annual commitment fee to participate in a credit facility. The upfront fee in the amount 0.10% of the total credit facility is allocated among the participating Funds based on an allocation schedule set forth in the credit agreement. The commitment fee in the amount of 0.25% of the daily unused portion of each lenders commitment is allocated among participating Funds based on an allocation schedule set forth in the credit agreement. For the year ended March 31, 2021, the Fund had no borrowings under the credit facility.
7. Master Netting Agreements
The Fund has entered into an International Swaps and Derivatives Association, Inc. Master Agreement (“ISDA Master Agreement”) or similar agreement with substantially all its derivative counterparties. An ISDA Master Agreement is a bilateral agreement between the Fund and a counterparty that governs the trading of certain Over the Counter (“OTC”) derivatives and typically contains, among other things, close-out and set-off provisions which apply upon the occurrence of an event of default and/or a termination event as defined under the relevant ISDA Master Agreement. The ISDA Master Agreement may also give a party the right to terminate all transactions traded under such agreement if, among other things, there is deterioration in the credit quality of the other party.
Pioneer Strategic Income Fund | Semiannual Report | 3/31/21 117
Upon an event of default or a termination of the ISDA Master Agreement, the non-defaulting party has the right to close-out all transactions under such agreement and to net amounts owed under each transaction to determine one net amount payable by one party to the other. The right to close out and net payments across all transactions under the ISDA Master Agreement could result in a reduction of the Fund’s credit risk to its counterparty equal to any amounts payable by the Fund under the applicable transactions, if any. However, the Fund’s right to set-off may be restricted or prohibited by the bankruptcy or insolvency laws of the particular jurisdiction to which each specific ISDA Master Agreement of each counterparty is subject.
The collateral requirements for derivatives transactions under an ISDA Master Agreement are governed by a credit support annex to the ISDA Master Agreement. Collateral requirements are generally determined at the close of business each day and are typically based on changes in market values for each transaction under an ISDA Master Agreement and netted into one amount for such agreement. Generally, the amount of collateral due from or to a counterparty is subject to threshold (a “minimum transfer amount”) before a transfer is required, which may vary by counterparty. Collateral pledged for the benefit of the Fund and/or counterparty is held in segregated accounts by the Fund’s custodian and cannot be sold, re-pledged, assigned or otherwise used while pledged. Cash that has been segregated to cover the Fund’s collateral obligations, if any, will be reported separately on the Statement of Assets and Liabilities as “Swaps collateral”. Securities pledged by the Fund as collateral, if any, are identified as such in the Schedule of Investments.
118 Pioneer Strategic Income Fund | Semiannual Report | 3/31/21
Financial instruments subject to an enforceable master netting agreement, such as an ISDA Master Agreement, have been offset on the Statement of Assets and Liabilities. The following charts show gross assets and liabilities of the Fund as of March 31, 2021.
| Derivative | |||||
| Assets | |||||
| Subject to | Derivatives | Non-Cash | Cash | Net Amount | |
| Master Netting | Available | Collateral | Collateral | of Derivative | |
| Counterparty | Agreement | for Offset | Received (a) | Received (a) | Assets (b) |
Bank of America NA | $ 7,418 | $ (7,418) | $ — | $ — | $ — |
Bank of New York | |||||
| Mellon Corp. | 373,967* | (373,967)* | — | — | — |
Brown | |||||
| Brothers & Co. | 1,392,858 | — | — | — | 1,392,858 |
Citibank NA | — | — | — | — | — |
Goldman Sachs | |||||
| International | 60,462 | — | — | — | 60,462 |
HSBC Bank NA | 1,456,674 | (1,456,674) | — | – | — |
JPMorgan Chase | |||||
| Bank NA | 2,105,663 | (192,920) | — | — | 1,912,743 |
State Street | |||||
Bank & Trust Co. | 1,601,959 | (1,601,959) | — | — | — |
| Total | $ 6,999,001 | $ (3,632,938) | $ — | $ — | $3,366,063 |
| Derivative | |||||
| Liabilities | |||||
| Subject to | Derivatives | Non-Cash | Cash | Net Amount | |
| Master Netting | Available | Collateral | Collateral | of Derivative | |
| Counterparty | Agreement | for Offset | Pledged (a) | Pledged (a) | Liabilities (c) |
Bank of | |||||
| America NA | $ 4,416,162 | $ (7,418) | $ — | $ — | $ 4,408,744 |
Bank of New York | |||||
| Mellon Corp. | 690,251* | (373,967)* | — | — | 316,284* |
Brown | |||||
| Brothers & Co. | — | — | — | — | — |
Citibank NA | 31,852 | — | — | — | 31,852 |
Goldman Sachs | |||||
| International | — | — | — | — | — |
HSBC Bank NA | 2,367,205 | (1,456,674) | — | — | 910,531 |
JPMorgan Chase | |||||
| Bank NA | 192,920 | (192,920) | — | — | — |
State Street | |||||
Bank & Trust Co. | 2,016,420 | (1,601,959) | — | — | 414,461 |
| Total | $ 9,714,810 | $ (3,632,938) | $ — | $ — | $ 6,081,872 |
* Includes securities that are valued at $0.
(a) The amount presented here may be less than the total amount of collateral received/pledged as the net amount of derivative assets and liabilities cannot be less than $0.
(b) Represents the net amount due from the counterparty in the event of default.
(c) Represents the net amount payable to the counterparty in the event of default.
Pioneer Strategic Income Fund | Semiannual Report | 3/31/21 119
8. Additional Disclosures about Derivative Instruments and Hedging Activities
The Fund’s use of derivatives may enhance or mitigate the Fund’s exposure to the following risks:
Interest rate risk relates to the fluctuations in the value of interest-bearing securities due to changes in the prevailing levels of market interest rates.
Credit risk relates to the ability of the issuer of a financial instrument to make further principal or interest payments on an obligation or commitment that it has to the Fund.
Foreign exchange rate risk relates to fluctuations in the value of an asset or liability due to changes in currency exchange rates.
Equity risk relates to the fluctuations in the value of financial instruments as a result of changes in market prices (other than those arising from interest rate risk or foreign exchange rate risk), whether caused by factors specific to an individual investment, its issuer, or all factors affecting all instruments traded in a market or market segment.
Commodity risk relates to the risk that the value of a commodity or commodity index will fluctuate based on increases or decreases in the commodities market and factors specific to a particular industry or commodity.
120 Pioneer Strategic Income Fund | Semiannual Report | 3/31/21
The fair value of open derivative instruments (not considered to be hedging instruments for accounting disclosure purposes) by risk exposure at March 31, 2021, was as follows:
| Statement of Assets and Liabilities |
| Foreign | ||||||||||||||||||||
| Interest | Credit | Exchange | Equity | Commodity | ||||||||||||||||
| Rate Risk | Risk | Rate Risk | Risk | Risk | ||||||||||||||||
| Assets: | ||||||||||||||||||||
| Options purchased* | $ | — | $ | — | $ | 100,402 | $ | — | ** | $ | — | |||||||||
| Swap contracts, at value | 45,322,890 | 1,753,246 | — | — | — | |||||||||||||||
| Total Value | $ | 45,322,890 | $ | 1,753,246 | $ | 100,402 | $ | — | ** | $ | — | |||||||||
| Liabilities | ||||||||||||||||||||
| Written options | ||||||||||||||||||||
| outstanding | $ | — | $ | — | $ | 245,139 | $ | — | $ | — | ||||||||||
| Net unrealized | ||||||||||||||||||||
| depreciation on | ||||||||||||||||||||
| forward foreign | ||||||||||||||||||||
| currency exchange | ||||||||||||||||||||
| contracts | — | — | 4,583,751 | — | — | |||||||||||||||
| Net unrealized | ||||||||||||||||||||
| depreciation on | ||||||||||||||||||||
| futures contracts | 2,363,201 | — | — | — | — | |||||||||||||||
| Total Value | $ | 2,363,201 | $ | — | $ | 4,828,890 | $ | — | $ | — | ||||||||||
* Reflects the market value of purchased option contracts (see Note 1J.). These amounts are included in investments in unaffiliated issuers, at value, on the statement of assets and liabilities.
** Includes securities that are valued at $0.
Pioneer Strategic Income Fund | Semiannual Report | 3/31/21 121
The effect of derivative instruments (not considered to be hedging instruments for accounting disclosure purposes) on the Statement of Operations by risk exposure at March 31, 2021, was as follows:
| Statement of Operations |
| Foreign | ||||||||||||||||||||
| Interest | Credit | Exchange | Equity | Commodity | ||||||||||||||||
| Rate Risk | Risk | Rate Risk | Risk | Risk | ||||||||||||||||
| Net realized gain (loss) on: | ||||||||||||||||||||
| Options purchased* | $ | — | $ | — | $ | (1,505,990 | ) | $ | — | $ | — | |||||||||
| Written options | — | — | 1,505,990 | — | — | |||||||||||||||
| Forward foreign | ||||||||||||||||||||
| currency exchange | ||||||||||||||||||||
| contracts | — | — | 12,499,947 | — | — | |||||||||||||||
| Futures contracts | 6,395,717 | — | — | — | — | |||||||||||||||
| Swap contracts | — | 13,863,122 | — | — | — | |||||||||||||||
| Total Value | $ | 6,395,717 | $ | 13,863,122 | $ | 12,499,947 | $ | — | $ | — | ||||||||||
| Change in net unrealized | ||||||||||||||||||||
| appreciation | ||||||||||||||||||||
| (depreciation) on: | ||||||||||||||||||||
| Options purchased** | $ | — | $ | — | $ | 575,280 | $ | — | *** | $ | — | |||||||||
| Written options | — | — | 240,546 | — | — | |||||||||||||||
| Forward foreign | ||||||||||||||||||||
| currency exchange | ||||||||||||||||||||
| contracts | — | — | (1,900,074 | ) | — | — | ||||||||||||||
| Futures contracts | (1,106,678 | ) | — | — | — | — | ||||||||||||||
| Swap contracts | 194,147 | (8,675,315 | ) | — | — | — | ||||||||||||||
| Total Value | $ | (912,531 | ) | $ | (8,675,315 | ) | $ | (1,084,248 | ) | $ | — | *** | $ | — | ||||||
* Reflects the net realized gain (loss) on purchased option contracts (see Note 1J). These amounts are included in Net realized gain (loss) on investments in unaffiliated issuers, on the Statement of Operations.
** Reflects the change in net unrealized appreciation (depreciation) on purchased option contracts (see Note 1J.). These amounts are included in change in net unrealized appreciation (depreciation) on Investments in unaffiliated issuers, on the statements of operations.
*** Includes securities that are valued at $0.
122 Pioneer Strategic Income Fund | Semiannual Report | 3/31/21
| Trustees | Officers |
Thomas J. Perna, Chairman | Lisa M. Jones, President and |
John E. Baumgardner, Jr. | Chief Executive Officer |
Diane Durnin | Anthony J. Koenig, Jr., Treasurer |
Benjamin M. Friedman | and Chief Financial and |
Lisa M. Jones | Accounting Officer |
Craig C. MacKay** | Christopher J. Kelley, Secretary and |
Lorraine H. Monchak | Chief Legal Officer |
Marguerite A. Piret | |
Fred J. Ricciardi | |
Kenneth J. Taubes |
Investment Adviser and Administrator
Amundi Asset Management US, Inc.
Custodian and Sub-Administrator
Brown Brothers Harriman & Co.
Principal Underwriter
Amundi Distributor US, Inc.
Legal Counsel
Morgan, Lewis & Bockius LLP
Transfer Agent
DST Asset Manager Solutions, Inc.
Amundi Asset Management US, Inc.
Custodian and Sub-Administrator
Brown Brothers Harriman & Co.
Principal Underwriter
Amundi Distributor US, Inc.
Legal Counsel
Morgan, Lewis & Bockius LLP
Transfer Agent
DST Asset Manager Solutions, Inc.
Proxy Voting Policies and Procedures of the Fund are available without charge, upon request, by calling our toll free number (1-800-225-6292). Information regarding how the Fund voted proxies relating to portfolio securities during the most recent 12-month period ended June 30 is publicly available to shareowners at www.amundi.com/us. This information is also available on the Securities and Exchange Commission’s web site at www.sec.gov.
* Effective April 30, 2021, Mark E. Bradley is no longer Treasurer of the Fund.
**Craig C. MacKay was appointed as a Trustee effective March 22, 2021.
Pioneer Strategic Income Fund | Semiannual Report | 3/31/21 123
This page was intentionally left blank.
124 Pioneer Strategic Income Fund | Semiannual Report | 3/31/21
How to Contact Amundi
We are pleased to offer a variety of convenient ways for you to contact us for assistance or information.
| Call us for: | |
Account Information, including existing accounts, | |
new accounts, prospectuses, applications | |
and service forms | 1-800-225-6292 |
FactFoneSM for automated fund yields, prices, | |
account information and transactions | 1-800-225-4321 |
| Retirement plans information | 1-800-622-0176 |
Write to us:
Amundi
P.O. Box 219427
Kansas City, MO 64121-9427
Amundi
P.O. Box 219427
Kansas City, MO 64121-9427
| Our toll-free fax | 1-800-225-4240 |
| Our internet e-mail address | us.askamundi@amundi.com |
(for general questions about Amundi only) | |
Visit our web site: www.amundi.com/us
This report must be preceded or accompanied by a prospectus.
The Fund files a complete schedule of portfolio holdings with the Securities and Exchange Commission for the first and third quarters of each fiscal year as an exhibit to its reports on Form N-PORT. Shareholders may view the filed Form N-PORT by visiting the Commission’s web site at https://www.sec.gov.

Amundi Asset Management US, Inc.
60 State Street
Boston, MA 02109
www. amundi. com/us
60 State Street
Boston, MA 02109
www. amundi. com/us
Securities offered through Amundi Distributor US, Inc.,
60 State Street, Boston, MA 02109
Underwriter of Pioneer Mutual Funds, Member SIPC
© 2021 Amundi Asset Management US, Inc. 19207-16-0521
60 State Street, Boston, MA 02109
Underwriter of Pioneer Mutual Funds, Member SIPC
© 2021 Amundi Asset Management US, Inc. 19207-16-0521
Pioneer Emerging Markets Equity Fund
Semiannual Report | March 31, 2021
| A: PEMEX | C: PEMNX | Y: PEMSX |
Paper copies of the Fund’s shareholder reports are no longer sent by mail, unless you specifically request paper copies of the reports from the Fund or from your financial intermediary, such as a broker-dealer, bank or insurance company. Instead, the reports are available on the Fund’s website, and you will be notified by mail each time a report is posted and provided with a website link to access the report.
You may elect to receive all future reports in paper free of charge. If you invest directly with the Fund, you can inform the Fund that you wish to continue receiving paper copies of your shareholder reports by calling 1-800-225-6292.
If you invest through a financial intermediary, you can contact your financial intermediary to request that you continue to receive paper copies of your shareholder reports. Your election to receive reports in paper will apply to all funds held in your account if you invest through your financial intermediary or all funds held within the Pioneer Fund complex if you invest directly.
visit us: www.amundi.com/us
| 2 | |
| 4 | |
| 10 | |
| 11 | |
| 12 | |
| 15 | |
| 17 | |
| 27 | |
| 34 | |
| 44 |
Pioneer Emerging Markets Equity Fund | Semiannual Report | 3/31/21 1
The first few months of 2021 have brought some better news on the COVID-19 global pandemic front, as the deployment of the first approved COVID-19 vaccines is well underway, with expectations for widespread vaccine distribution by the middle of the year. In general, COVID-19 cases and related hospitalizations have been on the decline in the US, despite a few problematic “hot spots” in some states, and that has had a positive effect on overall market sentiment.
While there may finally be a light visible at the end of the pandemic tunnel, the long-term impact on the global economy from COVID-19, while currently unknown, is likely to be considerable. It is clear that several industries have already felt greater effects than others, and the markets, which do not thrive on uncertainty, have been volatile. With that said, in the first few months of 2021, equity markets and other so-called “riskier” assets, such as high-yield bonds, have outperformed investments regarded as less risky, such as government debt. In addition, we’ve witnessed the long-awaited rebound in the performance of cyclical stocks, or stocks of companies with greater exposure to the ebbs and flows of the economic cycle, as investors have appeared to embrace the potential for a more widespread reopening of the economy in the coming months. Additional fiscal stimulus from the US government in recent months has also helped provide some market momentum.
However, despite the dramatic market rebound since its March 2020 low point, volatility has remained elevated, with momentum rising and falling on seemingly every bit of positive or negative news about the virus. In addition, the recent US Presidential and Congressional elections have resulted in a power shift in Washington, DC, and that most likely portends some changes in fiscal policy above and beyond just additional pandemic-related stimulus. That, too, could lead to increased market volatility as investors analyze the various tax and spending plans, and wait to see what proposed policy alterations actually become law.
With the advent of COVID-19 in early 2020, we implemented our business continuity plan according to the new COVID-19 guidelines, and most of our employees have been working remotely since March 2020. To date, our operating environment has faced no interruption. I am proud of the careful planning that has taken place and confident we can maintain this environment for as long as is prudent. History in the making for a company that first opened its doors way back in 1928.
2 Pioneer Emerging Markets Equity Fund | Semiannual Report | 3/31/21
Since 1928, Amundi US’s investment process has been built on a foundation of fundamental research and active management, principles which have guided our investment decisions for more than 90 years. We believe active management – that is, making active investment decisions – can help mitigate the risks during periods of market volatility. As 2020 has reminded us, investment risk can arise from a number of factors in today’s global economy, including slower or stagnating growth, changing U.S. Federal Reserve policy, oil price shocks, political and geopolitical factors and, unfortunately, major public health concerns such as a viral pandemic.
At Amundi US, active management begins with our own fundamental, bottom-up research process. Our team of dedicated research analysts and portfolio managers analyzes each security under consideration, communicating directly with the management teams of the companies issuing the securities and working together to identify those securities that best meet our investment criteria for our family of funds. Our risk management approach begins with each and every security, as we strive to carefully understand the potential opportunity, while considering any and all risk factors.
Today, as investors, we have many options. It is our view that active management can serve shareholders well, not only when markets are thriving, but also during periods of market stress.
As you consider your long-term investment goals, we encourage you to work with your financial professional to develop an investment plan that paves the way for you to pursue both your short-term and long-term goals.
We remain confident that the current crisis, like others in human history, will pass, and we greatly appreciate the trust you have placed in us and look forward to continuing to serve you in the future.
Sincerely,

Lisa M. Jones
Head of the Americas, President and CEO of US
Amundi Asset Management US, Inc.
May 2021
Head of the Americas, President and CEO of US
Amundi Asset Management US, Inc.
May 2021
Any information in this shareowner report regarding market or economic trends or the factors influencing the Fund’s historical or future performance are statements of opinion as of the date of this report. Past performance is no guarantee of future results.
Pioneer Emerging Markets Equity Fund | Semiannual Report | 3/31/21 3
In the following interview, portfolio managers Patrice Lemonnier and Mickaël Tricot discuss the investment environment for emerging markets equities and the performance of Pioneer Emerging Markets Equity Fund during the six-month period ended March 31, 2021. Mr. Lemonnier, Head of Emerging Markets Equity and a portfolio manager at Amundi Asset Management US, Inc. (Amundi US), and Mr. Tricot, Head of Global Emerging Markets Equity and portfolio manager at Amundi US, are responsible for the day-to-day management of the Fund.
Q How did the Fund perform during the six-month period ended on March 31, 2021?
A Pioneer Emerging Markets Equity Fund’s Class A shares returned 25.65% at net asset value over the six-month period ended March 31, 2021, while the Fund’s benchmark, the Morgan Stanley Capital International (MSCI) Emerging Markets Index1, returned 22.43%.
Q How would you describe the investment backdrop for emerging markets equity investors during the six-month period ended March 31, 2021?
A The investment environment over the past six months was highly supportive for emerging markets equities, as the better than 22% return for the MSCI Emerging Markets Index (the MSCI Index) suggests. The emergency-use approval of the first COVID-19 vaccines in November 2020 helped spark a broad-based rally across the spectrum of higher-risk assets, such as equities. The vaccine news caused investors to begin anticipating an eventual full reopening of the global economy and a corresponding rebound in both economic growth and corporate earnings. Stocks received a further boost from expectations that the US Federal Reserve (Fed) and other central banks would maintain their
1 The MSCI information may only be used for your internal use, may not be reproduced or re-disseminated in any form and may not be used as a basis for or a component of any financial instruments or products or indices. None of the MSCI information is intended to constitute investment advice or a recommendation to make (or refrain from making) any kind of investment decision and may not be relied on as such. Historical data and analysis should not be taken as an indication or guarantee of any future performance analysis, forecast or prediction. The MSCI information is provided on an “as is” basis and the user of this information assumes the entire risk of any use made of this information. MSCI, each of its affiliates and each other person involved in or related to compiling, computing or creating any MSCI information (collectively, the “MSCI Parties”) expressly disclaims all warranties (including, without limitation, any warranties of originality, accuracy, completeness, timeliness, non-infringement, merchantability and fitness for a particular purpose) with respect to this information. Without limiting any of the foregoing, in no event shall any MSCI Party have any liability for any direct, indirect, special, incidental, punitive, consequential (including, without limitation, lost profits) or any other damages.
4 Pioneer Emerging Markets Equity Fund | Semiannual Report | 3/31/21
accommodative monetary policies. The policy factor was especially important for emerging markets stocks, performance of which has tended to be very sensitive to the global interest-rate outlook. A rally in commodity prices provided an additional tailwind for the emerging markets in general during the six-month period.
The bulk of the market gain occurred in the first several months of the six-month period. The MSCI Index rose steadily and then hit its peak in mid-February, before trending somewhat lower thereafter. The loss of market momentum was largely attributable to the recovery in the US dollar (USD) as well as concerns that China’s government was becoming more aggressive in its attempts to rein in the influence of the nation’s leading technology companies. Still, emerging markets equities finished the period firmly in positive territory, thanks to the strength displayed during the span from early October 2020 through mid-February 2021. The gains built on the robust performance of emerging markets equites during the middle two calendar quarters of 2020, which helped the MSCI Index register a 12-month return of 58.39% through March 31, 2021.
Q What were the principal factors that affected the Fund’s benchmark-relative performance during the six-month period ended March 31, 2021?
A We believe our multifaceted investment process played a key role in the Fund’s strong relative performance over the six-month period. In managing the portfolio, we start with a top-down evaluation of each country in the emerging markets, which we view as critical given the wide divergence in economic fundamentals and the unique return drivers within individual countries. We then analyze the prospects of specific sectors in each country in an attempt to capture another layer of return potential. Finally, we drill down to what we think are the best company-specific ideas in the countries and sectors in which we want to invest the portfolio. In our view, the approach has contributed positively to the Fund’s benchmark-relative outperformance since its inception in October 2019.
All three phases of our investment process – country selection, sector allocation, and bottom-up stock selection – benefited the Fund’s relative returns over the six-month period.
Looking first at country selection, a portfolio underweight in China was a meaningful positive contributor to the Fund’s relative results. The Fund entered October 2020 with a below-benchmark allocation to the country, and we reduced the position further as the semiannual reporting period progressed. We saw the Chinese market as overvalued, and we were concerned about the potential effects of increased regulation on the
Pioneer Emerging Markets Equity Fund | Semiannual Report | 3/31/21 5
country’s technology sector. While Chinese stocks gained ground over the past six months, they indeed lagged the return of the MSCI Index by a sizable margin. An underweight in Malaysia was also a positive for the Fund’s benchmark-relative results, as was an overweight in Russia. Conversely, the Fund lost a modest degree of relative performance through underweight allocations to Chile and Thailand.
Sector allocation was a further plus for the Fund’s benchmark-relative returns for the six-month period. The largest positive contribution came from allocations within India, where the Fund’s overweight in the financials sector and underweights to utilities and energy boosted relative performance. Overweights in Mexico’s materials sector and South Korean information technology stocks also added value. However, the Fund’s positioning in China, where an overweight in consumer discretionary and an underweight in financials detracted from relative performance, offset some of the benefits from sector allocation in the other countries we mentioned.
Among individual stocks, many of the leading positive contributors to the Fund’s benchmark-relative performance over the six-month period were positions in companies that have not been heavily represented in the MSCI Index. Whereas the Fund’s benchmark consists of approximately 1,400 companies, the Fund’s investment universe encompasses more than 1,900. We believe that approach has provided us with the latitude to take advantage of potential opportunities in the frontier markets as well as in mid- and small-cap equities. (Frontier markets are defined as less-advanced capital markets in the developing world that are more established than the least-developed countries, but still less established than the emerging markets countries.)
The roster of stocks that represented the top positive contributors to the Fund’s relative returns during the six-month period reflected our investment approach. These included: Xtep International, a manufacturer of sports equipment based in Hong Kong; Russian conglomerate Sistema PJSFC; and China Yongda Automobiles Services, a provider of auto sales and services.
On the negative side, lack of portfolio exposure to Pinduoduo, a China-listed stock that delivered a return well in excess of the broader market, detracted from the Fund’s benchmark-relative returns for the six-month period. Among stocks in which the portfolio held positions, Coway, a South Korean manufacturer of household electronic appliances, and Meituan Dianping, a Chinese online food delivery company, were key detractors from the Fund’s relative performance.
.
6 Pioneer Emerging Markets Equity Fund | Semiannual Report | 3/31/21
Q Did the Fund have any exposure to derivative securities during the six-month period ended March 31, 2021?
A No, the Fund had no exposure to derivatives during the period.
Q How would you characterize market conditions heading into the second half of the Fund’s fiscal year?
A We have based our broad view of the emerging markets on four key factors: macroeconomic trends, company-level developments, valuations, and liquidity. On balance, we believe trends in those areas point to a continued supportive environment for the emerging markets equity asset class.
We have remained constructive on the macroeconomic outlook, given the gradual resumption of normal business activity across the globe. In addition, the majority of emerging markets countries have featured positive current-account balances. Rising inflation may also provide a tailwind for the asset class, since inflationary conditions could increase demand for stocks over bonds and potentially work to the advantage of countries that have typically relied on commodity exports to fuel economic growth.
At the company level, we think the stage could be set for impressive earnings growth in 2021, given that strong economic conditions may possibly translate to robust year-over-year comparisons. We also think companies in the emerging markets might benefit from their higher rate of profit growth in relation to their peers in the developed world.
Valuations have risen considerably over the past 12 months, and so they appear less attractive to us than they were in the immediate aftermath of the March 2020 market downturn in reaction to the onset of the pandemic. Still, emerging markets stocks have continued to trade at sizable valuation discounts to their developed-market peers, despite the higher earnings growth of emerging markets-domiciled companies. We believe that favorable combination may help encourage continued investor demand.
The liquidity picture also appears generally supportive, with most major central banks maintaining their highly accommodative monetary policies. However, conditions could become more challenging, as some emerging nations, including China, have begun to normalize policy. While that could act as somewhat of a headwind to performance, it might also create a higher dispersion of returns at the country level — a shift that we would welcome, due to the nature of our investment process.
Pioneer Emerging Markets Equity Fund | Semiannual Report | 3/31/21 7
We have continued to see what we believe are compelling opportunities in Russia, India, and Brazil. We have favored Russia due in part to our confidence in the country’s management of fiscal and monetary policies. Moreover, Russia’s economy could stand to benefit from the significant rise in oil prices over the past year. With that said, we have been keeping a close eye on geopolitical developments and their potential effect on the country’s stock market. With regard to India, we believe ongoing structural reforms and the country’s efforts to capitalize on US-China trade tensions by bringing new business investment into the country has helped support that market. Brazil, for its part, has faced more challenging circumstances than other emerging markets countries, due in part to the government’s slow adoption of reforms. Still, we believe the country might be poised for an economic recovery that could help close the market’s valuation gap compared with the broader emerging markets equity asset class.
On the other end of the spectrum, China represents the Fund’s largest underweight versus the MSCI Index as of the end of March. We continue to believe that valuations in the country are stretched, particularly in light of the regulatory headwinds for the nation’s technology companies.
At the sector level, consumer discretionary and information technology were the Fund’s leading benchmark-relative overweights at the close of the six-month period, while health care and financials were the largest underweights.
Please refer to the Schedule of Investments on pages 17–26 for a full listing of Fund securities.
The market prices of securities may go up or down, sometimes rapidly or unpredictably, due to general market conditions, such as real or perceived adverse economic, political, or regulatory conditions, recessions, inflation, changes in interest or currency rates, lack of liquidity in the bond markets, the spread of infectious illness or other public health issues or adverse investor sentiment. These conditions may continue, recur, worsen or spread.
Investing in foreign and/or emerging market securities involves risks relating to interest rates, currency exchange rates, economic, and political conditions.
8 Pioneer Emerging Markets Equity Fund | Semiannual Report | 3/31/21
To the extent the Fund invests in issuers located within specific countries or regions, the Fund may be particularly affected by adverse markets, rates, and events which may occur in those countries and regions.
Investing in other investment companies, including exchange traded funds (ETFs), subjects the Fund to the risks of investing in the underlying securities or assets held by those funds.
Investments in real estate securities, such as REITs, are affected by economic conditions, interest rates, governmental actions and other factors.
At times, the Fund’s investments may represent industries or industry sectors that are interrelated or have common risks, making the Fund more susceptible to any economic, political, or regulatory developments or other risks affecting those industries and sectors.
These risks may increase share price volatility.
Before investing, consider the product’s investment objectives, risks, charges and expenses. Contact your financial professional or Amundi Asset Management US, Inc., for a prospectus or summary prospectus containing this information. Read it carefully.
Any information in this shareholder report regarding market or economic trends or the factors influencing the Fund’s historical or future performance are statements of opinion as of the date of this report. Past performance is no guarantee of future results.
Pioneer Emerging Markets Equity Fund | Semiannual Report | 3/31/21 9
Sector Distribution
(As a percentage of total investments)*

Geographical Distribution
(As a percentage of total investments based on country of domicile)*
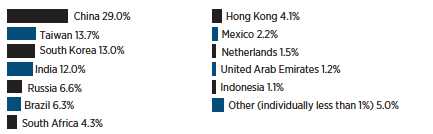
| 10 Largest Holdings | ||
(As a percentage of total investments)* | ||
| 1. | Taiwan Semiconductor Manufacturing Co., Ltd. (A.D.R.) | 7.00% |
| 2. | Alibaba Group Holding, Ltd. (A.D.R.) | 4.88 |
| 3. | Tencent Holdings, Ltd. | 4.07 |
| 4. | Samsung Electronics Co., Ltd. | 3.80 |
| 5. | Samsung Electronics Co., Ltd., Class Preferen | 2.51 |
| 6. | Naspersm, Ltd., Class N | 2.01 |
| 7. | Sberbank of Russia PJSC | 1.80 |
| 8. | Ping An Insurance Group Co. of China, Ltd., Class H | 1.56 |
| 9. | Housing Development Finance Corp. Ltd. | 1.53 |
| 10. | Prosus NV | 1.52 |
* Excludes temporary cash investments and all derivative contracts except for options purchased. |
| The Fund is actively managed, and current holdings may be different. The holdings listed should not |
| be considered recommendations to buy or sell any securities. |
10 Pioneer Emerging Markets Equity Fund | Semiannual Report | 3/31/21
Net Asset Value per Share
| Class | 3/31/21 | 9/30/20 |
A | $13.80 | $11.08 |
C | $13.75 | $11.02 |
Y | $13.81 | $11.10 |
Distributions per Share: 10/1/20–3/31/21
| Net Investment | Short-Term | Long-Term | |
| Class | Income | Capital Gains | Capital Gains |
A | $0.1141 | $ — | $ — |
C | $0.0472 | $ — | $ — |
Y | $0.1562 | $ — | $ — |
Index Definitions
The Morgan Stanley Capital International (MSCI) Emerging Markets Index measures the free-float weighted equity index that captures large and mid-cap representation across emerging markets countries. The index covers approximately 85% of the free float-adjusted market capitalization in each country. Indices are unmanaged and their returns assume reinvestment of dividends and, unlike fund returns, do not reflect any fees or expenses. You cannot invest directly in an index.
The index defined here pertains to the “Value of $10,000 Investment” and “Value of $5 Million Investment” charts on pages 12–14.
Pioneer Emerging Markets Equity Fund | Semiannual Report | 3/31/21 11
| Class A Shares |
Investment Returns
The mountain chart on the right shows the change in value of a $10,000 investment made in Class A shares of Pioneer Emerging Markets Equity Fund at public offering price during the periods shown, compared to that of the MSCI Emerging Markets Index.
| Average Annual Total Returns | |||
(As of March 31, 2021) | |||
| Net | Public | MSCI | |
| Asset | Offering | Emerging | |
| Value | Price | Markets | |
| Period | (NAV) | (POP) | Index |
Life-of-Class | |||
(10/2/19) | 25.23% | 20.37% | 22.60% |
1 year | 65.54 | 56.02 | 58.39 |
| Expense Ratio | |
(Per prospectus dated February 1, 2021) | |
| Gross | Net |
4.45% | 1.30% |

Call 1-800-225-6292 or visit www.amundi.com/us for the most recent month-end performance results. Current performance may be lower or higher than the performance data quoted.
The performance data quoted represents past performance, which is no guarantee of future results. Investment return and principal value will fluctuate, and shares, when redeemed, may be worth more or less than their original cost.
NAV results represent the percent change in net asset value per share. NAV returns would have been lower had sales charges been reflected. POP returns reflect deduction of maximum 5.75% sales charge. All results are historical and assume the reinvestment of dividends and capital gains. Other share classes are available for which performance and expenses will differ.
Performance results reflect any applicable expense waivers in effect during the periods shown. Without such waivers Fund performance would be lower. Waivers may not be in effect for all funds. Certain fee waivers are contractual through a specified period. Otherwise, fee waivers can be rescinded at any time. See the prospectus and financial statements for more information.
The net expense ratio reflects the contractual expense limitation currently in effect through February 1, 2022 for Class A shares. There can be no assurance that Amundi will extend the expense limitation beyond such time. Please see the prospectus for more information.
The performance table and graph do not reflect the deduction of fees and taxes that a shareowner would pay on Fund distributions or the redemption of Fund shares.
Please refer to the financial highlights for more current expense ratios.
12 Pioneer Emerging Markets Equity Fund | Semiannual Report | 3/31/21
Performance Update | 3/31/21 | Class C Shares |
Investment Returns
The mountain chart on the right shows the change in value of a $10,000 investment made in Class C shares of Pioneer Emerging Markets Equity Fund at public offering price during the periods shown, compared to that of the MSCI Emerging Markets Index.
| Average Annual Total Returns | ||
(As of March 31, 2021) | ||
| Net | MSCI | |
| Asset | Emerging | |
| Value | Markets | |
| Period | (NAV) | Index |
Life-of-Class | ||
(10/2/19) | 24.37% | 22.60% |
1 year | 64.49 | 58.39 |
| Expense Ratio | |
(Per prospectus dated February 1, 2021) | |
| Gross | Net |
5.17% | 2.05% |
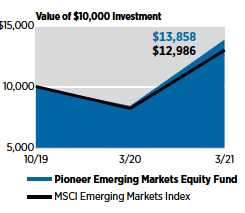
Call 1-800-225-6292 or visit www.amundi.com/us for the most recent month-end performance results. Current performance may be lower or higher than the performance data quoted.
The performance data quoted represents past performance, which is no guarantee of future results. Investment return and principal value will fluctuate, and shares, when redeemed, may be worth more or less than their original cost.
Class C shares held for less than one year are subject to a 1% contingent deferred sales charge (CDSC). “If Held” results represent the percent change in net asset value per share. “If Redeemed” returns would have been lower had sales charges been reflected. All results are historical and assume the reinvestment of dividends and capital gains. Other share classes are available for which performance and expenses will differ.
Performance results reflect any applicable expense waivers in effect during the periods shown. Without such waivers Fund performance would be lower. Waivers may not be in effect for all funds. Certain fee waivers are contractual through a specified period. Otherwise, fee waivers can be rescinded at any time. See the prospectus and financial statements for more information.
The net expense ratio reflects the contractual expense limitation currently in effect through February 1, 2022 for Class C shares. There can be no assurance that Amundi will extend the expense limitation beyond such time. Please see the prospectus for more information.
The performance table and graph do not reflect the deduction of fees and taxes that a shareowner would pay on Fund distributions or the redemption of Fund shares.
Please refer to the financial highlights for more current expense ratios.
Pioneer Emerging Markets Equity Fund | Semiannual Report | 3/31/21 13
Performance Update | 3/31/21 | Class Y Shares |
Investment Returns
The mountain chart on the right shows the change in value of a $5 million investment made in Class Y shares of Pioneer Emerging Markets Equity Fund at public offering price during the periods shown, compared to that of the MSCI Emerging Markets Index.
| Average Annual Total Returns | ||
(As of March 31, 2021) | ||
| Net | MSCI | |
| Asset | Emerging | |
| Value | Markets | |
| Period | (NAV) | Index |
Life-of-Class | ||
(10/2/19) | 25.63% | 22.60% |
1 year | 66.00 | 58.39 |
| Expense Ratio | |
(Per prospectus dated February 1, 2021) | |
| Gross | Net |
4.16% | 0.99% |

Call 1-800-225-6292 or visit www.amundi.com/us for the most recent month-end performance results. Current performance may be lower or higher than the performance data quoted.
The performance data quoted represents past performance, which is no guarantee of future results. Investment return and principal value will fluctuate, and shares, when redeemed, may be worth more or less than their original cost.
Class Y shares are not subject to sales charges and are available for limited groups of eligible investors, including institutional investors. All results are historical and assume the reinvestment of dividends and capital gains. Other share classes are available for which performance and expenses will differ.
Performance results reflect any applicable expense waivers in effect during the periods shown. Without such waivers Fund performance would be lower. Waivers may not be in effect for all funds. Certain fee waivers are contractual through a specified period. Otherwise, fee waivers can be rescinded at any time. See the prospectus and financial statements for more information.
The net expense ratio reflects the contractual expense limitation currently in effect through February 1, 2022 for Class Y shares. There can be no assurance that Amundi will extend the expense limitation beyond such time. Please see the prospectus for more information.
The performance table and graph do not reflect the deduction of fees and taxes that a shareowner would pay on Fund distributions or the redemption of Fund shares.
Please refer to the financial highlights for more current expense ratios.
14 Pioneer Emerging Markets Equity Fund | Semiannual Report | 3/31/21
As a shareowner in the Fund, you incur two types of costs:
(1) | ongoing costs, including management fees, distribution and/or service |
(12b-1) fees, and other Fund expenses; and | |
(2) | transaction costs, including sales charges (loads) on purchase |
payments. | |
This example is intended to help you understand your ongoing expenses (in dollars) of investing in the Fund and to compare these costs with the ongoing costs of investing in other mutual funds. The example is based on an investment of $1,000 at the beginning of the Fund’s latest six-month period and held throughout the six months.
Using the Tables
Actual Expenses
The first table below provides information about actual account values and actual expenses. You may use the information in this table, together with the amount you invested, to estimate the expenses that you paid over the period as follows:
(1) | Divide your account value by $1,000 |
Example: an $8,600 account value ÷ $1,000 = 8.6 | |
(2) | Multiply the result in (1) above by the corresponding share class’s number in the third row under the heading entitled “Expenses Paid During Period” to estimate the expenses you paid on your account during this period. |
Expenses Paid on a $1,000 Investment in Pioneer Emerging Markets Equity Fund
Based on actual returns from October 1, 2020 through March 31, 2021.
| Share Class | A | C | Y |
Beginning Account | $1,000.00 | $1,000.00 | $1,000.00 |
Value on 10/1/20 | |||
Ending Account Value | $1,256.50 | $1,252.30 | $1,259.20 |
(after expenses) | |||
on 3/31/21 | |||
Expenses Paid | $7.14 | $11.23 | $5.58 |
During Period* |
* Expenses are equal to the Fund’s annualized expense ratio of 1.27%, 2.00%, and 0.99% for classes A, C, and Y shares, respectively, multiplied by the average account value over the period, multiplied by 182/365, (to reflect the partial year period).
Pioneer Emerging Markets Equity Fund | Semiannual Report | 3/31/21 15
Hypothetical Example for Comparison Purposes
The table below provides information about hypothetical account values and hypothetical expenses based on the Fund’s actual expense ratio and an assumed rate of return of 5% per year before expenses, which is not the Fund’s actual return. The hypothetical account values and expenses may not be used to estimate the actual ending account balance or expenses you paid for the period.
You may use this information to compare the ongoing costs of investing in the Fund and other funds. To do so, compare this 5% hypothetical example with the 5% hypothetical examples that appear in the shareholder reports of the other funds.
Please note that the expenses shown in the tables are meant to highlight your ongoing costs only and do not reflect any transaction costs, such as sales charges (loads) that are charged at the time of the transaction. Therefore, the table below is useful in comparing ongoing costs only and will not help you determine the relative total costs of owning different funds. In addition, if these transaction costs were included, your costs would have been higher.
Expenses Paid on a $1,000 Investment in Pioneer Emerging Markets Equity Fund
Based on a hypothetical 5% return per year before expenses, reflecting the period from October 1, 2020 through March 31, 2021.
| Share Class | A | C | Y |
Beginning Account | $1,000.00 | $1,000.00 | $1,000.00 |
Value on 10/1/20 | |||
Ending Account Value | $1,018.60 | $1,014.96 | $1,020.00 |
(after expenses) | |||
on 3/31/21 | |||
Expenses Paid | $6.39 | $10.05 | $4.99 |
During Period* |
* | Expenses are equal to the Fund’s annualized expense ratio of 1.27%, 2.00%, and 0.99% for classes A, C, and Y shares, respectively, multiplied by the average account value over the period, multiplied by 182/365, (to reflect the partial year period). |
16 Pioneer Emerging Markets Equity Fund | Semiannual Report | 3/31/21
| Shares | Value | ||||||
| UNAFFILIATED ISSUERS — 97.5% | |||||||
| COMMON STOCKS — 97.5% of Net Assets | |||||||
| Air Freight & Logistics — 0.2% | |||||||
1,654 | (a) | InPost S.A. | $ | 27,089 | |||
| Total Air Freight & Logistics | $ | 27,089 | |||||
| Auto Components — 1.0% | |||||||
2,564 | Hanon Systems | $ | 40,384 | ||||
38,000 | Xinyi Glass Holdings Ltd. | 124,886 | |||||
| Total Auto Components | $ | 165,270 | |||||
| Automobiles — 1.0% | |||||||
56,000 | Brilliance China Automotive Holdings Ltd. | $ | 52,557 | ||||
1,950 | (a) | Eicher Motors Ltd. | 69,435 | ||||
574 | Kia Motors Corp. | 42,369 | |||||
| Total Automobiles | $ | 164,361 | |||||
| Banks — 11.7% | |||||||
483,000 | Agricultural Bank of China, Ltd., Class H | $ | 193,326 | ||||
35,333 | (a) | Alpha Bank AE | 37,846 | ||||
13,968 | Banco Bradesco S.A. (A.D.R.) | 65,650 | |||||
10,853 | Banco Bradesco S.A., Class Preferen | 51,510 | |||||
5,286 | Banco do Brasil S.A. | 28,537 | |||||
74,800 | Bank Central Asia Tbk PT | 160,313 | |||||
169,000 | China Construction Bank Corp., Class H | 142,084 | |||||
5,770 | Commercial International Bank Egypt S.A.E | 21,292 | |||||
111,000 | CTBC Financial Holding Co., Ltd. | 86,260 | |||||
11,993 | First Abu Dhabi Bank PJSC | 47,678 | |||||
8,506 | (a) | Grupo Financiero Banorte S.A.B de CV, Class O | 47,964 | ||||
1,778 | (a) | HDFC Bank, Ltd. (A.D.R.) | 138,133 | ||||
11,237 | (a) | ICICI Bank, Ltd. (A.D.R.) | 180,129 | ||||
8,689 | (a) | ICICI Bank, Ltd. | 69,384 | ||||
15,258 | Itausa - Investimentos Itau S.A. | 27,917 | |||||
1,995 | (a) | OTP Bank Nyrt | 85,266 | ||||
5,491 | (a) | Powszechna Kasa Oszczednosci Bank Polski S.A. | 45,419 | ||||
3,289 | Sberbank of Russia PJSC (A.D.R.) | 50,683 | |||||
29,685 | Sberbank of Russia PJSC | 106,173 | |||||
51,685 | Sberbank of Russia PJSC | 198,276 | |||||
2,373 | Shinhan Financial Group Co., Ltd. | 78,917 | |||||
22,803 | (a) | State Bank of India | 113,224 | ||||
981 | TCS Group Holding Plc (G.D.R.) | 57,030 | |||||
| Total Banks | $ | 2,033,011 | |||||
| Beverages — 0.9% | |||||||
MXN | 3,833 | Fomento Economico Mexicano S.A.B de CV | $ | 28,881 | |||
94,900 | Thai Beverage PCL | 52,259 | |||||
8,000 | Tsingtao Brewery Co., Ltd., Class H | 71,088 | |||||
| Total Beverages | $ | 152,228 | |||||
The accompanying notes are an integral part of these financial statements.
Pioneer Emerging Markets Equity Fund | Semiannual Report | 3/31/21 17
Schedule of Investments | 3/31/21 (continued)
| Shares | Value | ||||||
| Biotechnology — 0.3% | |||||||
285 | (a) | Hugel, Inc. | $ | 45,193 | |||
| Total Biotechnology | $ | 45,193 | |||||
| Capital Markets — 0.1% | |||||||
2,111 | Warsaw Stock Exchange | $ | 24,465 | ||||
| Total Capital Markets | $ | 24,465 | |||||
| Chemicals — 0.3% | |||||||
17,100 | PTT Global Chemical PCL | $ | 34,359 | ||||
225 | Sociedad Quimica y Minera de Chile S.A., Class B | 12,035 | |||||
| Total Chemicals | $ | 46,394 | |||||
| Commercial Services & Supplies — 0.9% | |||||||
101,000 | China Everbright International, Ltd. | $ | 68,483 | ||||
52,000 | Greentown Service Group Co., Ltd. | 79,163 | |||||
| Total Commercial Services & Supplies | $ | 147,646 | |||||
| Construction & Engineering — 1.0% | |||||||
146,000 | Beijing Urban Construction Design & Development | ||||||
| Group Co., Ltd., Class H (144A) | $ | 38,945 | |||||
38,500 | IJM Corp. Bhd | 15,699 | |||||
6,199 | Larsen & Toubro Ltd. | 120,433 | |||||
| Total Construction & Engineering | $ | 175,077 | |||||
| Construction Materials — 0.5% | |||||||
3,909 | (a) | Cemex S.A.B de CV (A.D.R.) | $ | 27,246 | |||
2,618 | Grasim Industries Ltd. | 52,215 | |||||
| Total Construction Materials | $ | 79,461 | |||||
| Distributors — 0.4% | |||||||
3,100 | Jardine Cycle & Carriage Ltd. | $ | 51,917 | ||||
1,893 | (a) | Sendas Distribuidora S.A. (A.D.R.) | 24,609 | ||||
| Total Distributors | $ | 76,526 | |||||
| Diversified Consumer Services — 0.6% | |||||||
5,890 | New Oriental Education & Technology Group, Inc. (A.D.R.) | $ | 82,460 | ||||
3,400 | YDUQS Participacoes S.A. | 16,101 | |||||
| Total Diversified Consumer Services | $ | 98,561 | |||||
| Diversified Financial Services — 0.3% | |||||||
8,000 | Chailease Holding Co., Ltd. | $ | 55,414 | ||||
| Total Diversified Financial Services | $ | 55,414 | |||||
| Electric Utilities — 0.5% | |||||||
| BRL | 2,229 | Alupar Investimento S.A. | $ | 10,137 | |||
11,200 | Centrais Eletricas Brasileiras S.A. | 68,049 | |||||
| Total Electric Utilities | $ | 78,186 | |||||
| Electrical Equipment — 0.2% | |||||||
11,000 | Zhuzhou CRRC Times Electric Co., Ltd., Class H | $ | 41,238 | ||||
| Total Electrical Equipment | $ | 41,238 | |||||
The accompanying notes are an integral part of these financial statements. | |||||||
18 Pioneer Emerging Markets Equity Fund | Semiannual Report | 3/31/21
| Shares | Value | ||||||
| Electronic Equipment, Instruments & Components — 2.2% | |||||||
7,000 | Chroma ATE, Inc. | $ | 46,809 | ||||
18,000 | Delta Electronics, Inc. | 183,796 | |||||
6,000 | Elite Material Co., Ltd. | 35,758 | |||||
648 | Samsung Electro-Mechanics Co., Ltd. | 108,763 | |||||
| Total Electronic Equipment, Instruments & Components | $ | 375,126 | |||||
| Energy Equipment & Services — 0.1% | |||||||
24,700 | Dialog Group Bhd | $ | 18,542 | ||||
| Total Energy Equipment & Services | $ | 18,542 | |||||
| Entertainment — 2.4% | |||||||
109 | NCSoft Corp. | $ | 84,603 | ||||
1,625 | NetEase, Inc. (A.D.R.) | 167,797 | |||||
378 | (a) | Sea Ltd. (A.D.R.) | 84,381 | ||||
4,197 | (a) | Tencent Music Entertainment Group (A.D.R.) | 85,997 | ||||
| Total Entertainment | $ | 422,778 | |||||
| Food & Staples Retailing — 0.9% | |||||||
18,900 | Atacadao Distribuicao Comercio e Industria Ltd. | $ | 77,806 | ||||
1,893 | Compania Brasileira de Distribuicao (A.D.R.) | 11,017 | |||||
4,000 | President Chain Store Corp. | 38,240 | |||||
833 | X5 Retail Group NV (G.D.R.) | 26,895 | |||||
| Total Food & Staples Retailing | $ | 153,958 | |||||
| Food Products — 2.4% | |||||||
27,000 | China Feihe, Ltd. (144A) | $ | 76,661 | ||||
2,875 | Gruma S.A.B de CV, Class B | 34,041 | |||||
15,500 | Health & Happiness H&H International Holdings, Ltd. | 58,876 | |||||
29,633 | JBS S.A. | 159,082 | |||||
32,000 | Uni-President Enterprises Corp. | 82,327 | |||||
| Total Food Products | $ | 410,987 | |||||
| Gas Utilities — 0.4% | |||||||
70,000 | Kunlun Energy Co., Ltd. | $ | 73,648 | ||||
| Total Gas Utilities | $ | 73,648 | |||||
| Health Care Providers & Services — 0.2% | |||||||
977 | Apollo Hospitals Enterprise Ltd. | $ | 38,690 | ||||
| Total Health Care Providers & Services | $ | 38,690 | |||||
| Hotels, Restaurants & Leisure — 0.6% | |||||||
11,000 | (a) | Galaxy Entertainment Group, Ltd. | $ | 99,479 | |||
| Total Hotels, Restaurants & Leisure | $ | 99,479 | |||||
| Household Durables — 0.8% | |||||||
1,235 | (a) | Dixon Technologies India Ltd. | $ | 62,072 | |||
2,083 | Ez Tec Empreendimentos e Participacoes S.A. | 11,836 | |||||
1,147 | Woongjin Coway Co., Ltd. | 66,670 | |||||
| Total Household Durables | $ | 140,578 | |||||
The accompanying notes are an integral part of these financial statements.
Pioneer Emerging Markets Equity Fund | Semiannual Report | 3/31/21 19
Schedule of Investments | 3/31/21 (continued)
| Shares | Value | ||||||
| Independent Power & Renewable | |||||||
| Electricity Producers — 0.4% | |||||||
50,000 | China Longyuan Power Group Corp. Ltd., Class H | $ | 68,340 | ||||
| Total Independent Power & Renewable | |||||||
| Electricity Producers | $ | 68,340 | |||||
| Industrial Conglomerates — 0.5% | |||||||
3,790 | Ayala Corp. | $ | 57,851 | ||||
3,183 | Bidvest Group Ltd. | 36,701 | |||||
| Total Industrial Conglomerates | $ | 94,552 | |||||
| Insurance — 1.5% | |||||||
22,000 | Ping An Insurance Group Co. of China, Ltd., Class H | $ | 262,710 | ||||
| Total Insurance | $ | 262,710 | |||||
| Interactive Media & Services — 6.9% | |||||||
479 | Autohome, Inc. (A.D.R.) | $ | 44,676 | ||||
878 | (a) | Baidu, Inc. (A.D.R.) | 191,009 | ||||
1,636 | (a) | Mail.Ru Group Ltd. (G.D.R.) | 37,474 | ||||
592 | NAVER Corp. | 198,604 | |||||
8,700 | Tencent Holdings, Ltd. | 685,824 | |||||
262 | (a) | Yandex NV | 17,024 | ||||
418 | (a) | Yandex NV | 26,777 | ||||
| Total Interactive Media & Services | $ | 1,201,388 | |||||
| Internet & Direct Marketing Retail — 12.5% | |||||||
4,100 | (a) | Alibaba Group Holding, Ltd. | $ | 116,012 | |||
3,629 | (a) | Alibaba Group Holding, Ltd. (A.D.R.) | 822,803 | ||||
1,442 | (a) | Baozun, Inc. (A.D.R.) | 54,998 | ||||
2,928 | (a) | JD.com, Inc. (A.D.R.) | 246,918 | ||||
1,544 | (a) | MakeMyTrip Ltd. | 48,760 | ||||
2,700 | (a) | Meituan Dianping, Class B (144A) | 104,007 | ||||
1,414 | Naspersm, Ltd., Class N | 338,862 | |||||
653 | (a) | Ozon Holdings PLC (A.D.R.) | 36,614 | ||||
2,304 | (a) | Prosus NV | 256,874 | ||||
3,504 | (a) | Trip.com Group Ltd. (A.D.R.) | 138,863 | ||||
| Total Internet & Direct Marketing Retail | $ | 2,164,711 | |||||
| IT Services — 2.1% | |||||||
6,086 | HCL Technologies, Ltd. | $ | 81,893 | ||||
3,678 | Infosys Ltd. | 68,957 | |||||
7,919 | Infosys Ltd. (A.D.R.) | 148,244 | |||||
5,285 | Tech Mahindra Ltd. | 71,824 | |||||
| Total IT Services | $ | 370,918 | |||||
| Leisure Products — 0.5% | |||||||
7,000 | Giant Manufacturing Co., Ltd. | $ | 85,045 | ||||
| Total Leisure Products | $ | 85,045 | |||||
The accompanying notes are an integral part of these financial statements.
20 Pioneer Emerging Markets Equity Fund | Semiannual Report | 3/31/21
| Shares | Value | ||||||
| Machinery — 1.9% | |||||||
24,423 | (a) | Ashok Leyland Ltd. | $ | 37,804 | |||
21,500 | China Conch Venture Holdings Ltd. | 101,128 | |||||
4,244 | Hiwin Technologies Corp. | 60,672 | |||||
33,075 | (a) | Iochpe Maxion S.A. | 70,543 | ||||
38,800 | Zoomlion Heavy Industry Science & Technology Co., Ltd., | ||||||
Class H | 55,636 | ||||||
| Total Machinery | $ | 325,783 | |||||
| Media — 0.2% | |||||||
MXN | 19,300 | (a) | Grupo Televisa S.A.B | $ | 34,306 | ||
| Total Media | $ | 34,306 | |||||
| Metals & Mining — 5.4% | |||||||
1,035 | AngloGold Ashanti Ltd. | $ | 22,616 | ||||
6,606 | Bradespar S.A., Class Preferen | 80,004 | |||||
28,254 | Grupo Mexico S.A.B de CV | 148,939 | |||||
39,950 | Hindalco Industries Ltd. | 179,236 | |||||
9,100 | Impala Platinum Holdings Ltd. | 168,522 | |||||
756 | (a) | KGHM Polska Miedz S.A. | 36,388 | ||||
105 | MMC Norilsk Nickel PJSC | 33,016 | |||||
2,630 | MMC Norilsk Nickel PJSC (A.D.R.) | 82,293 | |||||
15,492 | Sibanye Stillwater Ltd. | 68,865 | |||||
1,417 | Ternium S.A. (A.D.R.) | 55,036 | |||||
53,850 | (a) | United Co. RUSAL International PJSC | 35,253 | ||||
1,161 | Vale S.A., Class B (A.D.R.) | 20,178 | |||||
| Total Metals & Mining | $ | 930,346 | |||||
| Multiline Retail — 0.5% | |||||||
7,100 | El Puerto de Liverpool S.A.B de CV | $ | 24,998 | ||||
16,396 | Lojas Americanas S.A. | 60,463 | |||||
| Total Multiline Retail | $ | 85,461 | |||||
| Oil, Gas & Consumable Fuels — 4.7% | |||||||
204,000 | CNOOC Ltd. | $ | 213,582 | ||||
9,325 | Compania Energetica de Minas Gerais (A.D.R.) | 21,168 | |||||
1,868 | Cosan S.A. (A.D.R.) | 30,168 | |||||
3,050 | Gazprom PJSC | 9,202 | |||||
7,622 | Gazprom PJSC (A.D.R.) | 45,478 | |||||
18,956 | Gazprom PJSC | 57,210 | |||||
1,199 | LUKOIL PJSC | 96,979 | |||||
191 | Novatek PJSC (G.D.R.) | 37,741 | |||||
9,500 | Petroleo Brasileiro S.A. | 40,321 | |||||
2,093 | Petroleo Brasileiro S.A. (A.D.R.) | 17,874 | |||||
3,614 | Reliance Industries, Ltd. | 99,287 | |||||
11,439 | Rosneft Oil Co., PJSC (G.D.R.) | 86,415 | |||||
112 | (a) | SK Innovation Co., Ltd. | 21,921 | ||||
10,114 | Surgutneftegas PJSC | 5,617 | |||||
The accompanying notes are an integral part of these financial statements.
Pioneer Emerging Markets Equity Fund | Semiannual Report | 3/31/21 21
Schedule of Investments | 3/31/21 (continued)
| Shares | Value | ||||||
| Oil, Gas & Consumable Fuels (continued) | |||||||
27,630 | Surgutneftegas PJSC | $ | 12,620 | ||||
5,775 | (a) | Vista Oil & Gas S.A.B de CV (A.D.R.) | 14,784 | ||||
| Total Oil, Gas & Consumable Fuels | $ | 810,367 | |||||
| Paper & Forest Products — 0.4% | |||||||
5,900 | (a) | Suzano S.A. | $ | 71,705 | |||
| Total Paper & Forest Products | $ | 71,705 | |||||
| Real Estate Management & Development — 3.4% | |||||||
79,526 | (a) | Aldar Properties PJSC | $ | 81,464 | |||
19,900 | (a) | BR Malls Participacoes S.A. | 35,704 | ||||
32,000 | China Overseas Land & Investment Ltd. | 83,404 | |||||
20,000 | China Resources Land, Ltd. | 96,880 | |||||
60,000 | CIFI Holdings Group Co., Ltd. | 58,375 | |||||
7,277 | Corp. Inmobiliaria Vesta S.A.B de CV | 15,239 | |||||
20,804 | DLF Ltd. | 81,969 | |||||
77,686 | (a) | Emaar Malls PJSC | 35,775 | ||||
12,000 | Longfor Group Holdings, Ltd. (144A) | 79,898 | |||||
8,000 | Shimao Group Holdings, Ltd. | 25,183 | |||||
| Total Real Estate Management & Development | $ | 593,891 | |||||
| Semiconductors & Semiconductor Equipment — 11.1% | |||||||
5,000 | Alchip Technologies Ltd. | $ | 160,234 | ||||
5,000 | Global Unichip Corp. | 70,868 | |||||
5,000 | LandMark Optoelectronics Corp. | 47,701 | |||||
4,000 | MediaTek, Inc. | 137,779 | |||||
1,764 | SK Hynix, Inc. | 208,348 | |||||
9,985 | Taiwan Semiconductor Manufacturing Co., Ltd. (A.D.R.) | 1,181,026 | |||||
3,000 | Win Semiconductors Corp. | 41,559 | |||||
42,000 | Xinyi Solar Holdings, Ltd. | 70,396 | |||||
| Total Semiconductors & Semiconductor Equipment | $ | 1,917,911 | |||||
| Software — 0.6% | |||||||
15,000 | Kingsoft Corp. Ltd. | $ | 100,885 | ||||
| Total Software | $ | 100,885 | |||||
| Specialty Retail — 2.1% | |||||||
36,729 | Abu Dhabi National Oil Co. for Distribution PJSC | $ | 44,914 | ||||
3,000 | China International Travel Service Corp. Ltd. | 140,478 | |||||
67,500 | China Yongda Automobiles Services Holdings, Ltd. | 123,655 | |||||
23,145 | Detsky Mir PJSC (144A) | 43,646 | |||||
7,500 | (a) | Via Varejo S/A | 16,049 | ||||
| Total Specialty Retail | $ | 368,742 | |||||
| Technology Hardware, Storage & Peripherals — 6.9% | |||||||
67 | Samsung Electronics Co., Ltd. (G.D.R.) | $ | 122,290 | ||||
8,839 | Samsung Electronics Co., Ltd. | 640,369 | |||||
6,513 | Samsung Electronics Co., Ltd., Class Preferen | 422,645 | |||||
| Total Technology Hardware, Storage & Peripherals | $ | 1,185,304 | |||||
The accompanying notes are an integral part of these financial statements.
22 Pioneer Emerging Markets Equity Fund | Semiannual Report | 3/31/21
| Shares | Value | ||||||
| Textiles, Apparel & Luxury Goods — 2.0% | |||||||
1,185 | Fila Holdings Corp. | $ | 45,364 | ||||
15,000 | Li Ning Co., Ltd. | 97,987 | |||||
39,300 | (a) | Samsonite International S.A. (144A) | 76,096 | ||||
219,000 | Xtep International Holdings Ltd. | 128,552 | |||||
| Total Textiles, Apparel & Luxury Goods | $ | 347,999 | |||||
| Thrifts & Mortgage Finance — 1.5% | |||||||
7,550 | Housing Development Finance Corp. Ltd. | $ | 258,791 | ||||
| Total Thrifts & Mortgage Finance | $ | 258,791 | |||||
| Trading Companies & Distributors — 0.1% | |||||||
110,300 | AKR Corporindo Tbk PT | $ | 24,505 | ||||
| Total Trading Companies & Distributors | $ | 24,505 | |||||
| Transportation Infrastructure — 0.1% | |||||||
7,825 | (a) | EcoRodovias Infraestrutura e Logistica S.A. | $ | 16,259 | |||
| Total Transportation Infrastructure | $ | 16,259 | |||||
| Water Utilities — 0.2% | |||||||
4,648 | Compania de Saneamento Basico do Estado de Sao Paulo | ||||||
| (A.D.R.) | $ | 34,070 | |||||
| Total Water Utilities | $ | 34,070 | |||||
| Wireless Telecommunication Services — 2.1% | |||||||
14,994 | Bharti Airtel, Ltd. | $ | 106,184 | ||||
15,952 | MTN Group Ltd. | 93,710 | |||||
230,600 | Sistema PJSFC | 104,435 | |||||
276 | SK Telecom Co., Ltd. | 67,427 | |||||
| Total Wireless Telecommunication Services | $ | 371,756 | |||||
| TOTAL COMMON STOCKS | |||||||
(Cost $11,997,800) | $ | 16,869,651 | |||||
| RIGHT/WARRANT — 0.0%† of Net Assets | |||||||
CLP | 41 | (a) | Sociedad Quimica y Minera de Chile S.A. | $ | 159 | ||
| TOTAL RIGHT/WARRANT | |||||||
(Cost $779) | $ | 159 | |||||
| TOTAL INVESTMENTS IN UNAFFILIATED ISSUERS — 97.5% | |||||||
(Cost $11,998,579) | $ | 16,869,810 | |||||
| OTHER ASSETS AND LIABILITIES — 2.5% | $ | 437,881 | |||||
| NET ASSETS — 100.0% | $ | 17,307,691 | |||||
(144A) | Security is exempt from registration under Rule 144A of the Securities Act of 1933. Such | ||||||
securities may be resold normally to qualified institutional buyers in a transaction exempt | |||||||
from registration. At March 31, 2021, the value of these securities amounted to $419,253, | |||||||
or 2.4% of net assets. | |||||||
(A.D.R.) | American Depositary Receipts. | ||||||
(G.D.R.) | Global Depositary Receipts. | ||||||
† | Amount rounds to less than 0.1%. | ||||||
The accompanying notes are an integral part of these financial statements.
Pioneer Emerging Markets Equity Fund | Semiannual Report | 3/31/21 23
Schedule of Investments | 3/31/21 (continued)
(a) | Non-income producing security. | |
(b) | Distribution of investments by country of domicile (excluding temporary cash | |
| investments) as a percentage of total investments in securities, is as follows: | ||
| China | 29.0% | |
| Taiwan | 13.7% | |
| South Korea | 13.0% | |
| India | 12.0% | |
| Russia | 6.6% | |
| Brazil | 6.3% | |
| South Africa | 4.3% | |
| Hong Kong | 4.1% | |
| Mexico | 2.2% | |
| Netherlands | 1.5% | |
| United Arab Emirates | 1.2% | |
| Indonesia | 1.1% | |
| Other (individually less than 1%) | 5.0% | |
| 100.0% |
Principal amounts are denominated in U.S. dollars (“USD”) unless otherwise noted.
BRL — Brazilian Real
CLP — Chilean Peso
MXN — Mexican Peso
Purchases and sales of securities (excluding temporary cash investments) for the six months ended March 31, 2021, aggregated $3,607,867 and $2,590,494, respectively.
The Fund is permitted to engage in purchase and sale transactions (“cross trades”) with certain funds and accounts for which Amundi Asset Management US, Inc. (the “Adviser”) serves as the Fund’s investment adviser, as set forth in Rule 17a-7 under the Investment Company Act of 1940, pursuant to procedures adopted by the Board of Trustees. Under these procedures, cross trades are effected at current market prices. During the six months ended March 31, 2021, the Fund did not engage in any cross trade activity.
At March 31, 2021, the net unrealized appreciation on investments based on cost for federal tax purposes of $12,157,315 was as follows:
| Aggregate gross unrealized appreciation for all investments in which | |
| there is an excess of value over tax cost | $ 5,195,725 |
| Aggregate gross unrealized depreciation for all investments in which | |
| there is an excess of tax cost over value | (483,230) |
| Net unrealized appreciation | $ 4,712,495 |
Various inputs are used in determining the value of the Fund’s investments. These inputs are summarized in the three broad levels below.
| Level 1 - | unadjusted quoted prices in active markets for identical securities. |
Level 2 - | other significant observable inputs (including quoted prices for similar securities, interest rates, prepayment speeds, credit risks, etc.). See Notes to Financial Statements — Note 1A. |
Level 3 - | significant unobservable inputs (including the Fund’s own assumptions in determining fair value of investments). See Notes to Financial Statements — Note 1A. |
The accompanying notes are an integral part of these financial statements.
24 Pioneer Emerging Markets Equity Fund | Semiannual Report | 3/31/21
The following is a summary of the inputs used as of March 31, 2021, in valuing the Fund’s investments:
| Level 1 | Level 2 | Level 3 | Total | |
Common Stocks | ||||
| Air Freight & Logistics | $ — | $ 27,089 | $ — | $ 27,089 |
| Auto Components | — | 165,270 | — | 165,270 |
| Automobiles | — | 164,361 | — | 164,361 |
| Banks | 434,595 | 1,598,416 | — | 2,033,011 |
| Beverages | — | 152,228 | — | 152,228 |
| Biotechnology | — | 45,193 | — | 45,193 |
| Capital Markets | — | 24,465 | — | 24,465 |
| Chemicals | — | 46,394 | — | 46,394 |
| Commercial Services & Supplies | — | 147,646 | — | 147,646 |
| Construction & Engineering | — | 175,077 | — | 175,077 |
| Construction Materials | 27,246 | 52,215 | — | 79,461 |
| Distributors | 24,609 | 51,917 | — | 76,526 |
| Diversified Consumer Services | 82,460 | 16,101 | — | 98,561 |
| Diversified Financial Services | — | 55,414 | — | 55,414 |
| Electric Utilities | — | 78,186 | — | 78,186 |
| Electrical Equipment | — | 41,238 | — | 41,238 |
| Electronic Equipment, | ||||
| Instruments & Components | — | 375,126 | — | 375,126 |
| Energy Equipment & Services | — | 18,542 | — | 18,542 |
| Entertainment | 338,175 | 84,603 | — | 422,778 |
| Food & Staples Retailing | 11,017 | 142,941 | — | 153,958 |
| Food Products | — | 410,987 | — | 410,987 |
| Gas Utilities | — | 73,648 | — | 73,648 |
| Health Care Providers & Services | — | 38,690 | — | 38,690 |
| Hotels, Restaurants & Leisure | — | 99,479 | — | 99,479 |
| Household Durables | — | 140,578 | — | 140,578 |
| Independent Power & Renewable | ||||
| Electricity Producers | — | 68,340 | — | 68,340 |
| Industrial Conglomerates | — | 94,552 | — | 94,552 |
| Insurance | — | 262,710 | — | 262,710 |
| Interactive Media & Services | 262,462 | 938,926 | — | 1,201,388 |
| Internet & Direct Marketing Retail | 1,348,956 | 815,755 | — | 2,164,711 |
| IT Services | 148,244 | 222,674 | — | 370,918 |
| Leisure Products | — | 85,045 | — | 85,045 |
| Machinery | — | 325,783 | — | 325,783 |
| Media | — | 34,306 | — | 34,306 |
| Metals & Mining | 157,507 | 772,839 | — | 930,346 |
| Multiline Retail | — | 85,461 | — | 85,461 |
| Oil, Gas & Consumable Fuels | 83,994 | 726,373 | — | 810,367 |
| Paper & Forest Products | — | 71,705 | — | 71,705 |
| Real Estate Management & | ||||
| Development | — | 593,891 | — | 593,891 |
| Semiconductors & Semiconductor | ||||
| Equipment | 1,181,026 | 736,885 | — | 1,917,911 |
| Software | — | 100,885 | — | 100,885 |
The accompanying notes are an integral part of these financial statements.
Pioneer Emerging Markets Equity Fund | Semiannual Report | 3/31/21 25
Schedule of Investments | 3/31/21 (continued)
| Level 1 | Level 2 | Level 3 | Total | |
| Specialty Retail | $ — | $ 368,742 | $ — | $ 368,742 |
| Technology Hardware, Storage & | ||||
| Peripherals | — | 1,185,304 | — | 1,185,304 |
| Textiles, Apparel & Luxury Goods | — | 347,999 | — | 347,999 |
| Thrifts & Mortgage Finance | — | 258,791 | — | 258,791 |
| Trading Companies & Distributors | — | 24,505 | — | 24,505 |
| Transportation Infrastructure | — | 16,259 | — | 16,259 |
| Wireless Telecommunication | ||||
| Services | — | 371,756 | — | 371,756 |
| All Other Common Stock | 34,070 | — | — | 34,070 |
Right/Warrant | — | 159 | — | 159 |
| Total Investments in Securities | $4,134,361 | $12,735,449 | $ — | $16,869,810 |
During the six months ended March 31, 2021, there were no transfers in or out of Level 3.
The accompanying notes are an integral part of these financial statements.
26 Pioneer Emerging Markets Equity Fund | Semiannual Report | 3/31/21
(unaudited)
| ASSETS: | |
| Investments in unaffiliated issuers, at value (cost $11,998,579) | $16,869,810 |
| Cash | 503,813 |
| Foreign currencies, at value (cost $89,121) | 87,910 |
| Receivables — | |
| Investment securities sold | 88,743 |
| Fund shares sold | 401 |
| Dividends | 40,115 |
| Due from the Adviser | 36,744 |
| Other assets | 36,856 |
| Total assets | $17,664,392 |
| LIABILITIES: | |
| Payables — | |
| Investment securities purchased | $ 191,992 |
| Trustees’ fees | 48 |
| Professional fees | 22,272 |
| Printing expense | 24,872 |
| Custodian fees | 31,419 |
| Reserve for repatriation taxes | 56,091 |
| Due to affiliates | 14,524 |
| Accrued expenses | 15,483 |
| Total liabilities | $ 356,701 |
| NET ASSETS: | |
| Paid-in capital | $12,975,535 |
| Distributable earnings | 4,332,156 |
| Net assets | $17,307,691 |
| NET ASSET VALUE PER SHARE: | |
No par value (unlimited number of shares authorized) | |
| Class A (based on $6,380,382/462,198 shares) | $ 13.80 |
| Class C (based on $4,759,591/346,216 shares) | $ 13.75 |
| Class Y (based on $6,167,718/446,676 shares) | $ 13.81 |
| MAXIMUM OFFERING PRICE PER SHARE: | |
| Class A (based on $13.80 net asset value per share/100%-5.75% | |
| maximum sales charge) | $ 14.64 |
The accompanying notes are an integral part of these financial statements.
Pioneer Emerging Markets Equity Fund | Semiannual Report | 3/31/21 27
Statement of Operations (unaudited)
FOR THE SIX MONTHS ENDED 3/31/21
| INVESTMENT INCOME: | ||
| Dividends from unaffiliated issuers (net of foreign | ||
| taxes withheld $20,003) | $ 103,176 | |
| Interest from unaffiliated issuers | 75 | |
| Total investment income | $ 103,251 | |
| EXPENSES: | ||
| Management fees | $ 62,079 | |
| Administrative expense | 28,510 | |
| Transfer agent fees | ||
| Class A | 781 | |
| Class C | 116 | |
| Class Y | 48 | |
| Distribution fees | ||
| Class A | 6,680 | |
| Class C | 21,929 | |
| Shareowner communications expense | 675 | |
| Custodian fees | 66,295 | |
| Registration fees | 35,119 | |
| Professional fees | 14,655 | |
| Printing expense | 12,426 | |
| Pricing fees | 5,171 | |
| Trustees’ fees | 3,378 | |
| Insurance expense | 22 | |
| Miscellaneous | 7,354 | |
| Total expenses | $ 265,238 | |
| Less fees waived and expenses reimbursed | ||
| by the Adviser | (158,642) | |
| Net expenses | $ 106,596 | |
| Net investment income (loss) | $ (3,345) | |
| REALIZED AND UNREALIZED GAIN (LOSS) ON INVESTMENTS: | ||
| Net realized gain (loss) on: | ||
| Investments in unaffiliated issuers | $ 295,866 | |
| Other assets and liabilities denominated in | ||
| foreign currencies | 6,110 | $ 301,976 |
| Change in net unrealized appreciation (depreciation) on: | ||
| Investments in unaffiliated issuers (net of foreign | ||
| capital gains tax of $(51,411)) | $2,967,197 | |
| Other assets and liabilities denominated in | ||
| foreign currencies | (3,110) | $2,964,087 |
| Net realized and unrealized gain (loss) on investments | $3,266,063 | |
| Net increase in net assets resulting from operations | $3,262,718 | |
The accompanying notes are an integral part of these financial statements.
28 Pioneer Emerging Markets Equity Fund | Semiannual Report | 3/31/21
Statement of Changes in Net Assets
| Six Months | ||
| Ended | 10/2/19 | |
| 3/31/21 | to | |
| (unaudited) | 9/30/20 | |
| FROM OPERATIONS: | ||
Net investment income (loss) | $ (3,345) | $ 71,094 |
Net realized gain (loss) on investments | 301,976 | (658,331) |
Change in net unrealized appreciation (depreciation) | ||
| on investments | 2,964,087 | 1,848,540 |
| Net increase in net assets resulting from operations | $ 3,262,718 | $ 1,261,303 |
| DISTRIBUTIONS TO SHAREOWNERS: | ||
| Class A ($0.11 and $0.06 per share, respectively) | $ (44,319) | $ (21,270) |
| Class C ($0.05 and $0.04 per share, respectively) | (15,847) | (14,728) |
| Class Y ($0.16 and $0.07 per share, respectively) | (68,842) | (31,140) |
| Total distributions to shareowners | $ (129,008) | $ (67,138) |
| FROM FUND SHARE TRANSACTIONS: | ||
Net proceeds from sales of shares | $ 1,673,234 | $12,039,534 |
Reinvestment of distributions | 129,008 | 67,138 |
Cost of shares repurchased | (441,739) | (487,359) |
| Net increase in net assets resulting from | ||
| Fund share transactions | $ 1,360,503 | $11,619,313 |
| Net increase in net assets | $ 4,494,213 | $12,813,478 |
| NET ASSETS: | ||
Beginning of period | $12,813,478 | $ – |
End of period | $17,307,691 | $12,813,478 |
The accompanying notes are an integral part of these financial statements.
Pioneer Emerging Markets Equity Fund | Semiannual Report | 3/31/21 29
Statement of Changes in Net Assets
(continued)
| Six Months | Six Months | ||||||||||
| Ended | Ended | ||||||||||
| 3/31/21 | 3/31/21 | 10/2/19 to | 10/2/19 to | ||||||||
| Shares | Amount | 9/30/20 | 9/30/20 | ||||||||
| (unaudited) | (unaudited) | Shares | Amount | ||||||||
| Class A | |||||||||||
Shares sold | 106,549 | $ | 1,472,888 | 425,930 | $ | 4,281,156 | |||||
Reinvestment of | |||||||||||
| distributions | 3,454 | 44,319 | 1,949 | 21,270 | |||||||
Less shares repurchased | (29,714 | ) | (389,384 | ) | (45,970 | ) | (453,804 | ) | |||
| Net increase | 80,289 | $ | 1,127,823 | 381,909 | $ | 3,848,622 | |||||
| Class C | |||||||||||
Shares sold | 14,266 | $ | 191,504 | 336,915 | $ | 3,379,378 | |||||
Reinvestment of | |||||||||||
| distributions | 1,236 | 15,847 | 1,360 | 14,728 | |||||||
Less shares repurchased | (4,080 | ) | (52,355 | ) | (3,481 | ) | (33,555 | ) | |||
| Net increase | 11,422 | $ | 154,996 | 334,794 | $ | 3,360,551 | |||||
| Class Y | |||||||||||
Shares sold | 603 | $ | 8,842 | 437,900 | $ | 4,379,000 | |||||
Reinvestment of | |||||||||||
| distributions | 5,345 | 68,842 | 2,828 | 31,140 | |||||||
Less shares repurchased | — | — | — | — | |||||||
| Net increase | 5,948 | $ | 77,684 | 440,728 | $ | 4,410,140 | |||||
The accompanying notes are an integral part of these financial statements.
30 Pioneer Emerging Markets Equity Fund | Semiannual Report | 3/31/21
Financial Highlights
| Six Months | ||||||||
| Ended | ||||||||
| 3/31/21 | 10/2/19 to | |||||||
| (unaudited) | 9/30/20* | |||||||
| Class A | ||||||||
Net asset value, beginning of period | $ | 11.08 | $ | 10.00 | ||||
Increase (decrease) from investment operations: | ||||||||
| Net investment income (loss) (a) | $ | 0.00(b | ) | $ | 0.07 | |||
| Net realized and unrealized gain (loss) on investments | 2.83 | 1.07 | ||||||
| Net increase (decrease) from investment operations | $ | 2.83 | $ | 1.14 | ||||
Distributions to shareowners: | ||||||||
| Net investment income | $ | (0.11 | ) | $ | (0.06 | ) | ||
| Total distributions | $ | (0.11 | ) | $ | (0.06 | ) | ||
| Net increase (decrease) in net asset value | $ | 2.72 | $ | 1.08 | ||||
Net asset value, end of period | $ | 13.80 | $ | 11.08 | ||||
| Total return (c) | 25.65 | %(d) | 11.43 | %(d) | ||||
Ratio of net expenses to average net assets | 1.27 | %(e) | 1.28 | %(e) | ||||
Ratio of net investment income (loss) to average net assets | 0.06 | %(e) | 0.72 | %(e) | ||||
Portfolio turnover rate | 17 | %(d) | 61 | %(d) | ||||
Net assets, end of period (in thousands) | $ | 6,380 | $ | 4,232 | ||||
Ratios with no waiver of fees and assumption of expenses | ||||||||
| by the Adviser and no reduction for fees paid indirectly: | ||||||||
| Total expenses to average net assets | 3.32 | %(e) | 4.45 | %(e) | ||||
| Net investment income (loss) to average net assets | (1.99 | )%(e) | (2.45 | )%(e) | ||||
* | Class A commenced operations on October 2, 2019. |
(a) | The per-share data presented above is based upon the average shares outstanding for the periods presented. |
(b) | Amount rounds to less than $0.01 or $(0.01) per-share. |
(c) | Assumes initial investment at net asset value at the beginning of each period, reinvestment of all distributions, the complete redemption of the investment at net asset value at the end of each period and no sales charges. Total return would be reduced if sales charges were taken into account. |
(d) | Not annualized. |
(e) | Annualized. |
The accompanying notes are an integral part of these financial statements.
Pioneer Emerging Markets Equity Fund | Semiannual Report | 3/31/21 31
Financial Highlights (continued)
| Six Months | ||||||||
| Ended | ||||||||
| 3/31/21 | 10/2/19 to | |||||||
| (unaudited) | 9/30/20* | |||||||
| Class C | ||||||||
Net asset value, beginning of period | $ | 11.02 | $ | 10.00 | ||||
Increase (decrease) from investment operations: | ||||||||
| Net investment income (loss) (a) | $ | (0.04 | ) | $ | (0.00 | )(b) | ||
| Net realized and unrealized gain (loss) on investments | 2.82 | 1.06 | ||||||
| Net increase (decrease) from investment operations | $ | 2.78 | $ | 1.06 | ||||
Distributions to shareowners: | ||||||||
| Net investment income | $ | (0.05 | ) | $ | (0.04 | ) | ||
| Total distributions | $ | (0.05 | ) | $ | (0.04 | ) | ||
| Net increase (decrease) in net asset value | $ | 2.73 | $ | 1.02 | ||||
Net asset value, end of period | $ | 13.75 | $ | 11.02 | ||||
| Total return (c) | 25.23 | %(d) | 10.66 | %(d) | ||||
Ratio of net expenses to average net assets | 2.00 | %(e) | 2.01 | %(e) | ||||
Ratio of net investment income (loss) to average net assets | (0.67 | )%(e) | (0.02 | )%(e) | ||||
Portfolio turnover rate | 17 | %(d) | 61 | %(d) | ||||
Net assets, end of period (in thousands) | $ | 4,760 | $ | 3,689 | ||||
Ratios with no waiver of fees and assumption of expenses | ||||||||
| by the Adviser and no reduction for fees paid indirectly: | ||||||||
| Total expenses to average net assets | 4.05 | %(e) | 5.17 | %(e) | ||||
| Net investment income (loss) to average net assets | (2.72 | )%(e) | (3.18 | )%(e) | ||||
* | Class C commenced operations on October 2, 2019. |
(a) | The per-share data presented above is based upon the average shares outstanding for the periods presented. |
(b) | Amount rounds to less than $0.01 or $(0.01) per-share. |
(c) | Assumes initial investment at net asset value at the beginning of each period, reinvestment of all distributions, the complete redemption of the investment at net asset value at the end of each period and no sales charges. Total return would be reduced if sales charges were taken into account. |
(d) | Not annualized. |
(e) | Annualized. |
The accompanying notes are an integral part of these financial statements.
32 Pioneer Emerging Markets Equity Fund | Semiannual Report | 3/31/21
| Six Months | ||||||||
| Ended | ||||||||
| 3/31/21 | 10/2/19 to | |||||||
| (unaudited) | 9/30/20* | |||||||
| Class Y | ||||||||
Net asset value, beginning of period | $ | 11.10 | $ | 10.00 | ||||
Increase (decrease) from investment operations: | ||||||||
| Net investment income (loss) (a) | $ | 0.02 | $ | 0.10 | ||||
| Net realized and unrealized gain (loss) on investments | 2.85 | 1.07 | ||||||
| Net increase (decrease) from investment operations | $ | 2.87 | $ | 1.17 | ||||
Distributions to shareowners: | ||||||||
| Net investment income | $ | (0.16 | ) | $ | (0.07 | ) | ||
| Total distributions | $ | (0.16 | ) | $ | (0.07 | ) | ||
| Net increase (decrease) in net asset value | $ | 2.71 | $ | 1.10 | ||||
Net asset value, end of period | $ | 13.81 | $ | 11.10 | ||||
| Total return (b) | 25.92 | %(c) | 11.72 | %(c) | ||||
Ratio of net expenses to average net assets | 0.99 | %(d) | 0.99 | %(d) | ||||
Ratio of net investment income (loss) to average net assets | 0.34 | %(d) | 0.99 | %(d) | ||||
Portfolio turnover rate | 17 | %(c) | 61 | %(c) | ||||
Net assets, end of period (in thousands) | $ | 6,168 | $ | 4,893 | ||||
Ratios with no waiver of fees and assumption of expenses | ||||||||
| by the Adviser and no reduction for fees paid indirectly: | ||||||||
| Total expenses to average net assets | 3.04 | %(d) | 4.16 | %(d) | ||||
| Net investment income (loss) to average net assets | (1.71 | )%(d) | (2.18 | )%(d) | ||||
* | Class Y commenced operations on October 2, 2019. |
(a) | The per-share data presented above is based upon the average shares outstanding for the periods presented. |
(b) | Assumes initial investment at net asset value at the beginning of each period, reinvestment of all distributions and the complete redemption of the investment at net asset value at the end of each period. |
(c) | Not annualized. |
(d) | Annualized. |
The accompanying notes are an integral part of these financial statements.
Pioneer Emerging Markets Equity Fund | Semiannual Report | 3/31/21 33
(unaudited)
1. Organization and Significant Accounting Policies
Pioneer Emerging Markets Equity Fund (the “Fund”) is one of five portfolios comprising Pioneer Series Trust XIV, a Delaware statutory trust. The Fund is registered under the Investment Company Act of 1940 as a diversified, open end management investment company. The Fund’s investment objective is to seek long-term capital growth.
The Fund offers four classes of shares designated as Class A, Class C, Class K and Class Y shares. Class A, Class C and Class Y commenced operations on October 2, 2019. Class K has not yet commenced operations. Each class of shares represents an interest in the same portfolio of investments of the Fund and has identical rights (based on relative net asset values) to assets and liquidation proceeds. Share classes can bear different rates of class-specific fees and expenses, such as transfer agent and distribution fees. Differences in class specific fees and expenses will result in differences in net investment income and, therefore, the payment of different dividends from net investment income earned by each class. The Amended and Restated Declaration of Trust of the Fund gives the Board of Trustees the flexibility to specify either per-share voting or dollar-weighted voting when submitting matters for shareowner approval. Under per-share voting, each share of a class of the Fund is entitled to one vote. Under dollar-weighted voting, a shareowner’s voting power is determined not by the number of shares owned, but by the dollar value of the shares on the record date. Each share class has exclusive voting rights with respect to matters affecting only that class, including with respect to the distribution plan for that class. There is no distribution plan for Class Y shares.
Amundi Asset Management US, Inc., an indirect, wholly owned subsidiary of Amundi and Amundi’s wholly owned subsidiary, Amundi USA, Inc., serves as the Fund’s investment adviser (the “Adviser”). Prior to January 1, 2021, the Adviser was named Amundi Pioneer Asset Management, Inc. Amundi Distributor US, Inc., an affiliate of Amundi Asset Management US, Inc., serves as the Fund’s distributor (the “Distributor”).
In August 2018, the Financial Accounting Standards Board (FASB) issued Accounting Standards Update 2018-13 “Disclosure Framework - Changes to the Disclosure Requirements for Fair Value Measurement” (“ASU 2018-13”) which modifies disclosure requirements for fair value measurements, principally for Level 3 securities and transfers between levels of the fair value hierarchy. ASU 2018-13 is effective for fiscal years beginning after December 15, 2019 and for interim periods within those fiscal years. The
34 Pioneer Emerging Markets Equity Fund | Semiannual Report | 3/31/21
Fund has adopted ASU 2018-13 for the six months ended March 31, 2021. The impact to the Fund’s adoption was limited to changes in the Fund’s disclosures regarding fair value, primarily those disclosures related to transfers between levels of the fair value hierarchy and disclosure of the range and weighted average used to develop significant unobservable inputs for Level 3 fair value investments, when applicable.
The Fund is an investment company and follows investment company accounting and reporting guidance under U.S. Generally Accepted Accounting Principles (“U.S. GAAP”). U.S. GAAP requires the management of the Fund to make estimates and assumptions that affect the reported amounts of assets and liabilities, the disclosure of contingent assets and liabilities at the date of the financial statements, and the reported amounts of income, expenses and gain or loss on investments during the reporting period. Actual results could differ from those estimates.
The following is a summary of significant accounting policies followed by the Fund in the preparation of its financial statements:
A. Security Valuation
The net asset value of the Fund is computed once daily, on each day the New York Stock Exchange (“NYSE”) is open, as of the close of regular trading on the NYSE.
Equity securities that have traded on an exchange are valued by using the last sale price on the principal exchange where they are traded. Equity securities that have not traded on the date of valuation, or securities for which sale prices are not available, generally are valued using the mean between the last bid and asked prices or, if both last bid and asked prices are not available, at the last quoted bid price. Last sale and bid and asked prices are provided by independent third party pricing services. In the case of equity securities not traded on an exchange, prices are typically determined by independent third party pricing services using a variety of techniques and methods.
The principal exchanges and markets for non-U.S. equity securities have closing times prior to the close of the NYSE. However, the value of these securities may be influenced by changes in global markets occurring after the closing times of the local exchanges and markets up to the time the Fund determines its net asset value. Consequently, the Fund uses a fair value model developed by an independent pricing service to value non-U.S. equity securities. On a daily basis, the pricing service recommends changes, based on a proprietary model, to the closing market prices of each non-U.S. security held by the Fund to reflect the security’s fair value
Pioneer Emerging Markets Equity Fund | Semiannual Report | 3/31/21 35
at the time the Fund determines its net asset value. The Fund applies these recommendations in accordance with procedures approved by the Board of Trustees.
Securities for which independent pricing services or broker-dealers are unable to supply prices or for which market prices and/or quotations are not readily available or are considered to be unreliable are valued by a fair valuation team comprised of certain personnel of the Adviser pursuant to procedures adopted by the Fund’s Board of Trustees. The Adviser’s fair valuation team uses fair value methods approved by the Valuation Committee of the Board of Trustees. The Adviser’s fair valuation team is responsible for monitoring developments that may impact fair valued securities and for discussing and assessing fair values on an ongoing basis, and at least quarterly, with the Valuation Committee of the Board of Trustees.
Inputs used when applying fair value methods to value a security may include credit ratings, the financial condition of the company, current market conditions and comparable securities. The Fund may use fair value methods if it is determined that a significant event has occurred after the close of the exchange or market on which the security trades and prior to the determination of the Fund’s net asset value. Examples of a significant event might include political or economic news, corporate restructurings, natural disasters, terrorist activity or trading halts. Thus, the valuation of the Fund’s securities may differ significantly from exchange prices, and such differences could be material.
At March 31, 2021, no securities were valued using fair value methods (other than securities valued using prices supplied by independent pricing services, broker-dealers or using a third party insurance industry pricing model).
B. Investment Income and Transactions
Dividend income is recorded on the ex-dividend date, except that certain dividends from foreign securities where the ex-dividend date may have passed are recorded as soon as the Fund becomes aware of the ex-dividend data in the exercise of reasonable diligence.
Interest income, including interest on income-bearing cash accounts, is recorded on the accrual basis. Dividend and interest income are reported net of unrecoverable foreign taxes withheld at the applicable country rates and net of income accrued on defaulted securities.
Interest and dividend income payable by delivery of additional shares is reclassified as PIK (payment-in-kind) income upon receipt and is included in interest and dividend income, respectively.
36 Pioneer Emerging Markets Equity Fund | Semiannual Report | 3/31/21
Security transactions are recorded as of trade date. Gains and losses on sales of investments are calculated on the identified cost method for both financial reporting and federal income tax purposes.
C. Foreign Currency Translation
The books and records of the Fund are maintained in U.S. dollars. Amounts denominated in foreign currencies are translated into U.S. dollars using current exchange rates.
Net realized gains and losses on foreign currency transactions, if any, represent, among other things, the net realized gains and losses on foreign currency exchange contracts, disposition of foreign currencies and the difference between the amount of income accrued and the U.S. dollars actually received. Further, the effects of changes in foreign currency exchange rates on investments are not segregated on the Statement of Operations from the effects of changes in the market prices of those securities, but are included with the net realized and unrealized gain or loss on investments.
D. Federal Income Taxes
It is the Fund’s policy to comply with the requirements of the Internal Revenue Code applicable to regulated investment companies and to distribute all of its net taxable income and net realized capital gains, if any, to its shareowners. Therefore, no provision for federal income taxes is required. As of September 30, 2020, the Fund did not accrue any interest or penalties with respect to uncertain tax positions, which, if applicable, would be recorded as an income tax expense on the Statement of Operations. Tax returns filed within the prior three years remain subject to examination by federal and state tax authorities.
In determining the daily net asset value, the Fund estimates the reserve for the repatriation of taxes, if any, associated with its investments in certain countries. The estimated reserve for capital gains is based on the net unrealized appreciation on certain portfolio securities, the holding period of such securities and the related tax rates, tax loss carryforwards (if applicable) and other such factors. As of September 30, 2020, the Fund had accrued $4,679 in reserve for repatriation taxes related to capital gains.
The amount and character of income and capital gain distributions to shareowners are determined in accordance with federal income tax rules, which may differ from U.S. GAAP. Distributions in excess of net investment income or net realized gains are temporary over distributions for financial statement purposes resulting from differences in the recognition or classification of income or distributions for financial statement and tax
Pioneer Emerging Markets Equity Fund | Semiannual Report | 3/31/21 37
purposes. Capital accounts within the financial statements are adjusted for permanent book/tax differences to reflect tax character, but are not adjusted for temporary differences.
The tax character of current year distributions payable will be determined at the end of the current taxable year. The tax character of distributions paid during the year ended September 30, 2020 was as follows:
| 2020 | |
| Distributions paid from: | |
Ordinary income | $67,138 |
| Total | $67,138 |
The following shows the components of distributable earnings (losses) on a federal income tax basis at September 30, 2020:
| 2020 | ||||
| Distributable earnings: | ||||
Undistributed ordinary income | $ | 51,822 | ||
Capital loss carryforward | (543,180 | ) | ||
Unrealized appreciation | 1,689,804 | |||
| Total | $ | 1,198,446 | ||
The difference between book-basis and tax-basis net unrealized appreciation is attributable to the tax deferral of losses on wash sales and adjustments relating to passive foreign investment companies.
E. Fund Shares
The Fund records sales and repurchases of its shares as of trade date. The Distributor earned $268 in underwriting commissions on the sale of Class A shares during the six months ended March 31, 2021.
F. Class Allocations
Income, common expenses and realized and unrealized gains and losses are calculated at the Fund level and allocated daily to each class of shares based on its respective percentage of adjusted net assets at the beginning of the day.
Distribution fees are calculated based on the average daily net asset value attributable to Class A and Class C shares of the Fund, respectively (see Note 5). Class Y shares do not pay distribution fees. All expenses and fees paid to the Fund’s transfer agent for its services are allocated among the classes of shares based on the number of accounts in each class and the ratable allocation of related out-of-pocket expenses (see Note 4).
38 Pioneer Emerging Markets Equity Fund | Semiannual Report | 3/31/21
Distributions to shareowners are recorded as of the ex-dividend date. Distributions paid by the Fund with respect to each class of shares are calculated in the same manner and at the same time, except that net investment income dividends to Class A, Class C and Class Y shares can reflect different transfer agent and distribution expense rates.
G. Risks
The value of securities held by the Fund may go up or down, sometimes rapidly or unpredictably, due to general market conditions, such as real or perceived adverse economic, political or regulatory conditions, recessions, the spread of infectious illness or other public health issues, inflation, changes in interest rates, lack of liquidity in the bond markets or adverse investor sentiment. In the past several years, financial markets have experienced increased volatility, depressed valuations, decreased liquidity and heightened uncertainty. These conditions may continue, recur, worsen or spread. A general rise in interest rates could adversely affect the price and liquidity of fixed-income securities and could also result in increased redemptions from the Fund.
At times, the Fund’s investments may represent industries or industry sectors that are interrelated or have common risks, making the Fund more susceptible to any economic, political, or regulatory developments or other risks affecting those industries and sectors. The Fund’s investments in foreign markets and countries with limited developing markets may subject the Fund to a greater degree of risk than investments in a developed market. These risks include disruptive political or economic conditions and the imposition of adverse governmental laws or currency exchange restrictions.
To the extent that the fund invests from time to time more than 25% of its assets in issuers organized or located in a particular geographic region, including but not limited to issuers organized or located in China and other developing market Asia-Pacific countries, the fund may be particularly affected by adverse securities markets, exchange rates and social, political, regulatory or economic events which may occur in those regions.
Markets in China and other Asian countries are relatively new and undeveloped. China’s economic health is largely dependent upon exports, and may be dependent upon the economies of other Asian countries. Investments in Chinese and other Asian issuers could be adversely affected by changes in government policies, or trade or political disputes with major trading partners, including the U.S. China’s growing trade surplus with the
Pioneer Emerging Markets Equity Fund | Semiannual Report | 3/31/21 39
U.S. has given rise to trade disputes and the imposition of tariffs, which could adversely affect China’s economy. An economic slowdown in China could adversely affect economies of other emerging market countries that trade with China, as well as companies operating in those countries. Economies of Asian countries and Asian issuers could be adversely affected by regional security threats.
With the increased use of technologies such as the Internet to conduct business, the Fund is susceptible to operational, information security and related risks. While the Fund’s Adviser has established business continuity plans in the event of, and risk management systems to prevent, limit or mitigate, such cyber-attacks, there are inherent limitations in such plans and systems, including the possibility that certain risks have not been identified. Furthermore, the Fund cannot control the cybersecurity plans and systems put in place by service providers to the Fund such as Brown Brothers Harriman & Co., the Fund’s custodian and accounting agent, and DST Asset Manager Solutions, Inc., the Fund’s transfer agent. In addition, many beneficial owners of Fund shares hold them through accounts at broker-dealers, retirement platforms and other financial market participants over which neither the Fund nor the Adviser exercises control. Each of these may in turn rely on service providers to them, which are also subject to the risk of cyber-attacks. Cybersecurity failures or breaches at the Adviser or the Fund’s service providers or intermediaries have the ability to cause disruptions and impact business operations, potentially resulting in financial losses, interference with the Fund’s ability to calculate its net asset value, impediments to trading, the inability of Fund shareowners to effect share purchases, redemptions or exchanges or receive distributions, loss of or unauthorized access to private shareowner information and violations of applicable privacy and other laws, regulatory fines, penalties, reputational damage, or additional compliance costs. Such costs and losses may not be covered under any insurance. In addition, maintaining vigilance against cyber-attacks may involve substantial costs over time, and system enhancements may themselves be subject to cyber-attacks.
COVID-19
The respiratory illness COVID-19 caused by a novel coronavirus has resulted in a global pandemic and major disruption to economies and markets around the world, including the United States. Global financial markets have experienced extreme volatility and severe losses, and trading in many instruments has been disrupted. Liquidity for many instruments has been
40 Pioneer Emerging Markets Equity Fund | Semiannual Report | 3/31/21
greatly reduced for periods of time. Some interest rates are very low and in some cases yields are negative. Some sectors of the economy and individual issuers have experienced particularly large losses. These circumstances may continue for an extended period of time, and may continue to affect adversely the value and liquidity of the Fund’s investments. The ultimate economic fallout from the pandemic, and the long-term impact on economies, markets, industries and individual issuers, are not known. Governments and central banks, including the Federal Reserve in the U.S., have taken extraordinary and unprecedented actions to support local and global economies and the financial markets. These actions have resulted in significant expansion of public debt, including in the U.S. The impact of these measures, and whether they will be effective to mitigate the economic and market disruption, will not be known for some time. The consequences of high public debt, including its future impact on the economy and securities markets, likewise may not be known for some time.
The Fund’s prospectus contains unaudited information regarding the Fund’s principal risks. Please refer to that document when considering the Fund’s principal risks.
2. Management Agreement
The Adviser manages the Fund’s portfolio. Management fees are calculated daily and paid monthly at the annual rate of 0.80% of the fund’s average daily net assets up to $1 billion and 0.75% of the fund’s average daily net assets over $1 billion. For the six months ended March 31, 2021, the effective management fee (excluding waivers and/or assumption of expenses) was equivalent to 0.80% (annualized) of the Fund’s average daily net assets.
The Adviser has contractually agreed to limit ordinary operating expenses (ordinary operating expenses means all fund expenses other than extraordinary expenses, such as litigation, taxes, brokerage commissions and acquired fund fees and expenses) of the Fund to the extent required to reduce Fund expenses to 1.30%, 2.05% and 0.99% of the average daily net assets attributable to Class A, Class C and Class Y shares, respectively. These expense limitations are in effect through February 1, 2022. There can be no assurance that the Adviser will extend the expense limitation agreement for a class of shares beyond the date referred to above. Fees waived and expenses reimbursed during the six months ended March 31, 2021 are reflected on the Statement of Operations.
Pioneer Emerging Markets Equity Fund | Semiannual Report | 3/31/21 41
In addition, under the management and administration agreements, certain other services and costs, including accounting, regulatory reporting and insurance premiums, are paid by the Fund as administrative reimbursements. Included in “Due to affiliates” reflected on the Statement of Assets and Liabilities is $13,658 in management fees, administrative costs and certain other reimbursements payable to the Adviser at March 31, 2021.
3. Compensation of Trustees and Officers
The Fund pays an annual fee to its Trustees. The Adviser reimburses the Fund for fees paid to the Interested Trustees. The Fund does not pay any salary or other compensation to its officers. For the six months ended March 31, 2021, the Fund paid $3,378 in Trustees’ compensation, which is reflected on the Statement of Operations as Trustees’ fees. At March 31, 2021, the Fund had a payable for Trustees’ fees on its Statement of Assets and Liabilities of $48.
4. Transfer Agent
DST Asset Manager Solutions, Inc. serves as the transfer agent to the Fund at negotiated rates. Transfer agent fees and payables shown on the Statement of Operations and the Statement of Assets and Liabilities, respectively, include sub-transfer agent expenses incurred through the Fund’s omnibus relationship contracts.
In addition, the Fund reimbursed the transfer agent for out-of-pocket expenses incurred by the transfer agent related to shareowner communications activities such as proxy and statement mailings, and outgoing phone calls. For the six months ended March 31, 2021, such out-of-pocket expenses by class of shares were as follows:
| Shareowner Communications: | |
Class A | $498 |
Class C | 168 |
Class Y | 9 |
| Total | $675 |
5. Distribution Plan
The Fund has adopted a distribution plan (the “Plan”) pursuant to Rule 12b-1 of the Investment Company Act of 1940 with respect to its Class A and Class C shares. Pursuant to the Plan, the Fund pays the Distributor 0.25% of the average daily net assets attributable to Class A shares as compensation for personal services and/or account maintenance services or distribution services with regard to Class A shares. Pursuant to the Plan, the Fund also pays the Distributor 1.00% of the average daily net assets attributable to Class C shares. The fee for Class C shares consists of a 0.25%
42 Pioneer Emerging Markets Equity Fund | Semiannual Report | 3/31/21
service fee and a 0.75% distribution fee paid as compensation for personal services and/or account maintenance services or distribution services with regard to Class C shares. Pursuant to the Plan, the Fund further pays for the distribution services. Included in “Due to affiliates” reflected on the Statement of Assets and Liabilities is $866 in distribution fees payable to the Distributor at March 31, 2021.
In addition, redemptions of Class A and Class C shares may be subject to a contingent deferred sales charge (“CDSC”). A CDSC of 1.00% may be imposed on redemptions of certain net asset value purchases of Class A shares within 12 months of purchase. Redemptions of Class C shares within 12 months of purchase are subject to a CDSC of 1.00%, based on the lower of cost or market value of shares being redeemed. Shares purchased as part of an exchange remain subject to any CDSC that applied to the original purchase of those shares. There is no CDSC for Class Y shares. Proceeds from the CDSCs are paid to the Distributor. For the six months ended March 31, 2021, CDSCs in the amount of $0 were paid to the Distributor.
Pioneer Emerging Markets Equity Fund | Semiannual Report | 3/31/21 43
Trustees
Thomas J. Perna, Chairman
John E. Baumgardner, Jr.
Diane Durnin
Benjamin M. Friedman
Lisa M. Jones
Craig C. MacKay**
Lorraine H. Monchak
Marguerite A. Piret
Fred J. Ricciardi
Kenneth J. Taubes
Thomas J. Perna, Chairman
John E. Baumgardner, Jr.
Diane Durnin
Benjamin M. Friedman
Lisa M. Jones
Craig C. MacKay**
Lorraine H. Monchak
Marguerite A. Piret
Fred J. Ricciardi
Kenneth J. Taubes
Officers
Lisa M. Jones, President and
Chief Executive Officer
Anthony J. Koenig, Jr., Treasurer
and Chief Financial and
Accounting Officer
Christopher J. Kelley, Secretary and
Chief Legal Officer
Chief Executive Officer
Anthony J. Koenig, Jr., Treasurer
and Chief Financial and
Accounting Officer
Christopher J. Kelley, Secretary and
Chief Legal Officer
Amundi Asset Management US, Inc.
Custodian and Sub-Administrator
Brown Brothers Harriman & Co.
Principal Underwriter
Amundi Distributor US, Inc.
Legal Counsel
Morgan, Lewis & Bockius LLP
Transfer Agent
DST Asset Manager Solutions, Inc.
Custodian and Sub-Administrator
Brown Brothers Harriman & Co.
Principal Underwriter
Amundi Distributor US, Inc.
Legal Counsel
Morgan, Lewis & Bockius LLP
Transfer Agent
DST Asset Manager Solutions, Inc.
Proxy Voting Policies and Procedures of the Fund are available without charge, upon request, by calling our toll free number (1-800-225-6292). Information regarding how the Fund voted proxies relating to portfolio securities during the most recent 12-month period ended June 30 is publicly available to shareowners at www.amundi.com/us. This information is also available on the Securities and Exchange Commission’s web site at www.sec.gov.
* | Effective April 30, 2021, Mark E. Bradley is no longer Treasurer of the Fund. |
** | Craig C. MacKay was appointed as a Trustee effective March 22, 2021. |
44 Pioneer Emerging Markets Equity Fund | Semiannual Report | 3/31/21
How to Contact Amundi
We are pleased to offer a variety of convenient ways for you to contact us for assistance or information.
| Call us for: | |
Account Information, including existing accounts, | |
new accounts, prospectuses, applications | |
and service forms | 1-800-225-6292 |
FactFoneSM for automated fund yields, prices, | |
account information and transactions | 1-800-225-4321 |
| Retirement plans information | 1-800-622-0176 |
Write to us:
Amundi
P.O. Box 219427
Kansas City, MO 64121-9427
Amundi
P.O. Box 219427
Kansas City, MO 64121-9427
| Our toll-free fax | 1-800-225-4240 |
| Our internet e-mail address | us.askamundi@amundi.com |
(for general questions about Amundi only) | |
| Visit our web site: www.amundi.com/us | |
This report must be preceded or accompanied by a prospectus.
The Fund files a complete schedule of portfolio holdings with the Securities and Exchange Commission for the first and third quarters of each fiscal year as an exhibit to its reports on Form N-PORT. Shareholders may view the filed Form N-PORT by visiting the Commission’s web site at https://www.sec.gov.

Amundi Asset Management US, Inc.
60 State Street
Boston, MA 02109
www.amundi.com/us
Securities offered through Amundi Distributor US, Inc.,
60 State Street, Boston, MA 02109
Underwriter of Pioneer Mutual Funds, Member SIPC
© 2021 Amundi Asset Management US, Inc. 32079-01-0521
ITEM 2. CODE OF ETHICS.
(a) Disclose whether, as of the end of the period covered by the report, the registrant has adopted a code of ethics that applies to the registrant’s principal executive officer, principal financial officer, principal accounting officer or controller, or persons performing similar functions, regardless of whether these individuals are employed by the registrant or a third party. If the registrant has not adopted such a code of ethics, explain why it has not done so.
The registrant has adopted, as of the end of the period covered by this report, a code of ethics that applies to the registrant’s principal executive officer, principal financial officer, principal accounting officer and controller.
(b) For purposes of this Item, the term “code of ethics” means written standards that are reasonably designed to deter wrongdoing and to promote:
(1) Honest and ethical conduct, including the ethical handling of actual or apparent conflicts of interest between personal and professional relationships;
(2) Full, fair, accurate, timely, and understandable disclosure in reports and documents that a registrant files with, or submits to, the Commission and in other public communications made by the registrant;
(3) Compliance with applicable governmental laws, rules, and regulations;
(4) The prompt internal reporting of violations of the code to an appropriate person or persons identified in the code; and
(5) Accountability for adherence to the code.
(c) The registrant must briefly describe the nature of any amendment, during the period covered by the report, to a provision of its code of ethics that applies to the registrant’s principal executive officer, principal financial officer, principal accounting officer or controller, or persons performing similar functions, regardless of whether these individuals are employed by the registrant or a third party, and that relates to any element of the code of ethics definition enumerated in paragraph (b) of this Item. The registrant must file a copy of any such amendment as an exhibit pursuant to Item 10(a), unless the registrant has elected to satisfy paragraph (f) of this Item by posting its code of ethics on its website pursuant to paragraph (f)(2) of this Item, or by undertaking to provide its code of ethics to any person without charge, upon request, pursuant to paragraph (f)(3) of this Item.
The registrant has made no amendments to the code of ethics during the period covered by this report.
(d) If the registrant has, during the period covered by the report, granted a waiver, including an implicit waiver, from a provision of the code of ethics to the registrant’s principal executive officer, principal financial officer, principal accounting officer or controller, or persons performing similar functions, regardless of whether these individuals are employed by the registrant or a third party, that relates to one or more of the items set forth in paragraph (b) of this Item, the registrant must briefly describe the nature of the waiver, the name of the person to whom the waiver was granted, and the date of the waiver.
Not applicable.
(e) If the registrant intends to satisfy the disclosure requirement under paragraph (c) or (d) of this Item regarding an amendment to, or a waiver from, a provision of its code of ethics that applies to the registrant’s principal executive officer, principal financial officer, principal accounting officer or controller, or persons performing similar functions and that relates to any element of the code of ethics definition
enumerated in paragraph (b) of this Item by posting such information on its Internet website, disclose the registrant’s Internet address and such intention.
Not applicable.
(f) The registrant must:
(1) File with the Commission, pursuant to Item 12(a)(1), a copy of its code of ethics that applies to the registrant’s principal executive officer, principal financial officer, principal accounting officer or controller, or persons performing similar functions, as an exhibit to its annual report on this Form N-CSR (see attachment);
(2) Post the text of such code of ethics on its Internet website and disclose, in its most recent report on this Form N-CSR, its Internet address and the fact that it has posted such code of ethics on its Internet website; or
(3) Undertake in its most recent report on this Form N-CSR to provide to any person without charge, upon request, a copy of such code of ethics and explain the manner in which such request may be made. See Item 10(2)
ITEM 3. AUDIT COMMITTEE FINANCIAL EXPERT.
(a) (1) Disclose that the registrant’s board of trustees has determined that the registrant either:
(i) Has at least one audit committee financial expert serving on its audit committee; or
(ii) Does not have an audit committee financial expert serving on its audit committee.
The registrant’s Board of Trustees has determined that the registrant has at least one audit committee financial expert.
(2) If the registrant provides the disclosure required by paragraph (a)(1)(i) of this Item, it must disclose the name of the audit committee financial expert and whether that person is “independent.” In order to be considered “independent” for purposes of this Item, a member of an audit committee may not, other than in his or her capacity as a member of the audit committee, the board of trustees, or any other board committee:
(i) Accept directly or indirectly any consulting, advisory, or other compensatory fee from the issuer; or
(ii) Be an “interested person” of the investment company as defined in Section 2(a)(19) of the Act (15 U.S.C. 80a-2(a)(19)).
Mr. Fred J. Ricciardi, an independent trustee, is such an audit committee financial expert.
(3) If the registrant provides the disclosure required by paragraph (a)(1) (ii) of this Item, it must explain why it does not have an audit committee financial expert.
Not applicable.
ITEM 4. PRINCIPAL ACCOUNTANT FEES AND SERVICES.
(a) Disclose, under the caption AUDIT FEES, the aggregate fees billed for each of the last two fiscal years for professional services rendered by the principal accountant for the audit of the registrant’s annual financial statements or services that are normally provided by the accountant in connection with statutory and regulatory filings or engagements for those fiscal years.
N/A
(b) Disclose, under the caption AUDIT-RELATED FEES, the aggregate fees billed in each of the last two fiscal years for assurance and related services by the principal accountant that are reasonably related to the performance of the audit of the registrant’s financial statements and are not reported under paragraph (a) of this Item. Registrants shall describe the nature of the services comprising the fees disclosed under this category.
N/A
(c) Disclose, under the caption TAX FEES, the aggregate fees billed in each of the last two fiscal years for professional services rendered by the principal accountant for tax compliance, tax advice, and tax planning. Registrants shall describe the nature of the services comprising the fees disclosed under this category.
N/A
(d) Disclose, under the caption ALL OTHER FEES, the aggregate fees billed in each of the last two fiscal years for products and services provided by the principal accountant, other than the services reported in paragraphs (a) through (c) of this Item. Registrants shall describe the nature of the services comprising the fees disclosed under this category.
N/A
(e) (1) Disclose the audit committee’s pre-approval policies and procedures described in paragraph (c)(7) of Rule 2-01 of Regulation S-X.
PIONEER FUNDS
APPROVAL OF AUDIT, AUDIT-RELATED, TAX AND OTHER SERVICES
PROVIDED BY THE INDEPENDENT AUDITOR
SECTION I - POLICY PURPOSE AND APPLICABILITY
The Pioneer Funds recognize the importance of maintaining the independence of their outside auditors. Maintaining independence is a shared responsibility involving Amundi Asset Management, Inc, the audit committee and the independent auditors.
The Funds recognize that a Fund’s independent auditors: 1) possess knowledge of the Funds, 2) are able to incorporate certain services into the scope of the audit, thereby avoiding redundant work, cost and disruption of Fund personnel and processes, and 3) have expertise that has value to the Funds. As a result, there are situations where it is desirable to use the Fund’s independent auditors for services in addition to the annual audit and where the potential for conflicts of interests are minimal. Consequently, this policy, which is intended to comply with Rule 210.2-01(C)(7), sets forth guidelines and procedures to be followed by the Funds when retaining the independent audit firm to perform audit, audit-related tax and other services under those circumstances, while also maintaining independence.
Approval of a service in accordance with this policy for a Fund shall also constitute approval for any other Fund whose pre-approval is required pursuant to Rule 210.2-01(c)(7)(ii).
In addition to the procedures set forth in this policy, any non-audit services that may be provided consistently with Rule 210.2-01 may be approved by the Audit Committee itself and any pre-approval that may be waived in accordance with Rule 210.2-01(c)(7)(i)(C) is hereby waived.
Selection of a Fund’s independent auditors and their compensation shall be determined by the Audit Committee and shall not be subject to this policy.
| SECTION II - POLICY | ||
SERVICE CATEGORY | SERVICE CATEGORY DESCRIPTION | SPECIFIC PRE-APPROVED SERVICE SUBCATEGORIES |
I. AUDIT SERVICES | Services that are directly | o Accounting research assistance |
related to performing the | o SEC consultation, registration | |
independent audit of the Funds | statements, and reporting | |
o Tax accrual related matters | ||
o Implementation of new accounting standards | ||
o Compliance letters (e.g. rating agency letters) | ||
o Regulatory reviews and assistance | ||
regarding financial matters | ||
o Semi-annual reviews (if requested) | ||
o Comfort letters for closed end offerings | ||
II. AUDIT-RELATED | Services which are not | o AICPA attest and agreed-upon procedures |
SERVICES | prohibited under Rule | o Technology control assessments |
210.2-01(C)(4) (the “Rule”) | o Financial reporting control assessments | |
and are related extensions of | o Enterprise security architecture | |
the audit services support the | assessment | |
audit, or use the knowledge/expertise | ||
gained from the audit procedures as a | ||
foundation to complete the project. | ||
In most cases, if the Audit-Related | ||
Services are not performed by the | ||
Audit firm, the scope of the Audit | ||
Services would likely increase. | ||
The Services are typically well-defined | ||
and governed by accounting | ||
professional standards (AICPA, | ||
SEC, etc.) | ||
AUDIT COMMITTEE APPROVAL POLICY | AUDIT COMMITTEE REPORTING POLICY | |
| o “One-time” pre-approval | o A summary of all such | |
| for the audit period for all | services and related fees | |
| pre-approved specific service | reported at each regularly | |
| subcategories. Approval of the | scheduled Audit Committee | |
| independent auditors as | meeting. | |
| auditors for a Fund shall | ||
| constitute pre approval for | ||
| these services. | ||
| o “One-time” pre-approval | o A summary of all such | |
| for the fund fiscal year within | services and related fees | |
| a specified dollar limit | (including comparison to | |
| for all pre-approved | specified dollar limits) | |
| specific service subcategories | reported quarterly. | |
| o Specific approval is | |
| needed to exceed the | |
| pre-approved dollar limit for | |
| these services (see general | |
| Audit Committee approval policy | |
| below for details on obtaining | |
| specific approvals) | |
| o Specific approval is | |
| needed to use the Fund’s | |
| auditors for Audit-Related | |
| Services not denoted as | |
| “pre-approved”, or | |
| to add a specific service | |
| subcategory as “pre-approved” | |
SECTION III - POLICY DETAIL, CONTINUED
SERVICE CATEGORY | SERVICE CATEGORY DESCRIPTION | SPECIFIC PRE-APPROVED SERVICE |
SUBCATEGORIES | ||
III. TAX SERVICES | Services which are not | o Tax planning and support |
| prohibited by the Rule, | o Tax controversy assistance | |
| if an officer of the Fund | o Tax compliance, tax returns, excise | |
| determines that using the | tax returns and support | |
| Fund’s auditor to provide | o Tax opinions | |
| these services creates | ||
| significant synergy in | ||
| the form of efficiency, | ||
| minimized disruption, or | ||
| the ability to maintain a | ||
| desired level of | ||
| confidentiality. | ||
| AUDIT COMMITTEE APPROVAL POLICY | AUDIT COMMITTEE REPORTING POLICY |
o “One-time” pre-approval | o A summary of |
for the fund fiscal year | all such services and |
within a specified dollar limit | related fees |
(including comparison | |
to specified dollar | |
limits) reported | |
quarterly. | |
o Specific approval is | |
| needed to exceed the | |
| pre-approved dollar limits for | |
| these services (see general | |
| Audit Committee approval policy | |
| below for details on obtaining | |
| specific approvals) | |
o Specific approval is | |
| needed to use the Fund’s | |
| auditors for tax services not | |
| denoted as pre-approved, or to | |
| add a specific service subcategory as | |
| “pre-approved” | |
SECTION III - POLICY DETAIL, CONTINUED
SERVICE CATEGORY | SERVICE CATEGORY DESCRIPTION | SPECIFIC PRE-APPROVED SERVICE |
SUBCATEGORIES | ||
IV. OTHER SERVICES | Services which are not | o Business Risk Management support |
| prohibited by the Rule, | o Other control and regulatory | |
A. SYNERGISTIC, | if an officer of the Fund | compliance projects |
UNIQUE QUALIFICATIONS | determines that using the | |
| Fund’s auditor to provide | ||
| these services creates | ||
| significant synergy in | ||
| the form of efficiency, | ||
| minimized disruption, | ||
| the ability to maintain a | ||
| desired level of | ||
| confidentiality, or where | ||
| the Fund’s auditors | ||
| posses unique or superior | ||
| qualifications to provide | ||
| these services, resulting | ||
| in superior value and | ||
| results for the Fund. | ||
AUDIT COMMITTEE APPROVAL POLICY | AUDIT COMMITTEE REPORTING POLICY |
o “One-time” pre-approval | o A summary of |
| for the fund fiscal year within | all such services and |
| a specified dollar limit | related fees |
(including comparison | |
to specified dollar | |
limits) reported | |
quarterly. | |
o Specific approval is | |
| needed to exceed the | |
| pre-approved dollar limits for | |
| these services (see general | |
| Audit Committee approval policy | |
| below for details on obtaining | |
| specific approvals) | |
o Specific approval is | |
| needed to use the Fund’s | |
| auditors for “Synergistic” or | |
| “Unique Qualifications” Other | |
| Services not denoted as | |
| pre-approved to the left, or to | |
| add a specific service | |
| subcategory as “pre-approved” | |
SECTION III - POLICY DETAIL, CONTINUED
SERVICE CATEGORY | SERVICE CATEGORY DESCRIPTION | SPECIFIC PROHIBITED SERVICE |
SUBCATEGORIES | ||
PROHIBITED SERVICES | Services which result | 1. Bookkeeping or other services |
| in the auditors losing | related to the accounting records or | |
| independence status | financial statements of the audit | |
| under the Rule. | client* | |
2. Financial information systems design | ||
| and implementation* | ||
3. Appraisal or valuation services, | ||
| fairness* opinions, or | ||
| contribution-in-kind reports | ||
4. Actuarial services (i.e., setting | ||
| actuarial reserves versus actuarial | ||
| audit work)* | ||
5. Internal audit outsourcing services* | ||
6. Management functions or human | ||
| resources | ||
7. Broker or dealer, investment | ||
| advisor, or investment banking services | ||
8. Legal services and expert services | ||
| unrelated to the audit | ||
9. Any other service that the Public | ||
| Company Accounting Oversight Board | ||
| determines, by regulation, is | ||
| impermissible | ||
AUDIT COMMITTEE APPROVAL POLICY | AUDIT COMMITTEE REPORTING POLICY |
o These services are not to be | o A summary of all |
| performed with the exception of the(*) | services and related |
| services that may be permitted | fees reported at each |
| if they would not be subject to audit | regularly scheduled |
| procedures at the audit client (as | Audit Committee meeting |
| defined in rule 2-01(f)(4)) level | will serve as continual |
| the firm providing the service. | confirmation that has |
not provided any | |
restricted services. |
GENERAL AUDIT COMMITTEE APPROVAL POLICY:
o For all projects, the officers of the Funds and the Fund’s auditors will each make an assessment to determine that any proposed projects will not impair independence.
o Potential services will be classified into the four non-restricted service categories and the “Approval of Audit, Audit-Related, Tax and Other Services” Policy above will be applied. Any services outside the specific pre-approved service subcategories set forth above must be specifically approved by the Audit Committee.
o At least quarterly, the Audit Committee shall review a report summarizing the services by service category, including fees, provided by the Audit firm as set forth in the above policy.
(2) Disclose the percentage of services described in each of paragraphs (b) through (d) of this Item that were approved by the audit committee pursuant to paragraph (c)(7)(i)(C) of Rule 2-01 of Regulation S-X.
N/A
(f) If greater than 50 percent, disclose the percentage of hours expended on the principal accountants engagement to audit the registrant’s financial statements for the most recent fiscal year that were attributed to work performed by persons other than the principal accountant’s full-time, permanent employees.
N/A
(g) Disclose the aggregate non-audit fees billed by the registrants accountant for services rendered to the registrant, and rendered to the registrants investment adviser (not including any sub-adviser whose role is primarily portfolio management and is subcontracted with or overseen by another investment adviser), and any entity controlling, controlled by, or under common control with the adviser that provides ongoing services to the registrant for each of the last two fiscal years of the registrant.
N/A
(h) Disclose whether the registrants audit committee of the board of trustees has considered whether the provision of non-audit services that were rendered to the registrants investment adviser (not including any subadviser whose role is primarily portfolio management and is subcontracted with or overseen by another investment adviser), and any entity controlling, controlled by, or under common control with the investment adviser that provides ongoing services to the registrant that were not pre-approved pursuant to paragraph (c)(7)(ii) of Rule 2-01 of Regulation S-X is compatible with maintaining the principal accountant’s independence.
The Fund’s audit committee of the Board of Trustees has considered whether the provision of non-audit services that were rendered to the Affiliates (as defined) that were not pre- approved pursuant to paragraph (c)(7)(ii) of Rule 2-01 of Regulation S-X is compatible with maintaining the principal accountant’s independence.
ITEM 5. AUDIT COMMITTEE OF LISTED REGISTRANTS
(a) If the registrant is a listed issuer as defined in Rule 10A-3 under the Exchange Act (17 CFR 240.10A-3), state whether or not the registrant has a separately-designated standing audit committee established in accordance with Section 3(a)(58)(A) of the Exchange Act (15 U.S.C. 78c(a)(58)(A)). If the registrant has such a committee, however designated, identify each committee member. If the entire board of directors is acting as the registrant’s audit committee as specified in Section 3(a)(58)(B) of the Exchange Act (15 U.S.C. 78c(a)(58)(B)), so state.
N/A
(b) If applicable, provide the disclosure required by Rule 10A-3(d) under the Exchange Act (17 CFR 240.10A-3(d)) regarding an exemption from the listing standards for audit committees.
N/A
ITEM 6. SCHEDULE OF INVESTMENTS.
File Schedule of Investments in securities of unaffiliated issuers as of the close of the reporting period as set forth in 210.1212 of Regulation S-X [17 CFR 210.12-12], unless the schedule is included as part of the report to shareholders filed under Item 1 of this Form.
Included in Item 1
ITEM 7. DISCLOSURE OF PROXY VOTING POLICIES AND PROCEDURES FOR CLOSED-END MANAGEMENT INVESTMENT COMPANIES.
A closed-end management investment company that is filing an annual report on this Form N-CSR must, unless it invests exclusively in non-voting securities, describe the policies and procedures that it uses to determine how to vote proxies relating to portfolio securities, including the procedures that the company uses when a vote presents a conflict between the interests of its shareholders, on the one hand, and those of the company’s investment adviser; principal underwriter; or any affiliated person (as defined in Section 2(a)(3) of the Investment Company Act of 1940 (15 U.S.C. 80a-2(a)(3)) and the rules thereunder) of the company, its investment adviser, or its principal underwriter, on the other. Include any policies and procedures of the company’s investment adviser, or any other third party, that the company uses, or that are used on the company’s behalf, to determine how to vote proxies relating to portfolio securities.
Not applicable to open-end management investment companies.
ITEM 8. PORTFOLIO MANAGERS OF CLOSED-END MANAGEMENT INVESTMENT COMPANIES.
(a) If the registrant is a closed-end management investment company that is filing an annual report on this Form N-CSR, provide the following information:
(1) State the name, title, and length of service of the person or persons employed by or associated with the registrant or an investment adviser of the registrant who are primarily responsible for the day-to-day management of the registrant’s portfolio (“Portfolio Manager”). Also state each Portfolio Manager’s business experience during the past 5 years.
Not applicable to open-end management investment companies.
ITEM 9. PURCHASES OF EQUITY SECURITIES BY CLOSED-END MANAGEMENT INVESTMENT COMPANY AND AFFILIATED PURCHASERS.
(a) If the registrant is a closed-end management investment company, in the following tabular format, provide the information specified in paragraph (b) of this Item with respect to any purchase made by or on behalf of the registrant or any affiliated purchaser, as defined in Rule 10b-18(a)(3) under the Exchange Act (17 CFR 240.10b-18(a)(3)), of shares or other units of any class of the registrant’s equity securities that is registered by the registrant pursuant to Section 12 of the Exchange Act (15 U.S.C. 781).
Not applicable to open-end management investment companies.
ITEM 10. SUBMISSION OF MATTERS TO A VOTE OF SECURITY HOLDERS.
Describe any material changes to the procedures by which shareholders may recommend nominees to the registrant’s board of directors, where those changes were implemented after the registrant last provided disclosure in response to the requirements of Item 407(c)(2)(iv) of Regulation S-R(17 CFR 229.407)(as required by Item 22(b)(15)) of Schedule 14A (17 CFR 240.14a-101), or this Item.
There have been no material changes to the procedures by which the shareholders may recommend nominees to the registrant’s board of directors since the registrant last provided disclosure in response to the requirements of Item 407(c)(2)(iv) of Regulation S-R of Schedule 14(A) in its definitive proxy statement, or this item.
ITEM 11. CONTROLS AND PROCEDURES.
(a) Disclose the conclusions of the registrant’s principal executive and principal financials officers, or persons performing similar functions, regarding the effectiveness of the registrant’s disclosure controls and procedures (as defined in Rule 30a-3(c) under the Act (17 CFR 270.30a-3(c))) as of a date within 90 days of the filing date of the report that includes the disclosure required by this paragraph, based on the evaluation of these controls and procedures required by Rule 30a-3(b) under the Act (17 CFR 270.30(a)-3(b) and Rules 13a-15(b) or 15d-15(b) under the Exchange Act (17 CFR 240.13a-15(b) or 240.15d-15(b)).
The registrant’s principal executive officer and principal financial officer have concluded that the registrant’s disclosure controls and procedures are effective based on the evaluation of these controls and procedures as of a date within 90 days of the filing date of this report.
(b) Disclose any change in the registrant’s internal control over financial reporting (as defined in Rule 30a-3(d) under the Act (17CFR 270.30a-3(d)) that occured during the second fiscal quarter of the period covered by this report that has materially affected, or is reasonably likely to materially affect, the registrant’s internal control over financial reporting.
There were no significant changes in the registrant’s internal control over financial reporting that occurred during the second fiscal quarter of the period covered by this report that have materially affected, or are reasonably likely to materially affect, the registrant’s internal control over financial reporting.
Item 12. Disclosure of Securities Lending Activities for Closed-End Management Investment Companies.
(a) If the registrant is a closed-end management investment company, provide the following dollar amounts of income and compensation related to the securities lending activities of the registrant during its most recent fiscal year:
N/A
(1) Gross income from securities lending activities;
N/A
(2) All fees and/or compensation for each of the following securities lending activities and related services: any share of revenue generated by the securities lending program paid to the securities lending agent(s) (revenue split); fees paid for cash collateral management services (including fees deducted from a pooled cash collateral reinvestment vehicle) that are not included in the revenue split; administrative fees that are not included in the revenue split; fees for indemnification that are not included in the revenue split; rebates paid to borrowers; and any other fees relating to the securities lending program that are not included in the revenue split, including a description of those other fees;
N/A
(3) The aggregate fees/compensation disclosed pursuant to paragraph (2); and
N/A
(4) Net income from securities lending activities (i.e., the dollar amount in paragraph (1) minus the dollar amount in paragraph (3)).
If a fee for a service is included in the revenue split, state that the fee is included in the revenue split.
N/A
(b) If the registrant is a closed-end management investment company, describe the services provided to the registrant by the securities lending agent in the registrants most recent fiscal year.
N/A
ITEM 13. EXHIBITS.
(a) File the exhibits listed below as part of this Form. Letter or number the exhibits in the sequence indicated.
SIGNATURES
[See General Instruction F]
Pursuant to the requirements of the Securities Exchange Act of 1934 and the Investment Company Act of 1940, the registrant has duly caused this report to be signed on its behalf by the undersigned, thereunto duly authorized.
(Registrant) Pioneer Series Trust XIV
By (Signature and Title)* /s/ Lisa M. Jones
Lisa M. Jones, President & Chief Executive Officer
Date June 4, 2021
Pursuant to the requirements of the Securities Exchange Act of 1934 and the Investment Company Act of 1940, this report has been signed below by the following persons on behalf of the registrant and in the capacities and on the dates indicated.
By (Signature and Title)* /s/ Lisa M. Jones
Lisa M. Jones, President & Chief Executive Officer
Date June 4, 2021
By (Signature and Title)* /s/ Anthony J. Koenig
Anthony J. Koenig, Jr., Managing Director, Chief Operations Officer & Treasurer of the Funds
Date June 4, 2021
* Print the name and title of each signing officer under his or her signature.