 Jean-Yves Dexmier Executive Chairman & CEO Steve Markowski, CFO August 2010 1 Exhibit 99.1 |
 This presentation contains forward-looking statements, such as references to our business prospects. These statements, including their underlying assumptions, are subject to risks and uncertainties and are not guarantees of future performance. Results may differ due to various factors such as the possibility that our efforts to control expenses may not be successful, that our efforts to increase revenue and improve gross margin may not succeed, that we may be unable to gain or maintain customer acceptance of our publisher solutions or ad backfill products, that existing and potential customers for our products may opt to work with, or favor the products of, others due to more favorable products or pricing terms, that we may be limited in our ability or unable to retain and grow our ad and customer base, and that we may be limited in our ability to, or be unable to, enhance our products or our network of distribution partners. Additional risks that could cause actual results to differ materially from those projected are discussed in our Quarterly Report on Form 10-Q for the quarter ended June 30, 2010, our Annual Report on Form 10-K for the year ended December 31, 2009, and other documents we file with the Securities and Exchange Commission from time to time (available at www.sec.gov). The statements presented in this presentation speak only as of today’s date. Please note that except as required by applicable law we undertake no obligation to revise or update publicly any forward-looking statements for any reason. 2 Safe Harbor |
 3 Non-GAAP Information This presentation includes non-GAAP financial information. LookSmart provides “non-GAAP net income (loss),” and “Operating Expense excluding impairment charges,” which are non-GAAP financial measures. Non-GAAP net income (loss) consists of net income (loss) before (a) income (loss) from discontinued operations; (b) impairment charges; and (c) share-based compensation expense. Non-GAAP Operating Expenses exclude impairment charges, as noted on Slide 14. The Company believes these non-GAAP financial measures provide important supplemental information to management and investors. These non-GAAP financial measures reflects an additional way of viewing aspects of the Company’s operations that the Company believes, when viewed with the GAAP results and the accompanying reconciliation to corresponding GAAP financial measures, provides useful information regarding factors and trends affecting the Company’s business and results of operations. For the non-GAAP financial measures non-GAAP net income (loss) and non-GAAP operating expenses, the adjustments provide management with information about LookSmart’s operating performance that enables comparison of its operating financial results in different reporting periods. Additionally, our management uses non-GAAP net income (loss) and non-GAAP operating expenses as supplemental measures in the evaluation of our business, and believes that non-GAAP net income (loss) and non-GAAP operating expenses provide visibility into our ability to meet our future capital expenditures and working capital requirements. These non-GAAP financial measures are used in addition to, and in conjunction with, results presented in accordance with GAAP and should not be relied upon to the exclusion of GAAP financial measures. Management strongly encourages investors to review the Company’s consolidated financial statements in their entirety and to not rely on any single financial measure. Because non-GAAP financial measures are not standardized, it may not be possible to compare these financial measures with other companies’ non-GAAP financial measures having the same or similar names. In addition, the Company expects to continue to incur expenses similar to the non-GAAP adjustments described above, in particular stock based compensation expense, and exclusion of these items from the Company’s non-GAAP measures should not be construed as an inference that these costs are unusual, infrequent or non-recurring. Reconciliations of Non-GAAP information to GAAP information are provided elsewhere in this presentation. |
 4 Company Overview • LookSmart is an online search advertising network solutions company – Operates in the Tier 2 segment of the online paid search advertising market – Aggregates traffic from large number of publishers – Delivers traffic to a large number of advertisers • LookSmart at a glance – Founded in 1997; IPO in 1999 – 2009 Revenues: $52M – Employees: 65 – Headquarters in San Francisco; sales in NYC – Market capitalization: $26M (as of August 9 , 2010) th |
 5 Focus on Fundamentals • Strong Market Opportunity • Diversified customer base – Needs further expansion • Significant competitive advantage: AdCenter Platform • Must improve Traffic Delivery and Optimization • Must expand distribution network |
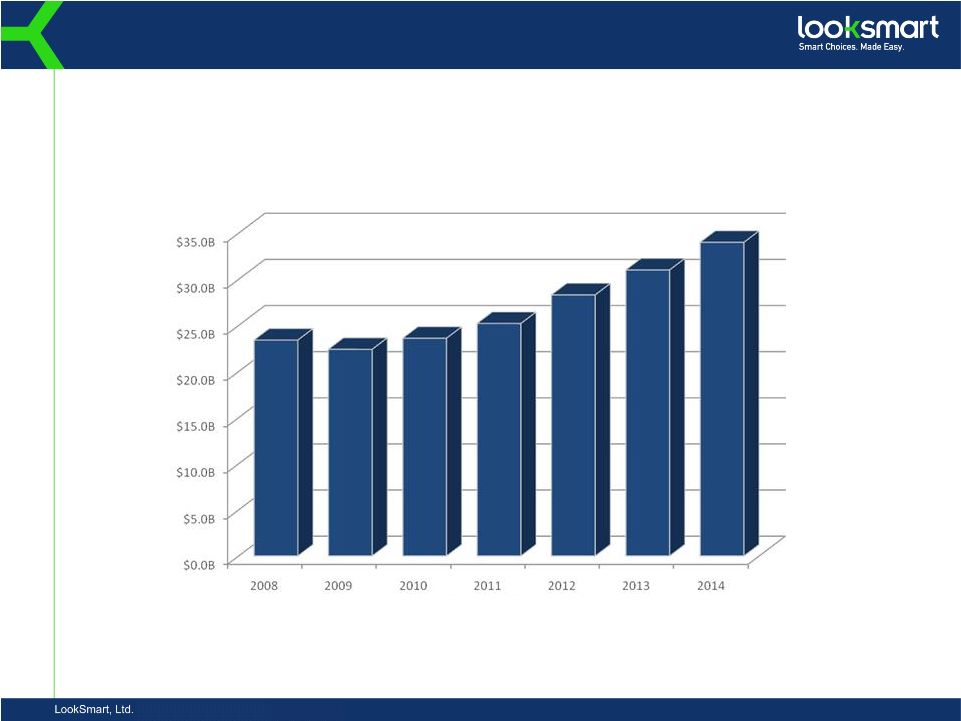 US Online Advertising Spend, 2008-2014 . Source: eMarketer, December 2009 6 We believe search advertising will grow as the largest segment in online advertising. $23.6B $22.4B $25.2B $28.3B $31.0B $34.0B $23.4B |
 7 A Diversified Customer Base • Intermediaries – Our Largest Category – Search Arbitrage reselling to large search engines – Backfill Customers with direct and arbitrage accounts • Direct Advertisers and Agencies – Transaction-based: CPA (cost-per-acquisition) – Page view-based: CPV (cost-per-view) • Self-service – Search Arbitrage – Transaction-based advertisers – Page view-based advertisers |
 8 The Ad Center Platform – A Competitive Advantage • Long-standing technology investment – Operating platform since 2002 – Developed with MSN and Ask.com until in-sourcing – Currently available for licensing on an opportunistic basis • A very strong feature set – Granular campaign setting similar to large search engine platforms – Unique granular setting of traffic selection within the network – Considered as a leading platform in the Tier 2 network segment • Self-service – Increased processing capability without degradation of latency – Linear scalability, currently processing about 2B queries/day |
 9 Optimizing Traffic Acquisition Costs (TAC) • Quest for quality drives focus on high quality traffic – High quality traffic can be acquired at higher TAC – Effort undertaken over the past year resulted in significant increase of TAC and resulting lower Gross Margin • Continuing focus on traffic quality – Separate LookSmart from the rest of the Tier 2 network market – Click rating techniques to measure individual click quality – Implementing these techniques in the Ad Center platform to automate click filtering and improve real time quality – Recently released “quality streaming” • TAC optimization algorithms – Implemented algorithms to optimize Traffic Acquisition Cost at the individual click level – Ad Network Gross Margin grew from 32% in Q1 to 42% in Q2 |
 10 Increasing “Throughput” Will Drive Revenues • Traffic Optimization – Deliver the “right” traffic at the “right” price to Search Arbitrage clients, CPA advertisers and Impression advertisers – As traffic delivery meets client performance, increase volume until reaching traffic limits – Stability and predictability are paramount • Methods – Developing data analytic techniques dedicated to each type of traffic – Real-time traffic selection based on specific account requirements – Price/volume optimization to deliver to customer performance metrics (profitability, CPA, unique page views, …) – Techniques under development – Further integration in the Ad Center platform • Human capital focused on analytics and traffic optimization |
 11 Planning Distribution Network Expansion • Focus on quality and customer requirements – Continuing quest for quality drives search for premium traffic – Optimize traffic for both page view and CPA customers • Traffic optimization will test distribution Network limits • Developing leading Distribution Network group – Requires dedicated human capital – Evaluating diversified traffic sources and media |
 12 Targeting Sustainable Profitability • Sustainable profitability will result from: – Continuing tight control of operating expenses – Continuing focus on Traffic Acquisition Costs (TAC) optimization in order to maintain Gross Margin levels – Controlled Revenue Growth through implementation of data analytic techniques under development |
 13 GAAP Operating Expenses * *Includes impairment charges of $9.8M in Q408, $0.2M in Q209, and $0.1M in Q409 |
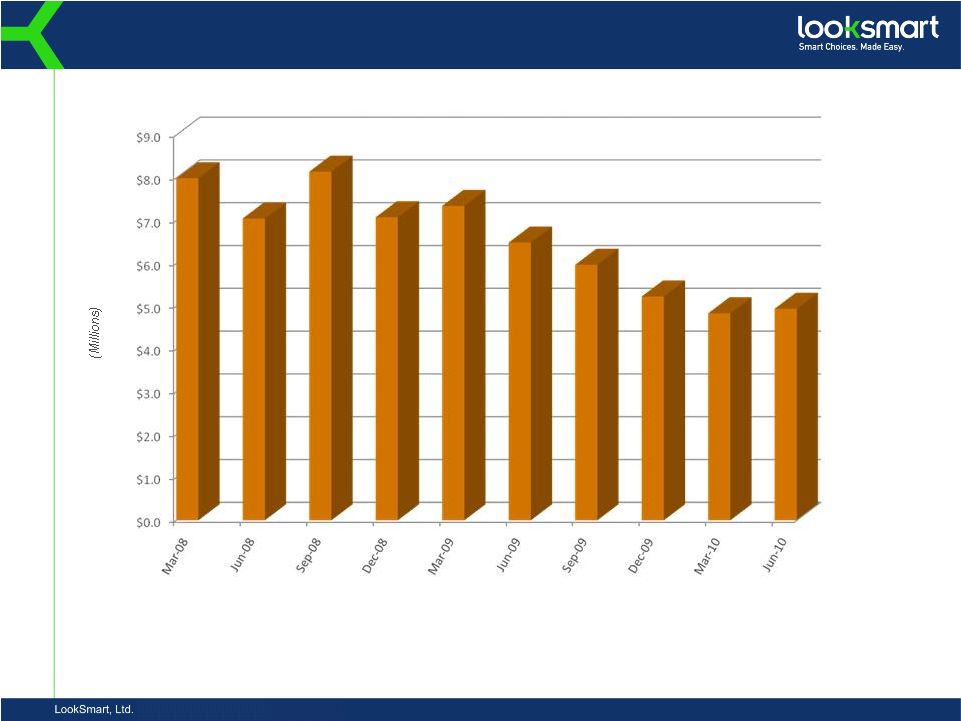 14 Non-GAAP Operating Expenses * *Excludes impairment charges of $9.8M in Q408, $0.2M in Q209, and $0.1M in Q409 Tight Control of Operating Expenses |
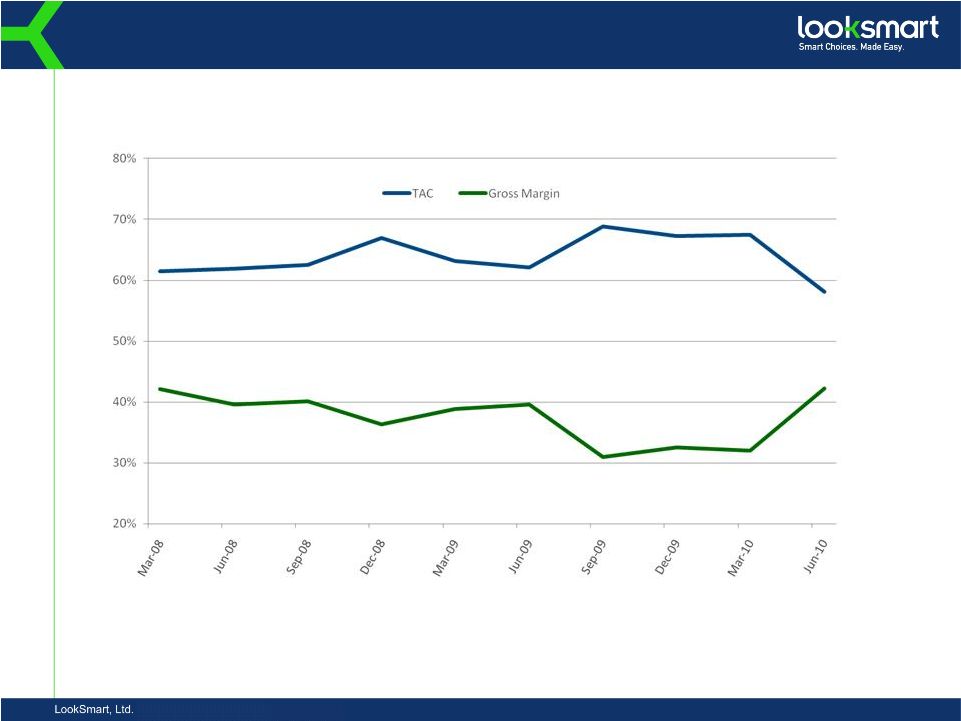 15 Gross Margin and TAC Optimizing TAC to materially improve Gross Margin |
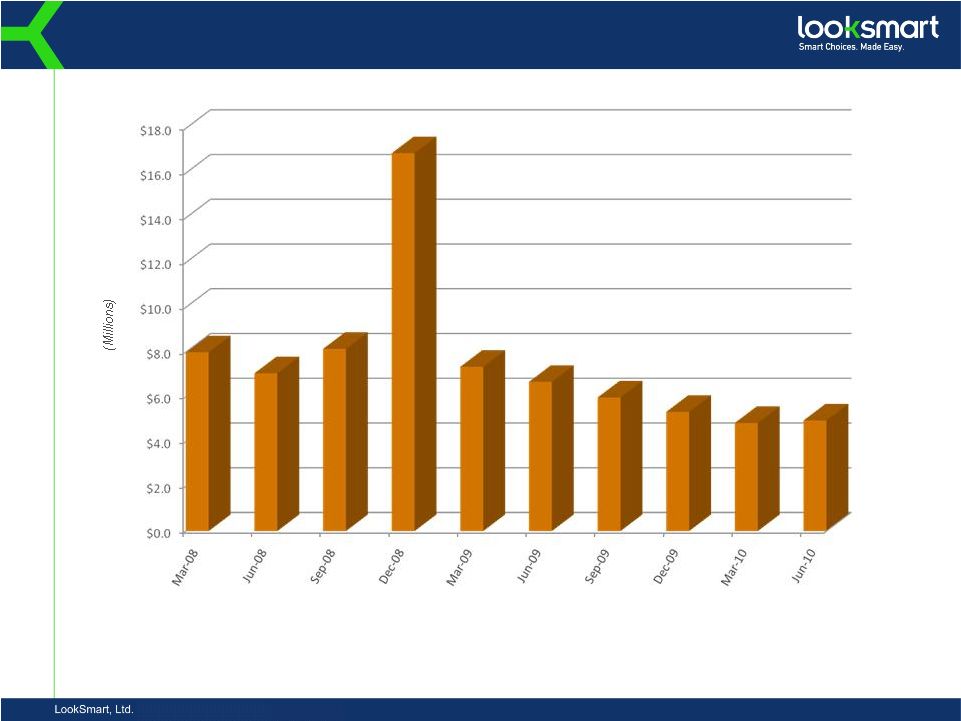
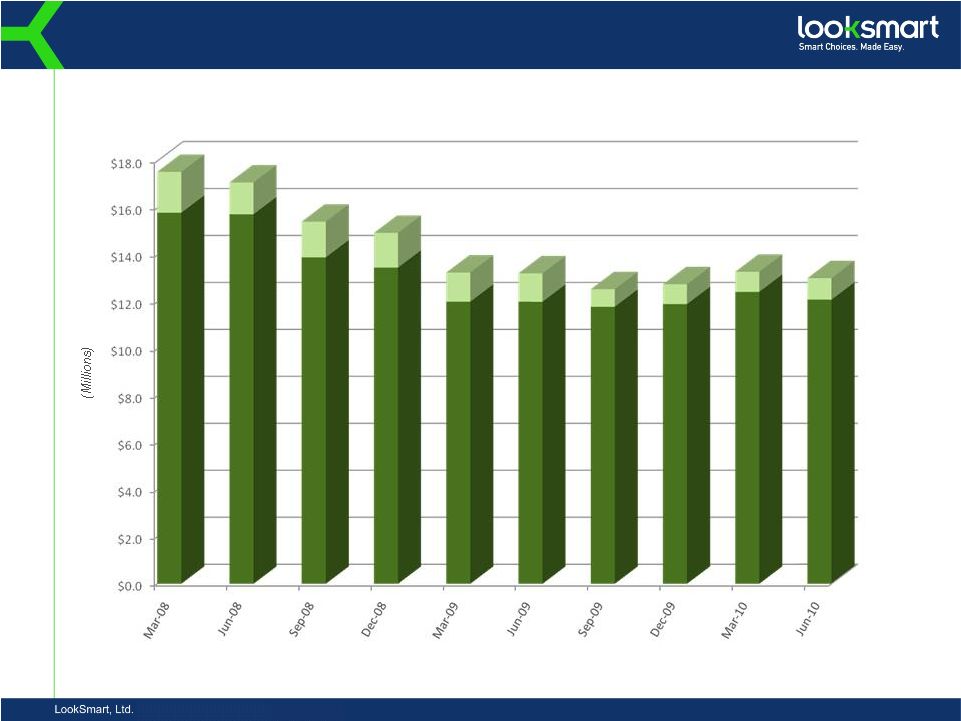 16 Revenue |
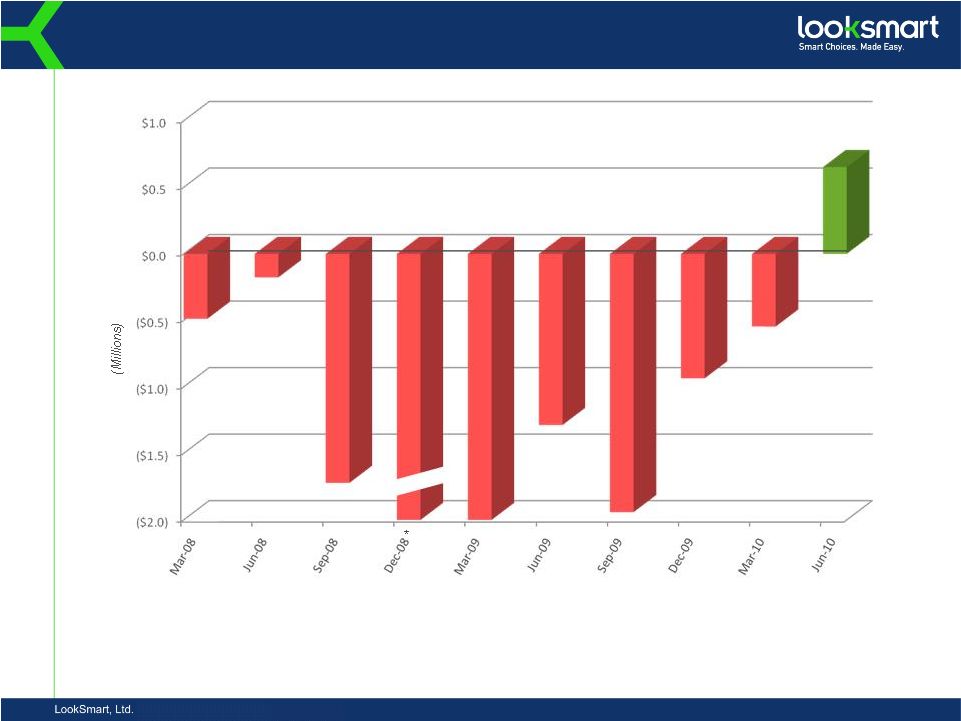 17 GAAP Net Income (Loss) * Dec-08 not drawn to scale ($12.45M loss) * |
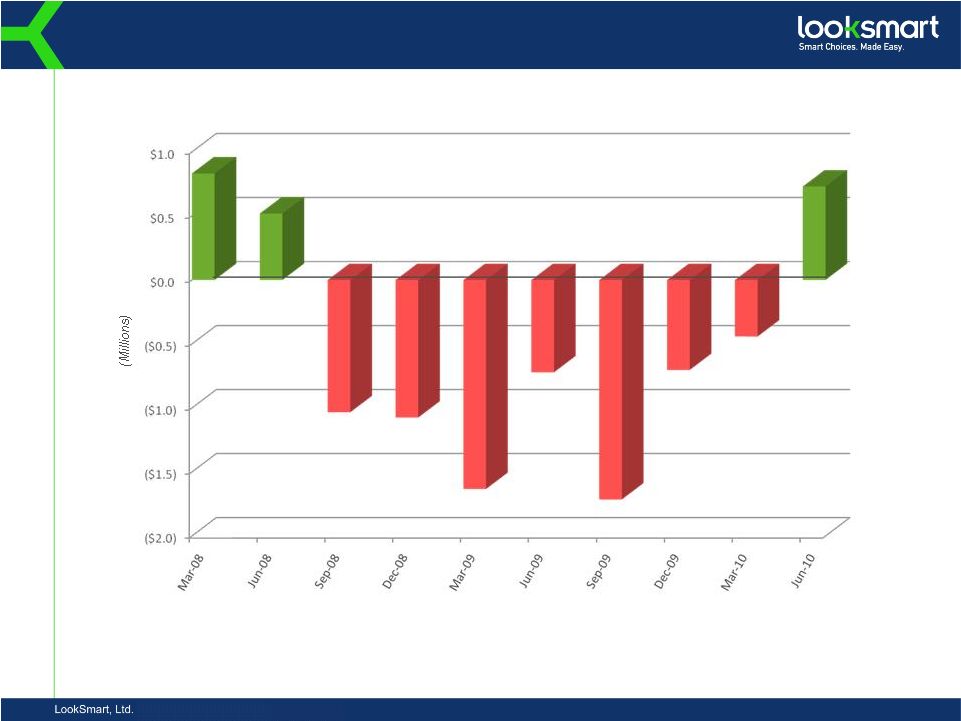 18 Non-GAAP Net Income (Loss) * * Without FAS 123R, impairment and discontinued operations Targeting Sustainable Non-GAAP Net Income |
   19 GAAP to Non-GAAP Reconciliations Operating Expenses Mar-08 Jun-08 Sep-08 Dec-08 FY2008 Mar-09 Jun-09 Sep-09 Dec-09 FY2009 Mar-10 Jun-10 GAAP Operating expenses 7,993 7,054 8,146 16,892 40,085 7,347 6,671 5,972 5,330 25,320 4,837 4,945 Less: Impairment charges - - - 9,810 9,810 - 180 - 100 280 - - Non-GAAP operating expenses 7,993 $7,054 $8,146 $7,082 $30,275 $7,347 $6,491 $5,972 $5,230 $25,040 $4,837 $4,945 Net Income Mar-08 Jun-08 Sep-08 Dec-08 FY2008 Mar-09 Jun-09 Sep-09 Dec-09 FY2009 Mar-10 Jun-10 GAAP net income (loss) (488) (176) (1,721) (12,449) (14,834) (2,040) (1,286) (1,941) (935) (6,202) (517) 652 Add: Stock based compensation from continuing operations 1,013 559 683 479 2,734 517 515 359 226 1,618 169 163 Add: (Income) loss from discontinued operations 307 136 5 1,073 1,521 (109) (130) (132) (93) (464) (93) (85) Add: Impairment charges - - - 9,810 9,810 - 180 - 100 280 - - Non-GAAP net income (loss) 832 $519 ($1,033) ($1,087) ($769) ($1,632) ($721) ($1,714) ($702) ($4,768) ($441) $730 |
 20 Tangible Net Worth TANGIBLE NET WORTH PER SHARE $1.43 June 30, 2010 Tangible Net Worth ASSETS Current assets: Cash and cash equivalents $ 24,457 Short-term investments 1,000 Total cash, cash equivalents and short-term investments 25,457 Trade accounts receivable, net 4,929 Prepaid expenses and other current assets 756 Total current assets 31,142 31,142 Property and equipment, net 3,873 3,873 Capitalized software and other assets, net 1,990 142 Total assets $ 37,005 LIABILITIES & STOCKHOLDERS' EQUITY Current liabilities: Trade accounts payable $ 2,821 Accrued liabilities 4,088 Deferred revenue and customer deposits 1,022 Current portion of long-term obligations 1,267 Total current liabilities 9,198 Capital lease and other obligations, net of current portion 1,398 Total liabilities 10,596 (10,596) Stockholders' equity: Common stock 17 Additional paid-in capital 261,337 Accumulated other comprehensive gain - Accumulated deficit (234,945) Total stockholders' equity 26,409 Total liabilities and stockholders' equity $ 37,005 Tangible net worth 24,561 Fully diluted shares outstanding at June 30, 2010 17,192 |
 21 Summary • PPC Search Advertising is a growing market • We are improving the business fundamentals to fully leverage our market opportunity • We have returned to profitability through a combination of tight expense control and gross margin improvement • We are now targeting sustained profitability |
 Questions 22 |