Wisconsin Electric Power Company PFD 6% (WELPM)
Filed: 28 Mar 23, 8:07am
UNITED STATES
SECURITIES AND EXCHANGE COMMISSION
WASHINGTON, D.C. 20549
SCHEDULE 14C INFORMATION
INFORMATION STATEMENT PURSUANT TO SECTION 14(C) OF THE
SECURITIES EXCHANGE ACT OF 1934
(AMENDMENT NO.)
Check the appropriate box:
| ☐ | Preliminary Information Statement |
| ☐ | Confidential, for Use of the Commission Only (as permitted by Rule 14c-5(d)(2)) |
| ☒ | Definitive Information Statement |
Wisconsin Electric Power Company
(NAME OF REGISTRANT AS SPECIFIED IN ITS CHARTER)
Payment of Filing Fee (Check the appropriate box)
| ☒ | No fee required. |
| ☐ | Fee computed on table below per Exchange Act Rules 14c-5(g) and 0-11. |
| 1) | Title of each class of securities to which transaction applies: |
| 2) | Aggregate number of securities to which transaction applies: |
| 3) | Per unit price or other underlying value of transaction computed pursuant to Exchange Act Rule 0-11 (Set forth the amount on which the filing fee is calculated and state how it was determined): |
| 4) | Proposed maximum aggregate value of transaction: |
| 5) | Total fee paid: |
| ☐ | Fee paid previously with preliminary materials. |
| ☐ | Check box if any part of the fee is offset as provided by Exchange Act Rule 0-11(a)(2) and identify the filing for which the offsetting fee was paid previously. Identify the previous filing by registration statement number, or the Form or Schedule and the date of its filing. |
| 1) | Amount Previously Paid: | |
| 2) | Form, Schedule or Registration Statement No.: | |
| 3) | Filing Party: | |
| 4) | Date Filed: |
 | Scott J. Lauber Chairman, President and Chief Executive Officer 231 W. Michigan Street Milwaukee, WI 53203 |
March 28, 2023
Dear Preferred Stockholder:
Wisconsin Electric Power Company, which does business under the trade name of We Energies, will hold its Annual Meeting of Stockholders on Thursday, April 27, 2023, at 10:00 a.m., Central time, in the Corporate Conference Center on the first floor of the Public Service Building, 231 W. Michigan Street, Milwaukee, Wisconsin 53203.
We are not soliciting proxies for this meeting, as more than 99% of the voting stock is owned, and will be voted, by Wisconsin Electric’s parent, WEC Energy Group, Inc. If you wish, you may vote your shares of preferred stock in person at the meeting; however, there will be no business session at the meeting. Please see page 1 of this information statement for more information about meeting attendance.
The annual report of Wisconsin Electric is attached as Appendix A to this information statement. If you have any questions, please call our toll-free stockholder hotline at 800-881-5882.
Thank you for your support.
Sincerely,

Scott J. Lauber
Chairman, President and Chief Executive Officer
NOTICE OF ANNUAL MEETING OF STOCKHOLDERS
March 28, 2023
To the Stockholders of Wisconsin Electric Power Company:
The 2023 Annual Meeting of Stockholders of Wisconsin Electric Power Company will be held on Thursday, April 27, 2023 at 10:00 a.m., Central time, in the Corporate Conference Center on the first floor of the Public Service Building, 231 W. Michigan Street, Milwaukee, Wisconsin 53203, for the following purposes:
| 1. | To elect the six members of the Board of Directors to hold office until the 2024 Annual Meeting of Stockholders; and |
| 2. | To consider any other matters that may properly come before the meeting. |
Stockholders of record at the close of business on February 23, 2023, are entitled to vote. The following pages provide additional details about the meeting as well as other useful information.
Important Notice Regarding the Availability of Materials Related to the Stockholder Meeting to Be Held on April 27, 2023 – The Information Statement and 2022 Annual Report to Stockholders are available at:
www.wisconsinelectric.com
By Order of the Board of Directors,

Margaret C. Kelsey
Executive Vice President, General Counsel and Corporate Secretary
 | We Energies 231 W. Michigan Street Milwaukee, WI 53203 |
INFORMATION STATEMENT
This information statement is being furnished to stockholders beginning on or about March 28, 2023, in connection with the annual meeting of stockholders of Wisconsin Electric Power Company (“WE” or the “Company”), which does business under the trade name of We Energies, and all adjournments or postponements of the annual meeting, for the purposes listed in the preceding Notice of Annual Meeting of Stockholders. The annual meeting of stockholders will be held on Thursday, April 27, 2023 (the “Meeting”), at 10:00 a.m., Central time, in the Corporate Conference Center on the first floor of the Public Service Building, 231 W. Michigan Street, Milwaukee, Wisconsin 53203. The WE annual report to stockholders is attached as Appendix A to this information statement.
We are not asking you for a proxy and you are requested not to send us a proxy. However, you may vote your shares of preferred stock at the Meeting. If you would like to attend the Meeting, please contact Stockholder Services by email at WEC-Stockholder-Services@wecenergygroup.com or by telephone at 800-881-5882.
VOTING SECURITIES
As of February 23, 2023, WE had outstanding 44,498 shares of $100 par value Six Per Cent. Preferred Stock; 260,000 shares of $100 par value 3.60% Serial Preferred Stock; and 33,289,327 shares of common stock. Each outstanding share of each class is entitled to one vote. Stockholders of record at the close of business on February 23, 2023 will be entitled to vote at the Meeting. In order to conduct the Meeting, a majority of the outstanding shares entitled to vote must be represented at the Meeting. This is known as a “quorum.” All of WE’s outstanding common stock, representing more than 99% of its voting securities, is owned by its parent company, WEC Energy Group, Inc. (“WEC Energy Group”), and will be represented at the Meeting. The principal business address of WEC Energy Group is 231 W. Michigan Street, Milwaukee, Wisconsin 53203. A list of stockholders entitled to vote at the Meeting will be available for inspection by stockholders at 231 W. Michigan Street, Milwaukee, Wisconsin 53203, prior to and at the Meeting. Please call us at 800-881-5882 to arrange to inspect the list.
INTERNET AVAILABILITY OF INFORMATION
The following documents can be found at wisconsinelectric.com:
| • | Notice of Annual Meeting; | |
| • | Information Statement; and | |
| • | 2022 Annual Report to Stockholders. |
ELECTION OF DIRECTORS
At the Meeting, there will be an election of six directors. Based upon the recommendation of the Corporate Governance Committee of WEC Energy Group’s Board of Directors (the “Corporate Governance Committee”), the individuals named below have been nominated by the WE Board of Directors (the “Board”) to serve a one-year term expiring at the 2024 Annual Meeting of Stockholders and until they are re-elected or until their respective successors are duly elected and qualified.
Directors will be elected by a plurality of the votes cast by the shares entitled to vote, as long as a quorum is present. “Plurality” means that the individuals who receive the largest number of votes are elected as directors up to the maximum number of directors to be chosen. Therefore, shares not voted, whether by withheld authority or otherwise, have no effect in the election of directors.
Each nominee has consented to being nominated and to serve if elected. In the unlikely event that any nominee becomes unable to serve for any reason, the Board will select a substitute nominee based upon the recommendation of the Corporate Governance Committee.
Director Nominees
The Company does not have a nominating committee. The Corporate Governance Committee provides oversight for the nominating process on behalf of the Board.
| Wisconsin Electric Power Company | 1 | 2023 Annual Meeting Information Statement |
Director nominees for the Board are evaluated as a whole with the goal of recommending nominees with diverse backgrounds and experience that, together, can best perpetuate the success of WE’s business and represent stockholder interests. In addition to the specific experiences and skills of the individual director nominees identified below, the Corporate Governance Committee believes that director nominees must demonstrate certain key attributes including: proven integrity; mature and independent judgment; vision and imagination; ability to appraise problems objectively; ability to evaluate strategic options and risks; sound business experience and acumen; relevant technological, civic, economic, or social/cultural experience; social consciousness; achievement of prominence in career; willingness to dedicate sufficient time to board service; and familiarity with domestic and international issues affecting the Company’s business. After considering the recommendations of the Corporate Governance Committee, the Board selected the nominees listed below.
Board Diversity
The Corporate Governance Committee does not have a specific policy regarding the consideration of diversity in identifying director nominees. However, the Corporate Governance Committee strives to recommend candidates who each bring a unique perspective to the Board in order to contribute to the collective diversity of the Board. As part of its process, in connection with the nomination of new directors to the Board, the Corporate Governance Committee considers several factors to ensure the entire Board collectively embraces a wide variety of characteristics, including professional background, experience, skills, and knowledge, as well as the criteria listed above. Each candidate will generally exhibit different and varying degrees of these characteristics.
Nominees for Election to the Board of Directors
Biographical information regarding each nominee is shown below. Ages are as of December 31, 2022. All nominees are officers of the Company and/or WEC Energy Group and are not independent.
Margaret C. Kelsey. Age 58.
| • | WEC Energy Group – Executive Vice President, General Counsel, and Corporate Secretary since January 2018; Executive Vice President from September 2017 to January 2018. | |
| • | Wisconsin Electric Power Company – Executive Vice President, General Counsel, and Corporate Secretary since January 2018. | |
| • | Director of Wisconsin Electric Power Company since January 2018. | |
| • | Ms. Kelsey also serves as an executive officer and/or director of other major subsidiaries of WEC Energy Group. |
Based primarily upon Ms. Kelsey’s position and qualifications as Executive Vice President, General Counsel, and Corporate Secretary of WEC Energy Group and its utility subsidiaries including her extensive experience in legal, governance, compliance, and regulatory matters, as well as upon Ms. Kelsey’s prior experience in managing corporate communications, strategic initiatives, business/corporate development, and treasury/risk management, the Board concluded that Ms. Kelsey should serve as a director of the Company.
Gale E. Klappa. Age 72.
| • | WEC Energy Group – Executive Chairman since February 2019; Chairman of the Board and CEO from 2004 to May 2016 and October 2017 to February 2019; Non-Executive Chairman of the Board from May 2016 to October 2017; President from 2003 to August 2013. | |
| • | Wisconsin Electric Power Company – Chairman of the Board from 2004 to May 2016 and January 2018 to February 2019; CEO from 2003 to May 2016 and January 2018 to February 2019; President from 2003 to June 2015. | |
| • | Director of Associated Banc-Corp since 2016 and Director of Badger Meter, Inc. since 2010 (planned retirement: April 30, 2023), both headquartered in Wisconsin. | |
| • | Director of WEC Energy Group since 2003; Director of Wisconsin Electric Power Company from 2003 to May 2016 and January 2018 to present. | |
| • | Mr. Klappa also serves as a director of other major subsidiaries of WEC Energy Group. |
Mr. Klappa has more than 45 years of experience working in the public utility industry, including more than 30 at a senior executive level. He has served as Chairman and CEO of WEC Energy Group and Wisconsin Electric and presently serves as Executive Chairman of WEC Energy Group’s Board of Directors. Mr. Klappa’s deep knowledge of the Company’s industry, operations, customers, stockholders, and management team is of great value to the Board. Based upon Mr. Klappa’s extensive executive management, financial, and strategic experience as a senior executive in the utility industry, the Board concluded that Mr. Klappa should serve as a director of the Company.
Scott J. Lauber. Age 57.
| • | WEC Energy Group – President and CEO since February 1, 2022; Senior Executive Vice President and Chief Operating Officer from June 2020 to January 31, 2022; Senior Executive Vice President and Chief Financial Officer from October 2019 to June 2020; Senior Executive Vice President, Chief Financial Officer and Treasurer from February 2019 to October 2019; Executive Vice President, Chief Financial Officer and Treasurer from October 2018 to February 2019; Executive Vice President and Chief Financial Officer from April 2016 to October 2018. | |
| • | Wisconsin Electric Power Company – Chairman of the Board and CEO since February 1, 2022; President since January 1, 2022; Executive Vice President from June 2020 to December 31, 2021; Executive Vice President and Chief Financial Officer from April |
| Wisconsin Electric Power Company | 2 | 2023 Annual Meeting Information Statement |
| 2016 to October 2018 and from October 2019 to June 2020; Executive Vice President, Chief Financial Officer and Treasurer from October 2018 to October 2019. | ||
| • | Director of WEC Energy Group since February 1, 2022; Director of Wisconsin Electric Power Company since April 2016. | |
| • | Mr. Lauber also serves as an executive officer and/or director of other major subsidiaries of WEC Energy Group. |
Mr. Lauber, who currently serves as President and CEO of WEC Energy Group and Chairman, President and CEO of Wisconsin Electric Power Company, has over 30 years of service at WEC Energy Group, including executive and financial management responsibility of its utility affiliates with a focus on operations and before that, long-range financial planning and oversight of the treasury function. Mr. Lauber also has significant experience in risk and insurance matters and knowledge of the financial community. Based upon this experience, the Board concluded that Mr. Lauber should serve as a director of the Company.
Xia Liu. Age 52.
| • | WEC Energy Group – Executive Vice President and Chief Financial Officer since June 2020. | |
| • | Wisconsin Electric Power Company – Executive Vice President and Chief Financial Officer since June 2020. | |
| • | CenterPoint Energy, Inc. – Senior Advisor from April 2020 to May 2020. Executive Vice President and Chief Financial Officer from April 2019 to April 2020. CenterPoint Energy, Inc. is a public utility holding company whose operating subsidiaries provide electric and natural gas service to customers in parts of the South and Midwest. | |
| • | Georgia Power Company – Executive Vice President, Chief Financial Officer and Treasurer from October 2017 to April 2019. Georgia Power Company is a utility subsidiary of The Southern Company that provides electric service to customers throughout Georgia. | |
| • | Director of Wisconsin Electric Power Company since June 2020. | |
| • | Ms. Liu also serves as an executive officer and/or director of other major subsidiaries of WEC Energy Group. |
Based primarily upon Ms. Liu’s knowledge of the Company’s industry and strong financial management experience including long-range financial planning, corporate forecasting and budgeting, treasury, accounting, tax, insurance and risk management, the Board concluded that Ms. Liu should serve as a director of the Company.
William Mastoris. Age 59.
| • | WEC Business Services (a centralized service company of WEC Energy Group) – Executive Vice President-Customer Service and Operations since December 2021; Vice President-Supply Chain and Fleet from January 2019 through November 2021. | |
| • | Wisconsin Electric Power Company – Executive Vice President-Customer Service and Operations since December 2021; Vice President-Supply Chain and Fleet from June 2015 through December 2018. | |
| • | Director of Wisconsin Electric Power Company since November 2021. | |
| • | Mr. Mastoris also serves as an executive officer and/or director of other major subsidiaries of WEC Energy Group. |
Mr. Mastoris has over 30 years of service at Wisconsin Electric Power Company, progressing to positions with increasing responsibility up to his current oversight of Wisconsin field and system operations, electric distribution asset management, customer operations support, fleet services, and economic development. Based upon his experience, the Board concluded that Mr. Mastoris should serve as a director of the Company.
Paul J. Spicer. Age 54.
| • | Wisconsin Electric Power Company – Senior Vice President-Power Generation since January 2019. | |
| • | Wisconsin Public Service Corporation – Senior Vice President-Power Generation since January 2019; Vice President-Gas and Renewable Generation from June 2015 through December 2018. | |
| • | Director of Wisconsin Electric Power Company since November 2021. | |
| • | Mr. Spicer also serves as an executive officer and/or director of other major subsidiaries of WEC Energy Group. |
Mr. Spicer has over 30 years of service at WEC Energy Group subsidiaries, including responsibility for power generation at the Company and Wisconsin Public Service Corporation (“WPS”), overseeing the companies’ combined generation fleet, which includes coal, natural gas, biomass, wind, solar and hydroelectric assets. Mr. Spicer’s responsibilities also include overseeing those groups that support power generation, including engineering, planning, training and safety. Mr. Spicer is also responsible for WEC Energy Group’s natural gas storage facilities. Based upon this experience, the Board concluded that Mr. Spicer should serve as a director of the Company.
| Wisconsin Electric Power Company | 3 | 2023 Annual Meeting Information Statement |
COMMITTEES OF THE WEC ENERGY GROUP BOARD OF DIRECTORS
WE is a wholly-owned subsidiary of WEC Energy Group, and the WE Board does not have any committees. The WEC Energy Group Board maintains the following committees, which oversee certain responsibilities on behalf of the WE Board: Audit and Oversight, Compensation, Corporate Governance, and Finance. All committees operate under a charter approved by WEC Energy Group’s Board of Directors. A copy of each committee charter is posted in the “Governance” section of WEC Energy Group’s website at wecenergygroup.com/govern/governance.htm and is available in print to any stockholder who requests it in writing from the Corporate Secretary. Members and principal responsibilities of the WEC Energy Group Board committees are provided below.
| Members | Key Responsibilities; Meetings | |
| Audit and Oversight Danny L. Cunningham, Chair Ave M. Bie* Maria C. Green Thomas K. Lane Glen E. Tellock | • Oversee the integrity of the financial statements. • Oversee management compliance with legal and regulatory requirements. • Oversee management’s strategy for data privacy and security, including cyber and physical. • Review WEC Energy Group’s and its subsidiaries’ environmental and compliance programs, including its Ethics and Compliance program and Code of Business Conduct. • Review, approve, and evaluate the independent auditors’ qualifications, independence and services. • Oversee the performance of the internal audit function and independent auditors. • Discuss risk management and major risk exposures and steps taken to monitor and control such exposures. • Establish procedures for the submission and treatment of complaints and concerns regarding WEC Energy Group’s and its subsidiaries’ accounting controls and auditing matters. • Prepare the audit committee report required by the Securities and Exchange Commission (“SEC”) for inclusion in the proxy and information statements. • The Audit and Oversight Committee conducted six meetings in 2022. | |
| *Ms. Bie was elected to the WEC Energy Group Board and appointed to the Audit and Oversight Committee effective January 1, 2023. | ||
| Compensation Ulice Payne, Jr., Chair William M. Farrow III Thomas K. Lane | • Determine and annually review the Compensation Committee’s compensation philosophy. • Oversee the development of competitive, performance-based executive and director compensation programs. • Review and approve the compensation paid to select employees, including WEC Energy Group’s and the Company’s executive officers (including base salaries, incentive compensation, and benefits). • Establish and administer the CEO and WEC Energy Group Executive Chairman compensation packages. • Set performance goals relevant to the compensation of the CEO and WEC Energy Group Executive Chairman. • Annually evaluate CEO and WEC Energy Group Executive Chairman performance and determine compensation adjustments. • Annually assess whether any risks arising from the compensation program are reasonably likely to have a material adverse effect on WEC Energy Group and the Company. • Review WEC Energy Group’s and the Company’s plans for leadership and succession planning of executive officers. • Periodically review and assess WEC Energy Group’s and the Company’s strategy for human capital management initiatives. • Prepare the reports required by the SEC for inclusion in the proxy and information statements. • Review the results of WEC Energy Group’s most recent stockholder advisory vote on the compensation of WEC Energy Group’s named executive officers. • The Compensation Committee conducted six meetings in 2022 including one joint meeting with the Corporate Governance Committee. | |
| Wisconsin Electric Power Company | 4 | 2023 Annual Meeting Information Statement |
| Members | Key Responsibilities; Meetings | |
| Corporate Governance William M. Farrow III, Chair Curt S. Culver Cristina A. Garcia-Thomas | • Establish and annually review the Corporate Governance Guidelines to verify that the WEC Energy Group Board of Directors and the Company’s Board are effectively performing their fiduciary responsibilities to stockholders. • Periodically review the charters of each committee of the WEC Energy Group Board of Directors and make recommended changes as appropriate. • Establish and annually review director candidate selection criteria, as well as the WEC Energy Group Board of Directors and each committee’s structure, size, composition and leadership. • Identify and recommend candidates to be named as nominees of WEC Energy Group’s Board of Directors and the Company’s Board for election as directors. • Perform an annual review of WEC Energy Group’s and the Company’s Related Party Transaction Policy, and where appropriate, review and approve related party transactions in accordance with the policy. • Lead the WEC Energy Group Board in its annual review of WEC Energy Group’s Board performance. • Review and determine the compensation package of WEC Energy Group’s non-management directors in conjunction with the Compensation Committee. • The Corporate Governance Committee conducted four meetings in 2022 including one joint meeting with the Compensation Committee. |
| Finance Curt S. Culver, Chair Maria C. Green Ulice Payne, Jr. Mary Ellen Stanek | • Review and monitor WEC Energy Group’s and its subsidiaries’ current and long-range financial policies and strategies, including each company’s capital structure and dividend policy. • Authorize the issuance of corporate debt within limits set by WEC Energy Group’s Board. • Discuss policies and financial programs with respect to financial risk management. • Approve the consolidated financial plans, including the consolidated capital budget for WEC Energy Group and its subsidiaries. • Review the investment performance of WEC Energy Group’s and its subsidiaries employee retirement and benefit plan assets. • The Finance Committee conducted three meetings in 2022. |
The WE Board met three times during calendar year 2022. All WE Board members attended 100% of the total number of WE Board meetings during 2022.
DIRECTOR COMPENSATION
All of the Company’s Board members are senior officers of WE and/or WEC Energy Group, and were not separately compensated as directors. Messrs. Lauber and Mastoris, and Mmes. Kelsey and Liu, are named executive officers of WE, and any compensation received by these individuals for service as named executive officers may be found in the “Summary Compensation Table” on page 25 of this information statement. Mr. J. Kevin Fletcher, who was a director of the Company through January 2022, was an executive officer of WEC Energy Group and the Company and also was not compensated separately as a director. Mr. Fletcher’s compensation can be found in the Summary Compensation Table.
OTHER MATTERS
The WE Board of Directors is not aware of any other matters that may properly come before the Meeting. The WE bylaws set forth the requirements that must be followed should a stockholder wish to propose any floor nominations for director or floor proposals at annual or special meetings of stockholders. In the case of annual meetings, the bylaws state, among other things, that notice and certain other documentation must be provided to WE at least 70 days and not more than 100 days before the scheduled date of the annual meeting. No such notices have been received by WE.
CORPORATE GOVERNANCE – FREQUENTLY ASKED QUESTIONS
Does WE have Corporate Governance Guidelines?
The Board follows WEC Energy Group’s Corporate Governance Guidelines (“Guidelines”), which WEC Energy Group has maintained since 1996. The Guidelines have been modified over the years in response to evolving governance best practices and stakeholder expectations. The Guidelines provide a framework under which the WEC Energy Group and WE Boards conduct their business.
To maintain effective Corporate Governance Guidelines, WEC Energy Group’s Corporate Governance Committee annually reviews WEC Energy Group’s and the Company’s governance practices, taking into consideration discussions with WEC Energy Group stockholders as part of the investor outreach and engagement program, best practices, industry surveys, rating agency reports, and benchmarking studies, as well as governance guidelines published by institutional investors and proxy advisors.
The Corporate Governance Guidelines are available in the “Governance” section of WEC Energy Group’s website at wecenergygroup.com/govern/governance.htm and are available in print to any stockholder who requests them in writing from the Corporate Secretary.
| Wisconsin Electric Power Company | 5 | 2023 Annual Meeting Information Statement |
How are directors determined to be independent?
No director qualifies as independent unless the Board affirmatively determines that the director has no material relationship with the Company.
What are the WEC Energy Group Board’s standards of independence?
The guidelines the WEC Energy Group and WE Boards use in determining director independence are located in Appendix A of the Guidelines. The Guidelines are available in the “Governance” section of WEC Energy Group’s website at wecenergygroup.com/govern/governance.htm. These standards of independence include a provision that a director will not be considered independent if he or she has been an employee of the Company within the last five years.
Who are the independent directors?
All of WE’s Board members are employees of the Company and/or WEC Energy Group and are not independent. In addition, Mr. Fletcher, who was a director through January 2022, was also an employee of the Company and WEC Energy Group and, therefore, also not independent.
Are the WEC Energy Group Audit and Oversight and Compensation Committees comprised solely of independent directors?
Yes. These committees are comprised solely of independent directors who meet the independence requirements of the SEC, New York Stock Exchange, and the Guidelines. In addition, the WEC Energy Group Audit and Oversight Committee is a separately designated committee established in accordance with Section 3(a)(58)(A) of the Securities Exchange Act of 1934, as amended.
Is the office of CEO combined with the office of Chairman of the Board?
Yes. The office of CEO is currently combined with the office of Chairman of the Board at WE. Consistent with WE’s bylaws and the Guidelines, the Board has discretion to combine and separate the offices of CEO and Chairman of the Board. The Board believes this structure promotes the development and execution of the Company’s strategy and is appropriate given that WEC Energy Group owns all of the Company’s common stock.
What is the Board’s role in risk oversight?
The Board has overall responsibility for risk oversight and, in that capacity, oversees the Company’s risk environment and associated management practices as part of its evaluation of the Company’s ongoing operations and strategic direction. Because WE is a wholly-owned subsidiary of WEC Energy Group and does not have any committees, the WEC Energy Group Board and its committees oversee certain responsibilities on behalf of the WE Board, as described below.
WEC Energy Group has created a framework from which management is able to provide meaningful information to the WEC Energy Group and Company Boards to aid in their oversight responsibilities. As a standing practice, each year, management systematically evaluates the corporate risk areas, whereby business leaders identify existing, new or emerging issues or changes within their business areas that could have enterprise implications. Risk areas are then mapped to create a cumulative assessment of their significance and likelihood, taking into consideration industry benchmarking information, as appropriate. The mapping identifies line of responsibility for managing the risks to ensure accountability and focus.
WEC Energy Group’s Enterprise Risk Steering Committee (“ERSC”), which consists of senior-level WEC Energy Group management employees, regularly reviews key risk areas and provides input into the development and implementation of effective compliance and risk management practices. On a bimonthly basis, the ERSC discusses findings of the annual enterprise risk assessment, holds in-depth discussions with members of management on identified subjects, and tracks the status of ongoing progress. Pertinent updates from these meetings are shared with the executive leadership team and are the subject of regular reports to the WEC Energy Group Board and its committees.
The WEC Energy Group Board retains collective responsibility for comprehensive risk oversight for WEC Energy Group and its subsidiaries, including short- and long-term critical risks that could impact WEC Energy Group and the Company. The WEC Energy Group Board believes that certain matters should be contemplated by the full WEC Energy Group Board. This includes oversight of environmental, social and governance risks that have the potential to result in significant financial or reputational consequences that could impact WEC Energy Group’s brand, limit its sustainability or jeopardize its value to stockholders.
The WEC Energy Group Board has delegated certain other risk monitoring responsibilities to its committees. These committees routinely report to the WEC Energy Group Board on matters that fall within designated areas of responsibility, as described in each committee’s charter. For more information about each committee’s duties and responsibilities, see “Committees of the WEC Energy Group Board” above.
To carry out its risk oversight function, the WEC Energy Group Board and its committees meet regularly throughout the year. Board members receive briefings prepared by management and outside advisers on specific areas of current and emerging risks to the enterprise as captured through the enterprise risk management framework described above. Committees routinely report to the WEC Energy Group Board on matters that fall within designated areas of responsibility.
Examples of risk monitoring activity which have been designated to the WEC Energy Group Board committees include:
Audit and Oversight Committee. External auditor independence; ethics and compliance program; financial reporting; and legal and regulatory risks and compliance matters such as data privacy and security, including cyber, physical and operating technology, electric reliability standards, environmental, government relations, and litigation.
Compensation Committee. Compensation practices and programs; CEO performance; executive succession planning; and human capital management and development.
| Wisconsin Electric Power Company | 6 | 2023 Annual Meeting Information Statement |
Corporate Governance Committee. WEC Board performance and succession planning; director independence; and governance structure and practices.
Finance Committee. Capital allocation; capital structure and financings; employee retirement and benefit plan assets; and insurance management.
These committees have direct access to, and meet as needed with, WEC Energy Group representatives without other management present to discuss matters related to risk management,
The Board believes that its leadership structure, in combination with WEC Energy Group’s Board and committee structure and enterprise risk management program, effectively supports the Board’s risk oversight function.
How can interested parties contact the members of the Board?
Correspondence may be sent to the directors in care of the Corporate Secretary, Margaret C. Kelsey, at the Company’s principal executive office, PO Box 2046, Milwaukee, Wisconsin 53201.
All communications received as set forth above will be opened by the Corporate Secretary for the sole purpose of confirming that the contents represent a message to the Company’s directors. All communication, other than advertising, promotion of a product or service, or patently offensive material, will be forwarded promptly to the addressee.
Does the Company have a written code of ethics?
Yes. All WE and WEC Energy Group directors, executive officers, and employees, including the principal executive, financial, and accounting officers, have a responsibility to comply with WEC Energy Group’s Code of Business Conduct (the “Code”), to seek advice in doubtful situations, and to report suspected violations. All those subject to the Code, including WEC Energy Group’s non-management directors, are required to participate in annual training on the elements of the Code.
WEC Energy Group’s Compliance Officer has responsibility for overseeing the management and operations of the program, and for providing regular update reports to WEC Energy Group’s Audit and Oversight Committee.
The Code addresses expectations for Company culture, including, among other things: non-retaliation for raising concerns; safety; diversity, equity and inclusion; conflicts of interest; confidentiality; fair dealing; protection and proper use of WEC Energy Group and Company resources, assets and information; and compliance with laws, rules and regulations (including political contribution and insider trading laws). Neither WEC Energy Group nor the Company have provided any waiver to the Code for any director, executive officer, or other employee.
The Code is posted in the “Governance” section of WEC Energy Group’s website at wecenergygroup.com/govern/governance.htm. It is also available in print to any stockholder upon request in writing to the Corporate Secretary.
The Company has several ways individuals can report concerns and raise questions concerning the Code and other Company policies. As one reporting mechanism, WEC Energy Group has contracted with a third party so that individuals can confidentially and anonymously report suspected violations of the Code or other concerns, including those regarding accounting, internal accounting controls, or auditing matters.
Does the Company have policies and procedures in place to review and approve related party transactions?
Yes. WEC Energy Group has adopted a written policy on the review, approval or ratification of transactions with related persons, which is overseen by the Corporate Governance Committee, as delegated by the WEC Energy Group Board.
The policy provides that the Corporate Governance Committee will review any proposed, existing, or completed related party transaction in which the amount involved exceeds $120,000, and in which any related party had, has, or will have a direct or indirect material interest. In general, a “related party” includes all directors and executive officers of WEC Energy Group and/or the Company and their immediate family members, as well as stockholders beneficially owning 5% or more of WEC Energy Group’s outstanding stock as defined in SEC rules. Legal Services reviews relevant information on transactions, arrangements, and relationships disclosed and makes a determination as to the existence of a related party transaction as defined by SEC rules and the policy. Related party transactions that are in, or are not inconsistent with, the best interests of WEC Energy Group or its subsidiaries, as applicable, are approved by the Corporate Governance Committee and reported to the WEC Energy Group Board. Related party transactions are disclosed in accordance with applicable SEC and other regulatory requirements.
In addition, the Code addresses, among other things, how to identify and report potential conflicts of interest, including those from related party transactions. The Code of Business Conduct lists the following as examples of potentially problematic situations: (1) family members who are a supplier, contractor or customer of WEC Energy Group or any of its subsidiaries, including the Company, or work for one; (2) obtaining any financial interest in or participating in any business relationship with any company, individual or concern doing business with WEC Energy Group or any of its subsidiaries, including the Company, that might influence the individual’s decisions or job performance; (3) participating in any joint venture, partnership or other business relationship with WEC Energy Group or any of its subsidiaries, including the Company; and (4) serving as an officer or member of the board of any substantial, outside for-profit organization.
Because the WEC Energy Group Board is mindful of the expectation of its directors to devote the time necessary to carefully fulfill their fiduciary duties, the Corporate Governance Guidelines contain additional requirements for directors seeking to join other boards. For example, all WEC Energy Group directors must notify WEC Energy Group’s Corporate Secretary before accepting a nomination for a position on the board of another public company, and the CEO must obtain the approval of WEC Energy Group’s full Board before accepting such a position.
| Wisconsin Electric Power Company | 7 | 2023 Annual Meeting Information Statement |
To further backstop such discussions and approvals, bi-annually all directors and executive officers are required to complete a questionnaire that asks about any business relationship that may give rise to a related party transaction or other conflict of interest and all transactions in which WEC Energy Group or one of its subsidiaries, including the Company, is involved and in which the director or executive officer or a relative or affiliate of such director or executive officer has a direct or indirect material interest. Director nominees under consideration by the WEC Energy Group or Company Board for election are required to complete the same questionnaire. The Corporate Secretary discusses the results of this diligence with the Corporate Governance Committee. Since January 1, 2022, there have been no related party transactions, and there are no currently proposed related party transactions, required to be disclosed pursuant to SEC rules.
Are all the members of the WEC Energy Group Audit Committee financially literate and does the committee have an “audit committee financial expert”?
Yes. The WEC Energy Group Board of Directors has determined that all of the members of WEC Energy Group’s Audit and Oversight Committee are financially literate as required by New York Stock Exchange rules. In addition, Directors Cunningham, Lane and Tellock of the WEC Energy Group Board qualify as audit committee financial experts within the meaning of SEC rules.
How does WEC Energy Group’s Compensation Committee administer the executive and director compensation programs?
One of the principal responsibilities of WEC Energy Group’s Compensation Committee (the “Compensation Committee”) is to provide competitive, performance-based executive and director compensation programs.
With respect to the executive compensation program, the Compensation Committee’s responsibilities include:
| • | determining and annually reviewing the Compensation Committee’s compensation philosophy; | |
| • | reviewing and approving the compensation paid to select employees, including certain senior officers and executive officers (including base salaries, incentive compensation, and benefits); | |
| • | establishing and administering the Chief Executive Officer and WEC Energy Group’s Executive Chairman compensation packages; and | |
| • | reviewing the results of the most recent WEC Energy Group stockholder advisory vote on the compensation of WEC Energy Group’s named executive officers. |
The Compensation Committee is also charged with administering the compensation package of WEC Energy Group’s non-management directors. The Compensation Committee meets with the WEC Energy Group Corporate Governance Committee annually to review the compensation package of WEC Energy Group’s non-management directors and to determine the appropriate amount of such compensation. All of the Company’s current Board members are executive officers of WE and/or WEC Energy Group and are not separately compensated as directors.
The Compensation Committee, which has authority to retain advisers, including compensation consultants, at WEC Energy Group’s expense, retained Frederic W. Cook & Co., Inc. (FW Cook) to analyze and help develop the executive compensation program, and to assess whether the compensation program is competitive and supports the Committee’s objectives. FW Cook also assesses and provides recommendations on non-management director compensation.
FW Cook is engaged solely by the Compensation Committee to provide executive compensation consulting services, and does not provide any additional services to WEC Energy Group or the Company. In connection with its retention of FW Cook, the Compensation Committee reviewed FW Cook’s independence including: (1) the amount of fees received by FW Cook from WEC Energy Group as a percentage of FW Cook’s total revenue; (2) FW Cook’s policies and procedures designed to prevent conflicts of interest; and (3) the existence of any business or personal relationships that could impact independence. After reviewing these and other factors, the Compensation Committee determined that FW Cook is independent and the engagement did not present any conflicts of interest. FW Cook also determined that it was independent from WEC Energy Group’s and its subsidiaries’ management, which was confirmed in a written statement delivered to the Compensation Committee.
For more information regarding the executive compensation processes and procedures, please refer to the “Compensation Discussion and Analysis” later in this information statement.
Does the Board have a nominating committee?
No. Instead, as discussed under “Director Nominees” above, WE relies upon WEC Energy Group’s Corporate Governance Committee for, among other things, identifying and evaluating director nominees.
What is the process used to identify director nominees and how do I recommend a nominee to WEC Energy Group’s Corporate Governance Committee?
Please refer to the discussion under the headings “Director Nominees” and “Other Matters” earlier in this information statement.
WEC Energy Group owns all of the Company’s common stock and, as a result, WEC Energy Group’s affirmative vote is sufficient to elect director nominees. Consequently, the Board does not accept proposals from preferred stockholders regarding potential candidates for director nominees.
What is WE’s policy regarding director attendance at annual meetings?
Directors are not expected to attend the Company’s annual meetings of stockholders, as they are only short business meetings.
| Wisconsin Electric Power Company | 8 | 2023 Annual Meeting Information Statement |
INDEPENDENT AUDITORS’ FEES AND SERVICES
Deloitte & Touche LLP served as the independent auditors for the Company for the last 21 fiscal years beginning with the fiscal year ended December 31, 2002. They have been selected by WEC Energy Group’s Audit and Oversight Committee (the “Audit and Oversight Committee”) as independent auditors for WEC Energy Group and its subsidiaries, including the Company, for the fiscal year ending December 31, 2023, subject to ratification by the stockholders of WEC Energy Group at WEC Energy Group’s Annual Meeting of Stockholders on May 4, 2023.
Representatives of Deloitte & Touche LLP are not expected to be present at the Company’s Annual Meeting, but are expected to attend WEC Energy Group’s Annual Meeting of Stockholders on May 4, 2023. They will have an opportunity to make a statement at WEC Energy Group’s Annual Meeting, if they so desire, and are expected to respond to appropriate questions that may be directed to them.
Pre-Approval Policy. The Audit and Oversight Committee has a formal policy delineating its responsibilities for reviewing and approving, in advance, all audit, audit-related, tax, and other services of the independent auditors. As such, the Audit and Oversight Committee is responsible for the audit fee negotiations associated with WEC Energy Group’s and the Company’s retention of independent auditors.
The Audit and Oversight Committee is committed to ensuring the independence of the auditors, both in appearance as well as in fact. In order to assure continuing auditor independence, the Audit and Oversight Committee periodically considers whether there should be a regular rotation of the independent external audit firm. In addition, the Audit and Oversight Committee is directly involved in the selection of Deloitte & Touche LLP’s lead audit partner.
Under the pre-approval policy, before engagement of the independent auditors for the next year’s audit, the independent auditors will submit: (1) a description of all services anticipated to be rendered, as well as an estimate of the fees for each of the services, for the Audit and Oversight Committee to approve, and (2) written confirmation that the performance of any non-audit services is permissible and will not impact the firm’s independence. Annual pre-approval will be deemed effective for a period of twelve months from the date of pre-approval, unless the Audit and Oversight Committee specifically provides for a different period. A fee level will be established for all permissible, pre-approved non-audit services. Any additional audit service, audit-related service, tax service, and other service must also be pre-approved.
The Audit and Oversight Committee delegated pre-approval authority to the Committee’s Chair. The Audit and Oversight Committee Chair is required to report any pre-approval decisions at the next scheduled Audit and Oversight Committee meeting. Under the pre-approval policy, the Audit and Oversight Committee may not delegate to management its responsibilities to preapprove services performed by the independent auditors.
Under the pre-approval policy, prohibited non-audit services are services prohibited by the Securities and Exchange Commission or by the Public Company Accounting Oversight Board (United States) from being performed by the Company’s independent auditors. These services include: bookkeeping or other services related to the accounting records or financial statements of the Company; financial information systems design and implementation; appraisal or valuation services; fairness opinions or contribution-in-kind reports; actuarial services; internal audit outsourcing services; management functions, or human resources, broker-dealer, investment advisor or investment banking services; legal services and expert services unrelated to the audit; services provided for a contingent fee or commission; and services related to planning, marketing, or opining in favor of the tax treatment of a confidential transaction or an aggressive tax position transaction that was initially recommended, directly or indirectly, by the independent auditors. In addition, the Audit and Oversight Committee has determined that the independent auditors may not provide any services, including personal financial counseling and tax services, to any officer or other employee of the Company who serves in a financial reporting oversight role or to the Audit and Oversight Committee chair or to an immediate family member of these individuals, including spouses, spousal equivalents, and dependents.
Fee Table. The following table shows the fees, all of which were approved by the Audit and Oversight Committee, for professional audit services provided by Deloitte & Touche LLP for the audit of the annual financial statements of the Company for fiscal years 2022 and 2021, and fees for other services rendered during those periods. No fees were paid to Deloitte & Touche LLP pursuant to the “de minimus” exception to the pre-approval policy permitted under the Securities Exchange Act of 1934, as amended.
| 2022 | 2021 | |||||||
| Audit Fees (1) | $ | 2,260,325 | $ | 2,351,049 | ||||
| Audit-Related Fees (2) | — | — | ||||||
| Tax Fees (3) | 15,750 | 42,000 | ||||||
| All Other Fees (4) | 1,569 | 2,106 | ||||||
| Total | $ | 2,277,644 | $ | 2,395,155 | ||||
| (1) | Audit Fees consist of fees for professional services rendered in connection with the audits of the annual financial statements of the Company, and other non-recurring audit work. This category also includes reviews of financial statements included in Form 10-Q filings of the Company, and services normally provided in connection with statutory and regulatory filings or engagements. |
| (2) | Audit-Related Fees consist of fees for professional services that are reasonably related to the performance of the audit or review of the Company’s financial statements and are not reported under “Audit Fees.” No such services were received from Deloitte & Touche in 2021 or 2022.. |
| (3) | Tax Fees consist of fees for professional services rendered with respect to federal and state tax compliance and tax advice. This can include preparation of tax returns, claims for refunds, payment planning, and tax law interpretation. |
| (4) | All Other Fees consist of costs for certain employees to attend accounting/tax seminars hosted by Deloitte & Touche LLP plus the subscription cost for the use of a Deloitte & Touche LLP accounting research tool. |
| Wisconsin Electric Power Company | 9 | 2023 Annual Meeting Information Statement |
AUDIT AND OVERSIGHT COMMITTEE REPORT
The Audit and Oversight Committee of WEC Energy Group’s Board of Directors, which is comprised solely of independent directors, oversees the integrity of the financial reporting process on behalf of the Company’s Board of Directors. In addition, the Audit and Oversight Committee oversees compliance with the Company’s legal and regulatory requirements. The Audit and Oversight Committee operates under a written charter approved by the Board of Directors of WEC Energy Group, which can be found in the “Governance” section of WEC Energy Group’s website at wecenergygroup.com.
The Audit and Oversight Committee is also directly responsible for the appointment, compensation, retention, and oversight of the Company’s independent auditors, as well as the oversight of the Company’s internal audit function.
In order to assure continuing auditor independence, the Audit and Oversight Committee periodically considers whether there should be a regular rotation of the independent external audit firm. For 2023, the Audit and Oversight Committee has appointed Deloitte & Touche LLP to remain as the Company’s independent auditors, subject to ratification by WEC Energy Group’s stockholders. The members of the Audit and Oversight Committee and other members of WEC Energy Group’s Board believe that the continued retention of Deloitte & Touche LLP to serve as the Company’s independent external auditor is in the best interests of the Company and its stockholders.
The Audit and Oversight Committee is directly involved in the selection of Deloitte & Touche LLP’s lead audit partner and is also responsible for audit fee negotiations with Deloitte & Touche LLP.
Management is responsible for the Company’s financial reporting process, the preparation of consolidated financial statements in accordance with generally accepted accounting principles, and the system of internal controls and procedures designed to provide reasonable assurance regarding compliance with accounting standards and applicable laws and regulations. The Company’s independent auditors are responsible for performing an independent audit of the Company’s consolidated financial statements in accordance with the standards of the Public Company Accounting Oversight Board (United States) (the “PCAOB”) and issuing a report thereon.
The Audit and Oversight Committee held six meetings during 2022. Meetings are designed to facilitate and encourage open communication among the members of the Audit and Oversight Committee, management, the internal auditors, and the Company’s independent auditors, Deloitte & Touche LLP. During these meetings, the Audit and Oversight Committee reviewed and discussed with management, among other items, the Company’s unaudited quarterly and audited annual financial statements and the system of internal controls designed to provide reasonable assurance regarding compliance with accounting standards and applicable laws.
The Audit and Oversight Committee has reviewed and discussed with management and the Company’s independent auditors the Company’s audited consolidated financial statements and related footnotes for the fiscal year ended December 31, 2022, and the independent auditor’s report on those financial statements. Management represented to the Audit and Oversight Committee that the Company’s financial statements were prepared in accordance with generally accepted accounting principles. Deloitte & Touche LLP presented the matters required to be discussed with the Audit and Oversight Committee by PCAOB Auditing Standard No. 1301, Communications with Audit Committees. This review included a discussion with management and the independent auditors about the quality of the Company’s accounting principles, the reasonableness of significant estimates and judgments, and the disclosures in the Company’s financial statements, as well as the disclosures relating to critical accounting policies and the auditor’s discussion about critical audit matters in its report on the audited consolidated financial statements.
In addition, the Audit and Oversight Committee received the written disclosures and the letter relative to the auditors’ independence from Deloitte & Touche LLP, as required by applicable requirements of the PCAOB regarding Deloitte & Touche LLP’s communications with the Audit and Oversight Committee concerning independence. The Audit and Oversight Committee discussed with Deloitte & Touche LLP its independence and also considered the compatibility of non-audit services provided by Deloitte & Touche LLP with maintaining its independence.
Based on these reviews and discussions, the Audit and Oversight Committee recommended to the Company’s Board that the audited financial statements be included in Wisconsin Electric Power Company’s Annual Report on Form 10-K for the fiscal year ended December 31, 2022 and filed with the Securities and Exchange Commission.
Respectfully submitted to Wisconsin Electric Power Company’s stockholders by the Audit and Oversight Committee.
| The Audit and Oversight Committee of WEC Energy Group, Inc. | |
| Danny L. Cunningham, Committee Chair Ave M. Bie Maria C. Green Thomas K. Lane Glen E. Tellock |
| Wisconsin Electric Power Company | 10 | 2023 Annual Meeting Information Statement |
COMPENSATION DISCUSSION AND ANALYSIS
The following discussion provides an overview and analysis of our executive compensation program, including the role of WEC Energy Group’s Compensation Committee (the “Compensation Committee”), the elements of our executive compensation program, the purposes and objectives of these elements, and the manner in which we established the compensation of our named executive officers (“NEOs”) for fiscal year 2022.
References to “we,” “us,” “our,” and the “Company,” in this discussion and analysis mean Wisconsin Electric Power Company and its management, as applicable, and references to “WEC Energy Group” mean WEC Energy Group, Inc.
The Compensation Committee oversees the compensation program of WEC Energy Group and its subsidiaries, including the Company, on behalf of WEC Energy Group’s Board of Directors. Therefore, the Compensation Committee has responsibility for making compensation decisions regarding the NEOs of the Company. There is significant overlap between the NEOs of the Company and the NEOs of WEC Energy Group.
EXECUTIVE SUMMARY
Overview
The primary objective of our executive compensation program is to provide a competitive, performance-based plan that enables WEC Energy Group and the Company to attract and retain key individuals and to reward them for achieving both WEC Energy Group’s and the Company’s short-term and long-term goals without creating an incentive for our NEOs to take excessive risks. Our program has been designed to provide a level of compensation that is strongly dependent upon the achievement of short-term and long-term goals that are aligned with the interests of WEC Energy Group’s and the Company’s stockholders and customers. To that end, a substantial portion of pay is at risk, and generally, the value will only be realized upon strong corporate performance.
We also recognize the increasing investor desire for companies to link environmental, social and governance factors to compensation. Environmental, social and governance initiatives are firmly entrenched in our executive compensation program. Since 2004, performance metrics have included operational and social metrics, including those related to customer satisfaction, supplier and workforce diversity, and safety.
2022 Business Highlights
During 2022, WEC Energy Group and its utilities, including us, achieved solid results and continued to create long-term value for stockholders and customers by focusing on the following:
| • | World-class reliability | • | Operating efficiency | • | Employee safety | |
| • | Financial discipline | • | Exceptional customer care | • | Environmental Stewardship |
Commitment to Stockholder Value Creation. In 2022, WEC Energy Group again delivered solid earnings growth, generated strong cash flow, and increased the dividend for the 19th consecutive year. In January 2022, the WEC Energy Group Board raised the quarterly dividend 7.4% to $0.7275 per share, equivalent to an annual rate of $2.91 per share. In January 2023, the WEC Energy Group Board again increased the quarterly dividend 7.2% to $0.780 per share, which is equivalent to an annual rate of $3.12 per share, in line with WEC Energy Group’s plan to maintain a dividend payout ratio of 65% to 70% of earnings. Overall, WEC Energy Group and the Company also turned in strong performances in safety and supplier and workforce diversity during 2022, while continuing to maintain effective cost controls throughout its operations.
ESG Progress Plan. WEC Energy Group introduced its capital investment plan for efficiency, sustainability and growth, referred to as the ESG Progress Plan, in November 2020. The WEC Energy Group plan calls for emission reductions, maintaining superior reliability, delivering significant savings for customers and growing its investment in the future of energy. In November 2022, WEC Energy Group announced its planned capital investment for the next five-year period (2023-2027) of the ESG Progress Plan, which includes capital investments by the Company in support of these objectives. WEC Energy Group expects to invest approximately $20.1 billion over the five-year period in its regulated and non-utility energy infrastructure businesses, including approximately $5.4 billion of regulated renewable investment. WEC Energy Group has already retired more than 1,800 megawatts (MW) of coal-fired generation since the beginning of 2018, and expects to retire approximately 1,600 MW of additional fossil-fueled generation by the end of 2026. In fact, WEC Energy Group announced that by the end of 2030 it expects to use coal only as a backup fuel for the power supplied to its customers, and to eliminate coal as an energy source by 2035.
In addition to its carbon dioxide emission reductions, WEC Energy Group also continued to reduce its methane emissions by improving its natural gas distribution systems, including our system. WEC Energy Group set a target across its natural gas operations to achieve net-zero methane emissions by the end of 2030.
| Wisconsin Electric Power Company | 11 | 2023 Annual Meeting Information Statement |
Other specific achievements during 2022 of WEC Energy Group and the Company include:
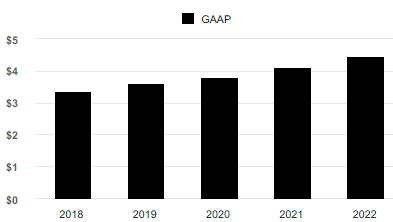
2022 Financial Highlights
| • | WEC Energy Group achieved diluted earnings per share of $4.45.* |
| • | Each of WEC Energy Group’s regulated utility subsidiaries, including the Company, achieved its financial goals. |
| • | WEC Energy Group returned approximately $918 million to its stockholders through dividends. |
Diluted Earnings Per Share
2022 Performance Highlights
| • | WEC Energy Group ended 2022 with the most diverse leadership team in its history.* |
| • | WEC Energy Group ranked number one in the nation for customer satisfaction in an independent survey of large commercial and industrial energy users. |
| • | WEC Energy Group achieved best safety record since the acquisition of Integrys Energy Group based on DART-recordable injuries and lost-time injuries.* |
| • | WEC Energy Group completed the first of its kind hydrogen blending project with EPRI at one of its reciprocal internal combustion engines in the Upper Peninsula of Michigan. |
| • | WEC Energy Group committed more than $20 million in community support through charitable contributions across its system. |
| • | WEC Energy Group executed four new renewable gas contracts to help achieve its net zero methane emission goal. |
| * | These measures are a component of our short-term incentive compensation program. |
Long-Term Stockholder Returns
Over the past decade, WEC Energy Group has consistently delivered among the best total returns in the industry.
Five-Year Cumulative Return**

| ** | The Five-Year Cumulative Return Chart shows a comparison of the cumulative total return, assuming reinvestment of dividends, over the last five years had $100 been invested at the close of business on December 31, 2017. Changes were made to the Custom Peer Index Group. For information about the Custom Peer Index Group, including the changes made, refer to “Long-Term Incentive Compensation” on page 21. |
Total Stockholder Returns
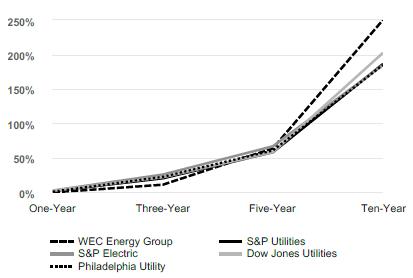
Source: Bloomberg; assumes all dividends are reinvested and returns are compounded daily.
| Wisconsin Electric Power Company | 12 | 2023 Annual Meeting Information Statement |
Consideration of 2022 WEC Energy Group Stockholder Advisory Vote and Stockholder Outreach
At the 2022 WEC Energy Group Annual Meeting of Stockholders, stockholders approved the compensation of WEC Energy Group’s named executive officers with 94.2% of the votes cast supporting the say-on-pay proposal. The Compensation Committee considered this outcome as well as the feedback received during meetings WEC Energy Group again held with many of its institutional stockholders. During 2022, WEC Energy Group communicated with stockholders representing approximately 30% of WEC Energy Group’s outstanding common stock about its environmental, social, governance and compensation practices. The Compensation Committee is always looking for ways to refine the compensation program. However, in light of the significant stockholder support the executive compensation program received in 2022 and the payout levels under the performance-based program for 2022, the Compensation Committee believes that the overall compensation program structure is competitive, aligned with WEC Energy Group’s and our financial and operational performance goals, and in the best interests of WEC Energy Group and the Company, stockholders, and customers.
COMPONENTS OF OUR EXECUTIVE COMPENSATION PROGRAM
We have three primary elements of total direct compensation: (1) base salary; (2) annual incentive awards; and (3) long-term incentive awards consisting of a mix of WEC Energy Group performance units, stock options, and restricted stock. The Compensation Committee again retained Frederic W. Cook & Co., Inc. (“FW Cook”) as its independent compensation consultant to advise the Compensation Committee with respect to the executive compensation program. The Compensation Committee generally relied upon the recommendations of FW Cook in its development of the 2022 program.
On October 21, 2021, the Board appointed Mr. Lauber to succeed Mr. Fletcher as WEC Energy Group’s President and CEO, effective February 1, 2022. Mr. Lauber was appointed President of the Company effective January 1, 2022, and Chairman and CEO effective February 1, 2022. Mr. Fletcher continued to serve as a senior adviser of WEC Energy Group until his retirement on June 1, 2022. As shown in the charts below, 86% of Mr. Lauber’s 2022 total direct compensation and an average of 82% of the other NEOs’ 2022 total direct compensation was tied to WEC Energy Group performance and was not guaranteed. Mr. Fletcher’s 2022 compensation is included in the “Other NEOs 2022 Total Direct Compensation Mix” chart below.
| CEO 2022 TOTAL DIRECT COMPENSATION MIX | OTHER NEOs 2022 TOTAL DIRECT COMPENSATION MIX | |
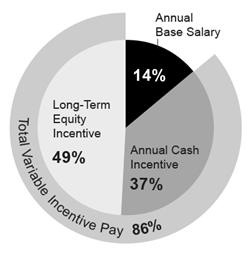 | 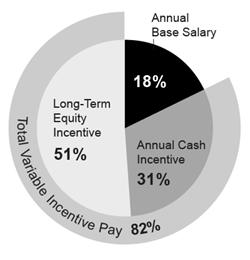 |
In addition to the components of total direct compensation identified above, retirement programs are another important component of our compensation program.
To the extent feasible, WEC Energy Group believes it is important that the compensation program not dilute the interests of its current stockholders. Therefore, WEC Energy Group currently uses open-market purchases to satisfy benefit plan obligations, including the exercise of stock options and awarding of restricted stock.
This Compensation Discussion and Analysis contains a more detailed discussion of each of the above components for 2022, including FW Cook’s recommendations with respect to each component.
| Wisconsin Electric Power Company | 13 | 2023 Annual Meeting Information Statement |
Compensation Governance and Practices
The Compensation Committee annually reviews and considers the Company’s compensation policies and practices to ensure our executive compensation program aligns with our compensation philosophy. Highlighted below is an overview of our current compensation practices.
| What We Do | ||
• Our compensation program focuses on key Company results (financial, safety, customer satisfaction, diversity) that are aligned with WEC Energy Group’s and our strategic goals.
• A substantial portion of compensation is at risk and tied to WEC Energy Group and Company performance.
• The compensation program has a long-term orientation aligned with WEC Energy Group stockholder interests.
• The compensation program includes environmental, social and governance metrics.
• The Compensation Committee retains an independent compensation consultant to help design the compensation program and determine competitive levels of pay.
• The Compensation Committee’s independent compensation consultant reviews competitive employment market data from two general industry surveys and a comparison group of companies similar to WEC Energy Group.
• We have a clawback policy that provides for the recoupment of incentive-based compensation.
• Annual incentive-based compensation contains multiple, pre-established performance metrics aligned with WEC Energy Group’s and the Company’s stockholder and customer interests.
| • The WEC Energy Group 2022 Performance Unit Plan award payouts (including dividend equivalents) are based on WEC Energy Group’s stockholder return as compared to an appropriate peer group and Additional Performance Measure(s), selected by the Compensation Committee. Starting in 2023, award payouts will be based on one or more performance measures selected by the Compensation Committee at the time of the award.
• WEC Energy Group’s Performance Unit Plan and Omnibus Stock Incentive Plan require a separation from service following a change in control for award vesting to occur.
• Equity award and other benefit plan obligations are satisfied through open market purchases of WEC Energy Group common stock.
• Meaningful WEC Energy Group stock ownership levels are required for senior executives.
• Ongoing engagement with investors takes place to ensure that compensation practices are responsive to WEC Energy Group stockholder interests.
• We prohibit hedging and pledging of WEC Energy Group common stock.
• We prohibit entry into any new arrangements that obligate WEC Energy Group or the Company to pay directly or reimburse individual tax liability for benefits provided.
• We prohibit repricing of WEC Energy Group stock options without WEC Energy Group stockholder approval.
| |
Competitive Benchmarking
As a general matter, we believe the labor market for WEC Energy Group and our executive officers is consistent with that of general industry. Although we recognize our business is focused on the energy services industry, our goal is to have an executive compensation program that will allow us to be competitive in recruiting the most qualified candidates to serve as executive officers of WEC Energy Group and the Company, including individuals who may be employed outside of the energy services industry. Further, in order to retain top performing executive officers, we believe our compensation practices must be competitive with those of general industry.
To confirm that our annual executive compensation is competitive with the market, FW Cook reviewed 2022 general industry executive compensation survey data obtained from WTW and Aon Hewitt. FW Cook also analyzed the compensation data from a peer group of 19 companies similar to WEC Energy Group in size and business model. The methodology used by FW Cook to determine the peer group of companies is described below.
FW Cook started with U.S. companies in the Standard & Poor’s database, and then limited those companies to the same line of business as WEC Energy Group as indicated by the Global Industry Classification Standards. This list of companies was then further limited to companies with revenues between $2.6 billion and $23.5 billion (approximately one-third to three times the size of WEC Energy Group’s revenues), and that were within a reasonable size range in various other measures such as operating income, total assets, total employees, and market capitalization. From this list, FW Cook selected companies similar in overall size to WEC Energy Group with consideration given to companies that met one or more of the following criteria:
| • | Diversified, technically sophisticated utility operations (e.g., multiple utilities, electric utilities); and | |
| • | Minimal non-regulated business. |
These criteria resulted in a comparison group of 19 companies with median revenues and market capitalization of approximately $10.5 billion and $21.2 billion, respectively.
| Wisconsin Electric Power Company | 14 | 2023 Annual Meeting Information Statement |
The comparison group utilized for purposes of 2022 compensation includes the same companies as the previous year’s comparison group, with the addition of Dominion Energy, Inc. The comparison group consisted of the 19 companies listed below.
• Alliant Energy Corporation • Ameren Corporation • American Electric Power Company • CMS Energy Corporation • CenterPoint Energy | • Consolidated Edison, Inc. • Dominion Energy, Inc. • DTE Energy Co. • Edison International • Entergy Inc. | • Evergy, Inc. • Eversource Energy • FirstEnergy Corp. • NiSource Inc. • PG&E Corporation | • PPL Corp. • Pinnacle West Capital Corp. • The Southern Company • Xcel Energy Inc. |
The Compensation Committee approved this comparison group.
DETERMINATION OF MARKET MEDIAN
In order to determine the “market median” for our NEOs, FW Cook recommended that the survey data from WTW and Aon Hewitt receive a 75% weighting and the comparison group of 19 companies receive a 25% weighting. The Compensation Committee agreed with this recommendation. The survey data received a higher weighting because we consider the labor market for our executives to be consistent with that of general industry. Using this methodology, FW Cook recommended, and the Compensation Committee approved, the appropriate market median for each of our NEOs.
The comparison of each component of compensation with the appropriate market median when setting the compensation levels of our NEOs generally drives the allocation of cash versus non-cash compensation and short-term versus long-term incentive compensation.
ANNUAL BASE SALARY
The annual base salary component of our executive compensation program provides each executive officer with a fixed level of annual cash compensation. We believe that providing annual cash compensation through a base salary is an established market practice and is a necessary component of a competitive compensation program.
Based upon the market data analyzed by FW Cook, we generally target base salaries to be at or near the market median for each NEO. However, the Compensation Committee may, in its discretion, set base salaries at a different amount when the Compensation Committee deems it appropriate.
Actual salary determinations are made taking into consideration factors such as the relative levels of individual experience, performance, responsibility, market compensation data and contribution to the results of WEC Energy Group’s and the Company’s operations. At the beginning of each year, the WEC Energy Group CEO and the other members of the WEC Energy Group Office of the Chair develop a list of goals for WEC Energy Group and its subsidiaries, including the Company, and their employees to achieve during the upcoming year. The Compensation Committee takes WEC Energy Group’s and the Company’s performance against these goals into consideration when establishing the CEO’s compensation for the upcoming year. The CEO undertakes a similar process with the other NEOs, who develop individual goals related to the achievement of WEC Energy Group’s and the Company’s goals. At the end of the year, each officer’s performance is measured against these goals. The CEO and WEC Energy Group Executive Chairman discuss these results and based on this performance assessment, a compensation recommendation is made to the Compensation Committee for the upcoming year for each executive officer.
2022 Salary Determination Process
Mr. Lauber’s 2022 annual base salary was initially set at $950,000 for his role as Senior Executive Vice President and Chief Operating Officer of WEC Energy Group. However, effective February 1, 2022, when Mr. Lauber became President and CEO of WEC Energy Group, his annual base salary was increased to $1,025,050.
Mr. Fletcher’s annualized base salary was set at $1,087,934, which was unchanged from his 2021 base salary.
With respect to the 2022 base salaries of Mmes. Liu and Kelsey, and Mr. Garvin, in December 2021, recommendations were made to the Compensation Committee based upon a review of the market compensation data provided by FW Cook and the other factors described above. The Compensation Committee approved the recommendations, which represented an average increase in annual base salary of approximately 3.67% for Mmes. Liu and Kelsey, and Mr. Garvin. Mr. Mastoris did not receive a base salary increase in 2022, as his salary was increased when he was appointed Executive Vice President - Customer Service and Operations effective December 1, 2021. The annual base salary of each NEO was at or near the market median.
ANNUAL CASH INCENTIVE COMPENSATION
We provide annual cash incentive compensation through WEC Energy Group’s Short-Term Performance Plan (“STPP”). The STPP provides for annual cash awards to executive officers and other key employees based upon the achievement of pre-established stockholder-, customer-, and employee-focused objectives. All payments under the STPP are at risk. Payments are made only if performance goals are achieved, and awards may be less or greater than targeted amounts based upon actual performance. Payments under the STPP are intended to reward achievement of short-term goals that contribute to WEC Energy Group stockholder and customer (including our customers) value, as well as individual contributions to successful operations.
2022 Target Awards. Each year, the Compensation Committee approves a target level of compensation under the STPP for each of our NEOs. This target level of compensation is expressed as a percentage of base salary.
| Wisconsin Electric Power Company | 15 | 2023 Annual Meeting Information Statement |
Effective February 1, 2022, the target award level for Mr. Lauber was increased to 140% of base salary in recognition of his appointment to President and Chief Executive Officer of WEC Energy Group. Therefore, Mr. Lauber’s STPP payout reflects an 85% target level for January 2022 and a 140% target level for February through the remainder of the year. In recognition of Mr. Fletcher’s service as CEO of WEC Energy Group until February 1, 2022, his target award level was 130%, which is the same as his 2021 target award level.
The year-end 2022 target awards for each NEO (other than Mr. Lauber and Mr. Fletcher, who are discussed above) are set forth in the chart below.
| Executive Officer | Target STPP Award as a Percentage of Base Salary |
| Ms. Liu | 80% |
| Ms. Kelsey | 75% |
| Mr. Garvin | 65% |
| Mr. Mastoris | 70% |
The target award levels of each NEO reflect median incentive compensation practices as indicated by the market data.
For 2022, the possible payout for any NEO ranged from 0% of the target award to 210% of the target award, based upon WEC Energy Group performance.
Supporting Business Fundamentals and Environmental, Social and Governance Commitments. The financial, operational and social goals established under the STPP are linked to key objectives that support WEC Energy Group’s and the Company’s sustainability.
Delivering a cleaner energy future is one of the fundamentals of our business and a major focus of WEC Energy Group’s capital plan. The Compensation Committee assesses management’s performance in achieving long-term strategic sustainability goals through the execution of WEC Energy Group’s capital spending plan. Its ability to fund the capital plan without issuing additional equity has been directly linked with its ability to consistently deliver on WEC Energy Group’s financial plan, which includes meeting the financial goals established under the STPP. These financial measures, which are discussed in more detail below, are key performance indicators underlying our NEOs’ incentive compensation, linking achievement of WEC Energy Group’s long-term strategy through its focus on short-term priorities.
The operational and social goals established under the STPP are tied to achievement of strategic objectives, which include a focus on customer satisfaction, employee safety, and workforce and supplier diversity.
2022 Financial Goals under the STPP. The Compensation Committee adopted the 2022 STPP with a continued focus on financial results. In December 2021, the Compensation Committee approved WEC Energy Group’s earnings per share (75% weight) and cash flow (25% weight) as the primary performance measures to be used in 2022. We continue to believe earnings per share and cash flow are key indicators of financial strength and performance, and are recognized as such by the investment community.
In January 2022, the Compensation Committee approved the performance goals under the STPP for WEC Energy Group’s earnings per share as set forth in the chart below.
| Earnings Per Share Performance Goal | Earnings Per Share CAGR | Payout Level |
| $4.25 | 6.0% | 25% |
| $4.26 | 6.2% | 50% |
| $4.29 | 7.0% | 100% |
| $4.30 | 7.2% | 135% |
| $4.33 | 8.0% | 200% |
If WEC Energy Group’s performance falls between these levels, the payout level with respect to earnings per share is determined by interpolating on a straight line basis the appropriate payout level.
At the time the Compensation Committee established the earnings per share performance goals for 2022, WEC Energy Group’s growth plan called for a compound annual growth rate (“CAGR”) in earnings per share of 6.0% to 7.0%, measured off a 2021 base of $4.01 per share, which represented the mid-point of WEC Energy Group’s original 2021 annual earnings guidance. We believe that achievement of this projected CAGR, plus WEC Energy Group’s continued growth in dividends, supports a premium valuation as compared to WEC Energy Group’s peers. In order to further motivate management, the Compensation Committee determined that the target payout level should equal the high end of the range and the maximum payout levels should exceed the high end of the 6.0% to 7.0% CAGR growth plan. Therefore, the target (100%) and maximum payout level (200%) were tied to 7.0% and 8.0% CAGRs, respectively. The Compensation Committee tied the above-target payout level to achievement of a 7.2% CAGR. Subsequently, in November 2022, WEC Energy Group announced that it tightened its projected CAGR in earnings per share to 6.5% to 7.0%.
| Wisconsin Electric Power Company | 16 | 2023 Annual Meeting Information Statement |
In January 2022, the Compensation Committee approved the performance goals under the STPP for WEC Energy Group’s cash flow as set forth in the chart below ($ in millions).
| Cash Flow | Payout Level |
| $1,775 | 25% |
| $1,825 | 50% |
| $1,875 | 100% |
| $1,925 | 135% |
| $2,000 | 200% |
If WEC Energy Group’s performance falls between these levels, the payout level with respect to cash flow is determined by interpolating on a straight-line basis the appropriate payout level.
The Compensation Committee based the cash flow performance level goals on WEC Energy Group’s “net cash provided by operating activities” and adjusting for certain accruals and other items related to capital spending (“Adjusted Cash From Operations”). GAAP requires these items to be recorded as part of cash from operations, but management views them as related to WEC Energy Group’s capital expenditure program. The Compensation Committee believes that basing the cash flow performance goals on Adjusted Cash From Operations provides a more accurate measurement of the cash generated by WEC Energy Group’s operations that is available for capital investment, which is WEC Energy Group’s and the Company’s primary driver for earnings growth. Adjusted Cash From Operations is not a measure of financial performance under GAAP, and our calculation may differ from similarly titled measures used by other companies or securities rating agencies.
2022 Financial Performance under the STPP. In January 2023, the Compensation Committee reviewed actual performance for 2022 against the financial, operational and social performance goals established under the STPP, subject to final audit.
WEC Energy Group’s 2022 financial performance satisfied the maximum payout level established for earnings per share and cash flow. WEC Energy Group’s earnings per share were $4.45 for 2022. WEC Energy Group’s cash flow, based on Adjusted Cash From Operations, was $2,142.0 million. WEC Energy Group’s cash flow result is not a measure of financial performance under GAAP.
By satisfying the maximum payout level with respect to these financial measures, the NEOs earned 200% of the target award from the financial goal component of the STPP.
2022 WEC Energy Group Operational and Social Performance Goals under the STPP. In December 2021 and January 2022, the Compensation Committee also approved operational and social performance measures and targets under the STPP that promote certain of WEC Energy Group’s and the Company’s priorities. The Compensation Committee identified commitment to customer satisfaction, supplier and workforce diversity, and safety as critical to the success of WEC Energy Group and the Company. For that reason, annual incentive awards could be increased or decreased by up to 10% of the actual award based upon WEC Energy Group’s performance in the areas of customer satisfaction (5% weight), safety (2.5% weight), and supplier and workforce diversity (2.5% weight).
The Compensation Committee measures customer satisfaction levels for WEC Energy Group based upon the results of surveys that an independent third party conducts of customers who had direct contact with WEC Energy Group’s utilities, including us, during the year, which measure (i) customers’ satisfaction with the respective utility overall, and (ii) customers’ satisfaction with respect to the particular transactions with the applicable utility.
Safety is measured based upon WEC Energy Group’s performance against the number of lost-time injuries and Days Away, Restricted or Transferred (“DART”) recordable incidents.
Beginning with the 2022 STPP award, the Compensation Committee started using DART as one of the safety metrics instead of OSHA Recordable Injuries. DART is a metric that focuses on more significant injuries and measures how many workplace injuries and illnesses resulted in employees missing work, required restricted work activities or resulted in job transfers. The change is consistent with the trend in the Company’s industry to focus safety practices and efforts on preventing the most severe injuries.
The operational performance measures are based upon recommendations from management and take into consideration both current-year performance and WEC Energy Group’s longer-term objective of achieving top quartile performance of all of its principal utilities, including us. The Compensation Committee reviews management’s recommendations and may make adjustments to the performance measures if it determines changes are necessary. The following table provides the operational and social goals approved by the Compensation Committee for 2022, as well as WEC Energy Group’s performance (which includes the Company’s performance) against these goals:
| Wisconsin Electric Power Company | 17 | 2023 Annual Meeting Information Statement |
| Operational Measure | Below Goal | Goal | Above Goal | Final Result |
| Customer Satisfaction Percentage of “Highly Satisfied”: | -5.00% | 0.00% | +5.00% | |
| WEC Energy Group | <79.5% | 79.5% - 82.3% | >82.3% | 80.4% |
| Transaction | <82.1% | 82.1% - 84.3% | >84.3% | 83.6% |
| Safety: | -2.50% | 0.00% | +2.50% | |
| DART-recordable injuries | >130 | 123 - 130 | <123 | 72 |
| Lost-time injuries | >52 | 30 - 52 | <30 | 25 |
| Diversity: | -2.50% | 0.00% | +2.50% | |
| Supplier ($ in Millions) | <212.0 | 212 - 272.0 | >272.0 | 299.4 |
| Workforce - Assessment | Not Met | Met | Exceeded | Exceeded |
WEC Energy Group’s performance against the safety and diversity goals generated a 5.0% increase to the compensation awarded under the STPP for 2022.
The Compensation Committee retains the right to exercise discretion in adjusting awards under the STPP when it deems appropriate, but did not factor individual contributions into determining the amount of the awards for the NEOs for 2022. Because WEC Energy Group’s performance against the financial, operational and social goals resulted in significant STPP awards in 2022, the Compensation Committee determined that no further adjustments based upon individual contributions or otherwise were appropriate.
Based upon performance against the financial, operational and social goals established by the Compensation Committee, Mr. Lauber received annual incentive cash compensation under the STPP of $2,832,628 for 2022. This represented 276% of his annual base salary. Mmes. Liu and Kelsey, and Messrs. Garvin and Mastoris, each received annual cash incentive compensation for 2022 under the STPP equal to 162%, 152%, 131%, and 139% of their respective annual base salaries, representing 205% of the target award for each officer. Mr. Fletcher’s 2022 annual cash incentive compensation of $1,207,397 equals 267% of his pro-rated 2022 annual base salary, representing 205% of his pro-rated target award.
LONG-TERM INCENTIVE COMPENSATION
The Compensation Committee administers the WEC Energy Group Omnibus Stock Incentive Plan, amended and restated effective as of May 6, 2021 (the “OSIP”), which is a WEC Energy Group stockholder-approved, long-term incentive plan designed to link the interests of executives and other key employees of WEC Energy Group and the Company to creating long-term stockholder value. It allows for various types of awards tied to the performance of WEC Energy Group’s common stock, including WEC Energy Group stock options, stock appreciation rights, and restricted stock. The Compensation Committee also administers the WEC Energy Group Performance Unit Plan, under which the Compensation Committee may award performance units. The Compensation Committee primarily uses WEC Energy Group (1) performance units, including dividend-equivalents, (2) stock options, and (3) restricted stock to deliver long-term incentive opportunities.
Amended and Restated Performance Unit Plan. On December 1, 2022, the Compensation Committee amended and restated the WEC Energy Group Performance Unit Plan, effective as of January 1, 2023 (the “Amended PUP”).
Pursuant to the Amended PUP, performance units will vest based upon WEC Energy Group’s performance during a three-year period against one or more performance measures selected by the Compensation Committee at the beginning of the performance period. The Compensation Committee may determine achievement of a performance measure on an annual basis or over the entire three-year performance period. The Compensation Committee will determine the vesting percentages of the performance units, and performance measures may have the same or different weightings with respect to performance unit vesting. Achievement within a performance measure may be determined based upon WEC Energy Group’s rank in comparison to a peer group of companies or by reaching stated levels of performance. The Compensation Committee will also select the target(s) for each performance measure and the potential impact to the vesting percentage based on achievement of the performance measure(s) relative to the selected target(s). In no event will the vesting percentage over the three-year performance period be less than zero or more than 200%.
The Amended PUP governs the terms of performance units starting with the 2023 award. The performance units awarded in January 2022 were awarded under the prior version of the performance unit plan (the “Prior PUP”), the terms of which are described herein.
Performance Units. Each year, the Compensation Committee makes annual grants of WEC Energy Group performance units under the performance unit plan. The performance units are designed to provide a form of long-term incentive compensation that aligns the interests of management with those of a typical utility stockholder who is focused not only on stock price appreciation but also on dividends. Payouts of the 2022 performance units are based upon WEC Energy Group’s level of “total stockholder return” (stock price appreciation plus reinvested dividends) in comparison to a peer group of companies over a three-year performance period, and may be adjusted based upon WEC Energy Group’s performance against one or more Additional Performance Measures. The performance units are settled in cash.
Selection of Additional Performance Measure(s). “Additional Performance Measure” is defined in the Prior PUP as the performance criterion or criteria (if any) that the Compensation Committee selects, in its sole discretion, based upon the attainment of specific levels of performance by WEC Energy Group. Pursuant to the terms of the Prior PUP, performance units vest in an amount between 0% and
| Wisconsin Electric Power Company | 18 | 2023 Annual Meeting Information Statement |
175% of the target award based upon WEC Energy Group’s comparative total stockholder return over a three-year performance period. However, the vesting percentage may be adjusted based upon WEC Energy’s performance against the Additional Performance Measure(s). The Additional Performance Measure(s), if any, were selected by the Compensation Committee at the beginning of the three-year performance period. For each year during the performance period, the Compensation Committee selected the target(s) for the Additional Performance Measure(s) and the potential adjustment to the vesting percentage for that year based upon achievement of the Additional Performance Measure(s) relative to the selected target(s). The actual adjustment, if any, to the vesting percentage based upon the Additional Performance Measure(s) is determined annually. In no event will any adjustment cause the vesting percentage over the three-year performance period to be less than zero.
Short-Term Dividend Equivalents. Pursuant to the terms of the Prior PUP, we increase the number of unvested performance units as of any date that WEC Energy Group declares a cash dividend on its common stock by the amount of short-term dividend equivalents a participant is entitled to receive. Short-term dividend equivalents are calculated by multiplying (a) the number of unvested performance units held by a plan participant as of the related dividend record date by (b) the amount of cash dividend payable by WEC Energy Group on a share of its common stock; and (c) dividing the result by the closing price for a share of WEC Energy Group’s common stock on the dividend payment date. In effect, short-term dividend equivalents are credited and accumulated as reinvested dividends on each performance unit so that the performance units and accumulated dividends will be paid out at the end of the three-year performance period, rather than paying out the dividend equivalents annually on unearned performance units.
Short-term dividend equivalents are treated as additional unvested performance units and are subject to the same vesting, forfeiture, payment, termination, and other terms and conditions as the original performance units to which they relate. In addition, outstanding short-term dividend equivalents are treated as unvested performance units for purposes of calculating future short-term dividend equivalents.
Short-term dividend equivalents are also a part of the Amended PUP and are calculated in the same manner.
Stock Options. Each year, the Compensation Committee also makes annual WEC Energy Group stock option grants as part of the long-term incentive program. These stock options have an exercise price equal to the fair market value of WEC Energy Group’s common stock on the date of grant and expire on the 10th anniversary of the grant date. Since management benefits from a stock option award only to the extent WEC Energy Group’s stock price appreciates above the exercise price of the stock option, stock options align the interests of management with those of WEC Energy Group stockholders in attaining long-term stock price appreciation.
Restricted Stock. The Compensation Committee also awards WEC Energy Group restricted stock as part of the long-term incentive plan, consistent with market practice. Similar to performance units, restricted stock aligns the interests of management with a typical utility stockholder who is focused on stock price appreciation and dividends.
Aggregate 2022 Long-Term Incentive Awards. Generally, when establishing the target value of long-term incentive awards and the appropriate mix of WEC Energy Group performance units, stock options, and restricted stock for each NEO, the Compensation Committee reviews the market compensation data and analysis provided by FW Cook. Based upon FW Cook’s analysis, for 2022 the Compensation Committee determined that the long-term incentive awards would be weighted 65% performance units, 20% stock options, and 15% restricted stock for our NEOs. Target values also were presented to and approved by the Compensation Committee in December 2021.
Based upon the market data provided by FW Cook, we customarily target the long-term incentive award to be at or near the market median value of long-term incentive compensation for each executive officer’s position. All of the NEOs’ long-term incentive awards were within this target range for 2022. The following provides the 2022 target long-term incentive award value for each NEO:
| Executive Officer | Target LTI Award as a Percentage of Base Salary |
| Mr. Lauber | 330% |
| Mr. Fletcher | 275% |
| Ms. Liu | 225% |
| Ms. Kelsey | 160% |
| Mr. Garvin | 160% |
| Mr. Mastoris | 135% |
Although awarded in January 2022, Mr. Lauber’s target award reflects his appointment as President and Chief Executive Officer of WEC Energy Group effective February 1, 2022. Mr. Fletcher’s target award is the same as 2021.
2022 Stock Option Grants. In December 2021, the Compensation Committee approved the grant of WEC Energy Group stock options to each of our NEOs and established an overall pool of options that were granted to approximately 170 other employees. The annual option grants to the NEOs were made effective January 3, 2022, the first trading day of 2022.
All such options were granted with an exercise price equal to the average of the high and low prices reported on the NYSE for shares of WEC Energy Group common stock on the grant date. The January 2022 options were granted in accordance with WEC Energy Group’s standard practice of making annual stock option grants effective on the first trading day of each year, and the timing of the grants was not tied to the timing of any release of material information.
All 2022 stock options have a term of 10 years and vest 100% on the third anniversary of the date of grant. The vesting of the stock options may be accelerated in connection with a termination of employment due to a change in control of WEC Energy Group or an executive officer’s termination of employment under certain circumstances. See “Potential Payments upon Termination or Change in
| Wisconsin Electric Power Company | 19 | 2023 Annual Meeting Information Statement |
Control” beginning on page 33 for additional information. Subject to the limitations of the OSIP, the Compensation Committee has the power to amend the terms of any option (with the participant’s consent). However, without WEC Energy Group stockholder approval, the Committee may not reduce the exercise price of existing options or cancel outstanding options in exchange for cash or other options having a lower exercise price.
For purposes of determining the appropriate number of options to grant to a particular NEO, the value of an option was determined based upon the Black-Scholes option pricing model. We use the Black-Scholes option pricing model for purposes of the compensation valuation. The following table provides the number of options granted to each NEO in 2022:
| Executive Officer | Options Granted |
| Mr. Lauber | 58,121 |
| Mr. Fletcher | 51,406 |
| Ms. Liu | 29,331 |
| Ms. Kelsey | 16,181 |
| Mr. Garvin | 14,128 |
| Mr. Mastoris | 9,046 |
For financial reporting purposes, the stock options granted on January 3, 2022 had a grant date fair value of $14.71 per option.
2022 Restricted Stock Awards. In December 2021, the Compensation Committee also approved the grant of restricted stock to each of our NEOs and established an overall pool of restricted stock that was granted to approximately 170 other employees. The grants were made effective January 3, 2022.
The restricted stock vests in three equal annual installments beginning on the one year anniversary of the applicable grant date. Subject to very limited exceptions, restricted stock awarded to the Company’s executive officers, including the NEOs, is subject to a minimum one-year holding period following the vesting date. The vesting of the restricted stock may be accelerated in connection with a termination of employment due to a change in control of WEC Energy Group, death or disability, or by action of the Compensation Committee. See “Potential Payments upon Termination or Change in Control” beginning on page 33 for additional information. Tax withholding obligations related to vesting may be satisfied, at the option of the executive officer, by withholding shares otherwise deliverable upon vesting or by cash. The NEOs have the right to vote the restricted stock and to receive cash dividends when WEC Energy Group pays a dividend to its stockholders.
For purposes of determining the appropriate number of shares of restricted stock to grant to a particular NEO, the Compensation Committee used a value of $92.088 per share. This value was based upon the volume-weighted price of WEC Energy Group’s common stock for the ten trading days beginning on December 1, 2021, and ending on December 14, 2021. The Compensation Committee uses the volume-weighted price for annual awards in order to minimize the impact of day-to-day volatility in the stock market.
The measurement period is customarily early- to mid-December for annual awards in order to shorten the timeframe between the calculation of the awards and the actual grant date. The following table provides the number of shares of restricted stock granted to each NEO in 2022:
| Executive Officer | Restricted Stock Granted |
| Mr. Lauber | 5,510 |
| Mr. Fletcher | 4,873 |
| Ms. Liu | 2,781 |
| Ms. Kelsey | 1,534 |
| Mr. Garvin | 1,339 |
| Mr. Mastoris | 858 |
2022 Performance Units. In December 2021, the Compensation Committee granted performance units to each of our NEOs and approved a pool of performance units that were granted to approximately 170 other employees.
With respect to the 2022 performance units, the amount of the benefit that ultimately vests will be dependent upon WEC Energy Group’s total stockholder return over a three-year period ending December 31, 2024, as compared to the total stockholder return of the custom peer group described below. Total stockholder return is the calculation of total return (stock price appreciation plus reinvestment of dividends) based upon an initial investment of $100 and subsequent $100 investments at the end of each quarter during the three-year performance period. However, the vesting percentage may be adjusted based upon WEC Energy Group’s performance against the Additional Performance Measure. For the 2022 performance unit awards, the Compensation Committee selected performance against the weighted average authorized return on equity of all WEC Energy Group’s utility subsidiaries, including us, as the Additional Performance Measure.
Upon vesting, the performance units will be settled in cash in an amount determined by multiplying the number of performance units that have vested by the closing price of WEC Energy Group’s common stock on the last trading day of the performance period.
| Wisconsin Electric Power Company | 20 | 2023 Annual Meeting Information Statement |
The 2022 performance unit peer group against which WEC Energy Group’s performance will be measured includes:
| • Alliant Energy Corporation | • Dominion Energy, Inc. | • Eversource Energy | • The Southern Company |
| • Ameren Corporation | • DTE Energy Co. | • FirstEnergy Corp. | • Xcel Energy Inc. |
| • American Electric Power Company | • Duke Energy Corp. | • NiSource Inc. | |
| • CMS Energy Corporation | • Edison International | • OGE Energy Corp. | |
| • Consolidated Edison, Inc. | • Evergy, Inc. | • Pinnacle West Capital Corp. |
The peer group is chosen by the Compensation Committee, based upon management’s recommendation and with the concurrence of FW Cook. This peer group was chosen because we believe these companies are similar to WEC Energy Group in terms of business model and long-term strategies, with a primary focus on regulated utility operations rather than a non-regulated business model. There is significant overlap between the performance unit peer group and the comparison group developed by FW Cook for purposes of benchmarking compensation levels. However, there are several companies that are different among the two groups because FW Cook places significant weight on the financial metrics of the companies included in its comparison group, whereas we focus more on operational measures for the performance unit peer group.
In December 2022, the Compensation Committee determined that PG&E Corporation (“PG&E”) was no longer an appropriate peer comparison and approved the removal of PG&E from the custom peer group for the outstanding 2020-2022 performance unit awards. PG&E is a public utility holding company whose primary operating subsidiary sells and delivers electricity and natural gas to customers located in Northern and Central California. As a result, PG&E is subject to a significantly increased financial risk from wildfires and other natural disasters. In fact, in 2020 PG&E emerged from bankruptcy resulting from incidents related to these risks. In addition, some financial analysts have recently dropped their coverage of PG&E.
The required percentile ranking for 3-year total stockholder return and the applicable vesting percentage are set forth in the chart below.
| Performance Percentile Rank | Vesting Percent |
| < 25th Percentile | 0% |
| 25th Percentile | 25% |
| Target (50th Percentile) | 100% |
| 75th Percentile | 125% |
| 90th Percentile | 175% |
If WEC Energy Group’s rank is between the benchmarks identified above, the vesting percentage will be determined by interpolating on a straight line basis the appropriate vesting percentage. Unvested performance units generally are immediately forfeited upon a NEO’s cessation of employment with WEC Energy Group prior to completion of the three-year performance period. However, the performance units will vest immediately at the target 100% rate upon the termination of the NEO’s employment (1) by reason of disability or death or (2) after a change in control of WEC Energy Group. In addition, a prorated number of performance units (based upon the target 100% rate) will vest upon the termination of employment of the NEO by reason of retirement prior to the end of the three-year performance period.
Pursuant to the terms of the performance unit plan, the vesting percentage of the performance units may be adjusted downwards or upwards based upon WEC Energy Group’s performance against an Additional Performance Measure. Similar to the performance units awarded in 2020 and 2021, the Additional Performance Measure for the 2022 performance unit awards is the weighted average authorized return on equity (“ROE”) of all WEC Energy Group’s utility subsidiaries, including us. In order for WEC Energy Group to meet its earnings per share targets, it is important that WEC Energy Group’s utilities (including the Company) earn at or close to their allowed rates of return. WEC Energy Group’s performance against this measure may decrease or increase the vesting percentage of the performance units up to 10% over the three-year performance period. The ROE target is based upon a formulaic calculation that varies each year based on WEC Energy Group’s past and planned investments among its utilities, as well as each utility’s authorized ROE. For the 2020, 2021, and 2022 performance unit awards, the ROE targets and potential adjustments were set as follows for 2022:
| If Actual Annual ROE is | The Annual Adjustment is | ROE Ranges |
| ≤ 20 bp below the Authorized ROE | + 3.33% | ≥ 9.61% |
| 21 - 30 bp below the Authorized ROE | 0% | 9.60% - 9.51% |
| > 30 bp below the Authorized ROE | (3.33)% | < 9.51% |
WEC Energy Group’s utility subsidiaries achieved a weighted average authorized ROE of 9.81% for 2022. This resulted in a 3.33% increase in the vesting percentage of the performance units awarded in January 2022, January 2021 and January 2020.
For purposes of determining the appropriate number of performance units to grant to a particular NEO, the Compensation Committee used a value of $92.088 per unit, the same value used for the 2022 restricted stock granted in January 2022.
| Wisconsin Electric Power Company | 21 | 2023 Annual Meeting Information Statement |
The following table provides the number of performance units granted to each NEO in 2022, at the 100% target level:
| Executive Officer | Performance Units Granted |
| Mr. Lauber | 23,876 |
| Mr. Fletcher | 21,118 |
| Ms. Liu | 12,049 |
| Ms. Kelsey | 6,647 |
| Mr. Garvin | 5,804 |
| Mr. Mastoris | 3,716 |
2022 Payouts under Long-Term Incentive Awards Granted in 2020. The Compensation Committee granted WEC Energy Group performance unit awards to participants in the Performance Unit Plan in 2020. The terms of these performance units were substantially similar to those of the performance units granted in 2022 and described above. The required percentile ranks for total stockholder return and related vesting schedule were identical to that of the 2022 performance units.
Other than the inclusion of Dominion Energy, Inc. for the 2022 performance unit awards, payouts under the 2020 performance units were based upon WEC Energy Group’s total stockholder return for the three-year performance period ended December 31, 2022 against the same group of peer companies used for the 2022 performance unit awards.
As previously described, the Compensation Committee amended and restated WEC Energy Group’s Performance Unit Plan, effective as of January 1, 2023, making several changes to the plan design. For purposes of calculating total shareholder return, the Prior PUP, under which the 2020 performance units were awarded, requires an initial investment of $100 and $100 investments each quarter thereafter for the duration of the three-year performance period. On the other hand, the plans of our peer companies require only the initial $100 investment. Investing $100 each quarter rewards those companies whose stock price drops significantly during the performance period compared to their peers, and then increases even if such increase is in line with the rest of their peers. Management and the Compensation Committee reviewed the performance of companies whose stock price significantly underperformed WEC Energy Group’s stock price between the start and end of the performance period, yet would have ranked higher in the total stockholder return calculation under WEC Energy Group’s plan. These companies were Edison International, First Energy, OGE Energy Corp. and Pinnacle West Capital. The stock price of these four companies dropped significantly during the three-year performance period for strategic, operational and/or regulatory reasons specific to each company.
As a result, when calculating the total stockholder return for these companies, the Compensation Committee adjusted for their significant underperformance during the performance period. Accounting for these adjustments, as well as the removal of PG&E Corporation from the peer group for all outstanding performance unit awards, resulted in a total stockholder return for WEC Energy Group at the 43.8th percentile of the peer group for the three-year performance period ended December 31, 2022, resulting in the performance units vesting at a level of 81.3%. The cumulative three-year impact of performance against the Additional Performance Measure was a 10% increase in the vesting percentage of the performance units for a total vesting level of 91.3%. The actual payouts were determined by multiplying the number of vested performance units by the closing price of WEC Energy Group common stock ($93.76) on December 30, 2022, the last trading day of the performance period. The actual payout to each NEO is reflected in the “Option Exercises and Stock Vested for Fiscal Year 2022” table.
COMPENSATION RECOUPMENT POLICY
Accountability is a fundamental value of WEC Energy Group and the Company. To reinforce this value through the executive compensation program, the Compensation Committee has adopted a clawback policy that provides for the recoupment of incentive-based compensation in the event WEC Energy Group is required to prepare an accounting restatement due to material noncompliance with any financial reporting requirement under the securities laws (other than restatements permitted as a result of changes in accounting principles or interpretation). Pursuant to the policy, the Compensation Committee will recover from any current or former executive officer who has received incentive-based compensation during the three-year period preceding the date on which WEC Energy Group is required to prepare the accounting restatement, any portion of the incentive-based compensation paid in excess of what would have been paid to the executive officer under the restated financial results. WEC Energy Group may also recover incentive-based compensation if an executive officer’s employment is terminated for cause, or the executive officer violates a noncompetition or other restrictive covenant.
STOCK OWNERSHIP GUIDELINES
The Compensation Committee believes that an important adjunct to the long-term incentive program is significant stock ownership by officers who participate in the program, including the NEOs. Accordingly, the Compensation Committee has implemented stock ownership guidelines requiring officers who participate in the long-term incentive program to hold an amount of WEC Energy Group common stock and other equity-related WEC Energy Group securities that varies depending upon such officer’s level.
In addition to shares owned outright, holdings of each of the following are included in determining compliance with the stock ownership guidelines: restricted stock; WEC Energy Group phantom stock units held in the Executive Deferred Compensation Plan and Non-Qualified Retirement Savings Plan; WEC Energy Group stock held in WEC Energy Group’s 401(k) plans; performance units at target; and shares held in a brokerage account, jointly with an immediate family member or in a trust.
| Wisconsin Electric Power Company | 22 | 2023 Annual Meeting Information Statement |
The guidelines require each executive officer, including the NEOs, to acquire (generally within five years of appointment as an executive officer) and hold common stock and other equity-related securities of WEC Energy Group having a minimum fair market value ranging from 250% to 600% of base salary. The Compensation Committee believes these stock ownership guidelines discourage unreasonable risk-taking by officers.
The Compensation Committee annually reviews whether executive officers are in compliance with these guidelines. The last review was completed in October 2022. The Compensation Committee determined that all NEOs are in compliance, or making sufficient progress towards compliance, with these guidelines.
PROHIBITION ON HEDGING AND PLEDGING
WEC Energy Group’s Corporate Securities Trading Policy prohibits directors and active employees (including officers) or any of their designees from using any strategies or products (including derivatives, short-selling techniques, prepaid variable forward contracts, equity swaps, collars, and exchange funds) that hedge or offset, or are designed to hedge or offset, any potential changes in the value of WEC Energy Group’s common stock. The policy applies to WEC Energy Group common stock granted to the employees or directors by WEC Energy Group as part of their compensation or held directly or indirectly by employees or directors. The policy also prohibits the holding of WEC Energy Group securities in a margin account, as well as the pledging of WEC Energy Group securities as collateral for a loan.
LIMITED TRADING WINDOWS
Officers, including the NEOs, other identified employees, and WEC Energy Group directors may only transact in WEC Energy Group securities during approved trading windows after satisfying mandatory pre-clearance requirements, or subject to a 10b5-1 trading plan approved during an open trading window.
RETIREMENT PROGRAMS
WEC Energy Group also maintains retirement plans in which our NEOs participate: a defined benefit pension plan of the cash balance type, a supplemental pension plan, individual letter agreements with some of the NEOs, a 401(k) plan, and a non-qualified retirement savings plan. We believe these retirement plans are a valuable benefit in the attraction and retention of our employees, including the NEOs. We believe that providing a foundation for long-term financial security for our employees, beyond their employment with the Company, is a valuable component of our overall compensation program which will inspire increased loyalty and improved performance. For more information about the retirement plans, see “Pension Benefits at Fiscal Year-End 2022” and “Retirement Plans” beginning on page 30.
OTHER BENEFITS, INCLUDING PERQUISITES
We provide our executive officers, including the NEOs, with employee benefits and a limited number of perquisites. Except as specifically noted elsewhere in this information statement, the employee benefits programs in which executive officers participate (which provide benefits such as medical coverage, retirement benefits, annual contributions to a qualified savings plan, and moving and relocation costs) are generally the same programs offered to substantially all of the Company’s management employees.
The perquisites made available to executive officers include financial planning, membership in a service that provides health care and safety management when traveling outside the United States, reimbursement for expenses related to annual physical exam costs not covered by insurance, and limited spousal travel for business purposes. The Company also pays periodic dues and fees for club memberships for certain of the NEOs and other designated officers.
WEC Energy Group customarily reviews market data regarding executive perquisite practices on an annual basis. For 2022, the Compensation Committee again reviewed the package of perquisites with FW Cook and decided not to make any changes. WEC Energy Group and the Company have a legacy group of executives who are still eligible for gross-ups. We reimburse those executives for taxes paid on income attributable to the financial planning benefits provided to the executives only if the executive uses either of the Company’s identified preferred providers, Annex Wealth Management or AYCO. We believe the use of the preferred financial advisers provides administrative benefits and eases communication between WEC Energy Group personnel and the financial advisers.
We pay periodic dues and fees for certain club memberships as we have found that the use of these facilities helps foster better customer and community relationships. Officers, including the NEOs, are expected to use clubs for which the Company pays dues primarily for business purposes. We do not pay any additional expenses incurred for personal use of these facilities, and officers are required to reimburse the Company to the extent that it pays for any such personal use. We do not permit personal use of the airplane available to WEC Energy Group. We do allow spousal travel if an executive’s spouse is accompanying the executive on business travel and the airplane is not fully utilized by WEC Energy Group personnel. There is no incremental cost to WEC Energy Group or the Company for this travel, other than the reimbursement for taxes paid on imputed income attributable to the executives for this perquisite, as the airplane cost is the same regardless of whether or not an executive’s spouse travels. Any tax reimbursement is subject to the Company’s Tax Gross-Up Policy discussed below.
In addition, each of our executive officers is eligible to participate in an officer life insurance benefit. If an executive officer chooses to participate, upon such officer’s death while employed by WEC Energy Group and/or the Company, a benefit is paid to his or her designated beneficiary in an amount equal to the value of three times the officer’s base salary at the time of death.
| Wisconsin Electric Power Company | 23 | 2023 Annual Meeting Information Statement |
TAX GROSS-UP POLICY
The Compensation Committee adopted a formal policy that prohibits entry into any contract, agreement, or arrangement with any officer of WEC Energy Group or its subsidiaries, including the Company, that obligates the Company to pay directly or reimburse the officer for any portion of the officer’s individual tax liability for benefits provided by the Company. Excluded from this policy are (1) agreements or arrangements entered into prior to December 2014 when the policy was adopted, (2) agreements or arrangements entered into prior to, and assumed by WEC Energy Group or the Company in connection with, any merger or acquisition, or (3) plans or policies applicable to Company employees generally.
SEVERANCE BENEFITS AND CHANGE IN CONTROL
Mr. Fletcher, who retired effective June 1, 2022, was a party to an employment agreement with WEC Energy Group that included severance benefits. In conjunction with his retirement, Mr. Fletcher was not entitled to any of these benefits. None of the remaining NEOs, including Mr. Lauber, have entered into an employment agreement that provides for severance and change in control benefits. However, they are eligible to participate in WEC Energy Group’s Severance Pay Plan. For a discussion of the severance benefits available to our executive officers generally, see “Potential Payments upon Termination or Change in Control” located on page 33.
In addition, WEC Energy Group’s supplemental pension plan provides that in the event of a change in control, participants will be entitled to a lump sum payment of amounts due under the plan if employment is terminated within 18 months of the change in control.
IMPACT OF PRIOR COMPENSATION
The Compensation Committee does not believe it is appropriate to consider the amounts realized or realizable from prior incentive compensation awards when establishing future levels of short-term and long-term incentive compensation.
TAX AND ACCOUNTING CONSIDERATIONS
When reviewing and adjusting WEC Energy Group’s and the Company’s compensation program, the Compensation Committee considers factors that may have an impact on WEC Energy Group’s and the Company’s financial performance, including tax and accounting rules. Section 162(m) of the Internal Revenue Code limits the tax deductibility of compensation paid to certain covered employees, generally including the NEOs, to $1 million in any year per person. Although the Compensation Committee takes into consideration the provisions of Section 162(m), it believes that maintaining tax deductibility is only one consideration among many in the design of an effective executive compensation program. Accordingly, achieving the desired flexibility in the design and delivery of compensation may result in compensation that in certain cases is not deductible for federal income tax purposes.
RETENTION AGREEMENT
Due to unforeseen medical circumstances in 2017 involving WEC Energy Group’s and the Company’s then-CEO, WEC Energy Group, under its Board’s careful oversight, was required to adjust its CEO succession plan and accelerate the development of the next generation of company leadership. Since that time, WEC Energy Group and the Company have continued to deliver strong results and shareholder value.
With his appointment, effective February 1, 2022, Mr. Lauber became WEC Energy Group’s and the Company’s fourth CEO in six years. In order to provide sufficient time for longer term succession planning, the Compensation Committee determined it was in WEC Energy Group’s best interest to incentivize Mr. Lauber, age 56 at that time, to remain with WEC Energy Group until his retirement.
As we previously disclosed, on February 21, 2022, WEC Energy Group and Mr. Lauber entered into a letter agreement, which was approved by the Compensation Committee after consideration of input from FW Cook. Pursuant to the terms of this agreement, WEC Energy Group will credit an annual contribution of $300,000 to a nonqualified account beginning February 21, 2022. So long as Mr. Lauber remains employed by WEC Energy Group, an additional $300,000 will be credited annually on February 1, until a maximum of 10 contributions have been made. In addition, the account will be credited with interest at a rate of 5.0% annually, which is equivalent to the interest crediting rate under WEC Energy Group’s cash balance pension plan. The account would vest upon the sixth such contribution, at which time Mr. Lauber will be 61, or upon Mr. Lauber’s death or disability.
COMPENSATION COMMITTEE REPORT
The Compensation Committee has reviewed and discussed the Compensation Discussion and Analysis required by Item 402(b) of Regulation S-K with management and, based on such review and discussions, the Compensation Committee recommended to the Board that the Compensation Discussion and Analysis be included in this information statement.
| The Compensation Committee of WEC Energy Group, Inc. | |
| Ulice Payne, Jr., Committee Chair | |
| William M. Farrow III | |
| Thomas K. Lane |
| Wisconsin Electric Power Company | 24 | 2023 Annual Meeting Information Statement |
EXECUTIVE COMPENSATION
The following table summarizes total compensation awarded to, earned by, or paid to the Company’s Chief Executive Officer (“CEO”), Chief Financial Officer (“CFO”), and each of the other individuals identified in the table below (the “NEOs”). The amounts shown in this and all subsequent tables in this information statement are WEC Energy Group consolidated compensation data.
SUMMARY COMPENSATION TABLE
| (5) | (6) | (7) | (8) | (9)(10) | ||||||
| Name and Principal Position | Year | Salary | Bonus | Stock Awards | Option Awards | Non-Equity Incentive Plan Compensation | Change in Pension Value and Nonqualified Deferred Compensation Earnings | All Other Compensation | Total | Total Without Change in Pension Value |
| ($) | ($) | ($) | ($) | ($) | ($) | ($) | ($) | ($) | ||
| Scott J. Lauber(1) Chairman of the Board, CEO and President | 2022 | 1,027,925 | — | 2,822,085 | 854,960 | 2,832,628 | 177,482 | 434,381 | 8,149,461 | 8,047,466 |
| 2021 | 921,719 | — | 1,577,250 | 615,740 | 1,555,544 | 199,430 | 117,568 | 4,987,251 | 4,833,031 | |
| 2020 | 750,923 | — | 1,354,142 | 419,612 | 1,269,733 | 201,143 | 101,459 | 4,097,012 | 3,918,311 | |
| J. Kevin Fletcher(1) Retired Chairman of the Board and CEO | 2022 | 452,193 | — | 3,531,880(2) | 756,182 | 1,207,397 | 2,173,669 | 30,190 | 8,151,511 | 6,171,519 |
| 2021 | 1,102,727 | — | 2,331,500 | 910,166 | 2,846,308 | 11,157,354 | 133,816 | 18,481,871 | 7,425,415 | |
| 2020 | 1,068,828 | — | 2,388,372 | 720,763 | 2,717,859 | 11,082,248 | 158,101 | 18,136,171 | 7,098,443 | |
| Xia Liu Executive Vice President and CFO | 2022 | 766,549 | — | 1,424,199 | 431,459 | 1,244,278 | 965 | 446,979 | 4,314,429 | 4,314,429 |
| 2021 | 739,450 | — | 1,279,120 | 499,356 | 1,174,535 | 812 | 356,739 | 4,050,012 | 4,050,012 | |
| 2020 | 423,519 | 100,000(3) | 1,678,010(3) | 456,977 | 684,975 | — | 306,688 | 3,650,169 | 3,650,169 | |
| Margaret C. Kelsey Executive Vice President, General Counsel and Corporate Secretary | 2022 | 593,767 | — | 785,663 | 238,023 | 904,973 | 683 | 162,781 | 2,685,890 | 2,685,890 |
| 2021 | 579,232 | — | 712,544 | 278,150 | 862,542 | 858 | 160,981 | 2,594,307 | 2,594,307 | |
| 2020 | 564,702 | — | 734,188 | 221,561 | 861,570 | 2,500 | 157,591 | 2,542,112 | 2,542,112 | |
| Robert M. Garvin Executive Vice President - External Affairs | 2022 | 522,428 | — | 685,978 | 207,823 | 684,792 | 123,272 | 84,402 | 2,308,695 | 2,201,990 |
| 2021 | 500,873 | — | 539,076 | 210,461 | 646,410 | 105,142 | 82,217 | 2,084,179 | 1,987,652 | |
| 2020 | 487,598 | — | 554,688 | 167,396 | 644,740 | 97,486 | 81,927 | 2,033,835 | 1,940,242 | |
| William Mastoris(4) Executive Vice President - Customer Service and Operations | 2022 | 401,939 | — | 439,264 | 133,067 | 559,650 | 42,742 | 34,191 | 1,610,853 | 1,610,853 |
Note: In order to show the effect that the year-over-year change in pension value had on total compensation, as determined under applicable SEC rules, we have included an additional column to show total compensation minus the change in pension value. The amounts reported in the Total Without Change in Pension Value column may differ substantially from the amounts reported in the Total column required under SEC rules and are not a substitute for total compensation. Total Without Change in Pension Value represents total compensation, as determined under applicable SEC rules, minus the change in pension value reported in the Change in Pension Value and Nonqualified Deferred Compensation Earnings column. The change in pension value is subject to many external variables, such as interest rates, that are not related to WEC Energy Group or Company performance. Therefore, we believe that total compensation minus the change in pension value provides helpful additional information for comparative purposes.
| (1) | Mr. Lauber was appointed President on January 1, 2022. As previously disclosed, Mr. Fletcher announced that he would retire in June 2022. Effective February 1, 2022, Mr. Fletcher transitioned to the role of Senior Adviser at WEC Energy Group until his retirement, and Mr. Lauber was appointed to the roles of CEO and Chairman of the Company. |
| (2) | In connection with Mr. Fletcher’s 2022 retirement, and in light of his many contributions to the success of WEC Energy Group and the Company, the Compensation Committee accelerated the vesting of 9,707 shares of restricted stock previously awarded to him. The fair value associated with this acceleration was $1,035,834, which is included in the reported amount. The prorated payout to Mr. Fletcher for the performance units that were granted in 2022 is reflected in the “Option Exercises and Stock Vested for Fiscal Year 2022” table. |
| (3) | In connection with her appointment as Executive Vice President and Chief Financial Officer, Ms. Liu received a signing bonus of $100,000 and a one-time restricted stock award valued at $400,000. |
| (4) | Mr. Mastoris became a named executive officer of the Company in 2022. Therefore, no information has been provided for 2020 and 2021. |
| (5) | The amounts reported reflect the aggregate grant date fair value, as computed in accordance with FASB ASC Topic 718 excluding estimated forfeitures, of performance units and/or restricted stock awarded to each NEO in the respective year for which such amounts are reported. The amounts reported for the performance units are based upon the probable outcome as of the grant date of associated performance and market conditions, and are consistent with our estimate, as of the grant date, of aggregate compensation cost to be recognized over the three-year performance period. The actual value received by the executives from these awards may range from $0 to greater than the reported amounts, depending upon WEC Energy Group’s performance and the executive’s number of additional years of service with the Company. |
The value of the performance unit awards as of the grant date, assuming achievement of the highest level of performance and excluding any performance units resulting from short-term dividend equivalents and the Additional Performance Measure, for each of Messrs. Lauber, Garvin, and Mastoris, and Mmes. Liu and Kelsey, is $4,012,630, $975,427, $624,516, $2,024,994 and $1,117,079, respectively, for the 2022 awards. The value of the performance unit awards as of the grant date, assuming achievement of the highest level of performance and excluding any performance units resulting from short-term dividend equivalents and the Additional Performance Measure, for each of Messrs. Lauber, Garvin, and Mastoris, and Mmes. Liu and Kelsey, is $2,242,626, $766,543,
| Wisconsin Electric Power Company | 25 | 2023 Annual Meeting Information Statement |
$187,584, $1,818,741 and $1,013,225, respectively, for the 2021 awards. See “Option Exercises and Stock Vested For Fiscal Year 2022” for the amount of the actual payout with respect to the 2020 award of performance units. See “Option Exercises and Stock Vested for Fiscal Year 2022” for the amount of the actual payout with respect to Mr. Fletcher’s 2020, 2021 and 2022 awards of performance units that vested pursuant to the terms of the Company’s Performance Unit Plan upon his retirement on June 1, 2022. Not included are the performance unit awards resulting from short-term dividend equivalents and/or the Additional Performance Measure that may increase or, in the case of the Additional Performance Measure, decrease these amounts.
| (6) | The amounts reported reflect the aggregate grant date fair value, as computed in accordance with FASB ASC Topic 718 excluding estimated forfeitures, of options awarded to each NEO in the respective year for which such amounts are reported. The actual value received by the executives from these awards may range from $0 to greater than the reported amounts, depending upon WEC Energy Group’s performance. In accordance with FASB ASC Topic 718, we made certain assumptions in our calculation of the grant date fair value of the stock options. See “Stock Options” in Note 1(l) -- Stock-Based Compensation, in the Notes to Consolidated Financial Statements in our 2022 Annual Report on Form 10-K for a description of these assumptions. For 2022, the assumptions made in connection with the valuation of the stock options are the same as described in Note 1(l). |
| (7) | Consists of the annual incentive compensation earned under WEC Energy Group’s STPP. |
| (8) | The amounts reported for 2022, 2021, and 2020 reflect the aggregate change in the actuarial present value of each applicable NEO’s accumulated benefit under all defined benefit plans from December 31, 2021 to December 31, 2022, December 31, 2020 to December 31, 2021, and December 31, 2019 to December 31, 2020, respectively. The amounts reported for all three years also include above-market earnings on compensation that is deferred by the NEOs into the Prime Rate Fund under WEC Energy Group’s Executive Deferred Compensation Plan. Above-market earnings represent the difference between the interest rate used to calculate earnings under the Plan and 120% of the applicable federal long-term rate prescribed by the Internal Revenue Code. The amounts earned for 2022 are shown below. |
| Name | Change in Pension Value ($) | Non-Qualified Deferred Compensation Earnings ($) | Total ($) |
| Scott J. Lauber | 101,995 | 75,487 | 177,482 |
| J. Kevin Fletcher | 1,979,992 | 193,677 | 2,173,669 |
| Xia Liu | — | 965 | 965 |
| Margaret C. Kelsey | — | 683 | 683 |
| Robert M. Garvin | 106,705 | 16,567 | 123,272 |
| William Mastoris | — | 42,742 | 42,742 |
For 2022, 2021, and 2020, the applicable discount rate used to value pension plan liabilities moved from 2.95% to 5.50%, 2.65% to 2.95%, and 3.40% to 2.65%, respectively. As the discount rate decreases, the Company’s pension funding obligation increases, and vice versa. The changes in the actuarial present values of the NEOs’ pension benefits do not constitute cash payments to the NEOs. For 2022, Mr. Mastoris’ pension value decreased by $60,461 due to the increase in the discount rate, and is shown as $0 pursuant to applicable SEC rules.
The pension values reported represent only WEC Energy Group’s obligation of the aggregate change in the actuarial present value of each NEO’s accumulated benefit under all defined benefit plans. Mr. Fletcher is entitled to receive a pension benefit from a prior employer. To the extent such prior employer is unable to pay its pension obligation, WEC Energy Group may be obligated to pay the total amount.
Mr. Fletcher’s increase in pension value in 2022, 2021 and 2020 primarily reflects the increase in his 36-month average compensation as President and CEO of WEC Energy Group.
| (9) | During 2022, each NEO received financial planning services and the cost of an annual physical exam; Messrs. Lauber and Fletcher, and Ms. Liu, were provided with membership in a service that provides healthcare and safety management when traveling outside the United States; Messrs. Garvin and Mastoris received reimbursement of dues and fees for club memberships. Although Mr. Fletcher utilized the benefit of spousal travel for business purposes in 2022, there was no associated cost to WEC Energy Group as Mr. Fletcher was not eligible to receive reimbursement for taxes paid on imputed income attributable for such travel. |
| (10) | All Other Compensation for Messrs. Lauber, Fletcher, Garvin, and Mastoris, and Mmes. Liu and Kelsey, for 2022 also consists of: |
| • | Employer matching of contributions into the WEC Energy Group 401(k) plan in the amount of $12,200 for each NEO; | |
| • | Employer contributions into the WEC Energy Group 401(k) plan in the amount of $18,300 for Mmes. Liu and Kelsey, and into the WEC Energy Group Non-Qualified Retirement Savings Plan in the amount of $97,661 for Ms. Liu and $68,749 for Ms. Kelsey. These payments are in lieu of participation in WEC Energy Group’s pension plan; | |
| • | “Make-whole” payments under the Executive Deferred Compensation Plan that provides a match at the same level as the WEC Energy Group 401(k) plan (4% for up to 7% of wages) for all deferred salary and bonus not otherwise eligible for a match in the amounts of $90,724 for Mr. Lauber, $65,107 for Ms. Liu, $45,833 for Ms. Kelsey, and $34,198 for Mr. Garvin; | |
| • | Retention credit contributed to a nonqualified account in the amount of $300,000 for Mr. Lauber. See “Retention Agreement” in the Compensation Discussion and Analysis for a description; | |
| • | Retirement income supplement contributed to a nonqualified account in the amount of $239,881 for Ms. Liu. See “Ms. Liu’s Retirement Income Supplement” on page 32 for a description of this benefit; and | |
| • | Tax reimbursements or “gross-ups” for all applicable perquisites in the amounts of $13,963 for Mr. Lauber and $17,862 for Mr. Garvin. |
| Wisconsin Electric Power Company | 26 | 2023 Annual Meeting Information Statement |
GRANTS OF PLAN-BASED AWARDS FOR FISCAL YEAR 2022
The following table shows additional data regarding incentive plan awards to the NEOs for 2022.
| Name | Grant Date | Action Date (1) | Estimated Future Payouts Under Non-Equity Incentive Plan Awards (2) | Estimated Future Payouts Under Equity Incentive Plan Awards (3) | All Other Stock Awards: Number of Shares of Stock or Units (4) (#) | All Other Option Awards (5) | Grant Date Fair Value of Stock and Option Awards ($) | ||||||
| Threshold ($) | Target ($) | Maximum ($) | Threshold (#) | Target (#) | Maximum (#) | Number of Securities Underlying Options (#) | Exercise or Base Price (6) ($/Sh) | Closing Market Price ($/Sh) | |||||
| Scott J. Lauber | 1/20/22 | — | 345,443 | 1,381,770 | 2,901,717 | — | — | — | — | — | — | — | — |
| 1/3/22 | 12/2/21 | — | — | — | 5,969 | 23,876 | 41,783 | — | — | — | — | 2,292,932 | |
| 1/3/22 | 12/2/21 | — | — | — | — | — | — | 5,510 | — | — | — | 529,153 | |
| 1/3/22 | 12/2/21 | — | — | — | — | — | — | — | 58,121 | 96.035 | 96.09 | 854,960 | |
| J. Kevin Fletcher | 1/20/22 | — | 147,244 | 588,975 | 1,236,848 | — | — | — | — | — | — | — | — |
| 1/3/22 | 12/2/21 | — | — | — | 5,280 | 21,118 | 36,957 | — | — | — | — | 2,028,067 | |
| 1/3/22 | 12/2/21 | — | — | — | — | — | — | 4,873 | — | — | — | 467,979 | |
| 1/3/22 | 12/2/21 | — | — | — | — | — | — | — | 51,406 | 96.035 | 96.09 | 756,182 | |
| Xia Liu | 1/20/22 | — | 151,741 | 606,965 | 1,274,626 | — | — | — | — | — | — | — | — |
| 1/3/22 | 12/2/21 | — | — | — | 3,012 | 12,049 | 21,086 | — | — | — | — | 1,157,126 | |
| 1/3/22 | 12/2/21 | — | — | — | — | — | — | 2,781 | — | — | — | 267,073 | |
| 1/3/22 | 12/2/21 | — | — | — | — | — | — | — | 29,331 | 96.035 | 96.09 | 431,459 | |
| Margaret C. Kelsey | 1/20/22 | — | 110,363 | 441,450 | 927,045 | — | — | — | — | — | — | — | — |
| 1/3/22 | 12/2/21 | — | — | — | 1,662 | 6,647 | 11,632 | — | — | — | — | 638,345 | |
| 1/3/22 | 12/2/21 | — | — | — | — | — | — | 1,534 | — | — | — | 147,318 | |
| 1/3/22 | 12/2/21 | — | — | — | — | — | — | — | 16,181 | 96.035 | 96.09 | 238,023 | |
| Robert M. Garvin | 1/20/22 | — | 83,511 | 334,045 | 701,495 | — | — | — | — | — | — | — | — |
| 1/3/22 | 12/2/21 | — | — | — | 1,451 | 5,804 | 10,157 | — | — | — | — | 557,387 | |
| 1/3/22 | 12/2/21 | — | — | — | — | — | — | 1,339 | — | — | — | 128,591 | |
| 1/3/22 | 12/2/21 | — | — | — | — | — | — | — | 14,128 | 96.035 | 96.09 | 207,823 | |
| William Mastoris | 1/20/22 | — | 68,250 | 273,000 | 573,300 | — | — | — | — | — | — | — | — |
| 1/3/22 | 12/2/21 | — | — | — | 929 | 3,716 | 6,503 | — | — | — | — | 356,866 | |
| 1/3/22 | 12/2/21 | — | — | — | — | — | — | 858 | — | — | — | 82,398 | |
| 1/3/22 | 12/2/21 | — | — | — | — | — | — | — | 9,046 | 96.035 | 96.09 | 133,067 | |
| (1) | On December 2, 2021, the Compensation Committee awarded the annual 2022 option, restricted stock, and performance unit grants effective the first trading day of 2022 (January 3, 2022). | |
| (2) | Non-equity incentive plan awards consist of annual incentive awards under WEC Energy Group’s STPP. For a more detailed description of the STPP, see the Compensation Discussion and Analysis. For Mr. Fletcher, these represent prorated amounts to account for his 2022 retirement. For Mr. Lauber, these represent prorated amounts based upon his base salary and target STPP award as Senior Executive Vice President and Chief Operating Officer of WEC Energy Group for one month and President and CEO for 11 months. | |
| (3) | Consists of performance units awarded under the WEC Energy Group Performance Unit Plan. WEC Energy Group’s Performance Unit Plan provides for short-term dividend equivalents. The number of performance units awarded will be increased as of any date that WEC Energy Group declares a cash dividend on its common stock by the amount of short-term dividend equivalents awarded. In effect, short-term dividend equivalents will be credited and accumulated as reinvested dividends on each performance unit so that the performance units and accumulated dividends will be paid out at the end of the performance units’ three-year performance period, contingent upon WEC Energy Group’s performance. Therefore, the number of performance units reported at each of the threshold, target, and maximum levels in this table will increase by the number of short-term dividend equivalents earned. In addition, these amounts do not reflect any potential impact of WEC Energy Group’s performance against the Additional Performance Measure. For a more detailed description of the performance units, short-term dividend equivalents and Additional Performance Measure, see the Compensation Discussion and Analysis. | |
| (4) | Consists of restricted stock awarded under the WEC Energy Group Omnibus Stock Incentive Plan. For a more detailed description of the terms of the restricted stock, see the Compensation Discussion and Analysis. | |
| (5) | Consists of non-qualified stock options to purchase shares of WEC Energy Group common stock pursuant to the WEC Energy Group Omnibus Stock Incentive Plan. For a more detailed description of the terms of the options, see the Compensation Discussion and Analysis. | |
| (6) | The exercise price of the option awards is equal to the fair market value of WEC Energy Group’s common stock on the date of grant. Fair market value is the average of the high and low prices of WEC Energy Group common stock, which is listed on the New York Stock Exchange, reported by Bloomberg L.P. on the grant date. |
| Wisconsin Electric Power Company | 27 | 2023 Annual Meeting Information Statement |
OUTSTANDING EQUITY AWARDS AT FISCAL YEAR-END 2022
The following table reflects the number and value of exercisable and unexercisable options as well as the number and value of other equity awards held by the NEOs at fiscal year-end 2022.
| Name | Option Awards | Stock Awards | |||||||
| Number of Securities Underlying Unexercised Options: Exercisable (#) | Number of Securities Underlying Unexercised Options: Unexercisable (1) (#) | Equity Incentive Plan Awards: Number of Securities Underlying Unexercised Unearned Options (#) | Option Exercise Price ($) | Option Expiration Date | Number of Shares or Units of Stock that Have Not Vested (2) (#) | Market Value of Shares or Units of Stock that Have Not Vested ($) | Equity Incentive Plan Awards: Number of Unearned Shares, Units or Other Rights that Have Not Vested (#) | Equity Incentive Plan Awards: Market or Payout Value of Unearned Shares, Units or Other Rights that Have Not Vested (3) ($) | |
| Scott J. Lauber | 5,330 | — | — | 52.895 | 1/2/25 | — | — | — | — |
| 6,720 | — | — | 50.925 | 1/4/26 | — | — | — | — | |
| 17,320 | — | — | 58.305 | 1/3/27 | — | — | — | — | |
| 26,465 | — | — | 66.015 | 1/2/28 | — | — | — | — | |
| 30,560 | — | — | 68.175 | 1/2/29 | — | — | — | — | |
| — | 32,420 | — | 91.4875 | 1/2/30 | — | — | — | — | |
| — | 5,750 | — | 88.5475 | 7/1/30 | — | — | — | — | |
| — | 46,647 | — | 91.06 | 1/4/31 | — | — | — | — | |
| — | 58,121 | — | 96.035 | 1/3/32 | — | — | — | — | |
| — | — | — | — | — | 8,606 | 806,899 | — | — | |
| — | — | — | — | — | — | — | 4,729 | 443,391 | |
| — | — | — | — | — | — | — | 25,408 | 2,382,254 | |
| J. Kevin Fletcher | 44,825 | — | — | 68.175 | 1/2/29 | — | — | — | — |
| 66,614 | — | — | 91.4875 | 1/2/30 | — | — | — | — | |
| 68,952 | — | — | 91.06 | 1/4/31 | — | — | — | — | |
| 51,406 | — | — | 96.035 | 1/3/32 | — | — | — | — | |
| Xia Liu | — | 36,705 | — | 92.315 | 6/1/30 | — | — | — | — |
| — | 37,830 | — | 91.06 | 1/4/31 | — | — | — | — | |
| — | 29,331 | — | 96.035 | 1/3/32 | — | — | — | — | |
| — | — | — | — | — | 6,846 | 641,881 | — | — | |
| — | — | — | — | — | — | — | 3,835 | 359,570 | |
| — | — | — | — | — | — | — | 12,822 | 1,202,191 | |
| Margaret C. Kelsey | 18,380 | — | — | 66.015 | 1/2/28 | — | — | — | — |
| 20,147 | — | — | 68.175 | 1/2/29 | — | — | — | — | |
| — | 20,477 | — | 91.4875 | 1/2/30 | — | — | — | — | |
| — | 21,072 | — | 91.06 | 1/4/31 | — | — | — | — | |
| — | 16,181 | — | 96.035 | 1/3/32 | — | — | — | — | |
| — | — | — | — | — | 3,015 | 282,686 | — | — | |
| — | — | — | — | — | — | — | 2,136 | 200,271 | |
| — | — | — | — | — | — | — | 7,073 | 663,164 | |
| Robert M. Garvin | 14,185 | — | — | 58.305 | 1/3/27 | — | — | — | — |
| 14,705 | — | — | 66.015 | 1/2/28 | — | — | — | — | |
| 14,931 | — | — | 68.175 | 1/2/29 | — | — | — | — | |
| — | 15,471 | — | 91.4875 | 1/2/30 | — | — | — | — | |
| — | 15,944 | — | 91.06 | 1/4/31 | — | — | — | — | |
| — | 14,128 | — | 96.035 | 1/3/32 | — | — | — | — | |
| — | — | — | — | — | 2,458 | 230,462 | — | — | |
| — | — | — | — | — | — | — | 1,616 | 151,516 | |
| — | — | — | — | — | — | — | 6,176 | 579,062 | |
| William Mastoris | 3,980 | — | — | 58.305 | 1/3/27 | — | — | — | — |
| 3,685 | — | — | 66.015 | 1/2/28 | — | — | — | — | |
| 3,733 | — | — | 68.175 | 1/2/29 | — | — | — | — | |
| — | 3,785 | — | 91.4875 | 1/2/30 | — | — | — | — | |
| — | 3,901 | — | 91.06 | 1/4/31 | — | — | — | — | |
| — | 9,046 | — | 96.035 | 1/3/32 | — | — | — | — | |
| — | — | — | — | — | 1,134 | 106,324 | — | — | |
| — | — | — | — | — | — | — | 396 | 37,129 | |
| — | — | — | — | — | — | — | 3,954 | 370,727 | |
| Wisconsin Electric Power Company | 28 | 2023 Annual Meeting Information Statement |
| (1) | All options reported in this column were granted ten years prior to their respective expiration date and vest 100% on the third anniversary of the grant date. Pursuant to the terms of the OSIP, all of Mr. Fletcher’s outstanding stock option awards fully vested upon his retirement. | |
| (2) | Effective January 2, 2020, Messrs. Lauber, Fletcher, Garvin, and Mastoris, and Ms. Kelsey, were granted restricted stock awards of 2,382; 4,895; 1,137; 278; and 1,505 shares, respectively, which began vesting in three equal annual installments on January 4, 2021. Effective June 1, 2020, Ms. Liu was granted a restricted stock award of 6,927 shares, which began vesting in three equal annual installments on June 1, 2021. Effective July 1, 2020, Mr. Lauber was granted a restricted stock award of 406 shares, which began vesting in three equal annual installments on July 1, 2021. Effective January 4, 2021, Messrs. Lauber, Fletcher, Garvin, and Mastoris, and Mmes. Liu and Kelsey, were granted restricted stock awards of 3,248; 4,801; 1,110; 272; 2,634; and 1,467 shares, respectively, which began vesting in three equal annual installments on January 4, 2022. Effective January 3, 2022, Messrs. Lauber, Garvin, and Mastoris, and Mmes. Liu and Kelsey, were granted restricted stock awards of 5,510; 1,339; 858; 2,781; and 1,534 shares, respectively, which began vesting in three equal annual installments on January 3, 2023. Effective January 3, 2022, Mr. Fletcher was granted a restricted stock award of 4,873 shares. In connection with his retirement effective June 1, 2022, the Compensation Committee accelerated the vesting of all of Mr. Fletcher’s unvested restricted stock granted in 2020, 2021 and 2022. The vesting of the restricted stock granted to Messrs. Lauber, Garvin, and Mastoris, and Mmes. Liu and Kelsey, may be accelerated in connection with a termination of employment due to a change in control of WEC Energy Group, death or disability, or by action of the Compensation Committee. | |
| (3) | The number of performance units reported were awarded in 2021 (first line) and 2022 (second line) and vest at the end of the three-year performance period ending December 31, 2023 and December 31, 2024, respectively. The number of performance units reported and their corresponding value are based upon a payout at the threshold amount for 2021 and target amount for 2022. The number and value of the 2021 performance units includes performance units resulting from the grant of short-term dividend equivalents and achievement of the Additional Performance Measure in 2021 and 2022. The number and value of the 2022 performance units includes performance units resulting from the grant of short-term dividend equivalents and achievement of the Additional Performance Measure in 2022. |
OPTION EXERCISES AND STOCK VESTED FOR FISCAL YEAR 2022
This table shows the number and value of (1) stock options that were exercised by the NEOs, (2) restricted stock awards that vested, and (3) performance units that vested in 2022.
| Name | Option Awards | Stock Awards | ||
| Number of Shares Acquired on Exercise (#) | Value Realized on Exercise (1) ($) | Number of Shares Acquired on Vesting (2) (#) | Value Realized on Vesting (3)(4) ($) | |
| Scott J. Lauber | 5,000 | 280,754 | 2,900 | 279,527 |
| — | — | 12,005 | 1,125,564 | |
| J. Kevin Fletcher | 33,400 | 1,506,717 | 14,241(5) | 1,454,225(5) |
| — | — | 31,620(6) | 3,309,617(6) | |
| Xia Liu | — | — | 3,187 | 326,783 |
| — | — | 11,048 | 1,035,854 | |
| Margaret C. Kelsey | — | — | 1,577 | 151,567 |
| — | — | 6,491 | 608,553 | |
| Robert M. Garvin | 31,480 | 1,649,253 | 1,183 | 113,700 |
| — | — | 4,904 | 459,775 | |
| William Mastoris | 4,690 | 251,142 | 292 | 28,064 |
| — | — | 1,200 | 112,470 | |
| 1. | Value realized upon the exercise of options is determined by multiplying the number of shares received upon exercise by the difference between the market price of WEC Energy Group common stock at the time of exercise and the exercise price. | |
| 2. | Reflects the number of shares of restricted stock that vested in 2022 (first line) and, except for Mr. Fletcher, the number of performance units that vested as of December 31, 2022, the end of the applicable three-year performance period (second line). The performance units were settled in cash. | |
| 3. | Restricted stock value realized is determined by multiplying the number of shares of restricted stock that vested by the fair market value of WEC Energy Group common stock on the date of vesting. We compute fair market value as the average of the high and low prices of WEC Energy Group common stock reported by Bloomberg L.P. on the vesting date. | |
| 4. | Other than Mr. Fletcher, performance units value realized is determined by multiplying the number of performance units that vested by the closing market price of WEC Energy Group common stock on December 30, 2022, the last trading day of the year. | |
| 5. | Includes 9,707 shares of restricted stock for which the Company accelerated vesting effective June 1, 2022. The value realized by Mr. Fletcher in connection with this acceleration was $1,018,410, and was determined by using the average of the high and low prices of WEC Energy Group common stock on June 1, 2022. | |
| 6. | Reflects the prorated number of performance units awarded in 2020, 2021 and 2022 (based upon the target 100% rate) that vested pursuant to the terms of the Company’s Performance Unit Plan upon Mr. Fletcher’s retirement. The value realized was determined using the closing price of WEC Energy Group common stock on June 1, 2022. |
| Wisconsin Electric Power Company | 29 | 2023 Annual Meeting Information Statement |
PENSION BENEFITS AT FISCAL YEAR-END 2022
The following table sets forth information for each NEO regarding their pension benefits at fiscal year-end 2022 under WEC Energy Group’s three different retirement plans discussed below.
| Name | Plan Name | Number of Years Credited Service (1) (#) | Present Value of Accumulated Benefit (3)(4) ($) | Payments During Last Fiscal Year ($) |
| Scott J. Lauber | WEC Energy Group Plan | 32.50 | 553,205 | — |
| SERP | 32.50 | 711,595 | — | |
| Individual Letter Agreement | — | — | — | |
| J. Kevin Fletcher | WEC Energy Group Plan | 10.59 | 165,895 | 5,629 |
| SERP | 10.59 | 787,327 | — | |
| Individual Letter Agreement | 45.17 | 32,804,663 | — | |
| Xia Liu(2) | WEC Energy Group Plan | — | — | — |
| SERP | — | — | — | |
| Individual Letter Agreement | — | — | — | |
| Margaret C. Kelsey(2) | WEC Energy Group Plan | — | — | — |
| SERP | — | — | — | |
| Individual Letter Agreement | — | — | — | |
| Robert M. Garvin | WEC Energy Group Plan | 11.67 | 258,779 | — |
| SERP | 11.67 | 574,237 | — | |
| Individual Letter Agreement | 11.67 | 89,568 | — | |
| William Mastoris | WEC Energy Group Plan | 30.75 | 505,144 | — |
| SERP | 30.75 | 181,801 | — | |
| Individual Letter Agreement | — | — | — |
| (1) | Years of service are computed as of December 31, 2022, the pension plan measurement date used for financial statement reporting purposes. Mr. Fletcher has been credited with 34.58 years of service pursuant to the terms of his Individual Letter Agreement (“ILA”). The increase in the aggregate amount of Mr. Fletcher’s accumulated benefit under all of WEC Energy Group’s retirement plans resulting from the additional years of credited service is $25,825,512. | |
| (2) | Mmes. Liu and Kelsey are not eligible to receive pension benefits under the WEC Energy Group Plan. | |
| (3) | The key assumptions used in calculating the actuarial present values reflected in this column are: |
| • | Earliest projected unreduced retirement age based upon projected service: | |
| ◦ | For Mr. Lauber, age 60. | |
| ◦ | For Mr. Fletcher, age 64 (actual age at retirement in 2022). | |
| ◦ | For Mr. Garvin, age 56.42. | |
| ◦ | For Mr. Mastoris, age 62. |
| • | Discount rate of 5.50%. | |
| • | Cash balance interest crediting rate of 5.00%. | |
| • | Form of payment: |
| ◦ | Mr. Lauber: WEC Energy Group Plan 50% lump sum / 50% life annuity; SERP - Ten Year Annual Installment | |
| ◦ | Mr. Fletcher’s actual form of payment elected at retirement: WEC Energy Group Plan 100% joint & survivor annuity; SERP and ILA - 50% joint & survivor annuity. | |
| ◦ | Mr. Garvin: WEC Energy Group Plan 50% lump sum / 50% life annuity; SERP and ILA - Five Annual Installments. | |
| ◦ | Mr. Mastoris: WEC Energy Group Plan 50% lump sum / 50% life annuity; SERP - Ten Year Annual Installments. |
| • | Mortality Table for life annuity - Pri-2012/Male/White Collar as published by the Society of Actuaries with modified MP2020 projection. | |
| (4) | WEC Energy Group’s pension benefit obligations to Mr. Fletcher will be partially offset by pension benefits Mr. Fletcher is entitled to receive from his former employer. The amounts reported for Mr. Fletcher represent only WEC Energy Group’s obligation of the aggregate actuarial present value of his accumulated benefit under all of the plans. The total aggregate actuarial present value of each of Mr. Fletcher’s accumulated benefit under all of the plans is $36,157,424, $2,399,539 of which we estimate the prior employer is obligated to pay. If Mr. Fletcher’s former employer becomes unable to pay its portion of his respective accumulated pension benefit, WEC Energy Group may be obligated to pay the total amount. |
RETIREMENT PLANS
WEC Energy Group maintains four different plans providing for retirement payments and benefits for the NEOs: a defined benefit pension plan of the cash balance type (“WEC Energy Group Plan”); a supplemental executive retirement plan (“SERP”); ILAs; and the WEC Energy Group Retirement Savings Plan, which is a 401(k) plan, for those individuals who are not eligible to participate in the WEC Energy Group Plan. The compensation considered for purposes of the retirement plans (other than the WEC Energy Group Plan and SERP) for Mr. Fletcher is $3,995,628. This amount represents the average compensation (consisting of base salary and annual incentive compensation) for the 36 highest consecutive months. For Messrs. Lauber, Garvin, and Mastoris, the compensation considered for purposes of the retirement plans is $2,573,089, $1,159,947, and $662,889, respectively, of which $305,000 is applied to the WEC Energy Group Plan and the remainder to the SERP. These amounts represent their 2022 base salary, plus their 2021 STPP award paid in 2022. As of December 31, 2022, Messrs. Lauber, Garvin, and Mastoris currently have or are considered to have 32.50, 11.67, and 30.75 credited years of service, respectively, under the various plans described below. Messrs. Lauber, Garvin, and Mastoris were not granted additional years of credited service. See below for a discussion of the contributions made to the WEC Energy Group Retirement Savings Plan on behalf of Mmes. Liu and Kelsey, who do not participate in the WEC Energy Group Plan.
| Wisconsin Electric Power Company | 30 | 2023 Annual Meeting Information Statement |
The WEC Energy Group Plan
Many of WEC Energy Group’s regular full-time and part-time employees, including several of the NEOs, participate in the WEC Energy Group Plan. The WEC Energy Group Plan bases a participant’s defined benefit pension on the value of a hypothetical account balance. For individuals participating in the WEC Energy Group Plan as of December 31, 1995, a starting account balance was created equal to the present value of the benefit accrued as of December 31, 1994, under the plan benefit formula prior to the change to a cash balance approach. That formula provided a retirement income based on years of credited service and average compensation (consisting of base salary and annual incentive compensation) for the 36 highest consecutive months, with an adjustment to reflect the Social Security integrated benefit. In addition, individuals participating in the WEC Energy Group Plan as of December 31, 1995, received a special one-time transition credit amount equal to a specified percentage varying with age multiplied by credited service and 1994 base pay.
The present value of the accrued benefit as of December 31, 1994, plus the transition credit, was also credited with interest at a stated rate. For 1996 through 2007, a participant received annual credits to the account equal to 5% of base pay (including WEC Energy Group 401(k) plan pre-tax deferrals and other items), plus an interest credit on all prior accruals equal to 4% plus 75% of the annual time-weighted trust investment return for the year in excess of 4%. From 2008 through 2013, the interest credit percentage was set at either the long-term corporate bond third segment rate, published by the Internal Revenue Service, or 4%, whichever was greater.
Effective January 1, 2014, participants receive an annual credit to the account equal to 6% of base pay (including WEC Energy Group 401(k) plan pre-tax deferrals and other items), plus an interest credit on all prior accruals equal to a 5% fixed rate. For participants in the WEC Energy Group Plan on December 31, 2007 and December 31, 2013, their WEC Energy Group Plan benefit will never be less than the benefit accrued as of December 31, 2007 and December 31, 2013, respectively. The WEC Energy Group Plan benefit will be calculated under all three formulas to provide participants with the greater benefit; however, in calculating a participant’s benefit accrued as of December 31, 2007 and December 31, 2013, interest credits as defined under each of the prior WEC Energy Group Plan formulas will be taken into account but not any additional pay credits.
Participants who were “grandfathered” as of December 31, 1995, as discussed below, will still receive the greater of the grandfathered benefit or the cash balance benefit.
The life annuity payable under the WEC Energy Group Plan is determined by converting the hypothetical account balance credits into annuity form.
Individuals who were participants in the WEC Energy Group Plan on December 31, 1995 were “grandfathered” so that they will not receive any lower retirement benefit than would have been provided under the formula in effect through December 31, 1995, had it continued. This amount continued to increase until December 31, 2010, at which time it was frozen. Upon retirement, participants will receive the greater of this frozen amount or the accumulated cash balance.
For Messrs. Lauber and Mastoris, estimated benefits under the cash balance plan formula are higher than under the grandfathered plan formula. Messrs. Fletcher and Garvin do not participate in the grandfathered formula.
Under the WEC Energy Group Plan, participants receive unreduced pension benefits upon reaching one of the following three thresholds: (1) age 65; (2) age 62 with 30 years of service; or (3) age 60 with 35 years of service.
Pursuant to the Internal Revenue Code, only $305,000 of pension eligible earnings (base pay and annual incentive compensation) could be considered for purposes of the WEC Energy Group Plan in 2022.
Supplemental Executive Retirement Plans and Individual Letter Agreements
Designated officers of WEC Energy Group and the Company, including all of the NEOs (other than Mmes. Liu and Kelsey) participate in the SERP, which is part of the Supplemental Pension Plan (the “SPP”) adopted to comply with Section 409A of the Internal Revenue Code. The SERP provides monthly supplemental pension benefits to participants, which will be paid out of unsecured corporate assets, or the grantor trust described below, in an amount equal to the difference between the actual pension benefit payable under the WEC Energy Group Plan and what such pension benefit would be if calculated without regard to any limitation imposed by the Internal Revenue Code on pension benefits or covered compensation, including amounts deferred to the WEC Energy Group Executive Deferred Compensation Plan. Except for a “change in control” of WEC Energy Group, as defined in the SPP, and pursuant to the terms of the ILAs discussed below, no payments are made until after the participant’s retirement at or after age 60 or death. If a participant in the SERP dies prior to age 60, his or her beneficiary is entitled to receive retirement benefits under the SERP.
WEC Energy Group entered into an agreement with Mr. Fletcher when he first commenced employment in 2011 to provide him with supplemental retirement benefits upon his retirement, provided he completed one year of service with the Company. The supplemental retirement payments are intended to make the total retirement benefits payable to Mr. Fletcher comparable to that which would have been received under his prior employer’s defined benefit pension plan, calculated without regard to Internal Revenue Code limits, and as if Mr. Fletcher’s employment continued with the prior employer and the defined benefit formula then in effect under the prior employer’s plan continued to his retirement. The retirement benefits payable as a result of this agreement will be offset by the value of any qualified and non-qualified defined benefit pension plan of the prior employer.
WEC Energy Group entered into an agreement with Mr. Garvin when he was hired in April 2011 that provides for a supplemental pension benefit account, which was credited with $50,000. This account is credited with interest annually at the same rate as the WEC Energy Group Plan. The account balance vested in April 2021, when Mr. Garvin completed 10 years of service.
The purpose of these agreements was to ensure that Messrs. Fletcher and Garvin did not lose pension earnings by joining the executive management team at WEC Energy Group and the Company they otherwise would have received from their former employers. Without providing a means to retain these pension benefits, it would have been difficult for WEC Energy Group to attract these officers.
| Wisconsin Electric Power Company | 31 | 2023 Annual Meeting Information Statement |
The SPP provides for a mandatory lump sum payment upon a change in control of WEC Energy Group if the executive’s employment is terminated within 18 months after the change in control. The Wisconsin Energy Corporation 2014 Rabbi Trust, a grantor trust, funds certain non-qualified benefits, including the SPP and the ILAs, as well as the Executive Deferred Compensation Plan. See “Potential Payments upon Termination or Change in Control” later in this information statement for additional information.
Ms. Liu’s Retirement Income Supplement
WEC Energy Group entered into an employment agreement with Ms. Liu when she commenced employment in June 2020 that provides for a retirement income supplement. Pursuant to the agreement, WEC Energy Group will credit $225,000 annually to a nonqualified account. The annual credit plus interest will continue until the year in which Ms. Liu ceases employment or reaches age 62. The balance at separation or age 62 will be frozen and will not exceed $3,000,000. Effective January 1 of each year, the account will be credited with interest at the annual average prime rate, not to exceed 5%. Amounts credited to the account will vest at age 55, and will be distributed at Ms. Liu’s retirement or other separation. Administration of this benefit is intended to comply with Section 409A of the Internal Revenue Code. The purpose of providing this benefit under Ms. Liu’s agreement was to ensure that she did not lose retirement benefits by joining the executive management team at WEC Energy Group and the Company she otherwise would have accrued and received from her former employer.
Mr. Lauber’s Retention Agreement
See “Retention Agreement” in the Compensation Discussion and Analysis for information regarding an agreement WEC Energy Group entered into with Mr. Lauber pursuant to which WEC Energy Group will credit up to 10 annual contributions of $300,000 to a nonqualified account if Mr. Lauber remains with WEC Energy Group.
WEC Energy Group Retirement Savings Plan
Effective January 1, 2015, all newly hired management employees, including executive officers, will receive an annual contribution equal to 6% of pension-eligible wages from WEC Energy Group into WEC Energy Group’s 401(k) plan rather than participate in the WEC Energy Group Plan. Pension-eligible wages consist of annual base salary and STPP payouts. In connection with this plan, the Compensation Committee adopted the WEC Energy Group Non-Qualified Retirement Savings Plan which provides “make-whole” benefits to address Internal Revenue Code limits on the amount of money that can be contributed to a 401(k) plan. Balances in the 401(k) and non-qualified retirement savings plans vest after one full year of service.
Mmes. Liu and Kelsey are entitled to receive Company contributions to the 401(k) plan and Non-Qualified Retirement Savings Plan.
NONQUALIFIED DEFERRED COMPENSATION FOR FISCAL YEAR 2022
The following table reflects activity by the NEOs during 2022 in WEC Energy Group’s Executive Deferred Compensation Plan discussed below.
| Name | Executive Contributions in Last Fiscal Year (1) ($) | Registrant Contributions in Last Fiscal Year (1) ($) | Aggregate Earnings In Last Fiscal Year ($) | Aggregate Withdrawals / Distributions ($) | Aggregate Balance at Last Fiscal Year-End (2) ($) |
| Scott J. Lauber | 276,630 | 90,724 | 96,963 | — | 3,719,367 |
| J. Kevin Fletcher | — | — | 314,806 | 1,210,669 | 5,922,613 |
| Xia Liu | 966,340 | 65,107 | 47,675 | — | 1,498,408 |
| Margaret C. Kelsey | 101,557 | 45,833 | 4,204 | — | 863,335 |
| Robert M. Garvin | 81,196 | 34,198 | 29,023 | — | 1,410,193 |
| William Mastoris | — | — | 12,020 | — | 2,326,495 |
| (1) | All of the amounts are reported as compensation in the “Summary Compensation Table” of this information statement. |
| (2) | $1,586,123, $4,728,428, $904,901, $391,543, and $396,947 of the reported amounts were reported as compensation in the Summary Compensation Tables in prior information statements for Messrs. Lauber, Fletcher, and Garvin, and Mmes. Liu and Kelsey, respectively. Mr. Mastoris became a named executive officer in 2022; therefore, no amounts were previously reported for him in prior information statements. |
Executive Deferred Compensation Plan
WEC Energy Group maintains two executive deferred compensation plans in which the NEOs participate: the Legacy WEC Energy Group Executive Deferred Compensation Plan (the “Legacy EDCP”), and the WEC Energy Group Executive Deferred Compensation Plan (the “EDCP”) adopted effective January 1, 2005 to comply with Section 409A of the Internal Revenue Code. The Legacy EDCP provides that (1) amounts earned, deferred, vested, credited, and/or accrued as of December 31, 2004 are preserved and frozen (subject to appreciation in value of such amounts) so that these amounts are exempt from Section 409A and (2) no new employees may participate in the Legacy EDCP as of January 1, 2005. Since January 1, 2005, all deferrals have been made to the EDCP. The provisions of the EDCP as in effect on December 31, 2022 are described below, as are the payout provisions of the Legacy EDCP.
The EDCP. Under the plan, a participant may defer up to 50% of his or her base salary, annual incentive compensation and vested awards of performance units. Stock option gains and vested restricted stock may not be deferred into the EDCP. Generally, deferral elections are made annually by each participant for the upcoming plan year. WEC Energy Group maintains detailed records tracking
| Wisconsin Electric Power Company | 32 | 2023 Annual Meeting Information Statement |
each participant’s “account balance.” In addition to deferrals made by the participants, WEC Energy Group may also credit each participant’s account balance by matching a certain portion of each participant’s deferral. Such deferral matching is determined by a formula taking into account the matching rate applicable under WEC Energy Group’s 401(k) plan, the percentage of compensation subject to such matching rate, the participant’s gross compensation eligible for matching, and the amount of eligible compensation actually deferred. Also, in its discretion, WEC Energy Group may credit any other amounts, as appropriate, to each participant’s account.
Participants may elect to participate in the WEC Energy Group Common Stock Fund and/or the Prime Rate Fund. WEC Energy Group tracks each participant’s account balance as though the balance was actually invested in these funds. Fund elections are not actual investments, but are elections chosen only for purposes of calculating market gain or loss on deferred amounts for the duration of the deferral period. Each participant may select the amount of deferred compensation to be allocated among the two measurement funds. Contributions and deductions may be made to each participant’s account based on the performance of the measurement fund(s) elected.
The annual rate of return for the calendar year ended December 31, 2022 for the WEC Energy Group Common Stock Fund and the Prime Rate Fund was -0.49% and 4.75%, respectively.
Each participant’s account balance is debited or credited periodically based on the performance of the measurement fund(s) elected by the participant. Subject to certain restrictions, participants may periodically make changes to their measurement fund elections.
At the time of his or her deferral election, each participant may designate a prospective payout election for any or the entire amount deferred, plus any amounts debited or credited to the deferred amount as of the designated payout. Amounts deferred into the EDCP may not be withdrawn at the discretion of the participant and a change to the designated payout delays the initial payment at least five years beyond the originally designated payout date. In addition, WEC Energy Group may not limit payout amounts in order to deduct such amounts under Section 162(m) of the Internal Revenue Code.
The balance of a participant’s account is payable on his or her retirement in either a lump sum payout or in annual installments, at the election of the participant. Upon the death of a participant after retirement, payouts are made to the deceased participant’s beneficiary in the same manner as though such payout would have been made to the participant had the participant survived. In the event of a participant’s termination of employment prior to retirement, the participant may elect to receive a payout beginning the year after termination in the amount of his or her account balance as of the termination date either in a lump sum or in annual installments over a period of five years. Disability is not itself a payment event until the participant terminates employment with WEC Energy Group or its subsidiaries, including the Company. A participant’s account balance will be paid out in a lump sum if the participant separates from service with WEC Energy Group or its subsidiaries within 18 months after a change in control of WEC Energy Group, as defined in the plan. The deferred amounts will be paid out of the general corporate assets or the assets of the Wisconsin Energy Corporation 2014 Rabbi Trust.
The Legacy EDCP. At the time of his or her deferral election, each participant designated a prospective payout election for any or the entire amount deferred, plus any amounts debited or credited to the deferred amount as of the designated payout. A participant may elect, at any time, to withdraw part (a minimum of $25,000) or all of his or her account balance, subject to a withdrawal penalty of 10%. Payout amounts may be limited to the extent to which they are deductible by WEC Energy Group under Section 162(m) of the Internal Revenue Code.
��
The balance of a participant’s account is payable on his or her retirement in either a lump sum payout or in annual installments, at the election of the participant. Upon the death of a participant after retirement, payouts are made to the deceased participant’s beneficiary in the same manner as though such payout would have been made to the participant had the participant survived. In the event of a participant’s termination of employment prior to retirement, the participant may elect to receive a payout beginning the year after termination in the amount of his or her account balance as of the termination date either in a lump sum or in annual installments over a period of five years. Any participant who suffers from a continued disability will be entitled to the benefits of plan participation unless and until the committee administering the plan determines that the participant has been terminated for purposes of continued participation in the plan. Upon any such determination, the disabled participant is paid out as though the participant had retired. Except in certain limited circumstances, participants’ account balances will be paid out in a lump sum (1) upon the occurrence of a change in control, as defined in the plan, or (2) upon any downgrade of WEC Energy Group’s senior debt obligations to less than “investment grade.” The deferred amounts will be paid out of the general corporate assets or the assets of the Wisconsin Energy Corporation 2014 Rabbi Trust.
POTENTIAL PAYMENTS UPON TERMINATION OR CHANGE IN CONTROL
The tables below reflect the amount of compensation payable to each of our NEOs in the event of termination of each executive’s employment. These amounts are in addition to each NEO’s aggregate balance in the EDCP at fiscal year-end 2022, as reported in the “Aggregate Balance at Last Fiscal Year-End” column under “Nonqualified Deferred Compensation for Fiscal Year 2022.” The amount of compensation payable to each NEO upon voluntary termination, normal retirement, for-cause termination, involuntary termination (by WEC Energy Group or the Company for any reason other than cause, death or disability or by the executive for “good reason”), termination following a “change in control,” disability, and death are set forth below. The amounts shown assume that such termination was effective as of December 31, 2022 and include amounts earned through that date, and are estimates of the amounts which would be paid out to the NEOs upon termination. The amounts shown under “Normal Retirement” assume the NEOs were retirement eligible with no reduction of retirement benefits. The amounts shown under “Termination Upon a Change in Control” assume the NEOs terminated employment as of December 31, 2022, which was within 18 months of a change in control of WEC Energy Group. The
| Wisconsin Electric Power Company | 33 | 2023 Annual Meeting Information Statement |
amounts reported in the row titled “Retirement Plans” in each table below are not in addition to the amounts reflected under “Pension Benefits at Fiscal Year-End 2022.” The actual amounts to be paid out can only be determined at the time of an officer’s termination of employment.
Payments Made Upon Voluntary Termination or Termination for Cause, Death or Disability
In the event a NEO voluntarily terminates employment or is terminated for cause, death, or disability, the officer will receive:
| • | accrued but unpaid base salary and, for termination by death or disability, prorated annual incentive compensation; | |
| • | WEC Energy Group 401(k) plan and EDCP account balances; | |
| • | the WEC Energy Group Plan cash balance; | |
| • | in the case of death or disability, full vesting in all outstanding stock options, restricted stock, and performance units (otherwise, the ability to exercise already vested options within three months of termination) as well as vesting in the SERP and ILAs; and | |
| • | if voluntary termination occurs after age 60, such termination is treated as a normal retirement. |
NEOs are also entitled to the value of unused vacation days, if any, and for termination by death, benefits payable under the officer life insurance benefit if the NEO participates in such benefit.
Payments Made Upon Normal Retirement
In the event of the retirement of a NEO, the officer will receive:
| • | accrued but unpaid base salary and prorated annual incentive compensation; | |
| • | full vesting in all outstanding stock options and a prorated amount of performance units; | |
| • | full vesting in all retirement plans, including the WEC Energy Group Plan, SERP, and ILAs (Ms. Liu would be entitled to full vesting of her retirement income supplement); | |
| • | WEC Energy Group 401(k) plan and EDCP account balances; and | |
| • | the value of unused vacation days, if any. |
In addition to the receipt of these benefits by Mr. Fletcher in connection with his retirement on June 1, 2022, the Compensation Committee accelerated the vesting of 9,707 shares of restricted stock. See “Summary Compensation Table” above for information regarding Mr. Fletcher’s prorated annual incentive compensation. See “Options Exercised and Stock Vested for Fiscal year 2022” for additional information regarding the vesting of Mr. Fletcher’s restricted stock and performance unit awards. The value of stock options that vested upon Mr. Fletcher’s retirement (based on the excess of the market price of WEC Energy Group common stock on June 1, 2022 over the exercise price of such options) was $2,260,467.
Payments Made Under Employment Agreement Upon a Change in Control of WEC Energy Group, Involuntary Termination, or Termination for Good Reason
Pursuant to the terms of the SPP, retirement benefits are paid to all participating NEOs upon termination of employment within 18 months of a change in control. Participants appointed by WEC Energy Group or the Company, including the NEOs, are also eligible to receive a supplemental disability benefit pursuant to the terms of the WEC Energy Group Supplemental Long Term Disability Plan, in an amount equal to the difference between the actual amount of the benefit payable under the long term disability plan applicable to all employees and what such disability benefit would have been if calculated without regard to any limitation imposed by the broad-based plan on annual compensation recognized thereunder.
Mr. Fletcher was a party to an employment agreement with WEC Energy Group that included severance benefits. In conjunction with his retirement on June 1, 2022, Mr. Fletcher was not entitled to any of these benefits.
Payments under the Severance Pay Plan
Messrs. Lauber, Garvin, and Mastoris, and Mmes. Liu and Kelsey, have not entered into any agreement that currently provides for severance benefits upon a change in control or otherwise. These officers are eligible to participate in WEC Energy Group’s Severance Pay Plan, in which all management employees are eligible to participate. In the event a participant is involuntarily terminated, other than for cause, death, disability, retirement, or resignation, the participant is entitled to receive severance pay in an amount equal to the sum of: (1) 4% of the participant’s annual base salary and target bonus, plus (2) 4% of the participant’s annual base salary and target bonus multiplied by his or her completed years of service with the Company. The maximum amount of severance pay that can be received under the plan is twelve months of a participant’s annual base salary and target bonus.
Payments under Retention Agreement
Pursuant to the terms of a letter agreement, Mr. Lauber will be credited an annual contribution of $300,000 to a nonqualified account beginning on February 21, 2022. So long as Mr. Lauber remains employed by WEC Energy Group, an additional $300,000 will be credited on February 1, until a maximum of 10 contributions have been made. In addition, the account will be credited with interest at a rate of 5.0% annually. This account would vest upon the sixth contribution, at which time Mr. Lauber will be 61, or upon Mr. Lauber’s death or disability. For more information, see “Compensation Discussion and Analysis - Retention Agreement”.
| Wisconsin Electric Power Company | 34 | 2023 Annual Meeting Information Statement |
Potential Payments to Named Executive Officers Upon Termination or Change in Control of WEC Energy Group
The following tables show the potential payments upon termination or a change in control of WEC Energy Group for:
| Executive Benefits and Payments Upon Separation | Voluntary Termination ($) | Normal Retirement ($) | For Cause Termination ($) | Involuntary Termination ($) | Termination Upon Change in Control ($) | Disability ($) | Death ($) |
| Scott J. Lauber | |||||||
| Compensation: | |||||||
| Cash Severance | — | — | — | 2,406,820 | 2,406,820 | — | — |
| Retention Agreement | — | — | — | — | — | 300,000 | 300,000 |
| Long-Term Incentive Compensation: | |||||||
| Performance Units | — | 1,702,119 | — | — | 3,705,912 | 3,705,912 | 3,705,912 |
| Restricted Stock | — | — | — | — | 806,899 | 806,899 | 806,899 |
| Options | — | 229,593 | — | — | 229,593 | 229,593 | 229,593 |
| Benefits & Perquisites: | |||||||
| Retirement Plans | 1,264,800 | 1,264,800 | 1,264,800 | 1,264,800 | 1,264,800 | 1,264,800 | 1,281,962 |
| Health and Welfare Benefits | — | — | — | 10,043 | 10,043 | — | — |
| Death Benefit | — | — | — | — | — | — | — |
| Total | 1,264,800 | 3,196,512 | 1,264,800 | 3,681,663 | 8,424,067 | 6,307,204 | 6,324,366 |
| Xia Liu | |||||||
| Compensation: | |||||||
| Cash Severance | — | — | — | 163,880 | 163,880 | — | — |
| Long-Term Incentive Compensation: | |||||||
| Performance Units | — | 1,144,997 | — | — | 2,299,199 | 2,299,199 | 2,299,199 |
| Restricted Stock | — | — | — | — | 641,881 | 641,881 | 641,881 |
| Options | — | 155,180 | — | — | 155,180 | 155,180 | 155,180 |
| Benefits & Perquisites: | |||||||
| Retirement Plans | — | 697,756 | — | 697,756 | 697,756 | 697,756 | 697,756 |
| Health and Welfare Benefits | — | — | — | 10,043 | 10,043 | — | — |
| Death Benefit | — | — | — | — | — | — | 2,277,000 |
| Total | — | 1,997,933 | — | 871,679 | 3,967,939 | 3,794,016 | 6,071,016 |
| Margaret C. Kelsey | |||||||
| Compensation: | |||||||
| Cash Severance | — | — | — | 247,212 | 247,212 | — | — |
| Long-Term Incentive Compensation: | |||||||
| Performance Units | — | 635,787 | — | — | 1,274,541 | 1,274,541 | 1,274,541 |
| Restricted Stock | — | — | — | — | 282,686 | 282,686 | 282,686 |
| Options | — | 103,428 | — | — | 103,428 | 103,428 | 103,428 |
| Benefits & Perquisites: | |||||||
| Retirement Plans | — | — | — | — | — | — | — |
| Health and Welfare Benefits | — | — | — | 10,043 | 10,043 | — | — |
| Death Benefit | — | — | — | — | — | — | 1,766,000 |
| Total | — | 739,215 | — | 257,255 | 1,917,910 | 1,660,655 | 3,426,655 |
| Wisconsin Electric Power Company | 35 | 2023 Annual Meeting Information Statement |
| Executive Benefits and Payments Upon Separation | Voluntary Termination ($) | Normal Retirement ($) | For Cause Termination ($) | Involuntary Termination ($) | Termination Upon Change in Control ($) | Disability ($) | Death ($) |
| Robert M. Garvin | |||||||
| Compensation: | |||||||
| Cash Severance | — | — | — | 407,021 | 407,021 | — | — |
| Long-Term Incentive Compensation: | |||||||
| Performance Units | — | 505,835 | — | — | 1,039,093 | 1,039,093 | 1,039,093 |
| Restricted Stock | — | — | — | — | 230,462 | 230,462 | 230,462 |
| Options | — | 78,207 | — | — | 78,207 | 78,207 | 78,207 |
| Benefits & Perquisites: | |||||||
| Retirement Plans | 922,584 | 922,584 | 922,584 | 922,584 | 922,584 | 922,584 | 926,991 |
| Health and Welfare Benefits | — | — | — | 10,043 | 10,043 | — | — |
| Death Benefit | — | — | — | — | — | — | 1,542,000 |
| Total | 922,584 | 1,506,626 | 922,584 | 1,339,648 | 2,687,410 | 2,270,346 | 3,816,753 |
| William Mastoris | |||||||
| Compensation: | |||||||
| Cash Severance | — | — | — | 663,000 | 663,000 | — | — |
| Long-Term Incentive Compensation: | |||||||
| Performance Units | — | 197,740 | — | — | 475,942 | 475,942 | 475,942 |
| Restricted Stock | — | — | — | — | 106,324 | 106,324 | 106,324 |
| Options | — | 19,134 | — | — | 19,134 | 19,134 | 19,134 |
| Benefits & Perquisites: | |||||||
| Retirement Plans | 686,945 | 686,945 | 686,945 | 686,945 | 686,945 | 686,945 | 693,647 |
| Health and Welfare Benefits | — | — | — | 10,043 | 10,043 | — | — |
| Death Benefit | — | — | — | — | — | — | 1,170,000 |
| Total | 686,945 | 903,819 | 686,945 | 1,359,988 | 1,961,388 | 1,288,345 | 2,465,047 |
| Wisconsin Electric Power Company | 36 | 2023 Annual Meeting Information Statement |
PAY RATIO DISCLOSURE
The primary objective of our executive compensation program is to provide a competitive, performance-based plan that enables WEC Energy Group and the Company to attract and retain key individuals and to reward them for achieving both WEC Energy Group’s and the Company’s short-term and long-term goals without creating an incentive for our NEOs to take excessive risks.
For 2022, the annual total compensation of Mr. Lauber, our principal executive officer serving in that position on December 31, 2022, of $8,149,461, as shown in the Summary Compensation Table above (“CEO Compensation”), was approximately 68 times the annual total compensation of the median employee of $119,284.
We identified the median employee as of December 31, 2022, using total wages and earnings paid during the rolling 12-month period ended December 31, 2022, as reflected in WEC Energy Group’s internal payroll records (including, without limitation, base salary, wages plus overtime, and annual cash incentive payments, as applicable), for all individuals who were employed by WEC Energy Group or any of its consolidated subsidiaries on December 31, 2022 (whether employed on a full-time, part-time, seasonal or temporary basis and including union and non-union employees). After identifying the median employee, we calculated annual total compensation for such employee using the same methodology we use for our CEO Compensation, which includes annual salary, bonus, change in pension value and 401(k) matching by WEC Energy Group. We decided to use December 31, the last day of our fiscal year, for administrative convenience to align with other fiscal year-end calculations.
To provide further context to our pay practices, due to the complexity of the work associated with operating public utilities, WEC Energy Group’s workforce tends to be more highly skilled than workforces at companies in other industries. Additionally, its employees often work for WEC Energy Group for long periods of time; average employee tenure is 14 years.
We are providing the pay ratio of Mr. Lauber to a median employee based upon his aggregate WEC Energy Group compensation because we believe doing otherwise would not be representative of the manner in which Mr. Lauber’s compensation is determined. A significant number of employees of a WEC Energy Group-owned centralized service company who provide a substantial amount of administrative and support services to the Company would otherwise be excluded from the pay ratio calculation if it were calculated on a basis other than the consolidated WEC Energy Group level. There are also employees of several of WEC Energy Group’s other utility subsidiaries who provide services to the Company and would otherwise be excluded from the calculation.
In addition to serving as CEO and President of WEC Energy Group and as Chairman, CEO and President of the Company, Mr. Lauber also serves in similar roles at several other major subsidiaries of WEC Energy Group. Therefore, the Compensation Committee determines Mr. Lauber’s annual compensation based upon his service to WEC Energy Group and its subsidiaries, taken as a whole.
RISK ANALYSIS OF COMPENSATION POLICIES AND PRACTICES
As part of its process to determine the 2022 compensation of the NEOs, the Compensation Committee analyzed whether the compensation program of WEC Energy Group and its subsidiaries taken as a whole creates risks that are reasonably likely to have a material adverse effect on WEC Energy Group and its subsidiaries, including the Company. The Compensation Committee concluded it does not. This analysis applies generally to the compensation program for WEC Energy Group’s and the Company’s employees since all management employees (both officers and non-officers) above a certain level are provided with substantially the same mix of compensation as the NEOs. The compensation package provided to employees below this level is not applicable to this analysis as such compensation package does not provide sufficient incentive to take risks that could materially affect WEC Energy Group or the Company.
There is no objective way to measure risk resulting from a corporation’s compensation program; therefore, this analysis is subjective in nature. We believe that the only elements of the compensation program that could incentivize risk-taking by the employees of WEC Energy Group or the Company, and therefore have a reasonable likelihood of materially adversely affecting WEC Energy Group or the Company, are the annual cash incentive compensation and the long-term incentive compensation, the payout of which is dependent on the achievement of certain performance levels by WEC Energy Group and its subsidiaries, including the Company. Based upon the value of each of these elements to the overall compensation mix and the relative value each has to the other, we believe the compensation program is appropriately balanced. We believe that the mix of short- and long-term awards minimizes risks that may be taken, as any risks taken for short-term gains could ultimately jeopardize WEC Energy Group’s or the Company’s ability to meet the long-term performance objectives. Given the current balance of compensation elements, we do not believe the compensation program incentivizes unreasonable risk-taking by management.
The Compensation Committee’s stock ownership guidelines require officers who participate in the long-term incentive compensation program to hold an amount of WEC Energy Group common stock and other equity-related WEC Energy Group securities that varies depending upon such officers’ level. The guidelines require executive officers to hold common stock and other equity-related securities of WEC Energy Group having a minimum fair market value ranging from 250% to 600% of base salary. The Compensation Committee believes these stock ownership guidelines further discourage unreasonable risk taking by the officers of WEC Energy Group or the Company.
As part of this analysis, we also considered the nature of WEC Energy Group’s business as a public utility holding company and the fact that substantially all of its earnings and other financial results are generated by, or relate to, regulated public utilities, including the Company. The highly regulated nature of WEC Energy Group’s business, including limits on the amount of profit WEC Energy Group’s public utility subsidiaries (and therefore, WEC Energy Group) may earn, significantly reduces any incentive to engage in conduct that would be reasonably likely to have a material adverse effect on WEC Energy Group or the Company.
| Wisconsin Electric Power Company | 37 | 2023 Annual Meeting Information Statement |
PAY VERSUS PERFORMANCE DISCLOSURE
As described in more detail in “Compensation Discussion and Analysis,” the executive compensation program has been designed to provide a level of compensation that is strongly dependent upon the achievement of short-term and long-term goals that are aligned with the interests of WEC Energy Group’s and the Company’s stockholders and customers. As such, a substantial portion of pay will only be realized upon strong corporate performance. The Compensation Committee has not designed the compensation program to specifically align WEC Energy Group’s and the Company’s performance measures with “compensation actually paid” (“CAP”) (as computed in accordance with Item 402(v) of Regulation S-K) for a particular year. For example, several performance measures are utilized to align executive compensation with WEC Energy Group’s and the Company’s performance that are not presented in the Pay versus Performance table below.
The following tables and supplemental graphical and narrative information present information about CAP, as defined by Item 402(v) of Regulation S-K, and compares CAP to various performance measures, also in accordance with such rules. CAP is a supplemental measure to be viewed alongside performance measures as an addition to the philosophy and strategy of compensation-setting discussed in “Compensation Discussion and Analysis,” and not in replacement thereof.
| Year | (1) Summary Compensation Table (SCT) Total for PEO ($) | (1,2) Compensation Actually Paid (CAP) to PEO ($) | (3) Average SCT total for non-PEO NEOs ($) | (2,3) Average Compensation Actually Paid to non-PEO NEOs ($) | Value of Initial Fixed $100 investment based on: ($) | WEC Net Income ($) (in millions) | Company Selected Measure | |||
| Lauber | Fletcher | Lauber | Fletcher | (4) WEC TSR | (5) Peer Group TSR | WEC Earnings Per Share (diluted) ($) | ||||
| 2022 | 8,149,461 | 8,151,511 | 9,721,228 | 17,332,947 | 2,729,967 | 3,457,990 | 110.80 | 111.03 | 1,408.1 | 4.45 |
| 2021 | — | 18,481,871 | — | 14,249,651 | 3,428,937 | 2,769,595 | 111.34 | 110.07 | 1,300.3 | 4.11 |
| 2020 | — | 18,136,171 | — | 15,590,856 | 2,871,392 | 3,298,800 | 102.49 | 95.94 | 1,199.9 | 3.79 |
| (1) | On February 1, 2022, Mr. Lauber succeeded Mr. Fletcher as CEO of WEC Energy Group and the Company. |
| (2) | Represents the CAP to each of Messrs. Lauber and Fletcher, and the average CAP to the non-PEO NEOs as a group, each as computed in accordance with Item 402(v) of Regulation S-K. The dollar amounts do not reflect the actual amount of compensation earned or paid during the applicable fiscal years. To calculate the CAP to Messrs. Lauber and Fletcher, and the average CAP to our non-PEO NEOs, the following adjustments were made to the SCT total compensation for the applicable fiscal year: |
SCT to CAP Reconciliation
| Year | SCT Total ($) | Deductions from SCT Total | Additions to SCT Total | CAP ($) | |||||
| Change in Pension Value ($) | (a) Equity-based awards Grant Date Fair Value ($) | (b) Pension Benefit Service Costs ($) | (c)(i) Change in Value of Covered Fiscal Year Awards Unvested at Covered Fiscal Year-End ($) | (c)(ii) Change in Value of Prior Years’ Awards Unvested at Fiscal Year-End ($) | (c)(iii) Value of Awards Granted and Vested in Covered Fiscal Year ($) | (c)(iv) Change in Value of Prior Years’ Awards that Vested in Fiscal Year ($) | |||
| Lauber SCT to CAP Reconciliation | |||||||||
| 2022 | 8,149,461 | 101,995 | 3,677,045 | 47,302 | 4,020,237 | 242,593 | — | 1,040,675 | 9,721,228 |
| 2021 | — | — | — | — | — | — | — | — | — |
| 2020 | — | — | — | — | — | — | — | — | — |
| Fletcher SCT to CAP Reconciliation | |||||||||
| 2022 | 8,151,511 | 1,979,992 | 4,288,062 | 12,250,001 | — | — | 1,481,678 | 1,717,811 | 17,332,947 |
| 2021 | 18,481,871 | 11,056,456 | 3,241,666 | 8,455,950 | 3,723,169 | (1,556,840) | — | (556,377) | 14,249,651 |
| 2020 | 18,136,171 | 11,037,728 | 3,109,135 | 7,556,108 | 3,386,570 | 633,130 | — | 25,740 | 15,590,856 |
| Average Non-PEO NEOs SCT to CAP Reconciliation | |||||||||
| 2022 | 2,729,967 | 26,676 | 1,086,369 | 26,386 | 1,187,762 | 110,141 | — | 516,779 | 3,457,990 |
| 2021 | 3,428,937 | 62,687 | 1,427,674 | 32,115 | 1,640,022 | (637,759) | — | (203,359) | 2,769,595 |
| 2020 | 2,871,392 | 91,293 | 1,237,573 | 35,602 | 1,325,526 | 365,710 | — | 29,436 | 3,298,800 |
| (a) | Represents the grant date fair value of equity awards as reflected in the “Stock Awards” and “Option Awards” columns of the SCT. |
| (b) | Represents the actuarially determined value of the pension benefit accrual for services rendered by each NEO during the applicable year. There were no costs of benefits granted pursuant to a plan amendment during any covered fiscal year that were attributed by the plan’s benefit formula to services rendered in periods prior to the plan amendment. |
| (c) | Represents (i) the covered fiscal year-end value of any equity awards granted in the covered fiscal year that were outstanding and unvested as of the end of such year; (ii) the amount of the change as of the covered fiscal year-end (from the end of the prior fiscal year) in fair value of any awards granted in prior years that were outstanding and unvested as of the end of the covered fiscal year; (iii) the fair value as of the vesting date of awards granted in a covered fiscal year that vested in the same covered fiscal year due to the retirement of a NEO; and (iv) the amount equal to the change as of the vesting date (from |
| Wisconsin Electric Power Company | 38 | 2023 Annual Meeting Information Statement |
| the end of the prior fiscal year) in fair value for awards granted in prior years that vested during the covered fiscal year. The valuation assumptions used to calculate fair values did not materially differ from those disclosed at the time of grant. | |
| (3) | The non-PEO NEOs for each of the years shown were as follows: |
| • | 2022: Messrs. Garvin and Mastoris, and Mmes. Liu and Kelsey | |
| • | 2021: Messrs. Lauber and Garvin, and Mmes. Liu and Kelsey | |
| • | 2020: Messrs. Lauber, Garvin, and Metcalfe, and Mmes. Liu and Kelsey |
| (4) | Assumes an investment of $100 at the beginning of the measurement period and reinvestment of all dividends. The “measurement period” for each covered fiscal year is the period from December 31, 2019 through the end of such covered fiscal year. |
| (5) | Represents the Total Shareholder Return (“TSR”) of the Custom Peer Index Group, weighted according to the respective companies’ stock market capitalization at the beginning of each period for which a return is indicated. The Compensation Committee determined that PG&E was no longer an appropriate peer comparison and approved its removal from, and the addition of Dominion Energy, Inc. to, the 2022 Custom Peer Index Group. Prior to these changes, the Custom Peer Index Group TSR would have been $115.80 for 2022. For information about the Custom Peer Index Group, including the changes made, see “Compensation Discussion and Analysis – Long-Term Incentive Compensation”. |
Most Important Performance Measures
The following represents the most important financial performance measures used by WEC Energy Group and the Company to link compensation actually paid to each NEO for the most recently completed fiscal year to company performance:
| WEC Earnings Per Share | WEC Net Income | WEC Cash Flow | Return on Equity of |
Achievement of WEC Energy Group’s goals with respect to the financial measures highlighted above should drive strong TSR performance for WEC Energy Group relative to its peers, which is an important component of the compensation program as more fully described in “Compensation Discussion and Analysis – Long-Term Incentive Compensation”.
Supplemental Graphs
The following graphs and descriptions are provided in accordance with Item 402(v) of Regulation S-K to show the relationships between the compensation actually paid for each of the PEOs, as well as the other NEOs as a group, to 1) the cumulative TSR of WEC Energy Group as it relates to the TSR of the Custom Peer Index Group, 2) WEC Energy Group net income, and 3) WEC Energy Group earnings per share, which is also the Company-selected performance measure.
In 2022, Mr. Fletcher was succeeded by Mr. Lauber as CEO. Mr. Fletcher’s “compensation actually paid” includes the accelerated vesting of all unvested long-term incentive awards upon his retirement.
CAP v. TSR
As demonstrated in the following graph, the amount of compensation paid to the PEOs and the average compensation paid to the other NEOs was aligned with WEC Energy Group’s TSR performance. A substantial portion of the compensation awarded to each of the NEOs is long-term incentive compensation. WEC Energy Group performance unit awards comprise 65% of the long-term incentive compensation granted each year, with vesting primarily based upon WEC Energy Group’s TSR performance against its peer group. As discussed further in “Compensation Discussion and Analysis,” the performance units granted in 2020, which vested at the end of the three-year performance period ended December 31, 2022, provided a payout that was less than target. See the Five-Year Cumulative Return and Total Stockholder Returns graphs in “Compensation Discussion and Analysis – Executive Summary” for information on WEC Energy Group’s TSR performance over the 5- and 10-year periods ended December 31, 2022, which exceeded the performance of its peer group.
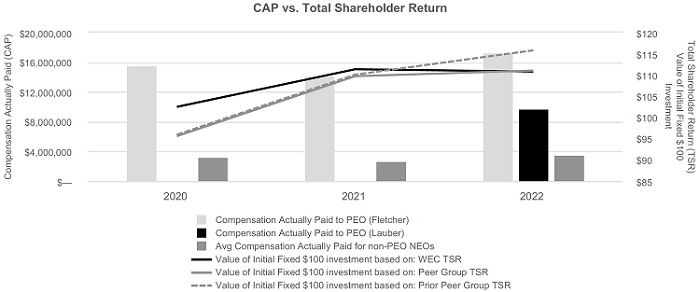
| Wisconsin Electric Power Company | 39 | 2023 Annual Meeting Information Statement |
CAP v. WEC Net Income and Earnings Per Share (Company-Selected Measure)
As demonstrated by the following graphs, during the cumulative three-year period ended December 31, 2022, the compensation paid to the PEOs and the average compensation paid to the other NEOs was aligned with WEC Energy Group’s net income and EPS performance. Pursuant to the terms of WEC Energy Group’s short-term performance plan, almost 75% of the payout was based upon WEC Energy Group’s performance against EPS goals, of which net income is a key component. Almost 25% was based upon WEC Energy Group’s performance against cash flow goals. As discussed further in “Compensation Discussion and Analysis,” for 2022, the target level payout under WEC Energy Group’s short-term performance plan with respect to EPS was set at the high end of its long-term EPS growth goal, and the maximum payout was set above the long-term EPS growth goal. WEC Energy Group’s strong performance against the EPS and cash flow goals in 2022 resulted in maximum level payouts for each measure.
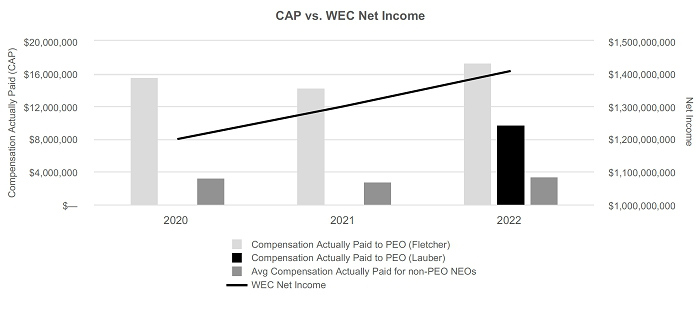

| Wisconsin Electric Power Company | 40 | 2023 Annual Meeting Information Statement |
STOCK OWNERSHIP OF DIRECTORS, NOMINEES AND EXECUTIVE OFFICERS
None of the Company’s directors, nominees, or executive officers own any WE stock but do beneficially own shares of its parent company, WEC Energy Group, Inc.
The following table lists the beneficial ownership of WEC Energy Group common stock of each WE director, director nominee, NEO, and of all of the directors and executive officers as a group as of January 31, 2023. In general, “beneficial ownership” includes those shares for which the indicated persons have voting power or investment power and WEC Energy Group stock options that are exercisable currently or within 60 days of January 31, 2023. Included are shares owned by each individual’s spouse, minor children, or any other relative sharing the same residence, as well as shares held in a fiduciary capacity or held in WEC Energy Group’s Stock Plus Investment Plan and WEC Energy Group’s 401(k) plans. The shares beneficially owned by all directors, director nominees and executive officers as a group consist of less than 1% of WEC Energy Group’s outstanding common stock.
| Name | Shares Beneficially Owned (1) | ||||
| Shares Owned (2) (3) (4) | Option Shares Exercisable Within 60 Days | Total | |||
| J. Kevin Fletcher | 23,450 | 250,683 | 274,133 | ||
| Robert M. Garvin | 11,956 | 59,292 | 71,248 | ||
| Margaret C. Kelsey | 12,922 | 59,004 | 71,926 | ||
| Gale E. Klappa | 258,701 | 281,404 | 540,105 | ||
| Scott J. Lauber | 36,332 | 118,815 | 155,147 | ||
| Xia Liu | 15,393 | — | 15,393 | ||
| William Mastoris | 6,134 | 15,183 | 21,317 | ||
| Paul J. Spicer | 8,448 | 11,784 | 20,232 | ||
| All directors and executive officers as a group (9 persons) (5) | 353,745(6) | 558,235 | 911,980(7) | ||
| (1) | Information on beneficially owned shares is based on data furnished by the specified persons and is determined in accordance with Rule 13d-3 under the Securities Exchange Act of 1934, as amended, as required for purposes of this information statement. It is not necessarily to be construed as an admission of beneficial ownership for other purposes. |
| (2) | Certain directors, director nominees, NEOs, and other executive officers also hold share units in the WEC Energy Group phantom common stock account under WEC Energy Group’s EDCP as indicated: Mr. Garvin (6,863), Ms. Kelsey (9,101), Mr. Lauber (1,372), Ms. Liu (12,201), Mr. Mastoris (2,493), Mr. Spicer (12,498) and all directors and executive officers as a group (42,962). Share units are intended to reflect the performance of WEC Energy Group common stock and are payable in cash. While these units do not represent a right to acquire WEC Energy Group common stock, have no voting rights, and are not included in the number of shares reflected in the “Shares Owned” column in the table above, the Company listed them in this footnote because they represent an additional economic interest of the directors, director nominees, NEOs, and other executive officers that is tied to the performance of WEC Energy Group common stock. |
| (3) | Each individual has sole voting and investment power as to all shares listed for such individual, except the following individual has shared voting and/or investment power (included in the table above) as indicated: Director Klappa (228,957). |
| (4) | The directors, director nominees, NEOs, and other executive officers hold shares of restricted stock (included in the table above) over which the holders have sole voting but no investment power: Mr. Garvin (2,605), Ms. Kelsey (3,019), Director Klappa (27,751), Mr. Lauber (11,820), Ms. Liu (8,013), Mr. Mastoris (1,515), Mr. Spicer (862) and all directors and executive officers as a group (56,072). |
| (5) | Includes directors, director nominees and current executive officers. |
| (6) | None of the shares beneficially owned by the directors, NEOs, or all directors and executive officers as a group are pledged as security. |
| (7) | Represents approximately 0.29% of total WEC Energy Group common stock outstanding on January 31, 2023. |
OWNERS OF MORE THAN 5% OF PREFERRED STOCK
Based upon reviews of Schedule 13Gs filed with the SEC as of February 14, 2023, there were no beneficial owners holding more than 5% of any class of WE’s preferred stock.
| Wisconsin Electric Power Company | 41 | 2023 Annual Meeting Information Statement |
CERTAIN RELATIONSHIPS AND RELATED TRANSACTIONS
The Company provides to and receives from WEC Energy Group and its other subsidiaries, including WEC Business Services LLC (“WBS”), a centralized service company, services, property and other items of value.
An affiliated interest agreement (the “AIA”), that became effective January 1, 2017, governs the provision and receipt of services by WEC Energy Group and its subsidiaries, including the Company. Services under the AIA are subject to various pricing methodologies. All services provided by any regulated subsidiary to another regulated subsidiary are priced at cost. All services provided by any regulated subsidiary to any nonregulated subsidiary are priced at the greater of cost or fair market value. All services provided by any nonregulated subsidiary to any regulated subsidiary are priced at the lesser of cost or fair market value. All services provided by any regulated or nonregulated subsidiary to WBS are priced at cost. WBS renders its services at cost.
Compensation Committee Interlocks and Insider Participation. None of the persons who served as members of the WEC Energy Group Compensation Committee during 2022 was an officer or employee of WEC Energy Group or the Company during 2022 or at any time in the past nor had reportable transactions with WEC Energy Group or the Company.
During 2022, none of our executive officers served as a member of the compensation committee or as a director of another entity, one of whose executive officers served on the Compensation Committee or as a director of WEC Energy Group or the Company
AVAILABILITY OF FORM 10-K
A copy (without exhibits) of Wisconsin Electric Power Company’s Annual Report on Form 10-K for the fiscal year ended December 31, 2022, as filed with the SEC, is available without charge to any stockholder of record or beneficial owner of Wisconsin Electric preferred stock by writing to the Corporate Secretary, Margaret C. Kelsey, at the Company’s principal business office, PO Box 2046, Milwaukee, Wisconsin 53201. The Wisconsin Electric consolidated financial statements and certain other information found in the Form 10-K are included in the Wisconsin Electric Power Company 2022 Annual Financial Statements and Review of Operations, attached hereto as Appendix A.
| Wisconsin Electric Power Company | 42 | 2023 Annual Meeting Information Statement |
APPENDIX A
| WISCONSIN ELECTRIC POWER COMPANY | ||
| 2022 ANNUAL REPORT TO STOCKHOLDERS | ||
| 2022 ANNUAL FINANCIAL STATEMENTS | ||
| AND | ||
| REVIEW OF OPERATIONS |
| Wisconsin Electric Power Company | A-1 | 2022 Annual Financial Statements |
GLOSSARY OF TERMS AND ABBREVIATIONS
The abbreviations and terms set forth below are used throughout this report and have the meanings assigned to them below:
| Subsidiaries and Affiliates | ||
| ATC | American Transmission Company LLC | |
| Bluewater | Bluewater Natural Gas Holding, LLC | |
| UMERC | Upper Michigan Energy Resources Corporation | |
| WBS | WEC Business Services LLC | |
| WE | Wisconsin Electric Power Company | |
| We Power | W.E. Power, LLC | |
| WEC Energy Group | WEC Energy Group, Inc. | |
| WEPCo Environmental Trust | WEPCo Environmental Trust Finance I, LLC | |
| WG | Wisconsin Gas LLC | |
| WPS | Wisconsin Public Service Corporation | |
| Federal and State Regulatory Agencies | ||
| CBP | United States Customs and Border Protection Agency | |
| DOC | United States Department of Commerce | |
| EPA | United States Environmental Protection Agency | |
| FERC | Federal Energy Regulatory Commission | |
| IRS | United States Internal Revenue Service | |
| PSCW | Public Service Commission of Wisconsin | |
| SEC | Securities and Exchange Commission | |
| WDNR | Wisconsin Department of Natural Resources | |
| Accounting Terms | ||
| AFUDC | Allowance for Funds Used During Construction | |
| ARO | Asset Retirement Obligation | |
| ASC | Accounting Standards Codification | |
| ASU | Accounting Standards Update | |
| CWIP | Construction Work in Progress | |
| FASB | Financial Accounting Standards Board | |
| GAAP | Generally Accepted Accounting Principles | |
| OPEB | Other Postretirement Employee Benefits | |
| VIE | Variable Interest Entity | |
| Environmental Terms | ||
| ACE | Affordable Clean Energy | |
| Act 141 | 2005 Wisconsin Act 141 | |
| BATW | Bottom Ash Transport Water | |
| BTA | Best Technology Available | |
| CAA | Clean Air Act | |
| CASAC | Clean Air Scientific Advisory Committee | |
| CO2 | Carbon Dioxide | |
| ELG | Steam Electric Effluent Limitation Guidelines | |
| FGD | Flue Gas Desulfurization | |
| GHG | Greenhouse Gas | |
| NAAQS | National Ambient Air Quality Standards | |
| NOPP | Notice of Planned Participation | |
| NOx | Nitrogen Oxide | |
| NSPS | New Source Performance Standards | |
| PM | Particulate Matter | |
| SO2 | Sulfur Dioxide | |
| WOTUS | Waters of the United States | |
| WPDES | Wisconsin Pollutant Discharge Elimination System | |
| Wisconsin Electric Power Company | A-2 | 2022 Annual Financial Statements |
| Measurements | ||
| Bcf | Billion Cubic Feet | |
| Dth | Dekatherm | |
| MW | Megawatt | |
| MWh | Megawatt-hour | |
| µg/m3 | Micrograms Per Cubic Meter | |
| Other Terms and Abbreviations | ||
| AD/CVD | Antidumping and Countervailing Duties | |
| AIA | Affiliated Interest Agreement | |
| AMI | Advanced Metering Infrastructure | |
| ARR | Auction Revenue Right | |
| Badger Hollow II | Badger Hollow Solar Park II | |
| Blue Sky | Blue Sky Green Field Wind Park | |
| CFR | Code of Federal Regulations | |
| Compensation Committee | Compensation Committee of the Board of Directors of WEC Energy Group, Inc. | |
| COVID-19 | Coronavirus Disease – 2019 | |
| D.C. Circuit Court of Appeals | United States Court of Appeals for the District of Columbia Circuit | |
| Darien | Darien Solar-Battery Park | |
| DER | Distributed Energy Resource | |
| DRER | Dedicated Renewable Energy Resource | |
| ERGS | Elm Road Generating Station | |
| ER 1 | Elm Road Generating Station Unit 1 | |
| ER 2 | Elm Road Generating Station Unit 2 | |
| ESG Progress Plan | WEC Energy Group’s Capital Investment Plan for Efficiency, Sustainability, and Growth for 2023-2027 | |
| ETB | Environmental Trust Bond | |
| EV | Electric Vehicle | |
| Exchange Act | Securities Exchange Act of 1934, as amended | |
| Executive Order 13990 | Executive Order 13990 of January 20, 2021 - Protecting Public Health and the Environment and Restoring Science To Tackle the Climate Crisis | |
| FTR | Financial Transmission Right | |
| GCRM | Gas Cost Recovery Mechanism | |
| IRA | Inflation Reduction Act | |
| ITC | Investment Tax Credit | |
| LIBOR | London Interbank Offered Rate | |
| LMP | Locational Marginal Price | |
| LNG | Liquefied Natural Gas | |
| MISO | Midcontinent Independent System Operator, Inc. | |
| MISO Energy Markets | MISO Energy and Operating Reserves Market | |
| NYMEX | New York Mercantile Exchange | |
| OCPP | Oak Creek Power Plant | |
| OC 5 | Oak Creek Power Plant Unit 5 | |
| OC 7 | Oak Creek Power Plant Unit 7 | |
| OC 8 | Oak Creek Power Plant Unit 8 | |
| Omnibus Stock Incentive Plan | WEC Energy Group Omnibus Stock Incentive Plan, Amended and Restated, Effective as of May 6, 2021 | |
| Paris | Paris Solar-Battery Park | |
| PIPP | Presque Isle Power Plant | |
| Point Beach | Point Beach Nuclear Power Plant | |
| PPA | Power Purchase Agreement | |
| PSB | Public Service Building | |
| PTC | Production Tax Credit | |
| PWGS | Port Washington Generating Station | |
| PWGS 1 | Port Washington Generating Station Unit 1 | |
| PWGS 2 | Port Washington Generating Station Unit 2 | |
| RICE | Reciprocating Internal Combustion Engine | |
| RNG | Renewable Natural Gas | |
| ROE | Return on Equity | |
| Wisconsin Electric Power Company | A-3 | 2022 Annual Financial Statements |
| RTO | Regional Transmission Organization | |
| S&P | Standard & Poor’s | |
| SIP | State Implementation Plan | |
| SOFR | Secured Overnight Financing Rate | |
| SSR | System Support Resource | |
| Supreme Court | United States Supreme Court | |
| Tax Legislation | Tax Cuts and Jobs Act of 2017 | |
| UFLPA | Uyghur Forced Labor Prevention Act | |
| VAPP | Valley Power Plant | |
| West Riverside | West Riverside Energy Center | |
| Whitewater | Whitewater Cogeneration Facility | |
| WRO | Withhold Release Order |
| Wisconsin Electric Power Company | A-4 | 2022 Annual Financial Statements |
CAUTIONARY STATEMENT REGARDING FORWARD-LOOKING INFORMATION
In this report, we make statements concerning our expectations, beliefs, plans, objectives, goals, strategies, and future events or performance. These statements are “forward-looking statements” within the meaning of Section 27A of the Securities Act of 1933, as amended, and Section 21E of the Exchange Act. Readers are cautioned not to place undue reliance on these forward-looking statements. Forward-looking statements may be identified by reference to a future period or periods or by the use of terms such as “anticipates,” “believes,” “could,” “estimates,” “expects,” “forecasts,” “goals,” “guidance,” “intends,” “may,” “objectives,” “plans,” “possible,” “potential,” “projects,” “seeks,” “should,” “targets,” “will,” or variations of these terms.
Forward-looking statements include, among other things, statements concerning management’s expectations and projections regarding earnings, completion of capital projects, sales and customer growth, rate actions and related filings with regulatory authorities, environmental and other regulations, including associated compliance costs, legal proceedings, effective tax rates, pension and OPEB plans, fuel costs, sources of electric energy supply, coal and natural gas deliveries, remediation costs, climate-related matters, the ESG Progress Plan, liquidity and capital resources, and other matters.
Forward-looking statements are subject to a number of risks and uncertainties that could cause our actual results to differ materially from those expressed or implied in the statements. These risks and uncertainties include those described below:
| • | Factors affecting utility operations such as catastrophic weather-related damage, environmental incidents, unplanned facility outages and repairs and maintenance, and electric transmission or natural gas pipeline system constraints; | |
| • | Factors affecting the demand for electricity and natural gas, including political or regulatory developments, varying, adverse, or unusually severe weather conditions, including those caused by climate change, changes in economic conditions, customer growth and declines, commodity prices, energy conservation efforts, and continued adoption of distributed generation by customers; | |
| • | The timing, resolution, and impact of rate cases and negotiations, including recovery of deferred and current costs and the ability to earn a reasonable return on investment, and other regulatory decisions impacting our regulated operations; | |
| • | The impact of federal, state, and local legislative and/or regulatory changes, including changes in rate-setting policies or procedures, deregulation and restructuring of the electric and/or natural gas utility industries, transmission or distribution system operation, the approval process for new construction, reliability standards, pipeline integrity and safety standards, allocation of energy assistance, energy efficiency mandates, electrification initiatives and other efforts to reduce the use of natural gas, and tax laws, including those that affect our ability to use PTCs and ITCs; | |
| • | Federal, state, and local legislative and regulatory changes relating to the environment, including climate change and other environmental regulations impacting generation facilities and renewable energy standards, the enforcement of these laws and regulations, changes in the interpretation of regulations or permit conditions by regulatory agencies, and the recovery of associated remediation and compliance costs; | |
| • | The ability to obtain and retain customers, including wholesale customers, due to increased competition in our electric and natural gas markets from retail choice and alternative electric suppliers, and continued industry consolidation; | |
| • | The timely completion of capital projects within budgets and the ability to recover the related costs through rates; | |
| • | The impact of changing expectations and demands of our customers, regulators, investors, and other stakeholders, including heightened emphasis on environmental, social, and governance concerns; | |
| • | The risk of delays and shortages, and increased costs of equipment, materials, or other resources that are critical to our business operations and corporate strategy, as a result of supply chain disruptions (including disruptions from rail congestion), inflation, and other factors; | |
| • | The impact of public health crises, including epidemics and pandemics, on our business functions, financial condition, liquidity, and results of operations; | |
| • | Factors affecting the implementation of WEC Energy Group’s CO2 emission and/or methane emission reduction goals and opportunities and actions related to those goals, including related regulatory decisions, the cost of materials, supplies, and labor, technology advances, the feasibility of competing generation projects, and the ability to execute WEC Energy Group’s capital plan; | |
| • | The financial and operational feasibility of taking more aggressive action to further reduce GHG emissions in order to limit future global temperature increases; | |
| • | The risks associated with inflation and changing commodity prices, including natural gas and electricity; | |
| • | The availability and cost of sources of natural gas and other fossil fuels, purchased power, materials needed to operate environmental controls at our electric generating facilities, or water supply due to high demand, shortages, transportation problems, nonperformance by electric energy or natural gas suppliers under existing power purchase or natural gas supply contracts, or other developments; | |
| • | Any impacts on the global economy, supply chains and fuel prices, generally, from the ongoing conflict between Russia and Ukraine and related sanctions; | |
| • | Changes in credit ratings, interest rates, and our ability to access the capital markets, caused by volatility in the global credit markets, our capitalization structure, and market perceptions of the utility industry or us; |
| Wisconsin Electric Power Company | A-5 | 2022 Annual Financial Statements |
| • | Changes in the method of determining LIBOR or the replacement of LIBOR with an alternative reference rate; | |
| • | Costs and effects of litigation, administrative proceedings, investigations, settlements, claims, and inquiries; | |
| • | The direct or indirect effect on our business resulting from terrorist or other physical attacks and cyber security intrusions, as well as the threat of such incidents, including the failure to maintain the security of personally identifiable information, the associated costs to protect our utility assets, technology systems, and personal information, and the costs to notify affected persons to mitigate their information security concerns and to comply with state notification laws; | |
| • | The risk of financial loss, including increases in bad debt expense, associated with the inability of our customers, counterparties, and affiliates to meet their obligations; | |
| • | Changes in the creditworthiness of the counterparties with whom we have contractual arrangements, including participants in the energy trading markets and fuel suppliers and transporters; | |
| • | The investment performance of our employee benefit plan assets, as well as unanticipated changes in related actuarial assumptions, which could impact future funding requirements; | |
| • | Factors affecting the employee workforce, including loss of key personnel, internal restructuring, work stoppages, and collective bargaining agreements and negotiations with union employees; | |
| • | Advances in technology, and related legislation or regulation supporting the use of that technology, that result in competitive disadvantages and create the potential for impairment of existing assets; | |
| • | The risk associated with the value of long-lived assets, including intangible assets, and their possible impairment; | |
| • | Potential business strategies to acquire and dispose of assets, which cannot be assured to be completed timely or within budgets; | |
| • | The timing and outcome of any audits, disputes, and other proceedings related to taxes; | |
| • | The effect of accounting pronouncements issued periodically by standard-setting bodies; and | |
| • | Other considerations disclosed elsewhere herein and in other reports we file with the SEC or in other publicly disseminated written documents. |
Except as may be required by law, we expressly disclaim any obligation to publicly update or revise any forward-looking statements, whether as a result of new information, future events, or otherwise.
| Wisconsin Electric Power Company | A-6 | 2022 Annual Financial Statements |
BUSINESS OF THE COMPANY
In this report, when we refer to “us,” “we,” “our,” or “ours,” we are referring to Wisconsin Electric Power Company. References to “Notes” are to the Notes to Consolidated Financial Statements included in this report.
We are a subsidiary of WEC Energy Group and were incorporated in the state of Wisconsin in 1896. We maintain our principal executive offices in Milwaukee, Wisconsin and serve customers in Wisconsin. We conduct our business primarily through our utility reportable segment.
UTILITY SEGMENT
We generate and distribute electric energy to approximately 1,152,400 customers located in southeastern Wisconsin (including the metropolitan Milwaukee area), east central Wisconsin, and northern Wisconsin.
We provide natural gas utility service to approximately 505,200 customers in three distinct service areas in Wisconsin, including west and south of the City of Milwaukee, the Appleton area, and areas within Iron and Vilas Counties.
We have a steam utility that generates, distributes, and sells steam supplied by the VAPP to customers in metropolitan Milwaukee, Wisconsin. Steam is used by approximately 400 customers for processing, space heating, domestic hot water, and humidification.
| Wisconsin Electric Power Company | A-7 | 2022 Annual Financial Statements |
MANAGEMENT’S DISCUSSION AND ANALYSIS OF
FINANCIAL CONDITION AND RESULTS OF OPERATIONS
CORPORATE DEVELOPMENTS
INTRODUCTION
We are a wholly owned subsidiary of WEC Energy Group, and derive revenues from the distribution and sale of electricity and natural gas to retail customers in Wisconsin. We also provide wholesale electric service to numerous utilities and cooperatives for resale. We conduct our business primarily through our utility reportable segment. See Note 19, Segment Information, for more information on our reportable business segments.
CORPORATE STRATEGY
Our goal is to continue to build and sustain long-term value for our customers and WEC Energy Group’s shareholders by focusing on the fundamentals of our business: environmental stewardship; reliability; operating efficiency; financial discipline; exceptional customer care; and safety. WEC Energy Group’s capital investment plan for efficiency, sustainability and growth, referred to as its ESG Progress Plan, provides a roadmap to achieve this goal. It is an aggressive plan to cut emissions, maintain superior reliability, deliver significant savings for customers, and grow WEC Energy Group’s and our investment in the future of energy.
Throughout its strategic planning process, WEC Energy Group takes into account important developments, risks and opportunities, including new technologies, customer preferences and affordability, energy resiliency efforts, and sustainability. WEC Energy Group published the results of a priority sustainability issue assessment in 2020, identifying the issues that are most important to the company and its stakeholders over the short and long terms. This risk and priority assessment has formed WEC Energy Group’s direction as a company.
Creating a Sustainable Future
WEC Energy Group’s ESG Progress Plan includes the retirement of older, fossil-fueled generation, to be replaced with zero-carbon-emitting renewables and clean natural gas-fired generation at its electric utilities, including us. When taken together, the retirements and new investments should better balance supply with demand, while maintaining reliable, affordable energy for our customers. The retirements will contribute to meeting WEC Energy Group’s and our goals to reduce CO2 emissions from electric generation.
In May 2021, WEC Energy Group announced goals to achieve reductions in carbon emissions from its electric generation fleet by 60% by the end of 2025 and by 80% by the end of 2030, both from a 2005 baseline. WEC Energy Group expects to achieve these goals by making operating refinements, retiring less efficient generating units, and executing its capital plan. Over the longer term, the target for its generation fleet is net-zero CO2 emissions by 2050.
As part of our path toward these goals, we are exploring co-firing with natural gas at our ERGS coal-fired units. By the end of 2030, WEC Energy Group expects to use coal as a backup fuel only, and WEC Energy Group believes it will be in a position to eliminate coal as an energy source by the end of 2035.
WEC Energy Group already has retired more than 1,800 MWs of coal-fired generation since the beginning of 2018, which included the 2019 retirement of the PIPP as well as the 2018 retirement of the Pleasant Prairie power plant. See Note 6, Regulatory Assets and Liabilities, for more information related to these power plant retirements. Through the ESG Progress Plan, WEC Energy Group expects to retire approximately 1,600 MW of additional fossil-fueled generation by the end of 2026, which includes the planned retirement in 2024-2025 of OCPP Units 5-8. See Note 7, Property, Plant, and Equipment, for more information related to the planned OCPP retirements.
In addition to retiring these older, fossil-fueled plants, WEC Energy Group expects to invest approximately $5.4 billion from 2023-2027 in regulated renewable energy in Wisconsin. WEC Energy Group’s plan is to replace a portion of the retired capacity by building and owning zero-carbon-emitting renewable generation facilities that are anticipated to include the following new investments made by either us or WPS based on specific customer needs:
| • | 1,900 MW of utility-scale solar; | |
| • | 700 MW of battery storage; and | |
| • | 700 MW of wind. |
| Wisconsin Electric Power Company | A-8 | 2022 Annual Financial Statements |
WEC Energy Group also plans on investing in a combination of clean, natural gas-fired generation, made by either us or WPS based on specific customer needs, including:
| • | 100 MW of RICE natural gas-fueled generation; and |
| • | the planned purchase of 200 MW of capacity in West Riverside – a combined-cycle natural gas plant recently completed by Alliant Energy in Wisconsin. |
For more details, see Liquidity and Capital Resources – Cash Requirements – Significant Capital Projects.
In December 2018, we received approval from the PSCW for two renewable energy pilot programs. The Solar Now pilot is expected to add a total of 35 MW of solar generation to our portfolio, allowing non-profit and government entities, as well as commercial and industrial customers, to site utility owned solar arrays on their property. Under this program, we have energized 24 Solar Now projects and currently have another five under construction, together totaling more than 30 MW. The second program, the DRER pilot, would allow large commercial and industrial customers to access renewable resources that we would operate, adding up to 150 MW of renewables to our portfolio. The DRER pilot would help these larger customers to meet their sustainability and renewable energy goals.
In August 2021, the PSCW approved pilot programs for us to install and maintain EV charging equipment for customers at their homes or businesses. The programs provide direct benefits to customers by removing cost barriers associated with installing EV equipment. In October 2021, subject to the receipt of any necessary regulatory approvals, WEC Energy Group pledged to expand the EV charging network within its utilities’ electric service territories. In doing so, WEC Energy Group joined a coalition of utility companies in a unified effort to make EV charging convenient and widely available throughout the Midwest. The coalition WEC Energy Group joined is planning to help build and grow EV charging corridors, enabling the general public to safely and efficiently charge their vehicles.
WEC Energy Group also continues to reduce methane emissions by improving its natural gas distribution system, and has set a target across its natural gas distribution operations to achieve net-zero methane emissions by the end of 2030. WEC Energy Group plans to achieve its net-zero goal through an effort that includes both continuous operational improvements and equipment upgrades, as well as the use of RNG throughout its utility systems. In 2022, we received approval from the PSCW for an RNG pilot associated with our natural gas distribution system.
In 2023, WEC Energy Group is planning a pilot program with EPRI and CMBlu Energy, a Germany-based designer and manufacturer, to test a new form of long-duration energy storage on the U.S. electric grid. The program will test battery system performance, including the ability to store and discharge energy for up to twice as long as the typical lithium-ion batteries in use today. The pilot is planned for the fourth-quarter of 2023.
Reliability
We have made significant reliability-related investments in recent years, and in accordance with the ESG Progress Plan, expect to continue strengthening and modernizing our generation fleet, as well as our electric and natural gas distribution networks to further improve reliability.
We received approval to construct an LNG facility to meet anticipated peak demand. Commercial operation of the LNG facility is targeted for the end of 2023.
For more details, see Liquidity and Capital Resources – Cash Requirements – Significant Capital Projects.
Operating Efficiency
We continually look for ways to optimize the operating efficiency of our company and will continue to do so under the ESG Progress Plan. For example, we are making progress on our AMI program, replacing aging meter-reading equipment on both our network and customer property. An integrated system of smart meters, communication networks, and data management programs enables two-way communication between us and our customers. This program reduces the manual effort for disconnects and reconnects and enhances outage management capabilities.
WEC Energy Group continues to focus on integrating the resources of its businesses and finding the best and most efficient processes.
Financial Discipline
A strong adherence to financial discipline is essential to meeting our earnings projections and maintaining a strong balance sheet, stable cash flows, and quality credit ratings.
We follow an asset management strategy that focuses on investing in and acquiring assets consistent with our strategic plans, as well as disposing of assets, including property, plants, and equipment, that are no longer strategic to operations, are not performing as intended, or have an unacceptable risk profile. See Note 2, Acquisition, for more information on our recent acquisition of Whitewater.
| Wisconsin Electric Power Company | A-9 | 2022 Annual Financial Statements |
Exceptional Customer Care
Our approach is driven by an intense focus on delivering exceptional customer care every day. We strive to provide the best value for our customers by demonstrating personal responsibility for results, leveraging our capabilities and expertise, and using creative solutions to meet or exceed our customers’ expectations.
A multiyear effort is driving a standardized, seamless approach to digital customer service across all of the WEC Energy Group companies. It has moved all utilities, including us, to a common platform for all customer-facing self-service options. Using common systems and processes reduces costs, provides greater flexibility and enhances the consistent delivery of exceptional service to customers.
Safety
Safety is one of our core values and a critical component of our culture. We are committed to keeping our employees and the public safe through a comprehensive corporate safety program that focuses on employee engagement and elimination of at-risk behaviors.
Under our “Target Zero” mission, we have an ultimate goal of zero incidents, accidents, and injuries. Management and union leadership work together to reinforce the Target Zero culture. We set annual goals for safety results as well as measurable leading indicators, in order to raise awareness of at-risk behaviors and situations and guide injury-prevention activities. All employees are encouraged to report unsafe conditions or incidents that could have led to an injury. Injuries and tasks with high levels of risk are assessed, and findings and best practices are shared across the WEC Energy Group companies.
Our corporate safety program provides a forum for addressing employee concerns, training employees and contractors on current safety standards, and recognizing those who demonstrate a safety focus.
RESULTS OF OPERATIONS
The following discussion and analysis of our Results of Operations includes comparisons of our results for the year ended December 31, 2022 with the year ended December 31, 2021. For a similar discussion that compares our results for the year ended December 31, 2021 with the year ended December 31, 2020, see Item 7. Management’s Discussion and Analysis of Financial Condition and Results of Operations – Results of Operations in Part II of our 2021 Annual Report on Form 10-K, which was filed with the SEC on February 24, 2022.
CONSOLIDATED EARNINGS
Our earnings for the year ended December 31, 2022 were $396.7 million, compared with $381.2 million for the year ended December 31, 2021. See below for additional information on the $15.5 million increase in earnings.
Non-GAAP Financial Measures
The discussion below addresses the contribution of our utility segment to net income attributed to common shareholder. The discussion includes financial information prepared in accordance with GAAP, as well as electric margins and natural gas margins, which are not measures of financial performance under GAAP. Electric margins (electric revenues less fuel and purchased power costs) and natural gas margins (natural gas revenues less cost of natural gas sold) are non-GAAP financial measures because they exclude other operation and maintenance expense, depreciation and amortization, and property and revenue taxes.
We believe that electric and natural gas margins provide a useful basis for evaluating utility operations since the majority of prudently incurred fuel and purchased power costs, as well as prudently incurred natural gas costs, are passed through to customers in current rates. As a result, management uses electric and natural gas margins internally when assessing the operating performance of our utility segment as these measures exclude the majority of revenue fluctuations caused by changes in these expenses. Similarly, the presentation of electric and natural gas margins herein is intended to provide supplemental information for investors regarding our operating performance.
Our electric margins and natural gas margins may not be comparable to similar measures presented by other companies. Furthermore, these measures are not intended to replace operating income as determined in accordance with GAAP as an indicator of operating performance. Our utility segment operating income for the years ended December 31, 2022 and 2021 was $940.0 million and $868.7 million, respectively. The discussion below includes a table that provides the calculation of electric margins and natural gas margins, along with a reconciliation to the most directly comparable GAAP measure, operating income.
| Wisconsin Electric Power Company | A-10 | 2022 Annual Financial Statements |
UTILITY SEGMENT CONTRIBUTION TO NET INCOME ATTRIBUTED TO COMMON SHAREHOLDER
| Year Ended December 31 | ||||||||||||
| (in millions) | 2022 | 2021 | B (W) | |||||||||
| Electric revenues | $ | 3,461.8 | $ | 3,188.6 | $ | 273.2 | ||||||
| Fuel and purchased power | 1,274.0 | 1,034.5 | (239.5 | ) | ||||||||
| Total electric margins | 2,187.8 | 2,154.1 | 33.7 | |||||||||
| Natural gas revenues | 608.5 | 475.9 | 132.6 | |||||||||
| Cost of natural gas sold | 419.3 | 306.6 | (112.7 | ) | ||||||||
| Total natural gas margins | 189.2 | 169.3 | 19.9 | |||||||||
| Total electric and natural gas margins | 2,377.0 | 2,323.4 | 53.6 | |||||||||
| Other operation and maintenance | 831.7 | 898.4 | 66.7 | |||||||||
| Depreciation and amortization | 479.7 | 457.9 | (21.8 | ) | ||||||||
| Property and revenue taxes | 125.6 | 98.4 | (27.2 | ) | ||||||||
| Operating income | 940.0 | 868.7 | 71.3 | |||||||||
| Other income, net | 49.4 | 32.1 | 17.3 | |||||||||
| Interest expense | 458.4 | 460.3 | 1.9 | |||||||||
| Income before income taxes | 531.0 | 440.5 | 90.5 | |||||||||
| Income tax expense | 133.1 | 58.1 | (75.0 | ) | ||||||||
| Preferred stock dividends of subsidiary | 1.2 | 1.2 | — | |||||||||
| Net income attributed to common shareholder | $ | 396.7 | $ | 381.2 | $ | 15.5 | ||||||
The following table shows a breakdown of other operation and maintenance:
| Year Ended December 31 | ||||||||||||
| (in millions) | 2022 | 2021 | B (W) | |||||||||
| Operation and maintenance not included in line items below | $ | 357.7 | $ | 366.3 | $ | 8.6 | ||||||
| Transmission (1) | 275.8 | 337.8 | 62.0 | |||||||||
| We Power (2) | 108.1 | 114.9 | 6.8 | |||||||||
| Regulatory amortizations and other pass through expenses (3) | 69.7 | 67.1 | (2.6 | ) | ||||||||
| Earnings sharing mechanism (4) | — | 1.7 | 1.7 | |||||||||
| Other | 20.4 | 10.6 | (9.8 | ) | ||||||||
| Total other operation and maintenance | $ | 831.7 | $ | 898.4 | $ | 66.7 | ||||||
| (1) | Represents transmission expense that we are authorized to collect in rates. The PSCW has approved escrow accounting for ATC and MISO network transmission expenses. As a result, we defer as a regulatory asset or liability, the difference between actual transmission costs and those included in rates until recovery or refund is authorized in a future rate proceeding. During 2022 and 2021, $340.0 million and $335.1 million, respectively, of costs were billed to us by transmission providers. |
During 2022, we amortized $62.0 million of the regulatory liabilities associated with our transmission escrows to offset certain 2022 revenue deficiencies, as approved by the PSCW in order to forego filing for 2022 base rate increases. This amortization drove the decrease in transmission expense during 2022, compared with 2021.
| (2) | Represents costs associated with the We Power generation units, including operating and maintenance costs we recognized. During 2022 and 2021, $121.7 million and $113.1 million, respectively, of costs were billed to or incurred by us related to the We Power generation units, with the difference in costs billed or incurred and expenses recognized, either deferred or deducted from the regulatory asset. |
| (3) | Regulatory amortizations and other pass through expenses are substantially offset in margins and therefore do not have a significant impact on net income. |
| (4) | Represents operation and maintenance associated with the earnings sharing mechanism we have in place. See Note 23, Regulatory Environment, for more information about our earnings sharing mechanism. |
| Wisconsin Electric Power Company | A-11 | 2022 Annual Financial Statements |
The following tables provide information on delivered sales volumes by customer class and weather statistics:
| Year Ended December 31 | ||||||||||||
| MWh (in thousands) | ||||||||||||
| Electric Sales Volumes | 2022 | 2021 | B (W) | |||||||||
| Customer class | ||||||||||||
| Residential | 8,099.8 | 8,198.1 | (98.3 | ) | ||||||||
| Small commercial and industrial | 8,655.9 | 8,595.9 | 60.0 | |||||||||
| Large commercial and industrial | 6,655.9 | 6,656.6 | (0.7 | ) | ||||||||
| Other | 110.2 | 118.5 | (8.3 | ) | ||||||||
| Total retail | 23,521.8 | 23,569.1 | (47.3 | ) | ||||||||
| Wholesale | 857.5 | 1,135.6 | (278.1 | ) | ||||||||
| Resale | 3,618.7 | 4,619.9 | (1,001.2 | ) | ||||||||
| Total sales in MWh | 27,998.0 | 29,324.6 | (1,326.6 | ) | ||||||||
| Year Ended December 31 | ||||||||||||
| Therms (in millions) | ||||||||||||
| Natural Gas Sales Volumes | 2022 | 2021 | B (W) | |||||||||
| Customer class | ||||||||||||
| Residential | 400.1 | 351.3 | 48.8 | |||||||||
| Commercial and industrial | 224.9 | 192.2 | 32.7 | |||||||||
| Total retail | 625.0 | 543.5 | 81.5 | |||||||||
| Transportation | 324.2 | 305.4 | 18.8 | |||||||||
| Total sales in therms | 949.2 | 848.9 | 100.3 | |||||||||
| Year Ended December 31 | ||||||||||||
| Degree Days | ||||||||||||
| Weather (1) | 2022 | 2021 | B (W) | |||||||||
| Heating (6,518 Normal) | 6,369 | 5,735 | 11.1 | % | ||||||||
| Cooling (774 Normal) | 944 | 1,061 | (11.0 | )% | ||||||||
| (1) | Normal degree days are based on a 20-year moving average of monthly temperatures from Mitchell International Airport in Milwaukee, Wisconsin. |
Electric Revenues
Electric revenues increased $273.2 million during 2022, compared with 2021. To the extent that changes in fuel and purchased power costs are passed through to customers, the changes are offset by comparable changes in revenues. See the discussion of electric utility margins below for more information related to the recovery of fuel and purchased power costs and the remaining drivers of the changes in electric revenues.
Electric Utility Margins
Electric utility margins increased $33.7 million during 2022, compared with 2021. The significant factors impacting the higher electric utility margins were:
| • | A $64.8 million increase in margins related to the impact of unprotected excess deferred taxes during 2021, which we agreed to return to customers in our PSCW-approved rate order. This increase in margins is offset in income taxes. See Note 15, Income Taxes, and Note 23, Regulatory Environment, for more information. |
| • | A $6.6 million increase in other revenues, primarily related to third-party use of our assets. |
| • | A $3.5 million increase in securitization revenues received during 2022, compared with 2021, related to an environmental control charge from our retail electric distribution customers on behalf of WEPCo Environmental Trust. We began assessing this charge in June 2021, subsequent to the issuance of the ETBs by WEPCo Environmental Trust in May 2021, in accordance with a November 2020 PSCW financing order. See Note 13, Long-Term Debt, and Note 20, Variable Interest Entities, for more information. These revenues are offset in depreciation and amortization as well as interest expense. |
| Wisconsin Electric Power Company | A-12 | 2022 Annual Financial Statements |
These increases in margins were partially offset by:
| • | A $17.1 million year-over-year negative impact from collections of fuel and purchased power costs compared with costs collected in rates. Under the Wisconsin fuel rules, our margins are impacted by under- or over-collections of certain fuel and purchased power costs that are within a 2% price variance from the costs included in rates, and the remaining variance beyond the 2% price variance is generally deferred for future recovery or refund to customers. |
| • | Lower margins of $12.7 million driven by the expiration of certain wholesale contracts. |
| • | A $12.3 million net decrease in margins related to lower sales volumes, driven by the impact of cooler weather during the 2022 cooling season, compared with 2021, and partially offset by the continued economic recovery in Wisconsin from the COVID-19 pandemic. As measured by cooling degree days, 2022 was 11.0% cooler than 2021. |
Natural Gas Revenues
Natural gas revenues increased $132.6 million during 2022, compared with 2021. Because prudently incurred natural gas costs are passed through to our customers in current rates, the changes are offset by comparable changes in revenues. The average per-unit cost of natural gas increased approximately 21% during 2022, compared with 2021. The remaining drivers of changes in natural gas revenues are described in the discussion of natural gas utility margins below.
Natural Gas Utility Margins
Natural gas utility margins increased $19.9 million during 2022, compared with 2021. The most significant factor impacting the higher natural gas utility margins was an increase from higher sales volumes, driven by the continued economic recovery in Wisconsin from the COVID-19 pandemic, as well as colder weather during the 2022 heating season, compared with 2021. As measured by heating degree days, 2022 was 11.1% colder than 2021.
Other Operating Expenses (includes other operation and maintenance, depreciation and amortization, and property and revenue taxes)
Other operating expenses at the utility segment decreased $17.7 million during 2022, compared with 2021. The significant factors impacting the decrease in other operating expenses were:
| • | A $62.0 million decrease in transmission expense driven by the amortization of a certain portion of our regulatory liability associated with our transmission escrow balance, as discussed in the notes under the other operation and maintenance table above. |
| • | A $6.8 million decrease in other operation and maintenance expense related to the We Power leases, as discussed in the notes under the other operation and maintenance table above. |
| • | A $5.7 million decrease in other operation and maintenance expense during 2022, compared with 2021, related to certain COVID-19 expenditures. |
| • | A $4.6 million decrease in other operating and maintenance expense related to our power plants, driven by increases to certain plant-related regulatory assets resulting from decisions included in our December 2022 Wisconsin rate order. This decrease in expense was partially offset by increased maintenance at our plants and reductions in refined coal credits during 2022, compared with 2021. |
These decreases in other operating expenses were partially offset by:
| • | A $27.2 million increase in property and revenue taxes, driven by higher gross receipt and property taxes. |
| • | A $21.8 million increase in depreciation and amortization, driven by assets being placed into service as we continue to execute on our capital plan and an increase related to the We Power leases. In addition, a portion of the increase is related to securitization amortization, which is offset in revenues. |
| • | A $13.8 million increase in electric and natural gas distribution expenses, primarily driven by higher costs to manage system reliability and for overall maintenance of our distribution system during 2022. |
Other Income, Net
Other income, net increased $17.3 million during 2022, compared with 2021, driven by higher net credits from the non-service components of our net periodic pension and OPEB costs. See Note 18, Employee Benefits, for more information on our benefit costs. Higher AFUDC–Equity due to continued capital investment also contributed to the increase in other income, net.
Interest Expense
Interest expense decreased $1.9 million during 2022, compared with 2021, driven by lower interest expense on finance lease liabilities, primarily related to the We Power leases, as finance lease liabilities decrease each year as payments are made. Also contributing to the decrease was AFUDC–Debt due to continued capital investment. The decrease was partially offset by a long-term debt issuance in September 2022 and higher short-term debt interest rates. See Note 13, Long-Term Debt, for more information on the debt issuance.
| Wisconsin Electric Power Company | A-13 | 2022 Annual Financial Statements |
Income Tax Expense
Income tax expense increased $75.0 million during 2022, compared with 2021. The increase was primarily due to an approximate $65 million negative impact related to the year-over-year amortization of the unprotected excess deferred tax benefits from the Tax Legislation in connection with the rate order approved by the PSCW, effective January 1, 2020. The impact due to the benefit from the amortization of these unprotected excess deferred tax benefits in 2021 did not impact earnings as there was an offsetting impact in operating income. Also contributing to the increase was higher pre-tax income in 2022. See Note 15, Income Taxes, for more information.
LIQUIDITY AND CAPITAL RESOURCES
OVERVIEW
We expect to maintain adequate liquidity to meet our cash requirements for operation of our business and implementation of our corporate strategy through internal generation of cash from operations and access to the capital markets.
The following discussion and analysis of our Liquidity and Capital Resources includes comparisons of our cash flows for the year ended December 31, 2022 with the year ended December 31, 2021. For a similar discussion that compares our cash flows for the year ended December 31, 2021 with the year ended December 31, 2020, see Item 7. Management’s Discussion and Analysis of Financial Condition and Results of Operations – Liquidity and Capital Resources in Part II of our 2021 Annual Report on Form 10-K, which was filed with the SEC on February 24, 2022.
CASH FLOWS
The following table summarizes our cash flows during the years ended December 31:
| (in millions) | 2022 | 2021 | Change in 2022 Over 2021 | |||||||||
| Cash provided by (used in): | ||||||||||||
| Operating activities | $ | 637.0 | $ | 802.2 | $ | (165.2 | ) | |||||
| Investing activities | (914.0 | ) | (798.0 | ) | (116.0 | ) | ||||||
| Financing activities | 321.7 | (8.4 | ) | 330.1 | ||||||||
Operating Activities
Net cash provided by operating activities decreased $165.2 million during 2022, compared with 2021, driven by:
| • | A $284.5 million decrease in cash from higher payments for fuel and purchased power at our plants during 2022, compared with 2021. Our plants incurred higher fuel costs during 2022 as a result of an increase in the price of natural gas. |
| • | A $92.4 million decrease in cash from higher payments for other operation and maintenance expenses. During 2022, our payments were higher for managing system reliability, overall maintenance of our distribution system, transmission, and We Power costs, as well as due to the timing of payments for accounts payable. |
| • | A $24.2 million decrease in cash due to lower collateral received from counterparties during 2022, compared with 2021, driven by the execution of natural gas contracts at higher prices in 2022. |
These decreases in net cash provided by operating activities were partially offset by a $231.4 million increase in cash related to higher overall collections from customers as a result of an increase in natural gas sales volumes during 2022, compared with 2021, driven by the continued economic recovery in Wisconsin from the COVID-19 pandemic and colder weather.
Investing Activities
Net cash used in investing activities increased $116.0 million during 2022, compared with 2021, driven by:
| • | A $117.1 million increase in cash paid for capital expenditures, which is discussed in more detail below. |
| • | A $16.6 million increase in cash paid for ATC’s construction costs during 2022, which will be reimbursed in the future. |
| • | Proceeds of $10.7 million received from affiliates during 2021 for assets transferred related to a customer billing system. There were no proceeds received from affiliates for assets transferred during 2022. |
These increases in net cash used in investing activities were partially offset by insurance proceeds of $41.0 million received during 2022 for property damage, primarily related to the PSB water damage claim. See Note 7, Property, Plant, and Equipment, for more information.
| Wisconsin Electric Power Company | A-14 | 2022 Annual Financial Statements |
Capital Expenditures
Capital expenditures for the years ended December 31 were as follows:
| (in millions) | 2022 | 2021 | Change in 2022 Over 2021 | ||||||
| Capital expenditures | $ | 930.4 | $ | 813.3 | $ | 117.1 | |||
The increase in cash paid for capital expenditures during 2022, compared with 2021, was primarily driven by higher payments for capital expenditures related to Paris, Badger Hollow II, and the new natural gas-fired generation being constructed at WPS’s existing Weston power plant. These increases were partially offset by lower payments for capital expenditures related to the restoration of our PSB and upgrades to our natural gas distribution system. See Note 7, Property, Plant, and Equipment, for more information on the PSB.
See Liquidity and Capital Resources – Cash Requirements – Significant Capital Projects below for more information.
Financing Activities
Net cash related to financing activities increased $330.1 million during 2022, compared with 2021, driven by:
| • | A $295.3 million increase in cash due to a decrease in retirements of long-term debt during 2022, compared with 2021. |
| • | A $225.0 million increase in cash related to higher equity contributions received from our parent during 2022, compared with 2021, to balance our capital structure. |
| • | An $81.2 million increase in cash due higher issuances of long-term debt during 2022, compared with 2021. |
These increases in cash related to financing activities were partially offset by a $270.0 million decrease in cash due to higher dividends paid to our parent during 2022, compared with 2021, to balance our capital structure.
Significant Financing Activities
For more information on our financing activities, see Note 12, Short-Term Debt and Lines of Credit, and Note 13, Long-Term Debt.
CASH REQUIREMENTS
We require funds to support and grow our business. Our significant cash requirements primarily consist of capital and investment expenditures, payments to retire and pay interest on long-term debt, the payment of common stock dividends to our parent, and the funding of our ongoing operations. Our significant cash requirements are discussed in further detail below.
Significant Capital Projects
We have several capital projects that will require significant capital expenditures over the next three years and beyond. All projected capital requirements are subject to periodic review and may vary significantly from estimates, depending on a number of factors. These factors include environmental requirements, regulatory restraints and requirements, changes in tax laws and regulations, acquisition and development opportunities, market volatility, economic trends, supply chain disruptions, inflation, and interest rates. Our estimated capital expenditures and acquisitions for the next three years are reflected below. These amounts include anticipated expenditures for environmental compliance and certain remediation issues. For a discussion of certain environmental matters affecting us, see Note 21, Commitments and Contingencies.
| (in millions) | |||
| 2023 | $ | 1,504.1 | |
| 2024 | 1,478.2 | ||
| 2025 | 1,274.6 | ||
| Total | $ | 4,256.9 | |
We continue to upgrade our electric and natural gas distribution systems to enhance reliability. These upgrades include addressing our aging infrastructure and system hardening and the AMI program. AMI is an integrated system of smart meters, communication networks, and data management systems that enable two-way communication between utilities and customers.
WEC Energy Group is committed to investing in solar, wind, battery storage, and clean natural gas-fired generation. Below are examples of projects that are proposed or currently underway.
| • | We have partnered with an unaffiliated utility to construct a utility-scale solar project, Badger Hollow II, that will be located in Iowa County, Wisconsin. Once constructed, we will own 100 MW of this project. Our share of the cost of this project is estimated to be approximately $151 million. Commercial operation of Badger Hollow II is targeted for 2023. |
| Wisconsin Electric Power Company | A-15 | 2022 Annual Financial Statements |
| • | We, along with WPS and an unaffiliated utility, received PSCW approval to acquire and construct Paris, a utility-scale solar-powered electric generating facility with a battery energy storage system. The project will be located in Kenosha County, Wisconsin and once fully constructed, we will own 150 MW of solar generation and 82 MW of battery storage of this project. Our share of the cost of this project is estimated to be approximately $325 million, with construction of the solar portion expected to be completed in 2023. |
| • | We, along with WPS and an unaffiliated utility, received PSCW approval to acquire and construct Darien, a utility-scale solar-powered electric generating facility with a battery energy storage system. The project will be located in Rock and Walworth counties, Wisconsin and once fully constructed, we will own 188 MW of solar generation and 56 MW of battery storage of this project. Our share of the cost of this project is estimated to be approximately $335 million, with construction of the solar portion expected to be completed in 2024. |
| • | In April 2021, we, along with WPS and an unaffiliated utility, filed an application with the PSCW for approval to acquire the Koshkonong Solar-Battery Park, a utility-scale solar-powered electric generating facility with a battery energy storage system. The project will be located in Dane County, Wisconsin and once fully constructed, we will own 225 MW of solar generation and 124 MW of battery storage of this project. If approved, our share of the cost of this project is estimated to be approximately $488 million, with construction of the solar portion expected to be completed in 2025. |
| • | We, along with WPS, received PSCW approval to construct a natural gas-fired generation facility at WPS’s existing Weston power plant site in northern Wisconsin. The new facility will consist of seven RICE units. Once constructed, we will own 64 MW of this project. Our share of the cost of this project is estimated to be approximately $85 million, with construction expected to be completed in 2023. |
| • | Effective January 1, 2023, we, along with WPS, completed the acquisition of Whitewater, a commercially operational 236.5 MW dual fueled (natural gas and low sulfur fuel oil) combined cycle electrical generation facility in Whitewater, Wisconsin. Our share of the cost of this facility was approximately $37.5 million for 50% of the capacity, which includes transaction costs and working capital. See Note 14, Leases, for more information. |
| • | In January 2022, WPS, along with an unaffiliated utility, filed an application with the PSCW for approval to acquire a portion of West Riverside’s nameplate capacity. WPS is also requesting approval to assign the option to purchase part of West Riverside to us. If approved, we or WPS would acquire 100 MW of capacity, in the first of two potential option exercises. West Riverside is a combined cycle natural gas plant recently completed by an unaffiliated utility in Rock County, Wisconsin. If approved, and WPS assigns the option to us, our share of the cost of this ownership interest would be approximately $91 million, with the transaction expected to close in the second quarter of 2023. In addition, WPS could exercise and request approval to assign to us a second option to acquire an additional 100 MW of capacity. If approved, and WPS assigns the option to us, our share of the cost of this ownership interest is expected to be approximately $90 million, with the transaction expected to close in 2024. |
In March 2022, the DOC opened an investigation into whether new tariffs should be imposed on solar panels and cells imported from multiple southeast Asian countries. See Factors Affecting Results, Liquidity, and Capital Resources – Regulatory, Legislative, and Legal Matters – United States Department of Commerce Complaints and Factors Affecting Results, Liquidity, and Capital Resources – Regulatory, Legislative, and Legal Matters – Uyghur Forced Labor Prevention Act for information on the potential impacts to our solar projects as a result of the DOC investigation and CBP actions related to solar panels, respectively. The expected in-service dates identified above already reflect some of these impacts.
We have received approval to construct an LNG facility. The facility would provide us with approximately one Bcf of natural gas supply to meet anticipated peak demand without requiring the construction of additional interstate pipeline capacity. The facility is expected to reduce the likelihood of constraints on our natural gas system during the highest demand days of winter. The project is estimated to cost approximately $185 million. Commercial operation of the LNG facility is targeted for the end of 2023.
Long-Term Debt
A significant amount of cash is required to retire and pay interest on our long-term debt obligations. See Note 13, Long-Term Debt, for more information on our outstanding long-term debt, including a schedule of our long-term debt maturities over the next five years. The following table summarizes our required interest payments on long-term debt (excluding finance lease obligations) as of December 31, 2022:
| Interest Payments Due by Period | |||||||||||||||
| (in millions) | Total | Less Than 1 Year | 1-3 Years | 3-5 Years | More Than 5 Years | ||||||||||
| Interest payments on long-term debt | $ | 2,276.6 | $ | 140.4 | $ | 269.3 | $ | 251.9 | $ | 1,615.0 | |||||
Common Stock Dividends
During the years ended December 31, 2022, 2021, and 2020, we paid common stock dividends of $630.0 million, $360.0 million, and $395.0 million, respectively, to the sole holder of our common stock, WEC Energy Group. Any payment of future dividends is subject to approval by our Board of Directors and is dependent upon future earnings, capital requirements, and financial and other business conditions. In addition, various financing arrangements and regulatory requirements impose certain restrictions on our ability to transfer funds to WEC Energy Group in the form of cash dividends, loans, or advances. We do not believe that these restrictions will materially
| Wisconsin Electric Power Company | A-16 | 2022 Annual Financial Statements |
affect our operations or limit any dividend payments in the foreseeable future. See Note 10, Common Equity, for more information related to these restrictions and our other common stock matters.
Other Significant Cash Requirements
Our utility operations have purchase obligations under various contracts for the procurement of fuel, power, and gas supply, as well as the related storage and transportation. These costs are a significant component of funding our ongoing operations. See Note 21, Commitments and Contingencies, for more information, including our minimum future commitments related to these purchase obligations.
In addition to our energy-related purchase obligations, we have commitments for other costs incurred in the normal course of business, including costs related to information technology services, meter reading services, maintenance and other service agreements for certain generating facilities, and various engineering agreements. Our estimated future cash requirements related to these purchase obligations are reflected below.
| Payments Due by Period | |||||||||||||||
| (in millions) | Total | Less Than 1 Year | 1-3 Years | 3-5 Years | More Than 5 Years | ||||||||||
| Purchase orders | $ | 110.7 | $ | 55.3 | $ | 38.8 | $ | 16.5 | $ | 0.1 | |||||
We have various finance and operating lease obligations. Our finance lease obligations primarily relate to power purchase commitments and land leases for Badger Hollow II. Our operating lease obligations are for office space and land. See Note 14, Leases, for more information, including an analysis of our minimum lease payments due in future years.
We make contributions to our pension and OPEB plans based upon various factors affecting us, including our liquidity position and tax law changes. See Note 18, Employee Benefits, for our expected contributions in 2023 and our expected pension and OPEB payments for the next 10 years. We expect the majority of these future pension and OPEB payments to be paid from our outside trusts. See Sources of Cash–Investments in Outside Trusts below for more information.
In addition to the above, our balance sheet at December 31, 2022 included various other liabilities that, due to the nature of the liabilities, the amount and timing of future payments cannot be determined with certainty. These liabilities include AROs, liabilities for the remediation of manufactured gas plant sites, and liabilities related to the accounting treatment for uncertainty in income taxes. For additional information on these liabilities, see Note 9, Asset Retirement Obligations, Note 21, Commitments and Contingencies, and Note 15, Income Taxes, respectively.
Off-Balance Sheet Arrangements
We are a party to various financial instruments with off-balance sheet risk as a part of our normal course of business, including letters of credit that primarily support our commodity contracts. We believe that these agreements do not have, and are not reasonably likely to have, a current or future material effect on our financial condition, changes in financial condition, revenues or expenses, results of operations, liquidity, capital expenditures, or capital resources. See Note 1(q), Guarantees, Note 12, Short-Term Debt and Lines of Credit, and Note 20, Variable Interest Entities, for more information.
SOURCES OF CASH
Liquidity
We anticipate meeting our short-term and long-term cash requirements to operate our business and implement our corporate strategy through internal generation of cash from operations, equity contributions from our parent, and access to the capital markets, which allows us to obtain external short-term borrowings, including commercial paper, and intermediate or long-term debt securities. Cash generated from operations is primarily driven by sales of electricity and natural gas to our utility customers, reduced by costs of operations. Our access to the capital markets is critical to our overall strategic plan and allows us to supplement cash flows from operations with external borrowings to manage seasonal variations, working capital needs, commodity price fluctuations, unplanned expenses, and unanticipated events.
We maintain a bank back-up credit facility, which provides liquidity support for our obligations with respect to commercial paper and for general corporate purposes. We review our bank back-up credit facility needs on an ongoing basis and expect to be able to maintain adequate credit facilities to support our operations.
The amount, type, and timing of any financings in 2023, as well as in subsequent years, will be contingent on investment opportunities and our cash requirements and will depend upon prevailing market conditions, regulatory approvals, and other factors. We plan to maintain a capital structure consistent with that approved by the PSCW.
The issuance of our securities is subject to the approval of the PSCW. Additionally, with respect to the public offering of securities, we file registration statements with the SEC under the Securities Act of 1933, as amended (1933 Act). The amounts of securities authorized
| Wisconsin Electric Power Company | A-17 | 2022 Annual Financial Statements |
by the PSCW, as well as the securities registered under the 1933 Act, are closely monitored and appropriate filings are made to ensure flexibility in the capital markets.
At December 31, 2022, our current liabilities exceeded our current assets by $165.0 million. We do not expect this to have any impact on our liquidity as we currently believe that our cash and cash equivalents, our available capacity under our existing revolving credit facility, cash generated from ongoing operations, and access to the capital markets are adequate to meet our short-term and long-term cash requirements.
See Note 12, Short-Term Debt and Lines of Credit, and Note 13, Long-Term Debt, for more information about our credit facility and securities.
Investments in Outside Trusts
We maintain investments in outside trusts to fund the obligation to provide pension and certain OPEB benefits to current and future retirees. As of December 31, 2022, these trusts had investments of approximately $1.2 billion, consisting of fixed income and equity securities, that are subject to the volatility of the stock market and interest rates. The performance of existing plan assets, long-term discount rates, changes in assumptions, and other factors could affect our future contributions to the plans, our financial position if our accumulated benefit obligation exceeds the fair value of the plan assets, and future results of operations related to changes in pension and OPEB expense and the assumed rate of return. For additional information, see Note 18, Employee Benefits.
Debt Covenants
Certain of our short-term debt agreements contain financial covenants that we must satisfy, including debt to capitalization ratios. At December 31, 2022, we were in compliance with all such covenants. We expect to be in compliance with all such debt covenants for the foreseeable future. See Note 12, Short-Term Debt and Lines of Credit, Note 13, Long-Term Debt, and Note 10, Common Equity, for more information.
Credit Rating Risk
Cash collateral postings and prepayments made with external parties, including postings related to exchange-traded contracts, and cash collateral posted by external parties were immaterial as of December 31, 2022. From time to time, we may enter into commodity contracts that could require collateral or a termination payment in the event of a credit rating change to below BBB- at S&P Global Ratings, a division of S&P Global Inc., and/or Baa3 at Moody’s Investors Service, Inc. If we had a sub-investment grade credit rating at December 31, 2022, we could have been required to post $100 million of additional collateral or other assurances pursuant to the terms of a PPA. We also have other commodity contracts that, in the event of a credit rating downgrade, could result in a reduction of our unsecured credit granted by counterparties.
In addition, access to capital markets at a reasonable cost is determined in large part by credit quality. Any credit ratings downgrade could impact our ability to access capital markets.
Subject to other factors affecting the credit markets as a whole, we believe our current ratings should provide a significant degree of flexibility in obtaining funds on competitive terms. However, these security ratings reflect the views of the rating agency only. An explanation of the significance of these ratings may be obtained from the rating agency. Such ratings are not a recommendation to buy, sell, or hold securities. Any rating can be revised upward or downward or withdrawn at any time by a rating agency.
FACTORS AFFECTING RESULTS, LIQUIDITY, AND CAPITAL RESOURCES
COMPETITIVE MARKETS
Electric Utility Industry
The FERC supports large RTOs, which directly impacts the structure of the wholesale electric market. Due to the FERC’s support of RTOs, MISO uses the MISO Energy Markets to carry out its operations, including the use of LMP to value electric transmission congestion and losses. Increased competition in the retail and wholesale markets, which may result from restructuring efforts, could have a significant and adverse financial impact on us.
Electric utility revenues in Wisconsin are regulated by the PSCW. The PSCW continues to maintain the position that the question of whether to implement electric retail competition in Wisconsin should ultimately be decided by the Wisconsin legislature. No such legislation has been introduced in Wisconsin to date, and it is uncertain when, if at all, retail choice might be implemented in Wisconsin.
Natural Gas Utility Industry
We offer both natural gas transportation service and interruptible natural gas sales to enable customers to better manage their energy costs. Customers continue to switch between firm system supply, interruptible system supply, and transportation service each year as the economics and service options change.
| Wisconsin Electric Power Company | A-18 | 2022 Annual Financial Statements |
Due to the PSCW’s previous proceedings on natural gas industry regulation in a competitive environment, the PSCW currently provides all Wisconsin customer classes with competitive markets the option to choose a third-party natural gas supplier. All of our Wisconsin non-residential customer classes have competitive market choices and, therefore, can purchase natural gas directly from either a third-party supplier or us. Since third-party suppliers can be used in Wisconsin, the PSCW has also adopted standards for transactions between a utility and its natural gas marketing affiliates.
We offer natural gas transportation services to our customers that elect to purchase natural gas directly from a third-party supplier. Since these transportation customers continue to use our distribution systems to transport natural gas to their facilities, we earn distribution revenues from them. As such, the loss of revenue associated with the cost of natural gas that our transportation customers purchase from third-party suppliers has little impact on our net income, as it is substantially offset by an equal reduction to natural gas costs.
We are currently unable to predict the impact, if any, of potential future industry restructuring on our results of operations or financial position.
REGULATORY, LEGISLATIVE, AND LEGAL MATTERS
Regulatory Recovery
We account for our regulated operations in accordance with accounting guidance under the Regulated Operations Topic of the FASB ASC. Our rates are determined by the PSCW and the FERC. See Note 23, Regulatory Environment, for additional information regarding recent rate proceedings and orders.
Regulated entities are allowed to defer certain costs that would otherwise be charged to expense if the regulated entity believes the recovery of those costs is probable. We record regulatory assets pursuant to generic and/or specific orders issued by our regulators. Recovery of the deferred costs in future rates is subject to the review and approval by our regulators. We assume the risks and benefits of ultimate recovery of these items in future rates. If the recovery of the deferred costs is not approved by our regulators, the costs would be charged to income in the current period. Regulators can impose liabilities on a prospective basis for amounts previously collected from customers and for amounts that are expected to be refunded to customers. We record these items as regulatory liabilities. See Note 6, Regulatory Assets and Liabilities, for more information on our regulatory assets and liabilities.
Petitions Before PSCW Regarding Third-Party Financed Distributed Energy Resources
In May 2022, two petitions were filed with the PSCW requesting a declaratory ruling that the owner of a third-party financed DER is not a “public utility” as defined under Wisconsin law and, therefore, is not subject to the PSCW’s jurisdiction under any statute or rule regulating public utilities. The parties that filed the petitions provide financing to their customers for installation of DERs (including solar panels and energy storage) on the customer’s property. A DER is connected to the host customer’s utility meter and is used for the customer’s energy needs. It may also be connected to the grid for distribution.
In July 2022, the PSCW found that the specific facts and circumstances merited the opening of a docket for each petition to consider whether to grant all or part of the requested declaratory ruling.
On December 1, 2022, the PSCW granted one petitioner’s request for a declaratory ruling, finding that the owner of the third-party financed DER at issue in the petitioner’s brief is not a public utility under Wisconsin law. The ruling was limited to the specific facts and circumstances of the lease presented in that petition. A second petition is also being considered. Although the finding in the first petition was limited to the specific facts and circumstances of the lease presented in that petition, similar findings or a broader policy position could adversely impact our business operations.
Uyghur Forced Labor Prevention Act
The CBP issued a WRO in June 2021, applicable to certain silica-based products originating from the Xinjiang Uyghur Autonomous Region of China (Xinjiang), such as polysilicon, included in the manufacturing of solar panels. In June 2022, the WRO was superseded by the implementation of the UFLPA, which was signed into law by President Biden in December 2021. The UFLPA establishes a rebuttable presumption that any imports wholly or partially manufactured in Xinjiang are prohibited from entering the United States. While our suppliers were able to provide the CBP sufficient documentation to meet WRO compliance requirements, and we expect the same will be true for UFLPA purposes, we cannot currently predict what, if any, impact the UFLPA will have on the overall supply of solar panels into the United States and the related timing and cost of our solar projects included in WEC Energy Group’s capital plan.
United States Department of Commerce Complaints
In August 2021, a group of anonymous domestic solar manufacturers filed a petition (AD/CVD) with the DOC seeking to impose new tariffs on solar panels and cells imported from several countries, including Malaysia, Vietnam, and Thailand. The petitioners claimed that Chinese solar manufacturers are shifting products to these countries to avoid the tariffs required on products imported from China. In November 2021, the DOC rejected this petition. In denying the petition, the DOC cited the anonymous group’s refusal of the DOC’s request to provide more detail and identify its members due to the members’ concerns about retribution from the dominant Chinese solar industry.
| Wisconsin Electric Power Company | A-19 | 2022 Annual Financial Statements |
In February 2022, a California based company filed a petition (AD/CVD) with the DOC seeking to impose new tariffs on solar panels and cells imported from multiple countries, including Malaysia, Vietnam, Thailand, and Cambodia. While the petition is similar to the one rejected by the DOC in November 2021, there are notable differences. The group added Cambodia to the petition and requested that the DOC conduct a country-wide inquiry into each of the four countries. In March 2022, the DOC decided to act on the February petition and investigate the claim. On December 2, 2022, the DOC announced its preliminary determination that certain companies are circumventing anti-dumping and countervailing duty orders on solar cells and modules from China. As the next step, the DOC will conduct in-person audits to verify the information that was the basis of the finding. If the DOC makes a final determination, which is currently expected in the second quarter of 2023, that such circumvention is occurring it would be able to apply any final tariffs retroactively to November 4, 2021. If imposed, the new tariffs could further disrupt the supply of solar modules to the United States, and could impact the cost and timing of our solar projects.
In June 2022, the Biden Administration used its executive powers to issue a 24-month tariff moratorium on solar panels manufactured in Cambodia, Malaysia, Thailand, and Vietnam. The moratorium comes as a direct response to concerns raised about the adverse impact from the ongoing DOC complaint on the U.S. solar industry. As the DOC will continue its investigation discussed above, companies may still be subject to tariffs after the moratorium ends; however, U.S. companies will reportedly be exempt from any retroactive tariffs that previously could have applied. The Biden Administration also announced that it plans to invoke the Defense Production Act to accelerate the production of solar panels in the U.S. The Biden Administration’s actions did not address whether WROs applied to panels under previous complaints would be affected.
Infrastructure Investment and Jobs Act
In November 2021, President Biden signed into law the Infrastructure Investment and Jobs Act, which provides for approximately $1.2 trillion of federal spending over the next five years, including approximately $85 billion for investments in power, utilities, and renewables infrastructure across the United States. We expect funding from this Act will support the work we are doing to reduce GHG emissions, increase EV charging, and strengthen and protect the energy grid. Funding in the Act should also help to expand emerging technologies, like hydrogen and carbon management, as we continue the transition to a clean energy future. We believe the Infrastructure Investment and Jobs Act will accelerate investment in projects that will help us meet our net zero emission goals to the benefit of our customers, the communities we serve, and our company.
Inflation Reduction Act
In August 2022, President Biden signed into law the IRA, which provides for $258 billion in energy-related provisions over a 10-year period. The provisions of the IRA are intended to, among other things, lower gasoline and electricity prices, incentivize domestic clean energy investment, manufacturing, and production, and promote reductions in carbon emissions. We believe that we and our customers can benefit from the IRA’s provisions that extend tax benefits for renewable technologies, increase or restore higher rates for PTCs, add an option to claim PTCs for solar projects, expand qualified ITC facilities to include standalone energy storage, and its provision to allow companies to transfer tax credits generated from renewable projects. The IRA also implements a 15% corporate alternative minimum tax and a 1% excise tax on stock repurchases. Although significant regulatory guidance is expected on the tax provisions in the IRA, we currently believe the provisions on alternative minimum tax and stock repurchases will not have a material impact on us. Overall, we believe the IRA will help reduce our cost of investing in projects that will support our commitment to reduce emissions and provide customers affordable, reliable, and clean energy over the longer term.
Environmental Matters
See Note 21, Commitments and Contingencies, for a discussion of certain environmental matters affecting us, including rules and regulations relating to air quality, water quality, land quality, and climate change.
MARKET RISKS AND OTHER SIGNIFICANT RISKS
We are exposed to market and other significant risks as a result of the nature of our businesses and the environments in which those businesses operate. These risks, described in further detail below, include but are not limited to:
Commodity Costs
In the normal course of providing energy, we are subject to market fluctuations in the costs of coal, natural gas, purchased power, and fuel oil used in the delivery of coal. We manage our fuel and natural gas supply costs through a portfolio of short and long-term procurement contracts with various suppliers for the purchase of coal, natural gas, and fuel oil. In addition, we manage the risk of price volatility through natural gas and electric hedging programs.
Embedded within our rates are amounts to recover fuel, natural gas, and purchased power costs. We have recovery mechanisms in place that allow us to recover or refund all or a portion of the changes in prudently incurred fuel, natural gas, and purchased power costs from rate case-approved amounts.
Higher commodity costs can increase our working capital requirements, result in higher gross receipts taxes, and lead to increased energy efficiency investments by our customers to reduce utility usage and/or fuel substitution. Higher commodity costs combined with slower economic conditions also expose us to greater risks of accounts receivable write-offs as more customers are unable to pay their
| Wisconsin Electric Power Company | A-20 | 2022 Annual Financial Statements |
bills. See Note 5, Credit Losses, for more information on our mechanism that allows for cost recovery or refund of uncollectible expense.
Weather
Our utility rates are based upon estimated normal temperatures. Our electric utility margins are unfavorably sensitive to below normal temperatures during the summer cooling season and, to some extent, to above normal temperatures during the winter heating season. Our natural gas utility margins are unfavorably sensitive to above normal temperatures during the winter heating season. A summary of actual weather information in our service territory during 2022 and 2021, as measured by degree days, may be found in Results of Operations.
Interest Rates
We are exposed to interest rate risk resulting from our short-term borrowings and projected near-term debt financing needs. We manage exposure to interest rate risk by limiting the amount of our variable rate obligations and continually monitoring the effects of market changes on interest rates. When it is advantageous to do so, we enter into long-term fixed rate debt.
Based on our variable rate debt outstanding at December 31, 2022 and 2021, a hypothetical increase in market interest rates of one percentage point would have increased annual interest expense by $4.6 million and $3.8 million in 2022 and 2021, respectively. This sensitivity analysis was performed assuming a constant level of variable rate debt during the period and an immediate increase in interest rates, with no other changes for the remainder of the period.
Marketable Securities Return
We use various trusts to fund our pension and OPEB obligations. These trusts invest in debt and equity securities. Changes in the market prices of these assets can affect future pension and OPEB expenses. Additionally, future contributions can also be affected by the investment returns on trust fund assets. The financial risks associated with investment returns are mitigated through the requirement that we implement escrow accounting treatment for pension and OPEB costs in 2023 and 2024, as required by the December 2022 rate order issued by the PSCW. See Note 23, Regulatory Environment, for more information on our 2023 and 2024 rates.
The fair value of our trust fund assets and expected long-term returns were approximately:
| (in millions) | As of December 31, 2022 | Expected Return on Assets in 2023 | ||||||
| Pension trust funds | $ | 940.7 | 6.75 | % | ||||
| OPEB trust funds | $ | 211.3 | 7.00 | % | ||||
Fiduciary oversight of the pension and OPEB trust fund investments is the responsibility of an Investment Trust Policy Committee. The Committee works with external actuaries and investment consultants on an ongoing basis to establish and monitor investment strategies and target asset allocations. Forecasted cash flows for plan liabilities are regularly updated based on annual valuation results. Target asset allocations are determined utilizing projected benefit payment cash flows and risk analyses of appropriate investments. The targeted asset allocations are intended to reduce risk, provide long-term financial stability for the plans, and maintain funded levels which meet long-term plan obligations while preserving sufficient liquidity for near-term benefit payments. Investment strategies utilize a wide diversification of asset types and qualified external investment managers.
WEC Energy Group consults with its investment advisors on an annual basis to help it forecast expected long-term returns on plan assets by reviewing actual historical returns and calculating expected total trust returns using the weighted-average of long-term market returns for each of the major target asset categories utilized in the funds.
Economic Conditions
Our service territories are within the state of Wisconsin. As such, we are exposed to market risks in the regional Midwest economy. In addition, any economic downturn or disruption of national or international markets could adversely affect the financial condition of our customers and demand for their products, which could affect their demand for our products.
Inflation and Supply Chain Disruptions
We continue to monitor the impact of inflation and supply chain disruptions. We monitor the costs of medical plans, fuel, transmission access, construction costs, regulatory and environmental compliance costs, and other costs in order to minimize inflationary effects in future years, to the extent possible, through pricing strategies, productivity improvements, and cost reductions. We monitor the global supply chain, and related disruptions, in order to ensure we are able to procure the necessary materials and other resources necessary to both maintain our energy services in a safe and reliable manner and to grow our infrastructure in accordance with WEC Energy Group’s capital plan, which includes us.
For additional information concerning risk factors, including market risks, see the Cautionary Statement Regarding Forward-Looking Information at the beginning of this report.
| Wisconsin Electric Power Company | A-21 | 2022 Annual Financial Statements |
CRITICAL ACCOUNTING POLICIES AND ESTIMATES
The preparation of financial statements in compliance with GAAP requires the application of accounting policies, as well as the use of estimates, assumptions, and judgments that could have a material impact on our financial statements and related disclosures. Judgments regarding future events may include the likelihood of success of particular projects, legal and regulatory challenges, and anticipated recovery of costs. Actual results may differ significantly from estimated amounts based on varying assumptions.
Our significant accounting policies are described in Note 1, Summary of Significant Accounting Policies. The following is a list of accounting policies and estimates that require management’s most difficult, subjective, or complex judgments and may change in subsequent periods.
Regulatory Accounting
Our utility operations follow the guidance under the Regulated Operations Topic of the FASB ASC (Topic 980). Our financial statements reflect the effects of the ratemaking principles followed by the jurisdictions regulating us. Certain items that would otherwise be immediately recognized as revenues and expenses are deferred as regulatory assets and regulatory liabilities for future recovery or refund to customers, as authorized by our regulators.
Future recovery of regulatory assets, including the timeliness of recovery and our ability to earn a reasonable return, is not assured and is generally subject to review by regulators in rate proceedings for matters such as prudence and reasonableness. Once approved, the regulatory assets and liabilities are amortized into earnings over the rate recovery or refund period. If recovery or refund of costs is not approved or is no longer considered probable, these regulatory assets or liabilities are recognized in current period earnings. Management regularly assesses whether these regulatory assets and liabilities are probable of future recovery or refund by considering factors such as changes in the regulatory environment, earnings from our electric and natural gas utility operations, rate orders issued by our regulators, historical decisions by our regulators regarding regulatory assets and liabilities, and the status of any pending or potential deregulation legislation.
The application of the Regulated Operations Topic of the FASB ASC would be discontinued if all or a separable portion of our utility operations no longer met the criteria for application. Our regulatory assets and liabilities would be written off to income as an unusual or infrequently occurring item in the period in which discontinuation occurred. See Note 6, Regulatory Assets and Liabilities, for more information on our regulatory assets and liabilities.
Long-Lived Assets
In accordance with ASC 980-360, Regulated Operations – Property, Plant, and Equipment, we periodically assess the recoverability of certain long-lived assets when events or changes in circumstances indicate that the carrying amount of those long-lived assets may not be recoverable. Examples of events or changes in circumstances include, but are not limited to, a significant decrease in the market price, a significant change in use, a regulatory decision related to recovery of assets from customers, adverse legal factors or a change in business climate, operating or cash flow losses, or an expectation that the asset might be sold or abandoned. See Note 1(j), Asset Impairment, for our policy on accounting for abandonments.
Performing an impairment evaluation involves a significant degree of estimation and judgment by management in areas such as identifying circumstances that indicate an impairment may exist, identifying and grouping affected assets, and developing the undiscounted future cash flows. An impairment loss is measured as the excess of the carrying amount of the asset in comparison to the fair value of the asset. The fair value of the asset is assessed using various methods, including internally developed discounted cash flow analysis, expected recovery of regulated assets, and analysis from outside advisors.
See Note 7, Property, Plant, and Equipment for more information on our generating units probable of being retired. See Note 6, Regulatory Assets and Liabilities and Note 23, Regulatory Environment, for more information on our retired generating units, including various approvals we received from the FERC and the PSCW.
Pension and Other Postretirement Employee Benefits
The costs of providing non-contributory defined pension benefits and OPEB, described in Note 18, Employee Benefits, are dependent upon numerous factors resulting from actual plan experience and assumptions of future experience.
Pension and OPEB costs are impacted by actual employee demographics (including age, compensation levels, and employment periods), the level of contributions made to the plans, and earnings on plan assets. Pension and OPEB costs may also be significantly affected by changes in key actuarial assumptions, including anticipated rates of return on plan assets, mortality and discount rates, and expected health care cost trends. Changes made to the plan provisions may also impact current and future pension and OPEB costs.
Pension and OPEB plan assets are primarily made up of equity and fixed income investments. Fluctuations in actual equity and fixed income market returns, as well as changes in general interest rates, may result in increased or decreased benefit costs in future periods. Changes in benefit costs are mitigated through the requirement that we implement escrow accounting treatment for pension and OPEB costs in 2023 and 2024, as required by the December 2022 rate order issued by the PSCW. See Note 23, Regulatory Environment, for more information on our 2023 and 2024 rates.
| Wisconsin Electric Power Company | A-22 | 2022 Annual Financial Statements |
The following table shows how a given change in certain actuarial assumptions would impact the projected benefit obligation and the reported net periodic pension cost (including amounts capitalized to our balance sheets). Each factor below reflects an evaluation of the change based on a change in that assumption only.
Actuarial Assumption (in millions, except percentages) | Percentage-Point Change in Assumption | Impact on Projected Benefit Obligation | Impact on 2022 Pension Cost | |||||||||
| Discount rate | (0.5 | ) | $ | 35.2 | $ | 1.9 | ||||||
| Discount rate | 0.5 | (31.6 | ) | (2.1 | ) | |||||||
| Rate of return on plan assets | (0.5 | ) | N/A | 5.3 | ||||||||
| Rate of return on plan assets | 0.5 | N/A | (5.3 | ) | ||||||||
The following table shows how a given change in certain actuarial assumptions would impact the accumulated OPEB obligation and the reported net periodic OPEB cost (including amounts capitalized to our balance sheets). Each factor below reflects an evaluation of the change based on a change in that assumption only.
Actuarial Assumption (in millions, except percentages) | Percentage-Point Change in Assumption | Impact on Postretirement Benefit Obligation | Impact on 2022 Postretirement Benefit Cost | |||||||||
| Discount rate | (0.5 | ) | $ | 7.4 | $ | 1.2 | ||||||
| Discount rate | 0.5 | (6.6 | ) | (1.2 | ) | |||||||
| Health care cost trend rate | (0.5 | ) | (3.2 | ) | (1.3 | ) | ||||||
| Health care cost trend rate | 0.5 | 3.7 | 1.5 | |||||||||
| Rate of return on plan assets | (0.5 | ) | N/A | 1.3 | ||||||||
| Rate of return on plan assets | 0.5 | N/A | (1.3 | ) | ||||||||
The discount rates are selected based on hypothetical bond portfolios consisting of noncallable, high-quality corporate bonds across the full maturity spectrum. From the hypothetical bond portfolios, a single rate is determined that equates the market value of the bonds purchased to the discounted value of the plans’ expected future benefit payments.
We establish our expected return on assets based on consideration of historical and projected asset class returns, as well as the target allocations of the benefit trust portfolios. The assumed long-term rate of return on pension plan assets was 6.75% in 2022, 2021, and 2020. The actual rate of return on pension plan assets, net of fees, was (11.36)%, 8.82%, and 10.72%, in 2022, 2021, and 2020, respectively.
In selecting assumed health care cost trend rates, past performance and forecasts of health care costs are considered. For more information on health care cost trend rates and a table showing future payments that we expect to make for our pension and OPEB, see Note 18, Employee Benefits.
Unbilled Revenues
We record utility operating revenues when energy is delivered to our customers. However, the determination of energy sales to individual customers is based upon the reading of their meters, which occurs on a systematic basis throughout the month. At the end of each month, amounts of energy delivered to customers since the date of their last meter reading are estimated and corresponding unbilled revenues are calculated.
Unbilled revenues are estimated each month based upon actual generation and throughput volumes, recorded sales, estimated customer usage by class, weather factors, estimated line losses, and applicable customer rates. Energy demand for the unbilled period or changes in rate mix due to fluctuations in usage patterns of customer classes could impact the accuracy of the unbilled revenue estimate. Total unbilled utility revenues were $201.5 million and $184.4 million as of December 31, 2022 and 2021, respectively. The changes in unbilled revenues are primarily due to changes in the costs of natural gas, weather, and customer rates.
Income Tax Expense
Significant management judgment is required in determining our provision for income taxes, deferred income tax assets and liabilities, the liability for unrecognized tax benefits, and any valuation allowance recorded against deferred income tax assets. The assumptions involved are supported by historical data, reasonable projections, and interpretations of applicable tax laws and regulations across multiple taxing jurisdictions. Significant changes in these assumptions could have a material impact on our financial condition and results of operations. See Note 1(n), Income Taxes, and Note 15, Income Taxes, for a discussion of accounting for income taxes.
We are required to estimate income taxes for each of our applicable tax jurisdictions as part of the process of preparing consolidated financial statements. This process involves estimating current income tax liabilities together with assessing temporary differences resulting from differing treatment of items, such as depreciation, for income tax and accounting purposes. These differences result in deferred income tax assets and liabilities, which are included within our balance sheets. We also assess the likelihood that our deferred income tax assets will be recovered through future taxable income. To the extent we believe that realization is not likely, we establish a valuation allowance, which is offset by an adjustment to income tax expense in our income statements.
| Wisconsin Electric Power Company | A-23 | 2022 Annual Financial Statements |
Uncertainty associated with the application of tax statutes and regulations, the outcomes of tax audits and appeals, changes in income tax law, enacted tax rates or amounts subject to income tax, and changes in the regulatory treatment of any tax reform benefits requires that judgments and estimates be made in the accrual process and in the calculation of effective tax rates. Only income tax benefits that meet the “more likely than not” recognition threshold may be recognized or continue to be recognized. Unrecognized tax benefits are re-evaluated quarterly and changes are recorded based on new information, including the issuance of relevant guidance by the courts or tax authorities and developments occurring in the examinations of our tax returns.
We expect our 2023 annual effective tax rate to be between 22.5% and 23.5%. Our effective tax rate calculations are revised every quarter based on the best available year-end tax assumptions, adjusted in the following year after returns are filed. Tax accrual estimates are trued-up to the actual amounts claimed on the tax returns and further adjusted after examinations by taxing authorities, as needed.
QUANTITATIVE AND QUALITATIVE DISCLOSURES ABOUT MARKET RISK
See Management’s Discussion and Analysis of Financial Condition and Results of Operations – Factors Affecting Results, Liquidity, and Capital Resources – Market Risks and Other Significant Risks, as well as Note 1(o), Fair Value Measurements, Note 1(p), Derivative Instruments, and Note 1(q), Guarantees, for information concerning potential market risks to which we are exposed.
| Wisconsin Electric Power Company | A-24 | 2022 Annual Financial Statements |
WISCONSIN ELECTRIC POWER COMPANY
CONSOLIDATED INCOME STATEMENTS
| Year Ended December 31 | ||||||||||||
| (in millions) | 2022 | 2021 | 2020 | |||||||||
| Operating revenues | $ | 4,070.3 | $ | 3,664.5 | $ | 3,367.0 | ||||||
| Operating expenses | ||||||||||||
| Cost of sales | 1,693.3 | 1,341.1 | 1,074.7 | |||||||||
| Other operation and maintenance | 831.7 | 898.4 | 902.0 | |||||||||
| Depreciation and amortization | 479.7 | 457.9 | 426.9 | |||||||||
| Property and revenue taxes | 125.6 | 98.4 | 102.9 | |||||||||
| Total operating expenses | 3,130.3 | 2,795.8 | 2,506.5 | |||||||||
| Operating income | 940.0 | 868.7 | 860.5 | |||||||||
| Other income, net | 49.4 | 32.1 | 18.5 | |||||||||
| Interest expense | 458.4 | 460.3 | 467.5 | |||||||||
| Other expense | (409.0 | ) | (428.2 | ) | (449.0 | ) | ||||||
| Income before income taxes | 531.0 | 440.5 | 411.5 | |||||||||
| Income tax expense | 133.1 | 58.1 | 44.7 | |||||||||
| Net income | 397.9 | 382.4 | 366.8 | |||||||||
| Preferred stock dividend requirements | 1.2 | 1.2 | 1.2 | |||||||||
| Net income attributed to common shareholder | $ | 396.7 | $ | 381.2 | $ | 365.6 | ||||||
The accompanying Notes to Consolidated Financial Statements are an integral part of these financial statements.
| Wisconsin Electric Power Company | A-25 | 2022 Annual Financial Statements |
WISCONSIN ELECTRIC POWER COMPANY
CONSOLIDATED BALANCE SHEETS
| At December 31 | ||||||||
| (in millions, except share and per share amounts) | 2022 | 2021 | ||||||
| Assets | ||||||||
| Current assets | ||||||||
| Cash and cash equivalents | $ | 6.1 | $ | — | ||||
| Accounts receivable and unbilled revenues, net of reserves of $49.7 and $51.4 respectively | 582.6 | 565.5 | ||||||
| Accounts receivable from related parties | 113.2 | 79.1 | ||||||
| Materials, supplies, and inventories | 292.9 | 246.4 | ||||||
| Prepaid taxes | 113.1 | 97.4 | ||||||
| Other prepayments | 25.6 | 24.3 | ||||||
| Other | 73.8 | 58.3 | ||||||
| Current assets | 1,207.3 | 1,071.0 | ||||||
| Long-term assets | ||||||||
| Property, plant, and equipment, net of accumulated depreciation and amortization of $5,450.3 and $5,136.4, respectively | 10,718.6 | 10,115.5 | ||||||
| Regulatory assets (December 31, 2022 and December 31, 2021 include $92.4 and $100.7, respectively, related to WEPCo Environmental Trust) | 2,817.5 | 2,763.1 | ||||||
| Pension and OPEB assets | 143.3 | 96.8 | ||||||
| Other | 133.5 | 98.1 | ||||||
| Long-term assets | 13,812.9 | 13,073.5 | ||||||
| Total assets | $ | 15,020.2 | $ | 14,144.5 | ||||
| Liabilities and Equity | ||||||||
| Current liabilities | ||||||||
| Short-term debt | $ | 460.7 | $ | 375.0 | ||||
| Current portion of long-term debt (related to WEPCo Environmental Trust) | 8.9 | 8.8 | ||||||
| Current portion of finance lease obligations | 112.3 | 109.3 | ||||||
| Accounts payable | 400.5 | 347.8 | ||||||
| Accounts payable to related parties | 179.4 | 170.9 | ||||||
| Other | 210.5 | 155.6 | ||||||
| Current liabilities | 1,372.3 | 1,167.4 | ||||||
| Long-term liabilities | ||||||||
| Long-term debt (December 31, 2022 and December 31, 2021 include $94.1 and $102.7, respectively, related to WEPCo Environmental Trust) | 3,351.5 | 2,863.3 | ||||||
| Finance lease obligations | 2,702.3 | 2,717.9 | ||||||
| Deferred income taxes | 1,467.3 | 1,401.6 | ||||||
| Regulatory liabilities | 1,637.4 | 1,723.2 | ||||||
| Pension and OPEB obligations | 30.8 | 38.8 | ||||||
| Other | 291.4 | 287.6 | ||||||
| Long-term liabilities | 9,480.7 | 9,032.4 | ||||||
| Commitments and contingencies (Note 21) | ||||||||
| Common shareholder’s equity | ||||||||
| Common stock – $10 par value; 65,000,000 shares authorized; 33,289,327 shares outstanding | 332.9 | 332.9 | ||||||
| Additional paid in capital | 1,746.8 | 1,290.9 | ||||||
| Retained earnings | 2,057.1 | 2,290.5 | ||||||
| Common shareholder’s equity | 4,136.8 | 3,914.3 | ||||||
| Preferred stock | 30.4 | 30.4 | ||||||
| Total liabilities and equity | $ | 15,020.2 | $ | 14,144.5 | ||||
The accompanying Notes to Consolidated Financial Statements are an integral part of these financial statements.
| Wisconsin Electric Power Company | A-26 | 2022 Annual Financial Statements |
WISCONSIN ELECTRIC POWER COMPANY
CONSOLIDATED STATEMENTS OF CASH FLOWS
| Year Ended December 31 | ||||||||||||
| (in millions) | 2022 | 2021 | 2020 | |||||||||
| Operating activities | ||||||||||||
| Net income | $ | 397.9 | $ | 382.4 | $ | 366.8 | ||||||
| Reconciliation to cash provided by operating activities | ||||||||||||
| Depreciation and amortization | 479.7 | 457.9 | 426.9 | |||||||||
| Deferred income taxes and ITCs, net | 54.6 | (26.4 | ) | (63.7 | ) | |||||||
| Net change in transmission regulatory asset and liability | (64.2 | ) | 2.7 | 23.2 | ||||||||
| Change in – | ||||||||||||
| Accounts receivable and unbilled revenues, net | (69.8 | ) | (68.4 | ) | (8.7 | ) | ||||||
| Materials, supplies, and inventories | (46.5 | ) | (26.9 | ) | 10.3 | |||||||
| Collateral on deposit | (40.9 | ) | 0.8 | 1.8 | ||||||||
| Other current assets | (16.1 | ) | (0.9 | ) | 5.5 | |||||||
| Accounts payable | 14.5 | 85.5 | (25.9 | ) | ||||||||
| Other current liabilities | 28.8 | (6.9 | ) | 1.1 | ||||||||
| Other, net | (101.0 | ) | 2.4 | 29.8 | ||||||||
| Net cash provided by operating activities | 637.0 | 802.2 | 767.1 | |||||||||
| Investing activities | ||||||||||||
| Capital expenditures | (930.4 | ) | (813.3 | ) | (663.6 | ) | ||||||
| Payments for ATC’s construction costs that will be reimbursed | (19.2 | ) | (2.6 | ) | (1.6 | ) | ||||||
| Proceeds from assets transferred to affiliates | — | 10.7 | 1.3 | |||||||||
| Insurance proceeds received for property damage | 41.0 | — | 22.2 | |||||||||
| Other, net | (5.4 | ) | 7.2 | 10.9 | ||||||||
| Net cash used in investing activities | (914.0 | ) | (798.0 | ) | (630.8 | ) | ||||||
| Financing activities | ||||||||||||
| Change in short-term debt | 85.7 | 83.0 | 176.5 | |||||||||
| Issuance of long-term debt | 500.0 | 418.8 | — | |||||||||
| Retirement of long-term debt | (8.8 | ) | (304.1 | ) | — | |||||||
| Payments for finance lease obligations | (73.6 | ) | (67.5 | ) | (58.3 | ) | ||||||
| Equity contribution from parent | 455.0 | 230.0 | 130.0 | |||||||||
| Payment of dividends to parent | (630.0 | ) | (360.0 | ) | (395.0 | ) | ||||||
| Other, net | (6.6 | ) | (8.6 | ) | (1.4 | ) | ||||||
| Net cash provided by (used in) financing activities | 321.7 | (8.4 | ) | (148.2 | ) | |||||||
| Net change in cash, cash equivalents, and restricted cash | 44.7 | (4.2 | ) | (11.9 | ) | |||||||
| Cash, cash equivalents, and restricted cash at beginning of year | 3.0 | 7.2 | 19.1 | |||||||||
| Cash, cash equivalents, and restricted cash at end of year | $ | 47.7 | $ | 3.0 | $ | 7.2 | ||||||
The accompanying Notes to Consolidated Financial Statements are an integral part of these financial statements.
| Wisconsin Electric Power Company | A-27 | 2022 Annual Financial Statements |
WISCONSIN ELECTRIC POWER COMPANY
CONSOLIDATED STATEMENTS OF EQUITY
| Wisconsin Electric Power Company Common Shareholder’s Equity | ||||||||||||||||||||||||
| (in millions) | Common Stock | Additional Paid In Capital | Retained Earnings | Total Common Shareholder’s Equity | Preferred Stock | Total Equity | ||||||||||||||||||
| Balance at December 31, 2019 | $ | 332.9 | $ | 929.5 | $ | 2,298.7 | $ | 3,561.1 | $ | 30.4 | $ | 3,591.5 | ||||||||||||
| Net income attributed to common shareholder | — | — | 365.6 | 365.6 | — | 365.6 | ||||||||||||||||||
| Payment of dividends to parent | — | — | (395.0 | ) | (395.0 | ) | — | (395.0 | ) | |||||||||||||||
| Equity contribution from parent | — | 130.0 | — | 130.0 | — | 130.0 | ||||||||||||||||||
| Stock-based compensation and other | — | 0.6 | (0.1 | ) | 0.5 | — | 0.5 | |||||||||||||||||
| Balance at December 31, 2020 | $ | 332.9 | $ | 1,060.1 | $ | 2,269.2 | $ | 3,662.2 | $ | 30.4 | $ | 3,692.6 | ||||||||||||
| Net income attributed to common shareholder | — | — | 381.2 | 381.2 | — | 381.2 | ||||||||||||||||||
| Payment of dividends to parent | — | — | (360.0 | ) | (360.0 | ) | — | (360.0 | ) | |||||||||||||||
| Equity contribution from parent | — | 230.0 | — | 230.0 | — | 230.0 | ||||||||||||||||||
| Stock-based compensation and other | — | 0.8 | 0.1 | 0.9 | — | 0.9 | ||||||||||||||||||
| Balance at December 31, 2021 | $ | 332.9 | $ | 1,290.9 | $ | 2,290.5 | $ | 3,914.3 | $ | 30.4 | $ | 3,944.7 | ||||||||||||
| Net income attributed to common shareholder | — | — | 396.7 | 396.7 | — | 396.7 | ||||||||||||||||||
| Payment of dividends to parent | — | — | (630.0 | ) | (630.0 | ) | — | (630.0 | ) | |||||||||||||||
| Equity contribution from parent | — | 455.0 | — | 455.0 | — | 455.0 | ||||||||||||||||||
| Stock-based compensation and other | — | 0.9 | (0.1 | ) | 0.8 | — | 0.8 | |||||||||||||||||
| Balance at December 31, 2022 | $ | 332.9 | $ | 1,746.8 | $ | 2,057.1 | $ | 4,136.8 | $ | 30.4 | $ | 4,167.2 | ||||||||||||
The accompanying Notes to Consolidated Financial Statements are an integral part of these financial statements.
| Wisconsin Electric Power Company | A-28 | 2022 Annual Financial Statements |
WISCONSIN ELECTRIC POWER COMPANY
NOTES TO CONSOLIDATED FINANCIAL STATEMENTS
NOTE 1—SUMMARY OF SIGNIFICANT ACCOUNTING POLICIES
(a) Nature of Operations—We are an electric, natural gas, and steam utility company that serves electric and natural gas customers in Wisconsin, and steam customers in metropolitan Milwaukee, Wisconsin. WEC Energy Group owns all of our outstanding common stock.
As used in these notes, the term “financial statements” refers to the consolidated financial statements. This includes the income statements, balance sheets, statements of cash flows, and statements of equity, unless otherwise noted. On our financial statements, we consolidate VIEs of which we are the primary beneficiary.
These financial statements reflect our proportionate interests in certain jointly owned utility facilities.
(b) Basis of Presentation—We prepare our financial statements in conformity with GAAP. We make estimates and assumptions that affect the reported amounts of assets and liabilities, the disclosure of contingent assets and liabilities at the date of the financial statements, and the reported amounts of revenues and expenses during the reporting period. Actual results may differ from these estimates.
(c) Cash and Cash Equivalents—Cash and cash equivalents include marketable debt securities with an original maturity of three months or less.
(d) Operating Revenues—The following discussion includes our significant accounting policies related to operating revenues. For additional required disclosures on disaggregation of operating revenues, see Note 4, Operating Revenues.
Revenues from Contracts with Customers
Electric Utility Operating Revenues – Electricity sales to residential and commercial and industrial customers are generally accomplished through requirements contracts, which provide for the delivery of as much electricity as the customer needs. These contracts represent discrete deliveries of electricity and consist of one distinct performance obligation satisfied over time, as the electricity is delivered and consumed by the customer simultaneously. For our residential and commercial and industrial customers, our performance obligation is bundled to consist of both the sale and the delivery of the electric commodity.
The transaction price of the performance obligations for residential and commercial and industrial customers is valued using the rates, charges, terms, and conditions of service included in our tariffs, which have been approved by the PSCW. These rates often have a fixed component customer charge and a usage-based variable component charge. We recognize revenue for the fixed component customer charge monthly using a time-based output method. We recognize revenue for the usage-based variable component charge using an output method based on the quantity of electricity delivered each month. Our retail electric rates in Wisconsin include base amounts for fuel and purchased power costs, which also impact our revenues. The electric fuel rules set by the PSCW allow us to defer, for subsequent rate recovery or refund, under- or over-collections of actual fuel and purchased power costs beyond a 2% price variance from the costs included in the rates charged to customers. We monitor the deferral of under-collected costs to ensure that it does not cause us to earn a greater ROE than authorized by the PSCW. In addition, our residential tariffs include a mechanism for cost recovery or refund of uncollectible expense based on the difference between actual uncollectible write-offs and the amounts recovered in rates.
Wholesale customers who resell power can choose to either bundle capacity and electricity services together under one contract with a supplier or purchase capacity and electricity separately from multiple suppliers. Furthermore, wholesale customers can choose to have us provide generation to match the customer’s load, similar to requirements contracts, or they can purchase specified quantities of electricity and capacity. Contracts with wholesale customers that include capacity bundled with the delivery of electricity contain two performance obligations, as capacity and electricity are often transacted separately in the marketplace at the wholesale level. When recognizing revenue associated with these contracts, the transaction price is allocated to each performance obligation based on its relative standalone selling price. Revenue is recognized as control of each individual component is transferred to the customer. Electricity is the primary product sold by our electric operations and represents a single performance obligation satisfied over time through discrete deliveries to a customer. Revenue from electricity sales is generally recognized as units are produced and delivered to the customer within the production month. Capacity represents the reservation of an electric generating facility and conveys the ability to call on a plant to produce electricity when needed by the customer. The nature of our performance obligation as it relates to capacity is to stand ready to deliver power. This represents a single performance obligation transferred over time, which generally represents a monthly obligation. Accordingly, capacity revenue is recognized on a monthly basis.
The transaction price of the performance obligations for wholesale customers is valued using the rates, charges, terms, and conditions of service, which have been approved by the FERC. These wholesale rates include recovery of fuel and purchased power costs from customers on a one-for-one basis. For the majority of our wholesale customers, the price billed for energy and capacity is a formula-based rate. Formula-based rates initially set a customer’s current year rates based on the previous year’s expenses. This is a predetermined formula derived from the utility’s costs and a reasonable rate of return. Because these rates are eventually trued up to
| Wisconsin Electric Power Company | A-29 | 2022 Annual Financial Statements |
reflect actual, current-year costs, they represent a form of variable consideration in certain circumstances. The variable consideration is estimated and recognized over time as wholesale customers receive and consume the capacity and electricity services.
We are an active participant in the MISO Energy Markets, where we bid our generation into the Day Ahead and Real Time markets and procure electricity for our retail and wholesale customers at prices determined by the MISO Energy Markets. Purchase and sale transactions are recorded using settlement information provided by MISO. These purchase and sale transactions are accounted for on a net hourly position. Net purchases in a single hour are recorded as purchased power in cost of sales and net sales in a single hour are recorded as resale revenues on our income statements. For resale revenues, our performance obligation is created only when electricity is sold into the MISO Energy Markets.
For all of our customers, consistent with the timing of when we recognize revenue, customer billings generally occur on a monthly basis, with payments typically due in full within 30 days.
Natural Gas Utility Operating Revenues – We recognize natural gas utility operating revenues under requirements contracts with residential, commercial and industrial, and transportation customers served under our tariffs. Tariffs provide our customers with the standard terms and conditions, including rates, related to the services offered. Requirements contracts provide for the delivery of as much natural gas as the customer needs. These requirements contracts represent discrete deliveries of natural gas and constitute a single performance obligation satisfied over time. Our performance obligation is both created and satisfied with the transfer of control of natural gas upon delivery to the customer. For most of our customers, natural gas is delivered and consumed by the customer simultaneously. A performance obligation can be bundled to consist of both the sale and the delivery of the natural gas commodity. In certain of our service territories, customers can purchase the commodity from a third party. In this case, the performance obligation only includes the delivery of the natural gas to the customer.
The transaction price of the performance obligations for our natural gas customers is valued using rates, charges, terms, and conditions of service included in our tariffs, which have been approved by the PSCW. These rates often have a fixed component customer charge and a usage-based variable component charge. We recognize revenue for the fixed component customer charge monthly using a time-based output method. We recognize revenue for the usage-based variable component charge using an output method based on natural gas delivered each month.
Our tariffs include various rate mechanisms that allow us to recover or refund changes in prudently incurred costs from rate case-approved amounts. Our rates include a one-for-one recovery mechanism for natural gas commodity costs. Under normal circumstances, we defer any difference between actual natural gas costs incurred and costs recovered through rates as a current asset or liability. The deferred balance is returned to or recovered from customers at intervals throughout the year. However, as a result of the extreme weather in the Midwest in February 2021, the cost of gas purchased for our natural gas customers was temporarily driven significantly higher than our normal winter weather expectations. See Note 23, Regulatory Environment, for more information on the recovery of these high natural gas costs.
In addition, our residential tariffs include a mechanism for cost recovery or refund of uncollectible expense based on the difference between actual uncollectible write-offs and the amounts recovered in rates.
Consistent with the timing of when we recognize revenue, customer billings generally occur on a monthly basis, with payments typically due in full within 30 days.
Other Operating Revenues
Alternative Revenues – Alternative revenues are created from programs authorized by regulators that allow us to record additional revenues by adjusting rates in the future, usually as a surcharge applied to future billings, in response to past activities or completed events. We record alternative revenues when the regulator-specified conditions for recognition have been met. We reverse these alternative revenues as the customer is billed, at which time this revenue is presented as revenues from contracts with customers.
Our only alternative revenue program relates to the wholesale electric service that we provide to customers under market-based rates and FERC formula rates. The customer is charged a base rate each year based upon a formula using prior year actual costs and customer demand. A true-up is calculated based on the difference between the amount billed to customers for the demand component of their rates and what the actual cost of service was for the year. The true-up can result in an amount that we will recover from or refund to the customer. We consider the true-up portion of the wholesale electric revenues to be alternative revenues.
(e) Credit Losses—The following discussion includes our significant accounting policies related to credit losses. For additional required disclosures on credit losses, see Note 5, Credit Losses.
Effective January 1, 2020, we adopted FASB ASU 2016-13, Financial Instruments – Credit Losses (Topic 326): Measurement of Credit Losses on Financial Instruments, using the modified retrospective transition method. This ASU amends the impairment model to utilize an expected loss methodology in place of the incurred loss methodology for financial instruments, including trade receivables. The amendment requires entities to consider a broader range of information to estimate expected credit losses, which may result in earlier recognition of loss. The cumulative effect of adopting this standard was not significant to our financial statements.
| Wisconsin Electric Power Company | A-30 | 2022 Annual Financial Statements |
Our exposure to credit losses is related to our accounts receivable and unbilled revenue balances, which are generated from the sale of electricity and natural gas by our regulated utility operations. Our regulated utility operations are included in our utility segment. No accounts receivable and unbilled revenue balances were reported in the other segment at December 31, 2022 and 2021.
We evaluate the collectability of our accounts receivable and unbilled revenue balances considering a combination of factors. For some of our larger customers and also in circumstances where we become aware of a specific customer’s inability to meet its financial obligations to us, we record a specific allowance for credit losses against amounts due in order to reduce the net recognized receivable to the amount we reasonably believe will be collected. For all other customers, we use the accounts receivable aging method to calculate an allowance for credit losses. Using this method, we classify accounts receivable into different aging buckets and calculate a reserve percentage for each aging bucket based upon historical loss rates. The calculated reserve percentages are updated on at least an annual basis, in order to ensure recent macroeconomic, political, and regulatory trends are captured in the calculation, to the extent possible. Risks identified that we do not believe are reflected in the calculated reserve percentages, are assessed on a quarterly basis to determine whether further adjustments are required.
We monitor our ongoing credit exposure through active review of counterparty accounts receivable balances against contract terms and due dates. Our activities include timely account reconciliation, dispute resolution and payment confirmation. To the extent possible, we work with customers with past due balances to negotiate payment plans, but will disconnect customers for non-payment as allowed by the PSCW, if necessary, and employ collection agencies and legal counsel to pursue recovery of defaulted receivables. For our larger customers, detailed credit review procedures may be performed in advance of any sales being made. We sometimes require letters of credit, parental guarantees, prepayments or other forms of credit assurance from our larger customers to mitigate credit risk.
(f) Materials, Supplies, and Inventories—Our inventory as of December 31 consisted of:
| (in millions) | 2022 | 2021 | ||||||
| Materials and supplies | $ | 150.6 | $ | 138.2 | ||||
| Natural gas in storage | 79.6 | 53.5 | ||||||
| Fossil fuel | 62.7 | 54.7 | ||||||
| Total | $ | 292.9 | $ | 246.4 | ||||
Substantially all materials and supplies, natural gas in storage, and fossil fuel inventories are recorded using the weighted-average cost method of accounting.
(g) Regulatory Assets and Liabilities—The economic effects of regulation can result in regulated companies recording costs and revenues that are allowed in the ratemaking process in a period different from the period they would have been recognized by a nonregulated company. When this occurs, regulatory assets and regulatory liabilities are recorded on the balance sheet. Regulatory assets represent deferred costs probable of recovery from customers that would have otherwise been charged to expense. Regulatory liabilities represent amounts that are expected to be refunded to customers in future rates or future costs already collected from customers in rates.
The recovery or refund of regulatory assets and liabilities is based on specific periods determined by our regulators or occurs over the normal operating period of the related assets and liabilities. If a previously recorded regulatory asset is no longer probable of recovery, the regulatory asset is reduced to the amount considered probable of recovery, and the reduction is charged to expense in the current period. See Note 6, Regulatory Assets and Liabilities, for more information.
(h) Property, Plant, and Equipment—We record property, plant, and equipment at cost. Cost includes material, labor, overhead, and both debt and equity components of AFUDC. Additions to and significant replacements of property are charged to property, plant, and equipment at cost; minor items are charged to other operation and maintenance expense. The cost of depreciable utility property less salvage value is charged to accumulated depreciation when property is retired.
We record straight-line depreciation expense over the estimated useful life of utility property using depreciation rates approved by the PSCW that include estimates for salvage value and removal costs. Annual utility composite depreciation rates were 3.06%, 3.09%, and 3.19% in 2022, 2021, and 2020, respectively.
We capitalize certain costs related to software developed or obtained for internal use and record these costs to amortization expense over the estimated useful life of the related software, which ranges from 3 to 15 years. If software is retired prior to being fully amortized, the difference is recorded as a loss on the income statement.
Third parties reimburse us for all or a portion of expenditures for certain capital projects. Such contributions in aid of construction costs are recorded as a reduction to property, plant, and equipment.
See Note 7, Property, Plant, and Equipment, for more information.
| Wisconsin Electric Power Company | A-31 | 2022 Annual Financial Statements |
(i) Allowance for Funds Used During Construction—AFUDC is included in utility plant accounts and represents the cost of borrowed funds (AFUDC–Debt) used during plant construction, and a return on shareholders’ capital (AFUDC–Equity) used for construction purposes. AFUDC–Debt is recorded as a reduction of interest expense, and AFUDC–Equity is recorded in other income, net.
Approximately 50% of our retail jurisdictional CWIP expenditures are subject to the AFUDC calculation. Our average AFUDC retail rate was 8.68% for 2022, 2021, and 2020. Our average AFUDC wholesale rates were 5.35%, 1.79%, and 5.39% for 2022, 2021, and 2020, respectively.
We recorded the following AFUDC for the years ended December 31:
| (in millions) | 2022 | 2021 | 2020 | |||||||||
| AFUDC–Debt | $ | 6.9 | $ | 2.9 | $ | 2.6 | ||||||
| AFUDC–Equity | 18.8 | 7.9 | 7.0 | |||||||||
(j) Asset Impairment—Intangible assets with indefinite lives are subject to an annual impairment test. Interim impairment tests are performed when impairment indicators are present. At December 31, 2022, we had $9.1 million of indefinite-lived intangible assets related to the purchase of spectrum frequencies during 2022. The spectrum frequencies enable us to transmit data and voice communications over a wavelength dedicated to us throughout our service territory. These indefinite-lived intangible assets are included in other long-term assets on our balance sheet. An impairment loss is recognized when the carrying amount of an asset is not recoverable and exceeds the fair value of the asset. An impairment loss is measured as the excess of the carrying amount of the intangible assets over its fair value. No impairment loss was recorded for our indefinite-lived intangible assets during the year ended December 31, 2022.
We periodically assess the recoverability of certain long-lived assets when factors indicate the carrying value of such assets may be impaired or such assets are planned to be sold. Long-lived assets that would be subject to an impairment assessment generally include any assets within regulated operations that may not be fully recovered from our customers as a result of regulatory decisions that will be made in the future. An impairment loss is recognized when the carrying amount of an asset is not recoverable and exceeds the fair value of the asset. The carrying amount of an asset is not recoverable if it exceeds the sum of the undiscounted cash flows expected to result from the use and eventual disposition of the asset. An impairment loss is measured as the excess of the carrying amount of the asset over the fair value of the asset.
When it becomes probable that a generating unit will be retired before the end of its useful life, we assess whether the generating unit meets the criteria for abandonment accounting. Generating units that are considered probable of abandonment are expected to cease operations in the near term, significantly before the end of their original estimated useful lives. If a generating unit meets the applicable criteria to be considered probable of abandonment, and the unit has been abandoned, we assess the likelihood of recovery of the remaining net book value of that generating unit at the end of each reporting period. If it becomes probable that regulators will disallow full recovery as well as a return on the remaining net book value of a generating unit that is either abandoned or probable of being abandoned, an impairment loss may be required. An impairment loss would be recorded if the remaining net book value of the generating unit is greater than the present value of the amount expected to be recovered from ratepayers, using an incremental borrowing rate. See Note 6, Regulatory Assets and Liabilities, and Note 7, Property, Plant, and Equipment, for more information.
(k) Asset Retirement Obligations—We recognize, at fair value, legal obligations associated with the retirement of long-lived assets that result from the acquisition, construction, development, and normal operation of the assets. An ARO liability is recorded, when incurred, for these obligations as long as the fair value can be reasonably estimated, even if the timing or method of settling the obligation is unknown. The associated retirement costs are capitalized as part of the related long-lived asset and are depreciated over the useful life of the asset. The ARO liabilities are accreted each period using the credit-adjusted risk-free interest rates associated with the expected settlement dates of the AROs. These rates are determined when the obligations are incurred. Subsequent changes resulting from revisions to the timing or the amount of the original estimate of undiscounted cash flows are recognized as an increase or a decrease to the carrying amount of the liability and the associated capitalized retirement costs. We recognize regulatory assets or liabilities for the timing differences between when we recover an ARO in rates and when we recognize the associated retirement costs. See Note 9, Asset Retirement Obligations, for more information.
(l) Stock-Based Compensation—Our employees participate in the WEC Energy Group stock-based compensation plans. In accordance with the Omnibus Stock Incentive Plan, WEC Energy Group provides long-term incentives through its equity interests to its non-employee directors, officers, and other key employees. The plan provides for the granting of stock options, restricted stock, performance shares, and other stock-based awards. Awards may be paid in WEC Energy Group common stock, cash, or a combination thereof. In addition to those shares of WEC Energy Group common stock that were subject to awards outstanding as of May 6, 2021, 9.0 million shares of WEC Energy Group common stock are reserved for issuance under the plan.
Stock-based compensation expense is allocated to us based on the outstanding awards held by our employees and our allocation of labor costs. Awards classified as equity awards are measured based on their grant-date fair value. Awards classified as liability awards are recorded at fair value each reporting period. We account for forfeitures as they occur, rather than estimating potential future forfeitures and recording them over the vesting period.
| Wisconsin Electric Power Company | A-32 | 2022 Annual Financial Statements |
Stock Options
Our employees are granted WEC Energy Group non-qualified stock options that generally vest on a cliff-basis after three years. The exercise price of a stock option under the plan cannot be less than 100% of the fair market value of WEC Energy Group common stock on the grant date. Historically, all stock options have been granted with an exercise price equal to the fair market value of WEC Energy Group common stock on the date of the grant. Options vest immediately upon retirement, death, or disability; however, they may not be exercised within six months of the grant date except in connection with certain termination of employment events following a change in control. Options expire no later than 10 years from the date of grant.
WEC Energy Group stock options are classified as equity awards. The fair value of each stock option was calculated using a binomial option-pricing model. The following table shows the estimated weighted-average fair value per stock option granted to our employees along with the weighted-average assumptions used in the valuation models:
| 2022 | 2021 | 2020 | ||||||||||
| Stock options granted | 51,511 | 60,108 | 59,511 | |||||||||
| Estimated weighted-average fair value per stock option | $ | 14.71 | $ | 13.20 | $ | 10.82 | ||||||
| Assumptions used to value the options: | ||||||||||||
| Risk-free interest rate | 0.2% – 1.6 | % | 0.1% – 0.9 | % | 1.6% – 1.9 | % | ||||||
| Dividend yield | 3.2 | % | 2.9 | % | 3.0 | % | ||||||
| Expected volatility | 21.0 | % | 21.0 | % | 16.0 | % | ||||||
| Expected life (years) | 8.7 | 8.7 | 8.6 | |||||||||
The risk-free interest rate was based on the United States Treasury interest rate with a term consistent with the expected life of the stock options. The dividend yield was based on WEC Energy Group’s dividend rate at the time of the grant and historical stock prices. Expected volatility and expected life assumptions were based on WEC Energy Group’s historical experience.
Restricted Shares
WEC Energy Group restricted shares granted to our employees have a vesting period of three years with one-third of the award vesting on each anniversary of the grant date. The restricted shares are classified as equity awards.
Performance Units
Officers and other key employees are granted performance units under the WEC Energy Group Performance Unit Plan. All grants of performance units are settled in cash and are accounted for as liability awards accordingly. Performance units accrue forfeitable dividend equivalents in the form of additional performance units. The fair value of the performance units reflects our estimate of the final expected value of the awards, which is based on WEC Energy Group’s stock price and performance achievement under the terms of the award. Stock-based compensation costs are generally recorded over the performance period, which is three years.
The ultimate number of units that will be awarded is dependent on WEC Energy Group’s total shareholder return (stock price appreciation plus dividends) as compared to the total shareholder return of a peer group of companies over three years, as well as other performance metrics, as may be determined by the Compensation Committee. Under the terms of awards granted prior to 2023, participants may earn between 0% and 175% of the performance unit award based on WEC Energy Group’s total shareholder return. Pursuant to the plan terms governing these awards, these percentages can be adjusted upwards or downwards by up to 10% based on WEC Energy Group’s performance against additional performance measures, if any, adopted by the Compensation Committee.
The WEC Energy Group Performance Unit Plan was amended and restated, effective January 1, 2023. In accordance with the amended plan, the Compensation Committee selected multiple performance measures that will be weighted to determine the ultimate payout for the awards granted in 2023. The ultimate number of units awarded will be based on WEC Energy Group’s total shareholder return compared to the total shareholder return of a peer group of companies over three years (55%), and WEC Energy Group’s performance against the weighted average authorized ROE of all of its utility subsidiaries (45%). In addition, the Compensation Committee selected the level of WEC Energy Group’s stock price to earnings ratio compared to its peer companies as a performance measure that can increase the payout by up to 25%. In no event can the performance unit payout be greater than 200% of the target award.
See Note 10, Common Equity, for more information on WEC Energy Group’s stock-based compensation plans.
(m) Leases—We recognize a right of use asset and lease liability for operating and finance leases with a term of greater than one year. As a policy election, we account for each lease component separately from the nonlease components of a contract.
We are currently party to several easement agreements that allow us access to land we do not own for the purpose of constructing and maintaining certain electric power and natural gas equipment. The majority of payments we make related to easements relate to our renewable generating facilities. We have not classified our easements as leases because we view the entire parcel of land specified in our easement agreements to be the identified asset, not just that portion of the parcel that contains our easement. As such, we have
| Wisconsin Electric Power Company | A-33 | 2022 Annual Financial Statements |
concluded that we do not control the use of an identified asset related to our easement agreements, nor do we obtain substantially all of the economic benefits associated with these shared-use assets.
See Note 14, Leases, for more information.
(n) Income Taxes—We follow the liability method in accounting for income taxes. Accounting guidance for income taxes requires the recording of deferred assets and liabilities to recognize the expected future tax consequences of events that have been reflected in our financial statements or tax returns and the adjustment of deferred tax balances to reflect tax rate changes. We are required to assess the likelihood that our deferred tax assets would expire before being realized. If we conclude that certain deferred tax assets are likely to expire before being realized, a valuation allowance would be established against those assets. GAAP requires that, if we conclude in a future period that it is more likely than not that some or all of the deferred tax assets would be realized before expiration, we reverse the related valuation allowance in that period. Any change to the allowance, as a result of a change in judgment about the realization of deferred tax assets, is reported in income tax expense.
ITCs associated with regulated operations are deferred and amortized over the life of the assets. PTCs are recognized in the period in which such credits are generated. The amount of the credit is based upon power production from our qualifying generation facilities. We are included in WEC Energy Group’s consolidated federal and state income tax returns. In accordance with our tax allocation agreement with WEC Energy Group, we are allocated income tax payments and refunds based upon the benefit for loss method, where attributes are realized when WEC Energy Group is able to realize them. See Note 15, Income Taxes, for more information.
We recognize interest and penalties accrued related to unrecognized tax benefits in income tax expense in our income statements.
(o) Fair Value Measurements—Fair value is the price that would be received to sell an asset or paid to transfer a liability in an orderly transaction between market participants at the measurement date (exit price).
Fair value accounting rules provide a fair value hierarchy that prioritizes the inputs used to measure fair value. The hierarchy gives the highest priority to unadjusted quoted prices in active markets for identical assets or liabilities (Level 1 measurement) and the lowest priority to unobservable inputs (Level 3 measurement). The three levels of the fair value hierarchy are defined as follows:
Level 1 – Quoted prices are available in active markets for identical assets or liabilities as of the reporting date. Active markets are those in which transactions for the asset or liability occur in sufficient frequency and volume to provide pricing information on an ongoing basis.
Level 2 – Pricing inputs are observable, either directly or indirectly, but are not quoted prices included within Level 1. Level 2 includes those financial instruments that are valued using external inputs within models or other valuation methods.
Level 3 – Pricing inputs include significant inputs that are generally less observable from objective sources. These inputs may be used with internally developed methods that result in management’s best estimate of fair value. Level 3 instruments include those that may be more structured or otherwise tailored to customers’ needs.
Assets and liabilities are classified in their entirety based on the lowest level of input that is significant to the fair value measurement. We use a mid-market pricing convention (the mid-point price between bid and ask prices) as a practical measure for valuing certain derivative assets and liabilities. We primarily use a market approach for recurring fair value measurements and attempt to use valuation techniques that maximize the use of observable inputs and minimize the use of unobservable inputs.
When possible, we base the valuations of our derivative assets and liabilities on quoted prices for identical assets and liabilities in active markets. These valuations are classified in Level 1. The valuations of certain contracts not classified as Level 1 may be based on quoted market prices received from counterparties and/or observable inputs for similar instruments. Transactions valued using these inputs are classified in Level 2. Certain derivatives, such as FTRs, are categorized in Level 3 due to the significance of unobservable or internally-developed inputs. Our FTRs are valued using MISO auction prices.
See Note 16, Fair Value Measurements, for more information.
(p) Derivative Instruments—We use derivatives as part of our risk management program to manage the risks associated with the price volatility of purchased power, generation, and natural gas costs for the benefit of our customers. Our approach is non-speculative and designed to mitigate risk. Our regulated hedging programs are approved by the PSCW.
We record derivative instruments on our balance sheets as assets or liabilities measured at fair value, unless they qualify for the normal purchases and sales exception, and are so designated. We continually assess our contracts designated as normal and will discontinue the treatment of these contracts as normal if the required criteria are no longer met. Changes in the derivative’s fair value are recognized currently in earnings unless specific hedge accounting criteria are met or we receive regulatory treatment for the derivative. For most energy related physical and financial contracts in our regulated operations that qualify as derivatives, the PSCW allows the effects of fair value accounting to be offset to regulatory assets and liabilities.
| Wisconsin Electric Power Company | A-34 | 2022 Annual Financial Statements |
We classify derivative assets and liabilities as current or long-term on our balance sheets based on the maturities of the underlying contracts. Cash flows from derivative activities are presented in the same category as the item being hedged within operating activities on our statements of cash flows.
Derivative accounting rules provide the option to present certain asset and liability derivative positions net on the balance sheets and to net the related cash collateral against these net derivative positions. We elected not to net these items. On our balance sheets, cash collateral provided to others is reflected in other current assets, and cash collateral received is reflected in other current liabilities. See Note 17, Derivative Instruments, for more information.
(q) Guarantees—We follow the guidance of the Guarantees Topic of the FASB ASC, which requires, under certain circumstances, that the guarantor recognize a liability for the fair value of the obligation undertaken in issuing the guarantee at its inception. As of December 31, 2022, we had $26.0 million of standby letters of credit issued by financial institutions for the benefit of third parties that have extended credit to us, which automatically renew each year unless proper termination notice is given. These amounts are not reflected on our balance sheets.
(r) Employee Benefits—The costs of pension and OPEB plans are expensed over the periods during which employees render service. These costs are distributed among WEC Energy Group’s subsidiaries based on current employment status and actuarial calculations, as applicable. Our regulators allow recovery in rates for our net periodic benefit cost calculated under GAAP. See Note 18, Employee Benefits, for more information.
(s) Customer Deposits and Credit Balances—When utility customers apply for new service, they may be required to provide a deposit for the service. Customer deposits are recorded within other current liabilities on our balance sheets.
Utility customers can elect to be on a budget plan. Under this type of plan, a monthly installment amount is calculated based on estimated annual usage. During the year, the monthly installment amount is reviewed by comparing it to actual usage. If necessary, an adjustment is made to the monthly amount. Annually, the budget plan is reconciled to actual annual usage. Payments in excess of actual customer usage are recorded within other current liabilities on our balance sheets.
(t) Environmental Remediation Costs—We are subject to federal and state environmental laws and regulations that in the future may require us to pay for environmental remediation at sites where we have been, or may be, identified as a potentially responsible party. Loss contingencies may exist for the remediation of hazardous substances at various potential sites, including coal combustion residual landfills and manufactured gas plant sites. See Note 9, Asset Retirement Obligations, for more information regarding coal combustion residual landfills and Note 21, Commitments and Contingencies, for more information regarding manufactured gas plant sites.
We record environmental remediation liabilities when site assessments indicate remediation is probable, and we can reasonably estimate the loss or a range of losses. The estimate includes both our share of the liability and any additional amounts that will not be paid by other potentially responsible parties or the government. When possible, we estimate costs using site-specific information but also consider historical experience for costs incurred at similar sites. Remediation efforts for a particular site generally extend over a period of several years. During this period, the laws governing the remediation process may change, as well as site conditions, potentially affecting the cost of remediation.
We have received approval to defer certain environmental remediation costs, as well as estimated future costs, through a regulatory asset. The recovery of deferred costs is subject to the PSCW’s approval.
We review our estimated costs of remediation annually for our manufactured gas plant sites and coal combustion residual landfills. We adjust the liabilities and related regulatory assets, as appropriate, to reflect the new cost estimates. Any material changes in cost estimates are adjusted throughout the year.
(u) Customer Concentrations of Credit Risk—The geographic concentration of our customers did not contribute significantly to our overall exposure to credit risk. We periodically review customers’ credit ratings, financial statements, and historical payment performance and require them to provide collateral or other security as needed. Our credit risk exposure is mitigated by our recovery mechanism for uncollectible expense discussed in Note 1(d), Operating Revenues. As a result, we did not have any significant concentrations of credit risk at December 31, 2022. In addition, there were no customers that accounted for more than 10% of our revenues for the year ended December 31, 2022.
NOTE 2—ACQUISITION
In accordance with Topic 805: Clarifying the Definition of a Business (ASU 2017-01), transactions are evaluated and are accounted for as acquisitions (or disposals) of assets or businesses, and transaction costs are capitalized in asset acquisitions.
Acquisition of Electric Generation Facility in Wisconsin
Effective January 1, 2023, we, along with WPS, completed the acquisition of Whitewater, a commercially operational 236.5 MW dual fueled (natural gas and low sulfur fuel oil) combined cycle electrical generation facility in Whitewater, Wisconsin. Our share of the cost
| Wisconsin Electric Power Company | A-35 | 2022 Annual Financial Statements |
of this facility was approximately $36.3 million for 50% of the capacity, which excludes working capital and transaction costs. See Note 14, Leases, for more information.
NOTE 3—RELATED PARTIES
We routinely enter into transactions with related parties, including WEC Energy Group, its other subsidiaries, ATC, and other affiliated entities.
We provide and receive services, property, and other items of value to and from our parent, WEC Energy Group, and other subsidiaries of WEC Energy Group pursuant to an AIA that became effective in 2017. The AIA was approved by the appropriate regulators, including the PSCW. In accordance with the AIA, WBS provides several categories of services to us (including financial, human resource, and administrative services). As required by FERC regulations for centralized service companies, WBS renders services at cost. Services provided by any regulated subsidiary of WEC Energy Group to another regulated subsidiary or WBS are provided at cost, and any services provided by a regulated subsidiary to a nonregulated subsidiary of WEC Energy Group are provided at the greater of cost or fair market value.
We pay ATC for transmission and other related services it provides. In addition, we provide a variety of operational, maintenance, and project management work for ATC, which is reimbursed by ATC. Services are billed to and from ATC under agreements approved by the PSCW, at each of our fully allocated costs. We are also required to initially fund the construction of transmission infrastructure upgrades needed for new generation projects. ATC owns these transmission assets and reimburses us for these costs when the new generation is placed in service.
Our balance sheets included the following receivables and payables for services provided to or received from ATC:
| (in millions) | December 31, 2022 | December 31, 2021 | ||||||
| Accounts receivable | ||||||||
| Services provided to ATC | $ | 0.7 | $ | 1.1 | ||||
| Amounts due from ATC for transmission infrastructure upgrades (1) | 23.3 | 4.5 | ||||||
| Accounts payable | ||||||||
| Services received from ATC | 20.0 | 20.2 | ||||||
| (1) | The transmission infrastructure upgrades were primarily related to the construction of our renewable energy projects. |
| Wisconsin Electric Power Company | A-36 | 2022 Annual Financial Statements |
The following table shows activity associated with our related party transactions for the years ended December 31:
| (in millions) | 2022 | 2021 | 2020 | |||||||||
| Transactions with WPS | ||||||||||||
| Natural gas related purchases from WPS (1) | $ | 3.3 | $ | 2.9 | $ | 1.5 | ||||||
| Charges to WPS for services and other items (2) | 13.3 | 11.8 | 12.5 | |||||||||
| Charges from WPS for services and other items (2) | 10.7 | 9.4 | 8.3 | |||||||||
| Transactions with WG | ||||||||||||
| Natural gas related purchases from WG (1) | 6.2 | 5.9 | 5.7 | |||||||||
| Natural gas related sales to WG (1) | 1.3 | 0.3 | — | |||||||||
| Charges to WG for services and other items (2) | 39.5 | 40.4 | 42.3 | |||||||||
| Charges from WG for services and other items (2) | 29.8 | 29.7 | 31.7 | |||||||||
| Transactions with UMERC | ||||||||||||
| Charges to UMERC for services and other items (2) | 13.7 | 10.5 | 9.8 | |||||||||
| Transactions with Bluewater | ||||||||||||
| Storage service fees | 14.8 | 13.6 | 12.9 | |||||||||
| Natural gas related sales to Bluewater (1) | 2.7 | 2.6 | 2.6 | |||||||||
| Charges to Bluewater for services and other items (2) | 2.7 | 3.0 | 3.0 | |||||||||
| Transactions with We Power | ||||||||||||
| Lease payments and other lease-related charges from We Power (3) | 412.6 | 406.0 | 404.3 | |||||||||
| Charges to We Power for services and other items (2) | 4.2 | 6.7 | 4.5 | |||||||||
| Transactions with WBS | ||||||||||||
| Charges to WBS for services and other items (2) | 49.5 | 67.8 | (4) | 67.8 | ||||||||
| Charges from WBS for services and other items (2) | 123.1 | 123.8 | 152.9 | |||||||||
| Transactions with ATC | ||||||||||||
| Charges to ATC for services and construction | 9.3 | 14.9 | 15.6 | |||||||||
| Charges from ATC for network transmission services | 239.3 | 240.4 | 229.3 | |||||||||
| Net refund (payment) from (to) ATC related to FERC ROE orders | (0.1 | ) | 5.1 | 7.3 | ||||||||
| (1) | Includes amounts related to the purchase or sale of natural gas and/or pipeline capacity. |
| (2) | Includes amounts charged for services, pass through costs, asset and liability transfers, and other items in accordance with the approved AIA. |
| (3) | We make lease payments to We Power for PWGS Units 1 and 2 and ERGS Units 1 and 2. See Note 14, Leases, for more information. |
| (4) | Includes $11.3 million for the transfer of certain software assets to WBS. |
NOTE 4—OPERATING REVENUES
For more information about our significant accounting policies related to operating revenues, see Note 1(d), Operating Revenues.
Disaggregation of Operating Revenues
The following tables present our operating revenues disaggregated by revenue source for our utility segment. We do not have any revenues associated with our other segment. We disaggregate revenues into categories that depict how the nature, amount, timing, and uncertainty of revenues and cash flows are affected by economic factors. Revenues are further disaggregated by electric and natural gas operations and then by customer class. Each customer class within our electric and natural gas operations has different expectations of service, energy and demand requirements, and can be impacted differently by regulatory activities within their jurisdictions.
| Year Ended December 31 | ||||||||||||
| (in millions) | 2022 | 2021 | 2020 | |||||||||
| Wisconsin Electric Power Company | ||||||||||||
| Electric utility | $ | 3,448.7 | $ | 3,171.6 | $ | 3,000.2 | ||||||
| Natural gas utility | 606.8 | 474.2 | 358.6 | |||||||||
| Total revenues from contracts with customers | 4,055.5 | 3,645.8 | 3,358.8 | |||||||||
| Other operating revenues | 14.8 | 18.7 | 8.2 | |||||||||
| Total operating revenues | $ | 4,070.3 | $ | 3,664.5 | $ | 3,367.0 | ||||||
| Wisconsin Electric Power Company |
A-37 | 2022 Annual Financial Statements |
Revenues from Contracts with Customers
Electric Utility Operating Revenues – The following table disaggregates electric utility operating revenues into customer class:
| Year Ended December 31 | ||||||||||||
| (in millions) | 2022 | 2021 | 2020 | |||||||||
| Residential | $ | 1,376.3 | $ | 1,306.2 | $ | 1,289.2 | ||||||
| Small commercial and industrial | 1,095.0 | 1,019.7 | 955.4 | |||||||||
| Large commercial and industrial | 629.1 | 568.6 | 527.3 | |||||||||
| Other | 20.4 | 20.2 | 19.9 | |||||||||
| Total retail revenues | 3,120.8 | 2,914.7 | 2,791.8 | |||||||||
| Wholesale | 58.4 | 71.0 | 78.8 | |||||||||
| Resale | 224.3 | 148.2 | 108.4 | |||||||||
| Steam | 28.4 | 28.7 | 21.3 | |||||||||
| Other utility revenues | 16.8 | 9.0 | (0.1 | ) | ||||||||
| Total electric utility operating revenues | $ | 3,448.7 | $ | 3,171.6 | $ | 3,000.2 | ||||||
Natural Gas Utility Operating Revenues – The following table disaggregates natural gas utility operating revenues into customer class:
| Year Ended December 31 | ||||||||||||
| (in millions) | 2022 | 2021 | 2020 | |||||||||
| Residential | $ | 397.8 | $ | 309.1 | $ | 238.4 | ||||||
| Commercial and industrial | 193.7 | 141.9 | 97.1 | |||||||||
| Total retail revenues | 591.5 | 451.0 | 335.5 | |||||||||
| Transportation | 17.8 | 17.3 | 16.3 | |||||||||
| Other utility revenues (1) | (2.5 | ) | 5.9 | 6.8 | ||||||||
| Total natural gas utility operating revenues | $ | 606.8 | $ | 474.2 | $ | 358.6 | ||||||
| (1) | Includes the revenues subject to our purchased gas recovery mechanism. As these amounts are billed to customers, they are reflected in retail revenues with an offsetting decrease in other utility revenues. |
Other Operating Revenues
Other operating revenues consist of the following:
| Year Ended December 31 | ||||||||||||
| (in millions) | 2022 | 2021 | 2020 | |||||||||
| Late payment charges (1) | $ | 12.1 | $ | 13.3 | $ | 5.6 | ||||||
| Rental revenues | 2.5 | 3.0 | 2.9 | |||||||||
| Alternative revenues (2) | 0.2 | 2.4 | (0.3 | ) | ||||||||
| Total other operating revenues | $ | 14.8 | $ | 18.7 | $ | 8.2 | ||||||
| (1) | The increase in late payment charges during 2021, compared with 2020, was a result of the expiration of a regulatory order from the PSCW in response to the COVID-19 pandemic, which included the suspension of late payment charges during a designated time period. See Note 23, Regulatory Environment, for more information. |
| (2) | Negative amounts can result from revenues to be refunded to wholesale customers subject to true-ups, as discussed in Note 1(d), Operating Revenues. |
NOTE 5—CREDIT LOSSES
The table below shows our gross third-party receivable balances and related allowance for credit losses.
| (in millions) | December 31, 2022 | December 31, 2021 | ||||||
| Accounts receivable and unbilled revenues | $ | 632.3 | $ | 616.9 | ||||
| Allowance for credit losses | 49.7 | 51.4 | ||||||
| Accounts receivable and unbilled revenues, net (1) | $ | 582.6 | $ | 565.5 | ||||
| Total accounts receivable, net – past due greater than 90 days (1) | $ | 35.8 | $ | 32.9 | ||||
| Past due greater than 90 days – collection risk mitigated by regulatory mechanisms (1) | 97.5 | % | 98.3 | % | ||||
| (1) | Our exposure to credit losses for certain regulated utility customers is mitigated by a regulatory mechanism we have in place. Specifically, our residential tariffs include a mechanism for cost recovery or refund of uncollectible expense based on the difference between actual uncollectible write-offs and the amounts recovered in rates. As a result, at December 31, 2022, $299.2 million, or 51.4%, of our net accounts receivable and unbilled revenues balance had regulatory protections in place to mitigate the exposure to credit losses. | |
| Wisconsin Electric Power Company | A-38 | 2022 Annual Financial Statements |
A rollforward of the allowance for credit losses for the years ended December 31, 2022, 2021 and 2020, is included below:
| Year Ended December 31 | ||||||||||||
| (in millions) | 2022 | 2021 | 2020 | |||||||||
| Balance at January 1 | $ | 51.4 | $ | 59.3 | $ | 38.1 | ||||||
| Provision for credit losses | 27.3 | 24.8 | 24.6 | |||||||||
| Provision for credit losses deferred for future recovery or refund | 34.0 | (0.3 | ) | 14.8 | ||||||||
| Write-offs charged against the allowance | (83.4 | ) | (47.6 | ) | (38.8 | ) | ||||||
| Recoveries of amounts previously written off | 20.4 | 15.2 | 20.6 | |||||||||
| Balance at December 31 | $ | 49.7 | $ | 51.4 | $ | 59.3 | ||||||
The allowance for credit losses decreased during the year ended December 31, 2022, driven by customer write-offs related to collection practices returning to pre-pandemic levels in 2021, including the restoration of our ability to disconnect customers. After a customer is disconnected for a period of time without payment on their account, we will write off that customer balance. Partially offsetting the decrease in the allowance for credit losses, we believe that the high energy costs that customers are seeing, which have been driven by high natural gas prices, contributed to higher past due accounts receivable balances and a related increase in the allowance of credit losses.
The allowance for credit losses decreased during the year ended December 31, 2021, primarily related to normal collection practices resuming in April 2021. Higher year-over-year natural gas prices drove an increase in gross accounts receivable balances, partially offsetting the decrease in the allowance for credit losses attributed to collection efforts.
The allowance for credit losses increased during the year ended December 31, 2020, driven by higher past due accounts receivable balances, primarily related to our residential customers. This increase in accounts receivable balances in arrears was driven by economic disruptions caused by the COVID-19 pandemic, including higher unemployment rates. Also, as a result of the COVID-19 pandemic and related regulatory orders we received, we were unable to disconnect any of our customers during the year ended December 31, 2020.
NOTE 6—REGULATORY ASSETS AND LIABILITIES
The following regulatory assets were reflected on our balance sheets as of December 31:
| (in millions) | 2022 | 2021 | See Note | |||||||||
| Regulatory assets (1) (2) | ||||||||||||
| Finance leases | $ | 1,072.0 | $ | 1,032.6 | 14 | |||||||
| Plant retirement related items | 632.7 | 659.1 | ||||||||||
| Income tax related items | 382.1 | 387.3 | 15 | |||||||||
| Pension and OPEB costs (3) | 337.2 | 386.1 | 18 | |||||||||
| SSR (4) | 123.5 | 129.5 | ||||||||||
| Securitization | 92.4 | 100.7 | 20 | |||||||||
| AROs | 41.1 | 42.0 | 1(k), 9 | |||||||||
| Derivatives | 40.3 | 4.8 | 1(p) | |||||||||
| We Power generation (5) | 21.6 | 6.1 | ||||||||||
| Energy efficiency programs (6) | 17.7 | 9.6 | ||||||||||
| Uncollectible expense | 16.4 | — | 5 | |||||||||
| Other, net | 40.5 | 6.6 | ||||||||||
| Total regulatory assets | $ | 2,817.5 | $ | 2,764.4 | ||||||||
| Balance sheet presentation | ||||||||||||
| Other current assets | $ | — | $ | 1.3 | ||||||||
| Regulatory assets | 2,817.5 | 2,763.1 | ||||||||||
| Total regulatory assets | $ | 2,817.5 | $ | 2,764.4 | ||||||||
| (1) | Based on prior and current rate treatment, we believe it is probable that we will continue to recover from customers the regulatory assets in this table. In accordance with GAAP, our regulatory assets do not include the allowance for ROE that is capitalized for regulatory purposes. This allowance was $14.7 million and $15.6 million at December 31, 2022 and 2021, respectively. |
| (2) | As of December 31, 2022, we had $4.3 million of regulatory assets not earning a return, $21.6 million of regulatory assets earning a return based on short-term interest rates, and $123.5 million of regulatory assets earning a return based on long-term interest rates. The regulatory assets not earning a return relate to certain environmental remediation costs. The other regulatory assets in the table either earn a return at our weighted average cost of capital or the cash has not yet been expended, in which case the regulatory assets are offset by liabilities. |
| (3) | Primarily represents the unrecognized future pension and OPEB costs related to our defined benefit pension and OPEB plans. We are authorized recovery of these regulatory assets over the average remaining service life of each plan. |
| Wisconsin Electric Power Company | A-39 | 2022 Annual Financial Statements |
| (4) | This regulatory asset relates to our 2014 announcement to retire the PIPP. Despite our intent to retire the PIPP, MISO designated the PIPP as an SSR, which meant the PIPP’s operation was necessary for reliability, and the plant could not be shut down until new generation or transmission facilities were built. In December 2014, the PSCW authorized escrow accounting for our SSR revenues because of the fluctuations in the actual revenues we received under the PIPP SSR agreements. The rate order we received from the PSCW in December 2019 authorized recovery of this SSR regulatory asset over a 15-year period that began on January 1, 2020. |
| (5) | Represents amounts recoverable from customers related to our costs of the generating units leased from We Power, including subsequent capital additions. |
| (6) | Represents amounts recoverable from customers related to programs designed to meet energy efficiency standards. |
The following regulatory liabilities were reflected on our balance sheets as of December 31:
| (in millions) | 2022 | 2021 | See Note | |||||||||
| Regulatory liabilities | ||||||||||||
| Removal costs (1) | $ | 718.1 | $ | 697.8 | ||||||||
| Income tax related items | 716.1 | 728.6 | 15 | |||||||||
| Pension and OPEB benefits (2) | 144.4 | 148.4 | 18 | |||||||||
| Derivatives | 39.1 | 55.6 | 1(p) | |||||||||
| Electric transmission costs (3) | 0.2 | 64.4 | ||||||||||
| Uncollectible expense | — | 17.8 | 5 | |||||||||
| Other, net | 20.9 | 10.6 | ||||||||||
| Total regulatory liabilities | $ | 1,638.8 | $ | 1,723.2 | ||||||||
| Balance sheet presentation | ||||||||||||
| Other current liabilities | $ | 1.4 | $ | — | ||||||||
| Regulatory liabilities | 1,637.4 | 1,723.2 | ||||||||||
| Total regulatory liabilities | $ | 1,638.8 | $ | 1,723.2 | ||||||||
| (1) | Represents amounts collected from customers to cover the future cost of property, plant, and equipment removals that are not legally required. Legal obligations related to the removal of property, plant, and equipment are recorded as AROs. See Note 9, Asset Retirement Obligations, for more information on our legal obligations. |
| (2) | Primarily represents the unrecognized future pension and OPEB benefits related to our defined benefit pension and OPEB plans. We will amortize these regulatory liabilities into net periodic benefit cost over the average remaining service life of each plan. |
| (3) | In accordance with the PSCW’s approval of escrow accounting for our ATC and MISO network transmission expenses, we defer as a regulatory asset or liability the difference between actual transmission costs and those included in rates until recovery or refund is authorized in a future rate proceeding. During 2022, we amortized $62.0 million of our transmission regulatory liabilities to offset certain 2022 revenue deficiencies, as approved by the PSCW in order to forego filing for 2022 base rate increases. See Note 23, Regulatory Environment, for more information. |
Pleasant Prairie Power Plant
The Pleasant Prairie power plant was retired on April 10, 2018. The net book value of this plant was $575.1 million at December 31, 2022, representing book value less cost of removal and accumulated depreciation. In addition, previously deferred unprotected tax benefits from the Tax Legislation related to the unrecovered balance of this plant were $17.5 million as of December 31, 2022. The net amount of $557.6 million was classified as a regulatory asset on our balance sheet at December 31, 2022 due to the retirement of the plant. This regulatory asset does not include certain other previously recorded deferred tax liabilities of $156.7 million related to the retired Pleasant Prairie power plant. Pursuant to our rate order issued by the PSCW in December 2019, we will continue to amortize this regulatory asset on a straight-line basis through 2039, using the composite depreciation rates approved by the PSCW before this plant was retired. The amortization is included in depreciation and amortization in the income statement. We also have FERC approval to continue to collect the net book value of the Pleasant Prairie power plant using the approved composite depreciation rates, in addition to a return on the remaining net book value.
We received approval from the PSCW in December 2019 to collect a full return of the net book value of the Pleasant Prairie power plant and a return on all but $100 million of the net book value. During May 2021, we securitized the remaining $100 million of the Pleasant Prairie power plant’s book value, the carrying costs accrued on the $100 million during the securitization process, and the related financing fees, in accordance with a written order issued by the PSCW in November 2020. See Note 20, Variable Interest Entities, for more information on this securitization.
Presque Isle Power Plant
Pursuant to MISO’s April 2018 approval of the retirement of the PIPP, these units were retired on March 31, 2019, and the plant was reclassified to a regulatory asset on our balance sheets. After the retirement of the PIPP, a portion of the regulatory asset and related cost of removal reserve was transferred to UMERC for recovery from its retail customers. On our balance sheet, the net book value of the PIPP was $151.6 million at December 31, 2022, representing book value less cost of removal and accumulated depreciation. In addition, previously deferred unprotected tax benefits from the Tax Legislation related to our unrecovered balance of these units were $5.2 million, resulting in a net amount of $146.4 million at December 31, 2022. This regulatory asset does not include certain other previously recorded deferred tax liabilities of $41.3 million related to the retired PIPP. Effective with our rate order issued by the PSCW in December 2019, we received approval to collect a return of and on our share of the net book value of the PIPP, and as a result, will continue to amortize the regulatory assets on a straight-line basis through 2037, using the composite depreciation rates approved by the PSCW before the units were retired. The amortization is included in depreciation and amortization in the income statement. We also
| Wisconsin Electric Power Company | A-40 | 2022 Annual Financial Statements |
have FERC approval to continue to collect the net book value of the PIPP using the approved composite depreciation rates, in addition to a return on the net book value.
NOTE 7—PROPERTY, PLANT, AND EQUIPMENT
Property, plant, and equipment consisted of the following at December 31:
| (in millions) | 2022 | 2021 | ||||||
| Electric – generation | $ | 2,200.0 | $ | 3,668.6 | ||||
| Electric – distribution | 5,822.4 | 5,565.8 | ||||||
| Natural gas – distribution, storage, and transmission | 1,757.0 | 1,669.7 | ||||||
| Property, plant, and equipment to be retired | 812.5 | — | ||||||
| Other | 1,044.9 | 984.7 | ||||||
| Less: Accumulated depreciation | 3,213.4 | 3,740.6 | ||||||
| Net | 8,423.4 | 8,148.2 | ||||||
| CWIP | 556.1 | 174.2 | ||||||
| Net utility and non-utility property, plant, and equipment | 8,979.5 | 8,322.4 | ||||||
| Property under finance leases | 3,248.8 | 3,188.9 | ||||||
| Less: Accumulated amortization | 1,509.7 | 1,395.8 | ||||||
| Net leased facilities | 1,739.1 | 1,793.1 | ||||||
| Total property, plant, and equipment | $ | 10,718.6 | $ | 10,115.5 | ||||
Severance Liability for Plant Retirements
We have severance liabilities related to past and future plant retirements recorded in other current liabilities on our balance sheets. Activity related to these severance liabilities for the years ended December 31 was as follows:
| (in millions) | 2022 | 2021 | 2020 | |||||||||
| Severance liability at January 1 | $ | 3.3 | $ | 0.7 | $ | 2.1 | ||||||
| Severance expense | 10.2 | 3.0 | — | |||||||||
| Severance payments | — | (0.4 | ) | (0.1 | ) | |||||||
| Other | — | — | (1.3 | ) | ||||||||
| Total severance liability at December 31 | $ | 13.5 | $ | 3.3 | $ | 0.7 | ||||||
Plant to be Retired
Oak Creek Power Plant Units 5 - 8
As a result of a PSCW approval for the construction of a solar and battery project received in December 2022, retirement of the OCPP generating units 5 - 8 became probable. OCPP units 5 and 6 are expected to be retired by May 2024, while units 7 and 8 are expected to be retired by late 2025. The total net book value of our ownership share of units 5 - 8 was $812.5 million at December 31, 2022, which does not include deferred taxes. These amounts were classified as plant to be retired within property, plant, and equipment on our balance sheet. These units are included in rate base, and we continue to depreciate them on a straight-line basis using the composite depreciation rates approved by the PSCW.
Public Service Building and Steam Tunnel Assets
During a significant rain event in May 2020, an underground steam tunnel in downtown Milwaukee flooded and steam vented into our PSB. The damage to the building and adjacent steam tunnel assets from the flooding and steam was extensive and required significant repairs and restorations. As of December 31, 2022, we had incurred $95.3 million of costs related to these repairs and restorations. In 2020, we received $20.0 million of insurance proceeds to cover a portion of these costs and wrote off $12.5 million of costs that we do not intend to seek recovery for through other operation and maintenance expense. In the first quarter of 2022, we received $41.0 million of insurance proceeds as a result of a settlement that was reached in February 2022. The remaining $21.8 million of costs is expected to be recovered through rates.
In June 2021, we received approval from the PSCW to restore the PSB and adjacent steam tunnel assets and to defer the project costs, net of insurance proceeds, as a component of rate base. As such, and in light of the agreement with insurers noted above, we do not currently expect a significant impact to our future results of operations.
| Wisconsin Electric Power Company | A-41 | 2022 Annual Financial Statements |
NOTE 8—JOINTLY OWNED UTILITY FACILITIES
We, along with an unaffiliated utility, received PSCW approval to construct Badger Hollow II, a solar project that will be located in Iowa County, Wisconsin. Once constructed, we will own 66.7%, or 100 MW, of this project. Commercial operation is targeted for 2023. The CWIP balance for Badger Hollow II was $107.5 million as of December 31, 2022.
We, along with WPS and an unaffiliated utility, received PSCW approval to construct Paris, a utility-scale solar-powered electric generating facility with a battery energy storage system. The project will be located in Kenosha County, Wisconsin and once fully constructed, we will own 75%, or 150 MW of solar generation and 82 MW of battery storage of this project. Commercial operation of the solar facility is targeted for 2023. The CWIP balance for Paris was $173.1 million as of December 31, 2022.
We, along with WPS and an unaffiliated utility, received PSCW approval to construct Darien, a utility-scale solar-powered electric generating facility with a battery energy storage system. The project will be located in Rock and Walworth counties, Wisconsin and once fully constructed, we will own 75%, or 188 MW of solar generation and 56 MW of battery storage of this project. Commercial operation of the solar facility is targeted for 2024. The CWIP balance for Darien was $7.8 million as of December 31, 2022.
We, along with WPS, received PSCW approval to construct a natural gas-fired generation facility at WPS’s existing Weston power plant site in northern Wisconsin. The new facility will consist of seven RICE units. Once constructed, we will own 50%, or 64 MW of this project. Commercial operation is targeted for 2023. The CWIP balance for the Weston RICE units was $60.5 million as of December 31, 2022.
Effective January 1, 2023, we, along with WPS, completed the acquisition of Whitewater, a commercially operational 236.5 MW dual fueled (natural gas and low sulfur fuel oil) combined cycle electrical generation facility in Whitewater, Wisconsin. Our share of the cost of this facility was approximately $36.3 million for 50% of the capacity, which includes transaction costs and working capital. See Note 14, Leases, for more information.
Our proportionate share of direct expenses for the joint operation of these plants is recorded in operating expenses in the income statements. We have supplied our own financing for all jointly owned projects.
NOTE 9—ASSET RETIREMENT OBLIGATIONS
We have recorded AROs primarily for asbestos abatement at certain generation and substation facilities; the removal and dismantlement of a biomass generation facility; the dismantling of wind generation projects; and the closure of coal combustion residual landfills at our generation facilities. We establish regulatory assets and liabilities to record the differences between ongoing expense recognition under the ARO accounting rules and the ratemaking practices for retirement costs authorized by the PSCW.
On our balance sheets, AROs are recorded within other long-term liabilities. The following table shows changes to our AROs during the years ended December 31:
| (in millions) | 2022 | 2021 | 2020 | |||||||||
| Balance as of January 1 | $ | 70.8 | $ | 54.5 | $ | 65.0 | ||||||
| Accretion | 1.8 | 1.7 | 2.3 | |||||||||
| Additions and revisions to estimated cash flows | 0.3 | 17.3 | (2) | (11.1 | ) (3) | |||||||
| Liabilities settled | (1.2 | ) (1) | (2.7 | ) | (1.7 | ) | ||||||
| Balance as of December 31 | $ | 71.7 | $ | 70.8 | $ | 54.5 | ||||||
| (1) | During 2022, AROs decreased $1.2 million due to partial settlements related to landfill monitoring costs, landfill closure activities, and a reduction in the number of distribution substations containing asbestos. |
| (2) | AROs increased by $16.8 million in 2021, due to revisions made to removal estimates for Blue Sky, Glacier Hills Wind Park, and Montfort Wind Energy Center. |
| (3) | The decrease in AROs during 2020 was primarily due to revisions made to estimated cash flows for the abatement of asbestos. | |
| Wisconsin Electric Power Company | A-42 | 2022 Annual Financial Statements |
NOTE 10—COMMON EQUITY
Stock-Based Compensation
The following table summarizes our pre-tax stock-based compensation expense, including amounts allocated from WBS, and the related tax benefit recognized in income for the years ended December 31:
| (in millions) | 2022 | 2021 | 2020 | |||||||||
| Stock options | $ | 2.4 | $ | 2.3 | $ | 2.1 | ||||||
| Restricted stock | 2.3 | 2.2 | 2.7 | |||||||||
| Performance units | 8.5 | 1.7 | 9.7 | |||||||||
| Stock-based compensation expense | $ | 13.2 | $ | 6.2 | $ | 14.5 | ||||||
| Related tax benefit | $ | 3.6 | $ | 1.7 | $ | 4.0 | ||||||
Stock-based compensation costs capitalized during 2022, 2021, and 2020 were not significant.
Stock Options
The following is a summary of our employees’ WEC Energy Group stock option activity during 2022:
| Stock Options | Number of Options | Weighted-Average Exercise Price | Weighted-Average Remaining Contractual Life (in years) | Aggregate Intrinsic Value (in millions) | ||||||||||||
| Outstanding as of January 1, 2022 | 531,533 | $ | 62.63 | |||||||||||||
| Granted | 51,511 | $ | 96.04 | |||||||||||||
| Exercised | (103,456 | ) | $ | 41.49 | ||||||||||||
| Transferred | (1,898 | ) | $ | 81.08 | ||||||||||||
| Forfeited | (2,181 | ) | $ | 92.88 | ||||||||||||
| Outstanding as of December 31, 2022 | 475,509 | $ | 70.63 | 5.3 | $ | 11.1 | ||||||||||
| Exercisable as of December 31, 2022 | 348,487 | $ | 62.52 | 4.3 | $ | 10.9 | ||||||||||
The aggregate intrinsic value of outstanding and exercisable options in the above table represents the total pre-tax intrinsic value that would have been received by the option holders had they exercised all of their options on December 31, 2022. This is calculated as the difference between WEC Energy Group’s closing stock price on December 31, 2022, and the option exercise price, multiplied by the number of in-the-money stock options. The intrinsic value of options exercised during the years ended December 31, 2022, 2021, and 2020 was $6.1 million, $2.9 million, and $7.1 million, respectively. Cash received by WEC Energy Group from exercises of its options by our employees was $4.3 million, $2.6 million, and $5.2 million during the years ended December 31, 2022, 2021, and 2020, respectively. The actual tax benefit from option exercises for the same periods was approximately $1.7 million, $0.8 million, and $1.9 million, respectively.
As of December 31, 2022, we expected to recognize approximately $0.7 million of unrecognized compensation cost related to unvested and outstanding WEC Energy Group stock options over the next 1.6 years on a weighted-average basis.
During the first quarter of 2023, the Compensation Committee awarded 30,495 non-qualified WEC Energy Group stock options with an exercise price of $93.69 and a weighted-average grant date fair value of $19.58 per option to certain of our officers and other key employees under its normal schedule of awarding long-term incentive compensation.
Restricted Shares
The following is a summary of our employees’ WEC Energy Group restricted stock activity during 2022:
| Restricted Shares | Number of Shares | Weighted-Average Grant Date Fair Value | |||||||
| Outstanding and unvested as of January 1, 2022 | 9,379 | $ | 87.21 | ||||||
| Granted | 4,886 | $ | 96.04 | ||||||
| Released | (4,643 | ) | $ | 83.21 | |||||
| Transferred | (89 | ) | $ | 89.84 | |||||
| Forfeited | (2,325 | ) | $ | 92.69 | |||||
| Outstanding and unvested as of December 31, 2022 | 7,208 | $ | 93.97 | ||||||
The intrinsic value of WEC Energy Group restricted stock held by our employees that was released was $0.4 million for each of the years ended December 31, 2022, 2021, and 2020. The actual tax benefit from released restricted shares was $0.1 million for each of the years ended December 31, 2022, 2021, and 2020.
| Wisconsin Electric Power Company | A-43 | 2022 Annual Financial Statements |
As of December 31, 2022, we expected to recognize approximately $1.0 million of unrecognized compensation cost related to unvested and outstanding WEC Energy Group restricted stock over the next 1.7 years on a weighted-average basis.
During the first quarter of 2023, the Compensation Committee awarded 4,544 WEC Energy Group restricted shares to our officers and other key employees under its normal schedule of awarding long-term incentive compensation. The grant date fair value of these awards was $93.69 per share.
Performance Units
During 2022, 2021, and 2020, the Compensation Committee awarded 21,158; 18,138; and 18,952 WEC Energy Group performance units, respectively, to our officers and other key employees under the WEC Energy Group Performance Unit Plan.
Performance units with an intrinsic value of $2.8 million, $3.1 million, and $3.9 million were settled during 2022, 2021, and 2020, respectively. The actual tax benefit from the distribution of performance units for the same years was $0.7 million, $0.7 million, and $0.9 million, respectively.
At December 31, 2022, our employees held 46,184 WEC Energy Group performance units, including dividend equivalents. A liability of $2.7 million was recorded on our balance sheet at December 31, 2022 related to these outstanding units. As of December 31, 2022, we expected to recognize approximately $5.6 million of unrecognized compensation cost related to unvested and outstanding WEC Energy Group performance units over the next 1.7 years on a weighted-average basis.
During the first quarter of 2023, performance units held by our employees with an intrinsic value of $1.1 million were settled. The actual tax benefit from the distribution of these awards was $0.3 million. In January 2023, the Compensation Committee also awarded 19,780 WEC Energy Group performance units to our officers and other key employees under its normal schedule of awarding long-term incentive compensation.
Restrictions
Various financing arrangements and regulatory requirements impose certain restrictions on our ability to transfer funds to WEC Energy Group in the form of cash dividends, loans, or advances. In addition, Wisconsin law prohibits us from making loans to or guaranteeing obligations of WEC Energy Group or its subsidiaries.
In accordance with our most recent rate order, we may not pay common dividends above the test year forecasted amount reflected in our rate case, if it would cause our average common equity ratio, on a financial basis, to fall below our authorized level of 53.0%. A return of capital in excess of the test year amount can be paid by us at the end of the year provided that our average common equity ratio does not fall below the authorized level.
We may not pay common dividends to WEC Energy Group under our Restated Articles of Incorporation if any dividends on our outstanding preferred stock have not been paid. In addition, pursuant to the terms of our 3.60% Serial Preferred Stock, our ability to declare common dividends would be limited to 75% or 50% of net income during a 12-month period if our common stock equity to total capitalization, as defined in the preferred stock designation, is less than 25% and 20%, respectively.
See Note 12, Short-Term Debt and Lines of Credit, for a discussion of certain financial covenants related to our short-term debt obligations.
As of December 31, 2022, our restricted retained earnings totaled approximately $1.8 billion.
We do not believe that these restrictions will materially affect our operations or limit any dividend payments in the foreseeable future.
NOTE 11—PREFERRED STOCK
The following table shows preferred stock authorized and outstanding at December 31, 2022 and 2021:
| (in millions, except share and per share amounts) | Shares Authorized | Shares Outstanding | Redemption Price Per Share | Total | ||||||||||||
| $100 par value, Six Per Cent. Preferred Stock | 45,000 | 44,498 | $ | — | $ | 4.4 | ||||||||||
| $100 par value, Serial Preferred Stock 3.60% Series | 2,286,500 | 260,000 | 101 | 26.0 | ||||||||||||
| $25 par value, Serial Preferred Stock | 5,000,000 | — | — | — | ||||||||||||
| Total | $ | 30.4 | ||||||||||||||
| Wisconsin Electric Power Company | A-44 | 2022 Annual Financial Statements |
NOTE 12—SHORT-TERM DEBT AND LINES OF CREDIT
The following table shows our short-term borrowings and their corresponding weighted-average interest rates as of December 31:
| (in millions, except percentages) | 2022 | 2021 | ||||||
| Commercial paper | ||||||||
| Amount outstanding at December 31 | $ | 460.7 | $ | 375.0 | ||||
| Average interest rate on amounts outstanding at December 31 | 4.59 | % | 0.21 | % | ||||
Our average amount of commercial paper borrowings based on daily outstanding balances during 2022 was $208.5 million, with a weighted-average interest rate during the period of 2.32%.
We have entered into a bank back-up credit facility to maintain short-term credit liquidity which, among other terms, requires us to maintain, subject to certain exclusions, a total funded debt to capitalization ratio of 65% or less. As of December 31, 2022, we were in compliance with this ratio.
The information in the table below relates to our revolving credit facility used to support our commercial paper borrowing program, including remaining available capacity under this facility as of December 31:
| (in millions) | Maturity | 2022 | ||||||
| Revolving credit facility | September 2026 | $ | 500.0 | |||||
| Less: | ||||||||
| Letters of credit issued inside credit facility | 1.0 | |||||||
| Commercial paper outstanding | 460.7 | |||||||
| Available capacity under existing agreement | $ | 38.3 | ||||||
This facility has a renewal provision for two extensions, subject to lender approval. Each extension is for a period of one year.
Our bank back-up credit facility contains customary covenants, including certain limitations on our ability to sell assets. The credit facility also contains customary events of default, including payment defaults, material inaccuracy of representations and warranties, covenant defaults, bankruptcy proceedings, certain judgments, Employee Retirement Income Security Act of 1974 defaults and change of control.
NOTE 13—LONG-TERM DEBT
The following table is a summary of our long-term debt outstanding as of December 31:
| (in millions) | Interest Rate | Year Due | 2022 | 2021 | |||||||||||
| WE Debentures (unsecured) | 2.05 | % | 2024 | $ | 300.0 | $ | 300.0 | ||||||||
| 3.10 | % | 2025 | 250.0 | 250.0 | |||||||||||
| 6.50 | % | 2028 | 150.0 | 150.0 | |||||||||||
| 1.70 | % | 2028 | 300.0 | 300.0 | |||||||||||
| 4.75 | % | 2032 | 500.0 | — | |||||||||||
| 5.625 | % | 2033 | 335.0 | 335.0 | |||||||||||
| 5.70 | % | 2036 | 300.0 | 300.0 | |||||||||||
| 3.65 | % | 2042 | 250.0 | 250.0 | |||||||||||
| 4.25 | % | 2044 | 250.0 | 250.0 | |||||||||||
| 4.30 | % | 2045 | 250.0 | 250.0 | |||||||||||
| 4.30 | % | 2048 | 300.0 | 300.0 | |||||||||||
| 6.875 | % | 2095 | 100.0 | 100.0 | |||||||||||
| WEPCo Environmental Trust (secured, nonrecourse) (1) (2) | 1.578 | % | 2023-2035 | 105.9 | 114.7 | ||||||||||
| Total | 3,390.9 | 2,899.7 | |||||||||||||
| Unamortized debt issuance costs | (14.9 | ) | (12.0 | ) | |||||||||||
| Unamortized discount, net | (15.6 | ) | (15.6 | ) | |||||||||||
| Total long-term debt, including current portion | 3,360.4 | 2,872.1 | |||||||||||||
| Current portion of long-term debt | (8.9 | ) | (8.8 | ) | |||||||||||
| Total long-term debt | $ | 3,351.5 | $ | 2,863.3 | |||||||||||
| (1) | WEPCo Environmental Trust’s ETBs are secured by a pledge of and lien on environmental control property, which includes the right to impose, collect and receive a non-bypassable environmental control charge paid by all of our retail electric distribution customers, the right to obtain true-up adjustments of the |
| Wisconsin Electric Power Company | A-45 | 2022 Annual Financial Statements |
| environmental control charge, and all revenues or other proceeds arising from those rights and interests. See Note 20, Variable Interest Entities, for more information. | |
| (2) | The long-term debt of WEPCo Environmental Trust requires periodic principal payments. |
We amortize debt premiums, discounts, and debt issuance costs over the life of the debt using the straight-line method and we include the costs in interest expense.
Wisconsin Electric Power Company
In September 2022, we issued $500.0 million of 4.75% Debentures due September 30, 2032, and intend to allocate an amount equal to the net proceeds for the construction and development of eligible green expenditures, which include existing and new expenditures for the acquisition, construction and development of wind and solar electric generating facilities and related energy storage assets.
The following table shows the future maturities of our long-term debt outstanding as of December 31, 2022:
| (in millions) | ||||
| 2023 | $ | 8.9 | ||
| 2024 | 309.0 | |||
| 2025 | 259.2 | |||
| 2026 | 9.3 | |||
| 2027 | 9.5 | |||
| Thereafter | 2,795.0 | |||
| Total | $ | 3,390.9 | ||
Our long-term debt obligations contain covenants related to payment of principal and interest when due and various other obligations. Failure to comply with these covenants could result in an event of default, which could result in the acceleration of outstanding debt obligations.
NOTE 14—LEASES
Obligations Under Operating Leases
We have recorded right of use assets and lease liabilities associated with the following operating leases.
| • | Land we are leasing related to our Rothschild biomass plant through June 2051. | |
| • | Land we are leasing related to our Solar Now projects. |
The operating leases generally require us to pay property taxes, insurance premiums, and operating and maintenance costs associated with the leased property. Many of our leases contain options to renew past the initial term, as set forth in the lease agreement. These optional renewals are not included in our calculation of the lease obligations as it is not reasonably certain that the leases will be extended.
Obligations Under Finance Leases
In accordance with ASC Subtopic 980-842, Regulated Operations – Leases, the expense recognition pattern of our finance leases discussed below resembles that of an operating lease. The difference between the minimum lease payments and the sum of imputed interest and unadjusted amortization costs calculated under Topic 842 is deferred as a regulatory asset on our balance sheets in accordance with Subtopic 980-842.
Power Purchase Commitment
In 1997, we entered into a 25-year PPA with LSP-Whitewater Limited Partnership. The contract, for 236.5 MWs of firm capacity from a natural gas-fired cogeneration facility, included zero minimum energy requirements. The PPA expired on May 31, 2022; however, in November 2021, we entered into a tolling agreement with LSP-Whitewater Limited Partnership that commenced on June 1, 2022. Concurrent with the execution of the tolling agreement, we entered into an asset purchase agreement to acquire a 50% ownership interest in the natural gas-fired cogeneration facility, and our share of the cost was $36.3 million, which excludes working capital and transaction costs. This asset purchase agreement was approved by the PSCW in December 2022, and the acquisition closed effective January 1, 2023.
Port Washington Generating Station
We are leasing PWGS 1 and PWGS 2, two 545 MW natural gas-fired generation units, which were placed in service in July 2005 and May 2008, respectively, from We Power under PSCW approved leases. We are amortizing the leased units on a straight-line basis over the original 25-year term of the leases. The lease payments are expected to be recovered through our rates, as supported by Wisconsin’s 2001 leased generation law.
| Wisconsin Electric Power Company | A-46 | 2022 Annual Financial Statements |
The only variability associated with the PWGS lease payments relates to the potential for future changes in We Power’s tax or interest rates, as the positive or negative impact of these changes is generally passed along to us, and subsequently to our customers. Because variability in the lease payments is dependent upon a rate (interest rate or tax rate), the lease payments are considered unavoidable under Topic 842, and are included in the measurement of the right of use asset and lease liability.
When the PWGS 1 and PWGS 2 contracts expire in 2030 and 2033, respectively, we may, at our option and with proper notice, choose to renew one or both contracts for up to three consecutive renewal terms (each renewal term would approximate 80% of the then remaining economic useful life of the respective generation unit), purchase one or both generating facilities at fair market value, or allow the contracts to expire.
Elm Road Generating Station
We are leasing ER 1, ER 2, and the common facilities, which are also utilized by our OC 5 through OC 8 generating units, from We Power under PSCW approved leases. We are amortizing the leased units on a straight-line basis over the 30-year term of the leases. ER 1 and ER 2 were placed in service in February 2010 and January 2011, respectively. The lease payments are expected to be recovered through our rates, as supported by Wisconsin’s 2001 leased generation law.
The only variability associated with the ERGS lease payments relates to the potential for future changes in We Power’s tax or interest rates, as the positive or negative impact of these changes are generally passed along to us, and subsequently to our customers. Because variability in the lease payments is dependent upon a rate (interest rate or tax rate), the lease payments are considered unavoidable under Topic 842, and are included in the measurement of the right of use asset and lease liability.
When the ER 1 and ER 2 contracts expire in 2040 and 2041, respectively, we may, at our option and with proper notice, choose to renew one or both contracts for up to three consecutive renewal terms (each renewal term would approximate 80% of the then remaining economic useful life of the respective generation unit), purchase one or both generating facilities at fair market value, or allow the contracts to expire.
Land Leases – Utility Solar Generation
We, along with WPS and an unaffiliated utility, have entered into various land leases related to our investments in utility-scale solar generation. Each lease has an initial term and one or more optional extensions. We expect the optional extensions to be exercised, and, as a result, all of the land leases are being amortized over an extended term of approximately 50 years. Once a solar project achieves commercial operation, the lease liability is remeasured to reflect the final total acres being leased. Our payments related to these leases are being recovered through rates.
Amounts Recognized in the Financial Statements and Other Information
The components of lease expense and supplemental cash flow information related to our leases for the years ended December 31 are as follows:
| (in millions) | 2022 | 2021 | 2020 | |||||||||
| Finance lease expense | ||||||||||||
| Amortization of right of use assets (1) | $ | 74.2 | $ | 68.1 | $ | 59.2 | ||||||
| Interest on lease liabilities (2) | 334.3 | 341.2 | 347.1 | |||||||||
| Operating lease expense (3) | 1.8 | 1.4 | 2.6 | |||||||||
| Total lease expense | $ | 410.3 | $ | 410.7 | $ | 408.9 | ||||||
| Other information | ||||||||||||
| Cash paid for amounts included in the measurement of lease liabilities | ||||||||||||
| Operating cash flows for finance leases | $ | 334.3 | $ | 341.2 | $ | 347.1 | ||||||
| Operating cash flows for operating leases | $ | 1.8 | $ | 1.4 | $ | 2.6 | ||||||
| Financing cash flows for finance leases | $ | 73.6 | $ | 67.5 | $ | 58.3 | ||||||
| Non-cash activities: | ||||||||||||
| Right of use assets obtained in exchange for finance lease liabilities | $ | 60.0 | $ | 52.7 | $ | 22.8 | ||||||
| Right of use assets obtained in exchange for operating lease liabilities | $ | — | $ | 0.3 | $ | — | ||||||
| Weighted-average remaining lease term – finance leases | 16.5 years | 16.9 years | 18.0 years | |||||||||
| Weighted-average remaining lease term – operating leases | 27.0 years | 28.5 years | 29.9 years | |||||||||
| Weighted-average discount rate – finance leases (4) | 13.6 | % | 13.8 | % | 13.8 | % | ||||||
| Weighted average discount rate – operating leases (4) | 4.5 | % | 4.5 | % | 4.6 | % | ||||||
| (1) | Amortization of right of use assets was included as a component of depreciation and amortization expense. |
| (2) | Interest on lease liabilities was included as a component of interest expense. |
| (3) | Operating lease expense was included as a component of operation and maintenance expense. |
| Wisconsin Electric Power Company | A-47 | 2022 Annual Financial Statements |
| (4) | Because our operating leases and our power purchase commitment and solar land leases accounted for as finance leases do not provide an implicit rate of return, we used the fully collateralized incremental borrowing rates based upon information available for similarly rated companies in determining the present value of lease payments. For the PWGS and ERGS units that meet the definition of a finance lease, the rate implicit in the lease was readily determinable. |
The following table summarizes our finance and operating lease right of use assets and obligations at December 31:
| (in millions) | 2022 | 2021 | Balance Sheet Location | |||||||
| Right of use assets | ||||||||||
| Operating lease right of use assets, net | $ | 8.4 | $ | 8.4 | Other long-term assets | |||||
| Finance lease right of use assets, net | ||||||||||
| Power purchase commitment | $ | 38.3 | $ | 41.0 | ||||||
| PWGS | 297.1 | 324.5 | ||||||||
| ERGS | 1,335.8 | 1,405.5 | ||||||||
| Land leases – utility solar generation | 67.9 | 22.1 | ||||||||
| Total finance lease right of use assets, net (1) | $ | 1,739.1 | $ | 1,793.1 | Property, plant, and equipment, net | |||||
| Lease obligations | ||||||||||
| Current operating lease liabilities | $ | 0.6 | $ | 0.4 | Other current liabilities | |||||
| Long-term operating lease liabilities | $ | 7.8 | $ | 8.0 | Other long-term liabilities | |||||
| Current finance lease liabilities | ||||||||||
| Power purchase commitment | $ | 36.3 | $ | 42.3 | ||||||
| PWGS | 37.8 | 33.2 | ||||||||
| ERGS | 38.2 | 33.8 | ||||||||
| Total current finance lease liabilities | $ | 112.3 | $ | 109.3 | Current portion of finance lease obligations | |||||
| Long-term finance lease liabilities | ||||||||||
| PWGS | $ | 512.2 | $ | 544.2 | ||||||
| ERGS | 2,118.8 | 2,150.1 | ||||||||
| Land leases – utility solar generation | 71.3 | 23.6 | ||||||||
| Total long-term finance lease liabilities | $ | 2,702.3 | $ | 2,717.9 | Finance lease obligations | |||||
| (1) | Amounts are net of accumulated amortization of $1,509.7 million and $1,395.8 million at December 31, 2022 and 2021, respectively. |
Future minimum lease payments under our operating and finance leases and the present value of our net minimum lease payments as of December 31, 2022, were as follows:
| (in millions) | Total Operating Leases | Power Purchase Commitment | PWGS | ERGS | Land Leases - Utility Solar Generation | Total Finance Leases | ||||||||||||||||||
| 2023 | $ | 0.9 | $ | 36.3 | $ | 101.9 | $ | 299.5 | $ | 2.4 | $ | 440.1 | ||||||||||||
| 2024 | 0.5 | — | 101.7 | 299.3 | 2.7 | 403.7 | ||||||||||||||||||
| 2025 | 0.5 | — | 101.4 | 299.2 | 2.8 | 403.4 | ||||||||||||||||||
| 2026 | 0.5 | — | 101.4 | 299.2 | 2.8 | 403.4 | ||||||||||||||||||
| 2027 | 0.5 | — | 101.1 | 299.2 | 2.8 | 403.1 | ||||||||||||||||||
| Thereafter | 11.8 | — | 399.6 | 3,742.6 | 210.8 | 4,353.0 | ||||||||||||||||||
| Total minimum lease payments | 14.7 | 36.3 | 907.1 | 5,239.0 | 224.3 | 6,406.7 | ||||||||||||||||||
| Less: Interest | (6.3 | ) | — | (357.1 | ) | (3,082.0 | ) | (153.0 | ) | (3,592.1 | ) | |||||||||||||
| Present value of minimum lease payments | 8.4 | 36.3 | 550.0 | 2,157.0 | 71.3 | 2,814.6 | ||||||||||||||||||
| Less: Short-term lease liabilities | (0.6 | ) | (36.3 | ) | (37.8 | ) | (38.2 | ) | — | (112.3 | ) | |||||||||||||
| Long-term lease liabilities | $ | 7.8 | $ | — | $ | 512.2 | $ | 2,118.8 | $ | 71.3 | $ | 2,702.3 | ||||||||||||
As of February 23, 2023, we have not entered into any material leases that have not yet commenced.
| Wisconsin Electric Power Company | A-48 | 2022 Annual Financial Statements |
NOTE 15—INCOME TAXES
Income Tax Expense
The following table is a summary of income tax expense for each of the years ended December 31:
| (in millions) | 2022 | 2021 | 2020 | |||||||||
| Current tax expense | $ | 81.0 | $ | 90.3 | $ | 112.2 | ||||||
| Deferred income taxes, net | 53.6 | (30.7 | ) | (66.0 | ) | |||||||
| ITCs | (1.5 | ) | (1.5 | ) | (1.5 | ) | ||||||
| Total income tax expense | $ | 133.1 | $ | 58.1 | $ | 44.7 | ||||||
Statutory Rate Reconciliation
The provision for income taxes for each of the years ended December 31 differs from the amount of income tax determined by applying the applicable United States statutory federal income tax rate to income before income taxes as a result of the following:
| 2022 | 2021 | 2020 | ||||||||||||||||||||||
| (in millions) | Amount | Effective Tax Rate | Amount | Effective Tax Rate | Amount | Effective Tax Rate | ||||||||||||||||||
| Statutory federal income tax | $ | 111.2 | 21.0 | % | $ | 92.3 | 21.0 | % | $ | 86.2 | 21.0 | % | ||||||||||||
| State income taxes net of federal tax benefit | 33.1 | 6.3 | % | 28.2 | 6.4 | % | 26.5 | 6.5 | % | |||||||||||||||
| Federal excess deferred tax amortization (1) | (23.2 | ) | (4.4 | )% | (23.2 | ) | (5.3 | )% | (23.2 | ) | (5.7 | )% | ||||||||||||
| AFUDC–Equity | (3.9 | ) | (0.7 | )% | (1.7 | ) | (0.4 | )% | (1.5 | ) | (0.4 | )% | ||||||||||||
| PTCs | (2.3 | ) | (0.4 | )% | (6.8 | ) | (1.5 | )% | (11.1 | ) | (2.7 | )% | ||||||||||||
| ITC restored | (1.5 | ) | (0.3 | )% | (1.5 | ) | (0.3 | )% | (1.5 | ) | (0.4 | )% | ||||||||||||
| Domestic production activities deferral | 6.3 | 1.1 | % | 6.3 | 1.4 | % | 6.3 | 1.5 | % | |||||||||||||||
| Federal excess deferred tax amortization – Wisconsin unprotected (2) | 5.3 | 1.0 | % | (42.7 | ) | (9.7 | )% | (42.7 | ) | (10.4 | )% | |||||||||||||
| Other, net | 8.1 | 1.5 | % | 7.2 | 1.6 | % | 5.7 | 1.5 | % | |||||||||||||||
| Total income tax expense | $ | 133.1 | 25.1 | % | $ | 58.1 | 13.2 | % | $ | 44.7 | 10.9 | % | ||||||||||||
| (1) | The Tax Legislation required us to remeasure our deferred income taxes and we began to amortize the resulting excess protected deferred income taxes beginning in 2018 in accordance with normalization requirements. The decrease in income tax expense related to the amortization of the deferred tax benefits is offset by a decrease in revenue as the benefits are returned to customers, resulting in no impact on net income. |
| (2) | In accordance with the rate order received from the PSCW in December 2019, the majority of our net unprotected deferred tax benefits related to electric operations were amortized to reduce near-term impacts to our customers over a period of two years, beginning with 2020. Consistent with the same rate order, the net unprotected tax expense related to gas and steam operations continues to be amortized over a period of four years, which began in 2020. The increase (decrease) in income tax expense related to the amortization of the deferred taxes is offset by an increase (decrease) in revenue as amounts are either collected from or returned to customers, resulting in no impact on net income. |
See Note 23, Regulatory Environment, for more information about the impact of the Tax Legislation and the Wisconsin rate order.
Deferred Income Tax Assets and Liabilities
The components of deferred income taxes as of December 31 were as follows:
| (in millions) | 2022 | 2021 | ||||||
| Deferred tax assets | ||||||||
| Tax gross up – regulatory items | $ | 110.3 | $ | 113.3 | ||||
| Deferred revenues | 106.5 | 117.9 | ||||||
| Future tax benefits | 10.1 | 8.3 | ||||||
| Other | 60.2 | 87.0 | ||||||
| Total deferred tax assets | $ | 287.1 | $ | 326.5 | ||||
| Deferred tax liabilities | ||||||||
| Property-related | $ | 1,399.0 | $ | 1,381.7 | ||||
| Deferred costs – plant retirements | 198.0 | 207.4 | ||||||
| Employee benefits and compensation | 68.2 | 47.7 | ||||||
| Deferred costs – SSR | 40.9 | 44.3 | ||||||
| Other | 48.3 | 47.0 | ||||||
| Total deferred tax liabilities | 1,754.4 | 1,728.1 | ||||||
| Deferred tax liability, net | $ | 1,467.3 | $ | 1,401.6 | ||||
Consistent with ratemaking treatment, deferred taxes in the table above are offset for temporary differences that have related regulatory assets and liabilities.
| Wisconsin Electric Power Company | A-49 | 2022 Annual Financial Statements |
The components of net deferred tax assets associated with federal tax benefit carryforwards as of December 31, 2022 and 2021 are summarized in the tables below:
| 2022 (in millions) | Gross Value | Deferred Tax Effect | Earliest Year of Expiration | |||||||||
| Future tax benefits as of December 31, 2022 | ||||||||||||
| Federal tax credit | $ | — | $ | 10.1 | 2041 | |||||||
| Balance as of December 31, 2022 | $ | — | $ | 10.1 | ||||||||
| 2021 (in millions) | Gross Value | Deferred Tax Effect | Earliest Year of Expiration | |||||||||
| Future tax benefits as of December 31, 2021 | ||||||||||||
| Federal tax credit | $ | — | $ | 8.3 | 2041 | |||||||
| Balance as of December 31, 2021 | $ | — | $ | 8.3 | ||||||||
Unrecognized Tax Benefits
We had no unrecognized tax benefits at December 31, 2022 and 2021.
We do not expect any unrecognized tax benefits to affect our effective tax rate in periods after December 31, 2022.
For the years ended December 31, 2022, 2021, and 2020, we recognized no interest expense and no penalties related to unrecognized tax benefits in our income statements. At December 31, 2022 and 2021, we had no interest accrued and no penalties accrued related to unrecognized tax benefits on our balance sheets.
We do not anticipate any significant increases in the total amount of unrecognized tax benefits within the next 12 months.
Our primary tax jurisdictions include federal and the state of Wisconsin. With a few exceptions we are no longer subject to federal income tax examinations by the IRS for years prior to 2019. As of December 31, 2022, we were subject to examination by the Wisconsin taxing authority for tax years 2018 through 2022.
NOTE 16—FAIR VALUE MEASUREMENTS
The following tables summarize our financial assets and liabilities that were accounted for at fair value on a recurring basis, categorized by level within the fair value hierarchy:
| December 31, 2022 | ||||||||||||||||
| (in millions) | Level 1 | Level 2 | Level 3 | Total | ||||||||||||
| Derivative assets | ||||||||||||||||
| Natural gas contracts | $ | 1.6 | $ | 2.5 | $ | — | $ | 4.1 | ||||||||
| FTRs | — | — | 2.0 | 2.0 | ||||||||||||
| Coal contracts | — | 32.7 | — | 32.7 | ||||||||||||
| Total derivative assets | $ | 1.6 | $ | 35.2 | $ | 2.0 | $ | 38.8 | ||||||||
| Derivative liabilities | ||||||||||||||||
| Natural gas contracts | $ | 29.3 | $ | 0.7 | $ | — | $ | 30.0 | ||||||||
| December 31, 2021 | ||||||||||||||||
| (in millions) | Level 1 | Level 2 | Level 3 | Total | ||||||||||||
| Derivative assets | ||||||||||||||||
| Natural gas contracts | $ | 11.5 | $ | 4.2 | $ | — | $ | 15.7 | ||||||||
| FTRs | — | — | 1.0 | 1.0 | ||||||||||||
| Coal contracts | — | 37.6 | — | 37.6 | ||||||||||||
| Total derivative assets | $ | 11.5 | $ | 41.8 | $ | 1.0 | $ | 54.3 | ||||||||
| Derivative liabilities | ||||||||||||||||
| Natural gas contracts | $ | 2.4 | $ | 0.3 | $ | — | $ | 2.7 | ||||||||
| Wisconsin Electric Power Company | A-50 | 2022 Annual Financial Statements |
The derivative assets and liabilities listed in the tables above include options, futures, physical commodity contracts, and other instruments used to manage market risks related to changes in commodity prices. They also include FTRs, which are used to manage electric transmission congestion costs in the MISO Energy Markets.
The following table summarizes the changes to derivatives classified as Level 3 in the fair value hierarchy at December 31:
| (in millions) | 2022 | 2021 | 2020 | |||||||||
| Balance at the beginning of the period | $ | 1.0 | $ | 1.1 | $ | 1.5 | ||||||
| Purchases | 7.6 | 3.1 | 3.1 | |||||||||
| Settlements | (6.6 | ) | (3.2 | ) | (3.5 | ) | ||||||
| Balance at the end of the period | $ | 2.0 | $ | 1.0 | $ | 1.1 | ||||||
Fair Value of Financial Instruments
The following table shows the financial instruments included on our balance sheets that are not recorded at fair value:
| December 31, 2022 | December 31, 2021 | |||||||||||||||
| (in millions) | Carrying Amount | Fair Value | Carrying Amount | Fair Value | ||||||||||||
| Preferred stock | $ | 30.4 | $ | 22.7 | $ | 30.4 | $ | 30.3 | ||||||||
| Long-term debt, including current portion | 3,360.4 | 3,143.2 | 2,872.1 | 3,403.4 | ||||||||||||
The fair values of our long-term debt and preferred stock are categorized within Level 2 of the fair value hierarchy.
NOTE 17—DERIVATIVE INSTRUMENTS
Derivative assets and liabilities not shown separately on our balance sheets are included in the other current and other long-term line items. The following table shows our derivative assets and derivative liabilities. None of the derivatives shown below were designated as hedging instruments.
| December 31, 2022 | December 31, 2021 | |||||||||||||||
| (in millions) | Derivative Assets | Derivative Liabilities | Derivative Assets | Derivative Liabilities | ||||||||||||
| Current | ||||||||||||||||
| Natural gas contracts | $ | 4.1 | $ | 28.8 | $ | 15.3 | $ | 2.6 | ||||||||
| FTRs | 2.0 | — | 1.0 | — | ||||||||||||
| Coal contracts | 17.6 | — | 32.4 | — | ||||||||||||
| Total current | 23.7 | 28.8 | 48.7 | 2.6 | ||||||||||||
| Long-term | ||||||||||||||||
| Natural gas contracts | — | 1.2 | 0.4 | 0.1 | ||||||||||||
| Coal contracts | 15.1 | — | 5.2 | — | ||||||||||||
| Total long-term | 15.1 | 1.2 | 5.6 | 0.1 | ||||||||||||
| Total | $ | 38.8 | $ | 30.0 | $ | 54.3 | $ | 2.7 | ||||||||
Realized gains and losses on derivatives are primarily recorded in cost of sales upon settlement; however, they may be subsequently deferred for future rate recovery or refund as the gains and losses are included in our fuel and natural gas cost recovery mechanisms. Our estimated notional sales volumes and realized gains and losses were as follows for the years ended:
| December 31, 2022 | December 31, 2021 | December 31, 2020 | ||||||||||||||||
| (in millions) | Volumes | Gains | Volumes | Gains | Volumes | Gains (Losses) | ||||||||||||
| Natural gas contracts | 59.7 Dth | $ | 86.6 | 69.2 Dth | $ | 50.8 | 62.1 Dth | $ | (15.1 | ) | ||||||||
| FTRs | 18.9 MWh | 8.1 | 21.0 MWh | 8.7 | 20.9 MWh | 2.5 | ||||||||||||
| Total | $ | 94.7 | $ | 59.5 | $ | (12.6 | ) | |||||||||||
At December 31, 2022 and 2021, we had posted cash collateral of $46.7 million and $5.5 million, respectively. We had also received cash collateral of $0.3 million at December 31, 2021.
| Wisconsin Electric Power Company | A-51 | 2022 Annual Financial Statements |
The following table shows derivative assets and derivative liabilities if derivative instruments by counterparty were presented net on our balance sheets:
| December 31, 2022 | December 31, 2021 | |||||||||||||||
| (in millions) | Derivative Assets | Derivative Liabilities | Derivative Assets | Derivative Liabilities | ||||||||||||
| Gross amount recognized on the balance sheet | $ | 38.8 | $ | 30.0 | $ | 54.3 | $ | 2.7 | ||||||||
| Gross amount not offset on the balance sheet | (1.8 | ) | (29.5 | ) (1) | (2.7 | ) (2) | (2.4 | ) | ||||||||
| Net amount | $ | 37.0 | $ | 0.5 | $ | 51.6 | $ | 0.3 | ||||||||
| (1) | Includes cash collateral posted of $27.7 million. |
| (2) | Includes cash collateral received of $0.3 million. |
NOTE 18—EMPLOYEE BENEFITS
Pension and Other Postretirement Employee Benefits
We participate in WEC Energy Group’s defined benefit pension plans and OPEB plans that cover substantially all of our employees. We are responsible for our share of the plan assets and obligations. The benefits for a portion of these plans are funded through irrevocable trusts, as allowed for income tax purposes. Our balance sheets reflect only the liabilities associated with our past and current employees and our share of the plan assets and obligations. We also offer medical, dental, and life insurance benefits to active employees and their dependents. We expense the costs of these benefits as incurred.
Generally, employees who started with us after 1995 receive a benefit based on a percentage of their annual salary plus an interest credit, while employees who started before 1996 receive a benefit based upon years of service and final average salary. Management employees hired after December 31, 2014, and certain new represented employees hired after May 1, 2017, receive an annual company contribution to their 401(k) savings plan instead of being enrolled in the defined benefit plans.
We use a year-end measurement date to measure the funded status of all of the pension and OPEB plans. Due to the regulated nature of our business, we have concluded that substantially all of the unrecognized costs resulting from the recognition of the funded status of the pension and OPEB plans qualify as a regulatory asset.
The following tables provide a reconciliation of the changes in our share of the plans’ benefit obligations and fair value of assets:
| Pension Benefits | OPEB Benefits | |||||||||||||||
| (in millions) | 2022 | 2021 | 2022 | 2021 | ||||||||||||
| Change in benefit obligation | ||||||||||||||||
| Obligation at January 1 | $ | 1,144.0 | $ | 1,213.1 | $ | 190.6 | $ | 206.1 | ||||||||
| Service cost | 13.4 | 14.4 | 3.9 | 4.3 | ||||||||||||
| Interest cost | 32.6 | 31.1 | 5.6 | 5.3 | ||||||||||||
| Participant contributions | — | — | 6.6 | 6.7 | ||||||||||||
| Plan amendments | — | — | — | (0.4 | ) | |||||||||||
| Net transfer from/to affiliates | 4.7 | (0.3 | ) | — | — | |||||||||||
| Actuarial gain | (211.3 | ) | (25.9 | ) | (46.9 | ) | (16.1 | ) | ||||||||
| Benefit payments | (88.5 | ) | (88.4 | ) | (19.0 | ) | (18.3 | ) | ||||||||
| Federal subsidy on benefits paid | N/A | N/A | 1.2 | 1.1 | ||||||||||||
| Transfer | — | — | 2.6 | 1.9 | ||||||||||||
| Obligation at December 31 | $ | 894.9 | $ | 1,144.0 | $ | 144.6 | $ | 190.6 | ||||||||
| Change in fair value of plan assets | ||||||||||||||||
| Fair value at January 1 | $ | 1,136.9 | $ | 1,127.2 | $ | 255.7 | $ | 244.9 | ||||||||
| Actual return on plan assets | (115.8 | ) | 94.8 | (32.6 | ) | 22.2 | ||||||||||
| Employer contributions | 3.8 | 3.9 | 0.1 | 0.1 | ||||||||||||
| Participant contributions | — | — | 6.6 | 6.7 | ||||||||||||
| Net transfer from/to affiliates | 4.3 | (0.6 | ) | 0.5 | 0.1 | |||||||||||
| Benefit payments | (88.5 | ) | (88.4 | ) | (19.0 | ) | (18.3 | ) | ||||||||
| Fair value at December 31 | $ | 940.7 | $ | 1,136.9 | $ | 211.3 | $ | 255.7 | ||||||||
| Funded status at December 31 | $ | 45.8 | $ | (7.1 | ) | $ | 66.7 | $ | 65.1 | |||||||
In 2022 and 2021, we had actuarial gains related to our pension benefit obligations of $211.3 million and $25.9 million, respectively, both of which were primarily driven by changes in our discount rates. The discount rate for our pension benefits was 5.50%, 2.94%, and 2.63% in 2022, 2021, and 2020, respectively.
| Wisconsin Electric Power Company | A-52 | 2022 Annual Financial Statements |
In 2022 and 2021, we had actuarial gains related to our OPEB benefit obligation of $46.9 million and $16.1 million, respectively, both of which were primarily driven by changes in our discount rates. The discount rate for our OPEB benefits was 5.50%, 2.95%, and 2.65% in 2022, 2021, and 2020, respectively.
The amounts recognized on our balance sheets at December 31 related to the funded status of the benefit plans were as follows:
| Pension Benefits | OPEB Benefits | |||||||||||||||
| (in millions) | 2022 | 2021 | 2022 | 2021 | ||||||||||||
| Pension and OPEB assets | $ | 76.6 | $ | 31.7 | $ | 66.7 | $ | 65.1 | ||||||||
| Pension and OPEB obligations | 30.8 | 38.8 | — | — | ||||||||||||
| Total net assets (liabilities) | $ | 45.8 | $ | (7.1 | ) | $ | 66.7 | $ | 65.1 | |||||||
The accumulated benefit obligation for all defined benefit pension plans was $894.0 million and $1,142.6 million as of December 31, 2022 and 2021, respectively.
The following table shows information for the pension plans with an accumulated benefit obligation in excess of plan assets. There were no plan assets related to these pension plans. Amounts presented are as of December 31:
| (in millions) | 2022 | 2021 | ||||||
| Accumulated benefit obligation | $ | 30.6 | $ | 38.6 | ||||
The following table shows information for pension plans with a projected benefit obligation in excess of plan assets. There were no plan assets related to these pension plans. Amounts presented are as of December 31:
| (in millions) | 2022 | 2021 | ||||||
| Projected benefit obligation | $ | 30.8 | $ | 38.8 | ||||
We do not have any OPEB plans with an accumulated benefit obligation in excess of plan assets.
The following table shows the amounts that had not yet been recognized in our net periodic benefit cost as of December 31:
| Pension Benefits | OPEB Benefits | |||||||||||||||
| (in millions) | 2022 | 2021 | 2022 | 2021 | ||||||||||||
| Net regulatory assets (liabilities) | ||||||||||||||||
| Net actuarial loss (gain) | $ | 326.7 | $ | 382.8 | $ | (113.0 | ) | $ | (128.4 | ) | ||||||
| Prior service credits | (2.0 | ) | (2.1 | ) | (1.3 | ) | (2.6 | ) | ||||||||
| Total | $ | 324.7 | $ | 380.7 | $ | (114.3 | ) | $ | (131.0 | ) | ||||||
The components of net periodic benefit cost (credit) (including amounts capitalized to our balance sheets) for the years ended December 31 were as follows:
| Pension Benefits | OPEB Benefits | |||||||||||||||||||||||
| (in millions) | 2022 | 2021 | 2020 | 2022 | 2021 | 2020 | ||||||||||||||||||
| Service cost | $ | 13.4 | $ | 14.4 | $ | 12.5 | $ | 3.9 | $ | 4.3 | $ | 4.2 | ||||||||||||
| Interest cost | 32.6 | 31.1 | 37.7 | 5.6 | 5.3 | 6.8 | ||||||||||||||||||
| Expected return on plan assets | (71.4 | ) | (70.3 | ) | (69.4 | ) | (17.7 | ) | (16.9 | ) | (15.7 | ) | ||||||||||||
| Plan settlement | — | — | 2.4 | — | — | — | ||||||||||||||||||
| Amortization of prior service credit | (0.1 | ) | (0.1 | ) | (0.1 | ) | (1.3 | ) | (1.2 | ) | (0.6 | ) | ||||||||||||
| Amortization of net actuarial loss (gain) | 29.8 | 41.9 | 37.8 | (12.1 | ) | (10.9 | ) | (10.6 | ) | |||||||||||||||
| Net periodic benefit cost (credit) | $ | 4.3 | $ | 17.0 | $ | 20.9 | $ | (21.6 | ) | $ | (19.4 | ) | $ | (15.9 | ) | |||||||||
| Wisconsin Electric Power Company | A-53 | 2022 Annual Financial Statements |
The weighted-average assumptions used to determine the benefit obligations for the plans were as follows for the years ended December 31:
| Pension Benefits | OPEB Benefits | ||||||||||||||||
| 2022 | 2021 | 2022 | 2021 | ||||||||||||||
| Discount rate | 5.50 | % | 2.94 | % | 5.50 | % | 2.95 | % | |||||||||
| Rate of compensation increase | 4.00 | % | 4.00 | % | N/A | N/A | |||||||||||
| Interest credit rate | 5.14 | % | 5.16 | % | N/A | N/A | |||||||||||
| Assumed medical cost trend rate (Pre 65) | N/A | N/A | 6.50 | % | 5.70 | % | |||||||||||
| Ultimate trend rate (Pre 65) | N/A | N/A | 5.00 | % | 5.00 | % | |||||||||||
| Year ultimate trend rate is reached (Pre 65) | N/A | N/A | 2031 | 2028 | |||||||||||||
| Assumed medical cost trend rate (Post 65) | N/A | N/A | 6.00 | % | 5.72 | % | |||||||||||
| Ultimate trend rate (Post 65) | N/A | N/A | 5.00 | % | 5.00 | % | |||||||||||
| Year ultimate trend rate is reached (Post 65) | N/A | N/A | 2031 | 2028 | |||||||||||||
The weighted-average assumptions used to determine the net periodic benefit cost for the plans were as follows for the years ended December 31:
| Pension Benefits | |||||||||||||
| 2022 | 2021 | 2020 | |||||||||||
| Discount rate | 2.94 | % | 2.63 | % | 3.37 | % | |||||||
| Expected return on plan assets | 6.75 | % | 6.75 | % | 6.75 | % | |||||||
| Rate of compensation increase | 4.00 | % | 4.00 | % | 4.00 | % | |||||||
| Interest credit rate | 5.16 | % | 5.16 | % | 5.16 | % | |||||||
| OPEB Benefits | |||||||||||||
| 2022 | 2021 | 2020 | |||||||||||
| Discount rate | 2.95 | % | 2.65 | % | 3.40 | % | |||||||
| Expected return on plan assets | 7.00 | % | 7.00 | % | 7.00 | % | |||||||
| Assumed medical cost trend rate (Pre 65) | 5.70 | % | 5.85 | % | 6.00 | % | |||||||
| Ultimate trend rate (Pre 65) | 5.00 | % | 5.00 | % | 5.00 | % | |||||||
| Year ultimate trend rate is reached (Pre 65) | 2028 | 2028 | 2028 | ||||||||||
| Assumed medical cost trend rate (Post 65) | 5.72 | % | 5.86 | % | 6.04 | % | |||||||
| Ultimate trend rate (Post 65) | 5.00 | % | 5.00 | % | 5.00 | % | |||||||
| Year ultimate trend rate is reached (Post 65) | 2028 | 2028 | 2028 | ||||||||||
WEC Energy Group consults with its investment advisors on an annual basis to help forecast expected long-term returns on plan assets by reviewing historical returns as well as calculating expected total trust returns using the weighted-average of long-term market returns for each of the major target asset categories utilized in the trust. For 2023, the expected return on asset assumption is 6.75% for the pension plan and 7.00% for the OPEB plan.
Plan Assets
Current pension trust assets and amounts which are expected to be contributed to the trusts in the future are expected to be adequate to meet pension payment obligations to current and future retirees.
The Investment Trust Policy Committee oversees investment matters related to all of our funded benefit plans. The Committee works with external actuaries and investment consultants on an on-going basis to establish and monitor investment strategies and target asset allocations. Forecasted cash flows for plan liabilities are regularly updated based on annual valuation results. Target allocations are determined utilizing projected benefit payment cash flows and risk analyses of appropriate investments. They are intended to reduce risk, provide long-term financial stability for the plans and maintain funded levels which meet long-term plan obligations while preserving sufficient liquidity for near-term benefit payments.
Our pension trust target asset allocations are 30% equity investments, 55% fixed income investments, and 15% private equity and real estate investments. The OPEB trust target asset allocations are 50% equity investments, 40% fixed income investments, and 10% real estate investments. Equity securities include investments in large-cap, mid-cap, and small-cap companies. Fixed income securities include corporate bonds of companies from diversified industries, mortgage and other asset backed securities, commercial paper, and United States Treasuries.
Pension and OPEB plan investments are recorded at fair value. See Note 1(o), Fair Value Measurements, for more information regarding the fair value hierarchy and the classification of fair value measurements based on the types of inputs used.
| Wisconsin Electric Power Company | A-54 | 2022 Annual Financial Statements |
The following tables summarize the fair values of our investments by asset class:
| December 31, 2022 | ||||||||||||||||||||||||||||||||
| Pension Plan Assets | OPEB Assets | |||||||||||||||||||||||||||||||
| (in millions) | Level 1 | Level 2 | Level 3 | Total | Level 1 | Level 2 | Level 3 | Total | ||||||||||||||||||||||||
| Asset Class | ||||||||||||||||||||||||||||||||
| Equity securities: | ||||||||||||||||||||||||||||||||
| United States equity | $ | 69.5 | $ | — | $ | — | $ | 69.5 | $ | 23.6 | $ | — | $ | — | $ | 23.6 | ||||||||||||||||
| International equity | 60.8 | — | — | 60.8 | 20.2 | — | — | 20.2 | ||||||||||||||||||||||||
| Fixed income securities: (1) | ||||||||||||||||||||||||||||||||
| United States bonds | — | 419.2 | — | 419.2 | 25.8 | 45.8 | — | 71.6 | ||||||||||||||||||||||||
| International bonds | — | 35.5 | — | 35.5 | — | 3.9 | — | 3.9 | ||||||||||||||||||||||||
| $ | 130.3 | $ | 454.7 | $ | — | $ | 585.0 | $ | 69.6 | $ | 49.7 | $ | — | $ | 119.3 | |||||||||||||||||
| Investments measured at net asset value: | ||||||||||||||||||||||||||||||||
| Equity securities | 139.7 | 47.3 | ||||||||||||||||||||||||||||||
| Fixed income securities | — | 12.7 | ||||||||||||||||||||||||||||||
| Other | 216.0 | 32.0 | ||||||||||||||||||||||||||||||
| Total | $ | 940.7 | $ | 211.3 | ||||||||||||||||||||||||||||
| (1) | This category represents investment grade bonds of United States and foreign issuers denominated in United States dollars from diverse industries. |
| December 31, 2021 | ||||||||||||||||||||||||||||||||
| Pension Plan Assets | OPEB Assets | |||||||||||||||||||||||||||||||
| (in millions) | Level 1 | Level 2 | Level 3 | Total | Level 1 | Level 2 | Level 3 | Total | ||||||||||||||||||||||||
| Asset Class | ||||||||||||||||||||||||||||||||
| Equity securities: | ||||||||||||||||||||||||||||||||
| United States equity | $ | 119.3 | $ | — | $ | — | $ | 119.3 | $ | 34.2 | $ | — | $ | — | $ | 34.2 | ||||||||||||||||
| International equity | 87.3 | — | — | 87.3 | 26.8 | — | — | 26.8 | ||||||||||||||||||||||||
| Fixed income securities: (1) | ||||||||||||||||||||||||||||||||
| United States bonds | — | 524.1 | — | 524.1 | 32.2 | 62.4 | — | 94.6 | ||||||||||||||||||||||||
| International bonds | — | 45.5 | — | 45.5 | — | 5.1 | — | 5.1 | ||||||||||||||||||||||||
| $ | 206.6 | $ | 569.6 | $ | — | $ | 776.2 | $ | 93.2 | $ | 67.5 | $ | — | $ | 160.7 | |||||||||||||||||
| Investments measured at net asset value: | ||||||||||||||||||||||||||||||||
| Equity securities | 171.8 | 57.7 | ||||||||||||||||||||||||||||||
| Fixed income securities | — | 21.3 | ||||||||||||||||||||||||||||||
| Other | 188.9 | 16.0 | ||||||||||||||||||||||||||||||
| Total | $ | 1,136.9 | $ | 255.7 | ||||||||||||||||||||||||||||
| (1) | This category represents investment grade bonds of United States and foreign issuers denominated in United States dollars from diverse industries. |
Cash Flows
We expect to contribute $3.3 million to the pension plans and $0.2 million to the OPEB plans in 2023, dependent upon various factors affecting us, including our liquidity position and possible tax law changes.
The following table shows the payments, reflecting expected future service, that we expect to make for pension and OPEB over the next 10 years:
| (in millions) | Pension Benefits | OPEB Benefits | ||||||
| 2023 | $ | 84.5 | $ | 11.5 | ||||
| 2024 | 84.0 | 11.1 | ||||||
| 2025 | 79.7 | 10.8 | ||||||
| 2026 | 78.4 | 10.7 | ||||||
| 2027 | 75.2 | 10.8 | ||||||
| 2028-2032 | 341.0 | 54.2 | ||||||
Savings Plans
WEC Energy Group sponsors 401(k) savings plans that allow substantially all of our full-time employees to contribute a portion of their pre-tax and/or after-tax income in accordance with plan-specified guidelines. A percentage of employee contributions are matched by us through a contribution into the employee’s savings plan account, up to certain limits. The 401(k) savings plans include an Employee Stock Ownership Plan. Certain employees receive an employer retirement contribution, which amounts are contributed to an
| Wisconsin Electric Power Company | A-55 | 2022 Annual Financial Statements |
employee’s savings plan account based on the employee’s wages. Total costs incurred under all of these plans were $14.2 million in 2022, $12.3 million in 2021, and $11.4 million in 2020.
NOTE 19—SEGMENT INFORMATION
We use net income attributed to common shareholder to measure segment profitability and to allocate resources to our business. At December 31, 2022, we reported two segments, which are described below.
Our utility segment includes our electric utility operations, including steam operations, and our natural gas utility operations.
| • | Our electric utility operations are engaged in the generation, distribution, and sale of electricity to customers in southeastern Wisconsin (including metropolitan Milwaukee), east central Wisconsin, and northern Wisconsin. In addition, our steam operations produce, distribute, and sell steam to customers in metropolitan Milwaukee. | |
| • | Our natural gas utility operations are engaged in the purchase, distribution, and sale of natural gas to retail customers as well as the transportation of customer-owned natural gas in southeastern, east central, and northern Wisconsin. |
No significant items were reported in the other segment during the twelve months ended December 31, 2022, 2021, and 2020.
All of our operations and assets are located within the United States.
NOTE 20—VARIABLE INTEREST ENTITIES
The primary beneficiary of a VIE must consolidate the entity’s assets and liabilities. In addition, certain disclosures are required for significant interest holders in VIEs.
We assess our relationships with potential VIEs, such as our coal suppliers, natural gas suppliers, coal transporters, natural gas transporters, and other counterparties related to PPAs, investments, and joint ventures. In making this assessment, we consider, along with other factors, the potential that our contracts or other arrangements provide subordinated financial support, the obligation to absorb the entity’s losses, the right to receive residual returns of the entity, and the power to direct the activities that most significantly impact the entity’s economic performance.
WEPCo Environmental Trust Finance I, LLC
In November 2020, the PSCW issued a financing order approving the securitization of $100 million of undepreciated environmental control costs related to our retired Pleasant Prairie power plant, the carrying costs accrued on the $100 million during the securitization process, and the related financing fees. The financing order also authorized us to form WEPCo Environmental Trust, a bankruptcy-remote special purpose entity, for the sole purpose of issuing ETBs to recover the costs approved in the financing order. WEPCo Environmental Trust is our wholly owned subsidiary.
In May 2021, WEPCo Environmental Trust issued ETBs and used the proceeds to acquire environmental control property from us. The environmental control property is recorded as a regulatory asset on our balance sheets and includes the right to impose, collect, and receive a non-bypassable environmental control charge from our retail electric distribution customers until the ETBs are paid in full and all financing costs have been recovered. The ETBs are secured by the environmental control property. Cash collections from the environmental control charge and funds on deposit in trust accounts are the sole sources of funds to satisfy the debt obligation. The bondholders have no recourse to us or any of our affiliates.
We act as the servicer of the environmental control property on behalf of WEPCo Environmental Trust and are responsible for metering, calculating, billing, and collecting the environmental control charge. As necessary, we are authorized to implement periodic adjustments of the environmental control charge. The adjustments are designed to ensure the timely payment of principal, interest, and other ongoing financing costs. We remit all collections of the environmental control charge to WEPCo Environmental Trust’s indenture trustee.
WEPCo Environmental Trust is a VIE primarily because its equity capitalization is insufficient to support its operations. As described above, we have the power to direct the activities that most significantly impact WEPCo Environmental Trust’s economic performance. Therefore, we are considered the primary beneficiary of WEPCo Environmental Trust, and consolidation is required.
| Wisconsin Electric Power Company | A-56 | 2022 Annual Financial Statements |
The following table summarizes the impact of WEPCo Environmental Trust on our balance sheet:
| (in millions) | December 31, 2022 | December 31, 2021 | ||||||
| Assets | ||||||||
| Other current assets (restricted cash) | $ | 3.0 | $ | 2.4 | ||||
| Regulatory assets | 92.4 | 100.7 | ||||||
| Other long-term assets (restricted cash) | 0.6 | 0.6 | ||||||
| Liabilities | ||||||||
| Current portion of long-term debt | 8.9 | 8.8 | ||||||
| Other current liabilities (accrued interest) | 0.1 | 0.1 | ||||||
| Long-term debt | 94.1 | 102.7 | ||||||
Power Purchase Commitment
On May 31, 2022, our PPA with LSP-Whitewater Limited Partnership that represented a variable interest expired. This agreement was for 236.5 MWs of firm capacity from a natural gas-fired cogeneration facility, and we accounted for it as a finance lease.
In November 2021, we entered into a tolling agreement with LSP-Whitewater Limited Partnership that commenced on June 1, 2022 upon the expiration of the PPA. Concurrent with the execution of the tolling agreement, we, along with WPS, entered into an agreement to purchase the natural gas-fired cogeneration facility. This asset purchase agreement was approved by the PSCW in December 2022, and the acquisition closed effective January 1, 2023. In accordance with the purchase agreement, we acquired a 50% ownership interest. See Note 2, Acquisition, for more information on the acquisition of this facility. The tolling agreement represented a variable interest until the facility was acquired since its terms were substantially similar to the terms of the PPA. Based on the risks of the entity, including operations, maintenance, dispatch, financing, fuel costs, and other factors, we were not the primary beneficiary of the entity. We did not hold an equity or debt interest in the entity, and there was no residual guarantee associated with the tolling agreement. Similar to the PPA, we accounted for the tolling agreement as a finance lease.
NOTE 21—COMMITMENTS AND CONTINGENCIES
We have significant commitments and contingencies arising from our operations, including those related to unconditional purchase obligations, environmental matters, and enforcement and litigation matters.
Unconditional Purchase Obligations
We have obligations to distribute and sell electricity and natural gas to our customers and expect to recover costs related to these obligations in future customer rates. In order to meet these obligations, we routinely enter into long-term purchase and sale commitments for various quantities and lengths of time.
The following table shows our minimum future commitments related to these purchase obligations as of December 31, 2022:
| Payments Due By Period | |||||||||||||||||||||||||||||||
| (in millions) | Date Contracts Extend Through | Total Amounts Committed | 2023 | 2024 | 2025 | 2026 | 2027 | Later Years | |||||||||||||||||||||||
| Electric utility: | |||||||||||||||||||||||||||||||
| Nuclear | 2033 | $ | 6,829.1 | $ | 548.5 | $ | 600.3 | $ | 634.5 | $ | 681.6 | $ | 730.4 | $ | 3,633.8 | ||||||||||||||||
| Coal supply and transportation | 2026 | 629.2 | 273.9 | 198.8 | 143.8 | 12.7 | — | — | |||||||||||||||||||||||
| Purchased power | 2051 | 43.2 | 14.0 | 3.6 | 2.3 | 2.4 | 2.4 | 18.5 | |||||||||||||||||||||||
| Natural gas utility supply and transportation | 2048 | 496.6 | 71.2 | 66.7 | 33.0 | 25.7 | 21.2 | 278.8 | |||||||||||||||||||||||
| Total | $ | 7,998.1 | $ | 907.6 | $ | 869.4 | $ | 813.6 | $ | 722.4 | $ | 754.0 | $ | 3,931.1 | |||||||||||||||||
Environmental Matters
Consistent with other companies in the energy industry, we face significant ongoing environmental compliance and remediation obligations related to current and past operations. Specific environmental issues affecting us include, but are not limited to, current and future regulation of air emissions such as SO2, NOx, fine particulates, mercury, and GHGs; water intake and discharges; management of coal combustion products such as fly ash; and remediation of impacted properties, including former manufactured gas plant sites.
We have continued to pursue a proactive strategy to manage our environmental compliance obligations, including:
| • | the development of additional sources of renewable electric energy supply; |
| Wisconsin Electric Power Company | A-57 | 2022 Annual Financial Statements |
| • | the addition of improvements for water quality matters such as treatment technologies to meet regulatory discharge limits and improvements to our cooling water intake systems; | |
| • | the addition of emission control equipment to existing facilities to comply with ambient air quality standards and federal clean air rules; | |
| • | the protection of wetlands and waterways, biodiversity including threatened and endangered species, and cultural resources associated with utility construction projects; | |
| • | the retirement of older coal-fired power plants and conversion to modern, efficient, natural gas generation, super-critical pulverized coal generation, and/or replacement with renewable generation; | |
| • | the beneficial use of ash and other products from coal-fired and biomass generating units; | |
| • | the remediation of former manufactured gas plant sites; | |
| • | the reduction of methane emissions across our natural gas distribution system by upgrading infrastructure; and | |
| • | the reporting of GHG emissions to comply with federal clean air rules. |
Air Quality
Cross State Air Pollution Rule – Good Neighbor Plan – The proposed rule to address the 2015 ozone NAAQS, resulting in more stringent regulation of ozone-season NOx emissions from electric utility generating units in 26 states, is expected to take effect in 2023. Based on a review of our existing units’ 2020 and 2021 actual ozone season emissions and projected future emissions versus proposed NOx ozone season allocations, we anticipate that we should be able to comply with the expanded rule requirements without procuring additional allowances on the open market.
Our planned RICE units in Wisconsin are not subject to this rule as proposed as each unit is less than 25 MW. We note that, to the extent we use RICE engines for natural gas distribution operations, those engines may be subject to the emission limits and operational requirements of the rule beginning in 2026. In June 2022, we submitted comments on this proposed rule seeking clarification of its applicability, as well as other items, and we will closely monitor the final rule for any changes from the proposed rule.
National Ambient Air Quality Standards – Ozone – After completing its review of the 2008 ozone standard, the EPA released a final rule in October 2015, creating a more stringent standard than the 2008 NAAQS. The 2015 ozone standard lowered the 8-hour limit for ground-level ozone. In November 2022, the EPA’s 2022 CASAC Ozone Review Panel issued a draft report supporting a previously issued EPA staff-written Integrated Science Assessment for ozone which supported the reconsideration of the 2015 standard. The EPA had planned a proposed rule in April 2023, but the CASAC review is expected to slow the process.
In June 2021, the EPA published its final action to revise the nonattainment area designations and/or boundaries for 13 counties associated with six nonattainment areas, including several in Illinois and Wisconsin. Under the new designations, all of Milwaukee and Ozaukee counties are now listed as nonattainment and portions of Racine, Waukesha, and Washington counties have been added to the “Milwaukee” nonattainment area. Additionally, the Chicago, IL-IN-WI nonattainment area now includes an expanded portion of Kenosha County, and the partial nonattainment area of Sheboygan County was also expanded.
In February 2022, revisions to the Wisconsin Administrative Code to adopt the 2015 standard were finalized. The amended regulations adopted the standard and incorporated by reference the federal air pollution monitoring requirements related to the standard. The WDNR submitted the rule updates as a SIP revision to the EPA in April 2022, which the EPA proposed to approve in August 2022.
In April 2022, the EPA proposed to find that the Milwaukee and Chicago, IL-IN-WI nonattainment areas did not meet the marginal attainment deadline of August 2021 and will be adjusted to “moderate” nonattainment status for the 2015 standard. In October 2022, the EPA published its final reclassifications from “marginal” to “moderate” for these areas, effective November 7, 2022. Accordingly, the WDNR must submit a SIP revision to address the moderate nonattainment status. We also expect the moderate nonattainment designation to impact emission offset ratios for major construction permitting in these areas.
We believe that we are well positioned to meet the requirements associated with the 2015 ozone standard and do not expect to incur significant costs to comply with the associated state and federal rules.
Particulate Matter – In December 2020, the EPA completed its 5-year review of the 2012 annual and 24-hour standards for fine PM and determined that no revisions were necessary to the current annual standard of 12 µg/m3 or the 24-hour standard of 35 µg/m3. Under the Biden Administration’s policy review, the EPA concluded that the scientific evidence and information from the December 2020 determination supports revising the level of the annual standard for the PM NAAQS to below the current level of 12 µg/m3, while retaining the 24-hour standard. In January 2023, the EPA announced its proposed decision to revise the primary (health-based) annual PM2.5 standard from its current level of 12 µg/m3 to within the range of 9 to 10 µg/m3. The EPA also proposed not to change the current secondary (welfare-based) annual PM2.5 standard, primary and secondary 24-hour PM2.5 standards, and primary and secondary PM10 standards. The EPA is also taking comments on the full range (between 8 and 11 µg/m3) included in the CASAC’s latest report. We anticipate the final rule to be released in late 2023. All counties within our service territories are in attainment with the current 2012 standards. If the EPA lowers the annual standard to 10 or 11 µg/m3, our generating facilities within our service territories should remain in attainment. If the EPA lowers it to below 10 µg/m3, there could be some nonattainment areas that may affect permitting of some
| Wisconsin Electric Power Company | A-58 | 2022 Annual Financial Statements |
smaller ancillary equipment located at our facilities. After finalization of the rule, the WDNR will need to draft a SIP and submit for the EPA’s approval.
Climate Change – The ACE rule, which replaced the Clean Power Plan, was vacated by the D.C. Circuit Court of Appeals in January 2021. In October 2021, the Supreme Court agreed to review the D.C. Circuit Court’s ruling vacating the EPA’s ACE rule and in June 2022, the Supreme Court issued its decision. The Supreme Court found that the EPA may regulate GHGs under section 111 of the CAA but cannot rely on generation shifting to lower carbon emitting sources to do so. We expect a new GHG replacement rule for existing sources to be proposed in March 2023.
In January 2021, the EPA finalized a rule to revise the NSPS for GHG emissions from new, modified, and reconstructed fossil-fueled power plants; however, it was vacated by the D.C. Circuit Court of Appeals in April 2021. Based on an updated EPA regulatory timeline, we expect a new rule to be proposed in March 2023. We continue to move forward on the ESG Progress Plan, which is heavily focused on reducing GHG emissions.
The EPA released proposed regulations for the Greenhouse Gas Reporting Rule, 40 CFR Part 98, in June 2022. The proposed revisions could impact the reporting required of our local natural gas distribution companies and underground natural gas storage facilities with updates to emission factors for equipment counts and increased disclosure for large release events. We expect the final rule in 2023, pending the EPA’s review and consideration of public comments.
The ESG Progress Plan includes the retirement of older, fossil-fueled generation, to be replaced with zero-carbon-emitting renewables and clean natural gas-fueled generation. We have already retired approximately 1,500 MW of coal-fired generation since the beginning of 2018. Through its ESG Progress Plan, WEC Energy Group expects to retire approximately 1,600 MW of additional fossil-fueled generation by the end of 2026, which includes the planned retirements in 2024-2025 of OCPP Units 5-8. See Note 7, Property, Plant, and Equipment, for more information. In May 2021, WEC Energy Group announced goals to achieve reductions in carbon emissions from its electric generation fleet by 60% by the end of 2025 and by 80% by the end of 2030, both from a 2005 baseline. WEC Energy Group expects to achieve these goals by making operating refinements, retiring less efficient generating units, and executing its capital plan. Over the longer term, the target for WEC Energy Group’s generation fleet is net-zero CO2 emissions by 2050.
WEC Energy Group also continues to reduce methane emissions by improving its natural gas distribution system and has set a target across its natural gas distribution operations to achieve net-zero methane emissions by the end of 2030. WEC Energy Group plans to achieve its net-zero goal through an effort that includes both continuous operational improvements and equipment upgrades, as well as the use of RNG throughout its utility systems.
We are required to report our CO2 equivalent emissions from the electric generating facilities we operate under the EPA Greenhouse Gases Reporting Program. Based upon our preliminary analysis of the data, we estimate that we will report CO2 equivalent emissions of approximately 13.3 million metric tonnes to the EPA for 2022. The level of CO2 and other GHG emissions varies from year to year and is dependent on the level of electric generation and mix of fuel sources, which is determined primarily by demand, the availability of the generating units, the unit cost of fuel consumed, and how our units are dispatched by MISO.
We are also required to report CO2 equivalent emissions related to the natural gas that our natural gas operations distribute and sell. Based upon our preliminary analysis of the data, we estimate that we will report CO2 equivalent emissions of approximately 4.5 million metric tonnes to the EPA for 2022.
Water Quality
Clean Water Act Cooling Water Intake Structure Rule – In August 2014, the EPA issued a final regulation under Section 316(b) of the Clean Water Act that requires the location, design, construction, and capacity of cooling water intake structures at existing power plants reflect the BTA for minimizing adverse environmental impacts. The federal rule became effective in October 2014 and applies to all of our existing generating facilities with cooling water intake structures, except for the ERGS units, which were permitted and received a final BTA determination under the rules governing new facilities.
In 2016, the WDNR initiated a state rulemaking process to incorporate the federal Section 316(b) requirements into the Wisconsin Administrative Code. This new state rule, NR 111, became effective in June 2020, and the WDNR will apply it when establishing BTA requirements for cooling water intake structures at existing facilities. These BTA requirements are incorporated into WPDES permits for our facilities.
We have received a final BTA determination for VAPP. We have received interim BTA determinations for PWGS and OCPP Units 5-8. Existing technology at the PWGS may satisfy the BTA requirements; however, a final determination will not be made until the WPDES permit is renewed for this facility, which is expected in the first half of 2023. We believe that existing technology installed at the OCPP facility meets the BTA requirements; however, depending on the timing of the permit reissuance, all four generating units may be retired prior to the WDNR making a final BTA decision anticipated in 2025.
As a result of past capital investments completed to address Section 316(b) compliance, we believe our fleet overall is well positioned to continue to meet this regulation and do not expect to incur significant additional compliance costs.
| Wisconsin Electric Power Company | A-59 | 2022 Annual Financial Statements |
Steam Electric Effluent Limitation Guidelines – The EPA’s final 2015 ELG rule took effect in January 2016 and was modified in 2020 to revise the treatment technology requirements related to BATW and wet FGD wastewaters at existing facilities. This rule created new requirements for several types of power plant wastewaters. The two new requirements that affect us relate to discharge limits for BATW and wet FGD wastewater. Our power plant facilities already have advanced wastewater treatment technologies installed that meet many of the discharge limits established by this rule. Modifications to OC 7 and OC 8 BATW systems were completed and placed in-service in mid-2021. Wastewater treatment system modifications also will be required for wet FGD discharges and site wastewater from the ERGS units. Based on existing contracts and engineering cost estimates, we expect that compliance with the ELG rule will require $90 million in capital investment. In December 2021, the PSCW issued a Certificate of Authority approving the ERGS FGD wastewater treatment system modification. The BATW modifications do not require PSCW approval prior to construction. All of these ELG required projects are either in-service or are on track for completion by the WPDES permit deadline in December 2023.
In July 2021, the EPA announced its intention to initiate a “supplemental rulemaking” to revise the ELG Reconsideration Rule that was finalized in late 2020. The EPA has stated that the 2020 ELG Rule will continue to be implemented and enforced while the agency pursues this rulemaking process. As part of their regulatory agenda, the EPA Office of Water included plans to issue a direct final rule reopening the NOPP deadline to enter the cessation of the coal subcategory (i.e. unit retirements or conversions to natural gas by the end of December 2028 instead of making capital investments to add more treatment technology) established in the 2020 ELG Rule. The new NOPP deadline will be 90 days after publication in the Federal Register, which is anticipated during the first quarter of 2023. The EPA will publish the direct final rule at the same time as the proposed ELG supplemental rulemaking.
Waters of the United States – In January 2023, the EPA and the United States Army Corps of Engineers together released a final rule revising the definition of WOTUS. This rule will be effective March 20, 2023. The final rule states that it is based on the pre-2015 definition of “waters of the United States.” The pre-2015 approach involves applying factors established through case law and agency precedents to determine whether a wetland or surface drainage feature is subject to federal jurisdiction.
The recent rulemaking could be affected by a significant pending Supreme Court case involving WOTUS determination. In January 2022, the Supreme Court granted certiorari in a case, Sackett v. Environmental Protection Agency, to evaluate the proper test for determining whether wetlands are WOTUS. A decision by the Supreme Court is expected in spring 2023.
At this point, our projects requiring federal permits are moving ahead, but we are monitoring these recent developments to better understand potential future impacts. The Sackett case, once decided, should provide some clarity regarding the definition of WOTUS. We will continue to monitor this litigation and any subsequent agency action.
Land Quality
Manufactured Gas Plant Remediation – We have identified sites at which we or a predecessor company owned or operated a manufactured gas plant or stored manufactured gas. We have also identified other sites that may have been impacted by historical manufactured gas plant activities. We are responsible for the environmental remediation of these sites. We are also working with the state of Wisconsin in our investigation and remediation planning. These sites are at various stages of investigation, monitoring, remediation, and closure.
The future costs for detailed site investigation, future remediation, and monitoring are dependent upon several variables including, among other things, the extent of remediation, changes in technology, and changes in regulation. Historically, our regulators have allowed us to recover incurred costs, net of insurance recoveries and recoveries from potentially responsible parties, associated with the remediation of manufactured gas plant sites. Accordingly, we have established regulatory assets for costs associated with these sites.
We have established the following regulatory assets and reserves for manufactured gas plant sites as of December 31:
| (in millions) | 2022 | 2021 | ||||||
| Regulatory assets | $ | 14.6 | $ | 16.8 | ||||
| Reserves for future environmental remediation (1) | $ | 10.3 | $ | 10.7 | ||||
| (1) | Recorded within other long-term liabilities on our balance sheets. |
Renewables, Efficiency, and Conservation
Wisconsin Legislation – In 2005, Wisconsin enacted Act 141, which established a goal that 10% of all electricity consumed in Wisconsin be generated by renewable resources annually. We have achieved our required renewable energy percentage of 8.27% by constructing various wind parks, a biomass facility, and by also relying on renewable energy purchases. We continue to review our renewable energy portfolio and acquire cost-effective renewables as needed to meet our requirements on an ongoing basis. The PSCW administers the renewable program related to Act 141, and we fund the program, along with other utilities, based on 1.2% of our annual retail operating revenues.
Enforcement and Litigation Matters
We are involved in legal and administrative proceedings before various courts and agencies with respect to matters arising in the ordinary course of business. Although we are unable to predict the outcome of these matters, management believes that appropriate
| Wisconsin Electric Power Company | A-60 | 2022 Annual Financial Statements |
reserves have been established and that final settlement of these actions will not have a material impact on our financial condition or results of operations.
NOTE 22—SUPPLEMENTAL CASH FLOW INFORMATION
| Year Ended December 31 | ||||||||||||
| (in millions) | 2022 | 2021 | 2020 | |||||||||
| Cash paid for interest, net of amount capitalized | $ | 449.2 | $ | 460.8 | $ | 464.7 | ||||||
| Cash paid for income taxes, net | 88.0 | 88.0 | 101.2 | |||||||||
| Significant non-cash investing and financing transactions: | ||||||||||||
| Accounts payable related to construction costs | 89.1 | 42.4 | 43.0 | |||||||||
| Increase in receivable related to insurance proceeds | — | 37.3 | 2.7 | |||||||||
| Liabilities accrued for software licensing agreement | 3.1 | — | — | |||||||||
The statements of cash flows include our activity related to cash, cash equivalents, and restricted cash. Our restricted cash consists of the following:
| • | Cash on deposit in a financial institution that is restricted to satisfy the requirements of a debt agreement at WEPCo Environmental Trust. See Note 20, Variable Interest Entities, for more information. | |
| • | Cash used for the purchase of a natural gas-fired cogeneration facility located in Whitewater, Wisconsin. This cash was included in other long-term assets at December 31, 2022. See Note 2, Acquisition, for more information on the purchase of this facility. |
The following table reconciles the cash, cash equivalents, and restricted cash amounts reported within the balance sheets at December 31 to the total of these amounts shown on the statements of cash flows:
| (in millions) | 2022 | 2021 | 2020 | |||||||||
| Cash and cash equivalents | $ | 6.1 | $ | — | $ | 7.2 | ||||||
| Restricted cash included in other current assets | 3.0 | 2.4 | — | |||||||||
| Restricted cash included in other long-term assets | 38.6 | 0.6 | — | |||||||||
| Cash, cash equivalents, and restricted cash | $ | 47.7 | $ | 3.0 | $ | 7.2 | ||||||
NOTE 23—REGULATORY ENVIRONMENT
2023 and 2024 Rates
In April 2022, we filed a request with the PSCW to increase our retail electric, natural gas, and steam rates. Our request was updated in July 2022 to reflect new developments that impacted the original proposal. The requested increase in electric rates was driven by capital investments in new wind, solar, and battery storage; capital investments in natural gas generation; reliability investments, including grid hardening projects to bury power lines and strengthen our distribution system against severe weather; and changes in wholesale business with other utilities. Many of these investments have already been approved by the PSCW. The requested increase in natural gas rates primarily related to capital investments previously approved by the PSCW, including LNG storage for our natural gas distribution system.
In September 2022, we entered into a settlement agreement with certain intervenors to resolve most of the outstanding issues in our rate case; however, the PSCW declined to approve the settlement agreement. In December 2022, the PSCW issued a final written order approving electric, natural gas, and steam base rate increases, effective January 1, 2023. The final order reflects the following:
| 2023 base rate increase | ||||||||
| Electric | $ | 283.5 million | / 9.1 | % | ||||
| Gas | $ | 46.1 million | / 9.6 | % | ||||
| Steam | $ | 7.6 million | / 35.3 | % | ||||
| ROE | 9.8 | % | ||||||
| Common equity component average on a financial basis | 53.0 | % | ||||||
In addition to the above, the final order includes the following terms:
| • | We will keep our current earnings sharing mechanism, under which, if we earn above our authorized ROE: (i) we will retain 100.0% of earnings for the first 15 basis points above the authorized ROE; (ii) 50.0% of the next 60 basis points will be required to be refunded to ratepayers; and (iii) 100.0% of any remaining excess earnings will be required to be refunded to ratepayers. | |
| • | We are required to complete an analysis of alternative recovery scenarios for generating units that will be retired prior to the end of their useful life. |
| Wisconsin Electric Power Company | A-61 | 2022 Annual Financial Statements |
| • | We will not propose any changes to our real time pricing rates for large commercial and industrial electric customers through the end of 2024. | |
| • | We will lower monthly residential and small commercial electric customer fixed charges by $1.00 from currently authorized rates. | |
| • | We will offer an additional voluntary renewable energy pilot for commercial and industrial customers. | |
| • | We will work with PSCW staff and other interested parties to develop alternative low income assistance programs. We, along with WPS, will also collectively contribute $4.0 million to the Keep Wisconsin Warm Fund. | |
| • | We are required to implement escrow accounting treatment for pension and OPEB costs in 2023 and 2024. | |
| • | We are authorized to file a limited electric rate case re-opener for 2024 to address changes to revenue requirements associated with generation projects that are expected to be placed into service in 2023 and 2024 and future plant retirements. We are also authorized to file a limited natural gas rate case re-opener for 2024 to address additional revenue requirements associated with our LNG project that is expected to be placed into service in 2023. |
2022 Rates
In March 2021, we filed an application with the PSCW for the approval of certain accounting treatments that allowed us to maintain our electric, natural gas, and steam base rates through 2022 and forego filing a rate case for one year. In connection with the request, we also entered into an agreement, dated March 23, 2021, with various stakeholders. Pursuant to the terms of the agreement, the stakeholders fully supported the application. In September 2021, the PSCW issued a written order approving the application.
The final order reflected the following:
| • | We amortized, in 2022, certain previously deferred balances to offset approximately half of our forecasted revenue deficiency. | |
| • | We were able to defer any increases in tax expense due to changes in tax law that occurred in 2021 and/or 2022. | |
| • | We maintained our earnings sharing mechanism for 2022, with modification. The earnings sharing mechanism was modified to authorize us to retain 100.0% of the first 15 basis points of earnings above our currently authorized ROE. The earnings sharing mechanism otherwise remained as previously authorized. |
2020 and 2021 Rates
In March 2019, we filed an application with the PSCW to increase our retail electric, natural gas, and steam rates, effective January 1, 2020. In August 2019, we filed an application with the PSCW for approval of a settlement agreement entered into with certain intervenors to resolve several outstanding issues in our rate case. In December 2019, the PSCW issued a written order that approved the settlement agreement without material modification and addressed the remaining outstanding issues that were not included in the settlement agreement. The new rates were effective January 1, 2020. The final order reflected the following:
| 2020 Effective rate increase | ||||||||
| Electric (1) | $ | 15.3 million | / | 0.5% | ||||
| Gas (2) | $ | 10.4 million | / | 2.8% | ||||
| Steam | $ | 1.9 million | / | 8.6% | ||||
| ROE | 10.0 | % | ||||||
| Common equity component average on a financial basis | 52.5 | % | ||||||
| (1) | Amount is net of certain deferred tax benefits from the Tax Legislation that were utilized to reduce near-term rate impacts. The rate order reflected the majority of the unprotected deferred tax benefits from the Tax Legislation being amortized evenly over two years, which resulted in approximately $65 million of tax benefits being amortized in each of 2020 and 2021. The unprotected deferred tax benefits related to the unrecovered balances of certain of our retired plants and our SSR regulatory asset were used to reduce the related regulatory asset. Unprotected deferred tax benefits by their nature are eligible to be returned to customers in a manner and timeline determined to be appropriate by the PSCW. |
| (2) | Amount includes certain deferred tax expense from the Tax Legislation. The rate order reflected all of the unprotected deferred tax expense from the Tax Legislation being amortized evenly over four years, which results in approximately $5 million of previously deferred tax expense being amortized each year. Unprotected deferred tax expense by its nature is eligible to be recovered from customers in a manner and timeline determined to be appropriate by the PSCW. |
In accordance with our rate order, we filed an application with the PSCW in July 2020 requesting a financing order to securitize $100 million of Pleasant Prairie power plant’s book value, plus the carrying costs accrued on the $100 million during the securitization process and the related financing fees. In November 2020, the PSCW issued a written order approving the application. The financing order also authorized us to form a bankruptcy-remote special purpose entity, WEPCo Environmental Trust, for the sole purpose of issuing ETBs to recover the approved costs. In May 2021, WEPCo Environmental Trust issued $118.8 million of 1.578% ETBs due December 15, 2035. See Note 20, Variable Interest Entities, for more information on WEPCo Environmental Trust.
The PSCW approved us continuing to have an earnings sharing mechanism through 2021. The earnings sharing mechanism was modified from its previous structure to one that was consistent with other Wisconsin investor-owned utilities. Under this earnings sharing mechanism, if we earned above our authorized ROE: (i) we retained 100.0% of earnings for the first 25 basis points above the authorized ROE; (ii) 50.0% of the next 50 basis points were required to be refunded to customers; and (iii) 100.0% of any remaining excess earnings were required to be refunded to customers. In addition, the rate order also required us to maintain residential and small
| Wisconsin Electric Power Company | A-62 | 2022 Annual Financial Statements |
commercial electric and natural gas customer fixed charges at previously authorized rates and to maintain the status quo for our electric market-based rate programs for large industrial customers through 2021.
Recovery of Natural Gas Costs
Due to the cold temperatures, wind, snow, and ice throughout the central part of the country during February 2021, the cost of gas purchased for our natural gas utility customers was temporarily driven significantly higher than our normal winter weather expectations. We have a regulatory mechanism in place for recovering all prudently incurred gas costs.
In March 2021, we received approval from the PSCW to recover approximately $54 million of natural gas costs in excess of the benchmark set in our GCRM over a period of three months, beginning in April 2021.
Coronavirus Disease – 2019
In March 2020, the PSCW issued two orders in response to the COVID-19 pandemic. The first order required all public utilities in the state of Wisconsin, including us, to temporarily suspend disconnections, the assessment of late fees, and deposit requirements for all customer classes. In addition, it required utilities to reconnect customers that were previously disconnected, offer deferred payment arrangements to all customers, and streamline the application process for customers applying for utility service.
In the second order issued in March 2020, the PSCW authorized Wisconsin utilities to defer expenditures and certain foregone revenues resulting from compliance with the first order, and expenditures as otherwise incurred to ensure safe, reliable, and affordable access to utility services during the declared public health emergency. In December 2021, the PSCW approved a motion to end all COVID-related deferrals as of December 31, 2021. At December 31, 2022, we did not have any amounts deferred related to the COVID-19 pandemic as the rate order we received from the PSCW in December 2022 did not allow recovery of these costs.
In June 2020, the PSCW issued a written order providing a timeline for the lifting of the temporary provisions required in the first March 2020 order. Utilities were allowed to disconnect commercial and industrial customers and require deposits for new service as of July 25, 2020 and July 31, 2020, respectively. After August 15, 2020, utilities were no longer required to offer deferred payment arrangements to all customers. Additionally, utilities were authorized to reinstate late fees except for the period between the first order and this supplemental order. We resumed charging late payment fees in late August 2020. Late payment fees were not charged on outstanding balances that were billed between the first order and late August 2020.
Subsequent to the June 2020 order, the PSCW extended the moratorium on disconnections of residential customers until November 1, 2020. In accordance with Wisconsin regulations, utilities are generally not allowed to disconnect residential customers for non-payment during the winter moratorium, which customarily begins on November 1 and ends on April 15 of each year. Utilities were allowed to continue assessing late payment fees during the winter moratorium. On April 5, 2021, the PSCW issued a written order indicating that it would not extend the moratorium on disconnections further; therefore, utilities could begin disconnecting residential customers for non-payment after April 15, 2021. The order also allowed us to resume charging late payment fees on the full balance of all outstanding arrears, regardless of the associated dates the service was provided, after April 15, 2021. We continue to offer flexible payment arrangements to low-income residential customers prior to disconnecting service.
NOTE 24—OTHER INCOME, NET
Total other income, net was as follows for the years ended December 31:
| (in millions) | 2022 | 2021 | 2020 | |||||||||
| Non-service components of net periodic benefit costs | $ | 33.8 | $ | 22.5 | $ | 11.8 | ||||||
| AFUDC–Equity | 18.8 | 7.9 | 7.0 | |||||||||
| Other, net | (3.2 | ) | 1.7 | (0.3 | ) | |||||||
| Other income, net | $ | 49.4 | $ | 32.1 | $ | 18.5 | ||||||
NOTE 25—NEW ACCOUNTING PRONOUNCEMENTS
Reference Rate Reform
In March 2020, the FASB issued ASU No. 2020-04, Reference Rate Reform (Topic 848): Facilitation of the Effects of Reference Rate Reform on Financial Reporting, which provides optional expedients and exceptions to provide relief for applying GAAP to contracts, hedging relationships, and other transactions affected by reference rate reform if certain criteria are met. The amendments apply only to contracts, hedging relationships, and other transactions that reference LIBOR or another reference rate expected to be discontinued because of reference rate reform. Under ASU No. 2020-04, this relief was effective for all entities beginning March 12, 2020 through December 31, 2022. In December 2022, the FASB issued ASU No. 2022-06, Reference Rate Reform (Topic 848): Deferral of the Sunset Date of Topic 848, which extends the relief for applying GAAP to contracts, hedging relationships, and other transactions affected by reference rate reform to December 31, 2024. We are currently evaluating the impact this guidance may have on our financial statements and related disclosures.
| Wisconsin Electric Power Company | A-63 | 2022 Annual Financial Statements |
Government Assistance
In November 2021, the FASB issued ASU No. 2021-10, Government Assistance (Topic 832). The amendments in this update increase the transparency surrounding government assistance by requiring disclosure of: (i) the types of assistance received; (ii) an entity’s accounting for the assistance; and (iii) the effect of the assistance on the entity’s financial statements. The update was effective for annual periods beginning after December 15, 2021. The adoption of ASU No. 2021-10, effective for our fiscal year ending on December 31, 2022, did not have a significant impact on our financial statements and related disclosures.
| Wisconsin Electric Power Company | A-64 | 2022 Annual Financial Statements |
 | Deloitte & Touche LLP
Tel: +1 414 271 3000
|
REPORT OF INDEPENDENT REGISTERED PUBLIC ACCOUNTING FIRM
To the shareholders and the Board of Directors of Wisconsin Electric Power Company
Opinion on the Financial Statements
We have audited the accompanying consolidated balance sheets of Wisconsin Electric Power Company and subsidiary (the “Company”) as of December 31, 2022 and 2021, the related consolidated statements of income, equity, and cash flows, for each of the three years in the period ended December 31, 2022, and the related notes (collectively referred to as the “financial statements”). In our opinion, the financial statements present fairly, in all material respects, the financial position of the Company as of December 31, 2022 and 2021, and the results of its operations and its cash flows for each of the three years in the period ended December 31, 2022, in conformity with accounting principles generally accepted in the United States of America.
Basis for Opinion
These financial statements are the responsibility of the Company’s management. Our responsibility is to express an opinion on the Company’s financial statements based on our audits. We are a public accounting firm registered with the Public Company Accounting Oversight Board (United States) (PCAOB) and are required to be independent with respect to the Company in accordance with the U.S. federal securities laws and the applicable rules and regulations of the Securities and Exchange Commission and the PCAOB.
We conducted our audits in accordance with the standards of the PCAOB. Those standards require that we plan and perform the audit to obtain reasonable assurance about whether the financial statements are free of material misstatement, whether due to error or fraud. The Company is not required to have, nor were we engaged to perform, an audit of its internal control over financial reporting. As part of our audits, we are required to obtain an understanding of internal control over financial reporting but not for the purpose of expressing an opinion on the effectiveness of the Company’s internal control over financial reporting. Accordingly, we express no such opinion.
Our audits included performing procedures to assess the risks of material misstatement of the financial statements, whether due to error or fraud, and performing procedures that respond to those risks. Such procedures included examining, on a test basis, evidence regarding the amounts and disclosures in the financial statements. Our audits also included evaluating the accounting principles used and significant estimates made by management, as well as evaluating the overall presentation of the financial statements. We believe that our audits provide a reasonable basis for our opinion.
Critical Audit Matter
The critical audit matter communicated below is a matter arising from the current-period audit of the financial statements that was communicated or required to be communicated to the audit committee and that (1) relates to accounts or disclosures that are material to the financial statements and (2) involved our especially challenging, subjective, or complex judgments. The communication of critical audit matters does not alter in any way our opinion on the financial statements, taken as a whole, and we are not, by communicating the critical audit matter below, providing a separate opinion on the critical audit matter or on the accounts or disclosures to which it relates.
Regulatory Assets and Liabilities - Impact of rate regulation on financial statements — Refer to Notes 6 and 23 to the financial statements
Critical Audit Matter Description
The Company is subject to regulation by state and federal regulatory bodies (collectively the “Commissions”) which have jurisdiction with respect to the rates of electric and gas distribution. Management has determined the Company meets the requirements under accounting principles generally accepted in the United States of America to prepare its financial statements applying the Regulated Operations Topic of the Financial Accounting Standards Board’s Accounting Standard Codification.
| A-65 |
Rates are determined and approved in regulatory proceedings based on an analysis of the Company’s costs to provide utility service and a return on, and recovery of, the Company’s investment in the utility business. Regulatory decisions can have an impact on the recovery of costs, the rate of return earned on investment, and the timing and amount of assets to be recovered by rates. The Commissions’ regulation of rates is premised on the full recovery of prudently incurred costs and a reasonable rate of return on invested capital. Certain items that would otherwise be immediately recognized as revenues and expenses are deferred as regulatory assets and regulatory liabilities for future recovery or refund to customers, as authorized by the Company’s regulators. Future decisions of the Commissions will impact the accounting for regulated operations, including decisions about the amount of allowable costs and return on invested capital included in rates, and any refunds that may be required.
While the Company has indicated it expects to recover costs from customers through regulated rates, there is a risk that the Commissions will not approve: (1) full recovery of the costs of providing utility service, (2) full recovery of all amounts invested in the utility business and a reasonable return on that investment or (3) timely recovery of costs incurred. The Company had $2,817.5 million and $1,638.8 million of regulatory assets and liabilities, respectively, as of December 31, 2022.
We identified the impact of rate regulation as a critical audit matter due to the significant judgments made by management to support its assertions about impacted account balances and disclosures and the subjectivity involved in assessing the impact of future regulatory orders on the financial statements. Given that management’s accounting judgments can be based on assumptions about the outcome of future decisions by the Commissions, auditing these judgments required specialized knowledge of accounting for rate regulation and the rate setting process due to its inherent complexities.
How the Critical Audit Matter Was Addressed in the Audit
Our audit procedures related to the uncertainty of future decisions by the Commissions included the following procedures, among others:
| • | We tested the effectiveness of management’s controls over regulatory assets and liabilities, including management’s controls over the identification of costs recorded as regulatory assets and the monitoring and evaluation of regulatory developments that may affect the likelihood of recovering costs in future rates. |
| • | We inquired of Company management and independently obtained and read: (1) relevant regulatory orders issued by the state and federal Commissions for the Company and other public utilities, (2) company filings, (3) filings made by intervenors and (4) other publicly available information to assess the likelihood of recovery in future rates or of a future reduction in rates based on precedents of the Commissions’ treatment of similar costs under similar circumstances. To assess completeness, we evaluated the information obtained and compared it to management’s recorded regulatory asset and liability balances. |
| • | For regulatory matters in process, we inspected the Company’s filings with the Commissions and the filings with the Commissions by intervenors that may impact the Company’s future rates, for any evidence that might contradict management’s assertions. |
| • | We obtained management’s analysis regarding probability of recovery for regulatory assets or refund or future reduction in rates for regulatory liabilities not yet addressed in a regulatory order to assess management’s assertion that amounts are probable of recovery or a future reduction in rates. |
| • | We evaluated the Company’s disclosures related to the impacts of rate regulation, including the balances recorded and regulatory developments. |
![]()
Milwaukee, Wisconsin
February 23, 2023
We have served as the Company’s auditor since 2002.
| A-66 |
MARKET FOR OUR COMMON EQUITY AND RELATED STOCKHOLDER MATTERS
There is no established public trading market for our common stock, as WEC Energy Group owns all of our outstanding common stock. See Note 10, Common Equity, for more information.
DIRECTORS AND EXECUTIVE OFFICERS
DIRECTORS
The information under “Nominees for Election to the Board of Directors” in Wisconsin Electric Power Company’s definitive Information Statement being furnished to stockholders on or about March 28, 2023, and attached hereto, is incorporated herein by reference.
EXECUTIVE OFFICERS
The names and positions as of December 31, 2022 of Wisconsin Electric’s executive officers are listed below.
Scott J. Lauber – Chairman of the Board, President and Chief Executive Officer.
Robert M. Garvin – Executive Vice President - External Affairs of WEC Energy Group.
William J. Guc – Vice President, Controller, and Assistant Corporate Secretary.
Margaret C. Kelsey – Executive Vice President, General Counsel and Corporate Secretary.
Xia Liu – Executive Vice President and Chief Financial Officer.
William Mastoris – Executive Vice President - Customer Service and Operations.
Anthony L. Reese – Vice President and Treasurer.
| Wisconsin Electric Power Company | A-67 | 2022 Annual Financial Statements |