| |
| UNITED STATES |
| SECURITIES AND EXCHANGE COMMISSION |
| Washington, D.C. 20549 |
| |
| FORM N-CSR |
| CERTIFIED SHAREHOLDER REPORT OF REGISTERED MANAGEMENT INVESTMENT |
| COMPANIES |
| |
| Investment Company Act file number 811-00216 | |
| |
| Nicholas High Income Fund, Inc. |
| (Exact Name of Registrant as specified in charter) |
| |
| 700 North Water Street, Milwaukee, Wisconsin 53202 |
| (Address of Principal Executive Offices) | (Zip Code) |
| |
| Jeffrey T. May, Senior Vice President, Secretary and Treasurer |
| 700 North Water Street |
| Milwaukee, Wisconsin 53202 |
| (Name and Address of Agent for Service) |
Registrant's telephone number, including area code: 414-272-4650
Date of fiscal year end: 12/31/2012
Date of reporting period: 12/31/2012
Item 1. Report to Stockholders.
ANNUAL REPORT
December 31, 2012

700 NORTH WATER STREET
MILWAUKEE, WISCONSIN 53202
WWW.NICHOLASFUNDS.COM
NICHOLAS HIGH INCOME FUND, INC.
February 2013
Report to Fellow Shareholders:
Market Overview
The high yield market generated an above expected return for the year ended December 31, 2012. At the start of the year, the majority of investors expressed more subdued expectations for high yield returns due to concerns of only modest economic growth potential and continued struggles over the federal budget. Yet with the continued support from an accommodative Federal Reserve and historically low interest rates, investors continued to place more assets into high yield securities pushing their yields to new all-time lows. The previous historical resistance yield was approximately 7.00%, but once that level was breached, yields fell sharply to 6.13% by year end. For the year, the Bank of America Merrill Lynch (BAML) U.S. High Yield Master II Constrained Index (HY Index) produced a 15.55% total return. This was significantly higher than our outlook and the most optimistic expectations from the beginning of the year.
Consistent with recent years, investors added risk to their portfolios by reaching down in quality in search of additional performance. As shown in the charts below the lower quality bonds generated the best performance over the last 1-, 3-, 5- and 10-years. In most of the periods shown below, high yield securities matched or exceeded the returns of stocks.
| | | | | | | | | | |
| As of: December 31, 2012 | | | | | | | | | | |
| | 2012 | | 2011 | | 2010 | | 2009 | | 2008 | |
| BAML High Yield Bond Indices: | | | | | | | | | | |
| CCC or Lower Index | 20.27 | % | -1.40 | % | 18.42 | % | 96.79 | % | -38.30 | % |
| B – Rated Index | 15.02 | % | 4.65 | % | 13.99 | % | 47.64 | % | -28.02 | % |
| BB – Rated Index | 14.36 | % | 6.12 | % | 14.93 | % | 45.21 | % | -19.20 | % |
| BBB – Rated Index | 11.98 | % | 8.12 | % | 10.88 | % | 31.42 | % | -11.05 | % |
| U.S. Treasury / Agency Master | 2.19 | % | 9.19 | % | 5.61 | % | -2.58 | % | 12.78 | % |
| Equity Indices: | | | | | | | | | | |
| Standard & Poor’s 500 | 16.00 | % | 2.11 | % | 15.06 | % | 26.46 | % | -37.00 | % |
| Russell 2000 | 16.35 | % | -4.18 | % | 26.85 | % | 27.17 | % | -33.79 | % |
| |
| | | | | | Average Annual Total Return | |
| | | | | | 3 Year | | 5 Year | | 10 Year | |
| BAML High Yield Bond Indices: | | | | | | | | | | |
| CCC or Lower Index | | | | | 11.97 | % | 11.25 | % | 14.16 | % |
| B – Rated Index | | | | | 11.11 | % | 7.82 | % | 9.22 | % |
| BB – Rated Index | | | | | 11.72 | % | 10.34 | % | 9.48 | % |
| BBB – Rated Index | | | | | 10.30 | % | 9.42 | % | 7.43 | % |
| U.S. Treasury / Agency Master | | | | | 5.62 | % | 5.30 | % | 4.70 | % |
| Equity Indices: | | | | | | | | | | |
| Standard & Poor’s 500 | | | | | 10.87 | % | 1.66 | % | 7.10 | % |
| Russell 2000 | | | | | 12.25 | % | 3.56 | % | 9.72 | % |
Investor moves to lower quality securities were not that surprising. As valuations and spreads in corporate bonds became more compressed, the best opportunity for
capturing alpha appeared to be in the lowest rated bonds with the widest available spreads. As money flowed into high yield over the course of the year, the down in quality trade was one of the more profitable in 2012. However, as investors look forward, the critical question is whether they are being properly compensated for the risk they are assuming given expected returns. We are cautious regarding the potential future return for the level of risk inherent in these lower quality securities. Our preference is to trade up in relative quality within the high yield market, even if that may require accepting a lower yield.
While the yields on high yield securities have fallen to historical lows, the spreads over government bonds are still fair. That is the bullish argument for investors to remain invested in high yield even at current levels. The HY Index closed 2012 with a spread just above 500 basis points, which is modestly below longer term averages. The high yield market’s near average spread, improving corporate fundamentals and the historical low correlation to government bond returns offer an attractive alternative to income investors in a low interest rate world.
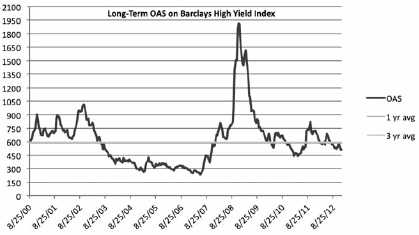
Source: FactSet & Barclays
Outlook
Our outlook for 2013 is more subdued compared to the beginning of 2012. We do not foresee any immediate risk of price decline in the high yield market, but expect a more moderate return this year. History is against the odds of a coupon like return but the combination of low interest rates, a modestly improving economy and generally improving corporate fundamentals should support current valuations. However, current valuations will also be the factor that will limit significant upside to high yield securities. It is our belief that interest rates are at or near their low point with a greater risk of higher interest rates in the future. The Federal Reserve has indicated they will keep short-term interest rates low for the foreseeable future, likely into 2014. But as we near the point where the Fed will begin to extract liquidity, the bond market may begin to anticipate higher yields, as longer term government bonds move up in yield. We are not predicting a specific date or move in rates, but we are acknowledging the
risk of higher rates at some point in the coming years. The high yield market should be able to absorb any initial increase in interest rates as spreads would tighten, resulting in attractive relative performance compared to other fixed income investments. That leaves us in the camp of modest, positive returns for high yield securities in 2013.
Performance
Nicholas High Income Fund – Class I produced a net return of 13.36% for the one-year period ended December 31, 2012. Returns for Nicholas High Income Fund, Inc. – Class I and N and selected indices are provided in the chart below for the periods ended December 31, 2012. The Fund and Morningstar performance data is net of fees, while the BAML Indices are gross of fees.
| | | | | | | | | | | | |
| | | Average Annual Total Return | |
| | | 1 Year | | | 3 Year | | | 5 Year | | | 10 Year | |
| Nicholas High Income Fund, Inc. – Class I | | 13.36 | % | | 10.36 | % | | 7.07 | % | | 7.92 | % |
| Nicholas High Income Fund, Inc. – | | | | | | | | | | | | |
| Class N (linked to Class I) | | 12.96 | % | | 9.92 | % | | 6.75 | % | | 7.52 | % |
| BAML U.S. High Yield Master II | | | | | | | | | | | | |
| Constrained Index | | 15.55 | % | | 11.53 | % | | 10.13 | % | | 10.37 | % |
| BAML U.S. High Yield | | | | | | | | | | | | |
| BB-B Bond Index | | 14.71 | % | | 11.45 | % | | 9.06 | % | | 9.37 | % |
| Morningstar High Yield Bond | | | | | | | | | | | | |
| Funds Category | | 14.67 | % | | 10.49 | % | | 8.02 | % | | 8.86 | % |
| Ending value of $10,000 invested in | | | | | | | | | | | | |
| Nicholas High Income Fund, Inc. – Class I | $ | 11,336 | | $ | 13,440 | | $ | 14,071 | | $ | 21,422 | |
| Ending value of $10,000 invested in | | | | | | | | | | | | |
| Nicholas High Income Fund, Inc. – Class N | $ | 11,296 | | $ | 13,281 | | $ | 13,863 | | $ | 20,652 | |
| Fund’s Class I Expense Ratio (from 04/30/12 Prospectus): 0.72% | | | | | | | | | | |
| Fund’s Class N Expense Ratio (from 01/28/13 Prospectus): 1.03% | | | | | | | | | | |
The Fund’s expense ratios for the period ended December 31, 2012 can be found in the financial highlights included within this report.
Performance data quoted represents past performance and is no guarantee of future results. The investment return and principal value of an investment will fluctuate so that an investor’s shares, when redeemed, may be worth more or less than their original cost. Current performance of the Fund may be lower or higher than the performance quoted. Performance data current to the most recent month-end may be obtained by visiting www.nicholasfunds.com/returns.html.
The ending values above illustrate the performance of a hypothetical $10,000 investment made in the Fund over the timeframes listed. Assumes reinvestment of dividends and capital gains. Returns shown do not reflect the deduction of taxes that a shareholder would pay on Fund distributions or the redemption of Fund shares. These figures do not imply any future performance.
Class N of the Fund commenced operations on February 28, 2005. Class I shares and Class N because both classes of shares are invested in the same portfolio of securities. Annual returns will generally differ only to the extent that the classes do not have the same expenses. Please see the respective prospectus for details.
The returns earned by the Fund are consistent with our investment philosophy and style. The approach has been to identify undervalued securities using rigorous financial analysis to verify that the fundamental outlook is properly aligned with current valuations. An analysis of trends in earnings, EBITDA, leverage and asset coverage are critical for making a sound investment. Security valuation is the primary gatekeeper in deciding whether to add or eliminate a holding from the portfolio. Financially sound companies with fully priced securities do not necessarily represent a good value, while companies that have stumbled financially should not automatically be dismissed as bad investments if we believe the valuations offer a sufficient margin of safety. This process suggests a more conservative approach to investing in high yield bonds, which we believe has the potential to allow for more consistent returns and less downside risk to investors.
We remain committed to the Fund’s long-term strategy, which is based on a process that seeks to identify value opportunities in out-of-favor or poorly followed securities of financially sound companies. Opportunities tend to arise over time in securities of companies that fall temporarily out-of-favor due to specific company or industry issues that may taint the issuers. Often times these companies are in a period of transition or restructuring where market sentiment is overly harsh or negative resulting in an undervalued situation. We are keenly aware that a cheap price alone does not guarantee a good investment; therefore, we seek to identify a catalyst we believe will allow the company and its securities to regain favor and be rewarded with higher valuations. We believe that investing in securities trading below their fair values due to non-fundamental short-term issues, emotion or misunderstanding offers significant long-term potential returns.
Thank you for your investment in the Nicholas High Income Fund.

Lawrence J. Pavelec, CFA
Senior Vice President
Portfolio Manager
The information above represents the opinions of the Fund manager, is subject to change, and any forecasts made cannot be guaranteed.
Mutual fund investing involves risk. Principal loss is possible. Investments in debt securities typically decrease in value when interest rates rise. This risk is usually greater for longer-term debt securities. Investment by the Fund in lower-rated and non-rated securities presents a greater risk of loss to principal and interest than higher-rated securities.
Please refer to the schedule of investments in the report for complete Fund holdings information. Fund holdings and sector allocations are subject to change and should not be considered a recommendation to buy or sell any security.
Current and future portfolio holdings are subject to risk.
Index Definitions – You cannot invest directly in an index.
The Bank of America Merrill Lynch U.S. High Yield Master II Index is a market value-weighted index of all domestic and yankee high-yield bonds, including deferred interest bonds and
payment-in-kind securities. Issues included in the index have maturities of one year or more and have a credit rating lower than BBB-/Baa3, but are not in default. The Bank of America Merrill Lynch U.S. High Yield Master II Constrained Index limits any individual issuer to a maximum of 2% benchmark exposure.
The Bank of America Merrill Lynch U.S. High Yield Index tracks the performance of U.S. dollar denominated below investment grade corporate debt publicly issued in the U.S. domestic market. Qualifying securities must have at least one year remaining term to final maturity, a fixed coupon schedule and a minimum amount outstanding of $250 million.
The Bank of America Merrill Lynch U.S. High Yield BB-B Index is a subset of the Bank of America Merrill Lynch U.S. High Yield Index including all securities rated BB1 through B3.
The Bank of America Merrill Lynch U.S. High Yield BB Index is a subset of the Bank of America Merrill Lynch U.S. High Yield Index including all securities rated BB1 through BB3.
The Bank of America Merrill Lynch U.S. High Yield BBB Index is a subset of the Bank of America Merrill Lynch U.S. High Yield Index including all securities rated BBB1 through BBB3.
The Bank of America Merrill Lynch U.S. High Yield CCC and Lower Rated Index is a subset of the Bank of America Merrill Lynch U.S. High Yield Index including all securities rated CCC1 or lower.
The Bank of America Merrill Lynch U.S. Treasury and Agency Index tracks the performance of U.S. dollar denominated U.S. Treasury and non-subordinated U.S. agency debt issued in the U.S. domestic market. Issues included in the index have maturities of one year or more, have an investment grade rating, a fixed coupon schedule and a minimum amount outstanding of $1 billion for sovereigns and $250 million for agencies.
The Barclays Capital U.S. Corporate High-Yield Bond Index covers the U.S. dollar-denominated, non-investment grade, fixed-rate, taxable corporate bond market.
The Russell 2000 Index measures the performance of the 2000 smallest companies in the Russell 3000 Index, which represents approximately 10% of the total market capitalization of the Russell 3000 Index. The Russell 2000 Growth Index measures the performance of those Russell 2000 companies with higher price-to-book ratios and higher forecasted growth values.
The S&P 500 Index is a broad based unmanaged index of 500 stocks, which is widely recognized as representative of the equity market in general.
Each Morningstar Category average represents a universe of Funds with similar invest objectives.
Alpha – A portfolio’s alpha measures the difference between its actual returns and its expected returns given its risk level as measured by its beta. A positive alpha indicates the portfolio has performed better than its beta would predict, while a negative alpha indicates a portfolio has under-performed given the expectations established by its beta.
Cash Flow – measures the cash generating capability of a company by adding non-cash charges (e.g. depreciation) and interest expense to pretax income.
Correlation – A correlation coefficient is a measure of the interdependence of two random variables that ranges in value from -1 to +1, indicating perfect negative correlation at -1, absence of correlation at zero, and perfect positive correlation at +1.
Duration – a commonly used measure of the potential volatility of the price of a debt security, or the aggregate market value of a portfolio of debt securities, prior to maturity. Securities with a longer duration generally have more volatile prices than securities of comparable quality with a shorter duration.
EBITDA – Earnings Before Interest, Taxes, Depreciation and Amortization.
OAS – Option Adjusted Spread Must be preceded or accompanied by a prospectus.
The Nicholas Funds are distributed by Quasar Distributors, LLC.
The line graph, which follows, compares the initial account value and subsequent account values at the end of each of the most recently completed ten fiscal years of the Fund’s Class I, to the same investment over the same periods in the Bank of America Merrill Lynch U.S. High Yield Master II Constrained Index. The graph assumes a $10,000 investment in the Fund’s Class I and the index at the beginning of the first fiscal year.
COMPARISON OF CHANGE IN VALUE OF $10,000 INVESTMENT IN NICHOLAS HIGH INCOME FUND, INC. CLASS I AND BANK OF AMERICA MERRILL LYNCH U.S. HIGH YIELD MASTER II CONSTRAINED INDEX
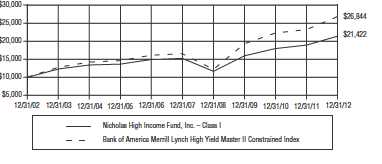
The Fund’s Class I average annual total returns for the one, five and ten year periods ended on the last day of the most recent fiscal year are as follows:
| | | | | | |
| | One Year Ended | | Five Years Ended | | Ten Years Ended | |
| | December 31, | | December 31, | | December 31, | |
| | 2012 | | 2012 | | 2012 | |
| Average Annual Total Return | 13.36 | % | 7.07 | % | 7.92 | % |
Past performance is not predictive of future performance, and the above graph and table do not reflect deduction of taxes that a shareholder would pay on Fund distributions or the redemption of Fund shares.
– 6–
Financial Highlights Class I (NCINX)
For a share outstanding throughout each period
| | | | | | | | | | | | | | | |
| | | | | | Years Ended December 31, | | | | |
| | | 2012 | | | 2011 | | | 2010 | | | 2009 | | | 2008 | |
| NET ASSET VALUE, BEGINNING OF PERIOD | $ | 9.28 | | $ | 9.52 | | $ | 9.09 | | $ | 7.18 | | $ | 10.18 | |
| INCOME (LOSS) FROM | | | | | | | | | | | | | | | |
| INVESTMENT OPERATIONS | | | | | | | | | | | | | | | |
| Net investment income | | .64 | | | .69 | | | .74 | | | .66 | | | .71 | |
| Net gain (loss) on securities | | | | | | | | | | | | | | | |
| (realized and unrealized) | | .58 | | | (.22 | ) | | .41 | | | 1.91 | | | (3.00 | ) |
| Total from investment operations | | 1.22 | | | .47 | | | 1.15 | | | 2.57 | | | (2.29 | ) |
| LESS DISTRIBUTIONS | | | | | | | | | | | | | | | |
| From net investment income | | (.64 | ) | | (.71 | ) | | (.72 | ) | | (.66 | ) | | (.71 | ) |
| NET ASSET VALUE, END OF PERIOD | $ | 9.86 | | $ | 9.28 | | $ | 9.52 | | $ | 9.09 | | $ | 7.18 | |
| |
| TOTAL RETURN | | 13.36 | % | | 4.93 | % | | 12.99 | % | | 36.42 | % | | (23.26 | )% |
| |
| SUPPLEMENTAL DATA: | | | | | | | | | | | | | | | |
| Net assets, end of period (millions) | $ | 103.0 | | $ | 93.8 | | $ | 91.6 | | $ | 88.6 | | $ | 65.2 | |
| Ratio of expenses to average net assets | | .66 | % | | .72 | % | | .74 | % | | .73 | % | | .77 | % |
| Ratio of net investment income | | | | | | | | | | | | | | | |
| to average net assets | | 6.52 | % | | 7.44 | % | | 7.74 | % | | 8.12 | % | | 7.70 | % |
| Portfolio turnover rate | | 62.31 | % | | 61.19 | % | | 78.23 | % | | 88.33 | % | | 61.42 | % |
The accompanying notes to financial statements are an integral part of these highlights.
– 7–
Financial Highlights Class N (NNHIX)
For a share outstanding throughout each period
| | | | | | | | | | | | | | | |
| | | | | | Years Ended December 31, | | | | |
| | | 2012 | | | 2011 | | | 2010 | | | 2009 | | | 2008 | |
| NET ASSET VALUE, BEGINNING OF PERIOD | $ | 9.39 | | $ | 9.64 | | $ | 9.18 | | $ | 7.24 | | $ | 10.06 | |
| INCOME (LOSS) FROM | | | | | | | | | | | | | | | |
| INVESTMENT OPERATIONS | | | | | | | | | | | | | | | |
| Net investment income | | .61 | | | .66 | | | .69 | | | .63 | | | .52 | |
| Net gain (loss) on securities | | | | | | | | | | | | | | | |
| (realized and unrealized) | | .59 | | | (.23 | ) | | .44 | | | 1.94 | | | (2.82 | ) |
| Total from investment operations | | 1.20 | | | .43 | | | 1.13 | | | 2.57 | | | (2.30 | ) |
| LESS DISTRIBUTIONS | | | | | | | | | | | | | | | |
| From net investment income | | (.61 | ) | | (.68 | ) | | (.67 | ) | | (.63 | ) | | (.52 | ) |
| NET ASSET VALUE, END OF PERIOD | $ | 9.98 | | $ | 9.39 | | $ | 9.64 | | $ | 9.18 | | $ | 7.24 | |
| |
| TOTAL RETURN | | 12.96 | % | | 4.45 | % | | 12.56 | % | | 36.15 | % | | (23.33 | )% |
| |
| SUPPLEMENTAL DATA: | | | | | | | | | | | | | | | |
| Net assets, end of period (millions) | $ | 9.3 | | $ | 2.6 | | $ | 3.4 | | $ | 16.2 | | $ | .09 | |
| Ratio of expenses to average net assets | | 1.01 | % | | 1.06 | % | | 1.06 | % | | 1.06 | % | | 1.06 | % |
| Ratio of net investment income | | | | | | | | | | | | | | | |
| to average net assets | | 6.15 | % | | 7.07 | % | | 7.34 | % | | 7.67 | % | | 6.72 | % |
| Portfolio turnover rate | | 62.31 | % | | 61.19 | % | | 78.23 | % | | 88.33 | % | | 61.42 | % |
The accompanying notes to financial statements are an integral part of these highlights.
– 8–
Top Ten Portfolio Issuers
December 31, 2012 (unaudited)
| | |
| | Percentage | |
| Name | of Net Assets | |
| American Axle & Manufacturing, Inc | 2.22 | % |
| Dean Foods Company | 2.02 | % |
| CDW LLC | 1.93 | % |
| Bombardier Inc | 1.91 | % |
| Wok Acquisition Corp | 1.89 | % |
| MGM Resorts International | 1.88 | % |
| ServiceMaster Company (The) | 1.86 | % |
| First Data Corporation | 1.82 | % |
| CKE Restaurants, Inc | 1.74 | % |
| Innovation Ventures, LLC | 1.67 | % |
| Total of top ten | 18.94 | % |
Sector Diversification
(as a percentage of portfolio) December 31, 2012 (unaudited)

– 9–
Fund Expenses
For the six month period ended December 31, 2012 (unaudited)
As a shareholder of the Fund, you incur two types of costs: (1) transaction costs and (2) ongoing costs, including management fees and other operating expenses. The following table is intended to help you understand your ongoing costs (in dollars) of investing in the Fund and to compare these costs with those of other mutual funds.
The example is based on an investment of $1,000 made at the beginning of the period and held for the entire period.
The first line of the table below for each share class of the Fund provides information about the actual account values and actual expenses. You may use the information in this line, together with the amount you invested, to estimate the expenses that you paid over the period. Simply divide your account value by $1,000 (for example, an $8,600 account value divided by $1,000 = 8.6), then multiply the result by the number in the first line under the heading entitled “Expenses Paid During Period” to estimate the expenses you paid on your account during this period.
The second line of the table below provides information about hypothetical account values and hypothetical expenses based on the Fund’s actual expense ratios for each class of the Fund and an assumed rate of return of 5% per year before expenses, which are not the Fund’s actual returns. The hypothetical account values and expenses may not be used to estimate the actual ending account balance or expenses you paid for the period. You may use this information to compare the ongoing costs of investing in the Fund with other funds. To do so, compare this 5% hypothetical example with the 5% hypothetical examples that appear in the shareholder reports of other funds.
Please note that the expenses shown in the table are meant to highlight your ongoing costs only and do not reflect any transactional costs, such as wire fees. Therefore, the second line of the table is useful in comparing ongoing costs only, and will not help you determine the relative total costs of owning different funds. In addition, if these transactional costs were included, your costs would have been higher.
| | | | | | |
| Class I | | | | | | |
| | | Beginning | | Ending | | Expenses |
| | | Account | | Account | | Paid During |
| | | Value | | Value | | Period* |
| | | 06/30/12 | | 12/31/12 | | 07/01/12 - 12/31/12 |
| Actual | $ | 1,000.00 | $ | 1,058.20 | $ | 3.27 |
| Hypothetical | | 1,000.00 | | 1,021.82 | | 3.21 |
| (5% return before expenses) | | | | | | |
| * | Expenses are equal to the Class I six-month annualized expense ratio of 0.63%, multiplied by the average account value over the period, multiplied by 184 then divided by 365 to reflect the one- half year period. |
– 10 –
Fund Expenses (continued)
For the six month period ended December 31, 2012 (unaudited)
| | | | | | |
| Class N | | | | | | |
| | | Beginning | | Ending | | Expenses |
| | | Account | | Account | | Paid During |
| | | Value | | Value | | Period** |
| | | 06/30/12 | | 12/31/12 | | 07/01/12 - 12/31/12 |
| Actual | $ | 1,000.00 | $ | 1,055.90 | $ | 5.13 |
| Hypothetical | | 1,000.00 | | 1,020.01 | | 5.04 |
| (5% return before expenses) | | | | | | |
| ** | Expenses are equal to the Class N six-month annualized expense ratio of 0.99%, multiplied by the average account value over the period, multiplied by 184 then divided by 365 to reflect the one-half year period. |
– 11 –
Schedule of Investments
December 31, 2012
| | | | | |
| | Shares or | | | | |
| | Principal | | | | |
| | Amount | | | | Value |
| NON-CONVERTIBLE BONDS — 89.42% | | | |
| | | Automotive – Parts & Equipment — 2.86% | | |
| $ | 400,000 | American Axle & Manufacturing Holdings, Inc. | | |
| | | 144A restricted 9.25%, 01/15/17 | | $ | 444,000 |
| | 1,000,000 | American Axle & Manufacturing, Inc. 7.875%, 03/01/17 | | 1,035,000 |
| | 1,000,000 | American Axle & Manufacturing, Inc. 6.625%, 10/15/22 | | 1,015,000 |
| | 675,000 | Visteon Corporation 6.75%, 04/15/19 | | 718,875 |
| | | | | | 3,212,875 |
| | | Banking — 1.63% | | | |
| | 1,000,000 | Ausdrill Finance Pty Ltd 6.875%, 11/01/19 | | 990,000 |
| | 1,000,000 | BAC Capital Trust XIV Floating Rate Preferred Hybrid | | |
| | | Income Term Securities 4.00%, 09/29/49(1) | | 845,160 |
| | | | | | 1,835,160 |
| | | Basic Industry – Building Materials — 1.89% | | |
| | 500,000 | Associated Materials, LLC 9.125%, 11/01/17 | | 507,500 |
| | 1,045,000 | CEMEX, S.A.B. de C.V. 144A restricted, | | |
| | | Floating Rate Senior Notes 5.311%, 09/30/15(2) | | 1,058,062 |
| | 500,000 | USG Corporation 144A restricted, 7.875%, 03/30/20 | | 556,250 |
| | | | | | 2,121,812 |
| | | Basic Industry – Forestry & Paper — 1.90% | | |
| | 1,500,000 | Cascades Inc. 7.75%, 12/15/17 | | | 1,586,250 |
| | 500,000 | Potlatch Corporation 144A restricted, 7.50%, 11/01/19 | | 543,750 |
| | | | | | 2,130,000 |
| | | Basic Industry – Metal/Mining Excluding Steel — 2.80% | | |
| | 250,000 | American Rock Salt Company LLC 144A restricted, 8.25%, 05/01/18 | | 226,250 |
| | 500,000 | Cloud Peak Energy Resources LLC 8.25%, 12/15/17 | | 535,000 |
| | 500,000 | Cloud Peak Energy Resources LLC 8.50%, 12/15/19 | | 548,750 |
| | 1,750,000 | FMG Resources Pty Ltd 144A restricted, 7.00%, 11/01/15 | | 1,837,500 |
| | | | | | 3,147,500 |
| | | Basic Industry – Steel Producers & Products — 0.47% | | |
| | 500,000 | United States Steel Corporation 7.375%, 04/01/20 | | 533,750 |
| | | Capital Goods – Aerospace & Defense — 3.09% | | |
| | 1,000,000 | Bombardier Inc. 144A restricted, 7.50%, 03/15/18 | | 1,113,750 |
| | 1,000,000 | Bombardier Inc. 144A restricted, 5.75%, 03/15/22 | | 1,027,500 |
| | 1,250,000 | ManTech International Corporation 7.25%, 04/15/18 | | 1,328,125 |
| | | | | | 3,469,375 |
| | | Capital Goods – Diversified — 0.95% | | |
| | 1,000,000 | Park-Ohio Industries, Inc. 8.125%, 04/01/21 | | 1,062,500 |
| | | Capital Goods – Machinery — 0.67% | | |
| | 750,000 | Manitowoc Company, Inc. (The) 5.875%, 10/15/22 | | 750,000 |
The accompanying notes to financial statements are an integral part of this schedule.
– 12 –
Schedule of Investments (continued)
December 31, 2012
| | | | |
| | Shares or | | | |
| | Principal | | | |
| | Amount | | | Value |
| | NON-CONVERTIBLE BONDS — 89.42% (continued) | | |
| | | Capital Goods – Packaging — 2.23% | | |
| $ | 1,000,000 | Berry Plastics Corporation 9.50%, 05/15/18 | $ | 1,100,000 |
| | 1,250,000 | Sealed Air Corporation 144A restricted, 8.125%, 09/15/19 | | 1,406,250 |
| | | | | 2,506,250 |
| | | Consumer Cyclical – Apparel and Textiles — 0.97% | | |
| | 1,000,000 | Levi Strauss & Co. 7.625%, 05/15/20 | | 1,090,000 |
| | | Consumer Cyclical – Household & Leisure Products — 0.92% | | |
| | 1,000,000 | Tempur-Pedic International Inc. | | |
| | | 144A restricted, 6.875%, 12/15/20 | | 1,028,750 |
| | | Consumer Cyclical – Restaurants — 4.89% | | |
| | 1,696,000 | CKE Restaurants, Inc. 11.375%, 07/15/18 | | 1,950,400 |
| | 1,220,000 | NPC International, Inc. 10.50%, 01/15/20 | | 1,415,200 |
| | 2,000,000 | Wok Acquisition Corp. 144A restricted, 10.25%, 06/30/20 | | 2,127,500 |
| | | | | 5,493,100 |
| | | Consumer Cyclical – Specialty Retail — 1.88% | | |
| | 1,000,000 | J.Crew Group, Inc. 8.125%, 03/01/19 | | 1,057,500 |
| | 500,000 | Pantry, Inc. (The) 144A restricted, 8.375%, 08/01/20 | | 522,500 |
| | 500,000 | Toys “R” Us Property Company II, LLC 8.50%, 12/01/17 | | 530,000 |
| | | | | 2,110,000 |
| | | Consumer Non-Cyclical – Beverage — 1.67% | | |
| | 2,000,000 | Innovation Ventures, LLC 144A restricted, 9.50%, 08/15/19 | | 1,880,000 |
| | | Consumer Non-Cyclical – Food-Wholesale — 5.18% | | |
| | 1,500,000 | Dean Foods Company 9.75%, 12/15/18 | | 1,725,000 |
| | 500,000 | Dean Foods Company 7.00%, 06/01/16 | | 548,750 |
| | 1,513,000 | Pinnacle Foods Finance LLC 9.25%, 04/01/15 | | 1,535,695 |
| | 1,500,000 | Post Holdings, Inc. 144A restricted, 7.375%, 02/15/22 | | 1,643,438 |
| | 350,000 | Shearer’s Foods, LLC and Chip Finance Corp. | | |
| | | 144A restricted, 9.00%, 11/01/19 | | 367,500 |
| | | | | 5,820,383 |
| | | Consumer Non-Cyclical – Products — 1.44% | | |
| | 1,500,000 | Libbey Glass Inc. 6.875%, 05/15/20 | | 1,612,500 |
| | | Energy – Exploration & Production — 5.46% | | |
| | 1,000,000 | Cimarex Energy Co. 5.875%, 05/01/22 | | 1,095,000 |
| | 1,000,000 | Forest Oil Corporation 7.25%, 06/15/19 | | 1,005,000 |
| | 250,000 | Forest Oil Corporation 144A restricted, 7.50%, 09/15/20 | | 262,500 |
| | 500,000 | Halcon Resources Corporation 144A restricted, 8.875%, 05/15/21 | | 530,000 |
| | 1,500,000 | LINN Energy, LLC 8.625%, 04/15/20 | | 1,635,000 |
| | 500,000 | SandRidge Energy, Inc. 144A restricted, 8.00%, 06/01/18 | | 530,000 |
The accompanying notes to financial statements are an integral part of this schedule.
– 13 –
Schedule of Investments (continued)
December 31, 2012
| | | | |
| | Shares or | | | |
| | Principal | | | |
| | Amount | | | Value |
| | NON-CONVERTIBLE BONDS — 89.42% (continued) | | |
| | | Energy – Exploration & Production — 5.46% (continued) | | |
| $ | 1,000,000 | Stone Energy Corporation 8.625%, 02/01/17 | $ | 1,073,750 |
| | | | | 6,131,250 |
| | | Energy – Oil Field Equipment & Services — 5.44% | | |
| | 1,500,000 | CHC Helicopter S.A. 9.25%, 10/15/20 | | 1,578,750 |
| | 1,500,000 | Chesapeake Oilfield Operating, L.L.C. | | |
| | | 144A restricted, 6.625%, 11/15/19 | | 1,413,750 |
| | 500,000 | Hercules Offshore, Inc. 144A restricted, 10.50%, 10/15/17 | | 538,750 |
| | 500,000 | Offshore Group Investment Limited 144A restricted, 7.50%, 11/01/19 | | 505,000 |
| | 925,000 | Parker Drilling Company 9.125%, 04/01/18 | | 987,438 |
| | 500,000 | Petroleum Geo-Services ASA 144A restricted, 7.375%, 12/15/18 | | 540,000 |
| | 500,000 | Pioneer Drilling Company 9.875%, 03/15/18 | | 543,750 |
| | | | | 6,107,438 |
| | | Energy – Oil Refining & Marketing — 1.01% | | |
| | 1,000,000 | Tesoro Corporation 9.75%, 06/01/19 | | 1,140,000 |
| | | Financial Services – Brokerage — 1.16% | | |
| | 1,250,000 | Oppenheimer Holdings Inc. 8.75%, 04/15/18 | | 1,300,000 |
| | | Financial Services – Investments & | | |
| | | Miscellaneous Financial Services — 1.38% | | |
| | 1,000,000 | Neuberger Berman Group LLC 144A restricted, 5.625%, 03/15/20 | | 1,047,500 |
| | 500,000 | Nuveen Investments, Inc. 9.50%, 10/15/20 | | 497,500 |
| | | | | 1,545,000 |
| | | Financials – Consumer, Commercial & Lease Financing — 0.71% | | |
| | 750,000 | International Lease Finance Corporation 6.25%, 05/15/19 | | 798,750 |
| | | Healthcare – Facilities — 3.58% | | |
| | 750,000 | American Renal Holdings Inc. 8.375%, 05/15/18 | | 789,375 |
| | 500,000 | Apria Healthcare Group Inc. 12.375%, 11/01/14 | | 495,000 |
| | 1,000,000 | Apria Healthcare Group Inc. 11.25%, 11/01/14 | | 1,033,750 |
| | 1,600,000 | Sabra Health Care Limited Partnership 8.125%, 11/01/18 | | 1,706,000 |
| | | | | 4,024,125 |
| | | Healthcare – Medical Products — 2.03% | | |
| | 850,000 | Fresenius Medical Care US Finance II, Inc. | | |
| | | 144A restricted, 5.625%, 07/31/19 | | 912,688 |
| | 750,000 | Physio-Control International, Inc. | | |
| | | 144A restricted, 9.875%, 01/15/19 | | 823,125 |
| | 500,000 | Teleflex Incorporated 6.875%, 06/01/19 | | 540,000 |
| | | | | 2,275,813 |
The accompanying notes to financial statements are an integral part of this schedule.
– 14 –
Schedule of Investments (continued)
December 31, 2012
| | | | |
| | Shares or | | | |
| | Principal | | | |
| | Amount | | | Value |
| | NON-CONVERTIBLE BONDS — 89.42% (continued) | | |
| | | Healthcare – Pharmaceuticals — 0.97% | | |
| $ | 1,000,000 | Valeant Pharmaceuticals International, Inc. | | |
| | | 144A restricted, 7.00%, 10/01/20 | $ | 1,087,500 |
| | | Media – Cable — 0.95% | | |
| | 1,000,000 | UPCB Finance III Limited 144A restricted, 6.625%, 07/01/20 | | 1,071,250 |
| | | Media – Printing & Publishing — 0.89% | | |
| | 500,000 | Deluxe Corporation 144A restricted, 6.00%, 11/15/20 | | 496,250 |
| | 500,000 | Scholastic Corporation 5.00%, 04/15/13 | | 501,875 |
| | | | | 998,125 |
| | | Media – Services — 0.23% | | |
| | 250,000 | Lamar Media Corp. 144A restricted, 5.00%, 05/01/23 | | 256,875 |
| | | Services – Gaming — 4.44% | | |
| | 500,000 | Boyd Gaming Corporation 9.125%, 12/01/18 | | 510,000 |
| | 1,000,000 | Caesars Entertainment Operating Company, Inc. 8.50%, 02/15/20 | | 992,500 |
| | 500,000 | Harrah’s Operating Company, Inc. 10.00%, 12/15/18 | | 331,250 |
| | 1,000,000 | MGM Resorts International 8.625%, 02/01/19 | | 1,115,000 |
| | 1,000,000 | MGM Resorts International 6.625%, 12/15/21 | | 1,000,000 |
| | 1,000,000 | Scientific Games International, Inc. | | |
| | | 144A restricted, 6.25%, 09/01/20 | | 1,032,500 |
| | | | | 4,981,250 |
| | | Services – Hotels — 0.92% | | |
| | 500,000 | FelCor Escrow Holdings, L.L.C. 6.75%, 06/01/19 | | 531,250 |
| | 500,000 | FelCor Lodging Limited Partnership | | |
| | | 144A restricted, 5.625%, 03/01/23 | | 497,500 |
| | | | | 1,028,750 |
| | | Services – Leisure — 1.33% | | |
| | 1,500,000 | Six Flags Entertainment Corporation 144A restricted, 5.25%, 01/15/21 | | 1,500,000 |
| | | Services – Railroads — 1.42% | | |
| | 1,500,000 | Florida East Coast Railway Corp. 144A restricted, 8.125%, 02/01/17 | | 1,590,000 |
| | | Services – Support & Services — 4.20% | | |
| | 500,000 | APX Group, Inc. 144A restricted, 6.375%, 12/01/19 | | 495,625 |
| | 1,000,000 | Interactive Data Corporation 10.25%, 08/01/18 | | 1,122,500 |
| | 1,000,000 | Iron Mountain Incorporated 5.75%, 08/15/24 | | 1,012,500 |
| | 2,000,000 | ServiceMaster Company (The) 8.00%, 02/15/20 | | 2,085,000 |
| | | | | 4,715,625 |
| | | Services – Theaters & Entertainment — 0.88% | | |
| | 900,000 | NAI Entertainment Holdings LLC 144A restricted, 8.25%, 12/15/17 | | 991,125 |
| | | Services – Transportation Excluding Air & Rail — 0.98% | | |
| | 1,000,000 | Swift Services Holdings, Inc. 10.00%, 11/15/18 | | 1,097,500 |
The accompanying notes to financial statements are an integral part of this schedule.
– 15 –
Schedule of Investments (continued)
December 31, 2012
| | | | |
| | Shares or | | | |
| | Principal | | | |
| | Amount | | | Value |
| | NON-CONVERTIBLE BONDS — 89.42% (continued) | | |
| | | Technology & Electronics – Software & Services — 5.08% | | |
| $ | 2,000,000 | First Data Corporation 9.875%, 09/24/15 | $ | 2,040,000 |
| | 1,500,000 | GXS Worldwide, Inc. 9.75%, 06/15/15 | | 1,563,750 |
| | 1,000,000 | iGATE Corporation 9.00%, 05/01/16 | | 1,083,750 |
| | 1,000,000 | SunGard Data Systems Inc. 144A restricted, 6.625%, 11/01/19 | | 1,022,500 |
| | | | | 5,710,000 |
| | Technology & Electronics – Telecommunications Equipment — 3.39% | | |
| | 2,000,000 | CDW LLC 8.50%, 04/01/19 | | 2,165,000 |
| | 1,500,000 | CommScope, Inc. 144A restricted, 8.25%, 01/15/19 | | 1,642,500 |
| | | | | 3,807,500 |
| | | Telecommunications – Integrated & Services — 6.63% | | |
| | 809,000 | Cincinnati Bell Inc. 8.375%, 10/15/20 | | 875,742 |
| | 500,000 | CyrusOne LP 144A restricted, 6.375%, 11/15/2022 | | 521,250 |
| | 1,000,000 | Frontier Communications Corporation 8.50%, 04/15/20 | | 1,150,000 |
| | 1,500,000 | Intelsat Jackson Holdings S.A. 7.25%, 04/01/19 | | 1,612,500 |
| | 500,000 | PAETEC Holding Corp. 8.875%, 06/30/17 | | 536,250 |
| | 1,000,000 | Windstream Corporation 7.50%, 04/01/23 | | 1,052,500 |
| | 500,000 | Zayo Group, LLC 8.125%, 01/01/20 | | 556,250 |
| | 1,000,000 | Zayo Group, LLC 10.125%, 07/01/20 | | 1,137,500 |
| | | | | 7,441,992 |
| | | Utility – Electric-Generation — 0.90% | | |
| | 900,000 | Calpine Corporation 144A restricted, 7.875%, 07/31/20 | | 1,010,250 |
| | | TOTAL NON-CONVERTIBLE BONDS | | |
| | | (cost $96,745,520) | | 100,414,073 |
| | COMMON STOCKS — 2.08% | | |
| | | Financials – Real Estate — 2.02% | | |
| | 23,500 | Hospitality Properties Trust | | 550,370 |
| | 25,000 | National Retail Properties, Inc | | 780,000 |
| | 98,741 | Summit Hotel Properties, Inc | | 938,039 |
| | | | | 2,268,409 |
| | | Other — 0.06% | | |
| | 500 | iShares iBoxx $ High Yield Corporate Bond Fund(3) | | 46,675 |
| | 500 | SPDR Barclays Capital High Yield Bond ETF(3) | | 20,350 |
| | | | | 67,025 |
| | | TOTAL COMMON STOCKS | | |
| | | (cost $2,249,244) | | 2,335,434 |
The accompanying notes to financial statements are an integral part of this schedule.
– 16 –
Schedule of Investments (continued)
December 31, 2012
| | | | |
| | Shares or | | | |
| | Principal | | | |
| | Amount | | | Value |
| | CONVERTIBLE PREFERRED STOCK — 1.09% | | |
| | | Financials – Banks — 1.09% | | |
| | 1,000 | Wachovia Corporation 7.50% Non-Cumulative | | |
| | | Perpetual Convertible Preferred Stock, Series L | | |
| | | (cost $1,007,500) | $ | 1,225,000 |
| SHORT-TERM INVESTMENTS — 5.58% | | |
| | | Commercial Paper — 3.85% | | |
| $ | 1,000,000 | CVS Corporation 0.28%, 01/02/13 | | 1,000,000 |
| | 350,000 | General Mills, Inc. 0.24%, 01/02/13 | | 350,000 |
| | 900,000 | VW Credit, Inc. 0.30%, 01/02/13 | | 900,000 |
| | 1,425,000 | Vectren Utility Holdings, Inc. 0.27%, 01/04/13 | | 1,424,979 |
| | 650,000 | Pentair Finance S.A. 0.40%, 01/07/13 | | 649,964 |
| | | | | 4,324,943 |
| | | Variable Rate Security — 1.73% | | |
| | 1,946,229 | Fidelity Institutional Money Market Fund – Class I | | 1,946,229 |
| | | TOTAL SHORT-TERM INVESTMENTS | | |
| | | (cost $6,271,172) | | 6,271,172 |
| | | TOTAL INVESTMENTS | | |
| | | (cost $106,273,436) — 98.17% | | 110,245,679 |
| | | OTHER ASSETS, NET OF LIABILITIES — 1.83% | | 2,051,739 |
| | | TOTAL NET ASSETS | | |
| | | (basis of percentages disclosed above) — 100% | $ | 112,297,418 |
| (1) | The greater of (i) 3-month LIBOR plus 0.40% and (ii) 4.00%; such rate being reset quarterly. |
| (2) | Resets quarterly, equal to three-month LIBOR plus 5.00%. |
| (3) | Exchange traded fund. |
The accompanying notes to financial statements are an integral part of this schedule.
– 17 –
Statement of Assets and Liabilities
December 31, 2012
| | | |
| ASSETS | | | |
| Investments in securities at value (cost $106,273,436) | $ | 110,245,679 | |
| Receivables — | | | |
| Investment securities sold | | 353,930 | |
| Dividend and interest | | 1,791,434 | |
| Capital stock subscription | | 359 | |
| Total receivables | | 2,145,723 | |
| Other | | 6,976 | |
| Total assets | | 112,398,378 | |
| LIABILITIES | | | |
| Payables — | | | |
| Due to adviser — | | | |
| Management fee | | 39,852 | |
| Accounting and administrative fee | | 4,235 | |
| Total due to adviser | | 44,087 | |
| 12b-1 and servicing fee | | 12,513 | |
| Other payables and accrued expense | | 44,360 | |
| Total liabilities | | 100,960 | |
| Total net assets | $ | 112,297,418 | |
| |
| NET ASSETS CONSIST OF | | | |
| Paid in capital | $ | 118,473,906 | |
| Net unrealized appreciation on investments | | 3,972,243 | |
| Accumulated net realized loss on investments | | (10,181,031 | ) |
| Accumulated undistributed net investment income | | 32,300 | |
| Total net assets | $ | 112,297,418 | |
| |
| Class I: | | | |
| Net assets | $ | 102,982,751 | |
| Shares outstanding | | 10,444,637 | |
| NET ASSET VALUE PER SHARE ($.05 par value, 75,000,000 | | | |
| shares authorized), offering price and redemption price | $ | 9.86 | |
| |
| Class N: | | | |
| Net assets | $ | 9,314,667 | |
| Shares outstanding | | 933,172 | |
| NET ASSET VALUE PER SHARE ($.05 par value, 25,000,000 | | | |
| shares authorized), offering price and redemption price | $ | 9.98 | |
The accompanying notes to financial statements are an integral part of this statement.
– 18 –
| | |
| Statement of Operations | | |
| For the year ended December 31, 2012 | | |
| |
| INCOME | | |
| Interest | $ | 7,740,450 |
| Dividend | | 243,731 |
| Other | | 135,590 |
| Total income | | 8,119,771 |
| |
| EXPENSES | | |
| Management fee | | 487,648 |
| Transfer agent fees | | 52,860 |
| Accounting and administrative fees | | 50,000 |
| Registration fees | | 39,091 |
| Audit and tax fees | | 28,500 |
| Accounting system and pricing service fees | | 26,446 |
| 12b-1 fees – Class N | | 23,403 |
| Printing | | 12,892 |
| Directors’ fees | | 12,500 |
| Legal fees | | 9,830 |
| Servicing fees – Class N | | 9,361 |
| Postage and mailing | | 6,458 |
| Custodian fees | | 5,817 |
| Insurance | | 5,392 |
| Other operating expenses | | 5,940 |
| Total expenses | | 776,138 |
| Net Investment income | | 7,343,633 |
| |
| NET REALIZED GAIN ON INVESTMENTS | | 1,419,152 |
| |
| CHANGE IN NET UNREALIZED APPRECIATION/DEPRECIATION | | |
| ON INVESTMENTS | | 5,039,135 |
| Net realized and unrealized gain on investments | | 6,458,287 |
| Net increase in net assets resulting from operations | $ | 13,801,920 |
The accompanying notes to financial statements are an integral part of this statement.
– 19 –
Statements of Changes in Net Assets
For the years ended December 31, 2012 and 2011
| | | | | | |
| | | 2012 | | | 2011 | |
| INCREASE (DECREASE) IN | | | | | | |
| NET ASSETS FROM OPERATIONS | | | | | | |
| Net investment income | $ | 7,343,633 | | $ | 7,178,781 | |
| Net realized gain on investments | | 1,419,152 | | | 1,770,664 | |
| Change in net unrealized | | | | | | |
| appreciation/depreciation on investments | | 5,039,135 | | | (4,190,756 | ) |
| Net increase in net assets resulting | | | | | | |
| from operations | | 13,801,920 | | | 4,758,689 | |
| |
| DISTRIBUTIONS TO SHAREHOLDERS | | | | | | |
| From net investment income – Class I | | (6,721,823 | ) | | (6,944,280 | ) |
| From net investment income – Class N | | (650,602 | ) | | (235,707 | ) |
| Total distributions | | (7,372,425 | ) | | (7,179,987 | ) |
| |
| CAPITAL SHARE TRANSACTIONS | | | | | | |
| Proceeds from shares issued – Class I | | | | | | |
| (3,114,137 and 1,574,038 shares, respectively) | | 30,014,304 | | | 15,100,736 | |
| Reinvestment of distributions – Class I | | | | | | |
| (607,693 and 632,406 shares, respectively) | | 5,929,442 | | | 6,016,331 | |
| Cost of shares redeemed – Class I | | | | | | |
| (3,380,902 and 1,723,488 shares, respectively) | | (32,901,123 | ) | | (16,612,574 | ) |
| Proceeds from shares issued – Class N | | | | | | |
| (2,446,544 and 1,256,593 shares, respectively) | | 23,970,255 | | | 12,289,451 | |
| Reinvestment of distributions – Class N | | | | | | |
| (64,626 and 24,268 shares, respectively) | | 638,248 | | | 235,179 | |
| Cost of shares redeemed – Class N | | | | | | |
| (1,854,905 and 1,354,193 shares, respectively) | | (18,182,494 | ) | | (13,213,172 | ) |
| Change in net assets derived from | | | | | | |
| capital share transactions | | 9,468,632 | | | 3,815,951 | |
| Total increase in net assets | | 15,898,127 | | | 1,394,653 | |
| |
| NET ASSETS | | | | | | |
| Beginning of period | | 96,399,291 | | | 95,004,638 | |
| End of period (including accumulated | | | | | | |
| undistributed net investment income of | | | | | | |
| $32,300 and $61,092, respectively) | $ | 112,297,418 | | $ | 96,399,291 | |
The accompanying notes to financial statements are an integral part of these statements.
– 20 –
Notes to Financial Statements
December 31, 2012
(1) Summary of Significant Accounting Policies —
Nicholas High Income Fund, Inc. (the “Fund”) is organized as a Maryland corporation and is registered as an open-end, diversified management investment company under the Investment Company Act of 1940, as amended. The primary objective of the Fund is high current income consistent with the preservation and conservation of capital values. The following is a summary of the significant accounting policies of the Fund: (a) Equity securities traded on a stock exchange will ordinarily be valued on the basis of the last sale price on the date of valuation on the securities principal exchange, or if in the absence of any sale on that day, the closing bid price. For securities principally traded on the NASDAQ market, the Fund uses the NASDAQ Official Closing Price. Debt securities, excluding short-term investments, are valued at their current evaluated bid price as determined by an independent pricing service, which generates evaluations on the basis of dealer quotes for normal institutional-sized trading units, issuer analysis, bond market activity and various other factors.
Securities for which market quotations may not be readily available are valued at their fair value as determined in good faith by procedures adopted by the Board of Directors. Variable rate demand notes are valued at cost, which approximates market value. U.S. Treasury Bills and commercial paper are stated at amortized cost, which approximates market value. The Fund did not maintain any positions in derivative instruments or engage in hedging activities during the year. Investment transactions for financial statement purposes are recorded on trade date.
In accordance with Accounting Standards Codification (“ASC”) 820-10, “Fair Value Measurements and Disclosures” (“ASC 820-10”), fair value is defined as the price that the Fund would receive upon selling an investment in a timely transaction to an independent buyer in the principal or most advantageous market of the investment. ASC 820-10 established a three-tier hierarchy to maximize the use of observable market data and minimize the use of unobservable inputs and to establish classification of fair value measurements for disclosure purposes. Inputs refer broadly to the assumptions that market participants would use in pricing the asset or liability, including assumptions about risk, for example, the risk inherent in a particular valuation technique used to measure fair value such as a pricing model and/or the risk inherent in the inputs to the valuation technique. Inputs may be observable or unobservable. Observable inputs are inputs that reflect the assumptions market participants would use in pricing the asset or liability based on market data obtained from sources independent of the reporting entity. Unobservable inputs are inputs that reflect the reporting entity’s own assumptions about the assumptions market participants would use in pricing the asset or liability based on the best information available in the circumstances. The three-tier hierarchy of inputs is summarized in the three broad levels listed below.
Level 1 – quoted prices in active markets for identical investments
Level 2 – other significant observable inputs (including quoted prices for similar investments, interest rates, benchmark yields, bids, offers, transactions, spreads and other relationships observed in the
– 21 –
Notes to Financial Statements (continued)
December 31, 2012
markets among market securities, underlying equity of the issuer, proprietary pricing models, credit risk, etc.)
Level 3 – significant unobservable inputs (including the Fund’s own assumptions in determining the fair value of investments) The inputs or methodology used for valuing securities are not necessarily an indication of the risk associated with investing in those securities.
The following is a summary of the inputs used as of December 31, 2012 in valuing the Fund’s investments carried at value:
| | |
| | | Investments |
| Valuation Inputs | | in Securities |
| Level 1 – | | |
| Common Stocks(1) | $ | 2,335,434 |
| Convertible Preferred Stock(1) | | 1,225,000 |
| Variable Rate Security | | 1,946,229 |
| Level 2 – | | |
| Non-Convertible Bonds(1) | | 100,414,073 |
| Commercial Paper | | 4,324,943 |
| Level 3 – | | |
| None | | — |
| Total | $ | 110,245,679 |
| (1) See Schedule of Investments for further detail by industry. | | |
There were no transfers between levels during the year ended December 31, 2012 and the Fund did not hold any Level 3 investments during the year.
(b) Net realized gain (loss) on portfolio securities was computed on the basis of specific identification.
(c) Dividend income is recorded on the ex-dividend date, and interest income is recognized on an accrual basis. Non-cash dividends, if any, are recorded at value on date of distribution. Generally, discounts and premiums on long-term debt security purchases, if any, are amortized over the expected lives of the respective securities using the effective yield method.
(d) Provision has not been made for federal income taxes or excise taxes since the Fund has elected to be taxed as a “regulated investment company” and intends to distribute substantially all net investment income and net realized capital gains on sales of investments to its shareholders and otherwise comply with the provisions of Subchapter M of the Internal Revenue Code applicable to regulated investment companies.
Investment income, net capital gains (losses) and all expenses incurred by the Fund are allocated based on the relative net assets of each class, except for service fees and certain other fees and expenses related to one class of shares.
Class N shares are subject to a 0.25% 12b-1 fee and a 0.10% servicing fee, as described in its prospectus. Income, expenses (other than expenses attributable to
– 22 –
Notes to Financial Statements (continued)
December 31, 2012
a specific class), and realized and unrealized gains and losses are allocated daily to each class of shares based upon the relative net asset value of outstanding shares.
(e) Dividends and distributions paid to shareholders are recorded on the ex-dividend date. Distributions from net investment income are generally declared and paid at least quarterly. Distributions of net realized capital gain, if any, are declared and paid at least annually.
The amount of distributions from net investment income and net realized capital gain are determined in accordance with federal income tax regulations, which may differ from U.S. generally accepted accounting principles (“U.S. GAAP”) for financial reporting purposes. Financial reporting records are adjusted for permanent book-to-tax differences to reflect tax character. At December 31, 2012, no reclassifications were recorded.
The tax character of distributions paid during the years ended December 31 was as follows:
| | | | |
| | | 12/31/2012 | | 12/31/2011 |
| Distributions paid from: | | | | |
| Ordinary income | $ | 7,372,425 | $ | 7,179,987 |
As of December 31, 2012, investment cost for federal tax purposes was $106,273,436 and the tax basis components of net assets were as follows:
| | | |
| Unrealized appreciation | $ | 4,573,875 | |
| Unrealized depreciation | | (601,632 | ) |
| Net unrealized appreciation | | 3,972,243 | |
| Undistributed ordinary income | | 32,300 | |
| Accumulated net realized capital loss | | (10,181,031 | ) |
| Paid in capital | | 118,473,906 | |
| Net assets | $ | 112,297,418 | |
There were no differences between the book-basis and tax-basis components of net assets.
The Fund utilized approximately $1,277,000 of capital loss carryforwards during fiscal 2012. As of December 31, 2012, the Fund has capital loss carryforwards of approximately $10,181,000, which expire as follows: $3,347,000 in 2016, and $6,834,000 in 2017. To the extent the Fund has future net realized capital gains, distributions of capital gains to shareholders will be offset by any unused capital loss carryforward.
The Fund had no material uncertain tax positions and has not recorded a liability for unrecognized tax benefits as of December 31, 2012. Also, the Fund recognized no interest and penalties related to uncertain tax benefits during the same period. At December 31, 2012, the fiscal years 2009 through 2012 remain open to examination in the Fund’s major tax jurisdictions.
– 23 –
Notes to Financial Statements (continued)
December 31, 2012
(f) The preparation of financial statements in conformity with U.S. GAAP requires management to make estimates and assumptions that affect the amounts reported in the financial statements and accompanying notes. Actual results could differ from estimates.
(g) In the normal course of business the Fund enters into contracts that contain general indemnification clauses. The Fund’s maximum exposure under these arrangements is unknown, as this would involve future claims against the Fund that have not yet occurred. Based on experience, the Fund expects the risk of loss to be remote.
(h) In connection with the preparation of the Fund’s financial statements, management evaluated subsequent events after the date of the Statement of Assets and Liabilities of December 31, 2012. There have been no significant subsequent events since December 31, 2012 that would require adjustment to or additional disclosure in these financial statements.
(i) In May 2011, the Financial Accounting Standards Board (“FASB”) issued Accounting Standards Update (“ASU”) No. 2011-04 “Amendments to Achieve Common Fair Value Measurement and Disclosure Requirements” in U.S. Generally Accepted Accounting Principles (“U.S. GAAP”) and International Financial Reporting Standards (“IFRS”). ASU No. 2011-04 amends FASB ASC Topic 820, “Fair Value Measurements and Disclosures,” to establish common requirements for measuring fair value and disclosing additional information about Level 3 fair value measurements in accordance with U.S. GAAP and IFRS. ASU No. 2011-04 is effective for interim and annual periods beginning after December 15, 2011. The Fund has disclosed the applicable requirements of this accounting standard in its financial statements.
(2) Related Parties —
(a) Investment Adviser and Management Agreement —
The Fund has an agreement with Nicholas Company, Inc. (with whom certain officers and directors of the Fund are affiliated) (the “Adviser”) to serve as investment adviser and manager. Under the terms of the agreement, a monthly fee is paid to the Adviser based on an annualized fee of .50% of the average net asset value up to and including $50 million, .40% of the average net asset value in excess of $50 million and up to and including $100 million and .30% of the average net asset value in excess of $100 million. Also, the Adviser may be paid for accounting and administrative services rendered by its personnel, subject to the following guidelines: (i) up to five basis points, on an annual basis, of the average net asset value of the Fund up to and including $2 billion and up to three basis points, on an annual basis, of the average net asset value of the Fund greater than $2 billion, based on the average net asset value of the Fund as determined by valuations made at the close of each business day of each month, and (ii) where the preceding calculation results in an annual payment of less than $50,000, the Adviser, in its discretion, may charge the Fund up to $50,000 for such services.
– 24 –
Notes to Financial Statements (continued)
December 31, 2012
(b) Legal Counsel —
A director of the Adviser is affiliated with a law firm that provides services to the Fund. The Fund incurred expenses of $5,288 for the year ended December 31, 2012 for legal services rendered by this law firm.
(3) Investment Transactions —
For the year ended December 31, 2012, the cost of purchases and the proceeds from sales of investment securities, other than short-term obligations, aggregated $73,436,558 and $64,254,611, respectively.
(4) Concentration of Risk —
The Fund invests primarily in high yield debt securities. The market values of these high yield debt securities tend to be more sensitive to economic conditions and individual corporate developments than those of higher rated securities. In addition, the market for these securities is generally less liquid than for higher rated securities.
– 25 –
Report of Independent Registered Public Accounting Firm
To the Board of Directors and Shareholders of Nicholas High Income Fund, Inc.: We have audited the accompanying statement of assets and liabilities of Nicholas High Income Fund, Inc. (the “Fund”), including the schedule of investments, as of December 31, 2012, and the related statement of operations for the year then ended, the statements of changes in net assets for each of the two years in the period then ended, and the financial highlights for each of the years presented in the period then ended. These financial statements and financial highlights are the responsibility of the Fund’s management. Our responsibility is to express an opinion on these financial statements and financial highlights based on our audits.
We conducted our audits in accordance with the standards of the Public Company Accounting Oversight Board (United States). Those standards require that we plan and perform the audit to obtain reasonable assurance about whether the financial statements and financial highlights are free of material misstatement. The Fund is not required to have, nor were we engaged to perform, an audit of its internal control over financial reporting. Our audits included consideration of internal control over financial reporting as a basis for designing audit procedures that are appropriate in the circumstances, but not for the purpose of expressing an opinion on the effectiveness of the Fund’s internal control over financial reporting. Accordingly, we express no such opinion. An audit also includes examining, on a test basis, evidence supporting the amounts and disclosures in the financial statements, assessing the accounting principles used and significant estimates made by management, as well as evaluating the overall financial statement presentation. Our procedures included confirmation of securities owned as of December 31, 2012, by correspondence with the custodian and brokers. We believe that our audits provide a reasonable basis for our opinion.
In our opinion, such financial statements and financial highlights referred to above present fairly, in all material respects, the financial position of the Fund as of December 31, 2012, the results of its operations for the year then ended, the changes in its net assets for each of the two years in the period then ended, and the financial highlights for each of the years presented in the period then ended, in conformity with accounting principles generally accepted in the United States of America.
Deloitte & Touche LLP
Milwaukee, Wisconsin
February 25, 2013
– 26 –
| | | | | | | |
| Historical Record(1) | | | | | |
| (unaudited) | | | | | | | |
| |
| | | Net | | Net Investment | | | Growth of an |
| | | Asset Value | | Income Distributions | | | Initial $10,000 |
| | | Per Share | | Per Share | | | Investment(3) |
| Class I | | | | | | | |
| November 21, 1977(2) | $ | 25.50 | $ | — | | $ | 10,000 |
| December 31, 1987 | | 18.20 | | 2.3300 | | | 22,560 |
| December 31, 1988 | | 18.40 | | 1.8550 | | | 25,164 |
| December 31, 1989 | | 17.20 | | 1.9150 | | | 26,155 |
| December 31, 1990 | | 15.05 | | 1.9850 | | | 25,886 |
| December 31, 1991 | | 16.70 | | 1.7300 | | | 31,853 |
| December 31, 1992 | | 16.90 | | 1.4775 | | | 35,143 |
| December 31, 1993 | | 17.60 | | 1.4450 | | | 39,695 |
| December 31, 1994 | | 16.05 | | 1.5050 | | | 39,626 |
| December 31, 1995 | | 17.10 | | 1.4750 | | | 46,029 |
| December 31, 1996 | | 17.65 | | 1.4800 | | | 51,721 |
| December 31, 1997 | | 18.45 | | 1.4515 | | | 58,514 |
| December 31, 1998 | | 16.95 | | 1.5775 | | | 58,788 |
| December 31, 1999 | | 15.30 | | 1.6560 | | | 58,749 |
| December 31, 2000 | | 12.00 | | 1.5300 | | | 51,620 |
| December 31, 2001 | | 11.80 | | 1.2150 | | | 56,144 |
| December 31, 2002 | | 9.65 | | 0.9925 | | | 50,459 |
| December 31, 2003 | | 10.95 | | 0.8450 | | | 61,937 |
| December 31, 2004 | | 11.15 | | 0.8200 | | | 67,915 |
| December 31, 2005 | | 10.50 | | 0.7895 | | | 68,849 |
| December 31, 2006 | | 10.70 | | 0.7455 | | | 75,221 |
| December 31, 2007 | | 10.18 | | 0.7502 | | | 76,820 |
| December 31, 2008 | | 7.18 | | 0.7140 | | | 58,955 |
| December 31, 2009 | | 9.09 | | 0.6581 | | | 80,426 |
| December 31, 2010 | | 9.52 | | 0.7230 | | | 90,876 |
| December 31, 2011 | | 9.28 | | 0.7070 | | | 95,354 |
| December 31, 2012 | | 9.86 | | 0.6375 | (a) | | 108,095 |
| Class N | | | | | | | |
| February 28, 2005(2) | $ | 11.20 | $ | — | | $ | 10,000 |
| December 31, 2005 | | 10.40 | | 0.7320 | | | 9,947 |
| December 31, 2006 | | 10.60 | | 0.7140 | | | 10,846 |
| December 31, 2007 | | 10.06 | | 0.7119 | | | 11,018 |
| December 31, 2008 | | 7.24 | | 0.5238 | | | 8,448 |
| December 31, 2009 | | 9.18 | | 0.6323 | | | 11,501 |
| December 31, 2010 | | 9.64 | | 0.6683 | | | 12,946 |
| December 31, 2011 | | 9.39 | | 0.6782 | | | 13,522 |
| December 31, 2012 | | 9.98 | | 0.6062 | (a) | | 15,275 |
| (1) | Per share amounts presented for the periods prior to December 31, 2007 in this historical record have been restated or adjusted to reflect a reverse stock split of one share for every five shares outstanding effected on January 29, 2007. |
| (2) | Initial date under Nicholas Company, Inc. management. |
| (3) | Assuming reinvestment of distributions. |
| |
| (a) | Paid on April 27, 2012, $0.1594 and $0.1531 to respective Class I and Class N shareholders of record as of April 26, 2012. Paid on July 26, 2012, $0.1586 and $0.1509 to respective Class I and Class N shareholders of record as of July 25, 2012. Paid on November 1, 2012, $0.1559 and $0.1495 to respective Class I and Class N shareholders of record as of October 31, 2012. Paid on December 21, 2012, $0.1636 and $0.1527 to respective Class I and Class N shareholders of record as of December 20, 2012. |
| |
| | The Fund distributed no capital gains for the time periods listed. |
– 27 –
Approval of Investment Advisory Contract
(unaudited)
A discussion of the Approval by the Board of Directors of the Fund’s Investment Advisory Contract can be found in the Fund’s Semiannual Report dated June 30, 2012.
Information on Proxy Voting
(unaudited)
A description of the policies and procedures that the Fund uses to determine how to vote proxies relating to portfolio securities is available, without charge, upon request by calling 800-544-6547 (toll-free) or 414-276-0535. It also appears in the Fund’s Statement of Additional Information, which can be found on the SEC’s website, www.sec.gov. A record of how the Fund voted its proxies for the most recent twelve-month period ended June 30, also is available on the Fund’s website, www.nicholasfunds.com, and the SEC’s website, www.sec.gov.
Quarterly Portfolio Schedule
(unaudited)
The Fund files its complete schedule of investments with the SEC for the first and third quarters of each fiscal year on Form N-Q. The Fund’s Form N-Q’s are available on the SEC’s website at www.sec.gov and may be reviewed and copied at the SEC’s Public Reference Room in Washington, D.C. Information on the operation of the Public Reference Room may be obtained by calling 800-SEC-0330.
– 28 –
Directors and Officers of the Fund
(unaudited)
The following table sets forth the pertinent information about the Fund’s directors and officers as of December 31, 2012. Unless otherwise listed, the business address of each director and officer is 700 North Water Street, Milwaukee, WI 53202.
| | | | | |
| | | | | Number of | |
| | | Term of | | Portfolios | |
| | Positions | Office and | Principal | in Fund | Other |
| | Held | Length of | Occupations | Complex | Directorships |
| | With | Time | During Past | Overseen | Held |
| Name and Age | Fund | Served | 5 Years | by Director | by Director |
| INTERESTED DIRECTOR | | | | | |
| David O. Nicholas, 51(1), (3) | President | (2), 8 years | Chief Investment Officer | 3 | None |
| | and | | and Director, Nicholas | | |
| | Director | | Company, Inc., the | | |
| | | | Adviser to the Fund. He | | |
| | | | is Portfolio Manager of | | |
| | | | Nicholas II, Inc. and | | |
| | | | Nicholas Limited Edition, | |
| | | | Inc. He is Associate | | |
| | | | Portfolio Manager of | | |
| | | | Nicholas Fund, Inc. He | | |
| | | | formerly was Co-Portfolio | |
| | | | Manager of Nicholas | | |
| | | | Equity Income Fund, Inc. | |
| | | | and the Fund. | | |
| DISINTERESTED DIRECTORS | | | | |
| Robert H. Bock, 80 | Director | (2), 10 years | Private Investor, | 5 | None |
| | | | Consultant, Dean Emeritus | |
| | | | of Business Strategy and | |
| | | | Ethics, University of | | |
| | | | Wisconsin School of | | |
| | | | Business, 1997 to present. | |
| Timothy P. Reiland, 56 | Director | (2), 8 years | Private Investor, | 5 | None |
| | | | Consultant, Chairman and | |
| | | | Chief Financial Officer, | | |
| | | | Musicnotes, Inc., | | |
| | | | October 2001 to present. | |
| | | | Investment Analyst from | | |
| | | | 1987 to October 2001, | | |
| | | | Tucker Anthony | | |
| | | | Incorporated, a brokerage | |
| | | | firm. He is a Chartered | | |
| | | | Financial Analyst. | | |
| Jay H. Robertson, 61 | Director | (2), 18 years | Private Investor, April | 6 | None |
| | | | 2000 to present. | | |
| | | | Chairman of the Board | | |
| | | | of Robertson-Ryan and | | |
| | | | Associates, Inc., an | | |
| | | | insurance brokerage firm | |
| | | | from 1993 to March 2000. | |
| |
| – 29 – |
Directors and Officers of the Fund (continued)
(unaudited)
| | | |
| | | Term of | |
| | Positions | Office and | |
| | Held | Length of | |
| | With | Time | |
| Name and Age | Fund | Served | Principal Occupations During Past 5 Years |
| OFFICERS | | | |
| Albert O. Nicholas, 81(3) | Executive | Annual, | Chief Executive Officer and Chairman of the Board, |
| | Vice | 35 years | Nicholas Company, Inc., the Adviser to the Fund. |
| | President | | He is Portfolio Manager of Nicholas Fund, Inc. and |
| | | | Co-Portfolio Manager of Nicholas Equity Income |
| | | | Fund, Inc. He was a Director of the Fund until |
| | | | October 29, 2004. |
| David L. Johnson, 70(3) | Executive | Annual, | Executive Vice President, Nicholas Company, Inc., |
| | Vice | 31 years | the Adviser to the Fund. |
| | President | | |
| Jeffrey T. May, 56 | Senior Vice | Annual, | Executive Vice President, Treasurer, Chief |
| | President, | 19 years | Financial Officer and Chief Compliance Officer, |
| | Secretary, | | Nicholas Company, Inc., the Adviser to the Fund. |
| | Treasurer | | He is Portfolio Manager of Nicholas Money |
| | and Chief | | Market Fund, Inc. |
| | Compliance | | |
| | Officer | | |
| Lawrence J. Pavelec, 54 | Senior | Annual, | Senior Vice President, Nicholas Company, Inc., |
| | Vice | 10 years | the Adviser to the Fund. He has been Portfolio |
| | President | | Manager of the Fund since April 2008. He served |
| | and | | as Co-Portfolio Manager from April 2003 until |
| | Portfolio | | April 2008. |
| | Manager | | |
| Candace L. Lesak, 55 | Vice | Annual, | Employee, Nicholas Company, Inc., the Adviser |
| | President | 26 years | to the Fund. |
| (1) | David O. Nicholas is the only director of the Fund who is an “interested person” of the Fund, as that |
| | term | is defined in the 1940 Act. Mr. Nicholas is a Director of the Adviser and owns 1% of the |
| | outstanding | voting securities of the Adviser. |
| (2) | Until duly elected or re-elected at a subsequent annual meeting of the Fund. |
| (3) | David O. Nicholas is the son of Albert O. Nicholas. David L. Johnson is the brother-in-law of Albert |
| | O. | Nicholas. |
The Fund’s Statement of Additional Information includes additional information about Fund directors and is available, without charge, upon request, by calling 800-544-6547 (toll-free) or 414-276-0535.
– 30 –
Privacy Policy
(unaudited)
Nicholas High Income Fund, Inc. respects each shareholder’s right to privacy. We are committed to safeguarding the information that you provide us to maintain and execute transactions on your behalf.
We collect the following non-public personal information about you:
| * | Information we receive from you on applications or other forms, whether we receive the form in writing or electronically. This includes, but is not limited to, your name, address, phone number, tax identification number, date of birth, beneficiary information and investment selection. |
| * | Information about your transactions with us and account history with us. This includes, but is not limited to, your account number, balances and cost basis information. This also includes transaction requests made through our transfer agent. |
| * | Other general information that we may obtain about you such as demographic information. |
WE DO NOT SELL ANY NON-PUBLIC PERSONAL INFORMATION ABOUT CURRENT OR FORMER SHAREHOLDERS.
INFORMATION SHARED WITH OUR TRANSFER AGENT, A THIRD PARTY COMPANY, ALSO IS NOT SOLD.
We may share, only as permitted by law, non-public personal information about you with third party companies. Listed below are some examples of third parties to whom we may disclose non-public personal information. While these examples do not cover every circumstance permitted by law, we hope they help you understand how your information may be shared.
We may share non-public personal information about you:
| * | With companies who work for us to service your accounts or to process transactions that you may request. This would include, but is not limited to, our transfer agent to process your transactions, mailing houses to send you required reports and correspondence regarding the Fund and its Adviser, the Nicholas Company, Inc., and our dividend disbursing agent to process fund dividend checks. |
| * | With a party representing you, with your consent, such as your broker or lawyer. |
| * | When required by law, such as in response to a subpoena or other legal process. |
The Fund and its Adviser maintain policies and procedures to safeguard your non-public personal information. Access is restricted to employees who the Adviser determines need the information in order to perform their job duties. To guard your non-public personal information we maintain physical, electronic, and procedural safeguards that comply with federal standards.
In the event that you hold shares of the Fund with a financial intermediary, including, but not limited to, a broker-dealer, bank, or trust company, the privacy policy of your financial intermediary would govern how your non-public personal information would be shared with non-affiliated third parties.
– 31 –
Nicholas Funds Services Offered
(unaudited)
| | |
| • | IRAs | |
| | • Traditional | • SIMPLE |
| | • Roth | • SEP |
Coverdell Education Accounts
Automatic Investment Plan
Direct Deposit of Dividend and Capital Gain Distributions
Systematic Withdrawal Plan
Monthly Automatic Exchange between Funds
Telephone Purchase and Redemption
Telephone Exchange
24-hour Automated Account Information (800-544-6547)
24-hour Internet Account Access (www.nicholasfunds.com)
Please call a shareholder representative for further information on the above services or with any other questions you may have regarding the Nicholas Funds (800-544-6547).
– 32 –
Directors and Officers
DAVID O. NICHOLAS, President and Director
ROBERT H. BOCK, Director
TIMOTHY P. REILAND, Director
JAY H. ROBERTSON, Director
ALBERT O. NICHOLAS, Executive Vice President
DAVID L. JOHNSON, Executive Vice President
JEFFREY T. MAY, Senior Vice President, Secretary,
Treasurer and Chief Compliance Officer
LAWRENCE J. PAVELEC, Senior Vice President
CANDACE L. LESAK, Vice President
Investment Adviser
NICHOLAS COMPANY, INC.
Milwaukee, Wisconsin
www.nicholasfunds.com
414-276-0535 or 800-544-6547
Transfer Agent
U.S. BANCORP FUND SERVICES, LLC
Milwaukee, Wisconsin
414-276-0535 or 800-544-6547
Distributor
QUASAR DISTRIBUTORS, LLC
Milwaukee, Wisconsin
Custodian
U.S. BANK N.A.
Milwaukee, Wisconsin
Independent Registered Public Accounting Firm
DELOITTE & TOUCHE LLP
Milwaukee, Wisconsin
Counsel
MICHAEL BEST & FRIEDRICH LLP
Milwaukee, Wisconsin
This report is submitted for the information of shareholders of the Fund. It is not authorized for distribution to prospective investors unless preceded or accompanied by an effective prospectus.
Item 2. Code of Ethics.
CODE OF ETHICS FOR PRINCIPAL EXECUTIVE AND
SENIOR FINANCIAL OFFICERS
I. Covered Officers/Purpose of the Code
The Nicholas Family of Funds code of ethics (this "Code") for the investment companies within the complex (collectively, "Funds" and each, "Company") applies to the Company's Principal Executive Officer and Principal Financial Officer (the "Covered Officers" each of whom are set forth in Exhibit A) for the purpose of promoting:
* honest and ethical conduct, including the ethical handling of actual or apparent conflicts of interest between personal and professional relationships; * full, fair, accurate, timely and understandable disclosure in reports and documents that a registrant files with, or submits to, the Securities and Exchange Commission ("SEC") and in other public communications made by the Company;
| * | compliance with applicable laws and governmental rules and regulations; |
| * | the prompt internal reporting of violations of the Code to an appropriate person or persons identified in |
the Code; and
* accountability for adherence to the Code.
Each Covered Officer should adhere to a high standard of business ethics and should be sensitive to situations that may give rise to actual as well as apparent conflicts of interest.
II. Covered Officers Should Handle Ethically Actual and Apparent Conflicts of Interest
Overview. A "conflict of interest" occurs when a Covered Officer's private interest interferes with the interests of, or his service to, the Company. For example, a conflict of interest would arise if a Covered Officer, or a member of his family, receives improper personal benefits as a result of his position with the Company.
Certain conflicts of interest arise out of the relationships between Covered Officers and the Company and already are subject to conflict of interest provisions in the Investment Company Act of 1940 ("Investment Company Act") and the Investment Advisers Act of 1940 ("Investment Advisers Act"). For example, Covered Officers may not individually engage in certain transactions (such as the purchase or sale of securities or other property) with the Company because of their status as "affiliated persons" of the Company. The Company's and the investment adviser's compliance programs and procedures are designed to prevent, or identify and correct, violations of these provisions. This Code does not, and is not intended to, repeat or replace these programs and procedures, and such conflicts fall outside of the parameters of this Code.
Although typically not presenting an opportunity for improper personal benefit, conflicts arise from, or as a result of, the contractual relationship between the Company and the investment adviser of which the Covered Officers are also officers or employees. As a result, this Code recognizes that the Covered Officers will, in the normal course of their duties (whether formally for the Company or for the
adviser, or for both), be involved in establishing policies and implementing decisions that will have different effects on the adviser and the Company. The participation of the Covered Officers in such activities is inherent in the contractual relationship between the Company and the adviser and is consistent with the performance by the Covered Officers of their duties as officers of the Company. Thus, if performed in conformity with the provisions of the Investment Company Act and the Investment Advisers Act, such activities will be deemed to have been handled ethically. In addition, it is recognized by the Funds' Boards of Directors ("Boards") that the Covered Officers may also be officers or employees of one or more other investment companies covered by this or other codes.
Other conflicts of interest are covered by the Code, even if such conflicts of interest are not subject to provisions in the Investment Company Act and the Investment Advisers Act. The following list provides examples of conflicts of interest under the Code, but Covered Officers should keep in mind that these examples are not exhaustive. The overarching principle is that the personal interest of a Covered Officer should not be placed improperly before the interest of the Company.
* * *
Each Covered Officer must:
* not use his personal influence or personal relationships improperly to influence investment decisions or financial reporting by the Company whereby the Covered Officer would benefit personally to the detriment of the Company; * not cause the Company to take action, or fail to take action, for the individual personal benefit of the Covered Officer rather than the benefit of the Company; * not use material non-public knowledge of portfolio transactions made or contemplated for the Company to trade personally or cause others to trade personally in contemplation of the market effect of such transactions;
| * | report, at least annually: |
| * | officer and director positions in corporations, public or private, for profit or not for profit, or in which |
the Covered Officer or any of his immediate family members holds 5% or more of its outstanding stock;
| * | Positions as a trustee, executor or other fiduciary; |
| * | Ownership interest in any broker-dealer or bank; |
| * | Transactions between the Covered Officer and any of the Nicholas Family of Funds, the Nicholas |
Company or any company in which any director of any of the Nicholas Family of Funds is an officer or director.
* Situations in which any immediate family member of the Covered Employee is an officer, director or employee of any company in which any officer or director of the Nicholas Company or any of the Nicholas Family of Funds is a director or executive officer.
There are some conflict of interest situations that should always be discussed with the appropriate officer if material. If the matter involves Jeffrey T. May, he should discuss the matter with David O. Nicholas. If the matter involves any other person, that person should discuss the matter with Jeffrey T. May. In each case, the officer with whom such matter is discussed is encouraged to review the matter with counsel to the Company. Examples of these include:
| * | service as a director on the board of any public company; |
| * | the receipt of any non-nominal gifts; |
| * | the receipt of any entertainment from any company with which the Company has current or |
prospective business dealings unless such entertainment is business-related, reasonable in cost, appropriate as to time and place, and not so frequent as to raise any question of impropriety; * any ownership interest in, or any consulting or employment relationship with, any of the Company's service providers, other than its investment adviser, principal underwriter, administrator or any affiliated person thereof; * a direct or indirect financial interest in commissions, transaction charges or spreads paid by the Company for effecting portfolio transactions or for selling or redeeming shares other than an interest arising from the Covered Officer's employment, such as compensation or equity ownership.
| III. | Disclosure and Compliance |
| * | Each Covered Officer should familiarize himself with the disclosure requirements generally applicable |
to the Company;
* each Covered Officer should not knowingly misrepresent, or cause others to misrepresent, facts about the Company to others, whether within or outside the Company, including to the Company's directors and auditors, and to governmental regulators and self-regulatory organizations; * each Covered Officer should, to the extent appropriate within his area of responsibility, consult with other officers and employees of the Funds and the adviser with the goal of promoting full, fair, accurate, timely and understandable disclosure in the reports and documents the Funds files with, or submits to, the SEC and in other public communications made by the Funds; and * it is the responsibility of each Covered Officer to promote compliance with the standards and restrictions imposed by applicable laws, rules and regulations.
IV. Reporting and Accountability
Each Covered Officer must:
* upon adoption of the Code (or thereafter as applicable, upon becoming a Covered Officer), affirm in writing to the Board that he has received, read, and understands the Code;
| * | annually thereafter affirm to the Board that he has complied with the requirements of the Code; |
| * | not retaliate against any other Covered Officer or any employee of the Funds or their affiliated persons |
for reports of potential violations that are made in good faith; and
* notify the appropriate person promptly if he knows of any violation of this Code. Failure to do so is itself a violation of this Code. Each Covered Officer should notify Jeffrey T. May unless the person violating the Code is Jeffrey T. May, in which case such person should notify David O. Nicholas. In each case, each Covered Officer is encouraged to also contact counsel to the Fund.
Jeffrey T. May is responsible for applying this Code to specific situations in which questions are presented under it and has the authority to interpret this Code in any particular situation; provided that if the situation involves Jeffrey T. May directly, then Mr. David O. Nicholas is responsible for applying the Code to him and he has authority to interpret the Code with respect to such application. Both Jeffrey T. May and David O. Nicholas are encouraged to discuss the matter with counsel to the Fund. However, any approvals or waivers sought by the Principal Executive Officer will be considered by the Independent Directors (the "Committee").
The Company will follow these procedures in investigating and enforcing this Code:
* Jeffrey T. May or David O. Nicholas, with the advice of counsel will take all appropriate action to investigate any potential violations reported to him; * if, after such investigation, the officer making such investigation believes that no violation has occurred, he is not required to take any further action; * any matter that the officer making the investigation believes is a violation will be reported to the independent directors; * if the independent directors concur that a violation has occurred, they will consider appropriate action, which may include review of, and appropriate modifications to, applicable policies and procedures; notification to appropriate personnel of the investment adviser or its board; or a recommendation to dismiss the Covered Officer;
| * | the independent directors will be responsible for granting waivers, as appropriate; and |
| * | any changes to or waivers of this Code will, to the extent required, be disclosed as provided by SEC |
rules.
V. Other Policies and Procedures
This Code shall be the sole code of ethics adopted by the Funds for purposes of Section 406 of the Sarbanes-Oxley Act and the rules and forms applicable to registered investment companies thereunder. Insofar as other policies or procedures of the Funds, the Funds' adviser, principal underwriter, or other service providers govern or purport to govern the behavior or activities of the Covered Officers who are subject to this Code, they are superseded by this Code to the extent that they overlap or conflict with the provisions of this Code. The Funds' and their investment adviser's codes of ethics under Rule 17j-1 under the Investment Company Act and the adviser's more detailed policies and procedures are separate requirements applying to the Covered Officers and others, and are not part of this Code.
VI. Amendments
Any amendments to this Code, other than amendments to Exhibit A, must be approved or ratified by a majority vote of the Board, including a majority of independent directors.
VII. Confidentiality
All reports and records prepared or maintained pursuant to this Code will be considered confidential and shall be maintained and protected accordingly. Except as otherwise required by law or this Code, such matters shall not be disclosed to anyone other than the appropriate Board and its counsel, the appropriate Company and the Nicholas Company.
VIII. Internal Use
The Code is intended solely for the internal use by the Funds and does not constitute an admission, by or on behalf of any Company, as to any fact, circumstance, or legal conclusion.
Date: November 20, 2003
Affirmed: November 15, 2012
Exhibit A
Persons Covered by this Code of Ethics
| | |
| The Nicholas Company | Albert O. Nicholas | Jeffrey T. May |
| Nicholas Fund, Inc. | Albert O. Nicholas | Jeffrey T. May |
| Nicholas II, Inc. | David O. Nicholas | Jeffrey T. May |
| Nicholas Limited Edition, Inc. | David O. Nicholas | Jeffrey T. May |
| Nicholas Income Fund, Inc. | David O. Nicholas | Jeffrey T. May |
| Nicholas Equity Income Fund, Inc. | Albert O. Nicholas | Jeffrey T. May |
| Nicholas Money Market Fund, Inc. | Albert O. Nicholas | Jeffrey T. May |
Item 3. Audit Committee Financial Expert.
The Fund's Board of Directors has determined that Mr. Timothy P. Reiland, an independent director, qualifies as an audit committee financial expert as that term is defined for purposes of this item.
Item 4. Principal Accountant Fees and Services.
(a) Audit Fees. The aggregate fees billed for each of the last two fiscal years (the "Reporting Periods") for professional services rendered by the Fund's principal accountant (the "Auditor") for the audit of the Fund's annual financial statements, or services that are normally provided by the Auditor in connection with the statutory and regulatory filings or engagements for the Reporting Periods, were $24,700 in 2005 and $24,000 in 2011.
(b) Audit-Related Fees. There were no fees billed in each of the last two fiscal years for assurance and related services rendered by the Auditor to the Fund that are reasonably related to the performance of the audit of the Fund's financial statements and are not reported under paragraph (a) of this Item 4.
(c) Tax Fees. The aggregate fees billed in the Reporting Periods for professional services rendered by the Auditor for tax compliance, tax advice and tax planning ("Tax Services") were $3,800 in 2012 and $3,700 in 2011. These services consisted of (i) review or preparation of U.S. federal, state, local and excise tax returns; (ii) U.S. federal, state and local tax planning, advice and assistance regarding statutory, regulatory or administrative developments, (iii) tax advice regarding tax qualification matters and/or treatment of various financial instruments held or proposed to be acquired or held.
(d) All Other Fees. The aggregate fees billed for professional services rendered by the Auditor to the Fund's investment adviser were approximately $16,000 in 2012 and $15,500 in 2011. These services were for the audit of the investment adviser for the adviser's fiscal year ended 10/31/2012 and 10/31/2011, respectively.
(e) (1) Audit Committee Pre-Approval Policies and Procedures. The Fund's Board of Director's has not adopted any pre-approval policies and procedures as described in paragraph (c)(7) of Rule 2-01 of Regulation S-X. The Fund's Board of Directors meets with the Auditors and management to review and authorize the Auditor's engagements for audit and non-audit services to the Fund and its Adviser prior to each engagement.
(e) (2) The percentage of services described in each of paragraphs (b) through (d) of this Item that were approved by the audit committee pursuant to paragraph (c)(7)(i)(C) of Rule 2-01 of Regulation S-X are as follows:
| (f) | No disclosures are required by this Item 4(f). |
| (g) | There were no non-audit fees billed in each of the last two fiscal years by the Auditor for services |
rendered to the Fund or the Fund's investment adviser that provides ongoing services.
(h) No disclosures are required by this Item 4(h).
Item 5. Audit Committee of Listed Registrants.
Not applicable to this filing.
Item 6. Schedule of Investments.
The schedule of investments in securities of unaffiliated issuers is included as part of the report to shareholders filed under Item 1.
Item 7. Disclosure of Proxy Voting Policies and Procedures for Closed-End Management Investment Companies.
Applicable only to annual reports filed by closed-end funds.
Item 8. Portfolio Managers of Closed-End Management Investment Companies.
Applicable only to annual reports filed by closed-end funds.
Item 9. Purchases of Equity Securities by Closed-End Management Investment Companies and Affiliated Purchasers.
Applicable only to closed-end funds.
Item 10. Submission of Matters to a Vote of Security Holders.
Not applicable to this filing.
Item 11. Controls and Procedures.
The Fund's principal executive officer and principal financial officer have concluded that the Fund's disclosure controls and procedures are sufficient to ensure that information required to be disclosed by the Fund in this Form N-CSR was recorded, processed, summarized and reported within the time periods specified in the Securities and Exchange Commission's rules and forms, based upon such officers' evaluation of these controls and procedures as of a date within 90 days of the filing date of the report. There were no significant changes or corrective actions with regard to significant deficiencies or material weaknesses in the Fund's internal controls or in other factors that could significantly affect the Fund's internal controls subsequent to the date of their evaluation.
Item 12. Exhibits.
(a)(1) Code of Ethics -- Any code of ethics, or amendments thereto, that is the subject of the disclosure required by Item 2, to the extent that the registrant intends to satisfy the Item 2 requirements through filing of an exhibit.
Not applicable to this filing.
(a)(2) Certifications of Principal Executive Officer and Principal Financial Officer pursuant to Section 302 of the Sarbannes-Oxley Act of 2002, attached hereto as part of EX-99.CERT.
(a)(3) Any written solicitation to purchase securities under Rule 23c-1 under the Act sent or given during the period covered by the report by or on behalf of the registrant to 10 or more person.
Applicable only to closed-end funds.
(b) Certifications of Principal Executive Officer and Principal Financial Officer pursuant to Section 906 of the Sarbannes-Oxley Act of 2002, attached hereto as part of EX-99.906CERT.
SIGNATURES
Pursuant to the requirements of the Securities Exchange Act of 1934 and the Investment Company Act of 1940, the registrant has duly caused this report to be signed on its behalf by the undersigned, thereunto duly authorized.
(Registrant) Nicholas High Income Fund, Inc.
By: /s/ David O. Nicholas
Name: David O. Nicholas
Title: Principal Executive Officer
Date: February 27, 2013
Pursuant to the requirements of the Securities Exchange Act of 1934 and the Investment Company Act of 1940, this report has been signed by the following persons on behalf of the registrant and in the capacities and on the dates indicated.
By: /s/ David O. Nicholas
Name: David O. Nicholas
Title: Principal Executive Officer
Date: February 27, 2013
By: /s/ Jeffrey T. May
Name: Jeffrey T. May
Title: Principal Financial Officer
Date: February 27, 2013