| |
| UNITED STATES |
| SECURITIES AND EXCHANGE COMMISSION |
| Washington, D.C. 20549 |
| |
| FORM N-CSR |
| CERTIFIED SHAREHOLDER REPORT OF REGISTERED MANAGEMENT INVESTMENT |
| COMPANIES |
| |
| Investment Company Act file number811-00216 | |
| |
| Nicholas High Income Fund, Inc. |
|
| (Exact Name of Registrant as specified in charter) |
| |
| 411 East Wisconsin Avenue, Milwaukee, Wisconsin 53202 |
|
| (Address of Principal Executive Offices) | (Zip Code) |
| |
| Jennifer R. Kloehn, Senior Vice President and Treasurer |
| 411 East Wisconsin Avenue |
| Milwaukee, Wisconsin 53202 |
|
| (Name and Address of Agent for Service) |
Registrant's telephone number, including area code:414-272-4650
Date of fiscal year end:12/31/2019
Date of reporting period:12/31/2019
Item 1. Report to Stockholders.
ANNUAL REPORT
December 31, 2019
NICHOLAS HIGH
INCOME FUND, INC.

Beginning on January 1, 2021, as permitted by regulations adopted by the Securities and Exchange Commission, paper copies of the Fund’s shareholder reports will no longer be sent by mail, unless you specifically request paper copies of the reports from the Fund or from your financial intermediary, such as a broker-dealer or bank. Instead, the reports will be made available on the Fund’s website, www.nicholasfunds.com, and you will be notified by mail each time a report is posted and provided with a website link to access the report.
If you already elected to receive shareholder reports electronically, you will not be affected by this change and you need not take any action. You may elect to receive shareholder reports and other communications from the Fund or your financial intermediary electronically by contacting your financial intermediary (such as a broker-dealer or bank); direct shareholders may call the Fund at 1-800-544-6547.
You may elect to receive all future reports in paper free of charge. You can inform the Fund or your financial intermediary that you wish to continue receiving paper copies of your shareholder reports by contacting your financial intermediary (such as a broker-dealer or bank); direct shareholders may call the Fund at 1-800-544-6547. Your election to receive reports in paper will apply to all funds held with the Fund complex or your financial intermediary.
WWW.NICHOLASFUNDS.COM
NICHOLAS HIGH INCOME FUND, INC.
February 2020
Report to Fellow Shareholders:
Market Overview
Nicholas High Income Fund (Fund) – Class I had a return of 12.68% for the year ended December 31, 2019, compared to the Morningstar High Yield Category return of 12.62% and the ICE BofAML U.S. High Yield Constrained Index (Index) of 14.41%. Returns for high yield bonds rebounded sharply in 2019 from the negative returns experienced in 2018, which was largely a result of the steep decline in 4Q18. The Fund generated solid returns for the year compared to its peers but lagged the Index, which is presented before fees. The Fund’s overweight position in shorter, higher quality BB/Ba bonds proved a benefit to performance as higher quality bonds handily exceeded the performance of lower quality bonds for the year. While the Fund’s position was a benefit for the year overall, it did surrender some of its accumulated relative outperformance in the 4Q19, when lower quality bonds snapped back. In December 2019, Ca-D-rated bonds within the Bloomberg Barclays US Corporate High Yield Bond Index returned 11.09% compared to the Ba-rated bonds 1.24%. The Fund participated in the market rally this past year after offering more stability versus the market during the sell-off in 4Q18.
We do not expect any significant changes to the positioning of the portfolio as the primary outlook and drivers appear similar to the past year as we look forward. The spreads of high yield bonds remain modest in our estimation and do not fully compensate investors for the potential risks in high yield securities. The primary cause for the high valuations has been the low interest rate environment which has pushed investors into longer and lower quality securities to seek to obtain more return. We have resisted the rationale to extend maturity or drop down in quality in order to potentially capture more yield. Solely reaching for yield is inconsistent with our philosophy that looks first to the quality of the business and the valuation against the potential risk. We believe that maintaining a greater focus on risk has provided greater consistency in returns and more stability for shareholders during uncertain times.
The risks we see include valuation, a potential slowing in the economy and volatility surrounding the upcoming elections. We view the valuations currently offered do not provide a suitable margin of safety should unexpected or unforeseen events negatively impact the companies issuing debt. The focus on risk has been largely shelved in recent years as massive liquidity is in constant search of yield regardless of the relative quality of the underlying issuer. There continues to be some risk to an economic slowdown due to a number of headwinds not limited solely to the tariffs and recent coronavirus outbreak. The Federal Reserve (Fed) has made a pivot from a tightening posture in 2018 to one of easing in 2019. This move has both injected more liquidity into the economy and reignited the confidence of investors. The Fed appears to prefer a neutral stance in 2020, but we feel the risks are skewed to easing versus tightening. The Fed does find themselves at the forefront to help stabilize the economy and the markets should the tariffs or coronavirus prove to have greater weight. The third headwind noted is the upcoming elections. While the impact may prove to be temporary and transitional during the election cycle it may prove to increase volatility in the months leading up to the vote.
The Fund maintained the strategy of overweighting higher quality, Ba-rated securities of companies offering more consistent earnings and stronger balance sheets. The weighted average duration declined to 2.15 years from 3.99 years. The decline was both a focus on shorter maturity bonds and an increase in the number of holdings subject to early calls.
We anticipate keeping with the theme of higher quality over the foreseeable future. The credit cycle continues to age with characteristics similar to past cycles where issuers have increased issuance with less protective covenants to investors. The tremendous growth in debt and the weakening of underwriting standards are typical of the late innings of a cycle. Current leverage for companies is manageable, but those measures can change quickly should rates rise or the economy slow. On a security level basis, our emphasis remains on companies holding a competitive advantage, sound balance sheet and manageable leverage. We believe the securities of companies with these characteristics tend to persevere when faced with uncertainty.
Performance
Nicholas High Income Fund – Class I produced a net return of 12.68% for the period ended December 31, 2019. Returns for Nicholas High Income Fund, Inc. Class I and N, and selected indices are provided in the chart below for the periods ended December 31, 2019. The Fund and Morningstar performance data is net of fees, while the ICE BofAML Indices are gross of fees.
| | | | | | | | | | | |
| | | Average Annual Total Return | |
| | | 1 Year | | 3 Year | | | 5 Year | | | 10 Year | |
| Nicholas High Income Fund, Inc. – Class I | | 12.68 | % | 4.51 | % | | 3.68 | % | | 5.65 | % |
| Nicholas High Income Fund, Inc. – Class N | | 12.32 | % | 4.22 | % | | 3.34 | % | | 5.29 | % |
| ICE BofAML US High Yield | | | | | | | | | | | |
| Constrained Index | | 14.41 | % | 6.32 | % | | 6.14 | % | | 7.48 | % |
| ICE BofAML US High Yield | | | | | | | | | | | |
| BB-B Bond Index | | 15.10 | % | 6.45 | % | | 6.10 | % | | 7.43 | % |
| Morningstar High Yield Bond Funds Category | | 12.62 | % | 5.31 | % | | 4.87 | % | | 6.42 | % |
| Ending value of $10,000 invested in | | | | | | | | | | | |
| Nicholas High Income Fund, Inc. – Class I | | $11,268 | | $11,414 | | | $11,979 | | | $17,330 | |
| Ending value of $10,000 invested in | | | | | | | | | | | |
| Nicholas High Income Fund, Inc. – Class N | | $11,232 | | $11,320 | | | $11,788 | | | $16,744 | |
| Fund’s Class I Expense Ratio (from 04/30/19 Prospectus): 0.72% | | | | | | | |
| Fund’s Class N Expense Ratio (from 01/29/20 Prospectus – includes 0.01% Acquired | |
| Funds Fees and Expenses): 1.02% | | | | | | | | | | | |
The Fund’s expense ratios for the for the current period can be found in the financial highlights included within this report.
Performance data quoted represents past performance and is no guarantee of future results. The investment return and principal value of an investment will fluctuate so that an investor’s shares, when redeemed, may be worth more or less than their original cost. Current performance of the Fund may be lower or higher than the performance quoted. Performance data current to the most recent month-end may be obtained by visiting www.nicholasfunds.com/returns.html.
The ending values above illustrate the performance of a hypothetical $10,000 investment made in the Fund over the timeframes listed. Assumes reinvestment of dividends and capital gains. Returns shown do not reflect the deduction of taxes that a
shareholder would pay on Fund distributions or the redemption of Fund shares. These figures do not imply any future performance.
Class I shares and Class N shares are invested in the same portfolio of securities. Annual returns will generally differ only to the extent that the classes do not have the same expenses. Please see the respective prospectus for details.
Philosophy and Process
The returns earned by the Fund are consistent with our investment philosophy and style. The approach has been to identify undervalued securities using rigorous financial analysis to verify that the fundamental outlook is properly aligned with current valuations. An analysis of trends in earnings, EBITDA, leverage and asset coverage are critical for making a sound investment. Security valuation is the primary gatekeeper in deciding whether to add or eliminate a holding from the portfolio. Financially, sound companies with fully priced securities do not necessarily represent a good value, while companies that have stumbled financially should not automatically be dismissed as bad investments if we believe the valuations offer a sufficient “margin of safety”. This process suggests a more conservative approach to investing in high yield bonds, which we believe has the potential to allow for more consistent returns with less downside risk.
We remain committed to the Fund’s long-term strategy, which is based on a process that seeks to identify value opportunities in out-of-favor or poorly followed securities of financially sound companies. Opportunities tend to arise over time in securities of companies that fall temporarily out-of-favor due to specific company or industry issues that may taint the issuers. Often times these companies are in a period of transition or restructuring where market sentiment is overly harsh or negative resulting in an undervalued situation. We are keenly aware that a cheap price alone does not guarantee a good investment; therefore, we seek to identify a catalyst we believe will allow the company and its securities to regain favor and be rewarded with higher valuations. We believe that investing in securities trading below their fair values due to non-fundamental short-term issues, emotion or misunderstanding offers significant long-term potential returns.
Thank you for your investment in the Nicholas High Income Fund.

Lawrence J. Pavelec, CFA
Senior Vice President
Portfolio Manager
The information above represents the opinions of the Fund manager, is subject to change, and any forecasts made cannot be guaranteed.
Mutual fund investing involves risk. Principal loss is possible. Investments in debt securities typically decrease in value when interest rates rise. This risk is usually greater for longer-term debt securities. Investment by the Fund in lower-rated and non-rated securities presents a greater risk of loss to principal and interest than higher-rated securities. The Fund may invest in illiquid securities which involve the risk that the securities will not be able to be sold at the time or prices desired by the fund, particularly during times of market turmoil.
Please refer to the schedule of investments in the report for complete Fund holdings information. Fund holdings and sector allocations are subject to change and should not be considered a recommendation to buy or sell any security.
Current and future portfolio holdings are subject to risk.
Cash Flowmeasures the cash generating capability of a company by adding non-cash charges (e.g. depreciation) and interest expense to pretax income.
Durationis a commonly used measure of the potential volatility of the price of a debt security, or the aggregate market value of a portfolio of debt securities, prior to maturity. Securities with a longer duration generally have more volatile prices than securities of comparable quality with a shorter duration.
Earnings before interest, taxes, depreciation and amortization (EBITDA)is an approximate measure of a company’s operating cash flow based on data from the company’s income statement. Calculated by looking at earnings before the deduction of interest expenses, taxes, depreciation, and amortization.
High yield bond spreadis the percentage difference in current yields of various classes of high-yield bonds compared against investment-grade corporate bonds, Treasury bonds, or another benchmark bond measure.
Margin of safety– Buying with a “margin of safety,” a phrase popularized by Benjamin Graham and Warren Buffet, is when a security is purchased for less than its estimated value. This helps protect against permanent capital loss in the case of an unexpected event or analytical mistake. A purchase made with a margin of safety does not guarantee the security will not decline in price.
Index Definitions – You cannot invest directly in an index.
The Bloomberg Barclays US Corporate High Yield Bond Index measures the US dollar denominated, high yield, fixed-rate corporate bond market. Securities are classified as high yield if the middle rating of Moody’s, Fitch and S&P is Ba1/BB+/BB+ or below. Bonds from issuers with an emerging markets country of risk, based on Barclays emerging market country definitions, are excluded.
The ICE BofAML US High Yield Index tracks the performance of US dollar denominated below investment grade corporate debt publicly issued in the US domestic market. Qualifying securities must have at least one year remaining term to final maturity, a fixed coupon schedule and a minimum amount outstanding of $250 million.
The ICE BoAML US High Yield Constrained Index limits any individual issuer included in the ICE BoAML US High Yield Index to a maximum of 2% benchmark exposure.
The ICE BoAML US High Yield BB-B Bond Index is a subset of the ICE BoAML US High Yield Index including all securities rated BB1 through B3, inclusive.
Credit Quality reflects the credit rating assigned by Fitch, Moody’s or S&P. Ratings are subject to change and generally expressed as a scale from AAA to D, where higher-rated bonds are in the A’s and lower-rated in the C’s. Any bond rated BBB or higher is considered investment grade debt. Any bond rated BBB- or below is considered below investment grade and are seen as having higher default risk or other adverse credit events, but typically pay higher yields than better quality bonds in order to make them attractive. The credit quality of the investments in the portfolio does not apply to the stability or safety of the Fund or its shares.
Each Morningstar Category average represents a universe of Funds with similar invest objectives.
Must be preceded or accompanied by a prospectus.
The Nicholas Funds are distributed by Quasar Distributors, LLC.
The line graph, which follows, compares the initial account value and subsequent account values at the end of each of the most recently completed ten fiscal years of the Fund’s Class I, to the same investment over the same periods in the ICE BofAML U.S. High Yield Constrained Index. The graph assumes a $100,000 investment in the Fund’s Class I and the index at the beginning of the first fiscal year.
COMPARISON OF CHANGE IN VALUE OF $100,000 INVESTMENT IN NICHOLAS HIGH INCOME FUND, INC. CLASS I AND
ICE BofAML U.S. HIGH YIELD CONSTRAINED INDEX
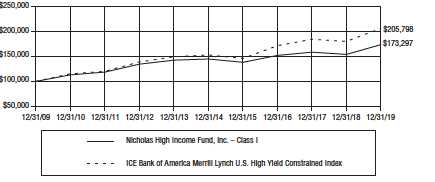
The Fund’s Class I average annual total returns for the one, five and ten year periods ended on the last day of the most recent fiscal year are as follows:
| | | | | | |
| | One Year Ended | | Five Years Ended | | Ten Years Ended | |
| | December 31, | | December 31, | | December 31, | |
| | 2019 | | 2019 | | 2019 | |
| Average Annual Total Return | 12.68 | % | 3.68 | % | 5.65 | % |
Past performance is not predictive of future performance, and the above graph and table do not reflect deduction of taxes that a shareholder would pay on Fund distributions or the redemption of Fund shares.
– 5–
Financial Highlights Class I (NCINX)
For a share outstanding throughout each period
| | | | | | | | | | | | | | | |
| | | | | | Years Ended December 31, | | | | |
| | | 2019 | | | 2018 | | | 2017 | | | 2016 | | | 2015 | |
| NET ASSET VALUE, BEGINNING OF PERIOD | $ | 8.36 | | $ | 9.00 | | $ | 9.08 | | $ | 8.65 | | $ | 9.52 | |
| INCOME (LOSS) FROM | | | | | | | | | | | | | | | |
| INVESTMENT OPERATIONS | | | | | | | | | | | | | | | |
| Net investment income. | | .38 | (1) | | .39 | (1) | | .44 | (1) | | .43 | (1) | | .43 | |
| Net gain (loss) on securities | | | | | | | | | | | | | | | |
| (realized and unrealized) | | .67 | | | (.64 | ) | | (.05 | ) | | .42 | | | (.84 | ) |
| Total from investment operations | | 1.05 | | | (.25 | ) | | .39 | | | .85 | | | (.41 | ) |
| LESS DISTRIBUTIONS | | | | | | | | | | | | | | | |
| From net investment income | | (.38 | ) | | (.39 | ) | | (.47 | ) | | (.42 | ) | | (.46 | ) |
| NET ASSET VALUE, END OF PERIOD | $ | 9.03 | | $ | 8.36 | | $ | 9.00 | | $ | 9.08 | | $ | 8.65 | |
| |
| TOTAL RETURN | | 12.68 | % | | (2.86 | )% | | 4.28 | % | | 9.94 | % | | (4.54 | )% |
| |
| SUPPLEMENTAL DATA: | | | | | | | | | | | | | | | |
| Net assets, end of period (millions) | $ | 104.6 | | $ | 95.0 | | $ | 101.9 | | $ | 100.5 | | $ | 93.1 | |
| Ratio of expenses to average net assets | | .73 | % | | .72 | % | | .69 | % | | .68 | % | | .70 | % |
| Ratio of net investment income | | | | | | | | | | | | | | | |
| to average net assets | | 4.26 | % | | 4.38 | % | | 4.80 | % | | 4.83 | % | | 4.61 | % |
| Portfolio turnover rate | | 30.24 | % | | 45.30 | % | | 44.80 | % | | 44.28 | % | | 41.30 | % |
| |
| (1) Computed based on average shares outstanding. | | | | | | | | | | | | | |
The accompanying notes to financial statements are an integral part of these highlights.
– 6–
Financial Highlights Class N (NNHIX)
For a share outstanding throughout each period
| | | | | | | | | | | | | | | |
| | | | | | Years Ended December 31, | | | | |
| | | 2019 | | | 2018 | | | 2017 | | | 2016 | | | 2015 | |
| NET ASSET VALUE, BEGINNING OF PERIOD | $ | 8.52 | | $ | 9.16 | | $ | 9.22 | | $ | 8.78 | | $ | 9.66 | |
| INCOME (LOSS) FROM | | | | | | | | | | | | | | | |
| INVESTMENT OPERATIONS | | | | | | | | | | | | | | | |
| Net investment income. | | .37 | (1) | | .36 | (1) | | .43 | (1) | | .40 | (1) | | .39 | |
| Net gain (loss) on securities | | | | | | | | | | | | | | | |
| (realized and unrealized) | | .67 | | | (.64 | ) | | (.06 | ) | | .43 | | | (.85 | ) |
| Total from investment operations | | 1.04 | | | (.28 | ) | | .37 | | | .83 | | | (.46 | ) |
| LESS DISTRIBUTIONS | | | | | | | | | | | | | | | |
| From net investment income | | (.36 | ) | | (.36 | ) | | (.43 | ) | | (.39 | ) | | (.42 | ) |
| NET ASSET VALUE, END OF PERIOD | $ | 9.20 | | $ | 8.52 | | $ | 9.16 | | $ | 9.22 | | $ | 8.78 | |
| |
| TOTAL RETURN | | 12.32 | % | | (3.12 | )% | | 4.03 | % | | 9.58 | % | | (4.97 | )% |
| |
| SUPPLEMENTAL DATA: | | | | | | | | | | | | | | | |
| Net assets, end of period (millions) | $ | 1.8 | | $ | 2.4 | | $ | 3.3 | | $ | 8.1 | | $ | 2.7 | |
| Ratio of expenses to average net assets | | .93 | % | | 1.03 | % | | 1.02 | % | | 1.03 | % | | 1.05 | % |
| Ratio of net investment income | | | | | | | | | | | | | | | |
| to average net assets | | 4.06 | % | | 4.08 | % | | 4.55 | % | | 4.42 | % | | 4.29 | % |
| Portfolio turnover rate | | 30.24 | % | | 45.30 | % | | 44.80 | % | | 44.28 | % | | 41.30 | % |
| |
| (1) Computed based on average shares outstanding. | | | | | | | | | | | | | |
The accompanying notes to financial statements are an integral part of these highlights.
– 7–
Top Ten Portfolio Issuers
December 31, 2019 (unaudited)
| | |
| | Percentage | |
| Name | of Net Assets | |
| Panther BF Aggregator 2 LP | 2.02 | % |
| Lamb Weston Holdings, Inc. | 1.99 | % |
| LPL Holdings, Inc. | 1.97 | % |
| KAR Auction Services, Inc. | 1.81 | % |
| IQVIA Inc. | 1.74 | % |
| Koppers Inc. | 1.72 | % |
| XPO Logistics, Inc. | 1.69 | % |
| Valvoline Inc. | 1.64 | % |
| CCO Holdings, LLC | 1.56 | % |
| Ball Corporation | 1.54 | % |
| Total of top ten | 17.68 | % |
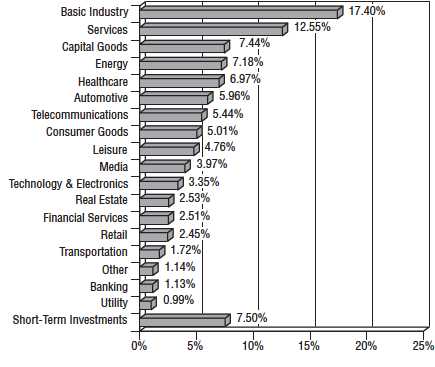
Sector Diversification(as a percentage of portfolio)
December 31, 2019 (unaudited)
– 8–
Fund Expenses
For the six month period ended December 31, 2019 (unaudited)
As a shareholder of the Fund, you incur two types of costs: (1) transaction costs and (2) ongoing costs, including management fees and other operating expenses. The following table is intended to help you understand your ongoing costs (in dollars) of investing in the Fund and to compare these costs with those of other mutual funds.
The example is based on an investment of $1,000 made at the beginning of the period and held for the entire period.
The first line of the table below for each share class of the Fund provides information about the actual account values and actual expenses. You may use the information in this line, together with the amount you invested, to estimate the expenses that you paid over the period. Simply divide your account value by $1,000 (for example, an $8,600 account value divided by $1,000 = 8.6), then multiply the result by the number in the first line under the heading entitled “Expenses Paid During Period” to estimate the expenses you paid on your account during this period.
The second line of the table below provides information about hypothetical account values and hypothetical expenses based on the Fund’s actual expense ratios for each class of the Fund and an assumed rate of return of 5% per year before expenses, which are not the Fund’s actual returns. The hypothetical account values and expenses may not be used to estimate the actual ending account balance or expenses you paid for the period. You may use this information to compare the ongoing costs of investing in the Fund with other funds. To do so, compare this 5% hypothetical example with the 5% hypothetical examples that appear in the shareholder reports of other funds.
Please note that the expenses shown in the table are meant to highlight your ongoing costs only and do not reflect any transactional costs, such as wire fees. Therefore, the second line of the table is useful in comparing ongoing costs only, and will not help you determine the relative total costs of owning different funds. In addition, if these transactional costs were included, your costs would have been higher.
| | | | | | |
| Class I | | Beginning | | Ending | | Expenses |
| | | Account | | Account | | Paid During |
| | | Value | | Value | | Period* |
| | | 06/30/19 | | 12/31/19 | | 07/01/19 - 12/31/19 |
| Actual | $ | 1,000.00 | $ | 1,036.70 | $ | 3.70 |
| Hypothetical | | 1,000.00 | | 1,021.37 | | 3.67 |
| (5% return before expenses) | | | | | | |
| * | Expenses are equal to the Class I six-month annualized expense ratio of 0.72%, multiplied by the average account value over the period, multiplied by 184 then divided by 365 to reflect the one-half year period. |
– 9–
Fund Expenses(continued)
For the six month period ended December 31, 2019 (unaudited)
| | | | | | |
| Class N | | Beginning | | Ending | | Expenses |
| | | Account | | Account | | Paid During |
| | | Value | | Value | | Period** |
| | | 06/30/19 | | 12/31/19 | | 07/01/19 - 12/31/19 |
| Actual | $ | 1,000.00 | $ | 1,035.90 | $ | 4.36 |
| Hypothetical | | 1,000.00 | | 1,020.72 | | 4.33 |
| (5% return before expenses) | | | | | | |
| ** | Expenses are equal to the Class N six-month annualized expense ratio of 0.85%, multiplied by the average account value over the period, multiplied by 184 then divided by 365 to reflect the one-half year period. |
– 10 –
Schedule of Investments
December 31, 2019
| | | | |
| | Shares or | | | |
| | Principal | | | |
| | Amount | | | Value |
| NON-CONVERTIBLE BONDS — 89.12% | | |
| | | Automotive – Parts & Equipment — 5.89% | | |
| $ | 1,500,000 | Allison Transmission, Inc. 144A restricted, 5.00%, 10/01/24 | $ | 1,535,625 |
| | 1,500,000 | American Axle & Manufacturing, Inc. 6.25%, 04/01/25 | | 1,561,875 |
| | 1,000,000 | LKQ Corporation 4.75%, 05/15/23 | | 1,015,800 |
| | 2,000,000 | Panther BF Aggregator 2 LP 144A restricted, 6.25%, 05/15/26 | | 2,155,000 |
| | | | | 6,268,300 |
| | | Banking — 1.11% | | |
| | 1,100,000 | CIT Group Inc. 5.00%, 08/01/23 | | 1,185,250 |
| | | Basic Industry – Building & Construction — 1.49% | | |
| | 500,000 | KB Home 7.625%, 05/15/23 | | 560,000 |
| | 1,000,000 | Lennar Corporation 4.125%, 01/15/22 | | 1,022,500 |
| | | | | 1,582,500 |
| | | Basic Industry – Building Materials — 3.75% | | |
| | 1,250,000 | American Woodmark Corporation 144A restricted, 4.875%, 03/15/26 | | 1,281,250 |
| | 1,100,000 | Beacon Roofing Supply, Inc. 144A restricted, 4.50%, 11/15/26 | | 1,133,000 |
| | 1,000,000 | HD Supply, Inc. 144A restricted, 5.375%, 10/15/26 | | 1,060,000 |
| | 500,000 | JELD-WEN, Inc. 144A restricted, 4.625%, 12/15/25 | | 514,750 |
| | | | | 3,989,000 |
| | | Basic Industry – Chemicals — 4.88% | | |
| | 1,750,000 | Koppers Inc. 144A restricted, 6.00%, 02/15/25 | | 1,833,125 |
| | 1,500,000 | PolyOne Corporation 5.25%, 03/15/23 | | 1,616,415 |
| | 1,680,000 | Valvoline Inc. 5.50%, 07/15/24 | | 1,743,000 |
| | | | | 5,192,540 |
| | | Basic Industry – Forestry & Paper — 2.43% | | |
| | 1,500,000 | Louisiana-Pacific Corporation 4.875%, 09/15/24 | | 1,550,625 |
| | 1,000,000 | Mercer International Inc. 6.50%, 02/01/24 | | 1,037,500 |
| | | | | 2,588,125 |
| | | Basic Industry – Metal/Mining Excluding Steel — 3.44% | | |
| | 500,000 | Alcoa Nederland Holding B.V. 144A restricted, 6.75%, 09/30/24 | | 526,045 |
| | 1,000,000 | Arconic Inc. 5.125%, 10/01/24 | | 1,090,000 |
| | 1,000,000 | Grinding Media Inc. 144A restricted, 7.375%, 12/15/23 | | 1,018,750 |
| | 1,000,000 | Kaiser Aluminum Corporation 144A restricted, 4.625%, 03/01/28 | | 1,026,000 |
| | | | | 3,660,795 |
| | | Basic Industry – Steel Producers & Products — 1.20% | | |
| | 1,500,000 | United States Steel Corporation 6.25%, 03/15/26 | | 1,282,650 |
| | | Capital Goods – Aerospace/Defense — 1.43% | | |
| | 1,000,000 | Moog Inc. 144A restricted, 4.25%, 12/15/27 | | 1,017,600 |
| | 500,000 | TransDigm Inc. 144A restricted, 5.50%, 11/15/27 | | 505,615 |
| | | | | 1,523,215 |
The accompanying notes to financial statements are an integral part of this schedule.
– 11 –
Schedule of Investments(continued)
December 31, 2019
| | | | |
| | Shares or | | | |
| | Principal | | | |
| | Amount | | | Value |
| | NON-CONVERTIBLE BONDS — 89.12% (continued) | | |
| | | Capital Goods – Diversified — 0.96% | | |
| $ | 1,000,000 | Park-Ohio Industries, Inc. 6.625%, 04/15/27 | $ | 1,018,055 |
| | | Capital Goods – Machinery — 0.97% | | |
| | 1,000,000 | Terex Corporation 144A restricted, 5.625%, 02/01/25 | | 1,032,500 |
| | | Capital Goods – Packaging — 3.99% | | |
| | 500,000 | Ball Corporation 4.00%, 11/15/23 | | 525,000 |
| | 1,000,000 | Ball Corporation 5.25%, 07/01/25 | | 1,113,750 |
| | 500,000 | Crown Americas LLC 4.25%, 09/30/26 | | 524,375 |
| | 1,500,000 | Reynolds Group Holdings Limited 144A restricted, 5.125%, 07/15/23 | | 1,535,625 |
| | 500,000 | Sealed Air Corporation 144A restricted, 5.50%, 09/15/25 | | 550,000 |
| | | | | 4,248,750 |
| | | Consumer Goods – Food-Wholesale — 3.97% | | |
| | 1,000,000 | JBS USA, LLC/Finance, Inc. 144A restricted, 5.875%, 07/15/24 | | 1,029,000 |
| | 1,000,000 | Lamb Weston Holdings, Inc. 144A restricted, 4.625%, 11/01/24 | | 1,061,250 |
| | 1,000,000 | Lamb Weston Holdings, Inc. 144A restricted, 4.875%, 11/01/26 | | 1,060,000 |
| | 1,000,000 | Post Holdings, Inc. 144A restricted, 5.625%, 01/15/28 | | 1,077,500 |
| | | | | 4,227,750 |
| | | Consumer Goods – Personal & Household Products — 0.97% | | |
| | 500,000 | Newell Rubbermaid Inc. 4.20%, 04/01/26 | | 521,378 |
| | 500,000 | Tempur Sealy International, Inc. 5.625%, 10/15/23 | | 514,375 |
| | | | | 1,035,753 |
| | | Energy – Exploration & Production — 0.45% | | |
| | 500,000 | Oasis Petroleum Inc. 6.875%, 03/15/22 | | 481,250 |
| | | Energy – Gas-Distribution — 5.08% | | |
| | 500,000 | Cheniere Corpus Christi Holdings, LLC 5.125%, 06/30/27 | | 552,590 |
| | 500,000 | Cheniere Energy Partners, L.P. 144A restricted, 4.50%, 10/01/29 | | 513,800 |
| | 1,550,000 | MPLX LP 144A restricted, 5.25%, 01/15/25 | | 1,628,032 |
| | 1,400,000 | Suburban Propane Partners L.P. 5.50%, 06/01/24 | | 1,438,500 |
| | 1,000,000 | Transcontinental Gas Pipe Line Company, LLC 7.85%, 02/01/26 | | 1,270,959 |
| | | | | 5,403,881 |
| | | Energy – Oil Field Equipment & Services — 0.98% | | |
| | 500,000 | Archrock Partners, L.P. 144A restricted, 6.25%, 04/01/28 | | 515,000 |
| | 500,000 | Transocean Inc. 144A restricted, 9.00%, 07/15/23 | | 528,125 |
| | | | | 1,043,125 |
| | | Financial Services – Brokerage — 1.97% | | |
| | 2,000,000 | LPL Holdings, Inc. 144A restricted, 5.75%, 09/15/25 | | 2,092,500 |
The accompanying notes to financial statements are an integral part of this schedule.
– 12 –
Schedule of Investments(continued)
December 31, 2019
| | | | |
| | Shares or | | | |
| | Principal | | | |
| | Amount | | | Value |
| | NON-CONVERTIBLE BONDS — 89.12% (continued) | | |
| | | Financial Services – Consumer, Commercial | | |
| | | & Lease Financing — 0.51% | | |
| $ | 500,000 | Springleaf Finance Corporation 6.125%, 03/15/24 | $ | 547,500 |
| | | Healthcare – Facilities — 2.73% | | |
| | 1,000,000 | HCA Inc. 5.00%, 03/15/24 | | 1,093,167 |
| | 750,000 | HealthSouth Corporation 5.75%, 09/15/25 | | 785,625 |
| | 1,000,000 | Tenet Healthcare Corporation 5.125%, 05/01/25 | | 1,030,000 |
| | | | | 2,908,792 |
| | | Healthcare – Services — 4.15% | | |
| | 1,000,000 | DaVita HealthCare Partners Inc. 5.125%, 07/15/24 | | 1,025,000 |
| | 1,750,000 | IQVIA Inc. 144A restricted, 5.00%, 05/15/27 | | 1,851,246 |
| | 1,500,000 | Service Corporation International 5.375%, 05/15/24 | | 1,545,000 |
| | | | | 4,421,246 |
| | | Leisure – Gaming — 1.06% | | |
| | 1,000,000 | International Game Technology PLC 144A restricted, 6.25%, 01/15/27 | | 1,125,000 |
| | | Leisure – Hotels — 1.49% | | |
| | 1,500,000 | Wyndham Hotels & Resorts, Inc. 144A restricted, 5.375%, 04/15/26 | | 1,582,500 |
| | | Leisure – Recreation & Travel — 1.21% | | |
| | 750,000 | NCL Corporation Ltd. 144A restricted, 3.625%, 12/15/24 | | 760,312 |
| | 500,000 | Viking Ocean Cruises Ltd 144A restricted, 5.00%, 02/15/28 | | 523,750 |
| | | | | 1,284,062 |
| | | Leisure – Theaters & Entertainment — 0.95% | | |
| | 1,000,000 | Cinemark USA, Inc. 5.125%, 12/15/22 | | 1,011,000 |
| | | Media – Cable & Satellite TV — 1.56% | | |
| | 73,000 | CCO Holdings, LLC 5.75%, 01/15/24 | | 74,277 |
| | 1,500,000 | CCO Holdings, LLC 144A restricted, 5.125%, 05/01/27 | | 1,582,500 |
| | | | | 1,656,777 |
| | | Media – Content — 1.90% | | |
| | 1,500,000 | AMC Networks Inc. 4.75%, 08/01/25 | | 1,505,625 |
| | 500,000 | Netflix, Inc. 4.375%, 11/15/26 | | 512,500 |
| | | | | 2,018,125 |
| | | Media – Diversified — 0.47% | | |
| | 500,000 | Twitter, Inc. 144A restricted, 3.875%, 12/15/27 | | 499,740 |
| | | Real Estate – REITs — 1.97% | | |
| | 1,000,000 | Brookfield Property REIT Inc. 144A restricted, 5.75%, 05/15/26 | | 1,055,000 |
| | 500,000 | MPT Operating Partnership, L.P. 5.00%, 10/15/27 | | 530,000 |
| | 500,000 | MPT Operating Partnership, L.P. 4.625%, 08/01/29 | | 515,000 |
| | | | | 2,100,000 |
The accompanying notes to financial statements are an integral part of this schedule.
– 13 –
Schedule of Investments(continued)
December 31, 2019
| | | | |
| | Shares or | | | |
| | Principal | | | |
| | Amount | | | Value |
| | NON-CONVERTIBLE BONDS — 89.12% (continued) | | |
| | | Retail – Food & Drug Retailer — 0.50% | | |
| $ | 500,000 | Murphy Oil USA, Inc. 4.75%, 09/15/29 | $ | 528,035 |
| | | Retail – Specialty Retail — 1.92% | | |
| | 1,000,000 | Levi Strauss & Co. 5.00%, 05/01/25 | | 1,030,000 |
| | 1,000,000 | Wolverine World Wide, Inc. 144A restricted, 5.00%, 09/01/26 | | 1,015,000 |
| | | | | 2,045,000 |
| | | Services – Environmental — 0.99% | | |
| | 1,000,000 | Covanta Holding Corporation 5.875%, 07/01/25 | | 1,055,000 |
| | | Services – Support-Services — 11.41% | | |
| | 1,500,000 | ADT Corporation (The) 3.50%, 07/15/22 | | 1,527,195 |
| | 1,500,000 | Aramark Services, Inc. 5.125%, 01/15/24 | | 1,539,300 |
| | 138,000 | Hertz Corporation (The) 144A restricted, 7.625%, 06/01/22 | | 143,520 |
| | 1,500,000 | IHS Markit Ltd. 144A restricted, 4.75%, 02/15/25 | | 1,638,630 |
| | 1,500,000 | Iron Mountain Incorporated 144A restricted, 4.875%, 09/15/27 | | 1,548,750 |
| | 1,850,000 | KAR Auction Services, Inc. 144A restricted, 5.125%, 06/01/25 | | 1,924,000 |
| | 1,500,000 | Ritchie Bros. Auctioneers Incorporated | | |
| | | 144A restricted, 5.375%, 01/15/25 | | 1,563,750 |
| | 673,000 | ServiceMaster Company, LLC (The) | | |
| | | 144A restricted, 5.125%, 11/15/24 | | 698,238 |
| | 1,500,000 | United Rentals (North America), Inc. 5.50%, 07/15/25 | | 1,558,595 |
| | | | | 12,141,978 |
| | | Technology & Electronics – Electronics — 1.03% | | |
| | 1,000,000 | Amkor Technology, Inc. 144A restricted, 6.625%, 09/15/27 | | 1,101,250 |
| | | Technology & Electronics – Hardware & Equipment — 1.27% | | |
| | 750,000 | CDW LLC 5.50%, 12/01/24 | | 832,500 |
| | 500,000 | CDW LLC 4.25%, 04/01/28 | | 524,375 |
| | | | | 1,356,875 |
| | | Technology & Electronics – Software & Services — 1.00% | | |
| | 1,000,000 | SS&C Technologies, Inc. 144A restricted, 5.50%, 09/30/27 | | 1,067,500 |
| | | Telecommunications – Wireless — 1.45% | | |
| | 500,000 | SBA Communications Corporation 4.875%, 09/01/24 | | 518,750 |
| | 1,000,000 | T-Mobile USA, Inc. 4.50%, 02/01/26 | | 1,025,000 |
| | | | | 1,543,750 |
| | | Telecommunications – Wireline Integrated & Services — 3.92% | | |
| | 1,000,000 | Cincinnati Bell Inc. 144A restricted, 7.00%, 07/15/24 | | 1,048,750 |
| | 1,500,000 | Equinix, Inc. 5.875%, 01/15/26 | | 1,591,890 |
| | 1,500,000 | Zayo Group, LLC 6.00%, 04/01/23 | | 1,533,750 |
| | | | | 4,174,390 |
The accompanying notes to financial statements are an integral part of this schedule.
– 14 –
Schedule of Investments(continued)
December 31, 2019
| | | | |
| | Shares or | | | |
| | Principal | | | |
| | Amount | | | Value |
| | NON-CONVERTIBLE BONDS — 89.12% (continued) | | |
| | | Transportation – Infrastructure/Services — 1.69% | | |
| $ | 250,000 | XPO Logistics, Inc. 144A restricted, 6.50%, 06/15/22 | $ | 254,750 |
| | 1,500,000 | XPO Logistics, Inc. 144A restricted, 6.125%, 09/01/23 | | 1,548,450 |
| | | | | 1,803,200 |
| | | Utility – Electric-Generation — 0.98% | | |
| | 500,000 | Dynegy Inc. 5.875%, 06/01/23 | | 511,520 |
| | 500,000 | Vistra Operations Company LLC 144A restricted, 5.50%, 09/01/26 | | 530,000 |
| | | | | 1,041,520 |
| | | TOTAL NON-CONVERTIBLE BONDS | | |
| | | (cost $91,679,121) | | 94,869,179 |
| | CONVERTIBLE PREFERRED STOCK — 0.53% | | |
| | | Real Estate – REITs — 0.53% | | |
| | 21,859 | Digital Realty Trust, Inc. 5.25%, Cumulative, Redeemable, Series J | | |
| | | (cost $523,345) | | 563,306 |
| | COMMON STOCKS — 1.70% | | |
| | | Energy — 0.58% | | |
| | 22,000 | Enterprise Products Partners L.P. | | 619,520 |
| | | Other — 1.12% | | |
| | 55,000 | Eaton Vance Floating-Rate Income Trust | | 754,600 |
| | 5,000 | iShares iBoxx $ High Yield Corporate Bond ETF | | 439,700 |
| | | | | 1,194,300 |
| | | TOTAL COMMON STOCKS | | |
| | | (cost $1,795,783) | | 1,813,820 |
The accompanying notes to financial statements are an integral part of this schedule.
– 15 –
Schedule of Investments(continued)
December 31, 2019
| | | | |
| | Shares or | | | |
| | Principal | | | |
| | Amount | | | Value |
| SHORT-TERM INVESTMENTS — 7.41% | | |
| | | U.S. Government Securities — 6.29% | | |
| $ | 1,300,000 | U.S. Treasury Bill 01/02/2020, 1.550% | $ | 1,299,945 |
| | 1,300,000 | U.S. Treasury Bill 01/14/2020, 1.497% | | 1,299,307 |
| | 1,000,000 | U.S. Treasury Bill 01/21/2020, 1.513% | | 999,171 |
| | 1,300,000 | U.S. Treasury Bill 02/04/2020, 1.494% | | 1,298,194 |
| | 1,300,000 | U.S. Treasury Bill 02/11/2020, 1.512% | | 1,297,796 |
| | 500,000 | U.S. Treasury Bill 02/25/2020, 1.431% | | 498,924 |
| | | | | 6,693,337 |
| | | Money Market Fund — 1.12% | | |
| | 1,194,766 | Morgan Stanley Liquidity Funds | | |
| | | Government Portfolio (Institutional Class), 7-day net yield 1.51% | | 1,194,766 |
| | | TOTAL SHORT-TERM INVESTMENTS | | |
| | | (cost $7,888,103) | | 7,888,103 |
| | | TOTAL INVESTMENTS | | |
| | | (cost $101,886,352) — 98.76% | | 105,134,408 |
| | | OTHER ASSETS, NET OF LIABILITIES — 1.24% | | 1,315,669 |
| | | TOTAL NET ASSETS | | |
| | | (basis of percentages disclosed above) — 100% | $ | 106,450,077 |
Securities purchased pursuant to Rule 144A under the Securities Act of 1933 may be sold in transactions exempt from registration only to qualified institutional buyers or in a public offering registered under the Securities Act of 1933.
The accompanying notes to financial statements are an integral part of this schedule.
– 16 –
Statement of Assets and Liabilities
December 31, 2019
| | | |
| ASSETS | | | |
| Investments in securities at value (cost $101,886,352) | $ | 105,134,408 | |
| Dividend and interest receivables | | 1,410,995 | |
| Other | | 25,908 | |
| Total assets | | 106,571,311 | |
| |
| LIABILITIES | | | |
| Payables — | | | |
| Due to adviser — | | | |
| Management fee | | 38,464 | |
| Accounting and administrative fee | | 4,110 | |
| Total due to adviser | | 42,574 | |
| 12b-1 and servicing fee | | 23,345 | |
| Other payables and accrued expense | | 55,315 | |
| Total liabilities | | 121,234 | |
| Total net assets | $ | 106,450,077 | |
| |
| NET ASSETS CONSIST OF | | | |
| Paid in capital | $ | 114,083,340 | |
| Accumulated distributable earnings (loss) | | (7,633,263 | ) |
| Total net assets | $ | 106,450,077 | |
| |
| Class I | | | |
| Net assets | $ | 104,641,433 | |
| Shares outstanding | | 11,589,105 | |
| NET ASSET VALUE PER SHARE ($.05 par value, 75,000,000 | | | |
| shares authorized), offering price and redemption price | $ | 9.03 | |
| |
| Class N | | | |
| Net assets | $ | 1,808,644 | |
| Shares outstanding | | 196,541 | |
| NET ASSET VALUE PER SHARE ($.05 par value, 25,000,000 | | | |
| shares authorized), offering price and redemption price | $ | 9.20 | |
The accompanying notes to financial statements are an integral part of this statement.
– 17 –
Statement of Operations
For the year ended December 31, 2019
| | | |
| INCOME | | | |
| Interest | $ | 5,016,609 | |
| Dividend | | 71,866 | |
| Other | | 56,550 | |
| Total income | | 5,145,025 | |
| |
| EXPENSES | | | |
| Management fee | | 459,317 | |
| Transfer agent fees | | 56,016 | |
| Accounting and administrative fees | | 50,000 | |
| Accounting system and pricing service fees | | 45,123 | |
| Registration fees | | 38,917 | |
| Audit and tax fees | | 35,261 | |
| Directors’ fees | | 15,875 | |
| Legal fees | | 12,199 | |
| Printing | | 11,543 | |
| Postage and mailing | | 5,403 | |
| Custodian fees | | 5,183 | |
| Insurance | | 4,477 | |
| 12b-1 fees – Class N | | 2,358 | |
| Servicing fees – Class N | | 805 | |
| Other operating expenses | | 9,049 | |
| Total expenses | | 751,526 | |
| Net investment income | | 4,393,499 | |
| |
| NET REALIZED LOSS ON INVESTMENTS | | (657,127 | ) |
| |
| CHANGE IN NET UNREALIZED APPRECIATION/DEPRECIATION | | | |
| ON INVESTMENTS | | 8,363,809 | |
| Net realized and unrealized gain on investments | | 7,706,682 | |
| Net increase in net assets resulting from operations | $ | 12,100,181 | |
The accompanying notes to financial statements are an integral part of this statement.
– 18 –
Statements of Changes in Net Assets
For the years ended December 31, 2019 and 2018
| | | | | | |
| | | 2019 | | | 2018 | |
| INCREASE (DECREASE) IN | | | | | | |
| NET ASSETS FROM OPERATIONS | | | | | | |
| Net investment income | $ | 4,393,499 | | $ | 4,463,083 | |
| Net realized loss on investments | | (657,127 | ) | | (2,007,934 | ) |
| Change in net unrealized | | | | | | |
| appreciation/depreciation on investments | | 8,363,809 | | | (5,383,118 | ) |
| Net increase (decrease) in net | | | | | | |
| assets resulting from operations | | 12,100,181 | | | (2,927,969 | ) |
| |
| DISTRIBUTIONS TO SHAREHOLDERS | | | | | | |
| Investment operations – Class I | | (4,334,022 | ) | | (4,360,774 | ) |
| Investment operations – Class N | | (59,671 | ) | | (105,877 | ) |
| Total distributions | | (4,393,693 | ) | | (4,466,651 | ) |
| |
| CAPITAL SHARE TRANSACTIONS | | | | | | |
| Proceeds from shares issued – Class I | | | | | | |
| (272,316 and 256,850 shares, respectively) | | 2,416,467 | | | 2,269,129 | |
| Reinvestment of distributions – Class I | | | | | | |
| (435,716 and 454,830 shares, respectively) | | 3,900,532 | | | 3,917,803 | |
| Cost of shares redeemed – Class I | | | | | | |
| (481,379 and 663,437 shares, respectively) | | (4,284,667 | ) | | (5,819,770 | ) |
| Proceeds from shares issued – Class N | | | | | | |
| (212,399 and 183,503 shares, respectively) | | 1,926,595 | | | 1,647,518 | |
| Reinvestment of distributions – Class N | | | | | | |
| (5,216 and 10,485 shares, respectively) | | 47,574 | | | 91,935 | |
| Cost of shares redeemed – Class N | | | | | | |
| (300,184 and 273,637 shares, respectively) | | (2,682,908 | ) | | (2,457,083 | ) |
| Change in net assets derived from | | | | | | |
| capital share transactions | | 1,323,593 | | | (350,468 | ) |
| Total increase (decrease) in net assets | | 9,030,081 | | | (7,745,088 | ) |
| |
| NET ASSETS | | | | | | |
| Beginning of period | | 97,419,996 | | | 105,165,084 | |
| End of period | $ | 106,450,077 | | $ | 97,419,996 | |
The accompanying notes to financial statements are an integral part of these statements.
– 19 –
Notes to Financial Statements
December 31, 2019
(1) Summary of Significant Accounting Policies —
Nicholas High Income Fund, Inc. (the “Fund”) is organized as a Maryland corporation
and is registered as an open-end, diversified management investment company under
the Investment Company Act of 1940, as amended. The primary objective of the Fund is
high current income consistent with the preservation and conservation of capital values.
The following is a summary of the significant accounting policies of the Fund:
(a) Equity securities traded on a stock exchange will ordinarily be valued on the basis of
the last sale price on the date of valuation on the securities principal exchange, or if
in the absence of any sale on that day, the closing bid price. For securities
principally traded on the NASDAQ market, the Fund uses the NASDAQ Official
Closing Price. Investments in shares of open-end mutual funds, including money
market funds, are valued at their daily net asset value, which is calculated as of the
close of regular trading on the New York Stock Exchange. Debt securities, excluding
short-term investments, are valued at their current evaluated bid price as determined
by an independent pricing service, which generates evaluations on the basis of
dealer quotes for normal institutional-sized trading units, issuer analysis, bond
market activity and various other factors. Securities for which market quotations
may not be readily available are valued at their fair value as determined in good faith
by procedures adopted by the Board of Directors. Short-term investments
purchased at par are valued at cost, which approximates market value. Short-term
investments purchased at a premium or discount are stated at amortized cost, which
approximates market value. The Fund did not maintain any positions in derivative
instruments or engage in hedging activities during the year. Investment transactions
for financial statement purposes are recorded on trade date.
In accordance with Accounting Standards Codification (“ASC”) 820-10, “Fair Value
Measurements and Disclosures” (“ASC 820-10”), fair value is defined as the price
that the Fund would receive upon selling an investment in a timely transaction to an
independent buyer in the principal or most advantageous market of the investment.
ASC 820-10 established a three-tier hierarchy to maximize the use of observable
market data and minimize the use of unobservable inputs and to establish
classification of fair value measurements for disclosure purposes. Inputs refer
broadly to the assumptions that market participants would use in pricing the asset
or liability, including assumptions about risk, for example, the risk inherent in a
particular valuation technique used to measure fair value such as a pricing model
and/or the risk inherent in the inputs to the valuation technique. Inputs may be
observable or unobservable. Observable inputs are inputs that reflect the
assumptions market participants would use in pricing the asset or liability based on
market data obtained from sources independent of the reporting entity.
Unobservable inputs are inputs that reflect the reporting entity’s own assumptions
about the assumptions market participants would use in pricing the asset or liability
based on the best information available in the circumstances. The three-tier
hierarchy of inputs is summarized in the three broad levels listed below.
– 20 –
Notes to Financial Statements(continued)
December 31, 2019
Level 1 – quoted prices in active markets for identical investments
Level 2 – other significant observable inputs (including quoted prices for
similar investments, interest rates, benchmark yields, bids, offers,
transactions, spreads and other relationships observed in the
markets among market securities, underlying equity of the issuer,
proprietary pricing models, credit risk, etc.)
Level 3 – significant unobservable inputs (including the Fund’s own
assumptions in determining the fair value of investments)
The inputs or methodology used for valuing securities are not necessarily an
indication of the risk associated with investing in those securities.
The following is a summary of the inputs used as of December 31, 2019 in valuing
the Fund’s investments carried at value:
| | |
| | | Investments |
| Valuation Inputs | | in Securities |
| Level 1 – | | |
| Common Stocks(1) | $ | 1,813,820 |
| Money Market Fund | | 1,194,766 |
| Level 2 – | | |
| Non-Convertible Bonds(1) | | 94,869,179 |
| Convertible Preferred Stock(1) | | 563,306 |
| U.S. Government Securities | | 6,693,337 |
| Level 3 – | | |
| None | | — |
| Total | $ | 105,134,408 |
| | |
| (1)See Schedule of Investments for further detail by industry. | | |
The Fund did not hold any Level 3 investments during the year.
(b) Net realized gain (loss) on portfolio securities was computed on the basis of
specific identification.
(c) Dividend income is recorded on the ex-dividend date, and interest income is
recognized on an accrual basis. Non-cash dividends, if any, are recorded at value
on date of distribution. Generally, discounts and premiums on long-term debt
security purchases, if any, are amortized over the expected lives of the respective
securities using the effective yield method.
(d) Provision has not been made for federal income taxes or excise taxes since the
Fund has elected to be taxed as a “regulated investment company” and intends to
distribute substantially all net investment income and net realized capital gains on
sales of investments to its shareholders and otherwise comply with the provisions
of Subchapter M of the Internal Revenue Code applicable to regulated investment
companies.
Investment income, net capital gains (losses) and all expenses incurred by the Fund
are allocated based on the relative net assets of each class, except for 12b-1 and
– 21 –
Notes to Financial Statements(continued)
December 31, 2019
shareholder servicing fees and certain other fees and expenses related to one class
of shares.
Class N shares are subject to a 0.25% 12b-1 fee and a 0.10% servicing fee, as
described in its prospectus. The 12b-1 fee from May 1, 2019 and the servicing fee
from May 1, 2017 through November 4, 2019 were voluntarily reduced to 0.10%
and 0.06%, respectively and from November 5, 2019 through period end were
reduced to 0.05% and 0.00%, respectively. Income, expenses (other than expenses
attributable to a specific class), and realized and unrealized gains and losses are
allocated daily to each class of shares based upon the relative net asset value of
outstanding shares.
(e) Dividends and distributions paid to shareholders are recorded on the ex-dividend
date. Distributions from net investment income are generally declared and paid at
least quarterly. Distributions of net realized capital gain, if any, are declared and
paid at least annually.
The amount of distributions from net investment income and net realized capital
gain are determined in accordance with federal income tax regulations, which may
differ from U.S. generally accepted accounting principles (“U.S. GAAP”) for
financial reporting purposes. Financial reporting records are adjusted for permanent
book-to-tax differences to reflect tax character. At December 31, 2019, no
reclassifications were recorded.
The tax character of distributions paid during the years ended December 31 was as
follows:
| | | | |
| | | 12/31/2019 | | 12/31/2018 |
| Distributions paid from: | | | | |
| Ordinary income | $ | 4,393,693 | $ | 4,466,651 |
As of December 31, 2019, investment cost for federal tax purposes was
$101,913,467 and the tax basis components of net assets were as follows:
| | | |
| Unrealized appreciation | $ | 3,456,560 | |
| Unrealized depreciation | | (235,619 | ) |
| Net unrealized appreciation | | 3,220,941 | |
| Undistributed ordinary income | | 49,387 | |
| Accumulated net realized capital loss | | (10,903,591 | ) |
| Paid in capital | | 114,083,340 | |
| Net assets | $ | 106,450,077 | |
The difference between financial statement and tax-basis cost is attributable
primarily to the tax deferral of wash sales losses.
As of December 31, 2019, the Fund has capital loss carryforwards of approximately
$10,904,000, which have no expiration date. To the extent the Fund has future net
realized capital gains, distributions of capital gains to shareholders will be offset by
any unused capital loss carryforwards.
– 22 –
Notes to Financial Statements(continued)
December 31, 2019
The Fund had no material uncertain tax positions and has not recorded a liability for
unrecognized tax benefits as of December 31, 2019. Also, the Fund recognized no
interest and penalties related to uncertain tax benefits during the year ended
December 31, 2019. At December 31, 2019, the fiscal years 2016 through 2019
remain open to examination in the Fund’s major tax jurisdictions.
(f) The Fund is considered an investment company under U.S. GAAP and follows the
accounting and reporting guidance applicable to investment companies in the
Financial Accounting Standards Board (“FASB”) ASC 946, “Financial Services –
Investment Companies.” U.S. GAAP guidance requires management to make
estimates and assumptions that effect the amounts reported in the financial
statements and accompanying notes. Actual results could differ from estimates.
(g) In the normal course of business the Fund enters into contracts that contain
general indemnification clauses. The Fund’s maximum exposure under these
arrangements is unknown, as this would involve future claims against the Fund that
have not yet occurred. Based on experience, the Fund expects the risk of loss to be
remote.
(h) In connection with the preparation of the Fund’s financial statements, management
evaluated subsequent events after the date of the Statement of Assets and
Liabilities of December 31, 2019. There have been no material subsequent events
since December 31, 2019 that would require adjustment to or additional disclosure
in these financial statements.
(2) Related Parties —
(a) Investment Adviser and Management Agreement —
The Fund has an agreement with Nicholas Company, Inc. (with whom certain
officers and directors of the Fund are affiliated) (the “Adviser”) to serve as
investment adviser and manager. Under the terms of the agreement, a monthly fee
is paid to the Adviser based on an annualized fee of 0.50% of the average net asset
value up to and including $50 million, 0.40% of the average net asset value in
excess of $50 million and up to and including $100 million and 0.30% of the
average net asset value in excess of $100 million.
The Adviser may be paid for accounting and administrative services rendered by its
personnel, subject to the following guidelines: (i) up to five basis points, on an
annual basis, of the average net asset value of the Fund up to and including
$2 billion and up to three basis points, on an annual basis, of the average net asset
value of the Fund greater than $2 billion, based on the average net asset value of
the Fund as determined by valuations made at the close of each business day of
each month, and (ii) where the preceding calculation results in an annual payment
of less than $50,000, the Adviser, in its discretion, may charge the Fund up to
$50,000 for such services.
(b) Legal Counsel —
A director of the Adviser is affiliated with a law firm that provides services to the
Fund. The Fund incurred expenses of $6,830 for the year ended December 31, 2019
for legal services rendered by this law firm.
– 23 –
Notes to Financial Statements(continued)
December 31, 2019
(3) Investment Transactions —
For the year ended December 31, 2019, the cost of purchases and the proceeds from
sales of investment securities, other than short-term obligations, aggregated
$31,646,756 and $28,593,576, respectively.
(4) Concentration of Risk —
The Fund invests primarily in high yield debt securities. The market values of these high
yield debt securities tend to be more sensitive to economic conditions and individual
corporate developments than those of higher rated securities. In addition, the market for
these securities is generally less liquid than for higher rated securities.
(5) New Accounting Pronouncement —
On August 28, 2018, the FASB issued Accounting Standards Update (“ASU”) 2018-13,
“Disclosure Framework – Changes to the Disclosure Requirements for Fair Value
Measurement,” which amends the fair value measurement disclosure requirements of
ASC 820. The amendments of ASU 2018-13 include new, eliminated, and modified
disclosure requirements of ASC 820. In addition, the amendments clarify that materiality
is an appropriate consideration of entities when evaluating disclosure requirements. The
ASU is effective for fiscal years beginning after December 15, 2019, including interim
periods therein. Early adoption is permitted for any eliminated or modified disclosures
upon issuance of this ASU. The Fund has early adopted ASU 2018-13 for these financial
statements.
– 24 –
Report of Independent Registered Public Accounting Firm
To the shareholders and Board of Directors of Nicholas High Income Fund, Inc.
Opinion on the Financial Statements and Financial Highlights
We have audited the accompanying statement of assets and liabilities of Nicholas High Income Fund, Inc. (the “Fund”), including the schedule of investments, as of December 31, 2019, the related statement of operations for the year then ended, the statements of changes in net assets for each of the two years in the period then ended, the financial highlights for each of the five years in the period then ended, and the related notes. In our opinion, the financial statements and financial highlights present fairly, in all material respects, the financial position of the Fund as of December 31, 2019, and the results of its operations for the year then ended, the changes in its net assets for each of the two years in the period then ended, and the financial highlights for each of the five years in the period then ended, in conformity with accounting principles generally accepted in the United States of America.
Basis for Opinion
These financial statements and financial highlights are the responsibility of the Fund’s management. Our responsibility is to express an opinion on the Fund’s financial statements and financial highlights based on our audits. We are a public accounting firm registered with the Public Company Accounting Oversight Board (United States) (PCAOB) and are required to be independent with respect to the Fund in accordance with the U.S. federal securities laws and the applicable rules and regulations of the Securities and Exchange Commission and the PCAOB.
We conducted our audits in accordance with the standards of the PCAOB. Those standards require that we plan and perform the audit to obtain reasonable assurance about whether the financial statements and financial highlights are free of material misstatement, whether due to error or fraud. The Fund is not required to have, nor were we engaged to perform, an audit of its internal control over financial reporting. As part of our audits we are required to obtain an understanding of internal control over financial reporting but not for the purpose of expressing an opinion on the effectiveness of the Fund’s internal control over financial reporting. Accordingly, we express no such opinion.
Our audits included performing procedures to assess the risks of material misstatement of the financial statements and financial highlights, whether due to error or fraud, and performing procedures that respond to those risks. Such procedures included examining, on a test basis, evidence regarding the amounts and disclosures in the financial statements and financial highlights. Our audits also included evaluating the accounting principles used and significant estimates made by management, as well as evaluating the overall presentation of the financial statements and financial highlights. Our procedures included confirmation of securities owned as of December 31, 2019, by correspondence with the custodian and brokers. We believe that our audits provide a reasonable basis for our opinion.

Milwaukee, Wisconsin
February 28, 2020
We have served as the auditor of one or more Nicholas investment companies since 1977.
– 25 –
Historical Record Class I(1)
(unaudited)
| | | | | | | |
| | | Net | | Net Investment | | | Growth of an |
| | | Asset Value | | Income Distributions | | | Initial $10,000 |
| | | Per Share | | Per Share | | | Investment(3) |
| November 21, 1977(2) | $ | 25.50 | $ | — | | $ | 10,000 |
| December 31, 1992 | | 16.90 | | 1.4775 | | | 35,143 |
| December 31, 1993 | | 17.60 | | 1.4450 | | | 39,695 |
| December 31, 1994 | | 16.05 | | 1.5050 | | | 39,626 |
| December 31, 1995 | | 17.10 | | 1.4750 | | | 46,029 |
| December 31, 1996 | | 17.65 | | 1.4800 | | | 51,721 |
| December 31, 1997 | | 18.45 | | 1.4515 | | | 58,514 |
| December 31, 1998 | | 16.95 | | 1.5775 | | | 58,788 |
| December 31, 1999 | | 15.30 | | 1.6560 | | | 58,749 |
| December 31, 2000 | | 12.00 | | 1.5300 | | | 51,620 |
| December 31, 2001 | | 11.80 | | 1.2150 | | | 56,144 |
| December 31, 2002 | | 9.65 | | 0.9925 | | | 50,459 |
| December 31, 2003 | | 10.95 | | 0.8450 | | | 61,937 |
| December 31, 2004 | | 11.15 | | 0.8200 | | | 67,915 |
| December 31, 2005 | | 10.50 | | 0.7895 | | | 68,849 |
| December 31, 2006 | | 10.70 | | 0.7455 | | | 75,221 |
| December 31, 2007 | | 10.18 | | 0.7502 | | | 76,820 |
| December 31, 2008 | | 7.18 | | 0.7140 | | | 58,955 |
| December 31, 2009 | | 9.09 | | 0.6581 | | | 80,426 |
| December 31, 2010 | | 9.52 | | 0.7230 | | | 90,876 |
| December 31, 2011 | | 9.28 | | 0.7070 | | | 95,354 |
| December 31, 2012 | | 9.86 | | 0.6375 | | | 108,095 |
| December 31, 2013 | | 9.86 | | 0.5757 | | | 114,488 |
| December 31, 2014 | | 9.52 | | 0.5065 | | | 116,347 |
| December 31, 2015 | | 8.65 | | 0.4592 | | | 111,068 |
| December 31, 2016 | | 9.08 | | 0.4204 | | | 122,109 |
| December 31, 2017 | | 9.00 | | 0.4675 | | | 127,333 |
| December 31, 2018 | | 8.36 | | 0.3876 | | | 123,690 |
| December 31, 2019 | | 9.03 | | 0.3806 | (a) | | 139,375 |
| (1) | Per share amounts presented for the periods prior to December 31, 2007 in this historical record have been restated or adjusted to reflect a reverse stock split of one share for every five shares outstanding effected on January 29, 2007. |
| (2) | Initial date under Nicholas Company, Inc. management. |
| (3) | Assuming reinvestment of distributions. |
| |
| (a) | Paid on April 24, 2019, $0.0954 to Class I shareholders of record as of April 23, 2019. Paid on July 24, 2019, $0.0968 to Class I shareholders of record as of July 23, 2019. Paid on October 23, 2019, $0.0940 to Class I shareholders of record as of October 22, 2019. Paid on December 30, 2019, $0.0944 to Class I shareholders of record as of December 27, 2019. |
| |
| | The Fund distributed no capital gains for the time periods listed. |
– 26 –
Historical Record Class N(1)
(unaudited)
| | | | | | | |
| | | Net | | Net Investment | | | Growth of an |
| | | Asset Value | | Income Distributions | | | Initial $10,000 |
| | | Per Share | | Per Share | | | Investment(3) |
| February 28, 2005(2) | $ | 11.20 | $ | — | | $ | 10,000 |
| December 31, 2005 | | 10.40 | | 0.7320 | | | 9,947 |
| December 31, 2006 | | 10.60 | | 0.7140 | | | 10,846 |
| December 31, 2007 | | 10.06 | | 0.7119 | | | 11,018 |
| December 31, 2008 | | 7.24 | | 0.5238 | | | 8,448 |
| December 31, 2009 | | 9.18 | | 0.6323 | | | 11,501 |
| December 31, 2010 | | 9.64 | | 0.6683 | | | 12,946 |
| December 31, 2011 | | 9.39 | | 0.6782 | | | 13,522 |
| December 31, 2012 | | 9.98 | | 0.6062 | | | 15,275 |
| December 31, 2013 | | 9.99 | | 0.5367 | | | 16,121 |
| December 31, 2014 | | 9.66 | | 0.4697 | | | 16,337 |
| December 31, 2015 | | 8.78 | | 0.4197 | | | 15,525 |
| December 31, 2016 | | 9.22 | | 0.3926 | | | 17,012 |
| December 31, 2017 | | 9.16 | | 0.4313 | | | 17,698 |
| December 31, 2018 | | 8.52 | | 0.3587 | | | 17,145 |
| December 31, 2019 | | 9.20 | | 0.3610 | (a) | | 19,257 |
| (1) | Per share amounts presented for the periods prior to December 31, 2007 in this historical record have been restated or adjusted to reflect a reverse stock split of one share for every five shares outstanding effected on January 29, 2007. |
| (2) | Initial Public Offering. |
| (3) | Assuming reinvestment of distributions. |
| |
| (a) | Paid on April 24, 2019, $0.0867 to Class N shareholders of record as of April 23, 2019. Paid on July 24, 2019, $0.0922 to Class N shareholders of record as of July 23, 2019. Paid on October 23, 2019, $0.0891 to Class N shareholders of record as of October 22, 2019. Paid on December 30, 2019, $0.0930 to Class N shareholders of record as of December 27, 2019. |
| |
| | The Fund distributed no capital gains for the time periods listed. |
| |
– 27 –
Approval of Investment Advisory Contract
(unaudited)
A discussion of the Approval by the Board of Directors of the Fund’s Investment Advisory Contract can be found in the Fund’s Semiannual Report dated June 30, 2019.
Information on Proxy Voting
(unaudited)
A description of the policies and procedures that the Fund uses to determine how to vote proxies relating to portfolio securities is available, without charge, upon request by calling 800-544-6547 or 414-276-0535. It also appears in the Fund’s Statement of Additional Information, which can be found on the SEC’s website, www.sec.gov. A record of how the Fund voted its proxies for the most recent twelve-month period ended June 30, also is available on the Fund’s website, www.nicholasfunds.com, and the SEC’s website, www.sec.gov.
Quarterly Portfolio Schedule
(unaudited)
The Fund files its complete schedule of investments with the SEC for the first and third quarters of each fiscal year as an exhibit to its reports on Form N-PORT (for first and third quarters ending March 31, 2019 or after). The Fund’s Form N-PORT reports are available on the SEC’s website at www.sec.gov and may be reviewed and copied at the SEC’s Public Reference Room in Washington, D.C. Information on the operation of the Public Reference Room may be obtained by calling 800-SEC-0330.
– 28 –
Directors and Officers of the Fund
(unaudited)
The following table sets forth the pertinent information about the Fund’s directors and officers as of December 31, 2019. Unless otherwise listed, the business address of each director and officer is 411 East Wisconsin Avenue, Milwaukee, WI 53202.
| | | | | | | |
| | | | | | | Number of | |
| | | | Term of | | | Portfolios | |
| | | Positions Office and | | Principal | in Fund | Other |
| | | Held | Length of | | Occupations | Complex Directorships |
| | | With | Time | | During Past | Overseen | Held |
| Name and Age | | Fund | Served | | 5 Years | by Director | by Director |
| INTERESTED DIRECTOR | | | | | | | |
| David O. Nicholas, CFA | | President | (3), 15 years | | President, Chief Executive | 5 | None |
| 58(1)(2) | | and | | | Officer, Chief Investment | | |
| | | Director | | | Officer and Director, | | |
| | | | | | Nicholas Company, Inc., | | |
| | | | | | the Adviser to the Fund. | | |
| | | | | | He also is the Lead Portfolio | |
| | | | | | Manager of Nicholas Fund, | | |
| | | | | | Inc., Nicholas II, Inc., | | |
| | | | | | Nicholas Limited Edition, Inc. | |
| | | | | | and Co-Portfolio | | |
| | | | | | Manager of Nicholas Equity | |
| | | | | | Income Fund, Inc. | | |
| DISINTERESTED DIRECTORS | | | | | |
| John A. Hauser | | Director | (3), 3 years | | Private Investor, January | 5 | None |
| 61 | | | | | 2017 to present. Senior Vice | |
| | | | | | President Trust and | | |
| | | | | | Community Relations, | | |
| | | | | | Nicolet Bank, October 2016 | |
| | | | | | to December 2016. | | |
| | | | | | Senior Vice President – | | |
| | | | | | Director of Wealth Services, | |
| | | | | | Nicolet Bank, April 2016 to | | |
| | | | | | October 2016. Prior to its | | |
| | | | | | acquisition by Nicolet Bank | | |
| | | | | | in April 2016, Mr. Hauser | | |
| | | | | | served in various senior | | |
| | | | | | management roles for Baylake | |
| | | | | | Bank from 1984 to 2008 and | |
| | | | | | from 2009 to April 2016. | | |
| | | | | | | |
| David P. Pelisek | | Director | (3),(4) | | Private Investor, | 5 | None |
| 60 | | | | | September 2016 to | | |
| | | | | | present. Managing Director, | |
| | | | | | Robert W. Baird & Co., | | |
| | | | | | Inc. and Partner, Baird Capital | |
| | | | | | Partners Buyout Funds I-V, | | |
| | | | | | January 1994 to May 2016. | |
– 29 –
Directors and Officers of the Fund(continued)
(unaudited)
| | | | | | |
| | | | | | Number of | |
| | | | Term of | | Portfolios | |
| | | Positions Office and | Principal | in Fund | Other |
| | | Held | Length of | Occupations | Complex Directorships |
| | | With | Time | During Past | Overseen | Held |
| Name and Age | | Fund | Served | 5 Years | by Director | by Director |
| Jay H. Robertson | | Director | (3), 25 years | Private Investor, April | 5 | None |
| 68 | | | | 2000 to present. | | |
| | | | | Chairman of the Board | | |
| | | | | of Robertson-Ryan and | | |
| | | | | Associates, Inc., an | | |
| | | | | insurance brokerage firm | | |
| | | | | from 1993 to March 2000. | | |
| | | | | | |
| | | | Term of | | | |
| | | Positions | Office and | | | |
| | | Held | Length of | | | |
| | | With | Time | | | |
| Name and Age | | Fund | Served | Principal Occupations During Past 5 Years |
| OFFICERS | | | | | | |
| David L. Johnson, CFA | | Executive | Annual, | Executive Vice President, Nicholas Company, Inc., |
| 77(2) | | Vice | 38 years | the Adviser to the Fund. | | |
| | | President | | | | |
| | | | |
| Lawrence J. Pavelec, CFA | | Senior | Annual, | Executive Vice President, Secretary and Chief |
| 61 | | Vice | 17 years | Operating Officer, Nicholas Company, Inc., the |
| | | President, | | Adviser to the Fund, and employed by the Adviser |
| | | Secretary | | since April 2003. He has been Portfolio Manager |
| | | and Portfolio | for Nicholas High Income Fund, Inc. since |
| | | Manager | | April 2008. | | |
| | | | |
| Jennifer R. Kloehn, CPA | | Senior | Annual, | Executive Vice President, Treasurer, Chief |
| 46 | | Vice | 3 years | Financial Officer and Chief Compliance |
| | | President, | | Officer, Nicholas Company, Inc. the Adviser |
| | | Treasurer | | to the Fund. Compliance Officer and Assistant |
| | | and Chief | | Vice President from July 2004 to April 2016. |
| | | Compliance | | | |
| | | Officer | | | | |
| | | | |
| Candace L. Lesak, CFP | | Vice | Annual, | Employee, Nicholas Company, Inc., the Adviser to |
| 62 | | President | 33 years | the Fund. | | |
| (1) | David O. Nicholas is the only director of the Fund who is an “interested person” of the Fund, as that term is defined in the 1940 Act. Mr. Nicholas is a Director of the Adviser and owns 60% of the outstanding voting securities of the Adviser. |
| (2) | David O. Nicholas is a nephew of David L. Johnson. |
| (3) | Until duly elected or re-elected at a subsequent annual meeting of the Fund. |
| (4) | David P. Pelisek was elected a Director of the Fund by shareholder vote on December 20, 2019. |
The Fund’s Statement of Additional Information includes additional information about the Fund directors and is available, without charge, upon request, by calling 800-544-6547 or 414-276-0535.
– 30 –
Privacy Policy
(unaudited)
Nicholas High Income Fund, Inc. respects each shareholder’s right to privacy. We are committed to safeguarding the information that you provide us to maintain and execute transactions on your behalf.
We collect the following non-public personal information about you:
| * | Information we receive from you on applications or other forms, whether we receive the form in writing or electronically. This includes, but is not limited to, your name, address, phone number, tax identification number, date of birth, beneficiary information and investment selection. |
| * | Information about your transactions with us and account history with us. This includes, but is not limited to, your account number, balances and cost basis information. This also includes transaction requests made through our transfer agent. |
| * | Other general information that we may obtain about you such as demographic information. |
WE DO NOT SELL ANY NON-PUBLIC PERSONAL INFORMATION ABOUT CURRENT OR FORMER SHAREHOLDERS.
INFORMATION SHARED WITH OUR TRANSFER AGENT, A THIRD PARTY COMPANY, ALSO IS NOT SOLD.
We may share, only as permitted by law, non-public personal information about you with third party companies. Listed below are some examples of third parties to whom we may disclose non-public personal information. While these examples do not cover every circumstance permitted by law, we hope they help you understand how your information may be shared.
We may share non-public personal information about you:
| * | With companies who work for us to service your accounts or to process transactions that you may request. This would include, but is not limited to, our transfer agent to process your transactions, mailing houses to send you required reports and correspondence regarding the Fund and its Adviser, the Nicholas Company, Inc., and our dividend disbursing agent to process fund dividend checks. |
| * | With a party representing you, with your consent, such as your broker or lawyer. |
| * | When required by law, such as in response to a subpoena or other legal process. |
The Fund and its Adviser maintain policies and procedures to safeguard your non-public personal information. Access is restricted to employees who the Adviser determines need the information in order to perform their job duties. To guard your non-public personal information we maintain physical, electronic, and procedural safeguards that comply with federal standards.
In the event that you hold shares of the Fund with a financial intermediary, including, but not limited to, a broker-dealer, bank, or trust company, the privacy policy of your financial intermediary would govern how your non-public personal information would be shared with non-affiliated third parties.
– 31 –
Nicholas Funds Services Offered
(unaudited)
| | |
| • | IRAs | |
| | • Traditional | • SIMPLE |
| | • Roth | • SEP |
| • | Coverdell Education Accounts |
| • | Automatic Investment Plan |
| • | Direct Deposit of Dividend and Capital Gain Distributions |
| • | Systematic Withdrawal Plan |
| • | Monthly Automatic Exchange between Funds |
| • | Telephone Purchase and Redemption |
| • | Telephone Exchange | |
| • | 24-hour Automated Account Information (800-544-6547) |
| • | 24-hour Internet Account Access (www.nicholasfunds.com) |
Please call a shareholder representative for further information on the above services or with any other questions you may have regarding the Nicholas Funds (800-544-6547).
– 32 –
Directors and Officers
DAVID O. NICHOLAS, President and Director
JOHN A. HAUSER, Director
DAVID P. PELISEK, Director
JAY H. ROBERTSON, Director
DAVID L. JOHNSON, Executive Vice President
JENNIFER R. KLOEHN, Senior Vice President,
Treasurer and Chief Compliance Officer
LAWRENCE J. PAVELEC, Senior Vice President and Secretary
CANDACE L. LESAK, Vice President
Investment Adviser
NICHOLAS COMPANY, INC.
Milwaukee, Wisconsin
www.nicholasfunds.com
414-276-0535 or 800-544-6547
Transfer Agent
U.S. BANCORP FUND SERVICES, LLC
Milwaukee, Wisconsin
414-276-0535 or 800-544-6547
Distributor
QUASAR DISTRIBUTORS, LLC
Milwaukee, Wisconsin
Custodian
U.S. BANK N.A.
Milwaukee, Wisconsin
Independent Registered Public Accounting Firm
DELOITTE & TOUCHE LLP
Milwaukee, Wisconsin
Counsel
MICHAEL BEST & FRIEDRICH LLP
Milwaukee, Wisconsin
This report is submitted for the information of shareholders of the Fund. It is not authorized for distribution to prospective investors unless preceded or accompanied by an effective prospectus.
Item 2. Code of Ethics.
CODE OF ETHICS FOR PRINCIPAL EXECUTIVE AND
SENIOR FINANCIAL OFFICERS
I. Covered Officers/Purpose of the Code
The Nicholas Family of Funds code of ethics (this “Code”) for theinvestment companies withinthe complex (collectively, “Funds” and each, “Company”) applies to the Company’s Principal Executive Officer and Principal Financial Officer (the “Covered Officers” each of whom are set forth in Exhibit A)for the purpose of promoting:
honest and ethical conduct, including the ethical handling of actual or apparent conflicts ofinterest between personal and professional relationships;
full, fair, accurate, timely and understandable disclosure in reports and documents that aregistrant files with, or submits to, the Securities and Exchange Commission (“SEC”) and inother public communications made by the Company;
compliance with applicable laws and governmental rules and regulations;
the prompt internal reporting of violations of the Code to an appropriate person or personsidentified in the Code; and
accountability for adherence to the Code.
Each Covered Officer should adhere to a high standard of business ethics and should be sensitive to situations that may give rise to actual as well as apparent conflicts of interest.
II.Covered Officers Should Handle Ethically Actual and Apparent Conflicts of Interest
Overview.A “conflict of interest” occurs when a Covered Officer’s private interest interferes withthe interests of, or his or her service to, the Company. For example, a conflict of interest would arise if a Covered Officer, or a member of his or her family, receives improper personal benefits as a result of his position with the Company.
Certain conflicts of interest arise out of the relationships between Covered Officers and the Company and already are subject to conflict of interest provisions in the Investment Company Act of 1940
(“Investment Company Act”) and the Investment Advisers Act of 1940 (“Investment Advisers Act”). Forexample, Covered Officers may not individually engage in certain transactions (such as the purchase orsale of securities or other property) with the Company because of their status as “affiliated persons” of the Company. The Company’s and the investment adviser’s compliance programs and procedures aredesigned to prevent, or identify and correct, violations of these provisions. This Code does not, and is not
intended to, repeat or replace these programs and procedures, and such conflicts fall outside of the parameters of this Code.
Although typically not presenting an opportunity for improper personal benefit, conflicts arise from, or as a result of, the contractual relationship between the Company and the investment adviser of which the Covered Officers are also officers or employees. As a result, this Code recognizes that the Covered Officers will, in the normal course of their duties (whether formally for the Company or for the adviser, or for both), be involved in establishing policies and implementing decisions that will have different effects on the adviser and the Company. The participation of the Covered Officers in such activities is inherent in the contractual relationship between the Company and the adviser and is consistent with the performance by the Covered Officers of their duties as officers of the Company. Thus, if performed in conformity with the provisions of the Investment Company Act and the Investment Advisers Act, such activities will be deemed to have been handled ethically. In addition, it is recognized by the
Funds’ Boards of Directors (“Boards”) that the Covered Officers may also be officers or employees ofone or more other investment companies covered by this or other codes.
Other conflicts of interest are covered by the Code, even if such conflicts of interest are not subject to provisions in the Investment Company Act and the Investment Advisers Act. The following list provides examples of conflicts of interest under the Code, but Covered Officers should keep in mind that these examples are not exhaustive. The overarching principle is that the personal interest of a Covered Officer should not be placed improperly before the interest of the Company.
* * *
Each Covered Officer must:
| not use his or her personal influence or personal relationships improperly to influencedecisions or financial reporting by the Company whereby the Covered Officerbenefit personally to the detriment of the Company; |
| | | |
| not cause the Company to take action, or fail to take action, for the individual personal benefitthe Covered Officer rather than the benefit of the Company; |
| | | |
| not use material non-public knowledge of portfolio transactions made or contemplated for theto trade personally or cause others to trade personally in contemplation of the marketof such transactions; |
| | | |
| report, at least annually:officer and director positions in corporations, public or private, for profit or not for profit, or in which the Covered Officer or any of his or her immediate family members holds 5% or more of its outstanding stock; |
| | | |
Positions as a trustee, executor or other fiduciary;
Ownership interest in any broker-dealer or bank;
Transactions between the Covered Officer and any of the Nicholas Family of Funds, theNicholas Company or any company in which any director of any of the Nicholas Familyof Funds is an officer or director.
Situations in which any immediate family member of the Covered Employee is an officer,director or employee of any company in which any officer or director of the NicholasCompany or any of the Nicholas Family of Funds is a director or executive officer.
There are some conflict of interest situations that should always be discussed with the appropriate officer if material. If the matter involves Jennifer R. Kloehn, she should discuss the matter with David O. Nicholas. If the matter involves any other person, that person should discuss the matter with Jennifer R. Kloehn. In each case, the officer with whom such matter is discussed is encouraged to review the matter with counsel to the Company. Examples of these include:
service as a director on the board of any public company;
the receipt of any non-nominal gifts;
the receipt of any entertainment from any company with which the Company has current orprospective business dealings unless such entertainment is business-related, reasonable in cost,appropriate as to time and place, and not so frequent as to raise any question of impropriety;
any ownership interest in, or any consulting or employment relationship with, any of the
Company’s service providers, other than its investment adviser, principal underwriter,administrator or any affiliated person thereof;
a direct or indirect financial interest in commissions, transaction charges or spreads paid bythe Company for effecting portfolio transactions or for selling or redeeming shares other thanan interest arising from the Covered Officer’s employment, such as compensation or equityownership.
III. Disclosure and Compliance
Each Covered Officer should familiarize himself or herself with the disclosure requirementsgenerally applicable to the Company;
each Covered Officer should not knowingly misrepresent, or cause others to misrepresent, factsabout the Company to others, whether within or outside the Company, including to the
Company’s directors and auditors, and to governmental regulators and self-regulatoryorganizations;
each Covered Officer should, to the extent appropriate within his or her area of responsibility,consult with other officers and employees of the Funds and the adviser with the goal ofpromoting full, fair, accurate, timely and understandable disclosure in the reports anddocuments the Funds files with, or submits to, the SEC and in other public communicationsmade by the Funds; and
it is the responsibility of each Covered Officer to promote compliance with the standards andrestrictions imposed by applicable laws, rules and regulations.
IV. Reporting and Accountability
Each Covered Officer must:
promptly after adoption of the Code or thereafter as applicable upon becoming a CoveredOfficer, affirm in writing to the Board that he or she has received, read, and understands theCode;
annually thereafter affirm to the Board that he or she has complied with the requirements ofthe Code;
not retaliate against any other Covered Officer or any employee of the Funds or their affiliatedpersons for reports of potential violations that are made in good faith; and
notify the appropriate person promptly if he or she knows of any violation of this Code. Failureto do so is itself a violation of this Code. Each Covered Officer should notify Jennifer R.
Kloehn unless the person violating the Code is Jennifer R. Kloehn, in which case such personshould notify David O. Nicholas. In each case, each Covered Officer is encouraged to alsocontact counsel to the Fund.
Jennifer R. Kloehn is responsible for applying this Code to specific situations in which questions are presented under it and has the authority to interpret this Code in any particular situation; provided that if the situation involves Jennifer R. Kloehn directly, then Mr. David O. Nicholas is responsible for applying the Code to her and he has authority to interpret the Code with respect to such application. Both Jennifer R. Kloehn and David O. Nicholas are encouraged to discuss the matter with counsel to the Fund. However, any approvals or waivers sought by the Principal Executive Officer will be considered by the independent directors.
The Company will follow these procedures in investigating and enforcing this Code:
Jennifer R. Kloehn or David O. Nicholas, with the advice of counsel will take all appropriateaction to investigate any potential violations reported to her or him;
if, after such investigation, the officer making such investigation believes that no violation hasoccurred, they are not required to take any further action;
any matter that the officer making the investigation believes is a violation will be reported tothe independent directors;
if the independent directors concur that a violation has occurred, they will consider appropriateaction, which may include review of, and appropriate modifications to, applicable policies andprocedures; notification to appropriate personnel of the investment adviser or its board; or arecommendation to dismiss the Covered Officer;
the independent directors will be responsible for granting waivers, as appropriate; and
any changes to or waivers of this Code will, to the extent required, be disclosed as provided bySEC rules.
V. Other Policies and Procedures
This Code shall be the sole code of ethics adopted by the Funds for purposes of Section 406 of the Sarbanes-Oxley Act and the rules and forms applicable to registered investment companies thereunder.
Insofar as other policies or procedures of the Funds, the Funds’ adviser, principal underwriter, or otherservice providers govern or purport to govern the behavior or activities of the Covered Officers who are subject to this Code, they are superseded by this Code to the extent that they overlap or conflict with theprovisions of this Code. The Funds’ and their investment adviser’s codes of ethics under Rule 17j-1 underthe Investment Company Act and the adviser’s more detailed policies andprocedures are separate requirements applying to the Covered Officers and others, and are not part of this Code.
VI. Amendments
Any amendments to this Code, other than amendments to Exhibit A, must be approved or ratified by a majority vote of the Board, including a majority of independent directors.
VII. Confidentiality
All reports and records prepared or maintained pursuant to this Code will be considered confidential and shall be maintained and protected accordingly. Except as otherwise required by law or this Code, such matters shall not be disclosed to anyone other than the appropriate Board and its counsel, the appropriate Company and the Nicholas Company.
VIII. Internal Use
The Code is intended solely for the internal use by the Funds and does not constitute an admission, by or on behalf of any Company, as to any fact, circumstance, or legal conclusion.
The undersigned, the duly elected secretary of the funds (the "Funds"), does hereby certify that the foregoing Code of Ethics (the "Code") is in the form adopted by the Board of Directors of each such Fund at which such person is the secretary, at a meeting duly called and convened on October 28, 2016, at which meeting all of the members of the Board of Directors, including all of the directors who are not "interested persons" of each such Fund, as such term is defined under the Investment Company Act of 1940, voted in favor of adoption of such Code presented at that meeting, and that the Code, in such form, as amended, has been adopted or will be ratified by all of the directors of each such Fund, including all of the directors of each such Fund who are not "interested persons" of the Fund.
Dated: November 22, 2016
Affirmed: November 22, 2019
|
| /s/ Lawrence J. Pavelec |
| Lawrence J. Pavelec, Secretary |
| Nicholas Fund, Inc. |
| Nicholas II, Inc. |
| Nicholas High Income Fund, Inc. |
| Nicholas Equity Income Fund, Inc. |
| Nicholas Limited Edition, Inc. |
| Nicholas Money Market Fund, Inc. |
Exhibit A
| | |
| Persons Covered by this Code of Ethics |
| The Nicholas Company | David O. Nicholas | Jennifer R. Kloehn |
| Nicholas Fund, Inc. | David O. Nicholas | Jennifer R. Kloehn |
| Nicholas II, Inc. | David O. Nicholas | Jennifer R. Kloehn |
| Nicholas Limited Edition, Inc. | David O. Nicholas | Jennifer R. Kloehn |
| Nicholas High Income Fund, Inc. | David O. Nicholas | Jennifer R. Kloehn |
| Nicholas Equity Income Fund, Inc. | David O. Nicholas | Jennifer R. Kloehn |
Item 3. Audit Committee Financial Expert.
The Fund's Board of Directors has determined that Mr. David P. Pelisek, an independent director, qualifies as an audit committee financial expert as that term is defined for purposes of this item. He wasselected as the Fund’s Audit Committee Financial Expert at the Fund’s Board of Directors Meeting heldon February 3, 2020.
Item 4. Principal Accountant Fees and Services.
(a)Audit Fees. The aggregate fees billed for each of the last two fiscal years (the "Reporting Periods") for professional services rendered by the Fund's principal accountant (the "Auditor") for the audit of the Fund's annual financial statements, or services that are normally provided by the Auditor in connection with the statutory and regulatory filings or engagements for the Reporting Periods, were $27,600 in 2019 and $26,800 in 2018.
(b)Audit-Related Fees. There were no fees billed in each of the last two fiscal years for assurance and related services rendered by the Auditor to the Fund that are reasonably related to the performance of the audit of the Fund's financial statements and are not reported under paragraph (a) of this Item 4.
(c)Tax Fees. The aggregate fees billed in the Reporting Periods for professional services rendered by the Auditor for tax compliance, tax advice and tax planning ("Tax Services") were $6,225 in 2019 and $6,292 in 2018. These services consisted of (i) review or preparation of U.S. federal, state, local and excise tax returns; (ii) U.S. federal, state and local tax planning, advice and assistance regarding statutory, regulatory or administrative developments, (iii) tax advice regarding tax qualification matters and/or treatment of various financial instruments held or proposed to be acquired or held.
(d)All Other Fees. The aggregate fees billed for professional services rendered by the Auditor to the Fund's investment adviser were approximately $18,200 in 2018 and $17,700 in 2017. These services were for the audit of the investment adviser for the adviser's fiscal year ended 10/31/2018 and 10/31/2017, respectively.
(e) (1)Audit Committee Pre-Approval Policies and Procedures. The Fund's Board of Director's has not adopted any pre-approval policies and procedures as described in paragraph (c)(7) of Rule 2-01 of Regulation S-X. The Fund's Board of Directors meets with the Auditors and management to review and authorize the Auditor's engagements for audit and non-audit services to the Fund and its Adviser prior to each engagement.
(e) (2) The percentage of services described in each of paragraphs (b) through (d) of this Item that were approved by the audit committee pursuant to paragraph (c)(7)(i)(C) of Rule 2-01 of Regulation S-X are as follows:
(f) No disclosures are required by this Item 4(f).
(g) There were no non-audit fees billed in each of the last two fiscal years by the Auditor for services rendered to the Fund or the Fund's investment adviser that provides ongoing services.
(h) No disclosures are required by this Item 4(h).
Item 5. Audit Committee of Listed Registrants.
Not applicable to this filing.
Item 6. Schedule of Investments.
The schedule of investments in securities of unaffiliated issuers is included as part of the report to shareholders filed under Item 1.
Item 7. Disclosure of Proxy Voting Policies and Procedures for Closed-End Management Investment Companies.
Applicable only to annual reports filed by closed-end funds.
Item 8. Portfolio Managers of Closed-End Management Investment Companies.
Applicable only to annual reports filed by closed-end funds.
Item 9. Purchases of Equity Securities by Closed-End Management Investment Companies and Affiliated Purchasers.
Applicable only to closed-end funds.
Item 10. Submission of Matters to a Vote of Security Holders.
Not applicable to this filing.
Item 11. Controls and Procedures.
(a) The Fund’s principal executive officer and principal financial officer have concluded that the Fund's disclosure controls and procedures are sufficient to ensure that information required to be disclosed by the Fund in this Form N-CSR was recorded, processed, summarized and reported within the time periods specified in the Securities and Exchange Commission's rules and forms, based upon such officers' evaluation of these controls and procedures as of a date within 90 days of the filing date of the report.
(b) There were no significant changes or corrective actions with regard to significant deficiencies or material weaknesses in the Fund's internal controls or in other factors that could significantly affect the Fund's internal controls subsequent to the date of their evaluation.
Item 12. Disclosure of Securities Lending Activities for Closed-End Management Investment Companies.
Applicable only to closed-end funds.
Item 13. Exhibits.
(a)(1) Code of Ethics -- Any code of ethics, or amendments thereto, that is the subject of the disclosure required by Item 2, to the extent that the registrant intends to satisfy the Item 2 requirements through filing of an exhibit.
Not applicable to this filing.
(a)(2) Certifications of Principal Executive Officer and Principal Financial Officer pursuant to Rule 30a-2(a) under the Investment Company Act of 1940, attached hereto as part of EX-99.CERT.
(a)(3) Any written solicitation to purchase securities under Rule 23c-1 under the Act sent or given during the period covered by the report by or on behalf of the registrant to 10 or more person.
Applicable only to closed-end funds.
(a)(4) Change in the registrant’s independent public accountant.
Not applicable to this filing.
(b) Certifications of Principal Executive Officer and Principal Financial Officer pursuant to Rule 30a-2(b) under the Investment Company Act of 1940, attached hereto as part of EX-99.906CERT.
SIGNATURES
Pursuant to the requirements of the Securities Exchange Act of 1934 and the Investment Company Act of 1940, the registrant has duly caused this report to be signed on its behalf by the undersigned, thereunto duly authorized.
(Registrant)Nicholas High Income Fund, Inc.
By:/s/ David O. Nicholas
Name: David O. Nicholas
Title: Principal Executive Officer
Date:February 28, 2020
Pursuant to the requirements of the Securities Exchange Act of 1934 and the Investment Company Act of 1940, this report has been signed by the following persons on behalf of the registrant and in the capacities and on the dates indicated.
By:/s/ David O. Nicholas
Name: David O. Nicholas
Title: Principal Executive Officer
Date:February 28, 2020
By:/s/ Jennifer R. Kloehn
Name: Jennifer R. Kloehn
Title: Principal Financial Officer
Date:February 28, 2020