Table of Contents
UNITED STATES
SECURITIES AND EXCHANGE COMMISSION
WASHINGTON, D.C. 20549
SCHEDULE 14A
Proxy Statement Pursuant to Section 14(a) of the Securities Exchange Act of 1934 (Amendment No. )
Filed by the Registrant x
Filed by a Party other than the Registrant ¨
Check the appropriate box:
| ¨ | Preliminary Proxy Statement |
| ¨ | Confidential, for use of the Commission Only (as permitted by Rule 14a-6(e)(2)) |
| x | Definitive Proxy Statement |
| ¨ | Definitive Additional Materials |
| ¨ | Soliciting Material Pursuant to (S) 240.14a-11(c) or (S) 240.14a-12 |
Wisconsin Power and Light Company
(Name of Registrant as Specified In Its Charter)
(Name of Person(s) Filing Proxy Statement, if other than the Registrant)
Payment of Filing Fee (Check the appropriate box):
| x | No fee required. |
| ¨ | Fee computed on table below per Exchange Act Rules 14a-6(i)(4) and 0-11. |
| (1) | Title of each class of securities to which transaction applies: |
| (2) | Aggregate number of securities to which transaction applies: |
| (3) | Per unit price or other underlying value of transaction computed pursuant to Exchange Act Rule 0-11 (set forth the amount on which the filing fee is calculated and state how it was determined): |
| (4) | Proposed maximum aggregate value of transaction: |
| (5) | Total fee paid: |
| ¨ | Fee paid previously with preliminary materials. |
| ¨ | Check box if any part of the fee is offset as provided by Exchange Act Rule 0-11(a)(2) and identify the filing for which the offsetting fee was paid previously. Identify the previous filing by registration statement number, or the Form or Schedule and the date of its filing. |
| (1) | Amount Previously Paid: |
| (2) | Form, Schedule or Registration Statement No.: |
| (3) | Filing Party: |
| (4) | Date Filed: |
Notes:
Reg. (S) 240.14a-101.
SEC 1913 (3-99)
Table of Contents
WISCONSIN POWER AND LIGHT COMPANY
ANNUAL MEETING OF SHAREOWNERS
| DATE: | Wednesday, May 25, 2005 | |
| TIME: | 2:00 p.m., Central Daylight Time | |
| LOCATION: | Wisconsin Power and Light Company Nile Meeting Room 4902 North Biltmore Lane Madison, Wis. | |
SHAREOWNER INFORMATION
| LOCAL (Madison, Wis., area) | (608) 458-3110 | |
| TOLL FREE | (800) 356-5343 | |
Table of Contents
Wisconsin Power and Light Company
4902 North Biltmore Lane
P. O. Box 2568
Madison, WI 53701-2568
Phone: 608.458.3110
NOTICE OF ANNUAL MEETING AND PROXY STATEMENT
Dear Wisconsin Power and Light Company Shareowner:
On Wednesday, May 25, 2005, Wisconsin Power and Light Company (the “Company”) will hold its 2005 Annual Meeting of Shareowners at the offices of Alliant Energy Corporation, 4902 North Biltmore Lane, Nile Meeting Room, Madison, Wis. The meeting will begin at 2:00 p.m. Central Daylight Time.
Only the sole common shareowner, Alliant Energy Corporation, and preferred shareowners who owned stock at the close of business on April 5, 2005, may vote at this meeting. All shareowners are requested to be present at the meeting in person or by proxy so that a quorum may be ensured. At the meeting, the Company’s shareowners will:
| 1. | Elect three directors for terms expiring at the 2008 Annual Meeting of Shareowners; and |
| 2. | Attend to any other business properly presented at the meeting. |
The Board of Directors of the Company presently knows of no other business to come before the meeting.
Please sign and return the enclosed proxy card as soon as possible.
The Company’s 2004 Annual Report appears as Appendix A to this proxy statement. The proxy statement and Annual Report have been combined into a single document to improve the effectiveness of our financial communication and to reduce costs, although the Annual Report does not constitute a part of the proxy statement.
Any Wisconsin Power and Light Company preferred shareowner who desires to receive a copy of the Alliant Energy Corporation 2004 Annual Report, Notice of Annual Meeting and Proxy Statement may do so by calling the Company’s Shareowner Services Department at the shareowner information numbers shown at the front of this proxy statement or writing to the Company at the address shown above.
By Order of the Board of Directors,

F. J. Buri
Corporate Secretary
Dated and mailed on or about April 13, 2005.
Table of Contents
| 1 | ||
| 3 | ||
| 5 | ||
| 7 | ||
| 8 | ||
| 9 | ||
| 10 | ||
| 11 | ||
| 13 | ||
| 13 | ||
| 14 | ||
Report of the Compensation and Personnel Committee on Executive Compensation | 17 | |
| 21 | ||
| 22 | ||
Appendix A – Wisconsin Power and Light Company Annual Report | ||
Table of Contents
| 1. Q: | Why am I receiving these materials? |
| A: | The Board of Directors of Wisconsin Power and Light Company (the “Company”) is providing these proxy materials to you in connection with the Company’s Annual Meeting of Shareowners (the “Annual Meeting”), which will take place on Wednesday, May 25, 2005. As a shareowner, you are invited to attend the Annual Meeting and are entitled to and requested to vote on the proposal described in this proxy statement. |
| 2. Q: | What is Wisconsin Power and Light Company and how does it relate to Alliant Energy Corporation? |
| A: | The Company is a subsidiary of Alliant Energy Corporation (“AEC”), a public utility holding company whose other primary first tier subsidiaries are Interstate Power and Light Company (“IP&L”), Alliant Energy Resources, Inc. (“Resources”) and Alliant Energy Corporate Services, Inc. (“Corporate Services”). |
| 3. Q: | Who is entitled to vote at the Annual Meeting? |
| A: | Only shareowners of record at the close of business on April 5, 2005 are entitled to vote at the Annual Meeting. As of the record date, 13,236,601 shares of common stock (owned solely by AEC) and 1,049,225 shares of preferred stock, in seven series (representing 599,630 votes), were issued and outstanding. Each share of Company common stock and Company preferred stock, with the exception of the 6.50% Series, is entitled to one vote per share. The 6.50% series of Company preferred stock is entitled to ¼ vote per share. |
| 4. Q: | What may I vote on at the Annual Meeting? |
| A: | You may vote on the election of three nominees to serve on the Company’s Board of Directors for terms expiring at the 2008 Annual Meeting of Shareowners. |
| 5. Q: | How does the Board of Directors recommend I vote? |
| A: | The Board of Directors recommends that you vote your shares FOR each of the listed director nominees. |
| 6. Q: | How can I vote my shares? |
| A: | You may vote either in person at the Annual Meeting or by appointing a proxy. If you desire to appoint a proxy, then sign and date each proxy card you receive and return it in the envelope provided. Appointing a proxy will not affect your right to vote your shares if you attend the Annual Meeting and desire to vote in person. |
| 7. Q: | How are votes counted? |
| A: | In the election of directors, you may vote FOR all of the director nominees or you may WITHHOLD your vote with respect to one or more nominees. If you return your signed proxy card but do not mark the boxes showing how you wish to vote, your shares will be voted FOR all listed director nominees. |
| 8. Q: | Can I change my vote? |
| A: | You have the right to revoke your proxy at any time before the Annual Meeting by: |
| • | Providing written notice to the Corporate Secretary of the Company and voting in person at the Annual Meeting; or |
| • | Appointing a new proxy prior to the start of the Annual Meeting. |
Attendance at the Annual Meeting will not cause your previously appointed proxy to be revoked unless you specifically so request in writing.
| 9. Q: | What does it mean if I get more than one proxy card? |
| A: | If your shares are registered differently and are in more than one account, then you will receive more than one proxy card. Be sure to vote all of your accounts to ensure that all of your shares are voted. The Company encourages you to have all accounts registered in the same name and address (whenever possible). You can accomplish this by contacting the Company’s Shareowner Services Department at the shareowner information numbers shown at the front of this proxy statement. |
| 10. Q: | Who may attend the Annual Meeting? |
| A: | All shareowners who owned shares of the Company’s common and preferred stock on April 5, 2005, may attend the Annual Meeting. |
1
Table of Contents
| 11. Q: | How will voting on any other business be conducted? |
| A: | The Board of Directors of the Company does not know of any business to be considered at the Annual Meeting other than the election of directors. If any other business is properly presented at the Annual Meeting, your proxy gives Barbara J. Swan, the Company’s President, and F. J. Buri, the Company’s Corporate Secretary, authority to vote on such matters at their discretion. |
| 12. Q: | Where and when will I be able to find the results of the voting? |
| A: | The results of the voting will be announced at the Annual Meeting. You may also call the Company’s Shareowner Services Department at the shareowner information numbers shown at the front of this proxy statement for the results. The Company will also publish the final results in its Quarterly Report on Form 10-Q for the second quarter of 2005 to be filed with the Securities and Exchange Commission (“SEC”). |
| 13. Q: | When are shareowner proposals for the 2006 Annual Meeting due? |
| A: | All shareowner proposals to be considered for inclusion in the Company’s proxy statement for the 2006 Annual Meeting must be received at the principal office of the Company by Dec. 14, 2005. In addition, any shareowner who intends to present a proposal from the floor at the 2006 Annual Meeting must submit the proposal in writing to the Corporate Secretary of the Company no later than Feb. 27, 2006. |
| 14. Q: | Who are the independent auditors of the Company and how are they appointed? |
| A: | Deloitte & Touche LLP audited the financial statements of the Company for the year ended Dec. 31, 2004. Representatives of Deloitte & Touche LLP are not expected to be present at the meeting. The Audit Committee of the Board of Directors expects to appoint the Company’s independent auditors for 2005 later in the year. |
| 15. Q: | Who will bear the cost of soliciting proxies for the Annual Meeting and how will these proxies be solicited? |
| A: | The Company will pay the cost of preparing, assembling, printing, mailing and distributing these proxy materials. In addition to the mailing of these proxy materials, the solicitation of proxies or votes may be made in person, by telephone or by electronic communication by the Company’s officers and employees who will not receive any additional compensation for these solicitation activities. The Company will pay banks, brokers, nominees and other fiduciaries reasonable charges and expenses incurred in forwarding the proxy materials to their principals. |
| 16. Q. | How can I obtain a copy of the Company’s Annual Report on Form 10-K? |
| A: | The Company will furnish without charge, to each shareowner who is entitled to vote at the Annual Meeting and who makes a written request, a copy of the Company’s Annual Report on Form 10-K (without exhibits) as filed with the SEC. Written requests for the Form 10-K should be mailed to the Corporate Secretary of the Company at the address on the first page of this proxy statement. |
| 17. Q: | If more than one shareowner lives in my household, how can I obtain an extra copy of the Company’s 2004 Annual Report and proxy statement? |
| A: | Pursuant to the rules of the SEC, services that deliver the Company’s communications to shareowners that hold their stock through a bank, broker or other holder of record may deliver to multiple shareowners sharing the same address a single copy of the Company’s 2004 Annual Report and proxy statement. Upon written or oral request, the Company will mail a separate copy of the 2004 Annual Report and proxy statement to any shareowner at a shared address to which a single copy of the document was delivered. You may notify the Company of your request by calling or writing the Company’s Shareowner Services Department at the shareowner information numbers shown at the front of this proxy statement or at the address of the Company shown on the Notice of Annual Meeting. |
2
Table of Contents
At the Annual Meeting, three directors will be elected for terms expiring in 2008. The nominees for election as recommended by the Nominating and Governance Committee and selected by the Board of Directors are: William D. Harvey, Singleton B. McAllister and Anthony R. Weiler. Each of the nominees is currently serving as a director of the Company. Each person elected as a director will serve until the Annual Meeting of Shareowners of the Company in 2008, or until his or her successor has been duly elected and qualified.
Directors will be elected by a plurality of the votes cast at the meeting (assuming a quorum is present). Consequently, any shares not voted at the meeting will have no effect on the election of directors. The proxies solicited may be voted for a substitute nominee or nominees if any of the nominees are unable to serve, or for good reason will not serve, a contingency not now anticipated.
Brief biographies of the director nominees and continuing directors follow. These biographies include their ages (as of Dec. 31, 2004), an account of their business experience and the names of publicly held and certain other corporations of which they are also directors. Except as otherwise indicated, each nominee and continuing director has been engaged in his or her present occupation for at least the past five years.
NOMINEES
 | WILLIAM D. HARVEY Age 55 | Director since 2005 Nominated term expires in 2008 | ||
| Mr. Harvey has served as President and Chief Operating Officer of AEC and Chief Operating Officer of IP&L, the Company and Resources since January 2004, and President of Resources since January 2005. He previously served as Executive Vice President – Generation for AEC, IP&L and Resources and President of the Company from 1998 to January 2004. He also previously served as the Company’s Senior Vice President from 1993 to 1998, Vice President and General Counsel from 1990 to 1993 and Vice President and Associate General Counsel from 1986 to 1990. He was recommended as a nominee by the Nominating and Governance Committee and appointed as a Director of the Company, AEC, IP&L, and Resources in January 2005 in connection with the Company’s succession plan. | ||||
 | SINGLETON B. MCALLISTER Age 52 | Director since 2001 Nominated term expires in 2008 | ||
| Ms. McAllister has been a partner in the public law and policy strategies group of the Washington, D.C. law firm office of Sonnenschein, Nath & Rosenthal, LLP since 2003. She was previously a partner at Patton Boggs LLP, a Washington, D.C. law firm, from 2001 to 2003. From 1996 until 2001, Ms. McAllister was General Counsel for the United States Agency for International Development. She was also a partner at Reed, Smith, Shaw and McClay where she specialized in government relations and corporate law. She serves on the Board of Directors of United Rentals, Inc. Ms. McAllister has served as a Director of IP&L (or predecessor companies), AEC and Resources since 2001. Ms. McAllister is Chairperson of the Compensation and Personnel Committee. | ||||
 | ANTHONY R. WEILER Age 68 | Director since 1998 Nominated term expires in 2008 | ||
Mr. Weiler is Chairman and President of A. R. Weiler Co. LLC, a consulting firm for home furnishings organizations. He was previously a Senior Vice President of Heilig-Meyers Company, a national furniture retailer headquartered in Richmond, Va. He is a Director of the Retail Home Furnishings Foundation.
| ||||
The Board of Directors unanimously recommends a vote FOR all nominees for election as directors.
3
Table of Contents
CONTINUING DIRECTORS
 | ERROLL B. DAVIS, JR. Age 60 | Director since 1984 Term expires in 2006 | ||
| Mr. Davis joined the Company in 1978 and served as President of the Company from 1987 until 1998. He was elected Chief Executive Officer of the Company in 1988. Mr. Davis has served as Chairman of the Board of the Company and AEC since 2000 and as Chief Executive Officer of AEC since 1990. He also served as President of AEC from 1990 through 2003. He has also served as Chief Executive Officer of Resources and IP&L (or predecessor companies) since 1998. He is a member of the Boards of Directors of BP p.l.c.; PPG Industries, Inc.; Union Pacific Corporation; Electric Power Research Institute; the Edison Electric Institute; and the U. S. Olympic Committee. Mr. Davis has served as a Director of AEC since 1982, of Resources since 1988 and of IP&L (or predecessor companies) since 1998. | ||||
 | MICHAEL L. BENNETT Age 51 | Director since 2003 Term expires in 2007 | ||
Mr. Bennett has served as President and Chief Executive Officer of Terra Industries Inc., an international producer of nitrogen products and methanol ingredients headquartered in Sioux City, Iowa, since April 2001. From 1997 to 2001, he was Executive Vice President and Chief Operating Officer of Terra Industries Inc. He also serves as Chairman of the Board for Terra Nitrogen Corp., a subsidiary of Terra Industries Inc. Mr. Bennett has served as a Director of AEC, IP&L and Resources since 2003. Mr. Bennett is Chairperson of the Audit Committee.
| ||||
 | ANN K. NEWHALL Age 53 | Director since 2003 Term expires in 2006 | ||
| Ms. Newhall is Executive Vice President, Chief Operating Officer, Secretary and a Director of Rural Cellular Corporation, a cellular communications corporation located in Alexandria, Minn. She has served as Executive Vice President and Chief Operating Officer since August 2000, as Secretary since February 2000 and as a Director since August 1999. Prior to assuming her current positions, she served as Senior Vice President and General Counsel from 1999 to 2000. She was previously a shareholder and President of the Moss & Barnett law firm in Minneapolis, Minn. Ms. Newhall has served as a Director of AEC, IP&L and Resources since 2003. | ||||
 | DAVID A. PERDUE Age 55 | Director since 2001 Term expires in 2007 | ||
| Mr. Perdue is Chairman of the Board and Chief Executive Officer of Dollar General Corporation, a sales organization headquartered in Goodlettsville, Tenn. He was named Chief Executive Officer and a Director in April 2003 and elected Chairman of the Board in June 2003. From July 2002 to March 2003, he was Chairman and Chief Executive Officer of Pillowtex Corporation, a textile manufacturing company located in Kannapolis, N.C. Pillowtex filed for bankruptcy in July 2003 after emerging from a previous bankruptcy in May 2002. From 1998 to 2002, he was employed by Reebok International Limited, where he served as President of the Reebok Brand from 2000 to 2002. Mr. Perdue has served as a Director of AEC, IP&L (or predecessor companies) and Resources since 2001. | ||||
 | JUDITH D. PYLE Age 61 | Director since 1994 Term expires in 2007 | ||
Ms. Pyle is President of Judith Dion Pyle and Associates, a financial services company located in Middleton, Wis. Prior to assuming her current position in 2003, she served as Vice Chair of The Pyle Group, a financial services company located in Madison, Wis. She previously served as Vice Chair and Senior Vice President of Corporate Marketing of Rayovac Corporation, a battery and lighting products manufacturer located in Madison, Wis. In addition, Ms. Pyle is a Director of Uniek, Inc. Ms. Pyle has served as a Director of AEC and Resources since 1992 and of IP&L (or predecessor companies) since 1998.
| ||||
 | ROBERT W. SCHLUTZ Age 68 | Director since 1998 Term expires in 2006 | ||
Mr. Schlutz is President of Schlutz Enterprises, Inc., a diversified farming and retailing business in Columbus Junction, Iowa. Mr. Schlutz has served as a Director of IP&L (or predecessor companies) since 1989, and of AEC and Resources since 1998. Mr. Schlutz is Chairperson of the Environmental, Nuclear, Health and Safety Committee.
| ||||
4
Table of Contents
MEETINGS AND COMMITTEES OF THE BOARD
The Board of Directors has standing Audit; Compensation and Personnel; Nominating and Governance; Environmental, Nuclear, Health and Safety; and Capital Approval Committees. The Board of Directors has adopted formal written charters for each of the Audit, Compensation and Personnel, and Nominating and Governance Committees, which are available, free of charge, on AEC’s Web site atwww.alliantenergy.com/investors under the “Corporate Governance” caption or in print to any shareowner who requests them from the Company’s Corporate Secretary. The following is a description of each of these committees:
Audit Committee
The Audit Committee held seven joint meetings (the Company, AEC, IP&L and Resources) in 2004. The Committee currently consists of M. L. Bennett (Chair), S. B. McAllister, A. K. Newhall and D. A. Perdue. Each of the members of the Committee is independent as defined by the New York Stock Exchange (“NYSE”) listing standards and SEC rules. The Board of Directors has determined that Mr. Bennett and one additional Audit Committee member qualify as “audit committee financial experts” as defined by SEC rules. The Audit Committee is responsible for assisting Board oversight of: (1) the integrity of the Company’s financial statements; (2) the Company’s compliance with legal and regulatory requirements; (3) the independent auditors’ qualifications and independence; and (4) the performance of the Company’s internal audit function and independent auditors. The Audit Committee is also directly responsible for the appointment, retention, termination, compensation and oversight of the Company’s independent auditors.
Compensation and Personnel Committee
The Compensation and Personnel Committee held four joint meetings in 2004. The Committee currently consists of S. B. McAllister (Chair), M. L. Bennett, D. A. Perdue and J. D. Pyle. Each of the members of the Committee is independent as defined by the NYSE listing standards. This Committee reviews and approves corporate goals and objectives relevant to Chief Executive Officer (“CEO”) compensation, evaluates the CEO’s performance and determines and approves as a committee, or together with the other independent directors, the CEO’s compensation level based on the evaluation of the CEO’s performance. In addition, the Committee has responsibilities with respect to the Company’s executive compensation and incentive programs and management development programs.
Nominating and Governance Committee
The Nominating and Governance Committee held three joint meetings in 2004. The Committee currently consists of A. R. Weiler (Chair), K. C. Lyall, A. K. Newhall and R. W. Schlutz. Each of the members of the Committee is independent as defined by the NYSE listing standards. This Committee’s responsibilities are to: (1) identify individuals qualified to become Board members, consistent with the criteria approved by the Board, and to recommend nominees for directorships to be filled by the Board or shareowners; (2) identify and recommend Board members qualified to serve on Board committees; (3) develop and recommend to the Board a set of corporate governance principles; (4) oversee the evaluation of the Board and the Company’s management; and (5) advise the Board with respect to other matters relating to corporate governance of the Company.
In making recommendations to the Company’s Board of Directors of nominees to serve as directors, the Nominating and Governance Committee will examine each director nominee on a case-by-case basis regardless of who recommended the nominee and take into account all factors it considers appropriate, which may include strength of character, mature judgment, career specialization, relevant technical skills or financial acumen, diversity of viewpoint and industry knowledge. However, the Committee believes that, to be recommended as a director nominee, each candidate must:
| • | display the highest personal and professional ethics, integrity and values. |
| • | have the ability to exercise sound business judgment. |
| • | be highly accomplished in his or her respective field, with superior credentials and recognition and broad experience at the administrative and/or policy-making level in business, government, education, technology or public interest. |
| • | have relevant expertise and experience, and be able to offer advice and guidance to the CEO based on that expertise and experience. |
| • | be independent of any particular constituency, be able to represent all shareowners of the Company and be committed to enhancing long-term shareowner value. |
5
Table of Contents
| • | have sufficient time available to devote to activities of the Board of Directors and to enhance his or her knowledge of the Company’s business. |
The Committee also believes the following qualities or skills are necessary for one or more directors to possess:
| • | At least one director should have the requisite experience and expertise to be designated as an “audit committee financial expert” as defined by the applicable rules of the SEC. |
| • | Directors generally should be active or former senior executive officers of public companies or leaders of major and/or complex organizations, including commercial, governmental, educational and other non-profit institutions. |
| • | Directors should be selected so that the Board of Directors is a diverse body, with diversity reflecting age, gender, race and political experience. |
The Nominating and Governance Committee will consider nominees recommended by shareowners in accordance with the Company’s Nominating and Governance Committee Charter and the Corporate Governance Principles.
The Company and the Committee maintain a file of recommended potential director nominees which is reviewed at the time a search for a new director needs to be performed. To assist the Committee in its identification of qualified director candidates, the Committee may engage an outside search firm.
Any shareowner wishing to make a recommendation should write to the Corporate Secretary of the Company and include appropriate biographical information concerning each proposed nominee. The Corporate Secretary will forward all recommendations to the Committee. The Company’s Bylaws also set forth certain requirements for shareowners wishing to nominate director candidates directly for consideration by shareowners. These provisions require such nominations to be made pursuant to timely notice (as specified in the Bylaws) in writing to the Corporate Secretary of the Company.
Environmental, Nuclear, Health and Safety Committee
The Environmental, Nuclear, Health and Safety Committee held two joint meetings in 2004. The Committee currently consists of R. W. Schlutz (Chair), K. C. Lyall, J. D. Pyle and A. R. Weiler. The Committee’s responsibilities are to review environmental policy and planning issues of interest to the Company, including matters involving the Company before environmental regulatory agencies and compliance with air, water and waste regulations. In addition, the Committee reviews policies and operating issues related to the Company’s nuclear generating station investments, including planning and funding for decommissioning of the plants. The Committee also reviews health and safety-related policies, activities and operational issues as they affect employees, customers and the general public.
Capital Approval Committee
The Capital Approval Committee held no meetings in 2004. The Committee currently consists of M. L. Bennett, D. A. Perdue and A. R. Weiler. Mr. Davis is the Chair and a non-voting member of this Committee. The purpose of this Committee is to evaluate certain investment proposals where (1) an iterative bidding process is required, and/or (2) the required timelines for such a proposal would not permit the proposal to be brought before a regular meeting of the Board of Directors and/or a special meeting of the full Board of Directors is not practical or merited.
The Board of Directors held seven joint meetings during 2004. Each director attended at least 75% of the aggregate number of meetings of the Board and Board committees on which he or she served.
The Board and each Board committee conduct performance evaluations annually to determine their effectiveness and suggest improvements for consideration and implementation. In addition, the Compensation and Personnel Committee evaluates Mr. Davis’ performance as CEO on an annual basis.
Board members are not expected to attend the Company’s Annual Meeting. In 2004, none of the Board members were present for the Company’s Annual Meeting.
6
Table of Contents
Corporate Governance Principles
The Board of Directors has adopted Corporate Governance Principles that, in conjunction with the Board committee charters, establish processes and procedures to help ensure effective and responsive governance by the Board. The Corporate Governance Principles are available, free of charge, on AEC’s Web site atwww.alliantenergy.com/investors under the “Corporate Governance” caption or in print to any shareowner who requests them from the Company’s Corporate Secretary.
The Board of Directors has adopted certain categorical standards of independence to assist it in making determinations of director independence under the NYSE listing standards. Under these categorical standards, the following relationships that currently exist or that have existed, including during the preceding three years, willnot be considered to be material relationships that would impair a director’s independence:
| • | A family member of the director is or was an employee (other than an executive officer) of the Company. |
| • | A director, or a family member of the director, receives or received less than $100,000 during any twelve-month period in direct compensation from the Company, other than director and committee fees and pension or other forms of deferred compensation for prior service (provided that such compensation is not contingent in any way on continued service with the Company). |
| • | A director, or a family member of the director, is a former partner or employee of the Company’s internal or external auditor but did not personally work on the Company’s audit within the last three years; or a family member of a director is employed by an internal or external auditor of the Company but does not participate in such auditor’s audit, assurance or tax compliance practice. |
| • | A director, or a family member of the director, is or was employed other than as an executive officer of another company where any of the Company’s present executives serve on that company’s compensation committee. |
| • | A director is or was an executive officer, employee or director of, or has or had any other relationship (including through a family member) with, another company, that makes payments (other than contributions to tax exempt organizations) to, or receives payments from, the Company for property or services in an amount which, in any of the last three fiscal years, does not exceed the greater of $1 million or 2% of such other company’s consolidated gross revenues. |
| • | A director is or was an executive officer, employee or director of, or has or had any other relationship (including through a family member) with, a tax exempt organization to which the Company’s discretionary charitable contributions in any single fiscal year do not exceed the greater of $1 million or 2% of such organization’s consolidated gross revenues. |
In addition, any relationship that a director (or an “immediate family member” of the director) previously had that constituted an automatic bar to independence under NYSE listing standards will not be considered to be a material relationship that would impair a director’s independence three years after the end of such relationship in accordance with NYSE listing standards.
Based on these standards, the Board of Directors has affirmatively determined by resolution that each of the Company’s directors (other than Mr. Davis, the Company’s Chairman and CEO, and Mr. Harvey, the Company’s Chief Operating Officer (“COO”)) has no material relationship with the Company and, therefore, is independent in accordance with the NYSE listing standards. The Board of Directors will regularly review the continuing independence of the directors.
The Corporate Governance Principles provide that at least 75% of the members of the Board of Directors must be independent directors under the NYSE listing standards. The Audit, Compensation and Personnel, and Nominating and Governance Committees must consist of all independent directors.
Lead Independent Director; Executive Sessions
The Corporate Governance Principles provide that the chairperson of the Nominating and Governance Committee shall be the designated “Lead Independent Director” and will preside as the chair at meetings or executive sessions of the independent directors. As the Chairperson of the Nominating and Governance Committee, Mr. Weiler is currently designated as the Lead Independent Director. At every regular in-person meeting of the Board of Directors, the independent directors meet in executive session with no member of Company management present.
7
Table of Contents
Communication with Directors
Shareowners and other interested parties may communicate with the full Board, non-management directors as a group or individual directors, including the Lead Independent Director, by providing such communication in writing to the Company’s Corporate Secretary, who will post such communications directly to the Company’s Board of Directors’ Web site.
Ethical and Legal Compliance Policy
The Company has adopted a Code of Ethics that applies to all employees, including its CEO, COO, Chief Financial Officer and Chief Accounting Officer, as well as its Board of Directors. The Company makes its Code of Ethics available, free of charge, on AEC’s Web site atwww.alliantenergy.com/investors under the “Corporate Governance” caption or in print to any shareowner who requests it from the Company’s Corporate Secretary. The Company intends to satisfy the disclosure requirements under Item 5.05 of Form 8-K regarding amendments to, or waivers from, the Code of Ethics by posting such information on its Web site address stated above under the “Corporate Governance” caption.
No retainer fees are paid to Mr. Davis or Mr. Harvey for their service on the Company’s Board of Directors. In 2004, all other directors (the “non-employee directors”), each of whom served on the Boards of the Company, AEC, IP&L and Resources, received an annual retainer for service on all four Boards consisting of $70,000 in cash. Also, in 2004, the Chairperson of the Audit Committee received an additional $7,500 cash retainer and the Chairpersons of the Compensation and Personnel, Nominating and Governance, and Environmental, Nuclear, Health, and Safety Committees received an additional $5,000 cash retainer. Travel expenses incurred by the Directors are paid for each meeting attended.
In 2005, the non-employee directors will each receive a cash retainer of $85,000. In 2005, the Chairperson of the Audit Committee will receive an additional $10,000 cash retainer; the Chairpersons of the Compensation and Personnel, Nominating and Governance, and Environmental, Nuclear, Health, and Safety Committees will each receive an additional $5,000 cash retainer; other members of the Audit Committee will each receive an additional $3,500 cash retainer; and the Lead Independent Director will receive an additional $15,000 cash retainer.
Each director is encouraged to voluntarily elect to use not less than 50% of his or her cash retainer to purchase shares of AEC common stock pursuant to AEC’s Shareowner Direct Plan or to defer such amount through the AEC stock account in the AEC Director’s Deferred Compensation Plan.
Director’s Deferred Compensation Plan
Under the AEC Director’s Deferred Compensation Plan, directors may elect to defer all or part of their retainer fee. Amounts deposited to a Deferred Compensation Interest Account receive an annual return based on the A-Utility Bond Rate with a minimum return no less than the prime interest rate published inThe Wall Street Journal, provided that the return may not be greater than 12% or less than 6%. Amounts deposited to the AEC Stock Account are treated as though invested in the common stock of AEC and will be credited with dividends, which will be treated as if reinvested. The director may elect that the AEC Deferred Compensation Account be paid in a lump sum or in annual installments for up to 10 years beginning in the year of or one, two or three tax years after retirement or resignation from the Board of Directors of AEC.
Director’s Charitable Award Program
AEC maintains a Director’s Charitable Award Program for certain members of its Board of Directors beginning after three years of service. The participants in this Program currently are E. B. Davis, K. C. Lyall, D. A. Perdue, J. D. Pyle and A. R. Weiler. S. B. McAllister has enrolled in the Program and is expected to become a participant. The purpose of the Program is to recognize the interest of the Company and its directors in supporting worthy institutions. Under the Program, when a director dies, the Company and/or AEC will donate a total of $500,000 to one qualified charitable organization or divide that amount among a maximum of five qualified charitable organizations selected by the individual director. The individual director derives no financial benefit from the Program. All deductions for charitable contributions are taken by the Company and/or AEC, and the donations are funded by the Company or AEC through life insurance policies on the directors. Over the life of the Program, all costs of donations and premiums on the life insurance policies, including a return of the Company’s or AEC’s cost of funds, will be recovered through life insurance proceeds on the directors. The Program, over its life, will not result in any material cost to the Company or AEC. The Board of Directors of AEC has terminated this Program for all new directors who join the Board after Jan. 1, 2005.
8
Table of Contents
Director’s Life Insurance Program
AEC maintains a split-dollar Director’s Life Insurance Program for non-employee directors. The participants in this Program currently include K. C. Lyle, J. D. Pyle and A. R. Weiler. The Program provides a maximum death benefit of $500,000 to each eligible director. Under the split-dollar arrangement, directors are provided a death benefit only and do not have any interest in the cash value of the policies. The Program is structured to pay a portion of the total death benefit to AEC to reimburse AEC for all costs of the Program, including a return on its funds. The Program, over its life, will not result in any material cost to AEC. The imputed income allocations reported for each director in 2004 under this Program were as follows: K. C. Lyall — $528, J. D. Pyle — $29, and A. R. Weiler — $50. In November 2003, the Board of Directors of AEC terminated this insurance benefit for any director not already having the required vesting period of three years of service and for all new directors.
OWNERSHIP OF VOTING SECURITIES
All of the common stock of the Company is held by AEC. None of the directors or officers of the Company own any shares of the Company’s preferred stock. Listed in the following table are the number of shares of AEC’s common stock beneficially owned by (1) the executive officers listed in the Summary Compensation Table, (2) all director nominees and directors of the Company, and (3) all director nominees, directors and executive officers as a group as of Feb. 28, 2005. The directors and executive officers of the Company as a group owned 1.4% of the outstanding shares of AEC common stock on that date. No individual director or officer owned more than 1% of the outstanding shares of AEC common stock on that date.
NAME OF BENEFICIAL OWNER | SHARES BENEFICIALLY OWNED(1) | ||
Executive Officers(2) | |||
Thomas L. Aller | 101,264 | (3) | |
Eliot G. Protsch | 210,089 | (3) | |
Barbara J. Swan | 149,575 | (3) | |
Director Nominees | |||
William D. Harvey | 218,536 | (3) | |
Singleton B. McAllister | 5,054 | (3) | |
Anthony R. Weiler | 17,888 | (3) | |
Directors | |||
Michael L. Bennett | 3,482 | (3) | |
Erroll B. Davis, Jr. | 799,433 | (3) | |
Katharine C. Lyall | 16,567 | (4) | |
Ann K. Newhall | 7,408 | (3) | |
David A. Perdue | 7,518 | (3) | |
Judith D. Pyle | 14,111 | ||
Robert W. Schlutz | 21,271 | (3) | |
All Executive Officers and Directors as a Group | |||
15 people, including those listed above | 1,673,240 | (3) | |
| (1) | Total shares of AEC common stock outstanding as of Feb. 28, 2005, were 116,183,026. |
| (2) | Stock ownership of Mr. Davis is shown with the directors and stock ownership for Mr. Harvey is shown with the director nominees. |
| (3) | Included in the beneficially owned shares shown are indirect ownership interests with shared voting and investment powers: Mr. Davis — 9,435, Mr. Harvey — 2,826, Mr. Weiler — 1,389, Mr. Protsch — 845 and Mr. Aller – 1,000; shares of common stock held in deferred compensation plans: Mr. Bennett — 3,082, Mr. Davis — 50,744, Mr. Harvey — 29,011, Ms. McAllister — 2,104, Ms. Newhall — 6,110, Mr. Perdue — 7,518, Mr. Schlutz — 9,797, Mr. Weiler — 6,707, Mr. Aller — 6,695, Mr. Protsch — 35,235 and Ms. Swan — 21,526 (all executive officers and directors as a group — 183,042); and stock options exercisable on or within 60 days of Feb. 28, 2005: Mr. Davis — 667,566, Mr. Harvey — 149,977, Mr. Aller — 86,136, Mr. Protsch — 139,157 and Ms. Swan — 110,644 (all executive officers and directors as a group — 1,240,675). |
| (4) | Ms. Lyall will retire as a director of the Company at AEC’s 2005 Annual Meeting on May 19, 2005. |
9
Table of Contents
To the Company’s knowledge, no shareowner beneficially owned 5% or more of any class of the Company’s preferred stock as of Dec. 31, 2004. The following table sets forth information, as of Dec. 31, 2004 regarding beneficial ownership by the only persons known to AEC to own more than 5% of AEC’s common stock. The beneficial ownership set forth below has been reported on Schedule 13G filings with the SEC by the beneficial owners.
Amount and Nature of Beneficial Ownership
| Voting Power | Investment Power | |||||||||||
Name and Address of Beneficial Owner | Sole | Shared | Sole | Shared | Aggregate | Percent of Class | ||||||
Franklin Resources, Inc. (and certain affiliates) One Franklin Parkway San Mateo, CA 94403 | 6,411,600 | 0 | 6,411,600 | 0 | 6,411,600 | 5.6% | ||||||
Hotchkis & Wiley Capital Management, LLC (and certain affiliates) 725 South Figueroa Street 39th Floor Los Angeles, CA 90017-5439 | 5,382,800 | 0 | 6,566,600 | 0 | 6,566,600 | 5.7% | ||||||
COMPENSATION OF EXECUTIVE OFFICERS
The following Summary Compensation Table sets forth the total compensation paid by the Company, AEC and AEC’s other subsidiaries to the Chief Executive Officer and certain other executive officers of the Company for all services rendered during 2004, 2003 and 2002.
SUMMARY COMPENSATION TABLE
| Annual Compensation | Long-Term Compensation | |||||||||||||||||||||
| Awards(2) | Payouts | |||||||||||||||||||||
Name and Principal Position | Year | | Base Salary | Bonus | | Other Annual Compensation(1) | | Restricted Stock Awards(3) | Securities Underlying Options (Shares) | | LTIP Payouts | | All Other Compensation(4) | |||||||||
Erroll B. Davis, Jr. Chairman and Chief Executive Officer | 2004 2003 2002 | $ | 749,019 685,000 685,000 | $ | 375,197 0 0 | $ | 74,987 14,949 17,582 | $ | 300,453 0 0 | 234,732 151,687 151,687 | $ | 0 0 0 | $ | 138,719 45,253 45,485 | ||||||||
William D. Harvey Chief Operating Officer | 2004 2003 2002 | | 459,442 290,000 282,500 | | 206,805 0 0 | | 6,246 5,954 7,707 | | 100,143 0 0 | 73,454 26,642 26,642 | | 0 0 0 | | 48,896 15,562 17,599 | ||||||||
Eliot G. Protsch Chief Financial Officer | 2004 2003 2002 | | 364,539 290,000 282,500 | | 142,167 0 0 | | 6,014 4,825 6,131 | | 149,981 0 0 | 40,996 26,642 26,642 | | 0 0 0 | | 43,611 15,605 16,318 | ||||||||
Barbara J. Swan President | 2004 2003 2002 | | 298,674 265,000 260,000 | | 110,791 0 0 | | 5,255 0 6,716 | | 100,143 0 0 | 32,026 24,705 24,705 | | 0 0 0 | | 18,843 14,536 16,356 | ||||||||
Thomas L. Aller(5) Senior Vice President | 2004 2003 2002 | | 237,692 200,000 190,000 | | 123,203 189,170 0 | | 0 0 0 | | 0 0 0 | 21,654 17,438 17,438 | | 0 0 0 | | 4,164 8,693 8,223 | ||||||||
| (1) | Other Annual Compensation consists of income tax gross-ups for split-dollar life insurance and, for Mr. Davis only, air travel. Certain personal benefits provided by the Company or AEC to the executive officers named in the Summary Compensation Table above are not included in the Table. The aggregate amount of such personal benefits for each such executive officer in each year reflected in the Table did not exceed the lesser of $50,000 or 10% of the sum of such executive officer’s base salary and bonus in each respective year. |
10
Table of Contents
| (2) | Awards made in 2004 were in addition to performance share awards as described in the table entitled “Long-Term Incentive Awards in 2004.” |
| (3) | The amounts in the Summary Compensation Table above for restricted stock in 2004 represent the market value based on the closing price of AEC common stock on the date of the grants. The restricted stock awards are subject to (i) two year cliff vesting in the case of 2,008 shares for Mr. Protsch, and (ii) the remaining awards are subject to three year cliff vesting. As of Dec. 31, 2004, the total number of shares of AEC restricted common stock (and their market value based on the closing price of AEC common stock on that date) held by each executive officer listed in the Summary Compensation Table above were as follows: Mr. Davis, 11,605 shares ($331,903); Mr. Harvey, 3,868 shares ($110,625); Mr. Protsch, 5,876 shares ($168,054); Ms. Swan, 3,868 shares ($110,625); and Mr. Aller, 0 shares ($0). |
| (4) | The table below shows the components of the compensation reflected under this column for 2004: |
| Erroll B. Davis, Jr. | William D. Harvey | Eliot G. Protsch | Barbara J. Swan | Thomas L. Aller | |||||||||||
A. | $ | 22,672 | $ | 6,580 | $ | 8,140 | $ | 6,272 | $ | 2,591 | |||||
B. | 95,649 | 35,096 | 28,058 | 7,500 | 0 | ||||||||||
C. | 8,470 | 3,244 | 1,373 | 1,095 | 1,573 | ||||||||||
D. | 11,928 | 3,976 | 6,040 | 3,976 | 0 | ||||||||||
Total | $ | 138,719 | $ | 48,896 | $ | 43,611 | $ | 18,843 | $ | 4,164 | |||||
| A. | Matching contributions to 401(k) Savings Plan and Deferred Compensation Plan |
| B. | Split dollar life insurance premiums |
| C. | Life insurance coverage in excess of $50,000 |
| D. | Dividends earned in 2004 on AEC restricted stock |
| (5) | Mr. Aller became an executive officer of the Company in September 2003, and previously served as an officer of Resources. |
The following table sets forth certain information concerning options to purchase shares of AEC common stock granted during 2004 to the executives named below:
STOCK OPTION GRANTS IN 2004
| Individual Grants | | Potential Realizable Value at Assumed Annual Rates of Stock Price Appreciation for Option Term(3) | ||||||||||||||||
Name | Grant Date (1) | Number of Securities Underlying Options Granted (2) | % of Total Options Granted to Employees in Fiscal Year | | | Exercise or Base Price ($/Share) | Expiration Date | 5% | 10% | |||||||||
Erroll B. Davis, Jr. | 01/02/04 01/02/04 02/09/04 | 146,917 74,413 13,402 | 21.6 11.0 2.0 | % % % | $ | 24.90 31.54 25.93 | 01/02/14 01/02/14 01/02/14 | $ | 2,300,720 671,205 215,638 | $ | 5,829,667 2,458,606 544,925 | |||||||
William D. Harvey | 01/02/04 02/09/04 | 50,938 22,516 | 7.5 3.3 | % % | | 24.90 25.93 | 01/02/14 01/02/14 | | 797,689 362,282 | | 2,021,220 915,501 | |||||||
Eliot G. Protsch | 01/02/04 02/09/04 | 31,099 9,897 | 4.6 1.5 | % % | | 24.90 25.93 | 01/02/14 01/02/14 | | 487,010 159,243 | | 1,234,008 402,412 | |||||||
Barbara J. Swan | 01/02/04 02/09/04 | 28,418 3,608 | 4.2 0.5 | % % | | 24.90 25.93 | 01/02/14 01/02/14 | | 445,026 58,053 | | 1,127,626 146,701 | |||||||
Thomas L. Aller | 01/02/04 02/09/04 | 18,767 2,887 | 2.8 0.4 | % % | | 24.90 25.93 | 01/02/14 01/02/14 | | 293,891 46,452 | | 744,675 117,385 | |||||||
11
Table of Contents
| (1) | The three separate grants of non-qualified stock options to purchase shares of AEC common stock are as follows: (a) All of the named executives received options on Jan. 2, 2004 as part of AEC’s annual long-term incentive (LTI) grant; (b) On Jan. 2, 2001, Mr. Davis was granted options that inadvertently exceeded the individual limit for option grants under the applicable plan by 74,413 shares. These options had an exercise price of $31.54, the fair market value of AEC’s common stock at the time of grant. AEC determined that the options in excess of the individual limit were not valid, so on Jan. 2, 2004, to make him whole, the Compensation Committee granted Mr. Davis 74,413 options from the current plan, at the same exercise price of $31.54; and (c) Supplemental grants of options were made on Feb. 9, 2004, to all named executives to adjust target values for the 2004 LTI awards to account for new salaries, target incentive changes and/or promotions. |
| (2) | Consists of non-qualified stock options to purchase shares of AEC common stock. Options vest as outlined below. Upon a “change in control” of AEC or upon retirement, disability or death of the option holder, the options will become immediately exercisable. |
Jan. 2, 2004 grant for all named executives | - | 1/3rd vests 1/2/05, 1/3rd vests 1/1/06, 1/3rd vests 1/1/07 | ||
Jan. 2, 2004 replacement grant for Mr. Davis | - | 100% vests 1/2/05 (same vesting date used for prior grant) | ||
Feb. 9, 2004 grant for all named executives | - | 1/3rd vests 2/9/05, 1/3rd vests 1/1/06, 1/3rd vests 1/1/07 |
| (3) | The hypothetical potential appreciation shown for the named executives is required by rules of the SEC. The amounts shown do not represent the historical or expected future performance of AEC’s common stock. Rather, in order for the named executives to realize the potential values set forth in the 5% and 10% columns in the table above, the price per share of AEC’s common stock would be as follows for each of the grants, all as of the expiration date of the options. |
| 5% | 10% | |||||
Jan. 2, 2004 grant for all named executives | $ | 40.56 | $ | 64.58 | ||
Jan. 2, 2004 replacement grant for Mr. Davis | 40.56 | 64.58 | ||||
Feb. 9, 2004 grant for all named executives | 42.02 | 66.59 | ||||
The following table provides information for the executives named below regarding options exercised in 2004 and the number and value of exercisable and unexercisable options.
AGGREGATE OPTION EXERCISES IN 2004 AND OPTION VALUES AT DEC. 31, 2004
Shares on Exercise | Value ($) | Number of Securities Underlying Unexercised Options at Fiscal Year End | Value of Unexercised In-the-Money Options at Year End(1) | ||||||||||||
Name | Exercisable | Unexercisable | Exercisable | Unexercisable | |||||||||||
Erroll B. Davis, Jr. | -- | $ | -- | 451,687 | 386,419 | $ | 699,194 | $ | 1,811,580 | ||||||
William D. Harvey | -- | -- | 112,430 | 100,096 | 126,724 | 465,010 | |||||||||
Eliot G. Protsch | -- | -- | 112,430 | 67,638 | 126,724 | 357,913 | |||||||||
Barbara J. Swan | 8,235 | 72,221 | 86,398 | 56,731 | 18,100 | 315,467 | |||||||||
Thomas L. Aller | -- | -- | 67,292 | 39,092 | 77,978 | 218,801 | |||||||||
| (1) | Based on the closing per share price of AEC common stock on Dec. 31, 2004 of $28.60. |
12
Table of Contents
The following table provides information concerning long-term incentive awards made to the executives named below in 2004.
LONG-TERM INCENTIVE AWARDS IN 2004
Name | Number of Shares, Units or Other Rights (#)(1) | Performance or Other Period Until Maturation or Payout | Estimated Future Payouts Under Non-Stock Price-Based Plans | |||||||
| Threshold (#) | Target (#) | Maximum (#) | ||||||||
Erroll B. Davis, Jr. | 36,020 | 1/1/2007 | 18,010 | 36,020 | 72,040 | |||||
William D. Harvey | 16,486 | 1/1/2007 | 8,243 | 16,486 | 32,972 | |||||
Eliot G. Protsch | 9,208 | 1/1/2007 | 4,604 | 9,208 | 18,416 | |||||
Barbara J. Swan | 7,194 | 1/1/2007 | 3,597 | 7,194 | 14,388 | |||||
Thomas L. Aller | 5,064 | 1/1/2007 | 2,532 | 5,064 | 10,128 | |||||
| (1) | Consists of performance shares awarded as part of AEC’s annual LTI grant. The payout from the performance shares is based on AEC’s three-year Total Shareowner Return (“TSR”) relative to an investor-owned utility peer group during the three-year performance cycle ending Dec. 31, 2006. Payouts are subject to modification pursuant to a performance multiplier that ranges from 0 to 2.00, and will be made in shares of AEC common stock or a combination of AEC common stock and cash. |
Mr. Davis currently has an employment agreement with AEC, pursuant to which he will serve as the Chairman of AEC until the expiration of the term of the agreement on the date of AEC’s 2006 Annual Meeting, but no later than May 30, 2006. In addition, he will serve as the Chief Executive Officer of AEC during the term of the agreement unless otherwise determined by the Board of Directors. Mr. Davis will also serve as the Chief Executive Officer of AEC and each subsidiary of AEC, including the Company, as long as he holds the same position for AEC. Pursuant to the employment agreement, Mr. Davis will be paid an annual base salary of not less than $750,000. Mr. Davis also will have the opportunity to earn short-term and long-term incentive compensation (including stock options, restricted stock and other long-term incentive compensation) at least equal to other executive officers and receive supplemental retirement benefits (including continued participation in the AEC Executive Tenure Compensation Plan) and life insurance providing a death benefit of three times his annual salary. For purposes of AEC’s Supplemental Executive Retirement Plan described in detail under “Retirement and Employee Benefit Plans,” (i) Mr. Davis will be deemed to have been paid an annual bonus for 2003 of $595,539 (the amount that he would have received had he been eligible for such a bonus for such year); (ii) if Mr. Davis ceases to be the Chief Executive Officer while remaining the Chairman in 2005 and if the annual bonus for 2005 payable in 2006 is less than the target award for Mr. Davis for 2005, Mr. Davis will be deemed to have earned the target award; (iii) a special calculation will apply to protect the dollar amount that Mr. Davis could have been paid on May 1, 2003 if he had retired on April 30, 2003; and (iv) upon termination of employment Mr. Davis generally will be deemed to be a retiree not subject to the early commencement reduction factors that would otherwise apply. For purposes of AEC’s Executive Tenure Compensation Plan, the Board of Directors has determined to treat Mr. Davis as an eligible retiree at his future termination of employment, regardless of the circumstances other than death. If, prior to the end of the term of the agreement, the employment of Mr. Davis is terminated by AEC without cause (as defined in the employment agreement), or if Mr. Davis terminates his employment for good reason (as defined in the employment agreement), or if the employment of Mr. Davis is terminated as a result of the mutual agreement of Mr. Davis and the Board of Directors of AEC, AEC or its affiliates will continue to provide the compensation and benefits called for by the employment agreement through the later of the end of the term of the agreement or one year after such termination of employment (with incentive compensation based on the maximum potential awards and with any stock compensation paid in cash), and all unvested stock compensation will vest immediately. If Mr. Davis dies or terminates his employment without good reason prior to the end of the term of the agreement, AEC or its affiliates will pay to Mr. Davis or his beneficiaries or estate all compensation earned through the date of death or such termination (including previously deferred compensation and pro rata incentive compensation based upon the maximum potential awards). If Mr. Davis’ employment is terminated by reason of his disability, he will be entitled to such benefits as may be provided by AEC’s current disability program. If Mr. Davis is terminated for cause, AEC or its affiliates will pay his base salary through the date
13
Table of Contents
of termination plus any previously deferred compensation. In any such case, Mr. Davis shall also be eligible for the benefits he has accrued under the applicable retirement plans, including the benefits under the Supplemental Executive Retirement Plan and the Executive Tenure Compensation Plan. Under the employment agreement, if any payments thereunder constitute an excess parachute payment under the Internal Revenue Code (“Code”), then AEC will pay to Mr. Davis the amount necessary to offset the excise tax and any applicable taxes on this additional payment.
AEC currently has in effect key executive employment and severance agreements (the “KEESAs”) with certain executive officers and key employees of AEC (including Messrs. Davis, Harvey, Protsch and Aller and Ms. Swan). The KEESAs provide that each executive officer who is a party thereto is entitled to benefits if, within a period of up to three years (depending on which executive is involved) after a change in control of AEC (as defined in the KEESAs) (the “Employment Period”), the officer’s employment is ended through (a) termination by AEC, other than by reason of death or disability or for cause (as defined in the KEESAs); or (b) termination by the officer due to a breach of the agreement by AEC or a significant change in the officer’s responsibilities; or (c) in the case of Mr. Davis’ agreement, termination by Mr. Davis following the first anniversary of the change of control. The benefits provided are (a) a cash termination payment of up to three times (depending on which executive is involved) the sum of the officer’s annual salary and his or her average annual bonus during the three years before the termination; and (b) continuation for up to the end of the Employment Period of equivalent hospital, medical, dental, accident and life insurance coverage as in effect at the time of termination. Each KEESA for executive officers below the level of Executive Vice President of AEC provides that if any portion of the benefits under the KEESA or under any other agreement for the officer would constitute an excess parachute payment for purposes of the Code, benefits will be reduced so that the officer will be entitled to receive $1 less than the maximum amount which he or she could receive without becoming subject to the 20% excise tax imposed by the Code on certain excess parachute payments, or which AEC may pay without loss of deduction under the Code. The KEESAs for the Chief Executive Officer, President, Senior Executive Vice President and the Executive Vice Presidents of AEC (including Messrs. Davis, Harvey, Protsch and Aller and Ms. Swan) provide that if any payments thereunder or otherwise constitute an excess parachute payment, AEC will pay to the appropriate officer the amount necessary to offset the excise tax and any additional taxes on this additional payment. Mr. Davis’ employment agreement as described above limits benefits paid thereunder to the extent that duplicate payments would be provided to him under his KEESA.
RETIREMENT AND EMPLOYEE BENEFIT PLANS
Alliant Energy Cash Balance Pension Plan
Salaried employees (including officers) of the Company are eligible to participate in the Alliant Energy Cash Balance Pension Plan (the “Pension Plan”) maintained by Corporate Services. The Pension Plan bases a participant’s defined benefit pension on the value of a hypothetical account balance. For individuals participating in the Pension Plan as of Aug. 1, 1998, a starting account balance was created equal to the present value of the benefit accrued as of Dec. 31, 1997, under the applicable prior benefit formula. In addition, such individuals received a special one-time transition credit amount equal to a specified percentage varying with age multiplied by credited service and pay. For 1998 and thereafter, a participant receives annual credits to the account equal to 5% of base pay (including certain incentive payments, pre-tax deferrals and other items), plus an interest credit on all prior accruals equal to 4%, plus a potential share of the gain on the investment return on assets in the trust investment for the year.
The life annuity payable under the Pension Plan is determined by converting the hypothetical account balance credits into annuity form. Individuals who were participants in the Pension Plan on Aug. 1, 1998, are in no event to receive any less than what would have been provided under the prior formula that was applicable to them, had it continued, if they terminate on or before Aug. 1, 2008, and do not elect to commence benefits before the age of 55.
All of the individuals listed in the Summary Compensation Table participate in the Pension Plan and are “grandfathered” under the applicable prior plan benefit formula. Because their estimated benefits under the applicable prior plan benefit formula are expected to be higher than under the Pension Plan formula, utilizing current assumptions, their benefits would currently be determined by the applicable prior plan benefit formula. The following tables illustrate the estimated annual benefits payable upon retirement at age 65 under the applicable prior plan formula based on average annual compensation and years of service. To the extent benefits under the Pension Plan are limited by tax law, any excess will be paid under the Unfunded Excess Plan described below.
Company Plan A Prior Formula. One of the applicable prior plan formulas provided retirement income based on years of credited service and final average compensation for the 36 highest consecutive months, with a reduction for Social Security
14
Table of Contents
offset. The individuals listed in the Summary Compensation Table covered by this formula are Messrs. Davis, Harvey and Protsch and Ms. Swan. The benefits would be as follows:
Company Plan A Prior Plan Formula Table
Average Annual Compensation | Annual Benefit After Specified Years in Plan | |||||||||||
| 15 | 20 | 25 | 30+ | |||||||||
$ 200,000 | $ | 55,000 | $ | 73,333 | $ | 91,667 | $ | 110,000 | ||||
300,000 | 82,500 | 110,000 | 137,500 | 165,000 | ||||||||
400,000 | 110,000 | 146,667 | 183,333 | 220,000 | ||||||||
500,000 | 137,500 | 183,333 | 229,167 | 275,000 | ||||||||
600,000 | 165,000 | 220,000 | 275,000 | 330,000 | ||||||||
700,000 | 192,500 | 256,667 | 320,833 | 385,000 | ||||||||
800,000 | 220,000 | 293,333 | 366,667 | 440,000 | ||||||||
900,000 | 247,500 | 330,000 | 412,500 | 495,000 | ||||||||
1,000,000 | 275,000 | 366,667 | 458,333 | 550,000 | ||||||||
1,100,000 | 302,500 | 403,333 | 504,167 | 605,000 | ||||||||
For purposes of the Pension Plan, compensation means payment for services rendered, including vacation and sick pay, and is substantially equivalent to the salary amounts reported in the Summary Compensation Table. Pension Plan benefits depend upon length of Pension Plan service (up to a maximum of 30 years), age at retirement and amount of compensation (determined in accordance with the Pension Plan) and are reduced by up to 50% of Social Security benefits. The estimated benefits in the table above do not reflect the Social Security offset. The estimated benefits are computed on a straight-life annuity basis. Benefits will be adjusted if the employee receives one of the optional forms of payment. Credited years of service under the Pension Plan for covered persons named in the Summary Compensation Table are as follows: Erroll B. Davis, Jr., 25 years; William D. Harvey, 17 years; Eliot G. Protsch, 25 years; and Barbara J. Swan, 16 years.
IES Industries Pension Plan Prior Formula. The other applicable prior plan formula provided retirement income based on years of service and final average compensation for the highest consecutive 36 months out of the last 10 years of employment. Mr. Aller is the only individual listed in the Summary Compensation Table covered by this formula. The benefits would be as follows:
IES Industries Pension Plan Prior Formula Table
Average Annual Compensation | Annual Benefit After Specified Years in Plan | ||||||||||||||
| 15 | 20 | 25 | 30 | 35 | |||||||||||
$ 200,000 | $ | 42,847 | $ | 57,130 | $ | 71,413 | $ | 85,696 | $ | 99,978 | |||||
300,000 | 66,098 | 88,130 | 110,163 | 132,196 | 154,228 | ||||||||||
400,000 | 89,348 | 119,130 | 148,913 | 178,696 | 208,478 | ||||||||||
500,000 | 112,598 | 150,130 | 187,663 | 225,196 | 262,728 | ||||||||||
600,000 | 135,848 | 181,130 | 226,413 | 271,696 | 316,978 | ||||||||||
For purposes of the Pension Plan, compensation means payment for services rendered, including vacation and sick pay, and is substantially equivalent to the salary amounts reported in the Summary Compensation Table. Pension Plan benefits depend upon length of Pension Plan service (up to a maximum of 35 years), age at retirement and amount of compensation (determined in accordance with the Pension Plan). The estimated benefits are computed on a straight-life annuity basis. Benefits will be adjusted if the employee receives one of the optional forms of payment. Mr. Aller has 11 credited years of service under the Pension Plan.
Unfunded Excess Plan
Corporate Services maintains an Unfunded Excess Plan that provides funds for payment of retirement benefits above the limitations on payments from qualified pension plans in those cases where an employee’s retirement benefits exceed the qualified plan limits. The Unfunded Excess Plan provides an amount equal to the difference between the actual pension benefit payable under the Pension Plan and what such pension benefit would be if calculated without regard to any limitation imposed by the Code on pension benefits or covered compensation.
Unfunded Executive Tenure Compensation Plan
Corporate Services maintains an Unfunded Executive Tenure Compensation Plan to provide incentive for selected key executives to remain in the service of AEC by providing additional compensation that is payable only if the executive
15
Table of Contents
remains with AEC until retirement (or other termination if approved by the Board of Directors of AEC). Any participant in the Plan must be approved by the Board of Directors of AEC. Mr. Davis was the only active participant in the Plan as of Dec. 31, 2004. The Plan provides for monthly payments to a participant after retirement (at or after age 65, or with Board approval, prior to age 65) for 120 months. The payments will be equal to 25% of the participant’s highest average salary for any consecutive 36-month period. If a participant dies prior to retirement or before 120 payments have been made, the participant’s beneficiary will receive monthly payments equal to 50% of such amount for 120 months in the case of death before retirement or, if the participant dies after retirement, 50% of such amount for the balance of the 120 months. Annual benefits of $187,500 would be payable to Mr. Davis upon retirement, assuming he continues in the service of AEC until retirement at the same salary as was in effect on Dec. 31, 2004.
Supplemental Executive Retirement Plan
AEC maintains an unfunded Supplemental Executive Retirement Plan (“SERP”) to provide incentive for key executives to remain in the service of AEC by providing additional compensation that is payable only if the executive remains with AEC until retirement, disability or death. While the SERP provides different levels of benefits depending on the executive covered, this summary reflects the terms applicable to all of the individuals listed in the Summary Compensation Table. Participants in the SERP must be approved by the Compensation and Personnel Committee of the Board of Directors of AEC. The SERP provides for payments of 60% of the participant’s average annual earnings (base salary and bonus) for the highest paid three years out of the last 10 years of the participant’s employment reduced by the sum of benefits payable to the officer from the officer’s defined benefit plan and the Unfunded Excess Plan. The normal retirement date under the SERP is age 62 with at least 10 years of service and early retirement is at age 55 with at least 10 years of service. If a participant retires prior to age 62, the 60% payment under the SERP is reduced by 3% per year for each year the participant’s retirement date precedes his/her normal retirement date. The actuarial reduction factor will be waived for participants who have attained age 55 and have a minimum of 10 years of service in a senior executive position with AEC after April 21, 1998. At the timely election of the participant, benefits under the SERP will be made in a lump sum, in installments over a period of up to 10 years, or for the lifetime of the participant. If the lifetime benefit is selected and the participant dies prior to receiving 12 years of payments, payments continue to any surviving spouse or dependent children of a deceased participant who dies while still employed by AEC, payable for a maximum of 12 years. A post-retirement death benefit of one times the participant’s final average earnings at the time of retirement will be paid to the designated beneficiary. Messrs. Davis, Harvey, Protsch and Aller and Ms. Swan are participants in the SERP. The following table shows the amount of retirement payments under the SERP, assuming a minimum of 10 years of service at retirement age and payment in the annuity form.
Supplemental Executive Retirement Plan Table
Average Annual Compensation | Annual Benefit After Specified Years in Plan | |||||
| <10 Years | >10 Years* | |||||
$ 200,000 | $ | 0 | $ | 120,000 | ||
300,000 | 0 | 180,000 | ||||
400,000 | 0 | 240,000 | ||||
500,000 | 0 | 300,000 | ||||
600,000 | 0 | 360,000 | ||||
700,000 | 0 | 420,000 | ||||
800,000 | 0 | 480,000 | ||||
900,000 | 0 | 540,000 | ||||
1,000,000 | 0 | 600,000 | ||||
1,100,000 | 0 | 660,000 | ||||
*Reduced by the sum of the benefit payable from the applicable defined benefit pension plan and the Unfunded Excess Plan.
Key Employee Deferred Compensation Plan
AEC maintains a Key Employee Deferred Compensation Plan under which participants may defer up to 100% of base salary and incentive compensation. Participants who have made the maximum allowed contribution to the AEC-sponsored 401(k) Savings Plan may receive an additional credit to the Deferred Compensation Plan. The credit will be equal to 50% of the lesser of (a) the amount contributed to the 401(k) Savings Plan plus the amount deferred under this Plan; or (b) 6% of base salary, reduced by the amount of any matching contributions in the 401(k) Savings Plan. The employee may elect to have his or her deferrals credited to an Interest Account or an AEC Stock Account. Deferrals and matching contributions to the Interest Account receive an annual return based on the A-Utility Bond Rate with a minimum return no less than the prime
16
Table of Contents
interest rate published inThe Wall Street Journal, provided that the return may not be greater than 12% or less than 6%. Deferrals and matching contributions credited to the AEC Stock Account are treated as though invested in AEC common stock and will be credited with dividends, which will be treated as if reinvested. The shares of common stock identified as obligations under the Plan are held in a rabbi trust. Payments from the Plan may be made in a lump sum or in annual installments for up to 10 years at the election of the participant. Participants are selected by the Chief Executive Officer of Corporate Services. Messrs. Davis, Harvey, Protsch and Aller and Ms. Swan are participants in the Plan.
REPORT OF THE COMPENSATION AND PERSONNEL
COMMITTEE ON EXECUTIVE COMPENSATION
To Our Shareowners:
The Compensation and Personnel Committee (the “Committee”) of the Board of Directors of the Company is currently composed of four independent directors (the same directors that comprise the AEC Compensation and Personnel Committee). The following is a report prepared by these directors with respect to compensation paid by AEC, the Company and AEC’s other subsidiaries.
The Committee assesses the effectiveness and competitiveness of, approves the design of, and administers executive compensation programs within a consistent total compensation framework for the Company. The Committee also reviews and approves all salary arrangements and other remuneration for executive officers, evaluates executive officer performance, and considers related matters. It also makes recommendations to the Nominating and Governance Committee regarding Director compensation. To support it in carrying out its mission, the Committee engages an independent consultant (which is retained by the Committee rather than Company executives).
The Committee Charter was amended in January 2004 to enhance corporate governance through the adoption of recommended and required modifications detailing the role and functions of the Committee in compliance with the NYSE listing standards.
The Committee is committed to implementing an overall compensation program for executive officers that furthers the Company’s mission. Therefore, the Committee adheres to the following compensation policies, which are intended to facilitate the achievement of the Company’s business strategies:
| • | Executive management compensation (and particularly, long-term incentive compensation) should be closely and strongly aligned with the long-term interests of AEC’s shareowners and customers. |
| • | Total compensation should enhance the Company’s ability to attract, retain and encourage the development of exceptionally knowledgeable and experienced executive officers, upon whom, in large part, the successful operation and management of the Company depends. |
| • | Base salary levels should be targeted at a competitive market range of base salaries paid to executive officers of comparable companies. Specifically, the Company targets the median (50th percentile) of base salaries paid by companies of similar revenue base within the utility and general industries. |
| • | Incentive compensation programs should strengthen the relationship between pay and performance by emphasizing variable at-risk compensation that is consistent with meeting predetermined corporate, subsidiary, business unit and individual performance goals. In addition, the Committee targets incentive levels at the median (50th percentile) of incentive compensation paid by companies of similar revenue base within the utility and general industries. |
Components of Compensation
The major elements of AEC’s executive compensation program are base salary, short-term (annual) incentives, long-term (equity) incentives and other benefits. These elements are addressed separately in this report. In setting the level for each major component of compensation, the Committee considers all elements of an executive officer’s total compensation package, including employee benefit and perquisite programs. The Committee’s goal is to provide an overall compensation package for each executive officer that is competitive to the packages offered to similarly situated executive officers at companies of similar size within the industry.
17
Table of Contents
For 2004, the Committee determined that total executive compensation at target levels is in line with competitive compensation of comparative companies.
To ensure the Committee has adequate time to consider executive officers’ total compensation for the coming year, Committee members are provided detailed compensation information in advance of the second to last Committee meeting of the previous year, which is then presented and analyzed at that Committee meeting. Committee members then have time between meetings to raise questions and ask for additional information. The Committee then makes final decisions regarding compensation at the last Committee meeting of the previous year.
Base Salaries
The Committee annually reviews each executive officer’s base salary. Base salaries are targeted at a competitive market range (i.e., at the median level) when comparing both utility and non-utility (general industry) data from similarly-sized companies, with utility-specific positions based exclusively on energy industry data. The industry peer group the Committee used for assessing compensation is the S&P Midcap 400 Utilities Index. The Committee annually adjusts base salaries to recognize changes in the market, AEC performance, varying levels of responsibility, and executive officers’ prior experience and breadth of knowledge. Increases to base salaries are driven primarily by market adjustments for a particular salary level, which generally limits across-the-board increases, though the Committee also considers individual performance factors in setting base salaries. The Committee reviews executive salaries for market comparability using utility and general industry data contained in published compensation surveys.
Based on this data and consultation with the independent executive compensation consultant, the Committee approved base salary increases for executive officers in 2004.
Short-Term Incentives
AEC’s short-term (annual) incentive program promotes the Committee’s pay-for-performance philosophy by providing executive officers with direct financial incentives in the form of annual cash bonuses tied to the achievement of AEC, subsidiary and business unit performance goals. Annual bonus opportunities allow the Committee to communicate specific goals that are of primary importance during the coming year and motivate executive officers to achieve these goals. On an annual basis, the Committee reviews and approves the program’s performance goals, the relative weight assigned to each goal and the targeted and maximum award levels. A description of the short-term incentive program available during 2004 to executive officers follows.
Alliant Energy Corporation Management Incentive Compensation Plan –In 2004, the Alliant Energy Corporation Management Incentive Compensation Plan (the “MICP”) covered executive officers and was based on achieving annual targets for AEC and business unit performance. AEC corporate performance was gauged on earnings per share from continuing operations, total cash flow from continuing operations, Lean Six Sigma savings, environmental, health and safety assessment closure rates, and diversity initiatives. Business unit performance was gauged on those goals and other operational measures specific to the business unit. Target and maximum bonus awards under the MICP in 2004 were set at the median of the utility and general industry market levels. The Committee considered these targets to be achievable, but substantially challenging. The level of performance achieved in each category determines actual payment of bonuses as a percentage of annual salary. Weighting factors are applied to the percentage achievement under each category to determine overall performance. If a pre-determined earnings per share from continuing operations target is not met, there is no bonus payment associated with the MICP. If the threshold performance for any other performance target is not reached, there is no bonus payment associated with that particular category. Once the designated maximum performance is reached, there is no additional payment for performance above the maximum level. The actual percentage of salary paid as a bonus, within the allowable range, is equal to the weighted average percent achievement for all the performance categories. MICP targets range from 80% of base salary for Mr. Davis, to 30-65% of base salary for other executive officers, with a maximum possible payout for all of two times their target percentage.
After assessing corporate and business unit performance against established goals, the Committee determined that the executive officers were eligible to receive MICP awards for 2004 plan year performance.
Long-Term Incentives
The Committee strongly believes compensation for executive officers should include long-term, at-risk pay to strengthen the alignment of the interests of the shareowners and management. In this regard, AEC maintains plans that permit grants of stock options, restricted stock and performance units/shares with respect to AEC’s common stock. The Committee believes that the incentive plans balance the Company’s annual compensation programs by emphasizing compensation based on the long-term, successful performance of the Company from the perspective of AEC’s shareowners.
18
Table of Contents
In determining actual award levels under the Alliant Energy Corporation Long-Term Incentive Program, the Committee sought to provide competitive total compensation opportunities to executive officers while also taking performance factors into account. As such, award levels for 2004 were based on a competitive analysis of similarly sized utility and general industry companies that took into consideration the market level of long-term incentives, the competitiveness of the total compensation package and AEC performance. Award levels were targeted to the median of the range of such awards paid by comparable companies. A description of the long-term incentive programs available to executive officers during 2004 follows.
Alliant Energy Corporation Long-Term Incentive Program – The Alliant Energy Corporation Long-Term Incentive Program covered all executive officers and consisted of the following components in 2004: non-qualified stock options and performance shares. Select executive officers were also awarded grants of restricted stock for retention purposes.
Non-qualified stock options provide a reward that is directly tied to the benefit shareowners receive from increases in the price of AEC’s common stock. Payout of performance shares granted in 2002 is based on AEC’s three-year total shareowner return (“TSR”) relative to an investor-owned utility peer group, and on AEC’s three-year annualized earnings per share growth. Payout of performance shares granted in 2003 and 2004 is based solely on AEC’s three-year TSR relative to the peer group. Thus, the Committee believes the two components of the Long-Term Incentive Program (i.e., stock options and performance shares) provide incentives for management to produce superior shareowner returns on both an absolute and relative basis. During 2004, the Committee made grants of stock options and performance shares to various executive officers, including Messrs. Davis, Harvey, Protsch and Aller and Ms. Swan. All option grants had a per share exercise price equal to the fair market value of a share of AEC common stock on the day following the date the grants were approved. Options vest on a one-third basis at the beginning of each calendar year after grant and have a 10-year term from the date of the grant. The performance share grants, with final awards that range from zero to 200% of target, were based on performance against the criteria described above.
Due to AEC’s three-year annualized earnings per share growth and TSR goals not being achieved, there was no performance share payout for the 2002 grant which had a three-year cycle ending in December 2004.
In addition to stock options and performance shares, executive officers, including Mr. Davis, received grants of AEC restricted stock in 2004. The AEC restricted stock vests 100% two or three years after the date of grant, as the case may be (with immediate vesting in case of death, disability or retirement). These grants of AEC restricted stock were made for the purpose of recognizing and retaining these key individuals.
Following an extensive review of AEC’s long-term incentive programs, the Committee determined that, commencing in 2005, performance-contingent AEC restricted stock would replace stock options as a component of an executive officer’s long-term incentive grant. Thus, performance shares and performance-contingent restricted stock will comprise the total target award for 2005.
Other Benefits
Basic benefit programs that are made available to all other salaried employees are also made available to executive officers, including AEC’s 401(k) Savings Plan and the Cash Balance Pension Plan. In addition, executive officers are eligible to participate in AEC’s Excess Plan, Supplemental Executive Retirement Plan and Key Employee Deferred Compensation Plan – all as described in the Retirement and Benefit Plans section of this proxy statement. Executive officers are also eligible for a separate Executive Health Care Plan (medical and dental) and flexible perquisites.
Certain executive officers receive individually owned life insurance policies. Premiums paid by AEC for this insurance were taxed as bonuses to the individual officers beginning in 2004.
Compensation of the Chairman and Chief Executive Officer
When determining the compensation package of the Chairman and CEO, the Committee follows the same general policies that guide compensation decisions for other executive officers. Thus, the Committee based Mr. Davis’ award levels on an analysis of similarly sized utility and general industry companies that took into consideration the competitiveness of the total compensation package, as well as AEC corporate performance.
As was the case for other executive officers, Mr. Davis received a base salary increase in 2004 to $750,000 from his previous level of $685,000, which had been in effect for both 2002 and 2003. The Committee approved the salary increase based on its evaluation of Mr. Davis’ performance and on a review of competitive data.
19
Table of Contents
For 2004, Mr. Davis’ short-term incentive payout was based solely on AEC’s performance on the corporate goals described above. The Committee approved a final 2004 incentive payout for Mr. Davis of $375,197 based on achievement of these pre-established goals.
For 2004, Mr. Davis’ target long-term incentive percentage was 200% of base salary, with the total award comprising performance shares and stock options. In addition to these grants, the Committee also approved a grant of AEC restricted stock for recognition and retention purposes. All of Mr. Davis’ 2004 awards under the long-term incentive program are shown in the tables under “Stock Option Grants in 2004” and “Long-Term Incentive Awards in 2004.”
Share Ownership Guidelines
AEC has established share ownership guidelines for executive officers as a way to better align the financial interests of its officers with those of its shareowners. Under these guidelines, the requisite ownership numbers are 85,000 shares for the Chief Executive Officer, 36,000 shares for Executive Vice Presidents and 12,000 shares for Vice Presidents. These executive officers are expected to make continuing progress toward compliance with these guidelines. Individuals at the participating levels are asked to achieve the recommended ownership multiple within a 5-year period from the effective date of becoming an officer. The Chief Executive Officer retains the right to grant special dispensation for hardship, promotions or new hires.
Policy with Respect to the $1 Million Deduction Limit
Section 162(m) of the Code generally limits the corporate deduction for compensation paid to executive officers named in the proxy statement to $1 million, unless such compensation is based upon performance objectives meeting certain regulatory criteria or is otherwise excluded from the limitation. Based on the Committee’s commitment to link compensation with performance as described in this report, the Committee intends to qualify future compensation paid to the Company’s executive officers for deductibility by the Company under Section 162(m) except in limited appropriate circumstances. All taxable income for 2004 of the executive officers of the Company qualified under Section 162(m) as deductible by the Company.
Conclusion
The Committee believes the existing executive compensation policies and programs provide an appropriate level of competitive compensation for the Company’s executive officers. In addition, the Committee believes that the long- and short-term performance incentives effectively align the interests of executive officers and shareowners toward a successful future for the Company.
COMPENSATION AND PERSONNEL COMMITTEE
Singleton B. McAllister (Chairperson)
Michael L. Bennett
David A. Perdue
Judith D. Pyle
20
Table of Contents
To Our Shareowners:
The Audit Committee of the Board of Directors of the Company is composed of four directors, each of whom is independent under the NYSE listing standards and SEC rules. The Committee operates under a written charter adopted by the Board of Directors.
The Company’s management is responsible for the Company’s internal controls and the financial reporting process, including the system of internal controls. The independent auditors are responsible for expressing an opinion on the conformity of the Company’s audited consolidated financial statements with accounting principles generally accepted in the United States of America. The Committee has reviewed and discussed the audited consolidated financial statements with management and the independent auditors. The Committee has discussed with the independent auditors matters required to be discussed by Statement on Auditing Standards No. 61 (Communication With Audit Committees).
The Company’s independent auditors have provided to the Committee the written disclosures required by Independence Standards Board Standard No. 1 (Independence Discussions with Audit Committees), and the Committee discussed with the independent auditors their independence.
The Committee has adopted a policy that requires advance approval of all audit, audit-related, tax and other permitted services performed by the independent auditor. The policy provides for pre-approval by the Committee of specifically defined audit and non-audit services after the Committee is provided with the appropriate level of details regarding the specific services to be provided. The policy does not permit delegation of the Committee’s authority to management. In the event the need for specific services arises between Committee meetings, the Committee has delegated to the Chairperson of the Committee authority to approve permitted services provided that the Chairperson reports any decisions to the Committee at its next scheduled meeting.
The principal accounting fees that were billed to the Company by its independent auditors for work performed on behalf of the Company and its subsidiaries for 2003 and 2004 were as follows:
| 2003 | 2004 | |||||
Audit Fees(1) | $ | 319,000 | $ | 987,000 | ||
Audit-Related Fees | 98,000 | 348,000 | ||||
Tax Fees | 162,000 | 70,000 | ||||
All Other Fees | 21,000 | 22,000 | ||||
(1)The Audit Fees for 2004 included additional fees required by Section 404 of the Sarbanes-Oxley Act related to AEC’s internal controls for financial reporting that were not required in 2003.
Audit-Related Fees consisted of the fees billed for employee benefits plan audits and attest services not required by statute or regulations for both 2003 and 2004, and Sarbanes-Oxley Section 404 planning for 2004.
Tax Fees consisted of the fees billed for professional services rendered for tax compliance, tax advice and tax planning, including all services performed by the professional staff in the independent auditors’ tax division, except those rendered in connection with the audit.
All Other Fees consisted of license fees for tax and accounting research software products.
The Audit Committee does not consider the provision of non-audit services by the independent auditors described above to be incompatible with maintaining auditor independence.
The Committee discussed with the Company’s internal and independent auditors the overall scopes and plans for their respective audits. The Committee meets with the internal and independent auditors, with and without management present, to discuss the results of their examinations, the evaluation of the Company’s internal controls and overall quality of the Company’s financial reporting.
Based on the Committee’s reviews and discussions with management, the internal auditors and the independent auditors referred to above, the Committee recommended to the Board of Directors that the audited consolidated financial statements be included in the Company’s Annual Report on Form 10-K for the year ended Dec. 31, 2004 for filing with the SEC.
AUDIT COMMITTEE
Michael L. Bennett (Chairperson)
Singleton B. McAllister
Ann K. Newhall
David A. Perdue
21
Table of Contents
SECTION 16(a) BENEFICIAL OWNERSHIP
REPORTING COMPLIANCE
Section 16(a) of the Securities Exchange Act of 1934 requires the Company’s directors and certain officers to file reports of ownership and changes in ownership of the Company’s preferred stock with the SEC and the NYSE. As a matter of practice, the Company’s Shareowner Services Department assists the Company’s reporting persons in preparing initial reports of ownership and reports of changes in ownership and files those reports on their behalf. The Company is required to disclose in this proxy statement the failure of reporting persons to file these reports when due. Based on the written representations of the reporting persons and on copies of the reports filed with the SEC, the Company believes that all reporting persons of the Company satisfied these filing requirements.
By Order of the Board of Directors,
/s/ F. J. Buri
F. J. Buri
Corporate Secretary
22
Table of Contents
APPENDIX A
WISCONSIN POWER AND LIGHT COMPANY
ANNUAL REPORT
For the Year Ended December 31, 2004
| Page | ||
| A-2 | ||
| A-2 | ||
Management’s Discussion and Analysis of Financial Condition and Results of Operations | A-3 | |
| A-15 | ||
Consolidated Financial Statements | ||
| A-16 | ||
| A-17 | ||
| A-19 | ||
| A-20 | ||
| A-21 | ||
| A-22 | ||
| A-39 | ||
| A-40 | ||
A-1
Table of Contents
Wisconsin Power and Light Company (WPL) filed a combined Form 10-K for 2004 with the Securities and Exchange Commission; such document included the filings of WPL’s parent, Alliant Energy Corporation (Alliant Energy), Interstate Power and Light Company (IPL) and WPL. The primary first tier subsidiaries of Alliant Energy are WPL, IPL, Alliant Energy Resources, Inc. (Resources) and Alliant Energy Corporate Services, Inc. (Corporate Services). Certain portions of Management’s Discussion and Analysis of Financial Condition and Results of Operations (MDA) and the Notes to Consolidated Financial Statements included in this WPL Annual Report represent excerpts from the combined Form 10-K. As a result, the disclosure included in this WPL Annual Report at times includes information relating to Alliant Energy, IPL, Resources and/or Corporate Services. All required disclosures for WPL are included in this Annual Report thus such additional disclosures represent supplemental information.
Overview- WPL was incorporated in 1917 in Wisconsin as Eastern Wisconsin Electric Company. WPL is a public utility engaged principally in the generation, distribution and sale of electric energy; and the purchase, distribution, transportation and sale of natural gas in selective markets. Nearly all of WPL’s customers are located in south and central Wisconsin. WPL operates in municipalities pursuant to permits of indefinite duration, which are regulated by Wisconsin law. At Dec. 31, 2004, WPL supplied electric and gas service to 445,198 and 176,045 (excluding transportation and other) customers, respectively. WPL also provides various other energy-related products and services, including construction management services for wind farms. In 2004, 2003 and 2002, WPL had no single customer for which electric, gas, water and/or other sales accounted for 10% or more of WPL’s consolidated revenues. WPL Transco LLC is a wholly-owned subsidiary of WPL and holds WPL’s investment in American Transmission Company LLC. WPL also owns all of the outstanding capital stock of South Beloit Water, Gas and Electric Company, a public utility supplying electric, gas and water service, principally in Winnebago County, Illinois, which was incorporated in 1908.
Regulation- WPL is subject to regulation by the Public Service Commission of Wisconsin (PSCW) for service territories in Wisconsin for retail utility rates and standards of service, accounting requirements, issuance and use of proceeds of securities, approval of the location and construction of electric generating facilities, certain other additions and extensions to facilities, and in other respects. WPL is required to file rate cases with the PSCW using a forward-looking test year period.
WPL is also subject, but not limited, to regulation by the Illinois Commerce Commission, the Federal Energy Regulatory Commission, the United States Environmental Protection Agency and the Nuclear Regulatory Commission.
Electric Utility Operations- As of Dec. 31, 2004, WPL provided electric service to 443,166 retail and 31 wholesale customers and 610 communities. 2004 electric utility operations accounted for 78% of operating revenues and 90% of operating income. Electric sales are seasonal to some extent with the annual peak normally occurring in the summer months. In 2004, the maximum peak hour demand for WPL was 2,627 megawatts and occurred on July 20, 2004.
Gas Utility Operations- As of Dec. 31, 2004, WPL provided retail natural gas service to 176,045 (excluding transportation and other) customers in 243 communities. 2004 gas utility operations accounted for 21% of operating revenues and 14% of operating income, which include providing gas services to retail and transportation customers. WPL’s gas sales follow a seasonal pattern. There is an annual base load of gas used for heating and other purposes, with a large heating peak occurring during the winter season.
| 2004 (1) | 2003 (1) | 2002 (1) | 2001 | 2000 | |||||||||||
| (in millions) | |||||||||||||||
Operating revenues | $ | 1,209.8 | $ | 1,217.0 | $ | 989.5 | $ | 993.7 | $ | 862.4 | |||||
Earnings available for common stock | 110.4 | 111.6 | 77.6 | 70.2 | 68.1 | ||||||||||
Cash dividends declared on common stock | 89.0 | 70.6 | 59.6 | 60.4 | — | ||||||||||
Cash flows from operating activities | 199.3 | 138.5 | 223.8 | 135.9 | 174.1 | ||||||||||
Total assets | 2,656.1 | 2,469.3 | 2,335.1 | 2,217.5 | 2,160.6 | ||||||||||
Long-term obligations, net | 491.3 | 453.5 | 523.3 | 523.2 | 569.3 | ||||||||||
| (1) | Refer to “Results of Operations” in MDA for a discussion of the 2004, 2003 and 2002 results of operations. |
Alliant Energy is the sole common shareowner of all 13,236,601 shares of WPL’s common stock outstanding. As such, earnings per share data is not disclosed herein.
A-2
Table of Contents
MANAGEMENT’S DISCUSSION AND ANALYSIS OF FINANCIAL
CONDITION AND RESULTS OF OPERATIONS (MDA)
FORWARD-LOOKING STATEMENTS
Statements contained in this report that are not of historical fact are forward-looking statements intended to qualify for the safe harbors from liability established by the Private Securities Litigation Reform Act of 1995. Such forward-looking statements are subject to risks and uncertainties that could cause actual results to differ materially from those expressed in, or implied by, such statements. Some, but not all, of the risks and uncertainties include: weather effects on sales and revenues; economic and political conditions in WPL’s service territories; federal and state regulatory or governmental actions, including the impact of potential energy-related legislation in Congress and recently enacted federal tax legislation, the ability to obtain adequate and timely rate relief to allow for, among other things, the recovery of operating costs, the earning of reasonable rates of return in current and future proceedings and the payment of expected levels of dividends; unanticipated construction and acquisition expenditures; unanticipated issues in connection with WPL’s construction of new generating facilities; issues related to the supply of purchased electricity and price thereof, including the ability to recover purchased power and fuel costs through rates; issues related to electric transmission, including recovery of costs incurred, and federal legislation and regulation affecting such transmission; risks related to the operations of WPL’s nuclear facility and unanticipated issues relating to the anticipated sale of WPL’s interest in the Kewaunee Nuclear Power Plant (Kewaunee); costs associated with WPL’s environmental remediation efforts and with environmental compliance generally; developments that adversely impact WPL’s ability to implement its strategic plan; no material permanent declines in the fair market value of, or expected cash flows from, WPL’s investments; WPL’s ability to continue its comprehensive cost-cutting and operational efficiency efforts; WPL’s ability to identify and successfully complete potential acquisitions and development projects; WPL’s ability to complete its proposed divestitures of various businesses and investments in a timely fashion and for anticipated proceeds; access to technological developments; employee workforce factors, including changes in key executives, collective bargaining agreements or work stoppages; continued access to the capital markets; the ability to successfully complete ongoing tax audits and appeals with no material impact on WPL’s earnings and cash flows; inflation rates; and factors listed in “Other Matters - Other Future Considerations.” WPL assumes no obligation, and disclaims any duty, to update the forward-looking statements in this report.
EXECUTIVE SUMMARY
Description of Business-WPL owns a portfolio of electric generating facilities with a diversified fuel mix including coal, nuclear, natural gas and renewable resources. The output from these generating facilities, supplemented with purchased power, is used to provide electric service to approximately 445,000 electric customers in the upper Midwest. WPL also procures natural gas from various suppliers to provide service to approximately 176,000 gas customers in the upper Midwest. WPL’s domestic utility business is its core business and primary source of earnings and cash flows. WPL’s earnings and cash flows are sensitive to various external factors including, but not limited to, the impact of weather on electric and gas sales volumes, the amount and timing of rate relief approved by regulatory authorities and other factors listed in “Forward-Looking Statements.”
Summary of Historical Results of Operations -In 2004, 2003 and 2002, WPL’s earnings available for common stock were $110.4 million, $111.6 million and $77.6 million, respectively. Refer to “Results of Operations” for details regarding the various factors impacting earnings during 2004, 2003 and 2002.
STRATEGIC OVERVIEW
Summary - WPL’s strategic plan is based on the following principles: a regional focus on utility operations; investments in new domestic utility generation; maintaining sustained, long-term strong financial performance with a strong balance sheet and investment grade credit ratings; and maintaining a performance culture focused on accountability and adherence to its corporate values of ethics, safety, diversity, efficiency and attention to the environment. This strategic plan is also concentrated on building and maintaining the generation and infrastructure necessary to provide WPL’s utility customers with safe, reliable and environmentally sound energy service. WPL has also implemented a comprehensive Lean Six Sigma program to assist it in generating cost savings and operational efficiencies in 2005 and beyond.
WPL’s strategy reflects the fact that it has investment opportunities in its utility business that did not exist several years ago. Wisconsin enacted legislation with the goal of assuring reliable electric energy for Wisconsin. The law allows the construction of merchant power plants in the state and streamlines the regulatory approval process for building new generation and transmission facilities. In addition, the Public Service Commission of Wisconsin (PSCW) approved a plan
A-3
Table of Contents
proposed by another Wisconsin utility, which provides a similar level of investment certainty by leasing generation from an affiliate. These changes have enabled WPL to pursue additional generation investments to serve its customers and to provide WPL with greater certainty regarding the returns on these investments.
Utility Generation Plan -In 2003, Alliant Energy announced a plan to add an additional 615 megawatts (MW) of utility generating capacity to its diversified portfolio by 2010 for WPL. WPL intends to add this new generation to meet increasing customer demand, reduce reliance on purchased power agreements and mitigate the impacts of potential future plant retirements. WPL will continue to purchase energy and capacity in the market and intends to remain a net purchaser of both, but at a reduced level assuming the successful completion of these generation projects. The plan also reflects continued commitments to WPL’s energy efficiency and environmental protection programs. The following is a summary of the significant progress Alliant Energy has made to-date regarding the execution of this plan that directly impacts WPL:
| • | Alliant Energy continues to make progress on acquiring regulatory approvals for the 300 MW, simple-cycle, natural gas-fired generating facility under construction near Sheboygan Falls, Wisconsin. Resources’ Non-regulated Generation business began construction of the generating facility in 2004 and is expected to complete the facility in time to meet increased summer demand in 2005. Alliant Energy is proposing that Resources’ Non-regulated Generation business would own the facility and enter into a long-term agreement with WPL whereby WPL would operate and maintain the facility and have exclusive rights to the generation output. The facility is expected to cost approximately $150 million, of which approximately $120 million had already been expended as of Dec. 31, 2004. The proposed structure is subject to final PSCW approval. |
| • | In October 2004, the federal renewable energy production tax credit was extended for generating facilities that will be placed in service prior to Jan. 1, 2006. As a result, Alliant Energy has moved forward with its plans to add 230 MW of wind generation to its diversified generation portfolio, preferably as purchased power agreements. WPL currently plans to add up to 100 MW of additional wind generation to its renewable resource portfolio by the end of 2005. |
| • | In May 2004, Alliant Energy announced WPL would pursue plans to build a jointly-owned 500 MW base-load electric plant with Wisconsin Public Service Corporation (WPSC) (respective ownership levels have not yet been determined). The planning process will include feasibility and siting studies. Based on the current energy requirement studies of both companies, WPL expects significant increases in electric supply are likely to be needed to offset rising energy demand and expiring purchased power agreements by 2010. |
WPL reviews and updates, as deemed necessary and in accordance with regulatory requirements, its utility generation requirements on a periodic basis.
Asset Divestitures -WPL is committed to streamlining its portfolio of businesses to those that can provide meaningful earnings and cash flows for WPL with acceptable risk profiles, as well as those it is prepared to invest the capital needed to reach the scale necessary to generate such earnings and cash flows.
WPL is currently pursuing the sale of its 41% interest in Kewaunee. In pursuing the sale of this facility, WPL expects to reduce the financial and operational uncertainty associated with nuclear generating facility ownership and operations, yet still retain the benefit of the output from such plant through a purchased power agreement. In November 2004, the PSCW issued a decision rejecting WPL’s and WPSC’s joint application to sell Kewaunee to Dominion Resources, Inc. (Dominion). WPL and WPSC joined Dominion and applied for a rehearing with the PSCW to continue the pursuit of the sale of the plant. In January 2005, the PSCW accepted the rehearing petition and expects to rule on the sale in the first half of 2005. Refer to Note 16 of the “Notes to Consolidated Financial Statements” for additional information regarding the proposed sale of this nuclear generating facility.
In August 2004, Alliant Energy announced its intention to sell WPL’s and IPL’s Illinois electric and gas utility properties (WPL’s net book value was approximately $20 million to $25 million as of Dec. 31, 2004). The administrative costs of serving relatively few customers in a jurisdiction that requires the same regulatory and administrative support as a state with a larger number of customers make it difficult for Alliant Energy to offer its services cost-effectively. Alliant Energy currently intends to enter into a sales agreement for the Illinois properties in the first half of 2005 and any such sales agreement would be subject to regulatory approvals.
In January 2005, WPL and the city of Ripon, Wisconsin finalized a purchase and sale agreement for the sale of the water utility serving the Ripon area. Pending approval by the PSCW, the transfer of ownership of the water utility is expected to take place in the first half of 2005. WPL also continues to make progress on the sale of its water utility in South Beloit, Illinois.
A-4
Table of Contents
Of all these divestitures, only WPL’s water utility in Ripon qualified as assets held for sale as of Dec. 31, 2004 and none of them have been reported as discontinued operations.
RATES AND REGULATORY MATTERS
Overview -WPL has one utility subsidiary, South Beloit Water, Gas and Electric Company (South Beloit) and is currently subject to federal regulation by the Federal Energy Regulatory Commission (FERC), which has jurisdiction over wholesale rates and certain natural gas facilities, and state regulation in Wisconsin and Illinois for retail utility rates and standards of service. Such regulatory oversight also covers WPL’s plans for construction and financing of new generation facilities and related activities.
WPL conducts its utility operations in an ever-changing business environment. Electric energy generation, transmission and distribution are facing a period of fundamental change resulting from potential legislative, regulatory, economic and technological changes. However, the pace of restructuring in WPL’s primary retail electric service territories has been delayed (and may continue to be delayed for a long period of time) due to uncertainty and developments in the industry. WPL cannot predict the timing of a restructured electric industry or the impact on its financial condition or results of operations.
Certain Recent Developments -Details of WPL’s domestic utility rate cases impacting its historical and future results of operations are as follows (dollars in millions; Electric (E); Gas (G); Water (W); To Be Determined (TBD); Not Applicable (N/A); Fuel-related (F-R)):
Case | Utility Type | Filing Date | Increase Requested | Interim Increase Granted (1) | Interim Effective Date | Final Increase Granted (1) | Final Effective Date | Expected Final Effective Date | Return on Common Equity | Notes | |||||||||||||||
2002 retail | E/G/W | 8/01 | $ | 104 | $ | 49 | 4/02 | $ | 82 | 9/02 | N/A | 12.3 | % | ||||||||||||
2003 retail | E/G/W | 5/02 | 123 | — | N/A | 81 | 4/03 | N/A | 12 | % | |||||||||||||||
2004 retail | E/G/W | 3/03 | 87 | — | N/A | 14 | 1/04 | N/A | 12 | % | |||||||||||||||
2005/2006 retail | E/G | 9/04 | 63 | N/A | N/A | TBD | TBD | 7/05 | TBD | (2) | |||||||||||||||
2004 retail (F-R) | E | 2/04 | 16 | 16 | 3/04 | 10 | 10/04 | N/A | N/A | (3) | |||||||||||||||
2004 retail (F-R) | E | 12/04 | 9 | — | N/A | — | N/A | N/A | N/A | (4) | |||||||||||||||
South Beloit | G/W | 10/03 | 1 | N/A | N/A | 1 | 10/04 | N/A | G-9.87%/ W-9.64% | | |||||||||||||||
Wholesale | E | 2/02 | 6 | 6 | 4/02 | 3 | 1/03 | N/A | N/A | ||||||||||||||||
Wholesale | E | 3/03 | 5 | 5 | 7/03 | 5 | 2/04 | N/A | N/A | ||||||||||||||||
Wholesale | E | 8/04 | 12 | 12 | 1/05 | TBD | TBD | 8/05 | N/A | ||||||||||||||||
| (1) | Interim rate relief is implemented, subject to refund, pending determination of final rates. The final rate relief granted replaces the amount of interim rate relief granted. |
| (2) | The 2005/2006 retail rate case is based on a test period from July 2005 to June 2006. |
| (3) | Since the final increase was lower than the interim relief granted, a refund to customers was made in 2004. |
| (4) | The PSCW denied WPL’s request for a rate increase in this proceeding during an oral hearing held in February 2005. WPL expects to receive the final written order in March 2005 and will consider its alternatives upon a thorough review of such written order. |
With the exception of additions to WPL’s infrastructure, a significant portion of the rate increases included in the previous table reflect the recovery of increased costs incurred by WPL or costs it expects to incur. In addition to the 2005/2006 retail base rate case, WPL currently plans to file an estimated $25 million to $35 million fuel-related rate case in the first quarter of 2005, with anticipated approval from the PSCW to implement interim rates for the fuel-related increase to be effective approximately three weeks after the filing is made. The major drivers in WPL’s base rate and fuel-related rate cases for 2005 are both fixed and variable fuel and purchased power costs. Thus, the potential increase in revenues related to these rate increase requests is not expected to result in a meaningful increase in net income.
WPL’s retail electric rates are based on annual forecasted fuel and purchased power costs. Under PSCW rules, WPL can seek rate increases for increases in the cost of electric fuel and purchased power if it experiences an increase in costs that are more than 3% higher than the estimated costs used to establish rates. The PSCW attempts to authorize, after a required hearing, interim fuel-related rate increases within 21 days of notice to customers. Any such change in rates would be
A-5
Table of Contents
effective prospectively and would require a refund with interest at the overall authorized return on common equity if final rates are determined to be lower than interim rates approved. Rate decreases due to decreases in fuel-related costs can be implemented without hearing. The rules also include a process whereby Wisconsin utilities can seek deferral treatment of emergency changes in fuel-related costs between fuel-related or base rate cases. Such deferrals would be subject to review, approval and recovery in future fuel-related or base rate cases.
Energy-related legislation is currently pending in the United States (U.S.) Congress that, among other proposals, would repeal the Public Utility Holding Company Act of 1935 (PUHCA). However, it is uncertain when or whether such legislation will be enacted or what impact it would have on WPL.
RESULTS OF OPERATIONS
Overview -WPL’s earnings available for common stock decreased $1.2 million in 2004 and increased $34 million in 2003. The 2004 decrease was primarily due to increased operating expenses, largely offset by higher electric margins. The 2003 increase was primarily due to higher electric and gas margins, partially offset by increased operating expenses.
Electric Margins -Electric margins and megawatt-hour (MWh) sales for WPL were as follows:
| Revenues and Costs (in millions) | MWhs Sold (in thousands) | ||||||||||||||||||||||||||
| 2004 | 2003 | * | 2002 | ** | 2004 | 2003 | * | 2002 | ** | ||||||||||||||||||
Residential | $ | 327.8 | $ | 316.9 | 3 | % | $ | 271.9 | 17 | % | 3,375 | 3,410 | (1 | %) | 3,432 | (1 | %) | ||||||||||
Commercial | 180.0 | 170.3 | 6 | % | 146.7 | 16 | % | 2,215 | 2,167 | 2 | % | 2,150 | 1 | % | |||||||||||||
Industrial | 262.6 | 243.8 | 8 | % | 211.3 | 15 | % | 4,769 | 4,595 | 4 | % | 4,454 | 3 | % | |||||||||||||
Total from retail customers | 770.4 | 731.0 | 5 | % | 629.9 | 16 | % | 10,359 | 10,172 | 2 | % | 10,036 | 1 | % | |||||||||||||
Sales for resale | 144.1 | 155.6 | (7 | %) | 125.8 | 24 | % | 3,797 | 4,196 | (10 | %) | 3,654 | 15 | % | |||||||||||||
Other | 25.3 | 23.5 | 8 | % | 32.0 | (27 | %) | 80 | 82 | (2 | %) | 94 | (13 | %) | |||||||||||||
Total revenues/sales | 939.8 | 910.1 | 3 | % | 787.7 | 16 | % | 14,236 | 14,450 | (1 | %) | 13,784 | 5 | % | |||||||||||||
Electric production fuel and purchased-power expense | 431.5 | 409.7 | 5 | % | 352.5 | 16 | % | ||||||||||||||||||||
Margins | $ | 508.3 | $ | 500.4 | 2 | % | $ | 435.2 | 15 | % | |||||||||||||||||
| * | Reflects the % change from 2003 to 2004. |
| ** | Reflects the % change from 2002 to 2003. |
| Actual | ||||||||
| 2004 | 2003 | 2002 | Normal | |||||
Cooling degree days*: | ||||||||
Madison | 138 | 224 | 356 | 242 | ||||
| * | Cooling degree days are calculated using a 70 degree base. Normal degree days are calculated using a fixed 30-year average most recently updated in February 2002. |
Electric margins increased $7.9 million, or 2%, in 2004, primarily due to the impact of various rate increases in 2004 and 2003, which included increased revenues to recover a significant portion of higher operating expenses, and weather-normalized sales growth of 3%, including increased industrial sales of 4% which reflects improving economic conditions in WPL’s service territory. These items were partially offset by the impact of extremely mild weather conditions in 2004, $8.9 million of lower energy conservation revenues and the effect of implementing seasonal rates in 2003. Cooling degree days in Madison were 43% below normal in 2004. WPL estimates the impact of weather reduced electric margins by approximately $12 million to $14 million in 2004 compared to normal weather. By comparison, WPL estimates that mild weather conditions reduced electric margins by approximately $3 million in 2003 compared to normal weather. The reduced energy conservation revenues were largely offset by lower energy conservation expenses.
Electric margins increased $65 million, or 15%, in 2003, primarily due to the implementation of rate increases during 2003 and 2002, including increased revenues to recover a significant portion of WPL’s increased operating expenses, weather-normalized retail sales growth, the impact of WPL implementing seasonal rates in 2003 for the first time, lower purchased power and fuel costs impacting margins and higher sales to non-retail customers. These items were partially offset by lower energy conservation revenues and the impact of milder weather conditions in 2003 compared to 2002.
A-6
Table of Contents
In April 2003, WPL implemented seasonal electric rates that are designed to result in higher rates for the peak demand period from June 1 through Sept. 30 and lower rates in all other periods during each calendar year. As a result, total annual revenues are not expected to be impacted significantly. However, given the seasonal rates were not yet effective in the first quarter of 2003, the impact of seasonal rates increased the 2003 electric margins by approximately $6 million compared to the 2004 and 2002 electric margins.
Gas Margins -Gas margins and dekatherm (Dth) sales for WPL were as follows:
| Revenues and Costs (in millions) | Dths Sold (in thousands) | ||||||||||||||||||||||||||
| 2004 | 2003 | * | 2002 | ** | 2004 | 2003 | * | 2002 | ** | ||||||||||||||||||
Residential | $ | 136.4 | $ | 137.1 | (1 | %) | $ | 94.5 | 45 | % | 12,456 | 12,797 | (3 | %) | 12,863 | (1 | %) | ||||||||||
Commercial | 76.8 | 74.6 | 3 | % | 50.1 | 49 | % | 8,585 | 8,539 | 1 | % | 8,574 | — | ||||||||||||||
Industrial | 8.1 | 9.6 | (16 | %) | 7.0 | 37 | % | 1,098 | 1,182 | (7 | %) | 1,303 | (9 | %) | |||||||||||||
Transportation/other | 32.5 | 51.1 | (36 | %) | 27.5 | 86 | % | 20,684 | 19,796 | 4 | % | 18,572 | 7 | % | |||||||||||||
Total revenues/sales | 253.8 | 272.4 | (7 | %) | 179.1 | 52 | % | 42,823 | 42,314 | 1 | % | 41,312 | 2 | % | |||||||||||||
Cost of gas sold | 165.8 | 186.3 | (11 | %) | 110.1 | 69 | % | ||||||||||||||||||||
Margins | $ | 88.0 | $ | 86.1 | 2 | % | $ | 69.0 | 25 | % | |||||||||||||||||
| * | Reflects the % change from 2003 to 2004. |
| ** | Reflects the % change from 2002 to 2003. |
| Actual | ||||||||
| 2004 | 2003 | 2002 | Normal | |||||
Heating degree days*: | ||||||||
Madison | 6,831 | 7,337 | 6,929 | 7,485 | ||||
| * | Heating degree days are calculated using a 65 degree base. Normal degree days are calculated using a fixed 30-year average most recently updated in February 2002. |
Gas margins increased $1.9 million, or 2%, in 2004, primarily due to improved results of $3.5 million from WPL’s performance-based gas commodity cost recovery program (benefits are shared by ratepayers and shareowners), partially offset by lower sales to retail customers due to milder weather conditions in 2004 compared to 2003. Gas revenues and cost of gas sold were higher in 2003 compared to 2002 due to increased natural gas prices. These increases alone had little impact on WPL’s gas margins given its rate recovery mechanism for gas costs. Gas margins increased $17 million, or 25%, in 2003, primarily due to the impact of rate increases implemented during 2003 and 2002, improved performance of $2.7 million from WPL’s performance-based gas commodity cost recovery program and continued modest customer growth.
Refer to “Rates and Regulatory Matters” for discussion of various electric and gas rate filings. Refer to Note 1(h) of the “Notes to Consolidated Financial Statements” for information relating to utility fuel and natural gas cost recovery.
Other Revenues -Other revenues decreased $18 million in 2004 primarily due to lower construction management revenues from WindConnect™, resulting from uncertainty in 2004 regarding the extension of the federal renewable energy production tax credit. This decrease was largely offset by lower operating expenses related to this activity. In the fourth quarter of 2004, the federal renewable energy production tax credit was extended for generating facilities that will be placed in service prior to Jan. 1, 2006. Other revenues increased $12 million in 2003, primarily due to increased revenues from WindConnect™, which were largely offset by higher operating expenses.
Other Operating Expenses - Other operation and maintenance expenses decreased $11 million in 2004, primarily due to $11 million of lower expenses for WindConnect™, lower energy conservation expenses and the impact of comprehensive cost-cutting and operational efficiency efforts. These items were partially offset by increases in employee and retiree benefits (comprised of compensation, medical and pension costs). Depreciation and amortization increased $6.1 million in 2004, primarily due to property additions. Taxes other than income taxes increased $4.7 million in 2004, primarily due to increased gross receipts taxes.
Other operation and maintenance expenses increased $53 million in 2003, largely due to increases in the amortization of deferred costs that are now being recovered in rates, employee and retiree benefits, WindConnect™ and nuclear expenses. The increased nuclear expenses resulted primarily from a planned refueling outage at Kewaunee in 2003. A similar planned outage occurred in 2004 but there was no refueling outage in 2002. These items were partially offset by lower fossil generation expenses. Depreciation and amortization expense decreased $3.8 million in 2003, primarily due to lower software amortizations, partially offset by property additions.
A-7
Table of Contents
Refer to “Rates and Regulatory Matters” for discussion of the interplay between utility operating expenses and utility margins given their impact on WPL’s utility rate activities.
Interest Expense and Other - Interest expense decreased $4.4 million and $2.3 million for 2004 and 2003, respectively, primarily due to lower average borrowings outstanding. Equity income from unconsolidated investments increased $4.3 million and $3.7 million for 2004 and 2003, respectively, primarily due to higher earnings at American Transmission Company LLC (ATC) resulting from rate increases.
Income Taxes- The effective income tax rates were 36.8%, 36.4%, and 35.6% in 2004, 2003 and 2002, respectively. Refer to Note 5 of the “Notes to Consolidated Financial Statements” for additional information.
LIQUIDITY AND CAPITAL RESOURCES
Overview - WPL believes it has a strong liquidity position and expects to maintain this position over its planning period of 2005 to 2009 as a result of its available capacity under its revolving credit facility and stable operating cash flows. Based on expected operating cash flows, WPL believes it will be able to secure the additional capital required to implement its strategic plan through the 2005 to 2009 planning period. WPL believes its ability to secure additional capital has been enhanced by its actions during the last several years to strengthen its balance sheet as is evidenced by, among other items, WPL’s current debt-to-total capitalization ratio of 33% compared to 43% in early 2002.
Primary Sources and Uses of Cash - WPL’s most significant source of cash is electric and gas sales to its utility customers. Cash from these sales reimburse WPL for prudently incurred expenses to provide service to its utility customers and provides WPL a return on the assets that are utilized to provide such services. Operating cash flows are expected to cover a majority of WPL’s utility maintenance capital expenditures and dividends paid to Alliant Energy. The capital requirements needed to retire maturing debt and pay capital expenditures associated with building additional generation are expected to be financed largely through external financings and proceeds from asset divestitures, supplemented by internally generated funds.
Cash Flows - Selected information from the Consolidated Statements of Cash Flows was as follows (in millions):
| 2004 | 2003 | 2002 | ||||||||||
Cash flows from (used for): | ||||||||||||
Operating activities | $ | 199.3 | $ | 138.5 | $ | 223.8 | ||||||
Investing activities | (214.3 | ) | (108.4 | ) | (187.8 | ) | ||||||
Financing activities | (12.0 | ) | (11.6 | ) | (27.7 | ) | ||||||
Cash Flows From Operating Activities -
Historical Changes in Cash Flows From Operating Activities - In 2004, WPL’s cash flows from operating activities increased $61 million primarily due to changes in working capital caused largely by the timing of tax payments and refunds. In 2003, WPL’s cash flows from operating activities decreased $85 million primarily due to changes in the levels of accounts receivable sold and the timing of tax payments and refunds, partially offset by lower pension plan contributions and the impact of rate increases.
Sale of Accounts Receivable - WPL discontinued its sale of accounts receivable program in 2004. Refer to Note 4 of the “Notes to Consolidated Financial Statements” for additional information.
Cash Flows Used For Investing Activities -
Historical Changes in Cash Flows Used For Investing Activities - In 2004, WPL’s cash flows used for investing activities increased $106 million primarily due to increased levels of construction and acquisition expenditures and the 2003 proceeds from the sale of WPL’s water utility serving the Beloit area. In 2003, WPL’s cash flows used for investing activities decreased $79 million primarily due to proceeds from the sale of WPL’s water utility serving the Beloit area and lower nuclear decommissioning trust fund contributions.
Construction and Acquisition Expenditures - Capital expenditures, investments and financing plans are continually reviewed, approved and updated as part of WPL’s ongoing strategic planning and budgeting processes. In addition, material capital expenditures and investments are subject to a rigorous cross-functional review prior to approval. Changes in WPL’s anticipated construction and acquisition expenditures may result from a number of reasons including, but not limited to, economic conditions, regulatory requirements, ability to obtain adequate and timely rate relief, the level of WPL’s profitability, WPL’s desire to maintain investment-grade credit ratings and reasonable capitalization ratios, variations in
A-8
Table of Contents
sales, changing market conditions and new opportunities. WPL currently anticipates construction and acquisition expenditures during 2005 and 2006 as follows (in millions):
| 2005 | 2006 | |||||
Transmission (gas only) and distribution (electric and gas) | $ | 120 | $ | 125 | ||
Generation (existing plants) | 30 | 30 | ||||
Environmental | 30 | 30 | ||||
Other miscellaneous utility property (includes gas transmission) | 45 | 40 | ||||
| $ | 225 | $ | 225 | |||
WPL has not yet entered into contractual commitments relating to the majority of its anticipated capital expenditures. As a result, WPL does have discretion with regard to the level of capital expenditures eventually incurred and it closely monitors and updates such estimates on an ongoing basis based on numerous economic and other factors. Refer to “Strategic Overview” for a further discussion of WPL’s generation plan as well as an update on WPL’s asset divestitures.
Cash Flows Used For Financing Activities -
Historical Changes in Cash Flows Used For Financing Activities - In 2004, WPL’s cash flows used for financing activities increased slightly in 2004 primarily due to a capital contribution from Alliant Energy in 2003 and higher common stock dividends, largely offset by changes in the amount of debt issued and retired. In 2003, WPL’s cash flows used for financing activities decreased $16 million primarily due to a higher capital contribution from Alliant Energy in 2003 compared to 2002, partially offset by changes in the amount of debt issued and retired.
Financing Authorizations - WPL has state regulatory agency financing authorization for short-term borrowings of $240 million, $185 million for general corporate purposes and an additional $55 million should WPL repurchase its variable rate demand bonds. Issuance of debt securities by WPL is exempt from regulation under provisions of PUHCA.
Shelf Registrations - In 2004, WPL filed a shelf registration with the Securities and Exchange Commission, which allows WPL flexibility to offer from time to time up to an aggregate of $150 million of its preferred stock, senior unsecured debt securities and first mortgage bonds. WPL had $50 million remaining available under its shelf registration as of Dec. 31, 2004.
Common Stock Dividends - In its December 2003 rate order, the PSCW stated WPL may not pay annual common stock dividends, including pass-through of subsidiary dividends, in excess of $89 million to Alliant Energy if WPL’s actual average common equity ratio, on a regulatory financial basis, is or will fall below the authorized level of 54.01%. WPL’s dividends are also restricted to the extent that such dividend would reduce the common stock equity ratio to less than 25%. WPL has common stock dividend payment restrictions based on its bond indentures and the terms of its outstanding preferred stock. At Dec. 31, 2004, WPL was in compliance with all such dividend restrictions.
Long-term Debt- In August 2004, WPL issued $100 million of 6.25% senior debentures due 2034 and used the proceeds to repay short-term debt, including $62 million incurred in connection with the repayment at maturity of 7.75% first mortgage bonds in June 2004, and for general corporate purposes. Refer to “Certain Financial Commitments - Contractual Obligations” for the timing of WPL’s long-term debt maturities. Refer to Note 8 of the “Notes to Consolidated Financial Statements” for additional information on short- and long-term debt.
Short-term Debt - In July 2004, WPL completed the syndication of a $250 million revolving credit facility (facility) which supports commercial paper and is available for direct borrowings. This facility is designed to be a five-year facility with the length of the facility subject to various regulatory approvals given the term is longer than a 364-day facility. WPL expects to receive the remaining regulatory approvals in 2005. In addition to funding working capital needs, the availability of short-term financing provides WPL flexibility in the issuance of long-term securities. The level of short-term borrowing fluctuates based on seasonal corporate needs, the timing of long-term financings and capital market conditions. Information regarding commercial paper at Dec. 31, 2004 was as follows (dollars in millions):
Amount outstanding | $ | 47 | ||
Weighted average maturity | 3 days | |||
Discount rate | 2.25 | % | ||
Available capacity | $ | 193 | * |
| * | WPL’s capacity is limited to $240 million due to a PSCW regulatory restriction. |
A-9
Table of Contents
Creditworthiness -
Credit Facilities -WPL’s credit facility agreement contains a covenant requiring a debt-to capital ratio of less than 58%. At Dec. 31, 2004, WPL’s debt-to-capital ratio was 34%. The debt component of the capital ratio includes, where applicable, long- and short-term debt (excluding non-recourse debt and trade payables), capital lease obligations, letters of credit and guarantees of the foregoing and unfunded vested benefits under qualified pension plans. The equity component excludes accumulated other comprehensive income (loss).
WPL’s credit facility contains a negative pledge provision, which generally prohibits placing liens on any of WPL’s property with certain exceptions, including among others, for the issuance of secured debt under WPL’s first mortgage bond indentures, non-recourse project financing and purchase money liens.
WPL’s credit facility contains a material adverse change (MAC) clause. Before each extension of credit (each borrowing under the facility), unless the borrowing will be used exclusively to repurchase commercial paper issued by or on behalf of WPL, WPL must represent and warrant that no MAC has occurred since Dec. 31, 2003. A MAC is defined as a change that would create: (1) a MAC in, or a material adverse effect upon, the operations, business, properties, liabilities (actual or contingent), condition (financial or otherwise) or prospects of the borrower or the borrower and its subsidiaries taken as a whole; (2) a material impairment of the ability of the borrower to perform its obligations under a credit facility agreement to which it is a party; or (3) a MAC upon the legality, validity, binding effect or enforceability against the borrower of the credit agreement to which it is a party.
WPL’s credit facility contains a provision that requires, during the term of the facility, any proceeds from asset sales, with certain exclusions, in excess of 20% of WPL’s consolidated assets be used to reduce commitments under its facility. Exclusions include, among others, certain sale and lease-back transactions, and any potential sales of WPL’s nuclear assets.
Credit Ratings and Balance Sheet - Access to the capital and credit markets, and costs of obtaining external financing, are dependent on creditworthiness. WPL is committed to taking the necessary steps required to maintain investment-grade credit ratings and a strong balance sheet. Although WPL believes the actions taken in recent years to strengthen its balance sheet will enable it to maintain investment-grade credit ratings, no assurance can be given that it will be able to maintain its existing credit ratings. If WPL’s credit ratings are downgraded in the future, then WPL’s borrowing costs may increase and its access to capital markets may be limited. If access to capital markets becomes significantly constrained, then WPL’s results of operations and financial condition could be materially adversely affected. WPL’s current credit ratings and outlook are as follows (long-term debt ratings only apply to senior debt):
| Standard & Poor’s Rating Services | Moody’s Investors Service | |||
Secured long-term debt | A- | A1 | ||
Unsecured long-term debt | BBB+ | A2 | ||
Commercial paper | A-2 | P-1 | ||
Corporate/issuer | A- | A2 | ||
Outlook | Negative | Stable |
Ratings Triggers - The long-term debt of WPL is not subject to any repayment requirements as a result of explicit credit rating downgrades or so-called “ratings triggers.” However, WPL is party to various agreements, including purchased power agreements and fuel contracts that are dependent on maintaining investment-grade credit ratings. In the event of a downgrade below investment-grade, WPL may need to provide credit support, such as letters of credit or cash collateral equal to the amount of the exposure, or may need to unwind the contract or pay the underlying obligation. In the event of a downgrade below investment-grade, management believes WPL’s credit facility would provide sufficient liquidity to cover counterparty credit support or collateral requirements under the various purchased power and fuel sales agreements.
Off-Balance Sheet Arrangements - WPL utilizes off-balance sheet synthetic operating leases to finance certain utility railcars and a utility radio dispatch system. Synthetic leases provide favorable financing rates to WPL while allowing it to maintain operating control of its leased assets. Refer to Note 3 of the “Notes to Consolidated Financial Statements” for future minimum lease payments under, and residual value guarantees by WPL, of these synthetic leases. WPL’s credit facility agreement prohibits it from entering into any additional synthetic leases. WPL has reviewed the lessor entities during its implementation of revised Financial Accounting Standards Board Interpretation No. 46, “Consolidation of Variable Interest Entities,” (FIN 46R), and determined that consolidation of these entities is not required. Refer to Note 18 of the “Notes to Consolidated Financial Statements” for additional information regarding the implementation of FIN 46R.
A-10
Table of Contents
Credit Risk - WPL has limited credit exposure from electric and natural gas sales and non-performance of contractual obligations by its counterparties. WPL maintains credit risk oversight and sets limits and policies with regards to its counterparties, which management believes minimizes its overall credit risk exposure. However, there is no assurance that such policies will protect WPL against all losses from non-performance by counterparties.
Certain Financial Commitments -
Contractual Obligations - WPL’s long-term contractual cash obligations as of Dec. 31, 2004 were as follows (in millions):
| 2005 | 2006 | 2007 | 2008 | 2009 | Thereafter | Total | |||||||||||||||
Long-term debt maturities (Note 8(b)) | $ | 88 | $ | — | $ | 105 | $ | 60 | $ | — | $ | 239 | $ | 492 | |||||||
Interest - long-term debt obligations | 31 | 26 | 22 | 18 | 15 | 165 | 277 | ||||||||||||||
Operating leases (Note 3) | 79 | 80 | 80 | 68 | 61 | 191 | 559 | ||||||||||||||
Purchase obligations (Note 11(b)): | |||||||||||||||||||||
Purchased power and fuel commitments | 128 | 61 | 32 | 25 | 25 | 65 | 336 | ||||||||||||||
Other | 9 | — | — | — | — | — | 9 | ||||||||||||||
| $ | 335 | $ | 167 | $ | 239 | $ | 171 | $ | 101 | $ | 660 | $ | 1,673 | ||||||||
At Dec. 31, 2004, long-term debt as noted in the previous table was included on the Consolidated Balance Sheet. Included in WPL’s long-term debt obligations was variable rate debt of $55 million, which represented 11% of total long-term debt outstanding. The long-term debt amounts exclude reductions related to unamortized debt discounts. Interest on variable rate debt in the previous table was calculated using rates as of Dec. 31, 2004. Purchased power and fuel commitments represent normal business contracts used to ensure adequate purchased power, coal and natural gas supplies and to minimize exposure to market price fluctuations. Alliant Energy has entered into various purchased power commitments that have not yet been directly assigned to IPL and WPL. Such commitments are not included in the WPL purchase obligations. Other purchase obligations represent individual commitments incurred during the normal course of business which exceeded $1.0 million at Dec. 31, 2004. In connection with its construction and acquisition program, WPL also enters into commitments related to such program on an ongoing basis which are not reflected in the previous table. Refer to “Cash Flows Used For Investing Activities - Construction and Acquisition Expenditures” for additional information. In addition, at Dec. 31, 2004, there were various other long-term liabilities and deferred credits included on the Consolidated Balance Sheet that, due to the nature of the liabilities, the timing of payments cannot be estimated and are therefore excluded from the table. Refer to Note 6 of the “Notes to Consolidated Financial Statements” for anticipated pension and other postretirement benefit funding amounts, which are not included in the previous table.
Environmental- WPL’s pollution abatement programs are subject to continuing review and are periodically revised due to changes in environmental regulations, construction plans and escalation of construction costs. WPL continually evaluates the impact of potential future federal, state and local environmental rulemakings on its operations. While the final outcome of these rule makings cannot be predicted, WPL believes that required capital investments and/or modifications resulting from them could be significant, but expects that prudent expenses incurred by WPL likely would be recovered in rates from its customers. The environmental rulemaking process continually evolves and the following are major emerging issues that could potentially have a significant impact on WPL’s operations.
Air Quality - WPL previously responded confidentially to multiple data requests from the U.S. Environmental Protection Agency (EPA) related to the historical operation and associated air permitting for certain major Wisconsin coal-fired generating units. In September 2004, WPL was notified by the EPA that a third party had requested WPL’s response materials. After review of such records, WPL determined that the information would no longer be claimed as confidential. There have been instances where citizen groups have pursued claims against utilities for alleged air permitting violations. WPL has not received any such actions to date and is unable to predict further actions, if any, from the information requests from the EPA or third parties.
The 1990 Clean Air Act Amendments mandate preservation of air quality through existing regulations and periodic reviews to ensure adequacy of these provisions based on scientific data. In 1997, the EPA revised National Ambient Air Quality Standards (NAAQS) for ozone and fine particulate matter. In 2003, the EPA proposed the Clean Air Interstate Rule that would require emission control upgrades to existing power plants. This rule would reduce the current level of power plant sulfur dioxide emissions approximately 40% by 2010 and 70% by 2015, and nitrogen oxide emission levels 50% by 2010 and 65% by 2015. Additional reduction requirements may also be imposed at the state level for those areas that are in non-attainment with NAAQS. WPL believes that the required capital investments and/or modifications resulting from these proposed regulations could be significant.
A-11
Table of Contents
In 2000, the EPA determined that regulation of hazardous air pollutant emissions from coal and oil-fired electric utility steam generating units was necessary. Under an existing settlement agreement, final utility Maximum Achievable Control Technology (MACT) requirements or alternative regulations must be issued by March 15, 2005. Accordingly, the EPA has published proposed rules requiring control of mercury from coal-fired and nickel from oil-fired generating units. The impact of these regulations on WPL’s generating facilities is subject to the control level mandated in the final rules. The Wisconsin Department of Natural Resources (DNR) also independently developed mercury control rules, which became effective in October 2004 for Wisconsin generating facilities, that cap emissions beginning in 2008, followed by subsequent reductions of 40% by 2010 and 75% by 2015. The Wisconsin mercury rule requirements will be superseded by federal mercury emissions standards when published. WPL has begun fuel sampling and will conduct stack testing in 2005 to support the compliance requirements for Wisconsin mercury rules. WPL continues to closely monitor the developments at the federal level related to mercury emissions standards and believes that required capital investments and/or modifications resulting from these rules could be significant.
WPL is also currently monitoring various other potential federal, state and local environmental rulemakings and activities, including, but not limited to: litigation of federal New Source Review Reforms; Regional Haze evaluations for Best Available Retrofit Technology; and several other legislative and regulatory proposals regarding the control of emissions of air pollutants and greenhouse gases from a variety of sources, including generating facilities.
Water Quality - The EPA regulation under the Clean Water Act referred to as “316(b)” became effective in September 2004. This regulation requires existing large power plants with cooling water intake structures to apply technology to minimize adverse environmental impacts to fish and other aquatic life. WPL is currently studying such impacts and will have compliance plans in place by the required date of January 2008. WPL is investigating compliance options and is unable to predict the final outcome, but believes that required capital investments and/or modifications resulting from this regulation could be significant.
WPL is also currently evaluating proposed revisions to the Wisconsin Administrative Code concerning the amount of heat that WPL’s generating stations can discharge into Wisconsin waters. At this time, WPL is unable to predict the final outcome, but believes that required capital investments and/or modifications resulting from this regulation could be significant.
In October 2004, FERC issued an order regarding one of WPL’s hydroelectric project licenses to require WPL to develop a detailed engineering and biological evaluation of potential fish passage alternatives within one year and to install within three years agency-approved fish-protective devices and fish passages. Accordingly, these provisions are now effective and WPL is in the process of working with the appropriate federal and state agencies to comply with these provisions and research solutions. WPL is currently unable to predict the final outcome, but believes that required capital investments and/or modifications resulting from this issue could be significant.
Land and Solid Waste - In 2003, at the request of the Wisconsin DNR, WPL submitted a written plan for facility closure of the Rock River Generating Station landfill and clean-up of the support ponds and all areas where coal combustion waste is present. Removal of ash from half of the remediation area to the landfill was completed in 2004. The remaining targeted ash will be moved to the landfill in 2005 and the landfill will be capped in 2006, with an insignificant total project cost.
WPL is also monitoring various other land and solid waste regulatory changes. This includes a potential EPA regulation for management of coal combustion product in landfills and surface impoundments that could require installation of monitoring wells at some facilities and an ongoing expanded groundwater monitoring program. Compliance with the polychlorinated biphenols (PCB) Fix-it Rule/Persistent Organic Pollutants Treaty could possibly require replacement of all electrical equipment containing PCB insulating fluid which is a substance known to be harmful to human health. The Wisconsin Department of Commerce is proposing new rules related to flammable, combustible and hazardous liquids stored in above-ground storage tanks in which the primary financial impact would be from a secondary containment requirement for all hazardous materials tanks and for hazardous material unloading areas. WPL is unable to predict the outcome of these possible regulatory changes at this time, but believes that the required capital investment and/or modifications resulting from these potential regulations could be significant.
Refer to Note 11(e) of the “Notes to Consolidated Financial Statements” and “Construction and Acquisition Expenditures” for further discussion of environmental matters.
A-12
Table of Contents
OTHER MATTERS
Market Risk Sensitive Instruments and Positions- WPL’s primary market risk exposures are associated with interest rates and commodity and equity prices. WPL has risk management policies to monitor and assist in controlling these market risks and uses derivative instruments to manage some of the exposures. Refer to Notes 1(j) and 10 of the “Notes to Consolidated Financial Statements” for further discussion of WPL’s derivative financial instruments.
Interest Rate Risk - WPL is exposed to risk resulting from changes in interest rates as a result of its issuance of variable-rate debt and leasing agreements. WPL manages its interest rate risk by limiting its variable interest rate exposure and by continuously monitoring the effects of market changes on interest rates. In the event of significant interest rate fluctuations, management would take actions to minimize the effect of such changes on WPL’s results of operations and financial condition. Assuming no change in WPL’s consolidated financial structure, if variable interest rates were to average 100 basis points higher (lower) in 2005 than in 2004, expense would increase (decrease) by approximately $1.2 million. This amount was determined by considering the impact of a hypothetical 100 basis point increase (decrease) in interest rates on WPL’s consolidated variable-rate debt held and variable-rate lease balances at Dec. 31, 2004.
Commodity Price Risk- WPL is exposed to the impact of market fluctuations in the commodity price and transportation costs of electric and natural gas products it procures and markets. WPL employs established policies and procedures to manage its risks associated with these market fluctuations including the use of various commodity derivatives. WPL’s exposure to commodity price risks is also significantly mitigated by the current rate making structures in place for the recovery of its electric fuel and purchased energy costs as well as its cost of natural gas purchased for resale.
Under PSCW rules, WPL can seek rate increases for increases in the cost of electric fuel and purchased power if it experiences an increase in costs that are more than 3% higher than the estimated costs used to establish rates. Such rules significantly reduce commodity risk for WPL by reducing the regulatory lag related to the timing of changes in rates for increased fuel and purchased energy costs. WPL’s retail gas tariffs provide for subsequent adjustments to its natural gas rates for changes in the current monthly natural gas commodity price index. Also, WPL has a gas performance incentive which includes a sharing mechanism whereby 50% of all gains and losses relative to current commodity prices, as well as other benchmarks, are retained by WPL, with the remainder refunded to or recovered from customers. Such rate mechanisms combined with commodity derivatives discussed above significantly reduce commodity risk associated with WPL’s cost of natural gas. Refer to Note 1(h) of the “Notes to Consolidated Financial Statements” for further discussion.
Equity Price Risk - WPL maintains a trust fund to fund the anticipated nuclear decommissioning costs of Kewaunee. At Dec. 31, 2004, this fund was invested primarily in domestic equity and debt instruments and money market funds. Fluctuations in equity prices or interest rates do not affect WPL’s consolidated results of operations. In 2004, WPL liquidated all of its qualified decommissioning trust fund assets into money market funds as a result of the proposed Kewaunee sale. Refer to Notes 9 and 16 of the “Notes to Consolidated Financial Statements” for further discussion. Refer to “Critical Accounting Policies - Accounting for Pensions and Other Postretirement Benefits” for the impact on WPL’s pension and other postretirement benefit costs of changes in the rate of returns earned by its plan assets, which include equity securities.
Accounting Pronouncements- WPL does not expect the various new accounting pronouncements that were effective in 2004 to have a material impact on its results of operations or financial condition.
Critical Accounting Policies- Based on historical experience and various other factors, WPL believes the following policies are critical to its business and the understanding of its results of operations as they require critical estimates be made based on the assumptions and judgment of management. The preparation of consolidated financial statements requires management to make various estimates and assumptions that affect revenues, expenses, assets, liabilities and the disclosure of contingencies. The results of these estimates and judgments form the basis for making judgments about the carrying values of assets and liabilities that are not readily apparent from other sources. Actual results may differ from these estimates and judgments. WPL’s management has discussed these critical accounting policies with the Audit Committee of its Board of Directors. Refer to Note 1 of the “Notes to Consolidated Financial Statements” for a discussion of WPL’s accounting policies and the estimates and assumptions used in the preparation of the consolidated financial statements.
A-13
Table of Contents
Regulatory Assets and Liabilities- WPL is regulated by various federal and state regulatory agencies. As a result, it qualifies for the application of Statement of Financial Accounting Standards (SFAS) 71, “Accounting for the Effects of Certain Types of Regulation” (SFAS 71). SFAS 71 recognizes that the actions of a regulator can provide reasonable assurance of the existence of an asset or liability. Regulatory assets or liabilities arise as a result of a difference between accounting principles generally accepted in the U.S. and the accounting principles imposed by the regulatory agencies. Regulatory assets generally represent incurred costs that have been deferred as they are probable of recovery in customer rates. Regulatory liabilities generally represent obligations to make refunds to customers for various reasons.
WPL recognizes regulatory assets and liabilities in accordance with the rulings of its federal and state regulators and future regulatory rulings may impact the carrying value and accounting treatment of WPL’s regulatory assets and liabilities. WPL periodically assesses whether the regulatory assets are probable of future recovery by considering factors such as regulatory environment changes, recent rate orders issued by the applicable regulatory agencies and the status of any pending or potential deregulation legislation. The assumptions and judgments used by regulatory authorities continue to have an impact on the recovery of costs, the rate of return on invested capital and the timing and amount of assets to be recovered by rates. A change in these assumptions may result in a material impact on WPL’s results of operations. Refer to Note 1(c) of the “Notes to Consolidated Financial Statements” for further discussion.
Unbilled Revenues - Energy sales to individual customers are based on the reading of their meters, which occurs on a systematic basis throughout the month. At the end of each month, amounts of energy delivered to customers since the date of the last meter reading are estimated and the corresponding estimated unbilled revenue is recorded. The unbilled revenue estimate is based on daily system demand volumes, estimated customer usage by class, weather impacts, line losses and the most recent customer rates. Such process involves the use of various estimates, thus significant changes in the estimates could have a material impact on WPL’s results of operations.
Accounting for Pensions and Other Postretirement Benefits- WPL accounts for pensions and other postretirement benefits under SFAS 87, “Employers’ Accounting for Pensions,” and SFAS 106, “Employers’ Accounting for Postretirement Benefits Other Than Pensions,” respectively. Under these rules, certain assumptions are made which represent significant estimates. There are many factors involved in determining an entity’s pension and other postretirement liabilities and costs each period including assumptions regarding employee demographics (including age, life expectancies, and compensation levels), discount rates, assumed rate of returns and funding. Changes made to the plan provisions may also impact current and future pension and other postretirement costs. WPL’s assumptions are supported by historical data and reasonable projections and are reviewed annually with an outside actuary firm and an investment consulting firm. As of Sep. 30, 2004 (WPL’s measurement date), WPL was using a 6% discount rate to calculate benefit obligations and a 9% annual rate of return on investments. In selecting an assumed discount rate, WPL reviews various corporate Aa bond indices. The 9% annual rate of return is consistent with WPL’s historical returns and is based on projected long-term equity and bond returns, maturities and asset allocations. Refer to Note 6 of the “Notes to Consolidated Financial Statements” for discussion of the impact of a change in the medical trend rates.
Other Future Considerations - In addition to items discussed earlier in MDA, the following items could impact WPL’s future financial condition or results of operations:
American Jobs Creation Act (AJCA)- In October 2004, the AJCA was passed which includes changes to several provisions of the Internal Revenue Code. In addition to the extension of certain renewable energy production tax credits discussed earlier, the key changes that may impact WPL include, but are not limited to, future tax relief for domestic manufacturers (including electric production activities). Any potential tax benefits realized as a result of this legislation would be subject to all appropriate regulatory reviews.
Generating Facility Outage- On Feb. 20, 2005, Kewaunee was removed from service after a potential design weakness was identified in a backup cooling system. Plant engineering staff identified the concern and the unit was shutdown in accordance with the plant license. A modification is being made to resolve the issue and it is anticipated that the unit will be back in service at full power in April 2005. The modification costs associated with resolving this issue and the operation and maintenance costs necessary to restart the unit are not expected to have a material adverse impact on WPL’s financial condition or results of operations. WPL plans to seek recovery of the additional purchased power costs incurred as a result of this outage through either a request for deferral or in the fuel-related rate case it will be filing in March 2005.
Refer to Note 1(h) of the “Notes to Consolidated Financial Statements” for information relating to utility fuel cost recovery.
A-14
Table of Contents
REPORT OF INDEPENDENT REGISTERED PUBLIC ACCOUNTING FIRM
To the Board of Directors and Shareowners of Wisconsin Power and Light Company:
We have audited the accompanying consolidated balance sheets and statements of capitalization of Wisconsin Power and Light Company and subsidiaries (the “Company”) as of December 31, 2004 and 2003, and the related consolidated statements of income, cash flows, and changes in common equity for each of the three years in the period ended December 31, 2004. These financial statements are the responsibility of the Company’s management. Our responsibility is to express an opinion on these financial statements based on our audits.
We conducted our audits in accordance with the standards of the Public Company Accounting Oversight Board (United States). Those standards require that we plan and perform the audit to obtain reasonable assurance about whether the financial statements are free of material misstatement. The Company is not required to have, nor were we engaged to perform, an audit of its internal control over financial reporting. Our audits included consideration of internal control over financial reporting as a basis for designing audit procedures that are appropriate in the circumstances, but not for the purpose of expressing an opinion on the effectiveness of the Company’s internal control over financial reporting. Accordingly, we express no such opinion.An audit also includes examining, on a test basis, evidence supporting the amounts and disclosures in the financial statements, assessing the accounting principles used and significant estimates made by management, as well as evaluating the overall financial statement presentation. We believe that our audits provide a reasonable basis for our opinion.
In our opinion, such consolidated financial statements present fairly, in all material respects, the financial position of the Company as of December 31, 2004 and 2003, and the results of its operations and its cash flows for each of the three years in the period ended December 31, 2004, in conformity with accounting principles generally accepted in the United States of America.
As discussed in Note 17 to the consolidated financial statements, on January 1, 2003, the Company adopted Statement of Financial Accounting Standards No. 143, “Accounting for Asset Retirement Obligations.”
DELOITTE & TOUCHE LLP
Milwaukee, Wisconsin
March 2, 2005
A-15
Table of Contents
CONSOLIDATED FINANCIAL STATEMENTS
CONSOLIDATED STATEMENTS OF INCOME
| Year Ended December 31, | ||||||||||||
| 2004 | 2003 | 2002 | ||||||||||
| (in millions) | ||||||||||||
Operating revenues: | ||||||||||||
Electric utility | $ | 939.8 | $ | 910.1 | $ | 787.7 | ||||||
Gas utility | 253.8 | 272.4 | 179.1 | |||||||||
Other | 16.2 | 34.5 | 22.7 | |||||||||
| 1,209.8 | 1,217.0 | 989.5 | ||||||||||
Operating expenses: | ||||||||||||
Electric production fuel and purchased power | 431.5 | 409.7 | 352.5 | |||||||||
Cost of gas sold | 165.8 | 186.3 | 110.1 | |||||||||
Other operation and maintenance | 282.1 | 292.6 | 239.7 | |||||||||
Depreciation and amortization | 111.0 | 104.9 | 108.7 | |||||||||
Taxes other than income taxes | 36.6 | 31.9 | 32.9 | |||||||||
| 1,027.0 | 1,025.4 | 843.9 | ||||||||||
Operating income | 182.8 | 191.6 | 145.6 | |||||||||
Interest expense and other: | ||||||||||||
Interest expense | 33.5 | 37.9 | 40.2 | |||||||||
Equity income from unconsolidated investments | (25.0 | ) | (20.7 | ) | (17.0 | ) | ||||||
Allowance for funds used during construction | (4.5 | ) | (4.0 | ) | (2.6 | ) | ||||||
Interest income and other | (1.2 | ) | (2.3 | ) | (0.6 | ) | ||||||
| 2.8 | 10.9 | 20.0 | ||||||||||
Income before income taxes | 180.0 | 180.7 | 125.6 | |||||||||
Income taxes | 66.3 | 65.8 | 44.7 | |||||||||
Net income | 113.7 | 114.9 | 80.9 | |||||||||
Preferred dividend requirements | 3.3 | 3.3 | 3.3 | |||||||||
Earnings available for common stock | $ | 110.4 | $ | 111.6 | $ | 77.6 | ||||||
The accompanying Notes to Consolidated Financial Statements are an integral part of these statements.
A-16
Table of Contents
| December 31, | ||||||||
| 2004 | 2003 | |||||||
| (in millions) | ||||||||
ASSETS | ||||||||
Property, plant and equipment: | ||||||||
Electric plant in service | $ | 2,128.5 | $ | 2,002.0 | ||||
Gas plant in service | 316.4 | 301.2 | ||||||
Other plant in service | 258.2 | 268.1 | ||||||
Accumulated depreciation | (1,196.6 | ) | (1,137.2 | ) | ||||
Net plant | 1,506.5 | 1,434.1 | ||||||
Construction work in progress | 75.8 | 66.3 | ||||||
Other, less accumulated depreciation of $0.3 for both periods | 18.7 | 15.7 | ||||||
| 1,601.0 | 1,516.1 | |||||||
Current assets: | ||||||||
Cash and temporary cash investments | 0.1 | 27.1 | ||||||
Accounts receivable: | ||||||||
Customer, less allowance for doubtful accounts of $1.1 and $2.7 | 139.7 | 78.9 | ||||||
Other, less allowance for doubtful accounts of $— and $0.4 | 30.5 | 24.4 | ||||||
Income tax refunds receivable | — | 16.8 | ||||||
Production fuel, at average cost | 16.0 | 17.7 | ||||||
Materials and supplies, at average cost | 24.2 | 22.9 | ||||||
Gas stored underground, at average cost | 30.3 | 24.3 | ||||||
Regulatory assets | 21.1 | 24.2 | ||||||
Prepaid gross receipts tax | 33.0 | 28.3 | ||||||
Assets held for sale | 4.9 | 6.1 | ||||||
Other | 18.5 | 14.6 | ||||||
| 318.3 | 285.3 | |||||||
Investments: | ||||||||
Nuclear decommissioning trust funds | 243.2 | 233.7 | ||||||
Investment in American Transmission Company LLC and other | 165.1 | 144.0 | ||||||
| 408.3 | 377.7 | |||||||
Other assets: | ||||||||
Regulatory assets | 128.6 | 96.0 | ||||||
Deferred charges and other | 199.9 | 194.2 | ||||||
| 328.5 | 290.2 | |||||||
Total assets | $ | 2,656.1 | $ | 2,469.3 | ||||
The accompanying Notes to Consolidated Financial Statements are an integral part of these statements.
A-17
Table of Contents
CONSOLIDATED BALANCE SHEETS (Continued)
| December 31, | ||||||||
| 2004 | 2003 | |||||||
| (in millions, except per share and share amounts) | ||||||||
CAPITALIZATION AND LIABILITIES | ||||||||
Capitalization (Refer to Consolidated Statements of Capitalization): | ||||||||
Common stock - $5 par value - authorized 18,000,000 shares; 13,236,601 shares outstanding | $ | 66.2 | $ | 66.2 | ||||
Additional paid-in capital | 525.7 | 525.6 | ||||||
Retained earnings | 461.7 | 440.3 | ||||||
Accumulated other comprehensive loss | (2.7 | ) | (20.3 | ) | ||||
Total common equity | 1,050.9 | 1,011.8 | ||||||
Cumulative preferred stock | 60.0 | 60.0 | ||||||
Long-term debt, net (excluding current portion) | 364.2 | 336.4 | ||||||
| 1,475.1 | 1,408.2 | |||||||
Current liabilities: | ||||||||
Current maturities | 88.0 | 62.0 | ||||||
Variable rate demand bonds | 39.1 | 55.1 | ||||||
Commercial paper | 47.0 | — | ||||||
Accounts payable | 91.0 | 80.1 | ||||||
Accounts payable to associated companies | 20.3 | 22.6 | ||||||
Regulatory liabilities | 23.8 | 13.9 | ||||||
Other | 39.5 | 33.5 | ||||||
| 348.7 | 267.2 | |||||||
Other long-term liabilities and deferred credits: | ||||||||
Deferred income taxes | 232.6 | 213.7 | ||||||
Deferred investment tax credits | 19.9 | 21.5 | ||||||
Regulatory liabilities | 215.1 | 227.9 | ||||||
Asset retirement obligations | 200.9 | 187.4 | ||||||
Pension and other benefit obligations | 85.7 | 59.0 | ||||||
Other | 78.1 | 84.4 | ||||||
| 832.3 | 793.9 | |||||||
Commitments and contingencies (Note 11) | ||||||||
Total capitalization and liabilities | $ | 2,656.1 | $ | 2,469.3 | ||||
The accompanying Notes to Consolidated Financial Statements are an integral part of these statements.
A-18
Table of Contents
CONSOLIDATED STATEMENTS OF CASH FLOWS
| Year Ended December 31, | ||||||||||||
| 2004 | 2003 | 2002 | ||||||||||
| (in millions) | ||||||||||||
Cash flows from operating activities: | ||||||||||||
Net income | $ | 113.7 | $ | 114.9 | $ | 80.9 | ||||||
Adjustments to reconcile net income to net cash flows from operating activities: | ||||||||||||
Depreciation and amortization | 111.0 | 104.9 | 108.7 | |||||||||
Other amortizations | 41.4 | 51.3 | 27.7 | |||||||||
Deferred tax expense (benefit) and investment tax credits | 8.5 | 21.8 | (5.6 | ) | ||||||||
Equity income from unconsolidated investments, net | (25.0 | ) | (20.7 | ) | (17.0 | ) | ||||||
Distributions from equity method investments | 20.5 | 14.0 | 13.2 | |||||||||
Other | (3.7 | ) | (2.3 | ) | (1.2 | ) | ||||||
Other changes in assets and liabilities: | ||||||||||||
Accounts receivable | (16.9 | ) | (10.0 | ) | (1.9 | ) | ||||||
Sale of accounts receivable | (50.0 | ) | (66.0 | ) | 28.0 | |||||||
Income tax refunds receivable | 16.8 | (16.8 | ) | — | ||||||||
Accounts payable | 8.6 | (2.6 | ) | (20.5 | ) | |||||||
Accrued taxes | 3.2 | (13.1 | ) | 17.3 | ||||||||
Benefit obligations and other | (28.8 | ) | (36.9 | ) | (5.8 | ) | ||||||
Net cash flows from operating activities | 199.3 | 138.5 | 223.8 | |||||||||
Cash flows used for investing activities: | ||||||||||||
Utility construction and acquisition expenditures | (211.5 | ) | (151.6 | ) | (156.9 | ) | ||||||
Nuclear decommissioning trust funds | (2.9 | ) | (2.9 | ) | (16.1 | ) | ||||||
Proceeds from asset sales | — | 21.3 | — | |||||||||
Other | 0.1 | 24.8 | (14.8 | ) | ||||||||
Net cash flows used for investing activities | (214.3 | ) | (108.4 | ) | (187.8 | ) | ||||||
Cash flows used for financing activities: | ||||||||||||
Common stock dividends | (89.0 | ) | (70.6 | ) | (59.6 | ) | ||||||
Preferred stock dividends | (3.3 | ) | (3.3 | ) | (3.3 | ) | ||||||
Capital contribution from parent | — | 200.0 | 61.0 | |||||||||
Proceeds from issuance of long-term debt | 100.0 | — | — | |||||||||
Reductions in long-term debt | (62.0 | ) | (70.0 | ) | — | |||||||
Net change in commercial paper and other short-term borrowings | 47.0 | (60.0 | ) | (30.8 | ) | |||||||
Other | (4.7 | ) | (7.7 | ) | 5.0 | |||||||
Net cash flows used for financing activities | (12.0 | ) | (11.6 | ) | (27.7 | ) | ||||||
Net increase (decrease) in cash and temporary cash investments | (27.0 | ) | 18.5 | 8.3 | ||||||||
Cash and temporary cash investments at beginning of period | 27.1 | 8.6 | 0.3 | |||||||||
Cash and temporary cash investments at end of period | $ | 0.1 | $ | 27.1 | $ | 8.6 | ||||||
Supplemental cash flows information: | ||||||||||||
Cash paid during the period for: | ||||||||||||
Interest | $ | 31.3 | $ | 39.6 | $ | 39.5 | ||||||
Income taxes, net of refunds | $ | 40.4 | $ | 84.3 | $ | 35.9 | ||||||
The accompanying Notes to Consolidated Financial Statements are an integral part of these statements.
A-19
Table of Contents
CONSOLIDATED STATEMENTS OF CAPITALIZATION
| December 31, | ||||||||
| 2004 | 2003 | |||||||
| (dollars in millions, except per share amounts) | ||||||||
Common equity (Refer to Consolidated Balance Sheets) | $ | 1,050.9 | $ | 1,011.8 | ||||
Cumulative preferred stock: | ||||||||
Cumulative, without par value, not mandatorily redeemable - authorized 3,750,000 shares, maximum aggregate stated value $150, redeemable any time: | ||||||||
$100 stated value - 4.50% series, 99,970 shares outstanding | 10.0 | 10.0 | ||||||
$100 stated value - 4.80% series, 74,912 shares outstanding | 7.5 | 7.5 | ||||||
$100 stated value - 4.96% series, 64,979 shares outstanding | 6.5 | 6.5 | ||||||
$100 stated value - 4.40% series, 29,957 shares outstanding | 3.0 | 3.0 | ||||||
$100 stated value - 4.76% series, 29,947 shares outstanding | 3.0 | 3.0 | ||||||
$100 stated value - 6.20% series, 150,000 shares outstanding | 15.0 | 15.0 | ||||||
$25 stated value - 6.50% series, 599,460 shares outstanding | 15.0 | 15.0 | ||||||
| 60.0 | 60.0 | |||||||
Long-term debt, net: | ||||||||
First Mortgage Bonds: | ||||||||
1992 Series Y, 7.6%, due 2005 | 72.0 | 72.0 | ||||||
1991 Series B, variable rate (2.5% at Dec. 31, 2004), due 2005 | 16.0 | 16.0 | ||||||
1984 Series A, variable rate (2.36% at Dec. 31, 2004), due 2014 | 8.5 | 8.5 | ||||||
1988 Series A, variable rate (2.15% at Dec. 31, 2004), due 2015 | 14.6 | 14.6 | ||||||
1991 Series A, variable rate (2.5% at Dec. 31, 2004), due 2015 | 16.0 | 16.0 | ||||||
1992 Series X, 7.75%, retired in 2004 | — | 62.0 | ||||||
| 127.1 | 189.1 | |||||||
Debentures, 7%, due 2007 | 105.0 | 105.0 | ||||||
Debentures, 5.7%, due 2008 | 60.0 | 60.0 | ||||||
Debentures, 7.625%, due 2010 | 100.0 | 100.0 | ||||||
Debentures, 6.25%, due 2034 | 100.0 | — | ||||||
| 492.1 | 454.1 | |||||||
Less: | ||||||||
Current maturities | (88.0 | ) | (62.0 | ) | ||||
Variable rate demand bonds | (39.1 | ) | (55.1 | ) | ||||
Unamortized debt discount, net | (0.8 | ) | (0.6 | ) | ||||
| 364.2 | 336.4 | |||||||
Total capitalization | $ | 1,475.1 | $ | 1,408.2 | ||||
The accompanying Notes to Consolidated Financial Statements are an integral part of these statements.
A-20
Table of Contents
CONSOLIDATED STATEMENTS OF CHANGES IN COMMON EQUITY
| Common Stock | Additional Paid-In Capital | Retained Earnings | Accumulated Other Comprehensive Loss | Total Common Equity | |||||||||||||
| (in millions) | |||||||||||||||||
2002: | |||||||||||||||||
Beginning balance (a) | $ | 66.2 | $ | 264.6 | $ | 381.3 | ($10.1) | $ | 702.0 | ||||||||
Earnings available for common stock | 77.6 | 77.6 | |||||||||||||||
Minimum pension liability adjustment, net of tax of ($6.8) | (10.2 | ) | (10.2 | ) | |||||||||||||
Unrealized holding losses on derivatives, net of tax of ($0.1) | (0.2 | ) | (0.2 | ) | |||||||||||||
Less: reclassification adjustment for gains included in earnings available for common stock, net of tax of $ 2.4 | 3.6 | 3.6 | |||||||||||||||
Net unrealized losses on qualifying derivatives | (3.8 | ) | (3.8 | ) | |||||||||||||
Total comprehensive income | 63.6 | ||||||||||||||||
Common stock dividends | (59.6 | ) | (59.6 | ) | |||||||||||||
Capital contribution from parent | 61.0 | 61.0 | |||||||||||||||
Ending balance | 66.2 | 325.6 | 399.3 | (24.1 | ) | 767.0 | |||||||||||
2003: | |||||||||||||||||
Earnings available for common stock | 111.6 | 111.6 | |||||||||||||||
Minimum pension liability adjustment, net of tax of $ 2.8 | 4.2 | 4.2 | |||||||||||||||
Unrealized holding losses on derivatives, net of tax of ($3.5) | (6.0 | ) | (6.0 | ) | |||||||||||||
Less: reclassification adjustment for losses included in earnings available for common stock, net of tax of ($3.8) | (5.6 | ) | (5.6 | ) | |||||||||||||
Net unrealized losses on qualifying derivatives | (0.4 | ) | (0.4 | ) | |||||||||||||
Total comprehensive income | 115.4 | ||||||||||||||||
Common stock dividends | (70.6 | ) | (70.6 | ) | |||||||||||||
Capital contribution from parent | 200.0 | 200.0 | |||||||||||||||
Ending balance | 66.2 | 525.6 | 440.3 | (20.3 | ) | 1,011.8 | |||||||||||
2004: | |||||||||||||||||
Earnings available for common stock | 110.4 | 110.4 | |||||||||||||||
Minimum pension liability adjustment, net of tax of $11.7 | 17.6 | 17.6 | |||||||||||||||
Total comprehensive income | 128.0 | ||||||||||||||||
Common stock dividends | (89.0 | ) | (89.0 | ) | |||||||||||||
Other | 0.1 | 0.1 | |||||||||||||||
Ending balance | $ | 66.2 | $ | 525.7 | $ | 461.7 | ($2.7) | $ | 1,050.9 | ||||||||
| (a) | Accumulated other comprehensive income (loss) at January 1, 2002 consisted of ($14.2) of a minimum pension liability adjustment and $4.1 of net unrealized gains on qualifying derivatives. |
The accompanying Notes to Consolidated Financial Statements are an integral part of these statements.
A-21
Table of Contents
NOTES TO CONSOLIDATED FINANCIAL STATEMENTS
(1) SUMMARY OF SIGNIFICANT ACCOUNTING POLICIES
(a) General - The consolidated financial statements include the accounts of Wisconsin Power and Light Company (WPL) and its principal consolidated subsidiaries WPL Transco LLC and South Beloit Water, Gas and Electric Company. WPL is a direct subsidiary of Alliant Energy Corporation (Alliant Energy) and is engaged principally in the generation, distribution and sale of electric energy; the purchase, distribution, transportation and sale of natural gas; and the provision of water and various other energy-related services including construction management services for wind farms. WPL’s primary service territories are located in south and central Wisconsin.
The consolidated financial statements reflect investments in controlled subsidiaries on a consolidated basis. All significant intercompany balances and transactions have been eliminated from the consolidated financial statements. The consolidated financial statements are prepared in conformity with accounting principles generally accepted in the United States of America (U.S.), which give recognition to the rate making and accounting practices of the Federal Energy Regulatory Commission (FERC) and state commissions having regulatory jurisdiction. The preparation of the consolidated financial statements requires management to make estimates and assumptions that affect: a) the reported amounts of assets and liabilities and the disclosure of contingent assets and liabilities at the date of the financial statements; and b) the reported amounts of revenues and expenses during the reporting period. Actual results could differ from those estimates. For all periods presented, certain amounts have been reclassified on a basis consistent with the current year presentation and relate to the reporting of assets held for sale pursuant to Statement of Financial Accounting Standards (SFAS) 144, “Accounting for the Impairment or Disposal of Long-lived Assets” (SFAS 144). Refer to Note 15 for additional information.
Unconsolidated investments for which WPL does not control, but does have the ability to exercise significant influence over operating and financial policies (generally, 20% to 50% voting interest), are accounted for under the equity method of accounting. These investments are stated at acquisition cost, increased or decreased for WPL’s equity in net income or loss, which is included in “Equity income from unconsolidated investments” in the Consolidated Statements of Income, and decreased for any dividends received. Investments that do not meet the criteria for consolidation or the equity method of accounting are accounted for under the cost method.
(b) Regulation - WPL is subject to regulation under the Securities and Exchange Commission (SEC), the Public Utility Holding Company Act of 1935 (PUHCA), FERC, the Public Service Commission of Wisconsin (PSCW), the Illinois Commerce Commission (ICC), the U.S. Environmental Protection Agency, and the Nuclear Regulatory Commission (NRC). WPL is also subject to regulation by various other federal, state and local agencies.
(c) Regulatory Assets and Liabilities - WPL is subject to the provisions of SFAS 71, “Accounting for the Effects of Certain Types of Regulation,” which provides that rate-regulated public utilities record certain costs and credits allowed in the rate making process in different periods than for non-regulated entities. These are deferred as regulatory assets or accrued as regulatory liabilities and are recognized in the Consolidated Statements of Income at the time they are reflected in rates. At Dec. 31, 2004 and 2003, WPL had $11 million and $7 million of regulatory assets that were not earning returns, respectively. At Dec. 31, regulatory assets were comprised of the following items (in millions):
| 2004 | 2003 | |||||
Minimum pension liability (Note 6) | $ | 39.4 | $ | — | ||
Tax-related (Note 1(d)) | 20.2 | 23.4 | ||||
Asset retirement obligations (Note 17) | 15.3 | 8.3 | ||||
Energy conservation program costs | 14.3 | 22.9 | ||||
Environmental-related (Note 11(e)) | 12.9 | 16.2 | ||||
Excess allowance for funds used during construction (AFUDC) (Note 1(f)) | 11.9 | 12.1 | ||||
Debt redemption costs | 9.6 | 10.0 | ||||
Derivatives (Note 10(a)) | 6.7 | 3.6 | ||||
Other | 19.4 | 23.7 | ||||
| $ | 149.7 | $ | 120.2 | |||
WPL believes it is probable that any differences between expenses for legal asset retirement obligations (AROs) calculated under SFAS 143, “Accounting for Asset Retirement Obligations” (SFAS 143), and expenses recovered currently in rates will be recoverable in future rates, and is deferring the difference as a regulatory asset.
A-22
Table of Contents
At Dec. 31, regulatory liabilities were comprised of the following items (in millions):
| 2004 | 2003 | |||||
Cost of removal obligations | $ | 198.0 | $ | 209.9 | ||
Tax-related (Note 1(d)) | 17.0 | 17.9 | ||||
Gas performance incentive (Note 1(h)) | 15.1 | 10.6 | ||||
Other | 8.8 | 3.4 | ||||
| $ | 238.9 | $ | 241.8 | |||
WPL collects in rates future removal costs for many assets that do not have an associated legal ARO. WPL records a regulatory liability for the estimated amounts it has collected in rates for these future removal costs less amounts spent on removal activities.
(d) Income Taxes - WPL is subject to the provisions of SFAS 109, “Accounting for Income Taxes,” and follows the liability method of accounting for deferred income taxes, which requires the establishment of deferred tax assets and liabilities, as appropriate, for temporary differences between the tax basis of assets and liabilities and the amounts reported in the consolidated financial statements. Deferred taxes are recorded using currently enacted tax rates.
Except as noted below, income tax expense includes provisions for deferred taxes to reflect the tax effects of temporary differences between the time when certain costs are recorded in the accounts and when they are deducted for tax return purposes. As temporary differences reverse, the related accumulated deferred income taxes are reversed to income. Investment tax credits have been deferred and are subsequently credited to income over the average lives of the related property. Other tax credits reduce income tax expense in the year claimed and are generally related to research and development.
The PSCW has allowed rate recovery of deferred taxes on all temporary differences since August 1991. WPL established a regulatory asset associated with those temporary differences occurring prior to August 1991 that will be recovered in future rates through 2007.
(e) Temporary Cash Investments - Temporary cash investments are stated at cost, which approximates market value, and are considered cash equivalents for the Consolidated Balance Sheets and the Consolidated Statements of Cash Flows. These investments consist of short-term liquid investments that have maturities of less than 90 days.
(f) Property, Plant and Equipment - Utility plant is recorded at original cost, which includes overhead, administrative costs and AFUDC. Ordinary retirements of utility plant and salvage value are netted and charged to accumulated depreciation upon removal from utility plant accounts and no gain or loss is recognized. Removal costs reduce the regulatory liability previously established. AFUDC recovery rates, computed in accordance with the prescribed regulatory formula, were as follows:
| 2004 | 2003 | 2002 | |||||||
PSCW formula - retail jurisdiction | 15.2 | % | 14.8 | % | 12.6 | % | |||
FERC formula - wholesale jurisdiction | 12.5 | % | 9.5 | % | 2.6 | % |
WPL records a regulatory asset for all retail jurisdiction construction projects equal to the difference between the AFUDC calculated in accordance with PSCW guidelines and the AFUDC authorized by FERC and amortizes the regulatory asset at a composite rate and time frame established during each rate case. The amount of AFUDC generated by equity and debt was as follows (in millions):
| 2004 | 2003 | 2002 | |||||||
Equity | $ | 3.7 | $ | 2.9 | $ | 1.5 | |||
Debt | 0.8 | 1.1 | 1.1 | ||||||
| $ | 4.5 | $ | 4.0 | $ | 2.6 | ||||
A-23
Table of Contents
Electric plant in service by functional category as of Dec. 31 was as follows (in millions):
| 2004 | 2003 | |||||
Distribution | $ | 1,069.1 | $ | 973.5 | ||
Generation | 995.0 | 964.6 | ||||
Other | 64.4 | 63.9 | ||||
| $ | 2,128.5 | $ | 2,002.0 | |||
WPL uses a combination of remaining life, straight-line and sum-of-the-years-digits depreciation methods as approved by the PSCW and the ICC. The remaining depreciable life of the Kewaunee Nuclear Power Plant (Kewaunee), of which WPL is a co-owner, is based on the PSCW approved revised end-of-life of 2010. Depreciation expense related to the decommissioning of Kewaunee is discussed further in Note 11(f). The average rates of depreciation for electric and gas properties, consistent with current rate making practices, were as follows:
| 2004 | 2003 | 2002 | |||||||
Electric | 3.5 | % | 3.7 | % | 3.6 | % | |||
Gas | 4.0 | % | 4.0 | % | 4.1 | % |
Nuclear fuel for Kewaunee is recorded at its original cost and is amortized to expense based upon the quantity of heat produced for electric generation. This accumulated amortization assumes spent nuclear fuel will have no residual value. Estimated future disposal costs of such fuel are expensed based on kilowatt-hours (KWhs) generated.
Other property, plant and equipment is recorded at cost, the majority of which is depreciated using the straight-line method. Upon retirement or sale of property, plant and equipment, the cost and related accumulated depreciation are removed from the accounts and any gain or loss is included in the Consolidated Statements of Income.
(g) Operating Revenues - Revenues from WPL are primarily from electric and natural gas sales and deliveries and are recorded under the accrual method of accounting and recognized upon delivery. WPL accrues revenues for services rendered but unbilled at month-end. WPL serves as a collection agent for sales or various other taxes and records revenues on a net basis. The revenues do not include the collection of the aforementioned taxes.
(h) Utility Fuel Cost Recovery - WPL’s retail electric rates are based on annual forecasts that include fuel and purchased energy costs. Under PSCW rules, WPL can seek rate increases for increases in the cost of electric fuel and purchased energy if it experiences an increase in costs that are more than 3% higher than the estimated costs used to establish rates and must reduce rates if annual costs are more than 3% lower than the estimated costs used to establish rates. WPL’s retail gas tariffs provide for subsequent adjustments to its natural gas rates for changes in the current monthly natural gas commodity price index. Also, WPL has a gas performance incentive which includes a sharing mechanism whereby 50% of all gains and losses relative to current commodity prices, as well as other benchmarks, are retained by WPL, with the remainder refunded to or recovered from customers. Recovery of capacity related charges associated with WPL’s purchased power costs are recovered from electric customers through changes in base rates.
(i) Generating Facility Outages - Operating expenses incurred during refueling outages at Kewaunee and the maintenance costs incurred during outages for WPL’s various other generating facilities are expensed as incurred. The timing of the Kewaunee refueling outages during 2002 to 2004 and anticipated refueling outages for 2005 to 2007 are as follows:
2002 | 2003 | 2004 | 2005 | 2006 | 2007 | |||||
None | Spring | Fall | None | Spring | Fall |
(j) Derivative Financial Instruments - WPL uses derivative financial instruments to hedge exposures to fluctuations in certain commodity prices and volatility in a portion of natural gas sales volumes due to weather. WPL also utilizes derivatives to mitigate the equity price volatility associated with certain investments in equity securities. WPL does not use such instruments for speculative purposes. The fair value of all derivatives are recorded as assets or liabilities on the Consolidated Balance Sheets and gains and losses related to derivatives that are designated as, and qualify as hedges, are recognized in earnings when the underlying hedged item or physical transaction is recognized in income. Gains and losses related to derivatives that do not qualify for, or are not designated in hedge relationships, are recognized in earnings immediately. Based on the fuel and natural gas cost recovery mechanisms in place, as well as other specific regulatory authorizations, changes in fair market values of WPL’s derivatives generally have no impact on its results of operations, as
A-24
Table of Contents
they are generally reported as changes in regulatory assets and liabilities. WPL has some commodity purchase and sales contracts that have been designated, and qualify for, the normal purchase and sale exception and based on this designation, these contracts are not accounted for as derivative instruments.
WPL is exposed to losses related to financial instruments in the event of counterparties’ non-performance. WPL has established controls to determine and monitor the creditworthiness of counterparties in order to mitigate its exposure to counterparty credit risk. WPL is not aware of any material exposure to counterparty credit risk related to its derivative financial instruments. Refer to Note 10 for further discussion of WPL’s derivative financial instruments.
(k) Pension Plan - - For the defined benefit pension plan sponsored by Alliant Energy Corporate Services, Inc. (Corporate Services), a subsidiary of Alliant Energy, Alliant Energy allocates pension costs and contributions to WPL based on labor costs of plan participants and any additional minimum pension liability based on the funded status of the WPL group.
(l) Asset Valuations - Assets held for sale are reviewed for possible impairment each reporting period and impairment charges are recorded if the carrying value of such asset exceeds the estimated fair value less cost to sell.
If events or circumstances indicate the carrying value of investments accounted for under the equity method of accounting may not be recoverable, potential impairment is assessed by comparing the fair value of these investments to their carrying values as well as assessing if a decline in fair value is temporary. If an impairment is indicated, a charge is recognized equal to the amount the carrying value exceeds the investment’s fair value.
(m) Operating Leases - WPL has certain purchased power agreements that are accounted for as operating leases. Costs associated with these agreements are included in “Electric production fuel and purchased power” in the Consolidated Statements of Income based on monthly payments for these agreements. Monthly capacity payments related to one of these agreements is higher during the peak demand period from May 1 through Sep. 30 and lower in all other periods during each calendar year. These seasonal differences in capacity charges are consistent with market pricing and the expected usage of energy from the plant.
(2) UTILITY RATE MATTERS
In 2005, WPL received approval from the PSCW to refund $12 million in 2005 to its natural gas customers for gains realized from its gas performance incentive program. At Dec. 31, 2004, WPL reserved for all amounts related to these refunds. Refer to Note 1(h) for further discussion of WPL’s fuel cost recovery.
(3) LEASES
WPL’s operating lease rental expenses, which include certain purchased power agreements, for 2004, 2003 and 2002 were $63 million, $25 million and $23 million, respectively. Contingent rentals from operating leases that were excluded from these amounts were $0.4 million, $0.9 million and $1.1 million for 2004, 2003 and 2002, respectively. At Dec. 31, 2004, WPL’s future minimum operating lease payments, excluding contingent rentals, were as follows (in millions):
| 2005 | 2006 | 2007 | 2008 | 2009 | Thereafter | Total | |||||||||||||||
Certain purchased power agreements | $ | 69 | $ | 70 | $ | 72 | $ | 64 | $ | 58 | $ | 177 | $ | 510 | |||||||
Synthetic leases | 8 | 8 | 7 | 3 | 3 | 13 | 42 | ||||||||||||||
Other | 2 | 2 | 1 | 1 | — | 1 | 7 | ||||||||||||||
| $ | 79 | $ | 80 | $ | 80 | $ | 68 | $ | 61 | $ | 191 | $ | 559 | ||||||||
The purchased power agreements meeting the criteria as operating leases are such that, over the contract term, WPL has exclusive rights to all or a substantial portion of the output from a specific generating facility. The purchased power agreements total in the previous table includes $429 million and $56 million related to the Riverside plant tolling agreement and RockGen plant purchased power agreement, respectively. Refer to Note 18 for additional information concerning the impacts of Financial Accounting Standards Board (FASB) Interpretation No. 46R, “Consolidation of Variable Interest Entities” (FIN 46R), on these two agreements.
The synthetic leases in the previous table relate to the financing of utility railcars and a utility radio dispatch system. The entities that lease these assets to WPL do not meet the consolidation requirements per FIN46R and are not included on the Consolidated Balance Sheets. WPL has guaranteed the residual value of its synthetic leases which total $8 million in the aggregate. The guarantees extend through the maturity of each respective underlying lease with remaining terms up to 11 years. Residual value guarantee amounts have been included in the previous table.
A-25
Table of Contents
(4) SALE OF ACCOUNTS RECEIVABLE
Utility customer accounts receivable, including unbilled revenues, arise primarily from electric and natural gas sales. At Dec. 31, 2004 and 2003, WPL was serving a diversified base of residential, commercial, industrial and wholesale customers and did not have any significant concentrations of credit risk.
In March 2004, WPL discontinued its participation in a utility customer accounts receivable sale program whereby it sold a portion of its accounts receivable to a third-party financial institution on a limited recourse basis through wholly-owned and consolidated special purpose entities. Corporate Services acted as a collection agent for the buyer and received a fee for collection services. Under terms of the agreement, the third-party financial institution purchased the receivables initially for the face amount. On a monthly basis, this sales price was adjusted, resulting in payments to the third-party financial institution of an amount that varied based on interest rates and length of time the sold receivables remained outstanding. Collections on sold receivables were used to purchase additional receivables from WPL. WPL had no receivables sold and no short-term debt outstanding at the time it discontinued its participation in the program. WPL accounted for the sale of accounts receivable to the third-party financial institution as sales under SFAS 140, “Accounting for Transfers and Servicing of Financial Assets and Extinguishments of Liabilities.” The entity that purchased the receivables did not require consolidation per the guidelines of FIN 46R. Retained receivables were available to the third-party financial institution to pay any fees or expenses due it, and to absorb all credit losses incurred on any of the sold receivables.
At Dec. 31, 2004 and 2003, WPL had sold $0 and $50 million of utility customer accounts receivable, respectively. In 2004, 2003 and 2002, WPL received $30 million, $0.8 billion and $1.2 billion, respectively, in aggregate proceeds from the sale of accounts receivable. WPL used proceeds from the sale of accounts receivable and unbilled revenues to maintain flexibility in its capital structure, take advantage of favorable short-term rates and finance a portion of its long-term cash needs. WPL incurred costs associated with these sales of $0.2 million, $1.2 million and $2.2 million in 2004, 2003 and 2002, respectively.
(5) INCOME TAXES
The components of income taxes for WPL were as follows (in millions):
| 2004 | 2003 | 2002 | ||||||||||
Current tax expense: | ||||||||||||
Federal | $ | 45.2 | $ | 29.0 | $ | 42.8 | ||||||
State | 13.3 | 15.7 | 9.7 | |||||||||
Deferred tax expense (benefit): | ||||||||||||
Federal | 9.7 | 22.8 | (5.0 | ) | ||||||||
State | 0.4 | 0.6 | 1.2 | |||||||||
Amortization of investment tax credits | (1.6 | ) | (1.6 | ) | (1.8 | ) | ||||||
Research and development tax credits | (0.7 | ) | (0.7 | ) | (2.2 | ) | ||||||
| $ | 66.3 | $ | 65.8 | $ | 44.7 | |||||||
Alliant Energy files a consolidated federal income tax return. Under the terms of an agreement between Alliant Energy and its subsidiaries, including WPL, the subsidiaries calculate their respective federal income tax provisions and make payments to or receive payments from Alliant Energy as if they were separate taxable entities. Separate return amounts are adjusted to reflect state apportionment benefits net of federal tax and the fact that PUHCA prohibits the retention of tax benefits at the parent level. Any difference between the separate return methodology and the actual consolidated return is allocated as prescribed in Alliant Energy’s tax allocation agreement. WPL realized net benefits of $1.2 million, $2.9 million and $0 related to state apportionment and allocation of parent tax benefits in 2004, 2003 and 2002, respectively.
A-26
Table of Contents
The overall effective income tax rates shown in the following table were computed by dividing total income tax expense by income before income taxes.
| 2004 | 2003 | 2002 | |||||||
Statutory federal income tax rate | 35.0 | % | 35.0 | % | 35.0 | % | |||
State income taxes, net of federal benefits | 6.2 | 5.8 | 6.1 | ||||||
Research and development tax credits | (0.4 | ) | (0.3 | ) | (1.8 | ) | |||
Amortization of excess deferred taxes | (0.5 | ) | (0.5 | ) | (1.4 | ) | |||
Amortization of investment tax credits | (0.9 | ) | (0.9 | ) | (1.4 | ) | |||
Adjustment of prior period taxes | (1.5 | ) | (0.8 | ) | (1.1 | ) | |||
Other items, net | (1.1 | ) | (1.9 | ) | 0.2 | ||||
Overall effective income tax rate | 36.8 | % | 36.4 | % | 35.6 | % | |||
The deferred income tax (assets) and liabilities included on the Consolidated Balance Sheets at Dec. 31 arise from the following temporary differences (in millions):
| 2004 | 2003 | |||||||||||||||||||
| Deferred Tax Assets | Deferred Tax Liabilities | Net | Deferred Tax Assets | Deferred Tax Liabilities | Net | |||||||||||||||
Property | ($13.2 | ) | $ | 222.7 | $ | 209.5 | ($14.3 | ) | $ | 216.0 | $ | 201.7 | ||||||||
Decommissioning | (23.5 | ) | — | (23.5 | ) | (22.2 | ) | — | (22.2 | ) | ||||||||||
Investment in American Transmission Co. LLC (ATC) | — | 14.0 | 14.0 | — | 7.9 | 7.9 | ||||||||||||||
Other | (8.0 | ) | 32.6 | 24.6 | (20.2 | ) | 39.9 | 19.7 | ||||||||||||
Total | ($44.7 | ) | $ | 269.3 | $ | 224.6 | ($56.7 | ) | $ | 263.8 | $ | 207.1 | ||||||||
| 2004 | 2003 | |||||||||||||||||||
Other current assets | ($8.0 | ) | ($6.6 | ) | ||||||||||||||||
Deferred income taxes | 232.6 | 213.7 | ||||||||||||||||||
Total deferred tax (assets) and liabilities | $ | 224.6 | $ | 207.1 | ||||||||||||||||
(6) PENSION PLANS AND OTHER POSTRETIREMENT BENEFITS
Substantially all of WPL’s employees are covered by several non-contributory defined benefit pension plans. Benefits are based on the employees’ years of service and compensation. WPL also provides certain defined benefit postretirement health care and life benefits to eligible retirees. In general, the health care plans are contributory with participants’ contributions adjusted regularly and the life insurance plans are non-contributory. The weighted-average assumptions at the measurement date of Sep. 30 were as follows (N/A=Not Applicable):
| Qualified Pension Benefits | Other Postretirement Benefits | |||||||||||||||||
| 2004 | 2003 | 2002 | 2004 | 2003 | 2002 | |||||||||||||
Discount rate for benefit obligations | 6 | % | 6 | % | 6.75 | % | 6 | % | 6 | % | 6.75 | % | ||||||
Discount rate for net periodic cost | 6 | % | 6.75 | % | 7.25 | % | 6 | % | 6.75 | % | 7.25 | % | ||||||
Expected return on plan assets | 9 | % | 9 | % | 9 | % | 9 | % | 9 | % | 9 | % | ||||||
Rate of compensation increase | 3.5 | % | 3.5 | % | 3.5 | % | 3.5 | % | 3.5 | % | 3.5 | % | ||||||
Medical cost trend on covered charges: | ||||||||||||||||||
Initial trend rate | N/A | N/A | N/A | 10 | % | 9.5 | % | 10.8 | % | |||||||||
Ultimate trend rate | N/A | N/A | N/A | 5 | % | 5 | % | 5 | % | |||||||||
The expected return on plan assets was determined by analysis of forecasted asset class returns as well as actual returns for the plan over the past 10 years. An adjustment to the returns to account for active management of the assets is also made in the analysis. The obligations are viewed as long-term commitments and a long-term approach is used when determining the expected rate of return on assets, which is reviewed on an annual basis.
A-27
Table of Contents
The components of WPL’s qualified pension benefits and other postretirement benefits costs were as follows (in millions):
| Qualified Pension Benefits | Other Postretirement Benefits | |||||||||||||||||||||||
| 2004 | 2003 | 2002 | 2004 | 2003 | 2002 | |||||||||||||||||||
Service cost | $ | 5.0 | $ | 4.0 | $ | 3.6 | $ | 4.0 | $ | 3.4 | $ | 2.4 | ||||||||||||
Interest cost | 11.2 | 10.6 | 10.1 | 5.4 | 5.2 | 4.4 | ||||||||||||||||||
Expected return on plan assets | (15.9 | ) | (13.5 | ) | (12.2 | ) | (1.7 | ) | (1.4 | ) | (1.6 | ) | ||||||||||||
Amortization of (*): | ||||||||||||||||||||||||
Transition obligation (asset) | — | — | (1.7 | ) | 1.1 | 1.1 | 1.1 | |||||||||||||||||
Prior service cost | 0.6 | 0.4 | 0.4 | — | — | — | ||||||||||||||||||
Actuarial loss | 3.0 | 3.5 | 1.5 | 1.4 | 0.8 | 0.1 | ||||||||||||||||||
| $ | 3.9 | $ | 5.0 | $ | 1.7 | $ | 10.2 | $ | 9.1 | $ | 6.4 | |||||||||||||
| * | Unrecognized net actuarial losses in excess of 10% of the projected benefit obligation and unrecognized prior service costs are amortized over the average future service lives of the participants. Unrecognized net transition obligations related to other postretirement benefits are amortized over a 20-year period ending 2012. |
The pension benefits costs shown previously (and in the following tables) represent only the pension benefits costs for bargaining unit employees of WPL covered under the bargaining unit pension plan that is sponsored by WPL. The benefit obligations and assets associated with WPL’s non-bargaining employees who are participants in other Alliant Energy plans are reported in Alliant Energy’s Consolidated Financial Statements and are not reported previously. The pension benefits costs for WPL’s non-bargaining employees who are now participants in other Alliant Energy plans were $0.5 million, $1.9 million and $0.3 million for 2004, 2003 and 2002, respectively. In addition, Corporate Services provides services to WPL. The allocated pension benefits costs associated with these services were $2.1 million, $2.0 million and $1.7 million for 2004, 2003 and 2002, respectively. The other postretirement benefits costs shown previously for each period (and in the following tables) represent the other postretirement benefits costs for all WPL employees. The allocated other postretirement benefits costs associated with Corporate Services for WPL were $1.6 million, $0.9 million and $0.5 million for 2004, 2003 and 2002, respectively.
The assumed medical trend rates are critical assumptions in determining the service and interest cost and accumulated postretirement benefit obligation related to postretirement benefits costs. A 1% change in the medical trend rates for 2004, holding all other assumptions constant, would have the following effects (in millions):
| 1% Increase | 1% Decrease | |||||
Effect on total of service and interest cost components | $ | 1.2 | ($1.1 | ) | ||
Effect on postretirement benefit obligation | $ | 9.7 | ($8.7 | ) | ||
A-28
Table of Contents
A reconciliation of the funded status of WPL’s plans to the amounts recognized on the Consolidated Balance Sheets at Dec. 31 was as follows (in millions):
| Qualified Pension Benefits | Other Postretirement Benefits | |||||||||||||||
| 2004 | 2003 | 2004 | 2003 | |||||||||||||
Change in projected benefit obligation: | ||||||||||||||||
Net projected benefit obligation at beginning of year | $ | 181.0 | $ | 156.0 | $ | 93.1 | $ | 76.6 | ||||||||
Service cost | 5.0 | 4.0 | 4.0 | 3.4 | ||||||||||||
Interest cost | 11.2 | 10.6 | 5.4 | 5.2 | ||||||||||||
Plan participants’ contributions | — | — | 1.6 | 1.5 | ||||||||||||
Plan amendments | 5.7 | — | — | — | ||||||||||||
Actuarial loss | 6.9 | 17.8 | 7.7 | 11.7 | ||||||||||||
Gross benefits paid | (7.3 | ) | (7.4 | ) | (6.5 | ) | (5.3 | ) | ||||||||
Net projected benefit obligation at end of year | 202.5 | 181.0 | 105.3 | 93.1 | ||||||||||||
Change in plan assets: | ||||||||||||||||
Fair value of plan assets at beginning of year | 175.0 | 153.5 | 19.5 | 16.7 | ||||||||||||
Actual return on plan assets | 20.2 | 28.9 | 2.1 | 2.2 | ||||||||||||
Employer contributions | 5.0 | — | 4.0 | 4.4 | ||||||||||||
Plan participants’ contributions | — | — | 1.6 | 1.5 | ||||||||||||
Gross benefits paid | (7.3 | ) | (7.4 | ) | (6.5 | ) | (5.3 | ) | ||||||||
Fair value of plan assets at end of year | 192.9 | 175.0 | 20.7 | 19.5 | ||||||||||||
Funded status at end of year | (9.6 | ) | (6.0 | ) | (84.6 | ) | (73.6 | ) | ||||||||
Unrecognized net actuarial loss | 62.0 | 62.4 | 36.4 | 30.5 | ||||||||||||
Unrecognized prior service cost | 8.1 | 3.0 | (0.1 | ) | (0.1 | ) | ||||||||||
Unrecognized net transition obligation | — | — | 9.2 | 10.3 | ||||||||||||
Net amount recognized at end of year | $ | 60.5 | $ | 59.4 | ($39.1 | ) | ($32.9 | ) | ||||||||
Amounts recognized on the Consolidated Balance Sheets consist of: | ||||||||||||||||
Prepaid benefit cost | $ | 60.5 | $ | 59.4 | $ | 1.6 | $ | 1.5 | ||||||||
Accrued benefit cost | — | — | (40.7 | ) | (34.4 | ) | ||||||||||
Net amount recognized at measurement date | 60.5 | 59.4 | (39.1 | ) | (32.9 | ) | ||||||||||
Contributions paid after 9/30 and prior to 12/31 | — | — | 0.6 | 0.4 | ||||||||||||
Net amount recognized at 12/31 | $ | 60.5 | $ | 59.4 | ($38.5 | ) | ($32.5 | ) | ||||||||
In 2004, the PSCW authorized Wisconsin utilities to record additional minimum pension liability to “Regulatory assets” in lieu of “Accumulated other comprehensive loss” on their Consolidated Balance Sheets. At Dec. 31, 2004 and 2003, Corporate Services allocated a minimum pension liability of $44 million and $34 million, respectively. Included in the following table are WPL’s accumulated benefit obligations, amounts applicable to qualified pension and other postretirement benefits with accumulated benefit obligations in excess of plan assets, as well as qualified pension plans with projected benefit obligations in excess of plan assets as of the measurement date of Sep. 30 (in millions):
| Qualified Pension Benefits | Other Postretirement Benefits | |||||||||||
| 2004 | 2003 | 2004 | 2003 | |||||||||
Accumulated benefit obligation | $ | 181.8 | $ | 165.7 | $ | 105.3 | $ | 93.1 | ||||
Plans with accumulated benefit obligations in excess of plan assets: | ||||||||||||
Accumulated benefit obligations | — | — | 103.6 | 91.5 | ||||||||
Fair value of plan assets | — | — | 17.3 | 16.3 | ||||||||
Plans with projected benefit obligations in excess of plan assets: | ||||||||||||
Projected benefit obligations | 202.5 | 181.0 | N/A | N/A | ||||||||
Fair value of plan assets | 192.9 | 175.0 | N/A | N/A | ||||||||
A-29
Table of Contents
WPL’s net periodic benefit cost is primarily included in “Other operation and maintenance” in the Consolidated Statements of Income. WPL calculates the fair value of plan assets by using the straight market value of assets approach.
Postretirement benefit plans are funded via specific assets within certain retirement plans (401(h) assets) as well as a Voluntary Employees’ Beneficiary Association (VEBA) trust. The asset allocation of the 401(h) assets mirror the qualified pension plan assets and the asset allocation of the VEBA trust are reflected in the following table under “Other Postretirement Plans.” The asset allocation for WPL’s qualified pension and other postretirement benefit plans at Sep. 30, 2004 and 2003, and the qualified pension plan target allocation for 2004 were as follows:
| Qualified Pension Plans | Other Postretirement Plans | ||||||||||||||
Target Allocation | Percentage of Plan Assets at Sep. 30, | Percentage of Plan Assets at Sep. 30, | |||||||||||||
Asset Category | 2004 | 2004 | 2003 | 2004 | 2003 | ||||||||||
Equity securities | 65-75 | % | 73 | % | 61 | % | 10 | % | 15 | % | |||||
Debt securities | 20-35 | % | 27 | % | 33 | % | 20 | % | 33 | % | |||||
Other | 0-5 | % | — | 6 | % | 70 | % | 52 | % | ||||||
| 100 | % | 100 | % | 100 | % | 100 | % | ||||||||
WPL’s plan assets are managed by outside investment managers. WPL’s investment strategy and its policies employed with respect to pension and postretirement assets is to combine both preservation of principal and prudent and reasonable risk-taking to protect the integrity of the assets in meeting the obligations to the participants while achieving the optimal return possible over the long-term. It is recognized that risk and volatility are present to some degree with all types of investments; however, high levels of risk are minimized at the total fund level. This is accomplished through diversification by asset class, number of investments, and sector and industry limits when applicable.
For the pension plans, the mix among asset classes is controlled by long-term asset allocation targets. The assets are viewed as long-term with moderate liquidity needs. Historical performance results and future expectations suggest that equity securities will provide higher total investment returns than debt securities over a long-term investment horizon. Consistent with the goals to maximize returns and minimize risk over the long-term, the pension plans have a long-term investment posture more heavily weighted towards equity holdings. The asset allocation mix is monitored quarterly and appropriate action is taken as needed to rebalance the assets within the prescribed range. Assets related to postretirement plans are viewed as long-term. A mix of both equity and debt securities are utilized to maximize returns and minimize risk over the long-term. Prohibited investment vehicles related to the pension and postretirement plans include, but may not be limited to, direct ownership of real estate, real estate investment trusts, options and futures unless specifically approved, margin trading, oil and gas limited partnerships, commodities, short selling and securities of the managers’ firms or affiliate firms.
WPL estimates that funding for the qualified pension and postretirement benefit plans for 2005 will be $0 and approximately $4 million, respectively.
The expected benefit payments and Medicare subsidies, which reflect expected future service, as appropriate, are as follows:
| 2005 | 2006 | 2007 | 2008 | 2009 | 2010 - 2014 | ||||||||||||||||||
Pension benefits | $ | 7.4 | $ | 7.4 | $ | 7.6 | $ | 7.8 | $ | 8.3 | $ | 54.8 | |||||||||||
Other benefits | 7.5 | 7.1 | 7.4 | 7.9 | 8.5 | 53.4 | |||||||||||||||||
Medicare subsidies | — | (0.6 | ) | (0.6 | ) | (0.7 | ) | (0.7 | ) | (4.3 | ) | ||||||||||||
| $ | 14.9 | $ | 13.9 | $ | 14.4 | $ | 15.0 | $ | 16.1 | $ | 103.9 | ||||||||||||
In 2004, WPL adopted FASB Staff Position No. SFAS 106-2, “Accounting and Disclosure Requirements Related to the Medicare Prescription Drug, Improvement and Modernization Act of 2003.” The U.S. Department of Health and Human Services recently provided initial guidance regarding actuarial equivalence. Additional guidance and clarifications are expected to be provided in the future. WPL believes that a substantial portion of its postretirement medical plans will be actuarially equivalent to the Medicare Prescription Drug Plan. WPL anticipates continuing its current prescription drug coverage for currently covered retirees and therefore should be eligible for the subsidy available from Medicare. The estimated reductions in WPL’s 2004 other postretirement benefits costs and accumulated projected benefit obligation are $1 million and $7 million, respectively.
A-30
Table of Contents
Alliant Energy sponsors several non-qualified pension plans that cover certain current and former key employees. The pension expense allocated to WPL for these plans was $1.8 million, $1.7 million and $1.5 million in 2004, 2003 and 2002, respectively. WPL has various life insurance policies that cover certain key employees and directors. At both Dec. 31, 2004 and 2003, the cash surrender value of these investments was $11 million. A significant number of WPL employees also participate in defined contribution pension plans (401(k) plans). WPL’s contributions to the plans, which are based on the participants’ level of contribution, were $2.3 million, $2.1 million and $2.2 million in 2004, 2003 and 2002, respectively.
(7) COMMON AND PREFERRED STOCK
(a) Common Stock - WPL has dividend payment restrictions based on its bond indentures, the terms of its outstanding preferred stock and state regulatory limitations. In its December 2003 rate order, the PSCW stated WPL may not pay annual common stock dividends, including pass-through of subsidiary dividends, in excess of $89 million to Alliant Energy if WPL’s actual average common equity ratio, on a regulatory financial basis, is or will fall below the authorized level of 54.01%. As of Dec. 31, 2004, WPL was in compliance with all such dividend restrictions.
(b) Preferred Stock - The carrying value of WPL’s cumulative preferred stock at both Dec. 31, 2004 and 2003 was $60 million. The fair value, based upon the market yield of similar securities and quoted market prices, at Dec. 31, 2004 and 2003 was $55 million and $53 million, respectively.
(8) DEBT
(a) Short-Term Debt - To provide short-term borrowing flexibility and security for commercial paper outstanding, WPL maintains committed bank lines of credit, which require a fee. At Dec. 31, 2004, WPL’s short term borrowing arrangements included a $250 million revolving credit facility (facility). The facility is designed to be a five-year facility with the length of the facility subject to various regulatory approvals given the term is longer than a 364-day facility. Information regarding commercial paper issued under the facility was as follows (dollars in millions):
| 2004 | 2003 | |||||||
At Dec. 31: | ||||||||
Commercial paper outstanding | $ | 47.0 | $ | — | ||||
Average discount rates - commercial paper | 2.3 | % | N/A | |||||
For the year ended: | ||||||||
Average amount of total short-term debt (based on daily outstanding balances) | $ | 12.8 | $ | 29.8 | ||||
Average interest rates - total short-term debt | 1.4 | % | 1.4 | % | ||||
(b) Long-Term Debt - WPL’s First Mortgage Bonds are secured by substantially all of its utility plant. WPL also maintains indentures related to the issuance of unsecured debt securities. WPL’s debt maturities for 2005 to 2009 are $88 million, $0, $105 million, $60 million, and $0, respectively. The carrying value of WPL’s long-term debt (including current maturities and variable rate demand bonds) at Dec. 31, 2004 and 2003 was $491 million and $454 million, respectively. The fair value, based upon the market yield of similar securities and quoted market prices, at Dec. 31, 2004 and 2003 was $532 million and $494 million, respectively. WPL’s unamortized debt issuance costs recorded in “Deferred charges and other” on the Consolidated Balance Sheets were $4.0 million and $4.2 million at Dec. 31, 2004 and 2003, respectively.
In August 2004, WPL issued $100 million of 6.25% senior debentures due 2034 and used the proceeds to repay short-term debt, including $62 million incurred in connection with the repayment at maturity of 7.25% first mortgage bonds in June 2004, and for general corporate purposes.
A-31
Table of Contents
(9) INVESTMENTS AND ESTIMATED FAIR VALUE OF FINANCIAL INSTRUMENTS
The carrying amount of WPL’s current assets and current liabilities approximates fair value because of the short maturity of such financial instruments. Since WPL is subject to regulation, any gains or losses related to the difference between the carrying amount and the fair value of its financial instruments may not be realized by Alliant Energy. Information relating to various investments held by WPL at Dec. 31 that are marked-to-market as a result of SFAS 115, “Accounting for Certain Investments in Debt and Equity Securities,” (SFAS 115) was as follows (in millions):
| 2004 | 2003 | |||||||||||
| Carrying/ Fair Value | Unrealized Net of Tax | Carrying/ Fair Value | Unrealized Net of Tax | |||||||||
Available-for-sale securities: | ||||||||||||
Nuclear decommissioning trust funds: | ||||||||||||
Debt securities | $ | 21.0 | $ | 0.7 | $ | 136.9 | $ | 3.3 | ||||
Equity securities | 51.3 | 13.0 | 96.8 | 18.6 | ||||||||
In accordance with SFAS 115, the carrying values of the investments are adjusted to estimated fair value based upon market values at the end of each quarter.
Refer to Notes 7(b), 8(b) and 10(a) for information regarding the fair values of preferred stock, long-term debt and derivatives, respectively.
Nuclear Decommissioning Trust Funds - At Dec. 31, 2004, $0.2 million, $3.1 million and $17.7 million of the debt securities mature in 2005-2009, 2010-2019 and 2020-2040, respectively. The fair value of the nuclear decommissioning trust funds, as reported by the trustee, was adjusted for the tax effect of unrealized gains and losses. Net unrealized holding gains were recorded as part of regulatory liabilities or as an offset to regulatory assets related to AROs. The funds realized pre-tax gains (losses) from the sales of securities of $12 million, ($6) million and $10 million in 2004, 2003 and 2002, respectively (cost of the investments based on specific identification was $1.1 billion, $334 million and $92 million and pre-tax proceeds from the sales were $1.1 billion, $328 million and $102 million, respectively). In January 2004, WPL liquidated all of the qualified decommissioning assets into money market funds as a result of the anticipated Kewaunee sale and at Dec. 31, 2004, the value of the qualified decommissioning assets was $171 million.
Unconsolidated Equity Investments -At Dec. 31, 2004 and 2003, WPL had $154 million and $133 million of investments in equity method investees, respectively, consisting of a 24% ownership interest in ATC (carrying value of $141 million at Dec. 31, 2004) and a 50% ownership interest in Wisconsin River Power Company (carrying value of $13 million at Dec. 31, 2004), respectively. Summary financial information from the financial statements of these investments is as follows (in millions):
| 2004 | 2003 | 2002 | |||||||
Operating revenues | $ | 270.3 | $ | 232.3 | $ | 211.7 | |||
Operating income | 107.1 | 87.7 | 75.7 | ||||||
Net income | 90.5 | 72.1 | 59.5 | ||||||
As of Dec. 31: | |||||||||
Current assets | 39.1 | 41.5 | |||||||
Non-current assets | 1,176.6 | 947.2 | |||||||
Current liabilities | 194.5 | 67.9 | |||||||
Non-current liabilities | 457.7 | 14.6 | |||||||
ATC- Pursuant to various agreements, WPL receives a range of transmission services from ATC. WPL provides operation, maintenance, and construction services to ATC. WPL and ATC also bill each other for use of shared facilities owned by each party. ATC billed WPL $48 million, $41 million and $39 million in 2004, 2003 and 2002, respectively. WPL billed ATC $13 million, $12 million and $18 million in 2004, 2003 and 2002, respectively. At Dec. 31, 2004 and 2003, WPL owed ATC net amounts of $2.9 million and $2.7 million, respectively.
Nuclear Management Company, LLC (NMC) - WPL receives services from NMC for the management and operation of Kewaunee. NMC billed WPL indirectly through Wisconsin Public Service Corporation (WPSC) $34 million, $33 million and $24 million in 2004, 2003 and 2002, respectively, for its allocated portion for Kewaunee.
A-32
Table of Contents
(10) DERIVATIVE FINANCIAL INSTRUMENTS
(a) Accounting for Derivative Instruments and Hedging Activities - WPL records derivative instruments at fair value on the balance sheet as assets or liabilities and changes in the derivatives’ fair values are generally recorded as regulatory assets or liabilities. At Dec. 31, 2004 and 2003, WP&L had $4.7 million and $1.3 million of derivative assets included in “Other current assets” and $6.7 million and $3.6 million of derivative liabilities included in “Other current liabilities” on the Consolidated Balance Sheets, respectively.
WPL’s derivatives that were not designated in hedge relationships during 2004 and/or 2003 included coal and gas contracts. Coal and gas contracts that do not qualify for the normal purchase and sale exception were used to manage the price of anticipated purchases and sales.
(b) Weather Derivatives - WPL uses weather derivatives to reduce the impact of weather volatility on its natural gas sales volumes. In 2004, 2003 and 2002, Corporate Services, as agent for WPL, entered into non-exchange traded options based on heating degree days in which Corporate Services receives payment from the counterparty if actual heating degree days are less than the heating degree days specified in the contract. Corporate Services paid premiums to enter into these contracts, which are amortized to expense over the contract period. WPL has used the intrinsic value method to account for these weather derivatives. Information relating to these weather derivatives was as follows (in millions):
| 2004 | 2003 | 2002 | |||||||
Premiums paid | $ | 1.2 | $ | 0.9 | $ | 0.9 | |||
Premiums amortized to expense | 1.0 | 0.9 | 0.9 | ||||||
Gains | — | 0.8 | 0.9 | ||||||
Amounts received from counterparties | — | — | 4.0 | ||||||
WPL’s ratepayers do not pay any of the premiums nor do they share in the gains/losses realized from the weather hedges.
(11) COMMITMENTS AND CONTINGENCIES
(a) Construction and Acquisition Expenditures - WPL has made certain commitments in connection with its 2005 capital expenditures.
(b) Purchase Obligations - Alliant Energy, through its subsidiaries Corporate Services, Interstate Power and Light Company (IPL) and WPL, has entered into purchased power, coal and natural gas supply, transportation and storage contracts. Certain purchased power commitments are considered operating leases and are therefore not included here, but are included in Note 3. The natural gas supply commitments and purchased-power contracts are either fixed price in nature or market-based. The coal commitments are fixed price and the transportation contracts are index-based. Alliant Energy expects to supplement its coal and natural gas supplies with spot market purchases as needed. The table includes commitments for “take-or-pay” contracts which result in dollar commitments with no associated tons or dekatherms (Dths). Based on the System Coordination and Operating Agreement, Alliant Energy annually allocates purchased power contracts to IPL and WPL, based on various factors such as resource mix, load growth and resource availability. The amounts in the following table reflect these allocated contracts. However, for 2005, system-wide purchased power contracts of $85.9 million (1.7 million megawatt-hours (MWhs)) have not yet been directly assigned to IPL and WPL since the specific needs of each utility are not yet known. Refer to Note 19 for additional information. Coal contract quantities are directly assigned to specific generating stations at WPL based on various factors including projected heat input requirements, combustion compatibility and efficiency. In addition, WPL enters into specific coal transportation contracts for its generating stations. The amounts in the following table reflect these directly assigned coal and corresponding coal transportation contracts. In addition, Corporate Services entered into system-wide coal contracts of $74.7 million (10.6 million tons), $48.7 million (7.4 million tons), $24.0 million (3.8 million tons), $12.2 million (1.8 million tons) and $2.8 million (0.4 million tons) on behalf of IPL and WPL for 2005 to 2009, respectively, to allow flexibility for the changing needs of the quantity of coal consumed by each. These contracts have not yet been directly assigned to IPL and WPL since the specific needs of each utility are not yet known. At Dec. 31, 2004, WPL’s minimum commitments were as follows (dollars and Dths in millions; MWhs and tons in thousands):
| Purchased power | Coal | Natural gas | |||||||||||||
| Dollars | MWhs | Dollars | Tons | Dollars | Dths | ||||||||||
| 2005 | $ | 6.0 | — | $ | 8.0 | — | $ | 114.4 | 15 | ||||||
| 2006 | 3.2 | — | 8.0 | — | 50.0 | 4 | |||||||||
| 2007 | 3.2 | — | 8.0 | — | 20.9 | — | |||||||||
| 2008 | 3.2 | — | 6.2 | — | 15.8 | — | |||||||||
| 2009 | 3.2 | — | 6.2 | — | 15.7 | — | |||||||||
| Thereafter | 10.6 | — | 31.2 | — | 22.2 | — | |||||||||
A-33
Table of Contents
Also, at Dec. 31, 2004, WPL’s other purchase obligations, which represent individual commitments incurred during the normal course of business which exceeded $1.0 million at Dec. 31, 2004, were $9 million for 2005. This excludes lease obligations which are included in Note 3.
(c) Legal Proceedings -WPL is involved in legal and administrative proceedings before various courts and agencies with respect to matters arising in the ordinary course of business. Although unable to predict the outcome of these matters, WPL believes that appropriate reserves have been established and final disposition of these actions will not have a material adverse effect on its financial condition or results of operations.
(d) Guarantees - Refer to Note 3 for discussion of WPL’s residual value guarantees of its synthetic leases.
(e) Environmental Liabilities -WPL had recorded the following environmental liabilities at Dec. 31 (in millions):
| 2004 | 2003 | |||||
Manufactured gas plant (MGP) sites | $ | 5.2 | $ | 5.4 | ||
Other | 1.3 | 2.0 | ||||
| $ | 6.5 | $ | 7.4 | |||
MGP Sites -WPL has current or previous ownership interests in 14 sites previously associated with the production of gas for which it may be liable for investigation, remediation and monitoring costs relating to the sites. WPL has received letters from state environmental agencies requiring no further action at six sites. WPL is working pursuant to the requirements of various federal and state agencies to investigate, mitigate, prevent and remediate, where necessary, the environmental impacts to property, including natural resources, at and around the sites in order to protect public health and the environment.
WPL records environmental liabilities based upon periodic studies, most recently updated in the third quarter of 2004, related to the MGP sites. Such amounts are based on the best current estimate of the remaining amount to be incurred for investigation, remediation and monitoring costs for those sites where the investigation process has been or is substantially completed, and the minimum of the estimated cost range for those sites where the investigation is in its earlier stages. It is possible that future cost estimates will be greater than current estimates as the investigation process proceeds and as additional facts become known. The amounts recognized as liabilities are reduced for expenditures made and are adjusted as further information develops or circumstances change. Costs of future expenditures for environmental remediation obligations are not discounted to their fair value. Management currently estimates the range of remaining costs to be incurred for the investigation, remediation and monitoring of WPL’s sites to be $5 million to $7 million.
Under the current rate making treatment approved by the PSCW, the MGP expenditures of WPL, net of any insurance proceeds, are deferred and collected from gas customers over a five-year period after new rates are implemented. Regulatory assets have been recorded by WPL, which reflect the probable future rate recovery, where applicable. Considering the current rate treatment, and assuming no material change therein, WPL believes that the clean-up costs incurred for these MGP sites will not have a material adverse effect on its financial condition or results of operations. Settlement has been reached with all of WPL’s insurance carriers regarding reimbursement for its MGP-related costs.
A-34
Table of Contents
(f) Decommissioning of Kewaunee -Decommissioning expense is included in “Depreciation and amortization” in the Consolidated Statements of Income and the cumulative amount is included in “Regulatory liabilities” or, for AROs, is netted in “Regulatory assets” on the Consolidated Balance Sheets. The PSCW and FERC, in orders effective Jan. 1, 2002 and Jan. 1, 2005, respectively, eliminated WPL’s recovery from customers for the cost to decommission Kewaunee, due to the current funded status and the proposed sale of Kewaunee. Additional information relating to the decommissioning of Kewaunee is as follows (dollars in millions):
WPL’s share of estimated decommissioning cost | $ | 243.2 | ||
Year dollars in | 2004 | |||
Method to develop estimate | | Site-specific study | | |
Assumptions relating to current rate recovery amounts (1): | ||||
Annual inflation rate | 6.50 | % | ||
Decommissioning method | | Prompt dismantling and removal | | |
Year decommissioning to commence | 2013 | |||
After-tax return on external investments: | ||||
Qualified | 6.12 | % | ||
Non-qualified | 5.14 | % | ||
External trust fund balance at Dec. 31, 2004 | $ | 243.2 | ||
After-tax earnings on external trust funds in 2004 | $ | 14.8 |
| (1) | Information is related to WPL’s most recent FERC order (prior to the elimination of cost recovery for Kewaunee). |
The earnings for WPL accumulate in the external trust fund balance and as an offset to regulatory assets for ARO related earnings or regulatory liabilities for non-ARO related earnings. Refer to Note 16 for information regarding the proposed sale of WPL’s interest in Kewaunee and Note 17 for information related to the impact of SFAS 143.
(g) Credit Risk - WPL has limited credit exposure from electric and natural gas sales and non-performance of contractual obligations by its counterparties. WPL maintains credit risk oversight and sets limits and policies with regards to its counterparties, which management believes minimizes its overall credit risk exposure. However, there is no assurance that such policies will protect WPL against all losses from non-performance by counterparties.
(h) Nuclear Liability/Insurance -Liability for nuclear accidents is governed by the Price-Anderson Act of 1988 as amended, which sets a statutory limit of $10.8 billion for liability to the public for a single nuclear power plant incident and requires nuclear power plant operators to provide financial protection for this amount. Financial protection for a nuclear incident is provided through a combination of liability insurance ($300 million) and industry-wide retrospective payment plans ($10.5 billion). Under the industry-wide plan, the owners of each operating licensed nuclear reactor in the U.S. are subject to an assessment in the event of a nuclear incident at any nuclear plant in the U.S. Based on its ownership in Kewaunee, WPL could be assessed a maximum of $41 million per nuclear incident, if losses related to the incident exceeded $300 million.
(12) JOINTLY-OWNED ELECTRIC UTILITY PLANT
Under joint ownership agreements with other Wisconsin utilities, WPL has undivided ownership interests in jointly-owned electric generating stations. Each of the respective owners is responsible for the financing of its portion of the construction costs. KWh generation and operating expenses are divided on the same basis as ownership with each owner reflecting its respective costs in its Consolidated Statements of Income. Information relative to WPL’s ownership interest in these facilities at Dec. 31, 2004 was as follows (dollars in millions):
| Fuel Type | Ownership Interest % | Plant in Service | Accumulated Provision for Depreciation | Construction Work In Progress | |||||||||
Edgewater Unit 5 | Coal | 75.0 | $ | 238.3 | $ | 127.7 | $ | 1.3 | |||||
Columbia Energy Center | Coal | 46.2 | 195.5 | 121.0 | 9.6 | ||||||||
Kewaunee | Nuclear | 41.0 | 204.4 | 145.7 | 12.5 | ||||||||
Edgewater Unit 4 | Coal | 68.2 | 71.1 | 41.9 | 0.9 | ||||||||
| $ | 709.3 | $ | 436.3 | $ | 24.3 | ||||||||
Refer to Note 16 for information regarding the proposed sale of WPL’s interest in Kewaunee.
A-35
Table of Contents
(13) SEGMENTS OF BUSINESS
WPL is a domestic utility, serving customers in Wisconsin and Illinois, and includes three segments: a) electric operations; b) gas operations; and c) other, which includes the water business, various other energy-related products and services including construction management services for wind farms and the unallocated portions of the utility business. Various line items in the following tables are not allocated to the electric and gas segments for management reporting purposes and therefore are included in “Total.” In 2004, 2003 and 2002, gas revenues included $20 million, $45 million and $22 million, respectively, for sales to the electric segment. All other intersegment revenues were not material to WPL’s operations and there was no single customer whose revenues were 10% or more of the consolidated revenues. Certain financial information relating to WPL’s significant business segments was as follows (in millions):
| Electric | Gas | Other | Total | |||||||||||
2004 | ||||||||||||||
Operating revenues | $ | 939.8 | $ | 253.8 | $ | 16.2 | $ | 1,209.8 | ||||||
Depreciation and amortization | 95.7 | 14.8 | 0.5 | 111.0 | ||||||||||
Operating income (loss) | 164.9 | 24.8 | (6.9 | ) | 182.8 | |||||||||
Interest expense, net of AFUDC | 29.0 | |||||||||||||
Equity income from unconsolidated investments | (25.0 | ) | ||||||||||||
Interest income and other | (1.2 | ) | ||||||||||||
Income tax expense | 66.3 | |||||||||||||
Net income | 113.7 | |||||||||||||
Preferred dividends | 3.3 | |||||||||||||
Earnings available for common stock | 110.4 | |||||||||||||
Total assets | 2,097.5 | 333.3 | 225.3 | 2,656.1 | ||||||||||
Investments in equity method subsidiaries | 154.3 | — | — | 154.3 | ||||||||||
Construction and acquisition expenditures | 189.1 | 20.2 | 2.2 | 211.5 | ||||||||||
2003 | ||||||||||||||
Operating revenues | $ | 910.1 | $ | 272.4 | $ | 34.5 | $ | 1,217.0 | ||||||
Depreciation and amortization | 89.2 | 14.6 | 1.1 | 104.9 | ||||||||||
Operating income | 163.8 | 25.5 | 2.3 | 191.6 | ||||||||||
Interest expense, net of AFUDC | 33.9 | |||||||||||||
Equity income from unconsolidated investments | (20.7 | ) | ||||||||||||
Interest income and other | (2.3 | ) | ||||||||||||
Income tax expense | 65.8 | |||||||||||||
Net income | 114.9 | |||||||||||||
Preferred dividends | 3.3 | |||||||||||||
Earnings available for common stock | 111.6 | |||||||||||||
Total assets | 1,950.5 | 306.2 | 212.6 | 2,469.3 | ||||||||||
Investments in equity method subsidiaries | 133.3 | — | — | 133.3 | ||||||||||
Construction and acquisition expenditures | 133.0 | 17.4 | 1.2 | 151.6 | ||||||||||
2002 | ||||||||||||||
Operating revenues | $ | 787.7 | $ | 179.1 | $ | 22.7 | $ | 989.5 | ||||||
Depreciation and amortization | 91.7 | 15.9 | 1.1 | 108.7 | ||||||||||
Operating income (loss) | 135.1 | 12.0 | (1.5 | ) | 145.6 | |||||||||
Interest expense, net of AFUDC | 37.6 | |||||||||||||
Equity income from unconsolidated investments | (17.0 | ) | ||||||||||||
Interest income and other | (0.6 | ) | ||||||||||||
Income tax expense | 44.7 | |||||||||||||
Net income | 80.9 | |||||||||||||
Preferred dividends | 3.3 | |||||||||||||
Earnings available for common stock | 77.6 | |||||||||||||
Total assets | 1,834.7 | 298.5 | 201.9 | 2,335.1 | ||||||||||
Investments in equity method subsidiaries | 121.7 | — | — | 121.7 | ||||||||||
Construction and acquisition expenditures | 144.6 | 10.6 | 1.7 | 156.9 | ||||||||||
A-36
Table of Contents
(14) SELECTED CONSOLIDATED QUARTERLY FINANCIAL DATA (UNAUDITED)
Summation of the individual quarters may not equal annual totals due to rounding.
| 2004 | 2003 | |||||||||||||||||||||||
| March 31 | June 30 | Sep. 30 | Dec. 31 | March 31 | June 30 | Sep. 30 | Dec. 31 | |||||||||||||||||
| (in millions) | ||||||||||||||||||||||||
Operating revenues | $ | 339.4 | $ | 270.7 | $ | 286.2 | $ | 313.5 | $ | 346.9 | $ | 254.8 | $ | 318.9 | $ | 296.3 | ||||||||
Operating income | 38.9 | 51.3 | 55.0 | 37.6 | 18.1 | 35.7 | 77.8 | 60.1 | ||||||||||||||||
Net income | 22.3 | 31.2 | 33.6 | 26.7 | 10.1 | 19.9 | 47.4 | 37.5 | ||||||||||||||||
Earnings available for common stock | 21.5 | 30.4 | 32.7 | 25.8 | 9.3 | 19.0 | 46.6 | 36.7 | ||||||||||||||||
(15) ASSETS HELD FOR SALE
WPL has announced its intention to sell its water utility in Ripon, Wisconsin in order to narrow its strategic focus. WPL has applied the provisions of SFAS 144 to the Ripon water utility assets, which are held for sale. SFAS 144 requires that a long-lived asset classified as held for sale be measured at the lower of its carrying amount or fair value, less costs to sell, and to cease depreciation, depletion and amortization. The operating results of WPL’s water utility did not qualify for reporting as discontinued operations at Dec. 31, 2004. At Dec. 31, the components of the Ripon water utility assets held for sale on the Consolidated Balance Sheets were as follows (in millions):
| 2004 | 2003 | |||||||
Property, plant and equipment: | ||||||||
Other plant in service | $ | 5.9 | $ | 7.6 | ||||
Less: accumulated depreciation | (2.9 | ) | (2.4 | ) | ||||
Net plant | 3.0 | 5.2 | ||||||
Construction work in progress | 1.9 | 0.9 | ||||||
Total assets held for sale | $ | 4.9 | $ | 6.1 | ||||
(16) PROPOSED SALE OF WPL’S INTEREST IN KEWAUNEE
WPL has signed a definitive agreement to sell its 41% ownership interest in Kewaunee to a subsidiary of Dominion Resources, Inc. (Dominion). Approval has already been obtained from the Federal Trade Commission, NRC, Iowa Utilities Board, ICC and Minnesota Public Utilities Commission, and certain approvals have been obtained from FERC. In November 2004, the PSCW issued a decision rejecting WPL’s and WPSC’s joint application to sell Kewaunee to Dominion. WPL and WPSC joined Dominion and filed a petition for a rehearing with the PSCW in December 2004. In the rehearing petition, new information was submitted that addressed the PSCW’s concerns and the petition was accepted in January 2005 on an expedited schedule. WPL anticipates that the PSCW will issue a decision on the sale in March 2005.
Assuming the sale closes, WPL anticipates it will receive approximately $90 million in cash and retain ownership of the trust assets contained in one of the two decommissioning funds it established to cover the eventual decommissioning of Kewaunee. The fund that WPL will retain had an after-tax value of $72 million as of Dec. 31, 2004. Dominion will assume responsibility for the eventual decommissioning of Kewaunee and will receive WPL’s qualified decommissioning trust assets, which had an after-tax value of $171 million as of Dec. 31, 2004. The cash proceeds, after certain transaction costs, from the sale are expected to slightly exceed WPL’s carrying value of the assets being sold. WPL has requested deferral of any gain and related costs from the PSCW. Because any gain realized and the retained decommissioning fund will likely be returned to customers in future rate filings, WPL does not expect this transaction will have a significant impact on its operating results. As of Dec. 31, 2004, WPL’s share of the carrying value of the assets and liabilities included within the sale agreement was as follows (in millions):
Assets: | ||||
Investments | $ | 171 | ||
Property, plant and equipment, net * | 88 | |||
Other | 18 | |||
| $ | 277 | |||
Liabilities: | ||||
AROs | $ | 200 | ||
Regulatory liabilities | (7 | ) | ||
| $ | 193 | |||
| * | Includes nuclear fuel, net of amortization |
A-37
Table of Contents
At the closing of the sale, WPL will enter into a long-term purchased power agreement with Dominion to purchase energy and capacity equivalent to the amounts received had current ownership continued. The purchased power agreement, which also will require regulatory approval, will extend through 2013 when Kewaunee’s current operating license will expire. In April 2004, WPL entered into an exclusivity agreement with Dominion. Under this agreement, if Dominion decides to extend the operating license of Kewaunee, Dominion must negotiate only with WPL and WPSC for new purchased power agreements for their respective share of the plant output that would extend beyond Kewaunee’s current operating license termination date. The exclusivity period will start on the closing date of the sale and will extend through Dec. 21, 2011.
(17) ASSET RETIREMENT OBLIGATIONS (AROs)
WPL adopted SFAS 143 on Jan. 1, 2003, which provides accounting and disclosure requirements for AROs associated with long-lived assets. SFAS 143 requires that when an asset is placed in service the present value of retirement costs for which WPL has a legal obligation must be recorded as liabilities with an equivalent amount added to the asset cost. The liability is accreted to its present value each period and the capitalized cost is depreciated over the useful life of the related asset. Upon settlement of the liability, an entity settles the obligation for its recorded amount or incurs a gain or loss.
The scope of SFAS 143 as it relates to WPL primarily includes decommissioning costs for Kewaunee. The differences between the estimated decommissioning costs disclosed in Note 11(f) for Kewaunee and the recorded SFAS 143 liability are primarily related to fuel management costs, non-nuclear demolition costs and the timing of future cash flows. It also applies to a smaller extent to the removal, closure or dismantlement of several other assets including, but not limited to, active ash landfills, water intake facilities, underground storage tanks, groundwater wells, distribution equipment, easements, leases and the dismantlement of certain hydro facilities. Other than Kewaunee, WPL’s current AROs are not significant. Refer to Note 16 for information regarding the proposed sale of WPL’s interest in Kewaunee. A reconciliation of the changes in the AROs is depicted below (in millions):
Balance at Jan. 1, 2004 | $ | 187.4 | |
Accretion expense | 13.5 | ||
Balance at Dec. 31, 2004 | $ | 200.9 | |
Upon adoption of SFAS 143 on Jan. 1, 2003, WPL recorded AROs of $175.0 million.
(18) VARIABLE INTEREST ENTITIES
In December 2003, the FASB issued FIN 46R which addresses consolidation by business enterprises of variable interest entities. FIN 46R requires consolidation where there is a controlling financial interest in a variable interest entity or where the variable interest entity does not have sufficient equity at risk to finance its activities without additional subordinated financial support from other parties. WPL adopted FIN 46R for those entities considered to be special-purpose entities as of Dec. 31, 2003, and for all other entities subject to FIN 46R as of March 31, 2004. WPL did not consolidate any entities as a result of this guidance.
After making an ongoing exhaustive effort, WPL concluded that it was unable to obtain the information necessary from the counterparties for the Riverside plant tolling agreement and RockGen plant purchased power agreement to determine whether the counterparties are variable interest entities and if WPL is the primary beneficiary. These agreements are currently accounted for as operating leases. The counterparties can sell their energy output and sell some or all of their generating capacity to WPL. In 2004, WPL incurred costs (excluding fuel costs) related to the Riverside contract of $38 million. In each of 2004 and 2003, WPL incurred costs related to the RockGen contract of approximately $33 million. WPL’s maximum exposure to loss from these contracts is undeterminable due to the inability to obtain the necessary information to complete such evaluation.
(19) RELATED PARTIES
WPL and IPL are parties to a System Coordination and Operating Agreement. The agreement, which has been approved by FERC, provides a contractual basis for coordinated planning, construction, operation and maintenance of the interconnected electric generation and transmission (IPL only) systems of WPL and IPL. In addition, the agreement allows the interconnected system to be operated as a single entity with off-system capacity sales and purchases made to market excess system capability or to meet system capability deficiencies. Such sales and purchases are allocated among WPL and IPL based on procedures included in the agreement. The sales amounts allocated to WPL were $25 million, $42 million and $27 million for 2004, 2003 and 2002, respectively. The purchases allocated to WPL were $279 million, $229 million and $206 million for 2004, 2003 and 2002, respectively. The procedures were approved by both FERC and all state regulatory bodies having jurisdiction over these sales. Under the agreement, WPL and IPL are fully reimbursed for any generation expense
A-38
Table of Contents
incurred to support the sale to an affiliate or to a non-affiliate. Any margins on sales to non-affiliates are distributed to WPL and IPL in proportion to each utility’s share of electric production at the time of the sale.
Pursuant to a service agreement approved by the SEC under PUHCA, WPL receives various administrative and general services from an affiliate, Corporate Services. These services are billed to WPL at cost based on payroll and other expenses incurred by Corporate Services for the benefit of WPL. These costs totaled $129 million, $125 million and $118 million for 2004, 2003 and 2002, respectively, and consisted primarily of employee compensation, benefits and fees associated with various professional services. At Dec. 31, 2004 and 2003, WPL had a net intercompany payable to Corporate Services of $31 million and $36 million, respectively.
In 2004, Alliant Energy Generation, Inc., a subsidiary of Alliant Energy Resources, Inc. (Resources), billed WPL $7 million related to the construction of the Sheboygan Falls plant. Refer to Note 9 for information regarding related party transactions with NMC and ATC.
Market Information- The 4.50% series of preferred stock is listed on the American Stock Exchange, with the trading symbol of WIS_PR. All other series of preferred stock are traded on the over-the-counter market. 71% of WPL’s individual preferred shareowners are Wisconsin residents.
Dividend Information- Preferred stock dividends paid per share for each quarter during 2004 were as follows:
Series | Dividend | ||
4.40% | $ | 1.10 | |
4.50% | $ | 1.125 | |
4.76% | $ | 1.19 | |
4.80% | $ | 1.20 | |
4.96% | $ | 1.24 | |
6.20% | $ | 1.55 | |
6.50% | $ | 0.40625 | |
As authorized by the WPL Board of Directors, preferred stock dividend record and payment dates for 2005 are as follows:
Record Date | Payment Date | |
February 28 | March 15 | |
May 31 | June 15 | |
August 31 | September 15 | |
November 30 | December 15 |
Stock Transfer Agent and Registrar
Alliant Energy Corporation
Shareowner Services
P.O. Box 2568
Madison, WI 53701-2568
Form 10-K Information- A copy of the combined Annual Report on Form 10-K for the year ended Dec. 31, 2004 as filed with the SEC will be provided without charge upon request. Requests may be directed to Shareowner Services at the above address.
A-39
Table of Contents
EXECUTIVE OFFICERS AND DIRECTORS
Executive Officers - Numbers following the names represent the officer’s age as of Dec. 31, 2004.
Erroll B. Davis, Jr., 60, was elected Chairman of the Board effective April 2000 and Chief Executive Officer effective April 1998.
William D. Harvey, 55, was elected Chief Operating Officer effective January 2004 and was appointed as a board member effective January 2005. He previously served as President since 1998.
Barbara J. Swan, 53, was elected President effective January 2004. She previously served as Executive Vice President and General Counsel since 1998.
Eliot G. Protsch, 51, was elected Chief Financial Officer effective January 2004. He previously served as Executive Vice President and Chief Financial Officer since September 2003 and Executive Vice President-Energy Delivery from 1998 to September 2003.
Thomas L. Aller, 55, was elected Senior Vice President-Energy Delivery effective January 2004. He previously served as interim Executive Vice President-Energy Delivery since September 2003 and Vice President-Investments at Resources from 1998 to 2003.
Thomas L. Hanson, 51, was elected Vice President and Treasurer effective April 2002. He previously served as Managing Director-Generation Services since 2001 at Alliant Energy and General Manager-Business and Financial Performance, Generation from 1998 to 2001 at Alliant Energy.
John E. Kratchmer, 42, was elected Vice President-Controller and Chief Accounting Officer effective October 2002. He previously served as Corporate Controller and Chief Accounting Officer since 2000.
Directors- Refer to WPL’s Proxy Statement for information on WPL’s board members.
A-40
Table of Contents
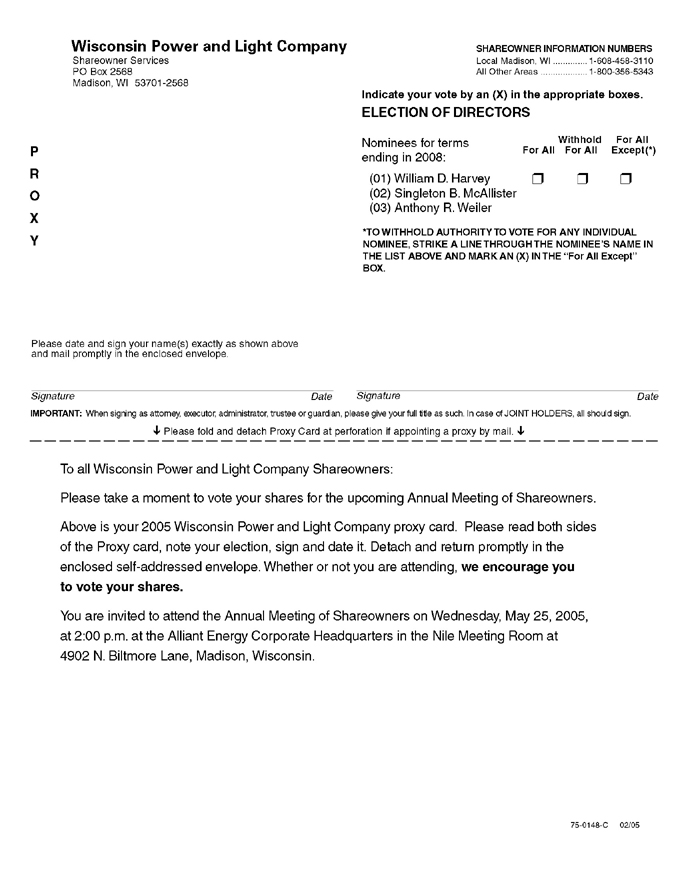
Wisconsin Power and Light Company
Shareowner Services PO Box 2568 Madison, WI 53701-2568
SHAREOWNER INFORMATION NUMBERS
Local Madison, WI 1-608-458-3110 All Other Areas 1-800-356-5343
Indicate your vote by an (X) in the appropriate boxes.
ELECTION OF DIRECTORS
Nominees for terms ending in 2008:
Withhold For All For All For All Except(*)
(01) William D. Harvey
(02) Singleton B. McAllister
(03) Anthony R. Weiler
*TO WITHHOLD AUTHORITY TO VOTE FOR ANY INDIVIDUAL NOMINEE, STRIKE A LINE THROUGH THE NOMINEE’S NAME IN THE LIST ABOVE AND MARK AN (X) IN THE “For All Except” BOX.
PROXY
Please date and sign your name(s) exactly as shown above and mail promptly in the enclosed envelope.
Signature Date Signature Date
IMPORTANT: When signing as attorney, executor, administrator, trustee or guardian, please give your full title as such. In case of JOINT HOLDERS, all should sign.
Please fold and detach Proxy Card at perforation if appointing a proxy by mail.
To all Wisconsin Power and Light Company Shareowners:
Please take a moment to vote your shares for the upcoming Annual Meeting of Shareowners.
Above is your 2005 Wisconsin Power and Light Company proxy card. Please read both sides of the Proxy card, note your election, sign and date it. Detach and return promptly in the enclosed self-addressed envelope. Whether or not you are attending, we encourage you to vote your shares.
You are invited to attend the Annual Meeting of Shareowners on Wednesday, May 25, 2005, at 2:00 p.m. at the Alliant Energy Corporate Headquarters in the Nile Meeting Room at 4902 N. Biltmore Lane, Madison, Wisconsin.
Table of Contents
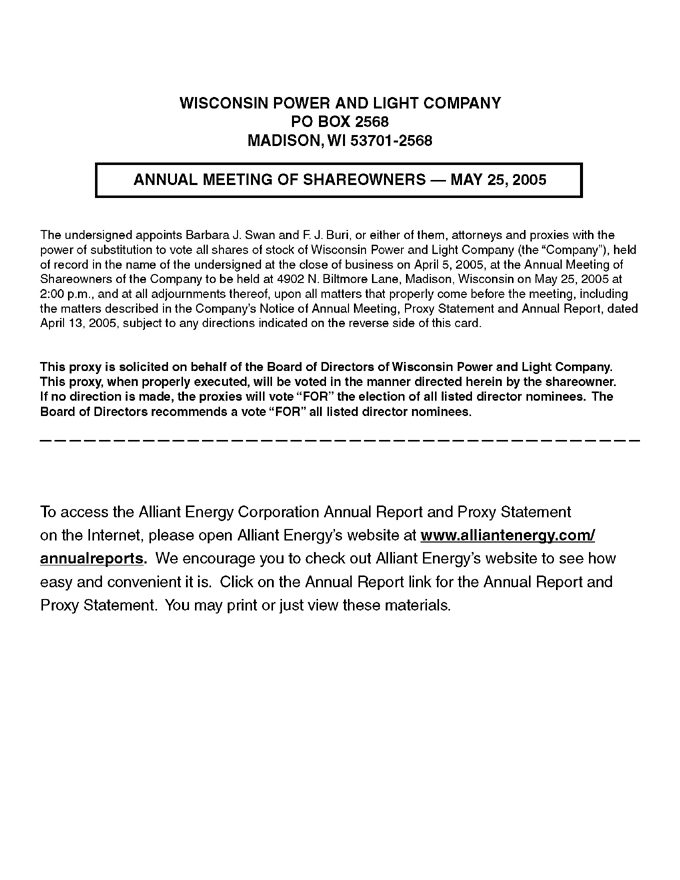
WISCONSIN POWER AND LIGHT COMPANY
PO BOX 2568 MADISON, WI 53701-2568
ANNUAL MEETING OF SHAREOWNERS — MAY 25, 2005
The undersigned appoints Barbara J. Swan and F. J. Buri, or either of them, attorneys and proxies with the power of substitution to vote all shares of stock of Wisconsin Power and Light Company (the “Company”), held of record in the name of the undersigned at the close of business on April 5, 2005, at the Annual Meeting of Shareowners of the Company to be held at 4902 N. Biltmore Lane, Madison, Wisconsin on May 25, 2005 at 2:00 p.m., and at all adjournments thereof, upon all matters that properly come before the meeting, including the matters described in the Company’s Notice of Annual Meeting, Proxy Statement and Annual Report, dated April 13, 2005, subject to any directions indicated on the reverse side of this card.
This proxy is solicited on behalf of the Board of Directors of Wisconsin Power and Light Company. This proxy, when properly executed, will be voted in the manner directed herein by the shareowner. If no direction is made, the proxies will vote “FOR” the election of all listed director nominees. The Board of Directors recommends a vote “FOR” all listed director nominees.
To access the Alliant Energy Corporation Annual Report and Proxy Statement on the Internet, please open Alliant Energy’s website at www.alliantenergy.com/ annualreports. We encourage you to check out Alliant Energy’s website to see how easy and convenient it is. Click on the Annual Report link for the Annual Report and Proxy Statement. You may print or just view these materials.