UNITED STATES
SECURITIES AND EXCHANGE COMMISSION
WASHINGTON, D.C. 20549
FORM 10-K
| [X] | ANNUAL REPORT PURSUANT TO SECTION 13 OR 15 (d) OF THE SECURITIES EXCHANGE ACT OF 1934 |
For the fiscal year endedDecember 31, 2010
or
| [ ] | TRANSITION REPORT PURSUANT TO SECTION 13 OR 15 (d) OF THE SECURITIES EXCHANGE ACT OF 1934 |
For the transition period from to
| | | | | | | | |
Commission File Number | | | | Name of Registrant, State of Incorporation, Address of Principal Executive Offices and Telephone Number | |
| IRS Employer
Identification Number |
|
1-9894 | | | | ALLIANT ENERGY CORPORATION | | | 39-1380265 | |
| | | | (a Wisconsin corporation) | | | | |
| | | | 4902 N. Biltmore Lane | | | | |
| | | | Madison, Wisconsin 53718 | | | | |
| | | | Telephone (608)458-3311 | | | | |
| | | |
0-4117-1 | | | | INTERSTATE POWER AND LIGHT COMPANY | | | 42-0331370 | |
| | | | (an Iowa corporation) | | | | |
| | | | Alliant Energy Tower | | | | |
| | | | Cedar Rapids, Iowa 52401 | | | | |
| | | | Telephone (319)786-4411 | | | | |
| | | |
0-337 | | | | WISCONSIN POWER AND LIGHT COMPANY | | | 39-0714890 | |
| | | | (a Wisconsin corporation) | | | | |
| | | | 4902 N. Biltmore Lane | | | | |
| | | | Madison, Wisconsin 53718 | | | | |
| | | | Telephone (608)458-3311 | | | | |
This combined Form 10-K is separately filed by Alliant Energy Corporation, Interstate Power and Light Company and Wisconsin Power and Light Company. Information contained in the Form 10-K relating to Interstate Power and Light Company and Wisconsin Power and Light Company is filed by such registrant on its own behalf. Each of Interstate Power and Light Company and Wisconsin Power and Light Company makes no representation as to information relating to registrants other than itself.
Securities registered pursuant to Section 12 (b) of the Act:
| | | | |
| | Title of Class | | Name of Each Exchange on Which Registered |
| Alliant Energy Corporation | | Common Stock, $0.01 Par Value | | New York Stock Exchange |
| Alliant Energy Corporation | | Common Share Purchase Rights | | New York Stock Exchange |
| Interstate Power and Light Company | | 8.375% Series B Cumulative Preferred Stock,
$0.01 Par Value | | New York Stock Exchange |
| Interstate Power and Light Company | | 7.10% Series C Cumulative Preferred Stock,
$0.01 Par Value | | New York Stock Exchange |
| Wisconsin Power and Light Company | | 4.50% Preferred Stock, No Par Value | | NYSE Amex LLC |
Securities registered pursuant to Section 12 (g) of the Act: Wisconsin Power and Light Company Preferred Stock
(Accumulation without Par Value)
Indicate by check mark if the registrants are well-known seasoned issuers, as defined in Rule 405 of the Securities Act.
| | | | | | | | | | |
| Alliant Energy Corporation | | Yes [X] | | | | No [ ] | | | | |
| Interstate Power and Light Company | | Yes [ ] | | | | No [X] | | | | |
| Wisconsin Power and Light Company | | Yes [ ] | | | | No [X] | | | | |
Indicate by check mark if the registrants are not required to file reports pursuant to Section 13 or Section 15(d) of the Act.
Yes [ ] No [X]
Indicate by check mark whether the registrants (1) have filed all reports required to be filed by Section 13 or 15 (d) of the Securities Exchange Act of 1934 during the preceding 12 months (or for such shorter period that the registrants were required to file such reports) and (2) have been subject to such filing requirements for the past 90 days. Yes [X] No [ ]
Indicate by check mark whether the registrants have submitted electronically and posted on their corporate Web site, if any, every Interactive Data File required to be submitted and posted pursuant to Rule 405 of Regulation S-T (§232.405 of this chapter) during the preceding 12 months (or for such shorter period that the registrants were required to submit and post such files).
| | | | | | | | | | | | |
| Alliant Energy Corporation | | | | Yes [X] | | | | No [ ] | | | | |
| Interstate Power and Light Company | | | | Yes [ ] | | | | No [ ] | | | | |
| Wisconsin Power and Light Company | | | | Yes [ ] | | | | No [ ] | | | | |
Indicate by check mark if disclosure of delinquent filers pursuant to Item 405 of Regulation S-K is not contained herein, and will not be contained, to the best of the registrants’ knowledge, in definitive proxy or information statements incorporated by reference in Part III of this Form 10-K or any amendment to this Form 10-K. [ ]
Indicate by check mark whether the registrants are large accelerated filers, accelerated filers, non-accelerated filers, or smaller reporting companies. See definitions of “large accelerated filer,” “accelerated filer” and “smaller reporting company” in Rule 12b-2 of the Exchange Act.
| | | | | | | | | | | | | | | | | | | | |
| | | | Large AcceleratedFiler | | | | AcceleratedFiler | | | | Non-accelerated Filer | | | | Smaller Reporting CompanyFiler | | | | |
| Alliant Energy Corporation | | | | [X] | | | | | | | | | | | | | | | | |
| Interstate Power and Light Company | | | | | | | | | | | | [X] | | | | | | | | |
| Wisconsin Power and Light Company | | | | | | | | | | | | [X] | | | | | | | | |
Indicate by checkmark whether the registrants are shell companies (as defined in Rule 12b-2 of the Exchange Act).
Yes [ ] No [X]
The aggregate market value of the voting and non-voting common equity held by nonaffiliates as of June 30, 2010:
| | |
| Alliant Energy Corporation | | $3.5 billion |
| Interstate Power and Light Company | | $-- |
| Wisconsin Power and Light Company | | $-- |
Number of shares outstanding of each class of common stock as of Jan. 31, 2011:
| | |
| Alliant Energy Corporation | | Common stock, $0.01 par value, 110,881,189 shares outstanding |
| Interstate Power and Light Company | | Common stock, $2.50 par value, 13,370,788 shares outstanding (all of which
are owned beneficially and of record by Alliant Energy Corporation) |
| Wisconsin Power and Light Company | | Common stock, $5 par value, 13,236,601 shares outstanding (all of which
are owned beneficially and of record by Alliant Energy Corporation) |
DOCUMENTS INCORPORATED BY REFERENCE
Portions of the Proxy Statements relating to Alliant Energy Corporation’s and Wisconsin Power and Light Company’s 2011 Annual Meetings of Shareowners are, or will be upon filing with the Securities and Exchange Commission, incorporated by reference into Part III hereof.
TABLE OF CONTENTS
FORWARD-LOOKING STATEMENTS
Statements contained in this Annual Report on Form 10-K that are not of historical fact are forward-looking statements intended to qualify for the safe harbors from liability established by the Private Securities Litigation Reform Act of 1995. These forward-looking statements can be identified as such because the statements include words such as “expect,” “anticipate,” “plan” or other words of similar import. Similarly, statements that describe future financial performance or plans or strategies are forward-looking statements. Such forward-looking statements are subject to certain risks and uncertainties that could cause actual results to differ materially from those expressed in, or implied by, such statements. Some, but not all, of the risks and uncertainties of Alliant Energy Corporation (Alliant Energy), Interstate Power and Light Company (IPL) and Wisconsin Power and Light Company (WPL) include:
| • | | federal and state regulatory or governmental actions, including the impact of energy, tax, financial and health care legislation, and of regulatory agency orders; |
| • | | IPL’s and WPL’s ability to obtain adequate and timely rate relief to allow for, among other things, the recovery of operating costs, fuel costs, transmission costs, deferred expenditures, capital expenditures, and remaining costs related to generating units that may be permanently closed, the earning of reasonable rates of return, and the payments to their parent of expected levels of dividends; |
| • | | the ability to continue cost controls and operational efficiencies; |
| • | | the impact of IPL’s retail electric base rate freeze in Iowa through 2013; |
| • | | the state of the economy in IPL’s and WPL’s service territories and resulting implications on sales, margins and ability to collect unpaid bills; |
| • | | IPL’s potential rate refunds to customers resulting from final rates set by the Minnesota Public Utilities Commission (MPUC) that are less than the interim rate increases IPL is currently collecting from its Minnesota retail customers; |
| • | | developments that adversely impact their ability to implement their strategic plans including unanticipated issues in connection with construction and operation or regulatory approval of a new wind generating facility to utilize the remaining 100 megawatts (MW) of Vestas-American Wind Technology, Inc. (Vestas) wind turbine generator sets, new emission control equipment for various coal-fired generating facilities, WPL’s potential purchases of the Riverside Energy Center (Riverside) and Wisconsin Electric Power Company’s (WEPCO’s) 25% interest in the Edgewater Generating Station Unit 5 (Edgewater Unit 5), and Alliant Energy’s ability to complete the proposed divestiture of its Industrial Energy Applications, Inc. business; |
| • | | weather effects on results of operations; |
| • | | successful resolution of the pending challenge by interveners of the approval by the Public Service Commission of Wisconsin (PSCW) of WPL’s Bent Tree - Phase I wind project; |
| • | | issues related to the availability of generating facilities and the supply and delivery of fuel and purchased electricity and price thereof, including the ability to recover and to retain the recovery of purchased power, fuel and fuel-related costs through rates in a timely manner; |
| • | | the impact that fuel and fuel-related prices may have on IPL’s and WPL’s customers’ demand for utility services; |
| • | | the ability to defend against environmental claims brought by state and federal agencies, such as the United States of America (U.S.) Environmental Protection Agency (EPA), or third parties, such as the Sierra Club; |
| • | | issues associated with environmental remediation efforts and with environmental compliance generally, including changing environmental laws and regulations; |
| • | | potential impacts of changing regulations on the ability to utilize already-purchased emission allowances and forward contracts to purchase additional emission allowances; |
| • | | the ability to recover through rates all environmental compliance costs, including costs for projects put on hold due to uncertainty of future environmental laws and regulations; |
| • | | potential impacts of any future laws or regulations regarding global climate change or carbon emissions reductions, including those that contain proposed regulations (including cap-and-trade) of greenhouse gas (GHG) emissions; |
| • | | continued access to the capital markets on competitive terms and rates; |
1
| • | | inflation and interest rates; |
| • | | financial impacts of risk hedging strategies, including the impact of weather hedges or the absence of weather hedges on earnings; |
| • | | changes to the creditworthiness of counterparties which Alliant Energy, IPL and WPL have contractual arrangements including participants in the energy markets and fuel suppliers and transporters; |
| • | | sales and project execution for RMT, Inc. (RMT), the level of growth in the wind and solar development market and the impact of the American Recovery and Reinvestment Act of 2009 and the Tax Relief, Unemployment Insurance Reauthorization and Job Creation Act of 2010, and future legislation; |
| • | | issues related to electric transmission, including operating in Regional Transmission Organization (RTO) energy and ancillary services markets, the impacts of potential future billing adjustments and cost allocation changes from RTOs and recovery of costs incurred; |
| • | | unplanned outages, transmission constraints or operational issues impacting fossil or renewable generating facilities and risks related to recovery of resulting incremental costs through rates; |
| • | | Alliant Energy’s ability to successfully pursue appropriate appeals with respect to, and any liabilities arising out of, the alleged violation of the Employee Retirement Income Security Act of 1974 by Alliant Energy’s Cash Balance Pension Plan; |
| • | | Alliant Energy’s ability to successfully resolve with the Internal Revenue Service (IRS) issues related to Alliant Energy’s Cash Balance Pension Plan; |
| • | | current or future litigation, regulatory investigations, proceedings or inquiries; |
| • | | Alliant Energy’s ability to sustain its dividend payout ratio goal; |
| • | | employee workforce factors, including changes in key executives, collective bargaining agreements and negotiations, work stoppages or additional restructurings; |
| • | | impacts that storms or natural disasters in IPL’s and WPL’s service territories may have on their operations and recovery of and rate relief for costs associated with restoration activities; |
| • | | access to technological developments; |
| • | | any material post-closing adjustments related to any past asset divestitures; |
| • | | increased retirement and benefit plan costs; |
| • | | the impact of necessary accruals for the terms of incentive compensation plans; |
| • | | the effect of accounting pronouncements issued periodically by standard-setting bodies; |
| • | | the ability to utilize tax credits and net operating losses generated to date, and those that may be generated in the future, before they expire; |
| • | | the ability to successfully complete tax audits and appeals with no material impact on earnings and cash flows; |
| • | | the direct or indirect effects resulting from terrorist incidents or responses to such incidents; and |
| • | | factors listed in Management’s Discussion and Analysis of Financial Condition and Results of Operations (MDA) and in Item 1A Risk Factors. |
Alliant Energy, IPL and WPL assume no obligation, and disclaim any duty, to update the forward-looking statements in this Annual Report on Form 10-K.
WEBSITE ACCESS TO REPORTS
Alliant Energy makes its periodic and current reports, and amendments to those reports, available, free of charge, on its website atwww.alliantenergy.com/investors on the same day as such material is electronically filed with, or furnished to, the Securities and Exchange Commission (SEC). Alliant Energy is not including the information contained on its website as a part of, or incorporating it by reference into, this Annual Report on Form 10-K.
2
PART I
This Annual Report on Form 10-K includes information relating to Alliant Energy, IPL and WPL (as well as Alliant Energy Resources, LLC (Resources) and Alliant Energy Corporate Services, Inc. (Corporate Services)). Where appropriate, information relating to a specific entity has been segregated and labeled as such. Unless otherwise noted, the information herein has been revised to exclude discontinued operations for all periods presented. Refer to Note 17 of the “Combined Notes to Consolidated Financial Statements” for information on businesses reported as discontinued operations.
ITEM 1. BUSINESS
A. GENERAL
Alliant Energy was incorporated in Wisconsin in 1981 and maintains its principal executive offices in Madison, Wisconsin. Alliant Energy operates as a regulated investor-owned public utility holding company. Alliant Energy’s primary focus is to provide regulated electricity and natural gas service to approximately 1 million electric and approximately 412,000 natural gas customers in the Midwest through its two public utility subsidiaries. The primary first tier subsidiaries of Alliant Energy are: IPL, WPL, Resources and Corporate Services. An illustration of Alliant Energy’s first tier subsidiaries is shown below.

A brief description of the primary first tier subsidiaries of Alliant Energy is as follows:
1) IPL - was incorporated in 1925 in Iowa as Iowa Railway and Light Corporation. IPL is a public utility engaged principally in the generation and distribution of electricity and the distribution and transportation of natural gas in selective markets in Iowa and southern Minnesota. In Iowa, IPL provides utility services to incorporated communities as directed by the Iowa Utilities Board (IUB) and utilizes non-exclusive franchises, which cover the use of public right-of-ways for utility facilities in incorporated communities for a maximum term of 25 years. At Dec. 31, 2010, IPL supplied electric and gas service to 525,657 and 233,792 retail customers, respectively. IPL is also engaged in the generation and distribution of steam for two customers in Cedar Rapids, Iowa. In 2010, 2009 and 2008, IPL had no single customer for which electric, gas, steam and/or other sales accounted for 10% or more of IPL’s consolidated revenues.
2) WPL - was incorporated in 1917 in Wisconsin as Eastern Wisconsin Electric Company. WPL is a public utility engaged principally in the generation and distribution of electricity and the distribution and transportation of natural gas in selective markets in southern and central Wisconsin. WPL operates in municipalities pursuant to permits of indefinite duration and state statutes authorizing utility operation in areas annexed by a municipality. At Dec. 31, 2010, WPL supplied electric and gas service to 454,776 and 178,570 retail customers, respectively. In 2010, 2009 and 2008, WPL had no single customer for which electric, gas and/or other sales accounted for 10% or more of WPL’s consolidated revenues. WPL Transco LLC is a wholly-owned subsidiary of WPL and holds WPL’s investment in the American Transmission Company LLC (ATC).
3) RESOURCES - was incorporated in 1988 in Wisconsin. In 2008, Resources was converted to a limited liability company. Alliant Energy’s non-regulated investments are organized under Resources. Refer to “D. Information Relating to Non-regulated Operations” for additional details.
4) CORPORATE SERVICES - was incorporated in 1997 in Iowa. Corporate Services provides administrative services to Alliant Energy and its subsidiaries.
Refer to Note 14 of the “Combined Notes to Consolidated Financial Statements” for further discussion of business segments, which information is incorporated herein by reference.
3
B. INFORMATION RELATING TO ALLIANT ENERGY ON A CONSOLIDATED BASIS
1) EMPLOYEES -At Dec. 31, 2010, Alliant Energy’s consolidated subsidiaries had the following full- and part-time employees:
| | | | | | | | | | | | | | |
| | | Number of
Bargaining Unit
Employees | | | Number of
Other
Employees | | | Total
Number of
Employees | | | Percentage of Employees
Covered by Collective
Bargaining Agreements |
IPL | | | 1,157 | | | | 257 | | | | 1,414 | | | 82% |
Corporate Services | | | 28 | | | | 1,366 | | | | 1,394 | | | 2% |
WPL | | | 1,150 | | | | 94 | | | | 1,244 | | | 92% |
Resources: | | | | | | | | | | | | | | |
RMT | | | -- | | | | 527 | | | | 527 | | | -- |
Other | | | 87 | | | | 38 | | | | 125 | | | 70% |
| | | | | | | | | | | | | | |
| | | 2,422 | | | | 2,282 | | | | 4,704 | | | 51% |
| | | | | | | | | | | | | | |
At Dec. 31, 2010, Alliant Energy employees covered by collective bargaining agreements were as follows:
| | | | | | | | |
| | | Number of
Employees | | | Contract
Expiration Date | |
IPL: | | | | | | | | |
International Brotherhood of Electrical Workers (IBEW) Local 1439 | | | 17 | | | | 6/30/11 | |
IBEW Local 1455 | | | 5 | | | | 6/30/11 | |
IBEW Local 204 (Emery) | | | 12 | | | | 11/30/11 | |
IBEW Local 949 | | | 231 | | | | 9/30/12 | |
IBEW Local 204 (Dubuque) | | | 99 | | | | 9/30/12 | |
IBEW Local 204 (Mason City) | | | 43 | | | | 9/30/12 | |
IBEW Local 204 (Cedar Rapids) | | | 750 | | | | 8/31/13 | |
| | | | | | | | |
| | | 1,157 | | | | | |
WPL - IBEW Local 965 | | | 1,150 | | | | 5/31/11 | |
Resources - Various | | | 87 | | | | Various | |
Corporate Services - IBEW Local 204 | | | 28 | | | | Negotiating | |
| | | | | | | | |
| | | 2,422 | | | | | |
| | | | | | | | |
2) CAPITAL EXPENDITURE AND INVESTMENT PLANS -Refer to “Liquidity and Capital Resources - Cash Flows - Investing Activities - Construction and Acquisition Expenditures” in MDA for discussion of anticipated construction and acquisition expenditures for 2011, 2012 and 2013.
3) REGULATION -Alliant Energy, IPL and WPL are subject to regulation by various federal, state and local agencies. The following includes the primary regulations impacting Alliant Energy’s, IPL’s and WPL’s businesses.
Federal Energy Regulatory Commission (FERC) - -
Public Utility Holding Company Act of 2005 (PUHCA 2005) - Alliant Energy is registered with FERC as a public utility holding company, pursuant to PUHCA 2005, and is required to maintain certain records and to report certain transactions involving its public utilities and other entities regulated by FERC. IPL and WPL are subject to regulation by FERC under PUHCA 2005 for various issues including, but not limited to, affiliate transactions, public utility mergers, acquisitions and dispositions, issuance of securities (IPL only) and books and records requirements.
Energy Policy Act - The Energy Policy Act requires creation of an Electric Reliability Organization (ERO) to provide oversight by FERC. FERC designated the North American Electric Reliability Corporation (NERC) as the overarching ERO. The Midwest Reliability Organization (MRO), which is a regional member of NERC, has direct responsibility for mandatory electric reliability standards for IPL and WPL.
4
Federal Power Act - FERC also has jurisdiction, under the Federal Power Act, over certain electric utility facilities and operations, electric wholesale and transmission rates, dividend payments and accounting practices of IPL and WPL.
Electric Wholesale Rates - Corporate Services, as agent for both IPL and WPL, has received wholesale electric market-based rate authority from FERC. Market-based rate authorization allows for wholesale sales of electricity within the Midwest Independent Transmission System Operator (MISO) and PJM Interconnection, LLC (PJM) markets and in bilateral markets, based on the market value of the transactions.
Electric Transmission Rates - FERC regulates the rates charged for electric transmission facilities used in interstate commerce. Neither IPL nor WPL own or operate electric transmission facilities; however, both IPL and WPL pay for the use of the interstate electric transmission system based upon FERC-regulated rates. IPL relies primarily upon the use of the ITC Midwest LLC (ITC) transmission system. WPL relies primarily upon the use of the ATC transmission system.
National Gas Act - FERC regulates the transportation and sale for resale of natural gas in interstate commerce under the Natural Gas Act. Under the Natural Gas Act, FERC has authority over certain natural gas facilities and operations of IPL and WPL.
Environmental - The EPA administers certain federal regulatory programs and has delegated the administration of other environmental regulatory programs to the applicable state environmental agencies. In general, the state agencies have jurisdiction over air and water quality, hazardous substances management and transportation, and solid waste management requirements. In certain cases, the state environmental agencies have delegated the administration of environmental programs to local agencies. Alliant Energy, IPL and WPL are subject to these environmental regulations as a result of their current and past operations.
IUB -IPL is subject to regulation by the IUB related to its operations in Iowa for various issues including, but not limited to, retail utility rates and standards of service, accounting requirements and approval of the location and construction of electric generating facilities.
Retail Utility Base Rates -IPL files periodic requests with the IUB for retail rate relief. These filings are based on historical test periods. The historical test periods may be adjusted for certain known and measurable capital additions placed in service by IPL within nine months from the end of the historical test period and certain known and measurable operating and maintenance expenses incurred by IPL within 12 months of the commencement of the proceeding. The IUB must decide on requests for retail rate relief within 10 months of the date of the application for which relief is filed, or the interim rates granted become permanent. Interim retail rates can be placed in effect 10 days after the rate application filing, subject to refund, and must be based on past precedent. Refer to “Rate Matters” in MDA for details of a retail electric base rate freeze effective for IPL’s Iowa customers through 2013.
Retail Commodity Cost Recovery Mechanisms -IPL’s retail electric and natural gas tariffs contain automatic adjustment clauses for changes in prudently incurred commodity costs required to serve its retail customers in Iowa. Any over- or under-collection of commodity costs for each given month are automatically reflected in future billings to retail customers.
Retail Electric Transmission Cost Recovery Mechanism - Effective in the first quarter of 2011, electric transmission service expenses will be removed from base rates and billed to IPL’s Iowa electric retail customers through a transmission cost rider approved by the IUB in January 2011. This new cost recovery mechanism will provide for subsequent adjustments to electric rates charged to Iowa electric retail customers for changes in electric transmission service expenses.
Energy Efficiency Cost Recovery Mechanism - -IPL’s electric and natural gas tariffs contain an energy efficiency cost recovery (EECR) factor to recover prudently incurred energy efficiency costs incurred on behalf of IPL’s Iowa customers. EECR factors are revised annually, subject to approval by the IUB, and include a reconciliation to eliminate any over- or under-recovery of energy efficiency expenses from prior periods.
New Electric Generating Facilities -A Certificate of Public Convenience, Use and Necessity (GCU Certificate) application is required to be filed with the IUB for construction approval of any new electric generating facility located in Iowa with 25 MW or more of capacity.
5
Advance Rate Making Principles -Iowa Code §476.53 provides Iowa utilities with rate making principles prior to making certain generation investments in Iowa. Under Iowa Code §476.53, IPL must file for, and the IUB must provide, rate making principles for electric generating facilities located in Iowa that have received construction approval including new base-load (primarily defined as nuclear or coal-fired generation) facilities with a capacity of 300 MW or more, combined-cycle natural gas-fired facilities of any size and renewable generating resources, such as wind facilities, of any size. Upon approval of rate making principles by the IUB, IPL must either build the facility under the approved rate making principles, or not at all.
PSCW -Alliant Energy is subject to regulation by the PSCW for the type and amount of Alliant Energy’s investments in non-utility businesses and other affiliated interest activities, among other issues. WPL is also subject to regulation by the PSCW related to its operations in Wisconsin for various issues including, but not limited to, retail utility rates and standards of service, accounting requirements, issuance and use of proceeds of securities, approval of the location and construction of electric generating facilities and certain other additions and extensions to facilities.
Retail Utility Base Rates -WPL files periodic requests with the PSCW for retail rate relief. These filings are required to be based on forward-looking test periods. There is no statutory time limit for the PSCW to decide retail rate requests. However, the PSCW attempts to process base retail rate cases in approximately 10 months and has the ability to approve interim retail rate relief, subject to refund, if necessary.
Retail Commodity Cost Recovery Mechanisms -
Electric - WPL’s retail electric base rates include estimates of annual fuel-related costs (fuel and purchased power energy costs) anticipated during the test period. During each electric retail rate proceeding or in a separate fuel cost plan approval proceeding, the PSCW sets fuel monitoring ranges based on the forecasted fuel-related costs used to determine rates in such proceeding. If WPL’s actual fuel-related costs fall outside these fuel monitoring ranges, WPL is authorized to defer the incremental over- or under-collection of fuel-related costs from electric retail customers that are outside the approved ranges. Any over- or under-collection of fuel-related costs for each year are reflected in future billings to retail customers. This cost recovery mechanism became effective for WPL on Jan. 1, 2011.
Natural Gas - WPL’s retail natural gas tariffs contain an automatic adjustment clause for changes in prudently incurred natural gas costs required to serve its retail gas customers. Any over- or under-collection of natural gas costs for each given month are automatically reflected in future billings to retail customers.
Energy Efficiency Cost Recovery Mechanism -WPL contributes a certain percentage of its annual retail utility revenues to help fund Focus on Energy, Wisconsin’s statewide energy efficiency and renewable energy resource program. Contributions to Focus on Energy are recovered from WPL’s retail customers through changes in base rates determined during periodic rate proceedings and include a reconciliation to eliminate any over- or under-recovery of contributions from prior periods.
New Electric Generating Facilities - A Certificate of Authority application is required to be filed with the PSCW for construction approval of any new electric generating facility with a capacity of less than 100 MW. A Certificate of Public Convenience and Necessity application is required to be filed with the PSCW for construction approval of any new electric generating facility with a capacity of 100 MW or more. In addition, WPL’s ownership and operation of electric generating facilities (including those located outside the state of Wisconsin) to serve Wisconsin customers is subject to retail utility rate regulation by the PSCW.
Advance Rate Making Principles - Wisconsin Statutes §196.371 provide Wisconsin utilities with the opportunity to request rate making principles prior to the purchase or construction of any nuclear or fossil-fueled electric generating facility or renewable generating resource, such as a wind facility, utilized to serve Wisconsin customers. WPL is not obligated to file for or accept authorized rate making principles under Wisconsin Statutes §196.371. WPL can proceed with an approved project under traditional rate making terms.
MPUC - IPL is subject to regulation by the MPUC related to its operations in Minnesota for various issues including, but not limited to, retail utility rates and standards of service, accounting requirements, issuance and use of proceeds of securities that encumber property in Minnesota and approval of the location and construction of electric generating facilities located in Minnesota with a capacity in excess of 50 MW.
6
Retail Utility Rates - Requests for retail rate relief can be based on either historical or projected data and interim retail rates are permitted. IPL typically files requests for retail rate relief based on historical test periods. The historical test periods may be adjusted for certain known and measurable capital additions placed in service by IPL and operating and maintenance expenses incurred by IPL within 12 months of the end of the test year. Unless otherwise ordered, the MPUC must reach a final decision within 10 months of filing for retail rate relief; however, the MPUC can extend the timing by 90 days.
Refer to Notes 1(b), 1(h), 2 and 12(e) of the “Combined Notes to Consolidated Financial Statements,” and “Rate Matters,” “Environmental Matters” and “Legislative Matters” in MDA for additional information regarding regulation and utility rate matters.
4) STRATEGIC OVERVIEW - Refer to “Strategic Overview” in MDA for discussion of various strategic actions by Alliant Energy, IPL and WPL.
C. INFORMATION RELATING TO UTILITY OPERATIONS
Alliant Energy’s utility business (IPL and WPL) has three segments: a) electric operations; b) gas operations; and c) other, which includes IPL’s steam operations, various other energy-related products and services, and the unallocated portions of the utility business. In 2010, IPL’s and WPL’s operating revenues and operating income (loss) for these three utility business segments were as follows:
| | | | | | | | |
| | | IPL | | WPL |
| | | Operating
Revenues | | Operating
Income (Loss) | | Operating
Revenues | | Operating
Income (Loss) |
Electric | | 82% | | 92% | | 85% | | 90% |
Gas | | 15% | | 9% | | 14% | | 11% |
Other | | 3% | | (1%) | | 1% | | (1%) |
| | | | | | | | |
| | 100% | | 100% | | 100% | | 100% |
| | | | | | | | |
1) ELECTRIC UTILITY OPERATIONS
General - Electric utility operations represent the largest operating segment for Alliant Energy, IPL and WPL. Alliant Energy’s electric utility operations are located in the Midwest with IPL and WPL providing electric service in Iowa, southern and central Wisconsin and southern Minnesota. Refer to the “Electric Operating Information” tables for additional details regarding electric utility operations.
Jurisdictions - Electric utility revenues by state were as follows (dollars in millions):
| | | | | | | | | | | | | | | | | | | | | | | | |
| | | 2010 | | | 2009 | | | 2008 | |
| | | Amount | | | Percent | | | Amount | | | Percent | | | Amount | | | Percent | |
IPL: | | | | | | | | | | | | | | | | | | | | | | | | |
Iowa | | | $1,386.0 | | | | 52% | | | | $1,242.3 | | | | 50% | | | | $1,184.3 | | | | 49% | |
Minnesota | | | 78.3 | | | | 3% | | | | 73.3 | | | | 3% | | | | 74.0 | | | | 3% | |
| | | | | | | | | | | | | | | | | | | | | | | | |
Subtotal | | | 1,464.3 | | | | 55% | | | | 1,315.6 | | | | 53% | | | | 1,258.3 | | | | 52% | |
| | | | | | | | | | | | | | | | | | | | | | | | |
WPL: | | | | | | | | | | | | | | | | | | | | | | | | |
Wisconsin | | | 1,209.9 | | | | 45% | | | | 1,160.3 | | | | 47% | | | | 1,153.0 | | | | 48% | |
| | | | | | | | | | | | | | | | | | | | | | | | |
| | | $2,674.2 | | | | 100% | | | | $2,475.9 | | | | 100% | | | | $2,411.3 | | | | 100% | |
| | | | | | | | | | | | | | | | | | | | | | | | |
The percentage of electric utility revenues regulated by IPL’s and WPL’s respective state commissions and FERC were as follows:
| | | | | | | | | | | | | | | | | | | | | | | | |
| | | IPL | | | WPL | |
| | | 2010 | | | 2009 | | | 2008 | | | 2010 | | | 2009 | | | 2008 | |
Respective state commissions | | | 96% | | | | 95% | | | | 96% | | | | 84% | | | | 80% | | | | 84% | |
FERC | | | 4% | | | | 5% | | | | 4% | | | | 16% | | | | 20% | | | | 16% | |
| | | | | | | | | | | | | | | | | | | | | | | | |
| | | 100% | | | | 100% | | | | 100% | | | | 100% | | | | 100% | | | | 100% | |
| | | | | | | | | | | | | | | | | | | | | | | | |
7
Customers - The number of electric customers and communities served at Dec. 31, 2010 was as follows:
| | | | | | | | | | |
| | | Retail Customers | | Wholesale Customers | | Other Customers | | Total Customers | | Communities Served |
IPL | | 525,657 | | 9 | | 1,357 | | 527,023 | | 752 |
WPL | | 454,776 | | 21 | | 2,245 | | 457,042 | | 606 |
| | | | | | | | | | |
| | 980,433 | | 30 | | 3,602 | | 984,065 | | 1,358 |
| | | | | | | | | | |
IPL and WPL provide electric utility service to a diversified base of retail customers in several industries, with the largest concentrations in the food manufacturing, chemical (including ethanol) and paper industries. IPL’s retail customers in the above table are billed under base rates established by the IUB or MPUC that include a return on investments in electric infrastructure and recovery of purchased electric capacity costs and other costs required to serve customers. Base rates charged to IPL’s Minnesota customers also include recovery of electric transmission service costs. Effective in the first quarter of 2011, electric transmission service expenses will be removed from base rates charged to IPL’s Iowa electric retail customers and billed separately through a transmission cost rider. IPL’s electric production fuel and energy purchases costs are recovered pursuant to fuel adjustment clauses. WPL’s retail customers in the above table are billed under base rates established by the PSCW that include a return on investments in electric infrastructure and recovery of electric production fuel and purchased energy costs, purchased electric capacity costs, electric transmission service costs and other costs required to serve customers. Effective in the first quarter of 2011, a new electric fuel cost recovery mechanism was implemented for utilities in Wisconsin that allows WPL to defer electric production fuel and energy purchases costs that exceed or fall below established fuel monitoring ranges.
Wholesale customers in the above table, which primarily consist of municipalities and rural electric cooperatives, are billed under wholesale service agreements. These agreements include standardized pricing mechanisms that are detailed in tariffs approved by FERC through wholesale rate case proceedings. A significant majority of IPL’s and WPL’s wholesale service agreements have terms that end after 2016.
In addition, IPL and WPL have bulk power customers, included in “Other customers” in the above table, that are billed according to negotiated, long-term customer-specific contracts, pursuant to FERC-approved tariffs.
Seasonality -Electric sales are seasonal to some extent with the annual peak normally occurring in the summer months due to air conditioning requirements. In 2010, the maximum peak hour demands were as follows:
| | | | | | |
| | | Alliant Energy | | IPL | | WPL |
MW | | 5,425 | | 2,963 | | 2,654 |
Date | | Aug. 11 | | July 27 | | Aug. 12 |
Competition -Retail electric customers in Iowa, Wisconsin and Minnesota currently do not have the ability to choose their electric supplier. However, IPL and WPL attempt to attract new customers into their service territories in an effort to keep energy rates low for all. Although electric service in Iowa, Wisconsin and Minnesota is regulated, IPL and WPL still face competition from self-generation by large industrial customers, alternative energy sources, and petitions to municipalize (Iowa) as well as service territory expansions by municipal utilities through annexations (Wisconsin). Refer to “Rate Matters - Proposed Changes to Rate Recovery Mechanisms - Economic Development Program” for discussion of the PSCW’s approval of an economic development program to attract and retain industrial customers in WPL’s service territory, which is currently being challenged by the Citizens Utility Board.
Renewable Energy Standards -
Iowa -Electric utilities in Iowa are required to purchase or own their proportionate share of 105 MW of capacity and associated energy from alternate energy or small hydro facilities located in the utilities’ service area. IPL’s proportionate share is approximately 50 MW. As of Dec. 31, 2010, IPL had met the requirements of this renewable energy standard.
Wisconsin -A Wisconsin Renewable Portfolio Standard (RPS) was established in 2006 that requires electric utilities in Wisconsin, including WPL, to increase the portion of their total Wisconsin retail electric sales supplied by renewable energy sources above a benchmark of average retail sales from renewables in 2001, 2002 and 2003. The RPS requires a 2% increase above the benchmark by 2010 and a 6% increase above the benchmark by 2015. Based on this RPS, WPL was required to supply a minimum of 6% of its total Wisconsin retail electric sales with renewable energy sources by 2010 and will be required to increase this amount to 10% by 2015. Wisconsin utilities may reach the RPS with renewable energy
8
generated by the utility, acquired under purchased power agreements (PPAs), or through the use of renewable resource credits. As of Dec. 31, 2010, WPL had met the requirements of this renewable energy standard for 2010.
Minnesota -A Minnesota Renewable Energy Standard (RES) was established in 2007 that requires electric utilities operating in Minnesota, including IPL, to supply a minimum level of their total Minnesota retail electric sales with renewable energy sources by certain future dates. Based on this RES, IPL’s total Minnesota retail electric sales supplied with renewable energy sources must be at least 12% by 2012; 17% by 2016; 20% by 2020; and 25% by 2025. Utilities in Minnesota may meet the requirements of the RES with renewable energy generated by the utility, renewable energy acquired under PPAs or the use of renewable resource credits.
Refer to “Strategic Overview - Generation Plans” in MDA for discussion of Alliant Energy’s generation plan, which includes additional supply from wind generation that contributed towards meeting renewable energy requirements discussed above.
Energy Conservation -IPL and WPL continue to promote energy conservation, including their customers’ ability to efficiently manage their energy use. Refer to “Strategic Overview - Energy Efficiency Programs” in MDA for discussion of current energy efficiency programs at IPL and WPL.
Electric Supply - Alliant Energy, IPL and WPL have met historical customer demand of electricity and expect to continue meeting future demand through internally generated electric supply, electric supply from long-term PPAs and additional electric supply purchases from wholesale energy markets. Alliant Energy’s mix of electric supply experienced changes in recent years with WPL’s purchase of the Neenah Energy Facility in 2009, the completion of IPL’s Whispering Willow - East wind project in late 2009 and the completion of WPL’s Bent Tree - Phase I wind project in early 2011. In addition, IPL retired various generating units in 2010, which are discussed in Note 1(e) of the “Combined Notes to Consolidated Financial Statements.” Alliant Energy expects its mix of electric supply to change further in the next few years with WPL’s anticipated purchases of Riverside and WEPCO’s 25% interest in Edgewater Unit 5 and the anticipated retirement of additional generating units at IPL. Alliant Energy, IPL and WPL periodically update their generation plans to identify longer term generation needs. These long-term generation plans are intended to meet customer demand, reduce reliance on PPAs and mitigate the impacts of future plant retirements while maintaining compliance with long-term electric demand planning reserve margins and renewable energy standards established by regulators. Alliant Energy, IPL and WPL currently expect to meet utility customer demand in the future. However, unanticipated regional or local reliability issues could still arise in the event of unexpected delays in the construction of new generating and/or transmission facilities, retirement of generating facilities, generating facility outages, transmission system outages or extended periods of extreme weather conditions. Refer to the “Electric Operating Information” tables for a profile of the sources of electric supply used to meet customer demand for Alliant Energy, IPL and WPL from 2006 to 2010. Refer to “Strategic Overview - Generation Plans” in MDA for details of Alliant Energy’s future generation plan.
Electric Demand Planning Reserve Margin (PRM) - IPL and WPL are required to maintain a PRM above their projected annual peak demand forecast to help ensure reliability of electric service to their customers. WPL is required to maintain a 14.5% PRM for long-term planning (planning years two through 10) and a PRM established by MISO for short-term planning. PRM requirements for IPL follow MISO’s reserve requirements. IPL and WPL currently have adequate capacity to meet the MISO PRM requirements.
Generation -IPL and WPL own a portfolio of electric generating facilities located in Iowa, Wisconsin and Minnesota with a diversified fuel mix including coal, natural gas and renewable resources. Refer to Item 2 Properties for details of IPL’s and WPL’s electric generating stations.
Generating Capacity - The generating capacity of IPL’s and WPL’s electric generating facilities is based upon MISO’s resource adequacy process, which uses the unforced capacity of the generating facilities. The generating capacity for the June 2010 to May 2011 planning period by fuel type in MWs was as follows:
| | | | | | | | | | | | |
| | | IPL | | | WPL | | | Total | |
Coal | | | 1,542 | | | | 1,231 | | | | 2,773 | |
Natural gas | | | 715 | | | | 582 | | | | 1,297 | |
Oil | | | 261 | | | | -- | | | | 261 | |
Wind (a) | | | -- | | | | 5 | | | | 5 | |
Hydro | | | -- | | | | 17 | | | | 17 | |
| | | | | | | | | | | | |
Total | | | 2,518 | | | | 1,835 | | | | 4,353 | |
| | | | | | | | | | | | |
9
| (a) | Represents 0% and 8% of the capacity of wind projects owned by IPL and WPL, respectively, based upon the MISO resource adequacy process, which is determined separately for each wind site, during the planning period from June 2010 to May 2011. As of Dec. 31, 2010, wind projects owned by Alliant Energy included IPL’s 200 MW Whispering Willow - East wind project in Franklin County, Iowa and WPL’s 68 MW Cedar Ridge wind project in Fond du Lac County, Wisconsin. WPL’s 200 MW Bent Tree - Phase I wind project in Freeborn County, Minnesota was completed in early 2011 and was not included in the June 2010 to May 2011 MISO planning period. |
Fuel Costs - The average cost of delivered fuel per million British Thermal Units used for electric generation was as follows:
| | | | | | | | | | | | | | | | | | | | | | | | |
| | | IPL | | | WPL | |
| | | 2010 | | | 2009 | | | 2008 | | | 2010 | | | 2009 | | | 2008 | |
All fuels | | | $2.17 | | | | $2.29 | | | | $2.09 | | | | $2.17 | | | | $2.13 | | | | $2.06 | |
Coal | | | 1.73 | | | | 1.56 | | | | 1.58 | | | | 2.06 | | | | 2.02 | | | | 1.93 | |
Natural gas (a) | | | 9.79 | | | | 13.31 | | | | 8.18 | | | | 12.83 | | | | 18.53 | | | | 8.64 | |
| (a) | The average cost of natural gas is impacted by gains and losses from swap contracts used to hedge the price of natural gas volumes expected to be used by Alliant Energy’s natural gas-fired electric generating facilities. |
Coal - Coal is the primary fuel source for Alliant Energy’s, IPL’s and WPL’s internally generated electric supply and generally represents approximately 50% to 55% of their total sources of electric energy. Alliant Energy, through Corporate Services as agent for IPL and WPL, has entered into contracts with different suppliers to help ensure that a specified supply of coal is available at known prices for IPL’s and WPL’s coal-fired generating facilities for 2011 through 2013. As of Dec. 31, 2010, existing contracts provide for a portfolio of coal supplies that cover approximately 78%, 17%, and 9% of Alliant Energy’s estimated coal supply needs for 2011, 2012 and 2013, respectively. Alliant Energy, IPL and WPL believe this portfolio of coal supplies represents a reasonable balance between the risks of insufficient supplies and those associated with being unable to respond to future coal market changes. Alliant Energy, IPL and WPL expect to meet remaining coal requirements from either future contracts or purchases in the spot market. Alliant Energy, through its subsidiaries Corporate Services, IPL and WPL, also enters into various coal transportation agreements to meet its coal supply requirements. As of Dec. 31, 2010, existing coal transportation agreements cover approximately 70%, 70%, 50% and 50% of Alliant Energy’s estimated coal transportation needs for 2011 through 2014, respectively.
The majority of the coal utilized by IPL and WPL is from the Wyoming Powder River Basin. A majority of this coal is transported by rail-car directly from Wyoming to IPL’s and WPL’s generating stations, with the remainder transported from Wyoming to the Mississippi River by rail-car and then via barges to the final destination. As protection against interruptions in coal deliveries, IPL and WPL strive to maintain average coal inventory supply targets of 25 to 50 days for generating stations with year-round deliveries and 30 to 150 days (depending upon the time of year) for generating stations with seasonal deliveries. Actual inventory averages for 2010 were 50 days for generating stations with year-round deliveries and 138 days for generating stations with seasonal deliveries. The average days on hand were computed based on actual tons of inventory divided by estimated average daily tons burned in 2010. Alliant Energy, IPL and WPL periodically test coal from sources other than the Wyoming Powder River Basin to determine which alternative sources of coal are most compatible with their generating stations. Access to alternative sources of coal is expected to provide Alliant Energy, IPL and WPL with further protection against interruptions and lessen their dependence on their primary coal source.
Average delivered fossil fuel costs are expected to increase in the future due to price structures and adjustment provisions in existing coal contracts, rate structures and adjustment provisions in existing transportation contracts, fuel-related surcharges incorporated by transportation carriers and recent coal and transportation market trends. Existing coal commodity contracts with terms of greater than one year have fixed future year prices that generally reflect recent market trends. A few of Alliant Energy’s existing coal contracts have provisions for price adjustments should specific indices change. Rate adjustment provisions in older transportation contracts are primarily based on changes in the Rail Cost Adjustment Factor as published by the U.S. Surface Transportation Board. Rate adjustment provisions in more recent transportation contracts are based on changes in the All Inclusive Index Less Fuel as published by the Association of American Railroads. These more recent transportation contracts also contain fuel surcharges that are subject to change monthly based on changes in diesel fuel prices. Other factors that may impact coal prices for future commitments are increasing costs for supplier mineral rights, increasing costs to mine the coal and changes in various associated laws and regulations. For example, emission restrictions related to sulfur dioxide (SO2), nitrogen oxide (NOx) and mercury, along with other environmental limitations on generating stations, continue to increase and will likely limit the ability to obtain, and further increase the cost of, adequate coal supplies. Factors that may impact future transportation rates include, but are not limited to: the need for railroads to enhance/expand infrastructure for demand growth, corresponding investments in locomotives and the desire to improve margins on coal movements commensurate with margins on non-coal movements.
10
Given their current coal procurement process, the specific coal market in their primary purchase region and regulatory cost-recovery mechanisms, Alliant Energy, IPL and WPL believe they are reasonably insulated against coal price volatility. Alliant Energy’s coal procurement process stresses periodic purchases, staggering of contract terms, stair-stepped levels of supply going forward for multiple years and supplier diversity. Similarly, given the term lengths of its transportation agreements, Alliant Energy, IPL and WPL believes they are reasonably insulated against future higher coal transportation rates from the major railroads.
Natural Gas - Alliant Energy owns several natural gas-fired generating facilities including IPL’s 565 MW Emery Generating Station, WPL’s 300 MW Neenah Energy Facility and Resources’ 300 MW Sheboygan Falls Energy Facility. WPL has exclusive rights to the output of the Sheboygan Falls Energy Facility under an affiliated lease agreement. These facilities help meet customer demand for electricity generally during peak hour demands. Internally generated electric supply from natural gas-fired generating facilities generally represent less than 5% of Alliant Energy’s, IPL’s and WPL’s total sources of electric energy.
Alliant Energy has responsibility to supply natural gas to the generating facilities it owns as well as Riverside, which WPL has rights to under a PPA. WPL has contracted with ANR Pipeline to provide firm pipeline transportation of 60,000 dekatherms (Dths) per day for Riverside and 2 million Dths of storage capacity for WPL’s natural gas-fired generating facilities.
Nuclear - In 2006, IPL sold its interest in the Duane Arnold Energy Center (DAEC) to a subsidiary of NextEra Energy, Inc. (NextEra) and upon closing of the sale entered into a PPA with NextEra to purchase energy and capacity from DAEC through February 2014. In 2005, WPL sold its interest in the Kewaunee Nuclear Power Plant (Kewaunee) to a subsidiary of Dominion Resources, Inc. (Dominion) and upon closing of the sale entered into a long-term PPA with Dominion to purchase energy and capacity from Kewaunee through December 2013. As a result of these transactions, Alliant Energy, IPL and WPL no longer have ownership interests in any nuclear generating facilities. Alliant Energy, IPL and WPL entered into these transactions to reduce the financial and operational uncertainty associated with nuclear generating facility ownership and operations while still retaining the benefit of the output from such nuclear generating facilities.
Wind - IPL’s 200 MW Whispering Willow - East wind project in Franklin County, Iowa began generating electricity in 2009. WPL’s 68 MW Cedar Ridge wind project in Fond du Lac County, Wisconsin began generating electricity in 2008. WPL’s 200 MW Bent Tree - Phase I wind project in Freeborn County, Minnesota began full generating electricity in early 2011. These wind projects are the first fully owned and operated wind projects for IPL and WPL.
Purchased Power - IPL and WPL enter into PPAs and purchase electricity from wholesale energy markets to meet a portion of their customer demand for electricity. Purchased power represented almost 45% of Alliant Energy’s, IPL’s and WPL’s total sources of electric energy in 2010. IPL’s most significant PPA is with NextEra for the purchase of energy and capacity from DAEC through February 2014. WPL’s most significant PPAs are with Dominion for the purchase of energy and capacity from Kewaunee through December 2013 and with a subsidiary of Calpine Corporation for the purchase of energy and capacity from Riverside through May 2013.
Refer to Note 1(h) for discussion of IPL’s and WPL’s rate recovery of electric production fuel and purchased energy costs, Note 3(a) for details regarding PPAs accounted for as operating leases and Note 12(b) for details on IPL’s and WPL’s coal, natural gas and other purchased power commitments in the “Combined Notes to Consolidated Financial Statements.”
Electric Transmission-
IPL - IPL completed the sale of its electric transmission assets located in Iowa, Minnesota and Illinois to ITC in 2007. IPL sold its electric transmission assets in order to monetize the value of the assets to help fund future capital expenditures, to capture tax benefits under federal tax policy that allowed deferral of gains on sales of qualifying electric transmission assets completed prior to Jan. 1, 2008 (based on regulations at the time of the sale) and to promote regional transmission expansion that is expected to improve transmission reliability and access for its customers in Iowa and Minnesota. ITC is an independent for-profit, transmission-only company and is a transmission-owning member of the MISO RTO, MRO and Reliability First Corporation Regional Entities. ITC has transmission interconnections at various locations with other transmission owning utilities in the Midwest. These interconnections enhance the overall reliability of the IPL delivery system and provide access to multiple sources of economic and emergency energy. IPL currently receives substantially all its transmission services from ITC. The annual transmission service rates that ITC charge its customers is calculated each calendar year using a FERC-approved cost of service formula rate template referred to as Attachment “O.” Refer to “Other Matters - Other Future Considerations - Electric Transmission Service Charges” in MDA for additional information
11
regarding transmission services charges from ITC. Refer to “Rate Matters - Recent Retail Base Rate Filings - IPL’s Iowa Retail Electric Rate Case (2009 Test Year)” for discussion of a new transmission cost rider for recovery of electric transmission service expenses approved by the IUB in January 2011.
WPL - WPL transferred its transmission assets to ATC in 2001 in exchange for an ownership interest in ATC. As of Dec. 31, 2010, WPL held a 16% ownership interest in ATC with a carrying value of $228 million. WPL currently anticipates making capital contributions of $5 million, $5 million and $2 million to ATC in 2011, 2012 and 2013, respectively, to maintain its current ownership percentage. During 2010, ATC distributed to WPL, in the form of dividends, $31 million or approximately 80% of WPL’s equity earnings from ATC. Although no assurance can be given, WPL anticipates ATC will continue this dividend payout ratio in the future. ATC is an independent for-profit, transmission-only company and is a transmission-owning member of the MISO RTO, MRO and Reliability First Corporation Regional Entities. ATC has transmission interconnections with various other transmission owning utilities in the Midwest. These interconnections enhance the overall reliability of the WPL delivery system and provide access to multiple sources of economic and emergency energy. WPL currently receives substantially all its transmission services from ATC. Refer to Note 20 of the “Combined Notes to Consolidated Financial Statements” for details of agreements between ATC and WPL.
MISO Markets - IPL and WPL are members of MISO, a FERC-approved RTO, which is responsible for monitoring and ensuring equal access to the transmission system in their service territories. IPL and WPL participate in the wholesale energy market and ancillary services markets operated by MISO, which are discussed in more detail below. IPL and WPL are parties to a system coordination and operating agreement whereby Corporate Services serves as agent on behalf of IPL and WPL. The agreement, which has been approved by FERC, provides a contractual basis for coordinated planning, construction, operation and maintenance of the interconnected electric generation systems of IPL and WPL. As agent of the agreement, Corporate Services enters into energy, capacity, ancillary services, and transmission service sale and purchase transactions. Corporate Services allocates such sales and purchases among IPL and WPL based on procedures included in the agreement. The procedures were approved by FERC and all state regulatory bodies having jurisdiction. Refer to Note 20 of the “Notes to Consolidated Financial Statements” for additional discussion of these allocated amounts.
Wholesale Energy Market -IPL and WPL began participation in the wholesale energy market operated by MISO in 2005. The market impacts the way IPL and WPL buy and sell wholesale electricity, obtain transmission services, schedule generation and ensure resource adequacy to reliably serve load. In the market, IPL and WPL submit day-ahead and/or real-time bids and offers for energy at locations across the MISO region. MISO evaluates IPL’s, WPL’s and other market participants’ offers, bids and energy injections into, and withdrawals from, the system to economically dispatch the entire MISO system on an hourly basis. MISO settles these hourly offers and bids based on locational marginal prices, which are market-driven values based on the specific time and location of the purchase and/or sale of energy. The market is intended to send price signals to stakeholders where generation or transmission system expansion is needed. This market-based approach is expected to result in lower overall costs in areas with abundant transmission capacity. In addition, MISO may dispatch generators that support reliability needs, but that would not have operated based on economic needs. In these cases, MISO’s settlement assures that these generators are made whole financially for their variable costs. IPL and WPL also periodically engage in related transactions in PJM’s bid/offer-based wholesale energy market, which are accounted for similar to the MISO transactions.
Financial Transmission Rights (FTRs) and Auction Revenue Rights (ARRs) - In areas of constrained transmission capacity, such as Wisconsin, costs could be higher due to congestion and their impact on locational marginal prices. As part of the MISO market restructuring in 2005, physical transmission rights of IPL and WPL were replaced with FTRs. FTRs provide a hedge for congestion costs that occur in the MISO day-ahead energy market. Both IPL and WPL are allocated ARRs from MISO each year based on historical use of the transmission system. The revenue rights associated with these ARRs are used by IPL and WPL to acquire FTRs through the FTR auctions operated by MISO. IPL’s and WPL’s current FTRs acquired from ARRs extend through May 31, 2011. MISO re-allocates ARRs annually based on a fiscal year from June 1 through May 31. Based on the FTRs awarded to IPL and WPL to-date and future expected allocations of ARRs, along with the expected regulatory recovery treatment of MISO costs, the financial impacts associated with FTRs have not differed significantly from the financial impacts associated with physical transmission rights that existed prior to the MISO wholesale energy market.
Ancillary Services Market - In 2009, MISO launched an ancillary services market, which integrates the procurement and use of regulation and contingency reserves with the existing wholesale energy market implemented in 2005. Regulation refers to the moment-to-moment changes in generation that are necessary to meet changes in electricity demand. Contingency reserves refer to additional generation or demand response resources, either on-line or that can be brought on-
12
line within 10 minutes, to meet certain major events such as the loss of a large generating unit or transmission line. MISO plans to address refinements to its ancillary services market in 2011.
MISO and PJM Market Flow Corrections - In 2009, MISO and PJM disclosed an error in the calculation of market flow data between the two independent system operators that began in 2005. The error resulted in incorrect payments between MISO and PJM during 2005 through 2009. Because IPL and WPL participated in both the MISO and PJM markets during the period of the error, IPL and WPL may have been entitled to refunds or may have been required to make additional payments to the two independent system operators. In 2010, MISO and PJM filed complaints against each other with FERC. In January 2011, MISO and PJM filed a settlement, which is pending final FERC approval. Under the proposed settlement, payments would not be exchanged between MISO and PJM. Instead, process changes would be established, including a baseline review of market-to-market processes and accounting, establishment of a change management process regarding the same biennial review of process changes, and enhanced access to pertinent data enabling independent verification of calculations related to settlements. Future market-to-market billing adjustment claims would be limited to one year before the error is discovered compared to the current two-year limitation.
Electric Environmental Matters -Alliant Energy, IPL and WPL are subject to environmental regulations issued by federal, state and local agencies. Such regulations are the result of a number of environmental laws passed by the U.S. Congress, state legislatures and local governments and enforced by federal, state and local regulatory agencies. The laws impacting Alliant Energy’s, IPL’s and WPL’s electric operations include, but are not limited to, the Safe Drinking Water Act; Clean Water Act; Clean Air Act (CAA); National Environmental Policy Act of 1969; Toxic Substances Control Act; Resource Conservation and Recovery Act; Comprehensive Environmental Response, Compensation and Liability Act of 1980, as amended by the Superfund Amendments and Reauthorization Act and Emergency Planning and Community Right-to-Know Act of 1986; Endangered Species Act; Occupational Safety and Health Act; National Energy Policy Act, as amended; Federal Insecticide, Fungicide and Rodenticide Act; Hazardous Materials Transportation Act; Pollution Prevention Act; and Department of Homeland Security Appropriations Act. Alliant Energy, IPL and WPL regularly obtain federal, state and local permits to assure compliance with environmental protection laws and regulations. Costs associated with such compliance have increased in recent years and are expected to continue to increase in the future. Alliant Energy, IPL and WPL anticipate these prudently incurred costs for IPL and WPL will be recoverable through future rate case proceedings. Refer to “Environmental Matters” in MDA and Note 12(e) of the “Combined Notes to Consolidated Financial Statements” for further discussion of electric environmental matters including current or proposed environmental regulations under the Clean Air Interstate Rule, Proposed Clean Air Transport Rule, Clean Air Visibility Rule, Utility Maximum Achievable Control Technology (MACT) Rule, Wisconsin State Mercury Rule, Wisconsin Reasonably Available Control Technology Rule, Ozone National Ambient Air Quality Standard (NAAQS) Rule, Fine Particle NAAQS Rule, Nitrogen Dioxide NAAQS Rule, SO2 NAAQS Rule, Industrial Boiler and Process Heater MACT Rule, Emission Standards for Internal Combustion Engines, Federal Clean Water Act including Section 316(b), Wisconsin State Thermal Rule, Hydroelectric Fish Passages and Fish Protective Devices, Coal Combustion Residuals, Polychlorinated Biphenyls and various legislation and EPA regulations to monitor and regulate the emission of GHG including the Mandatory GHG Reporting Rule, New Source Performance Standard for GHG Emissions from Electric Utilities and GHG Tailoring Rule. Refer to “Strategic Overview - Environmental Compliance Plans” in MDA for details of Alliant Energy’s, IPL’s and WPL’s future environmental compliance plans to adhere to environmental regulations.
13
Alliant Energy Corporation
| | | | | | | | | | | | | | | | | | |
| |
| Electric Operating Information | | 2010 | | | 2009 | | | 2008 | | | 2007 | | | 2006 |
| |
Operating Revenues (in millions) (a): | | | | | | | | | | | | | | | | | | |
Residential | | | $1,001.5 | | | | $868.6 | | | | $844.7 | | | | $847.5 | | | $857.1 |
Commercial | | | 619.0 | | | | 556.8 | | | | 537.5 | | | | 535.2 | | | 549.8 |
Industrial | | | 762.8 | | | | 710.7 | | | | 734.7 | | | | 731.9 | | | 763.7 |
| | | |
Retail subtotal | | | 2,383.3 | | | | 2,136.1 | | | | 2,116.9 | | | | 2,114.6 | | | 2,170.6 |
Sales for resale: | | | | | | | | | | | | | | | | | | |
Wholesale | | | 196.8 | | | | 190.1 | | | | 201.9 | | | | 179.8 | | | 145.2 |
Bulk power and other | | | 44.1 | | | | 98.3 | | | | 31.1 | | | | 56.7 | | | 68.5 |
Other (includes wheeling) | | | 50.0 | | | | 51.4 | | | | 61.4 | | | | 59.7 | | | 58.7 |
| | | |
Total | | | $2,674.2 | | | | $2,475.9 | | | | $2,411.3 | | | | $2,410.8 | | | $2,443.0 |
| | | |
| | | | |
Electric Sales (000s megawatt-hours (MWh)) (a): | | | | | | | | | | | | | | | | | | |
Residential | | | 7,836 | | | | 7,532 | | | | 7,664 | | | | 7,753 | | | 7,670 |
Commercial | | | 6,219 | | | | 6,108 | | | | 6,181 | | | | 6,222 | | | 6,187 |
Industrial | | | 11,213 | | | | 10,948 | | | | 12,490 | | | | 12,692 | | | 12,808 |
| | | |
Retail subtotal | | | 25,268 | | | | 24,588 | | | | 26,335 | | | | 26,667 | | | 26,665 |
Sales for resale: | | | | | | | | | | | | | | | | | | |
Wholesale | | | 3,325 | | | | 3,251 | | | | 3,813 | | | | 3,547 | | | 3,064 |
Bulk power and other | | | 1,378 | | | | 2,583 | | | | 983 | | | | 2,550 | | | 2,632 |
Other | | | 153 | | | | 155 | | | | 164 | | | | 167 | | | 171 |
| | | |
Total | | | 30,124 | | | | 30,577 | | | | 31,295 | | | | 32,931 | | | 32,532 |
| | | |
| | | | |
Customers (End of Period) (a): | | | | | | | | | | | | | | | | | | |
Residential | | | 841,726 | | | | 840,927 | | | | 840,644 | | | | 840,122 | | | 855,948 |
Commercial | | | 135,832 | | | | 135,099 | | | | 134,536 | | | | 134,235 | | | 135,822 |
Industrial | | | 2,875 | | | | 2,881 | | | | 2,934 | | | | 2,964 | | | 3,064 |
Other | | | 3,632 | | | | 3,555 | | | | 3,534 | | | | 3,529 | | | 3,391 |
| | | |
Total | | | 984,065 | | | | 982,462 | | | | 981,648 | | | | 980,850 | | | 998,225 |
| | | |
| | | | |
Other Selected Electric Data: | | | | | | | | | | | | | | | | | | |
Maximum peak hour demand (MW) | | | 5,425 | | | | 5,491 | | | | 5,491 | | | | 5,751 | | | 5,989 |
Cooling degree days (b): | | | | | | | | | | | | | | | | | | |
Cedar Rapids, Iowa (IPL) (normal - 754) | | | 923 | | | | 406 | | | | 583 | | | | 846 | | | 765 |
Madison, Wisconsin (WPL) (normal - 623) | | | 829 | | | | 368 | | | | 538 | | | | 781 | | | 637 |
Sources of electric energy (000s MWh): | | | | | | | | | | | | | | | | | | |
Coal | | | 16,366 | | | | 15,321 | | | | 17,495 | | | | 18,643 | | | 17,578 |
Purchased power: | | | | | | | | | | | | | | | | | | |
Nuclear | | | 5,667 | | | | 5,428 | | | | 5,465 | | | | 5,103 | | | 5,128 |
Wind | | | 1,254 | | | | 957 | | | | 853 | | | | 872 | | | 840 |
Other | | | 6,260 | | | | 8,585 | | | | 7,013 | | | | 7,426 | | | 8,088 |
Gas | | | 633 | | | | 661 | | | | 1,037 | | | | 1,894 | | | 1,541 |
Wind | | | 588 | | | | 222 | | | | 30 | | | | - | | | - |
Other | | | 232 | | | | 180 | | | | 215 | | | | 309 | | | 527 |
| | | |
Total | | | 31,000 | | | | 31,354 | | | | 32,108 | | | | 34,247 | | | 33,702 |
| | | |
Revenue per kilowatt-hour (KWh) sold to retail customers (cents) | | | 9.43 | | | | 8.69 | | | | 8.04 | | | | 7.93 | | | 8.14 |
| |
| (a) | In February 2007, Alliant Energy sold its electric distribution properties in Illinois. At the date of the sale, Alliant Energy had approximately 22,000 electric retail customers in Illinois. Prior to the asset sales, the electric sales to retail customers in Illinois are included in residential, commercial and industrial sales in the tables above. Following the asset sales, any electric sales associated with these customers are included in wholesale electric sales. |
| (b) | Cooling degree days are calculated using a simple average of the high and low temperatures each day compared to a 65 degree base. Normal degree days are calculated using a rolling 20-year average of historical cooling degree days. |
14
Interstate Power and Light Company
| | | | | | | | | | | | | | | | | | |
| |
| Electric Operating Information | | 2010 | | | 2009 | | | 2008 | | | 2007 | | | 2006 |
| |
Operating Revenues (in millions) (a): | | | | | | | | | | | | | | | | | | |
Residential | | | $561.9 | | | | $478.9 | | | | $455.2 | | | | $451.2 | | | $471.2 |
Commercial | | | 378.7 | | | | 336.8 | | | | 319.4 | | | | 316.2 | | | 337.4 |
Industrial | | | 441.9 | | | | 412.5 | | | | 407.0 | | | | 402.0 | | | 440.7 |
| | | |
Retail subtotal | | | 1,382.5 | | | | 1,228.2 | | | | 1,181.6 | | | | 1,169.4 | | | 1,249.3 |
Sales for resale: | | | | | | | | | | | | | | | | | | |
Wholesale | | | 29.8 | | | | 23.5 | | | | 23.4 | | | | 21.3 | | | 1.9 |
Bulk power and other | | | 23.5 | | | | 37.3 | | | | 21.1 | | | | 42.2 | | | 47.8 |
Other (includes wheeling) | | | 28.5 | | | | 26.6 | | | | 32.2 | | | | 37.2 | | | 32.6 |
| | | |
Total | | | $1,464.3 | | | | $1,315.6 | | | | $1,258.3 | | | | $1,270.1 | | | $1,331.6 |
| | | |
| | | | |
Electric Sales (000s MWh) (a): | | | | | | | | | | | | | | | | | | |
Residential | | | 4,295 | | | | 4,113 | | | | 4,218 | | | | 4,204 | | | 4,157 |
Commercial | | | 3,944 | | | | 3,851 | | | | 3,911 | | | | 3,912 | | | 3,910 |
Industrial | | | 6,961 | | | | 6,829 | | | | 7,742 | | | | 7,750 | | | 7,860 |
| | | |
Retail subtotal | | | 15,200 | | | | 14,793 | | | | 15,871 | | | | 15,866 | | | 15,927 |
Sales for resale: | | | | | | | | | | | | | | | | | | |
Wholesale | | | 425 | | | | 403 | | | | 449 | | | | 406 | | | 35 |
Bulk power and other | | | 683 | | | | 901 | | | | 682 | | | | 1,581 | | | 1,550 |
Other | | | 83 | | | | 84 | | | | 90 | | | | 93 | | | 99 |
| | | |
Total | | | 16,391 | | | | 16,181 | | | | 17,092 | | | | 17,946 | | | 17,611 |
| | | |
| | | | |
Customers (End of Period) (a): | | | | | | | | | | | | | | | | | | |
Residential | | | 443,694 | | | | 443,615 | | | | 443,589 | | | | 444,974 | | | 455,346 |
Commercial | | | 80,063 | | | | 79,805 | | | | 79,508 | | | | 79,473 | | | 81,045 |
Industrial | | | 1,900 | | | | 1,914 | | | | 1,939 | | | | 1,954 | | | 2,018 |
Other | | | 1,366 | | | | 1,376 | | | | 1,381 | | | | 1,398 | | | 1,299 |
| | | |
Total | | | 527,023 | | | | 526,710 | | | | 526,417 | | | | 527,799 | | | 539,708 |
| | | |
| | | | |
Other Selected Electric Data: | | | | | | | | | | | | | | | | | | |
Maximum peak hour demand (MW) | | | 2,963 | | | | 2,981 | | | | 2,943 | | | | 3,085 | | | 3,070 |
Cooling degree days (b): | | | | | | | | | | | | | | | | | | |
Cedar Rapids, Iowa (normal - 754) | | | 923 | | | | 406 | | | | 583 | | | | 846 | | | 765 |
Sources of electric energy (000s MWh): | | | | | | | | | | | | | | | | | | |
Coal | | | 8,663 | | | | 8,162 | | | | 9,517 | | | | 10,547 | | | 9,919 |
Purchased power: | | | | | | | | | | | | | | | | | | |
Nuclear | | | 3,623 | | | | 3,577 | | | | 3,619 | | | | 3,066 | | | 3,297 |
Wind | | | 606 | | | | 571 | | | | 616 | | | | 656 | | | 644 |
Other | | | 3,014 | | | | 3,744 | | | | 2,538 | | | | 2,445 | | | 3,099 |
Gas | | | 578 | | | | 636 | | | | 983 | | | | 1,778 | | | 1,426 |
Wind | | | 353 | | | | 42 | | | | - | | | | - | | | - |
Other | | | 22 | | | | 16 | | | | 23 | | | | 127 | | | 344 |
| | | |
Total | | | 16,859 | | | | 16,748 | | | | 17,296 | | | | 18,619 | | | 18,729 |
| | | |
| | | | | |
Revenue per KWh sold to retail customers (cents) | | | 9.10 | | | | 8.30 | | | | 7.45 | | | | 7.37 | | | 7.84 |
| |
| (a) | In February 2007, IPL sold its electric distribution properties in Illinois. At the date of the sale, IPL had approximately 13,000 electric retail customers in Illinois. Prior to the asset sale, the electric sales to retail customers in Illinois are included in residential, commercial and industrial sales in the tables above. Following the asset sale, any electric sales associated with these customers are included in wholesale electric sales. |
| (b) | Cooling degree days are calculated using a simple average of the high and low temperatures each day compared to a 65 degree base. Normal degree days are calculated using a rolling 20-year average of historical cooling degree days. |
15
Wisconsin Power and Light Company
| | | | | | | | | | | | | | | | | | |
| |
| Electric Operating Information | | 2010 | | | 2009 | | | 2008 | | | 2007 | | | 2006 |
| |
Operating Revenues (in millions) (a): | | | | | | | | | | | | | | | | | | |
Residential | | | $439.6 | | | | $389.7 | | | | $389.5 | | | | $396.3 | | | $385.9 |
Commercial | | | 240.3 | | | | 220.0 | | | | 218.1 | | | | 219.0 | | | 212.4 |
Industrial | | | 320.9 | | | | 298.2 | | | | 327.7 | | | | 329.9 | | | 323.0 |
| | | |
Retail subtotal | | | 1,000.8 | | | | 907.9 | | | | 935.3 | | | | 945.2 | | | 921.3 |
Sales for resale: | | | | | | | | | | | | | | | | | | |
Wholesale | | | 167.0 | | | | 166.6 | | | | 178.5 | | | | 158.5 | | | 143.3 |
Bulk power and other | | | 20.6 | | | | 61.0 | | | | 10.0 | | | | 14.5 | | | 20.7 |
Other | | | 21.5 | | | | 24.8 | | | | 29.2 | | | | 22.5 | | | 26.1 |
| | | |
Total | | | $1,209.9 | | | | $1,160.3 | | | | $1,153.0 | | | | $1,140.7 | | | $1,111.4 |
| | | |
| | | | | | | | | | | | | | | | | | | |
Electric Sales (000s MWh) (a): | | | | | | | | | | | | | | | | | | |
Residential | | | 3,541 | | | | 3,419 | | | | 3,446 | | | | 3,549 | | | 3,513 |
Commercial | | | 2,275 | | | | 2,257 | | | | 2,270 | | | | 2,310 | | | 2,277 |
Industrial | | | 4,252 | | | | 4,119 | | | | 4,748 | | | | 4,942 | | | 4,948 |
| | | |
Retail subtotal | | | 10,068 | | | | 9,795 | | | | 10,464 | | | | 10,801 | | | 10,738 |
Sales for resale: | | | | | | | | | | | | | | | | | | |
Wholesale | | | 2,900 | | | | 2,848 | | | | 3,364 | | | | 3,141 | | | 3,029 |
Bulk power and other | | | 695 | | | | 1,682 | | | | 301 | | | | 969 | | | 1,082 |
Other | | | 70 | | | | 71 | | | | 74 | | | | 74 | | | 72 |
| | | |
Total | | | 13,733 | | | | 14,396 | | | | 14,203 | | | | 14,985 | | | 14,921 |
| | | |
| | | | |
Customers (End of Period) (a): | | | | | | | | | | | | | | | | | | |
Residential | | | 398,032 | | | | 397,312 | | | | 397,055 | | | | 395,148 | | | 400,602 |
Commercial | | | 55,769 | | | | 55,294 | | | | 55,028 | | | | 54,762 | | | 54,777 |
Industrial | | | 975 | | | | 967 | | | | 995 | | | | 1,010 | | | 1,046 |
Other | | | 2,266 | | | | 2,179 | | | | 2,153 | | | | 2,131 | | | 2,092 |
| | | |
Total | | | 457,042 | | | | 455,752 | | | | 455,231 | | | | 453,051 | | | 458,517 |
| | | |
| | | | |
Other Selected Electric Data: | | | | | | | | | | | | | | | | | | |
Maximum peak hour demand (MW) | | | 2,654 | | | | 2,558 | | | | 2,583 | | | | 2,816 | | | 2,941 |
Cooling degree days (b): | | | | | | | | | | | | | | | | | | |
Madison, Wisconsin (normal - 623) | | | 829 | | | | 368 | | | | 538 | | | | 781 | | | 637 |
Sources of electric energy (000s MWh): | | | | | | | | | | | | | | | | | | |
Coal | | | 7,703 | | | | 7,159 | | | | 7,978 | | | | 8,096 | | | 7,659 |
Purchased power: | | | | | | | | | | | | | | | | | | |
Nuclear | | | 2,044 | | | | 1,851 | | | | 1,846 | | | | 2,037 | | | 1,831 |
Wind | | | 648 | | | | 386 | | | | 237 | | | | 216 | | | 196 |
Other | | | 3,246 | | | | 4,841 | | | | 4,475 | | | | 4,981 | | | 4,989 |
Gas | | | 55 | | | | 25 | | | | 54 | | | | 116 | | | 115 |
Wind | | | 235 | | | | 180 | | | | 30 | | | | - | | | - |
Other | | | 210 | | | | 164 | | | | 192 | | | | 182 | | | 183 |
| | | |
Total | | | 14,141 | | | | 14,606 | | | | 14,812 | | | | 15,628 | | | 14,973 |
| | | |
| | | | | |
Revenue per KWh sold to retail customers (cents) | | | 9.94 | | | | 9.27 | | | | 8.94 | | | | 8.75 | | | 8.58 |
| |
| (a) | In February 2007, WPL sold its electric distribution properties in Illinois. At the date of the sale, WPL had approximately 9,000 electric retail customers in Illinois. Prior to the asset sale, the electric sales to retail customers in Illinois are included in residential, commercial and industrial sales in the tables above. Following the asset sale, any electric sales associated with these customers are included in wholesale electric sales. |
| (b) | Cooling degree days are calculated using a simple average of the high and low temperatures each day compared to a 65 degree base. Normal degree days are calculated using a rolling 20-year average of historical cooling degree days. |
16
2) GAS UTILITY OPERATIONS
General - Gas utility operations represent the second largest operating segment for Alliant Energy, IPL and WPL. Alliant Energy’s gas utility operations are located in the Midwest with IPL and WPL providing gas service in Iowa, southern and central Wisconsin and southern Minnesota. Refer to the “Gas Operating Information” tables for additional details regarding gas utility operations.
Jurisdictions -Gas utility revenues by state were as follows (dollars in millions):
| | | | | | | | | | | | |
| | | 2010 | | 2009 | | 2008 |
| | | Amount | | Percent | | Amount | | Percent | | Amount | | Percent |
IPL: | | | | | | | | | | | | |
Iowa | | $261.5 | | 54% | | $295.2 | | 56% | | $390.4 | | 55% |
Minnesota | | 12.8 | | 3% | | 13.6 | | 3% | | 20.0 | | 3% |
| | | | | | | | | | | | |
Subtotal | | 274.3 | | 57% | | 308.8 | | 59% | | 410.4 | | 58% |
| | | | | | | | | | | | |
WPL: | | | | | | | | | | | | |
Wisconsin | | 206.3 | | 43% | | 216.5 | | 41% | | 300.0 | | 42% |
| | | | | | | | | | | | |
| | $480.6 | | 100% | | $525.3 | | 100% | | $710.4 | | 100% |
| | | | | | | | | | | | |
Customers -The number of gas customers and communities served at Dec. 31, 2010 were as follows:
| | | | | | | | |
| | | Retail | | Transportation / | | Total | | Communities |
| | | Customers | | Other Customers | | Customers | | Served |
IPL | | 233,792 | | 249 | | 234,041 | | 243 |
WPL | | 178,570 | | 226 | | 178,796 | | 237 |
| | | | | | | | |
| | 412,362 | | 475 | | 412,837 | | 480 |
| | | | | | | | |
IPL’s and WPL’s retail customers in the above table are billed under base rates established by the IUB, MPUC or PSCW that include a return on investments in gas infrastructure and recovery of costs required to serve customers. Commodity, storage and transportation costs incurred by IPL and WPL are recovered pursuant to natural gas cost recovery mechanisms. In addition to sales of natural gas to retail customers, IPL and WPL provide transportation service to commercial and industrial customers by moving customer-owned gas through Alliant Energy’s distribution systems to the customers’ meters. Revenues are collected for this service pursuant to transportation tariffs.
Seasonality -Gas sales follow a seasonal pattern with an annual base-load of gas and a large heating peak occurring during the winter season. Natural gas obtained from producers, marketers and brokers, as well as gas in storage, is utilized to meet the peak heating season requirements. Storage contracts allow IPL and WPL to purchase gas in the summer, store the gas in underground storage fields and deliver it in the winter.
Competition - Federal and state regulatory policies are in place to bring more competition to the gas industry. While the gas utility distribution function is expected to remain a regulated function, sales of the natural gas commodity and related services are subject to competition from third parties. It remains uncertain if, and when, the current economic disincentives for smaller consumption customers to choose an alternative gas commodity supplier may be removed such that the utility business begins to face competition for the sale of gas to those customers.
Gas Supply - IPL and WPL maintain purchase agreements with over 60 suppliers of natural gas from various gas producing regions of the U.S. and Canada. The majority of the gas supply contracts are for terms of six months or less, with the remaining supply contracts having terms through March 2013. IPL’s and WPL’s gas supply commitments are primarily market-based.
In providing gas commodity service to retail customers, Corporate Services administers a diversified portfolio of transportation and storage contracts on behalf of IPL and WPL. Transportation contracts with Northern Natural Gas Company (NNG), ANR Pipeline (ANR), Natural Gas Pipeline Co. of America (NGPL), Northern Border Pipeline (NBPL) and Guardian Pipeline (Guardian) allow access to gas supplies located in the U.S. and Canada. Arrangements with Firm Citygate Supplies (FCS) provide IPL with gas delivered directly to its service territory. In 2010, the maximum daily delivery capacity for IPL and WPL was as follows (in Dths):
17
| | | | | | | | | | | | | | |
| | | NNG | | ANR | | NGPL | | FCS | | NBPL | | Guardian | | Total |
IPL | | 191,969 | | 53,180 | | 42,618 | | 15,000 | | 14,085 | | -- | | 316,852 |
WPL | | 76,056 | | 167,467 | | -- | | -- | | -- | | 10,000 | | 253,523 |
FERC Investigation of Pipeline Tariffs - In 2009, FERC initiated proceedings to investigate the rates of return that NNG, Great Lakes Pipeline and NGPL earned in 2008. FERC used data from annual filings made by interstate pipelines to estimate the rate of return that all U.S. pipelines earned in 2008 and concluded that these three pipelines may have earned rates of return exceeding 20%. In 2010, settlements were reached in all three FERC investigations, resulting in no impact to WPL and an immaterial impact to IPL that was passed on to its customers through IPL’s natural gas cost recovery mechanism.
Refer to Note 1(h) for information relating to utility natural gas cost recovery mechanisms and Note 12(b) for discussion of natural gas commitments in the “Combined Notes to Consolidated Financial Statements.”
Gas Environmental Matters - Alliant Energy is subject to environmental regulations by federal, state and local agencies. Such regulations are the result of a number of environmental laws passed by the U.S. Congress, state legislatures and local governments and enforced by federal, state and local regulatory agencies. The laws impacting Alliant Energy’s gas operations include, but are not limited to, the Safe Drinking Water Act; Clean Water Act; National Environmental Policy Act of 1969; Toxic Substances Control Act; Resource Conservation and Recovery Act; Comprehensive Environmental Response, Compensation and Liability Act of 1980, as amended by the Superfund Amendments and Reauthorization Act and Emergency Planning and Community Right-to-Know Act of 1986; Endangered Species Act; Occupational Safety and Health Act; National Energy Policy Act, as amended; Federal Insecticide, Fungicide and Rodenticide Act; Hazardous Materials Transportation Act; Pollution Prevention Act, and Department of Homeland Security Appropriations Act. Alliant Energy regularly obtains federal, state and local permits to assure compliance with environmental protection laws and regulations. Costs associated with such compliance have increased in recent years and are expected to continue to increase in the future. Alliant Energy anticipates these prudently incurred costs for IPL and WPL will be recoverable through future rate case proceedings. Refer to Note 12(e) of the “Combined Notes to Consolidated Financial Statements” for discussion of gas environmental matters.
18
Alliant Energy Corporation
| | | | | | | | | | |
| Gas Operating Information | | 2010 | | 2009 | | 2008 | | 2007 | | 2006 |
Operating Revenues (in millions) (a): | | | | | | | | | | |
Residential | | $273.7 | | $290.8 | | $385.0 | | $348.6 | | $342.8 |
Commercial | | 154.2 | | 174.7 | | 240.5 | | 199.0 | | 198.8 |
Industrial | | 27.3 | | 30.7 | | 51.1 | | 39.4 | | 38.7 |
| | |
Retail subtotal | | 455.2 | | 496.2 | | 676.6 | | 587.0 | | 580.3 |
Interdepartmental | | 1.5 | | 4.9 | | 7.8 | | 17.4 | | 19.2 |
Transportation/other | | 23.9 | | 24.2 | | 26.0 | | 25.8 | | 33.8 |
| | |
Total | | $480.6 | | $525.3 | | $710.4 | | $630.2 | | $633.3 |
| | |
| | | | | | | | | | | |
Gas Sales (000s Dths) (a): | | | | | | | | | | |
Residential | | 27,128 | | 27,711 | | 30,630 | | 28,137 | | 26,406 |
Commercial | | 18,691 | | 20,725 | | 22,461 | | 19,417 | | 18,707 |
Industrial | | 4,158 | | 4,558 | | 5,558 | | 4,694 | | 4,498 |
| | |
Retail subtotal | | 49,977 | | 52,994 | | 58,649 | | 52,248 | | 49,611 |
Interdepartmental | | 887 | | 938 | | 1,373 | | 2,591 | | 2,468 |
Transportation/other | | 49,521 | | 53,580 | | 59,253 | | 58,911 | | 53,436 |
| | |
Total | | 100,385 | | 107,512 | | 119,275 | | 113,750 | | 105,515 |
| | |
| | | | | | | | | | | |
Retail Customers at End of Period (a): | | | | | | | | | | |
Residential | | 366,261 | | 365,597 | | 365,193 | | 363,825 | | 374,494 |
Commercial | | 45,552 | | 45,641 | | 45,413 | | 45,374 | | 46,319 |
Industrial | | 549 | | 571 | | 584 | | 591 | | 657 |
| | |
Total | | 412,362 | | 411,809 | | 411,190 | | 409,790 | | 421,470 |
| | |
| | | | | | | | | | | |
Other Selected Gas Data: |
Heating degree days (b): | | | | | | | | | | |
Cedar Rapids, Iowa (IPL) (normal - 6,768) | | 6,868 | | 7,074 | | 7,636 | | 6,815 | | 6,247 |
Madison, Wisconsin (WPL) (normal - 7,105) | | 6,798 | | 7,356 | | 7,714 | | 6,935 | | 6,520 |
Revenue per Dth sold to retail customers | | $9.11 | | $9.36 | | $11.54 | | $11.23 | | $11.70 |
Purchased gas costs per Dth sold to retail customers | | $6.05 | | $6.47 | | $8.73 | | $8.11 | | $8.32 |
| | | | | | | | | | | |
| (a) | In February 2007, Alliant Energy sold its natural gas properties in Illinois. At the date of the sale, Alliant Energy had approximately 14,000 gas retail customers in Illinois. Prior to the asset sales, the gas sales to retail customers in Illinois are included in residential, commercial and industrial sales in the tables above. |
| (b) | Heating degree days are calculated using a simple average of the high and low temperatures each day compared to a 65 degree base. Normal degree days are calculated using a rolling 20-year average of historical heating degree days. |
19
Interstate Power and Light Company
| | | | | | | | | | |
| Gas Operating Information | | 2010 | | 2009 | | 2008 | | 2007 | | 2006 |
Operating Revenues (in millions) (a): | | | | | | | | | | |
Residential | | $155.6 | | $168.6 | | $219.3 | | $203.4 | | $197.9 |
Commercial | | 88.4 | | 100.8 | | 137.3 | | 115.0 | | 114.4 |
Industrial | | 18.4 | | 25.0 | | 40.4 | | 31.2 | | 30.4 |
| | |
Retail subtotal | | 262.4 | | 294.4 | | 397.0 | | 349.6 | | 342.7 |
Interdepartmental | | 1.0 | | 2.9 | | 2.2 | | 2.6 | | 2.2 |
Transportation/other | | 10.9 | | 11.5 | | 11.2 | | 12.3 | | 14.5 |
| | |
Total | | $274.3 | | $308.8 | | $410.4 | | $364.5 | | $359.4 |
| | |
| | | | | | | | | | | |
Gas Sales (000s Dths) (a): | | | | | | | | | | |
Residential | | 15,923 | | 16,072 | | 18,110 | | 16,541 | | 15,136 |
Commercial | | 10,596 | | 11,451 | | 13,099 | | 11,080 | | 10,552 |
Industrial | | 2,869 | | 3,787 | | 4,539 | | 3,811 | | 3,622 |
| | |
Retail subtotal | | 29,388 | | 31,310 | | 35,748 | | 31,432 | | 29,310 |
Interdepartmental | | 148 | | 474 | | 217 | | 327 | | 352 |
Transportation/other | | 27,923 | | 29,924 | | 34,776 | | 34,433 | | 32,342 |
| | |
Total | | 57,459 | | 61,708 | | 70,741 | | 66,192 | | 62,004 |
| | |
| | | | | | | | | | | |
Retail Customers at End of Period (a): | | | | | | | | | | |
Residential | | 206,979 | | 206,937 | | 206,866 | | 206,873 | | 211,768 |
Commercial | | 26,470 | | 26,545 | | 26,603 | | 26,664 | | 27,222 |
Industrial | | 343 | | 359 | | 367 | | 366 | | 382 |
| | |
Total | | 233,792 | | 233,841 | | 233,836 | | 233,903 | | 239,372 |
| | |
| | | | | | | | | | | |
Other Selected Gas Data: | | | | | | | | | | |
Heating degree days (b): | | | | | | | | | | |
Cedar Rapids, Iowa (normal - 6,768) | | 6,868 | | 7,074 | | 7,636 | | 6,815 | | 6,247 |
Revenue per Dth sold to retail customers | | $8.93 | | $9.40 | | $11.11 | | $11.12 | | $11.69 |
Purchased gas cost per Dth sold to retail customers | | $6.05 | | $6.61 | | $8.50 | | $8.38 | | $8.69 |
| | | | | | | | | | | |
| | | | | |
Wisconsin Power and Light Company | | | | | | | | | | |
| Gas Operating Information | | 2010 | | 2009 | | 2008 | | 2007 | | 2006 |
Operating Revenues (in millions) (a): | | | | | | | | | | |
Residential | | $118.1 | | $122.2 | | $165.7 | | $145.2 | | $144.9 |
Commercial | | 65.8 | | 73.9 | | 103.2 | | 84.0 | | 84.4 |
Industrial | | 8.9 | | 5.7 | | 10.7 | | 8.2 | | 8.3 |
| | |
Retail subtotal | | 192.8 | | 201.8 | | 279.6 | | 237.4 | | 237.6 |
Interdepartmental | | 0.5 | | 2.0 | | 5.6 | | 14.8 | | 17.0 |
Transportation/other | | 13.0 | | 12.7 | | 14.8 | | 13.5 | | 19.3 |
| | |
Total | | $206.3 | | $216.5 | | $300.0 | | $265.7 | | $273.9 |
| | |
| | | | | | | | | | | |
Gas Sales (000s Dths) (a): | | | | | | | | | | |
Residential | | 11,205 | | 11,639 | | 12,520 | | 11,596 | | 11,270 |
Commercial | | 8,095 | | 9,274 | | 9,362 | | 8,337 | | 8,155 |
Industrial | | 1,289 | | 771 | | 1,019 | | 883 | | 876 |
| | |
Retail subtotal | | 20,589 | | 21,684 | | 22,901 | | 20,816 | | 20,301 |
Interdepartmental | | 739 | | 464 | | 1,156 | | 2,264 | | 2,116 |
Transportation/other | | 21,598 | | 23,656 | | 24,477 | | 24,478 | | 21,094 |
| | |
Total | | 42,926 | | 45,804 | | 48,534 | | 47,558 | | 43,511 |
| | |
| | | | | | | | | | | |
Retail Customers at End of Period (a): | | | | | | | | | | |
Residential | | 159,282 | | 158,660 | | 158,327 | | 156,952 | | 162,726 |
Commercial | | 19,082 | | 19,096 | | 18,810 | | 18,710 | | 19,097 |
Industrial | | 206 | | 212 | | 217 | | 225 | | 275 |
| | |
Total | | 178,570 | | 177,968 | | 177,354 | | 175,887 | | 182,098 |
| | |
| | | | | | | | | | | |
Other Selected Gas Data: | | | | | | | | | | |
Heating degree days (b): | | | | | | | | | | |
Madison, Wisconsin (normal - 7,105) | | 6,798 | | 7,356 | | 7,714 | | 6,935 | | 6,520 |
Revenue per Dth sold to retail customers | | $9.36 | | $9.31 | | $12.21 | | $11.40 | | $11.70 |
Purchased gas cost per Dth sold to retail customers | | $6.06 | | $6.28 | | $9.08 | | $7.70 | | $7.77 |
| | | | | | | | | | | |
| (a) | In February 2007, IPL and WPL sold their respective natural gas properties in Illinois. At the date of the sale, IPL and WPL had approximately 6,000 and 8,000 gas retail customers in Illinois, respectively. Prior to the asset sales, the gas sales to retail customers in Illinois are included in residential, commercial and industrial sales in the tables above. |
| (b) | Heating degree days are calculated using a simple average of the high and low temperatures each day compared to a 65 degree base. Normal degree days are calculated using a rolling 20-year average of historical heating degree days. |
20
3) STEAM UTILITY OPERATIONS -IPL has historically provided steam service to approximately 200 customers in Cedar Rapids, Iowa, who used high-pressure steam for production purposes or low-pressure steam for hot water and heat. Substantially all of the steam for these customers was generated by IPL’s Prairie Creek Generating Station (Prairie Creek) and Sixth Street Generating Station (Sixth Street) in Cedar Rapids prior to June 2008. In June 2008, Prairie Creek and Sixth Street were shutdown as a result of significant damage caused by severe flooding in downtown Cedar Rapids. Soon after the flood waters receded, IPL made necessary repairs to its steam distribution systems and established temporary steam generating systems (natural gas-fired package boilers and water treatment systems) to resume steam service for its customers. Following months of evaluations and discussions with its steam customers, IPL announced in 2009 its decision to discontinue providing temporary steam service to those steam customers located in downtown Cedar Rapids previously served by Sixth Street. IPL ceased low-pressure steam operations in downtown Cedar Rapids in December 2009 and high-pressure steam operations in downtown Cedar Rapids in the second quarter of 2010. Prairie Creek was returned to service in 2009 and is expected to be the primary source of steam for IPL’s remaining two high-pressure steam customers in the future.
D. INFORMATION RELATING TO NON-REGULATED OPERATIONS
Resources manages a portfolio of wholly-owned subsidiaries and additional investments through several distinct platforms: Transportation, RMT, Non-regulated Generation and other non-regulated investments.
Transportation -includes a short-line railway that provides freight service between Cedar Rapids, Iowa and Iowa City, Iowa; a barge terminal and hauling services on the Mississippi River; and other transfer and storage services.
RMT -provides renewable energy services, and environmental consulting and engineering services to clients throughout the U.S. RMT offers facility siting, permitting, design, construction and high voltage connection services for wind and solar projects in the U.S. RMT’s environmental consulting and engineering services include site remediation, restoration and construction management, air quality control, and auditing/compliance management.
Renewable energy services - Recent economic conditions have constrained financial markets and lowered funding for large capital projects in the renewable energy services market. With fewer renewable energy projects receiving funding, the competition for those projects has intensified and profit margins have been negatively impacted. RMT is currently among a small group of companies that has technical expertise and project experience for all phases of a renewable energy project, from siting through electrical grid connection. At Dec. 31, 2010, RMT had executed contracts for 6 wind projects and 1 solar project that were either under construction or expected to begin construction in 2011. Future growth in the renewable energy infrastructure market may attract new competitors to the renewable energy services market including large construction companies.
Environmental consulting and engineering services - The environmental consulting and engineering services market is mature, highly fragmented, and composed of a large number of firms ranging in size from small private entities to large public firms. Merger and acquisition activity continues, resulting in increased consolidation. RMT’s competitors in this market vary by their scope of services, scale and geographical location of projects.
Non-regulated Generation - owns the 300 MW, simple-cycle, natural gas-fired Sheboygan Falls Energy Facility near Sheboygan Falls, Wisconsin, which is leased to WPL for an initial period of 20 years ending in 2025.
Other non-regulated investments -include the Whiting Petroleum Corporation tax sharing agreement receivable discussed in Note 4(b) of the “Combined Notes to Consolidated Financial Statements,” real estate investments, two corporate airplanes and several other modest investments.
21
ITEM 1A. RISK FACTORS
You should carefully consider each of the risks described below relating to Alliant Energy, IPL and WPL, together with all of the other information contained in this combined Annual Report on Form 10-K, before making an investment decision with respect to our securities. If any of the following risks develop into actual events, our business, financial condition or results of operations could be materially and adversely affected and you may lose all or part of your investment.
Risks related to the regulation of our business could impact the rates we are able to charge, our costs and our profitability - We are subject to comprehensive regulation by federal and state regulatory authorities, which significantly influences our operating environment, the ability to timely recover costs from customers and to earn authorized rates of return. In particular, our utility operations are regulated by regulatory authorities with jurisdiction over public utilities, including the IUB, the PSCW, the MPUC and FERC. These authorities regulate many aspects of our operations, including rates charged to customers and the manner in which we provide utility services to our customers. The rates we charge our customers can be influenced by how these regulatory authorities allow us to recover from customers the costs of fuel, purchased power and natural gas, and other operating costs including transmission service costs. These regulatory authorities also influence our utility operations by regulating our ability to site and construct new generating facilities and the amount of costs associated therewith that may be recovered from customers; authorization to install environmental pollution control equipment and whether equipment costs can be recovered from customers, such as the construction and maintenance of facilities; operations, including requiring certain sources of energy such as renewable sources and reductions in energy usage by customers; rates paid to transmission operators; safety; issuance of securities; accounting matters; and transactions between affiliates. In addition, our utility financial condition is influenced by how these regulatory authorities establish our authorized rates of return on capital and common equity levels, and the amount of deferred costs that may be recovered from customers. Further, provisions of the Wisconsin Utility Holding Company Act limit our ability to invest in non-utility activities and could deter takeover attempts by a potential purchaser of our common stock that would be willing to pay a premium for our common stock. These regulatory authorities are also empowered to impose financial penalties and other sanctions on us if we are found to have violated statutes and regulations governing utility operations. Our ability to obtain rate adjustments to earn appropriate rates of return depends upon timely regulatory action under applicable statutes and regulations, and we cannot assure that rate adjustments will be obtained or appropriate rates of return on capital will be earned. In pending and future rate cases, IPL and WPL may not receive an adequate amount of rate relief, rates may be reduced, rate refunds may be required, rate adjustments may not be approved on a timely basis, costs may not be otherwise recovered through rates, future rates may be temporarily frozen (as occurred in the IPL rate case in Iowa through 2013) and authorized rates of return on capital may be inadequate. As a result, we may experience adverse impacts on our financial condition and results of operations. We are unable to predict the impact on our business and operating results from future regulatory activities of any of these agencies. Changes in regulations or the imposition of additional regulations may require us to incur additional costs or change business operations or our business plan, which may have an adverse impact on our financial condition and results of operations.
We are exposed to risks related to economic conditions - Our utility operations are impacted by the economic conditions in our service territories. The most recent recession in our service territories caused our sales and revenues to decline. If economic conditions decline further in our service territories, we may experience additional reduced demand for electricity or natural gas. If future demand declines are not reflected in our rates, our financial condition and results of operations could be negatively impacted. In addition, adverse economic conditions in our service territories could negatively impact our collections of receivables. We lost certain customers as a result of the most recent recession and could lose additional customers due to economic conditions, customers constructing their own generation facilities, and loss of service territory or franchises. The current economic climate, and future economic growth, may not create enough growth for us to replace the lost energy demand from these customers. The loss of customers, and the inability to replace those customers with new customers, could negatively impact our financial condition and results of operations.
22
Risks related to implementing our strategic plan -Our strategic plan includes investments in renewable energy and natural gas generation, environmental control equipment at existing generating facilities, potential decommissioning of older generating facilities, negotiating competitive purchase power agreements and energy efficiency. The construction or purchase of renewable energy generating facilities is subject to many risks, which may cause increased costs or inability to recover costs, or may impede or block our ability to achieve our strategic objectives. The state utility commissions may not permit us to site, construct or purchase the generating facilities, such as Riverside, a 25% interest in Edgewater Unit 5 and the remaining 100 MW of Vestas wind turbine generator sets and related equipment, or add large-scale environmental control equipment to existing generating facilities. Such a state utility commission decision could be based upon any number of factors, including the commission’s determination that there is no need for the facilities or equipment, customer rate increases associated with the new generating facilities or equipment are too large or that the added costs to the customer outweigh the benefits to the customer, technology changes, environmental concerns or other factors. State utility commissions could approve the construction or purchase of generating facilities or environmental control projects, but include conditions that make the project uneconomical. Such conditions could include low rates of return, inability to adequately recover costs or certain operating restrictions. If we receive regulatory approval to build the facilities, advocacy groups or other associations may file lawsuits seeking to overturn or modify the regulatory approvals, as has been done relative to WPL’s Bent Tree - Phase I wind project. If we receive regulatory approval, other parties to the agreement may not receive regulatory approval, or may receive regulatory approval with unacceptable conditions, and therefore, we may not be able to achieve certain strategic purchases or sales. We may not be able to negotiate competitive purchased power agreements, particularly new nuclear purchased power agreements, due to conditions placed by the other party to the agreements. Decommissioning of older generating facilities may require us to take material impairments of our assets. If we are not able to implement our strategic plan, our financial condition and ability to serve our customers could be negatively affected.
Our operating results may fluctuate on a seasonal and quarterly basis and can be adversely affected by the impacts of weather -Our electric and gas utility businesses are seasonal businesses and weather patterns can have a material impact on their operating performance. Demand for electricity is greater in the summer months associated with air conditioning requirements. In addition, market prices for electricity generally peak in the summer due to higher demand. Demand for natural gas depends significantly upon weather patterns in winter months due to heavy use for residential and commercial heating. As a result, our overall operating results in the future may fluctuate substantially on a seasonal basis. In addition, we have historically generated less revenues and income when weather conditions are warmer in the winter and cooler in the summer. Unusually mild winters and summers could have an adverse effect on our financial condition and results of operations.
Changes in commodity prices or the availability of commodities may increase the cost of producing electric energy or change the amount we receive from selling electric energy, harming our financial performance -The prices that we may obtain for electric energy may not compensate for changes in delivered coal, natural gas or electric energy spot-market costs, or changes in the relationship between such costs and the market prices of electric energy. As a result, we may be unable to pass on the changes in costs to our customers, especially at WPL where we do not have a retail automatic fuel cost adjustment clause, which allows more consistent and timely cost recovery. The PSCW recently adopted rules related to fuel recovery, but it is not clear that the rule will allow more consistent and timely fuel cost recovery. This may result in an adverse effect on our financial condition and results of operations. We are heavily exposed to changes in the price and availability of coal because the majority of the electricity generated by us is from our coal-fired generating facilities. We have contracts of varying durations for the supply and transportation of coal for most of our existing generating capability, but as these contracts end or otherwise are not honored, we may not be able to purchase coal on terms as favorable as the current contracts. Further, we currently rely on coal primarily from the Powder River Basin in Wyoming and any disruption of coal production in, or transportation from, that region may cause us to incur additional costs and adversely affect our financial condition and results of operations. We also have responsibility to supply natural gas to certain natural gas-fired electric generating facilities that we own and lease, which increases our exposure to volatile market prices of natural gas. We have natural gas supply contracts in place, which are generally short-term in duration. The natural gas supply commitments are either fixed price in nature or market-based. As some of the contracts are market-based, and all of the contracts are short-term, we may not be able to purchase natural gas on terms as favorable as the current contracts when the current contracts expire. Further, any disruption of production or transportation of natural gas may cause us to incur additional costs to purchase natural gas that may adversely impact our financial condition and results of operations. We buy electricity from the market, and sell our generation into the market. The market prices impact the volumes of electricity bought and sold and impact our results of operations. The derivative instruments we use to manage our commodity risks have terms allowing our counterparties to demand cash collateral. Extensive cash collateral demands could adversely impact our cash flows. In July 2010, the Dodd-Frank Wall Street Reform and Consumer Protection Act (Dodd-Frank Act) was enacted. One of the most significant financial provisions of the Dodd-Frank Act for us is a commercial end-user exemption
23
that is expected to allow utilities to continue trading derivatives “over-the-counter” without having to make such trades through cleared exchanges with collateral requirements. If, as a result of the rulemaking associated with the Dodd-Frank Act, we do not qualify for the end-user exemption, we could be subject to higher collateral requirements, which could adversely impact our cash flows.
Risks related to wind generation - Our strategic plan includes our utility subsidiaries building and operating wind generating facilities. Our subsidiary, RMT, is also dependent on growth in the wind development market. The health of, and growth of, the wind market depends on tax incentives, such as the production tax credit, and other incentives included in the American Recovery and Reinvestment Act of 2009, the Tax Relief, Unemployment Insurance Reauthorization and Job Creation Act of 2010, and other laws and regulations. The strategic plan also depends on the state of the economy and credit markets. The failure of tax incentives to work as expected, the elimination of or changes to these incentives, or continued economic and credit market weakness, could adversely impact our ability to achieve our strategic plan and could adversely impact our financial condition and results of operations. Growth at RMT requires RMT to maintain and grow its current market share in the wind construction market as the market grows, while growing its market share in other renewable energy construction markets, such as solar. RMT’s inability to maintain and grow its market share of the wind and other renewable energy markets could adversely impact our ability to achieve our strategic plan and could adversely impact our results of operations.
Risks related to large construction projects - Large construction projects, such as the building of renewable energy generating facilities or adding large-scale environmental control equipment to generating facilities, are subject to various risks that could cause costs to increase or delays in completion. These risks include shortages of, the inability to obtain, the cost of, and the consistency of, labor, materials and equipment; the inability of the general contractor or subcontractors to perform under their contracts; the inability to agree to terms of contracts or disputes in contract terms; work stoppages; adverse weather conditions; the inability to obtain necessary permits in a timely manner; changes in applicable laws or regulations; adverse interpretation or enforcement of permit conditions; governmental actions; legal action; and unforeseen engineering or technology issues. If the construction project is over budget, we may not be able to recover those excess costs. Inability to recover excess costs, or inability to complete the project in a timely manner, could adversely impact our financial condition and results of operations.
Costs of compliance with existing and future laws and the incurrence of liabilities, particularly related to the environment, could adversely affect our profitability -Our operations are subject to extensive regulation including environmental protection laws and regulations relating to, among other things, water discharges, management of hazardous and solid waste, and air emissions such as sulfur dioxide, nitrogen oxide, particulate matter and mercury. Laws and regulations affecting our operations have recently been adopted by the EPA and state authorities, and are being implemented in the states we operate. In addition, new regulations from federal and state authorities, such as potential water, GHG and coal ash regulations, are under consideration and may be adopted, requiring modifications to our utility operations. New interpretations of existing laws and regulations could be adopted or become applicable to us or our facilities. Rules may be adopted and then overturned by courts, such as the Clean Air Mercury Rule, or sent back to the EPA for revisions, such as the Clean Air Interstate Rule. These regulations, possible new regulations and possible new interpretations may substantially increase compliance expenditures made by us or restrict our operations in the future. We also have current or previous ownership interests in sites associated with the production of gas and the production and delivery of electricity for which we may be liable for additional costs related to investigation, remediation and monitoring of these sites. We cannot predict with certainty the amount and timing of all future expenditures (including the potential or magnitude of any fines or penalties, including the severity of any restrictions on our operations) related to environmental matters, although we expect the future expenditures to be material. Further, we believe we comply with such regulations, but a state or federal oversight agency may not agree, as occurred when the EPA issued a notice of violation to WPL in December 2009 alleging non-compliance with various permitting requirements under the Clean Air Act. The risks associated with compliance and estimating compliance costs include the possibility that changes will be made to the current environmental laws and regulations, the uncertainty regarding the type of compliance that will finally be required by rules and regulations, the possibility that a state or federal oversight agency will not agree that we are compliant, the uncertain treatment of expenditures by regulators in setting our rates, the possible inability to obtain necessary materials or skilled labor force required for certain equipment necessary to comply with environmental regulations, the rising costs of equipment, services and labor related to environmental compliance, the possibility that technology will not perform as anticipated, co-owner considerations with respect to our jointly-owned facilities, and the uncertainty in quantifying liabilities under environmental laws that impose joint and several liabilities on all potentially responsible parties. Compliance with current and future environmental laws and regulations may result in increased capital, operating and other costs, including remediation and containment expenses and monitoring obligations, which could adversely impact our financial condition and results of operations.
24
We have developed our generation plan, which includes investments in renewable energy, natural gas and coal generation and environmental control equipment at existing generating facilities, based on our expectations regarding these environmental regulations. If the regulations change, we may not be able to carry out our strategic plan. We also purchased emission allowances to comply with the Clean Air Interstate Rule. State utility commissions may not approve our generation projects because the current requirements for them are in question, or may not allow us to recover costs of the projects and emission allowances if future regulations are not adopted or changed as we expected. Co-owners in our jointly-owned facilities may not agree with our decision to move forward with these projects. Further, more stringent environmental regulations could be adopted in the future, requiring controls in addition to those currently planned. Failure to obtain utility commission approvals, inability to fully recover costs or failure to obtain co-owner approval could adversely impact our financial condition and results of operations.
Citizen groups or others may bring litigation over environmental issues including claims of various types, such as property damage and personal injury. Citizen legal challenges to compliance decisions on the enforcement of environmental requirements, such as approval of air permits, opacity and other air quality standards may be brought against us. WPL is currently involved in matters in which the Sierra Club is alleging various violations of the Clean Air Act. Specifically, the Sierra Club alleged that WPL violated the Clean Air Act by not obtaining permits for various projects at its owned and co-owned generating facilities, by violating opacity limits at a generating facility, and by changing the permitted operation of a generating facility. If we are unsuccessful defending such litigation, we could be subject to restrictions or prohibitions to operating our generation facilities, costly upgrades to our generation facilities, payment of damages or fines, and litigation costs, all of which could be material. An adverse result in such legal actions could have a material adverse impact on our financial condition and results of operations.
Actions related to global climate change and reducing GHG emissions could impact us - The primary GHG emitted from our utility operations is carbon dioxide (CO2) from combustion of fossil fuels at our generating facilities. Our generating facilities are primarily coal-fired facilities. Various regulations addressing climate change are being considered at the federal and state levels. The Supreme Court has ruled that CO2 may be regulated by the EPA. The EPA has determined that CO2 threatens the public health and welfare and may now regulate all CO2 emissions under the Clean Air Act. The Governors of all of the states in our service territories have signed on to the Midwestern Governors Association GHG Accord (GHG Accord). The stated goal of the GHG Accord’s platform is to “maximize the energy resources and economic advantages and opportunities of Midwestern states while reducing emissions of atmospheric CO2 and other GHG.” We could be subject to any regulations that are adopted in the future, and could become the target of challenges, because generating electricity using fossil fuels emits CO2. The impacts of such proposals could have a material adverse impact on our financial condition and results of operations.
Furthermore, state regulators may consider future climate change policy implications in proceedings related to making environmental upgrades to existing facilities. Future regulation of CO2 emissions could make some of our electric generating facilities uneconomic to maintain or operate. The cost to comply with future potential CO2 emissions regulations could be very high. There is no guarantee that we will be allowed to fully recover compliance costs or that cost recovery will not be delayed or otherwise conditioned. Due to the uncertainty of what form CO2 emissions regulations could take, control technologies available to reduce GHG emissions, including CO2, and the unknown nature of potential compliance obligations should climate change regulations be enacted, we cannot provide any assurance regarding the potential impacts these future regulations would have on our operations. In addition, we cannot predict if, or how, state regulators may factor this issue into approvals and permits for us to modify our existing coal-fired generation. All such regulatory results could adversely impact our ability to implement our strategic plan and our financial condition and results of operations.
Risks related to capital markets -We rely on accessing the capital markets to support capital expenditure programs and other capital requirements, including expenditures to build utility infrastructure and comply with future regulatory requirements. Successful implementation of our strategic plan and other long-term business strategies is dependent upon the ability of us to access the capital markets under competitive terms and rates. We have forecasted capital expenditures of $2.8 billion over the next three years. Capital markets, particularly debt markets, were under considerable strain recently, resulting in negative impacts on the availability and terms of credit available to certain businesses. Any national economic downturn or disruption of financial markets could reduce our access to capital necessary for our operations and to execute our strategic plan. If the credit crisis returns, we may be unable to access the credit markets, or our cost of borrowing might significantly increase. We rely on our strong credit ratings to access the credit markets. If our credit ratings are downgraded for any reason, we could pay higher interest rates in future financings, the pool of potential lenders could be reduced, borrowing costs under existing credit facilities could increase, our access to the commercial paper market could be limited, or we could be required to provide additional credit assurance, including cash collateral, to contract counterparties. If our access to capital were to become significantly constrained or costs of capital increased significantly due to lowered credit
25
ratings, prevailing industry conditions, regulatory constraints, the volatility of the capital markets or other factors, our financial condition and results of operations could be significantly adversely affected.
We are subject to employee workforce factors that could affect our businesses - We are subject to employee workforce factors, including loss or retirement of key personnel, availability of and our ability to recruit qualified personnel, collective bargaining agreements with employees and work stoppage that could affect our businesses and financial condition and results of operations. Further, our workforce is dominated by members of the baby boomer generation who are nearing retirement. As a large portion of our workforce prepares to retire, we must recruit and train new employees to replace them. Costs of recruitment are expected to increase and may not be recovered in rates, and the ability to find qualified employees is expected to become more difficult as our workforce retires. These factors could adversely affect our business and financial condition.
Failure to provide reliable service to our utility customers could adversely affect our operating results -We are currently obligated to supply electric energy in and natural gas to parts of Iowa, Wisconsin and Minnesota. From time to time and because of unforeseen circumstances, the demand for electric energy required to meet these obligations could exceed our available electric generating capability and energy commitments pursuant to purchased power agreements. The North American transmission grid is highly interconnected and, in extraordinary circumstances, disruptions at particular points within the grid could cause an extensive power outage in our delivery systems. Power outages in our service territories could result from factors outside of our control or service territories. If this occurs, we may have to buy electric energy in the market. Our utilities may not always have the ability to pass all the costs of purchasing the electric energy on to their customers, and even if they are able to do so, there may be a significant delay between the time the costs are incurred and the time the costs are recovered. Since these situations most often occur during periods of peak demand, it is possible that the market price for electric energy at the time we purchase it could be very high. Even if a supply shortage was brief, we could suffer substantial losses that could diminish our financial condition and results of operations. The transmission system in our utilities’ service territories is constrained, limiting the ability to transmit electric energy within our service territories and access electric energy from outside of our service territories. The transmission constraints could result in failure to provide reliable service to our utility customers and the inability to deliver energy from generating facilities, particularly wind generating facilities, to the national grid, or not being able to access lower cost sources of electric energy. There are a variety of hazards and operating risks inherent in our natural gas distribution activities, such as leaks, explosions and mechanical problems, which could cause substantial financial losses. In addition, these risks could result in loss of human life, particularly in high consequence areas, significant damage to property, environmental pollution, impairment of our operations and substantial losses to us. Failure to provide safe and reliable service, including effects of equipment failures in electric and natural gas delivery systems and any resulting fines or litigation costs, or market demand for energy exceeding available supply, may result in reduced revenues and increased maintenance and capital costs, which could adversely impact our financial condition and results of operations.
Operation of electric generating facilities or capital improvement of utility facilities may involve unanticipated changes or delays in operations that could negatively impact our business -The operation of electric generating facilities involves many risks, including start-up risks, breakdown or failure of equipment, transmission lines or pipelines, use of technology, the dependence on a specific fuel source, including the supply and transportation of fuel, as well as the risk of performance below expected or contracted levels of output or efficiency. These risks could negatively impact our business through asset degradation, lost revenues or increased costs, including the cost of replacement power. The distribution of natural gas involves many risks, including leaks, explosions and mechanical problems. Additionally, our ability to successfully and timely complete planned capital improvements to existing facilities within established budgets is contingent upon many variables and may be subject to substantial risks. Should such efforts be unsuccessful, we could be subject to additional costs and increased risk of non-recovery of construction or improvement costs through rates, which could adversely affect our financial condition and results of operations.
Storms or other natural disasters may impact our operations in unpredictable ways -Storms and other natural disasters, such as the flood of 2008 and the ice storms of 2007, may adversely impact our ability to generate, purchase or distribute electric energy or obtain fuel sources and may significantly slow growth, or cause a decline, in the economy within our service territories. Storms and natural disasters may prevent our customers from being able to operate, causing lower sales and revenues. In addition, we could incur large costs of repairing damage to our generating facilities and infrastructure due to storms or natural disasters. The loss of revenues may not be recovered. The restoration costs may not be fully covered by insurance policies. Damage to assets could also require us to take impairments, such as occurred with our damaged Sixth Street Generating Station. Some costs may not be recovered in rates, or there could be significant delays in cost recovery. Any of these items could adversely affect our financial condition and results of operations.
26
We are subject to limitations on our ability to pay dividends -Alliant Energy is a holding company with no significant operations of its own. Accordingly, the primary sources of funds for Alliant Energy to pay dividends to its shareowners are dividends and distributions from its subsidiaries. Our subsidiaries are separate and distinct legal entities and have no obligation to pay any amounts to us, whether by dividends, loans or other payments. The ability of our subsidiaries to pay dividends or make distributions to us and, accordingly, our ability to pay dividends on Alliant Energy common stock will depend on regulatory limitations and the earnings, cash flows, capital requirements and general financial condition of our subsidiaries. Our utilities each have dividend payment restrictions based on the terms of their outstanding preferred stock and regulatory limitations applicable to them. If we do not receive adequate dividends and distributions from our subsidiaries, then we may not be able to make, or may have to reduce, dividend payments on Alliant Energy common stock.
Threats of terrorism and catastrophic events that could result from terrorism may impact our operations in unpredictable ways -We are subject to direct and indirect effects of terrorist threats and activities. Generation and transmission facilities, in general, have been identified as potential targets. The effects of terrorist threats and activities include, among other things, terrorist actions or responses to such actions or threats, the inability to generate, purchase or transmit electric energy, the risk of significant slowdown in growth or a decline in the U.S. economy, disruption or volatility in, or other effects on capital markets, and the increased cost and adequacy of security and insurance. Terrorist threats and activities may adversely impact our ability to generate, purchase or distribute electric energy or obtain fuel sources and may significantly slow growth, or cause a decline, in the economy within our service territories, which could adversely impact our financial condition and results of operations. In addition, the cost of repairing damage to our generating facilities and infrastructure due to acts of terrorism, and the loss of revenue if such events prevent us from providing utility service to our customers, could adversely impact our financial condition and results of operations.
Energy industry changes could have a negative effect on our businesses -As a public utility company with significant utility assets, we conduct our utility operations in a regulated business environment. The advent of new and unregulated markets has the potential to significantly impact our financial condition and results of operations. The evolution of the wholesale and transmission markets has the potential to significantly increase costs of transmission, costs associated with inefficient generation dispatching, costs of participation in the new markets and costs stemming from estimated payment settlements. Competitive pressures, including advances in technology that reduce the costs of alternative methods of producing electric energy to a level that is competitive with that of current electric production methods, could result in our utilities losing market share and customers and incurring stranded costs (i.e., assets and other costs rendered unrecoverable through customer rates as a result of competitive pricing), which would be borne by our shareowners. Increased competition from any restructuring efforts in our primary retail electric service territories may have a significant adverse impact on our financial condition and results of operations.
| ITEM 1B. | UNRESOLVED STAFF COMMENTS |
None.
IPL - At Dec. 31, 2010, IPL’s electric generating facilities by primary fuel type were as follows. Generating capacity is based upon the unforced capacity of the generating stations included in MISO’s resource adequacy process for the planning period from June 2010 to May 2011.
27
| | | | | | | | | | | | | | | | |
Name of Generating Facility | | Location | | No.
of
Units | | In-service
Dates | | Primary
Dispatch
Type (a) | | Generating Capacity in MW | |
Ottumwa Generating Station (Unit 1) | | Ottumwa, IA | | 1 | | 1981 | | BL | | 296 | | (b) | | | | |
Lansing Generating Station (Units 3-4) | | Lansing, IA | | 2 | | 1957-1977 | | BL | | 252 | | (c) | | | | |
M.L. Kapp Generating Station (Unit 2) | | Clinton, IA | | 1 | | 1967 | | BL | | 184 | | | | | | |
Burlington Generating Station (Unit 1) | | Burlington, IA | | 1 | | 1968 | | BL | | 182 | | | | | | |
George Neal Generating Station (Unit 4) | | Sioux City, IA | | 1 | | 1979 | | BL | | 159 | | (d) | | | | |
Prairie Creek Generating Station (Units 1,3,4) | | Cedar Rapids, IA | | 3 | | 1958-1997 | | BL | | 147 | | | | | | |
George Neal Generating Station (Unit 3) | | Sioux City, IA | | 1 | | 1975 | | BL | | 140 | | (e) | | | | |
Sutherland Generating Station (Units 1,3) | | Marshalltown, IA | | 2 | | 1955-1961 | | BL | | 95 | | (c) | | | | |
Dubuque Generating Station (Units 3-4) | | Dubuque, IA | | 2 | | 1952-1959 | | IN | | 59 | | (c) | | | | |
Louisa Generating Station (Unit 1) | | Louisa, IA | | 1 | | 1983 | | BL | | 28 | | (f) | | | | |
| | | | | | | | | | | | | | | | |
Total Coal | | | | | | | | | | | | | | | 1,542 | |
| | | | | | | |
Emery Generating Station (Units 1-3) | | Mason City, IA | | 3 | | 2004 | | IN | | 510 | | | | | | |
Fox Lake Generating Station (Units 1,3) | | Sherburn, MN | | 2 | | 1950-1962 | | PK | | 89 | | (c) | | | | |
Burlington Combustion Turbines (Units 1-4) | | Burlington, IA | | 4 | | 1994-1996 | | PK | | 56 | | | | | | |
Grinnell Combustion Turbines (Units 1-2) | | Grinnell, IA | | 2 | | 1990-1991 | | PK | | 44 | | | | | | |
Red Cedar Combustion Turbine (Unit 1) | | Cedar Rapids, IA | | 1 | | 1996 | | PK | | 16 | | | | | | |
| | | | | | | | | | | | | | | | |
Total Gas | | | | | | | | | | | | | | | 715 | |
| | | | | | | |
Marshalltown Combustion Turbines (Units 1-3) | | Marshalltown, IA | | 3 | | 1978 | | PK | | 170 | | | | | | |
Lime Creek Combustion Turbines (Units 1-2) | | Mason City, IA | | 2 | | 1991 | | PK | | 56 | | | | | | |
Montgomery Combustion Turbine (Unit 1) | | Montgomery, MN | | 1 | | 1974 | | PK | | 20 | | | | | | |
Diesel Stations | | Iowa and Minnesota | | 9 | | 1963-1996 | | PK | | 15 | | | | | | |
Centerville Combustion Turbines (Units 1-2) | | Centerville, IA | | 2 | | 1990 | | PK | | -- | | (g) | | | | |
| | | | | | | | | | | | | | | | |
Total Oil | | | | | | | | | | | | | | | 261 | |
| | | | | | | |
Whispering Willow - East | | Franklin Co., IA | | 121 | | 2009 | | IN | | -- | | (h) | | | | |
| | | | | | | | | | | | | | | | |
Total Wind | | | | | | | | | | | | | | | -- | |
| | | | | | | | | | | | | | | | |
Total generating capacity | | | | | | | | | | | | | | | 2,518 | |
| | | | | | | | | | | | | | | | |
| (a) | Baseload units (BL) are designed for nearly continuous operation at or near full capacity to provide the system base load. Intermediate units (IN) follow system load changes with frequent starts and curtailments of output during low demand. Peaking units (PK) are generally low efficiency, quick response units run only when there is high demand. |
| (b) | Represents IPL’s 48% ownership interest in this 617 MW generating station, which is operated by IPL. |
| (c) | IPL’s November 2010 IRP begins a process of retiring Dubuque Generating Station Units 3 (27 MW) and 4 (32 MW) and Sutherland Generating Station Unit 1 (28 MW). While it is expected that the retirement of these units will be completed by 2015, specific timing will depend on operational, market and other factors. In addition, IPL requested approval from MISO to retire Lansing Generating Station Unit 3 (27 MW) and Fox Lake Generating Station Unit 1 (12 MW). The remaining units at each generating station will continue to generate cost-effective power on behalf of IPL customers. |
| (d) | Represents IPL’s 25.695% ownership interest in this 619 MW generating station, which is operated by MidAmerican Energy Company (MidAmerican). |
| (e) | Represents IPL’s 28% ownership interest in this 500 MW generating station, which is operated by MidAmerican. |
| (f) | Represents IPL’s 4% ownership interest in this 700 MW generating station, which is operated by MidAmerican. |
| (g) | Capacity testing required by MISO’s resource adequacy process was not able to be completed for the Centerville combustion turbines resulting in no capacity being credited to this facility for the planning period from June 2010 to May 2011. |
| (h) | Represents 0% of the capacity of this 200 MW wind project based upon the MISO resource adequacy process, which is determined separately for each wind site, during the planning period from June 2010 to May 2011. The 0% allocation resulted from the lack of firm transmission at this wind site during the planning period from June 2010 to May 2011. |
28
At Dec. 31, 2010, IPL owned approximately 19,826 miles of overhead electric distribution line and 2,642 miles of underground electric distribution cable, as well as 708 substation distribution transformers, substantially all of which are located in Iowa and Minnesota. IPL sold its electric transmission assets in 2007. IPL’s gas properties consist primarily of mains and services, meters, regulating and gate stations and other related distribution equipment. At Dec. 31, 2010, IPL’s gas distribution facilities included approximately 5,017 and 236 miles of gas mains located in Iowa and Minnesota, respectively. IPL’s other property included in “Other plant in service” on its Consolidated Balance Sheets consists primarily of operating and storeroom facilities, vehicles, computer hardware and software, communication equipment and other miscellaneous tools and equipment. IPL’s properties are suitable for their intended use. Refer to Note 1(e) of the “Combined Notes to Consolidated Financial Statements” for discussion of various generating facilities that IPL retired in 2010, including Sixth Street.
WPL - At Dec. 31, 2010, WPL’s electric generating facilities by primary fuel type were as follows. Generating capacity is based upon the unforced capacity of the generating stations included in MISO’s resource adequacy process for the planning period from June 2010 to May 2011.
| | | | | | | | | | | | | | |
Name of Generating Facility | | Location | | No. of
Units | | In-service
Dates | | Primary
Dispatch
Type (a) | | Generating Capacity in MW |
Columbia Energy Center (Units 1-2) | | Portage, WI | | 2 | | 1975-1978 | | BL | | 462 | | (b) | | |
Edgewater Generating Station (Unit 5) | | Sheboygan, WI | | 1 | | 1985 | | BL | | 297 | | (c) | | |
Nelson Dewey Generating Station (Units 1-2) | | Cassville, WI | | 2 | | 1959-1962 | | IN | | 209 | | | | |
Edgewater Generating Station (Unit 4) | | Sheboygan, WI | | 1 | | 1969 | | BL | | 193 | | (d) | | |
Edgewater Generating Station (Unit 3) | | Sheboygan, WI | | 1 | | 1951 | | IN | | 70 | | | | |
| | | | | | | | | | | | | | |
Total Coal | | | | | | | | | | | | | | 1,231 |
| | | | | | | |
Neenah Energy Facility (Units 1-2) | | Neenah, WI | | 2 | | 2000 | | PK | | 278 | | | | |
South Fond du Lac Combustion Turbines | | Fond du Lac, WI | | 2 | | 1994 | | PK | | 155 | | (e) | | |
Rock River Combustion Turbines (Units 3-6) | | Beloit, WI | | 4 | | 1967-1972 | | PK | | 127 | | | | |
Sheepskin Combustion Turbine (Unit 1) | | Edgerton, WI | | 1 | | 1971 | | PK | | 22 | | | | |
| | | | | | | | | | | | | | |
Total Gas | | | | | | | | | | | | | | 582 |
| | | | | | | |
Cedar Ridge | | Fond du Lac Co., WI | | 41 | | 2008 | | IN | | 5 | | (f) | | |
Bent Tree - Phase I | | Freeborn Co., MN | | 77 | | 2010 | | IN | | -- | | (g) | | |
| | | | | | | | | | | | | | |
Total Wind | | | | | | | | | | | | | | 5 |
| | | | | | | |
Prairie du Sac Hydro Plant | | Prairie du Sac, WI | | 8 | | 1914-1940 | | IN | | 12 | | | | |
Kilbourn Hydro Plant | | Wisconsin Dells, WI | | 4 | | 1926-1939 | | IN | | 5 | | | | |
| | | | | | | | | | | | | | |
Total Hydro | | | | | | | | | | | | | | 17 |
| | | | | | | | | | | | | | |
Total generating capacity | | | | | | | | | | | | | | 1,835 |
| | | | | | | | | | | | | | |
| (a) | Baseload units (BL) are designed for nearly continuous operation at or near full capacity to provide the system base load. Intermediate units (IN) follow system load changes with frequent starts and curtailments of output during low demand. Peaking units (PK) are generally low efficiency, quick response units run only when there is high demand. |
| (b) | Represents WPL’s 46.2% ownership interest in this 1,000 MW generating station, which is operated by WPL. |
| (c) | Represents WPL’s 75% ownership interest in this 396 MW generating station, which is operated by WPL. Refer to Note 12(g) of the “Combined Notes to Consolidated Financial Statements” for discussion of WPL’s contingent agreement to purchase the remaining 25% ownership interest (99 MW of generating capacity) in Edgewater Unit 5. |
| (d) | Represents WPL’s 68.2% ownership interest in this 283 MW generating station, which is operated by WPL. |
| (e) | Represents Units 2 and 3, which WPL owns. WPL also operates South Fond du Lac Combustion Turbines Units 1 and 4. |
| (f) | Represents 8% of the capacity of this 68 MW wind project based upon the MISO resource adequacy process, which is determined separately for each wind site, during the planning period from June 2010 to May 2011. |
| (g) | WPL’s 200 MW Bent Tree - Phase I wind project in Freeborn County, Minnesota began generating electricity (approximately 127 MW and 77 turbines) in the fourth quarter of 2010, and was not included in the June 2010 to May 2011 MISO planning period. WPL’s Bent Tree - Phase I wind project became fully operational in the first quarter of 2011. |
29
At Dec. 31, 2010, WPL owned approximately 16,662 miles of overhead electric distribution line and 4,601 miles of underground electric distribution cable, as well as 292 substation distribution transformers, substantially all of which are located in Wisconsin. In 2001, WPL’s electric transmission assets were transferred to ATC. WPL’s gas properties consist primarily of mains and services, meters, regulating and gate stations and other related distribution equipment. At Dec. 31, 2010, WPL’s gas distribution facilities included approximately 3,989 miles of gas mains located in Wisconsin. As of Dec. 31, 2010, WPL completed the installation of over 641,000 advanced metering infrastructure electric meters and gas modules in its service territory. WPL’s other property included in “Other plant in service” on its Consolidated Balance Sheets consists primarily of operating and storeroom facilities, vehicles, computer hardware and software, communication equipment and other miscellaneous tools and equipment. WPL’s properties are suitable for their intended use. Refer to Note 3(b) of the “Combined Notes to Consolidated Financial Statements” for information regarding WPL’s lease of the Sheboygan Falls Energy Facility from Resources’ Non-regulated Generation business.
Refer to “Strategic Overview - Generation Plans” in MDA for discussion of IPL’s and WPL’s generation plans.
Resources - Resources’ principal properties included in “Property, plant and equipment - Non-regulated and other” on Alliant Energy’s Consolidated Balance Sheet at Dec. 31, 2010 were as follows:
Non-regulated Generation - includes a 300 MW, simple-cycle, natural gas-fired facility near Sheboygan Falls, Wisconsin that is leased to WPL.
Transportation - includes a short-line railway in Iowa with 111 railroad track miles, 13 active locomotives and 122 railcars; and a barge terminal on the Mississippi River.
Other non-regulated investments - includes two corporate airplanes and real estate investments.
Corporate Services
Corporate Services’ property included in “Property, plant and equipment - Non-regulated and other” on Alliant Energy’s Consolidated Balance Sheet at Dec. 31, 2010 consisted primarily of computer software.
Alliant Energy - - None.
IPL -None.
WPL - -
Air Permitting Violation Claims -In September 2010, Sierra Club filed in U.S. District Court for the Western District of Wisconsin a complaint against WPL, as owner and operator of Nelson Dewey and Columbia, based on allegations that modifications were made at the facilities without complying with the Prevention of Significant Deterioration (PSD) program requirements, Title V Operating Permit requirements of the CAA and state regulatory counterparts contained within the Wisconsin state implementation plans (SIP) designed to implement the CAA. In October 2010, WPL responded to these claims related to Nelson Dewey and Columbia by filing with the U.S. District Court an answer denying the Columbia allegations and a motion to dismiss the Nelson Dewey allegations based on statute of limitations arguments. In November 2010, WPL filed a motion to dismiss the Nelson Dewey and Columbia allegations based on lack of jurisdiction. Sierra Club has responded to the motions. WPL and Sierra Club are currently exchanging and responding to discovery requests. In February 2011, WPL and Sierra Club filed a joint motion for stay of proceedings for 90 days to explore settlement options, which the U.S. District Court granted in part and denied in part. The trial date has been rescheduled to April 2012. In September 2010, Sierra Club filed in U.S. District Court for the Eastern District of Wisconsin a complaint against WPL, as owner and operator of Edgewater, which contained similar allegations regarding air permitting violations at Edgewater. In February 2011, WPL responded to these claims related to Edgewater by filing with the U.S. District Court an answer denying the allegations and a motion to dismiss the allegations based on lack of jurisdiction. In February 2011, WPL and Sierra Club filed a joint motion for stay of proceedings for 90 days to explore settlement options, of which the U.S. District Court has not yet ruled. No trial date or scheduling order has yet been set. The complaints filed by Sierra Club allege that various projects performed at Nelson Dewey, Columbia and Edgewater in the past were major modifications, as defined in the CAA, and that the owners violated the CAA when they undertook those projects without obtaining permits and installing the best available emission controls for SO2, NOx and particulate matter. In the Edgewater complaint, additional allegations were made regarding violations of emission limits for visible emissions.
30
In December 2009, the EPA sent a Notice of Violation (NOV) to WPL as an owner and the operator of Edgewater, Nelson Dewey and Columbia. The NOV alleges that the owners failed to comply with appropriate pre-construction review and permitting requirements and as a result violated the PSD program requirements, Title V Operating Permit requirements of the CAA and the Wisconsin SIP.
In response to similar EPA CAA enforcement initiatives, certain utilities have elected to settle with the EPA, while others have elected to litigate. If the EPA and/or Sierra Club successfully prove their claims that projects completed in the past at Edgewater, Nelson Dewey and Columbia required either a state or federal CAA permit, WPL may, under the applicable statutes, be required to pay civil penalties in amounts of up to $37,500 per day for each violation and/or complete actions for injunctive relief. Payment of fines and/or injunctive relief could be included in a settlement outcome. Injunctive relief contained in settlements or court-ordered remedies for other utilities required the installation of pollution control technology, changed operating conditions including use of alternative fuels other than coal, caps for emissions and limitations on generation including retirement of generating units, and other supplemental environmental projects. Should similar remedies be required for final resolution of these matters at Edgewater, Nelson Dewey and Columbia, Alliant Energy and WPL would incur additional capital and operating expenditures. Alliant Energy and WPL are currently reviewing the allegations and are unable to predict the impact of the allegations on their financial condition or results of operations, but believe that an adverse outcome could be significant. WPL and the other owners of Edgewater and Columbia are exploring settlement options while simultaneously defending against these allegations. WPL believes the projects at Edgewater, Nelson Dewey and Columbia were routine or not projected to increase emissions and therefore did not violate the permitting requirements of the CAA.
Environmental Matters
Additional information required by Item 3 with regards to environmental matters is included in “C. Information Relating to Utility Operations - Electric Utility Operations” in Item 1 Business, “Environmental Matters” in MDA and Note 12(e) of the “Combined Notes to Consolidated Financial Statements,” which information is incorporated herein by reference.
Rate Matters
The information required by Item 3 with regards to rate matters is included in “B. Information Relating to Alliant Energy on a Consolidated Basis - Regulation” and “C. Information Relating to Utility Operations” in Item 1 Business, Notes 1(b), 1(h) and 2 of the “Combined Notes to Consolidated Financial Statements” and “Rate Matters” in MDA, which information is incorporated herein by reference.
| ITEM 4. | (REMOVED AND RESERVED) |
EXECUTIVE OFFICERS OF THE REGISTRANTS
None of the executive officers for Alliant Energy, IPL or WPL listed below are related to any member of the Board of Directors or nominee for director or any other executive officer. All of the executive officers have no definite terms of office and serve at the pleasure of the Board of Directors. The executive officers of Alliant Energy, IPL and WPL as of the date of this filing are as follows (numbers following the names represent the officer’s age as of Dec. 31, 2010):
Executive Officers of Alliant Energy
William D. Harvey, 61, has served as Chairman of the Board since February 2006, Chief Executive Officer (CEO) since July 2005 and as a director since January 2005. He previously served as President from January 2004 to February 2011.
Patricia L. Kampling, 51, was elected President and Chief Operating Officer (COO) effective February 2011. She previously served as Executive Vice President (EVP) and Chief Financial Officer (CFO) since September 2010, as EVP-CFO and Treasurer from January 2010 to September 2010, as Vice President (VP)-CFO and Treasurer from January 2009 to January 2010, as VP and Treasurer from January 2007 to January 2009, and as VP-Finance from August 2005 to January 2007.
Thomas L. Aller, 61, was elected Senior VP-Energy Resource Development effective January 2009. He previously served as Senior VP-Energy Delivery since January 2004.
Dundeana K. Doyle, 52, was elected Senior VP-Energy Delivery effective January 2009. She previously served as VP-Strategy and Regulatory Affairs since January 2007 and as VP-Strategy and Risk from May 2003 to January 2007.
John O. Larsen, 47, was elected Senior VP-Generation effective January 2010. He previously served as VP-Generation since August 2008 and as VP-Technical and Integrated Services from January 2004 to August 2008.
James H. Gallegos, 50, was elected VP and General Counsel effective November 2010. He previously served as VP and Corporate General Counsel of BNSF Railway Company, a subsidiary of Burlington Northern and Santa Fe Corporation from April 2003 to April 2010.
Thomas L. Hanson, 57, was elected VP-CFO and Treasurer effective February 2011. He previously served as VP-Chief Accounting Officer (CAO) and Treasurer since September 2010, as VP-Controller and CAO from January 2007 to September 2010 and as VP and Treasurer from April 2002 to January 2007.
31
Wayne A. Reschke, 55, was elected VP-Human Resources effective September 2009. He was previously a Partner of the Center for Organization Effectiveness, Inc. since 1996.
Joel J. Schmidt, 47, was elected VP-Regulatory and Financial Planning effective September 2010. He previously served as Director-Financial Planning and Analysis since May 2009, as Regional Director-Customer Service Operations from March 2008 to May 2009, as Chief Audit Executive from January 2008 to March 2008, as Chief Audit, Ethics, Risk and Compliance Officer from January 2007 to January 2008 and as Chief Audit and Risk Officer from January 2005 to January 2007.
Robert J. Durian, 40, was elected Controller and CAO effective February 2011. He previously served as Controller since September 2010, as Assistant Controller from March 2009 to September 2010 and as Director of Financial Reporting from February 2006 to March 2009.
Executive Officers of IPL
William D. Harvey, 61, was elected Chairman of the Board effective February 2006 and CEO effective July 2005 and has been a director since January 2005.
Thomas L. Aller, 61, was elected President effective January 2004.
Patricia L. Kampling, 51, was elected COO effective February 2011.
Dundeana K. Doyle, 52, was elected Senior VP-Energy Delivery effective January 2009.
John O. Larsen, 47, was elected Senior VP-Generation effective January 2010.
James H. Gallegos, 50, was elected VP and General Counsel effective November 2010.
Thomas L. Hanson, 57, was elected VP-CFO and Treasurer effective February 2011.
Wayne A. Reschke, 55, was elected VP-Human Resources effective September 2009.
Joel J. Schmidt, 47, was elected VP-Regulatory and Financial Planning effective September 2010.
Robert J. Durian, 40, was elected Controller and CAO effective February 2011.
Executive Officers of WPL
William D. Harvey, 61, was elected Chairman of the Board effective February 2006 and CEO effective July 2005, and has been a director since January 2005.
John O. Larsen, 47, was elected President effective December 2010. He previously served as Senior VP-Generation since January 2010.
Patricia L. Kampling, 51, was elected COO effective February 2011.
Thomas L. Aller, 61, was elected Senior VP-Energy Resource Development effective January 2009.
Dundeana K. Doyle, 52, was elected Senior VP-Energy Delivery effective January 2009.
James H. Gallegos, 50, was elected VP and General Counsel effective November 2010.
Thomas L. Hanson, 57, was elected VP-CFO and Treasurer effective February 2011.
Wayne A. Reschke, 55, was elected VP-Human Resources effective September 2009.
Joel J. Schmidt, 47, was elected VP-Regulatory and Financial Planning effective September 2010.
Robert J. Durian, 40, was elected Controller and CAO effective February 2011.
PART II
| ITEM 5. | MARKET FOR REGISTRANTS’ COMMON EQUITY, RELATED STOCKHOLDER MATTERS AND ISSUER PURCHASES OF EQUITY SECURITIES |
Stock Price - Alliant Energy’s common stock trades on the New York Stock Exchange under the symbol “LNT.” Quarterly sales price ranges and dividends with respect to Alliant Energy’s common stock were as follows:
| | | | | | | | | | | | |
| | | 2010 | | 2009 |
| Quarter | | High | | Low | | Dividend | | High | | Low | | Dividend |
| First | | $33.87 | | $30.12 | | $0.395 | | $30.50 | | $20.31 | | $0.375 |
| Second | | 35.77 | | 29.20 | | 0.395 | | 26.26 | | 22.08 | | 0.375 |
| Third | | 36.74 | | 31.12 | | 0.395 | | 28.78 | | 24.73 | | 0.375 |
| Fourth | | 37.65 | | 35.66 | | 0.395 | | 31.53 | | 26.08 | | 0.375 |
| Year | | 37.65 | | 29.20 | | 1.58 | | 31.53 | | 20.31 | | 1.50 |
Stock closing price at Dec. 31, 2010: $36.77
32
Shareowners - At Dec. 31, 2010, there were 35,703 holders of record of Alliant Energy’s common stock, including holders through Alliant Energy’s Shareowner Direct Plan. Alliant Energy is the sole common shareowner of all 13,370,788 and 13,236,601 shares of IPL and WPL common stock, respectively, currently outstanding.
Dividends - Alliant Energy does not have any significant common stock dividend restrictions. Although Alliant Energy’s practice has been to pay cash dividends on its common stock quarterly, the timing of payment and amount of future dividends are necessarily dependent upon future earnings, capital requirements, general financial conditions, general business conditions, the ability of Alliant Energy’s subsidiaries to pay dividends, approval from its Board of Directors and other factors. In December 2010, Alliant Energy announced an increase in its expected 2011 annual common stock dividend to $1.70 per share, which is equivalent to a quarterly rate of $0.425 per share, beginning with the Feb. 15, 2011 dividend payment. Payment of future 2011 quarterly dividends is subject to the actual dividend declaration by Alliant Energy’s Board of Directors.
Refer to Note 7(a) of the “Combined Notes to Consolidated Financial Statements” for information about IPL’s and WPL’s dividend restrictions and limitations on distributions to their parent company.
Common Stock Repurchases - A summary of Alliant Energy common stock repurchases for the quarter ended Dec. 31, 2010 was as follows:
| | | | | | | | |
Period | | Total Number
of Shares Purchased (a) | | Average Price
Paid Per Share | | Total Number of
Shares Purchased as
Part of Publicly Announced Plan | | Maximum Number (or
Approximate Dollar Value) of Shares That May Yet Be Purchased
Under the Plan (a) |
| Oct. 1 to Oct. 31 | | 188 | | $36.44 | | -- | | N/A |
| Nov. 1 to Nov. 30 | | 2,762 | | 36.78 | | -- | | N/A |
| Dec. 1 to Dec. 31 | | 1,007 | | 36.95 | | -- | | N/A |
| | | | | | | | |
Total | | 3,957 | | 36.81 | | -- | | |
| | | | | | | | |
| (a) | Includes 188, 2,762 and 143 shares of Alliant Energy common stock for Oct. 1 to Oct. 31, Nov. 1 to Nov. 30, and Dec. 1 to Dec. 31, respectively, purchased on the open market and held in a rabbi trust under the Alliant Energy Deferred Compensation Plan (DCP). There is no limit on the number of shares of Alliant Energy common stock that may be held under the DCP, which currently does not have an expiration date. Also includes 864 shares of Alliant Energy common stock for Dec. 1 to Dec. 31 transferred from employees to Alliant Energy to satisfy tax withholding requirements in connection with the vesting of certain restricted stock under the EIP. |
33
ITEM 6. SELECTED FINANCIAL DATA
Alliant Energy
| | | | | | | | | | | | | | | | | | | | |
| Financial Information | | 2010 (a) | | | 2009 (a) | | | 2008 (a) | | | 2007 | | | 2006 | |
| | | (dollars in millions, except per share data) | |
Income Statement Data: | | | | | | | | | | | | | | | | | | | | |
Operating revenues | | | $3,416.1 | | | | $3,427.3 | | | | $3,669.1 | | | | $3,430.6 | | | | $3,352.4 | |
Income from continuing operations, net of tax | | | 308.0 | | | | 128.8 | | | | 298.1 | | | | 443.8 | | | | 356.5 | |
Income (loss) from discontinued operations, net of tax | | | (1.7) | | | | 0.9 | | | | 8.6 | | | | 0.2 | | | | (22.1) | |
Net income | | | 306.3 | | | | 129.7 | | | | 306.7 | | | | 444.0 | | | | 334.4 | |
Amounts attributable to Alliant Energy common shareowners: | | | | | | | | | | | | | | | | | | | | |
Income from continuing operations, net of tax | | | 289.3 | | | | 110.1 | | | | 279.4 | | | | 425.1 | | | | 337.8 | |
Income (loss) from discontinued operations, net of tax | | | (1.7) | | | | 0.9 | | | | 8.6 | | | | 0.2 | | | | (22.1) | |
Net income | | | 287.6 | | | | 111.0 | | | | 288.0 | | | | 425.3 | | | | 315.7 | |
Common Stock Data: | | | | | | | | | | | | | | | | | | | | |
Earnings per weighted average common share attributable to | | | | | | | | | | | | | | | | | | | | |
Alliant Energy common shareowners (basic): | | | | | | | | | | | | | | | | | | | | |
Income from continuing operations, net of tax | | | $2.62 | | | | $1.00 | | | | $2.53 | | | | $3.79 | | | | $2.89 | |
Income (loss) from discontinued operations, net of tax | | | ($0.02) | | | | $0.01 | | | | $0.08 | | | | $- | | | | ($0.19) | |
Net income | | | $2.60 | | | | $1.01 | | | | $2.61 | | | | $3.79 | | | | $2.70 | |
Earnings per weighted average common share attributable to | | | | | | | | | | | | | | | | | | | | |
Alliant Energy common shareowners (diluted): | | | | | | | | | | | | | | | | | | | | |
Income from continuing operations, net of tax | | | $2.62 | | | | $1.00 | | | | $2.53 | | | | $3.78 | | | | $2.88 | |
Income (loss) from discontinued operations, net of tax | | | ($0.02) | | | | $0.01 | | | | $0.08 | | | | $- | | | | ($0.19) | |
Net income | | | $2.60 | | | | $1.01 | | | | $2.61 | | | | $3.78 | | | | $2.69 | |
Common shares outstanding at year-end (000s) | | | 110,894 | | | | 110,656 | | | | 110,449 | | | | 110,359 | | | | 116,127 | |
Dividends declared per common share | | | $1.58 | | | | $1.50 | | | | $1.40 | | | | $1.27 | | | | $1.15 | |
Market value per share at year-end | | | $36.77 | | | | $30.26 | | | | $29.18 | �� | | | $40.69 | | | | $37.77 | |
Book value per share at year-end | | | $26.09 | | | | $25.06 | | | | $25.56 | | | | $24.30 | | | | $22.83 | |
Market capitalization at year-end | | | $4,077.6 | | | | $3,348.5 | | | | $3,222.9 | | | | $4,490.5 | | | | $4,386.1 | |
Other Selected Financial Data: | | | | | | | | | | | | | | | | | | | | |
Cash flows from operating activities | | | $984.9 | | | | $657.1 | | | | $338.2 | | | | $607.5 | | | | $422.0 | |
Construction and acquisition expenditures | | | $866.9 | | | | $1,202.6 | | | | $879.0 | | | | $542.0 | | | | $399.0 | |
Total assets at year-end | | | $9,282.9 | | | | $9,036.0 | | | | $8,201.5 | | | | $7,189.7 | | | | $7,084.1 | |
Long-term obligations, net | | | $2,710.3 | | | | $2,512.2 | | | | $1,887.1 | | | | $1,547.1 | | | | $1,520.7 | |
Times interest earned before income taxes (b) | | | 3.78X | | | | 1.77X | | | | 4.48X | | | | 7.00X | | | | 4.84X | |
Capitalization ratios: | | | | | | | | | | | | | | | | | | | | |
Common equity | | | 49% | | | | 49% | | | | 56% | | | | 59% | | | | 58% | |
Preferred stock | | | 4% | | | | 4% | | | | 5% | | | | 5% | | | | 5% | |
Long- and short-term debt | | | 47% | | | | 47% | | | | 39% | | | | 36% | | | | 37% | |
| | | | |
Total | | | 100% | | | | 100% | | | | 100% | | | | 100% | | | | 100% | |
| | | | |
| | | | | |
| (a) | Refer to “Alliant Energy’s Results of Operations” in MDA for discussion of the 2010, 2009 and 2008 results of operations. |
| (b) | Represents the sum of income from continuing operations before income taxes plus interest expense, divided by interest expense. The calculation does not consider the “Loss on early extinguishment of debt” that Alliant Energy has incurred as part of interest expense. |
34
| | | | | | | | | | | | | | | | | | | | |
| IPL | | 2010 (a) | | | 2009 (a) | | | 2008 (a) | | | 2007 | | | 2006 | |
| | | (in millions) | |
Operating revenues | | | $1,795.8 | | | | $1,708.0 | | | | $1,758.0 | | | | $1,695.9 | | | | $1,754.8 | |
Net income | | | 143.4 | | | | 153.0 | | | | 141.6 | | | | 290.3 | | | | 172.4 | |
Earnings available for common stock | | | 128.0 | | | | 137.6 | | | | 126.2 | | | | 274.9 | | | | 157.0 | |
Cash dividends declared on common stock | | | -- | | | | -- | | | | 29.1 | | | | 609.9 | | | | 219.8 | |
Cash flows from operating activities | | | 549.6 | | | | 373.2 | | | | 113.7 | | | | 257.4 | | | | 272.2 | |
Total assets | | | 4,937.6 | | | | 4,892.2 | | | | 4,210.9 | | | | 3,362.0 | | | | 3,628.6 | |
Long-term obligations, net | | | 1,310.6 | | | | 1,160.9 | | | | 996.8 | | | | 765.4 | | | | 895.0 | |
| (a) | Refer to “IPL’s Results of Operations” in MDA for a discussion of the 2010, 2009 and 2008 results of operations. |
Alliant Energy is the sole common shareowner of all 13,370,788 shares of IPL’s common stock outstanding. As such, earnings per share data is not disclosed herein.
| | | | | | | | | | | | | | | | | | | | |
| WPL | | 2010 (a) | | | 2009 (a) | | | 2008 (a) | | | 2007 | | | 2006 | |
| | | (in millions) | |
Operating revenues | | | $1,423.6 | | | | $1,386.1 | | | | $1,465.8 | | | | $1,416.8 | | | | $1,401.3 | |
Net income | | | 152.3 | | | | 89.5 | | | | 118.4 | | | | 113.5 | | | | 105.3 | |
Earnings available for common stock | | | 149.0 | | | | 86.2 | | | | 115.1 | | | | 110.2 | | | | 102.0 | |
Cash dividends declared on common stock | | | 109.5 | | | | 91.0 | | | | 91.3 | | | | 191.1 | | | | 92.2 | |
Cash flows from operating activities | | | 372.4 | | | | 305.8 | | | | 239.7 | | | | 258.0 | | | | 162.6 | |
Total assets | | | 3,889.6 | | | | 3,681.4 | | | | 3,265.5 | | | | 2,788.6 | | | | 2,699.1 | |
Long-term obligations, net | | | 1,193.7 | | | | 1,146.3 | | | | 899.0 | | | | 715.7 | | | | 524.5 | |
| (a) | Refer to “WPL’s Results of Operations” in MDA for a discussion of the 2010, 2009 and 2008 results of operations. |
Alliant Energy is the sole common shareowner of all 13,236,601 shares of WPL’s common stock outstanding. As such, earnings per share data is not disclosed herein.
35
| ITEM 7. | MANAGEMENT’S DISCUSSION AND ANALYSIS OF FINANCIAL CONDITION AND RESULTS OF OPERATIONS (MDA) |
This MDA includes information relating to Alliant Energy Corporation (Alliant Energy), Interstate Power and Light Company (IPL) and Wisconsin Power and Light Company (WPL), as well as Alliant Energy Resources, LLC (Resources) and Alliant Energy Corporate Services, Inc. (Corporate Services). Where appropriate, information relating to a specific entity has been segregated and labeled as such. The following discussion and analysis should be read in conjunction with the Consolidated Financial Statements and Combined Notes to Consolidated Financial Statements included in this report. Unless otherwise noted, all “per share” references in MDA refer to earnings per diluted share.
CONTENTS OF MDA
Alliant Energy’s, IPL’s and WPL’s MDA consists of the following information:
| | | | |
| • | | Executive Summary |
| • | | Strategic Overview |
| • | | Rate Matters |
| • | | Environmental Matters |
| • | | Legislative Matters |
| • | | Alliant Energy’s Results of Operations |
| • | | IPL’s Results of Operations |
| • | | WPL’s Results of Operations |
| • | | Liquidity and Capital Resources |
| • | | Other Matters |
| | • | | Market Risk Sensitive Instruments and Positions |
| | • | | New Accounting Pronouncements |
| | • | | Critical Accounting Policies and Estimates |
| | • | | Other Future Considerations |
EXECUTIVE SUMMARY
Description of Business
General - Alliant Energy is an investor-owned public utility holding company whose primary subsidiaries are IPL, WPL, Resources and Corporate Services. IPL is a public utility engaged principally in the generation and distribution of electricity and the distribution and transportation of natural gas in selective markets in Iowa and southern Minnesota. WPL is a public utility engaged principally in the generation and distribution of electricity and the distribution and transportation of natural gas in selective markets in southern and central Wisconsin. WPL also owns an approximate 16% interest in the American Transmission Company LLC (ATC), a transmission-only utility operating in Wisconsin, Michigan, Illinois and Minnesota. Resources is the parent company for Alliant Energy’s non-regulated businesses. Corporate Services provides administrative services to Alliant Energy and its subsidiaries. An illustration of Alliant Energy’s primary businesses is shown below.
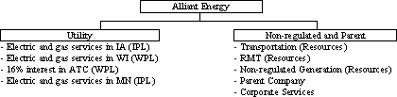
Utility Business- IPL and WPL own a portfolio of electric generating facilities located in Iowa, Wisconsin and Minnesota with a diversified fuel mix including coal, natural gas and renewable resources. The output from these generating facilities, supplemented with purchased power, is used to provide electric service to approximately 1 million electric customers in the upper Midwest. The utility business also procures natural gas from various suppliers to provide service to approximately 412,000 retail gas customers in the upper Midwest. Alliant Energy’s utility business is its primary source of earnings and cash flows. The earnings and cash flows from the utility business are sensitive to various external factors including, but not limited to, the amount and timing of rate relief approved by regulatory authorities, the impact of weather and economic
36
conditions on electric and gas sales volumes and other factors listed in “Risk Factors” in Item 1A and “Forward-looking Statements.”
Non-regulated Businesses- Resources manages various businesses including Transportation (short-line railway and barge transportation services), RMT (environmental, consulting, engineering and renewable energy services), Non-regulated Generation (electric generating facilities management) and several other modest investments.
Parent and Other- includes operations of Alliant Energy (parent holding company) and Corporate Services.
Financial Results
Alliant Energy’s earnings per weighted average common share (EPS) attributable to Alliant Energy common shareowners for 2010 and 2009 were as follows:
| | | | | | | | | | |
| | | 2010 | | | 2009 | | | |
Income from continuing operations | | | $2.62 | | | | $1.00 | | | |
Income (loss) from discontinued operations | | | (0.02) | | | | 0.01 | | | |
| | | | | | | | | | |
Net income | | | $2.60 | | | | $1.01 | | | |
| | | | | | | | | | |
Additional details regarding Alliant Energy’s net income and EPS attributable to Alliant Energy common shareowners were as follows (in millions):
| | | | | | | | | | | | | | | | | | |
| | | 2010 | | | 2009 | | | |
| Continuing operations: | | Net Income | | | EPS | | | Net Income | | | EPS | | | |
Utility | | | $277.0 | | | | $2.51 | | | | $223.8 | | | | $2.03 | | | |
Non-regulated and parent | | | 12.3 | | | | 0.11 | | | | (113.7) | | | | (1.03) | | | |
| | | | | | | | | | | | | | | | | | |
Income from continuing operations | | | 289.3 | | | | 2.62 | | | | 110.1 | | | | 1.00 | | | |
Income (loss) from discontinued operations | | | (1.7) | | | | (0.02) | | | | 0.9 | | | | 0.01 | | | |
| | | | | | | | | | | | | | | | | | |
Net income | | | $287.6 | | | | $2.60 | | | | $111.0 | | | | $1.01 | | | |
| | | | | | | | | | | | | | | | | | |
The table above includes utility, non-regulated and parent earnings (losses) per share from continuing operations, which are non-GAAP (accounting principles generally accepted in the United States of America (U.S.)) financial measures. Alliant Energy believes utility, non-regulated and parent earnings (losses) per share from continuing operations are useful to investors because they facilitate an understanding of segment performance and trends and provide additional information about Alliant Energy’s operations on a basis consistent with the measures that management uses to manage its operations and evaluate its performance. Alliant Energy’s management also uses utility earnings per share from continuing operations to determine incentive compensation.
Utility Business -Higher income from continuing operations in 2010 compared to 2009 was primarily due to:
| • | | $1.18 per share of higher revenues from non-fuel retail rate increases, net of reserves, implemented at IPL and WPL; |
| • | | an estimated $0.34 per share of higher revenues from changes in sales due to weather and impacts of 2009 weather hedges; |
| • | | $0.10 per share of charges incurred in 2009 for proposed coal plants at IPL and WPL; |
| • | | $0.09 per share of restructuring and impairment charges incurred in 2009; and |
| • | | $0.07 per share of production tax credits in 2010 for IPL’s Whispering Willow - East wind project. |
These items were partially offset by:
| • | | $0.32 per share of state income tax benefits in 2009 related to combined reporting for corporate income taxation in Wisconsin enacted in 2009 and a decision by management to allow WPL to do business in Iowa; |
| • | | $0.29 per share of higher electric transmission service expenses; |
| • | | $0.15 per share of higher incentive-related compensation expenses; |
| • | | $0.14 per share of higher depreciation and operating expenses for IPL’s Whispering Willow - East wind project, which was placed into service in late 2009; |
| • | | $0.12 per share of regulatory-related charges and credits in 2010 from IPL’s retail electric rate case decision; |
| • | | $0.11 per share of lower allowance for funds used during construction (AFUDC) in 2010 primarily due to lower wind construction work in progress balances at IPL; |
| • | | $0.08 per share of charges in 2010 related to the impacts of federal health care legislation enacted in 2010; and |
| • | | $0.06 per share of lower electric margins related to the changes in the recovery of electric production fuel and energy purchases at WPL. |
37
Non-regulated and parent- Higher income from continuing operations in 2010 compared to 2009 was primarily due to a $1.16 per share loss incurred in 2009 on the early extinguishment of Alliant Energy’s Exchangeable Senior Notes due 2030, partially offset by $0.04 per share of state income tax benefits in 2009 related to combined reporting for corporate income taxation in Wisconsin enacted in 2009.
Refer to “Alliant Energy’s Results of Operations,” “IPL’s Results of Operations” and “WPL’s Results of Operations” for additional details regarding the various factors impacting their respective earnings during 2010 , 2009 and 2008.
Strategic Overview
The strategic plans for Alliant Energy, IPL and WPL focus on construction of new wind generating facilities, purchasing newer and more-efficient coal and natural gas generating facilities and implementing emission controls and performance upgrades at their newer, larger and more-efficient generating facilities to enable the utilities to continue to produce reliable and affordable energy for their customers. Key strategic plan developments impacting Alliant Energy, IPL and WPL during 2010 and early 2011 include:
| • | | April 2010 - WPL announced plans to purchase Wisconsin Electric Power Company’s (WEPCO’s) 25% ownership interest in the Edgewater Generating Station Unit 5 (Edgewater Unit 5), subject to regulatory approval. WPL currently expects the transaction to close in the first half of 2011. |
| • | | May 2010 - WPL received an order from the Public Service Commission of Wisconsin (PSCW) authorizing the installation of a selective catalytic reduction (SCR) system at Edgewater Unit 5 to reduce nitrogen oxide (NOx) emissions at the facility. Construction of the SCR system began in the third quarter of 2010. |
| • | | July 2010 - IPL completed the installation of an SCR system and a baghouse at Lansing Unit 4. |
| • | | October 2010 - The Iowa Utilities Board (IUB) approved IPL’s updated Emissions Plan and Budget (EPB), which includes various emission control projects for its electric generating facilities including a planned scrubber to be installed at IPL’s Lansing Generating Station Unit 4 (Lansing Unit 4) and a planned scrubber and baghouse to be installed at IPL’s Ottumwa Generating Station (Ottumwa). |
| • | | November 2010 - IPL filed its Integrated Resource Plan (IRP) with the Minnesota Public Utilities Commission (MPUC). The IRP included plans for the retirement of several older, smaller and less-efficient electric generating facilities in IPL’s generation portfolio. |
| • | | February 2011 - WPL’s 200 megawatt (MW) Bent Tree - Phase I wind project in Freeborn County, Minnesota began full commercial operation. |
| • | | February 2011- WPL received approval from the PSCW to install scrubbers and baghouses at Columbia Units 1 and 2 to reduce SO2 and mercury emissions, respectively, at the facility. |
Refer to “Strategic Overview” for additional details regarding strategic plan developments.
Rate Matters
Alliant Energy’s utility subsidiaries, IPL and WPL, are subject to federal regulation by the Federal Energy Regulatory Commission (FERC), which has jurisdiction over wholesale electric rates, and state regulation in Iowa, Wisconsin and Minnesota for retail utility rates. Key regulatory developments impacting Alliant Energy, IPL and WPL during 2010 and early 2011 include:
| • | | January 2010 - IPL received an order from the IUB authorizing a final annual retail electric rate increase of $84 million, or approximately 7%, plus the use of a portion of IPL’s regulatory liabilities to offset costs related to the cancelled Sutherland #4 project and future transmission service costs. The order also authorized IPL to recover $8 million of flood-related costs incurred in 2008. |
| • | | May 2010 - IPL filed a request with the MPUC to increase annual rates for its Minnesota retail electric customers by $15 million, or approximately 22%. The request was based on a 2009 historical test year. An interim retail rate increase of $14 million, or approximately 20% on an annual basis, was implemented effective in July 2010 and is subject to refund pending determination of final rates from the request. In January 2011, IPL filed rebuttal testimony and reduced its requested increase to $14 million. |
| • | | December 2010 - WPL received an order from the PSCW authorizing an annual retail electric rate increase of $8 million, or approximately 1%, effective Jan. 1, 2011, related to WPL’s request to reopen the rate order for its 2010 test year. In addition, WPL received an order from the PSCW authorizing no increase in retail electric rates in 2010 related to fuel-related costs and required a 2010 interim rate increase of $9 million to terminate effective Dec. 31, 2010. These two items will result in a net $1 million decrease in annual electric retail rates charged to customers effective January 2011. |
| • | | February 2011 - IPL received an order from the IUB authorizing a final annual retail electric rate increase of $114 million, or approximately 10%. The IUB issued a separate order in January 2011 that: 1) approved IPL’s proposed transmission cost rider conditional upon IPL’s agreement to not file an electric base rate case for three years from the date of the order; 2) disallowed return on investment treatment for the portion of Whispering Willow - East costs incurred above the cost cap associated with the wind turbine generators; 3) authorized use of regulatory liabilities to implement a customer cost management plan and offset certain electric transmission service costs expected in 2011 and certain capital costs for the Whispering Willow - East wind project; 4) limited recovery of and return on investment treatment to 52.5% of the remaining net book value of the Sixth Street Generating Station (Sixth Street); and 5) allowed recovery of $7 million of flood-related costs previously incurred in 2009. |
38
| • | | January 2011 - New electric fuel cost recovery rules in Wisconsin became effective, which allow WPL to automatically defer electric fuel-related costs that fall outside a symmetrical cost tolerance band and reflect the over- /under-recovery of these deferred costs in future billings to its retail customers. |
Refer to “Rate Matters” for additional details regarding regulatory developments.
Environmental Matters
Alliant Energy, IPL and WPL are subject to regulation of environmental matters by various federal, state and local authorities. Key environmental developments during 2010 and early 2011 that may impact Alliant Energy, IPL and WPL include:
| • | | January 2010 - The U.S. Environmental Protection Agency (EPA) issued an information collection request for coal- and oil-fired electric generating units (EGUs) over 25 MW in order to develop a proposed Utility Maximum Achievable Control Technology (MACT) Rule for the control of mercury and other federal hazardous air pollutants (HAPs). Compliance with a MACT Rule is currently expected to be required by November 2014. |
| • | | June 2010 - The EPA issued a final rule that establishes a new one-hour National Ambient Air Quality Standards (NAAQS) for sulfur dioxide (SO2) at a level of 75 parts per billion (ppb). Compliance with the new SO2 NAAQS rule is currently expected to be required by 2017. The final rule is being challenged by several groups in the D.C. Circuit Court. |
| • | | June 2010 - The EPA issued a proposed rule seeking comment regarding two potential regulatory options for management of Coal Combustion Residuals (CCRs): 1) regulate as a special waste under the hazardous waste regulations when the CCR is destined for disposal, but continue to allow beneficial use of CCRs as a non-hazardous material; or 2) regulate as a non-hazardous waste for all applications subject to new national standards. The schedule for compliance with this rule has not yet been established. |
| • | | July 2010 - The EPA issued its proposed Clean Air Interstate Rule (CAIR) replacement rule, referred to as the Clean Air Transport Rule (CATR), which would require SO2 and NOx emissions reductions beginning in 2012 from IPL’s and WPL’s fossil-fueled EGUs with greater than 25 MW of capacity located in Iowa, Minnesota and Wisconsin. |
| • | | September 2010 - The Sierra Club filed complaints in U.S. District Court against WPL alleging air permitting violations at WPL’s Nelson Dewey, Columbia and Edgewater generating facilities. |
| • | | October 2010 - The EPA approved the Wisconsin State Thermal Rule. Compliance with this rule will be evaluated on a case-by-case basis as wastewater discharge permits for WPL’s generating facilities are renewed in the future. |
| • | | December 2010 - The EPA announced the future issuance of greenhouse gas (GHG) standards for electric utilities under the Clean Air Act (CAA). The GHG emission limits are to be established as New Source Performance Standards (NSPS) for new and existing fossil-fueled EGUs. The EPA is expected to propose NSPS by July 2011 and finalize NSPS by May 2012. The schedule for compliance with NSPS has not yet been established. |
| • | | January 2011 - The EPA’s GHG Tailoring Rule became effective. The rule establishes a GHG threshold for major sources under the Prevention of Significant Deterioration (PSD) and Title V Operation Permit programs at 100,000 tons per year of CO2-equivalent (CO2e). The rule is subject to legal challenge. |
| • | | February 2011 - The EPA promulgated a revised Industrial Boiler and Process Heater MACT Rule related to HAPs from fossil-fueled EGUs with less than 25 MW capacity as well as certain auxiliary boilers and process heaters operated at EGUs. The compliance deadline for this rule is currently expected to be 2014. |
Refer to “Environmental Matters” for additional details regarding environmental developments.
Legislative Matters
Alliant Energy, IPL and WPL monitor various legislative developments, including those relating to energy, tax, financial and other matters. Key legislative developments impacting Alliant Energy, IPL and WPL during 2010 include:
| • | | March 2010 - Federal health care legislation was enacted. One of the most significant provisions of the federal health care legislation for Alliant Energy, IPL and WPL requires a reduction in their tax deductions for retiree health care costs beginning in 2013, to the extent their drug expenses are reimbursed under the Medicare Part D retiree drug subsidy program. The reduction in the future deductibility of retiree health care costs accrued as of Dec. 31, 2009 required Alliant Energy, IPL and WPL to record deferred income tax expense of $7 million, $4 million and $3 million, respectively, in 2010. |
| • | | July 2010 - The Dodd-Frank Wall Street Reform and Consumer Protection Act (Dodd-Frank Act) was enacted. One of the most significant financial provisions of the Dodd-Frank Act for Alliant Energy, IPL and WPL is a commercial end-user exemption that is expected to allow utilities to continue trading derivatives “over-the-counter” without having to make such trades through cleared exchanges with collateral requirements. |
39
| • | | September 2010 and December 2010 - The Small Business Jobs Act of 2010 (SBJA) and the Tax Relief, Unemployment Insurance Reauthorization and Job Creation Act of 2010 (the Act) were enacted. The most significant provisions of the SBJA and the Act for Alliant Energy, IPL and WPL provide an extension of the bonus depreciation deductions for certain expenditures for property that are incurred through Dec. 31, 2012. |
Refer to “Legislative Matters” for additional details regarding legislative developments.
Liquidity and Capital Resources
Based on their current liquidity positions and capital structures, Alliant Energy, IPL and WPL believe they will be able to secure the additional capital required to implement their strategic plans and to meet their long-term contractual obligations.
Key financing developments impacting Alliant Energy, IPL and WPL during 2010 include:
| • | | March 2010 - WPL paid at maturity $100 million of its 7.625% debentures. |
| • | | April 2010 - IPL’s amended and restated Receivables Purchase and Sale Agreement became effective. IPL expects to receive up to $160 million of outstanding cash proceeds from the sale of receivables during the term of the Agreement. |
| • | | June 2010 - IPL issued $150 million of 3.3% senior debentures due 2015 and WPL issued $150 million of 4.6% debentures due 2020. Proceeds from these issuances were used initially to repay short-term debt and invest in short-term assets, and thereafter to fund capital expenditures and for general working capital purposes. |
| • | | August 2010 - IPL issued $200 million of 3.65% senior debentures due 2020 and used the proceeds in September 2010 to retire $200 million of its 6.75% senior debentures due 2011. |
| • | | October 2010 - The MPUC denied IPL’s petition for approval of an amended affiliate interest agreement related to its sales of accounts receivable program and deferred the issue to IPL’s current Minnesota retail electric rate case proceeding. |
| • | | November 2010 - IPL’s shelf registration became effective, which provides IPL the flexibility to offer up to $600 million of preferred stock and unsecured debt securities from November 2010 through November 2013. |
| • | | December 2010 - The PSCW authorized WPL to issue up to $200 million of long-term debt securities in 2011. |
| • | | December 2010 - Alliant Energy announced an increase in its expected 2011 annual common stock dividend from $1.58 per share to $1.70 per share, which is equivalent to a rate of $0.425 per share per quarter, beginning with the Feb. 15, 2011 dividend payment. |
| • | | December 2010 - At Dec. 31, 2010, Alliant Energy and its subsidiaries had $576 million of available capacity under their revolving credit facilities, $95 million of available capacity at IPL under its sales of accounts receivable program and $159 million of cash and cash equivalents. |
Refer to “Liquidity and Capital Resources” for additional details regarding financing developments.
STRATEGIC OVERVIEW
Strategic Plan- Alliant Energy’s, IPL’s and WPL’s strategic plan focuses on their core business of delivering regulated electric and natural gas service in their Iowa, Wisconsin and Minnesota service territories. The strategic plan is built upon three key elements: competitive costs, reliable service and balanced generation.
Competitive Costs -Providing competitive and predictable energy costs for customers is a key element of the strategic plan. Alliant Energy, IPL and WPL are aware that the majority of their costs become part of rates charged to their customers and any rate increase has an impact on their customers. Given that potential public policy changes and resulting increases in future energy cost are possible, Alliant Energy, IPL and WPL are focused on controlling their costs with the intent of providing competitive rates to their customers. Energy efficiency is also an important part of the strategic plan and is an option that provides customers with the opportunity to save on their energy bills. Alliant Energy’s, IPL’s and WPL’s approach to energy efficiency is based on regulations in Iowa, Wisconsin and Minnesota. The objective in each of these states is to meet prescribed goals in the most cost-effective manner. Additional details regarding energy efficiency programs used by Alliant Energy, IPL and WPL are included in “Energy Efficiency Programs” below.
Reliable Service- The strategic plan is intended to focus resources on providing reliable electricity and natural gas service. Investments are expected to be targeted in system improvements, replacing aging infrastructure and distribution grid efficiency to maintain strong reliability. Alliant Energy, IPL and WPL monitor system performance and take the necessary steps to continually improve the reliability of their service for their customers. Providing exceptional customer service, including emergency and outage response, is part of Alliant Energy’s, IPL’s and WPL’s mission and commitment to the customers they serve.
40
Balanced Generation- Alliant Energy, IPL and WPL believe a balanced and flexible generation portfolio provides long-term advantages to their customers and shareowners. The strategic plan calls for a focus on reducing overall fuel costs and the volatility of those costs by reducing reliance on purchased electricity and generation produced by older, smaller and less -efficient EGUs to meet the demands of our customers. The strategic plan reflects the recent construction of new wind generating facilities by IPL and WPL and proposed acquisitions of newer and more-efficient coal and natural gas plants by WPL to replace the electricity from purchased power agreements (PPAs) and generation produced by less efficient EGUs. Additional details of changes to the generation portfolio of IPL and WPL are included in “Generation Plans” below. The strategic plan also includes investments in performance and reliability upgrades and new emission controls at newer, larger, more-efficient EGUs to continue producing affordable energy for customers and to benefit the environment. Additional details regarding proposed new emission controls for IPL’s and WPL’s generating facilities are included in “Environmental Compliance Plans” below. Alliant Energy, IPL and WPL believe a diversified fuel mix for EGUs is important to meeting the needs of their customers, shareowners and the environment while preparing for a potentially carbon-constrained environment in the future.
The strategic plan for Alliant Energy’s non-regulated operations involves maintaining a portfolio of businesses that are accretive to earnings but not significant users of capital.
Generation Plans- Alliant Energy, IPL and WPL review and update, as deemed necessary and in accordance with regulatory requirements, their generation plans. Alliant Energy, IPL and WPL are currently evaluating the types of capacity additions they will pursue to meet their customers’ long-term energy needs and are monitoring several related external factors that will influence those evaluations. Some of these external factors include regulatory decisions regarding proposed projects, changes in long-term projections of customer demand, availability and cost effectiveness of different generation technologies, market conditions for obtaining financing, developments related to federal and state renewable portfolio standards, environmental requirements, such as future carbon and renewable requirements, and federal and state tax incentives.
New Generation Projects -Alliant Energy’s, IPL’s and WPL’s new generation projects through 2013 are as follows (To Be Determined (TBD); Not Applicable (N/A)):
| | | | | | | | | | | | |
Primary Generation Type | | Project Name / Location | | Capacity (MW) | | Actual / Expected
Availability Date | | Cost Estimate (a) | | Current Capitalized Costs (b) | | Actual / Expected
Regulatory Decision Date |
Wind | | Whispering Willow Franklin County, IA | | 100 | | TBD | | $225 - $250 | | $81 | | TBD |
| | | | | | |
WPL: | | | | | | | | | | | | |
Wind | | Bent Tree - Phase I Freeborn County, MN | | 200 | | Q4 2010 and Q1 2011 | | 440 - 450 | | 406 | | October 2009 |
| | | | | | |
Natural gas | | Riverside Energy Center Beloit, WI | | 600 | | 2013 | | 365 - 375 | | N/A | | 2012 - 2013 |
| | | | | | |
Coal | | 25% of Edgewater Unit 5 Sheboygan, WI | | 95 | | 2011 | | 40 - 45 | | N/A | | First half of 2011 |
| | | | | | | | | | | | |
| | | | | | | | | | $487 | | |
| | | | | | | | | | | | |
| (a) | Cost estimates represent IPL’s or WPL’s estimated portion of the total escalated construction and acquisition expenditures in millions of dollars and exclude AFUDC, if applicable. |
| (b) | Costs represent capitalized expenditures in millions of dollars recorded in “Property, plant and equipment” on the respective Consolidated Balance Sheets as of Dec. 31, 2010 and exclude AFUDC or capitalized interest, if applicable. |
Wind Generation Projects
Wind Turbine Generators - In 2008, Alliant Energy entered into a master supply agreement with Vestas-American Wind Technology, Inc. (Vestas) to purchase 500 MW of wind turbine generator sets and related equipment. Alliant Energy utilized 400 MW of these wind turbine generator sets and related equipment to construct IPL’s Whispering Willow - East wind project and WPL’s Bent Tree - Phase I wind project. Alliant Energy believes the Whispering Willow wind site in Iowa is the best location to deploy the remaining 100 MW of wind turbine generator sets and related equipment and is currently evaluating which of its subsidiaries will construct the 100 MW wind project. The capitalized costs at Dec. 31, 2010 in the table above relate to progress payments to Vestas for the 100 MW of wind turbine generator sets and related equipment.
41
Bent Tree - Phase I Wind Project - In 2009, WPL acquired approximately 400 MW of wind site capacity in Freeborn County, Minnesota. WPL used 200 MW of the capacity from this site for its Bent Tree - Phase I wind project. WPL also used 200 MW of wind turbine generator sets and related equipment under the master supply agreement entered into with Vestas in 2008 for the Bent Tree - Phase I wind project. Construction of the Bent Tree - Phase I was completed and full commercial operation began in February 2011.
In 2009, Wisconsin Industrial Energy Group, Inc. (WIEG) and Citizens Utility Board (CUB) filed a Petition for Review with the Circuit Court of Dane County, Wisconsin seeking judicial review of: 1) the PSCW’s 2008 interim order that determined WPL’s application for the Bent Tree - Phase I wind project must be reviewed under the Certificate of Authority (CA) statute and not the Certificate of Public Convenience and Necessity statute; and 2) the PSCW’s 2009 final order that granted WPL a CA to construct the Bent Tree - Phase I wind project. In 2009, the PSCW filed a motion to dismiss the petition, which was subsequently denied in April 2010. In September 2010, WIEG’s and CUB’s Petition for Review was denied by the Circuit Court of Dane County, Wisconsin. WIEG and CUB appealed the Circuit Court’s decision to the Appellate Court. In January 2011, WIEG and CUB filed briefs in support of their appeal. The PSCW, WPL and other interveners have the opportunity to file a brief in February 2011. WPL expects a decision on this matter in 2011.
Refer to Note 1(e) of the “Combined Notes to Consolidated Financial Statements” for discussion of additional wind sites expected to be used by Alliant Energy, IPL and WPL to develop future wind projects.
Natural Gas-Fired Generation Projects
Riverside Energy Center (Riverside) - WPL has a PPA with a subsidiary of Calpine Corporation related to Riverside that extends through May 2013 and provides WPL the option to purchase Riverside at the end of the PPA term. For planning purposes, WPL currently anticipates it will exercise its option to purchase Riverside, a 600 MW natural gas-fired electric generating facility in Beloit, Wisconsin, to replace the output currently obtained under the PPA.
Coal-Fired Generation Projects
Edgewater Unit 5 - WPL and WEPCO entered into an agreement, which became effective in March 2010, for WPL to purchase WEPCO’s 25% ownership interest in Edgewater Unit 5 for WEPCO’s net book value, including working capital. The proposed transaction was approved by PSCW and FERC in 2010. WEPCO is currently working with the Michigan Public Service Commission to obtain satisfactory approval for the transaction. WPL currently expects the transaction to close in the first half of 2011 at an approximate purchase price of $40 million to $45 million depending on WEPCO’s working capital balances and level of capital investment in Edgewater Unit 5 prior to the sale. If the purchase is completed, WPL would own 100% of Edgewater Unit 5.
Generation Retirements -In 2010, IPL retired various older, smaller and less-efficient EGUs including Sixth Street, Lansing Generating Station Unit 2, Sutherland Generating Station Unit 2, Prairie Creek Generating Station Unit 2, M.L. Kapp Generating Station Unit 1, Agency Street Combustion Turbines Units 1-4, Dubuque Generating Station Unit 2, and Fox Lake Generating Station Units 2 and 4. IPL’s November 2010 IRP also begins a process of retiring Dubuque Generating Station Units 3 and 4 and Sutherland Unit 1. While it is expected that the retirement of these units will be completed by 2015, specific timing will depend on operational, market and other factors. In addition, IPL requested approval from the Midwest Independent Transmission System Operator (MISO) in January 2011 to retire Lansing Unit 3 and Fox Lake Unit 1. IPL expects a decision from MISO in the first half of 2011. The remaining units at each of these generating stations will continue to generate cost-effective electricity on behalf of IPL customers. Refer to Note 1(e) of the “Combined Notes to Consolidated Financial Statements” for further discussion, including details on IPL’s IRP filed with the MPUC in November 2010 for the 2010 through 2025 planning period.
Environmental Compliance Plans - Alliant Energy, IPL and WPL have developed environmental compliance plans to help ensure cost effective compliance with current and proposed environmental regulations expected to significantly reduce future emissions of NOx, SO2 and mercury at their generating facilities. Alliant Energy, IPL and WPL review and update, as deemed necessary and in accordance with regulatory requirements, their environmental compliance plans to address various external factors. Some of these external factors include regulatory decisions regarding proposed emission control projects, developments related to environmental regulations, outcomes of legal proceedings, availability and cost effectiveness of different emission reduction technologies, market prices for emission allowances, market conditions for obtaining financings and federal and state tax incentives. Refer to “Environmental Matters” for details of current and proposed environmental regulations, including regulations for which these plans are expected to support compliance obligations. The following provides details of capital expenditure estimates for 2011 through 2013 for emission control projects included in Alliant Energy, IPL’s and WPL’s current environmental compliance plans (in millions):
42
| | | | | | | | | | | | | | | | | | |
Generating Unit | | Emissions Controlled | | Technology (a) | | 2011 | | | 2012 | | | 2013 | | | |
IPL: | | | | | | | | | | | | | | | | | |
Ottumwa Unit 1 | | SO2 and Mercury | | Scrubber and Baghouse | | | $5 | | | | $45 | | | | $75 | | |
Lansing Unit 4 | | SO2 | | Scrubber | | | 5 | | | | 20 | | | | 15 | | |
Non-operated units | | Various | | Various | | | 25 | | | | 50 | | | | 30 | | |
| | | | | | | | | | | | | | | | | |
| | | | | | | 35 | | | | 115 | | | | 120 | | |
| | | | | | | | | | | | | | | | | |
WPL: | | | | | | | | | | | | | | | | | |
Edgewater Unit 5 (b) | | NOx | | SCR | | | 55 | | | | 60 | | | | 15 | | |
Columbia Units 1 and 2 | | SO2 and Mercury | | Scrubber and Baghouse | | | 20 | | | | 95 | | | | 125 | | |
| | | | | | | | | | | | | | | | | |
| | | | | | | 75 | | | | 155 | | | | 140 | | |
| | | | | | | | | | | | | | | | | |
Alliant Energy | | | | | | | $110 | | | | $270 | | | | $260 | | |
| | | | | | | | | | | | | | | | | |
| (a) | Selective Catalytic Reduction (SCR) is a post-combustion process that injects ammonia or urea into the stream of gases leaving the generating facility boiler to convert NOx emissions into nitrogen and water. The use of a catalyst enhances the effectiveness of the conversion enabling NOx emissions reductions of up to 90%. |
Baghouse / carbon injection processis a post-combustion process that injects carbon particles into the stream of gases leaving the generating facility boiler to facilitate the capture of mercury in filters or bags. A baghouse / carbon injection process can remove more than 85% of mercury emissions.
Scrubberis a post-combustion process that injects lime or lime slurry into the stream of gases leaving the generating facility boiler to remove SO2 and capture it in a solid or liquid waste by-product. A scrubber typically removes more than 90% of the SO2 emissions regardless of generating facility boiler type or design.
| (b) | Capital expenditure estimates above assume WPL acquires WEPCO’s 25% ownership interest in Edgewater Unit 5 in 2011. |
These capital expenditure estimates represent IPL’s or WPL’s respective portion of the total escalated capital expenditures and exclude AFUDC, if applicable. Capital expenditure estimates are subject to change based on future changes to plant-specific costs of emission control technologies and air quality rules. Alliant Energy, IPL and WPL are currently evaluating their environmental compliance plans for 2014 and beyond and will update their capital expenditure plans for these periods in the future when the plans are finalized. Refer to “Environmental Matters” for additional details regarding proposed environmental rules that may impact environmental compliance plans.
IPL’s Emission Control Projects - Under Iowa law, IPL is required to file an EPB at least bi-annually. Filing of annual periodic reports regarding the implementation of IPL’s compliance plan and related budget is also required under a settlement agreement between IPL and the Office of Consumer Advocate in Iowa. An EPB provides a utility’s compliance plan and related budget to meet applicable state environmental requirements and federal air quality standards. IUB approval of an EPB demonstrates that the IUB believes the EPB is reasonably expected to achieve cost-effective compliance with applicable state environmental requirements and federal air quality standards. In October 2010, the IUB approved the most recent EPB filed by IPL in April 2010. IPL’s EPB filing includes the emission control projects listed in the above table and discussed below.
Ottumwa Unit 1 - IPL’s current EPB approved by the IUB in October 2010 includes plans to install a scrubber and baghouse at Ottumwa to reduce SO2 and mercury emissions at the generating facility. The scrubber and baghouse at Ottumwa are expected to support compliance obligations for anticipated air quality regulatory requirements including the CATR and the Utility MACT Rule. IPL’s portion of total capital expenditures, excluding AFUDC, for the scrubber and baghouse is currently estimated to be between $135 million to $175 million, a portion of which is included in the above estimates for Alliant Energy’s and IPL’s environmental compliance plans. Alliant Energy and IPL currently expect the scrubber and baghouse at Ottumwa to be placed into service in 2014.
Lansing Unit 4 - In 2010, IPL completed the installation of an SCR system and a baghouse at Lansing Unit 4 to reduce NOx and mercury emissions at the generating facility at a total cost of approximately $190 million, excluding AFUDC. IPL’s current EPB approved by the IUB in October 2010 also includes plans to install a scrubber at Lansing Unit 4 to reduce SO2 emissions at the generating facility. IPL’s capital expenditures, excluding AFUDC, for the scrubber are currently estimated to be between $40 million to $60 million, a portion of which is included in the above estimates for Alliant Energy’s and IPL’s environmental compliance plans. Alliant Energy and IPL currently expect the scrubber at Lansing Unit 4 to be placed into service in 2014. The SCR system, baghouse and scrubber at Lansing Unit 4 are expected to support compliance obligations for current and anticipated air quality regulatory requirements, including CAIR, CATR and the Utility MACT
43
Rule. Refer to “Rate Matters” for discussion of rate cases filed in Iowa and Minnesota in 2010 for recovery of investments in the SCR system and baghouse at Lansing Unit 4.
WPL’s Emission Control Projects -WPL must file a CA and receive authorization from the PSCW to proceed with any individual clean air compliance project containing estimated project costs of $8 million or more. In March 2007, the PSCW approved the deferral of the retail portion of WPL’s incremental pre-certification and pre-construction costs for current or future clean air compliance rule projects requiring PSCW approval, effective on the request date of November 2006. Alliant Energy and WPL currently anticipate that such deferred costs will be recovered in future rates and therefore do not expect these costs to have an adverse impact on their financial condition or results of operations. WPL has filed CAs for the following individual clean air compliance projects.
Edgewater Unit 5 - In May 2010, WPL received an order from the PSCW authorizing the installation of an SCR system at Edgewater Unit 5 to reduce NOx emissions at the facility. Construction began in the third quarter of 2010 and is expected to be completed prior to May 2013 when additional NOx emission reductions at Edgewater are required for WPL to comply with Wisconsin Reasonably Available Control Technology (RACT) Rule compliance deadlines. As of Dec. 31, 2010, Alliant Energy and WPL recorded $17 million of capitalized expenditures, excluding AFUDC, related to this project in “Construction work in progress - other” on Alliant Energy’s and WPL’s Consolidated Balance Sheets. Total capital expenditures, excluding AFUDC, for the Edgewater Unit 5 SCR are currently estimated to be approximately $155 million assuming WPL acquires WEPCO’s 25% ownership interest in Edgewater Unit 5 in 2011. The portion of these capital expenditures expected to be incurred in 2011 through 2013 are included in the above estimates for Alliant Energy’s and WPL’s environmental compliance plans. The SCR system at Edgewater Unit 5 is expected to support compliance obligations for current and anticipated air quality regulatory requirements, including the CATR and the Wisconsin RACT Rule.
Columbia Units 1 and 2 - In February 2011, WPL received approval from the PSCW to install scrubbers and baghouses at Columbia Units 1 and 2 to reduce SO2 and mercury emissions, respectively, at the generating facility. WPL’s portion of the capital expenditures, excluding AFUDC, for the Columbia Units 1 and 2 emission controls is currently estimated to be $290 million, a portion of which is included in the above estimates for Alliant Energy’s and WPL’s environmental compliance plans. The scrubbers and baghouses at Columbia Units 1 and 2 are expected to be placed into service in 2014 and support compliance obligations for current and anticipated air quality regulatory requirements, including CATR, the Utility MACT Rule and the Wisconsin State Mercury Rule.
Nelson Dewey - In 2007, WPL filed a CA with the PSCW to install a scrubber and baghouse at the two existing units at Nelson Dewey to reduce SO2 and mercury emissions, respectively, at the generating facility. WPL is re-evaluating this project due to forthcoming changes in environmental rules and regulations. There are no capital expenditures included in the above table relating to this project.
Energy Efficiency Programs - Alliant Energy has several energy efficiency programs and initiatives that help customers reduce their energy usage and related costs through the use of new energy efficient equipment, products and practices. The following are Alliant Energy’s current key energy efficiency programs:
Smart Grid Initiatives - Smart Grid initiatives are designed to improve customer service, enhance energy management and conservation and provide operational savings through increased efficiencies of IPL’s and WPL’s electric distribution systems. Advanced metering infrastructure (AMI) is expected to be the foundation for the Smart Grid in Alliant Energy’s service territories. WPL has substantially completed its AMI deployment by installing over 641,000 AMI electric meters and gas modules in its service territory as of Dec. 31, 2010. WPL anticipates its total capital expenditures for AMI will be approximately $115 million upon completion of the deployment. There is approximately $10 million of planned AMI investment remaining to be made for system and network enhancements at WPL through 2013. IPL continues to assess the sequence and timing of AMI deployment in Iowa and Minnesota. IPL currently has no plans for large scale implementation of AMI technology prior to 2014.
IPL Energy Efficiency Plan (EEP) - - In 2008, IPL filed an EEP for 2009 through 2013 with the IUB. The EEP includes spending approximately $400 million for electrical and natural gas energy efficiency programs in Iowa from 2009 through 2013, and aspires to conserve electric and gas usage equal to that of more than 100,000 homes. In accordance with Iowa law, IPL is required to file an EEP every five years. An EEP provides a utility’s plan and related budget to achieve specified levels of energy savings. IUB approval demonstrates that the IUB believes that IPL’s EEP is reasonably expected to achieve
44
cost-effective delivery of the energy efficiency programs. To the extent approved by the IUB, costs associated with executing the EEP are recovered from ratepayers through an additional tariff called an Energy Efficiency Cost Recovery (EECR) factor. The EECR factors are revised annually and include a reconciliation to eliminate any over- or under-recovery of energy efficiency expenses from prior periods. There are no carrying costs associated with the cost recovery factors. In March 2010, the IUB approved new EECR factors for IPL’s electric and gas retail customers for the period from April 1, 2010 through March 31, 2011. The new EECR factors are based on IPL’s approved budget as filed with its EEP for 2009 through 2013, along with any over- or under-collection from the prior year and therefore are not expected to have a material impact on Alliant Energy’s and IPL’s financial condition or results of operations.
Focus on Energy Program- In 2010, WPL contributed 1.2% of annual retail utility revenues to help fund Focus on Energy, Wisconsin’s statewide energy efficiency and renewable energy resource program. This contribution level increased to approximately 1.5% of WPL’s revenues in 2011 with additional increases in succeeding years not to exceed 3.2% by 2014. Focus on Energy works with eligible Wisconsin residents and businesses to finance and install energy efficiency and renewable energy equipment. Contributions to Focus on Energy are recovered from WPL’s retail rate payers through base rates.
Shared Savings Programs- IPL and WPL offer energy efficiency programs to certain customers in Minnesota and Wisconsin referred to as Shared Savings programs. These programs provide low-cost financing to help customers identify, purchase and install energy efficiency improvement projects. The customers repay IPL and WPL with monthly payments over a term up to five years. Refer to Note 4(c) of the “Combined Notes to Consolidated Financial Statements” for additional details of shared savings programs.
RATE MATTERS
Overview -Alliant Energy has two utility subsidiaries, IPL and WPL. Alliant Energy’s utility subsidiaries are subject to federal regulation by FERC, which has jurisdiction over wholesale electric rates and certain natural gas facilities, and state regulation in Iowa, Wisconsin and Minnesota for retail utility rates and standards of service. Such regulatory oversight also covers IPL’s and WPL’s plans for construction and financing of new generation facilities and related activities.
Recent Retail Base Rate Filings -Details of IPL’s and WPL’s recent retail base rate cases impacting their historical and future results of operations are as follows (dollars in millions; Electric (E); Gas (G); Not Applicable (N/A); To Be Determined (TBD)):
| | | | | | | | | | | | | | | | | | | | | | | | |
Retail Base Rate Cases | | Utility
Type | | | Filing
Date | | | Interim
Increase
Implemented
(a) (b) | | | Interim
Effective
Date | | Final
Increase
Granted (b) | | | Expected/
Actual
Final
Effective
Date | | | |
WPL: | | | | | | | | | | | | | | | | | | | | | | | |
2011 Test Year | | | E | | | | Apr-10 | | | | N/A | | | N/A | | | $8 | | | | Jan-11 | | |
2010 Test Year | | | E/G | | | | May-09 | | | | N/A | | | N/A | | | E-59; G-6 | | | | Jan-10 | | |
2009/2010 Test Period | | | E/G | | | | Feb-08 | | | | N/A | | | N/A | | | G-(4) | | | | Jan-09 | | |
IPL: | | | | | | | | | | | | | | | | | | | | | | | |
Minnesota 2009 Test Year | | | E | | | | May-10 | | | | $14 | | | Jul-10 | | | TBD | | | | Q3-11 | | |
Iowa 2009 Test Year | | | E | | | | Mar-10 | | | | 119 | | | Mar-10 | | | 114 | | | | Mar-11 | | |
Iowa 2008 Test Year | | | E | | | | Mar-09 | | | | 84 | | | Mar-09 | | | 84 | | | | Feb-10 | | |
| (a) | In Iowa, IPL’s interim rates are implemented 10 days after the filing date, without regulatory review and subject to refund, pending determination of final rates. In Minnesota, IPL’s interim rates are implemented 60 days after the filing date, with regulatory review and subject to refund, pending determination of final rates. The amount of the interim rates is replaced by the amount of final rates once the final rates are granted. |
| (b) | Rate increases reflect both returns on additions to IPL’s and WPL’s infrastructure and a recovery of increased costs incurred or expected to be incurred by IPL and WPL. Given a portion of the rate increases will offset increased costs, revenues from rate increases cannot be expected to result in an equal increase in income. |
WPL’s Retail Electric Rate Case (2011 Test Year) -In April 2010, WPL filed a request with the PSCW to reopen the rate order for its 2010 test year to increase annual retail electric rates for 2011 by $35 million, or approximately 4%. The request was based on a forward-looking test period that included 2011. The key drivers for the filing include recovery of investments in WPL’s Bent Tree - Phase I wind project and expiring deferral credits, partially offset by lower variable fuel expenses. In August 2010, WPL revised its request for an annual retail electric rate increase to $19 million, or approximately 2%. The primary differences between WPL’s original request in April 2010 and its revised request filed in August 2010 relate to
45
reduced variable fuel expenses, increased wind generation production tax credits and the impact of the $9 million annual rate increase implemented in June 2010 with the interim order in WPL’s 2010 test year retail fuel-related rate filing, which is discussed below.
In December 2010, WPL received an order from the PSCW authorizing an annual retail electric rate increase of $8 million, or approximately 1%, effective Jan. 1, 2011. This $8 million increase in annual rates effective Jan. 1, 2011 combined with the termination of the $9 million interim fuel-related rate increase effective Dec. 31, 2010 will result in a net $1 million decrease in annual electric retail rates charged to customers effective January 2011. Refer to “WPL’s Retail Fuel-related Rate Filings - 2010 Test Year” below for additional details of the interim fuel-related rate increase implemented in 2010 and a $5 million reduction to the 2011 test year base rate increase for refunds owed to electric retail customers related to interim fuel cost collections in 2010.
WPL’s Retail Rate Case (2010 Test Year) -In May 2009, WPL filed a request with the PSCW to increase annual retail electric rates by $86 million, or approximately 9%, and increase annual retail natural gas rates by $6 million, or approximately 3%. The request was based on a 2010 forward-looking test year. The key drivers for the filing included recovery of infrastructure costs of the electric and natural gas utility systems, which had been impacted by a material reduction in sales and increased costs. In addition, WPL requested recovery of the remaining retail portion of the deferred costs for its cancelled 300 MW coal-fired electric generating facility project, Nelson Dewey #3. In September 2009, WPL revised its request to an annual electric retail rate increase of $99 million and annual retail natural gas rate increase of $8 million. The increase in the requested amount for the retail electric rates was primarily due to increased infrastructure costs and a reduced 2010 sales forecast.
In December 2009, WPL received an order from the PSCW authorizing an annual retail electric rate increase of $59 million, or approximately 6%, and an annual retail natural gas rate increase of $6 million, or approximately 2%, effective Jan. 1, 2010. The annual retail electric rate increase of $59 million reflects an increase in the non-fuel component of rates and a decrease in the fuel component of rates. The December 2009 order from the PSCW also approved recovery of certain deferred benefits costs incurred by WPL in 2009 and a portion of the previously deferred costs for the cancelled Nelson Dewey #3 project. Refer to Note 1(b) of the “Combined Notes to Consolidated Financial Statements” for further discussion regarding the PSCW’s decision regarding recovery of these deferred costs and regulatory-related charges in 2009 for the portion of the cancelled Nelson Dewey #3 costs that WPL was denied recovery.
The 2010 test year retail electric rate increase approved by the PSCW included an amount that represented a current return on 50% of the estimated construction work in progress (CWIP) for WPL’s Bent Tree - Phase I wind project for 2010. The remaining CWIP balance for its Bent Tree - Phase I wind project accrued AFUDC during 2010. In addition, the PSCW authorized WPL to defer the retail portion of return on rate base, depreciation expense and other operation and maintenance expenses for those portions of the Bent Tree - Phase I wind project placed in service in 2010.
WPL’s Retail Rate Case (2009/2010 Test Period) -In February 2008, WPL filed a request with the PSCW to increase current retail electric rates by $93 million, or approximately 9%, and reduce current retail gas rates by $1 million, or approximately 1%, effective Jan. 1, 2009. The electric request was based on a 2009 forward-looking test year with approval to reopen the case to address limited cost drivers for 2010. The electric request reflected recovery for increased projected spending on electric generation infrastructure, environmental compliance and stewardship, enhanced investment in renewable energy projects, stepped-up customer energy efficiency and conservation efforts, and related electric transmission and distribution costs. The gas request was based on an average of 2009 and 2010 projected costs. Through the course of the PSCW audit, the 2009 request was updated for various new cost estimates and removal of capital projects that had not yet been approved by the PSCW. These projects include Bent Tree - Phase I, Nelson Dewey #3 (subsequently rejected by the PSCW in December 2008) and various environmental compliance projects.
In December 2008, WPL and major interveners in the case reached a stipulated agreement on electric and gas rate changes for 2009. The parties agreed to hold retail electric rates flat and decrease retail gas rates by $4 million. The stipulated agreement also included a provision that authorized WPL to defer, and record carrying costs on, the retail portion of pension and benefit costs in excess of $4 million, any change in the retail portion of network wheeling costs charged by ATC that is different than the $82 million included in rates and any change in the retail portion of emission allowance expense that is different than $2 million. In addition, the stipulated agreement included the recovery of $9 million over a two-year period for pre-certification costs related to the Nelson Dewey #3 project that had been incurred through December 2007. The PSCW approved the stipulations in December 2008.
IPL’s Minnesota Retail Electric Rate Case (2009 Test Year) -In May 2010, IPL filed a request with the MPUC to increase annual rates for its Minnesota retail electric customers by $15 million, or approximately 22%. The request was based on a 2009 historical test year as adjusted for certain known and measurable items at the time of the filing. The key
46
drivers for the filing include recovery of investments in the Whispering Willow - East wind project and emission control projects at Lansing Unit 4, and recovery of increased electric transmission service costs. IPL is requesting a return on common equity of 10.5% and a regulatory capital structure of 46.8% common equity, 41.9% long-term debt, 6.4% short-term debt and 4.9% preferred equity. In conjunction with the filing, IPL implemented an interim retail rate increase of $14 million on an annual basis, effective July 6, 2010. The interim retail rate increase was approved by the MPUC and is subject to refund pending determination of final rates from the request. In December 2010, the Minnesota Office of Energy Security (OES) filed direct testimony with the MPUC that included a proposed revenue increase of $8 million, plus recovery of costs associated with IPL’s Whispering Willow - East wind project at $51 per megawatt-hour (MWh) based on actual production of the facility. The primary differences between the requests filed by IPL and the OES relate to recovery of costs for electric transmission service, the Whispering Willow - East wind project, Sixth Street, and the cancellation of Sutherland #4, a proposed 600 MW coal-fired electric generating facility. In January 2011, IPL filed rebuttal testimony and reduced its requested increase to $14 million, primarily related to an adjustment made to recovery of electric transmission service costs.
IPL’s Iowa Retail Electric Rate Case (2009 Test Year) -In March 2010, IPL filed a request with the IUB to increase annual electric rates for its Iowa retail customers by $163 million, or approximately 14%. The request was based on a 2009 historical test year as adjusted for certain known and measurable changes occurring up to 12 months after the commencement of the proceeding. The key drivers for the filing include recovery of investments in the Whispering Willow - East wind project and emission control projects at Lansing Unit 4, and recovery of increased electric transmission service costs. In conjunction with the filing, IPL implemented an interim retail electric rate increase of $119 million, or approximately 10% on an annual basis, effective March 20, 2010, without regulatory review and subject to refund pending determination of final rates. The interim rates included the impact of increased transmission service rates billed by ITC Midwest LLC (ITC) that went into effect on Jan. 1, 2010.
In February 2011, IPL received an order from the IUB authorizing a final annual retail electric rate increase of $114 million, or approximately 10%. Because the final rate increase level was below the interim rate increase level implemented in March 2010, IPL expects to refund to its Iowa retail customers a portion of the interim rates collected. At Dec. 31, 2010, Alliant Energy and IPL reserved $4 million, including interest, for refunds anticipated to be paid to IPL’s retail electric customers in 2011. The IUB issued a separate order in January 2011 that included the following decisions for the 2009 Test Year rate case:
| | • | | Approved IPL’s proposed transmission cost rider conditional upon IPL’s agreement to not file an electric base rate case for three years from the date of the order. |
| | • | | Disallowed return on investment treatment for the portion of Whispering Willow - East costs incurred above the cost cap associated with the wind turbine generators. |
| | • | | Authorized use of regulatory liabilities to implement a customer cost management plan discussed below and offset certain electric transmission service costs expected in 2011 and certain capital costs for the Whispering Willow - East wind project. |
| | • | | Limited recovery of and return on investment treatment to 52.5% of the remaining net book value of Sixth Street. |
| | • | | Allowed recovery of $7 million of flood-related costs previously incurred in 2009. |
Refer to Note 1(b) of the “Combined Notes to Consolidated Financial Statements” for additional details of the IUB’s decision in the January 2011 order allowing IPL to recover $7 million of flood-related costs incurred in 2009 and to use regulatory liabilities to provide credits to electric retail customers in Iowa under a customer cost management plan, and offset the recovery of $26 million of costs incurred for its Whispering Willow - East wind project and up to $20 million of transmission costs expected to be billed to IPL in 2011 related to ITC’s 2009 transmission revenue true-up adjustment. Refer to Note 1(e) of the “Combined Notes to Consolidated Financial Statements” for additional details of the IUB’s decision in the January 2011 order disallowing IPL a return on a portion of its Whispering Willow - East wind project costs and recovery of a portion of its costs related to Sixth Street.
Transmission Cost Rider - In January 2011, the IUB approved IPL’s proposal to implement a transmission cost rider for recovery of electric transmission service expenses incurred to provide electric service to IPL’s retail customers in Iowa. The IUB stipulated that the rider would be implemented on a pilot basis conditional upon IPL’s agreement to not file a retail electric base rate case for three years from the date of the order and meet additional reporting requirements. In January 2011, IPL accepted the transmission cost rider with the IUB’s conditions. Effective in the first quarter of 2011, electric transmission service expenses will be removed from base rates and billed to IPL’s Iowa electric retail customers through the transmission cost rider. This new cost recovery mechanism will provide for subsequent adjustments to electric rates charged to Iowa electric retail customers for changes in electric transmission service expenses. The cumulative effects of the over-/under-collection of these costs will be recorded in regulatory assets or regulatory liabilities on Alliant Energy’s and IPL’s Consolidated Balance Sheets until they are reflected in future billings to customers.
47
Customer Cost Management Plan - In January 2011, the IUB approved a customer cost management plan proposed by IPL, which will utilize current and expected future regulatory liabilities to credit bills of Iowa electric retail customers to help offset the impact of the recent rate increases on such customers. In 2009, IPL filed a request with the IUB to create a regulatory liability account for potential tax benefits resulting from changes in accounting methodologies and tax elections available under the Internal Revenue Code. These potential tax benefits are related to the tax treatment of repair expenditures, allocation of insurance proceeds from the floods in 2008 and mixed service costs. The customer cost management plan approved by the IUB utilizes a tax benefit rider to credit customer bills while the issues are under Internal Revenue Service (IRS) audit. The tax benefit rider provides a mechanism to ensure only those amounts from the potential tax benefits that are sustained under IRS audit are retained by customers. The customer cost management plan includes the ability to record a regulatory asset if amounts credited to customer bills are in excess of the amounts sustained under IRS audit. IPL proposed approximately $200 million of regulatory liabilities from potential tax benefits be credited to customers’ bills from 2011 through 2013. IPL currently estimates $64 million of those benefits will be credited to its customers’ bills in 2011. The IUB only authorized the tax benefit credits for 2011 and will review and approve the remaining benefits for 2012 and 2013 on a yearly basis. At Dec. 31, 2010, IPL recognized $194 million of regulatory liabilities related to potential tax benefits associated with the tax treatment of repair expenditures and allocation of insurance proceeds from the floods in 2008. IPL currently estimates it may record up to approximately $130 million of additional regulatory liabilities in the future related to potential tax benefits from mixed service costs. Refer to “Other Matters - Other Future Considerations - Tax Accounting for Mixed Service Costs” for discussion of additional regulatory liabilities that may be recognized in the future related to mixed service costs.
Utilization of Regulatory Liabilities - In addition to the customer cost management plan discussed above, the order issued by the IUB in January 2011 also authorized use of regulatory liabilities from the sale of IPL’s electric transmission assets and the Duane Arnold Energy Center (DAEC) to offset certain electric transmission service costs expected in 2011 and certain capital costs for the Whispering Willow - East wind project. Details of these regulatory liabilities are as follows (in millions):
| | | | | | | | | | | | | | | | |
| | | Regulatory
liability at
Dec. 31, 2010 | | | Amounts that
will be utilized
under previous
IUB orders | | | Amounts to be
utilized under
January 2011
IUB order | | | Remaining
amounts | |
Electric transmission assets sale | | | $72 | | | | ($33) | | | | ($23) | | | | $16 | |
DAEC sale | | | 42 | | | | (19) | | | | (23) | | | | -- | |
| | | | | | | | | | | | | | | | |
| | | $114 | | | | ($52) | | | | ($46) | | | | $16 | |
| | | | | | | | | | | | | | | | |
Electric Transmission Assets Sale - In 2007, IPL completed the sale of its electric transmission assets to ITC and recognized a regulatory liability of $89 million related to the gain resulting from the sale. In 2009, the IUB issued an order authorizing IPL to use a portion of this regulatory liability to reduce Iowa retail electric customers’ rates by $12 million for the period from July 2009 through February 2010 with billing credits included in the monthly fuel cost portion of the customer bills. In January 2010, the IUB issued an order authorizing IPL to use up to $46 million of this regulatory liability to offset electric transmission costs expected to be billed to IPL by ITC in 2010 related to ITC’s 2008 transmission revenue adjustment. IPL expects to utilize $41 million of regulatory liabilities to offset the Iowa retail portion of costs incurred in 2010 related to ITC’s 2008 transmission revenue adjustment. In January 2011, the IUB authorized use of up to $20 million of this regulatory liability to offset ITC’s 2009 transmission revenue adjustment expected to be billed to IPL in 2011. The IUB also authorized IPL in its January 2011 order to utilize $3 million of this regulatory liability to reduce IPL’s Iowa retail electric rate base associated with the Whispering Willow - East wind project. The outstanding balance of this regulatory liability accrues interest at the monthly average U.S. Treasury rate for three-year maturities and has accrued cumulative interest of $4 million through Dec. 31, 2010. Refer to Note 1(b) of the “Combined Notes to Consolidated Financial Statements” for discussion of an order issued by the MPUC in June 2010 authorizing IPL to use a portion of this regulatory liability to refund $2 million annually to IPL’s retail electric customers in Minnesota beginning in July 2010 to coincide with the effective date of the interim rate increase for Minnesota retail customers.
DAEC Sale - In 2006, IPL completed the sale of its 70% ownership interest in DAEC and recognized a regulatory liability of $59 million related to the gain resulting from the sale. In 2009, IPL received $12 million as part of a settlement of a claim filed against the U.S. Department of Energy (DOE) in 2004 for recovery of damages due to the DOE’s delay in accepting spent nuclear fuel produced at DAEC. IPL recognized the $12 million received from the settlement as an increase to the regulatory liability established with the sale of DAEC. In 2009, the IUB authorized IPL to utilize $29 million of this regulatory liability to reduce electric plant in service related to the cumulative AFUDC recognized for the Whispering Willow - East wind project. In January 2010, the IUB authorized IPL to utilize $26 million of this regulatory liability to offset the amortization of costs incurred for the Sutherland #4 project over a five-year period ending September 2014. In
48
January 2011, the IUB authorized use of $23 million of this regulatory liability to reduce IPL’s Iowa retail electric rate base for the Whispering Willow - East wind project. The outstanding balance of this regulatory liability accrues interest at the monthly average U.S. Treasury rate for three-year maturities and has accrued cumulative interest of $7 million through Dec. 31, 2010.
IPL’s Iowa Retail Electric Rate Case (2008 Test Year) -In March 2009, IPL filed a request with the IUB to increase annual electric rates for its Iowa retail customers by $171 million, or approximately 17%. The filing was based on a 2008 historical test year as adjusted for certain known and measurable changes occurring up to 12 months after the commencement of the proceeding. The key drivers for the filing included recovery of increased costs and capital investments since IPL’s last Iowa electric retail rate case filed in 2004. These increased costs and capital investments included increased costs for electric transmission service, infrastructure investments completed during the past five years to enhance the reliability of IPL’s electric system and lower emissions at its generating facilities, increased costs for pension and other employee benefits, capital investments and operating expenses incurred by IPL to restore electric service following 2007 winter ice storms and 2008 severe flooding that impacted its Iowa electric service territory, and capital expenditures for the cancelled Sutherland #4 project. In conjunction with the filing, IPL implemented an interim retail electric rate increase of $84 million, on an annual basis, effective March 27, 2009 without regulatory review and subject to refund pending determination of final rates from the request. In September 2009, IPL revised this request to seek an increase of $146 million, or approximately 14%. The decrease in the requested amount was primarily due to an alternative cost recovery process for the capitalized expenditures for Sutherland #4 discussed below and an alternative method (five-year average) for calculating the annual recovery amount of pension and other postretirement benefits costs.
In January 2010, IPL received an order from the IUB authorizing a final annual retail electric rate increase of $84 million, or approximately 7%, plus the use of a portion of IPL’s regulatory liabilities to offset costs related to the cancelled Sutherland #4 project and future electric transmission service costs. Refer to Note 1(b) of the “Combined Notes to Consolidated Financial Statements” for additional discussion of the IUB’s decision in its January 2010 order to allow IPL to recover $8 million of flood-related costs incurred in 2008 and to use regulatory liabilities to offset the recovery of $26 million of costs incurred for the cancelled Sutherland #4 base-load project and up to $46 million of transmission costs expected to be billed to IPL in 2010 related to ITC’s 2008 transmission revenue true-up adjustment.
Planned Utility Rate Cases in 2011 -WPL currently expects to make a retail rate filing in the second quarter of 2011 based on a forward-looking test period that includes 2012 and 2013. The form and magnitude of such filing is currently being analyzed and could range from a future test year 2012 electric fuel plan to a full rate case for the 2012 and 2013 test period. The rate filing is expected to include a new fuel cost recovery plan under Wisconsin’s new fuel rules, which allow for recovery of costs for emission control chemicals and emission allowances within the fuel recovery mechanism. The key drivers for the filing include partial recovery of the approved emission control project at Edgewater Unit 5 and the emission control projects at Columbia Units 1 and 2. Any rate changes granted are expected to be effective in early 2012.
WPL’s Retail Fuel-related Rate Filings -
2010 Test Year -In April 2010, WPL filed a request with the PSCW to increase annual retail electric rates by $9 million to recover anticipated increased electric production fuel and energy purchases (fuel-related costs) in 2010. Actual fuel-related costs through March 2010, combined with projections of continued higher fuel-related costs for the remainder of 2010, significantly exceeded the amounts being recovered in retail electric rates at the time of the filing. WPL received approval from the PSCW to implement an interim rate increase of $9 million, on an annual basis, effective in June 2010. As part of the interim decision, the PSCW also approved annual forecasted fuel-related costs per MWh of $28.29 based on $389 million of variable fuel costs for WPL’s 2010 test period and left unchanged the annual fuel monitoring range of plus or minus 2%. Updated annual 2010 fuel-related costs during the proceeding resulted in WPL no longer qualifying for a fuel-related rate increase for 2010. In December 2010, the PSCW issued an order authorizing no increase in retail electric rates in 2010 related to fuel-related costs and requiring the interim rate increase to terminate at the end of 2010. The order also required WPL to refund to its retail electric customers the interim fuel rates collected in 2010 as a reduction to the 2011 test year base rate increase. As of Dec. 31, 2010, Alliant Energy and WPL reserved $5 million, including interest, for all interim fuel cost collections in 2010.
49
2009 Test Year -In August 2009, WPL notified the PSCW that its actual retail fuel-related costs incurred during the month of July 2009 were below the monthly monitoring range of plus or minus 8% and projected annual retail fuel-related costs for 2009 could fall outside the annual monitoring range of plus or minus 2%. In September 2009, the PSCW issued an order that set WPL’s retail electric fuel rates currently in effect subject to refund beginning Sep. 1, 2009. In January 2010, WPL filed a retail electric fuel refund report indicating retail fuel over collections of $4 million for the period from Sep. 1, 2009 through Dec. 31, 2009. In April 2010, WPL received approval from the PSCW to refund $4 million to its retail electric customers for retail fuel over collections for the period from Sep. 1, 2009 through Dec. 31, 2009. WPL refunded the $4 million to its retail electric customers in 2010.
2008 Test Year -In March 2008, WPL filed a request with the PSCW to increase annual retail electric rates by $16 million to recover anticipated increased electric production fuel and energy purchases (fuel-related costs). Actual fuel-related costs through February 2008, combined with projections of continued higher fuel-related costs for the remainder of 2008, significantly exceeded the amounts being recovered in retail electric rates at the time of the filing. In the second quarter of 2008, WPL received an order from the PSCW authorizing the requested $16 million interim increase, subject to refund, effective in April 2008. Retail fuel-related costs incurred by WPL in 2008 were lower than retail fuel-related costs used to determine interim rates that were effective April 2008, resulting in $23 million, including interest, of refunds owed to its retail electric customers. WPL refunded the $23 million to its retail electric customers in 2009.
Rule Changes -
Electric Fuel Cost Recovery Rule Changes in Wisconsin -In May 2010, Act 403 was enacted in Wisconsin to change statutes related to the process by which utilities recover electric fuel-related costs from their retail electric customers. On Jan. 1, 2011, revised new fuel rules issued by the PSCW became effective. The new fuel rules currently provide the following provisions and requirements for Wisconsin utilities:
| | • | | PSCW approval of a future test year fuel cost plan resulting in changes in rates either as a separate proceeding or in a base rate case proceeding; |
| | • | | deferral of any change in unit fuel costs from the approved fuel cost plan outside a range established by the PSCW (initial range for WPL is between plus and minus 2%); |
| | • | | inclusion of selected other variable costs and revenues directly related to fuel costs in the fuel cost plan (costs for emission control chemicals and emission allowances are expected to be included in fuel costs for WPL beginning in 2012 with the approval of WPL’s next fuel cost plan); |
| | • | | reporting after completion of the plan year for comparison of actual plan year costs to those included in the fuel cost plan; and |
| | • | | restrictions on the collection of deferred amounts if Wisconsin utilities earn in excess of their authorized return on common equity. |
Refer to Note 1(h) of the “Combined Notes to Consolidated Financial Statements” for additional details of WPL’s electric fuel-related cost recovery mechanism.
WPL’s Wholesale Formula Rate Structure -In 2006, WPL received an order from FERC authorizing an interim rate increase, subject to refund, effective June 1, 2007 related to WPL’s request to implement a formula rate structure for its wholesale electric customers. In February 2008, final written agreements were filed with FERC that contained a settlement between WPL and its wholesale customers of the issues identified in WPL’s filing requesting the formula rate structure. In August 2008, FERC approved the settlement and the implementation of settlement rates effective June 1, 2007. During the period the interim rate increase was effective from June 1, 2007 to May 31, 2008, WPL over-recovered $10 million, including interest, from its wholesale customers. In September 2008, WPL refunded the $10 million to its wholesale electric customers.
In 2009, WPL filed a request with FERC seeking approval of changes to WPL’s wholesale formula rates in order to implement for billing purposes the full impact of accounting for defined benefit pension and other postretirement benefits plans. In July 2010, FERC approved a settlement agreement reached earlier in 2010 between WPL and the wholesale customers regarding the formula rate change. WPL recorded an additional $4 million of electric revenues and regulatory assets in 2010 to reflect the settlement and is reducing the regulatory asset concurrently with collections from customers.
50
Rate Case Details -Details of the most recent rate orders in IPL’s and WPL’s key jurisdictions were as follows (Common Equity (CE); Preferred Equity (PE); Long-term Debt (LD); Short-term Debt (SD)):
| | | | | | | | | | | | | | | | | | | | | | |
Jurisdictions | | Test
Period | | | Authorized
Return on
Common
Equity (a) | | | | | | | | | | | After-tax | | | |
| | | | | | Weighted- | | Average | |
| | | | Capital Structure | | Average Cost | | Rate Base | |
| | | | CE | | PE | | LD | | SD | | of Capital | | (in millions) | |
IPL: | | | | | | | | | | | | | | | | | | | | | | |
Iowa retail (IUB): | | | | | | | | | | | | | | | | | | | | | | |
Electric: | | | | | | | | | | 48.2% | | 6.5% | | 45.3% | | N/A | | | | | | |
- Emery (b) | | | 2009 | | | | 11.58% | | | | | | | | | | | 8.85% | | | $281 | |
- Whispering Willow-East (b) | | | 2009 | | | | 11.09% | | | | | | | | | | | 8.61% | | | $266 | |
- Other (b) | | | 2009 | | | | 9.53% | | | | | | | | | | | 7.86% | | | $1,843 | |
Gas | | | 2004 | | | | 10.40% | | | 49.4% | | 8.3% | | 42.3% | | N/A | | 8.68% | | | $212 | |
| | | | | | | | |
Minnesota retail (MPUC): | | | | | | | | | | | | | | | | | | | | | | |
Electric | | | 2004 | | | | 10.39% | | | 49.1% | | 7.8% | | 41.6% | | 1.5% | | 8.58% | | | $136 | |
Gas | | | 1994 | | | | 10.75% | | | 41.0% | | 7.4% | | 44.0% | | 7.6% | | 8.82% | | | $7 | |
| | | | | | | | |
WPL: | | | | | | | | | | | | | | | | | | | | | | |
Wisconsin retail (PSCW): | | | | | | | | | | | | | | | | | | | | | | |
Electric | | | 2011 (c) | | | | 10.40% | | | 50.4% | | 2.4% | | 43.3% | | 3.9% | | 8.18% | | | $1,697 (d | ) |
Gas | | | 2011 (c) | | | | 10.40% | | | 50.4% | | 2.4% | | 43.3% | | 3.9% | | 8.18% | | | $215 (d | ) |
| | | | | | | | |
Wholesale (FERC): | | | | | | | | | | | | | | | | | | | | | | |
Electric | | | 2010 | | | | 10.90% | | | 55.0% | | N/A | | 45.0% | | N/A | | 8.92% | | | $169 | |
| (a) | Authorized returns on common equity may not be indicative of actual returns earned or projections of future returns. |
| (b) | Authorized returns on common equity and after-tax weighted-average cost of capital reflect application of double leverage pursuant to the IUB’s January 2011 order discussed above. Prior to the application of double leverage, authorized returns on common equity were: Emery-12.23%, Whispering Willow - East-11.7% and Other-10.0%, and after-tax weighted-average costs of capital were: Emery-9.16%, Whispering Willow - East-8.91% and Other-8.09%. |
| (c) | WPL’s 2011 rate order did not change the returns or capital structures approved in the prior rate order effective Jan. 1, 2010. |
| (d) | Retail rate base amounts do not include CWIP. The PSCW provides a return on selected CWIP by adjusting the percentage return on rate base. |
Proposed Changes to Rate Recovery Mechanisms -
IPL’s Minnesota Transmission Rider -In January 2010, IPL filed a proposal with the MPUC to implement an automatic cost recovery rider for annual changes in electric transmission service costs. The proposed automatic cost recovery rider would not require a base rate case for annual revisions of rates charged to IPL’s Minnesota retail electric customers, but would require that the electric transmission service costs incurred be fully reconciled against the revenues collected for such costs. In May 2010, the MPUC issued an order deferring consideration of IPL’s transmission cost recovery rider proposal to IPL’s Minnesota 2009 test year rate case. IPL anticipates a decision from the MPUC on this request in the third quarter of 2011.
IPL’s Minnesota Renewable Energy Rider -In April 2010, IPL filed a proposal with the MPUC to implement an automatic cost recovery rider to recover costs associated with renewable generation costs. Initially, this would allow recovery of IPL’s Whispering Willow - East wind project located in Iowa. The proposed automatic cost recovery rider would not require a base rate case for annual revisions of rates charged to IPL’s Minnesota retail electric customers, but would require that the renewable energy costs incurred be fully reconciled against the revenues collected for such costs. In May 2010, the MPUC issued an order deferring consideration of IPL’s renewable energy rider proposal to IPL’s Minnesota 2009 test year rate case. Costs related to IPL’s Whispering Willow - East wind project are currently included in interim base rates in effect since July 2010. IPL anticipates a decision from the MPUC on this request in the third quarter of 2011.
Economic Development Program -In June 2010, the PSCW issued an order approving an economic development program effective July 2010, which is intended to attract and retain industrial customers in WPL’s service territory. The program permits WPL to provide eligible industrial customers a discounted energy rate based upon specifically-defined conditions. To be eligible for the program, each customer needs to demonstrate that it is also eligible for direct governmental assistance through a local, state or federal economic development program, in addition to other criteria. The discount amounts are
51
limited to ensure recovery of marginal costs and will be decreased over time until a customer is paying the full tariff rate. In July 2010, CUB filed a petition for review with the Circuit Court of Dane County, Wisconsin (Circuit Court). CUB requested that the order be set aside, reversed or remanded to the PSCW for further deliberation and action. In February 2011, CUB’s petition for review was denied by the Circuit Court. Alliant Energy and WPL are currently unable to determine what action, if any, CUB may take in response to the Circuit Court’s decision or if any other legal action will occur. Alliant Energy and WPL are also unable to determine the level of participation in the program and the ultimate impact on their financial condition and results of operations.
Other -
WPL’s Edgewater Unit 5 Purchase Agreement -WPL and WEPCO entered into an agreement, which became effective in March 2010, for WPL to purchase WEPCO’s 25% ownership interest in Edgewater Unit 5 for WEPCO’s net book value, including working capital. In June 2010, FERC authorized the transaction. In November 2010, the PSCW approved the transaction and WPL’s request to defer all costs and benefits related to the purchase and operation of Edgewater Unit 5 between the time of the transaction and WPL’s next base rate case. WEPCO is currently working with the Michigan Public Service Commission to obtain satisfactory approval for the transaction. WPL currently expects the transaction to close in the first half of 2011.
WPL’s Deferral Request for Federal Health Care Legislation Costs -In April 2010, WPL filed a request with the PSCW for authorization to defer the anticipated and potential incremental costs WPL expects to incur in order to comply with the federal health care legislation that was enacted in March 2010. The vast majority of the incremental costs relate to changes in the taxability of Medicare Part D supplement reimbursements. In December 2010, the PSCW approved the deferral request for 2010 only. In order to obtain recovery of deferred amounts in a future rate proceeding, WPL must prove that the actual amounts incurred meet the deferral criteria.
ENVIRONMENTAL MATTERS
Overview -Alliant Energy, IPL and WPL are subject to regulation of environmental matters by federal, state and local authorities as a result of their current and past operations. Alliant Energy, IPL and WPL monitor these environmental matters and address them with pollution abatement programs. These programs are subject to continuing review and are periodically revised due to various factors, including changes in environmental regulations, litigation of environmental requirements, construction plans and compliance costs. There is currently significant regulatory uncertainty with respect to the various environmental rules and regulations discussed below. Given the dynamic nature of environmental regulations and other related regulatory requirements, Alliant Energy, IPL and WPL have established an integrated planning process that is used for environmental compliance for their operations. Alliant Energy, IPL and WPL anticipate future expenditures for environmental compliance will be material, including significant capital investments. Alliant Energy, IPL and WPL anticipate that prudent expenditures incurred by IPL and WPL to comply with environmental requirements likely would be recovered in rates from their customers. Refer to “Strategic Overview - Environmental Compliance Plans” for details of Alliant Energy’s, IPL’s and WPL’s environmental compliance plans, including estimated capital expenditures. The following are major environmental matters that could potentially have a significant impact on Alliant Energy’s, IPL’s and WPL’s financial condition and results of operations.
Air Quality -The CAA and its amendments mandate preservation of air quality through existing regulations and periodic reviews to ensure adequacy of these provisions based on scientific data. As part of the basic framework under the CAA, the EPA is required to establish NAAQS, which serve to protect public health and welfare. These standards address six “criteria” pollutants, four of which are particularly relevant to Alliant Energy’s, IPL’s and WPL’s electric utility operations, including NOx, SO2, particulate matter (PM), and ozone. Ozone is not directly emitted from Alliant Energy’s, IPL’s and WPL’s generating facilities; however, NOx emissions may contribute to its formation in the atmosphere. Fine particulate matter (PM2.5) may also be formed in the atmosphere from SO2 and NOx emissions.
State implementation plans (SIPs) document the collection of regulations that individual state agencies will apply to maintain NAAQS and related CAA requirements. The EPA must approve each SIP and if a SIP is not acceptable to the EPA or if a state chooses not to issue separate state rules, then the EPA can assume enforcement of the CAA in that state by issuing a federal implementation plan (FIP). Areas that comply with NAAQS are considered to be in attainment, whereas routinely monitored locations that do not comply with these standards may be classified by the EPA as non-attainment and require further actions to reduce emissions. Additional emissions standards may also be applied under the CAA regulatory framework beyond NAAQS. The specific federal and state air quality regulations that may affect Alliant Energy’s, IPL’s and WPL’s operations include: CAIR, CATR, Clean Air Visibility Rule (CAVR), Utility MACT Rule, Wisconsin State Mercury Rule, Wisconsin RACT Rule, Industrial Boiler and Process Heater MACT Rule and NAAQS rules. Alliant Energy, IPL and WPL also monitor various other potential environmental matters related to air quality, including: litigation of various federal rules issued under the CAA statutory authority; revisions to the New Source Review/PSD permitting programs and NSPS;
52
and proposed legislation or other regulatory actions to regulate the emission of GHG. Refer to the sections below the following tables for detailed discussion of the following air quality regulations.
| | | | | | | | |
| Environmental | | Emissions | | EGUs Potentially | | Actual/Anticipated | | |
| Regulation | | Regulated | | Affected | | Compliance Deadline | | |
CAIR | | SO2, NOx | | Fossil fuel-fired EGUs
over 25 MW capacity | | Phase I -NOx (2009); SO2 (2010) Phase II - 2015 | | |
CATR | | SO2, NOx | | Fossil fuel-fired EGUs
over 25 MW capacity | | Phase I - 2012 Phase II - 2014 (SO2 only) | | |
CAVR | | SO2, NOx, PM | | Fossil fuel-fired EGUs | | To Be Determined (TBD) | | |
Utility MACT Rule | | Mercury and
other HAP | | Coal- and oil-fired EGUs
over 25 MW capacity | | 2014 | | |
Wisconsin State
Mercury Rule | | Mercury | | WPL’s coal-fired EGUs | | Phase I - 2010 Phase II - 2015 | | |
Wisconsin RACT Rule | | NOx | | WPL’s Edgewater Units 3-5 | | Phase I - 2009 Phase II - 2013 | | |
Industrial Boiler and Process
Heater MACT Rule | | Mercury and
other HAP | | Fossil fuel-fired EGUs
below 25 MW capacity | | 2014 | | |
Ozone NAAQS Rule | | NOx | | Fossil fuel-fired EGUs | | TBD | | |
Fine Particle NAAQS Rule | | SO2, NOx, PM | | Fossil fuel-fired EGUs | | TBD | | |
NO2 NAAQS Rule | | NO2 | | Fossil fuel-fired EGUs | | TBD | | |
SO2 NAAQS Rule | | SO2 | | Fossil fuel-fired EGUs | | 2017 | | |
The following table lists the fossil fuel-fired EGUs by primary fuel type that IPL and WPL currently own or operate with greater than 25 MW of nameplate capacity. All of IPL’s EGUs listed below are located in Iowa except for Fox Lake Unit 3 and Montgomery Turbine 1, which are located in Minnesota. All of WPL’s EGUs listed below are located in Wisconsin.
| | | | | | | | | | |
IPL | | WPL | | |
Coal | | Natural Gas | | Oil | | Coal | | Natural Gas | | |
| Ottumwa 1 | | Emery 1-3 | | Marshalltown 1-3 | | Columbia 1-2 | | Sheboygan Falls 1-2 | | |
| Lansing 3-4 | | Fox Lake 3 | | Lime Creek 1-2 | | Edgewater 3-5 | | Neenah 1-2 | | |
| M.L. Kapp 2 | | | | Montgomery 1 | | Nelson Dewey 1-2 | | South Fond du Lac 1-4 | | |
| Burlington 1 | | | | | | | | Rock River 3,5-6 | | |
| Prairie Creek 3-4 | | | | | | | | Sheepskin 1 | | |
| George Neal 3-4 | | | | | | | | | | |
| Sutherland 1,3 | | | | | | | | | | |
| Dubuque 3-4 | | | | | | | | | | |
| Louisa 1 | | | | | | | | | | |
CAIR - CAIR established new SO2 and NOx (both annual and ozone season) emission caps beginning in 2010 and 2009, respectively, with further reductions in SO2 and NOx emission caps effective in 2015. CAIR impacts IPL’s and WPL’s fossil fuel-fired EGUs with greater than 25 MW of capacity located in Iowa and Wisconsin. CAIR included a large regional cap-and-trade system, where compliance may be achieved by either adding emission controls and/or purchasing emission allowances. In 2008, the U.S. Court of Appeals for the D.C. Circuit (D.C. Circuit Court) remanded CAIR to the EPA for revision to address flaws identified in a 2008 opinion issued in response to legal challenges to this rule. In the interim, CAIR obligations became effective for NOx on Jan. 1, 2009 and SO2 on Jan. 1, 2010 and remain in place until the EPA issues a final CAIR replacement rule.
CATR - In July 2010, the EPA issued its proposed CAIR replacement rule, referred to as the CATR. The CATR would require SO2 and NOx emissions reductions from emission sources located in 31 states in the eastern half of the U.S. as well as the District of Columbia. The CATR would affect IPL’s and WPL’s fossil-fueled EGUs with greater than 25 MW of capacity located in Iowa, Minnesota and Wisconsin. Existing CAIR compliance requirements remain effective until the final CATR compliance requirements supersede them, which the EPA currently estimates will occur in 2012. Beginning in 2012, the CATR would establish state emission caps for SO2 and NOx (Phase I). These SO2 emission caps would be lowered further in 2014 for Iowa and Wisconsin, but not Minnesota (Phase II). While the NOx emission caps are not lowered further in the CATR, the EPA indicates that it will likely lower these caps in the final version of the CATR or subsequent rulemakings.
53
In the CATR, the EPA identifies one preferred and two alternative approaches. All three approaches establish state emission caps; however, they allow varying degrees of limited, if any, emissions trading to meet compliance requirements. In addition, the emission allowances used for Acid Rain and CAIR program compliance cannot be used for compliance with the CATR. Refer to Note 12(b) of the “Combined Notes to Consolidated Financial Statements” for discussion of IPL’s forward contracts to purchase SO2 emission allowances, which may be impacted by CATR.
Alliant Energy, IPL and WPL continue to implement their environmental compliance plans to meet the currently effective CAIR requirements, which include investments in emission controls for EGUs as well as use of emission allowances. The final CATR is expected to be issued by the EPA in mid-2011. Alliant Energy, IPL and WPL will monitor future developments relating to the CATR and update their environmental compliance plans as needed. Alliant Energy, IPL and WPL are currently unable to predict the final outcome of the EPA’s CATR as a replacement rule for CAIR, but expect that capital investments and/or modifications to meet compliance requirements of the rule could be significant.
CAVR -CAVR requires states to develop and implement SIPs to address visibility impairment in designated national parks and wilderness areas across the country with a national goal of no impairment by 2064. Proposed CAVR SIPs for Iowa, Wisconsin and Minnesota have been submitted to the EPA for review and approval. These SIPs include Best Available Retrofit Technology Rule (BART) emission controls and other additional measures needed for reducing state contributions to regional haze. The EPA has not issued responses on these CAVR SIPs. If a CAVR SIP is found to be deficient, then the EPA is required to promulgate a CAVR FIP to address these requirements in the interim until the CAVR SIP is approved. The CAVR SIPs will determine required compliance actions and deadlines.
There are uncertainties in the applicability of and compliance outcomes of BART control approaches that will be approved by the EPA for inclusion in CAVR SIPs. EGU emissions of primary concern for BART and regional haze regulation include SO2, NOx and PM. There are pending obligations under the EPA’s CAVR to complete BART determinations that would evaluate control options to reduce these emissions at certain WPL and IPL EGUs that were built between 1962 and 1977. The D.C. Circuit Court remand of CAIR to the EPA in 2008 may have an indirect impact on the CAVR and BART SIP implementation approach because the EPA allowed BART obligations for SO2 and NOx emissions to be fulfilled by CAIR. The proposed CATR does not address the EPA’s prior decision related to CAIR being sufficient to meet compliance obligations for units subject to BART emissions reduction requirements for SO2 and NOx under the CAVR (often referred to as “CAIR equals BART”). The EPA’s revised assessment of the relationship for the CAVR’s BART requirements and the proposed CATR remains pending, including whether the EPA’s compliance approach and final rule will allow for “CATR equals BART” for SO2 and NOx. In addition, there are uncertainties whether additional emission reductions could be required to address regional haze impacts beyond BART. Alliant Energy, IPL and WPL are unable to predict the impact that CAVR might have on the operations of their existing EGUs until the EPA final approval of state CAVR plans, which is currently expected in 2011.
Utility MACT Rule -In 2009, the EPA announced its intention to develop MACT rules for EGUs pursuant to Section 112 of the CAA. When developing a MACT rule, the EPA looks at the current level of emissions control achieved by best-performing similar sources. These emissions control levels set a baseline, often referred to as the “MACT floor,” used in determination of the performance standards required under the new rule. Each regulated EGU must demonstrate performance with the standards adopted in the final rule. The CAA requirements of Section 112 state that these standards become effective upon promulgation of the final rule and that compliance is required no later than three years after the effective date of the standards. In January 2010, the EPA issued an information collection request for coal- and oil-fired EGUs over 25 MW in order to develop a proposed Utility MACT Rule for the control of mercury and other federal HAPs. The purpose of the proposed information collection request was to collect data necessary to identify affected categories of EGUs that will be subject to a Utility MACT Rule and to define the MACT floor. In February 2010, the EPA entered into a consent decree that requires the agency to propose Utility MACT Rules for coal- and oil-fired EGUs no later than March 2011 and promulgate final rules no later than November 2011. Based upon the timeline set forth in the consent decree, compliance with the Utility MACT Rule is expected to be required by November 2014. Alliant Energy, IPL and WPL are currently unable to predict the final outcome of a Utility MACT Rule to regulate mercury and other federal HAPs from EGUs, but expect that capital investments and/or modifications could be significant to comply with any such regulations.
Wisconsin State Mercury Rule - The Wisconsin State Mercury Rule requires electric utility companies in Wisconsin to meet compliance requirements to reduce annual mercury emissions by 40% from a historic baseline beginning in 2010 (Phase I). In addition, the Wisconsin State Mercury Rule requires large coal-fired EGUs with greater than 150 MW of capacity to either achieve a 90% annual mercury emissions reduction standard or limit the annual concentration of mercury emissions to 0.008 pounds of mercury per gigawatt-hour beginning in 2015 (Phase II). Small coal-fired EGUs between 25 MW and 150 MW of capacity must install Best Available Control Technology (BACT) by January 2015 to reduce mercury emissions. As an alternative, this rule allows large and small EGUs to achieve compliance through averaging. There is also an alternative multi-pollutant option that extends the time for compliance with the annual mercury reduction requirement until 2021.
54
However, this requires the affected facilities to achieve NOx and SO2 reductions beyond those currently required by federal and state regulations. In December 2010, WPL filed its compliance plan with the Wisconsin Department of Natural Resources (DNR). WPL’s plan states that it will utilize large and small EGU averaging to comply with the additional mercury rule emissions reduction requirements that commence in 2015 and not use the multi-pollutant option. Alliant Energy and WPL continue to evaluate the impact of this state mercury rule and the federal Utility MACT Rule discussed above to determine further mercury emission reductions that will be required. Refer to “Strategic Overview - Environmental Compliance Plans - WPL’s Emission Control Projects” for discussion of proposed WPL emission controls that support compliance with the requirements of this rule.
Wisconsin RACT Rule -In 2004, the EPA designated 10 counties in Southeastern Wisconsin as non-attainment areas for the ozone NAAQS. This designation includes Sheboygan County, where WPL operates the Sheboygan Falls Energy Facility and Edgewater. In 2007, the Wisconsin DNR issued a RACT Rule that requires NOx emission reductions at EGUs as part of the federal ozone SIP submittal to address non-attainment areas in Wisconsin. Facility modifications are not necessary at the Sheboygan Falls Energy Facility to comply with this rule. As part of its environmental compliance plan, WPL completed investments for installation of NOx emission control technologies at Edgewater to meet the 2009 to 2012 compliance requirements (Phase I). Additional investments will be needed at Edgewater to achieve compliance with the 2013 requirements that include facility boiler NOx rate limitations and a mass emissions cap (Phase II). Refer to “Strategic Overview - Environmental Compliance Plans - WPL’s Emission Control Projects” for discussion of proposed emission controls for further NOx emission reductions at Edgewater to meet 2013 compliance deadlines.
Ozone NAAQS Rule -In 2008, the EPA announced reductions in the primary NAAQS for eight-hour ozone to a level of 0.075 parts per million (ppm) from the previous standard of 0.08 ppm. In January 2010, the EPA issued a proposal to reduce the primary standard to a level within the range of 0.06 to 0.07 ppm and establish a new seasonal secondary standard. The final rule is expected to be issued by July 2011. Depending on the level and location of non-attainment areas, Alliant Energy, IPL and WPL may be subject to additional NOx emissions reduction requirements to meet the new ozone standard. The schedule for compliance with this rule has not yet been established. Alliant Energy, IPL and WPL are currently unable to predict the impact of any potential changes to the Ozone NAAQS on their financial condition and results of operations.
Fine Particle NAAQS Rule -The EPA lowered the 24-hour fine particle primary NAAQS (PM2.5 NAAQS) from 65 micrograms per cubic meter (ug/m3) to 35 ug/m3 in 2006. In 2009, the EPA announced final designation of PM2.5 non-attainment areas. IPL and WPL do not have any generating facilities in the non-attainment areas announced in 2009. However, in 2009, the D.C. Circuit Court issued a decision for litigation regarding the EPA’s determination not to lower the annual PM2.5 NAAQS in 2006. In response to the litigation decision, the EPA must re-evaluate its justification for not tightening the annual standard related to adverse effects on health and visibility. If the annual PM2.5 standard becomes more stringent, it could require SO2 and NOx emission reductions in additional areas not currently designated as non-attainment. The schedule for compliance with this rule has not yet been established. Alliant Energy, IPL and WPL are currently unable to predict the potential impact of the re-evaluation of the annual PM2.5 NAAQS on their financial condition and results of operations.
Nitrogen Dioxide (NO2) NAAQS Rule -In January 2010, the EPA issued a final rule to strengthen the primary NAAQS for NOx as measured by NO2. The final rule establishes a new one-hour NAAQS for NO2 of 100 ppb and associated ambient air monitoring requirements, while maintaining the current annual standard of 53 ppb. The EPA is expected to designate non-attainment areas for the new NO2 NAAQS by January 2012. The final rule is currently being challenged by several groups in the D.C. Circuit Court. The schedule for compliance with this rule has not yet been established. Alliant Energy, IPL and WPL are currently unable to predict the impact of any potential NO2 NAAQS changes on their financial condition or results of operations.
SO2 NAAQS Rule -In June 2010, the EPA issued a final rule that establishes a new one-hour NAAQS for SO2 at a level of 75 ppb. The final rule also revokes both the existing 24-hour and annual standards. The EPA is expected to designate non-attainment areas for the SO2 NAAQS by June 2012. Compliance with the new SO2 NAAQS rule is currently expected to be required by 2017 for non-attainment areas designated in 2012. The final rule is being challenged by several groups in the D.C. Circuit Court. Alliant Energy, IPL and WPL are currently unable to predict the impact of any potential SO2 NAAQS changes on their financial condition or results of operations.
Industrial Boiler and Process Heater MACT Rule-The initial Industrial Boiler and Process Heater MACT Rule issued by the EPA contained compliance requirements beginning in 2007 related to HAPs from fossil-fueled EGUs with less than 25 MW capacity as well as certain auxiliary boilers and process heaters operated at EGUs. In 2007, a court decision vacated the initial rule. In February 2011, the EPA promulgated a revised Industrial Boiler and Process Heater MACT Rule. The revised Industrial Boiler and Process Heater MACT Rule will be effective 60 days after it is published in the Federal Register. The CAA requirements of Section 112 state that the standards become effective upon promulgation of the final rule and that compliance is required no later than three years after
55
the effective date of the standards. Based on this requirement, the anticipated deadline for compliance with this rule is 2014. The federal CAA generally requires affected facilities to submit to state permitting authorities an application for a case-by-case MACT determination for all potentially affected EGUs under this rule. Case-by-case MACT determinations are the compliance measures that are in effect until revised final federal regulations can replace these interim requirements. IPL and WPL submitted case-by-case permit application information in 2009. The outcome of the case-by-case MACT determinations by the Iowa DNR and Wisconsin DNR are uncertain at this time. Alliant Energy, IPL and WPL will monitor future developments relating to this rule and update their environmental compliance plans as needed. Alliant Energy, IPL and WPL are currently unable to predict the outcome of the Industrial Boiler and Process Heater MACT Rule, but expect that capital investments and/or modifications to meet compliance requirements of the rule could be significant.
Emission Standards for Internal Combustion Engines - In March 2010, the EPA issued a final rule establishing national emission standards for HAPs for existing diesel-fired stationary Reciprocating Internal Combustion Engines (RICE), including compression ignition engines. The final compliance deadline for emissions and operating limitations is May 2013. The final rule is expected to apply to certain existing RICE at Alliant Energy’s Industrial Energy Applications, Inc. (IEA) business. Refer to Note 17 of the “Combined Notes to Consolidated Financial Statements” for discussion of Alliant Energy’s plan to sell its IEA business in 2011.
Air Permit Renewal Challenges - WPL is aware of certain public comments or petitions from citizen groups that have been submitted to the Wisconsin DNR or to the EPA regarding the renewal of air operating permits at certain of its generating facilities. In some cases, the EPA has responded to these comments and petitions with orders to the Wisconsin DNR to reconsider the air operating permits of WPL’s generating facilities. WPL has received renewed air permits for Columbia, Edgewater and Nelson Dewey from the Wisconsin DNR, which considered all public comments received as part of the renewal process.
Columbia - In 2008, the Sierra Club submitted a notice of intent to sue the EPA for failure to respond to its petition encouraging the EPA to challenge the air permit issued by the Wisconsin DNR for Columbia. In 2009, the EPA responded to the Sierra Club petition and granted one of three issues from the Sierra Club petition, objecting to that portion of the permit issued by the Wisconsin DNR. In July 2010, WPL received a copy of a notice of intent to file a civil lawsuit (NOI) by the Sierra Club against the EPA based on what the Sierra Club asserts is unreasonable delay in the EPA performing its duties related to the granting or denial of the Columbia air permit. Specifically, the Sierra Club alleges that because the Wisconsin DNR has exceeded its 90-day timeframe in which to respond to the EPA’s order, the EPA must now act on the permit. In September 2010, the Wisconsin DNR proposed a construction permit and a revised operation permit for Columbia. In October 2010, WPL submitted comments objecting to the appropriateness of the proposed draft permits. In November 2010, the comment period closed, and in February 2011, the Wisconsin DNR made the determination not to issue either of the permits. Alliant Energy and WPL believe the previously issued air permit for Columbia is still valid. Alliant Energy and WPL are currently unable to predict the outcome of this matter and its impact on their financial condition or results of operations.
Edgewater - In 2009, the Sierra Club petitioned the EPA to object to a proposed Title V air permit for Edgewater that the Wisconsin DNR had submitted to the EPA for review. In 2009, the Sierra Club filed a notice of intent to sue the EPA over its failure to act on the petition. In August 2010, the EPA issued an order to the Wisconsin DNR granting in part and denying in part the Sierra Club’s petition. The Wisconsin DNR has not yet acted on the EPA order. In December 2010, WPL received a copy of an NOI by the Sierra Club against the EPA based on what the Sierra Club asserts is unreasonable delay in the EPA performing its duties related to the reconsideration of the Edgewater Title V air permit. Specifically, the Sierra Club alleges that because the Wisconsin DNR has exceeded its 90-day timeframe in which to respond to the EPA’s order, the EPA must now act on the reconsideration of the permit. Alliant Energy and WPL are currently unable predict the outcome of this matter and its impact on their financial condition or results of operations.
Nelson Dewey - In September 2010, the Sierra Club petitioned the EPA and the Wisconsin DNR to reopen a Nelson Dewey air permit. The Sierra Club alleges that the Nelson Dewey air permit issued by the Wisconsin DNR in 2008 should be corrected because certain modifications were made at the facility without complying with the PSD program requirements. In November 2010, WPL filed a response to the petition with the EPA and the Wisconsin DNR objecting to its claims and supporting the Wisconsin DNR’s issuance of the current permit. No action on this petition has been taken by the EPA or the Wisconsin DNR. Alliant Energy and WPL are currently unable to predict the outcome of this petition and its impact on their financial condition or results of operations.
Air Permitting Violation Claims -Refer to Note 12(c) of the “Combined Notes to Consolidated Financial Statements” for discussion of complaints filed by the Sierra Club in September 2010 and a notice of violation issued by the EPA in December 2009 regarding alleged air permitting violations at Nelson Dewey, Columbia and Edgewater.
56
Water Quality -
Section 316(b) of Federal Clean Water Act -The Federal Clean Water Act requires the EPA to regulate cooling water intake structures to assure that these structures reflect the “best technology available” for minimizing adverse environmental impacts to fish and other aquatic life. The second phase of this EPA rule is generally referred to as Section 316(b). Section 316(b) applies to existing cooling water intake structures at large steam EGUs. In 2007, a court opinion invalidated aspects of the Section 316(b), which allowed for consideration of cost-effectiveness when determining the appropriate compliance measures. As a result, the EPA formally suspended Section 316(b) in 2007. In 2009, the U.S. Supreme Court granted the EPA authority to use a cost-benefit analysis when setting technology-based requirements under Section 316(b). A revised Section 316(b) rule reflecting the U.S. Supreme Court’s decision is anticipated to be proposed by the EPA in 2011 and a final rule is expected in 2012. IPL and WPL have identified six (Prairie Creek Unit 4, Fox Lake Units 1 and 3, Lansing Units 3-4, Dubuque Units 3 and 4, M.L. Kapp Unit 2, Burlington Unit 1) and two (Nelson Dewey Units 1-2 and Edgewater Units 3-5) generating facilities, respectively, which may be impacted by the revised Section 316(b) rule. The schedule for compliance with this rule has not yet been established. Alliant Energy, IPL and WPL are currently unable to predict the final requirements from Section 316(b), but expect that capital investments and/or modifications resulting from the rule could be significant.
Wisconsin State Thermal Rule -Section 316(a) of Federal Clean Water Act requires the EPA to regulate thermal impacts from wastewater discharges of industrial facilities, including those from EGUs. States have authority to establish standards for these discharges in order to minimize adverse environmental impacts to aquatic life. All IPL and WPL facilities are subject to these standards upon state promulgation, which become applicable upon their incorporation into a facility’s wastewater discharge permit. In January 2010, the Wisconsin Natural Resources Board adopted its state standard for regulating the amount of heat that facilities can discharge into Wisconsin waters. This rule was necessary because the EPA determined that Wisconsin had not developed a state thermal standard consistent with Section 316(a) of the Federal Clean Water Act. The Wisconsin State Thermal Rule was approved by the EPA in October 2010. Compliance with the thermal rule will be evaluated on a case-by-case basis as wastewater discharge permits for WPL’s generating facilities are renewed in the future. Alliant Energy and WPL continue to evaluate the thermal rule regulatory requirements and the compliance options available to meet the heat limitations for discharges from WPL’s EGUs. Alliant Energy and WPL are unable to predict the final requirements of this rule until wastewater discharge permits for impacted facilities are renewed. If capital investments and/or modifications are required, Alliant Energy and WPL believe these investments could be significant.
Hydroelectric Fish Passages and Fish Protective Devices -In 2002, FERC issued an order requiring the following actions by WPL regarding its Prairie du Sac hydro plant: 1) develop a detailed engineering and biological evaluation of potential fish passages for the facility; 2) install an agency-approved fish-protective device at the facility; and 3) install an agency-approved fish passage at the facility. In December 2009, WPL completed the installation of the agency-approved fish-protective device. WPL continues to work with the agencies to design and install the fish passage. The U.S. Fish and Wildlife Service and the Wisconsin DNR have requested additional information to support the conceptual plan for the fish passage and extended the required completion date to Dec. 31, 2012. WPL currently expects to request an additional extension from FERC in 2011. Alliant Energy and WPL believe the required capital investments and/or modifications to comply with the FERC order for the fish passage at WPL’s Prairie du Sac hydro plant could be significant.
Land and Solid Waste -
CCRs - Alliant Energy, IPL and WPL are monitoring potential regulatory changes that may affect the rules for operation and maintenance of ash surface impoundments (ash ponds) and/or landfills, in the wake of a structural failure in the containment berm of an ash surface impoundment at a different utility. In 2009, IPL and WPL responded to information collection requests from the EPA for data on coal ash surface impoundments at certain of their facilities. The EPA continues to evaluate the responses and conducted on-site follow-up inspections at certain IPL and WPL sites in 2010.
In June 2010, the EPA issued a proposed rule seeking comment regarding two potential regulatory options for management of CCRs: 1) regulate as a special waste under the federal hazardous waste regulations when the CCR is destined for disposal, but continue to allow beneficial use applications of CCRs as a non-hazardous material; or 2) regulate as a non-hazardous waste for all applications subject to new national standards. These proposed regulations include additional requirements with significant impact for CCR management, beneficial use applications and disposal. IPL and WPL have nine and four current or former coal generating facilities, respectively, with one or more existing ash surface impoundments. In addition, IPL and WPL each have two active CCR company-owned landfills. All of these CCR disposal units would be subject to the proposed rule anticipated to be final in 2012. The schedule for compliance with this rule has not yet been established. Alliant Energy, IPL and WPL are currently unable to predict the impact of these information collection requests, site inspections, or potential regulations resulting from such requests for the management of CCRs, but expect that capital investments, operating expenditures and/or modifications to comply with CCR rules could be significant.
57
Closed Ash Landfill Sites -In 2004, IPL received communication from the Iowa DNR regarding an evaluation of groundwater monitoring results for four of its closed ash landfills and a request to further evaluate potential offsite groundwater impacts at two of its closed landfills. The Iowa DNR approved IPL’s plans to evaluate potential offsite groundwater impacts at these two landfills in 2005. Work was completed at one of the landfills in 2005. Work at the other landfill has not been completed pending additional analysis from the installation of an additional groundwater monitoring well. In August 2010, the Iowa DNR approved the site for the installation of the well. Groundwater sampling at the site will continue in 2011, and the results will be provided to the Iowa DNR for review. Alliant Energy and IPL are currently unable to predict the outcome of this review and its impact on their financial condition or results of operations.
Polychlorinated Biphenyls (PCB) -In April 2010, the EPA published an Advance Notice of Proposed Rulemaking (ANPRM) to support a re-evaluation of all existing use authorizations for PCB-containing equipment. Based on the EPA’s review of the information obtained by this ANPRM, significant changes in PCB regulations may be proposed, including a possible mandated phase out of all PCB-containing equipment. The EPA plans to issue a proposed PCB rule amendment for public comment in 2013. The schedule for compliance with this rule has not yet been established. Pending the development of a final rule, Alliant Energy, IPL and WPL are currently unable to predict the outcome of this possible regulatory change, but believe that the required capital investment and/or modifications resulting from these potential regulations could be significant.
Manufactured Gas Plant (MGP) Sites -Refer to Note 12(e) of the “Combined Notes to Consolidated Financial Statements” for discussion of IPL’s and WPL’s MGP sites.
GHG Emissions - Climate change continues to garner public attention along with support for policymakers to take action to mitigate global warming. There is considerable debate regarding the public policy response that the U.S. should adopt, involving both domestic actions and international efforts. Several members of Congress have proposed legislation to regulate GHG emissions, primarily targeting reductions of carbon dioxide (CO2) emissions. The EPA is responding to a court ruling that requires issuance of federal rules to reduce GHG emissions under the existing CAA. Associated regulations to implement these federal GHG rules are also underway in the states covering IPL’s and WPL’s service territories. Given the highly uncertain outcome and timing of future regulations regarding the control of GHG emissions, Alliant Energy, IPL and WPL currently cannot predict the financial impact of any future climate change regulations on their operations but believe the expenditures to comply with any new emissions regulations could be significant.
Significant uncertainty exists surrounding the final implementation of the EPA’s GHG regulations. Furthermore, while implementation of these regulations continues to proceed, the impacts of these regulations remain subject to change as a consequence of the complexity and magnitude of determining how to effectively control GHGs under the existing legal framework of the CAA, which may include the EPA and state agency interpretations of appropriate permitting and emission compliance requirements. The outcome of these regulations and challenges will determine whether and how GHG stationary sources, including electric utility operations, will be regulated under the CAA. Alliant Energy, IPL and WPL are currently unable to predict the timing and nature of stationary source rules for GHG emissions including future issuance of regulations that would mandate reductions of GHGs at electric utilities.
In 2009, the EPA issued a final Endangerment and Cause or Contribute Findings for GHG under the CAA with an effective date of January 2010. This final action includes two distinct findings regarding GHG emissions under the CAA. First, the current and projected concentrations of GHG emissions in the atmosphere threaten the public health and welfare of current and future generations. This is referred to as the endangerment finding and includes the six key GHG emissions identified in the EPA’s mandatory GHG reporting rule. Second, the combined emissions of CO2, methane (CH4), nitrous oxide (N2O), and hydrofluorocarbons (HFCs) from new motor vehicles and motor vehicle engines contribute to the atmospheric concentrations of these key GHG emissions and hence to the threat of climate change. This is referred to as the cause or contribute finding. In April 2010, the EPA, under authority from the GHG Endangerment and Cause or Contribute Findings, also issued a final rule that regulates GHG emissions from motor vehicles as a pollutant under the CAA. This finding and rule are subject to legal challenges in the D.C. Circuit Court. These actions by the EPA enable it to regulate GHG stationary sources, including electric utility operations and natural gas distribution operations.
The primary GHG emitted from Alliant Energy’s utility operations is CO2 from the combustion of fossil fuels at its larger EGUs. Alliant Energy’s annual CO2 emissions from its larger EGUs, in terms of total mass, ranged from 19 million tons (or 17 million metric tons) to 24 million tons (or 22 million metric tons) during the 2006 through 2010 period. These amounts represent emissions from IPL’s and WPL’s ownership portion of fossil-fueled EGUs with a design nameplate of 25 MW or greater that are required to be equipped with continuous emissions monitoring systems.
58
EPA Mandatory GHG Reporting Rule -In December 2009, the final EPA Mandatory GHG Reporting rule became effective. The final rule does not require control of GHG emissions, rather it requires that sources above certain threshold levels monitor and report emissions. The EPA anticipates that the data collected by this rule will improve the U.S. government’s ability to formulate a set of climate change policy options. The GHG emissions covered by the final EPA reporting rule include CO2, CH4, N2O, sulfur hexafluoride, HFCs, perfluorocarbons and other fluorinated gases. Emissions of GHG will be reported at the facility level in CO2e and include those facilities that emit 25,000 metric tons or more of CO2e annually. The final rule applies to electric utility and natural gas distribution operations at IPL and WPL. The annual reporting compliance requirement begins for calendar year 2010, with the first GHG emissions reports due by March 31, 2011. Alliant Energy continues to maintain and update its emissions monitoring methodologies and data collection procedures to capture all the GHG emissions data required to comply with the EPA’s mandatory GHG reporting rule. This rule is subject to legal challenge in the D.C. Circuit Court.
EPA NSPS for GHG Emissions from Electric Utilities - In December 2010, the EPA announced the future issuance of GHG standards for electric utilities under the CAA. The GHG emission limits are to be established as NSPS for new and existing fossil-fueled EGUs. The EPA is expected to propose NSPS by July 2011 and finalize NSPS by May 2012. For existing EGUs, the NSPS issued by the EPA is expected to include emission guidelines that states must use to develop plans for reducing EGU GHG emissions. The guidelines will be established based on demonstrated controls, GHG emission reductions, costs and expected timeframes for installation and compliance. Under existing EPA regulations, states must submit their plans to the EPA within nine months after publication of the guidelines unless the EPA sets a different schedule. States have the ability to apply less or more stringent standards, or longer or shorter compliance schedules. The implications of the EPA’s NSPS rule for GHG emissions from EGUs are highly uncertain, including the nature of required emissions controls and compliance timeline for mandating reductions of GHGs. Alliant Energy, IPL and WPL are currently unable to predict the final outcome, but expect that expenditures to comply with any regulations to reduce GHG emissions could be significant.
EPA GHG Tailoring Rule -In June 2010, the EPA issued the GHG Tailoring Rule, which became effective on Jan. 2, 2011. The rule establishes a GHG emissions threshold for major sources under the PSD Construction Permit and Title V Operation Permit programs at 100,000 tons per year (tpy) of CO2e. The rule also establishes a threshold for what will be considered a significant increase in GHG emissions. New major sources and significantly modified existing sources of GHG will be required to obtain PSD construction permits that demonstrate BACT emissions measures to minimize GHG. The rule establishes a phased-in implementation schedule for compliance with these GHG permitting requirements. Through June 2011, GHG requirements only apply to sources that are already obtaining CAA permits for other (non-GHG) pollutants. In July 2011, GHG requirements will apply to all new major sources and modifications at existing major sources that would increase GHG emissions by at least 75,000 tpy for CO2e. The rule is subject to legal challenges in the D.C. Circuit Court. The implications of the EPA’s GHG Tailoring Rule are highly uncertain, and Alliant Energy, IPL and WPL are currently unable to predict the impact on their financial condition or results of operations, but expect that expenditures to comply with these regulations to reduce GHG emissions could be significant.
Refer to Note 12(e) of the “Combined Notes to Consolidated Financial Statements,” Item 1 Business, “Strategic Overview” and “Liquidity and Capital Resources - Cash Flows - Investing Activities - Construction and Acquisition Expenditures” for further discussion of environmental matters.
LEGISLATIVE MATTERS
Recent Legislative Developments -
Federal Tax Legislation - In 2010, the SBJA and the Tax Relief, Unemployment Insurance Reauthorization and Job Creation Act of 2010 (the Act) were enacted. The most significant provisions of the SBJA and the Act for Alliant Energy, IPL and WPL were provisions related to the extension of bonus depreciation deductions for certain expenditures for property that are incurred through Dec. 31, 2012. Based on capital projects placed into service in 2010 and capital projects expected to be placed into service in 2011, Alliant Energy currently estimates its total bonus depreciation deductions to be claimed in its 2010 and 2011 U.S. federal income tax returns will be approximately $425 million (includes $205 million for IPL and $215 million for WPL) and $500 million (includes $220 million for IPL and $280 million for WPL), respectively. Alliant Energy, IPL and WPL are currently unable to estimate their bonus depreciation deductions to be claimed on their 2012 U.S. federal income tax return but believe bonus depreciation deductions will likely contribute to annual federal net operating losses through 2012. Alliant Energy’s federal net operating losses carryforwards including mixed service costs are currently expected to offset future federal taxable income through 2015 resulting in minimal federal cash tax payments to the IRS by Alliant Energy, IPL and WPL through 2015. Refer to Note 5 of the “Combined Notes to Consolidated Financial Statements” for further discussion of the SBJA and the Act.
59
Federal Health Care Legislation -In March 2010, the Patient Protection and Affordable Care Act, and Health Care and Education Reconciliation Act of 2010 (Federal Health Care Legislation) were enacted. One of the most significant provisions of the Federal Health Care Legislation for Alliant Energy, IPL and WPL requires a reduction in their tax deductions for retiree health care costs beginning in 2013, to the extent their drug expenses are reimbursed under the Medicare Part D retiree drug subsidy program. The reduction in the future deductibility of retiree health care costs accrued as of Dec. 31, 2009 required Alliant Energy, IPL and WPL to record deferred income tax expense of $7 million, $4 million and $3 million, respectively, in 2010. In addition, Alliant Energy, IPL and WPL currently anticipate increased annual tax expense beginning in 2010 of approximately $2 million, $1 million, and $1 million, respectively, as a result of this legislation. The Federal Health Care Legislation also contains provisions that may impact future benefits costs for Alliant Energy, IPL and WPL. These provisions include the elimination of annual and lifetime caps for certain benefits beginning in 2011 and the implementation of an excise tax for health insurance plans with annual premiums in excess of certain thresholds beginning in 2018. Refer to Notes 5 and 6(a) of the “Combined Notes to Consolidated Financial Statements” for further discussion of the Federal Health Care Legislation.
Federal Regulatory Reform Legislation -In July 2010, the Dodd-Frank Act was enacted. One of the most significant financial provisions of the Dodd-Frank Act for Alliant Energy, IPL and WPL is a commercial end-user exemption that is expected to allow utilities to continue trading derivatives “over-the-counter” without having to make such trades through cleared exchanges with collateral requirements. As a result of this commercial end-user exemption, Alliant Energy, IPL and WPL currently do not believe the Dodd-Frank Act will have a material impact on their financial condition and results of operations.
Electric Fuel Cost Recovery Rule Changes in Wisconsin -Refer to “Rate Matters - Rule Changes” for discussion of new legislation enacted in May 2010 that changed the electric fuel cost recovery rules in Wisconsin effective Jan. 1, 2011.
ALLIANT ENERGY’S RESULTS OF OPERATIONS
Overview - “Executive Summary” provides an overview of Alliant Energy’s 2010, 2009 and 2008 earnings and the various components of Alliant Energy’s business. Additional details of Alliant Energy’s 2010, 2009 and 2008 earnings are discussed below.
Utility Electric Margins -Electric margins are defined as electric operating revenues less electric production fuel, energy purchases and purchased electric capacity expenses. Management believes that electric margins provide a more meaningful basis for evaluating utility operations than electric operating revenues since electric production fuel, energy purchases and purchased electric capacity expenses are generally passed through to customers, and therefore, result in changes to electric operating revenues that are comparable to changes in electric production fuel, energy purchases and purchased electric capacity expenses. Electric margins and MWh sales for Alliant Energy were as follows:
| | | | | | | | | | | | | | | | | | | | | | | | | | | | | | | | | | | | | | |
| | | Revenues and Costs (dollars in millions) | | MWhs Sold (MWhs in thousands) | |
| | | 2010 | | | 2009 | | | (a) | | | 2008 | | | (b) | | 2010 | | | 2009 | | | (a) | | | 2008 | | | (b) | |
Residential | | | $1,001.5 | | | | $868.6 | | | | 15% | | | | $844.7 | | | 3% | | | 7,836 | | | | 7,532 | | | | 4% | | | | 7,664 | | | | (2%) | |
Commercial | | | 619.0 | | | | 556.8 | | | | 11% | | | | 537.5 | | | 4% | | | 6,219 | | | | 6,108 | | | | 2% | | | | 6,181 | | | | (1%) | |
Industrial | | | 762.8 | | | | 710.7 | | | | 7% | | | | 734.7 | | | (3%) | | | 11,213 | | | | 10,948 | | | | 2% | | | | 12,490 | | | | (12%) | |
| | | | | | | | | | | | | | | | | | | | | | | | | | | | | | | | | | | | | | |
Retail subtotal | | | 2,383.3 | | | | 2,136.1 | | | | 12% | | | | 2,116.9 | | | 1% | | | 25,268 | | | | 24,588 | | | | 3% | | | | 26,335 | | | | (7%) | |
Sales for resale: | | | | | | | | | | | | | | | | | | | | | | | | | | | | | | | | | | | | | | |
Wholesale | | | 196.8 | | | | 190.1 | | | | 4% | | | | 201.9 | | | (6%) | | | 3,325 | | | | 3,251 | | | | 2% | | | | 3,813 | | | | (15%) | |
Bulk power and other | | | 44.1 | | | | 98.3 | | | | (55%) | | | | 31.1 | | | 216% | | | 1,378 | | | | 2,583 | | | | (47%) | | | | 983 | | | | 163% | |
Other | | | 50.0 | | | | 51.4 | | | | (3%) | | | | 61.4 | | | (16%) | | | 153 | | | | 155 | | | | (1%) | | | | 164 | | | | (5%) | |
| | | | | | | | | | | | | | | | | | | | | | | | | | | | | | | | | | | | | | |
Total revenues/sales | | | 2,674.2 | | | | 2,475.9 | | | | 8% | | | | 2,411.3 | | | 3% | | | 30,124 | | | | 30,577 | | | | (1%) | | | | 31,295 | | | | (2%) | |
| | | | | | | | | | | | | | | | | | | | | | | | | | | | | | | | | | | | | | |
Electric production fuel expense | | | 387.9 | | | | 388.5 | | | | -- | | | | 424.0 | | | (8%) | | | | | | | | | | | | | | | | | | | | |
Energy purchases expense | | | 431.3 | | | | 502.9 | | | | (14%) | | | | 419.1 | | | 20% | | | | | | | | | | | | | | | | | | | | |
Purchased electric capacity expense | | | 279.7 | | | | 281.1 | | | | -- | | | | 285.7 | | | (2%) | | | | | | | | | | | | | | | | | | | | |
| | | | | | | | | | | | | | | | | | | | | | | | | | | | | | | | | | | | | | |
Margins | | | $1,575.3 | | | | $1,303.4 | | | | 21% | | | | $1,282.5 | | | 2% | | | | | | | | | | | | | | | | | | | | |
| | | | | | | | | | | | | | | | | | | | | | | | | | | | | | | | | | | | | | |
| (a) | Reflects the % change from 2009 to 2010. (b) Reflects the % change from 2008 to 2009. |
2010 vs. 2009 Summary -Electric margins increased $272 million, or 21% in 2010, primarily due to the impact of non-fuel retail rate increases at IPL and WPL, which increased electric revenues by $213 million in 2010, an estimated $64 million increase in electric margins from changes in the net impacts of weather conditions and Alliant Energy’s weather hedging activities, $12 million of higher energy conservation revenues at IPL, $7 million of lower purchased electric capacity expenses at WPL related to the RockGen Energy Center (RockGen) PPA, which terminated in May 2009, and increased rates
60
charged to WPL’s wholesale customers including the impact of a wholesale formula rate change, which increased electric revenues at WPL by $4 million in 2010. These items were partially offset by an $11 million reduction in electric margins from changes in the recovery of electric production fuel and energy purchase expenses at WPL, reduced sales to two of IPL’s larger industrial customers who transitioned to their own cogeneration facilities in 2009, a $4 million regulatory-related credit recorded by IPL in 2009 related to the IUB’s approval to recover electric capacity expenses incurred in 2008 related to the severe flooding, $3 million of higher purchased electric capacity expenses related to the DAEC PPA, and a $3 million reduction in electric margins from the impact of annual adjustments to unbilled revenue estimates. Changes in energy conservation revenues are largely offset by changes in energy conservation expenses.
2009 vs. 2008 Summary -Electric margins increased $21 million, or 2% in 2009, primarily due to the impact of IPL’s 2009 interim retail rate increase effective March 2009, which increased IPL’s electric revenues by $62 million in 2009, an estimated $10 million reduction in electric margins in 2008 due to the loss of retail sales during electric service outages caused by the severe flooding in IPL’s service territory in 2008, $9 million of lower purchased electric capacity expenses at WPL related to the RockGen PPA, which terminated in May 2009, $6 million of incremental purchased electric capacity expenses at IPL in 2008 resulting from the severe flooding, $5 million of higher energy conservation revenues at IPL, a $4 million regulatory-related credit recorded by IPL in 2009 related to the IUB’s approval to recover electric capacity expenses incurred in 2008 related to the severe flooding, and changes in the recovery of electric production fuel and energy purchase expenses at WPL. These items were partially offset by an estimated $33 million reduction in electric margins from changes in the net impacts of weather conditions and Alliant Energy’s weather hedging activities, a decrease in weather-normalized sales volumes, $12 million of higher purchased electric capacity expenses at WPL related to the Kewaunee Nuclear Power Plant (Kewaunee) PPA, $6 million of higher purchased electric capacity expenses at IPL related to the DAEC PPA and a $4 million reduction in electric margins from the impact of annual adjustments to unbilled revenue estimates.
Non-fuel Retail Rate Increases - Increases to Alliant Energy’s electric revenues from the impacts of non-fuel retail rate increases for 2010 were as follows (dollars in millions):
| | | | | | | | | | | | |
Retail Base Rate Cases | | Percent
Increase | | | Effective
Date | | | Revenue
Impact (a) | |
WPL: | | | | | | | | | | | | |
2010 Test Year | | | 6% | | | | Jan. 1, 2010 | | | | $94 | |
IPL: | | | | | | | | | | | | |
Iowa 2009 Test Year | | | 10% | | | | March 20, 2010 | | | | 96 | |
Minnesota 2009 Test Year | | | 20% | | | | July 6, 2010 | | | | 5 | |
Iowa 2008 Test Year | | | 7% | | | | March 27, 2009 | | | | 18 | |
| | | | | | | | | | | | |
| | | | | | | | | | | $213 | |
| | | | | | | | | | | | |
| (a) | The revenue impact is net of any reserves for rate refunds. |
Refer to “Rate Matters” for additional information relating to electric rate increases, pending rate filings, IPL’s rate freeze for base rates charged to its Iowa electric retail customers through 2013 and an anticipated rate filing by WPL in 2011.
Impacts of Weather Conditions (excluding the impacts of severe flooding in IPL’s service territory) -Estimated increases (decreases) to Alliant Energy’s electric margins from the net impacts of weather and Alliant Energy’s weather hedging activities were as follows (in millions):
| | | | | | |
| | | 2010 | | 2009 | | 2008 |
Weather impacts on demand compared to normal weather | | $25 | | ($36) | | ($11) |
Gains (losses) from weather derivatives (a) | | -- | | (3) | | 5 |
| | | | | | |
Net weather impact | | $25 | | ($39) | | ($6) |
| | | | | | |
| (a) | Recorded in “Other” revenues in the utility electric margins table. |
Alliant Energy’s electric sales demand is seasonal to some extent with the annual peak normally occurring in the summer months due to air conditioning usage by its residential, commercial and wholesale customers. Cooling degree days (CDD) data is used to measure the variability of temperatures during summer months and is correlated with electric sales demand. Heating degree days (HDD) data is used to measure the variability of temperatures during winter months and is correlated with electric and gas sales demand. Refer to “Utility Gas Margins - Impacts of Weather Conditions” for details regarding HDD in Alliant Energy’s service territories. CDD in Alliant Energy’s service territories were as follows:
61
| | | | | | | | |
| | | Actual | | |
| CDD (a): | | 2010 | | 2009 | | 2008 | | Normal (a) |
Cedar Rapids, Iowa (IPL) | | 923 | | 406 | | 583 | | 754 |
Madison, Wisconsin (WPL) | | 829 | | 368 | | 538 | | 623 |
| (a) | CDD are calculated using a simple average of the high and low temperatures each day compared to a 65 degree base. Normal degree days are calculated using a rolling 20-year average of historical CDD. |
Alliant Energy periodically utilizes weather derivatives based on CDD and HDD to reduce the potential volatility on its margins during the summer months of June through August and the winter months of November through March, respectively. Alliant Energy entered into weather derivatives based on CDD in Cedar Rapids, Iowa and Madison, Wisconsin for the period June 1, 2008 to Aug. 31, 2008. Alliant Energy entered into weather derivatives based on HDD in Cedar Rapids, Iowa and Madison, Wisconsin for the periods Nov. 1, 2008 to March 31, 2009 and Nov. 1, 2007 to March 31, 2008. Alliant Energy has not entered into any weather derivatives since March 31, 2009.
Electric Production Fuel and Energy Purchases (Fuel-related) Cost Recoveries -Alliant Energy burns coal and other fossil fuels to produce electricity at its generating facilities. The cost of fossil fuels used during each period is included in electric production fuel expense. Alliant Energy also purchases electricity to meet the demand of its customers and charges these costs to energy purchases expense. Alliant Energy’s electric production fuel expense decreased $1 million in 2010 and $36 million, or 8%, in 2009. The 2010 decrease was primarily due to lower costs of natural gas swap contracts used to mitigate pricing volatility for fuel used to supply IPL’s Emery Generating Station, substantially offset by higher coal volumes burned at its generating facilities resulting from increased generation needed to serve the higher electricity demand in 2010. The 2009 decrease was primarily due to lower coal volumes burned at its generating facilities resulting from reduced generation needed to serve the lower electricity demand in 2009. Alliant Energy’s energy purchases expense decreased $72 million, or 14%, in 2010 and increased $84 million, or 20%, in 2009. The 2010 decrease was primarily due to lower energy volumes purchased and lower energy prices. The 2009 increase was primarily due to higher energy purchased volumes and higher costs in 2009 related to derivative instruments used to mitigate pricing volatility for the electricity purchased to supply to its customers. The impact of the changes in energy purchases volumes were largely offset by the impact of changes in bulk power sales volumes discussed below.
Due to IPL’s rate recovery mechanisms for fuel-related costs, changes in fuel-related costs resulted in comparable changes in electric revenues and, therefore, did not have a significant impact on IPL’s electric margins. WPL’s rate recovery mechanism for wholesale fuel-related costs also provides for adjustments to its wholesale electric rates for changes in commodity costs, thereby mitigating impacts of changes to commodity costs on WPL’s electric margins.
WPL’s retail fuel-related costs incurred in 2010 were higher than the forecasted fuel-related costs used to set retail rates effective at the beginning of 2010. In April 2010, WPL filed a request with the PSCW to increase its annual fuel-related retail electric rates for the remainder of 2010 to recover anticipated increased fuel-related costs for 2010. In June 2010, WPL received approval from the PSCW to implement an interim rate increase of $9 million, on an annual basis, subject to refund, effective in June 2010. Updated annual 2010 fuel-related costs during the proceeding resulted in WPL no longer qualifying for a fuel-related rate increase for 2010. In December 2010, the PSCW issued an order authorizing no increase in retail electric rates in 2010 related to fuel expense and authorized continuation of the interim rates through the end of 2010. The order obligates WPL to return the $5 million of interim rate over-collections to its retail customers as an offset to rate increases requested for 2011 rather than refunding a lump sum to applicable customers in early 2011. As of Dec. 31, 2010, Alliant Energy and WPL have fully reserved $5 million, including interest, for all interim rate over-collections in 2010.
WPL estimates the higher than forecasted retail fuel-related costs decreased electric margins by approximately $3 million in 2010. WPL’s retail fuel-related costs incurred in 2009 and 2008 were both lower than the forecasted fuel-related costs used to set retail rates during such periods. WPL estimates the lower than forecasted retail fuel-related costs increased electric margins by approximately $8 million and $5 million in 2009 and 2008, respectively.
Refer to “Other Matters - Market Risk Sensitive Instruments and Positions” for discussion of risks associated with increased electric production fuel and energy purchases expenses on WPL’s electric margins. Refer to “Rate Matters” and Note 1(h) of the “Combined Notes to Consolidated Financial Statements” for additional information relating to recovery mechanisms for electric production fuel and energy purchases expenses and changes to the retail rate recovery rules in Wisconsin for electric production fuel and energy purchases expenses beginning in 2011.
62
Purchased Electric Capacity Expense -Alliant Energy enters into PPAs to help meet the electricity demand of its customers. Certain of these PPAs include minimum payments for IPL’s and WPL’s rights to electric generating capacity. Details of purchased electric capacity expense included in the utility electric margins table above were as follows (in millions):
| | | | | | |
| | | 2010 | | 2009 | | 2008 |
DAEC PPA (IPL) | | $143 | | $140 | | $134 |
Kewaunee PPA (WPL) | | 72 | | 74 | | 62 |
Riverside PPA (WPL) | | 58 | | 57 | | 56 |
RockGen PPA (WPL) (Expired May 2009) | | -- | | 7 | | 16 |
Flood-related PPA (IPL) (Summer of 2008 only) (a) | | -- | | (4) | | 6 |
Other | | 7 | | 7 | | 12 |
| | | | | | |
| | $280 | | $281 | | $286 |
| | | | | | |
| (a) | IPL received approval from the IUB to recover $4 million from its retail customers in Iowa related to the incremental purchased electric capacity expenses IPL incurred during the summer of 2008 for leasing temporary generation to contribute to the reliability of the electric grid in Cedar Rapids, Iowa due to damage to infrastructure caused by the severe flooding in 2008. |
At Dec. 31, 2010, the future estimated purchased electric capacity expense related to the DAEC (expires in 2014), Kewaunee (expires in 2013) and Riverside (expires in 2013) PPAs were as follows (in millions):
| | | | | | | | | | |
| | | 2011 | | 2012 | | 2013 | | 2014 | | Total |
DAEC PPA (IPL) | | $146 | | $152 | | $154 | | $28 | | $480 |
Kewaunee PPA (WPL) | | 51 | | 59 | | 62 | | -- | | 172 |
Riverside PPA (WPL) | | 59 | | 60 | | 17 | | -- | | 136 |
| | | | | | | | | | |
| | $256 | | $271 | | $233 | | $28 | | $788 |
| | | | | | | | | | |
Unbilled Revenue Estimates -In the second quarter of each year, when weather impacts on electric sales volumes are historically minimal, Alliant Energy refines its estimates of unbilled electric revenues. Adjustments resulting from these refined estimates can increase or decrease electric margins reported each year in the second quarter. Estimated increases (decreases) in Alliant Energy’s electric margins from the annual adjustments to unbilled revenue estimates recorded in the second quarter were as follows (in millions):
| | | | | | | | | | | | |
| | | 2010 | | | 2009 | | | 2008 | |
IPL | | | $2 | | | | ($6) | | | | $3 | |
WPL | | | (6) | | | | 5 | | | | -- | |
| | | | | | | | | | | | |
Alliant Energy | | | ($4) | | | | ($1) | | | | $3 | |
| | | | | | | | | | | | |
Sales Trends -Retail sales volumes increased 3% and decreased 7% in 2010 and 2009, respectively. The 2010 increase was primarily due to higher usage per customer caused by changes in weather and economic conditions in Alliant Energy’s service territories in 2010 compared to 2009, partially offset by reduced sales to two of IPL’s larger industrial customers who transitioned to their own cogeneration facilities in 2009 and the impact of the annual unbilled sales adjustments discussed above. The 2009 decrease was largely due to a 12% decrease in industrial sales, which was caused by reduced sales to two of IPL’s larger industrial customers who transitioned to their own cogeneration facilities in 2009 and plant closures and shift reductions as a result of economic conditions in 2009.
Wholesale sales volumes increased 2% and decreased 15% in 2010 and 2009, respectively. The 2010 increase was primarily due to higher sales caused by weather conditions. The effect of the higher sales in 2010 was partially offset by lower sales to WPL’s partial-requirement wholesale customers that have contractual options to be served by WPL, other power supply sources or the MISO market. The 2009 decrease was largely due to the impact of weather and economic conditions in 2009 on the electric sales demand of IPL’s and WPL’s wholesale customers.
Bulk power and other sales volumes changes were largely due to changes in sales in the wholesale energy markets operated by MISO and PJM Interconnection, LLC. These changes are impacted by several factors including the availability of Alliant Energy’s generating facilities and electricity demand within these wholesale energy markets. Changes in bulk power and other sales revenues were largely offset by changes in energy purchases expense and therefore did not have a significant impact on electric margins.
63
Refer to “Other Matters - Other Future Considerations” for discussion of retail electric sales projections expected to be influenced by economic conditions and ethanol production facilities in Alliant Energy’s service territories.
Utility Gas Margins -Gas margins are defined as gas operating revenues less cost of gas sold. Management believes that gas margins provide a more meaningful basis for evaluating utility operations than gas operating revenues since cost of gas sold are generally passed through to customers, and therefore, result in changes to gas operating revenues that are comparable to changes in cost of gas sold. Gas margins and dekatherm (Dth) sales for Alliant Energy were as follows:
| | | | | | | | | | | | | | | | | | | | | | | | | | | | | | | | | | | | | | | | |
| | | Revenues and Costs (dollars in millions) | | | Dths Sold (Dths in thousands) | |
| | | 2010 | | | 2009 | | | (a) | | | 2008 | | | (b) | | | 2010 | | | 2009 | | | (a) | | | 2008 | | | (b) | |
Residential | | | $273.7 | | | | $290.8 | | | | (6%) | | | | $385.0 | | | | (24%) | | | | 27,128 | | | | 27,711 | | | | (2%) | | | | 30,630 | | | | (10%) | |
Commercial | | | 154.2 | | | | 174.7 | | | | (12%) | | | | 240.5 | | | | (27%) | | | | 18,691 | | | | 20,725 | | | | (10%) | | | | 22,461 | | | | (8%) | |
Industrial | | | 27.3 | | | | 30.7 | | | | (11%) | | | | 51.1 | | | | (40%) | | | | 4,158 | | | | 4,558 | | | | (9%) | | | | 5,558 | | | | (18%) | |
| | | | | | | | | | | | | | | | | | | | | | | | | | | | | | | | | | | | | | | | |
Retail subtotal | | | 455.2 | | | | 496.2 | | | | (8%) | | | | 676.6 | | | | (27%) | | | | 49,977 | | | | 52,994 | | | | (6%) | | | | 58,649 | | | | (10%) | |
Interdepartmental | | | 1.5 | | | | 4.9 | | | | (69%) | | | | 7.8 | | | | (37%) | | | | 887 | | | | 938 | | | | (5%) | | | | 1,373 | | | | (32%) | |
Transportation/other | | | 23.9 | | | | 24.2 | | | | (1%) | | | | 26.0 | | | | (7%) | | | | 49,521 | | | | 53,580 | | | | (8%) | | | | 59,253 | | | | (10%) | |
| | | | | | | | | | | | | | | | | | | | | | | | | | | | | | | | | | | | | | | | |
Total revenues/sales | | | 480.6 | | | | 525.3 | | | | (9%) | | | | 710.4 | | | | (26%) | | | | 100,385 | | | | 107,512 | | | | (7%) | | | | 119,275 | | | | (10%) | |
| | | | | | | | | | | | | | | | | | | | | | | | | | | | | | | | | | | | | | | | |
Cost of gas sold | | | 304.0 | | | | 347.9 | | | | (13%) | | | | 519.6 | | | | (33%) | | | | | | | | | | | | | | | | | | | | | |
| | | | | | | | | | | | | | | | | | | | | | | | | | | | | | | | | | | | | | | | |
Margins | | | $176.6 | | | | $177.4 | | | | -- | | | | $190.8 | | | | (7%) | | | | | | | | | | | | | | | | | | | | | |
| | | | | | | | | | | | | | | | | | | | | | | | | | | | | | | | | | | | | | | | |
| (a) | Reflects the % change from 2009 to 2010. (b) Reflects the % change from 2008 to 2009. |
2010 vs. 2009 Summary -Gas margins decreased $1 million in 2010, primarily due to a 6% decrease in retail sales volumes. This item was substantially offset by the impact of WPL’s 2010 retail gas rate increase effective in January 2010, which increased gas revenues by $5 million in 2010. The decrease in retail sales volumes was largely due to lower usage per customer caused by weather conditions and lower gas required by agricultural customers to dry grain in 2010.
2009 vs. 2008 Summary -Gas margins decreased $13 million, or 7%, in 2009, primarily due to an estimated $7 million reduction in gas margins from changes in the net impacts of weather conditions and Alliant Energy’s weather hedging activities, and the impact of WPL’s 2009 retail gas rate decrease effective in January 2009 that reduced WPL’s gas revenues in 2009 by $4 million.
Natural Gas Cost Recoveries -In 2010 and 2009, Alliant Energy’s cost of gas sold decreased $44 million, or 13%, and $172 million, or 33%, respectively. The 2010 and 2009 decreases were primarily due to a decrease in Dths sold to retail customers and a decrease in natural gas prices. Due to Alliant Energy’s rate recovery mechanisms for natural gas costs, these changes in cost of gas sold resulted in comparable changes in gas revenues and, therefore, did not have a significant impact on gas margins. Refer to Note 1(h) of the “Combined Notes to Consolidated Financial Statements” for additional information relating to natural gas cost recoveries.
Impacts of Weather Conditions - -Estimated increases (decreases) to Alliant Energy’s gas margins from the net impacts of weather and Alliant Energy’s weather hedging activities were as follows (in millions):
| | | | | | |
| | | 2010 | | 2009 | | 2008 |
Weather impacts on demand compared to normal weather | | ($1) | | $3 | | $12 |
Losses from weather derivatives (a) | | -- | | (3) | | (5) |
| | | | | | |
Net weather impact | | ($1) | | $-- | | $7 |
| | | | | | |
| (a) | Recorded in “Transportation/other” revenues in the utility gas margins table. |
Alliant Energy’s gas sales demand follows a seasonal pattern with an annual base load of gas and a large heating peak occurring during the winter season. HDD data is used to measure the variability of temperatures during winter months and is correlated with gas sales demand. HDD in Alliant Energy’s service territories were as follows:
| | | | | | | | |
| | | Actual | | |
| HDD (a): | | 2010 | | 2009 | | 2008 | | Normal (a) |
Cedar Rapids, Iowa (IPL) | | 6,868 | | 7,074 | | 7,636 | | 6,768 |
Madison, Wisconsin (WPL) | | 6,798 | | 7,356 | | 7,714 | | 7,105 |
64
| (a) | HDD are calculated using a simple average of the high and low temperatures each day compared to a 65 degree base. Normal degree days are calculated using a rolling 20-year average of historical HDD. |
Alliant Energy periodically utilizes weather derivatives based on HDD to reduce the potential volatility on its gas margins during the winter months of November through March.
Utility Other Revenues - Changes in utility other revenues were largely offset by related changes in utility other operation and maintenance expenses.
2010 vs. 2009 Summary -Other revenues for the utilities decreased $28 million in 2010, primarily due to lower steam revenues at IPL and lower revenues from other energy-related products and services. Steam revenues decreased by $15 million in 2010 primarily due to IPL’s discontinuance of steam service to a portion of its steam customers located in downtown Cedar Rapids, Iowa.
2009 vs. 2008 Summary -Other revenues for the utilities decreased $9 million in 2009, primarily due to $5 million of lower steam revenues at IPL. IPL’s steam revenues were higher than normal during the second half of 2008 due to higher rates charged to steam customers for operating the temporary steam generating systems (natural gas-fired package boilers and water treatment systems) used to resume steam service after the Prairie Creek Generating Station (Prairie Creek) and Sixth Street were shut down due to severe flooding in 2008.
Non-regulated Revenues - Alliant Energy’s non-regulated revenues were as follows (in millions):
| | | | | | |
| | | 2010 | | 2009 | | 2008 |
RMT | | $154 | | $294 | | $397 |
Transportation | | 42 | | 35 | | 36 |
Non-regulated Generation | | -- | | 1 | | 12 |
Other | | 1 | | 3 | | -- |
| | | | | | |
| | $197 | | $333 | | $445 |
| | | | | | |
Changes in non-regulated revenues were largely offset by related changes in non-regulated operation and maintenance expenses.
2010 vs. 2009 Summary -The decreased RMT revenues were primarily caused by reduced demand for construction management services for large wind projects and environmental consulting services in 2010. Future demand for RMT’s construction management services for large renewable energy projects is expected to be impacted by various external factors, including the availability and amount of government incentives for renewable energy projects, the number and scope of federal and state-imposed renewable portfolio standards and the availability and cost of capital to fund capital expenditures for renewable energy projects. The American Recovery and Reinvestment Act of 2009 (ARRA) enacted in February 2009 extended incentives to renewable energy projects completed by Dec. 31, 2012. Refer to “Other Matters - Other Future Considerations” for additional information on government incentives for wind projects.
The increased Transportation revenues were primarily due to increased demand for freight services provided by Alliant Energy’s short-line railway company.
2009 vs. 2008 Summary - The decreased RMT revenues were primarily caused by reduced demand for construction management services for large wind generation projects in 2009.
The decreased Non-regulated Generation revenues were primarily due to $9 million of lower revenues generated by the Neenah Energy Facility as a result of the sale of the facility to WPL on June 1, 2009.
Electric Transmission Service Expenses -
2010 vs. 2009 Summary -Alliant Energy’s electric transmission service expenses for the utilities increased $54 million in 2010, primarily due to higher transmission service costs billed to IPL by ITC and increased transmission rates billed to WPL by ATC. Electric transmission service expenses billed to IPL by ITC increased by $86 million in 2010, primarily due to increased transmission rates effective in January 2010 and higher monthly peak demands in 2010 compared to 2009. This item was partially offset by IPL’s deferral of $41 million of costs incurred in 2010, in accordance with an IUB order issued in January 2010. The IUB’s order authorizes IPL to defer these transmission costs in 2010 and to amortize these deferred costs over a five-year period ending in 2014 with an equal and offsetting amortization of IPL’s regulatory liability associated with the 2007 gain on its sale of electric transmission assets to ITC.
65
2009 vs. 2008 Summary -Alliant Energy’s electric transmission service expenses for the utilities increased $43 million in 2009, primarily due to $45 million of higher expenses billed to IPL from ITC in 2009, resulting from increased rates effective in January 2009.
Refer to “Other Matters - Other Future Considerations” for discussion of 2011 transmission rates proposed by ITC. Refer to “Rate Matters” for discussion of a transmission cost rider for recovery of electric transmission service charges incurred by IPL for its Iowa retail electric customers that was approved by the IUB in January 2011 and a proposal made by IPL to the MPUC to implement an automatic cost recovery rider for electric transmission service charges incurred by IPL for its Minnesota retail electric customers. Refer to Notes 1(b) and 1(h) of the “Combined Notes to Consolidated Financial Statements” for additional information relating to recovery of electric transmission service expenses.
Utility Other Operation and Maintenance Expenses - Alliant Energy’s other operation and maintenance expenses for the utilities increased $18 million and decreased $21 million for 2010 and 2009, respectively, due to the following reasons (amounts represent variances between periods in millions):
| | | | | | |
| 2010 vs. 2009 Summary: | | Alliant
Energy | | IPL | | WPL |
Higher incentive-related compensation expenses (a) | | $29 | | $17 | | $12 |
Regulatory-related charges in 2010 related to Whispering Willow - East wind project (b) | | 21 | | 21 | | -- |
Higher energy conservation expenses at IPL (c) | | 14 | | 14 | | -- |
Deferral of retail pension and benefits costs in 2009 at WPL (b) | | 12 | | -- | | 12 |
Higher wind turbine operation and maintenance expenses at IPL (d) | | 9 | | 9 | | -- |
Regulatory-related charges in 2010 related to Sixth Street (b) | | 7 | | 7 | | -- |
Higher electric generation maintenance expenses at IPL (m) | | 6 | | 6 | | -- |
Restructuring charges in 2010 (e) | | 4 | | 2 | | 2 |
Asset impairment in 2010 related to Sixth Street (f) | | 4 | | 4 | | -- |
Regulatory-related credits in 2009 related to 2008 flood costs (b) | | 4 | | 4 | | -- |
Lower pension and other postretirement benefits costs (g) | | (16) | | (9) | | (7) |
Lower steam fuel, operation and maintenance expenses at IPL (h) | | (16) | | (16) | | -- |
Restructuring charges in 2009 (e) | | (11) | | (4) | | (7) |
Regulatory-related charges in 2009 related to Nelson Dewey #3 project (b) | | (11) | | -- | | (11) |
Regulatory-related credits in 2010 related to 2009 flood costs and other costs (b) | | (8) | | (8) | | -- |
Incremental expenses incurred in 2009 related to severe flooding (i) | | (7) | | (7) | | -- |
Lower bad debt expense at IPL (j) | | (5) | | (5) | | -- |
Charges in 2009 related to a settlement with Sutherland #4 joint partners (k) | | (4) | | (4) | | -- |
Loss contingency reserve for Cash Balance Plan lawsuit in 2009 (l) | | (4) | | (2) | | (2) |
Asset impairment in 2009 related to Sixth Street (f) | | (4) | | (4) | | -- |
Other (includes lower expenses related to other energy-related products and services) | | (6) | | (6) | | (1) |
| | | | | | |
| | $18 | | $19 | | ($2) |
| | | | | | |
| | | |
| 2009 vs. 2008 Summary: | | Alliant
Energy | | IPL | | WPL |
Incremental expenses incurred in 2008 related to severe flooding (i) | | ($29) | | ($29) | | $-- |
Deferral of retail pension and other benefits costs in 2009 (b) | | (12) | | -- | | (12) |
Lower electric generation maintenance expenses at IPL (m) | | (10) | | (10) | | -- |
Lower steam fuel, operation and maintenance expenses (h) | | (9) | | (9) | | -- |
Lower incentive-related compensation expenses (a) | | (6) | | (3) | | (3) |
Regulatory-related credits in 2009 related to 2008 flood costs (b) | | (4) | | (4) | | -- |
Regulatory-related charges in 2008 related to Nelson Dewey #3 project (b) | | (4) | | -- | | (4) |
Higher pension and other postretirement benefits costs (g) | | 33 | | 18 | | 15 |
Restructuring charges in 2009 (e) | | 11 | | 4 | | 7 |
Regulatory-related charges in 2009 related to Nelson Dewey #3 project (b) | | 11 | | -- | | 11 |
Incremental expenses incurred in 2009 related to severe flooding (i) | | 7 | | 7 | | -- |
Higher energy conservation expenses at IPL (c) | | 5 | | 5 | | -- |
Charges in 2009 related to a settlement with Sutherland #4 joint partners (k) | | 4 | | 4 | | -- |
Loss contingency reserve for Cash Balance Plan lawsuit in 2009 (l) | | 4 | | 2 | | 2 |
Asset impairment in 2009 related to Sixth Street (f) | | 4 | | 4 | | -- |
Other (includes impact of cost saving initiatives) (n) | | (26) | | (12) | | (14) |
| | | | | | |
| | ($21) | | ($23) | | $2 |
| | | | | | |
66
| (a) | Incentive-related compensation expenses are largely based on the achievement of specific annual operational and financial performance measures compared to targets established within the incentive plans. Refer to “Other Matters - Other Future Considerations” and Note 6(b) of the “Combined Notes to Consolidated Financial Statements” for further details of incentive plans. |
| (b) | Refer to Note 1(b) of the “Combined Notes to Consolidated Financial Statements” for details of regulatory-related charges and credits incurred by IPL and WPL in 2010, 2009 and 2008. |
| (c) | Changes in energy conservation expenses were largely offset by changes in energy conservation revenues. |
| (d) | IPL started to incur operation and maintenance expenses to operate its Whispering Willow - East wind project in late 2009 when the wind project began generating electricity. |
| (e) | Restructuring charges resulted from the elimination of certain corporate and operations positions in 2010 and 2009. |
| (f) | Refer to Note 1(e) of the “Combined Notes to Consolidated Financial Statements” for details of asset impairments recorded by IPL in 2010 and 2009 related to Sixth Street. |
| (g) | Changes in pension and other postretirement benefits costs are largely based on changes in plan assets caused by contributions and returns on plan assets. Significant decreases in plan assets during 2008 resulted in higher pension and other postretirement benefits costs in 2009 and increases in plan assets during 2009 resulted in lower pension and other postretirement benefits costs in 2010. Refer to Note 6(a) of the “Combined Notes to Consolidated Financial Statements” for further details. These variance amounts exclude the portion of pension and other postretirement benefits costs allocated to capital projects. |
| (h) | Lower steam fuel, operation and maintenance expenses resulted from discontinuance of steam service to the portion of IPL’s steam customers located in downtown Cedar Rapids and from additional costs incurred by IPL in late 2008 and early 2009 to operate the temporary steam generating systems used to resume service after Prairie Creek and Sixth Street were shut down due to severe flooding. |
| (i) | IPL incurred significant operating expenditures in 2008 and 2009 required to restore operations impacted by the severe flooding in 2008 that were not reimbursed under Alliant Energy’s property insurance policy. |
| (j) | Lower bad debt expenses were largely due to improved economic conditions in IPL’s service territory. |
| (k) | IPL made $4 million of aggregate payments in 2009 to its joint partners in the Sutherland #4 project for a settlement agreement reached with them related to payments the joint partners incurred for Sutherland #4. |
| (l) | Refer to Note 12(c) of the “Combined Notes to Consolidated Financial Statements” for details of the Alliant Energy Cash Balance Pension Plan lawsuit. |
| (m) | Changes in electric generation maintenance expenses were primarily due to the timing of planned maintenance outages. |
| (n) | IPL and WPL implemented several cost saving initiatives in 2009 to reduce other operation and maintenance expenses, including, but not limited to, an elimination of certain corporate and operations positions, a mandatory one-week furlough for all non-bargaining and certain bargaining unit employees in 2009 and suspension of a portion of 401(k) Savings Plan contributions by Alliant Energy for the second half of 2009. |
Refer to “Other Matters - Other Future Considerations” for discussion of anticipated decreases in pension and other postretirement benefits costs in 2011 resulting from increases in retirement plan assets during 2010 and anticipated increases in maintenance expenses in 2011 for WPL’s Bent Tree - Phase I wind project, which began generating electricity in late 2010.
Non-regulated Operation and Maintenance Expenses - Alliant Energy’s non-regulated operation and maintenance expenses were as follows (in millions):
| | | | | | | | | | | | |
| | | 2010 | | | 2009 | | | 2008 | |
RMT | | | $150 | | | | $291 | | | | $370 | |
Transportation | | | 17 | | | | 17 | | | | 19 | |
Other | | | 3 | | | | 4 | | | | -- | |
| | | | | | | | | | | | |
| | | $170 | | | | $312 | | | | $389 | |
| | | | | | | | | | | | |
2010 vs. 2009 Summary -The RMT variance was largely driven by lower construction management costs associated with the execution of fewer large wind projects in 2010.
2009 vs. 2008 Summary -The RMT variance was largely driven by lower construction management costs associated with the execution of fewer large wind projects in 2009 and lower incentive-related compensation expenses of $8 million in 2009 resulting from the lower earnings at RMT in 2009. The increased Other expenses were largely due to higher professional expenses incurred at the parent company in 2009.
67
Depreciation and Amortization Expenses -
2010 vs. 2009 Summary -Depreciation and amortization expenses increased $18 million in 2010, primarily due to $17 million of higher depreciation expense recognized in 2010 as compared to 2009 for IPL’s Whispering Willow - East wind project that began generating electricity in late 2009. The increase was also due to additional depreciation expense from the impact of other property additions related to WPL’s AMI placed into service in 2009 and June 2009 acquisition of the Neenah Energy Facility, and new environmental controls at IPL’s Lansing Unit 4 placed into service in 2010. These items were partially offset by a depreciation adjustment recorded in 2010 at WPL, which is not anticipated to have a material impact on future periods.
2009 vs. 2008 Summary - Depreciation and amortization expenses increased $34 million in 2009, primarily due to additional depreciation expense from the impact of property additions at IPL related to restoration activities associated with the severe flooding and the Whispering Willow - East wind project that began generating electricity in late 2009 and property additions at WPL related to its Cedar Ridge wind project that began generating electricity in late 2008, AMI placed into service in 2009 and the June 2009 acquisition of the Neenah Energy Facility. The increase was also impacted by higher depreciation rates at IPL.
Refer to Note 1(e) of the “Combined Notes to Consolidated Financial Statements” for details of WPL’s Bent Tree - Phase I wind project, which is expected to result in a material increase in depreciation expense in 2011.
Refer to “Rate Matters” for discussion of the interplay between utility operating expenses and utility margins given their impact on Alliant Energy’s rate activities.
Interest Expense-
2010 vs. 2009 Summary -Alliant Energy’s interest expense increased $8 million due to the following reasons (amounts represent variances between 2010 and 2009 in millions):
| | | | | | | | | | | | |
| | | Alliant
Energy | | | IPL | | | WPL | |
Interest expense variances from certain issuances of long-term debt: | | | | | | | | | | | | |
IPL’s $300 million of 6.25% senior debentures issued in July 2009 | | | $10 | | | | $10 | | | | $-- | |
Alliant Energy’s $250 million of 4% senior notes issued in October 2009 | | | 8 | | | | -- | | | | -- | |
WPL’s $250 million of 5% debentures issued in July 2009 | | | 7 | | | | -- | | | | 7 | |
WPL’s $150 million of 4.6% debentures issued in June 2010 | | | 4 | | | | -- | | | | 4 | |
IPL’s $150 million of 3.3% senior debentures issued in June 2010 | | | 3 | | | | 3 | | | | -- | |
IPL’s $200 million of 3.65% senior debentures issued in August 2010 | | | 3 | | | | 3 | | | | -- | |
Interest expense variances from certain reductions in long-term debt: | | | | | | | | | | | | |
Alliant Energy’s Exchangeable Senior Notes retired in 2009 | | | (8) | | | | -- | | | | -- | |
WPL’s $100 million of 7.625% debentures retired in March 2010 | | | (6) | | | | -- | | | | (6) | |
IPL’s $135 million of 6.625% senior debentures retired in August 2009 | | | (5) | | | | (5) | | | | -- | |
IPL’s $200 million of 6.75% senior debentures retired in September 2010 | | | (4) | | | | (4) | | | | -- | |
Other | | | (4) | | | | (1) | | | | (1) | |
| | | | | | | | | | | | |
| | | $8 | | | | $6 | | | | $4 | |
| | | | | | | | | | | | |
2009 vs. 2008 Summary -Alliant Energy’s interest expense increased $29 million due to the following reasons (amounts represent variances between 2009 and 2008 in millions):
| | | | | | | | | | | | |
| | | Alliant
Energy | | | IPL | | | WPL | |
Interest expense variances from certain issuances of long-term debt: | | | | | | | | | | | | |
WPL’s $250 million of 7.6% debentures issued in October 2008 | | | $15 | | | | $-- | | | | $15 | |
IPL’s $250 million of 7.25% senior debentures issued in October 2008 | | | 14 | | | | 14 | | | | -- | |
IPL’s $300 million of 6.25% senior debentures issued in July 2009 | | | 9 | | | | 9 | | | | -- | |
WPL’s $250 million of 5% debentures issued in July 2009 | | | 6 | | | | -- | | | | 6 | |
Alliant Energy’s $250 million of 4% senior notes issued in October 2009 | | | 3 | | | | -- | | | | -- | |
Interest expense variances from certain reductions in long-term debt: | | | | | | | | | | | | |
IPL’s $135 million of 6.625% senior debentures retired in August 2009 | | | (4) | | | | (4) | | | | -- | |
WPL’s $60 million of 5.7% debentures retired in October 2008 | | | (3) | | | | -- | | | | (3) | |
Corporate Services’ $75 million of 4.55% senior notes retired in October 2008 | | | (3) | | | | -- | | | | -- | |
Alliant Energy’s Exchangeable Senior Notes retired in 2009 | | | (3) | | | | -- | | | | -- | |
Other (includes impact of lower commercial paper interest rates) | | | (5) | | | | (4) | | | | (5) | |
| | | | | | | | | | | | |
| | | $29 | | | | $15 | | | | $13 | |
| | | | | | | | | | | | |
68
Refer to Note 8(b) of the “Combined Notes to Consolidated Financial Statements” for additional details of Alliant Energy’s, IPL’s and WPL’s long-term debt issuances and retirements.
Loss on Early Extinguishment of Debt - Refer to Note 8(b) of the “Combined Notes to Consolidated Financial Statements” for information on $203 million of pre-tax losses incurred in 2009 related to the repurchase of Alliant Energy’s Exchangeable Senior Notes due 2030.
AFUDC -
2010 vs. 2009 Summary -AFUDC decreased $22 million in 2010, primarily due to $21 million of AFUDC recognized for IPL’s Whispering Willow - East wind project in 2009. The decrease was also due to AFUDC recognized in 2009 on capital projects related to restoration activities at IPL associated with the severe flooding in June 2008 and new environmental controls at IPL’s Lansing Unit 4. These items were partially offset by $7 million of higher AFUDC recognized in 2010 as compared to 2009 for WPL’s Bent Tree - Phase I wind project.
2009 vs. 2008 Summary -AFUDC increased $15 million in 2009, primarily due to $14 million of higher AFUDC recognized in 2009 as compared to 2008 for IPL’s Whispering Willow - East wind project. The increase was also due to AFUDC recognized in 2009 on capital projects related to restoration activities at IPL associated with the severe flooding in 2008, new environmental controls at IPL’s Lansing Unit 4 and WPL’s Bent Tree - - Phase I wind project. These items were partially offset by AFUDC recognized in 2008 related to the construction of WPL’s Cedar Ridge wind project.
Interest Income and Other -
2009 vs. 2008 Summary -Interest income and other decreased $14 million in 2009, primarily due to $15 million of lower interest income caused by lower average balances of cash and cash equivalents and lower interest rates on money market fund investments in 2009 compared to 2008.
Refer to Notes 1(d) and 1(l) of the “Combined Notes to Consolidated Financial Statements” for additional information regarding Alliant Energy’s cash and cash equivalents and interest income and other, respectively.
Income Taxes - The effective income tax rates for Alliant Energy’s continuing operations were 32.0%, (7.8%) and 31.9% for 2010, 2009 and 2008, respectively. Details of the effective income tax rates were as follows:
| | | | | | | | | | |
| | | 2010 | | | 2009 | | | 2008 |
Statutory federal income tax rate | | | 35.0% | | | | 35.0% | | | 35.0% |
State filing changes due to Wisconsin Senate Bill 62 (SB 62) enacted in February 2009 | | | -- | | | | (33.8) | | | -- |
Federal Health Care Legislation enacted in March 2010 | | | 1.6 | | | | -- | | | -- |
State income taxes, net of federal benefit | | | 1.5 | | | | 5.4 | | | 5.0 |
Production tax credits | | | (2.5) | | | | (3.9) | | | (0.1) |
Federal income tax audits | | | (1.4) | | | | -- | | | (2.8) |
Other items, net | | | (2.2) | | | | (10.5) | | | (5.2) |
| | | | | | | | | | |
Overall income tax rate | | | 32.0% | | | | (7.8%) | | | 31.9% |
| | | | | | | | | | |
2010 vs. 2009 Summary -The increase in the effective income tax rate for Alliant Energy’s continuing operations was primarily due to $40 million of income tax benefits recognized in 2009 related to the net impacts of SB 62 enacted in February 2009 and a 2009 decision to allow WPL to do business in Iowa in order to take advantage of efficiencies that will likely be available as a result of IPL and WPL sharing resources and facilities. The increase in the effective tax rate was also due to $7 million of income tax expense recognized in 2010 related to the impacts of the Federal Health Care Legislation, which is expected to reduce Alliant Energy’s tax deductions for retiree health care costs beginning in 2013, to the extent prescription drug expenses are reimbursed under the Medicare Part D retiree drug subsidy program. These items were partially offset by lower state taxes at IPL related to property related differences for which Iowa deferred tax is not recorded in the income statement pursuant to Iowa rate making principles and $7 million of income tax benefits recorded in 2010 related to the impact of the IRS completing audits of Alliant Energy’s U.S. federal income tax returns for calendar years 2005 through 2008.
2009 vs. 2008 Summary -The decrease in the effective income tax rate was primarily due to $40 million of income tax benefits recognized in 2009 related to the net impacts of SB 62 enacted in February 2009 and a decision by management to allow WPL to do business in Iowa in order to take advantage of efficiencies that will likely be available as a result of IPL and WPL sharing resources and facilities and $4 million of production tax credits in 2009 from WPL’s Cedar Ridge wind project,
69
which began generating electricity in late 2008. These items were partially offset by $12 million of income tax benefits recorded in 2008 as a result of finalizing the audit of Alliant Energy’s U.S. federal income tax returns for calendar years 2002 through 2004 and recording known adjustments for the tax returns for calendar years 2005 through 2007.
Refer to Note 5 of the “Combined Notes to Consolidated Financial Statements” for additional information regarding Alliant Energy’s effective income tax rates. Refer to “Other Matters - Other Future Considerations” for discussion of production tax credits for wind projects, which may impact future effective income tax rates.
Income (Loss) from Discontinued Operations, Net of Tax - Refer to Note 17 of the “Combined Notes to Consolidated Financial Statements” for discussion of Alliant Energy’s discontinued operations.
IPL’S RESULTS OF OPERATIONS
Overview - Earnings available for common stock decreased $10 million in 2010 and increased $11 million in 2009. The 2010 decrease was primarily due to higher electric transmission rates billed from ITC, depreciation and maintenance expenses recognized for the Whispering Willow - East wind project in 2010, AFUDC recognized on the Whispering Willow - East wind project in 2009, regulatory-related charges recorded in 2010 related to the Whispering Willow - East wind project and Sixth Street, and a higher effective income tax rate. These items were partially offset by the impact of the electric retail rate increases effective in 2010 and higher electric sales in 2010 compared to 2009 caused by weather conditions in IPL’s service territory. The 2009 increase was primarily due to a lower effective income tax rate, the impact of the severe flooding on electric margins and operating expenses in 2008 and the impact of the electric retail rate increases effective in 2009. These items were partially offset by lower electric sales resulting from cool summer weather and economic conditions in 2009 and higher operating expenses.
Electric Margins -Electric margins are defined as electric operating revenues less electric production fuel, energy purchases and purchased electric capacity expenses. Management believes that electric margins provide a more meaningful basis for evaluating utility operations than electric operating revenues since electric production fuel, energy purchases and purchased electric capacity expenses are generally passed through to customers, and therefore, result in changes to electric operating revenues that are comparable to changes in electric production fuel, energy purchases and purchased electric capacity expenses. Electric margins and MWh sales for IPL were as follows:
| | | | | | | | | | | | | | | | | | | | | | | | | | | | | | | | | | | | | | | | |
| | | Revenues and Costs (dollars in millions) | | | MWhs Sold (MWhs in thousands) | |
| | | 2010 | | | 2009 | | | (a) | | | 2008 | | | (b) | | | 2010 | | | 2009 | | | (a) | | | 2008 | | | (b) | |
Residential | | | $561.9 | | | | $478.9 | | | | 17% | | | | $455.2 | | | | 5% | | | | 4,295 | | | | 4,113 | | | | 4% | | | | 4,218 | | | | (2%) | |
Commercial | | | 378.7 | | | | 336.8 | | | | 12% | | | | 319.4 | | | | 5% | | | | 3,944 | | | | 3,851 | | | | 2% | | | | 3,911 | | | | (2%) | |
Industrial | | | 441.9 | | | | 412.5 | | | | 7% | | | | 407.0 | | | | 1% | | | | 6,961 | | | | 6,829 | | | | 2% | | | | 7,742 | | | | (12%) | |
| | | | | | | | | | | | | | | | | | | | | | | | | | | | | | | | | | | | | | | | |
Retail subtotal | | | 1,382.5 | | | | 1,228.2 | | | | 13% | | | | 1,181.6 | | | | 4% | | | | 15,200 | | | | 14,793 | | | | 3% | | | | 15,871 | | | | (7%) | |
Sales for resale: | | | | | | | | | | | | | | | | | | | | | | | | | | | | | | | | | | | | | | | | |
Wholesale | | | 29.8 | | | | 23.5 | | | | 27% | | | | 23.4 | | | | -- | | | | 425 | | | | 403 | | | | 5% | | | | 449 | | | | (10%) | |
Bulk power and other | | | 23.5 | | | | 37.3 | | | | (37%) | | | | 21.1 | | | | 77% | | | | 683 | | | | 901 | | | | (24%) | | | | 682 | | | | 32% | |
Other | | | 28.5 | | | | 26.6 | | | | 7% | | | | 32.2 | | | | (17%) | | | | 83 | | | | 84 | | | | (1%) | | | | 90 | | | | (7%) | |
| | | | | | | | | | | | | | | | | | | | | | | | | | | | | | | | | | | | | | | | |
Total revenues/sales | | | 1,464.3 | | | | 1,315.6 | | | | 11% | | | | 1,258.3 | | | | 5% | | | | 16,391 | | | | 16,181 | | | | 1% | | | | 17,092 | | | | (5%) | |
| | | | | | | | | | | | | | | | | | | | | | | | | | | | | | | | | | | | | | | | |
Electric production fuel expense | | | 216.2 | | | | 227.9 | | | | (5%) | | | | 249.4 | | | | (9%) | | | | | | | | | | | | | | | | | | | | | |
Energy purchases expense | | | 201.8 | | | | 212.2 | | | | (5%) | | | | 159.5 | | | | 33% | | | | | | | | | | | | | | | | | | | | | |
Purchased electric capacity expense | | | 145.0 | | | | 136.5 | | | | 6% | | | | 140.6 | | | | (3%) | | | | | | | | | | | | | | | | | | | | | |
| | | | | | | | | | | | | | | | | | | | | | | | | | | | | | | | | | | | | | | | |
Margins | | | $901.3 | | | | $739.0 | | | | 22% | | | | $708.8 | | | | 4% | | | | | | | | | | | | | | | | | | | | | |
| | | | | | | | | | | | | | | | | | | | | | | | | | | | | | | | | | | | | | | | |
| (a) | Reflects the % change from 2009 to 2010. (b) Reflects the % change from 2008 to 2009. |
2010 vs. 2009 Summary -Electric margins increased $162 million, or 22% in 2010, primarily due to the impact of retail rate increases from the Iowa 2008 and 2009 test year base rate cases and Minnesota 2009 test year base rate case, which increased IPL’s electric revenues by $119 million in aggregate in 2010, an estimated $41 million increase in electric margins from changes in the net impacts of weather conditions and IPL’s weather hedging activities, $12 million of higher energy conservation revenues and an $8 million increase in electric margins from the impact of IPL’s annual adjustments to unbilled revenue estimates. These items were partially offset by reduced sales to two of IPL’s larger industrial customers who transitioned to their own cogeneration facilities in 2009, a $4 million regulatory-related credit recorded by IPL in 2009 related to IUB approval to recover electric capacity expenses incurred in 2008 related to the severe flooding and $3 million of higher purchased electric capacity expenses related to the DAEC PPA.
70
2009 vs. 2008 Summary -Electric margins increased $30 million, or 4% in 2009, primarily due to the impact of IPL’s 2009 interim retail rate increase effective in March 2009, which increased IPL’s electric revenues by $62 million in 2009, an estimated $10 million reduction in electric margins in 2008 from the loss of retail sales during electric service outages caused by the severe flooding in IPL’s service territory in 2008, $6 million of incremental purchased electric capacity expenses in 2008 resulting from the severe flooding, $5 million of higher energy conservation revenues and a $4 million regulatory-related credit recorded by IPL in 2009 related to IUB approval to recover electric capacity expenses incurred in 2008 related to the severe flooding. These items were partially offset by an estimated $21 million reduction in electric margins from changes in the net impacts of weather conditions and IPL’s weather hedging activities, a decrease in weather-normalized sales volumes, a $9 million reduction in electric margins from the impact of IPL’s annual adjustments to unbilled revenue estimates and $6 million of higher purchased electric capacity expenses related to the DAEC PPA. The decrease in weather-normalized retail sales volumes was largely due to a 12% decrease in industrial sales caused by reduced sales to two of IPL’s larger industrial customers who transitioned to their own cogeneration facilities in 2009 and plant closures and shift reductions as a result of economic conditions in 2009.
Impacts of Weather Conditions (excluding the impacts of severe flooding in IPL’s service territory) -Estimated increases (decreases) to IPL’s electric margins from the net impacts of weather and IPL’s weather hedging activities were as follows (in millions):
| | | | | | | | | | | | |
| | | 2010 | | | 2009 | | | 2008 | |
Weather impacts on demand compared to normal weather | | | $14 | | | | ($25) | | | | ($10) | |
Gains (losses) from weather derivatives (a) | | | -- | | | | (2) | | | | 4 | |
| | | | | | | | | | | | |
Net weather impact | | | $14 | | | | ($27) | | | | ($6) | |
| | | | | | | | | | | | |
| (a) | Recorded in “Other” revenues in the electric margins table. |
Refer to “Alliant Energy’s Results of Operations - Utility Electric Margins” for additional discussion of IPL’s non-fuel retail rate increases, CDD data in IPL’s service territory, IPL’s recoveries of electric production fuel and energy purchases expenses, IPL’s purchased electric capacity expenses, IPL’s annual adjustments to unbilled revenue estimates, IPL’s sales trends and IPL’s wholesale energy market transactions. Refer to “Rate Matters” for details of IPL’s retail electric rate filings and IPL’s rate freeze for base rates charged to its Iowa electric retail customers through 2013. Refer to “Other Matters - Other Future Considerations” for discussion of retail electric sales projections expected to be influenced by economic conditions and ethanol production facilities in IPL’s service territory.
Gas Margins -Gas margins are defined as gas operating revenues less cost of gas sold. Management believes that gas margins provide a more meaningful basis for evaluating utility operations than gas operating revenues since cost of gas sold are generally passed through to customers, and therefore, result in changes to gas operating revenues that are comparable to changes in cost of gas sold. Gas margins and Dth sales for IPL were as follows:
| | | | | | | | | | | | | | | | | | | | | | | | | | | | | | | | | | | | | | | | |
| | | Revenues and Costs (dollars in millions) | | | Dths Sold (Dths in thousands) | |
| | | 2010 | | | 2009 | | | (a) | | | 2008 | | | (b) | | | 2010 | | | 2009 | | | (a) | | | 2008 | | | (b) | |
Residential | | | $155.6 | | | | $168.6 | | | | (8%) | | | | $219.3 | | | | (23%) | | | | 15,923 | | | | 16,072 | | | | (1%) | | | | 18,110 | | | | (11%) | |
Commercial | | | 88.4 | | | | 100.8 | | | | (12%) | | | | 137.3 | | | | (27%) | | | | 10,596 | | | | 11,451 | | | | (7%) | | | | 13,099 | | | | (13%) | |
Industrial | | | 18.4 | | | | 25.0 | | | | (26%) | | | | 40.4 | | | | (38%) | | | | 2,869 | | | | 3,787 | | | | (24%) | | | | 4,539 | | | | (17%) | |
| | | | | | | | | | | | | | | | | | | | | | | | | | | | | | | | | | | | | | | | |
Retail subtotal | | | 262.4 | | | | 294.4 | | | | (11%) | | | | 397.0 | | | | (26%) | | | | 29,388 | | | | 31,310 | | | | (6%) | | | | 35,748 | | | | (12%) | |
Interdepartmental | | | 1.0 | | | | 2.9 | | | | (66%) | | | | 2.2 | | | | 32% | | | | 148 | | | | 474 | | | | (69%) | | | | 217 | | | | 118% | |
Transportation/other | | | 10.9 | | | | 11.5 | | | | (5%) | | | | 11.2 | | | | 3% | | | | 27,923 | | | | 29,924 | | | | (7%) | | | | 34,776 | | | | (14%) | |
| | | | | | | | | | | | | | | | | | | | | | | | | | | | | | | | | | | | | | | | |
Total revenues/sales | | | 274.3 | | | | 308.8 | | | | (11%) | | | | 410.4 | | | | (25%) | | | | 57,459 | | | | 61,708 | | | | (7%) | | | | 70,741 | | | | (13%) | |
| | | | | | | | | | | | | | | | | | | | | | | | | | | | | | | | | | | | | | | | |
Cost of gas sold | | | 178.7 | | | | 209.8 | | | | (15%) | | | | 306.0 | | | | (31%) | | | | | | | | | | | | | | | | | | | | | |
| | | | | | | | | | | | | | | | | | | | | | | | | | | | | | | | | | | | | | | | |
Margins | | | $95.6 | | | | $99.0 | | | | (3%) | | | | $104.4 | | | | (5%) | | | | | | | | | | | | | | | | | | | | | |
| | | | | | | | | | | | | | | | | | | | | | | | | | | | | | | | | | | | | | | | |
| (a) | Reflects the % change from 2009 to 2010. (b) Reflects the % change from 2008 to 2009. |
2010 vs. 2009 Summary -Gas margins decreased $3 million, or 3% in 2010, primarily due to a 6% decrease in retail sales volumes. The decrease in retail sales volumes was largely due to lower gas required by IPL’s agricultural customers to dry grain in 2010.
2009 vs. 2008 Summary -Gas margins decreased $5 million, or 5% in 2009, primarily due to an estimated $5 million reduction in gas margins from the changes in the net impacts of weather conditions and IPL’s weather hedging activities.
71
Impacts of Weather Conditions -Estimated increases (decreases) to IPL’s gas margins from the net impacts of weather and IPL’s weather hedging activities were as follows (in millions):
| | | | | | | | | | | | |
| | | 2010 | | | 2009 | | | 2008 | |
Weather impacts on demand compared to normal weather | | | $1 | | | | $2 | | | | $8 | |
Losses from weather derivatives (a) | | | -- | | | | (2) | | | | (3) | |
| | | | | | | | | | | | |
Net weather impact | | | $1 | | | | $-- | | | | $5 | |
| | | | | | | | | | | | |
| (a) | Recorded in “Transportation/other” revenues in the gas margins table. |
Refer to “Alliant Energy’s Results of Operations - Utility Gas Margins” for HDD data in IPL’s service territory and discussion of the impacts on IPL’s gas margins of recoveries of natural gas costs.
Steam and Other Revenues - Changes in steam and other revenues were largely offset by related changes in operating expenses.
2010 vs. 2009 Summary -Steam and other revenues decreased $26 million in 2010, primarily due to lower steam revenues and lower revenues from other energy-related products and services. Steam revenues decreased by $15 million in 2010, primarily due to IPL’s discontinuance of steam service to a portion of its steam customers located in downtown Cedar Rapids.
2009 vs. 2008 Summary -Steam and other revenues decreased $6 million in 2009, primarily due to $5 million of lower steam revenues. IPL’s steam revenues were higher than normal during the second half of 2008 due to higher rates charged to steam customers for operating the temporary steam generating systems used to resume steam service after Prairie Creek and Sixth Street were shut down due to severe flooding in 2008.
Electric Transmission Service Expenses -
2010 vs. 2009 Summary -Electric transmission service expense increased $48 million in 2010, primarily due to higher transmission service costs billed to IPL by ITC. Electric transmission service expenses billed to IPL by ITC increased by $86 million in 2010, primarily due to increased transmission rates effective in January 2010 and higher monthly peak demands in 2010 compared to 2009. This item was partially offset by IPL’s deferral of $41 million of costs incurred in 2010 in accordance with an IUB order issued in January 2010. The IUB’s order authorizes IPL to defer these transmission costs billed to IPL by ITC during 2010 and to amortize these deferred costs over a five-year period ending in 2014 with an equal and offsetting amortization of IPL’s regulatory liability associated with the 2007 gain on its sale of electric transmission assets to ITC.
2009 vs. 2008 Summary -Electric transmission service expense increased $42 million in 2009, primarily due to $45 million of higher expenses billed from ITC resulting from increased rates effective in January 2009.
Refer to “Other Matters - Other Future Considerations” for discussion of 2011 transmission rates proposed by ITC. Refer to “Rate Matters” for discussion of a transmission cost rider for recovery of electric transmission service charges incurred by IPL for its Iowa retail electric customers that was approved by the IUB in January 2011 and a proposal made by IPL to the MPUC to implement an automatic cost recovery rider for electric transmission service charges incurred by IPL for its Minnesota retail electric customers. Refer to Notes 1(b) and 1(h) of the “Combined Notes to Consolidated Financial Statements” for additional information relating to recovery of electric transmission service expenses.
Other Operation and Maintenance Expenses -
2010 vs. 2009 Summary -Other operation and maintenance expenses increased $19 million in 2010, primarily due to a $21 million regulatory-related charge in 2010 related to the Whispering Willow - East wind project, $17 million of higher incentive-related compensation expenses, $14 million of higher energy conservation expenses, $9 million of higher wind turbine operation and maintenance expenses, a $7 million regulatory-related charge in 2010 related to Sixth Street, $6 million of higher electric generation maintenance expenses, a $4 million asset impairment charge related to Sixth Street recorded in 2010, $4 million of regulatory-related credits recorded in 2009 related to 2008 flood costs, and $2 million of restructuring charges incurred in 2010 related to the elimination of certain corporate and operations positions. These items were partially offset by $16 million of lower steam fuel, operation and maintenance expenses, $9 million of lower pension and other postretirement benefits costs, $8 million of regulatory-related credits recorded in 2010 related to 2009 flood costs and other costs, $7 million of incremental expenses incurred in 2009 related to the severe flooding that occurred in 2008, $5 million of lower bad debt expenses, $4 million of restructuring charges incurred in 2009 related to the elimination of certain corporate and operations positions, a $4 million asset impairment charge related to Sixth Street recorded in 2009, a $4 million charge in 2009 related to a settlement with joint partners of the Sutherland #4 project, a $2 million loss contingency reserve recorded in
72
2009 related to the Alliant Energy Cash Balance Pension Plan lawsuit and lower expenses related to other energy-related products and services.
2009 vs. 2008 Summary -Other operation and maintenance expenses decreased $23 million in 2009, primarily due to $29 million of incremental expenses incurred in 2008 related to severe flooding, $10 million of lower electric generation maintenance expenses caused by the timing of planned maintenance outages, $9 million of lower steam fuel, operation and maintenance expenses, $4 million of regulatory-related credits recorded in 2009 related to 2008 flood costs, $3 million of lower incentive-related compensation expenses and lower expenses resulting from cost saving initiatives implemented in 2009. These items were partially offset by $18 million of higher pension and other postretirement benefits costs, $7 million of incremental expenses incurred in 2009 related to the severe flooding that occurred in 2008, $5 million of higher energy conservation expenses, $4 million of restructuring charges incurred in 2009 related to the elimination of certain corporate and operations positions, a $4 million asset impairment charge related to Sixth Street recorded in 2009, a $4 million charge in 2009 related to a settlement with joint partners of the Sutherland #4 project and a $2 million loss contingency reserve recorded in 2009 related to the Alliant Energy Cash Balance Pension Plan lawsuit.
Refer to “Alliant Energy’s Results of Operations - Utility Other Operation and Maintenance Expenses” for additional details of IPL’s other operation and maintenance expenses. Refer to “Other Matters - Other Future Considerations” for discussion of anticipated decreases in pension and other postretirement benefits costs in 2011 resulting from increases in retirement plan assets during 2010.
Depreciation and Amortization Expenses -
2010 vs. 2009 Summary -Depreciation and amortization expenses increased $24 million in 2010, primarily due to $17 million of higher depreciation expense recognized in 2010 as compared to 2009 for the Whispering Willow - East wind project, which began generating electricity in late 2009, and additional depreciation expense from other property additions including new environmental controls at IPL’s Lansing Unit 4 placed into service in 2010.
2009 vs. 2008 Summary -Depreciation and amortization expenses increased $22 million in 2009, primarily due to additional depreciation expense from the impact of property additions and higher depreciation rates. The increased property additions were primarily related to restoration activities associated with the severe flooding in 2008 and the Whispering Willow - East wind project, which began generating electricity in late 2009.
Refer to “Rate Matters” for discussion of the interplay between utility operating expenses and utility margins given their impact on IPL’s rate activities.
Interest Expense -
2010 vs. 2009 Summary -Interest expense increased $6 million in 2010, primarily due to interest expense from IPL’s issuances of $300 million of 6.25% senior debentures in July 2009, $150 million of 3.3% senior debentures in June 2010 and $200 million of 3.65% senior debentures in August 2010. These items were partially offset by the impact of IPL’s retirements of $135 million of 6.625% senior debentures in August 2009 and $200 million of 6.75% senior debentures in September 2010.
2009 vs. 2008 Summary -Interest expense increased $15 million in 2009, primarily due to interest expense from IPL’s issuances of $250 million of 7.25% senior debentures in October 2008 and $300 million of 6.25% senior debentures in July 2009. These items were partially offset by the impact of $135 million of IPL’s 6.625% senior debentures retired in August 2009 and the impact of lower interest rates on commercial paper borrowings in 2009 compared to 2008.
Refer to Note 8(b) of the “Combined Notes to Consolidated Financial Statements” for discussion of IPL’s long-term debt issuances and retirements.
AFUDC -
2010 vs. 2009 Summary -AFUDC decreased $29 million in 2010, primarily due to $21 million of AFUDC recognized for the Whispering Willow - East wind project in 2009. The decrease was also due to AFUDC recognized in 2009 on capital projects related to restoration activities at IPL associated with the severe flooding in June 2008 and new environmental controls at IPL’s Lansing Unit 4.
2009 vs. 2008 Summary -AFUDC increased $19 million in 2009, primarily due to $14 million of higher AFUDC recognized in 2009 for the Whispering Willow - East wind project. The increase was also due to AFUDC recognized in 2009 on capital projects related to restoration activities associated with the severe flooding in 2008 and new environmental controls at IPL’s Lansing Unit 4.
73
Income Taxes -IPL’s effective income tax rates were 22.8%, 15.0% and 27.1% in 2010, 2009 and 2008, respectively. Details of the effective income tax rates were as follows:
| | | | | | |
| | | 2010 | | 2009 | | 2008 |
Statutory federal income tax rate | | 35.0% | | 35.0% | | 35.0% |
State filing changes due to SB 62 enacted in February 2009 | | -- | | (18.2) | | -- |
Federal Health Care Legislation enacted in March 2010 | | 2.0 | | -- | | -- |
Production tax credits | | (4.1) | | (0.5) | | -- |
State income taxes, net of federal benefit | | (3.5) | | 4.0 | | 4.5 |
Federal income tax audits | | (2.7) | | -- | | (6.5) |
Other items, net | | (3.9) | | (5.3) | | (5.9) |
| | | | | | |
Overall income tax rate | | 22.8% | | 15.0% | | 27.1% |
| | | | | | |
2010 vs. 2009 Summary -The increase in the effective tax rate was primarily due to $33 million of income tax benefits recognized in 2009 related to the net impacts of SB 62 enacted in February 2009 and a 2009 decision to allow WPL to do business in Iowa in order to take advantage of efficiencies that will likely be available as a result of IPL and WPL sharing resources and facilities. The increase in the effective tax rate was also due to $4 million of income tax expense recognized in 2010 related to the impacts of Federal Health Care Legislation enacted in March 2010, which is expected to reduce IPL’s tax deductions for retiree health care costs beginning in 2013, to the extent prescription drug expenses are reimbursed under the Medicare Part D retiree drug subsidy program. These items were partially offset by lower state taxes related to property related differences for which Iowa deferred tax is not recorded in the income statement pursuant to Iowa rate making principles, $8 million of production tax credits recorded in 2010 associated with the Whispering Willow - East wind project, which began generating electricity in late 2009 and $5 million of income tax benefits recorded by IPL in 2010 related to the impact of the IRS completing the audits of Alliant Energy’s U.S. federal income tax returns for calendar years 2005 through 2008.
2009 vs. 2008 Summary -The decrease in the effective income tax rate was primarily due to $33 million of income tax benefits recognized in 2009 related to the net impacts of SB 62 enacted in February 2009 and a decision by management to allow WPL to do business in Iowa in order to take advantage of efficiencies that will likely be available as a result of IPL and WPL sharing resources and facilities. This item was partially offset by $13 million of income tax benefits recorded in 2008 as a result of finalizing the audit of Alliant Energy’s U.S. federal income tax returns for calendar years 2002 through 2004 and recording known adjustments for the tax returns for calendar years 2005 through 2007.
Refer to Note 5 of the “Combined Notes to Consolidated Financial Statements” for additional information regarding IPL’s effective income tax rates. Refer to “Other Matters - Other Future Considerations” for discussion of production tax credits for wind projects, which may impact future effective income tax rates.
WPL’S RESULTS OF OPERATIONS
Overview -WPL’s earnings available for common stock increased $63 million in 2010 and decreased $29 million in 2009. The 2010 increase was primarily due to the impact of the electric and gas retail rate increases effective in January 2010 and higher electric sales in 2010 compared to 2009 caused by weather conditions in WPL’s service territory. The 2009 decrease was primarily due to lower electric sales in 2009 compared to 2008 caused by weather and adverse economic conditions in WPL’s service territory, higher depreciation expense from its Cedar Ridge wind project and the acquisition of the Neenah Energy Facility, and higher interest expense from the issuances of new debentures.
Electric Margins -Electric margins are defined as electric operating revenues less electric production fuel, energy purchases and purchased electric capacity expenses. Management believes that electric margins provide a more meaningful basis for evaluating utility operations than electric operating revenues since electric production fuel, energy purchases and purchased electric capacity expenses are generally passed through to customers, and therefore result in changes to electric operating revenues that are comparable to changes in electric production fuel, energy purchases and purchased electric capacity expenses. Electric margins and MWh sales for WPL were as follows:
74
| | | | | | | | | | | | | | | | | | | | | | | | | | | | | | | | | | | | | | | | |
| | | Revenues and Costs (dollars in millions) | | | MWhs Sold (MWhs in thousands) | |
| | | 2010 | | | 2009 | | | (a) | | | 2008 | | | (b) | | | 2010 | | | 2009 | | | (a) | | | 2008 | | | (b) | |
Residential | | | $439.6 | | | | $389.7 | | | | 13% | | | | $389.5 | | | | -- | | | | 3,541 | | | | 3,419 | | | | 4% | | | | 3,446 | | | | (1%) | |
Commercial | | | 240.3 | | | | 220.0 | | | | 9% | | | | 218.1 | | | | 1% | | | | 2,275 | | | | 2,257 | | | | 1% | | | | 2,270 | | | | (1%) | |
Industrial | | | 320.9 | | | | 298.2 | | | | 8% | | | | 327.7 | | | | (9%) | | | | 4,252 | | | | 4,119 | | | | 3% | | | | 4,748 | | | | (13%) | |
| | | | | | | | | | | | | | | | | | | | | | | | | | | | | | | | | | | | | | | | |
Retail subtotal | | | 1,000.8 | | | | 907.9 | | | | 10% | | | | 935.3 | | | | (3%) | | | | 10,068 | | | | 9,795 | | | | 3% | | | | 10,464 | | | | (6%) | |
Sales for resale: | | | | | | | | | | | | | | | | | | | | | | | | | | | | | | | | | | | | | | | | |
Wholesale | | | 167.0 | | | | 166.6 | | | | -- | | | | 178.5 | | | | (7%) | | | | 2,900 | | | | 2,848 | | | | 2% | | | | 3,364 | | | | (15%) | |
Bulk power and other | | | 20.6 | | | | 61.0 | | | | (66%) | | | | 10.0 | | | | 510% | | | | 695 | | | | 1,682 | | | | (59%) | | | | 301 | | | | 459% | |
Other | | | 21.5 | | | | 24.8 | | | | (13%) | | | | 29.2 | | | | (15%) | | | | 70 | | | | 71 | | | | (1%) | | | | 74 | | | | (4%) | |
| | | | | | | | | | | | | | | | | | | | | | | | | | | | | | | | | | | | | | | | |
Total revenues/sales | | | 1,209.9 | | | | 1,160.3 | | | | 4% | | | | 1,153.0 | | | | 1% | | | | 13,733 | | | | 14,396 | | | | (5%) | | | | 14,203 | | | | 1% | |
| | | | | | | | | | | | | | | | | | | | | | | | | | | | | | | | | | | | | | | | |
Electric production fuel expense | | | 171.7 | | | | 160.6 | | | | 7% | | | | 174.6 | | | | (8%) | | | | | | | | | | | | | | | | | | | | | |
Energy purchases expense | | | 229.5 | | | | 290.7 | | | | (21%) | | | | 259.6 | | | | 12% | | | | | | | | | | | | | | | | | | | | | |
Purchased electric capacity expense | | | 134.7 | | | | 144.6 | | | | (7%) | | | | 145.1 | | | | -- | | | | | | | | | | | | | | | | | | | | | |
| | | | | | | | | | | | | | | | | | | | | | | | | | | | | | | | | | | | | | | | |
Margins | | | $674.0 | | | | $564.4 | | | | 19% | | | | $573.7 | | | | (2%) | | | | | | | | | | | | | | | | | | | | | |
| | | | | | | | | | | | | | | | | | | | | | | | | | | | | | | | | | | | | | | | |
| (a) | Reflects the % change from 2009 to 2010. (b) Reflects the % change from 2008 to 2009. |
2010 vs. 2009 Summary -Electric margins increased $110 million, or 20% in 2010, primarily due to the impact of a non-fuel retail rate increase effective January 2010, which increased WPL’s electric revenues by $94 million in 2010, an estimated $23 million increase in electric margins from changes in the net impacts of weather conditions and WPL’s weather hedging activities, $7 million of lower purchased electric capacity expenses related to the RockGen PPA, which terminated in May 2009, and increased rates charged to wholesale customers including the impact of a wholesale formula rate change, which increased electric revenues by $4 million in 2010. These items were partially offset by an $11 million decrease in electric margins from the impact of WPL’s annual adjustments to unbilled revenue estimates and an $11 million decrease in electric margins from the impact of changes in the recovery of electric production fuel and energy purchases expense.
2009 vs. 2008 Summary -Electric margins decreased $9 million, or 2% in 2009, primarily due to an estimated $12 million reduction in electric margins from changes in the net impacts of weather conditions and WPL’s weather hedging activities, $12 million of higher purchased electric capacity expenses related to the Kewaunee PPA and a decrease in weather-normalized sales volumes. The decrease in weather-normalized retail sales volumes was largely due to a 13% decrease in industrial sales caused by plant closures and shift reductions as a result of economic conditions in 2009. These items were partially offset by $9 million of lower purchased electric capacity expenses related to the RockGen PPA, which terminated in May 2009, a $5 million increase in electric margins from the impact of WPL’s annual adjustments to unbilled revenue estimates and a $3 million increase in electric margins from the impact of changes in the recovery of electric production fuel and energy purchases expense.
Impacts of Weather Conditions -Estimated increases (decreases) to WPL’s electric margins from the net impacts of weather and WPL’s weather hedging activities were as follows (in millions):
| | | | | | | | | | | | |
| | | 2010 | | | 2009 | | | 2008 | |
Weather impacts on demand compared to normal weather | | | $11 | | | | ($11) | | | | ($1) | |
Gains (losses) from weather derivatives (a) | | | -- | | | | (1) | | | | 1 | |
| | | | | | | | | | | | |
Net weather impact | | | $11 | | | | ($12) | | | | $-- | |
| | | | | | | | | | | | |
| (a) | Recorded in “Other” revenues in the electric margins table. |
Refer to “Alliant Energy’s Results of Operations - Utility Electric Margins” for additional discussion of WPL’s non-fuel retail rate increase, CDD data in WPL’s service territory, WPL’s recoveries of electric production fuel and energy purchases expenses, WPL’s purchased electric capacity expenses, WPL’s annual adjustments to unbilled revenue estimates, WPL’s sales trends and WPL’s wholesale energy market transactions. Refer to “Rate Matters” for discussion of WPL’s retail electric rate filings, the wholesale formula rate change in 2010, changes to the retail cost recovery rules in Wisconsin for electric production fuel and energy purchases expenses beginning in 2011 and an anticipated rate filing in 2011. Refer to “Other Matters - Other Future Considerations” for discussion of retail electric sales projections influenced by economic conditions.
75
Gas Margins -Gas margins are defined as gas operating revenues less cost of gas sold. Management believes that gas margins provide a more meaningful basis for evaluating utility operations than gas operating revenues since cost of gas sold are generally passed through to customers, and therefore, result in changes to gas operating revenues that are comparable to changes in cost of gas sold. Gas margins and Dth sales for WPL were as follows:
| | | | | | | | | | | | | | | | | | | | | | | | | | | | | | | | | | | | | | | | |
| | | Revenues and Costs (dollars in millions) | | | Dths Sold (Dths in thousands) | |
| | | 2010 | | | 2009 | | | (a) | | | 2008 | | | (b) | | | 2010 | | | 2009 | | | (a) | | | 2008 | | | (b) | |
Residential | | | $118.1 | | | | $122.2 | | | | (3%) | | | | $165.7 | | | | (26%) | | | | 11,205 | | | | 11,639 | | | | (4%) | | | | 12,520 | | | | (7%) | |
Commercial | | | 65.8 | | | | 73.9 | | | | (11%) | | | | 103.2 | | | | (28%) | | | | 8,095 | | | | 9,274 | | | | (13%) | | | | 9,362 | | | | (1%) | |
Industrial | | | 8.9 | | | | 5.7 | | | | 56% | | | | 10.7 | | | | (47%) | | | | 1,289 | | | | 771 | | | | 67% | | | | 1,019 | | | | (24%) | |
| | | | | | | | | | | | | | | | | | | | | | | | | | | | | | | | | | | | | | | | |
Retail subtotal | | | 192.8 | | | | 201.8 | | | | (4%) | | | | 279.6 | | | | (28%) | | | | 20,589 | | | | 21,684 | | | | (5%) | | | | 22,901 | | | | (5%) | |
Interdepartmental | | | 0.5 | | | | 2.0 | | | | (75%) | | | | 5.6 | | | | (64%) | | | | 739 | | | | 464 | | | | 59% | | | | 1,156 | | | | (60%) | |
Transportation/other | | | 13.0 | | | | 12.7 | | | | 2% | | | | 14.8 | | | | (14%) | | | | 21,598 | | | | 23,656 | | | | (9%) | | | | 24,477 | | | | (3%) | |
| | | | | | | | | | | | | | | | | | | | | | | | | | | | | | | | | | | | | | | | |
Total revenues/sales | | | 206.3 | | | | 216.5 | | | | (5%) | | | | 300.0 | | | | (28%) | | | | 42,926 | | | | 45,804 | | | | (6%) | | | | 48,534 | | | | (6%) | |
| | | | | | | | | | | | | | | | | | | | | | | | | | | | | | | | | | | | | | | | |
Cost of gas sold | | | 125.3 | | | | 138.1 | | | | (9%) | | | | 213.6 | | | | (35%) | | | | | | | | | | | | | | | | | | | | | |
| | | | | | | | | | | | | | | | | | | | | | | | | | | | | | | | | | | | | | | | |
Margins | | | $81.0 | | | | $78.4 | | | | 3% | | | | $86.4 | | | | (9%) | | | | | | | | | | | | | | | | | | | | | |
| | | | | | | | | | | | | | | | | | | | | | | | | | | | | | | | | | | | | | | | |
| (a) | Reflects the % change from 2009 to 2010. (b) Reflects the % change from 2008 to 2009. |
2010 vs. 2009 Summary -Gas margins increased $3 million, or 3% in 2010, primarily due to the impact of the 2010 retail gas rate increase effective in January 2010, which increased gas revenues by $5 million in 2010. This item was partially offset by a 5% decrease in retail sales primarily due to lower usage per customer caused by weather conditions.
2009 vs. 2008 Summary -Gas margins decreased $8 million, or 9% in 2009, primarily due to the impact of the 2009 retail gas rate decrease effective in January 2009, which reduced gas revenues in 2009 by $4 million and an estimated $2 million reduction in gas margins from changes in the net impacts of weather conditions and WPL’s weather hedging activities.
Impacts of Weather Conditions -Estimated increases (decreases) to WPL’s gas margins from the net impacts of weather and WPL’s weather hedging activities were as follows (in millions):
| | | | | | |
| | | 2010 | | 2009 | | 2008 |
Weather impacts on demand compared to normal weather | | ($2) | | $1 | | $4 |
Losses from weather derivatives (a) | | -- | | (1) | | (2) |
| | | | | | |
Net weather impact | | ($2) | | $-- | | $2 |
| | | | | | |
| (a) | Recorded in “Transportation/other” revenues in the gas margins table. |
Refer to “Alliant Energy’s Results of Operations - Utility Gas Margins” for HDD data in WPL’s service territory and discussion of the impacts on WPL’s gas margins of recoveries of natural gas costs.
Refer to “Rate Matters” for discussion of WPL’s gas rate filings.
Electric Transmission Service Expenses -
2010 vs. 2009 Summary -Electric transmission service expenses increased $6 million in 2010, largely due to increased transmission rates billed to WPL by ATC.
Other Operation and Maintenance Expenses-
2010 vs. 2009 Summary -Other operation and maintenance expenses decreased $2 million in 2010, primarily due to $11 million of regulatory-related charges in 2009 related to the Nelson Dewey #3 project, $7 million of restructuring charges incurred in 2009 related to the elimination of certain corporate and operations positions, $7 million of lower pension and other postretirement benefits costs, a $2 million loss contingency reserve recorded in 2009 related to the Alliant Energy Cash Balance Pension Plan lawsuit and lower expenses related to other energy-related products and services. These items were partially offset by a $12 million deferral of retail pension and benefits costs recorded in 2009 in accordance with the stipulation agreement approved by the PSCW related to WPL’s 2009 retail rate case, $12 million of higher incentive-related compensation expenses and $2 million of restructuring charges incurred in 2010 related to the elimination of certain corporate and operations positions.
2009 vs. 2008 Summary -Other operation and maintenance expenses increased $2 million in 2009, primarily due to $15 million of higher pension and other postretirement benefits costs, $11 million of regulatory-related charges in 2009 related to the Nelson Dewey #3 project, $7 million of restructuring charges incurred in 2009 related to the elimination of certain
76
corporate and operations positions and a $2 million loss contingency reserve recorded in 2009 related to the Alliant Energy Cash Balance Pension Plan lawsuit. These items were substantially offset by a $12 million deferral of retail pension and benefits costs recorded in 2009 in accordance with the stipulation agreement approved by the PSCW related to WPL’s 2009 retail rate case, $4 million of regulatory-related charges in 2008 related to the Nelson Dewey #3 project, $3 million of lower incentive-related compensation expenses and the impact of cost saving initiatives implemented by WPL in 2009.
Refer to “Alliant Energy’s Results of Operations - Utility Other Operation and Maintenance Expenses” for additional details of WPL’s other operation and maintenance expenses. Refer to “Other Matters - Other Future Considerations” for discussion of anticipated decreases in pension and other postretirement benefits costs in 2011 resulting from increases in retirement plan assets during 2010 and anticipated increases in maintenance expenses in 2011 for WPL’s Bent Tree - Phase I wind project, which began generating electricity in late 2010.
Depreciation and Amortization Expenses -
2010 vs. 2009 Summary -Depreciation and amortization expenses decreased $7 million in 2010, primarily due to a depreciation adjustment recorded in 2010, which is not anticipated to have a material impact on future periods. This item was partially offset by additional depreciation from the impact of property additions related to AMI placed into service in 2009 and the June 2009 acquisition of the Neenah Energy Facility.
2009 vs. 2008 Summary -Depreciation and amortization expenses increased $14 million in 2009, primarily due to the impact of property additions related to WPL’s Cedar Ridge wind project, which began generating electricity in late 2008, AMI placed into service in 2009 and the June 2009 acquisition of the Neenah Energy Facility.
Refer to Note 1(e) of the “Combined Notes to Consolidated Financial Statements” for details of WPL’s Bent Tree - Phase I wind project, which is expected to result in a material increase in depreciation expense in 2011.
Refer to “Rate Matters” for discussion of the interplay between utility operating expenses and utility margins given their impact on WPL’s rate activities.
Interest Expense-
2010 vs. 2009 Summary -Interest expense increased $4 million in 2010, primarily due to interest expense from WPL’s issuances of $250 million of 5% debentures in July 2009 and $150 million of 4.6% debentures in June 2010. These items were partially offset by the impact of WPL’s retirement of $100 million of 7.625% debentures in March 2010.
2009 vs. 2008 Summary -Interest expense increased $13 million in 2009, primarily due to interest expense from WPL’s issuances of $250 million of 7.6% debentures in October 2008 and $250 million of 5% debentures in July 2009. These items were partially offset by the impact of WPL’s retirement of $60 million of 5.7% debentures in October 2008 and lower commercial paper outstanding balances and interest rates in 2009 compared to 2008.
Refer to Note 8(b) of the “Combined Notes to Consolidated Financial Statements” for details of WPL’s long-term debt issuances and retirements.
AFUDC-
2010 vs. 2009 Summary -AFUDC increased $7 million in 2010 primarily due to $7 million of higher AFUDC recognized in 2010 as compared to 2009 for the Bent Tree - Phase I wind project.
2009 vs. 2008 Summary -AFUDC decreased $4 million in 2009, primarily due to AFUDC recognized in 2008 related to the construction of the Cedar Ridge wind project, partially offset by AFUDC recognized in 2009 related to the construction of the Bent Tree - Phase I wind project.
Income Taxes -WPL’s effective income tax rates were 39.2%, 33.9% and 36.6% in 2010, 2009 and 2008, respectively. Details of the effective income tax rates were as follows:
| | | | | | | | |
| | | 2010 | | | 2009 | | 2008 |
Statutory federal income tax rate | | | 35.0% | | | 35.0% | | 35.0% |
Federal Health Care Legislation enacted in March 2010 | | | 1.2 | | | -- | | -- |
State filing changes due to SB 62 enacted in February 2009 | | | -- | | | (1.8) | | -- |
Production tax credits | | | (1.4) | | | (2.9) | | (0.2) |
Other items, net | | | 4.4 | | | 3.6 | | 1.8 |
| | | | | | | | |
Overall income tax rate | | | 39.2% | | | 33.9% | | 36.6% |
| | | | | | | | |
77
2010 vs. 2009 Summary - The increase in the effective income tax rate was primarily due to $3 million of income tax expense recognized in 2010 related to the impacts of the Federal Health Care Legislation enacted in March 2010, which is expected to reduce WPL’s tax deductions for retiree health care costs beginning in 2013, to the extent prescription drug expenses are reimbursed under the Medicare Part D retiree drug subsidy program, and $2 million of income tax benefits recognized in 2009 related to the net impacts of SB 62 enacted in February 2009 and a 2009 decision to allow WPL to do business in Iowa thus requiring WPL to file as part of the Iowa consolidated tax return.
2009 vs. 2008 Summary - The decrease in the effective income tax rate for 2009 was primarily due to $4 million of production tax credits in 2009 from the Cedar Ridge wind project, which began generating electricity in December 2008, and $2 million of income tax benefits recognized in 2009 related to the net impacts of the SB 62 enacted in February 2009 and a decision by management to allow WPL to do business in Iowa thus requiring WPL to file as part of the Iowa consolidated tax return.
Refer to Note 5 of the “Combined Notes to Consolidated Financial Statements” for additional information regarding WPL’s effective income tax rates. Refer to “Other Matters - Other Future Considerations” for discussion of production tax credits for wind projects, which may impact future effective income tax rates.
LIQUIDITY AND CAPITAL RESOURCES
Overview - Alliant Energy, IPL and WPL believe they have, and expect to maintain, an adequate liquidity position to operate their businesses as a result of available capacity under their revolving credit facilities, operating cash flows generated by their utility business, and available cash and cash equivalents. Based on their liquidity positions and capital structures, Alliant Energy, IPL and WPL believe they will be able to secure the additional capital required to implement their strategic plans and meet their long-term contractual obligations. Access by Alliant Energy, IPL and WPL to capital markets to fund their future capital requirements at reasonable terms is largely dependent on their respective credit quality and on developments in those capital markets.
Liquidity Position - At Dec. 31, 2010, Alliant Energy and its subsidiaries had $159 million of cash and cash equivalents, $576 million ($287 million at IPL, $193 million at WPL and $96 million at the parent company) of available capacity under their revolving credit facilities, and $95 million of available capacity at IPL under its sales of accounts receivable program. Refer to “Cash Flows - Financing Activities - Short-term Debt” and Note 8(a) of the “Combined Notes to Consolidated Financial Statements” for further discussion of the credit facilities. Refer to Notes 1(d) and 4(a) of the “Combined Notes to Consolidated Financial Statements” for additional information on Alliant Energy’s cash and cash equivalents, and IPL’s sales of accounts receivable program, respectively.
Capital Structure - Alliant Energy, IPL and WPL plan to maintain consolidated debt-to-total capitalization ratios that are consistent with investment-grade credit ratings in order to facilitate ongoing and reliable access to capital markets on reasonable terms and conditions. Alliant Energy’s, IPL’s and WPL’s capital structures at Dec. 31, 2010 were as follows (dollars in millions):
| | | | | | | | | | | | | | | | | | | | | | | | |
| | | Alliant Energy
(Consolidated) | | | IPL | | | WPL | |
Common equity | | | $2,893.6 | | | | 49.1% | | | | $1,389.8 | | | | 48.2% | | | | $1,369.3 | | | | 53.5% | |
Preferred stock | | | 243.8 | | | | 4.2% | | | | 183.8 | | | | 6.4% | | | | 60.0 | | | | 2.3% | |
Noncontrolling interest | | | 2.0 | | | | --% | | | | -- | | | | --% | | | | -- | | | | --% | |
Long-term debt (incl. current maturities) | | | 2,704.7 | | | | 45.9% | | | | 1,308.6 | | | | 45.4% | | | | 1,081.7 | | | | 42.3% | |
Short-term debt | | | 47.4 | | | | 0.8% | | | | -- | | | | --% | | | | 47.4 | | | | 1.9% | |
| | | | | | | | | | | | | | | | | | | | | | | | |
| | | $5,891.5 | | | | 100.0% | | | | $2,882.2 | | | | 100.0% | | | | $2,558.4 | | | | 100.0% | |
| | | | | | | | | | | | | | | | | | | | | | | | |
In addition to capital structures, other important financial considerations used to determine the characteristics of future financings include financial coverage ratios, flexibility regarding the generation plans, state regulations and the levels of debt imputed by rating agencies. The most significant debt imputations include operating leases, a portion of the DAEC, Kewaunee and Riverside PPAs, and postretirement benefits obligations. The PSCW explicitly factors certain imputed debt adjustments in establishing a regulatory capital structure as part of WPL’s retail rate cases, particularly those related to operating leases and PPAs. The IUB and MPUC do not make any explicit adjustments for imputed debt in establishing capital ratios used in determining customer rates, although such adjustments are considered by IPL in recommending an equity ratio.
78
Alliant Energy, IPL and WPL intend to manage their respective capital structures and liquidity positions in such a way that they do not compromise their ability to raise the necessary funding required to enable them to continue to provide utility services reliably and at reasonable costs, while maintaining financial capital structure targets consistent with those approved by regulators. Key considerations include maintaining access to the financial markets on the terms, in the amounts and within the timeframes required to fund Alliant Energy’s strategic plan, retaining a prudent level of financial flexibility and maintaining IPL’s and WPL’s investment-grade credit ratings. The capital structure is only one of a number of components that needs to be actively managed in order to achieve these objectives. Both IPL and WPL currently expect to maintain a capital structure in which total debt would not exceed 45% to 50%, and preferred stock would not exceed 5% to 10%, of total capital. These targets may be adjusted depending on subsequent developments and on their potential impact on IPL’s and WPL’s investment-grade credit ratings.
Credit and Capital Market Developments - Alliant Energy’s, IPL’s and WPL’s ability to provide reliable and cost-effective utility services depends on their access to cost-effective capital. Financial markets that were subjected to considerable strain since 2007 have shown signs of selective recovery. Certain sectors of the equity and debt capital markets, including the regulated utility sector, have attracted and retained investor interest. However, areas of concern remain, including certain issues in the U.S. and overseas, which have impacted the availability of credit and the liquidity of financial assets. There is also concern about the level of spending by the U.S. federal government and the temporary monetary policies of the Federal Reserve System intended to spur economic growth, with potential implications over time for inflation and interest rate levels. The evolving profile and impact of financial market re-regulation, both in the U.S. and overseas, contributes to the unsettled tone of the various market sectors. These developments translate into uncertainties regarding the availability of capital and for the terms and conditions of capital raised to meet funding requirements.
Alliant Energy, IPL and WPL are aware of the potential implications that these credit and capital market developments might have on their ability to raise the external funding required for their respective operations and capital expenditure plans. The strategic implications include protecting their respective liquidity positions and avoiding over-reliance on short-term funding to meet IPL’s and WPL’s long-term asset profile. Alliant Energy, IPL and WPL maintain revolving credit facilities to provide backstop liquidity to their commercial paper programs and a committed source of alternative liquidity in the event the commercial paper market becomes disrupted; retain sufficient cash and cash equivalents at the parent company to help meet Alliant Energy’s, IPL’s and WPL’s current operating and capital requirements in the event of credit market disruptions; and extended IPL’s and WPL’s respective long-term debt maturity profiles, avoiding undue concentrations of maturities over the next few years as IPL and WPL execute their capital investment program. In addition, Alliant Energy and IPL maintain a sales of accounts receivable program at IPL as an alternative financing source. As discussed below, IPL and WPL retain flexibility in undertaking their capital expenditure programs, particularly with respect to capital expenditures to fund the investment programs within their strategic plans.
Primary Sources and Uses of Cash - Alliant Energy’s, IPL’s and WPL’s most significant source of cash is from electric and gas sales to their utility customers. Cash from these sales reimburses IPL and WPL for prudently incurred expenses to provide service to their utility customers and provides IPL and WPL a return on the rate base assets required to provide such services. Utility operating cash flows are expected to cover the majority of IPL’s and WPL’s capital expenditures required to maintain their current infrastructure and dividends paid to Alliant Energy’s shareowners. Capital requirements needed to retire debt and fund capital expenditures related to environmental compliance programs and new generating facilities are expected to be met primarily through external financings. Ongoing monitoring of credit and capital market conditions allows management to evaluate the availability of funding and the terms and conditions attached to such financing. In order to maintain debt-to-total capitalization ratios that are consistent with investment-grade ratings, Alliant Energy, IPL and WPL may periodically fund such capital requirements with additional debt and equity.
Cash Flows - Selected information from Alliant Energy’s, IPL’s and WPL’s Consolidated Statements of Cash Flows was as follows (in millions):
| | | | | | | | | | | | | | | | | | |
| | | Alliant Energy | | IPL | | WPL |
| | | 2010 | | 2009 | | 2008 | | 2010 | | 2009 | | 2008 | | 2010 | | 2009 | | 2008 |
| | | | | | |
Cash and cash equivalents at Jan. 1 | | $175.3 | | $346.9 | | $745.6 | | $0.4 | | $6.2 | | $39.4 | | $18.5 | | $4.5 | | $0.4 |
Cash flows from (used for): | | | | | | | | | | | | | | | | | | |
Operating activities | | 984.9 | | 657.1 | | 338.2 | | 549.6 | | 373.2 | | 113.7 | | 372.4 | | 305.8 | | 239.7 |
Investing activities | | (866.5) | | (1,148.9) | | (866.1) | | (415.0) | | (712.7) | | (469.1) | | (449.3) | | (493.4) | | (376.0) |
Financing activities | | (134.4) | | 320.2 | | 129.2 | | (129.3) | | 333.7 | | 322.2 | | 58.5 | | 201.6 | | 140.4 |
| | | | | | |
Net increase (decrease) | | (16.0) | | (171.6) | | (398.7) | | 5.3 | | (5.8) | | (33.2) | | (18.4) | | 14.0 | | 4.1 |
| | | | | | |
Cash and cash equivalents at Dec. 31 | | $159.3 | | $175.3 | | $346.9 | | $5.7 | | $0.4 | | $6.2 | | $0.1 | | $18.5 | | $4.5 |
| | | | | | |
79
Operating Activities -
2010 vs. 2009 - Alliant Energy’s cash flows from operating activities increased $328 million primarily due to increased collections from IPL’s and WPL’s customers during 2010 caused by the impacts of rate increases and higher electric sales, $131 million of pension plan contributions during 2009, $90 million of higher cash flows from changes in the level of accounts receivable sold during 2010 and 2009, $26 million of higher cash flows from operations at RMT largely due to cash received in 2010 for large renewable energy projects and $23 million of refunds paid by WPL to its retail customers during 2009 for over-collected fuel-related costs during 2008. These items were partially offset by $86 million of higher payments by IPL to ITC during 2010 for electric transmission services, $27 million of insurance proceeds received by IPL during 2009 for operation expenditures related to the severe flooding in 2008 and $25 million of lower income tax refunds during 2010.
IPL’s cash flows from operating activities increased $176 million primarily due to increased collections from IPL’s customers during 2010 caused by the impacts of rate increases and higher electric sales, $90 million of higher cash flows from changes in the level of accounts receivable sold during 2010 and 2009, $59 million of pension plan contributions during 2009 and $38 million of higher income tax refunds during 2010. These items were partially offset by $86 million of higher payments to ITC during 2010 for electric transmission service and $27 million of insurance proceeds received by IPL during 2009 for operation expenditures related to the severe flooding in 2008.
WPL’s cash flows from operating activities increased $67 million primarily due to increased collections from WPL’s customers during 2010 caused by the impacts of rate increases and higher electric sales, $47 million of pension plan contributions during 2009 and $23 million of refunds paid by WPL to its retail customers during 2009 for over-collected fuel-related costs in 2008. These items were partially offset by $72 million of lower income tax refunds.
2009 vs. 2008 - Alliant Energy’s cash flows from operating activities increased $319 million primarily due to $272 million of higher cash flows from changes in income tax payments and refunds, lower payments for prepaid gas and gas stored underground partially due to lower natural gas prices, $73 million of incremental operating expenditures in 2008 due to the severe flooding in IPL’s service territory, $50 million of higher cash flows from changes in the level of accounts receivable sold at IPL during 2009 and 2008, $32 million of higher cash flows from changes in the amount of collateral paid to and received from counterparties of derivative contracts during 2009 and 2008, $27 million of insurance proceeds received by IPL in 2009 for operating expenditures related to the severe flooding in 2008, and $16 million of refunds paid by WPL to retail electric customers in 2008 related to over-recovered fuel-related costs in 2007. These items were partially offset by $131 million of pension plan contributions in 2009, $40 million of lower cash flows from operations at RMT largely due to payments received in 2008 for a large wind construction management project, $23 million of refunds paid by WPL to its retail customers in 2009 for over-collected fuel-related costs during 2008, $18 million of insurance proceeds received by IPL in 2008 for operating expenditures related to severe flooding, and the impact of lower electric sales at IPL and WPL due to weather and economic conditions in 2009.
IPL’s cash flows from operating activities increased $260 million primarily due to $119 million of higher cash flows from changes in income tax payments and refunds, $73 million of incremental operating expenditures in 2008 due to the severe flooding in IPL’s service territory, lower payments for prepaid gas and gas stored underground partially due to lower natural gas prices, $50 million of higher cash flows from changes in the level of accounts receivable sold during 2009 and 2008, and $27 million of insurance proceeds received in 2009 for operating expenditures related to the severe flooding in 2008. These items were partially offset by $59 million of pension plan contributions in 2009, $18 million of insurance proceeds received in 2008 for operating expenditures related to severe flooding, and the impact of lower electric sales due to weather and economic conditions in 2009.
WPL’s cash flows from operating activities increased $66 million primarily due to $107 million of higher cash flows from changes in income tax payments and refunds, lower payments for gas stored underground partially due to lower natural gas prices, $28 million of higher cash flows from changes in the amount of collateral paid to and received from counterparties of derivative contracts during 2009 and 2008, and $16 million of refunds paid by WPL to retail electric customers in 2008 related to over-recovered fuel-related costs in 2007. These items were partially offset by $47 million of pension plan contributions in 2009, $23 million of refunds paid by WPL to its retail customers in 2009 for over-collected fuel-related costs in 2008, and the impact of lower electric sales due to weather and economic conditions in 2009.
Electric and Gas Rate Increases - IPL and WPL implemented rate increases in 2010 that resulted in higher collections from their retail customers. A portion of these higher collections was used to reimburse IPL and WPL for prudently incurred expenses to provide service to their customers (e.g. higher payments for electric transmission services) resulting in limited impacts on cash flows from operations. Another portion of these rate increases provided IPL and WPL returns on new rate base additions (e.g. returns on new wind projects), which significantly increased cash flows from operations for Alliant Energy, IPL and WPL in 2010. Refer to “Rate Matters” for additional details of retail rate increases implemented by IPL and
80
WPL in 2010 and discussion of a customer cost management plan approved by the IUB in January 2011. The customer cost management plan is expected to reduce collections from IPL’s retail electric customers in Iowa by approximately $200 million in aggregate during 2011 through 2013.
IPL’s Sales of Accounts Receivable Program - Changes in cash flows related to IPL’s sales of accounts receivable program increased (decreased) Alliant Energy’s and IPL’s cash flows from operations by $65 million, ($25) million and ($75) million in 2010, 2009 and 2008, respectively. In 2010, proceeds from the receivables sold were primarily used by IPL to help fund construction expenditures and to reduce short-term debt. IPL is currently pursuing an extension of the purchase commitment, which expires in March 2011, from the third-party financial institution to which it sells its receivables.
In 2007, the MPUC approved an affiliated interest agreement related to IPL’s sales of accounts receivable program subject to IPL demonstrating in its next Minnesota retail base rate case that the sales of accounts receivable program is consistent with the public interest. In April 2010, IPL filed a petition with the MPUC for approval of an amended affiliated interest agreement related to its amended and restated Receivables Purchase and Sale Agreement (Agreement) that became effective in April 2010. In October 2010, the MPUC denied IPL’s petition without prejudice, stating that IPL had not adequately addressed the question of whether the accounts receivable sale program is consistent with the public interest, and deferred the issue to IPL’s current Minnesota retail electric rate case proceeding. Alliant Energy and IPL are currently unable to predict the ultimate impact of this ruling but believe an adverse decision by the MPUC could require IPL to replace that source of liquidity with an alternative one.
Refer to Note 4(a) of the “Combined Notes to Consolidated Financial Statements” for additional details of IPL’s sales of accounts receivable program, including discussion of the Agreement that became effective in April 2010.
Income Tax Payments and Refunds - Income tax payments and refunds resulted in higher cash flows from operations for Alliant Energy, IPL and WPL in 2010 and 2009 compared to 2008 primarily due to income tax refunds received in 2010 and 2009 related to claims filed with the IRS to carryback net operating losses to prior years. Refer to “Legislative Matters - Federal Tax Legislation” and “Other Matters - Other Future Considerations - Tax Accounting for Mixed Service Costs” for additional discussion of anticipated future trends in federal income tax payments and refunds impacted by bonus tax depreciation deductions for 2010 and 2009 and potential deductions for mixed service costs.
Pension Plan Contributions - Pension plan contributions for 2008 through 2010 along with estimates of pension plan contributions currently expected to be made in 2011 through 2013 are as follows (in millions):
| | | | | | | | | | | | | | | | | | | | | | | | |
| | | 2008 | | | 2009 | | | 2010 | | | 2011 (b) | | | 2012 (b) | | | 2013 (b) | |
IPL (a) | | | $-- | | | | $59 | | | | $-- | | | | $-- | | | | $-- | | | | $10 | |
WPL (a) | | | -- | | | | 47 | | | | -- | | | | -- | | | | -- | | | | 5 | |
Other subsidiaries | | | 2 | | | | 25 | | | | 8 | | | | 7 | | | | 5 | | | | 5 | |
| | | | | | | | | | | | | | | | | | | | | | | | |
Alliant Energy | | | $2 | | | | $131 | | | | $8 | | | | $7 | | | | $5 | | | | $20 | |
| | | | | | | | | | | | | | | | | | | | | | | | |
| (a) | Pension plan contributions for IPL and WPL include contributions to their respective qualified pension plans as well as an allocated portion of the contributions to pension plans sponsored by Corporate Services. |
| (b) | Pension plan contributions expected to be made in 2011 through 2013 are based on the funded status and assumed return on assets as of the Dec. 31, 2010 measurement date for each plan and are subject to change. Refer to Note 6(a) of the “Combined Notes to Consolidated Financial Statements” for discussion of the current funded levels of pension plans. |
Cash Collateral - Alliant Energy, IPL and WPL have entered into various commodity contracts that contain provisions requiring the parties to provide cash collateral if their liability position under the contract exceeds certain limitations. Refer to “Legislative Matters - Federal Regulatory Reform Legislation” for additional details of legislation enacted in 2010, which Alliant Energy, IPL and WPL currently do not believe will have a material impact on their financial condition and results of operations.
Investing Activities -
2010 vs. 2009 - Alliant Energy’s cash flows used for investing activities decreased $282 million primarily due to $336 million of lower construction expenditures. The lower construction expenditures primarily resulted from expenditures during 2009 for IPL’s Whispering Willow - East wind project, restoration activities at Prairie Creek and implementation of AMI at WPL, partially offset by higher expenditures during 2010 for WPL’s Bent Tree - Phase I wind project. The lower construction expenditures were partially offset by $38 million of insurance proceeds received by IPL during 2009 for property damaged by the severe flooding in 2008 and changes in the collection of and advances for customer energy efficiency projects.
81
IPL’s cash flows used for investing activities decreased $298 million primarily due to $351 million of lower construction expenditures. The lower construction expenditures primarily resulted from expenditures during 2009 for its Whispering Willow - East wind project and restoration activities at Prairie Creek. The lower construction expenditures were partially offset by $38 million of insurance proceeds received by IPL during 2009 for property damaged by the severe flooding in 2008.
WPL’s cash flows used for investing activities decreased $44 million primarily due to $58 million of lower construction and acquisition expenditures resulting from expenditures during 2009 for the acquisition of the Neenah Energy Facility and implementation of AMI, partially offset by higher expenditures during 2010 for its Bent Tree - Phase I wind project. The lower construction and acquisition expenditures were partially offset by changes in the collection of and advances for customer energy efficiency projects.
2009 vs. 2008 - - Alliant Energy’s cash flows used for investing activities increased $283 million primarily due to $324 million of higher construction expenditures including expenditures in 2009 for IPL’s and WPL’s wind projects, restoration activities at Prairie Creek, implementation of AMI at WPL and emission controls at IPL’s Lansing Unit 4. This item was partially offset by changes in the collection of and advances for customer energy efficiency projects and higher insurance proceeds received by IPL in 2009 compared to 2008 for property damaged by the severe flooding in 2008.
IPL’s cash flows used for investing activities increased $244 million primarily due to $254 million of higher construction expenditures including expenditures in 2009 for its Whispering Willow - East wind project, restoration activities at Prairie Creek and emission controls at Lansing Unit 4. This item was partially offset by higher insurance proceeds received in 2009 compared to 2008 for property damaged by the severe flooding in 2008.
WPL’s cash flows used for investing activities increased $117 million due to $145 million of higher construction and acquisition expenditures including expenditures in 2009 for the Bent Tree - Phase I wind project, the Neenah Energy Facility and implementation of AMI. This item was partially offset by changes in the collection of and advances for customer energy efficiency projects.
Construction and Acquisition Expenditures - Capital expenditures and financing plans are reviewed, approved and updated as part of Alliant Energy’s strategic planning and budgeting processes. In addition, significant capital expenditures and investments are subject to a cross-functional review prior to approval. Changes in Alliant Energy’s anticipated construction and acquisition expenditures may result from a number of reasons including economic conditions, regulatory requirements, ability to obtain adequate and timely rate relief, changing market conditions and new opportunities. Alliant Energy, IPL and WPL have not yet entered into contractual commitments relating to the majority of their anticipated future capital expenditures. As a result, they have some discretion with regard to the level, and timing of, capital expenditures eventually incurred and closely monitor and frequently update such estimates based on numerous economic and other factors. Alliant Energy, IPL and WPL currently anticipate construction and acquisition expenditures during 2011 through 2013 as follows (in millions):
| | | | | | | | | | | | | | | | | | | | | | | | | | | | | | | | | | | | |
| | | Alliant Energy | | | IPL | | | WPL | |
| Utility business (a): | | 2011 | | | 2012 | | | 2013 | | | 2011 | | | 2012 | | | 2013 | | | 2011 | | | 2012 | | | 2013 | |
| | | | | | | | | | | | |
Generation - new facilities: | | | | | | | | | | | | | | | | | | | | | | | | | | | | | | | | | | | | |
WPL coal - 25% of Edgewater Unit 5 | | | $45 | | | | $-- | | | | $-- | | | | $-- | | | | $-- | | | | $-- | | | | $45 | | | | $-- | | | | $-- | |
WPL wind - Bent Tree - Phase I (b) | | | 35 | | | | -- | | | | -- | | | | -- | | | | -- | | | | -- | | | | 35 | | | | -- | | | | -- | |
WPL gas - Riverside | | | -- | | | | -- | | | | 375 | | | | -- | | | | -- | | | | -- | | | | -- | | | | -- | | | | 375 | |
| | | | | | | | | | | | |
Total generation - new facilities | | | 80 | | | | -- | | | | 375 | | | | -- | | | | -- | | | | -- | | | | 80 | | | | -- | | | | 375 | |
Environmental | | | 110 | | | | 270 | | | | 260 | | | | 35 | | | | 115 | | | | 120 | | | | 75 | | | | 155 | | | | 140 | |
Other utility capital expenditures | | | 440 | | | | 545 | | | | 515 | | | | 235 | | | | 320 | | | | 290 | | | | 205 | | | | 225 | | | | 225 | |
| | | | | | | | | | | | |
Total utility business | | | 630 | | | | 815 | | | | 1,150 | | | | $270 | | | | $435 | | | | $410 | | | | $360 | | | | $380 | | | | $740 | |
| | | | | | | | | | | | | | | | | | | | |
100 MW wind project and related interconnection (b) | | | 80 | | | | 95 | | | | 5 | | | | | | | | | | | | | | | | | | | | | | | | | |
Non-regulated businesses | | | 10 | | | | 10 | | | | 10 | | | | | | | | | | | | | | | | | | | | | | | | | |
| | | | | | | | | | | | | | | | | | | | | | | | | | | | |
| | | $720 | | | | $920 | | | | $1,165 | | | | | | | | | | | | | | | | | | | | | | | | | |
| | | | | | | | | | | | | | | | | | | | | | | | | | | | |
| (a) | Cost estimates represent IPL’s or WPL’s estimated portion of total escalated construction and acquisition expenditures in millions of dollars and exclude AFUDC, if applicable. Refer to “Strategic Overview” for further discussion of the generation plans and environmental compliance plans. |
| (b) | Refer to “Certain Financial Commitments - Contractual Obligations” for long-term capital purchase obligations related to wind projects. Alliant Energy, IPL and WPL have capital purchase obligations under a master supply agreement |
82
| | executed in 2008 with Vestas for the purchase of wind turbine generator sets and related equipment to support IPL’s and WPL’s wind generation plans. |
Alliant Energy, IPL and WPL expect to finance their 2011 through 2013 capital expenditure plans in a manner that allows them to adhere to the capital structure targets discussed in the “Capital Structure” section above. 2011 capital expenditures are expected to be funded with a combination of available cash and cash equivalents, internally-generated cash and short-term debt. The precise characteristics of the financing for the 2012 and 2013 capital expenditures and any potential changes to the revolving credit facilities will be determined closer to the time that the financing needs are required. Flexibility will be required in implementing the long-term financing for capital expenditure plans to allow for scheduling variations in the required authorization and construction work, changing market conditions and any adjustments that might be required to ensure there are no material adverse impacts to Alliant Energy’s, IPL’s and WPL’s respective capital structures.
Financing Activities -
2010 vs. 2009 - Alliant Energy’s cash flows from financing activities decreased $455 million primarily due to changes in the amount of commercial paper outstanding at IPL and WPL and impacts of long-term debt issued and retired during 2010 and 2009 discussed below.
IPL’s cash flows from financing activities decreased $463 million primarily due to changes in the amount of commercial paper outstanding, $150 million of capital contributions received during 2009 from its parent company, Alliant Energy, and impacts of long-term debt issued and retired during 2010 and 2009 discussed below. These items were partially offset by $50 million of capital contributions received during 2010 from IPL’s parent company.
WPL’s cash flows from financing activities decreased $143 million primarily due to impacts of long-term debt issued and retired during 2010 and 2009 discussed below and $100 million of capital contributions received during 2009 from its parent company, Alliant Energy. These items were partially offset by changes in the amount of commercial paper outstanding and $75 million of capital contributions received during 2010 from WPL’s parent company.
Alliant Energy’s, IPL’s and WPL’s increases (decreases) in financing cash flows due to changes in long-term debt for 2010 vs. 2009 were as follows (in millions):
| | | | | | | | | | | | |
| | | Alliant
Energy | | | IPL | | | WPL | |
Proceeds from issuances: | | | | | | | | | | | | |
IPL’s 3.65% senior debentures issued in August 2010 | | | $200 | | | | $200 | | | | $-- | |
IPL’s 3.3% senior debentures issued in June 2010 | | | 150 | | | | 150 | | | | -- | |
WPL’s 4.6% debentures issued in June 2010 | | | 150 | | | | -- | | | | 150 | |
IPL’s 6.25% senior debentures issued in July 2009 | | | (300) | | | | (300) | | | | -- | |
WPL’s 5% debentures issued in July 2009 | | | (250) | | | | -- | | | | (250) | |
Alliant Energy’s 4% senior notes issued in October 2009 | | | (250) | | | | -- | | | | -- | |
Payments to retire: | | | | | | | | | | | | |
IPL’s 6.75% senior debentures retired in September 2010 | | | (206) | | | | (206) | | | | -- | |
WPL’s 7.625% debentures retired in March 2010 | | | (100) | | | | -- | | | | (100) | |
Alliant Energy’s Exchangeable Senior Notes retired in September 2009 | | | 241 | | | | -- | | | | -- | |
IPL’s 6.625% senior debentures retired in August 2009 | | | 135 | | | | 135 | | | | -- | |
| | | | | | | | | | | | |
| | | ($230) | | | | ($21) | | | | ($200) | |
| | | | | | | | | | | | |
2009 vs. 2008 - Alliant Energy’s cash flows from financing activities increased $191 million primarily due to changes in the amount of commercial paper outstanding at IPL and impacts of long-term debt issued and retired during 2009 and 2008 discussed below.
IPL’s cash flows from financing activities increased $12 million primarily due to changes in the amount of commercial paper outstanding. This item was partially offset by impacts of long-term debt issued and retired during 2009 and 2008 discussed below and $50 million of lower capital contributions received from IPL’s parent company.
WPL’s cash flows from financing activities increased $61 million primarily due to impacts of long-term debt issued and retired during 2009 and 2008 discussed below.
83
Alliant Energy’s, IPL’s and WPL’s increases (decreases) in financing cash flows due to changes in long-term debt for 2009 vs. 2008 were as follows (in millions):
| | | | | | | | | | |
| | | Alliant
Energy | | IPL | | | WPL | |
Proceeds from issuances: | | | | | | | | | | |
IPL’s 6.25% senior debentures issued in July 2009 | | $300 | | | $300 | | | | $-- | |
WPL’s 5% debentures issued in July 2009 | | 250 | | | -- | | | | 250 | |
Alliant Energy’s 4% senior notes issued in October 2009 | | 250 | | | -- | | | | -- | |
IPL’s 7.25% senior debentures issued in October 2008 | | (250) | | | (250) | | | | -- | |
WPL’s 7.6% debentures issued in October 2008 | | (250) | | | -- | | | | (250) | |
Payments to retire: | | | | | | | | | | |
Alliant Energy’s Exchangeable Senior Notes retired in September 2009 | | (241) | | | -- | | | | -- | |
IPL’s 6.625% senior debentures retired in August 2009 | | (135) | | | (135) | | | | -- | |
Corporate Services’ 4.55% senior notes retired in October 2008 | | 75 | | | -- | | | | -- | |
WPL’s 5.7% debentures retired in October 2008 | | 60 | | | -- | | | | 60 | |
IPL’s various pollution control revenue bonds retired in 2008 | | 17 | | | 17 | | | | -- | |
| | | | | | | | | | |
| | $76 | | | ($68) | | | | $60 | |
| | | | | | | | | | |
FERC and Public Utility Holding Company Act Financing Authorizations - Under the Public Utility Holding Company Act of 2005, FERC has authority over the issuance of utility securities, except to the extent that a public utility company’s primary state regulatory commission has retained jurisdiction over such matters. In 2008, FERC issued an order allowing IPL to pay up to $400 million in common equity distributions from additional paid-in capital, rather than retained earnings. In 2010, 2009 and 2008, IPL paid $118 million, $106 million and $75 million, respectively, of common equity distributions from additional paid-in capital under this order. As of Dec. 31, 2010, IPL had remaining authority for $101 million of common equity distributions from additional paid-in capital, rather than retained earnings, under the 2008 authorization issued by FERC.
As of Dec. 31, 2010, IPL had remaining authority for $550 million of long-term debt securities issuances, $750 million of short-term debt securities issuances and $200 million of preferred stock issuances for 2011 under a December 2009 authorization issued by FERC. Issuance of debt securities by WPL is authorized by the PSCW and therefore is exempt from regulation by FERC. FERC does not have authority over the issuance of securities by Alliant Energy or Resources.
State Regulatory Financing Authorizations - IPL received approval from FERC and the MPUC to borrow directly from its parent should external sources of short-term debt become unavailable or short-term borrowing costs become excessive. Currently, there are no limits on the amount that IPL may borrow from its parent. In August 2010, the MPUC issued an order that determined IPL does not need to obtain authorization to issue securities as long as IPL is not organized under the laws of the state of Minnesota and the securities issued do not encumber any of its property in the state of Minnesota. IPL currently does not have, and does not plan to issue, securities that encumber its property, thus IPL is not currently required to obtain approval from the MPUC for unsecured securities issuances. However, if in the future IPL were to subject its utility property in Minnesota to an encumbrance for the purpose of securing the payment of any indebtedness, IPL would be required to obtain an order from the MPUC approving such securities issuances.
In December 2010, WPL received authorization from the PSCW to issue up to $200 million of long-term debt securities in 2011. WPL is also authorized by the PSCW to have no more than $250 million of short-term borrowings and letters of credit outstanding.
Shelf Registrations - Alliant Energy, IPL and WPL have current shelf registration statements with the Securities and Exchange Commission as follows:
| | | | | | |
| | | Alliant Energy | | IPL | | WPL |
Aggregate amount available as of Dec. 31, 2010 | | Unspecified | | $600 million | | $300 million |
| Time period available | | Sep-2009 - Sep-2012 | | Nov-2010 - Nov-2013 | | Jun-2009 - Jun-2012 |
| Securities available to be issued | | Common stock, senior notes, other securities | | Preferred stock and unsecured debt securities | | Preferred stock and unsecured debt securities |
Common Stock Dividends - In December 2010, Alliant Energy announced an increase in its expected 2011 annual common stock dividend from $1.58 per share to $1.70 per share, which is equivalent to a quarterly rate of $0.425 per share, beginning with the Feb. 15, 2011 dividend payment. Payment of future 2011 quarterly dividends is subject to the actual dividend
84
declaration by Alliant Energy’s Board of Directors. Alliant Energy’s general long-term goal is to maintain a dividend payout ratio that is competitive with the industry average. Currently, Alliant Energy’s goal is to attain a dividend payout level of approximately 60% to 70% of its utility earnings. Alliant Energy’s dividend payout ratio was 63% of its utility earnings in 2010. Refer to Note 7(a) of the “Combined Notes to Consolidated Financial Statements” for discussion of IPL’s and WPL’s dividend payment restrictions based on the terms of their outstanding preferred stock and applicable regulatory limitations.
Common Stock Issuances and Capital Contributions - Alliant Energy issued $6 million, $1 million and $1 million of additional common stock from the exercise of stock options under its equity incentive plans for employees in 2010, 2009 and 2008, respectively. Alliant Energy currently anticipates its only common stock issuances in 2011 and 2012 will be to issue new shares under its equity incentive plans for employees. Refer to Note 6(b) of the “Combined Notes to Consolidated Financial Statements” for discussion of Alliant Energy’s common stock issuances in 2010 under its equity incentive plans for employees. Refer to Note 7(a) of the “Combined Notes to Consolidated Financial Statements” for discussion of capital contributions from Alliant Energy to each of IPL and WPL, payments of common stock dividends by WPL to its parent company and repayments of capital by IPL and Resources to their parent company in 2010.
Short-term Debt - In 2007, Alliant Energy, IPL and WPL extended the terms of their respective revolving credit facilities to November 2012. These credit facilities backstop commercial paper issuances used to finance short-term borrowing requirements, which fluctuate based on seasonal corporate needs, the timing of long-term financings and capital market conditions. The facility at the parent company is generally used to fund Resources and Corporate Services as well as its own needs. At Dec. 31, 2010, Alliant Energy’s short-term borrowing arrangements included three revolving credit facilities totaling $623 million ($96 million for Alliant Energy at the parent company level, $287 million for IPL and $240 million for WPL). Currently, there are 13 lenders that participate in the three credit facilities, with aggregate respective commitments ranging from $20 million to $118 million. At Dec. 31, 2010, additional credit facility information was as follows (dollars in millions; Not Applicable (N/A)):
| | | | | | | | | | | | | | | | |
| | | Alliant Energy
(Consolidated) | | | Parent
Company | | | IPL | | | WPL | |
Commercial paper: | | | | | | | | | | | | | | | | |
Amount outstanding | | | $47 | | | | $-- | | | | $-- | | | | $47 | |
Remaining maturity | | | 3 days | | | | N/A | | | | N/A | | | | 3 days | |
Interest rates | | | 0.3% | | | | N/A | | | | N/A | | | | 0.3% | |
Available credit facility capacity | | | $576 | | | | $96 | | | | $287 | | | | $193 | |
During 2010, IPL and WPL issued commercial paper to meet short-term financing requirements and did not borrow directly under their respective credit facilities. During 2010, the Alliant Energy parent company did not issue commercial paper or borrow directly under its credit facility.
Alliant Energy’s, IPL’s and WPL’s credit facility agreements each contain a financial covenant that requires the entities to maintain certain debt-to-capital ratios. The debt-to-capital ratios required in order to borrow under the credit facilities compared to the actual debt-to-capital ratios at Dec. 31, 2010 were as follows:
| | | | | | |
| | | Alliant Energy | | IPL | | WPL |
Requirement | | Less than 65% | | Less than 58% | | Less than 58% |
Status at Dec. 31, 2010 | | 46% | | 45% | | 46% |
The debt component of the capital ratios includes long- and short-term debt (excluding non-recourse debt and hybrid securities to the extent such hybrid securities do not exceed 15% of consolidated capital of the borrower), capital lease obligations, letters of credit, guarantees of the foregoing and new synthetic leases. The equity component excludes accumulated other comprehensive income (loss).
Alliant Energy’s, IPL’s and WPL’s credit facility agreements each contain negative pledge provisions, which generally prohibit placing liens on any of the property of Alliant Energy or its subsidiaries with certain exceptions. Exceptions include among others, securing obligations of up to 5% of the consolidated assets of the borrower, non-recourse project financing and purchase money liens.
The credit facility agreements each contain provisions that require, during their term, any proceeds from asset sales, with certain exclusions, in excess of 20% of Alliant Energy’s, IPL’s and WPL’s respective consolidated assets to be used to reduce commitments under their respective facilities. Exclusions include, among others, certain sale and lease-back transactions, and transmission and non-regulated assets.
85
The credit facility agreements each contain customary events of default. In addition, Alliant Energy’s credit facility agreement contains a cross-default provision that is triggered if a domestic majority-owned subsidiary of Alliant Energy incurs an event of default on debt totaling $50 million or more. If an event of default under any of the credit facility agreements occurs and is continuing, the lenders may declare any outstanding obligations under the credit facility agreements immediately due and payable and could terminate such agreements. In addition, if any order for relief is entered under bankruptcy laws with respect to Alliant Energy, IPL or WPL, then any outstanding obligations under the respective credit facility agreements would be immediately due and payable. At Dec. 31, 2010, Alliant Energy, IPL and WPL did not have any direct borrowings outstanding under their credit facility agreements. In addition, IPL’s sales of accounts receivable program agreement contains a cross-default provision that is triggered if IPL or Alliant Energy incurs an event of default on debt totaling $50 million or more. If an event of default under IPL’s sales of accounts receivable program agreement occurs, then the counterparty could terminate such agreement. At Dec. 31, 2010, IPL sold in the aggregate $220 million of accounts receivable. A default by a minority-owned affiliate or a foreign subsidiary would not trigger a cross-default event. A default by either Alliant Energy or Resources would not trigger a cross-default event for either IPL or WPL, nor would a default by either of IPL or WPL trigger a cross-default event for the other under their respective credit facility agreements.
A material adverse change representation is not required for borrowings under the credit facility agreements.
At Dec. 31, 2010, Alliant Energy, IPL and WPL were in compliance with all covenants and other provisions of the credit facility agreements.
Refer to Note 8(a) of the “Combined Notes to Consolidated Financial Statements” for additional information on short-term debt.
Long-term Debt - In 2010 and 2009, significant issuances of long-term debt were as follows (dollars in millions):
| | | | | | | | | | |
Company | | Principal
Amount | | Type | | Interest
Rate | | Due Date | | Use of Proceeds |
2010 | | | | | | | | | | |
IPL | | $200.0 | | Senior debentures | | 3.65% | | Sep-2020 | | Redeem its $200 million 6.75% senior debentures due 2011 |
IPL | | $150.0 | | Senior debentures | | 3.3% | | Jun-2015 | | Repay short-term debt, fund capital expenditures and for general working capital purposes |
WPL | | $150.0 | | Debentures | | 4.6% | | Jun-2020 | | Repay short-term debt, fund capital expenditures and for general working capital purposes |
| | | | | |
2009 | | | | | | | | | | |
Alliant Energy | | $250.0 | | Senior notes | | 4% | | Oct-2014 | | Repay a short-term loan used for the repurchase of the Exchangeable Senior Notes due 2030 and for general corporate purposes |
IPL | | $300.0 | | Senior debentures | | 6.25% | | Jul-2039 | | Repay short-term debt, invest in short-term assets and redeem at maturity its $135 million 6.625% senior debentures |
WPL | | $250.0 | | Debentures | | 5% | | Jul-2019 | | Repay short-term debt and invest in short-term assets |
In 2010 and 2009, significant retirements of long-term debt were as follows (dollars in millions):
| | | | | | | | |
Company | | Principal
Amount | | Type | | Interest
Rate | | Original
Due Date |
2010 | | | | | | | | |
IPL | | $200.0 | | Senior debentures | | 6.75% | | Mar-2011 |
WPL | | $100.0 | | Debentures | | 7.625% | | Mar-2010 |
| | | | |
2009 | | | | | | | | |
Alliant Energy | | $402.5 | | Exchangeable Senior Notes | | 2.5% | | Feb-2030 |
IPL | | $135.0 | | Senior debentures | | 6.625% | | Aug-2009 |
Refer to Note 8(b) of the “Combined Notes to Consolidated Financial Statements” for additional information on long-term debt.
86
Creditworthiness -
Ratings Triggers -The long-term debt of Alliant Energy and its subsidiaries is not subject to any repayment requirements as a result of explicit credit rating downgrades or so-called “ratings triggers.” However, Alliant Energy and its subsidiaries are parties to various agreements, including PPAs, commodity contracts and corporate guarantees that are dependent on maintaining investment-grade credit ratings. In the event of a downgrade below investment-grade level, Alliant Energy or its subsidiaries may need to provide credit support, such as letters of credit or cash collateral equal to the amount of the exposure, or may need to unwind the contract or pay the underlying obligation. In the event of a downgrade below investment-grade level, management believes Alliant Energy, IPL and WPL have sufficient liquidity to cover counterparty credit support or collateral requirements under these various agreements. In addition, a downgrade in the credit ratings of Alliant Energy, IPL or WPL could also result in them paying higher interest rates in future financings, reduce their pool of potential lenders, increase their borrowing costs under existing credit facilities or limit their access to the commercial paper market. Alliant Energy, IPL and WPL are committed to taking the necessary steps required to maintain investment-grade credit ratings. Alliant Energy’s, IPL’s and WPL’s current credit ratings and outlooks are as follows:
| | | | | | |
| | | | | Standard & Poor’s
Ratings Services | | Moody’s Investors
Service |
Alliant Energy: | | Corporate/issuer | | BBB+ | | Baa1 |
| | Commercial paper | | A-2 | | P-2 |
| | Senior unsecured long-term debt | | BBB | | Baa1 |
| | Outlook | | Positive | | Stable |
IPL: | | Corporate/issuer | | BBB+ | | A3 |
| | Commercial paper | | A-2 | | P-2 |
| | Senior unsecured long-term debt | | BBB+ | | A3 |
| | Preferred stock | | BBB- | | Baa2 |
| | Outlook | | Positive | | Stable |
WPL: | | Corporate/issuer | | A- | | A2 |
| | Commercial paper | | A-2 | | P-1 |
| | Senior unsecured long-term debt | | A- | | A2 |
| | Preferred stock | | BBB | | Baa1 |
| | Outlook | | Stable | | Stable |
Resources | | Corporate/issuer | | BBB+ | | Not rated |
Credit ratings are not recommendations to buy or sell securities and are subject to change, and each rating should be evaluated independently of any other rating. None of Alliant Energy, IPL or WPL assumes any obligation to update their respective credit ratings. Refer to Note 11(a) of the “Combined Notes to Consolidated Financial Statements” for additional information on ratings triggers for commodity contracts accounted for as derivatives.
Off-Balance Sheet Arrangements -
Synthetic Leases -Alliant Energy and WPL utilize off-balance sheet synthetic operating leases related to the financing of certain corporate headquarters (Alliant Energy) and utility railcars (Alliant Energy and WPL). Synthetic leases provide favorable financing rates to Alliant Energy and WPL while allowing them to maintain operating control of their leased assets. Refer to Note 3(a) of the “Combined Notes to Consolidated Financial Statements” for future minimum lease payments and residual value guarantees associated with these synthetic leases.
Special Purpose Entities -Effective April 1, 2010, IPL entered into an amended and restated Receivables Purchase and Sale Agreement (Agreement) whereby it may sell its customer accounts receivables, unbilled revenues and certain other accounts receivables to a third-party financial institution through wholly-owned and consolidated special purpose entities. In 2010, IPL evaluated the third-party financial institution that purchases IPL’s receivable assets under the Agreement and believes that the third-party financial institution is a variable interest entity. However, IPL does not have a variable interest in the third-party financial institution. Refer to “Cash Flows - Operating Activities - IPL’s Sales of Accounts Receivable Program” and Note 4(a) of the “Combined Notes to Consolidated Financial Statements” for further discussion of IPL’s sales of accounts receivable program. Refer to Note 19 of the “Combined Notes to Consolidated Financial Statements” for information regarding variable interest entities.
Guarantees and Indemnifications -Alliant Energy has guarantees and indemnifications outstanding related to its prior divestiture activities. Refer to Note 12(d) of the “Combined Notes to Consolidated Financial Statements” for additional information.
87
Certain Financial Commitments -
Contractual Obligations -Alliant Energy’s, IPL’s and WPL’s consolidated long-term contractual obligations as of Dec. 31, 2010 were as follows (in millions):
| | | | | | | | | | | | | | | | | | | | | | | | | | | | |
| Alliant Energy | | 2011 | | | 2012 | | | 2013 | | | 2014 | | | 2015 | | | Thereafter | | | Total | |
| | | | |
Operating expense purchase obligations (Note 12(b)): | | | | | | | | | | | | | | | | | | | | | | | | | | | | |
Purchased power and fuel commitments (a) | | | $604 | | | | $416 | | | | $381 | | | | $79 | | | | $19 | | | | $33 | | | | $1,532 | |
SO2 emission allowances | | | -- | | | | -- | | | | -- | | | | -- | | | | 12 | | | | 22 | | | | 34 | |
Other (b) | | | 85 | | | | 15 | | | | 7 | | | | 1 | | | | -- | | | | -- | | | | 108 | |
Long-term debt maturities (Note 8(b)) | | | 1 | | | | 1 | | | | 1 | | | | 298 | | | | 183 | | | | 2,234 | | | | 2,718 | |
Interest - long-term debt obligations | | | 153 | | | | 153 | | | | 153 | | | | 152 | | | | 137 | | | | 1,921 | | | | 2,669 | |
Wind generation capital purchase obligations (Note 12(a))(c) | | | 79 | | | | 8 | | | | -- | | | | -- | | | | -- | | | | -- | | | | 87 | |
Operating leases (Note 3(a)) | | | 72 | | | | 114 | | | | 24 | | | | 8 | | | | 4 | | | | 22 | | | | 244 | |
Capital leases (Note 3(b)) | | | 2 | | | | 1 | | | | 1 | | | | 1 | | | | -- | | | | 2 | | | | 7 | |
| | | | |
| | | $996 | | | | $708 | | | | $567 | | | | $539 | | | | $355 | | | | $4,234 | | | | $7,399 | |
| | | | |
| | | | | | | |
| IPL | | | 2011 | | | | 2012 | | | | 2013 | | | | 2014 | | | | 2015 | | | | Thereafter | | | | Total | |
| | | | |
Operating expense purchase obligations (Note 12(b)): | | | | | | | | | | | | | | | | | | | | | | | | | | | | |
Purchased power and fuel commitments (a) | | | $325 | | | | $243 | | | | $231 | | | | $54 | | | | $6 | | | | $12 | | | | $871 | |
SO2 emission allowances | | | -- | | | | -- | | | | -- | | | | -- | | | | 12 | | | | 22 | | | | 34 | |
Other (b) | | | 13 | | | | 7 | | | | -- | | | | -- | | | | -- | | | | -- | | | | 20 | |
Long-term debt maturities (Note 8(b)) | | | -- | | | | -- | | | | -- | | | | 38 | | | | 150 | | | | 1,125 | | | | 1,313 | |
Interest - long-term debt obligations | | | 74 | | | | 74 | | | | 74 | | | | 73 | | | | 70 | | | | 847 | | | | 1,212 | |
Wind generation capital purchase obligations (Note 12(a))(c) | | | 54 | | | | 8 | | | | -- | | | | -- | | | | -- | | | | -- | | | | 62 | |
Operating leases (Note 3(a)) | | | 4 | | | | 4 | | | | 4 | | | | 3 | | | | 3 | | | | 20 | | | | 38 | |
Capital leases | | | -- | | | | -- | | | | -- | | | | -- | | | | -- | | | | 3 | | | | 3 | |
| | | | |
| | | $470 | | | | $336 | | | | $309 | | | | $168 | | | | $241 | | | | $2,029 | | | | $3,553 | |
| | | | |
| | | | | | | |
| WPL | | 2011 | | | 2012 | | | 2013 | | | 2014 | | | 2015 | | | Thereafter | | | Total | |
| | | | |
Operating expense purchase obligations (Note 12(b)): | | | | | | | | | | | | | | | | | | | | | | | | | | | | |
Purchased power and fuel commitments (a) | | | $160 | | | | $125 | | | | $111 | | | | $25 | | | | $13 | | | | $21 | | | | $455 | |
Other (b) | | | 9 | | | | 8 | | | | 7 | | | | 1 | | | | -- | | | | -- | | | | 25 | |
Long-term debt maturities (Note 8(b)) | | | -- | | | | -- | | | | -- | | | | 8 | | | | 31 | | | | 1,050 | | | | 1,089 | |
Interest - long-term debt obligations | | | 66 | | | | 66 | | | | 66 | | | | 66 | | | | 65 | | | | 1,056 | | | | 1,385 | |
Wind generation capital purchase obligations (Note 12(a))(c) | | | 25 | | | | -- | | | | -- | | | | -- | | | | -- | | | | -- | | | | 25 | |
Operating leases (Note 3(a)) | | | 63 | | | | 67 | | | | 20 | | | | 5 | | | | 1 | | | | 1 | | | | 157 | |
Capital lease - Sheboygan Falls Energy Facility (Note 3(b)) | | | 15 | | | | 15 | | | | 15 | | | | 15 | | | | 15 | | | | 143 | | | | 218 | |
Capital leases - other | | | -- | | | | -- | | | | -- | | | | -- | | | | -- | | | | 2 | | | | 2 | |
| | | | |
| | | $338 | | | | $281 | | | | $219 | | | | $120 | | | | $125 | | | | $2,273 | | | | $3,356 | |
| | | | |
| (a) | Purchased power and fuel commitments represent normal business contracts used to ensure adequate purchased power, coal and natural gas supplies and to minimize exposure to market price fluctuations. Alliant Energy, through its subsidiary Corporate Services, has entered into various coal commitments that have not yet been directly assigned to IPL and WPL. Such commitments are included in the Alliant Energy purchased power and fuel commitments but are not included in the IPL or WPL purchased power and fuel commitments. |
| (b) | Other operating expense purchase obligations represent individual commitments incurred during the normal course of business that exceeded $1 million at Dec. 31, 2010. |
| (c) | In 2008, Corporate Services, as agent for IPL and WPL, entered into a master supply agreement with Vestas for the purchase of 500 MW of wind turbine generator sets and related equipment to support wind generation plans. The wind generation plans are described in more detail in “Strategic Overview - Generation Plans.” |
At Dec. 31, 2010, Alliant Energy, IPL and WPL had $67 million, $33 million and $34 million, respectively, of uncertain tax positions recorded as liabilities, which are not included in the above tables. It is uncertain if, and when, such amounts may be settled with the respective taxing authorities. Related to these uncertain tax positions, Alliant Energy, IPL and WPL also recorded liabilities for potential interest of $1 million, $1 million and $0, respectively, at Dec. 31, 2010, which are also not included in the above tables.
Refer to Note 6(a) of the “Combined Notes to Consolidated Financial Statements” for anticipated pension and other postretirement benefits funding amounts, which are not included in the above tables. Refer to “Cash Flows - Investing Activities - Construction and Acquisition Expenditures” for additional information on Alliant Energy’s, IPL’s and WPL’s
88
construction and acquisition programs. In addition, at Dec. 31, 2010, there were various other long-term liabilities and deferred credits included on the respective Consolidated Balance Sheets that, due to the nature of the liabilities, the timing of payments cannot be estimated and are therefore excluded from the above tables.
OTHER MATTERS
Market Risk Sensitive Instruments and Positions - Alliant Energy’s, IPL’s and WPL’s primary market risk exposures are associated with commodity prices, investment prices and interest rates. Alliant Energy, IPL and WPL have risk management policies to monitor and assist in controlling these market risks and use derivative instruments to manage some of the exposures. Refer to Notes 1(i) and 11 of the “Combined Notes to Consolidated Financial Statements” for further discussion of Alliant Energy’s, IPL’s and WPL’s derivative instruments.
Commodity Price - Alliant Energy, IPL and WPL are exposed to the impact of market fluctuations in the price and transportation costs of commodities they procure and market. Alliant Energy, IPL and WPL employ established policies and procedures to mitigate their risks associated with these market fluctuations including the use of various commodity derivatives and contracts of various durations for the forward sale and purchase of these commodities. Alliant Energy’s exposure to commodity price risks in its utility business is also significantly mitigated by current rate making structures in place for recovery of its electric production fuel and purchased energy expenses (fuel-related costs) as well as its cost of natural gas purchased for resale. IPL’s and WPL’s electric and gas tariffs provide for subsequent adjustments to their rates for changes in prudently incurred commodity costs. IPL’s and WPL’s rate mechanisms, combined with commodity derivatives, significantly reduce commodity risk associated with their electric and gas margins.
WPL’s retail electric margins have the most exposure to the impact of changes in commodity prices for Alliant Energy and WPL due largely to the current retail recovery mechanism in place in Wisconsin for fuel-related costs, which became effective on Jan. 1, 2011. The cost recovery mechanism applicable for WPL’s retail electric customers is based on forecasts of fuel-related costs expected to be incurred during forward-looking test year periods and fuel monitoring ranges determined by the PSCW during each electric retail rate proceeding or in a separate fuel cost plan approval proceeding. In December 2010, the PSCW approved annual forecasted fuel-related costs per MWh of $25.12 based on $346 million of variable fuel costs for WPL’s 2011 test period and left unchanged the annual fuel monitoring range of plus or minus 2%. Under the new cost recovery mechanism, if WPL’s actual fuel-related costs fall outside this fuel monitoring range during the test period, WPL is authorized to defer the incremental over- or under-collection of fuel-related costs from electric retail customers that are outside the approved ranges. Any over- or under-collection of fuel-related costs for each year are reflected in future billings to customers. Based on this new cost recovery mechanism in Wisconsin and the annual forecasted fuel-related costs and fuel monitoring range approved by the PSCW in December 2010, Alliant Energy and WPL currently estimate the commodity risk exposure to WPL’s electric margins in 2011 is approximately $5 million.
Refer to “Rate Matters” and Note 1(h) of the “Combined Notes to Consolidated Financial Statements” for additional details of utility cost recovery mechanisms that significantly reduce commodity risk for IPL and WPL.
Investment Price - Alliant Energy, IPL and WPL are exposed to investment price risk as a result of their investments in debt and equity securities, largely related to securities held by their pension and other postretirement benefits plans. Refer to Note 6(a) of the “Combined Notes to Consolidated Financial Statements” for details of the debt and equity securities held by their pension and other postretirement benefit plans. Refer to “Critical Accounting Policies and Estimates - Pensions and Other Postretirement Benefits” for the impact on Alliant Energy’s retirement plan costs of changes in the rate of returns earned by its plan assets.
Interest Rate - Alliant Energy, IPL and WPL are exposed to risk resulting from changes in interest rates as a result of their issuance of variable-rate short-term borrowings. In addition, Alliant Energy and IPL are exposed to risk resulting from changes in interest rates as a result of cash proceeds outstanding under IPL’s sales of receivables program. Assuming the impact of a hypothetical 100 basis point increase in interest rates on variable-rate short-term borrowings and cash proceeds outstanding under IPL’s sales of receivables program at Dec. 31, 2010, Alliant Energy’s, IPL’s and WPL’s annual pre-tax expense would increase by approximately $1.1 million, $0.6 million and $0.5 million, respectively.
In addition, Alliant Energy is exposed to changes in earnings resulting from changes in interest rates as a result of balances of cash and cash equivalents that are invested in money market funds with yields that may fluctuate daily. Assuming the impact of a hypothetical 100 basis point increase in interest rates on Alliant Energy’s money market fund investments at Dec. 31, 2010, Alliant Energy’s annual interest income would increase by approximately $1.4 million.
89
Refer to Notes 1(d), 4(a) and 8(a) of the “Combined Notes to Consolidated Financial Statements” for additional information on investments in money market funds, cash proceeds outstanding under IPL’s sales of receivables program and variable-rate short-term borrowings, respectively.
New Accounting Pronouncements - Refer to Note 1(t) of the “Combined Notes to Consolidated Financial Statements” for discussion of new accounting pronouncements impacting Alliant Energy, IPL and WPL.
Critical Accounting Policies and Estimates - The preparation of consolidated financial statements in conformity with GAAP requires that management apply accounting policies and make estimates that affect results of operations and the amounts of assets and liabilities reported in the financial statements. Based on historical experience and various other factors, Alliant Energy, IPL and WPL believe the following accounting policies and estimates are critical to their business and the understanding of their financial results as they require critical assumptions and judgments by management. The results of these assumptions and judgments form the basis for making estimates regarding the results of operations and the amounts of assets and liabilities that are not readily apparent from other sources. Actual financial results may differ materially from these estimates. Alliant Energy’s, IPL’s and WPL’s management has discussed these critical accounting policies and estimates with the Audit Committee of their Board of Directors. Refer to Note 1 of the “Combined Notes to Consolidated Financial Statements” for additional discussion of Alliant Energy’s, IPL’s and WPL’s accounting policies and the estimates used in the preparation of the consolidated financial statements.
Contingencies - Alliant Energy, IPL and WPL make assumptions and judgments each reporting period regarding the future outcome of contingent events and record loss contingency amounts for any contingent events that are both probable and reasonably estimated based upon current available information. The amounts recorded may differ from the actual income or expense that occurs when the uncertainty is resolved. The estimates that Alliant Energy, IPL and WPL make in accounting for contingencies, and the gains and losses that they record upon the ultimate resolution of these uncertainties, could have a significant effect on the results of operations and the amount of assets and liabilities in their financial statements. Note 12 of the “Combined Notes to Consolidated Financial Statements” provides discussion of contingencies assessed at Dec. 31, 2010 including various pending legal proceedings that may have a material impact on Alliant Energy’s, IPL’s and WPL’s financial condition or results of operations.
Regulatory Assets and Regulatory Liabilities - Alliant Energy’s utility subsidiaries (IPL and WPL) are regulated by various federal and state regulatory agencies. As a result, they are subject to accounting guidance for regulated operations, which recognizes that the actions of a regulator can provide reasonable assurance of the existence of an asset or liability. Regulatory assets or regulatory liabilities arise as a result of a difference between GAAP and the accounting principles imposed by the regulatory agencies. Regulatory assets represent incurred costs that have been deferred as they are probable of recovery in future customer rates. Regulatory liabilities represent obligations to make refunds to customers and amounts collected in rates for which the related costs have not yet been incurred. IPL and WPL recognize regulatory assets and regulatory liabilities in accordance with the rulings of their federal and state regulators and future regulatory rulings may impact the carrying value and accounting treatment of Alliant Energy’s, IPL’s and WPL’s regulatory assets and regulatory liabilities.
Alliant Energy, IPL and WPL make assumptions and judgments each reporting period regarding whether their regulatory assets are probable of future recovery and their regulatory liabilities are probable of future obligations by considering factors such as regulatory environment changes, rate orders issued by the applicable regulatory agencies and historical decisions by applicable regulatory agencies regarding similar regulatory assets and regulatory liabilities. The assumptions and judgments used by regulatory authorities have an impact on the recovery of costs, the rate of return on invested capital and the timing and amount of assets to be recovered by rates. A change in these assumptions may result in a material impact on Alliant Energy’s, IPL’s and WPL’s results of operations and the amount of assets and liabilities in their financial statements. Note 1(b) of the “Combined Notes to Consolidated Financial Statements” provides details of the nature and amounts of Alliant Energy’s, IPL’s and WPL’s regulatory assets and regulatory liabilities assessed at Dec. 31, 2010.
Long-Lived Assets - Alliant Energy’s, IPL’s and WPL’s Consolidated Balance Sheets include long-lived assets, which are not yet being recovered from their customers or may cease to be recovered from their customers as a result of regulatory decisions in the future. As a result, Alliant Energy, IPL and WPL must determine whether they will be able to generate sufficient future cash flows from such assets to ensure recovery of the carrying value of the long-lived assets. Alliant Energy, IPL and WPL assess the carrying amount and potential impairment of these assets whenever events or changes in circumstances indicate that the carrying value may not be recoverable. Factors considered in determining if an impairment review is necessary include a significant underperformance of the assets relative to historical or projected future operating results, a significant change in the use of the acquired assets or business strategy related to such assets, and significant negative industry, regulatory or economic trends. When an impairment review is deemed necessary, a comparison is made between the expected undiscounted future cash flows and the carrying amount of the asset. If the carrying amount of the
90
asset is the larger of the two balances, an impairment loss is recognized equal to the amount the carrying amount of the asset exceeds the fair value of the asset. The fair value is determined by the use of quoted market prices, appraisals, or the use of valuation techniques such as expected discounted future cash flows.
Alliant Energy, IPL and WPL make assumptions and judgments each reporting period regarding the recoverability of certain long-lived assets including assets held for sale and assets not yet being recovered from their customers. Alliant Energy’s, IPL’s and WPL’s assets assessed at Dec. 31, 2010 include the IEA business currently held for sale, and wind sites and wind turbine generators currently expected to be used to develop future wind projects. Note 17 of the “Combined Notes to Consolidated Financial Statements” provides details of the IEA business currently held for sale including pre-tax, non-cash valuation charges of $5 million recorded in 2010 as a result of declines in the fair value of the IEA business. Note 1(e) of the “Combined Notes to Consolidated Financial Statements” and “Strategic Overview - Generation Plans” provide details of wind sites and wind turbine generators currently expected to be used by Alliant Energy, IPL and WPL to develop future wind projects.
Unbilled Revenues - Unbilled revenues are primarily associated with Alliant Energy’s, IPL’s and WPL’s utility operations. Energy sales to individual customers are based on the reading of customers’ meters, which occurs on a systematic basis throughout the month. Amounts of energy delivered to customers since the date of the last meter reading are estimated at the end of each reporting period and the corresponding estimated unbilled revenue is recorded. The unbilled revenue estimate is based on daily system demand volumes, estimated customer usage by class, weather impacts, line losses and the most recent customer rates. Such process involves the use of various judgments and assumptions and significant changes in these judgments and assumptions could have a material impact on Alliant Energy’s, IPL’s and WPL’s results of operations.
At Dec. 31, 2010 and 2009, unbilled revenues associated with Alliant Energy’s utility operations were $163 million ($81 million at IPL and $82 million at WPL) and $169 million ($82 million at IPL and $87 million at WPL), respectively. “Alliant Energy’s Results of Operations - Utility Electric Margins - Unbilled Revenue Estimates” provides discussion of annual adjustments to unbilled electric revenue estimates in the second quarters of 2010, 2009 and 2008. Note 4(a) of the “Combined Notes to Consolidated Financial Statements” provides discussion of IPL’s unbilled revenues as of Dec. 31, 2010 sold to a third-party financial institution under an amended and restated Receivables Purchase and Sale Agreement that became effective in April 2010.
Pensions and Other Postretirement Benefits - Alliant Energy, IPL and WPL sponsors various defined benefit pension and other postretirement benefits plans that provide benefits to a significant portion of their employees. Alliant Energy, IPL and WPL make assumptions and judgments periodically to estimate the obligations and costs related to their retirement plans. There are many judgments and assumptions involved in determining an entity’s pension and other postretirement liabilities and costs each period including employee demographics (including age, life expectancies and compensation levels), discount rates, assumed rate of returns and funding. Changes made to the plan provisions may also impact current and future benefits costs. Judgments and assumptions are supported by historical data and reasonable projections and are reviewed annually. As of Dec. 31, 2010 (Alliant Energy’s most recent measurement date), future assumptions for Alliant Energy included the following:
| | | | |
| | | Defined Benefit
Pension Plans | | Other Postretirement
Benefits Plans |
Discount rate to calculate benefit obligations (a) | | 5.56% | | 5.25% |
Future annual expected rate of return on plan assets (b) | | 8% | | 6.9% |
| (a) | In selecting an assumed discount rate, management reviews various corporate Aa bond indices. |
| (b) | Future annual expected rates of return on plan assets are based on projected long-term equity and bond returns, maturities and asset allocations. |
The following table shows the impacts of changing certain key actuarial assumptions discussed above (in millions):
| | | | | | | | |
| | | Defined Benefit Pension Plans | | Other Postretirement Benefits Plans |
Change in Actuarial Assumption | | Impact on Projected
Benefit Obligation at
Dec. 31, 2010 | | Impact on 2011
Net Periodic
Benefit Costs | | Impact on Projected
Benefit Obligation at
Dec. 31, 2010 | | Impact on 2011
Net Periodic
Benefit Costs |
1% change in discount rate | | $121 | | $8 | | $28 | | $3 |
1% change in expected rate of return | | -- | | 8 | | -- | | 1 |
1% change in medical trend rates | | -- | | -- | | 12 | | 1 |
91
Note 6(a) of the “Combined Notes to Consolidated Financial Statements” provides additional details of pension and other postretirement benefits plans. “Other Future Considerations - Retirement Plan Costs” provides discussion of anticipated decreases in pension and other postretirement benefits costs in 2011 due to lower amortization of actuarial losses and higher expected returns on plan assets resulting from increases in retirement plan assets during 2010. Note 12(c) of the “Combined Notes to Consolidated Financial Statements” provides discussion of a class action lawsuit filed against the Alliant Energy Cash Balance Pension Plan in 2008 and the IRS review of the tax qualified status of the Plan.
Income Taxes -Alliant Energy, IPL and WPL are subject to income taxes in various jurisdictions. Alliant Energy, IPL and WPL make assumptions and judgments each reporting period to estimate their income tax assets, liabilities, benefits and expenses. Judgments and assumptions are supported by historical data and reasonable projections. Significant changes in these judgments and assumptions could have a material impact on Alliant Energy’s, IPL’s and WPL’s financial condition and results of operations. Alliant Energy’s, IPL’s and WPL’s critical assumptions and judgments for 2010 include projections of Alliant Energy’s future taxable income used to determine its ability to utilize federal net operating loss and credit carry forwards prior to their expiration and the interpretation of tax laws regarding uncertain tax positions.
Federal Net Operating Loss Carryforward Utilization - Alliant Energy’s federal tax returns for calendar years 2008 and 2009 have included net operating losses primarily due to a change in tax method of accounting for repair expenditure deductions included in its 2008 tax return and bonus depreciation deductions allowed in its 2009 tax return. Alliant Energy also currently anticipates a federal net operating loss on its federal tax returns for calendar years 2010 through 2012 primarily due to additional bonus depreciation deductions eligible under new tax legislation enacted in 2010. Federal net operating losses for each calendar year can be utilized to offset federal taxable income in other years by generally carrying the losses back two years or forward 20 years. Alliant Energy carried back a portion of the net operating losses generated in 2008 and 2009 and currently plans to utilize the remaining portion of its federal net operating loss carryforward of approximately $429 million at Dec. 31, 2010 to offset federal taxable income in the future. Based on current projections of Alliant Energy’s future federal taxable income, Alliant Energy currently plans to utilize its current net operating loss carryforwards prior to their expiration, therefore no valuation allowances have been recorded by Alliant Energy, IPL and WPL for deferred tax assets associated with their federal net operating loss carryforwards as of Dec. 31, 2010. Changes in assumptions regarding Alliant Energy’s future taxable income could have a material impact on Alliant Energy’s, IPL’s and WPL’s financial condition and results of operations.
Federal Tax Credit Carryforward Utilization - Alliant Energy generates federal tax credits each year primarily based on the amount of electricity generated by wind projects at IPL and WPL and the amount of its research and development activities. In addition, in prior years, Alliant Energy generated significant non-conventional source fuel credits. Federal tax credits reduce Alliant Energy’s federal income tax obligations in calendar years that Alliant Energy generates sufficient federal taxable income to utilize the tax credits. If Alliant Energy does not generate sufficient federal taxable income to utilize the federal tax credits generated for that year, the federal tax credits can be carried back and carried forward to be utilized to reduce federal income tax in prior or subsequent years. The federal tax credits have different expiration periods with the most stringent limiting the carry forward period to 20 years. Alliant Energy currently plans to utilize the remaining portion of its federal tax credit carryforward of approximately $80 million at Dec. 31, 2010 to offset federal tax obligations in the future. Based on current projections of Alliant Energy’s future federal taxable income, Alliant Energy currently plans to utilize all current federal tax credit carryforwards prior to their expiration, therefore no valuation allowances have been recorded by Alliant Energy, IPL and WPL for deferred tax assets associated with their federal tax credit carryforwards as of Dec. 31, 2010. Changes in assumptions regarding Alliant Energy’s future taxable income could have a material impact on Alliant Energy’s, IPL’s and WPL’s financial condition and results of operations.
State Net Operating Loss Carryforward Utilization - Alliant Energy generated significant state net operating losses over the past 20 years that are currently being carried forward. At Dec. 31, 2010, the state net operating losses being carried forward had expiration dates ranging from 2011 to 2030 with 92% expiring after 2015. Due to uncertainty in the realization of these state net operating losses being carried forward, Alliant Energy established deferred tax asset valuation allowances related to state net operating loss carryforwards of $19 million at Dec. 31, 2010. Changes in assumptions regarding Alliant Energy’s ability to utilize state net operating loss carryforwards could have a material impact on Alliant Energy’s financial condition and results of operations.
Refer to Notes 1(c) and 5 of the “Combined Notes to Consolidated Financial Statements” for further discussion of regulatory accounting for taxes and details of uncertain tax positions, respectively. Refer to “Other Future Considerations - Tax Accounting for Mixed Service Costs” for discussion of a proposed change in tax accounting for mixed service costs that may result in significant tax deductions for Alliant Energy, IPL and WPL. The significant tax deductions from the change in tax accounting for mixed service costs are expected to increase Alliant Energy’s federal net operating loss. However, Alliant Energy, IPL and WPL currently believe all federal net operating losses and tax credit carry forwards will be utilized before their expiration dates.
92
Other Future Considerations -In addition to items discussed earlier in MDA, the “Combined Notes to Consolidated Financial Statements” in Item 8 and “Risk Factors” in Item 1A, the following items could impact Alliant Energy’s, IPL’s or WPL’s future financial condition or results of operations:
Electric Transmission Service Charges -
Rates Charged by ITC - IPL currently receives substantially all its transmission services from ITC. The annual transmission service rates that ITC charges their customers is calculated each calendar year using a FERC-approved cost of service formula rate template referred to as Attachment “O.” The Attachment “O” rate is based on ITC’s projected net revenue requirement for the upcoming calendar year (i.e. the year the rates will be billed) as well as a true-up adjustment for any over- or under-recovered amounts from the previous calendar year (i.e. two years prior to the year the rates will be billed). Because Attachment “O” is a FERC-approved formula rate, ITC can implement new rates each calendar year without filing a request with FERC. However, new rates are subject to challenge by FERC if the rates proposed by ITC are determined by FERC to be unjust or unreasonable or another mechanism is determined by FERC to be just and reasonable.
In September 2010, ITC filed with MISO the Attachment “O” rate it proposes to charge its customers in 2011 for electric transmission services. The proposed rate was based on ITC’s net revenue requirement for 2011 as well as the impact of a $24 million true-up adjustment related to amounts that ITC under-recovered from its customers in 2009. The 2011 Attachment “O” rate filed with MISO is approximately the same as the rate ITC charged its customers in 2010, which included the impact of a $53 million true-up adjustment related to amounts that ITC under-recovered from its customers in 2008. In January 2010, the IUB issued an order authorizing IPL to defer the Iowa retail portion of the 2008 under-recovered costs billed in 2010 and amortize these deferred costs over a five-year period with an equal and offsetting amount of amortization of IPL’s regulatory liability related to its electric transmission assets sale. In January 2011, the IUB issued an order authorizing IPL to use $20 million of the regulatory liability related to its electric transmission assets sale to offset the Iowa retail portion of the 2009 under-recovered costs expected to be billed to IPL by ITC in 2011. Excluding the impact of the under-recovered costs from 2008 and 2009 that will be offset with regulatory liabilities, IPL currently estimates the electric transmission service costs expected to be billed in 2011 will be approximately $20 million to $30 million higher than the comparable costs billed in 2010. IPL expects to recover a significant portion of these higher transmission service costs in 2010 with the implementation of an automatic transmission cost recovery rider approved by the IUB in the first quarter of 2011. Refer to “Rate Matters” for additional details of the transmission cost recovery rider approved by the IUB and a proposal made by IPL in 2010 to the MPUC to implement an automatic transmission cost recovery rider for electric transmission service costs incurred by IPL to serve its Minnesota retail electric customers.
In 2008, IPL filed a FERC 206 complaint against ITC concerning certain cost components included in ITC’s 2009 proposed rates. ITC requested that the FERC 206 complaint be dismissed on the grounds that the asset sale agreement between IPL and ITC barred IPL from challenging the rate elements for a seven-year period. IPL maintains that its complaint does not take issue with the use of forward-looking data to set rates and instead is challenging how these rates were implemented. In April 2009, FERC denied IPL’s FERC 206 complaint filed against ITC. FERC concluded that IPL had not presented adequate evidence that ITC’s formula rate implementation produced unjust and unreasonable rates with respect to operations and maintenance and administrative and general expenses for 2009. FERC also rejected IPL’s allegations that ITC had not been adequately forthcoming with information about its projected rates and true-up. In May 2009, IPL filed a request for rehearing with FERC. In June 2009, FERC granted IPL’s request for rehearing; however, it is unknown when FERC will take final action on the complaint.
MISO Transmission Cost Allocation - In July 2010, MISO filed a proposed revised tariff with FERC for a new category of transmission projects called Multi-Value Projects (MVPs). MVPs include new large scale transmission projects that enable the reliable and economic delivery of energy in support of documented energy policy mandates or provide economic value across multiple pricing zones within MISO. The MVP category is intended to facilitate the integration of large amounts of location-constrained resources including renewable resources, support MISO member and customer compliance with evolving state and federal energy policy requirements, enable MISO to address multiple reliability needs and provide economic opportunities through regional transmission development. The proposed revised tariff would allow certain costs of MVPs to be socialized across the entire MISO footprint based on energy usage by the MISO participants to ensure that areas within the MISO footprint that have large amounts of generation and a small share of load are not allocated a disproportionate amount of the costs for MVPs. In December 2010, FERC conditionally approved MISO’s proposal for the MVP transmission cost allocation. Alliant Energy, IPL and WPL are currently unable to determine the ultimate impact that the revised tariff may have on their financial condition and results of operation, but believe the outcome could be material to their future electric transmission service expense.
93
Government Incentives for Wind Projects -Alliant Energy’s, IPL’s and WPL’s corporate strategy includes building wind projects to produce electricity to meet customer demand and renewable portfolio standards. In addition to producing electricity, these wind projects may also generate material incentives depending on when they begin generating electricity. The ARRA enacted in February 2009 provided incentives to owners of wind projects placed into service between Jan. 1, 2009 and Dec. 31, 2012. The incentive options available to qualified wind projects under the ARRA include production tax credits for a 10-year period based on the electricity output generated by the wind project, an investment tax credit equal to 30% of the qualified cost basis of the wind project, or a government grant equal to 30% of the qualified cost basis of the wind project. In December 2010, the Tax Relief, Unemployment Insurance Reauthorization and Job Creation Act of 2010 modified the requirements for the government grant incentive. The government grant incentive is now available for qualified wind projects that are placed into service in 2009, 2010 or 2011 and qualified wind projects that began construction in 2009, 2010 and 2011 and are placed into service by Dec. 31, 2012.
Alliant Energy’s generation plan has four wind projects that currently qualify, or may qualify, for one of the government incentives. The four wind projects are WPL’s Cedar Ridge wind project (68 MW capacity) that began generating electricity in late 2008, IPL’s Whispering Willow - East wind project (200 MW capacity) that began generating electricity in late 2009, WPL’s Bent Tree - - Phase I wind project (200 MW capacity) that began generating electricity in the fourth quarter of 2010, and a proposed 100 MW capacity wind project currently under evaluation. Based on an evaluation of the most beneficial alternative for customers, Alliant Energy, IPL and WPL have chosen to recognize production tax credits for the three eligible wind projects that are already generating electricity. The amount of production tax credits is dependent on the level of electricity output generated by each wind project, which is impacted by a variety of operating and economic parameters including transmission availability. Any incentives for IPL’s and WPL’s wind projects are expected to be utilized in determining customers’ rates. Production tax credits earned for 2009 and 2010 along with estimates of production tax credits currently expected to be earned in 2011 for these wind projects are as follows (in millions):
| | | | | | |
| | | 2009 | | 2010 | | 2011 |
Whispering Willow - East wind project (IPL) | | $1 | | $8 | | $8 - $9 |
Cedar Ridge wind project (WPL) | | 4 | | 3 | | 3 - 4 |
Bent Tree - Phase I wind project (WPL) | | – | | 1 | | 7 - 8 |
| | | | | | |
| | $5 | | $12 | | $18 - $21 |
| | | | | | |
Tax Accounting for Mixed Service Costs -In September 2010, Alliant Energy filed a request with the IRS for a change in its tax method of accounting for mixed service costs. The requested change would allow Alliant Energy to currently deduct a portion of its mixed service costs, which have historically been capitalized for tax purposes. If approved by the IRS, this proposed change could be applied retroactively to mixed service costs incurred since 1987. Alliant Energy recently completed an assessment of its eligible mixed service costs for the period from 1987 through 2009 and currently believes it will include approximately $390 million ($200 million for IPL and $190 million for WPL) of mixed service costs deductions for these years in its 2010 federal income tax return if the proposed change is approved by the IRS. These mixed service cost deductions are expected to contribute to a federal net operating loss in 2010. Alliant Energy’s federal net operating losses incurred through 2010 (including the impacts of mixed service costs deductions) are currently expected to offset future federal taxable income resulting in minimal federal cash tax payments to the IRS by Alliant Energy, IPL and WPL through 2015. In accordance with accounting rules, Alliant Energy, IPL and WPL will not reflect the impact of this proposed change to mixed service costs in its financial statements until they receive consent from the IRS for the change in tax method of accounting for mixed service costs. Refer to “Rate Matters - Recent Retail Base Rate Filings - IPL’s Iowa Retail Electric Rate Case (2009 Test Year)” for discussion of a customer cost management plan that includes IPL using cash flows realized from this project to refund to its Iowa retail customers. Alliant Energy and IPL currently expect any cash flow tax benefits from this project will be refunded to IPL’s Iowa retail customers in 2012 and 2013.
Retirement Plan Costs - Alliant Energy’s, IPL’s and WPL’s net periodic benefit costs related to their defined benefit pension and other postretirement benefits plans are currently expected to be lower in 2011 than 2010 by approximately $9 million, $5 million and $4 million, respectively. The decrease in expected net periodic benefit costs are primarily due to lower amortization of actuarial losses and higher expected returns on plan assets resulting from increases in retirement plan assets during 2010. Approximately 30% to 40% of net periodic benefit costs are allocated to capital projects each year. As a result, the decrease in net periodic benefit costs is not expected to result in a comparable decrease in other operation and maintenance expenses. Refer to Note 6(a) of the “Combined Notes to Consolidated Financial Statements” for additional details of Alliant Energy’s, IPL’s and WPL’s defined benefit pension and other postretirement benefits plans.
94
Electric Sales Projections - Alliant Energy, IPL and WPL are currently expecting modest (approximately 1% to 1.5%) increases in weather-normalized retail electric sales in 2011 compared to 2010 largely due to a slow economic recovery, low customer growth and limited new ethanol production facilities in their service territories.
Ethanol Production - Ethanol production in the U.S. experienced growth since 2002 largely due to a mandate for ethanol usage in the Energy Policy Act of 2005 and the promotion of E85, a blend of 85% ethanol and 15% gasoline, used to fuel vehicles. Ethanol production facilities in the U.S. are concentrated in the corn-growing regions in the Midwest given corn is the primary raw material used to produce ethanol. Electricity demand from new ethanol production facilities located in Alliant Energy’s, IPL’s and WPL’s utility service territories has resulted in an increase in electric sales volumes in the last decade. Demand from ethanol plants is estimated to be approximately 150 MW (approximately 125 MW in IPL’s service territory and approximately 25 MW in WPL’s service territory) in 2011. A number of previously announced plants in Alliant Energy’s, IPL’s and WPL’s service territories have not begun construction, which is reflective of a nationwide slowdown in the construction of ethanol production facilities. This slowdown has been caused by a number of factors, including changes in the price of ethanol, cost of gasoline, cost of corn, tighter access to financing and escalation of construction costs to build the production facilities. Alliant Energy, IPL and WPL are currently unable to estimate the impacts ethanol production facilities in their service territories will have on their future electric sales demand and electric margins.
Maintenance Costs for Wind Projects -Wind projects require periodic maintenance to ensure reliability of operations. IPL and WPL have entered into agreements with outside vendors to provide these services for their Whispering Willow - East and Bent Tree - Phase I wind projects. IPL and WPL currently estimate approximately $7 million to $8 million of annual maintenance expenses for each of its Whispering Willow - East and Bent Tree - Phase I wind projects after they begin generating electricity.
Incentive Compensation Plans -Alliant Energy’s total compensation package includes an incentive compensation program, which provides substantially all of Alliant Energy’s non-bargaining employees an opportunity to receive annual short-term incentive cash payments based on the achievement of specific annual operational and financial performance measures. The operational performance measures for 2011 relate to diversity, safety, customer satisfaction, service reliability and generating facilities’ availability, and the financial performance measures for 2011 relate to utility earnings per share from continuing operations and cash flows from operations generated by IPL, WPL and Corporate Services. In addition, the total compensation program for certain key employees includes long-term incentive awards issued under an equity incentive plan. Refer to “Alliant Energy’s Results of Operations - Utility Other Operation and Maintenance Expenses” for discussion of higher incentive-related compensation expenses in 2010 and Note 6(b) of Alliant Energy’s “Combined Notes to Consolidated Financial Statements” for details of long-term incentive awards. Alliant Energy, IPL and WPL are currently unable to determine what impacts these incentive compensation plans will have on their future financial condition or results of operations.
95
ITEM 7A. QUANTITATIVE AND QUALITATIVE DISCLOSURES ABOUT MARKET RISK
Quantitative and Qualitative Disclosures About Market Risk are reported under “Other Matters - Market Risk Sensitive Instruments and Positions” in MDA.
ITEM 8. FINANCIAL STATEMENTS AND SUPPLEMENTARY DATA
MANAGEMENT’S ANNUAL REPORT ON INTERNAL CONTROL OVER FINANCIAL REPORTING
The management of Alliant Energy Corporation and subsidiaries (Alliant Energy) is responsible for establishing and maintaining adequate internal control over financial reporting, as such term is defined in Rules 13a-15(f) and 15d-15(f) under the Securities Exchange Act of 1934. Alliant Energy’s internal control over financial reporting is designed to provide reasonable assurance regarding the reliability of financial reporting and the preparation of financial statements for external purposes in accordance with accounting principles generally accepted in the United States of America.
Because of the inherent limitations of internal control over financial reporting, misstatements may not be prevented or detected on a timely basis. Also, projections of any evaluation of the effectiveness of the internal control over financial reporting to future periods are subject to the risk that the controls may become inadequate because of changes in conditions, or that the degree of compliance with the policies or procedures may deteriorate.
Alliant Energy’s management assessed the effectiveness of Alliant Energy’s internal control over financial reporting as of December 31, 2010 using the criteria set forth inInternal Control - Integrated Framework issued by the Committee of Sponsoring Organizations of the Treadway Commission. Based on this assessment, Alliant Energy’s management concluded that, as of December 31, 2010, Alliant Energy’s internal control over financial reporting was effective.
Deloitte & Touche LLP, Alliant Energy’s independent registered public accounting firm, has audited Alliant Energy’s internal control over financial reporting. That report is set forth immediately prior to the report of Deloitte & Touche LLP on the financial statements included herein.
|
| /s/ William D. Harvey |
| William D. Harvey |
| Chairman and Chief Executive Officer |
|
| /s/ Thomas L. Hanson |
| Thomas L. Hanson |
| Vice President-Chief Financial Officer and Treasurer |
|
| /s/ Robert J. Durian |
| Robert J. Durian |
| Controller and Chief Accounting Officer |
February 28, 2011
96
REPORT OF INDEPENDENT REGISTERED PUBLIC ACCOUNTING FIRM
To the Board of Directors and Shareowners of Alliant Energy Corporation
Madison, Wisconsin
We have audited the internal control over financial reporting of Alliant Energy Corporation and subsidiaries (the “Company”) as of December 31, 2010, based on the criteria established inInternal Control — Integrated Frameworkissued by the Committee of Sponsoring Organizations of the Treadway Commission. The Company’s management is responsible for maintaining effective internal control over financial reporting and for its assessment of the effectiveness of internal control over financial reporting, included in the accompanying Management’s Annual Report on Internal Control over Financial Reporting. Our responsibility is to express an opinion on the Company’s internal control over financial reporting based on our audit.
We conducted our audit in accordance with the standards of the Public Company Accounting Oversight Board (United States). Those standards require that we plan and perform the audit to obtain reasonable assurance about whether effective internal control over financial reporting was maintained in all material respects. Our audit included obtaining an understanding of internal control over financial reporting, assessing the risk that a material weakness exists, testing and evaluating the design and operating effectiveness of internal control based on the assessed risk, and performing such other procedures as we considered necessary in the circumstances. We believe that our audit provides a reasonable basis for our opinion.
A company’s internal control over financial reporting is a process designed by, or under the supervision of, the company’s principal executive and principal financial officers, or persons performing similar functions, and effected by the company’s board of directors, management, and other personnel to provide reasonable assurance regarding the reliability of financial reporting and the preparation of financial statements for external purposes in accordance with generally accepted accounting principles. A company’s internal control over financial reporting includes those policies and procedures that (1) pertain to the maintenance of records that, in reasonable detail, accurately and fairly reflect the transactions and dispositions of the assets of the company; (2) provide reasonable assurance that transactions are recorded as necessary to permit preparation of financial statements in accordance with generally accepted accounting principles, and that receipts and expenditures of the company are being made only in accordance with authorizations of management and directors of the company; and (3) provide reasonable assurance regarding prevention or timely detection of unauthorized acquisition, use, or disposition of the company’s assets that could have a material effect on the financial statements.
Because of the inherent limitations of internal control over financial reporting, including the possibility of collusion or improper management override of controls, material misstatements due to error or fraud may not be prevented or detected on a timely basis. Also, projections of any evaluation of the effectiveness of the internal control over financial reporting to future periods are subject to the risk that the controls may become inadequate because of changes in conditions, or that the degree of compliance with the policies or procedures may deteriorate.
In our opinion, the Company maintained, in all material respects, effective internal control over financial reporting as of December 31, 2010, based on the criteria established inInternal Control — Integrated Frameworkissued by the Committee of Sponsoring Organizations of the Treadway Commission.
We have also audited, in accordance with the standards of the Public Company Accounting Oversight Board (United States), the consolidated financial statements and financial statement schedules as of and for the year ended December 31, 2010 of the Company and our report dated February 28, 2011, expressed an unqualified opinion on those financial statements and financial statement schedules.
/s/ DELOITTE & TOUCHE LLP
DELOITTE & TOUCHE LLP
Milwaukee, Wisconsin
February 28, 2011
97
REPORT OF INDEPENDENT REGISTERED PUBLIC ACCOUNTING FIRM
To the Board of Directors and Shareowners of Alliant Energy Corporation
Madison, Wisconsin
We have audited the accompanying consolidated balance sheets of Alliant Energy Corporation and subsidiaries (the “Company”) as of December 31, 2010 and 2009, and the related consolidated statements of income, common equity, comprehensive income, and cash flows for each of the three years in the period ended December 31, 2010. Our audits also included the financial statement schedules listed in the Index at Item 15. These financial statements and financial statement schedules are the responsibility of the Company’s management. Our responsibility is to express an opinion on the financial statements and financial statement schedules based on our audits.
We conducted our audits in accordance with the standards of the Public Company Accounting Oversight Board (United States). Those standards require that we plan and perform the audit to obtain reasonable assurance about whether the financial statements are free of material misstatement. An audit includes examining, on a test basis, evidence supporting the amounts and disclosures in the financial statements. An audit also includes assessing the accounting principles used and significant estimates made by management, as well as evaluating the overall financial statement presentation. We believe that our audits provide a reasonable basis for our opinion.
In our opinion, such consolidated financial statements present fairly, in all material respects, the financial position of the Company as of December 31, 2010 and 2009, and the results of its operations and its cash flows for each of the three years in the period ended December 31, 2010, in conformity with accounting principles generally accepted in the United States of America. Also, in our opinion, such financial statement schedules, when considered in relation to the basic consolidated financial statements taken as a whole, present fairly, in all material respects, the information set forth therein.
We have also audited, in accordance with the standards of the Public Company Accounting Oversight Board (United States), the Company’s internal control over financial reporting as of December 31, 2010, based on the criteria established inInternal Control—Integrated Framework issued by the Committee of Sponsoring Organizations of the Treadway Commission and our report dated February 28, 2011 expressed an unqualified opinion on the Company’s internal control over financial reporting.
|
| /s/ DELOITTE & TOUCHE LLP |
| DELOITTE & TOUCHE LLP |
|
| Milwaukee, Wisconsin |
| February 28, 2011 |
98
ALLIANT ENERGY CORPORATION
CONSOLIDATED STATEMENTS OF INCOME
| | | | | | | | | | | | |
| | | Year Ended December 31, | |
| | | 2010 | | | 2009 | | | 2008 | |
| | |
| | | (dollars in millions, except per share amounts) | |
Operating revenues: | | | | | | | | | | | | |
Utility: | | | | | | | | | | | | |
Electric | | | $2,674.2 | | | | $2,475.9 | | | | $2,411.3 | |
Gas | | | 480.6 | | | | 525.3 | | | | 710.4 | |
Other | | | 64.6 | | | | 92.9 | | | | 102.1 | |
Non-regulated | | | 196.7 | | | | 333.2 | | | | 445.3 | |
| | | | | | | | | | | | |
Total operating revenues | | | 3,416.1 | | | | 3,427.3 | | | | 3,669.1 | |
| | | | | | | | | | | | |
| | |
Operating expenses: | | | | | | | | | | | | |
Utility: | | | | | | | | | | | | |
Electric production fuel and energy purchases | | | 819.2 | | | | 891.4 | | | | 843.1 | |
Purchased electric capacity | | | 279.7 | | | | 281.1 | | | | 285.7 | |
Electric transmission service | | | 279.5 | | | | 225.4 | | | | 182.2 | |
Cost of gas sold | | | 304.0 | | | | 347.9 | | | | 519.6 | |
Other operation and maintenance | | | 617.2 | | | | 599.7 | | | | 620.4 | |
Non-regulated operation and maintenance | | | 169.5 | | | | 311.9 | | | | 388.7 | |
Depreciation and amortization | | | 291.3 | | | | 273.6 | | | | 239.7 | |
Taxes other than income taxes | | | 99.6 | | | | 100.1 | | | | 102.7 | |
| | | | | | | | | | | | |
Total operating expenses | | | 2,860.0 | | | | 3,031.1 | | | | 3,182.1 | |
| | | | | | | | | | | | |
| | |
Operating income | | | 556.1 | | | | 396.2 | | | | 487.0 | |
| | | | | | | | | | | | |
| | |
Interest expense and other: | | | | | | | | | | | | |
Interest expense | | | 163.0 | | | | 154.9 | | | | 125.8 | |
Loss on early extinguishment of debt | | | - | | | | 203.0 | | | | - | |
Equity income from unconsolidated investments, net | | | (38.1) | | | | (36.6) | | | | (33.2) | |
Allowance for funds used during construction | | | (18.0) | | | | (39.7) | | | | (24.7) | |
Interest income and other | | | (4.0) | | | | (4.9) | | | | (18.6) | |
| | | | | | | | | | | | |
Total interest expense and other | | | 102.9 | | | | 276.7 | | | | 49.3 | |
| | | | | | | | | | | | |
| | |
Income from continuing operations before income taxes | | | 453.2 | | | | 119.5 | | | | 437.7 | |
| | | | | | | | | | | | |
| | |
Income tax expense (benefit) | | | 145.2 | | | | (9.3) | | | | 139.6 | |
| | | | | | | | | | | | |
| | |
Income from continuing operations, net of tax | | | 308.0 | | | | 128.8 | | | | 298.1 | |
| | | | | | | | | | | | |
| | |
Income (loss) from discontinued operations, net of tax | | | (1.7) | | | | 0.9 | | | | 8.6 | |
| | | | | | | | | | | | |
| | |
Net income | | | 306.3 | | | | 129.7 | | | | 306.7 | |
| | | | | | | | | | | | |
| | |
Preferred dividend requirements of subsidiaries | | | 18.7 | | | | 18.7 | | | | 18.7 | |
| | | | | | | | | | | | |
| | |
Net income attributable to Alliant Energy common shareowners | | | $287.6 | | | | $111.0 | | | | $288.0 | |
| | | | | | | | | | | | |
| | |
Weighted average number of common shares outstanding (basic) (000s) | | | 110,442 | | | | 110,268 | | | | 110,170 | |
| | | | | | | | | | | | |
| | |
Earnings per weighted average common share attributable to Alliant Energy common shareowners (basic): | | | | | | | | | | | | |
Income from continuing operations, net of tax | | | $2.62 | | | | $1.00 | | | | $2.53 | |
Income (loss) from discontinued operations, net of tax | | | (0.02) | | | | 0.01 | | | | 0.08 | |
| | | | | | | | | | | | |
Net income | | | $2.60 | | | | $1.01 | | | | $2.61 | |
| | | | | | | | | | | | |
| | |
Weighted average number of common shares outstanding (diluted) (000s) | | | 110,521 | | | | 110,352 | | | | 110,308 | |
| | | | | | | | | | | | |
| | |
Earnings per weighted average common share attributable to Alliant Energy common shareowners (diluted): | | | | | | | | | | | | |
Income from continuing operations, net of tax | | | $2.62 | | | | $1.00 | | | | $2.53 | |
Income (loss) from discontinued operations, net of tax | | | (0.02) | | | | 0.01 | | | | 0.08 | |
| | | | | | | | | | | | |
Net income | | | $2.60 | | | | $1.01 | | | | $2.61 | |
| | | | | | | | | | | | |
| | |
Amounts attributable to Alliant Energy common shareowners: | | | | | | | | | | | | |
Income from continuing operations, net of tax | | | $289.3 | | | | $110.1 | | | | $279.4 | |
Income (loss) from discontinued operations, net of tax | | | (1.7) | | | | 0.9 | | | | 8.6 | |
| | | | | | | | | | | | |
Net income attributable to Alliant Energy common shareowners | | | $287.6 | | | | $111.0 | | | | $288.0 | |
| | | | | | | | | | | | |
| | |
Dividends declared per common share | | | $1.58 | | | | $1.50 | | | | $1.40 | |
| | | | | | | | | | | | |
| | |
The accompanying Combined Notes to Consolidated Financial Statements are an integral part of these statements.
99
ALLIANT ENERGY CORPORATION
CONSOLIDATED BALANCE SHEETS
| | | | | | | | | | |
| | | December 31, | |
| ASSETS | | 2010 | | | | | 2009 | |
| | | (in millions) | |
Property, plant and equipment: | | | | | | | | | | |
Utility: | | | | | | | | | | |
Electric plant in service | | | $7,676.8 | | | | | | $7,037.7 | |
Gas plant in service | | | 830.1 | | | | | | 798.1 | |
Other plant in service | | | 499.2 | | | | | | 522.0 | |
Accumulated depreciation (accum. depr.) | | | (2,982.2) | | | | | | (2,909.5) | |
| | | | | | | | | | |
Net plant | | | 6,023.9 | | | | | | 5,448.3 | |
Construction work in progress: | | | | | | | | | | |
Bent Tree - Phase I wind project (Wisconsin Power and Light Company) | | | 154.5 | | | | | | 165.5 | |
Lansing Generating Station Unit 4 emission controls (Interstate Power and Light Company) | | | - | | | | | | 137.0 | |
Other | | | 155.5 | | | | | | 101.5 | |
Other, less accum. depr. of $6.4 and $5.8 | | | 126.0 | | | | | | 67.3 | |
| | | | | | | | | | |
Total utility | | | 6,459.9 | | | | | | 5,919.6 | |
| | | | | | | | | | |
Non-regulated and other: | | | | | | | | | | |
Non-regulated Generation, less accum. depr. of $22.4 and $18.4 | | | 119.0 | | | | | | 123.0 | |
Alliant Energy Corporate Services, Inc. and other, less accum. depr. of $173.6 and $160.4 | | | 151.7 | | | | | | 150.3 | |
| | | | | | | | | | |
Total non-regulated and other | | | 270.7 | | | | | | 273.3 | |
| | | | | | | | | | |
Total property, plant and equipment | | | 6,730.6 | | | | | | 6,192.9 | |
| | | | | | | | | | |
| | |
| | | |
Current assets: | | | | | | | | | | |
Cash and cash equivalents | | | 159.3 | | | | | | 175.3 | |
Accounts receivable: | | | | | | | | | | |
Customer, less allowance for doubtful accounts | | | 120.5 | | | | | | 246.9 | |
Unbilled utility revenues | | | 82.3 | | | | | | 169.0 | |
Other, less allowance for doubtful accounts | | | 213.1 | | | | | | 86.0 | |
Income tax refunds receivable | | | 39.3 | | | | | | 169.7 | |
Production fuel, at weighted average cost | | | 122.8 | | | | | | 140.2 | |
Materials and supplies, at weighted average cost | | | 61.6 | | | | | | 53.5 | |
Gas stored underground, at weighted average cost | | | 48.6 | | | | | | 44.8 | |
Regulatory assets | | | 109.0 | | | | | | 154.4 | |
Derivative assets | | | 19.1 | | | | | | 23.7 | |
Assets held for sale | | | 5.7 | | | | | | 14.4 | |
Other | | | 111.4 | | | | | | 112.1 | |
| | | | | | | | | | |
Total current assets | | | 1,092.7 | | | | | | 1,390.0 | |
| | | | | | | | | | |
| | |
| | | |
Investments: | | | | | | | | | | |
Investment in American Transmission Company LLC | | | 227.9 | | | | | | 218.6 | |
Other | | | 61.3 | | | | | | 62.9 | |
| | | | | | | | | | |
Total investments | | | 289.2 | | | | | | 281.5 | |
| | | | | | | | | | |
| | |
| | | |
Other assets: | | | | | | | | | | |
Regulatory assets | | | 1,032.7 | | | | | | 999.3 | |
Deferred charges and other | | | 137.7 | | | | | | 172.3 | |
| | | | | | | | | | |
Total other assets | | | 1,170.4 | | | | | | 1,171.6 | |
| | | | | | | | | | |
| | |
| | | |
Total assets | | | $9,282.9 | | | | | | $9,036.0 | |
| | | | | | | | | | |
| | |
The accompanying Combined Notes to Consolidated Financial Statements are an integral part of these statements.
100
ALLIANT ENERGY CORPORATION
CONSOLIDATED BALANCE SHEETS (Continued)
| | | | | | | | |
| | | December 31, | |
| CAPITALIZATION AND LIABILITIES | | 2010 | | | 2009 | |
| | |
| | | (in millions, except per
share and share amounts) | |
Capitalization: | | | | | | | | |
Alliant Energy Corporation common equity: | | | | | | | | |
Common stock - $0.01 par value - 240,000,000 shares authorized;
110,893,901 and 110,656,498 shares outstanding | | | $1.1 | | | | $1.1 | |
Additional paid-in capital | | | 1,506.8 | | | | 1,499.1 | |
Retained earnings | | | 1,394.7 | | | | 1,281.7 | |
Accumulated other comprehensive loss | | | (1.4) | | | | (1.4) | |
Shares in deferred compensation trust - 246,301 and 262,161 shares
at a weighted average cost of $30.75 and $30.25 per share | | | (7.6) | | | | (7.9) | |
| | | | | | | | |
Total Alliant Energy Corporation common equity | | | 2,893.6 | | | | 2,772.6 | |
Cumulative preferred stock of Interstate Power and Light Company | | | 183.8 | | | | 183.8 | |
Noncontrolling interest | | | 2.0 | | | | 2.1 | |
| | | | | | | | |
Total equity | | | 3,079.4 | | | | 2,958.5 | |
Cumulative preferred stock of Wisconsin Power and Light Company | | | 60.0 | | | | 60.0 | |
Long-term debt, net (excluding current portion) | | | 2,703.4 | | | | 2,404.5 | |
| | | | | | | | |
Total capitalization | | | 5,842.8 | | | | 5,423.0 | |
| | | | | | | | |
| | |
Current liabilities: | | | | | | | | |
Current maturities of long-term debt | | | 1.3 | | | | 101.5 | |
Commercial paper | | | 47.4 | | | | 190.0 | |
Accounts payable | | | 336.3 | | | | 331.9 | |
Regulatory liabilities | | | 173.7 | | | | 102.7 | |
Accrued taxes | | | 45.3 | | | | 77.7 | |
Accrued interest | | | 46.7 | | | | 51.1 | |
Derivative liabilities | | | 55.3 | | | | 100.5 | |
Liabilities held for sale | | | 0.6 | | | | 3.8 | |
Other | | | 160.1 | | | | 117.4 | |
| | | | | | | | |
Total current liabilities | | | 866.7 | | | | 1,076.6 | |
| | | | | | | | |
| | |
Other long-term liabilities and deferred credits: | | | | | | | | |
Deferred income taxes | | | 1,434.3 | | | | 1,184.3 | |
Regulatory liabilities | | | 626.4 | | | | 734.1 | |
Pension and other benefit obligations | | | 303.8 | | | | 323.9 | |
Other | | | 208.9 | | | | 294.1 | |
| | | | | | | | |
Total long-term liabilities and deferred credits | | | 2,573.4 | | | | 2,536.4 | |
| | | | | | | | |
| | |
Commitments and contingencies (Note 12) | | | | | | | | |
| | |
Total capitalization and liabilities | | | $9,282.9 | | | | $9,036.0 | |
| | | | | | | | |
| | |
The accompanying Combined Notes to Consolidated Financial Statements are an integral part of these statements.
101
ALLIANT ENERGY CORPORATION
CONSOLIDATED STATEMENTS OF CASH FLOWS
| | | | | | | | | | | | |
| | | Year Ended December 31, | |
| | | 2010 | | | 2009 | | | 2008 | |
| | |
| | | (in millions) | |
Cash flows from operating activities: | | | | | | | | | | | | |
Net income | | | $306.3 | | | | $129.7 | | | | $306.7 | |
Adjustments to reconcile net income to net cash flows from operating activities: | | | | | | | | | | | | |
Depreciation and amortization | | | 292.3 | | | | 275.6 | | | | 241.9 | |
Other amortizations | | | 51.8 | | | | 42.1 | | | | 44.5 | |
Deferred tax expense and investment tax credits | | | 216.6 | | | | 94.3 | | | | 73.5 | |
Loss on early extinguishment of debt | | | - | | | | 203.0 | | | | - | |
Equity income from unconsolidated investments, net | | | (38.1) | | | | (36.6) | | | | (33.2) | |
Distributions from equity method investments | | | 32.2 | | | | 29.9 | | | | 27.8 | |
Equity component of allowance for funds used during construction | | | (11.2) | | | | (28.2) | | | | (17.2) | |
Non-cash valuation and regulated-related charges | | | 38.0 | | | | 20.4 | | | | 12.5 | |
Other | | | (4.7) | | | | (5.7) | | | | 3.6 | |
Other changes in assets and liabilities: | | | | | | | | | | | | |
Accounts receivable | | | 16.3 | | | | 73.5 | | | | (140.4) | |
Sales of accounts receivable | | | 65.0 | | | | (25.0) | | | | (75.0) | |
Income tax refunds receivable | | | 130.4 | | | | (102.3) | | | | (54.2) | |
Production fuel | | | 17.4 | | | | (28.5) | | | | (19.5) | |
Gas stored underground | | | (3.8) | | | | 30.2 | | | | (4.5) | |
Regulatory assets | | | (20.8) | | | | (163.9) | | | | (507.6) | |
Prepaid pension costs | | | - | | | | - | | | | 65.5 | |
Current deferred tax assets | | | 23.7 | | | | (19.8) | | | | (25.8) | |
Accounts payable | | | (0.4) | | | | (37.6) | | | | 19.8 | |
Regulatory liabilities | | | 8.4 | | | | 136.7 | | | | (11.1) | |
Accrued taxes | | | (32.4) | | | | 25.8 | | | | (22.0) | |
Derivative liabilities | | | (52.0) | | | | 16.3 | | | | 77.2 | |
Deferred income taxes | | | 28.9 | | | | 118.9 | | | | 74.6 | |
Non-current taxes payable | | | (66.6) | | | | 60.7 | | | | (15.6) | |
Pension and other benefit obligations | | | (20.1) | | | | (190.0) | | | | 311.3 | |
Other | | | 7.7 | | | | 37.6 | | | | 5.4 | |
| | | | | | | | | | | | |
Net cash flows from operating activities | | | 984.9 | | | | 657.1 | | | | 338.2 | |
| | | | | | | | | | | | |
| | | |
Cash flows used for investing activities: | | | | | | | | | | | | |
Construction and acquisition expenditures: | | | | | | | | | | | | |
Utility business | | | (833.3) | | | | (1,149.6) | | | | (842.4) | |
Alliant Energy Corporate Services, Inc. and non-regulated businesses | | | (33.6) | | | | (53.0) | | | | (36.6) | |
Advances for customer energy efficiency projects | | | (17.1) | | | | (31.0) | | | | (38.3) | |
Collections of advances for customer energy efficiency projects | | | 34.2 | | | | 63.6 | | | | 38.3 | |
Insurance proceeds received for property damages | | | - | | | | 37.7 | | | | 18.1 | |
Other | | | (16.7) | | | | (16.6) | | | | (5.2) | |
| | | | | | | | | | | | |
Net cash flows used for investing activities | | | (866.5) | | | | (1,148.9) | | | | (866.1) | |
| | | | | | | | | | | | |
| | | |
Cash flows from (used for) financing activities: | | | | | | | | | | | | |
Common stock dividends | | | (174.6) | | | | (165.5) | | | | (154.3) | |
Preferred dividends paid by subsidiaries | | | (18.7) | | | | (18.7) | | | | (18.7) | |
Proceeds from issuance of long-term debt | | | 500.0 | | | | 800.2 | | | | 500.0 | |
Payments to retire long-term debt | | | (307.8) | | | | (377.9) | | | | (154.3) | |
Net change in short-term borrowings | | | (142.6) | | | | 103.9 | | | | (25.2) | |
Other | | | 9.3 | | | | (21.8) | | | | (18.3) | |
| | | | | | | | | | | | |
Net cash flows from (used for) financing activities | | | (134.4) | | | | 320.2 | | | | 129.2 | |
| | | | | | | | | | | | |
| | | |
Net decrease in cash and cash equivalents | | | (16.0) | | | | (171.6) | | | | (398.7) | |
Cash and cash equivalents at beginning of period | | | 175.3 | | | | 346.9 | | | | 745.6 | |
| | | | | | | | | | | | |
Cash and cash equivalents at end of period | | | $159.3 | | | | $175.3 | | | | $346.9 | |
| | | | | | | | | | | | |
| | |
| | | |
Supplemental cash flows information: | | | | | | | | | | | | |
Cash paid (refunded) during the period for: | | | | | | | | | | | | |
Interest, net of capitalized interest | | | $165.5 | | | | $142.4 | | | | $130.4 | |
| | | | | | | | | | | | |
Income taxes, net of refunds | | | ($116.2) | | | | ($140.7) | | | | $131.0 | |
| | | | | | | | | | | | |
Significant noncash investing and financing activities: | | | | | | | | | | | | |
Accrued capital expenditures | | | $75.0 | | | | $66.7 | | | | $118.9 | |
| | | | | | | | | | | | |
| | |
The accompanying Combined Notes to Consolidated Financial Statements are an integral part of these statements.
102
ALLIANT ENERGY CORPORATION
CONSOLIDATED STATEMENTS OF COMMON EQUITY
| | | | | | | | | | | | | | | | | | | | | | | | |
| | | Common
Stock | | | Additional
Paid-In
Capital | | | Retained
Earnings | | | Accumulated
Other
Comprehensive
Income (Loss) | | | Shares in
Deferred
Compensation
Trust | | | Total
Alliant Energy
Common
Equity | |
| | |
| | | (in millions) | |
2008: | | | | | | | | | | | | | | | | | | | | | | | | |
Beginning balance | | | $1.1 | | | | $1,483.4 | | | | $1,205.2 | | | | $0.2 | | | | ($8.7) | | | | $2,681.2 | |
Net income attributable to Alliant Energy common shareowners | | | | | | | | | | | 288.0 | | | | | | | | | | | | 288.0 | |
Common stock dividends ($1.40 per share) | | | | | | | | | | | (154.3) | | | | | | | | | | | | (154.3) | |
Adoption of new measurement date for retirement plans, net of tax of ($2.6) (Note 6(a)) | | | | | | | | | | | (2.7) | | | | | | | | | | | | (2.7) | |
Common stock issued, repurchased and other, net | | | | | | | 11.5 | | | | | | | | | | | | 1.4 | | | | 12.9 | |
Other comprehensive loss, net of tax | | | | | | | | | | | | | | | (1.6) | | | | | | | | (1.6) | |
| | | | | | | | | | | | | | | | | | | | | | | | |
Ending balance | | | 1.1 | | | | 1,494.9 | | | | 1,336.2 | | | | (1.4) | | | | (7.3) | | | | 2,823.5 | |
| | | | | | |
2009: | | | | | | | | | | | | | | | | | | | | | | | | |
Net income attributable to Alliant Energy common shareowners | | | | | | | | | | | 111.0 | | | | | | | | | | | | 111.0 | |
Common stock dividends ($1.50 per share) | | | | | | | | | | | (165.5) | | | | | | | | | | | | (165.5) | |
Common stock issued, repurchased and other, net | | | | | | | 4.2 | | | | | | | | | | | | (0.6) | | | | 3.6 | |
| | | | | | | | | | | | | | | | | | | | | | | | |
Ending balance | | | 1.1 | | | | 1,499.1 | | | | 1,281.7 | | | | (1.4) | | | | (7.9) | | | | 2,772.6 | |
| | | | | | |
2010: | | | | | | | | | | | | | | | | | | | | | | | | |
Net income attributable to Alliant Energy common shareowners | | | | | | | | | | | 287.6 | | | | | | | | | | | | 287.6 | |
Common stock dividends ($1.58 per share) | | | | | | | | | | | (174.6) | | | | | | | | | | | | (174.6) | |
Common stock issued, repurchased and other, net | | | | | | | 7.7 | | | | | | | | | | | | 0.3 | | | | 8.0 | |
| | | | | | | | | | | | | | | | | | | | | | | | |
Ending balance | | | $1.1 | | | | $1,506.8 | | | | $1,394.7 | | | | ($1.4) | | | | ($7.6) | | | | $2,893.6 | |
| | | | | | | | | | | | | | | | | | | | | | | | |
| |
| | |
ALLIANT ENERGY CORPORATION
CONSOLIDATED STATEMENTS OF COMPREHENSIVE INCOME
| | | | | | | | | | | | |
| | | Year Ended December 31, | |
| | | 2010 | | | 2009 | | | 2008 | |
| | |
| | | (in millions) | |
| | | |
| Net income | | | $306.3 | | | | $129.7 | | | | $306.7 | |
| Other comprehensive income (loss), net of tax: | | | | | | | | | | | | |
Unrealized holding gains (losses) on securities, net of tax of ($0.3), $0.3 and ($0.6) | | | (0.4) | | | | 0.5 | | | | (1.0) | |
Less: reclassification adjustment for gains (losses) included in net income, net of tax of $0.1, $0.1 and ($0.2) | | | 0.2 | | | | 0.1 | | | | (0.3) | |
| | | | | | | | | | | | |
Net unrealized gains (losses) on securities, net of tax | | | (0.6) | | | | 0.4 | | | | (0.7) | |
Pension and other postretirement benefits plans adjustments, net of tax of $0.4, ($0.2) and ($0.6) | | | 0.6 | | | | (0.4) | | | | (0.9) | |
| | | | | | | | | | | | |
| Total other comprehensive loss | | | - | | | | - | | | | (1.6) | |
| | | | | | | | | | | | |
| Comprehensive income | | | 306.3 | | | | 129.7 | | | | 305.1 | |
| Preferred dividend requirements of subsidiaries | | | (18.7) | | | | (18.7) | | | | (18.7) | |
| | | | | | | | | | | | |
| Comprehensive income attributable to Alliant Energy common shareowners | | | $287.6 | | | | $111.0 | | | | $286.4 | |
| | | | | | | | | | | | |
| | |
The accompanying Combined Notes to Consolidated Financial Statements are an integral part of these statements.
103
MANAGEMENT’S ANNUAL REPORT ON INTERNAL CONTROL OVER FINANCIAL REPORTING
The management of Interstate Power and Light Company and subsidiary (IPL) is responsible for establishing and maintaining adequate internal control over financial reporting, as such term is defined in Rules 13a-15(f) and 15d-15(f) under the Securities Exchange Act of 1934. IPL’s internal control over financial reporting is designed to provide reasonable assurance regarding the reliability of financial reporting and the preparation of financial statements for external purposes in accordance with accounting principles generally accepted in the United States of America.
Because of the inherent limitations of internal control over financial reporting, misstatements may not be prevented or detected on a timely basis. Also, projections of any evaluation of the effectiveness of the internal control over financial reporting to future periods are subject to the risk that the controls may become inadequate because of changes in conditions, or that the degree of compliance with the policies or procedures may deteriorate.
IPL’s management assessed the effectiveness of IPL’s internal control over financial reporting as of December 31, 2010 using the criteria set forth inInternal Control - Integrated Framework issued by the Committee of Sponsoring Organizations of the Treadway Commission. Based on this assessment, IPL’s management concluded that, as of December 31, 2010, IPL’s internal control over financial reporting was effective.
|
| /s/ William D. Harvey |
| William D. Harvey |
| Chairman and Chief Executive Officer |
|
| /s/ Thomas L. Hanson |
| Thomas L. Hanson |
| Vice President-Chief Financial Officer and Treasurer |
|
| /s/ Robert J. Durian |
| Robert J. Durian |
| Controller and Chief Accounting Officer |
|
| February 28, 2011 |
104
REPORT OF INDEPENDENT REGISTERED PUBLIC ACCOUNTING FIRM
To the Board of Directors and Shareowners of Interstate Power and Light Company
Cedar Rapids, Iowa
We have audited the accompanying consolidated balance sheets of Interstate Power and Light Company and subsidiary (the “Company”) as of December 31, 2010 and 2009, and the related consolidated statements of income, common equity, and cash flows for each of the three years in the period ended December 31, 2010. Our audits also included the financial statement schedules listed in the Index at Item 15. These financial statements and financial statement schedules are the responsibility of the Company’s management. Our responsibility is to express an opinion on the financial statements and financial statement schedules based on our audits.
We conducted our audits in accordance with the standards of the Public Company Accounting Oversight Board (United States). Those standards require that we plan and perform the audit to obtain reasonable assurance about whether the financial statements are free of material misstatement. The Company is not required to have, nor were we engaged to perform, an audit of its internal control over financial reporting. Our audits included consideration of internal control over financial reporting as a basis for designing audit procedures that are appropriate in the circumstances, but not for the purpose of expressing an opinion on the effectiveness of the Company’s internal control over financial reporting. Accordingly, we express no such opinion. An audit also includes examining, on a test basis, evidence supporting the amounts and disclosures in the financial statements, assessing the accounting principles used and significant estimates made by management, as well as evaluating the overall financial statement presentation. We believe that our audits provide a reasonable basis for our opinion.
In our opinion, such consolidated financial statements present fairly, in all material respects, the financial position of the Company as of December 31, 2010 and 2009, and the results of its operations and its cash flows for each of the three years in the period ended December 31, 2010, in conformity with accounting principles generally accepted in the United States of America. Also, in our opinion, such financial statement schedules, when considered in relation to the basic consolidated financial statements taken as a whole, present fairly, in all material respects, the information set forth therein.
|
| /s/ DELOITTE & TOUCHE LLP |
| DELOITTE & TOUCHE LLP |
|
| Milwaukee, Wisconsin |
| February 28, 2011 |
105
INTERSTATE POWER AND LIGHT COMPANY
CONSOLIDATED STATEMENTS OF INCOME
| | | | | | | | | | | | |
| | | Year Ended December 31, | |
| | | 2010 | | | 2009 | | | 2008 | |
| | | (in millions) | |
| | | |
Operating revenues: | | | | | | | | | | | | |
Electric utility | | | $1,464.3 | | | | $1,315.6 | | | | $1,258.3 | |
Gas utility | | | 274.3 | | | | 308.8 | | | | 410.4 | |
Steam and other | | | 57.2 | | | | 83.6 | | | | 89.3 | |
| | | | | | | | | | | | |
Total operating revenues | | | 1,795.8 | | | | 1,708.0 | | | | 1,758.0 | |
| | | | | | | | | | | | |
| | | |
| | | | | | | | | | | | | |
| | | |
Operating expenses: | | | | | | | | | | | | |
Electric production fuel and energy purchases | | | 418.0 | | | | 440.1 | | | | 408.9 | |
Purchased electric capacity | | | 145.0 | | | | 136.5 | | | | 140.6 | |
Electric transmission service | | | 179.1 | | | | 131.2 | | | | 89.0 | |
Cost of gas sold | | | 178.7 | | | | 209.8 | | | | 306.0 | |
Other operation and maintenance | | | 384.5 | | | | 365.4 | | | | 388.1 | |
Depreciation and amortization | | | 177.0 | | | | 152.8 | | | | 131.3 | |
Taxes other than income taxes | | | 51.6 | | | | 50.5 | | | | 54.4 | |
| | | | | | | | | | | | |
Total operating expenses | | | 1,533.9 | | | | 1,486.3 | | | | 1,518.3 | |
| | | | | | | | | | | | |
| | | |
| | | | | | | | | | | | | |
| | | |
Operating income | | | 261.9 | | | | 221.7 | | | | 239.7 | |
| | | | | | | | | | | | |
| | | |
| | | | | | | | | | | | | |
| | | |
Interest expense and other: | | | | | | | | | | | | |
Interest expense | | | 82.2 | | | | 76.5 | | | | 61.9 | |
Allowance for funds used during construction | | | (5.5) | | | | (34.0) | | | | (15.1) | |
Interest income and other | | | (0.5) | | | | (0.8) | | | | (1.3) | |
| | | | | | | | | | | | |
Total interest expense and other | | | 76.2 | | | | 41.7 | | | | 45.5 | |
| | | | | | | | | | | | |
| | | |
| | | | | | | | | | | | | |
| | | |
Income before income taxes | | | 185.7 | | | | 180.0 | | | | 194.2 | |
| | | | | | | | | | | | |
| | | |
| | | | | | | | | | | | | |
| | | |
Income taxes | | | 42.3 | | | | 27.0 | | | | 52.6 | |
| | | | | | | | | | | | |
| | | |
| | | | | | | | | | | | | |
| | | |
Net income | | | 143.4 | | | | 153.0 | | | | 141.6 | |
| | | | | | | | | | | | |
| | | |
| | | | | | | | | | | | | |
| | | |
Preferred dividend requirements | | | 15.4 | | | | 15.4 | | | | 15.4 | |
| | | | | | | | | | | | |
| | | |
| | | | | | | | | | | | | |
| | | |
Earnings available for common stock | | | $128.0 | | | | $137.6 | | | | $126.2 | |
| | | | | | | | | | | | |
| | | |
| | | | | | | | | | | | | |
Earnings per share data is not disclosed given Alliant Energy Corporation is the sole shareowner of all shares of IPL's common stock outstanding during the periods presented.
The accompanying Combined Notes to Consolidated Financial Statements are an integral part of these statements.
106
INTERSTATE POWER AND LIGHT COMPANY
CONSOLIDATED BALANCE SHEETS
| | | | | | | | |
| | | December 31, | |
| ASSETS | | 2010 | | | 2009 | |
| | | (in millions) | |
Property, plant and equipment: | | | | | | | | |
Electric plant in service | | | $4,562.2 | | | | $4,311.2 | |
Gas plant in service | | | 418.7 | | | | 404.3 | |
Steam plant in service | | | 34.9 | | | | 50.4 | |
Other plant in service | | | 245.3 | | | | 251.8 | |
Accumulated depreciation | | | (1,738.4) | | | | (1,723.7) | |
| | | | | | | | |
Net plant | | | 3,522.7 | | | | 3,294.0 | |
Construction work in progress: | | | | | | | | |
Lansing Generating Station Unit 4 emission controls | | | - | | | | 137.0 | |
Other | | | 74.5 | | | | 62.1 | |
Other, less accumulated depreciation of $4.2 for both periods | | | 106.0 | | | | 46.3 | |
| | | | | | | | |
Total property, plant and equipment | | | 3,703.2 | | | | 3,539.4 | |
| | | | | | | | |
| | |
| | | | | | | | | |
| | |
Current assets: | | | | | | | | |
Cash and cash equivalents | | | 5.7 | | | | 0.4 | |
Accounts receivable: | | | | | | | | |
Customer, less allowance for doubtful accounts | | | - | | | | 123.3 | |
Unbilled utility revenues | | | - | | | | 82.3 | |
Other, less allowance for doubtful accounts | | | 174.1 | | | | 39.3 | |
Income tax refunds receivable | | | 19.1 | | | | 103.4 | |
Production fuel, at weighted average cost | | | 80.1 | | | | 101.1 | |
Materials and supplies, at weighted average cost | | | 33.5 | | | | 29.1 | |
Gas stored underground, at weighted average cost | | | 21.8 | | | | 17.4 | |
Regulatory assets | | | 59.0 | | | | 75.8 | |
Derivative assets | | | 12.6 | | | | 12.5 | |
Other | | | 22.3 | | | | 14.2 | |
| | | | | | | | |
Total current assets | | | 428.2 | | | | 598.8 | |
| | | | | | | | |
| | |
| | | | | | | | | |
| | |
Investments | | | 16.4 | | | | 15.6 | |
| | | | | | | | |
| | |
| | | | | | | | | |
| | |
Other assets: | | | | | | | | |
Regulatory assets | | | 740.6 | | | | 668.0 | |
Deferred charges and other | | | 49.2 | | | | 70.4 | |
| | | | | | | | |
Total other assets | | | 789.8 | | | | 738.4 | |
| | | | | | | | |
| | |
| | | | | | | | | |
| | |
Total assets | | | $4,937.6 | | | | $4,892.2 | |
| | | | | | | | |
| | |
| | | | | | | | | |
The accompanying Combined Notes to Consolidated Financial Statements are an integral part of these statements.
107
INTERSTATE POWER AND LIGHT COMPANY
CONSOLIDATED BALANCE SHEETS (Continued)
| | | | | | | | |
| | | December 31, | |
| CAPITALIZATION AND LIABILITIES | | 2010 | | | 2009 | |
| | | (in millions, except per
share and share amounts) | |
| | |
Capitalization: | | | | | | | | |
Interstate Power and Light Company common equity: | | | | | | | | |
Common stock - $2.50 par value - 24,000,000 shares authorized; 13,370,788 shares outstanding | | | $33.4 | | | | $33.4 | |
Additional paid-in capital | | | 974.0 | | | | 1,042.2 | |
Retained earnings | | | 382.4 | | | | 254.4 | |
| | | | | | | | |
Total Interstate Power and Light Company common equity | | | 1,389.8 | | | | 1,330.0 | |
Cumulative preferred stock | | | 183.8 | | | | 183.8 | |
| | | | | | | | |
Total equity | | | 1,573.6 | | | | 1,513.8 | |
Long-term debt, net | | | 1,308.6 | | | | 1,158.7 | |
| | | | | | | | |
Total capitalization | | | 2,882.2 | | | | 2,672.5 | |
| | | | | | | | |
| | |
| | | | | | | | | |
| | |
Current liabilities: | | | | | | | | |
Commercial paper | | | - | | | | 190.0 | |
Accounts payable | | | 146.0 | | | | 168.2 | |
Accounts payable to associated companies | | | 37.1 | | | | 50.4 | |
Regulatory liabilities | | | 155.8 | | | | 70.2 | |
Accrued taxes | | | 62.4 | | | | 68.3 | |
Derivative liabilities | | | 23.0 | | | | 49.5 | |
Other | | | 58.2 | | | | 62.1 | |
| | | | | | | | |
Total current liabilities | | | 482.5 | | | | 658.7 | |
| | | | | | | | |
| | |
| | | | | | | | | |
| | |
Other long-term liabilities and deferred credits: | | | | | | | | |
Deferred income taxes | | | 849.0 | | | | 690.4 | |
Regulatory liabilities | | | 472.1 | | | | 574.5 | |
Pension and other benefit obligations | | | 110.2 | | | | 119.2 | |
Other | | | 141.6 | | | | 176.9 | |
| | | | | | | | |
Total other long-term liabilities and deferred credits | | | 1,572.9 | | | | 1,561.0 | |
| | | | | | | | |
| | |
| | | | | | | | | |
| | |
Commitments and contingencies (Note 12) | | | | | | | | |
| | |
| | | | | | | | | |
| | |
Total capitalization and liabilities | | | $4,937.6 | | | | $4,892.2 | |
| | | | | | | | |
| | |
| | | | | | | | | |
The accompanying Combined Notes to Consolidated Financial Statements are an integral part of these statements.
108
INTERSTATE POWER AND LIGHT COMPANY
CONSOLIDATED STATEMENTS OF CASH FLOWS
| | | | | | | | | | | | |
| | | Year Ended December 31, | |
| | | 2010 | | | 2009 | | | 2008 | |
| | | (in millions) | |
Cash flows from operating activities: | | | | | | | | | | | | |
Net income | | | $143.4 | | | | $153.0 | | | | $141.6 | |
Adjustments to reconcile net income to net cash flows from operating activities: | | | | | | | | | | | | |
Depreciation and amortization | | | 177.0 | | | | 152.8 | | | | 131.3 | |
Deferred tax expense and investment tax credits | | | 116.0 | | | | 73.3 | | | | 21.7 | |
Equity component of allowance for funds used during construction | | | (3.0) | | | | (24.2) | | | | (10.8) | |
Non-cash valuation and regulated-related charges | | | 30.5 | | | | 8.0 | | | | 12.0 | |
Other | | | 3.7 | | | | (1.3) | | | | 9.6 | |
Other changes in assets and liabilities: | | | | | | | | | | | | |
Accounts receivable | | | 5.1 | | | | 40.6 | | | | (84.3) | |
Sales of accounts receivable | | | 65.0 | | | | (25.0) | | | | (75.0) | |
Income tax refunds receivable | | | 84.3 | | | | (54.8) | | | | (4.0) | |
Production fuel | | | 21.0 | | | | (31.1) | | | | (14.8) | |
Regulatory assets | | | (49.5) | | | | (109.7) | | | | (315.3) | |
Prepaid gas costs | | | - | | | | 22.7 | | | | (22.7) | |
Prepaid pension costs | | | - | | | | - | | | | 25.5 | |
Accounts payable | | | (12.5) | | | | (21.2) | | | | 18.5 | |
Regulatory liabilities | | | 17.5 | | | | 158.9 | | | | (13.4) | |
Accrued taxes | | | (5.9) | | | | 21.9 | | | | (3.8) | |
Derivative liabilities | | | (29.0) | | | | (35.2) | | | | 70.1 | |
Deferred income taxes | | | 42.0 | | | | 116.5 | | | | 54.2 | |
Non-current taxes payable | | | (28.4) | | | | 25.8 | | | | 2.4 | |
Pension and other benefit obligations | | | (9.0) | | | | (94.7) | | | | 162.1 | |
Other | | | (18.6) | | | | (3.1) | | | | 8.8 | |
| | | | | | | | | | | | |
Net cash flows from operating activities | | | 549.6 | | | | 373.2 | | | | 113.7 | |
| | | | | | | | | | | | |
Cash flows used for investing activities: | | | | | | | | | | | | |
Utility construction and acquisition expenditures | | | (382.8) | | | | (733.6) | | | | (479.3) | |
Insurance proceeds received for property damages | | | - | | | | 37.7 | | | | 18.1 | |
Other | | | (32.2) | | | | (16.8) | | | | (7.9) | |
| | | | | | | | | | | | |
Net cash flows used for investing activities | | | (415.0) | | | | (712.7) | | | | (469.1) | |
| | | | | | | | | | | | |
Cash flows from (used for) financing activities: | | | | | | | | | | | | |
Common stock dividends | | | - | | | | - | | | | (29.1) | |
Preferred stock dividends | | | (15.4) | | | | (15.4) | | | | (15.4) | |
Capital contributions from parent | | | 50.0 | | | | 150.0 | | | | 200.0 | |
Repayment of capital to parent | | | (118.2) | | | | (106.1) | | | | (75.0) | |
Proceeds from issuance of long-term debt | | | 350.0 | | | | 300.0 | | | | 250.0 | |
Payments to retire long-term debt | | | (206.3) | | | | (135.0) | | | | (16.6) | |
Net change in short-term borrowings | | | (190.0) | | | | 147.6 | | | | 12.9 | |
Other | | | 0.6 | | | | (7.4) | | | | (4.6) | |
| | | | | | | | | | | | |
Net cash flows from (used for) financing activities | | | (129.3) | | | | 333.7 | | | | 322.2 | |
| | | | | | | | | | | | |
Net increase (decrease) in cash and cash equivalents | | | 5.3 | | | | (5.8) | | | | (33.2) | |
Cash and cash equivalents at beginning of period | | | 0.4 | | | | 6.2 | | | | 39.4 | |
| | | | | | | | | | | | |
Cash and cash equivalents at end of period | | | $5.7 | | | | $0.4 | | | | $6.2 | |
| | | | | | | | | | | | |
| | | |
| | | | | | | | | | | | | |
| | | |
Supplemental cash flows information: | | | | | | | | | | | | |
Cash paid (refunded) during the period for: | | | | | | | | | | | | |
Interest | | | $82.0 | | | | $70.3 | | | | $55.8 | |
| | | | | | | | | | | | |
Income taxes, net of refunds | | | ($125.9) | | | | ($87.5) | | | | $31.7 | |
| | | | | | | | | | | | |
Significant noncash investing and financing activities: | | | | | | | | | | | | |
Accrued capital expenditures | | | $45.7 | | | | $56.2 | | | | $94.6 | |
| | | | | | | | | | | | |
| | | |
| | | | | | | | | | | | | |
The accompanying Combined Notes to Consolidated Financial Statements are an integral part of these statements.
109
INTERSTATE POWER AND LIGHT COMPANY
CONSOLIDATED STATEMENTS OF COMMON EQUITY
| | | | | | | | | | | | | | | | |
| | | Common
Stock | | | Additional
Paid-In
Capital | | | Retained
Earnings | | | Total IPL Common
Equity | |
| | | (in millions) | |
2008: | | | | | | | | | | | | | | | | |
Beginning balance | | | $33.4 | | | | $873.1 | | | | $21.0 | | | | $927.5 | |
Earnings available for common stock | | | | | | | | | | | 126.2 | | | | 126.2 | |
Common stock dividends | | | | | | | | | | | (29.1) | | | | (29.1) | |
Capital contribution from parent | | | | | | | 200.0 | | | | | | | | 200.0 | |
Repayment of capital to parent | | | | | | | (75.0) | | | | | | | | (75.0) | |
Adoption of new measurement date for retirement plans, net of tax of ($1.3) (Note 6(a)) | | | | | | | | | | | (1.3) | | | | (1.3) | |
| | | | | | | | | | | | | | | | |
Ending balance | | | 33.4 | | | | 998.1 | | | | 116.8 | | | | 1,148.3 | |
| | | | |
2009: | | | | | | | | | | | | | | | | |
Earnings available for common stock | | | | | | | | | | | 137.6 | | | | 137.6 | |
Capital contribution from parent | | | | | | | 150.0 | | | | | | | | 150.0 | |
Repayment of capital to parent | | | | | | | (106.1) | | | | | | | | (106.1) | |
Other | | | | | | | 0.2 | | | | | | | | 0.2 | |
| | | | | | | | | | | | | | | | |
Ending balance | | | 33.4 | | | | 1,042.2 | | | | 254.4 | | | | 1,330.0 | |
| | | | |
2010: | | | | | | | | | | | | | | | | |
Earnings available for common stock | | | | | | | | | | | 128.0 | | | | 128.0 | |
Capital contribution from parent | | | | | | | 50.0 | | | | | | | | 50.0 | |
Repayment of capital to parent | | | | | | | (118.2) | | | | | | | | (118.2) | |
| | | | | | | | | | | | | | | | |
Ending balance | | | $33.4 | | | | $974.0 | | | | $382.4 | | | | $1,389.8 | |
| | | | | | | | | | | | | | | | |
The accompanying Combined Notes to Consolidated Financial Statements are an integral part of these statements.
110
MANAGEMENT’S ANNUAL REPORT ON INTERNAL CONTROL OVER FINANCIAL REPORTING
The management of Wisconsin Power and Light Company and subsidiaries (WPL) is responsible for establishing and maintaining adequate internal control over financial reporting, as such term is defined in Rules 13a-15(f) and 15d-15(f) under the Securities Exchange Act of 1934. WPL’s internal control over financial reporting is designed to provide reasonable assurance regarding the reliability of financial reporting and the preparation of financial statements for external purposes in accordance with accounting principles generally accepted in the United States of America.
Because of the inherent limitations of internal control over financial reporting, misstatements may not be prevented or detected on a timely basis. Also, projections of any evaluation of the effectiveness of the internal control over financial reporting to future periods are subject to the risk that the controls may become inadequate because of changes in conditions, or that the degree of compliance with the policies or procedures may deteriorate.
WPL’s management assessed the effectiveness of WPL’s internal control over financial reporting as of December 31, 2010 using the criteria set forth inInternal Control - Integrated Framework issued by the Committee of Sponsoring Organizations of the Treadway Commission. Based on this assessment, WPL’s management concluded that, as of December 31, 2010, WPL’s internal control over financial reporting was effective.
|
| /s/ William D. Harvey |
| William D. Harvey |
| Chairman and Chief Executive Officer |
|
| /s/ Thomas L. Hanson |
| Thomas L. Hanson |
| Vice President-Chief Financial Officer and Treasurer |
|
| /s/ Robert J. Durian |
| Robert J. Durian |
| Controller and Chief Accounting Officer |
February 28, 2011
111
REPORT OF INDEPENDENT REGISTERED PUBLIC ACCOUNTING FIRM
To the Board of Directors and Shareowners of Wisconsin Power and Light Company
Madison, Wisconsin
We have audited the accompanying consolidated balance sheets of Wisconsin Power and Light Company and subsidiaries (the “Company”) as of December 31, 2010 and 2009, and the related consolidated statements of income, common equity, and cash flows for each of the three years in the period ended December 31, 2010. Our audits also included the financial statement schedules listed in the Index at Item 15. These financial statements and financial statement schedules are the responsibility of the Company’s management. Our responsibility is to express an opinion on the financial statements and financial statement schedules based on our audits.
We conducted our audits in accordance with the standards of the Public Company Accounting Oversight Board (United States). Those standards require that we plan and perform the audit to obtain reasonable assurance about whether the financial statements are free of material misstatement. The Company is not required to have, nor were we engaged to perform, an audit of its internal control over financial reporting. Our audits included consideration of internal control over financial reporting as a basis for designing audit procedures that are appropriate in the circumstances, but not for the purpose of expressing an opinion on the effectiveness of the Company’s internal control over financial reporting. Accordingly, we express no such opinion. An audit also includes examining, on a test basis, evidence supporting the amounts and disclosures in the financial statements, assessing the accounting principles used and significant estimates made by management, as well as evaluating the overall financial statement presentation. We believe that our audits provide a reasonable basis for our opinion.
In our opinion, such consolidated financial statements present fairly, in all material respects, the financial position of the Company as of December 31, 2010 and 2009, and the results of its operations and its cash flows for each of the three years in the period ended December 31, 2010, in conformity with accounting principles generally accepted in the United States of America. Also, in our opinion, such financial statement schedules, when considered in relation to the basic consolidated financial statements taken as a whole, present fairly, in all material respects, the information set forth therein.
/s/ DELOITTE & TOUCHE LLP
DELOITTE & TOUCHE LLP
Milwaukee, Wisconsin
February 28, 2011
112
WISCONSIN POWER AND LIGHT COMPANY
CONSOLIDATED STATEMENTS OF INCOME
| | | | | | | | | | | | |
| | | Year Ended December 31, | |
| | | 2010 | | | 2009 | | | 2008 | |
| | | (in millions) | |
Operating revenues: | | | | | | | | | | | | |
Electric utility | | | $1,209.9 | | | | $1,160.3 | | | | $1,153.0 | |
Gas utility | | | 206.3 | | | | 216.5 | | | | 300.0 | |
Other | | | 7.4 | | | | 9.3 | | | | 12.8 | |
| | | | | | | | | | | | |
Total operating revenues | | | 1,423.6 | | | | 1,386.1 | | | | 1,465.8 | |
| | | | | | | | | | | | |
| | | |
| | | | | | | | | | | | | |
| | | |
Operating expenses: | | | | | | | | | | | | |
Electric production fuel and energy purchases | | | 401.2 | | | | 451.3 | | | | 434.2 | |
Purchased electric capacity | | | 134.7 | | | | 144.6 | | | | 145.1 | |
Electric transmission service | | | 100.4 | | | | 94.2 | | | | 93.2 | |
Cost of gas sold | | | 125.3 | | | | 138.1 | | | | 213.6 | |
Other operation and maintenance | | | 232.7 | | | | 234.3 | | | | 232.3 | |
Depreciation and amortization | | | 108.6 | | | | 115.4 | | | | 101.7 | |
Taxes other than income taxes | | | 41.9 | | | | 41.2 | | | | 40.8 | |
| | | | | | | | | | | | |
Total operating expenses | | | 1,144.8 | | | | 1,219.1 | | | | 1,260.9 | |
| | | | | | | | | | | | |
| | | |
| | | | | | | | | | | | | |
| | | |
Operating income | | | 278.8 | | | | 167.0 | | | | 204.9 | |
| | | | | | | | | | | | |
| | | |
| | | | | | | | | | | | | |
| | | |
Interest expense and other: | | | | | | | | | | | | |
Interest expense | | | 78.6 | | | | 74.8 | | | | 62.2 | |
Equity income from unconsolidated investments | | | (37.8) | | | | (37.0) | | | | (33.9) | |
Allowance for funds used during construction | | | (12.5) | | | | (5.7) | | | | (9.6) | |
Interest income and other | | | (0.1) | | | | (0.4) | | | | (0.6) | |
| | | | | | | | | | | | |
Total interest expense and other | | | 28.2 | | | | 31.7 | | | | 18.1 | |
| | | | | | | | | | | | |
| | | |
| | | | | | | | | | | | | |
| | | |
Income before income taxes | | | 250.6 | | | | 135.3 | | | | 186.8 | |
| | | | | | | | | | | | |
| | | |
| | | | | | | | | | | | | |
| | | |
Income taxes | | | 98.3 | | | | 45.8 | | | | 68.4 | |
| | | | | | | | | | | | |
| | | |
| | | | | | | | | | | | | |
| | | |
Net income | | | 152.3 | | | | 89.5 | | | | 118.4 | |
| | | | | | | | | | | | |
| | | |
| | | | | | | | | | | | | |
| | | |
Preferred dividend requirements | | | 3.3 | | | | 3.3 | | | | 3.3 | |
| | | | | | | | | | | | |
| | | |
| | | | | | | | | | | | | |
| | | |
Earnings available for common stock | | | $149.0 | | | | $86.2 | | | | $115.1 | |
| | | | | | | | | | | | |
| | | |
| | | | | | | | | | | | | |
Earnings per share data is not disclosed given Alliant Energy Corporation is the sole shareowner of all shares of WPL's common stock outstanding during the periods presented.
The accompanying Combined Notes to Consolidated Financial Statements are an integral part of these statements.
113
WISCONSIN POWER AND LIGHT COMPANY
CONSOLIDATED BALANCE SHEETS
| | | | | | | | |
| | | December 31, | |
| ASSETS | | 2010 | | | 2009 | |
| | |
| | | (in millions) | |
Property, plant and equipment: | | | | | | | | |
Electric plant in service | | | $3,114.6 | | | | $2,726.5 | |
Gas plant in service | | | 411.4 | | | | 393.8 | |
Other plant in service | | | 219.0 | | | | 219.8 | |
Accumulated depreciation | | | (1,243.8) | | | | (1,185.8) | |
| | | | | | | | |
Net plant | | | 2,501.2 | | | | 2,154.3 | |
Leased Sheboygan Falls Energy Facility, less accumulated amortization of $34.4 and $28.2 | | | 89.4 | | | | 95.5 | |
Construction work in progress: | | | | | | | | |
Bent Tree - Phase I wind project | | | 154.5 | | | | 165.5 | |
Other | | | 81.0 | | | | 39.4 | |
Other, less accumulated depreciation of $2.2 and $1.6 | | | 20.0 | | | | 21.0 | |
| | | | | | | | |
Total property, plant and equipment | | | 2,846.1 | | | | 2,475.7 | |
| | | | | | | | |
|
| | |
| | |
Current assets: | | | | | | | | |
Cash and cash equivalents | | | 0.1 | | | | 18.5 | |
Accounts receivable: | | | | | | | | |
Customer, less allowance for doubtful accounts | | | 84.2 | | | | 80.8 | |
Unbilled utility revenues | | | 82.3 | | | | 86.7 | |
Other, less allowance for doubtful accounts | | | 38.1 | | | | 45.7 | |
Income tax refunds receivable | | | 40.6 | | | | 81.3 | |
Production fuel, at weighted average cost | | | 42.7 | | | | 39.1 | |
Materials and supplies, at weighted average cost | | | 25.7 | | | | 22.7 | |
Gas stored underground, at weighted average cost | | | 26.8 | | | | 27.4 | |
Regulatory assets | | | 50.0 | | | | 78.6 | |
Prepaid gross receipts tax | | | 38.6 | | | | 38.5 | |
Derivative assets | | | 6.5 | | | | 11.2 | |
Other | | | 9.4 | | | | 30.3 | |
| | | | | | | | |
Total current assets | | | 445.0 | | | | 560.8 | |
| | | | | | | | |
|
| | |
| | |
Investments: | | | | | | | | |
Investment in American Transmission Company LLC | | | 227.9 | | | | 218.6 | |
Other | | | 20.8 | | | | 22.7 | |
| | | | | | | | |
Total investments | | | 248.7 | | | | 241.3 | |
| | | | | | | | |
|
| | |
| | |
Other assets: | | | | | | | | |
Regulatory assets | | | 292.1 | | | | 331.3 | |
Deferred charges and other | | | 57.7 | | | | 72.3 | |
| | | | | | | | |
Total other assets | | | 349.8 | | | | 403.6 | |
| | | | | | | | |
|
| | |
| | |
Total assets | | | $3,889.6 | | | | $3,681.4 | |
| | | | | | | | |
|
| | |
The accompanying Combined Notes to Consolidated Financial Statements are an integral part of these statements.
114
WISCONSIN POWER AND LIGHT COMPANY
CONSOLIDATED BALANCE SHEETS (Continued)
| | | | | | | | |
| | | December 31, | |
| CAPITALIZATION AND LIABILITIES | | 2010 | | | 2009 | |
| | |
| | | (in millions, except per
share and share amounts) | |
Capitalization: | | | | | | | | |
Wisconsin Power and Light Company common equity: | | | | | | | | |
Common stock - $5 par value - 18,000,000 shares authorized;
13,236,601 shares outstanding | | | $66.2 | | | | $66.2 | |
Additional paid-in capital | | | 844.0 | | | | 768.9 | |
Retained earnings | | | 459.1 | | | | 419.6 | |
| | | | | | | | |
Total Wisconsin Power and Light Company common equity | | | 1,369.3 | | | | 1,254.7 | |
Cumulative preferred stock | | | 60.0 | | | | 60.0 | |
Long-term debt, net (excluding current portion) | | | 1,081.7 | | | | 931.6 | |
| | | | | | | | |
Total capitalization | | | 2,511.0 | | | | 2,246.3 | |
| | | | | | | | |
|
| | |
| | |
Current liabilities: | | | | | | | | |
Current maturities of long-term debt | | | - | | | | 100.0 | |
Commercial paper | | | 47.4 | | | | - | |
Accounts payable | | | 118.5 | | | | 99.6 | |
Accounts payable to associated companies | | | 16.0 | | | | 15.7 | |
Regulatory liabilities | | | 17.9 | | | | 32.5 | |
Accrued interest | | | 21.6 | | | | 24.1 | |
Derivative liabilities | | | 32.3 | | | | 51.0 | |
Other | | | 38.9 | | | | 39.5 | |
| | | | | | | | |
Total current liabilities | | | 292.6 | | | | 362.4 | |
| | | | | | | | |
|
| | |
| | |
Other long-term liabilities and deferred credits: | | | | | | | | |
Deferred income taxes | | | 570.4 | | | | 490.8 | |
Regulatory liabilities | | | 154.3 | | | | 159.6 | |
Capital lease obligations - Sheboygan Falls Energy Facility | | | 107.0 | | | | 110.4 | |
Pension and other benefit obligations | | | 119.2 | | | | 121.7 | |
Other | | | 135.1 | | | | 190.2 | |
| | | | | | | | |
Total long-term liabilities and deferred credits | | | 1,086.0 | | | | 1,072.7 | |
| | | | | | | | |
|
| | |
| | |
Commitments and contingencies (Note 12) | | | | | | | | |
| | |
| | |
Total capitalization and liabilities | | | $3,889.6 | | | | $3,681.4 | |
| | | | | | | | |
|
| | |
The accompanying Combined Notes to Consolidated Financial Statements are an integral part of these statements.
115
WISCONSIN POWER AND LIGHT COMPANY
CONSOLIDATED STATEMENTS OF CASH FLOWS
| | | | | | | | | | | | |
| | | Year Ended December 31, | |
| | | 2010 | | | 2009 | | | 2008 | |
| | |
| | | (in millions) | |
Cash flows from operating activities: | | | | | | | | | | | | |
Net income | | | $152.3 | | | | $89.5 | | | | $118.4 | |
Adjustments to reconcile net income to net cash flows from operating activities: | | | | | | | | | | | | |
Depreciation and amortization | | | 108.6 | | | | 115.4 | | | | 101.7 | |
Other amortizations | | | 39.5 | | | | 35.2 | | | | 38.4 | |
Deferred tax expense and investment tax credits | | | 98.5 | | | | 157.7 | | | | 36.1 | |
Equity income from unconsolidated investments | | | (37.8) | | | | (37.0) | | | | (33.9) | |
Distributions from equity method investments | | | 32.2 | | | | 29.9 | | | | 27.8 | |
Equity component of allowance for funds used during construction | | | (8.2) | | | | (4.0) | | | | (6.4) | |
Non-cash valuation and regulated-related charges and other | | | - | | | | 12.5 | | | | (0.2) | |
Other changes in assets and liabilities: | | | | | | | | | | | | |
Accounts receivable | | | 4.6 | | | | 31.3 | | | | (68.7) | |
Income tax refunds receivable | | | 40.7 | | | | (72.9) | | | | (5.8) | |
Prepaid pension costs | | | - | | | | - | | | | 37.2 | |
Regulatory assets | | | 28.7 | | | | (54.2) | | | | (192.3) | |
Accounts payable | | | (0.4) | | | | (16.0) | | | | 27.2 | |
Regulatory liabilities | | | (9.1) | | | | (22.2) | | | | 2.3 | |
Derivative liabilities | | | (23.0) | | | | 51.5 | | | | 7.1 | |
Deferred income taxes | | | (20.0) | | | | 2.5 | | | | 22.4 | |
Non-current taxes payable | | | (38.5) | | | | 36.2 | | | | (0.2) | |
Pension and other benefit obligations | | | (2.5) | | | | (63.4) | | | | 112.3 | |
Other | | | 6.8 | | | | 13.8 | | | | 16.3 | |
| | | | | | | | | | | | |
Net cash flows from operating activities | | | 372.4 | | | | 305.8 | | | | 239.7 | |
| | | | | | | | | | | | |
| | | |
Cash flows used for investing activities: | | | | | | | | | | | | |
Utility construction and acquisition expenditures: | | | | | | | | | | | | |
Neenah Energy Facility and related assets | | | - | | | | (92.4) | | | | - | |
Other | | | (450.5) | | | | (416.0) | | | | (363.1) | |
Advances for customer energy efficiency projects | | | (16.0) | | | | (28.1) | | | | (34.5) | |
Collections of advances for customer energy efficiency projects | | | 30.3 | | | | 58.6 | | | | 33.1 | |
Other | | | (13.1) | | | | (15.5) | | | | (11.5) | |
| | | | | | | | | | | | |
Net cash flows used for investing activities | | | (449.3) | | | | (493.4) | | | | (376.0) | |
| | | | | | | | | | | | |
| | | |
Cash flows from financing activities: | | | | | | | | | | | | |
Common stock dividends | | | (109.5) | | | | (91.0) | | | | (91.3) | |
Preferred stock dividends | | | (3.3) | | | | (3.3) | | | | (3.3) | |
Capital contributions from parent | | | 75.0 | | | | 100.0 | | | | 100.0 | |
Proceeds from issuance of long-term debt | | | 150.0 | | | | 250.0 | | | | 250.0 | |
Payments to retire long-term debt | | | (100.0) | | | | - | | | | (60.0) | |
Net change in short-term borrowings | | | 47.4 | | | | (43.7) | | | | (38.1) | |
Other | | | (1.1) | | | | (10.4) | | | | (16.9) | |
| | | | | | | | | | | | |
Net cash flows from financing activities | | | 58.5 | | | | 201.6 | | | | 140.4 | |
| | | | | | | | | | | | |
| | | |
Net increase (decrease) in cash and cash equivalents | | | (18.4) | | | | 14.0 | | | | 4.1 | |
Cash and cash equivalents at beginning of period | | | 18.5 | | | | 4.5 | | | | 0.4 | |
| | | | | | | | | | | | |
Cash and cash equivalents at end of period | | | $0.1 | | | | $18.5 | | | | $4.5 | |
| | | | | | | | | | | | |
|
| | |
| | | |
Supplemental cash flows information: | | | | | | | | | | | | |
Cash paid (refunded) during the period for: | | | | | | | | | | | | |
Interest | | | $80.9 | | | | $69.6 | | | | $57.6 | |
| | | | | | | | | | | | |
Income taxes, net of refunds | | | ($3.8) | | | | ($76.1) | | | | $30.7 | |
| | | | | | | | | | | | |
Significant noncash investing and financing activities: | | | | | | | | | | | | |
Accrued capital expenditures | | | $27.4 | | | | $16.4 | | | | $19.8 | |
| | | | | | | | | | | | |
|
| | |
The accompanying Combined Notes to Consolidated Financial Statements are an integral part of these statements.
116
WISCONSIN POWER AND LIGHT COMPANY
CONSOLIDATED STATEMENTS OF COMMON EQUITY
| | | | | | | | | | | | | | | | |
| | | Common
Stock | | | Additional
Paid-In
Capital | | | Retained
Earnings | | | Total
WPL
Common
Equity | |
| | |
| | | (in millions) | |
2008: | | | | | | | | | | | | | | | | |
Beginning balance | | | $66.2 | | | | $568.8 | | | | $401.8 | | | | $1,036.8 | |
Earnings available for common stock | | | | | | | | | | | 115.1 | | | | 115.1 | |
Common stock dividends | | | | | | | | | | | (91.3) | | | | (91.3) | |
Capital contribution from parent | | | | | | | 100.0 | | | | | | | | 100.0 | |
Adoption of new measurement date for retirement plans, net of tax of ($1.2) (Note 6(a)) | | | | | | | | | | | (1.2) | | | | (1.2) | |
Other | | | | | | | 0.1 | | | | | | | | 0.1 | |
| | | | | | | | | | | | | | | | |
Ending balance | | | 66.2 | | | | 668.9 | | | | 424.4 | | | | 1,159.5 | |
| | | | |
2009: | | | | | | | | | | | | | | | | |
Earnings available for common stock | | | | | | | | | | | 86.2 | | | | 86.2 | |
Common stock dividends | | | | | | | | | | | (91.0) | | | | (91.0) | |
Capital contribution from parent | | | | | | | 100.0 | | | | | | | | 100.0 | |
| | | | | | | | | | | | | | | | |
Ending balance | | | 66.2 | | | | 768.9 | | | | 419.6 | | | | 1,254.7 | |
| | | | |
2010: | | | | | | | | | | | | | | | | |
Earnings available for common stock | | | | | | | | | | | 149.0 | | | | 149.0 | |
Common stock dividends | | | | | | | | | | | (109.5) | | | | (109.5) | |
Capital contribution from parent | | | | | | | 75.0 | | | | | | | | 75.0 | |
Other | | | | | | | 0.1 | | | | | | | | 0.1 | |
| | | | | | | | | | | | | | | | |
Ending balance | | | $66.2 | | | | $844.0 | | | | $459.1 | | | | $1,369.3 | |
| | | | | | | | | | | | | | | | |
The accompanying Combined Notes to Consolidated Financial Statements are an integral part of these statements.
117
ALLIANT ENERGY CORPORATION
INTERSTATE POWER AND LIGHT COMPANY
WISCONSIN POWER AND LIGHT COMPANY
COMBINED NOTES TO CONSOLIDATED FINANCIAL STATEMENTS
(1) SUMMARY OF SIGNIFICANT ACCOUNTING POLICIES
(a) General -
Description of Business - Alliant Energy Corporation’s (Alliant Energy’s) consolidated financial statements include the accounts of Alliant Energy and its consolidated subsidiaries. Alliant Energy is an investor-owned public utility holding company, whose primary subsidiaries are Interstate Power and Light Company (IPL), Wisconsin Power and Light Company (WPL), Alliant Energy Resources, LLC (Resources) and Alliant Energy Corporate Services, Inc. (Corporate Services).
IPL’s consolidated financial statements include the accounts of IPL and its consolidated subsidiary, IPL SPE LLC, which is used for IPL’s sales of accounts receivable program. IPL is a direct subsidiary of Alliant Energy and is engaged principally in the generation and distribution of electricity and the distribution and transportation of natural gas. IPL is also engaged in the generation and distribution of steam for two customers in Cedar Rapids, Iowa. IPL’s service territories are located in Iowa and southern Minnesota.
WPL’s consolidated financial statements include the accounts of WPL and its consolidated subsidiary, WPL Transco LLC, which holds WPL’s investment in the American Transmission Company LLC (ATC). WPL is a direct subsidiary of Alliant Energy and is engaged principally in the generation and distribution of electricity and the distribution and transportation of natural gas. WPL’s service territories are located in southern and central Wisconsin.
Resources is comprised of Transportation, RMT, Non-regulated Generation and other non-regulated investments. Transportation includes a short-line railway that provides freight service between Cedar Rapids, Iowa and Iowa City, Iowa; barge terminal and hauling services on the Mississippi River; and other transfer and storage services. RMT provides renewable energy services and environmental consulting and engineering services to customers throughout the United States of America (U.S.). Non-regulated Generation owns the 300 megawatt (MW), simple-cycle, natural gas-fired Sheboygan Falls Energy Facility near Sheboygan Falls, Wisconsin, which is leased to WPL for an initial period of 20 years ending in 2025. Refer to Note 17 for discussion of the Industrial Energy Applications, Inc. (IEA) business, which is reported as discontinued operations and assets and liabilities held for sale in Alliant Energy’s Consolidated Financial Statements.
Corporate Services is the subsidiary formed to provide administrative services to Alliant Energy and its subsidiaries.
Basis of Presentation - The consolidated financial statements reflect investments in controlled subsidiaries on a consolidated basis and Alliant Energy’s proportionate shares of jointly owned utility facilities. Unconsolidated investments, which Alliant Energy does not control, but does have the ability to exercise significant influence over operating and financial policies, are accounted for under the equity method of accounting. Investments that do not meet the criteria for consolidation or the equity method of accounting are accounted for under the cost method. Alliant Energy, IPL and WPL did not reflect any variable interest entities on a consolidated basis in their consolidated financial statements. Refer to Notes 9(a) and 19 for further discussion of equity method investments and variable interest entities, respectively.
All significant intercompany balances and transactions, other than certain energy-related transactions affecting IPL and WPL, have been eliminated from the consolidated financial statements. Such energy-related transactions not eliminated include costs that are recoverable from customers through rate making processes. The consolidated financial statements are prepared in conformity with accounting principles generally accepted in the U.S. (GAAP), which give recognition to the rate making and accounting practices of the Federal Energy Regulatory Commission (FERC) and state commissions having regulatory jurisdiction. Certain prior period amounts have been reclassified on a basis consistent with the current period financial statement presentation. Unless otherwise noted, the notes herein have been revised to exclude discontinued operations for all periods presented.
Use of Estimates - The preparation of the consolidated financial statements requires management to make estimates and assumptions that affect: a) the reported amounts of assets and liabilities and the disclosure of contingent assets and liabilities at the date of the financial statements; and b) the reported amounts of revenues and expenses during the reporting period. Actual results could differ from those estimates.
(b) Regulatory Assets and Liabilities - Alliant Energy, IPL and WPL are subject to regulation by FERC and various state regulatory commissions. As a result, Alliant Energy, IPL and WPL are subject to GAAP provisions for regulated operations, which provide that rate-regulated public utilities record certain costs and credits allowed in the rate making process in different periods than for non-regulated entities. These are deferred as regulatory assets or accrued as regulatory liabilities and are generally recognized in the Consolidated Statements of Income at the time they are reflected in rates.
118
Regulatory Assets - At Dec. 31, regulatory assets were comprised of the following items (in millions):
| | | | | | | | | | | | | | | | | | | | | | | | |
| | | Alliant Energy | | | IPL | | | WPL | |
| | | 2010 | | | 2009 | | | 2010 | | | 2009 | | | 2010 | | | 2009 | |
Pension and other postretirement benefits costs | | | $418.9 | | | | $466.4 | | | | $217.4 | | | | $244.1 | | | | $201.5 | | | | $222.3 | |
Tax-related | | | 395.9 | | | | 322.7 | | | | 377.2 | | | | 310.9 | | | | 18.7 | | | | 11.8 | |
Derivatives | | | 66.8 | | | | 116.3 | | | | 24.0 | | | | 51.2 | | | | 42.8 | | | | 65.1 | |
Asset retirement obligations (AROs) | | | 49.6 | | | | 47.1 | | | | 33.2 | | | | 32.4 | | | | 16.4 | | | | 14.7 | |
Environmental-related costs | | | 38.4 | | | | 40.6 | | | | 32.1 | | | | 34.1 | | | | 6.3 | | | | 6.5 | |
IPL’s electric transmission service costs | | | 33.3 | | | | -- | | | | 33.3 | | | | -- | | | | -- | | | | -- | |
Proposed base-load projects costs | | | 27.3 | | | | 37.0 | | | | 18.9 | | | | 24.3 | | | | 8.4 | | | | 12.7 | |
Debt redemption costs | | | 23.7 | | | | 18.8 | | | | 16.5 | | | | 11.1 | | | | 7.2 | | | | 7.7 | |
Proposed clean air compliance projects costs | | | 17.9 | | | | 19.3 | | | | 9.5 | | | | 9.0 | | | | 8.4 | | | | 10.3 | |
IPL’s Sixth Street Generating Station | | | | | | | | | | | | | | | | | | | | | | | | |
(Sixth Street) costs | | | 15.7 | | | | -- | | | | 15.7 | | | | -- | | | | -- | | | | -- | |
IPL’s flood-related costs | | | 11.7 | | | | 8.0 | | | | 11.7 | | | | 8.0 | | | | -- | | | | -- | |
Wholesale customer rate recovery | | | 10.5 | | | | 7.7 | | | | 2.6 | | | | 1.2 | | | | 7.9 | | | | 6.5 | |
WPL’s benefits costs | | | 8.8 | | | | 12.0 | | | | -- | | | | -- | | | | 8.8 | | | | 12.0 | |
WPL’s Midwest Independent Transmission | | | | | | | | | | | | | | | | | | | | | | | | |
System Operator (MISO)-related costs | | | -- | | | | 5.0 | | | | -- | | | | -- | | | | -- | | | | 5.0 | |
Other | | | 23.2 | | | | 52.8 | | | | 7.5 | | | | 17.5 | | | | 15.7 | | | | 35.3 | |
| | | | | | | | | | | | | | | | | | | | | | | | |
| | | $1,141.7 | | | | $1,153.7 | | | | $799.6 | | | | $743.8 | | | | $342.1 | | | | $409.9 | |
| | | | | | | | | | | | | | | | | | | | | | | | |
A portion of the regulatory assets in the above table are not earning a return. These regulatory assets are expected to be recovered from customers in future rates, however the carrying costs of these assets are borne by Alliant Energy’s shareowners. At Dec. 31, 2010, IPL and WPL had $99 million and $22 million, respectively, of regulatory assets representing past expenditures that were not earning a return. IPL’s regulatory assets that were not earning a return consisted primarily of electric transmission service costs, costs for proposed base-load and clean air compliance projects, debt redemption costs, flood-related costs and amounts related to wholesale customer rate recovery. WPL’s regulatory assets that were not earning a return consisted primarily of amounts related to wholesale customer rate recovery, debt redemption costs and the wholesale portion of costs for clean air compliance projects. The other regulatory assets reported in the above table either earn a return or the cash has not yet been expended, in which case the assets are offset by liabilities that also do not incur a carrying cost.
Pension and other postretirement benefits - The Iowa Utilities Board (IUB) and Public Service Commission of Wisconsin (PSCW) have authorized IPL and WPL, respectively, to record the retail portion of their previously unrecognized net actuarial gains and losses, prior service costs and credits, and transition assets and obligations as regulatory assets in lieu of accumulated other comprehensive loss on the respective Consolidated Balance Sheets. IPL and WPL also recognize the wholesale portion of their previously unrecognized net actuarial gains and losses, prior service costs and credits and transition assets and obligations as regulatory assets on the respective Consolidated Balance Sheets because these costs are expected to be recovered in rates in future periods under the formula rate structure implemented in 2007. These regulatory assets will be increased or decreased as the net actuarial gains or losses, prior service costs or credits, and transition assets or obligations are subsequently amortized and recognized as a component of net periodic benefit costs.
Pension and other postretirement benefits costs are included within the recoverable cost of service component of rates charged to IPL’s and WPL’s customers. The recoverable costs included in customers’ rates are based upon pension and other postretirement benefits costs determined in accordance with GAAP and are calculated using different methods for the various regulatory jurisdictions in which IPL and WPL operate. The methods for IPL’s and WPL’s primary regulatory jurisdictions are described below. The IUB authorized IPL in its most recent retail rate case order to recover from its electric retail customers in Iowa an allocated portion of annual costs equal to a simple average of actual costs incurred during its test year (2009) and an estimate of costs for its forward-looking post-test year (2010). The PSCW authorized WPL in its most recent retail rate case order to recover from its electric and gas retail customers an allocated portion of annual costs equal to the estimated costs expected during its forward-looking test year (2010). WPL is authorized to recover from its wholesale customers an allocated portion of actual pension costs incurred each year. In accordance with FERC-approved formula rates, any over- or under-collection of these costs each year are refunded to or recovered from customers through subsequent changes to wholesale customer rates. WPL is authorized to recover from its wholesale customers an allocated portion of other postretirement benefits costs based on the amount of other postretirement benefits costs incurred in 2006.
Refer to Note 6(a) for additional details regarding IPL’s and WPL’s pension and other postretirement benefits costs.
119
Tax-related - IPL and WPL record regulatory assets for certain temporary differences (primarily related to utility property, plant and equipment at IPL) that result in a decrease in current rates charged to customers and an increase in future rates charged to customers based on the timing of income tax expense that is used to determine such rates. These temporary differences include the impact of Iowa accelerated tax depreciation, which contributes to lower current income tax expense during the first part of an asset’s useful life and higher current tax expense during the last part of an asset’s useful life. These regulatory assets will be recovered from customers in the future when these temporary differences reverse resulting in additional current income tax expense used to determine customers’ rates. Refer to Note 5 for information regarding a change in tax accounting method for repairs expenditures and the tax method for allocating flood insurance proceeds, which contributed to increases in tax-related regulatory assets on Alliant Energy’s and IPL’s Consolidated Balance Sheets in 2010.
Derivatives - In accordance with IPL’s and WPL’s fuel and natural gas recovery mechanisms, prudently incurred costs from derivative instruments are recovered from customers in the future when any losses are realized. Based on these recovery mechanisms, the changes in the fair value of derivative liabilities resulted in comparable changes to regulatory assets on Alliant Energy’s, IPL’s and WPL’s Consolidated Balance Sheets during 2010. Refer to Note 11(a) for additional details of Alliant Energy’s, IPL’s and WPL’s derivative liabilities.
AROs - Alliant Energy, IPL and WPL believe it is probable that any differences between expenses accrued for legal AROs related to their regulated operations and expenses recovered currently in rates will be recoverable in future rates, and are deferring the differences as regulatory assets. Refer to Note 18 for additional details of Alliant Energy’s, IPL’s and WPL’s AROs.
Environmental-related costs - The IUB has permitted IPL to recover prudently incurred costs by allowing a representative level of manufactured gas plants (MGP) costs in the recoverable cost of service component of rates determined in its most recent retail gas rate case. Under the current rate making treatment approved by the PSCW, the MGP expenditures of WPL are deferred and collected from retail gas customers over a five-year period after new rates are implemented. The Minnesota Public Utilities Commission (MPUC) allows the deferral of MGP-related costs applicable to IPL’s Minnesota sites and IPL has received approval to recover such costs in retail gas rates in Minnesota. Regulatory assets have been recorded by IPL and WPL, which reflect the probable future rate recovery of MGP expenditures. Refer to Note 12(e) for additional details of Alliant Energy’s, IPL’s and WPL’s environmental-related costs.
IPL’s electric transmission service costs - - In 2010, IPL incurred electric transmission service costs billed by ITC Midwest LLC (ITC) under the Attachment “O” rate for ITC’s under-recovered 2008 costs. In January 2010, the IUB issued an order authorizing IPL to defer the Iowa retail portion of these costs and amortize the deferred costs over a five-year period ending December 2014. The IUB determined that IPL should not include the unamortized balance of these deferred costs in electric rate base during the five-year recovery period. The IUB also authorized IPL to use up to $46 million of regulatory liabilities from its 2007 electric transmission assets sale to offset these deferred costs as they are amortized. In 2010, $41 million (portion allocated to Iowa retail customers) of the Attachment “O” costs were deferred by IPL and recognized as a regulatory asset. In 2010, $8 million of this regulatory asset was amortized with an equal and offsetting amount of amortization of IPL’s regulatory liability related to its electric transmission assets sale.
Proposed base-load projects -
IPL’s base-load project - In 2009, IPL announced a decision to cancel the construction of the proposed 630 MW coal-fired electric generating facility in Marshalltown, Iowa referred to as Sutherland #4. In January 2010, IPL received approval from the IUB to recover $26 million of the costs incurred for Sutherland #4 from its retail customers in Iowa by amortizing the costs over a five-year period ending September 2014 and offsetting the amortization of these costs with an equal reduction of the regulatory liability resulting from the sale of the Duane Arnold Energy Center (DAEC). The IUB determined that IPL should not include the unamortized balance of these Sutherland #4 costs in electric rate base during the five-year recovery period. Costs included in the above table include only the remaining Iowa retail portion of costs related to this project.
WPL’s base-load project - In 2008, the PSCW issued an order denying WPL’s application to construct a 300 MW coal-fired electric generating facility in Cassville, Wisconsin referred to as Nelson Dewey #3. Costs included in the above table reflect the remaining retail and wholesale portions of costs related to this project.
Retail portion - In 2009, WPL received approval from the PSCW to recover $11 million of project costs from its retail customers over a five-year period ending December 2014. In 2009, the PSCW also denied WPL recovery of the remaining project costs, which represent all project costs incurred by WPL after June 2008 and one-half of the pre-construction project costs incurred by WPL prior to July 2008. As a result of this PSCW order, Alliant Energy and WPL recorded a pre-tax regulatory-related charge of $11 million in “Other operation and maintenance” in their Consolidated Statements of Income in 2009.
120
Wholesale portion - In 2009, WPL executed an agreement with its wholesale customers to recover $4 million of the wholesale portion of the capitalized expenditures for the Nelson Dewey #3 project that were incurred by WPL through December 2008. The agreement allowed WPL to recover the $4 million of capitalized expenditures from its wholesale customers over a 12-month period ending May 2010. As a result of this agreement, Alliant Energy and WPL recorded a pre-tax regulatory-related charge of $4 million in “Other operation and maintenance” in their Consolidated Statements of Income in 2008.
Debt redemption costs - For debt retired early with no subsequent re-issuance, IPL and WPL defer any debt repayment premiums and unamortized debt issuance costs and discounts as regulatory assets. These regulatory assets are amortized over the remaining original life of the debt retired early. Debt repayment premiums and other losses resulting from the refinancing of debt by IPL and WPL are deferred as regulatory assets and amortized over the life of the new debt issued. Refer to Note 8(b) for additional details of $6 million of debt repayment premiums incurred in 2010 for the early retirement of IPL’s $200 million 6.75% senior debentures due 2011.
Proposed clean air compliance plan (CACP) projects - CACP projects require material expenditures for activities related to determining the feasibility of environmental compliance projects under consideration. These expenditures commonly called preliminary survey and investigation charges are generally recorded as regulatory assets on the Consolidated Balance Sheets in accordance with FERC regulations. In Iowa, no specific retail authorization is required before charging these costs to regulatory asset accounts. In Wisconsin, the retail portion of these amounts is expensed immediately unless otherwise authorized by the PSCW. However, since these amounts are material for WPL’s CACP projects, WPL requested and received deferral accounting approval to record the retail portion of these costs as regulatory assets on the Consolidated Balance Sheets.
For IPL, amounts deferred and recorded as preliminary survey and investigation charges do not include any accrual of carrying costs or allowance for funds used during construction (AFUDC). Upon management’s decision to proceed with a project and receipt of certain required permits, all such amounts included as preliminary survey and investigation charges are transferred to construction work in progress (CWIP) and begin to accrue AFUDC.
For WPL, the wholesale portion of amounts deferred and recorded as preliminary survey and investigation charges do not include any accrual of carrying costs or AFUDC. WPL’s retail portion of deferred preliminary survey and investigation charges (commonly referred to as pre-certification expenditures) and construction expenditures incurred prior to project approval that are recorded in regulatory assets include accrual of carrying costs as prescribed in the approved deferral order. Upon regulatory approval of the project, the wholesale portion of deferred preliminary survey and investigation charges as well as all pre-construction expenditures are transferred to CWIP and begin to accrue AFUDC. The retail portion of deferred preliminary survey and investigation charges or pre-certification expenditures remain as regulatory assets until they are approved for inclusion in revenue requirements and amortized to expense. In 2009, WPL received approval from the PSCW to recover $4 million from its retail customers over a three-year period ending December 2012 for a portion of the pre-certification expenditures incurred through December 2008.
In May 2010, WPL received an order from the PSCW authorizing the installation of a selective catalytic reduction (SCR) system at the Edgewater Generating Station Unit 5 (Edgewater Unit 5) to reduce nitrogen oxide (NOx) emissions at the facility. Upon regulatory approval of the project, $4 million of project costs incurred to-date including all pre-construction expenditures and the wholesale portion of deferred preliminary survey and investigation charges were transferred from “Regulatory assets” to “Construction work in progress” on Alliant Energy’s and WPL’s Consolidated Balance Sheets in 2010.
Alliant Energy, IPL and WPL anticipate that all remaining costs for proposed CACP projects are probable of recovery from future rates charged to customers. The recovery period for these remaining costs will generally be determined by regulators in future rate proceedings.
IPL’s Sixth Street costs - In 2008, Sixth Street was shut down as a result of significant damage caused by severe flooding in downtown Cedar Rapids. In January 2011, IPL received approval from the IUB to recover $16 million from its retail electric customers in Iowa over a five-year period ending February 2014 for a portion of the remaining net book value of Sixth Street and previously impaired CWIP assets related to Sixth Street. The $16 million recovery amount was recorded as a regulatory asset in 2010 with an offsetting increase of $14 million in “Utility accumulated depreciation” on Alliant Energy’s and IPL’s Consolidated Balance Sheets for the remaining net book value of Sixth Street and a credit of $2 million in “Other operation and maintenance” in Alliant Energy’s and IPL’s Consolidated Statements of Income in 2010 related to the previously impaired construction work in progress assets.
IPL’s flood-related costs - In January 2010, IPL received approval from the IUB to recover $8 million from its retail electric customers in Iowa over a four-year period ending December 2013 related to costs incurred in 2008 from severe flooding in
121
IPL’s service territory. These costs included $4 million of operation and maintenance expenses and $4 million of charges for leasing temporary generating capacity. Alliant Energy and IPL recorded an $8 million regulatory asset in 2009 with offsetting pre-tax regulatory-related credits of $4 million in “Other operation and maintenance” and $4 million in “Purchased electric capacity” in their Consolidated Statements of Income in 2009 related to amounts approved for recovery.
In January 2011, IPL received approval from the IUB to recover $7 million from its retail electric customers in Iowa over a four-year period ending February 2014 related to operation and maintenance expenses incurred in 2009 for restoration activities from severe flooding in IPL’s service territory. Alliant Energy and IPL recorded a $7 million regulatory asset in 2010 with an offsetting pre-tax regulatory-related credit of $7 million in “Other operation and maintenance” in their Consolidated Statements of Income in 2010 related to amounts approved for recovery. In 2010, $1 million of this regulatory asset was amortized.
Wholesale customer rate recovery - IPL and WPL accrue revenues from their wholesale customers to the extent that the actual net revenue requirements calculated in accordance with FERC-approved formula rates for the reporting period are higher than the amounts billed to wholesale customers during such period. In accordance with authoritative guidance, regulatory assets are recorded as the offset for these accrued revenues under formulaic rate making programs. IPL’s estimated recovery amount is recorded in the current period of service and is reflected in customer bills within two years under the provisions of approved formula rates. WPL’s estimated recovery amount is recorded in the current period of service and subject to final adjustments after a customer audit period in the subsequent year. Final settled recovery amounts are reflected in WPL’s customer bills within two years under the provisions of approved formula rates.
In 2009, WPL filed a request with FERC seeking approval of changes to WPL’s wholesale formula rates in order to implement for billing purposes the full impact of accounting for defined benefit postretirement plans. In July 2010, FERC approved a settlement agreement reached between WPL and the wholesale customers regarding the formula rate change. WPL recorded an additional $4 million of electric revenues and regulatory assets in 2010 to reflect the settlement and is reducing the regulatory asset concurrently with collections from customers.
WPL’s benefits costs - In 2008, WPL received approval from the PSCW to defer the retail portion of pension and other benefit costs charged to other operation and maintenance expenses during 2009 in excess of $4 million. WPL’s retail portion of pension and other benefit costs expensed during 2009 were $16 million resulting in the recognition of a regulatory asset of $12 million in 2009 for the deferred portion of these costs. In December 2009, WPL received approval from the PSCW to recover the deferred costs over a five-year period ending December 2014.
WPL’s MISO-related costs - In 2007, the PSCW issued an order requiring WPL to discontinue, effective Dec. 31, 2007, the deferral of the retail portion of certain costs incurred by WPL to participate in the MISO market. WPL incurred $10 million of deferred retail costs prior to 2008 to participate in the MISO market that were recognized in regulatory assets on Alliant Energy’s and WPL’s Consolidated Balance Sheets. In 2008, WPL received approval from the PSCW to recover the $10 million of deferred retail costs over a two-year period ending December 2010. MISO costs incurred after Dec. 31, 2007 are subject to recovery through WPL’s retail electric fuel-related cost recovery mechanism.
Other - IPL and WPL assess whether their regulatory assets are probable of future recovery by considering factors such as applicable regulations, recent orders by the applicable regulatory agencies, historical treatment of similar costs by the applicable regulatory agencies and regulatory environment changes. Based on these assessments, Alliant Energy, IPL and WPL believe the regulatory assets recognized as of Dec. 31, 2010 in the above table are probable of future recovery. However, no assurance can be made that IPL and WPL will recover all of these regulatory assets in future rates. If future recovery of a regulatory asset ceases to be probable, the regulatory asset will be charged to expense in the period in which future recovery ceases to be probable.
Regulatory Liabilities - At Dec. 31, regulatory liabilities were comprised of the following items (in millions):
| | | | | | | | | | | | | | | | | | | | | | | | |
| | | Alliant Energy | | | IPL | | | WPL | |
| | | 2010 | | | 2009 | | | 2010 | | | 2009 | | | 2010 | | | 2009 | |
Cost of removal obligations | | | $395.4 | | | | $402.9 | | | | $257.6 | | | | $259.9 | | | | $137.8 | | | | $143.0 | |
Tax-related | | | 210.3 | | | | 178.5 | | | | 198.1 | | | | 166.3 | | | | 12.2 | | | | 12.2 | |
IPL electric transmission assets sale | | | 71.8 | | | | 83.6 | | | | 71.8 | | | | 83.6 | | | | -- | | | | -- | |
IPL DAEC sale | | | 42.3 | | | | 47.0 | | | | 42.3 | | | | 47.0 | | | | -- | | | | -- | |
Emission allowances | | | 34.4 | | | | 53.4 | | | | 33.9 | | | | 47.2 | | | | 0.5 | | | | 6.2 | |
Commodity cost recovery | | | 12.7 | | | | 26.2 | | | | 7.5 | | | | 22.0 | | | | 5.2 | | | | 4.2 | |
Derivatives | | | 11.0 | | | | 25.4 | | | | 4.3 | | | | 13.2 | | | | 6.7 | | | | 12.2 | |
IPL Iowa retail rate refund reserve | | | 3.9 | | | | -- | | | | 3.9 | | | | -- | | | | -- | | | | -- | |
Other | | | 18.3 | | | | 19.8 | | | | 8.5 | | | | 5.5 | | | | 9.8 | | | | 14.3 | |
| | | | | | | | | | | | | | | | | | | | | | | | |
| | | $800.1 | | | | $836.8 | | | | $627.9 | | | | $644.7 | | | | $172.2 | | | | $192.1 | |
| | | | | | | | | | | | | | | | | | | | | | | | |
122
Regulatory liabilities related to cost of removal obligations, to the extent expensed through depreciation rates, reduce rate base. A significant portion of the remaining regulatory liabilities are not used to reduce rate base in the revenue requirement calculations utilized in IPL’s and WPL’s respective rate proceedings.
Cost of removal obligations - Alliant Energy collects in rates future removal costs for many assets that do not have associated legal AROs. Alliant Energy records a regulatory liability for the estimated amounts it has collected in rates for these future removal costs less amounts spent on removal activities.
Tax-related - Refer to Note 5 for information regarding a change in tax accounting method for repairs expenditures and the tax method for allocating flood insurance proceeds, which represent a significant portion of the tax-related regulatory liabilities on Alliant Energy’s and IPL’s Consolidated Balance Sheets at Dec. 31, 2010 and 2009. In January 2011, the IUB approved IPL’s proposed customer cost management plan, which will utilize tax-related regulatory liabilities related to projected tax benefits from these tax accounting methods to credit IPL’s retail customer bills in Iowa during 2011, 2012 and 2013. IPL estimates $64 million of tax-related regulatory liabilities will be utilized to credit customer’s bills in 2011. Tax-related regulatory liability amounts utilized to credit customer bills in 2012 and 2013 will be determined in the future.
IPL electric transmission assets sale - In 2007, IPL completed the sale of its electric transmission assets to ITC and recognized a gain based on the terms of the agreement. Upon closing of the sale, IPL established a regulatory liability of $89 million pursuant to conditions established by the IUB when it allowed the transaction to proceed. The regulatory liability represented the present value of IPL’s obligation to refund to its customers payments beginning in the year IPL’s customers experience an increase in rates related to the transmission charges assessed by ITC. The regulatory liability accrues interest at the monthly average U.S. Treasury rate for three-year maturities.
Iowa retail portion - In 2009, the IUB issued an order authorizing IPL to use a portion of this regulatory liability to reduce Iowa retail electric customers’ rates by $12 million for the period from July 2009 through February 2010 with billing credits included in the monthly energy adjustment clause. In January 2010, the IUB issued an order authorizing IPL to use up to $46 million of this regulatory liability to offset electric transmission costs expected to be billed to IPL by ITC in 2010 related to ITC’s 2008 transmission revenue adjustment. IPL expects to utilize $41 million of this regulatory liability over a five-year period ending December 2014 to offset the Iowa retail portion of transmission costs billed to IPL by ITC in 2010 related to ITC’s 2008 transmission revenue adjustment. In 2010, $8 million of this regulatory liability was amortized with an equal and offsetting amount of amortization for IPL’s regulatory asset related to electric transmission costs. In January 2011, the IUB approved IPL’s proposal to utilize $20 million of this regulatory liability to offset ITC’s 2009 transmission revenue adjustment expected to be billed to IPL in 2011. The IUB also authorized IPL to utilize $3 million of this regulatory liability in 2011 to reduce IPL’s Iowa retail electric rate base associated with the Whispering Willow - East wind project.
Minnesota retail portion - In June 2010, the MPUC issued an interim rate order authorizing IPL to use a portion of this regulatory liability to implement an alternative transaction adjustment through its energy adjustment clause resulting in annual credits of $2 million to its Minnesota retail electric customers beginning in July 2010 to coincide with the effective date of the interim rate increase for Minnesota retail customers. In 2010, IPL refunded $1 million to its Minnesota retail electric customers under the alternative transaction adjustment.
Refunds related to any remaining balance of this regulatory liability are expected to be determined in future rate proceedings.
IPL DAEC sale - In 2006, IPL completed the sale of its 70% ownership interest in DAEC and recognized a regulatory liability of approximately $59 million from the transaction based on the terms of the sale agreement. Pursuant to the IUB order approving the DAEC sale, the gain resulting from the sale was used to establish a regulatory liability. In 2009, IPL received $12 million as part of a settlement of a claim filed against the U.S. Department of Energy (DOE) in 2004 for recovery of damages due to the DOE’s delay in accepting spent nuclear fuel produced at DAEC. IPL recognized the $12 million received from the settlement as an increase to the regulatory liability established with the sale of DAEC. The regulatory liability accrues interest at the monthly average U.S. Treasury rate for three-year maturities.
In 2009, the IUB authorized IPL to utilize $29 million of this regulatory liability to reduce electric plant in service in 2009 related to the cumulative AFUDC recognized for the Whispering Willow - East wind project. In January 2010, IPL received approval from the IUB to utilize $26 million of this regulatory liability to offset the amortization of costs incurred for the Sutherland #4 project over a five-year period ending September 2014. In 2010, $5 million of this regulatory liability was amortized with an equal and offsetting amount of amortization for IPL’s regulatory asset related to the Sutherland #4 project. In January 2011, the IUB authorized IPL to utilize $23 million of this regulatory liability to reduce IPL’s Iowa retail electric rate base in 2011 for the Whispering Willow - East wind project.
Refunds related to any remaining balance of this regulatory liability are expected to be determined in future rate proceedings.
123
Emission allowances - IPL and WPL have entered into various transactions for the purchase and sale or non-monetary exchange of sulfur dioxide (SO2) and NOx emission allowances. The emission allowances acquired in these transactions were recorded as intangible assets. The value received from these transactions was recorded as regulatory liabilities given the emission allowances relinquished had a zero-cost basis. The amortization of these intangible assets and regulatory liabilities are equal and offsetting and based on the amount of the emission allowances acquired that were utilized each reporting period. Refer to Note 15 for additional details regarding Alliant Energy’s, IPL’s and WPL’s emission allowances.
Commodity cost recovery - The wholesale electric rates and retail gas rates of IPL and WPL as well as the retail electric rates of IPL provide for subsequent adjustments to rates for changes in prudently incurred commodity costs used to serve customers. The cumulative under-/over-collection of these commodity costs are recorded as regulatory assets/regulatory liabilities until they are automatically reflected in future billings to customers. Refer to Note 1(h) for additional details of IPL’s and WPL’s cost recovery mechanisms. Refer to Note 2 for discussion of certain rate refund reserves recorded as regulatory liabilities on Alliant Energy’s and WPL’s Consolidated Balance Sheets related to the commodity cost recovery mechanism used to determine WPL’s retail electric rates.
Derivatives - In accordance with IPL’s and WPL’s fuel and natural gas recovery mechanisms, gains from derivative instruments are refunded to customers in the future when any gains are realized. Based on these recovery mechanisms, the changes in the fair value of derivative assets resulted in comparable changes to regulatory liabilities on Alliant Energy’s, IPL’s and WPL’s Condensed Consolidated Balance Sheets during 2010. Refer to Note 11(a) for additional details of Alliant Energy’s, IPL’s and WPL’s derivative assets.
IPL Iowa rate refund reserve - In 2010, Alliant Energy and IPL recorded a $4 million reserve, including interest, for refunds anticipated to be paid to IPL’s retail electric customers in Iowa in 2011 in accordance with a February 2011 order issued by the IUB. Refer to Note 2 for additional details of the IUB’s order.
(c) Income Taxes -Alliant Energy, IPL and WPL follow the liability method of accounting for deferred income taxes, which requires the establishment of deferred income tax assets and liabilities, as appropriate, for temporary differences between the tax basis of assets and liabilities and the amounts reported in the consolidated financial statements. Deferred income taxes are recorded using currently enacted tax rates. Changes in deferred income tax assets and liabilities associated with certain property-related differences at IPL are accounted for differently than other subsidiaries of Alliant Energy due to rate making practices in Iowa. Rate making practices in Iowa do not include the impact of certain deferred tax expenses (benefits) in the determination of retail rates. Based on these rate making practices, deferred tax expense (benefit) related to these property-related differences at IPL is not recorded in the income statement but instead charged to regulatory assets or regulatory liabilities until these temporary differences are reversed. Refer to Note 1(b) for further discussion of regulatory assets and regulatory liabilities associated with property-related differences at IPL. In Wisconsin, the PSCW has allowed rate recovery of deferred taxes on all temporary differences since 1991.
Alliant Energy, IPL and WPL recognize positions taken, or expected to be taken, in income tax returns that are more-likely-than-not to be realized, assuming that the position will be examined by tax authorities with full knowledge of all relevant information. If it is more-likely-than-not that a tax position, or some portion thereof, will not be sustained, the related tax benefits are not recognized in the financial statements. For the majority of uncertain tax positions, the ultimate deductibility is highly certain, but there is uncertainty about the timing of such deductibility. Uncertain tax positions may result in an increase in income taxes payable, a reduction of income tax refunds receivable or changes in deferred taxes. Also, when uncertainty about the deductibility of an amount is limited to the timing of such deductibility, the increase in taxes payable (or reduction in tax refunds receivable) is accompanied by a decrease in deferred tax liabilities. Generally Alliant Energy, IPL and WPL recognize current taxes payable related to uncertain tax positions in “Accrued taxes” and non-current taxes payable related to uncertain tax positions in “Other long-term liabilities and deferred credits” on their respective Consolidated Balance Sheets. However, if the uncertain tax position would be settled through the reduction of a net operating loss rather than through the payment of cash, the uncertain tax position is reflected in “Deferred income taxes” on their Consolidated Balance Sheets. Refer to Note 5 for further discussion of uncertain tax positions.
Alliant Energy, IPL and WPL defer investment tax credits and amortize the credits to income over the average lives of the related property. Other tax credits for Alliant Energy, IPL and WPL reduce income tax expense in the year claimed.
Alliant Energy, IPL and WPL have elected the alternative transition method to calculate their beginning pool of excess tax benefits available to absorb any tax deficiencies associated with recognition of share-based payment awards.
124
(d) Cash and Cash Equivalents - Cash and cash equivalents include short-term liquid investments that have original maturities of less than 90 days. At Dec. 31, 2010 and 2009, the majority of Alliant Energy’s cash and cash equivalents were invested in money market funds providing daily liquidity. The yield on these funds can fluctuate daily. Information on Alliant Energy’s cash and cash equivalents at Dec. 31 was as follows (dollars in millions):
| | | | |
| | | 2010 | | 2009 |
Total cash and cash equivalents | | $159 | | $175 |
Money market fund investments | | $128 | | $169 |
Interest rates on money market fund investments | | 0.17% - 0.19% | | 0.09% - 0.11% |
(e) Utility Property, Plant and Equipment -
General - Utility plant in service (other than acquisition adjustments) is recorded at the original cost of acquisition or construction, which includes material, labor, contractor services, AFUDC and allocable overheads, such as supervision, engineering, benefits, certain taxes and transportation. Repairs, replacements and renewals of items of property determined to be less than a unit of property or that do not increase the property’s life or functionality are charged to maintenance expense. Ordinary retirements of utility plant and salvage value are netted and charged to accumulated depreciation upon removal from utility plant accounts and no gain or loss is recognized. Removal costs incurred reduce the regulatory liability.
Electric plant in service - Electric plant in service by functional category at Dec. 31 was as follows (in millions):
| | | | | | | | | | | | | | | | | | | | | | | | |
| | | Alliant Energy | | | IPL | | | WPL | |
| | | 2010 | | | 2009 | | | 2010 | | | 2009 | | | 2010 | | | 2009 | |
| Generation | | | $3,818.9 | | | | $3,402.0 | | | | $2,387.7 | | | | $2,263.1 | | | | $1,431.2 | | | | $1,138.9 | |
Distribution | | | 3,575.6 | | | | 3,371.9 | | | | 1,954.1 | | | | 1,842.9 | | | | 1,621.5 | | | | 1,529.0 | |
Other | | | 282.3 | | | | 263.8 | | | | 220.4 | | | | 205.2 | | | | 61.9 | | | | 58.6 | |
| | | | | | | | | | | | | | | | | | | | | | | | |
| | | $7,676.8 | | | | $7,037.7 | | | | $4,562.2 | | | | $4,311.2 | | | | $3,114.6 | | | | $2,726.5 | |
| | | | | | | | | | | | | | | | | | | | | | | | |
The increase in IPL’s generation portion of electric plant in service during 2010 was primarily due to the impact of placing the Lansing Generating Station Unit 4 (Lansing Unit 4) emission controls into service in 2010. This item was partially offset by IPL’s retirement of certain electric generating units in 2010. The increase in WPL’s generation portion of electric plant in service during 2010 was primarily due to the impact of placing a portion of the Bent Tree - Phase I wind project into service in 2010.
Wind Generation Projects -
IPL’s Whispering Willow Wind Site - In 2007, IPL acquired approximately 500 MW of wind site capacity in Franklin County, Iowa referred to as the Whispering Willow wind site. The initial 200 MW of the wind site was utilized for the Whispering Willow - East wind project, which began generating electricity in 2009. Future development of the balance of the wind site will depend on numerous factors such as renewable portfolio standards, availability of wind turbines and transmission capabilities. As of Dec. 31, 2010, IPL’s capitalized costs related to the remaining approximately 300 MW of wind site capacity at Whispering Willow were $18 million and were recorded in “Other property, plant and equipment” on Alliant Energy’s and IPL’s Consolidated Balance Sheets.
Whispering Willow - East Wind Project - In 2008, IPL received approval from the IUB to construct the 200 MW Whispering Willow - East wind project. The advanced rate making principles for this project, as approved by the IUB in 2008, included a predetermined level, or “cost cap,” of $417 million for construction costs. Final construction costs for the project exceeded this cost cap. Therefore, IPL was required to demonstrate the construction costs above the cost cap were prudent and reasonable in order to recover the additional costs in future electric rates. In January 2011, IPL received an order from the IUB allowing IPL to recover all of its Whispering Willow - East wind project construction costs. However, the IUB did not allow IPL to recover a return on the portion of costs above the cost cap associated with the Vestas-American Wind Technology, Inc. (Vestas) wind turbine generator sets and related equipment. As a result, IPL recognized a $21 million impairment related to the disallowance, which was recorded as a reduction to “Electric plant in service” on Alliant Energy’s and IPL’s Consolidated Balance Sheets and a charge to “Utility - other operation and maintenance” in Alliant Energy’s and IPL’s Consolidated Statements of Income in 2010. As of Dec. 31, 2010 and 2009 the capitalized project costs for the Whispering Willow-East wind project of $449 million and $466 million, respectively, were recorded in “Electric plant in service” on Alliant Energy’s and IPL’s Consolidated Balance Sheets. The capitalized costs for the project are being depreciated using a straight-line method of depreciation over a 25-year period.
Refer to Note 1(b) for discussion of regulatory liabilities established at the time of the sales of IPL’s electric transmission assets and DAEC. A portion of these regulatory liabilities was used in 2009 to offset the Whispering Willow - East wind project plant in service balance related to the $29 million of AFUDC recognized for this project, and another portion of these
125
regulatory liabilities will be used in 2011 to offset an additional $26 million of the Whispering Willow - East wind project plant in service balance in accordance with the order received from the IUB in January 2011. Refer to Note 18 for discussion of AROs recorded by Alliant Energy and IPL in 2009 related to IPL’s Whispering Willow - East wind project.
WPL’s Bent Tree Wind Site - In 2009, WPL acquired approximately 400 MW of wind site capacity in Freeborn County, Minnesota, referred to as the Bent Tree wind site. The initial 200 MW of the wind site was utilized to construct the Bent Tree - Phase I wind project, which began generating electricity in 2010. Future development of the balance of the wind site will depend on numerous factors such as renewable portfolio standards, availability of wind turbines and transmission capabilities. As of Dec. 31, 2010, WPL’s capitalized costs related to the remaining approximately 200 MW of wind site capacity at Bent Tree were $13 million and were recorded in “Other property, plant and equipment” on Alliant Energy’s and WPL’s Consolidated Balance Sheets.
Bent Tree - Phase I Wind Project - In 2009, WPL received approval from the MPUC and PSCW to construct the initial 200 MW of the wind project. As of Dec. 31, 2010, WPL incurred capitalized expenditures of $406 million and recognized $13 million of AFUDC related to the 200 MW wind project. WPL placed a portion of the project into service in 2010, which resulted in a transfer of $265 million of capitalized project costs from “Construction work in progress - Bent Tree - Phase I wind project” to “Electric plant in service” on Alliant Energy’s and WPL’s Consolidated Balance Sheets in 2010. These capitalized costs for the project are being depreciated using a straight-line method of depreciation over a 30-year period. The remainder of the capitalized expenditures and AFUDC are recorded in “Construction work in progress - Bent Tree - Phase I wind project” on Alliant Energy’s and WPL’s Consolidated Balance Sheets at Dec. 31, 2010 and 2009. Refer to Note 18 for discussion of AROs recorded by WPL in 2010 related to its Bent Tree - Phase I wind project.
WPL’s Green Lake and Fond du Lac Counties Wind Site - In 2009, WPL purchased development rights to an approximately 100 MW wind site in Green Lake and Fond du Lac Counties in Wisconsin. As of Dec. 31, 2010, WPL’s capitalized costs related to this wind project were $5 million and were recorded in “Other property, plant and equipment” on Alliant Energy’s and WPL’s Consolidated Balance Sheets.
Wind Turbine Generators - In 2008, Alliant Energy entered into a master supply agreement with Vestas to purchase 500 MW of wind turbine generator sets and related equipment. Alliant Energy utilized 400 MW of these wind turbine generator sets and related equipment to construct IPL’s Whispering Willow - East wind project and WPL’s Bent Tree - Phase I wind project. Alliant Energy believes the Whispering Willow wind site in Iowa is the best location to deploy the remaining 100 MW of wind turbine generator sets and related equipment and is currently evaluating which of its subsidiaries will construct the 100 MW wind project. As of Dec. 31, 2010, the capitalized costs related to the remaining 100 MW of wind turbine generator sets and related equipment were $81 million and were recorded in “Other property, plant and equipment” on Alliant Energy’s and IPL’s Consolidated Balance Sheets. Refer to Note 12(b) for remaining future obligations under the master supply agreement with Vestas.
Environmental Compliance Plans Projects -
Lansing Unit 4 Emission Controls - In 2010, IPL completed the installation of an SCR system and baghouse at Lansing Unit 4 to reduce NOx and mercury emissions, respectively, at the generating facility. As of Dec. 31, 2010, Alliant Energy and IPL had incurred capitalized expenditures of $99 million and recognized $6 million of AFUDC for the SCR system and had incurred capitalized expenditures of $88 million and recognized $3 million of AFUDC for the baghouse at Lansing Unit 4. IPL placed the projects into service in 2010, which resulted in a transfer of the capitalized project costs from “Construction work in progress - Lansing Generating Station Unit 4 emission controls” to “Electric plant in service” on Alliant Energy’s and IPL’s Consolidated Balance Sheets in 2010. The capitalized costs for the project are being depreciated using a straight-line method of depreciation over a 25-year period. Refer to Note 12(c) for discussion of a vendor dispute related to the installation of emission controls at Lansing Unit 4.
Edgewater Unit 5 Emission Controls - In 2010, WPL began construction on the installation of an SCR system at Edgewater Unit 5 to reduce NOx emissions at the generating facility. As of Dec. 31, 2010, Alliant Energy and WPL recorded $17 million of capitalized expenditures related to this project in “Construction work in progress - other” on Alliant Energy’s and WPL’s Consolidated Balance Sheets.
Retirements -
Sixth Street - Sixth Street was shut down in June 2008 as a result of significant damage caused by severe flooding in downtown Cedar Rapids. Sixth Street was a facility that generated electricity and was also a source of steam generating capability in downtown Cedar Rapids. In 2009, IPL announced its decision to discontinue providing steam service to customers in downtown Cedar Rapids resulting in a $4 million impairment charge related to the steam assets associated with Sixth Street. The impairment charge was recorded as a reduction in steam plant in service and a charge to “Utility - other operation and maintenance” in Alliant Energy’s and IPL’s Consolidated Statements of Income in 2009. In 2010, IPL completed its evaluation of the future viability of Sixth Street in 2010 and decided not to rebuild electric operations at Sixth
126
Street. IPL also received approval from MISO in 2010 to retire Sixth Street. The retirement of Sixth Street resulted in a $41 million reduction in both “Electric plant in service” and “Utility accumulated depreciation” on Alliant Energy’s and IPL’s Consolidated Balance Sheets in 2010 related to the value of the gross plant. In addition, IPL recognized a $4 million impairment in 2010 related to the assets of Sixth Street that were recorded in CWIP. The impairment was recorded as a reduction in CWIP and a charge to “Utility - other operation and maintenance” in Alliant Energy’s and IPL’s Consolidated Statements of Income in 2010.
In January 2011, IPL received approval from the IUB to recover $16 million from its retail electric customers in Iowa over the next five years for a portion of the remaining net book value and impaired CWIP at Sixth Street. This recovery was recorded as a $16 million increase in “Regulatory assets” and a $14 million increase in “Utility accumulated depreciation” on Alliant Energy’s and IPL’s Consolidated Balance Sheets and a $2 million credit to “Utility - other operation and maintenance” in Alliant Energy’s and IPL’s Consolidated Statements of Income in 2010. IPL also recognized a $7 million impairment charge in 2010 related to the remaining net book value of Sixth Street that the IUB did not allow IPL to recover. This impairment was recorded in “Utility - other operation and maintenance” in Alliant Energy’s and IPL’s Consolidated Statements of Income in 2010. Refer to Note 1(b) for further discussion of the regulatory assets related to Sixth Street.
IPL’s Integrated Resource Plan (IRP) - In 2010, IPL filed an IRP with the MPUC for the 2010 through 2025 planning period. The IRP must be filed once every two years and includes plans for meeting the electric needs of customers at a reasonable cost. IPL’s IRP filed in 2010 provides details of a process to retire certain older, smaller, and less-efficient units including Lansing Generating Station Unit 2, Sutherland Generating Station Unit 2, Prairie Creek Generating Station Unit 2, M.L. Kapp Generating Station Unit 1, Agency Street Combustion Turbines Units 1-4, Dubuque Generating Station Unit 2, and Fox Lake Generating Station Units 2 and 4. The remaining units at each generating station will continue to generate cost-effective power on behalf of IPL customers. These units were retired in 2010 resulting in reductions of $32 million to “Electric plant in service” and “Utility accumulated depreciation” on Alliant Energy’s and IPL’s Consolidated Balance Sheets in 2010.
Depreciation - IPL and WPL use a combination of remaining life and straight-line depreciation methods as approved by their respective regulatory commissions. The composite or group method of depreciation is used, in which a single depreciation rate is applied to the gross investment in a particular class of property. This method pools similar assets and then depreciates each group as a whole. Periodic depreciation studies are performed to determine the appropriate group lives, net salvage and group depreciation rates. These depreciation studies are subject to review and approval by IPL’s and WPL’s respective regulatory commissions. Depreciation expense is included within the recoverable cost of service component of rates charged to customers. The average rates of depreciation for electric, gas and other properties, consistent with current rate making practices, were as follows:
| | | | | | | | | | | | | | | | | | | | | | | | |
| | | IPL | | | WPL | |
| | | 2010 | | | 2009 | | | 2008 | | | 2010 | | | 2009 | | | 2008 | |
Electric: | | | | | | | | | | | | | | | | | | | | | | | | |
Generation | | | 3.7% | | | | 3.4% | | | | 3.3% | | | | 2.9% | | | | 3.2% | | | | 3.0% | |
Distribution | | | 2.7% | | | | 2.7% | | | | 2.8% | | | | 2.6% | | | | 3.0% | | | | 3.1% | |
Gas | | | 3.3% | | | | 3.1% | | | | 3.0% | | | | 2.2% | | | | 2.8% | | | | 3.1% | |
Other | | | 4.9% | | | | 6.0% | | | | 4.8% | | | | 6.5% | | | | 6.4% | | | | 5.4% | |
AFUDC - AFUDC represents costs to finance construction additions including a return on equity component and cost of debt component as required by regulatory accounting. The concurrent credit for the amount of AFUDC capitalized is recorded as “Allowance for funds used during construction” in the Consolidated Statements of Income. The amount of AFUDC generated by equity and debt components was as follows (in millions):
| | | | | | | | | | | | | | | | | | | | | | | | | | | | | | | | | | | | |
| | | Alliant Energy | | | IPL | | | WPL | |
| | | 2010 | | | 2009 | | | 2008 | | | 2010 | | | 2009 | | | 2008 | | | 2010 | | | 2009 | | | 2008 | |
| | | | | | | | | | | | | | | | | | | | | | | | | | | | | | | | | | | | |
Equity | | | $11.2 | | | | $28.2 | | | | $17.2 | | | | $3.0 | | | | $24.2 | | | | $10.8 | | | | $8.2 | | | | $4.0 | | | | $6.4 | |
Debt | | | 6.8 | | | | 11.5 | | | | 7.5 | | | | 2.5 | | | | 9.8 | | | | 4.3 | | | | 4.3 | | | | 1.7 | | | | 3.2 | |
| | | | | | | | | | | | | | | | | | | | | | | | | | | | | | | | | | | | |
| | | $18.0 | | | | $39.7 | | | | $24.7 | | | | $5.5 | | | | $34.0 | | | | $15.1 | | | | $12.5 | | | | $5.7 | | | | $9.6 | |
| | | | | | | | | | | | | | | | | | | | | | | | | | | | | | | | | | | | |
WPL recognized $10 million and $3 million of AFUDC in 2010 and 2009, respectively, for its Bent Tree - Phase I wind project, a portion of which was placed in service in 2010. WPL recognized $6 million of AFUDC in 2008 for its Cedar Ridge wind project, which was placed in service in 2008. IPL recognized $21 million and $8 million of AFUDC in 2009 and 2008, respectively, for its Whispering Willow - East wind project, which was placed in service in 2009.
127
AFUDC for IPL’s construction projects is calculated in accordance with FERC guidelines. AFUDC for WPL’s retail and wholesale jurisdiction construction projects is calculated in accordance with PSCW and FERC guidelines, respectively. The AFUDC recovery rates, computed in accordance with the prescribed regulatory formula, were as follows (Not Applicable (N/A)):
| | | | | | |
| | | 2010 | | 2009 | | 2008 |
IPL (FERC formula - Whispering Willow - East) | | N/A | | 8.4% | | 8.0% |
IPL (FERC formula - other projects) | | 4.8% | | 8.0% | | 7.6% |
WPL (PSCW formula - retail jurisdiction) (a) | | 8.8% | | 9.0% | | 9.0% |
WPL (FERC formula - wholesale jurisdiction) | | 7.2% | | 6.7% | | 6.8% |
| (a) | Consistent with the PSCW’s retail rate case order issued in December 2009, WPL earned a current return on 50% of the estimated CWIP related to its Bent Tree - Phase I wind project for 2010 and accrued AFUDC on the remaining 50% in 2010. In addition, the PSCW’s order changed WPL’s AFUDC recovery rate to 8.8% from 9.0% effective Jan. 1, 2010. |
| (f) | Non-regulated and Other Property, Plant and Equipment - |
General -Non-regulated and other property, plant and equipment is recorded at the original cost of acquisition or construction, which includes material, labor and contractor services. Repairs, replacements and renewals of items of property determined to be less than a unit of property or that do not increase the property’s life or functionality are charged to maintenance expense. The Sheboygan Falls Energy Facility within Alliant Energy’s Non-regulated Generation business represents a significant portion of the non-regulated and other property, plant and equipment and is being depreciated using the straight-line method over a 35-year period. The property, plant and equipment related to Corporate Services, Transportation, RMT and other non-regulated investments is depreciated using the straight-line method over periods ranging from 5 to 30 years. Upon retirement or sale of non-regulated and other property, plant and equipment, the original cost and related accumulated depreciation are removed from the accounts and any gain or loss is included in the Consolidated Statements of Income.
(g) Operating Revenues -
Utility - Revenues from Alliant Energy’s utility business are primarily from electricity and natural gas sales and are recognized on an accrual basis as services are rendered or commodities are delivered to customers. Energy sales to individual customers are based on the reading of customers’ meters, which occurs on a systematic basis throughout each reporting period. Amounts of energy delivered to customers since the date of the last meter reading are estimated at the end of each reporting period and the corresponding estimated unbilled revenue is recorded. The unbilled revenue estimate is based on daily system demand volumes, estimated customer usage by class, weather impacts, line losses and the most recent customer rates.
IPL and WPL participate in bid/offer-based wholesale energy and ancillary services markets operated by MISO. IPL’s and WPL’s customers and generating resources are located in the MISO region. MISO requires that all load serving entities and generation owners, including IPL and WPL, submit hourly day-ahead and/or real-time bids and offers for energy and ancillary services. The MISO day-ahead and real-time transactions are grouped together, resulting in a net supply to or net purchase from MISO of megawatt-hours (MWhs) for each hour of each day. The net supply to MISO is recorded in “Electric operating revenues” and the net purchase from MISO is recorded in “Electric production fuel and energy purchases” in the Consolidated Statements of Income. IPL and WPL also periodically engage in related transactions in PJM Interconnection, LLC’s bid/offer-based wholesale energy market, which are accounted for similar to the MISO transactions.
Non-regulated - Revenues from Alliant Energy’s non-regulated businesses are primarily from its RMT business and are recognized on an accrual basis based on services provided as specified under contract terms. Alliant Energy’s RMT business accounts for revenues from certain large construction management projects under the percentage of completion and cost-to-cost methods. Revenues from fixed-price and modified fixed-price construction contracts are recognized on the percentage-of-completion method, measured by the percentage of costs incurred to date to the estimated total costs for each contract. This method is used because management considers total costs to be the best available measure of progress on these contracts. Revenues from cost-plus-fee contracts are recognized on the basis of costs incurred during the reporting period plus the fee earned, measured by the cost-to-cost method. Revenues from time-and-material contracts are recognized in the period the work is performed.
Taxes Collected from Customers - Certain of Alliant Energy’s subsidiaries serve as collection agents for sales or various other taxes and record revenues on a net basis. Operating revenues do not include the collection of the aforementioned taxes.
128
(h) Utility Cost Recovery Mechanisms -
Electric Production Fuel and Energy Purchases -IPL and WPL burn coal and other fossil fuels to produce electricity at their generating facilities to meet the demand of their customers and charge the cost of fossil fuels used during each period to “Electric production fuel and energy purchases” in the Consolidated Statements of Income. IPL and WPL also purchase electricity to meet the demand of their customers and charge the costs to purchase the electricity during each period to “Electric production fuel and energy purchases” in the Consolidated Statements of Income.
The cost recovery mechanisms applicable for IPL’s retail electric customers and IPL’s and WPL’s wholesale electric customers provide for subsequent adjustments to their electric rates for changes in electric production fuel and purchased energy expenses (fuel-related costs). Changes in the under-/over-collection of these costs each period are also recognized in “Electric production fuel and energy purchases” in the Consolidated Statements of Income. The cumulative effects of the under/over collection of these costs are recorded in current “Regulatory assets” or current “Regulatory liabilities” on the Consolidated Balance Sheets until they are reflected in future billings to customers.
The cost recovery mechanism applicable for WPL’s retail electric customers was changed effective Jan. 1, 2011. For periods prior to Jan. 1, 2011, WPL’s retail electric rates approved by the PSCW were based on forecasts of forward-looking test periods and included estimates of future fuel-related costs anticipated during the test period. During each electric retail rate proceeding, the PSCW set fuel monitoring ranges based on the forecasted fuel-related costs used to determine retail base rates. If WPL’s actual fuel-related costs fell outside these fuel monitoring ranges during the test period, WPL and/or other parties could request, and the PSCW could authorize, an adjustment to future retail electric rates based on changes in fuel-related costs only. The PSCW also could have authorized an interim retail rate increase. However, if the final retail rate increase was less than the monitoring range threshold required to be met in order to request interim rate relief, all interim rates collected would be subject to refund to WPL’s retail customers with interest at the current authorized return on common equity rate. In addition, if the final retail rate increase was less than the interim retail rate increase, WPL must refund any excess collections above the final rate increase to its retail customers with interest at the current authorized return on common equity rate.
For periods after Dec. 31, 2010, the cost recovery mechanism applicable for WPL’s retail electric customers will continue to be based on forecasts of fuel-related costs expected to be incurred during forward-looking test year periods and fuel monitoring ranges determined by the PSCW during each electric retail rate proceeding or in a separate fuel cost plan approval proceeding. However, under the new cost recovery mechanism if WPL’s actual fuel-related costs fall outside these fuel monitoring ranges during the test period, WPL is authorized to defer the incremental over- or under-collection of fuel costs that are outside the approved ranges. Such deferred amounts will be recognized in “Electric production fuel and energy purchases” in Alliant Energy’s and WPL’s Consolidated Statements of Income each period. The cumulative effects of these deferred amounts will be recorded in current “Regulatory assets” or current “Regulatory liabilities” on Alliant Energy’s and WPL’s Consolidated Balance Sheets until they are reflected in future billings to customers.
Purchased Electric Capacity -IPL and WPL enter into purchased power agreements (PPAs) to help meet the electricity demand of their customers. Certain of these PPAs include minimum payments for IPL’s and WPL’s rights to electric generating capacity, which are charged each period to “Purchased electric capacity” in the Consolidated Statements of Income. Purchased electric capacity expenses are recovered from IPL’s and WPL’s retail electric customers through changes in base rates determined during periodic rate proceedings. Purchased electric capacity expenses are recovered from wholesale electric customers of IPL and WPL through annual changes in base rates determined by a formula rate structure.
Electric Transmission Service -IPL and WPL incur costs for the transmission of electricity to their customers and charge these costs each period to “Electric transmission service” in the Consolidated Statements of Income. Electric transmission service expenses are recovered from WPL’s retail electric customers through changes in base rates determined during periodic rate proceedings. Electric transmission service expenses are recovered from IPL’s and WPL’s wholesale electric customers through annual changes in base rates determined by a formula rate structure. Prior to Jan. 1, 2011, electric transmission service expenses were recovered from IPL’s retail electric customers through changes in base rates determined during periodic rate proceedings.
In January 2011, the IUB approved IPL’s proposal to implement a transmission cost rider for recovery of electric transmission service expenses with certain conditions. The IUB stipulated that the rider would be implemented on a pilot basis conditional upon IPL’s agreement to not file an electric base rate case for three years from the date of the order and meet additional reporting requirements. In January 2011, IPL accepted the transmission cost rider with the IUB’s conditions. Effective in the first quarter of 2011, electric transmission service expenses will be removed from base rates and billed to IPL’s Iowa electric retail customers through the transmission cost rider. This new cost recovery mechanism will provide for subsequent adjustments to electric rates charged to Iowa electric retail customers for changes in electric transmission service expenses. Changes in the under-/over-collection of these costs each period will also be recognized in “Electric transmission service” in Alliant Energy’s and IPL’s Consolidated Statements of Income. The cumulative effects of the under-/over-
129
collection of these costs will be recorded in current “Regulatory assets” or current “Regulatory liabilities” on Alliant Energy’s and IPL’s Consolidated Balance Sheets until they are reflected in future billings to customers.
Cost of Gas Sold -IPL and WPL incur costs for the purchase, transportation and storage of natural gas to serve their gas customers and charge the costs associated with the natural gas delivered to customers during each period to “Cost of gas sold” in the Consolidated Statements of Income. The tariffs for IPL’s and WPL’s retail gas customers provide for subsequent adjustments to their rates for changes in the cost of gas sold. Changes in the under-/over-collection of these costs are also recognized in “Cost of gas sold” in the Consolidated Statements of Income. The cumulative effects of the under-/over-collection of these costs are recorded in current “Regulatory assets” or current “Regulatory liabilities” on the Consolidated Balance Sheets until they are reflected in future billings to customers.
Energy Efficiency Costs -IPL and WPL incur costs to fund energy efficiency programs and initiatives that help customers reduce their energy usage and charge these costs incurred each period to “Utility operating expenses - other operation and maintenance” in the Consolidated Statements of Income. Energy efficiency costs incurred by IPL are recovered from its retail electric and gas customers in Iowa through an additional tariff called an energy efficiency cost recovery (EECR) factor. EECR factors are revised annually and include a reconciliation to eliminate any over- /under-collection of energy efficiency costs from prior periods. Energy efficiency costs incurred by WPL are recovered from retail electric and gas customers through changes in base rates determined during periodic rate proceedings and include a reconciliation to eliminate any over- /under-collection of energy efficiency costs from prior periods. Changes in the under-/over-collection of energy efficiency costs each period are recognized in “Utility operating expenses - other operation and maintenance” in the Consolidated Statements of Income. The cumulative effects of the under- /over-collection of these costs are recorded in current “Regulatory assets” or current “Regulatory liabilities” on the Consolidated Balance Sheets until they are reflected in future billings to customers.
Refer to Notes 1(b) and 2 for additional information regarding these utility cost recovery mechanisms.
(i) Financial Instruments -Alliant Energy, IPL and WPL periodically use financial instruments for risk management purposes to mitigate exposures to fluctuations in certain commodity prices, transmission congestion costs and currency exchange rates. The fair value of those financial instruments that are determined to be derivatives are recorded as assets or liabilities on the Consolidated Balance Sheets. Derivative instruments representing unrealized gain positions are reported as derivative assets, and derivative instruments representing unrealized loss positions are reported as derivative liabilities at the end of each reporting period. Alliant Energy, IPL and WPL also have certain commodity purchase and sales contracts that have been designated, and qualify for, the normal purchase and sale exception and based on this designation, these contracts are accounted for on the accrual basis of accounting. Alliant Energy, IPL and WPL do not offset fair value amounts recognized for the right to reclaim cash collateral (receivable) or the obligation to return cash collateral (payable) against fair value amounts recognized for derivative instruments executed with the same counterparty under the same master netting arrangement. Refer to Note 1(b) for discussion of the recognition of regulatory assets and regulatory liabilities related to the unrealized losses and unrealized gains on IPL’s and WPL’s derivative instruments. Refer to Notes 11 and 12(f) for further discussion of derivatives and related credit risk, respectively.
(j) Pension and Other Postretirement Benefits Plans -For the defined benefit pension and other postretirement benefits plans sponsored by Corporate Services, Alliant Energy allocates costs to IPL, WPL, Resources and the parent company based on labor costs of plan participants.
(k) Asset Impairments -
Property, Plant and Equipment of Regulated Operations -Property, plant and equipment of regulated operations are reviewed for possible impairment whenever events or changes in circumstances indicate all or a portion of the carrying value of the assets may be disallowed for rate-making purposes. If IPL or WPL are diasallowed recovery of any portion of the carrying value of their regulated property, plant and equipment, an impairment charge is recognized equal to the amount of the carrying value that was disallowed. If IPL or WPL are disallowed a full or partial return on the carrying value of their regulated property, plant and equipment, an impairment charge is recognized equal to the difference between the carrying value and the present value of the future revenues expected from their regulated property, plant and equipment. Refer to Notes 1(b) and 1(e) for discussion of impairments recorded by IPL in 2010 related to Sixth Street and the Whispering Willow - East wind project.
Property, Plant and Equipment of Non-regulated Operations and Intangible Assets -Property, plant and equipment of non-regulated operations and intangible assets are reviewed for possible impairment whenever events or changes in circumstances indicate the carrying value of the assets may not be recoverable. Impairment is indicated if the carrying value of an asset exceeds its undiscounted future cash flows. An impairment charge is recognized equal to the amount the carrying value exceeds the asset’s fair value. Refer to Note 15 for additional discussion of intangible assets.
130
Unconsolidated Equity Investments -If events or circumstances indicate the carrying value of investments accounted for under the equity method of accounting may not be recoverable, potential impairment is assessed by comparing the fair value of these investments to their carrying values as well as assessing if a decline in fair value is temporary. If an impairment is indicated, a charge is recognized equal to the amount the carrying value exceeds the investment’s fair value. Refer to Note 9(a) for additional discussion of investments accounted for under the equity method of accounting.
Goodwill -Goodwill is subject to annual impairment tests, which are completed in the third quarter, and whenever an event occurs or circumstances change in the interim that would indicate goodwill might be impaired. Impairment is indicated if the carrying value of a reporting unit containing the goodwill exceeds the fair value of the reporting unit. Refer to Note 15 for additional discussion of goodwill.
(l) Supplemental Financial Information- The other (income) and deductions included in “Interest income and other” in Alliant Energy’s Consolidated Statements of Income were as follows (in millions):
| | | | | | | | | | | | |
| | | 2010 | | | 2009 | | | 2008 | |
Interest income | | | ($3.3) | | | | ($4.2) | | | | ($19.0) | |
Gains on investment sales, net | | | (0.3) | | | | (0.2) | | | | -- | |
Other | | | (0.4) | | | | (0.5) | | | | 0.4 | |
| | | | | | | | | | | | |
| | | ($4.0) | | | | ($4.9) | | | | ($18.6) | |
| | | | | | | | | | | | |
(m) Operating Leases - WPL has certain PPAs that provide it exclusive rights to all or a substantial portion of the output from the specific generating facility over the contract term and therefore are accounted for as operating leases. Costs associated with these PPAs are included in “Electric production fuel and energy purchases” and “Purchased electric capacity” in Alliant Energy’s and WPL’s Consolidated Statements of Income based on monthly payments for these PPAs. Monthly capacity payments related to one of these PPAs is higher during the peak demand period from May 1 through Sep. 30 and lower in all other periods during each calendar year. These seasonal differences in capacity charges are consistent with expected market pricing and the expected usage of energy from the facility.
(n) Emission Allowances - Emission allowances are granted by the U.S. Environmental Protection Agency (EPA) at zero cost and permit the holder of the allowances to emit certain gaseous by-products of fossil fuel combustion, including SO2 and NOx. Unused emission allowances may be bought and sold or carried forward to be utilized in future years. Purchased emission allowances are recorded as intangible assets at their original cost and evaluated for impairment as long-lived assets to be held and used. Emission allowances allocated to or acquired by Alliant Energy, IPL or WPL are held primarily for consumption. Amortization of emission allowances is based upon a weighted average cost for each category of vintage year utilized during the reporting period and is recorded in “Electric production fuel and energy purchases” in the Consolidated Statements of Income. Cash inflows and outflows related to sales and purchases of emission allowances are recorded as investing activities in the Consolidated Statements of Cash Flows. Refer to Note 15 for additional discussion of emission allowances and Note 1(b) for information regarding regulatory liabilities related to emission allowances.
(o) Cash Flows Presentation -Alliant Energy reports cash flows from continuing operations together with cash flows from discontinued operations in its Consolidated Statements of Cash Flows. Refer to Note 17 for details of cash flows from discontinued operations.
(p) AROs -The fair value of any retirement costs associated with an asset for which Alliant Energy has a legal obligation is recorded as a liability with an equivalent amount added to the asset cost when an asset is placed in service or when sufficient information becomes available to determine a reasonable estimate of the fair value of future retirement costs. The fair value of AROs is generally determined using discounted cash flow analyses. The liability is accreted to its present value each period and the capitalized cost is depreciated over the useful life of the related asset. For IPL and WPL, accretion and depreciation expense related to their regulated operations is recorded to regulatory assets on the respective Consolidated Balance Sheets. Upon settlement of the liability, an entity settles the obligation for its recorded amount or incurs a gain or loss. For IPL and WPL, any gain or loss related to their regulated operations is recorded to regulatory liabilities or regulatory assets on the respective Consolidated Balance Sheets. Refer to Note 18 for additional discussion of AROs.
(q) Debt Issuance and Retirement Costs -Alliant Energy, IPL and WPL defer and amortize debt issuance costs and debt premiums or discounts over the expected lives of IPL’s and WPL’s respective debt issues, considering maturity dates and, if applicable, redemption rights held by others. Alliant Energy’s remaining businesses expense in the period of retirement any unamortized debt issuance costs and debt premiums or discounts on debt retired early. Refer to Note 8(b) for details on Alliant Energy’s, IPL’s and WPL’s long-term debt and a loss on early extinguishment of debt in 2009, and Note 1(b) for information on IPL’s and WPL’s regulatory assets related to debt retired early or refinanced.
131
(r) Allowance for Doubtful Accounts -Alliant Energy, IPL and WPL maintain allowances for doubtful accounts for estimated losses resulting from the inability of their customers to make required payments. Alliant Energy, IPL and WPL estimate the allowance for doubtful accounts based on historical write-offs, customer arrears and other economic factors within their service territories. Allowance for doubtful accounts at Dec. 31 was as follows (in millions):
| | | | | | | | | | | | |
| | | Alliant Energy | | IPL | | WPL |
| | | 2010 | | 2009 | | 2010 | | 2009 | | 2010 | | 2009 |
Customer (a) | | $2.5 | | $4.9 | | $-- | | $2.3 | | $1.4 | | $1.6 |
Other | | 1.9 | | 0.6 | | 0.4 | | 0.2 | | 0.3 | | 0.4 |
| | | | | | | | | | | | |
| | $4.4 | | $5.5 | | $0.4 | | $2.5 | | $1.7 | | $2.0 |
| | | | | | | | | | | | |
| (a) | Refer to Note 4(a) for discussion of IPL’s sales of accounts receivable program. |
(s) Comprehensive Income -In 2010, 2009 and 2008, IPL and WPL had no other comprehensive income; therefore their comprehensive income was equal to their earnings available for common stock for such periods.
(t) New Accounting Pronouncements -
Variable Interest Entities (VIEs)
In 2009, the Financial Accounting Standards Board (FASB) issued authoritative guidance changing the approach to determine a VIE’s primary beneficiary and requiring ongoing assessments of whether an enterprise is the primary beneficiary of a VIE. This guidance also requires additional disclosures about a company’s involvement with VIEs and any significant changes in risk exposure due to that involvement. Alliant Energy, IPL and WPL adopted this guidance on Jan. 1, 2010 with no material impact on their financial condition and results of operations. Refer to Note 19 for disclosures about VIEs.
Transfers of Financial Assets
In 2009, the FASB issued authoritative guidance requiring additional disclosures about transfers of financial assets, including securitization transactions, and where companies have continuing exposure to the risks related to transferred financial assets. This guidance also eliminates the concept of a “qualifying special-purpose entity” and changes the requirements for derecognizing financial assets. Alliant Energy, IPL and WPL adopted this guidance on Jan. 1, 2010. WPL did not transfer any financial assets in 2010 therefore the adoption of this guidance did not have a material impact on its financial condition and results of operations. Alliant Energy and IPL transferred financial assets in 2010. Refer to Note 4(a) for disclosures about these transfers of financial assets and modifications to IPL’s sales of receivables program effective April 2010 that resulted in transactions under IPL’s new sales of receivables program being accounted for as transfers of financial assets.
(2) UTILITY RATE CASES
IPL’s Minnesota Retail Electric Rate Case (2009 Test Year) - In May 2010, IPL filed a request with the MPUC to increase annual rates for its Minnesota retail electric customers by $15 million, or approximately 22%. The request was based on a 2009 historical test year as adjusted for certain known and measurable items at the time of the filing. The key drivers for the filing include recovery of investments in the Whispering Willow - - East wind project and emission control projects at Lansing Unit 4, and recovery of increased electric transmission service costs. In conjunction with the filing, IPL implemented an interim retail rate increase of $14 million, on an annual basis, effective July 6, 2010. The interim retail rate increase was approved by the MPUC and is subject to refund pending determination of final rates from the request. In 2010, Alliant Energy and IPL recorded $5 million in electric revenues from its Minnesota retail electric customers related to the interim retail electric rate increase.
IPL’s Iowa Retail Electric Rate Case (2009 Test Year) -In March 2010, IPL filed a request with the IUB to increase annual rates for its Iowa retail electric customers by $163 million, or approximately 14%. The request was based on a 2009 historical test year as adjusted for certain known and measurable changes occurring up to 12 months after the commencement of the proceeding. The key drivers for the filing include recovery of investments in the Whispering Willow - East wind project and emission control projects at Lansing Unit 4, and recovery of increased electric transmission service costs. In conjunction with the filing, IPL implemented an interim retail electric rate increase of $119 million, on an annual basis, effective March 20, 2010. In 2010, Alliant Energy and IPL recorded $96 million in electric revenues from their Iowa retail electric customers related to the interim retail electric rate increase and the reserve for rate refund discussed below. In February 2011, IPL received an order from the IUB authorizing a final annual retail electric rate increase of $114 million, or approximately 10%. As of Dec. 31, 2010, Alliant Energy and IPL reserved $4 million, including interest, for refunds anticipated to be paid to IPL’s retail electric customers in Iowa in 2011 in accordance with the IUB’s February 2011 order. Refer to Note 1(b) for discussion of the IUB’s decision in a January 2011 order allowing IPL to recover $7 million of flood-related costs incurred in 2009 and to use regulatory liabilities to provide credits to electric retail customers in Iowa under a customer cost management plan and offset the recovery of $26 million of costs incurred for its Whispering Willow - East wind project and up to $20 million of transmission costs expected to be billed to IPL in 2011 related to ITC’s 2009 transmission revenue true-up adjustment. Refer to Note 1(e) for discussion of the IUB’s decision in a January 2011 order
132
disallowing IPL a return on a portion of its Whispering Willow - East wind project costs and recovery of a portion of its costs related to Sixth Street.
IPL’s Iowa Retail Electric Rate Case (2008 Test Year) -In March 2009, IPL filed a request with the IUB to increase annual rates for its Iowa retail electric customers. The request was based on a 2008 historical test year as adjusted for certain known and measurable changes occurring up to 12 months after the commencement of the proceeding. In conjunction with the filing, IPL implemented an interim retail electric rate increase of $84 million, on an annual basis, effective March 27, 2009. In January 2010, IPL received an order from the IUB authorizing final rates equivalent to the interim rate increase. Refer to Note 1(b) for discussion of the IUB’s decision in the January 2010 order allowing IPL to recover $8 million of flood-related costs incurred in 2008 and to use regulatory liabilities to offset the recovery of $26 million of costs incurred for the cancelled Sutherland #4 base-load project and up to $46 million of transmission costs expected to be billed to IPL in 2010 related to ITC’s 2008 transmission revenue true-up adjustment.
WPL’s Retail Electric Rate Case (2011 Test Year) -In April 2010, WPL filed a request with the PSCW to reopen the rate order for its 2010 test year to increase annual retail electric rates for 2011 by $35 million, or approximately 4%. The request was based on a forward-looking test period that included 2011. The key drivers for the filing include recovery of investments in WPL’s Bent Tree - Phase I wind project and expiring deferral credits, partially offset by lower variable fuel expenses.
In August 2010, WPL revised its request for an annual retail electric rate increase to $19 million, or approximately 2%. The primary differences between WPL’s original request in April 2010 and its revised request filed in August 2010 relates to reduced variable fuel expenses, increased wind generation production tax credits and the impact of the $9 million annual rate increase implemented in June 2010 with the interim order in WPL’s 2010 test year retail fuel-related rate filing, which is discussed below.
In December 2010, WPL received an order from the PSCW authorizing an annual retail electric rate increase of $8 million, or approximately 1%, effective Jan. 1, 2011. This $8 million increase in annual rates effective Jan. 1, 2011 combined with the termination of the $9 million interim fuel-related rate increase effective Dec. 31, 2010 will result in a net $1 million decrease in annual electric retail rates charged to customers effective January 2011. Refer to “WPL’s Retail Fuel-related Rate Case (2010 Test Year)” below for additional details of the interim fuel-related rate increase implemented in 2010 and a $5 million reduction to the 2011 test year base rate increase for refunds owed to electric retail customers related to interim fuel cost collections in 2010.
WPL’s Retail Rate Case (2010 Test Year) -In December 2009, WPL received an order from the PSCW authorizing an annual retail electric rate increase of $59 million, or approximately 6%, and an annual retail natural gas increase of $6 million, or approximately 2%, effective January 2010. Refer to Note 1(b) for discussion of the PSCW’s decision in the December 2009 order regarding recovery of previously incurred costs for the cancelled Nelson Dewey #3 base-load project.
WPL’s Retail Fuel-related Rate Case (2010 Test Year) - In April 2010, WPL filed a request with the PSCW to increase annual retail electric rates by $9 million to recover anticipated increased electric production fuel and energy purchases (fuel-related costs) in 2010. Actual fuel-related costs through March 2010, combined with projections of continued higher fuel-related costs for the remainder of 2010, significantly exceeded the amounts being recovered in retail electric rates at the time of the filing. WPL received approval from the PSCW to implement an interim rate increase of $9 million, on an annual basis, effective in June 2010. Updated annual 2010 fuel-related costs during the proceeding resulted in WPL no longer qualifying for a fuel-related rate increase for 2010. In December 2010, the PSCW issued an order authorizing no increase in retail electric rates in 2010 related to fuel-related costs and required the interim rate increase to terminate at the end of 2010. The order also authorized WPL to use $5 million of the interim fuel rates collected in 2010 as a reduction to the 2011 test year base rate increase. As of Dec. 31, 2010, Alliant Energy and WPL reserved $5 million, including interest, for interim fuel cost collections in 2010.
WPL’s Retail Fuel-related Rate Case (2009 Test Year) -Retail fuel-related costs incurred by WPL during the period from Sep. 1, 2009 through Dec. 31, 2009 were lower than retail fuel-related costs used to determine rates during such period resulting in refunds owed to its retail electric customers. As of Dec. 31, 2009, WPL reserved $4 million, including interest, for refunds to be paid to its retail electric customers. In 2010, WPL refunded $4 million, including interest, to its retail electric customers after receiving approval from the PSCW to complete the refund.
Refer to Note 1(h) for further discussion of WPL’s fuel cost recovery mechanism and Note 1(b) for discussion of various other rate matters.
133
(3) LEASES
(a) Operating Leases - Alliant Energy, IPL and WPL have entered into various agreements related to property, plant and equipment rights that are accounted for as operating leases. Alliant Energy’s and WPL’s most significant operating leases relate to certain PPAs. These PPAs contain fixed rental payments related to capacity and contingent rental payments related to the energy portion (actual MWhs) of the respective PPAs. Rental expenses associated with Alliant Energy’s, IPL’s and WPL’s operating leases were as follows (in millions):
| | | | | | | | | | | | | | | | | | | | | | | | | | | | | | | | | | | | |
| | | Alliant Energy | | | IPL | | | WPL | |
| | | 2010 | | | 2009 | | | 2008 | | | 2010 | | | 2009 | | | 2008 | | | 2010 | | | 2009 | | | 2008 | |
Operating lease rental expenses (excluding contingent rentals) | | | $73 | | | | $79 | | | | $90 | | | | $4 | | | | $4 | | | | $6 | | | | $63 | | | | $68 | | | | $77 | |
Contingent rentals related to certain PPAs | | | 4 | | | | 7 | | | | 7 | | | | -- | | | | -- | | | | -- | | | | 4 | | | | 7 | | | | 7 | |
Other contingent rentals | | | 1 | | | | 1 | | | | 2 | | | | 1 | | | | 1 | | | | 1 | | | | -- | | | | -- | | | | -- | |
| | | | | | | | | | | | | | | | | | | | | | | | | | | | | | | | | | | | |
| | | $78 | | | | $87 | | | | $99 | | | | $5 | | | | $5 | | | | $7 | | | | $67 | | | | $75 | | | | $84 | |
| | | | | | | | | | | | | | | | | | | | | | | | | | | | | | | | | | | | |
At Dec. 31, 2010, future minimum operating lease payments, excluding contingent rentals, were as follows (in millions):
| | | | | | | | | | | | | | | | | | | | | | | | | | | | |
| | | 2011 | | | 2012 | | | 2013 | | | 2014 | | | 2015 | | | Thereafter | | | Total | |
| Alliant Energy | | | | | | | | | | | | | | | | | | | | | | | | | | | | |
Riverside Energy Center (Riverside) PPA (a) | | | $59 | | | | $60 | | | | $17 | | | | $-- | | | | $-- | | | | $-- | | | | $136 | |
Synthetic leases (b) | | | 4 | | | | 43 | | | | 2 | | | | 4 | | | | 1 | | | | -- | | | | 54 | |
Other | | | 9 | | | | 11 | | | | 5 | | | | 4 | | | | 3 | | | | 22 | | | | 54 | |
| | | | | | | | | | | | | | | | | | | | | | | | | | | | |
| | | $72 | | | | $114 | | | | $24 | | | | $8 | | | | $4 | | | | $22 | | | | $244 | |
| | | | | | | | | | | | | | | | | | | | | | | | | | | | |
| IPL | | | | | | | | | | | | | | | | | | | | | | | | | | | | |
Operating leases | | | $4 | | | | $4 | | | | $4 | | | | $3 | | | | $3 | | | | $20 | | | | $38 | |
| | | | | | | |
| WPL | | | | | | | | | | | | | | | | | | | | | | | | | | | | |
Riverside PPA (a) | | | $59 | | | | $60 | | | | $17 | | | | $-- | | | | $-- | | | | $-- | | | | $136 | |
Synthetic leases (b) | | | 1 | | | | 1 | | | | 2 | | | | 4 | | | | 1 | | | | -- | | | | 9 | |
Other | | | 3 | | | | 6 | | | | 1 | | | | 1 | | | | -- | | | | 1 | | | | 12 | |
| | | | | | | | | | | | | | | | | | | | | | | | | | | | |
| | | $63 | | | | $67 | | | | $20 | | | | $5 | | | | $1 | | | | $1 | | | | $157 | |
| | | | | | | | | | | | | | | | | | | | | | | | | | | | |
| (a) | WPL’s Riverside PPA contains a provision granting WPL the option to purchase this facility in 2013. Refer to Note 19 for additional information on this PPA. |
| (b) | The synthetic leases relate to the financing of certain corporate headquarters (Alliant Energy) and utility railcars (Alliant Energy and WPL). The entities that lease these assets to Alliant Energy and WPL do not meet consolidation requirements and are not included on Alliant Energy’s or WPL’s Consolidated Balance Sheets. Alliant Energy and WPL have guaranteed the residual value of the related assets, which total $45 million and $4 million, respectively, in the aggregate. The guarantees extend through the maturity of each respective underlying lease with remaining terms up to five years. Residual value guarantee amounts have been included in the future minimum operating lease payments. |
(b) Capital Leases -
Alliant Energy - At Dec. 31, 2010 and 2009, Alliant Energy’s gross assets under its capital leases (excluding capital leases between related parties) were $9 million and $8 million, and the related accumulated amortization was $3 million and $2 million, respectively. At Dec. 31, 2010, Alliant Energy’s future minimum capital lease payments were as follows (in millions):
| | | | | | | | | | | | | | | | | | | | | | | | | | | | |
| | | | | | | | | | | | | | | | | | | | | | Less: amount | | Present value of net |
| | | | | | | | | | | | | | | | | | | | | | representing | | minimum capital |
| | | 2011 | | | 2012 | | | 2013 | | | 2014 | | | 2015 | | | Thereafter | | Total | | interest | | lease payments |
Capital leases | | | $2 | | | | $1 | | | | $1 | | | | $1 | | | | $- | | | $2 | | $7 | | $1 | | $6 |
WPL - In 2005, WPL entered into a 20-year agreement with Resources’ Non-regulated Generation business to lease the Sheboygan Falls Energy Facility (SFEF), with an option for two lease renewal periods thereafter. The lease became effective in 2005 when SFEF began commercial operation. WPL is responsible for the operation of SFEF and has exclusive rights to its output. In 2005, the PSCW approved this affiliated lease agreement with initial monthly payments of approximately $1.3 million. The lease payments were based on a 50% debt to capital ratio, a return on equity of 10.9%, a cost of debt based on the cost of senior notes issued by Resources’ Non-regulated Generation business in 2005 and certain costs incurred to construct the facility. In accordance with its order approving the lease agreement, the PSCW reserved the right to review the capital structure, return on equity and cost of debt every five years from the date of the order. No revisions to the lease were
134
made in 2010. The capital lease asset is amortized using the straight-line method over the 20-year lease term. Since the inception of the lease in 2005, WPL’s retail and wholesale rates have included recovery of the monthly SFEF lease payments. In 2010, 2009 and 2008, SFEF lease expenses were $18.2 million, $18.5 million and $18.8 million ($12.0 million, $12.3 million and $12.6 million included in “Interest expense” and $6.2 million, $6.2 million and $6.2 million included in “Depreciation and amortization” in WPL’s Consolidated Statements of Income), respectively. At Dec. 31, 2010, WPL’s estimated future minimum capital lease payments for SFEF were as follows (in millions):
| | | | | | | | | | | | | | | | | | |
| | | | | | | | | | | | | | | | | Less: amount | | Present value of net |
| | | | | | | | | | | | | | | | | representing | | minimum capital |
| | | 2011 | | 2012 | | 2013 | | 2014 | | 2015 | | Thereafter | | Total | | interest | | lease payments |
SFEF | | $15 | | $15 | | $15 | | $15 | | $15 | | $143 | | $218 | | $108 | | $110 |
(4) RECEIVABLES
(a) Sales of Accounts Receivable -Effective April 1, 2010, IPL entered into an amended and restated Receivables Purchase and Sale Agreement (Agreement) whereby it may sell its customer accounts receivables, unbilled revenues and certain other accounts receivables to a third-party financial institution through wholly-owned and consolidated special purpose entities. The purchase commitment from the third-party financial institution expires in March 2011. IPL is currently pursuing the extension of the purchase commitment. IPL accounts for sales of receivables under the Agreement as transfers of financial assets. In exchange for the receivables sold, IPL will receive from the third-party financial institution cash proceeds (based on seasonal limits up to $160 million), and deferred proceeds recorded in “Accounts receivable - other” on Alliant Energy’s and IPL’s Consolidated Balance Sheets. IPL makes monthly payments to the third-party financial institution of an amount that varies based on interest rates, the length of time the cash proceeds remain outstanding and the total amount under commitment by the third-party financial institution. IPL has historically used proceeds from the sales of receivables to maintain flexibility in its capital structure, take advantage of favorable short-term rates and finance a portion of its cash needs.
Deferred proceeds are payable by the third-party financial institution solely from the collections of the receivables, but only after paying any required expenses to the third-party financial institution and the collection agent. Corporate Services acts as collection agent for the third-party financial institution and receives a fee for collection services. IPL believes that the allowance for doubtful accounts related to its sales of receivables is a reasonable approximation of any credit risk of the customers that generated the receivables. Therefore, the carrying amount of deferred proceeds, after being reduced by the allowance for doubtful accounts, approximates the fair value of the deferred proceeds due to the short-term nature of the collection period. The carrying amount of deferred proceeds represents IPL’s maximum exposure to loss related to the receivables sold.
As of Dec. 31, 2010 and 2009, IPL sold $219.6 million and $0 aggregate amounts of receivables, respectively. IPL’s maximum and average outstanding cash proceeds, and costs incurred related to the sales of receivables program for 2010, 2009 and 2008 were as follows (in millions):
| | | | | | | | | | | | |
| | | 2010 | | | 2009 | | | 2008 | |
Maximum outstanding aggregate cash proceeds (based on daily outstanding balances) | | $ | 160.0 | | | $ | 170.0 | | | $ | 150.0 | |
Average outstanding aggregate cash proceeds (based on daily outstanding balances) | | | 78.1 | | | | 113.0 | | | | 47.5 | |
Costs incurred | | | 1.4 | | | | 2.1 | | | | 1.6 | |
As of Dec. 31, 2010, the attributes of IPL’s receivables sold under the Agreement were as follows (in millions):
| | | | |
Customer accounts receivable | | | $133.0 | |
Unbilled utility revenues | | | 80.9 | |
Other receivables | | | 5.7 | |
| | | | |
Receivables sold | | | 219.6 | |
Less: cash proceeds (a) | | | 65.0 | |
| | | | |
Deferred proceeds | | | 154.6 | |
Less: allowance for doubtful accounts | | | 1.7 | |
| | | | |
Fair value of deferred proceeds | | | $152.9 | |
| | | | |
Outstanding receivables past due | | | $14.1 | |
| (a) | Recorded in “Sales of accounts receivable” in operating activities in Alliant Energy’s and IPL’s Consolidated Statements of Cash Flows. |
135
Additional attributes of IPL’s receivables sold under the Agreement for 2010 were as follows (in millions):
| | | | |
Collections reinvested in receivables | | $ | 1,354.2 | |
Credit losses, net of recoveries | | | 7.9 | |
Refer to Note 1(t) for discussion of a new accounting pronouncement impacting accounting for transfers of financial assets.
(b) Whiting Petroleum Corporation (WPC) Tax Sharing Agreement -Prior to an initial public offering (IPO) of WPC in 2003, Alliant Energy and WPC entered into a tax separation and indemnification agreement pursuant to which Alliant Energy and WPC made tax elections. These tax elections had the effect of increasing the tax basis of the assets of WPC’s consolidated tax group based on the sales price of WPC’s shares in the IPO. The increase in the tax basis of the assets was included in income in Alliant Energy’s U.S. federal income tax return for the calendar year 2003. Pursuant to the tax separation and indemnification agreement, WPC will be obligated to pay Resources 90% of any tax benefits realized annually due to the additional tax deductions from the increase in tax basis for years ending on or prior to Dec. 31, 2013. Such tax benefits will generally be calculated by comparing WPC’s actual taxes to the taxes that would have been owed by WPC had the increase in basis not occurred. In 2014, WPC will be obligated to pay Resources the present value of the remaining tax benefits assuming all such tax benefits will be realized in future years. At the IPO closing date, Resources recorded a receivable from WPC based on the estimated present value of the payments expected from WPC. At Dec. 31, 2010 and 2009, the carrying value of this receivable was $26 million and $25 million, respectively. The current and non-current portions of this receivable are recorded in “Other current assets” and “Deferred charges and other,” respectively, on Alliant Energy’s Consolidated Balance Sheets.
(c) Advances for Customer Energy Efficiency Projects - WPL and IPL offer energy efficiency programs to certain of their customers in Wisconsin and Minnesota, respectively. The energy efficiency programs provide low-cost financing to help customers identify, purchase and install energy efficiency improvement projects. The customers repay WPL and IPL with monthly payments over a term up to five years. The advances for and collections of customer energy efficiency projects are recorded as investing activities in the Consolidated Statements of Cash Flows. The current portion and non-current portion of outstanding advances for customer energy efficiency projects are recorded in “Other accounts receivable” and “Deferred charges and other,” respectively, on the Consolidated Balance Sheets. At Dec. 31, 2010 and 2009, outstanding advances for customer energy efficiency projects were as follows (in millions):
| | | | | | | | | | | | |
| | | Alliant Energy | | IPL | | WPL |
| | | 2010 | | 2009 | | 2010 | | 2009 | | 2010 | | 2009 |
Current portion | | $28.0 | | $32.9 | | $3.0 | | $3.9 | | $25.0 | | $29.0 |
Non-current portion | | 48.3 | | 60.5 | | 4.6 | | 6.5 | | 43.7 | | 54.0 |
| | | | | | | | | | | | |
| | $76.3 | | $93.4 | | $7.6 | | $10.4 | | $68.7 | | $83.0 |
| | | | | | | | | | | | |
(5) INCOME TAXES
Income Tax Expense (Benefit) - The components of “Income tax expense (benefit)” in the Consolidated Statements of Income were as follows (in millions):
| | | | | | | | | | | | | | | | | | | | | | | | | | | | | | | | | | | | |
| | | Alliant Energy | | | IPL | | | WPL | |
| | | 2010 | | | 2009 | | | 2008 | | | 2010 | | | 2009 | | | 2008 | | | 2010 | | | 2009 | | | 2008 | |
Current tax expense (benefit): | | | | | | | | | | | | | | | | | | | | | | | | | | | | | | | | | | | | |
Federal | | | $3.4 | | | | ($141.2) | | | | $63.4 | | | | ($22.4) | | | | ($59.5) | | | | $14.6 | | | | $26.8 | | | | ($137.7) | | | | $22.4 | |
State | | | 9.8 | | | | (4.4) | | | | 18.5 | | | | (7.6) | | | | 5.9 | | | | 16.7 | | | | 14.7 | | | | (14.3) | | | | 10.5 | |
Deferred tax expense (benefit): | | | | | | | | | | | | | | | | | | | | | | | | | | | | | | | | | | | | |
Federal | | | 167.7 | | | | 135.8 | | | | 55.1 | | | | 100.9 | | | | 110.3 | | | | 25.8 | | | | 63.3 | | | | 153.6 | | | | 34.2 | |
State | | | 4.8 | | | | (38.9) | | | | 13.7 | | | | (2.8) | | | | (35.6) | | | | (2.1) | | | | 6.6 | | | | 9.3 | | | | 3.3 | |
Production tax credit | | | (11.2) | | | | (4.7) | | | | (0.3) | | | | (7.7) | | | | (0.8) | | | | -- | | | | (3.5) | | | | (3.9) | | | | (0.3) | |
Investment tax credits | | | (1.8) | | | | (1.9) | | | | (3.4) | | | | (0.6) | | | | (0.6) | | | | (2.0) | | | | (1.2) | | | | (1.3) | | | | (1.4) | |
Provision recorded as a change in uncertain tax positions: | | | | | | | | | | | | | | | | | | | | | | | | | | | | | | | | | | | | |
Current | | | (84.0) | | | | 47.1 | | | | (0.5) | | | | (41.1) | | | | 7.0 | | | | 2.3 | | | | (41.7) | | | | 39.7 | | | | 0.1 | |
Deferred | | | 59.6 | | | | -- | | | | -- | | | | 26.2 | | | | -- | | | | -- | | | | 33.3 | | | | -- | | | | -- | |
Provision recorded as a change in accrued interest | | | (3.1) | | | | (1.1) | | | | (6.9) | | | | (2.6) | | | | 0.3 | | | | (2.7) | | | | -- | | | | 0.4 | | | | (0.4) | |
| | | | | | | | | | | | | | | | | | | | | | | | | | | | | | | | | | | | |
| | | $145.2 | | | | ($9.3) | | | | $139.6 | | | | $42.3 | | | | $27.0 | | | | $52.6 | | | | $98.3 | | | | $45.8 | | | | $68.4 | |
| | | | | | | | | | | | | | | | | | | | | | | | | | | | | | | | | | | | |
136
Income Tax Rates - The overall income tax rates shown in the following table were computed by dividing income tax expense (benefit) by income from continuing operations before income taxes.
| | | | | | | | | | | | | | | | | | | | | | | | | | | | | | | | | | | | |
| | | Alliant Energy | | | IPL | | | WPL | |
| | | 2010 | | | 2009 | | | 2008 | | | 2010 | | | 2009 | | | 2008 | | | 2010 | | | 2009 | | | 2008 | |
Statutory federal income tax rate | | | 35.0% | | | | 35.0% | | | | 35.0% | | | | 35.0% | | | | 35.0% | | | | 35.0% | | | | 35.0% | | | | 35.0% | | | | 35.0% | |
State income taxes, net of federal benefits | | | 1.5 | | | | 5.4 | | | | 5.0 | | | | (3.5) | | | | 4.0 | | | | 4.5 | | | | 5.0 | | | | 4.4 | | | | 4.6 | |
Federal Health Care Legislation | | | 1.6 | | | | -- | | | | -- | | | | 2.0 | | | | -- | | | | -- | | | | 1.2 | | | | -- | | | | -- | |
Adjustment of prior period taxes | | | 0.2 | | | | (6.2) | | | | (3.4) | | | | (1.8) | | | | (5.4) | | | | (8.8) | | | | 2.0 | | | | 0.7 | | | | 0.2 | |
State filing changes | | | -- | | | | (33.8) | | | | -- | | | | -- | | | | (18.2) | | | | -- | | | | -- | | | | (1.8) | | | | -- | |
Amortization of excess deferred taxes | | | (0.3) | | | | (1.1) | | | | (0.5) | | | | (0.5) | | | | (0.5) | | | | (0.5) | | | | (0.2) | | | | (0.2) | | | | (0.7) | |
Amortization of investment tax credits | | | (0.4) | | | | (1.6) | | | | (0.8) | | | | (0.3) | | | | (0.4) | | | | (1.0) | | | | (0.5) | | | | (1.0) | | | | (0.7) | |
Effect of rate making on property related differences | | | (1.1) | | | | (2.4) | | | | (2.1) | | | | (1.3) | | | | (1.0) | | | | (3.8) | | | | (1.0) | | | | (0.8) | | | | (0.9) | |
Production tax credits | | | (2.5) | | | | (3.9) | | | | (0.1) | | | | (4.1) | | | | (0.5) | | | | -- | | | | (1.4) | | | | (2.9) | | | | (0.2) | |
Other items, net | | | (2.0) | | | | 0.8 | | | | (1.2) | | | | (2.7) | | | | 2.0 | | | | 1.7 | | | | (0.9) | | | | 0.5 | | | | (0.7) | |
| | | | | | | | | | | | | | | | | | | | | | | | | | | | | | | | | | | | |
Overall income tax rate | | | 32.0% | | | | (7.8%) | | | | 31.9% | | | | 22.8% | | | | 15.0% | | | | 27.1% | | | | 39.2% | | | | 33.9% | | | | 36.6% | |
| | | | | | | | | | | | | | | | | | | | | | | | | | | | | | | | | | | | |
State income taxes -State income taxes decreased significantly in 2010 for Alliant Energy and IPL as a result of significant property related differences at IPL for which deferred tax is not recorded in the income statement pursuant to Iowa rate making principles. The primary factor contributing to this decrease in state taxes was tax depreciation related to IPL’s Whispering Willow - East wind project, which was placed into service in late 2009 and resulted in a decrease in state taxes for Alliant Energy and IPL of approximately $12 million in 2010.
Federal Health Care Legislation -In March 2010, the Patient Protection and Affordable Care Act, and Health Care and Education Reconciliation Act of 2010 (Federal Health Care Legislation) were enacted. One of the most significant provisions of the Federal Health Care Legislation for Alliant Energy, IPL and WPL requires a reduction in their tax deductions for retiree health care costs beginning in 2013, to the extent their drug expenses are reimbursed under the Medicare Part D retiree drug subsidy program. The reduction in the future deductibility of retiree health care costs accrued as of Dec. 31, 2009 required Alliant Energy, IPL and WPL to record deferred income tax expense of $7 million, $4 million and $3 million, respectively, in 2010.
Adjustment of prior period taxes -In September 2010, the Internal Revenue Service (IRS) completed the audits of Alliant Energy’s U.S. federal income tax returns for calendar years 2005 through 2008. The net impact of the completion of these audits and reversal of reserves for uncertain tax positions related to those audits resulted in Alliant Energy and IPL recognizing net income tax benefits in 2010 of $7 million and $5 million, respectively. These income tax benefits decreased Alliant Energy’s and IPL’s effective tax rate by 1.4% and 2.7%, respectively, and are included, along with other adjustments, in “Adjustments of prior period taxes” in the 2010 column of the table above. The net impact of the completion of the 2005 through 2008 audit and reversal of reserves for uncertain tax positions related to this audit did not have a material impact on WPL’s income tax rates for 2010.
In 2008, Alliant Energy reached a settlement with the IRS, which finalized the audit of Alliant Energy’s U.S. federal income tax returns for calendar years 2002 through 2004. As a result of completing the audit and recording known adjustments for the tax returns for calendar years 2005 through 2007, Alliant Energy and IPL recorded net income tax benefits in 2008 of $12 million and $13 million, respectively. These income tax benefits decreased Alliant Energy’s and IPL’s effective tax rate by 2.8% and 6.5%, respectively, and are included, along with other adjustments, in “Adjustments of prior period taxes” in the 2008 column of the table above. The net impact of these adjustments did not have a material impact on WPL’s income tax rates for 2008.
State filing changes -In 2009, the Wisconsin Senate Bill 62 (SB 62) was enacted. The most significant provision of SB 62 for Alliant Energy, IPL and WPL required combined reporting for corporate income taxation in Wisconsin beginning with tax returns filed for the calendar year 2009. This provision requires all legal entities in which Alliant Energy owns a 50% or more interest to file as members of a unitary return in Wisconsin. As a result of this provision in SB 62 and in order to take advantage of efficiencies that may be available as a result of IPL and WPL sharing resources and facilities, WPL filed as a member of Iowa consolidated tax returns beginning with calendar year 2009. Changes in state apportioned income tax rates resulting from Wisconsin combined reporting requirements and WPL’s plans to be included in Iowa consolidated tax returns required Alliant Energy, IPL and WPL to adjust the carrying value of their deferred income tax assets and liabilities in 2009. The provisions of SB 62 also make it unlikely that Alliant Energy will be able to utilize the majority of its current Wisconsin
137
net operating loss carryforwards before they expire resulting in additional valuation allowances in 2009. Alliant Energy, IPL and WPL recognized net income tax benefits in 2009 of $40 million, $33 million and $2 million, respectively, from the changes in state apportioned income tax rates and additional valuation allowances.
Production tax credits -Alliant Energy, IPL and WPL earn production tax credits from the wind projects they own and operate. Production tax credits are generated during the first 10 years of operations and are based on the electricity output generated by each wind project. Alliant Energy has three wind projects that are currently generating production tax credits including IPL’s 200 MW Whispering Willow - East wind project, which began generating electricity in late 2009, WPL’s 68 MW Cedar Ridge wind project, which began generating electricity in late 2008, and WPL’s 200 MW Bent Tree - Phase I wind project, which began generating electricity in late 2010. Production tax credits (net of state tax impacts) generated during 2010, 2009 and 2008 by these wind projects were as follows (in millions):
| | 2010 | | 2010 | | 2010 | | 2010 | | 2010 | | 2010 | | 2010 | | 2010 | | 2010 |
| | | Alliant Energy | | IPL | | WPL |
| | | 2010 | | 2009 | | 2008 | | 2010 | | 2009 | | 2008 | | 2010 | | 2009 | | 2008 |
Whispering Willow - East | | $8 | | $1 | | $-- | | $8 | | $1 | | $-- | | $-- | | $-- | | $-- |
Cedar Ridge | | 3 | | 4 | | -- | | -- | | -- | | -- | | 3 | | 4 | | -- |
Bent Tree - Phase I | | 1 | | -- | | -- | | -- | | -- | | -- | | 1 | | -- | | -- |
| | | | | | | | | | | | | | | | | | |
| | 12 | | 5 | | -- | | 8 | | 1 | | -- | | 4 | | 4 | | -- |
Deferral (a) | | (1) | | -- | | -- | | -- | | -- | | -- | | (1) | | -- | | -- |
| | | | | | | | | | | | | | | | | | |
| | $11 | | $5 | | $-- | | $8 | | $1 | | $-- | | $3 | | $4 | | $-- |
| | | | | | | | | | | | | | | | | | |
| (a) | In accordance with its December 2009 order, the PSCW authorized WPL to defer any production tax credits generated from its Bent Tree - Phase I wind project in 2010. |
Deferred Tax Assets and Liabilities - Consistent with rate making treatment, deferred taxes are offset in the tables below for temporary differences that have related regulatory assets and regulatory liabilities. The deferred income tax (assets) and liabilities included on Alliant Energy’s Consolidated Balance Sheets at Dec. 31 arise from the following temporary differences (in millions):
| | | | | | | | | | | | | | | | | | | | | | | | |
| | | 2010 | | | 2009 | |
| | | Deferred | | | Deferred Tax | | | | | | Deferred | | | Deferred Tax | | | | |
| | | Tax Assets | | | Liabilities | | | Net | | | Tax Assets | | | Liabilities | | | Net | |
Property | | | $-- | | | | $1,419.8 | | | | $1,419.8 | | | | $-- | | | | $1,127.1 | | | | $1,127.1 | |
Deferred portion of tax gain on IPL’s electric transmission assets sale | | | -- | | | | 100.3 | | | | 100.3 | | | | -- | | | | 125.5 | | | | 125.5 | |
Investment in ATC | | | -- | | | | 83.9 | | | | 83.9 | | | | -- | | | | 71.5 | | | | 71.5 | |
Emission allowances | | | (9.6) | | | | -- | | | | (9.6) | | | | (13.4) | | | | -- | | | | (13.4) | |
Regulatory liability - DAEC sale | | | (13.7) | | | | -- | | | | (13.7) | | | | (15.7) | | | | -- | | | | (15.7) | |
Customer advances | | | (15.0) | | | | -- | | | | (15.0) | | | | (16.4) | | | | -- | | | | (16.4) | |
Net operating losses carryforward - state | | | (19.2) | | | | -- | | | | (19.2) | | | | (27.7) | | | | -- | | | | (27.7) | |
Regulatory liability - IPL’s electric transmission assets sale | | | (27.2) | | | | -- | | | | (27.2) | | | | (32.1) | | | | -- | | | | (32.1) | |
Regulatory liability - repairs expenditures | | | (60.9) | | | | -- | | | | (60.9) | | | | (53.5) | | | | -- | | | | (53.5) | |
Federal credit carryforward | | | (79.8) | | | | -- | | | | (79.8) | | | | (79.4) | | | | -- | | | | (79.4) | |
Net operating losses carryforward - federal | | | (93.7) | | | | -- | | | | (93.7) | | | | (53.4) | | | | -- | | | | (53.4) | |
Other | | | (88.5) | | | | 197.9 | | | | 109.4 | | | | (93.7) | | | | 173.6 | | | | 79.9 | |
| | | | | | | | |
Subtotal | | | (407.6) | | | | 1,801.9 | | | | 1,394.3 | | | | (385.3) | | | | 1,497.7 | | | | 1,112.4 | |
Valuation allowances (a) | | | 18.5 | | | | -- | | | | 18.5 | | | | 26.7 | | | | -- | | | | 26.7 | |
| | | | | | | | |
| | | ($389.1) | | | | $1,801.9 | | | | $1,412.8 | | | | ($358.6) | | | | $1,497.7 | | | | $1,139.1 | |
| | | | | | | | |
| | | | | | |
| | | | | | | | | 2010 | | | | | | | | | 2009 | |
Other current assets | | | | | | | | | | | ($21.5) | | | | | | | | | | | | ($45.2) | |
Deferred income taxes | | | | | | | | | | | 1,434.3 | | | | | | | | | | | | 1,184.3 | |
| | | | | | | | | | | | | | | | | | | | | | | | |
Total deferred tax (assets) and liabilities | | | | | | | | | | | $1,412.8 | | | | | | | | | | | | $1,139.1 | |
| | | | | | | | | | | | | | | | | | | | | | | | |
| (a) | The reduction of valuation allowances was primarily due to the 2010 expiration of a Wisconsin capital loss that was fully valued. |
138
The deferred income tax (assets) and liabilities included on IPL’s Consolidated Balance Sheets at Dec. 31 arise from the following temporary differences (in millions):
| | | | | | | | | | | | | | | | | | | | | | | | |
| | | 2010 | | | 2009 | |
| | | Deferred
Tax Assets | | | Deferred Tax Liabilities | | | Net | | | Deferred
Tax Assets | | | Deferred Tax
Liabilities | | | Net | |
| | | | | | | | |
Property | | | $-- | | | | $850.5 | | | | $850.5 | | | | $-- | | | | $673.6 | | | | $673.6 | |
Deferred portion of tax gain on electric transmission assets sale | | | -- | | | | 100.3 | | | | 100.3 | | | | -- | | | | 125.5 | | | | 125.5 | |
Pension and other postretirement benefits obligations | | | -- | | | | 43.9 | | | | 43.9 | | | | -- | | | | 43.7 | | | | 43.7 | |
Emission allowances | | | (9.6 | ) | | | -- | | | | (9.6 | ) | | | (13.3 | ) | | | -- | | | | (13.3 | ) |
Federal credit carryforward | | | (12.4 | ) | | | -- | | | | (12.4 | ) | | | (5.9 | ) | | | -- | | | | (5.9 | ) |
Regulatory liability - DAEC sale | | | (13.7 | ) | | | -- | | | | (13.7 | ) | | | (15.7 | ) | | | -- | | | | (15.7 | ) |
Regulatory liability - flood insurance | | | (16.8 | ) | | | -- | | | | (16.8 | ) | | | (11.3 | ) | | | -- | | | | (11.3 | ) |
Regulatory liability - electric transmission assets sale | | | (27.2 | ) | | | -- | | | | (27.2 | ) | | | (32.1 | ) | | | -- | | | | (32.1 | ) |
Net operating losses carryforward - federal | | | (41.3 | ) | | | -- | | | | (41.3 | ) | | | (26.2 | ) | | | -- | | | | (26.2 | ) |
Regulatory liability - repairs expenditures | | | (60.9 | ) | | | -- | | | | (60.9 | ) | | | (53.5 | ) | | | -- | | | | (53.5 | ) |
Other | | | (31.5 | ) | | | 54.5 | | | | 23.0 | | | | (29.7 | ) | | | 29.0 | | | | (0.7 | ) |
| | | | | | | | |
| | | ($213.4 | ) | | | $1,049.2 | | | | $835.8 | | | | ($187.7 | ) | | | $871.8 | | | | $684.1 | |
| | | | | | | | |
| | | | | | |
| | | | | | | | | 2010 | | | | | | | | | 2009 | |
Other current assets | | | | | | | | | | | ($13.2 | ) | | | | | | | | | | | ($6.3 | ) |
Deferred income taxes | | | | | | | | | | | 849.0 | | | | | | | | | | | | 690.4 | |
| | | | | | | | | | | | | | | | | | | | | | | | |
Total deferred tax (assets) and liabilities | | | | | | | | | | | $835.8 | | | | | | | | | | | | $684.1 | |
| | | | | | | | | | | | | | | | | | | | | | | | |
The deferred income tax (assets) and liabilities included on WPL’s Consolidated Balance Sheets at Dec. 31 arise from the following temporary differences (in millions): | |
| | | 2010 | | | 2009 | |
| | | Deferred
Tax Assets | | | Deferred Tax Liabilities | | | Net | | | Deferred
Tax Assets | | | Deferred Tax
Liabilities | | | Net | |
| | | | | | | | |
Property | | | $-- | | | | $494.8 | | | | $494.8 | | | | $-- | | | | $389.0 | | | | $389.0 | |
Investment in ATC | | | -- | | | | 83.9 | | | | 83.9 | | | | -- | | | | 71.5 | | | | 71.5 | |
Pension and other postretirement benefits obligations | | | -- | | | | 32.1 | | | | 32.1 | | | | -- | | | | 31.4 | | | | 31.4 | |
Net operating losses carryforward - state | | | -- | | | | -- | | | | -- | | | | (9.2 | ) | | | -- | | | | (9.2 | ) |
Investment tax credits | | | (7.4 | ) | | | -- | | | | (7.4 | ) | | | (8.2 | ) | | | -- | | | | (8.2 | ) |
Federal credit carryforward | | | (11.5 | ) | | | -- | | | | (11.5 | ) | | | (11.2 | ) | | | -- | | | | (11.2 | ) |
Customer advances | | | (13.1 | ) | | | -- | | | | (13.1 | ) | | | (14.6 | ) | | | -- | | | | (14.6 | ) |
Net operating losses carryforward - federal | | | (38.2 | ) | | | -- | | | | (38.2 | ) | | | (15.4 | ) | | | -- | | | | (15.4 | ) |
Other | | | (12.0 | ) | | | 37.2 | | | | 25.2 | | | | (13.0 | ) | | | 45.8 | | | | 32.8 | |
| | | | | | | | |
| | | ($82.2 | ) | | | $648.0 | | | | $565.8 | | | | ($71.6 | ) | | | $537.7 | | | | $466.1 | |
| | | | | | | | |
| | | | | | |
| | | | | | | | | 2010 | | | | | | | | | 2009 | |
Other current assets | | | | | | | | | | | ($4.6 | ) | | | | | | | | | | | ($24.7 | ) |
Deferred income taxes | | | | | | | | | | | 570.4 | | | | | | | | | | | | 490.8 | |
| | | | | | | | | | | | | | | | | | | | | | | | |
Total deferred tax (assets) and liabilities | | | | | | | | | | | $565.8 | | | | | | | | | | | | $466.1 | |
| | | | | | | | | | | | | | | | | | | | | | | | |
139
Carryforwards - Alliant Energy’s tax carryforwards and associated deferred tax assets and expiration dates at Dec. 31, 2010 were as follows (in millions):
| | | | | | |
| | | Carryforward
Amount | | Deferred Tax
Asset (a) | | Earliest
Expiration Date |
Federal net operating losses | | $429 | | $148 | | 2029 |
Federal net operating losses offset - uncertain tax positions | | (154) | | (54) | | |
Federal credits - alternative minimum tax | | 42 | | 42 | | None |
Federal credits - general business credits | | 38 | | 38 | | 2022 |
State net operating losses (b) | | 494 | | 25 | | 2011 |
State net operating losses offset - uncertain tax positions | | (74) | | (6) | | |
| (a) | The amounts for IPL and WPL are included in the deferred tax (assets) and liabilities tables above. |
| (b) | At Dec. 31, 2010, the state net operating losses carryforwards had expiration dates ranging from 2011 to 2030 with 92% expiring after 2015. Due to the uncertainty of the realization of state net operating losses tax carryforwards, Alliant Energy established valuation allowances of $19 million as of Dec. 31, 2010. |
Property - In September 2010, the Small Business Jobs Act of 2010 (SBJA) was enacted. One of the most significant provisions of the SBJA for Alliant Energy, IPL and WPL provides a one-year extension of the 50% bonus depreciation deduction for certain expenditures for property that is acquired or constructed in 2010. In December 2010, the Tax Relief, Unemployment Insurance Reauthorization and Job Creation Act of 2010 (the Act) was enacted. One of the most significant provisions of the Act for Alliant Energy, IPL and WPL provides 100% bonus depreciation on qualifying expenditures through 2011 for property placed in service by Dec. 31, 2012. In addition, 50% bonus depreciation will be allowed on qualifying expenditures through 2012 for property that is placed in service by Dec. 31, 2013. Based on capital projects placed into service in 2010, Alliant Energy, IPL and WPL estimate their total 2010 bonus tax depreciation deduction under the SBJA and the Act to be approximately $425 million, $205 million and $215 million, respectively. These 2010 bonus tax depreciation deductions were the primary reason for the increase in deferred tax liabilities related to property in 2010.
Deferred portion of tax gain on IPL’s electric transmission asset sale - Alliant Energy and IPL recognized a $527 million taxable gain upon the sale of IPL’s electric transmission assets in 2007. Under the provisions of the 2005 Energy Tax Act, Alliant Energy and IPL deferred its income tax obligation associated with the taxable gain over an eight-year period, with one-eighth of the income tax obligation being paid in each of the years of 2007 through 2014.
Uncertain Tax Positions- A reconciliation of the beginning and ending amounts of uncertain tax positions, excluding interest, is as follows (in millions):
| | | | | | | | | | | | | | | | | | | | | | | | | | | | | | | | | | | | |
| | | Alliant Energy | | | IPL | | | WPL | |
| | | 2010 | | | 2009 | | | 2008 | | | 2010 | | | 2009 | | | 2008 | | | 2010 | | | 2009 | | | 2008 | |
Balance, Jan. 1 | | | $101.7 | | | | $14.0 | | | | $24.5 | | | | $58.4 | | | | $9.4 | | | | $7.1 | | | | $42.1 | | | | $2.5 | | | | $2.4 | |
Additions based on tax positions related to the current year | | | 3.8 | | | | 6.6 | | | | 2.1 | | | | 2.5 | | | | 3.2 | | | | 1.7 | | | | 1.3 | | | | 2.5 | | | | 0.4 | |
Reductions based on tax positions related to the current year | | | -- | | | | -- | | | | -- | | | | -- | | | | -- | | | | -- | | | | -- | | | | -- | | | | -- | |
Additions for tax positions of prior years (a) | | | 9.1 | | | | 88.7 | | | | 8.0 | | | | 3.8 | | | | 51.2 | | | | 4.9 | | | | 5.2 | | | | 37.3 | | | | 2.5 | |
Reductions for tax positions of prior years (b) | | | (31.8) | | | | (4.5) | | | | (6.2) | | | | (22.7) | | | | (4.1) | | | | (0.5) | | | | (8.0) | | | | (0.2) | | | | (0.3) | |
Settlements with taxing authorities | | | (16.1) | | | | (1.2) | | | | (11.9) | | | | (9.0) | | | | -- | | | | (2.3) | | | | (6.9) | | | | -- | | | | (2.5) | |
Lapse of statute of limitations | | | -- | | | | (1.9) | | | | (2.5) | | | | -- | | | | (1.3) | | | | (1.5) | | | | -- | | | | -- | | | | -- | |
| | | | | | | | | | | | | | | | | | | | | | | | | | | | | | | | | | | | |
Balance, Dec. 31 (c) | | | $66.7 | | | | $101.7 | | | | $14.0 | | | | $33.0 | | | | $58.4 | | | | $9.4 | | | | $33.7 | | | | $42.1 | | | | $2.5 | |
| | | | | | | | | | | | | | | | | | | | | | | | | | | | | | | | | | | | |
| (a) | The additions of tax positions of prior years were primarily related to positions taken by Alliant Energy, IPL and WPL on their federal and state tax returns related to the capitalization and dispositions of property. |
| (b) | The reductions of tax positions of prior years during 2010 were primarily related to deductions taken by Alliant Energy, IPL and WPL on their federal and state tax returns that were settled under audit for amounts less than the recorded amounts. |
| (c) | At Dec. 31, 2010 and 2009, $31 million and $42 million, respectively, of uncertain tax positions balances for both Alliant Energy and IPL included amounts recorded in regulatory liability accounts. |
140
| | | | | | | | | | | | | | | | | | | | | | | | | | | | | | | | | | | | | | | | | | | | | |
| | | Alliant Energy | | IPL | | WPL |
| | | Dec. 31, | | Dec. 31, | | Dec. 31, |
| | | 2010 | | 2009 | | 2008 | | 2010 | | 2009 | | 2008 | | 2010 | | 2009 | | 2008 |
Tax positions favorably impacting future effective tax rates for continuing operations | | | | $-- | | | | | $13.6 | | | | | $11.2 | | | | | $-- | | | | | $10.9 | | | | | $8.8 | | | | | $-- | | | | | $1.4 | | | | | $1.7 | |
Interest accrued | | | | 0.7 | | | | | 5.0 | | | | | 1.9 | | | | | 0.7 | | | | | 2.8 | | | | | 0.8 | | | | | -- | | | | | 2.1 | | | | | 0.3 | |
Penalties accrued | | | | -- | | | | | -- | | | | | -- | | | | | -- | | | | | -- | | | | | -- | | | | | -- | | | | | -- | | | | | -- | |
Open tax years - Tax years that remain subject to examination by major jurisdictions are as follows:
| | | | |
Major Jurisdiction | | Open Years | |
Consolidated federal income tax returns (Alliant Energy, IPL and WPL) | | | 2005-2009 (a) | |
Consolidated Iowa income tax returns (Alliant Energy, IPL and WPL) | | | 2005-2009 (b) | |
Wisconsin income tax returns (WPL) | | | 2005-2008 | |
Wisconsin combined tax return (Alliant Energy, IPL and WPL) | | | 2009 | |
| (a) | 2005 through 2008 are effectively settled excluding deductions included in Alliant Energy’s 2008 federal income tax return for repairs expenditures. The statute of limitations for 2005 through 2007 has been extended to the end of 2011. |
| (b) | 2005 and 2006 are open for federal audit adjustments only. |
Reasonably possible changes to uncertain tax positions in 2011 - In 2011, statutes of limitations will expire for Alliant Energy’s, IPL’s and WPL’s tax returns in multiple state jurisdictions. The impact of the statutes of limitations expiring is not anticipated to be material. In September 2010, the IRS completed the audits of Alliant Energy’s U.S. federal income tax returns for calendar years 2005 through 2008. Alliant Energy agreed to all the IRS’ proposed adjustments for deductions and credits included in the 2005 through 2008 income tax returns with the exception of the deduction for the repairs expenditure change in method of tax accounting included in Alliant Energy’s 2008 income tax return. The IRS denied the full amount of the $527 million ($226 million for IPL and $301 million for WPL) deduction for the repairs expenditures included in Alliant Energy’s 2008 income tax return given the absence of current IRS guidelines regarding this deduction. Alliant Energy is appealing the IRS’ denial of this deduction. The federal income tax return for calendar year 2009 is part of the Compliance Assurance Program of the IRS and as a result, the IRS audit of such return is expected to be completed in 2011. The IRS has consented to a majority of the deductions and credits included by Alliant Energy in its 2009 income tax return. Based on the effective settlement with the IRS of various deductions and credits included in Alliant Energy’s federal income tax returns for calendar years 2005 through 2009, Alliant Energy, IPL and WPL reversed certain uncertain tax positions in 2010. Unrecognized tax benefits for Alliant Energy, IPL and WPL are expected to increase within the next 12 months upon receipt of consent from the IRS related to a change in tax method of accounting for mixed service costs. In accordance with accounting rules, Alliant Energy, IPL and WPL will not reflect the impact of this proposed change to mixed service costs in their financial statements until consent is rendered by the IRS. In addition, unrecognized tax benefits for Alliant Energy, IPL, and WPL will decrease within the next 12 months if an expected revenue procedure clarifying the treatment of repairs for distribution property is published. An estimate of the expected changes for 2011 cannot be determined at this time.
Income Tax Refunds Receivable - Alliant Energy, IPL and WPL received $110 million, $94 million, and $37 million, respectively, of income tax refunds from the IRS in the fourth quarter of 2010 related to claims filed with the IRS to carryback net operating losses to prior years. These refunds were the primary reason for the decreases in “Income tax refunds receivable” on Alliant Energy’s, IPL’s and WPL’s Consolidated Balance Sheets of $130 million, $84 million and $41 million, respectively, during 2010.
Regulatory Assets and Regulatory Liabilities - As a rate-regulated enterprise, changes in deferred tax assets and liabilities in the normal course of business that are related to certain property at IPL are required to be passed on to customers through future rates (over a period exceeding 30 years for some generating plant differences) consistent with rate making practices in Iowa. In 2009, IPL recognized significant tax benefits as a result of a change in tax accounting method for repairs expenditures and the tax method for allocating flood insurance proceeds that were recorded as regulatory liabilities. IPL may also recognize significant tax benefits in 2011 related to its change in tax accounting method for mixed service costs, which will be recorded in a regulatory liability account if consent for the change is received from the IRS. In January 2011, the IUB issued an order providing for a return of these significant tax benefits to IPL’s Iowa electric retail customers during 2011 through 2013. Flood insurance allocation and repairs expenditures tax benefits of $38 million and $26 million, respectively, are expected to be returned in 2011 and have been reclassified from non-current “Regulatory liabilities” to current “Regulatory liabilities” on Alliant Energy’s and IPL’s Consolidated Balance Sheets. The estimated tax benefits expected to be returned to IPL’s Iowa retail electric customers over the three-year period are $200 million in aggregate. Alliant Energy and IPL recorded an increase to their non-current regulatory assets to reflect the benefit IPL expects to receive from its Iowa retail electric customers in the future as the significant temporary differences associated with the repairs expenditures and
141
flood insurance proceeds reverse into current tax expense. An increase to non-current regulatory assets will also be reflected if consent is received from the IRS related to the change in tax accounting method related to mixed service costs.
Other Income Tax Matters - Alliant Energy files a consolidated federal income tax return, which includes the aggregate taxable income or loss of Alliant Energy and its subsidiaries. In addition, a combined return including Alliant Energy and all of its subsidiaries was filed in Wisconsin beginning with the tax return for calendar year 2009. Alliant Energy subsidiaries with a presence in Iowa file as part of a consolidated return in Iowa. Under the terms of a tax sharing agreement signed in 2009 between Alliant Energy and its subsidiaries, the subsidiaries began calculating state income tax using consolidated apportionment rates applied to separate company taxable income in 2009. Prior to 2009, Alliant Energy’s subsidiaries calculated income tax provisions using the separate return methodology. Separate return amounts prior to 2009 were adjusted for state apportionment benefits, net of federal tax, with any difference between the separate return methodology and the actual consolidated return allocated as prescribed in the prior tax allocation agreement. In 2010, 2009 and 2008, Alliant Energy’s, IPL’s and WPL’s foreign sources of income were not material.
(6) BENEFIT PLANS
(a) Pension and Other Postretirement Benefits Plans - Alliant Energy, IPL and WPL provide retirement benefits to substantially all of their employees through various qualified and non-qualified non-contributory defined benefit pension plans, and through defined contribution plans (including 401(k) savings plans). Alliant Energy’s, IPL’s and WPL’s qualified and non-qualified non-contributory defined benefit pension plans are currently closed to new hires. Benefits of the non-contributory defined benefit pension plans are based on the plan participant’s years of service, age and compensation. Benefits of the defined contribution plans are based on the plan participant’s years of service, age, compensation and contributions. Alliant Energy, IPL and WPL also provide certain defined benefit postretirement health care and life benefits to eligible retirees. In general, the health care plans are contributory with participants’ contributions adjusted regularly and the life insurance plans are non-contributory.
Assumptions - The assumptions for Alliant Energy’s, IPL’s and WPL’s defined benefit pension and other postretirement benefits plans at the measurement date of Dec. 31 were as follows (Not Applicable (N/A)):
| | | | | | | | | | | | | | | | | | | | | | |
| | | Defined Benefit Pension Plans | | | Other Postretirement Benefits Plans | |
| | | 2010 | | | 2009 | | | 2008 | | | 2010 | | 2009 | | | 2008 | |
Discount rate for benefit obligations | | | 5.56% | | | | 5.8% | | | | 6.15% | | | 5.25% | | | 5.55% | | | | 6.15% | |
Discount rate for net periodic cost | | | 5.8% | | | | 6.15% | | | | 6.2% | | | 5.55% | | | 6.15% | | | | 6.2% | |
Expected rate of return on plan assets | | | 8% | | | | 8.25% | | | | 8.5% | | | 6.9% | | | 8.25% | | | | 8.5% | |
Rate of compensation increase (a) | | | 3.5-4.5% | | | | 3.5-4.5% | | | | 3.5-4.5% | | | 3.5% | | | 3.5% | | | | 3.5% | |
| | |
| | | Defined Benefit Pension Plans | | | Other Postretirement Benefits Plans | |
| | | 2010 | | | 2009 | | | 2008 | | | 2010 | | 2009 | | | 2008 | |
Medical cost trend on covered charges: | | | | | | | | | | | | | | | | | | | | | | |
Initial trend rate | | | N/A | | | | N/A | | | | N/A | | | 7.5% | | | 7.5% | | | | 8% | |
Ultimate trend rate | | | N/A | | | | N/A | | | | N/A | | | 5% | | | 5% | | | | 5% | |
| (a) | IPL’s and WPL’s assumptions for rates of compensation increase for their qualified defined benefit pension plans were 3.5% for 2010, 2009 and 2008. |
Expected rate of return on plan assets - The expected rate of return on plan assets is determined by analysis of projected asset class returns based on the target asset class allocations. Alliant Energy uses a portfolio return simulator and also reviews historical returns, survey information and capital market information to support the expected rate of return on plan assets assumption. Refer to “Investment Policy and Strategy for Plan Assets” below for additional information related to Alliant Energy’s investment policy and strategy and mix of assets for the pension and other postretirement benefits plans.
Medical cost trend on covered charges - The assumed medical trend rates are critical assumptions in determining the service and interest cost and accumulated postretirement benefit obligation related to postretirement benefits costs. A 1% change in the medical trend rates for 2010, holding all other assumptions constant, would have the following effects (in millions):
| | | | | | | | | | | | |
| | | Alliant Energy | | IPL | | WPL |
| | | 1% Increase | | 1% Decrease | | 1% Increase | | 1% Decrease | | 1% Increase | | 1% Decrease |
Effect on total of service and interest cost components | | $1.3 | | ($1.3) | | $0.6 | | ($0.6) | | $0.5 | | ($0.5) |
Effect on postretirement benefit obligation | | 12.0 | | (12.6) | | 5.9 | | (6.1) | | 4.5 | | (4.7) |
142
Measurement dates - In 2006, the FASB issued authoritative guidance requiring an employer to measure benefit plan assets and obligations as of the end of its fiscal year. Alliant Energy, IPL and WPL adopted this guidance in 2008 and changed their measurement date from Sep. 30 to Dec. 31, which resulted in reductions to their Jan. 1, 2008 balance of retained earnings of $2.7 million, $1.3 million and $1.2 million, respectively.
Net Periodic Benefit Costs - The components of Alliant Energy’s, IPL’s and WPL’s net periodic benefit costs for their defined benefit pension and other postretirement benefits plans were as follows (in millions):
| | | | | | | | | | | | |
Alliant Energy | | Defined Benefit Pension Plans | | Other Postretirement Benefits Plans |
| | | 2010 | | 2009 | | 2008 | | 2010 | | 2009 | | 2008 |
Service cost | | $11.9 | | $11.9 | | $16.3 | | $9.3 | | $8.7 | | $8.4 |
Interest cost | | 52.3 | | 54.3 | | 54.6 | | 14.9 | | 15.2 | | 15.1 |
Expected return on plan assets (a) | | (62.1) | | (47.6) | | (74.6) | | (7.7) | | (6.1) | | (9.0) |
Amortization of (b): | | | | | | | | | | | | |
Transition obligation | | -- | | -- | | -- | | 0.1 | | 0.2 | | 0.2 |
Prior service cost (credit) | | 0.9 | | 2.1 | | 2.9 | | (2.4) | | (3.7) | | (3.7) |
Actuarial loss | | 23.8 | | 30.6 | | 4.2 | | 7.4 | | 6.2 | | 3.5 |
Settlement loss (c) | | 1.4 | | -- | | -- | | -- | | -- | | -- |
Curtailment losses (d)(e) | | -- | | 1.0 | | -- | | -- | | -- | | -- |
Special termination benefits costs (e) | | -- | | 0.9 | | -- | | -- | | -- | | -- |
| | | | | | | | | | | | |
| | $28.2 | | $53.2 | | $3.4 | | $21.6 | | $20.5 | | $14.5 |
| | | | | | | | | | | | |
| | |
IPL | | Qualified Defined Benefit Pension Plans | | Other Postretirement Benefits Plans |
| | | 2010 | | 2009 | | 2008 | | 2010 | | 2009 | | 2008 |
Service cost | | $6.2 | | $6.1 | | $6.1 | | $3.4 | | $3.1 | | $2.8 |
Interest cost | | 16.5 | | 16.1 | | 15.8 | | 6.8 | | 7.3 | | 7.3 |
Expected return on plan assets (a) | | (19.5) | | (14.0) | | (21.6) | | (5.3) | | (4.2) | | (6.1) |
Amortization of (b): | | | | | | | | | | | | |
Transition obligation | | -- | | -- | | -- | | 0.1 | | 0.2 | | 0.2 |
Prior service cost (credit) | | 0.6 | | 0.8 | | 1.0 | | (1.1) | | (1.6) | | (1.6) |
Actuarial loss | | 7.2 | | 9.3 | | 0.2 | | 4.0 | | 4.0 | | 2.0 |
| | | | | | | | | | | | |
| | $11.0 | | $18.3 | | $1.5 | | $7.9 | | $8.8 | | $4.6 |
| | | | | | | | | | | | |
| | |
WPL | | Qualified Defined Benefit Pension Plan | | Other Postretirement Benefits Plans |
| | | 2010 | | 2009 | | 2008 | | 2010 | | 2009 | | 2008 |
Service cost | | $4.9 | | $4.9 | | $5.3 | | $3.6 | | $3.4 | | $3.3 |
Interest cost | | 15.7 | | 15.5 | | 15.0 | | 5.5 | | 5.5 | | 5.5 |
Expected return on plan assets (a) | | (19.1) | | (14.1) | | (21.4) | | (1.3) | | (1.1) | | (1.9) |
Amortization of (b): | | | | | | | | | | | | |
Prior service cost (credit) | | 0.5 | | 0.5 | | 0.8 | | (0.7) | | (0.9) | | (1.0) |
Actuarial loss | | 8.5 | | 10.4 | | 1.0 | | 2.5 | | 1.3 | | 1.0 |
Curtailment loss (d) | | -- | | 0.7 | | -- | | -- | | -- | | -- |
Special termination benefits costs (e) | | -- | | 0.9 | | -- | | -- | | -- | | -- |
| | | | | | | | | | | | |
| | $10.5 | | $18.8 | | $0.7 | | $9.6 | | $8.2 | | $6.9 |
| | | | | | | | | | | | |
| (a) | The expected return on plan assets is based on the expected rate of return on plan assets and the fair value approach to the market-related value of plan assets. |
| (b) | Unrecognized net actuarial losses in excess of 10% of the projected benefit obligation and unrecognized prior service costs (credits) are generally amortized over the average future service lives of the participants for each plan. Unrecognized net transition obligations related to other postretirement benefits are amortized over a 20-year period ending 2012, unless noted otherwise. |
| (c) | In 2010, the settlement loss of $1.4 million related to payments made to a retired executive of Alliant Energy. |
| (d) | In 2007, members of the International Brotherhood of Electrical Workers Local 965 ratified a four-year collective bargaining agreement reached with WPL, resulting in changes to WPL’s qualified pension plan (Plan). One of these changes provided Plan participants an option to cease participating in the Plan and begin participating in the Alliant Energy 401(k) Savings Plan with increased levels of contribution by Alliant Energy. The election of this option did not impact a participant’s eligibility for benefits previously vested under the Plan. In 2009, certain of these employees elected to cease participating in the Plan, resulting in Alliant Energy and WPL recognizing a curtailment loss related to the Plan of $0.7 million in 2009. |
| (e) | In 2009, Alliant Energy eliminated certain corporate and operations positions. As a result, Alliant Energy recognized |
143
| | curtailment losses related to its pension plans of $0.3 million in 2009. In addition, Alliant Energy and WPL recognized special termination benefits costs related to the qualified defined benefit pension plan that is sponsored by WPL of $0.9 million in 2009. |
In the above tables for IPL and WPL, the qualified defined benefit pension plans costs represent only those respective costs for bargaining unit employees of IPL and WPL covered under the plans that are sponsored by IPL and WPL, respectively. The other postretirement benefits costs represent costs for all IPL and WPL employees. Corporate Services provides services to IPL and WPL, and as a result, IPL and WPL are allocated pension and other postretirement benefits costs (credits) associated with Corporate Services employees. The following table includes qualified pension benefits costs (credits) for IPL’s and WPL’s non-bargaining employees who are participants in other Alliant Energy plans, and the allocated qualified pension and other postretirement benefits costs (credits) associated with Corporate Services employees providing services to IPL and WPL as follows (in millions):
| | | | | | | | | | | | |
| | | Qualified Pension Benefits Costs (Credits) | | Other Postretirement Benefits Costs |
| | | 2010 | | 2009 | | 2008 | | 2010 | | 2009 | | 2008 |
IPL | | $ -- | | $6.1 | | ($1.9) | | $2.0 | | $1.8 | | $1.5 |
WPL | | 0.7 | | 4.5 | | (2.2) | | 1.3 | | 1.2 | | 1.0 |
Alliant Energy sponsors several non-qualified defined benefit pension plans that cover certain current and former key employees. The pension costs allocated to IPL and WPL for these plans was as follows (in millions):
| | | | | | | | | | | | |
| | | IPL | | WPL |
| | | 2010 | | 2009 | | 2008 | | 2010 | | 2009 | | 2008 |
Allocated pension costs | | $3.6 | | $3.3 | | $3.6 | | $2.1 | | $2.1 | | $2.0 |
The estimated amortization from “Regulatory assets” on the Consolidated Balance Sheets and “Accumulated other comprehensive loss” (AOCL) on Alliant Energy’s Consolidated Balance Sheet into net periodic benefit cost in 2011 is as follows (in millions):
| | | | | | | | | | | | | | | | | | | | | | | | |
| | | Alliant Energy | | | IPL | | | WPL | |
| | | Defined
Benefit
Pension
Plans | | | Other
Postretirement
Benefits
Plans | | | Qualified
Defined
Benefit
Pension Plans | | | Other
Postretirement
Benefits
Plans | | | Qualified
Defined
Benefit
Pension Plans | | | Other
Postretirement
Benefits
Plans | |
Actuarial loss | | | $20.9 | | | | $5.7 | | | | $5.7 | | | | $3.3 | | | | $7.1 | | | | $2.1 | |
Prior service cost (credit) | | | 0.7 | | | | (2.7) | | | | 0.5 | | | | (1.1) | | | | 0.5 | | | | (1.1) | |
| | | | | | | | | | | | | | | | | | | | | | | | |
| | | $21.6 | | | | $3.0 | | | | $6.2 | | | | $2.2 | | | | $7.6 | | | | $1.0 | |
| | | | | | | | | | | | | | | | | | | | | | | | |
In addition to the estimated amortizations from “Regulatory assets” in the above table for IPL and WPL, $4.0 million and $3.6 million, respectively, of amortizations are expected in 2011 from “Regulatory assets” associated with IPL’s and WPL’s non-bargaining employees who are participants in other Alliant Energy plans and Corporate Services employees participating in Alliant Energy sponsored plans allocated to IPL and WPL.
Alliant Energy’s, IPL’s and WPL’s net periodic benefit costs are primarily included in “Utility operating expenses - other operation and maintenance” in the Consolidated Statements of Income.
144
Benefit Plan Assets and Obligations - A reconciliation of the funded status of Alliant Energy’s qualified and non-qualified defined benefit pension and other postretirement benefits plans to the amounts recognized on Alliant Energy’s Consolidated Balance Sheets at Dec. 31 was as follows (in millions):
| | | | | | | | | | | | | | | | |
Alliant Energy | | Defined Benefit | | | Other Postretirement | |
| | | Pension Plans | | | Benefits Plans | |
| | | 2010 | | | 2009 | | | 2010 | | | 2009 | |
Change in projected benefit obligation: | | | | | | | | | | | | | | | | |
Net projected benefit obligation at Jan. 1 | | | $920.1 | | | | $896.4 | | | | $268.4 | | | | $247.7 | |
Service cost | | | 11.9 | | | | 11.9 | | | | 9.3 | | | | 8.7 | |
Interest cost | | | 52.3 | | | | 54.3 | | | | 14.9 | | | | 15.2 | |
Plan participants’ contributions | | | -- | | | | -- | | | | 5.6 | | | | 4.7 | |
Plan amendments (a)(b) | | | -- | | | | (12.4) | | | | (3.1) | | | | -- | |
Actuarial (gain) loss | | | 27.0 | | | | 21.9 | | | | (0.2) | | | | 13.7 | |
Gross benefits paid | | | (58.3) | | | | (52.9) | | | | (21.2) | | | | (22.7) | |
Federal subsidy on other postretirement benefits paid | | | -- | | | | -- | | | | 1.2 | | | | 1.1 | |
Special termination benefits | | | -- | | | | 0.9 | | | | -- | | | | -- | |
| | | | | | | | | | | | | | | | |
Net projected benefit obligation at Dec. 31 | | | 953.0 | | | | 920.1 | | | | 274.9 | | | | 268.4 | |
| | | | | | | | | | | | | | | | |
| | | | |
Change in plan assets: | | | | | | | | | | | | | | | | |
Fair value of plan assets at Jan. 1 | | | 776.4 | | | | 565.9 | | | | 102.4 | | | | 80.2 | |
Actual return on plan assets | | | 96.9 | | | | 132.6 | | | | 14.0 | | | | 19.2 | |
Employer contributions | | | 8.0 | | | | 130.8 | | | | 21.9 | | | | 21.0 | |
Plan participants’ contributions | | | -- | | | | -- | | | | 5.6 | | | | 4.7 | |
Gross benefits paid | | | (58.3) | | | | (52.9) | | | | (21.2) | | | | (22.7) | |
| | | | | | | | | | | | | | | | |
Fair value of plan assets at Dec. 31 | | | 823.0 | | | | 776.4 | | | | 122.7 | | | | 102.4 | |
| | | | | | | | | | | | | | | | |
| | | | |
Under funded status at Dec. 31 | | | ($130.0) | | | | ($143.7) | | | | ($152.2) | | | | ($166.0) | |
| | | | | | | | | | | | | | | | |
| | | | |
Amounts recognized on the Consolidated | | | | | | | | | | | | | | | | |
Balance Sheets consist of: | | | | | | | | | | | | | | | | |
Other current liabilities | | | ($6.9) | | | | ($8.2) | | | | $-- | | | | ($3.7) | |
Pension and other benefit obligations | | | (123.1) | | | | (135.5) | | | | (152.2) | | | | (162.3) | |
| | | | | | | | | | | | | | | | |
Net amount recognized at Dec. 31 | | | ($130.0) | | | | ($143.7) | | | | ($152.2) | | | | ($166.0) | |
| | | | | | | | | | | | | | | | |
| | |
Alliant Energy | | Defined Benefit | | | Other Postretirement | |
| | | Pension Plans | | | Benefits Plans | |
| | | 2010 | | | 2009 | | | 2010 | | | 2009 | |
Amounts recognized in Regulatory Assets and AOCL
consist of (c): | | | | | | | | | | | | | | | | |
Net actuarial loss | | | $356.0 | | | | $389.0 | | | | $77.1 | | | | $91.0 | |
Prior service credit | | | (6.2) | | | | (5.3) | | | | (5.7) | | | | (5.5) | |
Transition obligation | | | -- | | | | -- | | | | -- | | | | 0.5 | |
| | | | | | | | | | | | | | | | |
| | | $349.8 | | | | $383.7 | | | | $71.4 | | | | $86.0 | |
| | | | | | | | | | | | | | | | |
| (a) | Refer to “Alliant Energy Cash Balance Pension Plan” below for additional information regarding the defined benefit pension plan amendment in 2009. |
| (b) | In 2010, the plan amendments for other postretirement benefits plans related to the Federal Health Care Legislation enacted in March 2010. In 2010, Alliant Energy approved an amendment to its health and welfare benefit plan, which will split the plan into two separate plans consisting of a plan for active employees and a plan for retirees beginning in 2011. |
| (c) | Refer to Note 1(b) and Alliant Energy’s Consolidated Statements of Common Equity for amounts recognized in “Regulatory assets” and “AOCL,” respectively, on Alliant Energy’s Consolidated Balance Sheets. |
The benefit plan assets and obligations associated with IPL’s and WPL’s non-bargaining employees who are participants in other Alliant Energy plans are reported in Alliant Energy’s Consolidated Financial Statements and are not reported in the following tables for IPL and WPL. A reconciliation of the funded status of IPL’s qualified defined benefit pension and other postretirement benefits plans to the amounts recognized on IPL’s Consolidated Balance Sheets at Dec. 31 was as follows (in millions):
145
| | | | | | | | | | | | | | | | |
IPL | | Qualified Defined Benefit
Pension Plans | | | Other Postretirement
Benefits Plans | |
| | | 2010 | | | 2009 | | | 2010 | | | 2009 | |
Change in projected benefit obligation: | | | | | | | | | | | | | | | | |
Net projected benefit obligation at Jan. 1 | | | $284.3 | | | | $262.1 | | | | $123.9 | | | | $120.5 | |
Service cost | | | 6.2 | | | | 6.1 | | | | 3.4 | | | | 3.1 | |
Interest cost | | | 16.5 | | | | 16.1 | | | | 6.8 | | | | 7.3 | |
Plan participants’ contributions | | | -- | | | | -- | | | | 1.6 | | | | 1.3 | |
Plan amendments (a) | | | -- | | | | -- | | | | (1.7) | | | | -- | |
Actuarial loss | | | 3.1 | | | | 13.4 | | | | 4.0 | | | | 0.8 | |
Gross benefits paid | | | (16.3) | | | | (13.4) | | | | (10.1) | | | | (9.6) | |
Federal subsidy on other postretirement benefits paid | | | -- | | | | -- | | | | 0.6 | | | | 0.5 | |
| | | | | | | | | | | | | | | | |
Net projected benefit obligation at Dec. 31 | | | 293.8 | | | | 284.3 | | | | 128.5 | | | | 123.9 | |
| | | | | | | | | | | | | | | | |
| | | | |
Change in plan assets: | | | | | | | | | | | | | | | | |
Fair value of plan assets at Jan. 1 | | | 242.8 | | | | 163.2 | | | | 68.4 | | | | 54.6 | |
Actual return on plan assets | | | 30.4 | | | | 39.4 | | | | 9.6 | | | | 13.3 | |
Employer contributions | | | -- | | | | 53.6 | | | | 8.0 | | | | 8.8 | |
Plan participants’ contributions | | | -- | | | | -- | | | | 1.6 | | | | 1.3 | |
Gross benefits paid | | | (16.3) | | | | (13.4) | | | | (10.1) | | | | (9.6) | |
| | | | | | | | | | | | | | | | |
Fair value of plan assets at Dec. 31 | | | 256.9 | | | | 242.8 | | | | 77.5 | | | | 68.4 | |
| | | | | | | | | | | | | | | | |
| | | | |
Under funded status at Dec. 31 | | | ($36.9) | | | | ($41.5) | | | | ($51.0) | | | | ($55.5) | |
| | | | | | | | | | | | | | | | |
| | | | |
Amounts recognized on the Consolidated | | | | | | | | | | | | | | | | |
Balance Sheets consist of: | | | | | | | | | | | | | | | | |
Pension and other benefit obligations | | | ($36.9) | | | | ($41.5) | | | | ($51.0) | | | | ($55.5) | |
| | | | | | | | | | | | | | | | |
| | | | |
Amounts recognized in Regulatory Assets: | | | | | | | | | | | | | | | | |
Net actuarial loss | | | $90.8 | | | | $105.8 | | | | $42.4 | | | | $46.7 | |
Prior service cost (credit) | | | 1.6 | | | | 2.2 | | | | (2.5) | | | | (2.4) | |
Transition obligation | | | -- | | | | -- | | | | -- | | | | 0.6 | |
| | | | | | | | | | | | | | | | |
| | | $92.4 | | | | $108.0 | | | | $39.9 | | | | $44.9 | |
| | | | | | | | | | | | | | | | |
| (a) | In 2010, the plan amendments for other postretirement benefits plans related to Federal Health Care Legislation enacted in March 2010. In 2010, Alliant Energy approved an amendment to its health and welfare benefit plan, which will split the plan into two separate plans consisting of a plan for active employees and a plan for retirees beginning in 2011. |
A reconciliation of the funded status of WPL’s qualified defined benefit pension and other postretirement benefits plans to the amounts recognized on WPL’s Consolidated Balance Sheets at Dec. 31 was as follows (in millions):
| | | | | | | | | | | | | | | | |
WPL | | Qualified Defined Benefit
Pension Plan | | | Other Postretirement
Benefits Plans | |
| | | 2010 | | | 2009 | | | 2010 | | | 2009 | |
Change in projected benefit obligation: | | | | | | | | | | | | | | | | |
Net projected benefit obligation at Jan. 1 | | | $271.6 | | | | $252.9 | | | | $99.1 | | | | $89.3 | |
Service cost | | | 4.9 | | | | 4.9 | | | | 3.6 | | | | 3.4 | |
Interest cost | | | 15.7 | | | | 15.5 | | | | 5.5 | | | | 5.5 | |
Plan participants’ contributions | | | -- | | | | -- | | | | 3.2 | | | | 2.9 | |
Plan amendments (a) | | | -- | | | | -- | | | | (1.5) | | | | -- | |
Actuarial loss | | | 2.5 | | | | 7.5 | | | | 1.9 | | | | 7.9 | |
Gross benefits paid | | | (11.4) | | | | (10.1) | | | | (9.0) | | | | (10.4) | |
Federal subsidy on other postretirement benefits paid | | | -- | | | | -- | | | | 0.5 | | | | 0.5 | |
Special termination benefits | | | -- | | | | 0.9 | | | | -- | | | | -- | |
| | | | | | | | | | | | | | | | |
Net projected benefit obligation at Dec. 31 | | | 283.3 | | | | 271.6 | | | | 103.3 | | | | 99.1 | |
| | | | | | | | | | | | | | | | |
| | | | |
Change in plan assets: | | | | | | | | | | | | | | | | |
Fair value of plan assets at Jan. 1 | | | 236.6 | | | | 164.6 | | | | 18.8 | | | | 14.6 | |
Actual return on plan assets | | | 30.0 | | | | 39.7 | | | | 2.1 | | | | 3.2 | |
Employer contributions | | | -- | | | | 42.4 | | | | 9.9 | | | | 8.5 | |
Plan participants’ contributions | | | -- | | | | -- | | | | 3.2 | | | | 2.9 | |
Gross benefits paid | | | (11.4) | | | | (10.1) | | | | (9.0) | | | | (10.4) | |
| | | | | | | | | | | | | | | | |
Fair value of plan assets at Dec. 31 | | | 255.2 | | | | 236.6 | | | | 25.0 | | | | 18.8 | |
| | | | | | | | | | | | | | | | |
| | | | |
Under funded status at Dec. 31 | | | ($28.1) | | | | ($35.0) | | | | ($78.3) | | | | ($80.3) | |
| | | | | | | | | | | | | | | | |
146
| | | | | | | | | | | | | | | | |
WPL | | Qualified Defined Benefit
Pension Plan | | | Other Postretirement
Benefits Plans | |
| | | 2010 | | | 2009 | | | 2010 | | | 2009 | |
Amounts recognized on the Consolidated | | | | | | | | | | | | | | | | |
Balance Sheets consist of: | | | | | | | | | | | | | | | | |
Other current liabilities | | | $-- | | | | $-- | | | | $-- | | | | ($3.5) | |
Pension and other benefit obligations | | | (28.1) | | | | (35.0) | | | | (78.3) | | | | (76.8) | |
| | | | | | | | | | | | | | | | |
Net amount recognized at Dec. 31 | | | ($28.1) | | | | ($35.0) | | | | ($78.3) | | | | ($80.3) | |
| | | | | | | | | | | | | | | | |
| | | | |
Amounts recognized in Regulatory Assets: | | | | | | | | | | | | | | | | |
Net actuarial loss | | | $95.6 | | | | $112.5 | | | | $27.2 | | | | $28.6 | |
Prior service cost (credit) | | | 2.9 | | | | 3.4 | | | | (2.5) | | | | (1.7) | |
| | | | | | | | | | | | | | | | |
| | | $98.5 | | | | $115.9 | | | | $24.7 | | | | $26.9 | |
| | | | | | | | | | | | | | | | |
| (a) | In 2010, the plan amendments for other postretirement benefits plans related to Federal Health Care Legislation enacted in March 2010. In 2010, Alliant Energy approved an amendment to its health and welfare benefit plan, which will split the plan into two separate plans consisting of a plan for active employees and a plan for retirees beginning in 2011. |
In addition to the amounts recognized in “Regulatory assets” in the above tables for IPL and WPL, “Regulatory assets” were recognized for amounts associated with IPL’s and WPL’s non-bargaining employees who are participants in other Alliant Energy plans and Corporate Services employees participating in Alliant Energy sponsored benefit plans that were allocated to IPL and WPL at Dec. 31 as follows (in millions):
| | | | | | | | |
| | | IPL | | WPL |
| | | 2010 | | 2009 | | 2010 | | 2009 |
Regulatory assets recognized | | $85 | | $91 | | $78 | | $79 |
Included in the following tables are Alliant Energy’s, IPL’s and WPL’s accumulated benefit obligations, aggregate amounts applicable to defined benefit pension and other postretirement benefits plans with accumulated benefit obligations in excess of plan assets, as well as defined benefit pension plans with projected benefit obligations in excess of plan assets as of the Dec. 31 measurement date (Not Applicable (N/A); in millions):
| | | | | | | | | | | | | | | | |
Alliant Energy | | Defined Benefit
Pension Plans | | | Other Postretirement
Benefits Plans | |
| | | 2010 | | | 2009 | | | 2010 | | | 2009 | |
Accumulated benefit obligations | | | $915.5 | | | | $870.0 | | | | $274.9 | | | | $268.4 | |
Plans with accumulated benefit obligations in excess
of plan assets: | | | | | | | | | | | | | | | | |
Accumulated benefit obligations | | | 915.5 | | | | 870.0 | | | | 274.9 | | | | 268.4 | |
Fair value of plan assets | | | 823.0 | | | | 776.4 | | | | 122.7 | | | | 102.4 | |
Plans with projected benefit obligations in excess
of plan assets: | | | | | | | | | | | | | | | | |
Projected benefit obligations | | | 953.0 | | | | 920.1 | | | | N/A | | | | N/A | |
Fair value of plan assets | | | 823.0 | | | | 776.4 | | | | N/A | | | | N/A | |
| | |
IPL | | Qualified Defined Benefit
Pension Plans | | | Other Postretirement
Benefits Plans | |
| | | 2010 | | | 2009 | | | 2010 | | | 2009 | |
Accumulated benefit obligations | | | $274.1 | | | | $259.7 | | | | $128.5 | | | | $123.9 | |
Plans with accumulated benefit obligations in excess
of plan assets: | | | | | | | | | | | | | | | | |
Accumulated benefit obligations | | | 274.1 | | | | 259.7 | | | | 128.5 | | | | 123.9 | |
Fair value of plan assets | | | 256.9 | | | | 242.8 | | | | 77.5 | | | | 68.4 | |
Plans with projected benefit obligations in excess
of plan assets: | | | | | | | | | | | | | | | | |
Projected benefit obligations | | | 293.8 | | | | 284.3 | | | | N/A | | | | N/A | |
Fair value of plan assets | | | 256.9 | | | | 242.8 | | | | N/A | | | | N/A | |
147
| | | | | | | | | | | | | | | | |
WPL | | Qualified Defined Benefit
Pension Plans | | | Other Postretirement
Benefits Plans | |
| | | 2010 | | | 2009 | | | 2010 | | | 2009 | |
Accumulated benefit obligations | | | $270.2 | | | | $253.2 | | | | $103.3 | | | | $99.1 | |
Plans with accumulated benefit obligations in excess of plan assets: | | | | | | | | | | | | | | | | |
Accumulated benefit obligations | | | 270.2 | | | | 253.2 | | | | 103.3 | | | | 99.1 | |
Fair value of plan assets | | | 255.2 | | | | 236.6 | | | | 25.0 | | | | 18.8 | |
Plans with projected benefit obligations in excess of plan assets: | | | | | | | | | | | | | | | | |
Projected benefit obligations | | | 283.3 | | | | 271.6 | | | | N/A | | | | N/A | |
Fair value of plan assets | | | 255.2 | | | | 236.6 | | | | N/A | | | | N/A | |
Estimated Future Employer Contributions and Benefit Payments - Alliant Energy, IPL, and WPL estimate that funding for the qualified defined benefit pension, non-qualified defined benefit pension and other postretirement benefits plans during 2011 will be as follows (in millions):
| | | | | | |
| | | Alliant Energy | | IPL | | WPL |
Qualified defined benefit pension plans | | $-- | | $-- | | $-- |
Non-qualified defined benefit pension plans | | 7 | | (a) | | (a) |
Other postretirement benefits plans | | 18 | | 7 | | 8 |
| (a) | Alliant Energy sponsors several non-qualified defined benefit pension plans that cover certain current and former key employees of IPL and WPL. Alliant Energy allocates pension costs to IPL and WPL for these plans. |
Alliant Energy’s, IPL’s and WPL’s expected benefit payments and Medicare subsidies, which reflect expected future service, as appropriate, are as follows (in millions):
| | | | | | | | | | | | | | | | | | | | | | | | |
Alliant Energy | | 2011 | | | 2012 | | | 2013 | | | 2014 | | | 2015 | | | 2016 - 2020 | |
Qualified and non-qualified defined benefit pension benefits | | | $59.6 | | | | $56.0 | | | | $57.6 | | | | $60.3 | | | | $63.0 | | | | $335.6 | |
Other postretirement benefits | | | 19.0 | | | | 19.4 | | | | 20.1 | | | | 21.0 | | | | 21.8 | | | | 121.4 | |
Medicare subsidies | | | (1.2) | | | | (1.4) | | | | (1.5) | | | | (1.7) | | | | (1.8) | | | | (12.0) | |
| | | | | | | | | | | | | | | | | | | | | | | | |
| | | $77.4 | | | | $74.0 | | | | $76.2 | | | | $79.6 | | | | $83.0 | | | | $445.0 | |
| | | | | | | | | | | | | | | | | | | | | | | | |
| | | | | | |
IPL | | 2011 | | | 2012 | | | 2013 | | | 2014 | | | 2015 | | | 2016 - 2020 | |
Qualified defined benefit pension benefits | | | $14.3 | | | | $15.3 | | | | $16.1 | | | | $17.0 | | | | $18.1 | | | | $104.8 | |
Other postretirement benefits | | | 9.8 | | | | 10.0 | | | | 10.2 | | | | 10.5 | | | | 10.7 | | | | 57.5 | |
Medicare subsidies | | | (0.6) | | | | (0.7) | | | | (0.7) | | | | (0.8) | | | | (0.8) | | | | (5.0) | |
| | | | | | | | | | | | | | | | | | | | | | | | |
| | | $23.5 | | | | $24.6 | | | | $25.6 | | | | $26.7 | | | | $28.0 | | | | $157.3 | |
| | | | | | | | | | | | | | | | | | | | | | | | |
| | | | | | |
WPL | | 2011 | | | 2012 | | | 2013 | | | 2014 | | | 2015 | | | 2016 - 2020 | |
Qualified defined benefit pension benefits | | | $11.8 | | | | $12.5 | | | | $13.3 | | | | $14.3 | | | | $15.3 | | | | $93.7 | |
Other postretirement benefits | | | 7.1 | | | | 7.1 | | | | 7.5 | | | | 7.9 | | | | 8.3 | | | | 46.7 | |
Medicare subsidies | | | (0.5) | | | | (0.6) | | | | (0.6) | | | | (0.7) | | | | (0.7) | | | | (4.8) | |
| | | | | | | | | | | | | | | | | | | | | | | | |
| | | $18.4 | | | | $19.0 | | | | $20.2 | | | | $21.5 | | | | $22.9 | | | | $135.6 | |
| | | | | | | | | | | | | | | | | | | | | | | | |
Investment Policy and Strategy for Plan Assets -Alliant Energy’s, IPL’s and WPL’s investment strategy and their policies employed with respect to assets of defined benefit pension and other postretirement benefits plans are to combine both preservation of principal and prudent and reasonable risk-taking to protect the integrity of plan assets, in order to meet the obligations to plan participants while achieving the optimal return possible over the long-term to minimize benefit costs. It is recognized that risk and volatility are present to some degree with all types of investments; however, high levels of risk are minimized at the total fund level. This is accomplished through diversification by asset class including both U.S. and international equity exposure, the number of individual investments, and sector and industry limits when applicable. Alliant Energy, IPL and WPL believe that any risk associated with the various plan assets is minimized by this diversification. Alliant Energy, IPL and WPL also use an overlay management service to help maintain target allocations, liquidity needs and intended exposures to the plan assets. The overlay manager is authorized to use derivative financial instruments to facilitate this service.
148
Defined Benefit Pension Plans Assets -For assets of defined benefit pension plans, the mix among asset classes is controlled by long-term asset allocation targets. The assets are viewed as long-term with moderate liquidity needs. Historical performance results and future expectations suggest that equity securities will provide higher total investment returns than debt securities over a long-term investment horizon. Consistent with the goals of maximizing returns and minimizing risks over the long-term, the defined benefit pension plans have a long-term investment posture more heavily weighted towards equity holdings. The asset allocation mix is monitored regularly and appropriate action is taken as needed to rebalance the assets within the prescribed range. Prohibited investment vehicles include, but may not be limited to, direct ownership of real estate, options and futures (unless specifically approved as is the case of the overlay manager), margin trading, oil and gas limited partnerships, commodities, short selling and securities of the managers’ firms or affiliate firms. At Dec. 31, 2010, the current target range and actual allocations for Alliant Energy’s, IPL’s and WPL’s defined benefit pension plan assets were as follows:
| | | | |
| | | Target Range
Allocation | | Actual
Allocation |
Cash and equivalents | | 0%-5% | | 1% |
Equity securities: | | | | |
U.S. large cap core | | 10%-20% | | 14% |
U.S. large cap value | | 8%-16% | | 12% |
U.S. large cap growth | | 8%-16% | | 12% |
U.S. small cap value | | 0%-6% | | 4% |
U.S. small cap growth | | 0%-4% | | 2% |
International - developed markets | | 12%-24% | | 17% |
International - emerging markets | | 0%-8% | | 4% |
Fixed income securities | | 20%-40% | | 34% |
Other Postretirement Benefits Plans Assets -Other postretirement benefits plans assets are comprised of specific assets within certain defined benefit pension plans (401(h) assets) as well as assets held in Voluntary Employees’ Beneficiary Association (VEBA) trusts. The investment policy and strategy of the 401(h) assets mirrors those of the defined benefit pension plans, which are discussed above. The assets in the VEBA trusts are viewed as long-term. A mix of both equity and debt securities are utilized to maximize returns and minimize risk over the long-term. There are no specific target allocations for the VEBA trusts as a whole. Separate investment guidelines have been established for the VEBA trusts which are actively managed. At Dec. 31, 2010, Alliant Energy’s other postretirement benefits plan assets consisted of 59% equity securities, 29% fixed income securities and 12% cash and equivalents. At Dec. 31, 2010, IPL’s other postretirement benefits plan assets consisted of 65% equity securities, 31% fixed income securities and 4% cash and equivalents. At Dec. 31, 2010, WPL’s other postretirement benefits plan assets consisted of 39% equity securities, 19% fixed income securities and 42% cash and equivalents.
Securities Lending Program - Alliant Energy, IPL and WPL have a securities lending program with the trustee that allows the trustee to lend certain securities from their defined benefit pension and other postretirement benefits plans to selected entities against receipt of collateral (in the form of cash, government securities or letters of credit) as provided for and determined in accordance with its securities loan agreement. Initial collateral levels are no less than 102% and 105% of the market value of the borrowed securities for collateral denominated in U.S. and foreign currency, respectively. Refer to “Fair Value Measurements” below for details of Alliant Energy’s, IPL’s and WPL’s fair value of invested collateral and amounts due to borrowers for the securities lending program.
Fair Value Measurements -The following tables report a framework for measuring fair value. The fair value hierarchy prioritizes the inputs to valuation techniques used to measure fair value. The three levels of the fair value hierarchy are as follows:
Level 1 - Pricing inputs are unadjusted quoted prices available in active markets for identical assets or liabilities as of the reporting date. Alliant Energy’s, IPL’s and WPL’s investments in registered investment companies and common and preferred stocks are valued at the closing price reported in the active market in which the individual securities are traded. Level 1 plan assets also include interest-bearing cash, which is held in money market accounts managed by an affiliate of the trustee.
Level 2 - Pricing inputs are quoted prices for similar asset or liabilities in active markets, quoted prices for identical or similar assets or liabilities in inactive markets, inputs other than quoted prices that are observable for the asset or liability and inputs that are derived principally from or corroborated by observable market data by correlation or other means. Alliant Energy’s, IPL’s and WPL’s investments in corporate bonds and government and agency obligations are valued at the closing price reported in the active market for similar assets in which the individual securities are traded or based on yields currently available on comparable securities of issuers with similar credit ratings. Alliant Energy’s, IPL’s and
149
WPL’s investments in common/collective trusts are valued at the net asset value of shares held by the plans, which is based on the fair market value of the underlying investments in equity and fixed income securities of the common/collective trusts. Level 2 plan assets also consist of asset backed securities, commercial paper and repurchase agreements within their securities lending invested collateral.
Level 3 - Pricing inputs are unobservable inputs for assets or liabilities for which little or no market data exist and require significant management judgment or estimation. Alliant Energy’s, IPL’s and WPL’s Level 3 plan assets include certain asset backed securities and corporate bonds within their securities lending invested collateral.
The fair value hierarchy gives the highest priority to unadjusted quoted prices in active markets (Level 1) and the lowest priority to unobservable data (Level 3). In some cases, the inputs used to measure fair value might fall in different levels of the fair value hierarchy. The lowest level input that is significant to a fair value measurement in its entirety determines the applicable level in the fair value hierarchy. Assessing the significance of a particular input to the fair value measurement in its entirety requires judgment, considering factors specific to the asset or liability.
The methods described above may produce a fair value calculation that may not be indicative of net realizable value or reflective of future fair values. Furthermore, while Alliant Energy, IPL and WPL believe their valuation methods are appropriate and consistent with other market participants, the use of different methodologies or assumptions to determine the fair value of certain financial instruments could result in a different fair value measurement at the reporting date.
At Dec. 31, 2010 and 2009, the fair values of Alliant Energy’s qualified and non-qualified defined benefit pension plans assets by asset category and fair value hierarchy level were as follows (in millions):
| | | | | | | | | | | | | | | | | | | | | | | | | | | | | | | | |
Alliant Energy | | Dec. 31, 2010 | | | Dec. 31, 2009 | |
| | | Fair
Value | | | Level
1 | | | Level
2 | | | Level
3 | | | Fair
Value | | | Level
1 | | | Level
2 | | | Level
3 | |
Cash and equivalents | | | $11.1 | | | | $11.1 | | | | $-- | | | | $-- | | | | $36.3 | | | | $36.3 | | | | $-- | | | | $-- | |
Equity securities: | | | | | | | | | | | | | | | | | | | | | | | | | | | | | | | | |
U.S. large cap core | | | 118.4 | | | | 118.4 | | | | -- | | | | -- | | | | 104.5 | | | | 104.5 | | | | -- | | | | -- | |
U.S. large cap value | | | 100.4 | | | | -- | | | | 100.4 | | | | -- | | | | 87.2 | | | | -- | | | | 87.2 | | | | -- | |
U.S. large cap growth | | | 101.0 | | | | -- | | | | 101.0 | | | | -- | | | | 86.7 | | | | -- | | | | 86.7 | | | | -- | |
U.S. small cap value | | | 29.0 | | | | -- | | | | 29.0 | | | | -- | | | | 23.3 | | | | -- | | | | 23.3 | | | | -- | |
U.S. small cap growth | | | 16.6 | | | | 16.6 | | | | -- | | | | -- | | | | 13.8 | | | | 13.8 | | | | -- | | | | -- | |
International - developed markets | | | 142.3 | | | | 76.0 | | | | 66.3 | | | | -- | | | | 131.0 | | | | 68.4 | | | | 62.6 | | | | -- | |
International - emerging markets | | | 34.1 | | | | 34.1 | | | | -- | | | | -- | | | | 39.3 | | | | 39.3 | | | | -- | | | | -- | |
Fixed income securities: | | | | | | | | | | | | | | | | | | | | | | | | | | | | | | | | |
Corporate bonds | | | 54.2 | | | | -- | | | | 54.2 | | | | -- | | | | 61.9 | | | | -- | | | | 61.9 | | | | -- | |
Government and agency obligations | | | 78.9 | | | | -- | | | | 78.9 | | | | -- | | | | 70.9 | | | | -- | | | | 70.9 | | | | -- | |
Fixed income funds | | | 142.7 | | | | 0.2 | | | | 142.5 | | | | -- | | | | 131.2 | | | | 1.5 | | | | 129.7 | | | | -- | |
Securities lending invested collateral | | | 17.3 | | | | 3.0 | | | | 11.5 | | | | 2.8 | | | | 24.8 | | | | 6.7 | | | | 14.9 | | | | 3.2 | |
| | | | | | | | | | | | | | | | | | | | | | | | | | | | | | | | |
| | | 846.0 | | | | $259.4 | | | | $583.8 | | | | $2.8 | | | | 810.9 | | | | $270.5 | | | | $537.2 | | | | $3.2 | |
| | | | | | | | | | | | | | | | | | | | | | | | | | | | | | | | |
Accrued investment income | | | 1.2 | | | | | | | | | | | | | | | | 1.6 | | | | | | | | | | | | | |
Due to brokers, net (a) | | | (0.6) | | | | | | | | | | | | | | | | (3.4) | | | | | | | | | | | | | |
Due to borrowers for securities lending program | | | (23.6) | | | | | | | | | | | | | | | | (32.7) | | | | | | | | | | | | | |
| | | | | | | | | | | | | | | | | | | | | | | | | | | | | | | | |
Total pension plan assets | | | $823.0 | | | | | | | | | | | | | | | | $776.4 | | | | | | | | | | | | | |
| | | | | | | | | | | | | | | | | | | | | | | | | | | | | | | | |
| (a) | This category represents pending trades with brokers. |
150
At Dec. 31, 2010 and 2009, the fair values of IPL’s qualified defined benefit pension plans assets by asset category and fair value hierarchy level were as follows (in millions):
| | | | | | | | | | | | | | | | | | | | | | | | | | | | | | | | |
IPL | | Dec. 31, 2010 | | | Dec. 31, 2009 | |
| | | Fair
Value | | | Level
1 | | | Level
2 | | | Level
3 | | | Fair
Value | | | Level
1 | | | Level
2 | | | Level
3 | |
Cash and equivalents | | | $3.5 | | | | $3.5 | | | | $-- | | | | $-- | | | | $11.3 | | | | $11.3 | | | | $-- | | | | $-- | |
Equity securities: | | | | | | | | | | | | | | | | | | | | | | | | | | | | | | | | |
U.S. large cap core | | | 37.0 | | | | 37.0 | | | | -- | | | | -- | | | | 32.7 | | | | 32.7 | | | | -- | | | | -- | |
U.S. large cap value | | | 31.4 | | | | -- | | | | 31.4 | | | | -- | | | | 27.2 | | | | -- | | | | 27.2 | | | | -- | |
U.S. large cap growth | | | 31.5 | | | | -- | | | | 31.5 | | | | -- | | | | 27.1 | | | | -- | | | | 27.1 | | | | -- | |
U.S. small cap value | | | 9.0 | | | | -- | | | | 9.0 | | | | -- | | | | 7.3 | | | | -- | | | | 7.3 | | | | -- | |
U.S. small cap growth | | | 5.2 | | | | 5.2 | | | | -- | | | | -- | | | | 4.3 | | | | 4.3 | | | | -- | | | | -- | |
International - developed markets | | | 44.4 | | | | 23.7 | | | | 20.7 | | | | -- | | | | 41.0 | | | | 21.4 | | | | 19.6 | | | | -- | |
International - emerging markets | | | 10.7 | | | | 10.7 | | | | -- | | | | -- | | | | 12.3 | | | | 12.3 | | | | -- | | | | -- | |
Fixed income securities: | | | | | | | | | | | | | | | | | | | | | | | | | | | | | | | | |
Corporate bonds | | | 16.9 | | | | -- | | | | 16.9 | | | | -- | | | | 19.4 | | | | -- | | | | 19.4 | | | | -- | |
Government and agency obligations | | | 24.6 | | | | -- | | | | 24.6 | | | | -- | | | | 22.2 | | | | -- | | | | 22.2 | | | | -- | |
Fixed income funds | | | 44.5 | | | | -- | | | | 44.5 | | | | -- | | | | 41.0 | | | | 0.5 | | | | 40.5 | | | | -- | |
Securities lending invested collateral | | | 5.4 | | | | 0.9 | | | | 3.6 | | | | 0.9 | | | | 7.8 | | | | 2.1 | | | | 4.7 | | | | 1.0 | |
| | | | | | | | | | | | | | | | | | | | | | | | | | | | | | | | |
| | | 264.1 | | | | $81.0 | | | | $182.2 | | | | $0.9 | | | | 253.6 | | | | $84.6 | | | | $168.0 | | | | $1.0 | |
| | | | | | | | | | | | | | | | | | | | | | | | | | | | | | | | |
Accrued investment income | | | 0.4 | | | | | | | | | | | | | | | | 0.5 | | | | | | | | | | | | | |
Due to brokers, net (a) | | | (0.2) | | | | | | | | | | | | | | | | (1.1) | | | | | | | | | | | | | |
Due to borrowers for securities lending program | | | (7.4) | | | | | | | | | | | | | | | | (10.2) | | | | | | | | | | | | | |
| | | | | | | | | | | | | | | | | | | | | | | | | | | | | | | | |
Total pension plan assets | | | $256.9 | | | | | | | | | | | | | | | | $242.8 | | | | | | | | | | | | | |
| | | | | | | | | | | | | | | | | | | | | | | | | | | | | | | | |
| (a) | This category represents pending trades with brokers. |
At Dec. 31, 2010 and 2009, the fair values of WPL’s qualified defined benefit pension plan assets by asset category and fair value hierarchy level were as follows (in millions):
| | | | | | | | | | | | | | | | | | | | | | | | | | | | | | | | |
WPL | | Dec. 31, 2010 | | | Dec. 31, 2009 | |
| | | Fair
Value | | | Level
1 | | | Level
2 | | | Level
3 | | | Fair
Value | | | Level
1 | | | Level
2 | | | Level
3 | |
Cash and equivalents | | | $3.4 | | | | $3.4 | | | | $-- | | | | $-- | | | | $11.0 | | | | $11.0 | | | | $-- | | | | $-- | |
Equity securities: | | | | | | | | | | | | | | | | | | | | | | | | | | | | | | | | |
U.S. large cap core | | | 36.7 | | | | 36.7 | | | | -- | | | | -- | | | | 31.8 | | | | 31.8 | | | | -- | | | | -- | |
U.S. large cap value | | | 31.2 | | | | -- | | | | 31.2 | | | | -- | | | | 26.6 | | | | -- | | | | 26.6 | | | | -- | |
U.S. large cap growth | | | 31.3 | | | | -- | | | | 31.3 | | | | -- | | | | 26.4 | | | | -- | | | | 26.4 | | | | -- | |
U.S. small cap value | | | 9.0 | | | | -- | | | | 9.0 | | | | -- | | | | 7.1 | | | | -- | | | | 7.1 | | | | -- | |
U.S. small cap growth | | | 5.2 | | | | 5.2 | | | | -- | | | | -- | | | | 4.2 | | | | 4.2 | | | | -- | | | | -- | |
International - developed markets | | | 44.1 | | | | 23.6 | | | | 20.5 | | | | -- | | | | 39.9 | | | | 20.8 | | | | 19.1 | | | | -- | |
International - emerging markets | | | 10.6 | | | | 10.6 | | | | -- | | | | -- | | | | 12.0 | | | | 12.0 | | | | -- | | | | -- | |
Fixed income securities: | | | | | | | | | | | | | | | | | | | | | | | | | | | | | | | | |
Corporate bonds | | | 16.8 | | | | -- | | | | 16.8 | | | | -- | | | | 18.9 | | | | -- | | | | 18.9 | | | | -- | |
Government and agency obligations | | | 24.5 | | | | -- | | | | 24.5 | | | | -- | | | | 21.6 | | | | -- | | | | 21.6 | | | | -- | |
Fixed income funds | | | 44.2 | | | | -- | | | | 44.2 | | | | -- | | | | 40.0 | | | | 0.5 | | | | 39.5 | | | | -- | |
Securities lending invested collateral | | | 5.4 | | | | 1.0 | | | | 3.5 | | | | 0.9 | | | | 7.6 | | | | 2.0 | | | | 4.6 | | | | 1.0 | |
| | | | | | | | | | | | | | | | | | | | | | | | | | | | | | | | |
| | | 262.4 | | | | $80.5 | | | | $181.0 | | | | $0.9 | | | | 247.1 | | | | $82.3 | | | | $163.8 | | | | $1.0 | |
| | | | | | | | | | | | | | | | | | | | | | | | | | | | | | | | |
Accrued investment income | | | 0.3 | | | | | | | | | | | | | | | | 0.5 | | | | | | | | | | | | | |
Due to brokers, net (a) | | | (0.2) | | | | | | | | | | | | | | | | (1.0) | | | | | | | | | | | | | |
Due to borrowers for securities lending program | | | (7.3) | | | | | | | | | | | | | | | | (10.0) | | | | | | | | | | | | | |
| | | | | | | | | | | | | | | | | | | | | | | | | | | | | | | | |
Total pension plan assets | | | $255.2 | | | | | | | | | | | | | | | | $236.6 | | | | | | | | | | | | | |
| | | | | | | | | | | | | | | | | | | | | | | | | | | | | | | | |
| (a) | This category represents pending trades with brokers. |
151
Additional information for fair value measurements of Alliant Energy’s defined benefit pension plans assets, and IPL’s and WPL’s qualified defined benefit pension plans assets using significant unobservable inputs (Level 3 inputs) for 2010 and 2009 is as follows (in millions):
| | | | | | | | | | | | | | | | | | | | | | | | |
| | | Alliant Energy | | | IPL | | | WPL | |
Securities Lending Invested Collateral | | 2010 | | | 2009 | | | 2010 | | | 2009 | | | 2010 | | | 2009 | |
Beginning balance, Jan. 1 | | | $3.2 | | | | $7.3 | | | | $1.0 | | | | $2.3 | | | | $1.0 | | | | $2.2 | |
Actual return on plan assets: | | | | | | | | | | | | | | | | | | | | | | | | |
Relating to assets still held at the reporting date | | | 0.8 | | | | (0.3) | | | | 0.2 | | | | (0.1) | | | | 0.2 | | | | (0.1) | |
Relating to assets sold during the period | | | -- | | | | 0.4 | | | | -- | | | | 0.1 | | | | -- | | | | 0.1 | |
Purchases, sales and settlements, net | | | -- | | | | (4.4) | | | | -- | | | | (1.4) | | | | -- | | | | (1.3) | |
Transfers in and/or out of Level 3 | | | (1.2) | | | | 0.2 | | | | (0.3) | | | | 0.1 | | | | (0.3) | | | | 0.1 | |
| | | | | | | | | | | | | | | | | | | | | | | | |
Ending balance, Dec. 31 | | | $2.8 | | | | $3.2 | | | | $0.9 | | | | $1.0 | | | | $0.9 | | | | $1.0 | |
| | | | | | | | | | | | | | | | | | | | | | | | |
At Dec. 31, 2010 and 2009, the fair values of Alliant Energy’s other postretirement benefits plans assets by asset category and fair value hierarchy level were as follows (in millions):
| | | | | | | | | | | | | | | | | | | | | | | | | | | | | | | | |
Alliant Energy | | Dec. 31, 2010 | | | Dec. 31, 2009 | |
| | | Fair
Value | | | Level
1 | | | Level
2 | | | Level
3 | | | Fair
Value | | | Level
1 | | | Level
2 | | | Level
3 | |
Cash and equivalents | | | $15.4 | | | | $15.4 | | | | $-- | | | | $-- | | | | $10.6 | | | | $10.6 | | | | $-- | | | | $-- | |
Equity securities: | | | | | | | | | | | | | | | | | | | | | | | | | | | | | | | | |
U.S. large cap core | | | 38.6 | | | | 38.6 | | | | -- | | | | -- | | | | 30.7 | | | | 30.7 | | | | -- | | | | -- | |
U.S. large cap value | | | 2.7 | | | | -- | | | | 2.7 | | | | -- | | | | 2.2 | | | | -- | | | | 2.2 | | | | -- | |
U.S. large cap growth | | | 2.7 | | | | -- | | | | 2.7 | | | | -- | | | | 2.2 | | | | -- | | | | 2.2 | | | | -- | |
U.S. mid cap core | | | 18.6 | | | | 18.6 | | | | -- | | | | -- | | | | 15.1 | | | | 15.1 | �� | | | -- | | | | -- | |
U.S. small cap core | | | 3.8 | | | | 3.8 | | | | -- | | | | -- | | | | 4.7 | | | | 4.7 | | | | -- | | | | -- | |
U.S. small cap value | | | 0.8 | | | | -- | | | | 0.8 | | | | -- | | | | 0.6 | | | | -- | | | | 0.6 | | | | -- | |
U.S. small cap growth | | | 0.4 | | | | 0.4 | | | | -- | | | | -- | | | | 0.4 | | | | 0.4 | | | | -- | | | | -- | |
International - developed markets | | | 3.9 | | | | 2.1 | | | | 1.8 | | | | -- | | | | 3.3 | | | | 1.7 | | | | 1.6 | | | | -- | |
International - emerging markets | | | 0.9 | | | | 0.9 | | | | -- | | | | -- | | | | 1.0 | | | | 1.0 | | | | -- | | | | -- | |
Fixed income securities: | | | | | | | | | | | | | | | | | | | | | | | | | | | | | | | | |
Corporate bonds | | | 6.3 | | | | -- | | | | 6.3 | | | | -- | | | | 6.2 | | | | -- | | | | 6.2 | | | | -- | |
Government and agency obligations | | | 4.9 | | | | -- | | | | 4.9 | | | | -- | | | | 4.5 | | | | -- | | | | 4.5 | | | | -- | |
Fixed income funds | | | 24.0 | | | | 20.1 | | | | 3.9 | | | | -- | | | | 21.3 | | | | 18.0 | | | | 3.3 | | | | -- | |
Securities lending invested collateral | | | 0.8 | | | | 0.2 | | | | 0.5 | | | | 0.1 | | | | 1.2 | | | | 0.3 | | | | 0.8 | | | | 0.1 | |
| | | | | | | | | | | | | | | | | | | | | | | | | | | | | | | | |
| | | 123.8 | | | | $100.1 | | | | $23.6 | | | | $0.1 | | | | 104.0 | | | | $82.5 | | | | $21.4 | | | | $0.1 | |
| | | | | | | | | | | | | | | | | | | | | | | | | | | | | | | | |
Accrued investment income | | | 0.1 | | | | | | | | | | | | | | | | 0.1 | | | | | | | | | | | | | |
Due to brokers, net (a) | | | (0.1) | | | | | | | | | | | | | | | | (0.1) | | | | | | | | | | | | | |
Due to borrowers for securities lending program | | | (1.1) | | | | | | | | | | | | | | | | (1.6) | | | | | | | | | | | | | |
| | | | | | | | | | | | | | | | | | | | | | | | | | | | | | | | |
Total other postretirement benefits plan assets | | | $122.7 | | | | | | | | | | | | | | | | $102.4 | | | | | | | | | | | | | |
| | | | | | | | | | | | | | | | | | | | | | | | | | | | | | | | |
| (a) | This category represents pending trades with brokers. |
152
At Dec. 31, 2010 and 2009, the fair values of IPL’s other postretirement benefits plans assets by asset category and fair value hierarchy level were as follows (in millions):
| | | | | | | | | | | | | | | | | | | | | | | | | | | | | | | | |
IPL | | Dec. 31, 2010 | | | Dec. 31, 2009 | |
| | | Fair
Value | | | Level
1 | | | Level
2 | | | Level
3 | | | Fair
Value | | | Level
1 | | | Level
2 | | | Level
3 | |
Cash and equivalents | | | $3.5 | | | | $3.5 | | | | $-- | | | | $-- | | | | $4.5 | | | | $4.5 | | | | $-- | | | | $-- | |
Equity securities: | | | | | | | | | | | | | | | | | | | | | | | | | | | | | | | | |
U.S. large cap core | | | 30.7 | | | | 30.7 | | | | -- | | | | -- | | | | 24.7 | | | | 24.7 | | | | -- | | | | -- | |
U.S. large cap value | | | 1.0 | | | | -- | | | | 1.0 | | | | -- | | | | 0.8 | | | | -- | | | | 0.8 | | | | -- | |
U.S. large cap growth | | | 1.0 | | | | -- | | | | 1.0 | | | | -- | | | | 0.8 | | | | -- | | | | 0.8 | | | | -- | |
U.S. mid cap core | | | 15.3 | | | | 15.3 | | | | -- | | | | -- | | | | 12.8 | | | | 12.8 | | | | -- | | | | -- | |
U.S. small cap value | | | 0.3 | | | | -- | | | | 0.3 | | | | -- | | | | 0.2 | | | | -- | | | | 0.2 | | | | -- | |
U.S. small cap growth | | | 0.2 | | | | 0.2 | | | | -- | | | | -- | | | | 0.1 | | | | 0.1 | | | | -- | | | | -- | |
International - developed markets | | | 1.4 | | | | 0.8 | | | | 0.6 | | | | -- | | | | 1.2 | | | | 0.6 | | | | 0.6 | | | | -- | |
International - emerging markets | | | 0.3 | | | | 0.3 | | | | -- | | | | -- | | | | 0.4 | | | | 0.4 | | | | -- | | | | -- | |
Fixed income securities: | | | | | | | | | | | | | | | | | | | | | | | | | | | | | | | | |
Corporate bonds | | | 4.5 | | | | -- | | | | 4.5 | | | | -- | | | | 4.6 | | | | -- | | | | 4.6 | | | | -- | |
Government and agency obligations | | | 3.3 | | | | -- | | | | 3.3 | | | | -- | | | | 3.0 | | | | -- | | | | 3.0 | | | | -- | |
Fixed income funds | | | 16.0 | | | | 14.6 | | | | 1.4 | | | | -- | | | | 15.5 | | | | 14.3 | | | | 1.2 | | | | -- | |
Securities lending invested collateral | | | 0.5 | | | | 0.1 | | | | 0.3 | | | | 0.1 | | | | 0.8 | | | | 0.2 | | | | 0.5 | | | | 0.1 | |
| | | | | | | | | | | | | | | | | | | | | | | | | | | | | | | | |
| | | 78.0 | | | | $65.5 | | | | $12.4 | | | | $0.1 | | | | 69.4 | | | | $57.6 | | | | $11.7 | | | | $0.1 | |
| | | | | | | | | | | | | | | | | | | | | | | | | | | | | | | | |
Accrued investment income | | | 0.2 | | | | | | | | | | | | | | | | 0.1 | | | | | | | | | | | | | |
Due to borrowers for securities lending program | | | (0.7) | | | | | | | | | | | | | | | | (1.1) | | | | | | | | | | | | | |
| | | | | | | | | | | | | | | | | | | | | | | | | | | | | | | | |
Total other postretirement benefits plan assets | | | $77.5 | | | | | | | | | | | | | | | | $68.4 | | | | | | | | | | | | | |
| | | | | | | | | | | | | | | | | | | | | | | | | | | | | | | | |
At Dec. 31, 2010 and 2009, the fair values of WPL’s other postretirement benefits plans assets by asset category and fair value hierarchy level were as follows (in millions):
| | | | | | | | | | | | | | | | | | | | | | | | | | | | | | | | |
WPL | | Dec. 31, 2010 | | | Dec. 31, 2009 | |
| | | Fair
Value | | | Level
1 | | | Level
2 | | | Level
3 | | | Fair
Value | | | Level
1 | | | Level
2 | | | Level
3 | |
Cash and equivalents | | | $10.7 | | | | $10.7 | | | | $-- | | | | $-- | | | | $5.0 | | | | $5.0 | | | | $-- | | | | $-- | |
Equity securities: | | | | | | | | | | | | | | | | | | | | | | | | | | | | | | | | |
U.S. large cap core | | | 1.3 | | | | 1.3 | | | | -- | | | | -- | | | | 1.1 | | | | 1.1 | | | | -- | | | | -- | |
U.S. large cap value | | | 1.1 | | | | -- | | | | 1.1 | | | | -- | | | | 0.9 | | | | -- | | | | 0.9 | | | | -- | |
U.S. large cap growth | | | 1.1 | | | | -- | | | | 1.1 | | | | -- | | | | 0.9 | | | | -- | | | | 0.9 | | | | -- | |
U.S. small cap core | | | 3.8 | | | | 3.8 | | | | -- | | | | -- | | | | 4.7 | | | | 4.7 | | | | -- | | | | -- | |
U.S. small cap value | | | 0.3 | | | | -- | | | | 0.3 | | | | -- | | | | 0.2 | | | | -- | | | | 0.2 | | | | -- | |
U.S. small cap growth | | | 0.2 | | | | 0.2 | | | | -- | | | | -- | | | | 0.1 | | | | 0.1 | | | | -- | | | | -- | |
International - developed markets | | | 1.6 | | | | 0.8 | | | | 0.8 | | | | -- | | | | 1.4 | | | | 0.7 | | | | 0.7 | | | | -- | |
International - emerging markets | | | 0.4 | | | | 0.4 | | | | -- | | | | -- | | | | 0.4 | | | | 0.4 | | | | -- | | | | -- | |
Fixed income securities: | | | | | | | | | | | | | | | | | | | | | | | | | | | | | | | | |
Corporate bonds | | | 1.4 | | | | -- | | | | 1.4 | | | | -- | | | | 1.3 | | | | -- | | | | 1.3 | | | | -- | |
Government and agency obligations | | | 1.0 | | | | -- | | | | 1.0 | | | | -- | | | | 1.1 | | | | -- | | | | 1.1 | | | | -- | |
Fixed income funds | | | 2.3 | | | | 0.7 | | | | 1.6 | | | | -- | | | | 1.8 | | | | 0.4 | | | | 1.4 | | | | -- | |
Securities lending invested collateral | | | 0.2 | | | | 0.1 | | | | 0.1 | | | | -- | | | | 0.2 | | | | 0.1 | | | | 0.1 | | | | -- | |
| | | | | | | | | | | | | | | | | | | | | | | | | | | | | | | | |
| | | 25.4 | | | | $18.0 | | | | $7.4 | | | | $-- | | | | 19.1 | | | | $12.5 | | | | $6.6 | | | | $-- | |
| | | | | | | | | | | | | | | | | | | | | | | | | | | | | | | | |
Due to brokers, net (a) | | | (0.1) | | | | | | | | | | | | | | | | -- | | | | | | | | | | | | | |
Due to borrowers for securities lending program | | | (0.3) | | | | | | | | | | | | | | | | (0.3) | | | | | | | | | | | | | |
| | | | | | | | | | | | | | | | | | | | | | | | | | | | | | | | |
Total other postretirement benefits plan assets | | | $25.0 | | | | | | | | | | | | | | | | $18.8 | | | | | | | | | | | | | |
| | | | | | | | | | | | | | | | | | | | | | | | | | | | | | | | |
| (a) | This category represents pending trades with brokers. |
Additional information for Alliant Energy’s, IPL’s and WPL’s fair value measurements of other postretirement benefits plans assets using significant unobservable inputs (Level 3 inputs) for 2010 and 2009 is as follows (in millions):
153
| | | | | | | | | | | | | | | | | | | | | | | | |
| | | Alliant Energy | | | IPL | | | WPL | |
Securities Lending Invested Collateral | | 2010 | | | 2009 | | | 2010 | | | 2009 | | | 2010 | | | 2009 | |
Beginning balance, Jan. 1 | | | $0.1 | | | | $0.3 | | | | $0.1 | | | | $0.2 | | | | $-- | | | | $0.1 | |
Purchases, sales and settlements, net | | | -- | | | | (0.2) | | | | -- | | | | (0.1) | | | | -- | | | | (0.1) | |
| | | | | | | | | | | | | | | | | | | | | | | | |
Ending balance, Dec. 31 | | | $0.1 | | | | $0.1 | | | | $0.1 | | | | $0.1 | | | | $-- | | | | $-- | |
| | | | | | | | | | | | | | | | | | | | | | | | |
For the various Alliant Energy defined benefit pension and other postretirement benefits plans, Alliant Energy common stock represented less than 1% of total plan assets at Dec. 31, 2010 and 2009.
Alliant Energy Cash Balance Pension Plan -Alliant Energy’s defined benefit pension plans include a cash balance plan that provides benefits for certain non-bargaining unit employees. The cash balance plan has been closed to new hires since 2005. Effective August 2008, Alliant Energy amended the cash balance plan by discontinuing additional contributions into employees’ cash balance plan accounts. Also effective August 2008, Alliant Energy increased its level of contributions to its 401(k) Savings Plan, which offset the impact of discontinuing additional contributions into the employees’ cash balance plan accounts. These amendments are designed to provide employees portability and self-directed flexibility of their retirement benefits. These changes did not have a significant impact on Alliant Energy’s results of operations. In 2009, Alliant Energy amended the cash balance plan by changing the participants’ future interest credit formula to use the annual change in consumer price index as the interest credit. This amendment is designed to provide participants an interest crediting rate that will always be 3% more than the annual change in the cost of living. Refer to Note 12(c) for discussion of a class action lawsuit filed against the Alliant Energy Cash Balance Pension Plan in 2008 and the IRS review of the tax qualified status of the Plan.
401(k) Savings Plans -A significant number of Alliant Energy, IPL and WPL employees participate in defined contribution retirement plans (401(k) savings plans). The number of employees participating in these plans has increased recently as certain bargaining unit employees have elected to participate in defined contribution retirement plans instead of defined benefit pension plans. In 2009, Alliant Energy, IPL and WPL implemented several cost saving initiatives to reduce other operation and maintenance expenses, including suspension of a portion of 401(k) savings plans contributions during the second half of 2009. In 2008, Alliant Energy increased its level of contributions to its 401(k) savings plans, which offset the impact of discontinuing additional contributions into employees’ cash balance plan accounts. Alliant Energy common stock represented 12.9% and 13.5% of total assets held in 401(k) savings plans at Dec. 31, 2010 and 2009, respectively. Alliant Energy’s, IPL’s and WPL’s costs related to the 401(k) savings plans, which are partially based on the participants’ level of contribution, were as follows (in millions):
| | | | | | | | | | | | | | | | | | | | | | | | | | | | | | | | | | | | |
| | | Alliant Energy | | | IPL | | | WPL | |
| | | 2010 | | | 2009 | | | 2008 | | | 2010 | | | 2009 | | | 2008 | | | 2010 | | | 2009 | | | 2008 | |
401(k) savings plans costs | | | $18.5 | | | | $16.2 | | | | $14.4 | | | | $8.8 | | | | $2.8 | | | | $3.0 | | | | $8.9 | | | | $4.3 | | | | $3.7 | |
(b) Equity Incentive Plans - In May 2010, Alliant Energy’s shareowners approved the Alliant Energy 2010 Omnibus Incentive Plan (OIP), which permits the grant of stock options, restricted stock, restricted stock units, performance shares, performance units, and other stock-based awards and cash incentive awards to key employees. The OIP authorizes the issuance of up to 4,500,000 shares of Alliant Energy’s common stock. As of Dec. 31, 2010, there were no grants issued under the OIP. Upon shareowner approval of the OIP, the Alliant Energy 2002 Equity Incentive Plan (EIP) terminated resulting in no new awards authorized to be granted under the EIP. All awards previously granted under the EIP that are still outstanding remain valid and continue to be subject to all of the terms and conditions of the EIP. At Dec. 31, 2010, non-qualified stock options, restricted stock and performance shares were outstanding under the EIP and another predecessor plan under which new awards can no longer be granted. Alliant Energy satisfies payouts related to equity awards under the OIP and EIP through the issuance of new shares of its common stock.
A summary of compensation expense and the related income tax benefits recognized for share-based compensation awards was as follows (in millions):
| | | | | | | | | | | | | | | | | | | | | | | | | | | | | | | | | | | | |
| | | Alliant Energy | | | IPL | | | WPL | |
| | | 2010 | | | 2009 | | | 2008 | | | 2010 | | | 2009 | | | 2008 | | | 2010 | | | 2009 | | | 2008 | |
Share-based compensation expense | | | $7.5 | | | | $2.8 | | | | $3.3 | | | | $4.0 | | | | $1.6 | | | | $1.8 | | | | $3.0 | | | | $1.1 | | | | $1.2 | |
Income tax benefits | | | 3.0 | | | | 1.2 | | | | 1.4 | | | | 1.6 | | | | 0.7 | | | | 0.8 | | | | 1.2 | | | | 0.4 | | | | 0.5 | |
As of Dec. 31, 2010, total unrecognized compensation cost related to share-based compensation awards was $10.0 million, which is expected to be recognized over a weighted average period between one and two years. Share-based compensation expense is recognized on a straight-line basis over the requisite service periods.
154
Performance Shares and Units -Payouts of performance shares and units to key employees are contingent upon achievement over three-year periods of specified performance criteria, which currently include metrics of total shareowner return relative to an investor-owned utility peer group. Payouts of nonvested performance shares and units are prorated at retirement, death, disability or involuntary termination without cause based on time worked during the performance period and achievement of the performance criteria. Participants’ nonvested performance shares and units are forfeited if the participant voluntarily leaves Alliant Energy or is terminated for cause. Nonvested performance shares and units do not have non-forfeitable rights to dividends when dividends are paid to common shareowners. Alliant Energy anticipates making future payouts of its performance shares and units in cash; therefore, performance shares and units are accounted for as liability awards.
Performance Shares -Performance shares can be paid out in shares of Alliant Energy’s common stock, cash or a combination of cash and stock and are adjusted by a performance multiplier, which ranges from zero to 200% based on the performance criteria. A summary of the performance shares activity was as follows:
| | | | | | | | | | | | |
| | | 2010 | | | 2009 | | | 2008 | |
| | | Shares (a) | | | Shares (a) | | | Shares (a) | |
Nonvested shares, Jan. 1 | | | 256,579 | | | | 208,579 | | | | 221,834 | |
Granted | | | 72,487 | | | | 152,735 | | | | 65,516 | |
Vested (b) | | | -- | | | | (84,633) | | | | (78,532) | |
Forfeited (c) | | | (94,548) | | | | (20,102) | | | | (239) | |
| | | | | | | | | | | | |
Nonvested shares, Dec. 31 | | | 234,518 | | | | 256,579 | | | | 208,579 | |
| | | | | | | | | | | | |
| (a) | Share amounts represent the target number of performance shares. Each performance share’s value is based on the price of one share of Alliant Energy’s common stock at the end of the performance period. The actual number of shares that will be paid out upon vesting is dependent upon actual performance and may range from zero to 200% of the target number of shares. |
| (b) | In 2009, 84,633 performance shares granted in 2006 vested resulting in a payout valued at $4.1 million, which consisted of a combination of cash and common stock (51,189 shares). In 2008, 78,532 performance shares granted in 2005 vested resulting in a payout valued at $5.0 million, which consisted of a combination of cash and common stock (3,835 shares). |
| (c) | In 2010, 57,100 performance shares granted in 2007 were forfeited without payout because the specified performance criteria for such shares were not met. The remaining forfeitures during 2010, 2009 and 2008 were primarily caused by retirements and voluntary terminations of participants. |
Performance Units -Alliant Energy granted new share-based compensation awards to key employees in 2010 referred to as performance units. The performance units and the performance contingent cash awards discussed below were granted in 2010 in lieu of time-based restricted stock. Performance units must be paid out in cash and are adjusted by a performance multiplier, which ranges from zero to 200% based on the performance criteria. A summary of the performance unit activity for 2010 was as follows:
| | | | |
| | | Units (a) | |
Nonvested units, Jan. 1 | | | -- | |
Granted | | | 23,795 | |
Forfeited | | | (667) | |
| | | | |
Nonvested units, Dec. 31 | | | 23,128 | |
| | | | |
| (a) | Unit amounts represent the target number of performance units. Each performance unit’s value is based on the average price of one share of Alliant Energy’s common stock on the grant date of the award. The actual payout for performance units is dependent upon actual performance and may range from zero to 200% of the target number of units. |
Fair Value of Awards -Information related to fair values of nonvested performance shares and units at Dec. 31, 2010, by year of grant, were as follows:
| | | | | | | | |
| | | | | Performance |
| | | Performance Shares | | Units |
| | | 2010 Grant | | 2009 Grant | | 2008 Grant | | 2010 Grant |
Nonvested awards | | 64,174 | | 112,506 | | 57,838 | | 23,128 |
Alliant Energy common stock closing price on Dec. 31, 2010 | | $36.77 | | $36.77 | | $36.77 | | |
Alliant Energy common stock average price on grant date | | | | | | | | $32.56 |
Estimated payout percentage based on performance criteria | | 124% | | 113% | | 75% | | 124% |
Fair values of each nonvested award | | $45.59 | | $41.55 | | $27.58 | | $40.37 |
155
At Dec. 31, 2010, fair values of nonvested performance shares and units were calculated using a Monte Carlo simulation to determine the anticipated total shareowner returns of Alliant Energy and its investor-owned utility peer group. Expected volatility was based on historical volatilities using daily stock prices over the past three years. Expected dividend yields were calculated based on the most recent quarterly dividend rates announced prior to the measurement date and stock prices at the measurement date. The risk-free interest rate was based on the three-year U.S. Treasury rate in effect as of the measurement date.
Restricted Stock -Restricted stock issued under the EIP consists of time-based and performance-contingent restricted stock.
Time-based restricted stock - The current restriction period for outstanding time-based restricted stock is three years. Nonvested shares of time-based restricted stock generally become vested upon retirement. Compensation costs related to awards granted to retirement-eligible employees are generally expensed on the date of grant. Participants’ nonvested time-based restricted stock is forfeited if the participant voluntarily leaves Alliant Energy or is terminated for cause. Nonvested time-based restricted stock is fully vested in the event of retirement, death, disability or involuntary termination without cause. The fair value of time-based restricted stock is based on the average market price at the grant date. A summary of the time-based restricted stock activity was as follows:
| | | | | | | | | | | | | | | | | | | | | | | | |
| | | 2010 | | | 2009 | | | 2008 | |
| | | Shares | | | Weighted
Average
Fair Value | | | Shares | | | Weighted
Average
Fair Value | | | Shares | | | Weighted
Average
Fair Value | |
Nonvested shares, Jan. 1 | | | 125,349 | | | | $32.47 | | | | 156,807 | | | | $32.80 | | | | 165,832 | | | | $30.66 | |
Granted | | | -- | | | | -- | | | | 51,236 | | | | 29.40 | | | | 47,922 | | | | 35.60 | |
Vested | | | (54,016) | | | | 32.72 | | | | (79,459) | | | | 31.08 | | | | (53,322) | | | | 28.46 | |
Forfeited | | | (1,300) | | | | 32.78 | | | | (3,235) | | | | 33.97 | | | | (3,625) | | | | 35.69 | |
| | | | | | | | | | | | | | | | | | | | | | | | |
Nonvested shares, Dec. 31 | | | 70,033 | | | | 32.27 | | | | 125,349 | | | | 32.47 | | | | 156,807 | | | | 32.80 | |
| | | | | | | | | | | | | | | | | | | | | | | | |
Performance-contingent restricted stock - Vesting of performance-contingent restricted stock grants are based on the achievement of certain performance targets (currently specified earnings growth). The performance metric for the 2010, 2009 and 2008 grants is consolidated net income growth. The performance metric for the 2007 grants is consolidated earnings per share growth. If performance targets are not met within the performance period, which currently ranges from two to four years, these restricted stock grants are forfeited. Nonvested shares of performance-contingent restricted stock are prorated at retirement based on time worked during the performance period and vest only if and when the performance criteria are met. Participants’ nonvested performance-contingent restricted stock is forfeited if the participant voluntarily leaves Alliant Energy for reasons other than retirement. The fair value of performance-contingent restricted stock is based on the average market price at the grant date. A summary of the performance-contingent restricted stock activity was as follows:
| | | | | | | | | | | | | | | | | | | | | | | | |
| | | 2010 | | | 2009 | | | 2008 | |
| | | Shares | | | Weighted
Average
Fair Value | | | Shares | | | Weighted
Average
Fair Value | | | Shares | | | Weighted
Average
Fair Value | |
Nonvested shares, Jan. 1 | | | 226,007 | | | | $32.25 | | | | 124,185 | | | | $39.28 | | | | 135,348 | | | | $32.42 | |
Granted | | | 72,487 | | | | 32.56 | | | | 101,822 | | | | 23.67 | | | | 65,516 | | | | 40.49 | |
Vested | | | -- | | | | -- | | | | -- | | | | -- | | | | (54,991) | | | | 28.20 | |
Forfeited | | | (2,304) | | | | 32.56 | | | | -- | | | | -- | | | | (21,688) | | | | 28.19 | |
| | | | | | | | | | | | | | | | | | | | | | | | |
Nonvested shares, Dec. 31 | | | 296,190 | | | | 32.32 | | | | 226,007 | | | | 32.25 | | | | 124,185 | | | | 39.28 | |
| | | | | | | | | | | | | | | | | | | | | | | | |
Non-qualified Stock Options - Options granted under the plans were granted at the market price of the shares on the date of grant, vest over three years and expire no later than 10 years after the grant date. Options become fully vested upon retirement and remain exercisable at any time prior to their expiration date or for three years after the effective date of the retirement, whichever period is shorter. Options become fully vested upon death or disability and remain exercisable at any time prior to their expiration date or for one year after the effective date of the death or disability, whichever period is shorter. If participants leave Alliant Energy for reasons other than retirement, death or disability, their options that are not vested are forfeited and their vested options expire three months after their departure. Alliant Energy has not granted any options since 2004. A summary of the stock option activity was as follows:
156
| | | | | | | | | | | | | | | | | | | | | | | | | | | | | | | | |
| | | 2010 | | | | | | 2009 | | | | | | 2008 | |
| | | | | | | | | | | | | | | | | | | | |
| | | Shares | | | Weighted
Average
Exercise
Price | | | | | | Shares | | | Weighted
Average
Exercise
Price | | | | | | Shares | | | Weighted
Average
Exercise
Price | |
| | | | | | | | | | | | | | | | | | | | |
Outstanding, Jan. 1 | | | 384,331 | | | | $27.02 | | | | | | | | 497,183 | | | | $27.30 | | | | | | | | 542,844 | | | | $27.45 | |
Exercised | | | (191,433) | | | | 28.93 | | | | | | | | (39,877) | | | | 25.80 | | | | | | | | (45,661) | | | | 29.02 | |
Expired | | | (29,218) | | | | 28.59 | | | | | | | | (56,098) | | | | 29.88 | | | | | | | | -- | | | | -- | |
Forfeited | | | -- | | | | -- | | | | | | | | (16,877) | | | | 28.67 | | | | | | | | -- | | | | -- | |
| | | | | | | | | | | | | | | | | | | | | | | | | | | | | | | | |
Outstanding and exercisable, Dec. 31 | | | 163,680 | | | | 24.51 | | | | | | | | 384,331 | | | | 27.02 | | | | | | | | 497,183 | | | | 27.30 | |
| | | | | | | | | | | | | | | | | | | | | | | | | | | | | | | | |
The weighted average remaining contractual term for options outstanding and exercisable at Dec. 31, 2010 was two years. The aggregate intrinsic value of options outstanding and exercisable at Dec. 31, 2010 was $2.0 million.
Other information related to stock option activity was as follows (in millions):
| | | | | | |
| | | 2010 | | 2009 | | 2008 |
Cash received from stock options exercised | | $5.5 | | $1.0 | | $1.3 |
Aggregate intrinsic value of stock options exercised | | 1.1 | | 0.1 | | 0.3 |
Income tax benefit from the exercise of stock options | | 0.4 | | 0.1 | | 0.1 |
Performance Contingent Cash Awards - Alliant Energy granted new share-based compensation awards to key employees in 2010 referred to as performance contingent cash awards. Performance contingent cash award payouts to key employees are based on the achievement of certain performance targets (currently specified consolidated net income growth). If performance targets are not met within the performance period, which currently ranges from two to four years, there are no payouts for these awards. Nonvested awards are prorated at retirement based on time worked during the performance period and achievement of the performance criteria. Participants’ nonvested awards are forfeited if the participant voluntarily leaves Alliant Energy for reasons other than retirement. Each performance contingent cash award’s value is based on the price of one share of Alliant Energy’s common stock at the end of the performance period. Alliant Energy accounts for performance contingent cash awards as liability awards because payouts will be made in the form of cash. A summary of the performance contingent cash awards activity for 2010 was as follows:
| | | | |
| | | Awards | |
Nonvested awards, Jan. 1 | | | -- | |
Granted | | | 23,795 | |
Forfeited | | | (367) | |
| | | | |
Nonvested awards, Dec. 31 | | | 23,428 | |
| | | | |
(c) Deferred Compensation Plan - Alliant Energy maintains a deferred compensation plan under which key employees may defer up to 100% of base salary and incentive compensation and directors may elect to defer all or part of their retainer and committee fees. Key employees who have made the maximum allowed contribution to the Alliant Energy 401(k) Savings Plan may receive an additional credit to the deferred compensation plan. Key employees and directors may elect to have their deferrals credited to a company stock account, an interest account or an equity account based on an index fund.
Company Stock Accounts -The deferred compensation plan does not permit diversification of deferrals credited to the company stock account and all distributions from participants’ company stock accounts are made in the form of shares of Alliant Energy common stock. The deferred compensation obligations for participants’ company stock accounts are recorded in “Additional paid-in capital” and the shares of Alliant Energy common stock held in a rabbi trust to satisfy this obligation are recorded in “Shares in deferred compensation trust” on Alliant Energy’s Consolidated Balance Sheets. At Dec. 31, 2010 and 2009, the carrying values of the deferred compensation obligation for the company stock accounts and the shares in the deferred compensation trust were $7.6 million and $7.9 million, respectively, based on the historical value of the shares of Alliant Energy common stock contributed to the rabbi trust. At Dec. 31, 2010 and 2009, the fair market value of the shares held in the rabbi trust was $9.1 million and $7.9 million, respectively.
Interest and Equity Accounts -Distributions from participants’ interest and equity accounts are in the form of cash payments. The deferred compensation obligations for participants’ interest and equity accounts are recorded in “Pension and other benefit obligations” on Alliant Energy’s Consolidated Balance Sheets. At Dec. 31, 2010 and 2009, the carrying value of the deferred compensation obligations for participants’ interest and equity accounts was $20.5 million and $21.7 million, respectively.
157
(7) COMMON EQUITY, PREFERRED STOCK AND NONCONTROLLING INTEREST
(a) Common Equity
Common Share Activity - A summary of Alliant Energy’s common stock activity was as follows:
| | | | | | | | | | | | |
| | | 2010 | | | 2009 | | | 2008 | |
Shares outstanding, Jan. 1 | | | 110,656,498 | | | | 110,449,099 | | | | 110,359,314 | |
Equity incentive plans (Note 6(b)) | | | 260,316 | | | | 240,889 | | | | 137,621 | |
Other (a) | | | (22,913) | | | | (33,490) | | | | (47,836) | |
| | | | | | | | | | | | |
Shares outstanding, Dec. 31 | | | 110,893,901 | | | | 110,656,498 | | | | 110,449,099 | |
| | | | | | | | | | | | |
| (a) | Includes shares transferred from employees to Alliant Energy to satisfy tax withholding requirements in connection with the vesting of certain restricted stock under the EIP. |
At Dec. 31, 2010, Alliant Energy had a total of 7.3 million shares available for issuance in the aggregate, pursuant to its OIP, 401(k) Savings Plan and Shareowner Direct Plan.
Shareowner Rights Agreement -Alliant Energy has established an amended and restated Shareowner Rights Agreement. The rights under this agreement will only become exercisable if a person or group has acquired, or announced an intention to acquire, 15% or more of Alliant Energy’s outstanding common stock. Each right will initially entitle registered shareowners to purchase from Alliant Energy one-half of one share of Alliant Energy’s common stock. The rights will be exercisable at an initial price of $110.00 per full share, subject to adjustment. If any shareowner acquires 15% or more of the outstanding common stock of Alliant Energy, each right (subject to limitations) will entitle its holder to purchase, at the right’s then current exercise price, a number of common shares of Alliant Energy or of the acquirer having a market value at the time of twice the right’s per full share exercise price. Alliant Energy’s Board of Directors is authorized to reduce the 15% ownership threshold to not less than 10%. The amended and restated Shareowner Rights Agreement expires in December 2018.
Dividend Restrictions -Alliant Energy is a holding company with no significant operations of its own therefore Alliant Energy is dependent upon receiving dividends from its subsidiaries to pay dividends to its shareowners. Alliant Energy does not have any significant common stock dividend restrictions. IPL and WPL each have common stock dividend restrictions based on the terms of their outstanding preferred stock and applicable regulatory limitations. At Dec. 31, 2010, IPL and WPL were in compliance with all such dividend restrictions.
Both IPL and WPL are restricted from paying common stock dividends to their parent company, Alliant Energy, if for any past or current dividend period, dividends on their respective preferred stock have not been paid, or declared and set apart for payment. IPL and WPL have paid all dividends on their respective preferred stock through 2010.
IPL’s most significant regulatory limitation on distributions to its parent company requires IPL to obtain IUB approval for a reasonable utility capital structure if its common equity ratio falls below 42% of total capitalization. As of Dec. 31, 2010, IPL’s amount of retained earnings that were free of restrictions was $364 million.
WPL’s most significant regulatory limitation on distributions to its parent company is included in an order issued by the PSCW in December 2009 that prohibits WPL from paying annual common stock dividends in excess of $112 million if WPL’s common stock equity ratio is or will fall below 51.01%. WPL’s dividends are also restricted to the extent that such dividend would reduce WPL’s common stock equity ratio to less than 25%. As of Dec. 31, 2010, WPL’s amount of retained earnings that were free of restrictions was $112 million for 2011.
Restricted Net Assets of Subsidiaries -Neither IPL nor WPL have regulatory authority to lend or advance any amounts to their parent company. As of Dec. 31, the amount of net assets of IPL and WPL that were not available to be transferred to their parent company in the form of loans, advances or cash dividends without the consent of IPL’s and WPL’s regulatory authorities was as follows (in billions):
| | | | | | | | |
| | | 2010 | | | 2009 | |
IPL | | | $1.0 | | | | $1.1 | |
WPL | | | 1.3 | | | | 1.1 | |
158
Capital Transactions With Subsidiaries -IPL, WPL and Resources paid common stock dividends and repayments of capital to their parent during 2010, 2009 and 2008 as follows (in millions):
| | | | | | | | | | | | | | | | | | | | | | | | | | | | | | | | |
| | | IPL | | | WPL | | | Resources | |
| | | 2010 | | | 2009 | | | 2008 | | | 2010 | | | 2009 | | | 2008 | | | 2010 | | | 2009 | |
Common stock dividends to Alliant Energy | | | $-- | | | | $-- | | | | $29 | | | | $110 | | | | $91 | | | | $91 | | | | $-- | | | | $-- | |
Repayments of capital to Alliant Energy | | | 118 | | | | 106 | | | | 75 | | | | -- | | | | -- | | | | -- | | | | 65 | | | | 100 | |
| | | | | | | | | | | | | | | | | | | | | | | | | | | | | | | | |
Total distributions from common equity | | | $118 | | | | $106 | | | | $104 | | | | $110 | | | | $91 | | | | $91 | | | | $65 | | | | $100 | |
| | | | | | | | | | | | | | | | | | | | | | | | | | | | | | | | |
In July 2008, FERC issued an order allowing IPL to pay up to $400 million in common equity distributions from additional paid-in capital, rather than retained earnings. As of Dec. 31, 2010, IPL’s remaining authority under this FERC order was $101 million.
IPL and WPL received capital contributions from their parent during 2010, 2009 and 2008, as follows (in millions):
| | | | | | | | | | | | | | | | | | | | | | | | |
| | | IPL | | | WPL | |
| | | 2010 | | | 2009 | | | 2008 | | | 2010 | | | 2009 | | | 2008 | |
Capital contributions from Alliant Energy | | | $50 | | | | $150 | | | | $200 | | | | $75 | | | | $100 | | | | $100 | |
(b) Preferred Stock - Information related to the carrying value of Alliant Energy’s cumulative preferred stock of subsidiaries, net (none are mandatorily redeemable) at Dec. 31 was as follows (dollars in millions):
| | | | | | | | | | | | | | | | | | |
| Liquidation Preference/ | | Authorized | | Shares | | | | | | | | | | |
| Stated Value | | Shares | | Outstanding | | Series | | Redemption | | 2010 | | | 2009 | |
IPL: | | | | | | | | | | | | | | | | |
$25 | | (a) | | 6,000,000 | | 8.375% | | On or after March 15, 2013 | | | $150.0 | | | | $150.0 | |
$25 | | (a) | | 1,600,000 | | 7.1% | | Any time | | | 40.0 | | | | 40.0 | |
| | | | | | | | | | | | | | | | | | |
| | | | | | | | | | | | | 190.0 | | | | 190.0 | |
Less: discount | | | | | | | | | | | (6.2) | | | | (6.2) | |
| | | | | | | | | | | | | | | | | | |
| | | | | | | | | | | | | 183.8 | | | | 183.8 | |
| | | | | | | | | | | | | | | | | | |
WPL: | | | | | | | | | | | | | | | | |
$100 | | (b) | | 99,970 | | 4.50% | | Any time | | | 10.0 | | | | 10.0 | |
$100 | | (b) | | 74,912 | | 4.80% | | Any time | | | 7.5 | | | | 7.5 | |
$100 | | (b) | | 64,979 | | 4.96% | | Any time | | | 6.5 | | | | 6.5 | |
$100 | | (b) | | 29,957 | | 4.40% | | Any time | | | 3.0 | | | | 3.0 | |
$100 | | (b) | | 29,947 | | 4.76% | | Any time | | | 3.0 | | | | 3.0 | |
$100 | | (b) | | 150,000 | | 6.20% | | Any time | | | 15.0 | | | | 15.0 | |
$25 | | (b) | | 599,460 | | 6.50% | | Any time | | | 15.0 | | | | 15.0 | |
| | | | | | | | | | | | | | | | | | |
| | | | | | | | | | | 60.0 | | | | 60.0 | |
| | | | | | | | | | | | | | | | | | |
| | | | | | | | | $243.8 | | | | $243.8 | |
| | | | | | | | | | | | | | | | | | |
| (a) | IPL has 16,000,000 authorized shares in total. |
| (b) | WPL has 3,750,000 authorized shares in total. |
IPL - The articles of incorporation of IPL contain a provision that grants the holders of its preferred stock voting rights to elect two members of IPL’s Board of Directors if preferred dividends equal to the annual dividend requirements are in arrears. Such voting rights would not provide the holders of IPL’s preferred stock control of the decision on redemption of IPL’s preferred stock and could not force IPL to exercise its call option. Therefore, IPL’s preferred stock is presented in total equity on Alliant Energy’s and IPL’s Consolidated Balance Sheets in a manner consistent with noncontrolling interests.
WPL -The articles of incorporation of WPL contain a provision that grants the holders of its preferred stock voting rights to elect a majority of WPL’s Board of Directors if preferred dividends equal to the annual dividend requirements are in arrears. The exercise of such voting rights would provide the holders of WPL’s preferred stock control of the decision on redemption of WPL’s preferred stock and could force WPL to exercise its call option. Therefore, the contingent control right and the embedded call option cause WPL’s preferred stock to be presented outside of total equity on Alliant Energy’s and WPL’s Consolidated Balance Sheets in a manner consistent with temporary equity.
Refer to Note 10 for information on the fair value of Alliant Energy’s cumulative preferred stock of subsidiaries.
159
(c) Noncontrolling Interest- A summary of Alliant Energy’s noncontrolling interest activity was as follows (in millions):
| | | | | | |
| | | 2010 | | 2009 | | 2008 |
Beginning balance, Jan. 1 | | $2.1 | | $2.1 | | $3.9 |
Sale of investments | | -- | | -- | | (1.8) |
Other | | (0.1) | | -- | | -- |
| | | | | | |
Ending balance, Dec. 31 | | $2.0 | | $2.1 | | $2.1 |
| | | | | | |
(8) DEBT
(a) Short-Term Debt- Alliant Energy and its subsidiaries maintain committed bank lines of credit to provide short-term borrowing flexibility and backstop liquidity for commercial paper outstanding. At Dec. 31, 2010, Alliant Energy’s short-term borrowing arrangements included three revolving credit facilities totaling $623 million ($96 million for Alliant Energy at the parent company level, $287 million for IPL and $240 million for WPL), which expire in November 2012. Information regarding commercial paper issued under these facilities and other short-term borrowings was as follows (Not Applicable (N/A); dollars in millions):
| | | | | | | | | | | | | | | | | | | | | | | | |
| | | Alliant Energy | | | IPL | | | WPL | |
| | | 2010 | | | 2009 | | | 2010 | | | 2009 | | | 2010 | | | 2009 | |
At Dec. 31: | | | | | | | | | | | | | | | | | | | | | | | | |
Commercial paper outstanding | | | $47.4 | | | | $190.0 | | | | $-- | | | | $190.0 | | | | $47.4 | | | | $-- | |
Weighted average interest rates - commercial paper | | | 0.3% | | | | 0.4% | | | | N/A | | | | 0.4% | | | | 0.3% | | | | N/A | |
| | | | | | | | | | | | | | | | | | | | | | | | |
| | | |
| | | Alliant Energy | | | IPL | | | WPL | |
| | | 2010 | | | 2009 | | | 2010 | | | 2009 | | | 2010 | | | 2009 | |
For the year ended: | | | | | | | | | | | | | | | | | | | | | | | | |
Maximum amount of total short-term debt outstanding (based on daily outstanding balances) | | | $350.3 | | | | $255.9 | | | | $219.1 | | | | $190.0 | | | | $170.2 | | | | $103.1 | |
Average amount of total short-term debt outstanding (based on daily outstanding balances) | | | $92.0 | | | | $80.6 | | | | $62.8 | | | | $52.8 | | | | $36.6 | | | | $26.4 | |
Weighted average interest rates - total short-term debt | | | 0.3% | | | | 0.8% | | | | 0.3% | | | | 0.7% | | | | 0.3% | | | | 0.5% | |
Alliant Energy’s, IPL’s and WPL’s credit facility agreements each contain a financial covenant that requires the entities to maintain certain debt-to-capital ratios. The debt-to-capital ratios required in order to borrow under the credit facilities compared to the actual debt-to-capital ratios at Dec. 31, 2010 were as follows:
| | | | | | |
| | | Alliant Energy | | IPL | | WPL |
Requirement | | Less than 65% | | Less than 58% | | Less than 58% |
Status at Dec. 31, 2010 | | 46% | | 45% | | 46% |
The debt component of the capital ratios includes long- and short-term debt (excluding non-recourse debt and hybrid securities to the extent such hybrid securities do not exceed 15% of consolidated capital of the borrower), capital lease obligations, letters of credit, guarantees of the foregoing and new synthetic leases. The equity component excludes accumulated other comprehensive income (loss).
160
(b) Long-Term Debt -
Alliant Energy’s, IPL’s and WPL’s long-term debt, net as of Dec. 31 was as follows (dollars in millions):
| | | | | | | | | | | | | | | | | | | | | | | | |
| | | 2010 | | | 2009 | |
| | | Alliant
Energy | | | IPL | | | WPL | | | Alliant
Energy | | | IPL | | | WPL | |
Senior Debentures: | | | | | | | | | | | | | | | | | | | | | | | | |
3.3%, due 2015 (a) | | | $150.0 | | | | $150.0 | | | | $-- | | | | $-- | | | | $-- | | | | $-- | |
5.875%, due 2018 | | | 100.0 | | | | 100.0 | | | | -- | | | | 100.0 | | | | 100.0 | | | | -- | |
7.25%, due 2018 | | | 250.0 | | | | 250.0 | | | | -- | | | | 250.0 | | | | 250.0 | | | | -- | |
3.65%, due 2020 (b) | | | 200.0 | | | | 200.0 | | | | -- | | | | -- | | | | -- | | | | -- | |
5.5%, due 2025 | | | 50.0 | | | | 50.0 | | | | -- | | | | 50.0 | | | | 50.0 | | | | -- | |
6.45%, due 2033 | | | 100.0 | | | | 100.0 | | | | -- | | | | 100.0 | | | | 100.0 | | | | -- | |
6.3%, due 2034 | | | 125.0 | | | | 125.0 | | | | -- | | | | 125.0 | | | | 125.0 | | | | -- | |
6.25%, due 2039 | | | 300.0 | | | | 300.0 | | | | -- | | | | 300.0 | | | | 300.0 | | | | -- | |
6.75% (b) | | | -- | | | | -- | | | | -- | | | | 200.0 | | | | 200.0 | | | | -- | |
| | | | | | | | | | | | | | | | | | | | | | | | |
| | | 1,275.0 | | | | 1,275.0 | | | | -- | | | | 1,125.0 | | | | 1,125.0 | | | | -- | |
Debentures: | | | | | | | | | | | | | | | | | | | | | | | | |
5%, due 2019 | | | 250.0 | | | | -- | | | | 250.0 | | | | 250.0 | | | | -- | | | | 250.0 | |
4.6%, due 2020 (a) | | | 150.0 | | | | -- | | | | 150.0 | | | | -- | | | | -- | | | | -- | |
6.25%, due 2034 | | | 100.0 | | | | -- | | | | 100.0 | | | | 100.0 | | | | -- | | | | 100.0 | |
6.375%, due 2037 | | | 300.0 | | | | -- | | | | 300.0 | | | | 300.0 | | | | -- | | | | 300.0 | |
7.6%, due 2038 | | | 250.0 | | | | -- | | | | 250.0 | | | | 250.0 | | | | -- | | | | 250.0 | |
7.625% (c) | | | -- | | | | -- | | | | -- | | | | 100.0 | | | | -- | | | | 100.0 | |
| | | | | | | | | | | | | | | | | | | | | | | | |
| | | 1,050.0 | | | | -- | | | | 1,050.0 | | | | 1,000.0 | | | | -- | | | | 1,000.0 | |
Pollution Control Revenue Bonds: | | | | | | | | | | | | | | | | | | | | | | | | |
5%, due 2014 | | | 38.4 | | | | 38.4 | | | | -- | | | | 38.4 | | | | 38.4 | | | | -- | |
5%, due 2014 and 2015 | | | 24.5 | | | | -- | | | | 24.5 | | | | 24.5 | | | | -- | | | | 24.5 | |
5.375%, due 2015 | | | 14.6 | | | | -- | | | | 14.6 | | | | 14.6 | | | | -- | | | | 14.6 | |
| | | | | | | | | | | | | | | | | | | | | | | | |
| | | 77.5 | | | | 38.4 | | | | 39.1 | | | | 77.5 | | | | 38.4 | | | | 39.1 | |
Other: | | | | | | | | | | | | | | | | | | | | | | | | |
4% senior notes, due 2014 | | | 250.0 | | | | -- | | | | -- | | | | 250.0 | | | | -- | | | | -- | |
5.06% senior secured notes, due 2011 to 2024 | | | 64.5 | | | | -- | | | | -- | | | | 65.7 | | | | -- | | | | -- | |
Other, 1% to 7%, due 2011 to 2025 | | | 0.5 | | | | -- | | | | -- | | | | 0.8 | | | | -- | | | | -- | |
| | | | | | | | | | | | | | | | | | | | | | | | |
| | | 315.0 | | | | -- | | | | -- | | | | 316.5 | | | | -- | | | | -- | |
| | | | | | | | | | | | | | | | | | | | | | | | |
Subtotal | | | 2,717.5 | | | | 1,313.4 | | | | 1,089.1 | | | | 2,519.0 | | | | 1,163.4 | | | | 1,039.1 | |
Current maturities | | | (1.3) | | | | -- | | | | -- | | | | (101.5) | | | | -- | | | | (100.0) | |
Unamortized debt (discount) and premium, net | | | (12.8) | | | | (4.8) | | | | (7.4) | | | | (13.0) | | | | (4.7) | | | | (7.5) | |
| | | | | | | | | | | | | | | | | | | | | | | | |
Long-term debt, net | | | $2,703.4 | | | | $1,308.6 | | | | $1,081.7 | | | | $2,404.5 | | | | $1,158.7 | | | | $931.6 | |
| | | | | | | | | | | | | | | | | | | | | | | | |
| (a) | In June 2010, IPL issued $150 million of 3.3% senior debentures due 2015 and WPL issued $150 million of 4.6% debentures due 2020. The proceeds from the June 2010 debt issuances were used initially to repay short-term debt and invest in short-term assets, and thereafter to fund capital expenditures and for general working capital purposes. |
| (b) | In August 2010, IPL issued $200 million of 3.65% senior debentures due 2020 and used the net proceeds and cash on hand in September 2010 to retire $200 million of its 6.75% senior debentures due 2011. In 2010, IPL incurred debt repayment premiums of $6 million related to the September 2010 retirement that were recorded in “Regulatory assets” on Alliant Energy’s and IPL’s Consolidated Balance Sheets at Dec. 31, 2010. |
| (c) | In March 2010, WPL retired $100 million of its 7.625% debentures. |
In 2009, Alliant Energy announced a tender offer and consent solicitation for all 5,940,960 of its 2.5% Exchangeable Senior Notes due 2030 (Notes). In 2009, Alliant Energy received valid tenders and consents from holders of 5,940,660 Notes and made $241 million of payments related to the Notes tendered using short-term borrowings and cash on hand. These payments exceeded the carrying value of the Notes tendered resulting in Alliant Energy incurring $203 million of pre-tax charges in 2009 related to the repurchase of the Notes. These pre-tax charges were recorded in “Loss on early extinguishment of debt” in Alliant Energy’s Consolidated Statement of Income in 2009. In March 2010, Alliant Energy retired its remaining 300 Notes.
161
Five-Year Schedule of Debt Maturities - At Dec. 31, 2010, Alliant Energy’s, IPL’s and WPL’s debt maturities for 2011 to 2015 were as follows (in millions):
| | | | | | | | | | | | | | | | | | | | |
| | | 2011 | | | 2012 | | | 2013 | | | 2014 | | | 2015 | |
IPL | | | $-- | | | | $-- | | | | $-- | | | | $38 | | | | $150 | |
WPL | | | -- | | | | -- | | | | -- | | | | 8 | | | | 31 | |
Resources | | | 1 | | | | 1 | | | | 1 | | | | 2 | | | | 2 | |
Alliant Energy parent company | | | -- | | | | -- | | | | -- | | | | 250 | | | | -- | |
| | | | | | | | | | | | | | | | | | | | |
Alliant Energy | | | $1 | | | | $1 | | | | $1 | | | | $298 | | | | $183 | |
| | | | | | | | | | | | | | | | | | | | |
At Dec. 31, 2010, there were no significant sinking fund requirements related to the long-term debt on Alliant Energy’s, IPL’s and WPL’s Consolidated Balance Sheets.
Indentures - Alliant Energy maintains an indenture related to its 4% senior notes due 2014. IPL maintains an indenture related to its senior debentures due 2015 through 2039. WPL maintains an indenture related to its debentures due 2019 through 2038. Sheboygan Power, LLC, Resources’ wholly-owned subsidiary, maintains an indenture related to the issuance of its 5.06% senior secured notes due 2011 to 2024.
Optional Redemption Provisions -Alliant Energy and its subsidiaries have certain issuances of long-term debt that contain optional redemption provisions which, if elected by the issuer at its sole discretion, could require material redemption premium payments by the issuer. The redemption premium payments under these optional redemption provisions are variable and dependent on applicable U.S. Treasury rates at the time of redemption. At Dec. 31, 2010, the debt issuances that contained these optional redemption provisions included Alliant Energy’s senior notes due 2014, IPL’s senior debentures due 2015 through 2039, WPL’s debentures due 2019 through 2038 and Sheboygan Power, LLC’s senior secured notes due 2011 to 2024.
Security Provisions -Sheboygan Power, LLC’s 5.06% senior secured notes due 2011 to 2024 are secured by the Sheboygan Falls Energy Facility and related assets.
Unamortized Debt Issuance Costs - Alliant Energy’s, IPL’s and WPL’s unamortized debt issuance costs recorded in “Deferred charges and other” on the Consolidated Balance Sheets at Dec. 31 were as follows (in millions):
| | | | | | | | | | | | |
| | | Alliant Energy | | IPL | | WPL |
| | | 2010 | | 2009 | | 2010 | | 2009 | | 2010 | | 2009 |
Unamortized debt issuance costs | | $21.2 | | $19.3 | | $10.0 | | $8.3 | | $9.1 | | $8.5 |
Carrying Amount and Fair Value of Long-term Debt - Refer to Note 10 for information on the carrying amount and fair value of Alliant Energy’s, IPL’s and WPL’s long-term debt outstanding at Dec. 31, 2010 and 2009.
(9) INVESTMENTS
(a) Unconsolidated Equity Investments -Alliant Energy’s and WPL’s unconsolidated investments accounted for under the equity method of accounting are as follows (dollars in millions):
| | | | | | | | | | | | | | | | | | | | | | | | |
| | | Ownership
Interest at
Dec. 31, 2010 | | | Carrying Value
at Dec. 31, | | | Equity (Income) / Loss | |
| | | | 2010 | | | 2009 | | | 2010 | | | 2009 | | | 2008 | |
Alliant Energy | | | | | | | | | | | | | | | | | | | | | | | | |
ATC (a) | | | 16% | | | | $228 | | | | $219 | | | | ($37) | | | | ($36) | | | | ($32) | |
Wisconsin River Power Company | | | 50% | | | | 8 | | | | 8 | | | | (1) | | | | (1) | | | | (2) | |
Other | | | Various | | | | 2 | | | | 2 | | | | -- | | | | -- | | | | 1 | |
| | | | | | | | | | | | | | | | | | | | | | | | |
| | | | | | | $238 | | | | $229 | | | | ($38) | | | | ($37) | | | | ($33) | |
| | | | | | | | | | | | | | | | | | | | | | | | |
WPL | | | | | | | | | | | | | | | | | | | | | | | | |
ATC (a) | | | 16% | | | | $228 | | | | $219 | | | | ($37) | | | | ($36) | | | | ($32) | |
Wisconsin River Power Company | | | 50% | | | | 8 | | | | 8 | | | | (1) | | | | (1) | | | | (2) | |
| | | | | | | | | | | | | | | | | | | | | | | | |
| | | | | | | $236 | | | | $227 | | | | ($38) | | | | ($37) | | | | ($34) | |
| | | | | | | | | | | | | | | | | | | | | | | | |
| (a) | Alliant Energy and WPL have the ability to exercise significant influence over ATC’s financial and operating policies through their participation on ATC’s Board of Directors. Refer to Note 20 for information regarding related party transactions with ATC. |
162
Summary financial information from the financial statements of these investments is as follows (in millions):
| | | | | | | | | | | | | | | | | | | | | | | | |
| | | Alliant Energy | | | WPL | |
| | | 2010 | | | 2009 | | | 2008 | | | 2010 | | | 2009 | | | 2008 | |
Operating revenues | | | $564 | | | | $529 | | | | $474 | | | | $564 | | | | $529 | | | | $474 | |
Operating income | | | 307 | | | | 292 | | | | 258 | | | | 308 | | | | 294 | | | | 260 | |
Net income | | | 226 | | | | 218 | | | | 197 | | | | 221 | | | | 215 | | | | 192 | |
As of Dec. 31: | | | | | | | | | | | | | | | | | | | | | | | | |
Current assets | | | 64 | | | | 56 | | | | | | | | 63 | | | | 54 | | | | | |
Non-current assets | | | 2,941 | | | | 2,814 | | | | | | | | 2,906 | | | | 2,786 | | | | | |
Current liabilities | | | 429 | | | | 286 | | | | | | | | 429 | | | | 286 | | | | | |
Non-current liabilities | | | 1,266 | | | | 1,341 | | | | | | | | 1,263 | | | | 1,340 | | | | | |
(b) Cash Surrender Value of Life Insurance Policies -Alliant Energy, IPL and WPL have various life insurance policies that cover certain current and former employees and directors. At Dec. 31, the cash surrender value of these investments was as follows (in millions):
| | | | | | | | | | | | |
| | | Alliant Energy | | IPL | | WPL |
| | | 2010 | | 2009 | | 2010 | | 2009 | | 2010 | | 2009 |
Cash surrender value | | $48.3 | | $47.8 | | $14.3 | | $13.2 | | $12.4 | | $14.0 |
(c) Other Investments - Information relating to various debt and equity securities held by Alliant Energy at Dec. 31 that are marked-to-market each reporting period was as follows (in millions):
| | | | | | | | |
| | | 2010 | | 2009 |
| | | Carrying/Fair
Value | | Unrealized Gains,
Net of Tax | | Carrying/Fair
Value | | Unrealized Gains,
Net of Tax |
Available-for-sale securities | | $2.1 | | $-- | | $4.2 | | $0.6 |
(10) FAIR VALUE MEASUREMENTS
Fair Value of Financial Instruments -The carrying amounts of Alliant Energy’s, IPL’s and WPL’s current assets and current liabilities approximate fair value because of the short maturity of such financial instruments. Carrying amounts and the related estimated fair values of other financial instruments at Dec. 31, 2010 and 2009 were as follows (in millions):
| | | | | | | | | | | | | | | | | | | | | | | | |
| | | Alliant Energy | | | IPL | | | WPL | |
| | | Carrying
Amount | | | Fair
Value | | | Carrying
Amount | | | Fair
Value | | | Carrying
Amount | | | Fair
Value | |
Dec. 31, 2010 | | | | | | | | | | | | | | | | | | | | | | | | |
Assets: | | | | | | | | | | | | | | | | | | | | | | | | |
Cash equivalents (Note 1(d)) | | | $128.3 | | | | $128.3 | | | | $5.6 | | | | $5.6 | | | | $-- | | | | $-- | |
Derivative assets (Note 11(a)) | | | 20.9 | | | | 20.9 | | | | 12.9 | | | | 12.9 | | | | 8.0 | | | | 8.0 | |
Deferred proceeds (sales of receivables) (Note 4 (a)) | | | 152.9 | | | | 152.9 | | | | 152.9 | | | | 152.9 | | | | -- | | | | -- | |
Available-for-sale securities (Note 9(c)) | | | 2.1 | | | | 2.1 | | | | 2.1 | | | | 2.1 | | | | -- | | | | -- | |
Capitalization and liabilities: | | | | | | | | | | | | | | | | | | | | | | | | |
Long-term debt (including current maturities) (Note 8(b)) | | | 2,704.7 | | | | 2,958.6 | | | | 1,308.6 | | | | 1,417.0 | | | | 1,081.7 | | | | 1,219.6 | |
Cumulative preferred stock of subsidiaries (Note 7(b)) | | | 243.8 | | | | 266.7 | | | | 183.8 | | | | 210.7 | | | | 60.0 | | | | 56.0 | |
Derivative liabilities (Note 11(a)) | | | 67.3 | | | | 67.3 | | | | 24.0 | | | | 24.0 | | | | 43.3 | | | | 43.3 | |
| | | | | | |
Dec. 31, 2009 | | | | | | | | | | | | | | | | | | | | | | | | |
Assets: | | | | | | | | | | | | | | | | | | | | | | | | |
Cash equivalents (Note 1(d)) | | | 169.3 | | | | 169.3 | | | | -- | | | | -- | | | | 18.1 | | | | 18.1 | |
Derivative assets (Note 11(a)) | | | 31.7 | | | | 31.7 | | | | 16.4 | | | | 16.4 | | | | 15.3 | | | | 15.3 | |
Available-for-sale securities (Note 9(c)) | | | 4.2 | | | | 4.2 | | | | 2.3 | | | | 2.3 | | | | -- | | | | -- | |
Capitalization and liabilities: | | | | | | | | | | | | | | | | | | | | | | | | |
Long-term debt (including current maturities) (Note 8(b)) | | | 2,506.0 | | | | 2,675.5 | | | | 1,158.7 | | | | 1,238.1 | | | | 1,031.6 | | | | 1,125.9 | |
Cumulative preferred stock of subsidiaries (Note 7(b)) | | | 243.8 | | | | 260.9 | | | | 183.8 | | | | 210.3 | | | | 60.0 | | | | 50.6 | |
Derivative liabilities (Note 11(a)) | | | 119.3 | | | | 119.3 | | | | 53.0 | | | | 53.0 | | | | 66.3 | | | | 66.3 | |
163
Valuation Techniques -
Cash equivalents - Cash equivalents include money market fund investments, which are measured at fair value each reporting date using quoted market prices on listed exchanges. Refer to Note 1(d) for additional information regarding cash equivalents.
Derivative assets and derivative liabilities -As of Dec. 31, 2010 and 2009, derivative assets and derivative liabilities included swap contracts, option contracts, and physical forward purchase and sale contracts for electricity and natural gas, financial transmission rights (FTRs) and embedded foreign currency derivatives. IPL’s and WPL’s swap, option and physical forward commodity contracts were non-exchange-based derivative instruments valued using indicative price quotations available through a pricing vendor that provides daily exchange forward price settlements, from broker or dealer quotations or from on-line exchanges. The indicative price quotations reflected the average of the bid-ask mid-point prices and were obtained from sources believed to provide the most liquid market for the commodity. IPL and WPL corroborated a portion of these indicative price quotations using quoted prices for similar assets or liabilities in active markets and categorized derivative instruments based on such indicative price quotations as Level 2. IPL’s and WPL’s commodity contracts that were valued using indicative price quotations based on significant assumptions such as seasonal or monthly shaping and indicative price quotations that could not be readily corroborated were categorized as Level 3. IPL’s and WPL’s swap, option and physical forward commodity contracts were predominately at liquid trading points. IPL’s and WPL’s FTRs were measured at fair value each reporting date using monthly or annual auction shadow prices from relevant auctions. The embedded foreign currency derivatives related to Euro-denominated payment terms included in the wind turbine supply contract with Vestas were measured at fair value using an extrapolation of forward currency rates. Refer to Note 11(a) for additional details of Alliant Energy’s derivative assets and derivative liabilities.
Deferred proceeds (sales of receivables) -At Dec. 31, 2010, the fair value of IPL’s deferred proceeds related to its sales of receivables program was calculated using the carrying amount of receivables sold less the allowance for doubtful accounts associated with the receivables sold and cash proceeds received from the receivables sold. Refer to Note 4(a) for additional information regarding deferred proceeds.
Available-for-sale securities -The fair value of Resources’ investment in Capstone Turbine Corporation’s common stock and certain IPL investments in various debt and equity securities was measured at fair value each reporting date using quoted market prices on listed exchanges. Resources sold its remaining investment in Capstone Turbine Corporation in 2010. Refer to Note 9(c) for additional information regarding available-for-sale securities.
Long-term debt (including current maturities) -For long-term debt instruments that are actively traded, the fair value was based upon quoted market prices each reporting date. For long-term debt instruments that are not actively traded, the fair value was based on discounted cash flow methodology and utilizes assumptions of current market pricing curves. Refer to Note 8(b) for additional information regarding long-term debt.
Cumulative preferred stock of subsidiaries -The fair values of IPL’s 8.375% and 7.10% cumulative preferred stock were based on their closing market prices quoted by the New York Stock Exchange each reporting date. The fair value of WPL’s 4.50% cumulative preferred stock was based on the closing market prices quoted by the NYSE Amex LLC each reporting date. The fair value of WPL’s remaining preferred stock was calculated based on the market yield of similar securities. Refer to Note 7(b) for additional information regarding cumulative preferred stock of subsidiaries.
Valuation Hierarchy -Fair value measurement accounting establishes a fair value hierarchy that prioritizes the inputs to valuation techniques used to measure fair value. The three levels of the fair value hierarchy and examples of each are as follows:
Level 1 -Pricing inputs are quoted prices available in active markets for identical assets or liabilities as of the reporting date. Level 1 assets as of Dec. 31, 2010 and 2009 included cash equivalents and certain IPL investments in securities valued using quoted market prices on listed exchanges.
Level 2 -Pricing inputs are quoted prices for similar asset or liabilities in active markets or quoted prices for identical or similar assets or liabilities in markets that are not active as of the reporting date. Level 2 assets and liabilities as of Dec. 31, 2010 and 2009 included IPL’s and WPL’s non-exchange traded commodity contracts valued using indicative price quotations that are corroborated with quoted prices for similar assets or liabilities in active markets.
Level 3 -Pricing inputs are unobservable inputs for assets or liabilities for which little or no market data exist and require significant management judgment or estimation. Level 3 assets and liabilities as of Dec. 31, 2010 and 2009 included IPL’s deferred proceeds, and IPL’s and WPL’s FTRs, natural gas option contracts, embedded foreign currency derivatives and certain commodity contracts that are valued using indicative price quotations based on significant assumptions such as seasonal or monthly shaping.
164
The fair value hierarchy gives the highest priority to quoted prices in active markets (Level 1) and the lowest priority to unobservable data (Level 3). In some cases, the inputs used to measure fair value might fall in different levels of the fair value hierarchy. The lowest level input that is significant to a fair value measurement in its entirety determines the applicable level in the fair value hierarchy. Assessing the significance of a particular input to the fair value measurement in its entirety requires judgment, considering factors specific to the asset or liability.
Recurring Fair Value Measurements -Disclosure requirements for Alliant Energy’s, IPL’s and WPL’s recurring items subject to fair value measurements at Dec. 31, 2010 and 2009 were as follows (in millions):
| | | | | | | | | | | | | | | | | | | | | | | | | | | | | | | | |
Alliant Energy | | Dec. 31, 2010 | | | Dec. 31, 2009 | |
| | | Fair
Value | | | Level
1 | | | Level
2 | | | Level
3 | | | Fair
Value | | | Level
1 | | | Level
2 | | | Level
3 | |
Assets: | | | | | | | | | | | | | | | | | | | | | | | | | | | | | | | | |
Cash equivalents | | | $128.3 | | | | $128.3 | | | | $-- | | | | $-- | | | | $169.3 | | | | $169.3 | | | | $-- | | | | $-- | |
Derivative assets: | | | | | | | | | | | | | | | | | | | | | | | | | | | | | | | | |
Commodity contracts | | | 16.1 | | | | -- | | | | 10.0 | | | | 6.1 | | | | 27.1 | | | | -- | | | | 20.0 | | | | 7.1 | |
Foreign exchange contracts | | | 4.8 | | | | -- | | | | -- | | | | 4.8 | | | | 4.6 | | | | -- | | | | -- | | | | 4.6 | |
| | | | | | | | | | | | | | | | | | | | | | | | | | | | | | | | |
Total derivative assets | | | 20.9 | | | | -- | | | | 10.0 | | | | 10.9 | | | | 31.7 | | | | -- | | | | 20.0 | | | | 11.7 | |
Deferred proceeds | | | 152.9 | | | | -- | | | | -- | | | | 152.9 | | | | -- | | | | -- | | | | -- | | | | -- | |
Available-for-sale securities | | | 2.1 | | | | 0.6 | | | | 1.4 | | | | 0.1 | | | | 4.2 | | | | 2.3 | | | | 1.8 | | | | 0.1 | |
Liabilities: | | | | | | | | | | | | | | | | | | | | | | | | | | | | | | | | |
Derivative liabilities: | | | | | | | | | | | | | | | | | | | | | | | | | | | | | | | | |
Commodity contracts | | | 67.2 | | | | -- | | | | 63.9 | | | | 3.3 | | | | 117.8 | | | | -- | | | | 113.3 | | | | 4.5 | |
Foreign exchange contracts | | | 0.1 | | | | -- | | | | -- | | | | 0.1 | | | | 1.5 | | | | -- | | | | -- | | | | 1.5 | |
| | | | | | | | | | | | | | | | | | | | | | | | | | | | | | | | |
Total derivative liabilities | | | 67.3 | | | | -- | | | | 63.9 | | | | 3.4 | | | | 119.3 | | | | -- | | | | 113.3 | | | | 6.0 | |
| | |
IPL | | Dec. 31, 2010 | | | Dec. 31, 2009 | |
| | | Fair
Value | | | Level
1 | | | Level
2 | | | Level
3 | | | Fair
Value | | | Level
1 | | | Level
2 | | | Level
3 | |
Assets: | | | | | | | | | | | | | | | | | | | | | | | | | | | | | | | | |
Cash equivalents | | | $5.6 | | | | $5.6 | | | | $-- | | | | $-- | | | | $-- | | | | $-- | | | | $-- | | | | $-- | |
Derivative assets: | | | | | | | | | | | | | | | | | | | | | | | | | | | | | | | | |
Commodity contracts | | | 8.1 | | | | -- | | | | 3.6 | | | | 4.5 | | | | 11.8 | | | | -- | | | | 8.5 | | | | 3.3 | |
Foreign exchange contracts | | | 4.8 | | | | -- | | | | -- | | | | 4.8 | | | | 4.6 | | | | -- | | | | -- | | | | 4.6 | |
| | | | | | | | | | | | | | | | | | | | | | | | | | | | | | | | |
Total derivative assets | | | 12.9 | | | | -- | | | | 3.6 | | | | 9.3 | | | | 16.4 | | | | -- | | | | 8.5 | | | | 7.9 | |
Deferred proceeds | | | 152.9 | | | | -- | | | | -- | | | | 152.9 | | | | -- | | | | -- | | | | -- | | | | -- | |
Available-for-sale securities | | | 2.1 | | | | 0.6 | | | | 1.4 | | | | 0.1 | | | | 2.3 | | | | 0.4 | | | | 1.8 | | | | 0.1 | |
Liabilities: | | | | | | | | | | | | | | | | | | | | | | | | | | | | | | | | |
Derivative liabilities: | | | | | | | | | | | | | | | | | | | | | | | | | | | | | | | | |
Commodity contracts | | | 24.0 | | | | -- | | | | 23.8 | | | | 0.2 | | | | 53.0 | | | | -- | | | | 51.1 | | | | 1.9 | |
| | |
WPL | | Dec. 31, 2010 | | | Dec. 31, 2009 | |
| | | Fair
Value | | | Level
1 | | | Level
2 | | | Level
3 | | | Fair
Value | | | Level
1 | | | Level
2 | | | Level
3 | |
Assets: | | | | | | | | | | | | | | | | | | | | | | | | | | | | | | | | |
Cash equivalents | | | $-- | | | | $-- | | | | $-- | | | | $-- | | | | $18.1 | | | | $18.1 | | | | $-- | | | | $-- | |
Derivative assets: | | | | | | | | | | | | | | | | | | | | | | | | | | | | | | | | |
Commodity contracts | | | 8.0 | | | | -- | | | | 6.4 | | | | 1.6 | | | | 15.3 | | | | -- | | | | 11.5 | | | | 3.8 | |
Liabilities: | | | | | | | | | | | | | | | | | | | | | | | | | | | | | | | | |
Derivative liabilities: | | | | | | | | | | | | | | | | | | | | | | | | | | | | | | | | |
Commodity contracts | | | 43.2 | | | | -- | | | | 40.1 | | | | 3.1 | | | | 64.8 | | | | -- | | | | 62.2 | | | | 2.6 | |
Foreign exchange contracts | | | 0.1 | | | | -- | | | | -- | | | | 0.1 | | | | 1.5 | | | | -- | | | | -- | | | | 1.5 | |
| | | | | | | | | | | | | | | | | | | | | | | | | | | | | | | | |
Total derivative liabilities | | | 43.3 | | | | -- | | | | 40.1 | | | | 3.2 | | | | 66.3 | | | | -- | | | | 62.2 | | | | 4.1 | |
Additional information for Alliant Energy’s, IPL’s and WPL’s recurring fair value measurements using significant unobservable inputs (Level 3 inputs) for 2010 and 2009 was follows (in millions):
165
| | | | | | | | | | | | | | | | | | | | | | | | | | | | | | | | |
Alliant Energy | | Derivative Assets and (Liabilities), net | | | | | | | |
| | | Commodity
Contracts | | | Foreign
Contracts | | | Deferred
Proceeds | | | Available-for-sale
Securities | |
| | | 2010 | | | 2009 | | | 2010 | | | 2009 | | | 2010 | | | 2009 | | | 2010 | | | 2009 | |
Beginning balance, Jan. 1 | | | $2.6 | | | | $10.3 | | | | $3.1 | | | | $4.4 | | | | $-- | | | | $-- | | | | $0.1 | | | | $-- | |
Total gains or (losses) (realized/unrealized) included in changes in net assets (a) | | | (0.8) | | | | (0.3) | | | | 3.8 | | | | (3.3) | | | | -- | | | | -- | | | | -- | | | | 0.1 | |
Transfers in and/or out of Level 3 (b) | | | (0.3) | | | | -- | | | | -- | | | | -- | | | | -- | | | | -- | | | | -- | | | | -- | |
Purchases, sales, issuances and
settlements, net | | | 1.3 | | | | (7.4) | | | | (2.2) | | | | 2.0 | | | | 152.9 | | | | -- | | | | -- | | | | -- | |
| | | | | | | | | | | | | | | | | | | | | | | | | | | | | | | | |
Ending balance, Dec. 31 | | | $2.8 | | | | $2.6 | | | | $4.7 | | | | $3.1 | | | | $152.9 | | | | $-- | | | | $0.1 | | | | $0.1 | |
| | | | | | | | | | | | | | | | | | | | | | | | | | | | | | | | |
| | | | | | | | |
The amount of total gains or (losses) for the period included in changes in net assets attributable to the change in unrealized
gains or (losses) relating to assets and
liabilities held at Dec. 31 (a) | | | ($0.8) | | | | ($0.3) | | | | $3.8 | | | | ($3.3) | | | | $-- | | | | $-- | | | | $-- | | | | $0.1 | |
| | | | | | | | | | | | | | | | | | | | | | | | | | | | | | | | |
| | | |
IPL | | Derivative Assets and (Liabilities), net | | | | | | | |
| | | Commodity
Contracts | | | Foreign
Contracts | | | Deferred
Proceeds | | | Available-for-sale
Securities | |
| | | 2010 | | | 2009 | | | 2010 | | | 2009 | | | 2010 | | | 2009 | | | 2010 | | | 2009 | |
Beginning balance, Jan. 1 | | | $1.4 | | | | $1.4 | | | | $4.6 | | | | ($1.1) | | | | $-- | | | | $-- | | | | $0.1 | | | | $-- | |
Total gains or (losses) (realized/unrealized) included in changes in net assets (a) | | | 0.5 | | | | -- | | | | 3.8 | | | | (2.9) | | | | -- | | | | -- | | | | -- | | | | 0.1 | |
Purchases, sales, issuances and
settlements, net | | | 2.4 | | | | -- | | | | (3.6) | | | | 8.6 | | | | 152.9 | | | | -- | | | | -- | | | | -- | |
| | | | | | | | | | | | | | | | | | | | | | | | | | | | | | | | |
Ending balance, Dec. 31 | | | $4.3 | | | | $1.4 | | | | $4.8 | | | | $4.6 | | | | $152.9 | | | | $-- | | | | $0.1 | | | | $0.1 | |
| | | | | | | | | | | | | | | | | | | | | | | | | | | | | | | | |
| | | | | | | | |
The amount of total gains or (losses) for the period included in changes in net assets attributable to the change in unrealized
gains or (losses) relating to assets and
liabilities held at Dec. 31 (a) | | | $0.5 | | | | $-- | | | | $3.8 | | | | ($2.9) | | | | $-- | | | | $-- | | | | $-- | | | | $0.1 | |
| | | | | | | | | | | | | | | | | | | | | | | | | | | | | | | | |
| | | | | | | | | | | | | | | | | | | | |
WPL | | Derivative Assets and (Liabilities), net | | | | |
| | | Commodity
Contracts | | | Foreign
Contracts | | | | |
| | | 2010 | | | 2009 | | | 2010 | | | 2009 | | | | |
Beginning balance, Jan. 1 | | | $1.2 | | | | $8.9 | | | | ($1.5) | | | | $5.5 | | | | | |
Total gains or (losses) (realized/unrealized) included in changes in net assets (a) | | | (1.3) | | | | (0.3) | | | | -- | | | | (0.4) | | | | | |
Transfers in and/or out of Level 3 (b) | | | (0.3) | | | | -- | | | | -- | | | | -- | | | | | |
Purchases, sales, issuances and settlements, net | | | (1.1) | | | | (7.4) | | | | 1.4 | | | | (6.6) | | | | | |
| | | | | | | | | | | | | | | | | | | | |
Ending balance, Dec. 31 | | | ($1.5) | | | | $1.2 | | | | ($0.1) | | | | ($1.5) | | | | | |
| | | | | | | | | | | | | | | | | | | | |
The amount of total gains or (losses) for the period included in changes in net
assets attributable to the change in unrealized gains or (losses) relating to
assets and liabilities held at Dec. 31 (a) | | | ($1.3) | | | | ($0.3) | | | | $-- | | | | ($0.4) | | | | | |
| | | | | | | | | | | | | | | | | | | | |
| (a) | Gains and losses related to derivative assets and derivative liabilities are recorded in “Regulatory assets” and “Regulatory liabilities” on the Consolidated Balance Sheets. |
| (b) | Observable market inputs became available for certain commodity contracts previously classified as Level 3. The transfers were valued as of the beginning of the period. |
(11) DERIVATIVE INSTRUMENTS
(a) Commodity and Foreign Exchange Derivatives -
Purpose -Alliant Energy, IPL and WPL periodically use derivative instruments for risk management purposes to mitigate exposures to fluctuations in certain commodity prices, transmission congestion costs and currency exchange rates. Alliant Energy’s, IPL’s and WPL’s derivative instruments as of Dec. 31, 2010 and 2009 were not designated as hedging instruments. IPL’s and WPL’s derivative instruments as of Dec. 31, 2010 and 2009 included electric physical forward purchase contracts
166
and swap contracts to mitigate pricing volatility for the electricity purchased to supply to their customers; electric physical forward sale contracts to offset long positions created by reductions in electricity demand forecasts; natural gas swap contracts to mitigate pricing volatility for the fuel used to supply to the natural gas-fired electric generating facilities they operate; natural gas options to mitigate price increases during periods of high demand or lack of supply; FTRs acquired to manage transmission congestion costs; natural gas physical forward purchase and swap contracts to mitigate pricing volatility for natural gas supplied to their retail customers; and embedded foreign currency derivatives related to Euro-denominated payment terms included in the wind turbine supply contract with Vestas.
Notional Amounts -As of Dec. 31, 2010, Alliant Energy, IPL and WPL had notional amounts related to outstanding swap contracts, option contracts, physical forward contracts and FTRs that were accounted for as derivative instruments as follows (units in thousands):
| | | | | | | | | | | | | | | | |
| | | 2011 | | | 2012 | | | 2013 | | | Total | |
Alliant Energy | | | | | | | | | | | | | | | | |
Commodity: | | | | | | | | | | | | | | | | |
Electricity (MWhs) | | | 2,765 | | | | 248 | | | | 204 | | | | 3,217 | |
FTRs (MWs) | | | 25 | | | | -- | | | | -- | | | | 25 | |
Natural gas (dekatherms (Dths)) | | | 51,340 | | | | 14,157 | | | | 1,735 | | | | 67,232 | |
| | | | |
IPL | | | | | | | | | | | | | | | | |
Commodity: | | | | | | | | | | | | | | | | |
Electricity (MWhs) | | | 703 | | | | -- | | | | -- | | | | 703 | |
FTRs (MWs) | | | 13 | | | | -- | | | | -- | | | | 13 | |
Natural gas (Dths) | | | 34,604 | | | | 4,325 | | | | 675 | | | | 39,604 | |
| | | | |
WPL | | | | | | | | | | | | | | | | |
Commodity: | | | | | | | | | | | | | | | | |
Electricity (MWhs) | | | 2,062 | | | | 248 | | | | 204 | | | | 2,514 | |
FTRs (MWs) | | | 12 | | | | -- | | | | -- | | | | 12 | |
Natural gas (Dths) | | | 16,736 | | | | 9,832 | | | | 1,060 | | | | 27,628 | |
The notional amounts in the above table were computed by aggregating the absolute value of purchase and sale positions within commodities for each year. In 2010, Euro-denominated payment terms included in the wind turbine supply contract with Vestas were converted to U.S. dollars.
Financial Statement Presentation -Alliant Energy records derivative instruments at fair value each reporting date on the balance sheet as assets or liabilities. At Dec. 31, 2010 and 2009, the fair values of current derivative assets were included in “Derivative assets,” non-current derivative assets were included in “Deferred charges and other,” current derivative liabilities were included in “Derivative liabilities” and non-current derivative liabilities were included in “Other long-term liabilities and deferred credits” on the Consolidated Balance Sheets as follows (in millions):
| | | | | | | | | | | | | | | | | | | | | | | | |
| | | Alliant Energy | | | IPL | | | WPL | |
| | | 2010 | | | 2009 | | | 2010 | | | 2009 | | | 2010 | | | 2009 | |
Current derivative assets | | | | | | | | | | | | | | | | | | | | | | | | |
Commodity contracts | | | $14.3 | | | | $20.3 | | | | $7.8 | | | | $9.1 | | | | $6.5 | | | | $11.2 | |
Foreign exchange contracts | | | 4.8 | | | | 3.4 | | | | 4.8 | | | | 3.4 | | | | -- | | | | -- | |
| | | | | | | | | | | | | | | | | | | | | | | | |
| | | $19.1 | | | | $23.7 | | | | $12.6 | | | | $12.5 | | | | $6.5 | | | | $11.2 | |
| | | | | | | | | | | | | | | | | | | | | | | | |
Non-current derivative assets | | | | | | | | | | | | | | | | | | | | | | | | |
Commodity contracts | | | $1.8 | | | | $6.8 | | | | $0.3 | | | | $2.7 | | | | $1.5 | | | | $4.1 | |
Foreign exchange contracts | | | -- | | | | 1.2 | | | | -- | | | | 1.2 | | | | -- | | | | -- | |
| | | | | | | | | | | | | | | | | | | | | | | | |
| | | $1.8 | | | | $8.0 | | | | $0.3 | | | | $3.9 | | | | $1.5 | | | | $4.1 | |
| | | | | | | | | | | | | | | | | | | | | | | | |
Current derivative liabilities | | | | | | | | | | | | | | | | | | | | | | | | |
Commodity contracts | | | $55.2 | | | | $99.0 | | | | $23.0 | | | | $49.5 | | | | $32.2 | | | | $49.5 | |
Foreign exchange contracts | | | 0.1 | | | | 1.5 | | | | -- | | | | -- | | | | 0.1 | | | | 1.5 | |
| | | | | | | | | | | | | | | | | | | | | | | | |
| | | $55.3 | | | | $100.5 | | | | $23.0 | | | | $49.5 | | | | $32.3 | | | | $51.0 | |
| | | | | | | | | | | | | | | | | | | | | | | | |
Non-current derivative liabilities | | | | | | | | | | | | | | | | | | | | | | | | |
Commodity contracts | | | $12.0 | | | | $18.8 | | | | $1.0 | | | | $3.5 | | | | $11.0 | | | | $15.3 | |
167
IPL and WPL generally record gains and losses from their derivative instruments with offsets to regulatory assets or regulatory liabilities, based on their fuel and natural gas cost recovery mechanisms, as well as other specific regulatory authorizations. Gains and losses from derivative instruments not designated as hedging instruments were recorded as follows (in millions):
| | | | | | | | | | | | | | | | | | | | | | | | | | |
| | | Location | | Gains (Losses) | |
| | | Recorded on | | Alliant Energy | | | IPL | | | WPL | |
| | | Balance Sheets | | 2010 | | | 2009 | | | 2010 | | | 2009 | | | 2010 | | | 2009 | |
Commodity contracts | | (a) | | ($ | 78.4) | | | ($ | 137.6) | | | ($ | 47.8) | | | ($ | 69.5) | | | ($ | 30.6) | | | ($ | 68.1) | |
Commodity contracts | | (b) | | | 11.5 | | | | 24.4 | | | | 10.6 | | | | 11.7 | | | | 0.9 | | | | 12.7 | |
Foreign exchange contracts | | (b) | | | 3.8 | | | | (3.3) | | | | 3.8 | | | | (2.9) | | | | -- | | | | (0.4) | |
(a) “Regulatory assets” on the Consolidated Balance Sheets
(b) “Regulatory liabilities” on the Consolidated Balance Sheets
Losses from commodity contracts during 2010 and 2009 were primarily due to impacts of decreases in electricity and natural gas prices during such periods.
Credit Risk-related Contingent Features -Alliant Energy, IPL and WPL have entered into various agreements that contain credit risk-related contingent features including requirements for them to maintain certain credit ratings from each of the major credit rating agencies and limitations on their liability positions under the various agreements based upon their credit ratings. In the event of a downgrade in their credit ratings or if their liability positions exceed certain contractual limits, Alliant Energy, IPL or WPL may need to provide credit support in the form of letters of credit or cash collateral up to the amount of their exposure under the contracts, or may need to unwind the contracts and pay the underlying liability positions.
Certain of these agreements with credit risk-related contingency features are accounted for as derivative instruments. The aggregate fair value of all derivatives with credit risk-related contingent features that were in a net liability position on Dec. 31, 2010 was $67.3 million, $24.0 million and $43.3 million for Alliant Energy, IPL and WPL, respectively. At Dec. 31, 2010, Alliant Energy, IPL and WPL all had investment-grade credit ratings. However, IPL exceeded its liability position with one counterparty requiring it to post $0.5 million of cash collateral. If the most restrictive credit risk-related contingent features for derivative agreements in a net liability position were triggered on Dec. 31, 2010, Alliant Energy, IPL and WPL would be required to post an additional $66.8 million, $23.5 million and $43.3 million, respectively, of credit support to their counterparties.
(b) Weather Derivatives -IPL and WPL periodically use non-exchange traded swap agreements based on cooling degree days (CDD) and heating degree days (HDD) measured in their utility service territories to reduce the impact of weather volatility on their electric and natural gas sales volumes. These weather derivatives are accounted for using the intrinsic value method. Any premiums paid related to these weather derivative agreements are expensed over each respective contract period. IPL’s and WPL’s ratepayers do not pay any of the premiums nor do they share in the gains or losses realized from these weather derivatives.
Summer weather derivatives- IPL and WPL periodically utilize weather derivatives based on CDD to reduce the impact of weather volatility on their electric margins for June 1 through Aug. 31 each year. Weather derivatives are based on CDD measured in Cedar Rapids, Iowa and Madison, Wisconsin. The actual CDD measured during these periods resulted in settlements with the counterparties under the agreements, which included net receipts of $9.0 million (IPL receiving $7.0 million and WPL receiving $2.0 million) in 2008. IPL and WPL did not enter into CDD swap agreements in 2010 and 2009.
Winter weather derivatives- IPL and WPL periodically utilize weather derivatives based on HDD to reduce the impact of weather volatility on IPL’s and WPL’s electric and gas margins for Jan. 1 through March 31 and Nov. 1 through Dec. 31 each calendar year. Weather derivatives are based on HDD measured in Cedar Rapids, Iowa and Madison, Wisconsin. The actual HDD measured during these periods resulted in settlements with the counterparties under the agreements, which included net payments of $8.8 million (IPL paying $5.4 million and WPL paying $3.4 million) and net payments of $9.0 million (IPL paying $5.4 million and WPL paying $3.6 million) in 2009 and 2008, respectively. IPL and WPL did not enter into any HDD swap agreements in 2010.
168
Summary information relating to the summer and winter weather derivatives was as follows (in millions):
| | | | | | | | | | | | | | | | | | | | | | | | | | | | | | | | | | | | |
| | | Alliant Energy | | | IPL | | | WPL | |
| | | 2010 | | | 2009 | | | 2008 | | | 2010 | | | 2009 | | | 2008 | | | 2010 | | | 2009 | | | 2008 | |
Gains (losses): | | | | | | | | | | | | | | | | | | | | | | | | | | | | | | | | | | | | |
Electric utility operating revenues | | | $-- | | | | ($2.6) | | | | $4.6 | | | | $-- | | | | ($1.8) | | | | $4.0 | | | | $-- | | | | ($0.8) | | | | $0.6 | |
Gas utility operating revenues | | | -- | | | | (2.6) | | | | (4.6) | | | | -- | | | | (1.4) | | | | (2.4) | | | | -- | | | | (1.2) | | | | (2.2) | |
Settlements (paid to) / received from counterparties, net | | | -- | | | | (8.8) | | | | -- | | | | -- | | | | (5.4) | | | | 1.6 | | | | -- | | | | (3.4) | | | | (1.6) | |
Premiums expensed | | | -- | | | | -- | | | | 0.1 | | | | -- | | | | -- | | | | 0.1 | | | | -- | | | | -- | | | | -- | |
Premiums paid to counterparties | | | -- | | | | -- | | | | 0.1 | | | | -- | | | | -- | | | | 0.1 | | | | -- | | | | -- | | | | -- | |
(12) COMMITMENTS AND CONTINGENCIES
(a) Capital Purchase Obligations -Alliant Energy, IPL and WPL have entered into capital purchase obligations that contain minimum future commitments related to certain capital expenditures for their wind projects. The obligations are related to capital purchase obligations under a master supply agreement executed in 2008 with Vestas for the purchase of 500 MW of wind turbine generator sets and related equipment to support wind generation plans. At Dec. 31, 2010, minimum future commitments related to these capital expenditures were as follows (in millions):
| | | | | | | | | | | | |
| | | 2011 | | | 2012 | | | Total | |
WPL | | | $25 | | | | $-- | | | | $25 | |
Other | | | 54 | | | | 8 | | | | 62 | |
| | | | | | | | | | | | |
Alliant Energy | | | $79 | | | | $8 | | | | $87 | |
| | | | | | | | | | | | |
(b) Operating Expense Purchase Obligations -Alliant Energy, IPL and WPL have entered into various commodity supply, transportation and storage contracts to meet their obligations to deliver electricity and natural gas to their utility customers. Alliant Energy, IPL and WPL also enter into other operating expense purchase obligations with various vendors for other goods and services. At Dec. 31, 2010, Alliant Energy’s, IPL’s and WPL’s minimum future commitments related to these operating expense purchase obligations were as follows (in millions):
| | | | | | | | | | | | | | | | | | | | | | | | | | | | |
Alliant Energy: | | 2011 | | | 2012 | | | 2013 | | | 2014 | | | 2015 | | | Thereafter | | | Total | |
Purchased power (a): | | | | | | | | | | | | | | | | | | | | | | | | | | | | |
DAEC (IPL) (b) | | | $176 | | | | $178 | | | | $200 | | | | $34 | | | | $-- | | | | $-- | | | | $588 | |
Kewaunee Nuclear Power Plant (Kewaunee) (WPL) | | | 61 | | | | 72 | | | | 77 | | | | -- | | | | -- | | | | -- | | | | 210 | |
Other | | | 31 | | | | 3 | | | | -- | | | | -- | | | | -- | | | | -- | | | | 34 | |
| | | | | | | | | | | | | | | | | | | | | | | | | | | | |
| | | 268 | | | | 253 | | | | 277 | | | | 34 | | | | -- | | | | -- | | | | 832 | |
| | | | | | | |
Natural gas | | | 174 | | | | 74 | | | | 42 | | | | 25 | | | | 19 | | | | 33 | | | | 367 | |
Coal (c) | | | 162 | | | | 89 | | | | 62 | | | | 20 | | | | -- | | | | -- | | | | 333 | |
SO2 emission allowances (d) | | | -- | | | | -- | | | | -- | | | | -- | | | | 12 | | | | 22 | | | | 34 | |
Other (e) | | | 85 | | | | 15 | | | | 7 | | | | 1 | | | | -- | | | | -- | | | | 108 | |
| | | | | | | | | | | | | | | | | | | | | | | | | | | | |
| | | $689 | | | | $431 | | | | $388 | | | | $80 | | | | $31 | | | | $55 | | | | $1,674 | |
| | | | | | | | | | | | | | | | | | | | | | | | | | | | |
| | | | | | | |
IPL: | | 2011 | | | 2012 | | | 2013 | | | 2014 | | | 2015 | | | Thereafter | | | Total | �� |
Purchased power (a): | | | | | | | | | | | | | | | | | | | | | | | | | | | | |
DAEC (b) | | | $176 | | | | $178 | | | | $200 | | | | $34 | | | | $-- | | | | $-- | | | | $588 | |
Other | | | 15 | | | | -- | | | | -- | | | | -- | | | | -- | | | | -- | | | | 15 | |
| | | | | | | | | | | | | | | | | | | | | | | | | | | | |
| | | 191 | | | | 178 | | | | 200 | | | | 34 | | | | -- | | | | -- | | | | 603 | |
| | | | | | | |
Natural gas | | | 98 | | | | 31 | | | | 15 | | | | 8 | | | | 6 | | | | 12 | | | | 170 | |
Coal (c) | | | 36 | | | | 34 | | | | 16 | | | | 12 | | | | -- | | | | -- | | | | 98 | |
SO2 emission allowances (d) | | | -- | | | | -- | | | | -- | | | | -- | | | | 12 | | | | 22 | | | | 34 | |
Other (e) | | | 13 | | | | 7 | | | | -- | | | | -- | | | | -- | | | | -- | | | | 20 | |
| | | | | | | | | | | | | | | | | | | | | | | | | | | | |
| | | $338 | | | | $250 | | | | $231 | | | | $54 | | | | $18 | | | | $34 | | | | $925 | |
| | | | | | | | | | | | | | | | | | | | | | | | | | | | |
169
| | | | | | | | | | | | | | | | | | | | | | | | | | | | |
WPL: | | 2011 | | | 2012 | | | 2013 | | | 2014 | | | 2015 | | | Thereafter | | | Total | |
Purchased power (a): | | | | | | | | | | | | | | | | | | | | | | | | | | | | |
Kewaunee | | | $61 | | | | $72 | | | | $77 | | | | $-- | | | | $-- | | | | $-- | | | | $210 | |
Other | | | 16 | | | | 3 | | | | -- | | | | -- | | | | -- | | | | -- | | | | 19 | |
| | | | | | | | | | | | | | | | | | | | | | | | | | | | |
| | | 77 | | | | 75 | | | | 77 | | | | -- | | | | -- | | | | -- | | | | 229 | |
| | | | | | | |
Natural gas | | | 76 | | | | 43 | | | | 27 | | | | 17 | | | | 13 | | | | 21 | | | | 197 | |
Coal (c) | | | 7 | | | | 7 | | | | 7 | | | | 8 | | | | -- | | | | -- | | | | 29 | |
Other (e) | | | 9 | | | | 8 | | | | 7 | | | | 1 | | | | -- | | | | -- | | | | 25 | |
| | | | | | | | | | | | | | | | | | | | | | | | | | | | |
| | | $169 | | | | $133 | | | | $118 | | | | $26 | | | | $13 | | | | $21 | | | | $480 | |
| | | | | | | | | | | | | | | | | | | | | | | | | | | | |
| (a) | Includes payments required by PPAs for capacity rights and minimum quantities of MWh required to be purchased. Refer to Note 20 for additional information on purchased power transactions. |
| (b) | IPL is obligated to pay for capacity and energy delivered under the DAEC PPA. If energy delivered under the DAEC PPA is less than the targeted energy amount, an adjustment payment is made to IPL, which is reflected in IPL’s energy adjustment clause. |
| (c) | IPL and WPL enter into coal transportation contracts that are directly assigned to their specific generating stations, the amounts of which are included in Alliant Energy’s, IPL’s and WPL’s tables above. Also included in Alliant Energy’s and IPL’s tables is IPL’s respective portion of coal and coal transportation contracts related to jointly-owned generating stations not operated by IPL. In addition, Corporate Services entered into system-wide coal contracts on behalf of IPL and WPL of $119 million, $48 million and $39 million for 2011 to 2013, respectively, to allow flexibility for the changing needs of the quantity of coal consumed by each. Coal contract quantities are allocated to specific IPL or WPL generating stations at or before the time of delivery based on various factors including projected heat input requirements, combustion compatibility and efficiency. These system-wide coal contracts have not been directly assigned to IPL and WPL since the specific needs of each utility were not yet known as of Dec. 31, 2010 and therefore are excluded from IPL’s and WPL’s tables above. |
| (d) | IPL has entered into forward contracts to purchase SO2 emission allowances with vintage years of 2014 through 2017 from various counterparties for $34 million. Any SO2 emission allowances acquired under these forward contracts may be used to meet requirements under the Acid Rain Program regulations or the more stringent Clean Air Interstate Rule (CAIR) emission reduction standards. However, any emission allowances acquired under these forward contracts are not expected to be eligible to be used for compliance requirements under the proposed Clean Air Transport Rule (CATR) issued by the EPA in July 2010. The compliance requirements under the CATR may begin as early as 2012. Existing CAIR compliance requirements are expected to remain in effect until compliance requirements under the CATR supersede them. Alliant Energy and IPL are monitoring the possibility of any losses from these forward contracts and the regulatory recovery of any such losses in light of the CATR issued in July 2010. Alliant Energy and IPL are currently unable to predict the ultimate impact these forward contracts will have on their financial condition and results of operations. As of Dec. 31, 2010, Alliant Energy and IPL did not believe any losses from these forward contracts were probable and therefore did not recognize any loss contingency amounts related to the forward contracts. |
| (e) | Includes individual commitments incurred during the normal course of business that exceeded $1 million at Dec. 31, 2010. |
Alliant Energy, IPL and WPL enter into certain contracts that are considered leases and are therefore not included here, but are included in Note 3.
(c) Legal Proceedings -
Air Permitting Violation Claims -In September 2010, Sierra Club filed in U.S. District Court for the Western District of Wisconsin a complaint against WPL, as owner and operator of the Nelson Dewey Generating Station (Nelson Dewey) and the Columbia Energy Center (Columbia), based on allegations that modifications were made at the facilities without complying with the Prevention of Significant Deterioration (PSD) program requirements, Title V Operating Permit requirements of the Clean Air Act (CAA) and state regulatory counterparts contained within the Wisconsin state implementation plans (SIPs) designed to implement the CAA. In October 2010, WPL responded to these claims related to Nelson Dewey and Columbia by filing with the U.S. District Court an answer denying the Columbia allegations and a motion to dismiss the Nelson Dewey allegations based on statute of limitations arguments. In November 2010, WPL filed a motion to dismiss the Nelson Dewey and Columbia allegations based on lack of jurisdiction. Sierra Club has responded to the motions. WPL and Sierra Club are currently exchanging and responding to discovery requests. In February 2011, WPL and Sierra Club filed a joint motion for stay of proceedings for 90 days to explore settlement options, which the U.S. District Court granted in part and denied in part. The trial date has been rescheduled to April 2012. In September 2010, Sierra Club filed in U.S. District Court for the Eastern District of Wisconsin a complaint against WPL, as owner and operator of the Edgewater Generating Station (Edgewater), which contained similar allegations regarding air permitting violations at Edgewater. In February 2011, WPL responded to these claims related to Edgewater by filing with the U.S. District Court an answer denying the allegations and a motion to dismiss the allegations based on lack of jurisdiction. In February 2011, WPL and Sierra Club filed a joint motion for stay of proceedings for 90 days to explore settlement options, of which the U.S. District Court has not yet ruled. No trial date or
170
scheduling order has yet been set. The complaints filed by Sierra Club allege that various projects performed at Nelson Dewey, Columbia and Edgewater in the past were major modifications, as defined in the CAA, and that the owners violated the CAA when they undertook those projects without obtaining permits and installing the best available emission controls for SO2, NOx and particulate matter. In the Edgewater complaint, additional allegations were made regarding violations of emission limits for visible emissions.
In December 2009, the EPA sent a Notice of Violation (NOV) to WPL as an owner and the operator of Edgewater, Nelson Dewey and Columbia. The NOV alleges that the owners failed to comply with appropriate pre-construction review and permitting requirements and as a result violated the PSD program requirements, Title V Operating Permit requirements of the CAA and the Wisconsin SIP.
In response to similar EPA CAA enforcement initiatives, certain utilities have elected to settle with the EPA, while others have elected to litigate. If the EPA and/or Sierra Club successfully prove their claims that projects completed in the past at Edgewater, Nelson Dewey and Columbia required either a state or federal CAA permit, WPL may, under the applicable statutes, be required to pay civil penalties in amounts of up to $37,500 per day for each violation and/or complete actions for injunctive relief. Payment of fines and/or injunctive relief could be included in a settlement outcome. Injunctive relief contained in settlements or court-ordered remedies for other utilities required the installation of pollution control technology, changed operating conditions including use of alternative fuels other than coal, caps for emissions and limitations on generation including retirement of generating units, and other supplemental environmental projects. Should similar remedies be required for final resolution of these matters at Edgewater, Nelson Dewey and Columbia, Alliant Energy and WPL would incur additional capital and operating expenditures. Alliant Energy and WPL are currently reviewing the allegations and are unable to predict the impact of the allegations on their financial condition or results of operations, but believe that an adverse outcome could be significant. WPL and the other owners of Edgewater and Columbia are exploring settlement options while simultaneously defending against these allegations. WPL believes the projects at Edgewater, Nelson Dewey and Columbia were routine or not projected to increase emissions and therefore did not violate the permitting requirements of the CAA. Alliant Energy and WPL do not currently believe any losses from these allegations are both probable and reasonably estimable and therefore have not recognized any related loss contingency amounts as of Dec. 31, 2010.
Alliant Energy Cash Balance Pension Plan (Plan) -In February 2008, a class action lawsuit was filed against the Plan in U.S. District Court for the Western District of Wisconsin (Court). The complaint alleges that certain Plan participants who received distributions prior to their normal retirement age did not receive the full benefit to which they were entitled in violation of the Employee Retirement Income Security Act of 1974 because the Plan applied an improper interest crediting rate to project the cash balance account to their normal retirement age. These Plan participants are limited to individuals who, prior to normal retirement age, received a lump sum distribution and/or received any form of distribution calculated under the Plan’s prior formula after that benefit was determined to be more valuable than their benefit calculated under the Plan’s cash balance formula. The Court has certified two subclasses of plaintiffs that in aggregate include all persons vested or partially vested in the Plan who received these distributions from Jan. 1, 1998 through Aug. 17, 2006 including: 1) persons who received distributions from Jan. 1, 1998 through Feb. 28, 2002; and 2) persons who received distributions from Feb. 29, 2002 through Aug. 17, 2006. In June 2010, the Court issued an opinion and order that granted the plaintiffs’ motion for summary judgment on liability in the lawsuit and decided with respect to damages that prejudgment interest on damages will be allowed at the prime rate at the time of the judgment. A bench trial on the issue of damages was held in June 2010, at which the Court heard evidence on issues related to the amount of damages. In December 2010, the Court issued an opinion and order that decided the interest crediting rate that the Plan used to project the cash balance accounts of the plaintiffs during the class period should have been 8.2% and a pre-retirement mortality discount will not apply to the damages calculation. Based on this opinion and order, the Plan currently believes that the final judgment of damages by the Court may be up to $23 million, which does not include any award for plantiff’s attorney’s fees or costs. The Plan is contesting the Court’s decision and intends to pursue appropriate appeals after the final judgment is rendered by the Court. Alliant Energy, IPL and WPL have not recognized any potential liability for damages from the lawsuit while this matter is being contested. Alliant Energy is currently unable to predict the final outcome of the class action lawsuit or the ultimate impact on its financial condition or results of operations but believes an adverse outcome could have a material effect on retirement plan funding and expense for Alliant Energy, IPL and WPL.
The interest crediting rate used to project the cash balance account to participants’ normal retirement age has also been considered by the IRS as part of its review of Alliant Energy’s request for a favorable determination letter with respect to the tax-qualified status of the Plan. Alliant Energy has reached an agreement with the IRS, which is expected to result in a favorable determination letter for the Plan. The agreement with the IRS is expected to require an amendment to the Plan, which will likely result in future payments to certain Plan participants. Any future payments to Plan participants resulting from an amendment to the Plan will be recognized in the period the amendment is executed.
171
Enerfab Contract -In January 2011, IPL filed a lawsuit in U.S. District Court for the Northern District of Iowa alleging breach of contract against Enerfab, Inc. (Enerfab). The lawsuit alleges that Enerfab, the contractor for extensive work at IPL’s Lansing Generating Station (Lansing), sought payment in excess of the contracted amount. IPL has withheld payment of the disputed amounts from Enerfab. Enerfab claims to be entitled to approximately $8 million of additional payments. In addition, certain subcontractors engaged by Enerfab to work on Lansing have filed liens on Lansing that are approximately $12 million in aggregate. The lawsuit was filed to adjudicate what amounts are actually owed by IPL to Enerfab. Alliant Energy and IPL are currently unable to predict the ultimate outcome of this lawsuit. As of Dec. 31, 2010, Alliant Energy and IPL recognized $6 million in “Electric plant in service” related to future payments the court may determine are owed to Enerfab.
Other - Alliant Energy, IPL and WPL are involved in other legal and administrative proceedings before various courts and agencies with respect to matters arising in the ordinary course of business. Although unable to predict the outcome of these matters, Alliant Energy, IPL and WPL believe that appropriate reserves have been established and final disposition of these actions will not have a material adverse effect on their financial condition or results of operations.
(d)Guarantees and Indemnifications - Alliant Energy provided indemnifications associated with various sales of its non-regulated businesses/assets for losses resulting from potential breach of the representations and warranties made by Alliant Energy on the sale dates and for the breach of its obligations under the sale agreements. Alliant Energy believes the likelihood of having to make any material cash payments under these indemnifications is remote. Alliant Energy recorded liabilities of $1 million related to these indemnifications as of Dec. 31, 2010. The terms of the indemnifications provided by Alliant Energy at Dec. 31, 2010 for the various sales were generally as follows (in millions):
| | | | | | |
Businesses/Assets Sold | | Disposal Date | | Maximum Limit | | Expiration Date |
Brazil | | First quarter of 2006 | | $10 | | January 2011 |
New Zealand | | Fourth quarter of 2006 | | 163 (a) | | March 2012 |
Mexico | | Second quarter of 2007 | | 20 | | June 2012 |
(a) Based on exchange rates at Dec. 31, 2010
Alliant Energy also continues to guarantee the abandonment obligations of Whiting Petroleum Corporation under the Point Arguello partnership agreements. The guarantee does not include a maximum limit. As of Dec. 31, 2010, the present value of the abandonment obligations is estimated at $30 million. Alliant Energy believes that no payments will be made under this guarantee.
Refer to Note 3(a) for discussion of Alliant Energy’s and WPL’s residual value guarantees of their synthetic leases.
(e) Environmental Matters -Alliant Energy, IPL and WPL are subject to environmental regulations as a result of their current and past operations. These regulations are designed to protect public health and the environment and have resulted in compliance, remediation, containment and monitoring obligations which are recorded as environmental liabilities. At Dec. 31, current environmental liabilities were included in “Other current liabilities” and non-current environmental liabilities were included in “Other long-term liabilities and deferred credits” on the Consolidated Balance Sheets as follows (in millions):
| | | | | | | | | | | | |
| | | Alliant Energy | | IPL | | WPL |
| | | 2010 | | 2009 | | 2010 | | 2009 | | 2010 | | 2009 |
Current environmental liabilities | | $7.1 | | $7.3 | | $6.8 | | $6.8 | | $0.3 | | $0.5 |
Non-current environmental liabilities | | 25.8 | | 27.5 | | 21.6 | | 23.4 | | 4.1 | | 4.0 |
| | | | | | | | | | | | |
| | $32.9 | | $34.8 | | $28.4 | | $30.2 | | $4.4 | | $4.5 |
| | | | | | | | | | | | |
MGP Sites -IPL and WPL have current or previous ownership interests in 40 and 14 sites, respectively, previously associated with the production of gas for which they may be liable for investigation, remediation and monitoring costs relating to the sites. IPL and WPL have received letters from state environmental agencies requiring no further action at ten and eight sites, respectively. Additionally, IPL has met state environmental agency expectations at three additional sites requiring no further action for soil remediation. IPL and WPL are working pursuant to the requirements of various federal and state agencies to investigate, mitigate, prevent and remediate, where necessary, the environmental impacts to property, including natural resources, at and around the sites in order to protect public health and the environment.
Alliant Energy, IPL and WPL record environmental liabilities related to these MGP sites based upon periodic studies. Such amounts are based on the best current estimate of the remaining amount to be incurred for investigation, remediation and monitoring costs for those sites where the investigation process has been or is substantially completed, and the minimum of the estimated cost range for those sites where the investigation is in its earlier stages. There are inherent uncertainties associated with the estimated remaining costs for MGP projects primarily due to unknown site conditions and potential changes in regulatory agency requirements. It is possible that future cost estimates will be greater than current estimates as
172
the investigation process proceeds and as additional facts become known. The amounts recognized as liabilities are reduced for expenditures incurred and are adjusted as further information develops or circumstances change. Costs of future expenditures for environmental remediation obligations are not discounted to their fair value. Management currently estimates the range of remaining costs to be incurred for the investigation, remediation and monitoring of Alliant Energy’s sites to be $19 million ($16 million for IPL and $3 million for WPL) to $44 million ($39 million for IPL and $5 million for WPL). At Dec. 31, 2010, Alliant Energy, IPL and WPL had recorded $32 million, $28 million and $4 million, respectively, in current and non-current environmental liabilities for their remaining costs to be incurred for these MGP sites.
Refer to Note 1(b) for discussion of regulatory assets recorded by IPL and WPL, which reflect the probable future rate recovery of MGP expenditures. Considering the current rate treatment, and assuming no material change therein, Alliant Energy, IPL and WPL believe that the clean-up costs incurred for these MGP sites will not have a material adverse effect on their respective financial condition or results of operations. Settlement has been reached with all of IPL’s and WPL’s insurance carriers regarding reimbursement for their MGP-related costs and such amounts have been accounted for as directed by the applicable regulatory jurisdiction.
Other Environmental Contingencies -In addition to the environmental liabilities discussed above, Alliant Energy, IPL and WPL are also monitoring various environmental regulations that may have a significant impact on their future operations. Given uncertainties regarding the outcome, timing and compliance plans for these environmental regulations, Alliant Energy, IPL and WPL are currently not able to determine the complete financial impact of these regulations but do believe that future capital investments and/or modifications to their electric generating facilities to comply with these regulations could be significant. Specific current, proposed or potential environmental regulations that may require significant future expenditures by Alliant Energy, IPL and WPL are included below along with a brief description of these environmental regulations.
Air Quality -
CAIR is an emissions trading program that requires SO2 and NOx emissions reductions at IPL’s and WPL’s fossil fuel-fired electric generating units (EGUs) with greater than 25 MW capacity located in Iowa and Wisconsin through installation of emission controls and/or purchases of allowances. The requirements for NOx and SO2 reductions started in 2009 and 2010, respectively. The requirements of CAIR remain subject to further review by the federal courts and the EPA.
CATR is the EPA’s proposed CAIR replacement rule that would require SO2 and NOx emissions reductions from IPL’s and WPL’s fossil-fueled EGUs with greater than 25 MW of capacity located in Iowa, Minnesota and Wisconsin. Existing CAIR compliance requirements remain effective until the final CATR compliance requirements supersedes them, which the EPA currently estimates will occur in 2012. The compliance deadline for CATR is expected to begin in 2012.
Clean Air Visibility Rule (CAVR) addresses regional haze at national parks and wilderness areas and is expected to require reductions in visibility-impairing emissions, including SO2, NOx and particulate matter, from certain EGUs by installing emission controls including those determined to be Best Available Retrofit Technology. The requirements of CAVR remain subject to further review by the federal courts and the EPA. The CAVR SIPs will determine required compliance actions and deadlines.
Utility Maximum Achievable Control Technology (MACT) Rule is expected to require standards for the control of mercury and other federal hazardous air pollutants for coal- and oil-fired EGUs with greater than 25 MW capacity. The final rule has not been issued; however, compliance is currently expected to be required by 2014.
Wisconsin State Mercury Rule requires WPL’s existing coal-fired EGUs to reduce annual mercury emissions by 40% from a historic baseline beginning in 2010, and to either achieve a 90% annual mercury emissions reduction standard or limit the annual concentration of mercury emissions to 0.008 pounds of mercury per gigawatt-hour beginning in 2015.
Wisconsin Reasonably Available Control Technology Rule requires NOx emissions reductions at Edgewater to achieve compliance with 2013 requirements since it is located in Sheboygan County, which is currently designated as a non-attainment area for Oxone National Ambient Air Quality Standard (NAAQS). WPL installed NOx emission control technologies at Edgewater to meet 2009 to 2012 compliance requirements under this rule.
Ozone NAAQS Rule is expected to reduce the primary standard to a level within a range of 0.06 to 0.07 parts per million and establish a new seasonal secondary standard for EGUs located in areas designated as non-attainment. The final rule is expected to be issued by July 2011 and the schedule for compliance with the Ozone NAAQS Rule has not yet been established.
173
Fine Particle NAAQS Rule is expected to require SO2 and NOx emission reductions in areas designated as non-attainment. The EPA lowered the 24-hour standard and left the annual standard unchanged. In response to a court decision, the EPA is reviewing whether the annual fine particulate matter standard should also be lowered. The schedule for compliance with the Fine Particle NAAQS Rule has not yet been established.
Nitrogen Dioxide (NO2) NAAQS Rule requires a new one-hour NAAQS for NO2 at a level of 100 parts per billion (ppb) and associated ambient air monitoring requirements, while maintaining the current annual standard of 53 ppb. The EPA’s final designations identifying non-attainment areas for the NO2 NAAQS are expected to be issued in 2012. The requirements of the NO2 NAAQS Rule remain subject to further review by the federal courts and the EPA and the schedule for compliance has not yet been established.
SO2 NAAQS Rule requires a new one-hour NAAQS for SO2 at a level of 75 ppb. The EPA’s final designations identifying non-attainment areas for the SO2 NAAQS are expected to be issued in 2012. The compliance deadline for SO2 NAAQS is currently expected to be required by 2017 for non-attainment areas.
Industrial Boiler and Process Heater MACT Rule requires reductions of emissions of hazardous air pollutants at EGUs with less than 25 MW capacity, and auxiliary boilers and process heaters located at EGUs. The requirements of this rule remain subject to further review by the federal courts, the EPA and state environmental agencies. The compliance deadline for the Industrial Boiler and Process Heater MACT rule is currently expected to be 2014.
Emission Standards for Internal Combustion Engines requires national emission standards for hazardous air pollutants for existing diesel-fired stationary reciprocating internal combustion engines, including compression ignition engines. The final compliance deadline for emissions and operating limitations is 2013.
Water Quality -
Section 316(b) of the Federal Clean Water Act is expected to require modifications to cooling water intake structures to assure that these structures reflect the “best technology available” for minimizing adverse environmental impacts to fish and other aquatic life. The requirements of this rule remain subject to further review by the federal courts and the EPA and the schedule for compliance has not yet been established. The EPA expects to issue a proposed rule in 2011 and a final rule in 2012.
Wisconsin State Thermal Rule may require modifications to certain of WPL’s EGUs to limit the amount of heat those facilities can discharge into Wisconsin waters. Compliance with the thermal rule will be evaluated on a case-by-case basis as discharge permits for WPL’s EGUs are renewed.
Hydroelectric Fish Passages and Fish Protective Devices - FERC issued an order requiring WPL’s Prairie du Sac hydro plant to install an agency-approved fish passage at the facility by December 2012. WPL currently expects to request an extension from FERC in 2011.
Land and Solid Waste -
Coal Combustion Residuals (CCR) could impose additional requirements for CCR management, beneficial use applications and disposal including operation and maintenance of active surface impoundments (ash ponds) and/or landfills. The EPA issued a proposed regulation for public comment in 2010, and a final rule is expected by early 2012. The schedule for compliance with the CCR Rule has not yet been established.
Polychlorinated Biphenyls (PCB) - The EPA is re-examining the current authorized uses of PCB in electrical equipment and other applications to determine if these uses present an unreasonable risk of injury to health and the environment. The EPA is expected to issue proposed PCB rules for public comment in 2012 and could include a possible mandate to phase out all PCB-containing equipment. The schedule for compliance with the PCB Rule has not yet been established.
GHG Emissions -
EPA Mandatory GHG Reporting Rule requires that sources above certain threshold levels monitor and report GHG emissions. The annual reporting compliance requirement begins for the calendar year 2010 with the first GHG emissions reports due by March 2011.
EPA New Source Performance Standard (NSPS) for GHG Emissions from Electric Utilities is expected to require performance standards for GHG emissions from new and existing fossil fuel-fired EGUs. The EPA is expected to propose NSPS by July 2011 and finalize NSPS by May 2012. For existing EGUs, state agencies must submit their plans for reducing EGU GHG emissions to the EPA within nine months after publication of the NSPS. The schedule for compliance with the NSPS has not yet been established.
174
EPA GHG Tailoring Rule establishes GHG emissions thresholds for construction and operation of facilities emitting GHG incorporated with air permits applied for after January 2011. The rule also requires new and significantly modified facilities to demonstrate use of the Best Available Control Technologies and energy efficiency measures to minimize GHG emissions.
(f) Credit Risk - Alliant Energy, IPL and WPL are subject to credit risk related to the ability of counterparties to meet their contractual payment obligations or the potential non-performance of counterparties to deliver contracted commodities, other goods or services at the contracted price.
IPL and WPL provide regulated electricity and natural gas services to residential, commercial, industrial and wholesale customers in the Midwest region of the U.S. The geographic concentration of their customers did not contribute significantly to their overall exposure to credit risk. In addition, as a result of their diverse customer base, IPL and WPL did not have any significant concentration of credit risk for receivables arising from the sale of electricity and natural gas services.
IPL and WPL are typically net buyers of commodities (primarily electricity, coal and natural gas) required to provide regulated electricity and natural gas services to their customers. As a result, IPL and WPL are also subject to credit risk related to their counterparties’ failures to deliver commodities at the contracted price.
Alliant Energy, IPL and WPL maintain credit policies to minimize their credit risk. These credit policies include evaluation of the financial condition of counterparties, use of credit risk-related contingent provisions in certain commodity agreements that require credit support from counterparties that exceed certain exposure limits, diversification of counterparties to minimize concentrations of credit risk and the use of standardized agreements that facilitate the netting of cash flows associated with a single counterparty. Based on these credit policies, it is unlikely that a material adverse effect on Alliant Energy’s, IPL’s or WPL’s financial condition or results of operations would occur as a result of counterparty non-performance. However, there is no assurance that such policies will protect Alliant Energy, IPL and WPL against all losses from non-performance by counterparties.
Refer to Notes 1(r) and 11(a) for details of allowances for doubtful accounts and credit risk-related contingent features, respectively.
(g) WPL’s Edgewater Unit 5 Purchase Agreement -WPL and Wisconsin Electric Power Company (WEPCO) entered into an agreement, which became effective in March 2010, for WPL to purchase WEPCO’s 25% ownership interest in Edgewater Unit 5 for WEPCO’s net book value, including working capital. In June 2010, FERC authorized the transaction. In November 2010, the PSCW approved the transaction and WPL’s request to defer all costs and benefits related to the purchase and operation of Edgewater Unit 5 between the time of the transaction and WPL’s next base rate case. WEPCO is currently working with the Michigan Public Service Commission to obtain satisfactory approval for the transaction. WPL currently expects the transaction to close in the first half of 2011 at an approximate purchase price of $40 million to $45 million depending on WEPCO’s working capital balances and level of capital investment in Edgewater Unit 5 prior to the sale. If the purchase is completed, WPL would own 100% of Edgewater Unit 5.
(h) Collective Bargaining Agreements -At Dec. 31, 2010, employees covered by collective bargaining agreements represented 51%, 82% and 92% of total employees of Alliant Energy, IPL and WPL, respectively. In May 2011, WPL’s collective bargaining agreement with International Brotherhood of Electrical Workers (IBEW) Local 965 expires representing 24% and 92% of total employees of Alliant Energy and WPL, respectively. While negotiations to renew the contract with IBEW Local 965 are underway, Alliant Energy and WPL are currently unable to predict the outcome.
(13) JOINTLY-OWNED ELECTRIC UTILITY PLANT
Under joint ownership agreements with other utilities, IPL and WPL have undivided ownership interests in jointly-owned electric generating facilities. Each of the respective owners is responsible for the financing of its portion of the construction costs. Kilowatt-hour generation and operating expenses are primarily divided between the joint owners on the same basis as ownership. IPL’s and WPL’s shares of expenses from jointly-owned electric generating facilities are included in the corresponding operating expenses (e.g. electric production fuel, other operation and maintenance, etc.) on their respective Consolidated Statements of Income. Refer to Note 1(b) for further discussion of cost of removal obligations. Information relative to IPL’s and WPL’s ownership interest in these jointly-owned electric generating facilities at Dec. 31, 2010 was as follows (dollars in millions):
175
| | | | | | | | | | | | | | | | | | | | | | | | | | | | |
| | | In-service
Dates | | | Fuel
Type | | | Ownership
Interest % | | | Plant in
Service | | | Accumulated
Provision for
Depreciation | | | Construction
Work in
Progress | | | Cost of Removal
Obligations
Included in
Regulatory
Liabilities | |
IPL | | | | | | | | | | | | | | | | | | | | | | | | | | | | |
Ottumwa Unit 1 | | | 1981 | | | | Coal | | | | 48.0% | | | | $227.2 | | | | $108.6 | | | | $1.6 | | | | $13.9 | |
George Neal Unit 4 | | | 1979 | | | | Coal | | | | 25.7% | | | | 96.8 | | | | 63.6 | | | | 0.3 | | | | 10.7 | |
George Neal Unit 3 | | | 1975 | | | | Coal | | | | 28.0% | | | | 58.8 | | | | 38.0 | | | | 0.3 | | | | 5.1 | |
Louisa Unit 1 | | | 1983 | | | | Coal | | | | 4.0% | | | | 35.1 | | | | 18.3 | | | | 0.1 | | | | 2.8 | |
| | | | | | | | | | | | | | | | | | | | | | | | | | | | |
| | | | | | | | | | | | | | | 417.9 | | | | 228.5 | | | | 2.3 | | | | 32.5 | |
| | | | | | | | | | | | | | | | | | | | | | | | | | | | |
WPL | | | | | | | | | | | | | | | | | | | | | | | | | | | | |
Edgewater Unit 5 (a) | | | 1985 | | | | Coal | | | | 75.0% | | | | 260.4 | | | | 147.8 | | | | 17.4 | | | | 11.8 | |
Columbia Units 1-2 | | | 1975-1978 | | | | Coal | | | | 46.2% | | | | 241.4 | | | | 148.3 | | | | 2.7 | | | | 9.7 | |
Edgewater Unit 4 | | | 1969 | | | | Coal | | | | 68.2% | | | | 86.7 | | | | 44.6 | | | | 0.3 | | | | 2.6 | |
| | | | | | | | | | | | | | | | | | | | | | | | | | | | |
| | | | | | | | | | | | | | | 588.5 | | | | 340.7 | | | | 20.4 | | | | 24.1 | |
| | | | | | | | | | | | | | | | | | | | | | | | | | | | |
| | | | | | | |
| | | | | | | | | | | | | | | $1,006.4 | | | | $569.2 | | | | $22.7 | | | | $56.6 | |
| | | | | | | | | | | | | | | | | | | | | | | | | | | | |
| (a) | Refer to Note 12(g) for discussion of WPL’s agreement to purchase the remaining 25% ownership interest in Edgewater Unit 5 from WEPCO. |
(14) SEGMENTS OF BUSINESS
Alliant Energy -Alliant Energy’s principal businesses as of Dec. 31, 2010 are:
| • | | Utility -includes the operations of IPL and WPL, which serve customers in Iowa, Wisconsin and Minnesota. The utility business has three reportable segments: a) utility electric operations; b) utility gas operations; and c) utility other, which includes steam operations, various other energy-related products and services and the unallocated portions of the utility business. Various line items in the following tables are not allocated to the electric and gas segments for management reporting purposes and therefore are included only in “Total Utility.” |
| • | | Non-regulated, Parent and Other -includes the operations of Resources and its subsidiaries, Corporate Services, the Alliant Energy parent company, and any Alliant Energy parent company consolidating adjustments. Non-regulated, parent and other has one reportable segment, RMT, a subsidiary of Resources. Additional Resources businesses include Transportation, Non-regulated Generation and other non-regulated investments described in Note 1(a). |
Alliant Energy’s administrative support services are directly charged to the applicable segment where practicable. In all other cases, administrative support services are allocated to the applicable segment based on services agreements. Intersegment revenues were not material to Alliant Energy’s operations and there was no single customer whose revenues were 10% or more of Alliant Energy’s consolidated revenues. Certain financial information relating to Alliant Energy’s business segments, products and services and geographic information was as follows (in millions):
| | | | | | | | | | | | | | | | | | | | | | | | | | | | | | |
| | | | | | Non-regulated, | | | Alliant | | | |
| | | Utility | | | Parent and Other | | | Energy | | | |
| | | Electric | | | Gas | | | Other | | | Total | | | RMT | | | Other | | | Consolidated | | | |
| | | | | | |
2010 | | | | | | | | | | | | | | | | | | | | | | | | | | | | | | |
Operating revenues | | | $2,674.2 | | | | $480.6 | | | | $64.6 | | | | $3,219.4 | | | | $154.0 | | | | $42.7 | | | | $3,416.1 | | | |
Depreciation and amortization | | | 255.1 | | | | 25.2 | | | | 5.3 | | | | 285.6 | | | | 4.0 | | | | 1.7 | | | | 291.3 | | | |
Operating income (loss) | | | 489.8 | | | | 53.4 | | | | (2.5) | | | | 540.7 | | | | (3.9) | | | | 19.3 | | | | 556.1 | | | |
Interest expense, net of AFUDC | | | | | | | | | | | | | | | 142.8 | | | | 0.2 | | | | 2.0 | | | | 145.0 | | | |
Equity income from unconsolidated investments, net | | | (37.8) | | | | -- | | | | -- | | | | (37.8) | | | | -- | | | | (0.3) | | | | (38.1) | | | |
Interest income and other | | | | | | | | | | | | | | | (0.6) | | | | 0.6 | | | | (4.0) | | | | (4.0) | | | |
Income tax expense (benefit) | | | | | | | | | | | | | | | 140.6 | | | | (2.5) | | | | 7.1 | | | | 145.2 | | | |
Income (loss) from continuing operations, net of tax | | | | | | | | | | | | | | | 295.7 | | | | (2.2) | | | | 14.5 | | | | 308.0 | | | |
Loss from discontinued operations, net of tax | | | | | | | | | | | | | | | -- | | | | -- | | | | (1.7) | | | | (1.7) | | | |
Net income (loss) | | | | | | | | | | | | | | | 295.7 | | | | (2.2) | | | | 12.8 | | | | 306.3 | | | |
Preferred dividends | | | | | | | | | | | | | | | 18.7 | | | | -- | | | | -- | | | | 18.7 | | | |
Net income (loss) attributable to Alliant Energy common shareowners | | | | | | | | | | | | | | | 277.0 | | | | (2.2) | | | | 12.8 | | | | 287.6 | | | |
Total assets | | | 7,227.2 | | | | 817.6 | | | | 782.4 | | | | 8,827.2 | | | | 90.7 | | | | 365.0 | | | | 9,282.9 | | | |
Investments in equity method subsidiaries | | | 236.0 | | | | -- | | | | -- | | | | 236.0 | | | | -- | | | | 2.5 | | | | 238.5 | | | |
Construction and acquisition expenditures | | | 729.1 | | | | 39.9 | | | | 64.3 | | | | 833.3 | | | | 1.4 | | | | 32.2 | | | | 866.9 | | | |
176
| | | | | | | | | | | | | | | | | | | | | | | | | | | | |
| | | | | | Non-regulated, | | | Alliant | |
| | | Utility | | | Parent and Other | | | Energy | |
| | | Electric | | | Gas | | | Other | | | Total | | | RMT | | | Other | | | Consolidated | |
| | | | |
2009 | | | | | | | | | | | | | | | | | | | | | | | | | | | | |
Operating revenues | | | $2,475.9 | | | | $525.3 | | | | $92.9 | | | | $3,094.1 | | | | $294.1 | | | | $39.1 | | | | $3,427.3 | |
Depreciation and amortization | | | 233.5 | | | | 25.8 | | | | 8.9 | | | | 268.2 | | | | 2.4 | | | | 3.0 | | | | 273.6 | |
Operating income (loss) | | | 342.2 | | | | 52.3 | | | | (5.8) | | | | 388.7 | | | | (4.9) | | | | 12.4 | | | | 396.2 | |
Interest expense, net of AFUDC | | | | | | | | | | | | | | | 111.6 | | | | 0.2 | | | | 3.4 | | | | 115.2 | |
Loss on early extinguishment of debt | | | | | | | | | | | | | | | -- | | | | -- | | | | 203.0 | | | | 203.0 | |
Equity (income) loss from unconsolidated investments, net | | | (37.0) | | | | -- | | | | -- | | | | (37.0) | | | | -- | | | | 0.4 | | | | (36.6) | |
Interest income and other | | | | | | | | | | | | | | | (1.2) | | | | (1.1) | | | | (2.6) | | | | (4.9) | |
Income tax expense (benefit) | | | | | | | | | | | | | | | 72.8 | | | | (2.5) | | | | (79.6) | | | | (9.3) | |
Income (loss) from continuing operations, net of tax | | | | | | | | | | | | | | | 242.5 | | | | (1.5) | | | | (112.2) | | | | 128.8 | |
Income from discontinued operations, net of tax | | | | | | | | | | | | | | | -- | | | | -- | | | | 0.9 | | | | 0.9 | |
Net income (loss) | | | | | | | | | | | | | | | 242.5 | | | | (1.5) | | | | (111.3) | | | | 129.7 | |
Preferred dividends | | | | | | | | | | | | | | | 18.7 | | | | -- | | | | -- | | | | 18.7 | |
Net income (loss) attributable to Alliant Energy common shareowners | | | | | | | | | | | | | | | 223.8 | | | | (1.5) | | | | (111.3) | | | | 111.0 | |
Total assets | | | 6,867.6 | | | | 803.1 | | | | 902.9 | | | | 8,573.6 | | | | 63.6 | | | | 398.8 | | | | 9,036.0 | |
Investments in equity method subsidiaries | | | 227.1 | | | | -- | | | | -- | | | | 227.1 | | | | -- | | | | 2.1 | | | | 229.2 | |
Construction and acquisition expenditures | | | 1,191.8 | | | | 45.2 | | | | 5.0 | | | | 1,242.0 | | | | 8.2 | | | | (47.6) | | | | 1,202.6 | |
| | | |
| | | | | | Non-regulated, | | | Alliant | |
| | | Utility | | | Parent and Other | | | Energy | |
| | | Electric | | | Gas | | | Other | | | Total | | | RMT | | | Other | | | Consolidated | |
| | | | |
2008 | | | | | | | | | | | | | | | | | | | | | | | | | | | | |
Operating revenues | | | $2,411.3 | | | | $710.4 | | | | $102.1 | | | | $3,223.8 | | | | $396.8 | | | | $48.5 | | | | $3,669.1 | |
Depreciation and amortization | | | 204.8 | | | | 25.1 | | | | 3.1 | | | | 233.0 | | | | 1.5 | | | | 5.2 | | | | 239.7 | |
Operating income (loss) | | | 386.3 | | | | 61.5 | | | | (3.2) | | | | 444.6 | | | | 20.7 | | | | 21.7 | | | | 487.0 | |
Interest expense, net of AFUDC | | | | | | | | | | | | | | | 99.4 | | | | -- | | | | 1.7 | | | | 101.1 | |
Equity (income) loss from unconsolidated investments, net | | | (33.9) | | | | -- | | | | -- | | | | (33.9) | | | | -- | | | | 0.7 | | | | (33.2) | |
Interest income and other | | | | | | | | | | | | | | | (1.9) | | | | (1.8) | | | | (14.9) | | | | (18.6) | |
Income taxes | | | | | | | | | | | | | | | 121.0 | | | | 8.9 | | | | 9.7 | | | | 139.6 | |
Income from continuing operations, net of tax | | | | | | | | | | | | | | | 260.0 | | | | 13.6 | | | | 24.5 | | | | 298.1 | |
Income from discontinued operations, net of tax | | | | | | | | | | | | | | | -- | | | | -- | | | | 8.6 | | | | 8.6 | |
Net income | | | | | | | | | | | | | | | 260.0 | | | | 13.6 | | | | 33.1 | | | | 306.7 | |
Preferred dividends | | | | | | | | | | | | | | | 18.7 | | | | -- | | | | -- | | | | 18.7 | |
Net income attributable to Alliant Energy common shareowners | | | | | | | | | | | | | | | 241.3 | | | | 13.6 | | | | 33.1 | | | | 288.0 | |
Total assets | | | 5,724.6 | | | | 850.5 | | | | 901.3 | | | | 7,476.4 | | | | 110.6 | | | | 614.5 | | | | 8,201.5 | |
Investments in equity method subsidiaries | | | 203.6 | | | | -- | | | | -- | | | | 203.6 | | | | -- | | | | 2.3 | | | | 205.9 | |
Construction and acquisition expenditures | | | 775.1 | | | | 39.8 | | | | 27.5 | | | | 842.4 | | | | 2.5 | | | | 34.1 | | | | 879.0 | |
Products and Services -Alliant Energy’s consolidated operating revenues by segment were as follows:
| | | | | | | | | | | | |
| | | 2010 | | | 2009 | | | 2008 | |
Utility electric operations | | | 78% | | | | 72% | | | | 66% | |
Utility gas operations | | | 14% | | | | 15% | | | | 19% | |
Utility other | | | 2% | | | | 3% | | | | 3% | |
Non-regulated - RMT | | | 5% | | | | 9% | | | | 11% | |
Other | | | 1% | | | | 1% | | | | 1% | |
| | | | | | | | | | | | |
| | | 100% | | | | 100% | | | | 100% | |
| | | | | | | | | | | | |
Geographic Information -At Dec. 31, 2010, 2009 and 2008, Alliant Energy’s long-lived assets to be held and used in foreign countries were not material.
177
IPL - IPL is a utility serving customers in Iowa and Minnesota and includes three reportable segments: a) electric operations; b) gas operations; and c) other, which includes steam operations, various other energy-related products and services and the unallocated portions of the utility business. Various line items in the following tables are not allocated to the electric and gas segments for management reporting purposes and therefore are included only in “Total.” Intersegment revenues were not material to IPL’s operations and there was no single customer whose revenues were 10% or more of IPL’s consolidated revenues. Certain financial information relating to IPL’s business segments was as follows (in millions):
| | | | | | | | | | | | | | | | |
| | | Electric | | | Gas | | | Other | | | Total | |
2010 | | | | | | | | | | | | | | | | |
Operating revenues | | | $1,464.3 | | | | $274.3 | | | | $57.2 | | | | $1,795.8 | |
Depreciation and amortization | | | 157.1 | | | | 14.6 | | | | 5.3 | | | | 177.0 | |
Operating income (loss) | | | 239.7 | | | | 23.6 | | | | (1.4 | ) | | | 261.9 | |
Interest expense, net of AFUDC | | | | | | | | | | | | | | | 76.7 | |
Interest income and other | | | | | | | | | | | | | | | (0.5 | ) |
Income taxes | | | | | | | | | | | | | | | 42.3 | |
Net income | | | | | | | | | | | | | | | 143.4 | |
Preferred dividends | | | | | | | | | | | | | | | 15.4 | |
Earnings available for common stock | | | | | | | | | | | | | | | 128.0 | |
Total assets | | | 4,025.3 | | | | 460.3 | | | | 452.0 | | | | 4,937.6 | |
Construction and acquisition expenditures | | | 298.8 | | | | 20.0 | | | | 64.0 | | | | 382.8 | |
| | | | |
| | | Electric | | | Gas | | | Other | | | Total | |
| 2009 | | | | | | | | | | | | | | | | |
Operating revenues | | | $1,315.6 | | | | $308.8 | | | | $83.6 | | | | $1,708.0 | |
Depreciation and amortization | | | 130.3 | | | | 13.6 | | | | 8.9 | | | | 152.8 | |
Operating income (loss) | | | 196.8 | | | | 27.7 | | | | (2.8 | ) | | | 221.7 | |
Interest expense, net of AFUDC | | | | | | | | | | | | | | | 42.5 | |
Interest income and other | | | | | | | | | | | | | | | (0.8 | ) |
Income taxes | | | | | | | | | | | | | | | 27.0 | |
Net income | | | | | | | | | | | | | | | 153.0 | |
Preferred dividends | | | | | | | | | | | | | | | 15.4 | |
Earnings available for common stock | | | | | | | | | | | | | | | 137.6 | |
Total assets | | | 3,976.6 | | | | 461.4 | | | | 454.2 | | | | 4,892.2 | |
Construction and acquisition expenditures | | | 711.3 | | | | 17.5 | | | | 4.8 | | | | 733.6 | |
| | | | |
| | | Electric | | | Gas | | | Other | | | Total | |
| 2008 | | | | | | | | | | | | | | | | |
Operating revenues | | | $1,258.3 | | | | $410.4 | | | | $89.3 | | | | $1,758.0 | |
Depreciation and amortization | | | 115.5 | | | | 12.7 | | | | 3.1 | | | | 131.3 | |
Operating income (loss) | | | 219.2 | | | | 25.9 | | | | (5.4 | ) | | | 239.7 | |
Interest expense, net of AFUDC | | | | | | | | | | | | | | | 46.8 | |
Interest income and other | | | | | | | | | | | | | | | (1.3 | ) |
Income taxes | | | | | | | | | | | | | | | 52.6 | |
Net income | | | | | | | | | | | | | | | 141.6 | |
Preferred dividends | | | | | | | | | | | | | | | 15.4 | |
Earnings available for common stock | | | | | | | | | | | | | | | 126.2 | |
Total assets | | | 3,232.1 | | | | 483.4 | | | | 495.4 | | | | 4,210.9 | |
Construction and acquisition expenditures | | | 438.8 | | | | 14.5 | | | | 26.0 | | | | 479.3 | |
WPL - WPL is a utility serving customers in Wisconsin and includes three reportable segments: a) electric operations; b) gas operations; and c) other, which includes various other energy-related products and services and the unallocated portions of the utility business. Various line items in the following tables are not allocated to the electric and gas segments for management reporting purposes and therefore are included only in “Total.” Intersegment revenues were not material to WPL’s operations and there was no single customer whose revenues were 10% or more of WPL’s consolidated revenues. Certain financial information relating to WPL’s business segments was as follows (in millions):
178
| | | | | | | | | | | | | | | | |
| | | Electric | | | Gas | | | Other | | | Total | |
2010 | | | | | | | | | | | | | | | | |
Operating revenues | | | $1,209.9 | | | | $206.3 | | | | $7.4 | | | | $1,423.6 | |
Depreciation and amortization | | | 98.0 | | | | 10.6 | | | | -- | | | | 108.6 | |
Operating income (loss) | | | 250.1 | | | | 29.8 | | | | (1.1 | ) | | | 278.8 | |
Interest expense, net of AFUDC | | | | | | | | | | | | | | | 66.1 | |
Equity income from unconsolidated investments | | | (37.8 | ) | | | -- | | | | -- | | | | (37.8 | ) |
Interest income and other | | | | | | | | | | | | | | | (0.1 | ) |
Income taxes | | | | | | | | | | | | | | | 98.3 | |
Net income | | | | | | | | | | | | | | | 152.3 | |
Preferred dividends | | | | | | | | | | | | | | | 3.3 | |
Earnings available for common stock | | | | | | | | | | | | | | | 149.0 | |
Total assets | | | 3,201.9 | | | | 357.3 | | | | 330.4 | | | | 3,889.6 | |
Investments in equity method subsidiaries | | | 236.0 | | | | -- | | | | -- | | | | 236.0 | |
Construction and acquisition expenditures | | | 430.3 | | | | 19.9 | | | | 0.3 | | | | 450.5 | |
| | | | |
| | | Electric | | | Gas | | | Other | | | Total | |
| 2009 | | | | | | | | | | | | | | | | |
Operating revenues | | | $1,160.3 | | | | $216.5 | | | | $9.3 | | | | $1,386.1 | |
Depreciation and amortization | | | 103.2 | | | | 12.2 | | | | -- | | | | 115.4 | |
Operating income (loss) | | | 145.4 | | | | 24.6 | | | | (3.0 | ) | | | 167.0 | |
Interest expense, net of AFUDC | | | | | | | | | | | | | | | 69.1 | |
Equity income from unconsolidated investments | | | (37.0 | ) | | | -- | | | | -- | | | | (37.0 | ) |
Interest income and other | | | | | | | | | | | | | | | (0.4 | ) |
Income taxes | | | | | | | | | | | | | | | 45.8 | |
Net income | | | | | | | | | | | | | | | 89.5 | |
Preferred dividends | | | | | | | | | | | | | | | 3.3 | |
Earnings available for common stock | | | | | | | | | | | | | | | 86.2 | |
Total assets | | | 2,891.0 | | | | 341.7 | | | | 448.7 | | | | 3,681.4 | |
Investments in equity method subsidiaries | | | 227.1 | | | | -- | | | | -- | | | | 227.1 | |
Construction and acquisition expenditures | | | 480.5 | | | | 27.7 | | | | 0.2 | | | | 508.4 | |
| | | | |
| | | Electric | | | Gas | | | Other | | | Total | |
| 2008 | | | | | | | | | | | | | | | | |
Operating revenues | | | $1,153.0 | | | | $300.0 | | | | $12.8 | | | | $1,465.8 | |
Depreciation and amortization | | | 89.3 | | | | 12.4 | | | | -- | | | | 101.7 | |
Operating income | | | 167.1 | | | | 35.6 | | | | 2.2 | | | | 204.9 | |
Interest expense, net of AFUDC | | | | | | | | | | | | | | | 52.6 | |
Equity income from unconsolidated investments | | | (33.9 | ) | | | -- | | | | -- | | | | (33.9 | ) |
Interest income and other | | | | | | | | | | | | | | | (0.6 | ) |
Income taxes | | | | | | | | | | | | | | | 68.4 | |
Net income | | | | | | | | | | | | | | | 118.4 | |
Preferred dividends | | | | | | | | | | | | | | | 3.3 | |
Earnings available for common stock | | | | | | | | | | | | | | | 115.1 | |
Total assets | | | 2,492.5 | | | | 367.1 | | | | 405.9 | | | | 3,265.5 | |
Investments in equity method subsidiaries | | | 203.6 | | | | -- | | | | -- | | | | 203.6 | |
Construction and acquisition expenditures | | | 336.3 | | | | 25.3 | | | | 1.5 | | | | 363.1 | |
(15) GOODWILL AND OTHER INTANGIBLE ASSETS
Goodwill - At both Dec. 31, 2010 and 2009, Alliant Energy had $3 million of goodwill related to RMT included in “Other assets - deferred charges and other” on Alliant Energy’s Consolidated Balance Sheets.
Emission Allowances - The gross carrying amount and accumulated amortization of emission allowances were recorded as intangible assets in “Other assets - deferred charges and other” on the Consolidated Balance Sheets at Dec. 31 as follows (in millions):
| | | | | | | | | | | | | | | | | | | | | | | | |
| | | Alliant Energy | | | IPL | | | WPL | |
| | | 2010 | | | 2009 | | | 2010 | | | 2009 | | | 2010 | | | 2009 | |
Gross carrying amount | | | $50.9 | | | | $68.0 | | | | $47.0 | | | | $59.0 | | | | $3.9 | | | | $9.0 | |
Accumulated amortization | | | 16.5 | | | | 16.7 | | | | 13.1 | | | | 11.8 | | | | 3.4 | | | | 4.9 | |
179
Amortization expense for emission allowances was recorded in “Electric production fuel and energy purchases” in the Consolidated Statements of Income as follows (in millions):
| | | | | | | | | | | | | | | | | | | | | | | | | | | | | | | | | | |
| | | Alliant Energy | | | IPL | | | WPL | |
| | | 2010 | | | 2009 | | | 2008 | | | 2010 | | | 2009 | | | 2008 | | | 2010 | | 2009 | | | 2008 | |
Amortization expense | | | $16.5 | | | | $16.7 | | | | $-- | | | | $13.1 | | | | $11.8 | | | | $-- | | | $3.4 | | | $4.9 | | | | $-- | |
At Dec. 31, 2010, estimated amortization expense for 2011 to 2015 for emission allowances was as follows (in millions):
| | | | | | | | | | | | | | | | | | | | |
| | | 2011 | | | 2012 | | | 2013 | | | 2014 | | | 2015 | |
IPL | | | $11.6 | | | | $8.8 | | | | $7.7 | | | | $5.8 | | | | $-- | |
WPL | | | 0.5 | | | | -- | | | | -- | | | | -- | | | | -- | |
| | | | | | | | | | | | | | | | | | | | |
Alliant Energy | | | $12.1 | | | | $8.8 | | | | $7.7 | | | | $5.8 | | | | $-- | |
| | | | | | | | | | | | | | | | | | | | |
(16) SELECTED CONSOLIDATED QUARTERLY FINANCIAL DATA (UNAUDITED)
Alliant Energy - All “per share” references refer to earnings per diluted share. Summation of the individual quarters may not equal annual totals due to rounding. The amounts for the first quarter of 2010 and first quarter of 2009 have been adjusted from the amounts reflected in the quarterly report on Form 10-Q for the quarter ended March 31, 2010 to reflect a non-regulated business as discontinued operations. Refer to Note 17 for additional information on discontinued operations.
| | | | | | | | | | | | | | | | | | | | | | | | | | | | | | | | |
| | | 2010 | | | 2009 | |
| | | March 31 | | | June 30 | | | Sep. 30 | | | Dec. 31 | | | March 31 | | | June 30 | | | Sep. 30 | | | Dec. 31 | |
| | | (in millions, except per share data) | |
| | | | | | | | |
Operating revenues | | | $890.2 | | | | $741.6 | | | | $951.7 | | | | $832.6 | | | | $948.8 | | | | $740.8 | | | | $884.0 | | | | $853.7 | |
Operating income | | | 109.0 | | | | 100.7 | | | | 246.6 | | | | 99.8 | | | | 73.7 | | | | 62.4 | | | | 159.4 | | | | 100.7 | |
Amounts attributable to Alliant Energy common shareowners: | | | | | | | | | | | | | | | | | | | | | | | | | | | | | | | | |
Income (loss) from continuing operations, net of tax (a) | | | 43.4 | | | | 48.0 | | | | 150.9 | | | | 47.0 | | | | 72.5 | | | | 29.0 | | | | (43.6) | | | | 52.2 | |
Income (loss) from discontinued operations, net of tax (Refer to Note 17) | | | -- | | | | (0.2) | | | | (1.8) | | | | 0.3 | | | | 0.1 | | | | 0.1 | | | | (0.7) | | | | 1.4 | |
Net income (loss) (a) | | | 43.4 | | | | 47.8 | | | | 149.1 | | | | 47.3 | | | | 72.6 | | | | 29.1 | | | | (44.3) | | | | 53.6 | |
| | | | | | | | |
Earnings per weighted average common share attributable to Alliant Energy common shareowners: | | | | | | | | | | | | | | | | | | | | | | | | | | | | | | | | |
Income (loss) from continuing operations, net of tax (a) | | | 0.39 | | | | 0.43 | | | | 1.37 | | | | 0.43 | | | | 0.66 | | | | 0.26 | | | | (0.40) | | | | 0.48 | |
Income (loss) from discontinued operations, net of tax | | | -- | | | | -- | | | | (0.02) | | | | -- | | | | -- | | | | -- | | | | -- | | | | 0.01 | |
Net income (loss) (a) | | | 0.39 | | | | 0.43 | | | | 1.35 | | | | 0.43 | | | | 0.66 | | | | 0.26 | | | | (0.40) | | | | 0.49 | |
| (a) | In the third quarter of 2009, Alliant Energy recorded an after-tax loss of $128 million related to a loss on the early extinguishment of its Exchangeable Senior Notes due 2030. |
IPL -
| | | | | | | | | | | | | | | | | | | | | | | | | | | | | | | | |
| | | 2010 | | | 2009 | |
| | | March 31 | | | June 30 | | | Sep. 30 | | | Dec. 31 | | | March 31 | | | June 30 | | | Sep. 30 | | | Dec. 31 | |
| | | (in millions) | |
| | | | | | | | |
Operating revenues | | | $454.5 | | | | $389.3 | | | | $534.8 | | | | $417.2 | | | | $492.4 | | | | $343.8 | | | | $457.9 | | | | $413.9 | |
Operating income | | | 38.3 | | | | 45.2 | | | | 155.7 | | | | 22.7 | | | | 24.2 | | | | 33.7 | | | | 116.6 | | | | 47.2 | |
Net income | | | 9.7 | | | | 21.2 | | | | 100.6 | | | | 11.9 | | | | 41.7 | | | | 19.4 | | | | 72.8 | | | | 19.1 | |
Earnings available for common stock | | | 5.8 | | | | 17.4 | �� | | | 96.8 | | | | 8.0 | | | | 37.8 | | | | 15.6 | | | | 69.0 | | | | 15.2 | |
WPL -
| | | | | | | | | | | | | | | | | | | | | | | | | | | | | | | | |
| | | 2010 | | | 2009 | |
| | | March 31 | | | June 30 | | | Sep. 30 | | | Dec. 31 | | | March 31 | | | June 30 | | | Sep. 30 | | | Dec. 31 | |
| | | (in millions) | |
| | | | | | | | |
Operating revenues | | | $392.9 | | | | $312.9 | | | | $369.6 | | | | $348.2 | | | | $411.3 | | | | $300.4 | | | | $326.6 | | | | $347.8 | |
Operating income | | | 69.7 | | | | 52.3 | | | | 86.7 | | | | 70.1 | | | | 52.1 | | | | 25.7 | | | | 41.5 | | | | 47.7 | |
Net income | | | 37.0 | | | | 30.2 | | | | 50.0 | | | | 35.1 | | | | 31.3 | | | | 11.6 | | | | 21.0 | | | | 25.6 | |
Earnings available for common stock | | | 36.2 | | | | 29.3 | | | | 49.2 | | | | 34.3 | | | | 30.5 | | | | 10.7 | | | | 20.2 | | | | 24.8 | |
180
(17) DISCONTINUED OPERATIONS AND ASSETS AND LIABILITIES HELD FOR SALE
Alliant Energy is currently pursuing the disposal of its IEA business in order to narrow its strategic focus and risk profile. IEA is included in Alliant Energy’s “Non-regulated - Other” segment. Alliant Energy currently expects to complete the disposal of IEA in the first quarter of 2011. The IEA business qualified as assets held for sale at Dec. 31, 2010.
The operating results of IEA have been separately classified and reported as discontinued operations in Alliant Energy’s Consolidated Statements of Income. A summary of the components of discontinued operations in Alliant Energy’s Consolidated Statements of Income was as follows (in millions):
| | | | | | | | | | | | |
| | | 2010 | | | 2009 | | | 2008 | |
Operating revenues | | | $6.3 | | | | $5.5 | | | | $12.6 | |
Operating expenses (excluding valuation charge) | | | 3.5 | | | | 4.5 | | | | 11.3 | |
Valuation charges (a) | | | 5.4 | | | | -- | | | | -- | |
Interest expense and other | | | 0.2 | | | | 0.3 | | | | 0.4 | |
| | | | | | | | | | | | |
Income (loss) before income taxes | | | (2.8) | | | | 0.7 | | | | 0.9 | |
Income tax benefit (b) | | | (1.1) | | | | (0.2) | | | | (7.7) | |
| | | | | | | | | | | | |
Income (loss) from discontinued operations, net of tax | | | ($1.7) | | | | $0.9 | | | | $8.6 | |
| | | | | | | | | | | | |
| (a) | In 2010, Alliant Energy recorded pre-tax, non-cash valuation charges of $5.4 million as a result of declines in the fair value of IEA during 2010. The fair value was estimated using updated market information from bids received from potential buyers for IEA. |
| (b) | In 2008, Alliant Energy reached a settlement with the IRS related to the audit of its U.S. federal income tax returns for calendar years 2002 through 2004. As a result of completing the audit and recording known adjustments for the tax returns for calendar years 2005 through 2007, Alliant Energy recorded decreases in its liabilities for uncertain tax positions and related interest, net of tax, and changes to its provision for income taxes including the impact of $8 million of income tax benefits allocated to its discontinued operations in 2008 largely related to its former Australia and China businesses. |
A summary of the assets and liabilities held for sale on Alliant Energy’s Consolidated Balance Sheets at Dec. 31 was as follows (in millions):
| | | | | | | | |
| | | 2010 | | | 2009 | |
Assets held for sale: | | | | | | | | |
Property, plant and equipment, net | | | $3.6 | | | | $10.1 | |
Current assets (includes cash) | | | 1.5 | | | | 1.7 | |
Other assets | | | 0.6 | | | | 2.6 | |
| | | | | | | | |
Total assets held for sale | | | 5.7 | | | | 14.4 | |
| | | | | | | | |
Liabilities held for sale: | | | | | | | | |
Current liabilities | | | 1.0 | | | | 1.3 | |
Other long-term liabilities and deferred credits | | | (0.4) | | | | 2.5 | |
| | | | | | | | |
Total liabilities held for sale | | | 0.6 | | | | 3.8 | |
| | | | | | | | |
Net assets held for sale | | | $5.1 | | | | $10.6 | |
| | | | | | | | |
A summary of the components of cash flows for discontinued operations was as follows (in millions):
| | | | | | | | | | | | |
| | | 2010 | | | 2009 | | | 2008 | |
Net cash flows from operating activities | | | $1.3 | | | | $1.7 | | | | $4.8 | |
Net cash flows from (used for) investing activities | | | 2.1 | | | | (0.1) | | | | 0.1 | |
Net cash flows used for financing activities | | | (3.4) | | | | (1.6) | | | | (5.0) | |
(18) ASSET RETIREMENT OBLIGATIONS
Alliant Energy’s AROs relate to legal obligations for the removal, closure or dismantlement of several assets including, but not limited to, active ash landfills, water intake facilities, above ground and under ground storage tanks, groundwater wells, distribution equipment, easement improvements, leasehold improvements, wind projects and certain hydro facilities. Alliant Energy’s AROs also include legal obligations for the management and final disposition of asbestos, lead-based paint and PCB. Alliant Energy’s AROs are recorded in “Other long-term liabilities and deferred credits” on the Consolidated Balance Sheets. Refer to Note 1(b) for information regarding regulatory assets related to AROs. A reconciliation of the changes in AROs associated with long-lived assets is as follows (in millions):
181
| | | | | | | | | | | | | | | | | | | | | | | | |
| | | Alliant Energy | | | IPL | | | WPL | |
| | | 2010 | | | 2009 | | | 2010 | | | 2009 | | | 2010 | | | 2009 | |
Balance, Jan. 1 | | | $63.3 | | | | $48.4 | | | | $41.9 | | | | $30.5 | | | | $21.4 | | | | $17.9 | |
Liabilities incurred (a) | | | 9.8 | | | | 11.6 | | | | -- | | | | 11.6 | | | | 9.8 | | | | -- | |
Accretion expense | | | 4.1 | | | | 2.8 | | | | 2.8 | | | | 1.7 | | | | 1.3 | | | | 1.1 | |
Liabilities settled | | | (1.3) | | | | (2.2) | | | | (1.1) | | | | (1.9) | | | | (0.2) | | | | (0.3) | |
Revisions in estimated cash flows (b) | | | -- | | | | 2.7 | | | | -- | | | | -- | | | | -- | | | | 2.7 | |
| | | | | | | | | | | | | | | | | | | | | | | | |
Balance, Dec. 31 | | | $75.9 | | | | $63.3 | | | | $43.6 | | | | $41.9 | | | | $32.3 | | | | $21.4 | |
| | | | | | | | | | | | | | | | | | | | | | | | |
| (a) | In 2010, WPL recorded AROs of $9.8 million related to its Bent Tree - Phase I wind project. In 2009, IPL recorded AROs of $11.6 million related to its Whispering Willow - - East wind project. |
| (b) | In 2009, WPL recorded revisions in estimated cash flows of $2.7 million based on revised remediation timing and cost information for its Columbia landfill ARO. |
(19) VARIABLE INTEREST ENTITIES
An entity is considered a VIE if its equity investors do not have sufficient equity at risk for the entity to finance its activities without additional subordinated financial support from other parties or its equity investors lack any one of the following three characteristics: (1) power, through voting rights or similar rights, to direct the activities of the entity that most significantly impact the entity’s economic performance; (2) the obligation to absorb expected losses of the entity; or (3) the right to receive expected benefits of the entity. The primary beneficiary of a VIE is required to consolidate the financial statements of the VIE.
After making an ongoing exhaustive effort, Alliant Energy and WPL concluded they were unable to obtain the information necessary from the counterparty (subsidiary of Calpine Corporation) for the Riverside PPA for Alliant Energy and WPL to determine whether the counterparty is a VIE and if Alliant Energy is the primary beneficiary. This PPA is currently accounted for as an operating lease. The counterparty for the Riverside PPA sells a portion of its generating capacity to WPL and can sell its energy output to WPL. Alliant Energy’s and WPL’s maximum exposure to loss from this PPA is undeterminable due to the inability to obtain the necessary information to complete such evaluation. In 2010, 2009 and 2008, Alliant Energy’s (primarily WPL’s) costs, excluding fuel costs, related to the Riverside PPA were $61 million, $63 million and $63 million, respectively.
Refer to Note 1(t) for discussion of new accounting standards effective Jan. 1, 2010 that impact the accounting for VIEs.
(20) RELATED PARTIES
System Coordination and Operating Agreement -IPL and WPL are parties to a system coordination and operating agreement whereby Corporate Services serves as agent on behalf of IPL and WPL. The agreement, which has been approved by FERC, provides a contractual basis for coordinated planning, construction, operation and maintenance of the interconnected electric generation systems of IPL and WPL. As agent of the agreement, Corporate Services enters into energy, capacity, ancillary services, and transmission sale and purchase transactions. Corporate Services allocates such sales and purchases among IPL and WPL based on procedures included in the agreement. The procedures were approved by FERC and all state regulatory bodies having jurisdiction. The sales credited to and purchases billed to IPL and WPL were as follows (in millions):
| | | | | | | | | | | | | | | | | | | | | | | | |
| | | IPL | | | WPL | |
| | | 2010 | | | 2009 | | | 2008 | | | 2010 | | | 2009 | | | 2008 | |
Sales credited | | | $28 | | | | $54 | | | | $43 | | | | $24 | | | | $72 | | | | $22 | |
Purchases billed | | | 341 | | | | 270 | | | | 334 | | | | 73 | | | | 121 | | | | 371 | |
Service Agreement -Pursuant to a service agreement, IPL and WPL receive various administrative and general services from an affiliate, Corporate Services. These services are billed to IPL and WPL at cost based on expenses incurred by Corporate Services for the benefit of IPL and WPL, respectively. These costs consisted primarily of employee compensation, benefits and fees associated with various professional services. The amounts billed to IPL and WPL were as follows (in millions):
| | | | | | | | | | | | |
| | | IPL | | WPL |
| | | 2010 | | 2009 | | 2008 | | 2010 | | 2009 | | 2008 |
Corporate Services billings | | $170 | | $153 | | $193 | | $127 | | $112 | | $120 |
182
As of Dec. 31, net intercompany payables to Corporate Services were as follows (in millions):
| | | | | | | | |
| | | IPL | | WPL |
| | | 2010 | | 2009 | | 2010 | | 2009 |
Net intercompany payables to Corporate Services | | $79 | | $90 | | $42 | | $45 |
ATC -Pursuant to various agreements, WPL receives a range of transmission services from ATC. WPL provides operation, maintenance, and construction services to ATC. WPL and ATC also bill each other for use of shared facilities owned by each party. The related amounts billed between the parties were as follows (in millions):
| | | | | | |
| | | 2010 | | 2009 | | 2008 |
ATC billings to WPL | | $92 | | $83 | | $82 |
WPL billings to ATC | | 11 | | 13 | | 9 |
As of Dec. 31, 2010 and 2009, WPL owed ATC net amounts of $7 million and $5 million, respectively.
Construction Services for IPL’s Whispering Willow - East Wind Project -IPL engaged RMT to provide certain construction services for its Whispering Willow - East wind project. In 2009, RMT recognized $45 million of revenues from IPL related to this project. As of Dec. 31, 2010 and 2009, IPL owed RMT $0 and $7 million, respectively, related to this project.
IPL’s Temporary Generation Lease -Pursuant to a leasing agreement, IPL leased temporary generation in 2008 from IEA, a subsidiary of Resources. IPL used the leased temporary generation to contribute to the reliability of the electric grid in Cedar Rapids, Iowa following the damage to infrastructure caused by the severe flooding in June 2008. IEA billed IPL $6 million in 2008. As of Dec. 31, 2010 and 2009, IPL did not have any outstanding intercompany payables to IEA.
WPL’s Acquisition of the Neenah Energy Facility -In 2009, WPL acquired a 300 MW, simple-cycle, dual-fueled (natural gas/diesel) electric generating facility and related inventories (diesel fuel and materials and supplies) located in Neenah, Wisconsin from Resources for $92 million. The purchase price was allocated to property, plant and equipment ($90 million), production fuel ($1 million) and materials and supplies ($1 million) based on the net book value of the assets acquired.
WPL’s Sheboygan Falls Energy Facility Lease -Refer to Note 3(b) for discussion of WPL’s Sheboygan Falls Energy Facility lease.
(21) EARNINGS PER SHARE
A reconciliation of the weighted average common shares outstanding used in the basic and diluted earnings per weighted average common share (EPS) calculation was as follows (in thousands):
| | | | | | | | | | | | |
| Weighted average common shares outstanding: | | 2010 | | | 2009 | | | 2008 | |
Basic EPS calculation | | | 110,442 | | | | 110,268 | | | | 110,170 | |
Effect of dilutive share-based awards | | | 79 | | | | 84 | | | | 138 | |
| | | | | | | | | | | | |
Diluted EPS calculation | | | 110,521 | | | | 110,352 | | | | 110,308 | |
| | | | | | | | | | | | |
The following options to purchase shares of common stock were excluded from the calculation of diluted EPS as the exercise prices were greater than the average market price:
��
| | | | | | |
| | | 2010 | | 2009 | | 2008 |
Options to purchase shares of common stock | | -- | | 313,237 | | 41,939 |
Weighted average exercise price of options excluded | | $-- | | $29.26 | | $30.98 |
183
| ITEM 9. | CHANGES IN AND DISAGREEMENTS WITH ACCOUNTANTS ON ACCOUNTING AND FINANCIAL DISCLOSURE |
None.
| ITEM 9A. | CONTROLS AND PROCEDURES |
Alliant Energy’s, IPL’s and WPL’s management evaluated, with the participation of each of Alliant Energy’s, IPL’s and WPL’s Chief Executive Officer (CEO), Chief Financial Officer (CFO) and Disclosure Committee, the effectiveness of the design and operation of Alliant Energy’s, IPL’s and WPL’s disclosure controls and procedures as of the end of the quarter ended Dec. 31, 2010 pursuant to the requirements of the Securities Exchange Act of 1934, as amended. Based on their evaluation, the CEO and the CFO concluded that Alliant Energy’s, IPL’s and WPL’s disclosure controls and procedures were effective as of the end of the quarter ended Dec. 31, 2010.
The information required by Item 9A relating to “Management’s Annual Report on Internal Control Over Financial Reporting” and, with respect to Alliant Energy, “Report of Independent Registered Public Accounting Firm” is incorporated herein by reference to the relevant information in Item 8 Financial Statements and Supplementary Data. There was no change in Alliant Energy’s, IPL’s and WPL’s internal control over financial reporting that occurred during the quarter ended Dec. 31, 2010 that has materially affected, or is reasonably likely to materially affect, Alliant Energy’s, IPL’s or WPL’s internal control over financial reporting.
| ITEM 9B. | OTHER INFORMATION |
None.
PART III
| ITEM 10. | DIRECTORS, EXECUTIVE OFFICERS AND CORPORATE GOVERNANCE |
ALLIANT ENERGY AND IPL
The directors of Alliant Energy and IPL are the same and therefore the information required by Item 10 relating to directors and nominees for election of directors is the same for both registrants. The information required by Item 10 relating to directors and nominees for election of directors at the 2011 Annual Meeting of Shareowners is incorporated herein by reference to the relevant information under the caption “Election of Directors” in Alliant Energy’s Proxy Statement for the 2011 Annual Meeting of Shareowners (the 2011 Alliant Energy Proxy Statement), which will be filed with the SEC within 120 days after the end of Alliant Energy’s and IPL’s fiscal years. The information required by Item 10 relating to the timely filing of reports under Section 16 of the Securities Exchange Act of 1934 is incorporated herein by reference to the relevant information under the caption “Section 16(a) Beneficial Ownership Reporting Compliance” in the 2011 Alliant Energy Proxy Statement. Information regarding executive officers of Alliant Energy and IPL may be found in Part I of this report under the caption “Executive Officers of the Registrants.” The information required by Item 10 relating to audit committees and audit committee financial experts is incorporated herein by reference to the relevant information under the caption “Meetings and Committees of the Board” in the 2011 Alliant Energy Proxy Statement. The code of ethics, also referred to as the Code of Conduct, of Alliant Energy and IPL are the same. The information required by Item 10 relating to Alliant Energy’s and IPL’s Code of Conduct is incorporated herein by reference to the relevant information under the caption “Corporate Governance” in the 2011 Alliant Energy Proxy Statement.
WPL
The information required by Item 10 relating to directors and nominees for election of directors at the 2011 Annual Meeting of Shareowners is incorporated herein by reference to the relevant information under the caption “Election of Directors” in WPL’s Proxy Statement for the 2011 Annual Meeting of Shareowners (the 2011 WPL Proxy Statement), which will be filed with the SEC within 120 days after the end of WPL’s fiscal year. The information required by Item 10 relating to the timely filing of reports under Section 16 of the Securities Exchange Act of 1934 is incorporated herein by reference to the relevant information under the caption “Section 16(a) Beneficial Ownership Reporting Compliance” in the 2011 WPL Proxy Statement. Information regarding executive officers of WPL may be found in Part I of this report under the caption “Executive Officers of the Registrants.” The information required by Item 10 relating to audit committees and audit committee financial experts is incorporated herein by reference to the relevant information under the caption “Meetings and Committees of the Board” in the 2011 WPL Proxy Statement. The information required by Item 10 relating to WPL’s code
184
of ethics, also referred to as the Code of Conduct, is incorporated herein by reference to the relevant information under the caption “Corporate Governance” in the 2011 WPL Proxy Statement.
| ITEM 11. | EXECUTIVE COMPENSATION |
ALLIANT ENERGY
The information required by Item 11 for Alliant Energy is incorporated herein by reference to the relevant information under the captions “Compensation Discussion and Analysis,” “Compensation and Personnel Committee Report,” “Summary Compensation Table,” “Grants of Plan-Based Awards,” “Outstanding Equity Awards at Fiscal Year-End,” “Option Exercises and Stock Vested,” “Pension Benefits,” “Nonqualified Deferred Compensation,” “Potential Payments Upon Termination or Change in Control” and “Director Compensation” in the 2011 Alliant Energy Proxy Statement, which will be filed with the SEC within 120 days after the end of Alliant Energy’s fiscal year.
IPL AND WPL
The directors and executive officers for IPL and WPL for which compensation information must be included are the same. Therefore, the information required by Item 11 for each of IPL and WPL is incorporated herein by reference to the relevant information under the captions “Compensation Discussion and Analysis,” “Compensation and Personnel Committee Report,” “Summary Compensation Table,” “Grants of Plan-Based Awards,” “Outstanding Equity Awards at Fiscal Year-End,” “Option Exercises and Stock Vested,” “Pension Benefits,” “Nonqualified Deferred Compensation,” “Potential Payments Upon Termination or Change in Control” and “Director Compensation” in the 2011 WPL Proxy Statement, which will be filed with the SEC within 120 days after the end of IPL’s and WPL’s fiscal years.
| ITEM 12. | SECURITY OWNERSHIP OF CERTAIN BENEFICIAL OWNERS AND MANAGEMENT AND RELATED STOCKHOLDER MATTERS |
ALLIANT ENERGY
Information regarding Alliant Energy’s equity compensation plans as of Dec. 31, 2010 was as follows (Not Applicable (N/A)):
| | | | | | | | | | | | |
Plan Category | | (A)
Number of securities
to be issued upon
exercise of
outstanding options,
warrants and rights | | | (B)
Weighted-average
exercise price of
outstanding
options, warrants
and rights | | | (C)
Number of securities
remaining available for
future issuance under
equity compensation plans
(excluding securities
reflected in column (A)) | |
Equity compensation plans approved by shareowners | | | 560,419 (a) | | | | $27.25 | | | | 4,500,000 (b) | |
Equity compensation plans not approved by shareowners (c) | | | N/A | | | | N/A | | | | N/A (d) | |
| | | | | | | | | | | | |
| | | 560,419 | | | | $27.25 | | | | 4,500,000 | |
| | | | | | | | | | | | |
| (a) | Represents performance shares and options to purchase shares of Alliant Energy’s common stock granted under the Alliant Energy Long-Term Equity Incentive Plan, as amended, and the Alliant Energy Amended and Restated 2002 Equity Incentive Plan (EIP). The performance shares may be paid out in shares of Alliant Energy’s common stock, cash, or a combination of cash and stock and are adjusted by a performance multiplier, which ranges from zero to 200%, based on the performance criteria. The performance shares included in column (A) of the table reflect an assumed payout in the form of Alliant Energy’s common stock at the maximum performance multiplier of 200% for the 2010 and 2009 grants and at the actual performance multiplier of 75% for the 2008 grants. |
| (b) | All of the available shares under the Alliant Energy 2010 Omnibus Incentive Plan (OIP) may be issued upon the exercise of stock options or may be issued as awards in the form of restricted stock, restricted stock units, performance shares, performance units, and other stock-based awards. As of Dec. 31, 2010, there were no grants issued under the OIP. Upon shareowner approval of the OIP in May 2010, the EIP terminated resulting in no new awards authorized to be granted under the EIP. All awards previously granted under the EIP that are still outstanding remain valid and continue to be subject to all of the terms and conditions of the EIP. Excludes 366,223 shares of non-vested restricted common stock previously issued and outstanding under the EIP at Dec. 31, 2010. |
| (c) | As of Dec. 31, 2010, there were 246,301 shares of Alliant Energy’s common stock outstanding under the Alliant Energy Deferred Compensation Plan (DCP), which is described in Note 6(c) of the “Combined Notes to Consolidated Financial Statements.” |
| (d) | There is no limit on the number of shares of Alliant Energy’s common stock that may be held under the DCP. |
185
The remainder of the information required by Item 12 is incorporated herein by reference to the relevant information under the caption “Ownership of Voting Securities” in the 2011 Alliant Energy Proxy Statement, which will be filed with the SEC within 120 days after the end of Alliant Energy’s fiscal year.
IPL
To IPL’s knowledge, no shareowner beneficially owned 5% or more of IPL’s 7.10% Cumulative Preferred Stock. The following table sets forth information, as of Dec. 31, 2010, regarding beneficial ownership by the only persons known to IPL to own more than 5% of its 8.375% Cumulative Preferred Stock. The beneficial ownership set forth below has been reported on Schedule 13G filings with the SEC by the beneficial owners.
| | | | | | | | | | | | | | | | | | | | | | | | |
Amount and Nature of Beneficial Ownership | |
Name and Address of Beneficial Owner | | Voting Power | | | Investment Power | | | Aggregate | | | Percent
of Class | |
| | Sole | | | Shared | | | Sole | | | Shared | | | |
Wells Fargo and Company | | | 401,413 | | | | -- | | | | 401,413 | | | | -- | | | | 401,413 | | | | 6.69% | |
(and certain affiliates) | | | | | | | | | | | | | | | | | | | | | | | | |
420 Montgomery Street | | | | | | | | | | | | | | | | | | | | | | | | |
San Francisco, CA 94104 | | | | | | | | | | | | | | | | | | | | | | | | |
WPL
The information required by Item 12 is incorporated herein by reference to the relevant information under the caption “Ownership of Voting Securities” in the 2011 WPL Proxy Statement, which will be filed with the SEC within 120 days after the end of WPL’s fiscal year.
| ITEM 13. | CERTAIN RELATIONSHIPS AND RELATED TRANSACTIONS, AND DIRECTOR INDEPENDENCE |
ALLIANT ENERGY AND IPL
The information required by Item 13 for each of Alliant Energy and IPL is incorporated herein by reference to the relevant information under the caption “Corporate Governance” in the 2011 Alliant Energy Proxy Statement, which will be filed with the SEC within 120 days after the end of Alliant Energy’s and IPL’s fiscal years.
WPL
The information required by Item 13 is incorporated herein by reference to the relevant information under the caption “Corporate Governance” in the 2011 WPL Proxy Statement, which will be filed with the SEC within 120 days after the end of WPL’s fiscal year.
| ITEM 14. | PRINCIPAL ACCOUNTING FEES AND SERVICES |
ALLIANT ENERGY
The information required by Item 14 is incorporated herein by reference to the relevant information under the caption “Report of the Audit Committee” in the 2011 Alliant Energy Proxy Statement, which will be filed with the SEC within 120 days after the end of Alliant Energy’s fiscal year.
IPL
IPL’s Audit Committee of the Board of Directors (Committee) has adopted a policy that requires advance approval of all audit, audit-related, tax and other permitted services performed by the independent registered public accounting firm. The policy provides for pre-approval by the Committee of specifically defined audit and non-audit services after the Committee is provided with the appropriate level of details regarding the specific services to be provided. The policy does not permit delegation of the Committee’s authority to management. In the event the need for specific services arises between Committee meetings, the Committee has delegated to the Chairperson of the Committee authority to approve permitted services provided that the Chairperson reports any decisions to the Committee at its next scheduled meeting. The principal accounting fees billed to Alliant Energy by its independent registered public accounting firm, all of which were approved in advance by the Committee, directly related and allocated to IPL were as follows (in thousands):
186
| | | | | | | | | | | | | | | | |
| | | 2010 | | | 2009 | |
| | | Fees | | | % of Total | | | Fees | | | % of Total | |
Audit fees | | | $959 | | | | 72% | | | | $941 | | | | 51% | |
Audit-related fees | | | 201 | | | | 15% | | | | 69 | | | | 4% | |
Tax fees | | | 155 | | | | 12% | | | | 811 | | | | 44% | |
All other fees | | | 11 | | | | 1% | | | | 9 | | | | 1% | |
| | | | | | | | | | | | | | | | |
| | | $1,326 | | | | 100% | | | | $1,830 | | | | 100% | |
| | | | | | | | | | | | | | | | |
Audit Fees for 2010 and 2009 consisted of the fees billed for the audits of the consolidated financial statements of IPL and its subsidiary, for reviews of financial statements included in Form 10-Q filings, and for services normally provided in connection with statutory and regulatory filings such as financing transactions. Audit fees also included IPL’s portion of fees for the 2010 and 2009 audits of Alliant Energy’s consolidated financial statements and effectiveness of internal controls over financial reporting. Audit-related fees for 2010 and 2009 consisted of the fees billed for services rendered related to employee benefits plan audits and attest services not required by statute or regulations. Audit-related fees for 2010 also included IPL’s portion of the fees billed for an assessment of International Financial Reporting Standards. Tax fees for 2010 and 2009 consisted of the fees billed for professional services rendered for tax compliance, tax advice and tax planning, including all services performed by the tax professional staff of affiliates of the independent registered public accounting firm, except those rendered in connection with the audit. All other fees for 2010 and 2009 consisted of license fees for accounting research software products, seminars and other education programs. The Committee does not consider the provision of non-audit services by the independent registered public accounting firm described above to be incompatible with maintaining independence of the independent registered public accounting firm.
WPL
The information required by Item 14 is incorporated herein by reference to the relevant information under the caption “Report of the Audit Committee” in the 2011 WPL Proxy Statement, which will be filed with the SEC within 120 days after the end of WPL’s fiscal year.
PART IV
| ITEM 15. | EXHIBITS, FINANCIAL STATEMENT SCHEDULES |
| (1) | Consolidated Financial Statements - Refer to Item 8 Financial Statements and Supplementary Data. |
| (2) | Financial Statement Schedules - |
Schedule I. Condensed Parent Company Financial Statements
Schedule II. Valuation and Qualifying Accounts and Reserves
NOTE: All other schedules are omitted because they are not applicable or not required, or because that required information is shown either in the consolidated financial statements or in the notes thereto.
The following financial statements of American Transmission Company LLC, as a 50 percent or less owned person, are filed herewith as Exhibit 99.1 and incorporated herein, along with the Report of Independent Registered Public Accounting Firm thereon:
Statements of Operations for the Years Ended Dec. 31, 2010, 2009 and 2008
Balance Sheets as of Dec. 31, 2010 and 2009
Statements of Cash Flows for the Years Ended Dec. 31, 2010, 2009 and 2008
Statements of Changes in Members’ Equity for the Years Ended Dec. 31, 2010, 2009 and 2008
187
| (3) | Exhibits Required by SEC Regulation S-K - The following Exhibits are filed herewith or incorporated herein by reference. |
| | |
| 3.1 | | Restated Articles of Incorporation of Alliant Energy, as amended (incorporated by reference to Exhibit 4.1 to Alliant Energy’s Registration Statement on Form S-8, dated July 26, 2004 (Reg. No. 333-117654)) |
| 3.2 | | Restated Bylaws of Alliant Energy, effective as of Dec. 6, 2006 (incorporated by reference to Exhibit 3.1 to Alliant Energy’s Form 8-K, dated Dec. 6, 2006 (File No. 1-9894)) |
| 3.3 | | Restated Articles of Incorporation of WPL, as amended (incorporated by reference to Exhibit 3.1 to WPL’s Form 10-Q for the quarter ended June 30, 1994 (File No. 0-337)) |
| 3.4 | | Restated Bylaws of WPL, effective as of Dec. 6, 2006 (incorporated by reference to Exhibit 3.2 to WPL’s Form 8-K, dated Dec. 6, 2006 (File No. 0-337)) |
| 3.5 | | Restated Articles of Incorporation of IPL (incorporated by reference to Exhibit 3.5 to IPL’s Form 10-K for the year 2003 (File No. 0-4117-1)) |
| 3.6 | | Restated Bylaws of IPL, effective as of Dec. 6, 2006 (incorporated by reference to Exhibit 3.3 to IPL’s Form 8-K, dated Dec. 6, 2006 (File No. 0-4117-1)) |
| 4.1 | | Second Amended and Restated Five Year Credit Agreement, dated as of Nov. 7, 2006, among Alliant Energy and the Banks set forth therein (incorporated by reference to Exhibit 4.4 to Alliant Energy’s Registration Statement on Form S-3 (Reg. No. 333-162214)) |
| 4.2 | | First Amendment, dated as of March 31, 2009, to Second Amended and Restated Five Year Credit Agreement, dated Nov. 7, 2006, among Alliant Energy and the Banks set forth therein (incorporated by reference to Exhibit 4.1 to Alliant Energy’s Form 10-Q for the quarter ended March 31, 2009 (File No. 1-9894)) |
| 4.3 | | Senior Note Indenture, dated as of Sep. 30, 2009, between Alliant Energy and Wells Fargo Bank, N.A. (incorporated by reference to Exhibit 4.28 to Alliant Energy’s Registration Statement on Form S-3 (Reg. No. 333-162214)) |
| 4.4 | | Officer’s Certificate, dated as of Sep. 30, 2009, creating Alliant Energy’s 4.00% Senior Notes due Oct. 15, 2014 (incorporated by reference to Exhibit 4.2 to Alliant Energy’s Form 8-K, dated Sep. 30, 2009 (File No. 1-9894)) |
| 4.5 | | Amended and Restated Rights Agreement, dated as of Dec. 11, 2008, between Alliant Energy and Wells Fargo Bank, N.A. (incorporated by reference to Exhibit 4.1 to Alliant Energy’s Registration Statement on Form 8-A/A, dated Dec. 11, 2008 (File No. 1-9894)) |
| 4.6 | | Second Amended and Restated Five Year Credit Agreement, dated as of Nov. 7, 2006, among WPL and the Banks set forth therein (incorporated by reference to Exhibit 4.8 to Alliant Energy’s Registration Statement on Form S-3 (Reg. No. 333-162214)) |
| 4.7 | | First Amendment, dated as of March 31, 2009, to Second Amended and Restated Five Year Credit Agreement, dated Nov. 7, 2006, among WPL and the Banks set forth therein (incorporated by reference to Exhibit 4.3 to WPL’s Form 10-Q for the quarter ended March 31, 2009 (File No. 0-337)) |
| 4.8 | | Indenture, dated as of June 20, 1997, between WPL and Wells Fargo Bank, N.A., Successor, as Trustee (incorporated by reference to Exhibit 4.33 to Amendment No. 2 to WPL’s Registration Statement on Form S-3 (Reg. No. 033-60917)) |
| 4.9 | | Officers’ Certificate, dated as of July 28, 2004, creating WPL’s 6.25% Debentures due July 31, 2034 (incorporated by reference to Exhibit 4.1 to WPL’s Form 8-K, dated July 30, 2004 (File No. 0-337)) |
| 4.10 | | Officers’ Certificate, dated as of Aug. 8, 2007, creating WPL’s 6.375% Debentures due Aug. 15, 2037 (incorporated by reference to Exhibit 4.1 to WPL’s Form 8-K, dated Aug. 8, 2007 (File No. 0-337)) |
| 4.11 | | Officer’s Certificate, dated as of Oct. 1, 2008, creating WPL’s 7.60% Debentures due Oct. 1, 2038 (incorporated by reference to Exhibit 4.2 to WPL’s Form 8-K, dated Oct. 1, 2008 (File No. 0-337)) |
| 4.12 | | Officers’ Certificate, dated as of July 7, 2009, creating WPL’s 5.00% Debentures due July 15, 2019 (incorporated by reference to Exhibit 4.2 to WPL’s Form 8-K, dated July 7, 2009 (File No. 0-337)) |
| 4.13 | | Officers’ Certificate, dated as of June 10, 2010, creating WPL’s 4.60% Debentures due June 15, 2020 (incorporated by reference to Exhibit 4.2 to WPL’s Form 8-K, dated June 10, 2010 (File No. 0-337)) |
| 4.14 | | Second Amended and Restated Five Year Credit Agreement, dated as of Nov. 7, 2006, among IPL and the Banks set forth therein (incorporated by reference to Exhibit 4.16 to Alliant Energy’s Registration Statement on Form S-3 (Reg. No. 333-162214)) |
| 4.15 | | First Amendment, dated as of March 31, 2009, to Second Amended and Restated Five Year Credit Agreement, dated Nov. 7, 2006, among IPL and the Banks set forth therein (incorporated by reference to Exhibit 4.2 to IPL’s Form 10-Q for the quarter ended March 31, 2009 (File No. 0-4117-1)) |
| 4.16 | | Indenture (For Senior Unsecured Debt Securities), dated as of Aug. 20, 2003, between IPL and The Bank of New York Mellon Trust Co., N.A. (f/k/a The Bank of New York Trust Co., N.A.), as Trustee (incorporated by reference to Exhibit 4.11 to IPL’s Registration Statement on Form S-3 (Reg. No. 333-108199)) |
188
| | |
| 4.17 | | Officer’s Certificate, dated as of Sep. 10, 2003, creating IPL’s 5.875% Senior Debentures due Sep. 15, 2018 (incorporated by reference to Exhibit 4.1 to IPL’s Form 8-K, dated Sep. 10, 2003 (File No. 0-4117-1)) |
| 4.18 | | Officer’s Certificate, dated as of Oct. 14, 2003, creating IPL’s 6.45% Senior Debentures due Oct. 15, 2033 (incorporated by reference to Exhibit 4.1 to IPL’s Form 8-K, dated Oct. 14, 2003 (File No. 0-4117-1)) |
| 4.19 | | Officer’s Certificate, dated as of May 3, 2004, creating IPL’s 6.30% Senior Debentures due May 1, 2034 (incorporated by reference to Exhibit 4.1 to IPL’s Form 8-K, dated May 3, 2004 (File No. 0-4117-1)) |
| 4.19a | | Officer’s Certificate, dated as of Aug. 2, 2004, reopening IPL’s 6.30% Senior Debentures due May 1, 2034 (incorporated by reference to Exhibit 4.1 to IPL’s Form 8-K, dated Aug. 2, 2004 (File No. 0-4117-1)) |
| 4.20 | | Officer’s Certificate, dated as of July 18, 2005, creating IPL’s 5.50% Senior Debentures due July 15, 2025 (incorporated by reference to Exhibit 4 to IPL’s Form 8-K, dated July 18, 2005 (File No. 0-4117-1)) |
| 4.21 | | Officer’s Certificate, dated as of Oct. 1, 2008, creating IPL’s 7.25% Senior Debentures due Oct. 1, 2018 (incorporated by reference to Exhibit 4.1 to IPL’s Form 8-K, dated Oct. 1, 2008 (File No. 0-4117-1)) |
| 4.22 | | Officer’s Certificate, dated as of July 7, 2009, creating IPL’s 6.25% Senior Debentures due July 15, 2039 (incorporated by reference to Exhibit 4.1 to IPL’s Form 8-K, dated July 7, 2009 (File No. 0-4117-1)) |
| 4.23 | | Officer’s Certificate, dated as of June 10, 2010, creating IPL’s 3.30% Senior Debentures due June 15, 2015 (incorporated by reference to Exhibit 4.1 to IPL’s Form 8-K, dated June 10, 2010 (File No. 0-4117-1)) |
| 4.24 | | Officer’s Certificate, dated as of Aug. 23, 2010, creating IPL’s 3.65% Senior Debentures due Sep. 1, 2020 (incorporated by reference to Exhibit 4.1 to IPL’s Form 8-K, dated Aug. 23, 2010 (File No. 0-4117-1)) |
| 10.1 | | Operating Agreement of ATC, dated as of Jan. 1, 2001 (incorporated by reference to Exhibit 10.16 to WPL’s Form 10-K for the year 2000 (File No. 0-337)) |
| 10.2 | | Master Supply Agreement between Corporate Services, as agent for IPL and WPL, and Vestas-American Wind Technology, Inc., dated as of June 1, 2008 (incorporated by reference to Exhibit 10.1 to Alliant Energy’s Form 10-Q for the quarter ended June 30, 2008 (File No. 1-9894)) (a) |
| | (a) Portions of this exhibit have been redacted and are subject to confidential treatment as filed with the Secretary of the SEC pursuant to Rule 24b-2. The redacted material has been filed separately with the SEC. |
| 10.3# | | Alliant Energy Long-Term Equity Incentive Plan, as amended (incorporated by reference to Exhibit 10.1 to Alliant Energy’s Form 10-Q for the quarter ended June 30, 1999 (File No. 1-9894)) |
| 10.4# | | Alliant Energy Amended and Restated 2002 Equity Incentive Plan (EIP) (incorporated by reference to Appendix A to Alliant Energy’s definitive proxy statement filed on Schedule 14A on April 5, 2006 (File No. 1-9894)) |
| 10.4a# | | Form of Non-qualified Stock Option Agreement pursuant to the Alliant Energy EIP (incorporated by reference to Exhibit 10.1 to Alliant Energy’s Form 10-Q for the quarter ended Sep. 30, 2004 (File No. 1-9894)) |
| 10.4b# | | Form of Restricted Stock Agreement pursuant to the Alliant Energy EIP (incorporated by reference to Exhibit 10.2 to Alliant Energy’s Form 10-Q for the quarter ended Sep. 30, 2004 (File No. 1-9894)) |
| 10.4c# | | Form of 2009 Performance Share Agreement pursuant to the Alliant Energy EIP (incorporated by reference to Exhibit 10.4c to Alliant Energy’s Form 10-K for the year 2008 (File No. 1-9894)) |
| 10.4d# | | Form of 2010 Performance Share Agreement pursuant to the Alliant Energy EIP (incorporated by reference to Exhibit 10.4d to Alliant Energy’s Form 10-K for the year 2009 (File No. 1-9894)) |
| 10.4e# | | Form of 2009 Performance Contingent Restricted Stock Agreement pursuant to the Alliant Energy EIP (incorporated by reference to Exhibit 10.4d to Alliant Energy’s Form 10-K for the year 2008 (File No. 1-9894)) |
| 10.4f# | | Form of 2010 Performance Contingent Restricted Stock Agreement pursuant to the Alliant Energy EIP (incorporated by reference to Exhibit 10.4f to Alliant Energy’s Form 10-K for the year 2009 (File No. 1-9894)) |
| 10.5# | | Alliant Energy 2010 Omnibus Incentive Plan (OIP) (incorporated by reference to Appendix A to Alliant Energy’s definitive proxy statement filed on Schedule 14A on April 1, 2010 (File No. 1-9894)) |
| 10.5a# | | Form of Performance Share Agreement pursuant to the Alliant Energy OIP |
| 10.5b# | | Form of Performance Contingent Restricted Stock Agreement pursuant to the Alliant Energy OIP |
| 10.6# | | Alliant Energy Director Long Term Incentive Plan (DLIP), for director-level employees |
| 10.6a# | | Form of Restricted Cash Agreement pursuant to the Alliant Energy DLIP |
| 10.6b# | | Form of Performance Restricted Award Agreement pursuant to the Alliant Energy DLIP |
| 10.7# | | Alliant Energy Deferred Compensation Plan, as amended and restated effective Jan. 1, 2011 (incorporated by reference to Exhibit 10.1 to Alliant Energy’s Form 8-K, dated Dec. 8, 2010 (File No. 1-9894)) |
| 10.8# | | Alliant Energy Rabbi Trust Agreement for Deferred Compensation Plans (incorporated by reference to Exhibit 10.19 to Alliant Energy’s Form 10-K for the year 2005 (File No. 1-9894)) |
| 10.9# | | Alliant Energy Excess Retirement Plan (incorporated by reference to Exhibit 10.1 to Alliant Energy’s Form 10-Q for the quarter ended Sep. 30, 2008 (File No. 1-9894)) |
189
| | |
| 10.10# | | Form of Supplemental Retirement Plan Agreement (SRP) by and between Alliant Energy and W.D. Harvey (incorporated by reference to Exhibit 10.1 to Alliant Energy’s Form 8-K, dated Dec. 10, 2008 (File No. 1-9894)) |
| 10.11# | | Form of SRP by and between Alliant Energy and each of T.L. Aller, T.L. Hanson, P.L. Kampling and J.O. Larsen (incorporated by reference to Exhibit 10.3 to Alliant Energy’s Form 8-K, dated Dec. 10, 2008 (File No. 1-9894)) |
| 10.12# | | Form of SRP by and between Alliant Energy and D.K. Doyle (incorporated by reference to Exhibit 10.2 to Alliant Energy’s Form 8-K, dated Dec. 10, 2008 (File No. 1-9894)) |
| 10.13# | | Form of Alliant Energy Defined Contribution Supplemental Retirement Plan (incorporated by reference to Exhibit 10.1 to Alliant Energy’s Form 10-Q for the quarter ended Sep. 30, 2010 (File No. 1-9894)) |
| 10.14# | | Form of Key Executive Employment and Severance Agreement (KEESA), by and between Alliant Energy and W.D. Harvey (incorporated by reference to Exhibit 10.2 to Alliant Energy’s Form 10-Q for the quarter ended June 30, 2008 (File No. 1-9894)) |
| 10.15# | | Form of KEESA, by and between Alliant Energy and P.L. Kampling (incorporated by reference to Exhibit 10.1 to Alliant Energy’s Form 8-K, dated Oct. 27, 2010 (File No. 1-9894)) |
| 10.16# | | Form of KEESA, by and between Alliant Energy and each of T.L. Aller, D.K. Doyle, J.H. Gallegos, T.L. Hanson, J.O. Larsen, W.A. Reschke and J.J. Schmidt (incorporated by reference to Exhibit 10.3 to Alliant Energy’s Form 10-Q for the quarter ended June 30, 2008 (File No. 1-9894)) |
| 10.17# | | Executive Severance Benefit under the Alliant Energy Severance Plan Summary Plan Description, effective March 19, 2008 (incorporated by reference to Exhibit 10.1 to Alliant Energy’s Form 8-K, dated March 19, 2008 (File No. 1-9894)) |
| 10.18# | | Summary of Compensation and Benefits for Non-Employee Directors of Alliant Energy, IPL and WPL, effective Jan. 1, 2011 |
| 12.1 | | Ratio of Earnings to Fixed Charges for Alliant Energy |
| 12.2 | | Ratio of Earnings to Fixed Charges and Ratio of Earnings to Combined Fixed Charges and Preferred Dividend Requirements for IPL |
| 12.3 | | Ratio of Earnings to Fixed Charges and Ratio of Earnings to Combined Fixed Charges and Preferred Dividend Requirements for WPL |
| 21.1 | | Subsidiaries of Alliant Energy |
| 21.2 | | Subsidiaries of WPL |
| 23.1 | | Consent of Independent Registered Public Accounting Firm for Alliant Energy |
| 23.2 | | Consent of Independent Registered Public Accounting Firm for IPL |
| 23.3 | | Consent of Independent Registered Public Accounting Firm for WPL |
| 23.4 | | Consent of Independent Registered Public Accounting Firm for American Transmission Company LLC |
| 31.1 | | Certification of the Chairman and CEO for Alliant Energy |
| 31.2 | | Certification of the Vice President-CFO and Treasurer for Alliant Energy |
| 31.3 | | Certification of the Chairman and CEO for IPL |
| 31.4 | | Certification of the Vice President-CFO and Treasurer for IPL |
| 31.5 | | Certification of the Chairman and CEO for WPL |
| 31.6 | | Certification of the Vice President-CFO and Treasurer for WPL |
| 32.1 | | Written Statement of the CEO and CFO Pursuant to 18 U.S.C.§1350 for Alliant Energy |
| 32.2 | | Written Statement of the CEO and CFO Pursuant to 18 U.S.C.§1350 for IPL |
| 32.3 | | Written Statement of the CEO and CFO Pursuant to 18 U.S.C.§1350 for WPL |
| 99.1 | | Financial Statements of American Transmission Company LLC |
| 101.INS* | | Alliant Energy’s XBRL Instance Document |
| 101.SCH* | | Alliant Energy’s XBRL Taxonomy Extension Schema Document |
| 101.CAL* | | Alliant Energy’s XBRL Taxonomy Extension Calculation Linkbase Document |
| 101.LAB* | | Alliant Energy’s XBRL Taxonomy Extension Label Linkbase Document |
| 101.PRE* | | Alliant Energy’s XBRL Taxonomy Extension Presentation Linkbase Document |
| 101.DEF* | | Alliant Energy’s XBRL Taxonomy Extension Definition Linkbase Document |
| # | A management contract or compensatory plan or arrangement. |
190
| * | Furnished as Exhibit 101 to this report are the following documents formatted in Extensible Business Reporting Language (XBRL): (i) Alliant Energy’s Consolidated Statements of Income for the years ended Dec. 31, 2010, 2009 and 2008; (ii) Alliant Energy’s Consolidated Balance Sheets as of Dec. 31, 2010 and 2009; (iii) Alliant Energy’s Consolidated Statements of Cash Flows for the years ended Dec. 31, 2010, 2009 and 2008; (iv) Alliant Energy’s Consolidated Statements of Common Equity for the years ended Dec. 31, 2010, 2009 and 2008; (v) Alliant Energy’s Consolidated Statements of Comprehensive Income for the years ended Dec. 31, 2010, 2009 and 2008; and (vi) Alliant Energy’s Combined Notes to Consolidated Financial Statements. |
Pursuant to Item 601(b)(4)(iii) of Regulation S-K, the registrants agree to furnish to the SEC, upon request, any instrument defining the rights of holders of unregistered long-term debt not filed as an exhibit to this combined Form 10-K. No such instrument authorizes securities in excess of 10% of the total assets of Alliant Energy, WPL or IPL, as the case may be.
SCHEDULE I - CONDENSED PARENT COMPANY FINANCIAL STATEMENTS
ALLIANT ENERGY CORPORATION
(Parent Company Only)
CONDENSED STATEMENTS OF INCOME
| | | | | | | | | | | | |
| | | Year Ended December 31, | |
| | | 2010 | | | 2009 | | | 2008 | |
| | | (in millions) | |
Operating revenues | | | $1 | | | | $1 | | | | $1 | |
Operating expenses | | | 2 | | | | 6 | | | | 1 | |
| | | | | | | | | | | | |
Operating loss | | | (1) | | | | (5) | | | | -- | |
| | | | | | | | | | | | |
Interest expense and other: | | | | | | | | | | | | |
Equity earnings from consolidated subsidiaries | | | (292) | | | | (235) | | | | (279) | |
Loss on early extinguishment of debt | | | -- | | | | 203 | | | | -- | |
Interest expense | | | 11 | | | | 12 | | | | 1 | |
Interest income | | | (1) | | | | (1) | | | | (12) | |
| | | | | | | | | | | | |
Total interest expense and other | | | (282) | | | | (21) | | | | (290) | |
| | | | | | | | | | | | |
Income before income taxes | | | 281 | | | | 16 | | | | 290 | |
Income tax expense (benefit) | | | (6) | | | | (95) | | | | 2 | |
| | | | | | | | | | | | |
Net income | | | $287 | | | | $111 | | | | $288 | |
| | | | | | | | | | | | |
The accompanying Notes to Condensed Financial Statements are an integral part of these statements.
191
ALLIANT ENERGY CORPORATION
(Parent Company Only)
CONDENSED BALANCE SHEETS
| | | | | | | | |
| | | December 31, | |
| | | 2010 | | | 2009 | |
| | | (in millions) | |
ASSETS | | | | | | | | |
Current assets: | | | | | | | | |
Cash and cash equivalents | | | $123 | | | | $75 | |
Notes receivable from affiliated companies | | | 56 | | | | 106 | |
Income tax refunds receivable | | | 16 | | | | 28 | |
Other | | | -- | | | | 2 | |
| | | | | | | | |
| | | 195 | | | | 211 | |
Investments: | | | | | | | | |
Investments in consolidated subsidiaries | | | 2,966 | | | | 2,841 | |
Other | | | 19 | | | | 17 | |
| | | | | | | | |
| | | 2,985 | | | | 2,858 | |
Other assets | | | 7 | | | | 4 | |
| | | | | | | | |
Total assets | | | $3,187 | | | | $3,073 | |
| | | | | | | | |
| |
| | | December 31, | |
| | | 2010 | | | 2009 | |
| | | (in millions) | |
CAPITALIZATION AND LIABILITIES | | | | | | | | |
Capitalization: | | | | | | | | |
Common stock and additional paid-in capital | | | $1,508 | | | | $1,500 | |
Retained earnings | | | 1,391 | | | | 1,279 | |
Accumulated other comprehensive loss | | | (1) | | | | (1) | |
Shares in deferred compensation trust | | | (8) | | | | (8) | |
| | | | | | | | |
Total common equity | | | 2,890 | | | | 2,770 | |
Long-term debt, net (excluding current portion) | | | 249 | | | | 249 | |
| | | | | | | | |
| | | 3,139 | | | | 3,019 | |
Current liabilities | | | 6 | | | | 5 | |
Other long-term liabilities and deferred credits: | | | | | | | | |
Deferred income taxes | | | 35 | | | | 46 | |
Other | | | 7 | | | | 3 | |
| | | | | | | | |
| | | 42 | | | | 49 | |
| | | | | | | | |
Total capitalization and liabilities | | | $3,187 | | | | $3,073 | |
| | | | | | | | |
The accompanying Notes to Condensed Financial Statements are an integral part of these statements.
192
ALLIANT ENERGY CORPORATION
(Parent Company Only)
CONDENSED STATEMENTS OF CASH FLOWS
| | | | | | |
| | | Year Ended December 31, |
| | | 2010 | | 2009 | | 2008 |
| | | (in millions) |
Net cash flows from operating activities | | $110 | | $70 | | $100 |
| | | | | | |
| | | |
Cash flows from (used for) investing activities: | | | | | | |
Capital contributions to consolidated subsidiaries | | (125) | | (250) | | (300) |
Capital repayments from consolidated subsidiaries | | 183 | | 206 | | 75 |
Dividends from consolidated subsidiaries in excess of equity earnings | | -- | | 5 | | -- |
| | | | | | |
Net cash flows from (used for) investing activities | | 58 | | (39) | | (225) |
| | | | | | |
| | | |
Cash flows used for financing activities: | | | | | | |
Common stock dividends | | (175) | | (166) | | (154) |
Proceeds from issuance of long-term debt | | -- | | 250 | | -- |
Payments to retire long-term debt | | -- | | (241) | | -- |
Net change in notes receivable from affiliates | | 50 | | (36) | | (70) |
Repurchase of common stock | | (1) | | (1) | | (2) |
Proceeds from issuance of common stock | | 6 | | 1 | | 1 |
Other | | -- | | (5) | | 3 |
| | | | | | |
Net cash flows used for financing activities | | (120) | | (198) | | (222) |
| | | | | | |
Net increase (decrease) in cash and cash equivalents | | 48 | | (167) | | (347) |
Cash and cash equivalents at beginning of period | | 75 | | 242 | | 589 |
| | | | | | |
Cash and cash equivalents at end of period | | $123 | | $75 | | $242 |
| | | | | | |
| | | |
Supplemental cash flows information: | | | | | | |
Cash paid (refunded) during the period for: | | | | | | |
Interest, net of capitalized interest | | $11 | | $11 | | $12 |
Income taxes, net of refunds | | (11) | | 8 | | 25 |
Noncash investing and financing activities: | | | | | | |
Subsidiary debt assumed by Alliant Energy | | -- | | -- | | 39 |
The accompanying Notes to Condensed Financial Statements are an integral part of these statements.
ALLIANT ENERGY CORPORATION
(Parent Company Only)
NOTES TO CONDENSED FINANCIAL STATEMENTS
Pursuant to rules and regulations of the Securities and Exchange Commission, the Condensed Financial Statements of Alliant Energy Corporation (Parent Company Only) do not reflect all of the information and notes normally included with financials statements prepared in accordance with accounting principles generally accepted in the United States of America. Therefore, these Condensed Financial Statements should be read in conjunction with the Consolidated Financial Statements and related Combined Notes to Consolidated Financial Statements included in Alliant Energy’s 2010 Form 10-K, Part II, Item 8, which is incorporated herein by reference.
In the Condensed Financial Statements of Alliant Energy Corporation (Parent Company Only), investments in subsidiaries are accounted for using the equity method.
193
SCHEDULE II - VALUATION AND QUALIFYING ACCOUNTS AND RESERVES
| | | | | | | | | | | | | | | | | | | | |
| | | | | | | Additions | | | | | | | | | | |
| Description | | Balance, Jan. 1 | | | | Charged to
Expense | | | | Charged to Other
Accounts (a) | | | | Deductions (b) | | | | Balance, Dec. 31 | | |
| | | | | | | | | | | (in millions) | | | | | | | | | | |
| |
| Valuation and Qualifying Accounts Which are Deducted in the Balance Sheet From the Assets to Which They Apply: | | |
Accumulated Provision for Uncollectible Accounts: | | | | | | | | | | |
Alliant Energy Corporation | | | | | | | | | | | | | | | | | | | | |
Year ended Dec. 31, 2010 (c) | | $5.5 | | | | $7.7 | | | | $1.8 | | | | $10.6 | | | | $4.4 | | |
Year ended Dec. 31, 2009 | | 6.6 | | | | 8.9 | | | | 2.4 | | | | 12.4 | | | | 5.5 | | |
Year ended Dec. 31, 2008 | | 3.8 | | | | 10.0 | | | | 1.2 | | | | 8.4 | | | | 6.6 | | |
Interstate Power and Light Company | | | | | | | | | | | | | | | | | | | | |
Year ended Dec. 31, 2010 (c) | | $2.5 | | | | $5.6 | | | | $-- | | | | $7.7 | | | | $0.4 | | |
Year ended Dec. 31, 2009 | | 4.2 | | | | 8.2 | | | | -- | | | | 9.9 | | | | 2.5 | | |
Year ended Dec. 31, 2008 | | 1.9 | | | | 9.7 | | | | -- | | | | 7.4 | | | | 4.2 | | |
Wisconsin Power and Light Company | | | | | | | | | | | | | | | | | | | | |
Year ended Dec. 31, 2010 | | $2.0 | | | | $0.1 | | | | $1.8 | | | | $2.2 | | | | $1.7 | | |
Year ended Dec. 31, 2009 | | 1.8 | | | | 0.1 | | | | 2.4 | | | | 2.3 | | | | 2.0 | | |
Year ended Dec. 31, 2008 | | 1.4 | | | | 0.1 | | | | 1.2 | | | | 0.9 | | | | 1.8 | | |
Note: The above provisions relate to various customer, notes and other receivable balances included in various line items on the respective Consolidated Balance Sheets.
| | | | | | | | | | | | | | | | | | | | |
| Other Reserves: | | |
Accumulated Provision for Other Reserves (d): | | |
Alliant Energy Corporation | | | | | | | | | | | | | | | | |
Year ended Dec. 31, 2010 | | $22.9 | | | | $14.5 | | | | $-- | | | | $11.7 | | | | $25.7 | | |
Year ended Dec. 31, 2009 | | 17.9 | | | | 12.6 | | | | -- | | | | 7.6 | | | | 22.9 | | |
Year ended Dec. 31, 2008 | | 16.4 | | | | 9.1 | | | | -- | | | | 7.6 | | | | 17.9 | | |
Interstate Power and Light Company | | | | | | | | | | | | | | | | | | | | |
Year ended Dec. 31, 2010 | | $9.0 | | | | $2.0 | | | | $-- | | | | $2.2 | | | | $8.8 | | |
Year ended Dec. 31, 2009 | | 7.1 | | | | 3.6 | | | | -- | | | | 1.7 | | | | 9.0 | | |
Year ended Dec. 31, 2008 | | 7.1 | | | | 3.5 | | | | -- | | | | 3.5 | | | | 7.1 | | |
Wisconsin Power and Light Company | | | | | | | | | | | | | | | | | | | | |
Year ended Dec. 31, 2010 | | $10.7 | | | | $7.5 | | | | $-- | | | | $5.4 | | | | $12.8 | | |
Year ended Dec. 31, 2009 | | 7.1 | | | | 6.5 | | | | -- | | | | 2.9 | | | | 10.7 | | |
Year ended Dec. 31, 2008 | | 6.9 | | | | 2.8 | | | | -- | | | | 2.6 | | | | 7.1 | | |
| (a) | Accumulated provision for uncollectible accounts: In accordance with its regulatory treatment, certain amounts provided by Wisconsin Power and Light Company are recorded in regulatory assets. |
| (b) | Deductions are of the nature for which the reserves were created. In the case of the accumulated provision for uncollectible accounts, deductions from this reserve are reduced by recoveries of amounts previously written off. |
| (c) | Refer to Note 4(a) of the “Combined Notes to Consolidated Financial Statements” for discussion of IPL’s sales of accounts receivable program. |
| (d) | Other reserves are largely related to injury and damage claims arising in the ordinary course of business. |
194
SIGNATURES
Pursuant to the requirements of Section 13 or 15(d) of the Securities Exchange Act of 1934, the Registrant has duly caused this report to be signed on its behalf by the undersigned, thereunto duly authorized on the 28th day of February 2011.
ALLIANT ENERGY CORPORATION
| | | | | | |
| | | | By:/s/ William D. Harvey | | |
| | | | William D. Harvey | | |
| | | | Chairman and Chief Executive Officer |
Pursuant to the requirements of the Securities Exchange Act of 1934, this report has been signed below by the following persons on behalf of the registrant and in the capacities indicated on the 28th day of February 2011.
| | | | | | | | | | | | |
/s/ William D. Harvey | | Chairman, Chief Executive Officer and Director (Principal Executive Officer) |
| William D. Harvey | | | | |
| |
/s/ Thomas L. Hanson | | Vice President-Chief Financial Officer and Treasurer (Principal Financial Officer) |
| Thomas L. Hanson | | | | |
| | |
/s/ Robert J. Durian | | Controller and Chief Accounting Officer (Principal Accounting Officer) | | |
| Robert J. Durian | | | | |
| | | | | | |
/s/ Michael L. Bennett | | Director | | /s/ Ann K. Newhall | | Director | | /s/ Judith D. Pyle | | Director | | |
| Michael L. Bennett | | | | Ann K. Newhall | | | | Judith D. Pyle | | | | |
| | | | | | |
/s/ Darryl B. Hazel | | Director | | /s/ Dean C. Oestreich | | Director | | /s/ Carol P. Sanders | | Director | | |
| Darryl B. Hazel | | | | Dean C. Oestreich | | | | Carol P. Sanders | | | | |
| | | | | | |
/s/ Singleton B. McAllister | | Director | | /s/ David A. Perdue | | Director | | | | | | |
| Singleton B. McAllister | | | | David A. Perdue | | | | | | | | |
SIGNATURES
Pursuant to the requirements of Section 13 or 15(d) of the Securities Exchange Act of 1934, the Registrant has duly caused this report to be signed on its behalf by the undersigned, thereunto duly authorized on the 28th day of February 2011.
INTERSTATE POWER AND LIGHT COMPANY
| | | | | | |
| | | | By:/s/ William D. Harvey | | |
| | | | William D. Harvey | | |
| | | | Chairman and Chief Executive Officer |
Pursuant to the requirements of the Securities Exchange Act of 1934, this report has been signed below by the following persons on behalf of the registrant and in the capacities indicated on the 28th day of February 2011.
| | | | | | | | | | | | |
/s/ William D. Harvey | | Chairman, Chief Executive Officer and Director (Principal Executive Officer) | | |
| William D. Harvey | | | | |
| |
/s/ Thomas L. Hanson | | Vice President-Chief Financial Officer and Treasurer (Principal Financial Officer) |
| Thomas L. Hanson | | | | |
| |
/s/ Robert J. Durian | | Controller and Chief Accounting Officer (Principal Accounting Officer) |
| Robert J. Durian | | | | |
| | | | | | |
/s/ Michael L. Bennett | | Director | | /s/ Ann K. Newhall | | Director | | /s/ Judith D. Pyle | | Director | | |
| Michael L. Bennett | | | | Ann K. Newhall | | | | Judith D. Pyle | | | | |
| | | | | | |
/s/ Darryl B. Hazel | | Director | | /s/ Dean C. Oestreich | | Director | | /s/ Carol P. Sanders | | Director | | |
| Darryl B. Hazel | | | | Dean C. Oestreich | | | | Carol P. Sanders | | | | |
| | | | | | |
/s/ Singleton B. McAllister | | Director | | /s/ David A. Perdue | | Director | | | | | | |
| Singleton B. McAllister | | | | David A. Perdue | | | | | | | | |
195
SIGNATURES
Pursuant to the requirements of Section 13 or 15(d) of the Securities Exchange Act of 1934, the Registrant has duly caused this report to be signed on its behalf by the undersigned, thereunto duly authorized on the 28th day of February 2011.
WISCONSIN POWER AND LIGHT COMPANY
| | | | | | |
| | | | By:/s/ William D. Harvey | | |
| | | | William D. Harvey | | |
| | | | Chairman and Chief Executive Officer |
Pursuant to the requirements of the Securities Exchange Act of 1934, this report has been signed below by the following persons on behalf of the registrant and in the capacities indicated on the 28th day of February 2011.
| | | | | | | | | | | | |
/s/ William D. Harvey | | Chairman, Chief Executive Officer and Director (Principal Executive Officer) | | |
| William D. Harvey | | | | |
| | |
/s/ Thomas L. Hanson | | Vice President-Chief Financial Officer and Treasurer (Principal Financial Officer) | | |
| Thomas L. Hanson | | | | |
| | |
/s/ Robert J. Durian | | Controller and Chief Accounting Officer (Principal Accounting Officer) | | |
| Robert J. Durian | | | | |
| | | | | | |
/s/ Michael L. Bennett | | Director | | /s/ Ann K. Newhall | | Director | | /s/ Judith D. Pyle | | Director | | |
| Michael L. Bennett | | | | Ann K. Newhall | | | | Judith D. Pyle | | | | |
| | | | | | |
/s/ Darryl B. Hazel | | Director | | /s/ Dean C. Oestreich | | Director | | /s/ Carol P. Sanders | | Director | | |
| Darryl B. Hazel | | | | Dean C. Oestreich | | | | Carol P. Sanders | | | | |
| | | | | | |
/s/ Singleton B. McAllister | | Director | | /s/ David A. Perdue | | Director | | | | | | |
| Singleton B. McAllister | | | | David A. Perdue | | | | | | | | |
196
ALLIANT ENERGY CORPORATION
INTERSTATE POWER AND LIGHT COMPANY
WISCONSIN POWER AND LIGHT COMPANY
Exhibit Index to Annual Report on Form 10-K
For the fiscal year ended Dec. 31, 2010
| | | | |
Exhibit
Number | | Description | | |
| 10.5a | | Form of Performance Share Agreement pursuant to the Alliant Energy OIP | | |
| 10.5b | | Form of Performance Contingent Restricted Stock Agreement pursuant to the Alliant Energy OIP | | |
| 10.6 | | Alliant Energy Director Long Term Incentive Plan (DLIP), for director-level employees | | |
| 10.6a | | Form of Restricted Cash Agreement pursuant to the Alliant Energy DLIP | | |
| 10.6b | | Form of Performance Restricted Award Agreement pursuant to the Alliant Energy DLIP | | |
| 10.18 | | Summary of Compensation and Benefits for Non-Employee Directors of Alliant Energy, IPL and WPL, effective Jan. 1, 2011 | | |
| 12.1 | | Ratio of Earnings to Fixed Charges for Alliant Energy | | |
| 12.2 | | Ratio of Earnings to Fixed Charges and Ratio of Earnings to Combined Fixed Charges and Preferred Dividend Requirements for IPL | | |
| 12.3 | | Ratio of Earnings to Fixed Charges and Ratio of Earnings to Combined Fixed Charges and Preferred Dividend Requirements for WPL | | |
| 21.1 | | Subsidiaries of Alliant Energy | | |
| 21.2 | | Subsidiaries of WPL | | |
| 23.1 | | Consent of Independent Registered Public Accounting Firm for Alliant Energy | | |
| 23.2 | | Consent of Independent Registered Public Accounting Firm for IPL | | |
| 23.3 | | Consent of Independent Registered Public Accounting Firm for WPL | | |
| 23.4 | | Consent of Independent Registered Public Accounting Firm for American Transmission Company LLC | | |
| 31.1 | | Certification of the Chairman and CEO for Alliant Energy | | |
| 31.2 | | Certification of the Vice President-CFO and Treasurer for Alliant Energy | | |
| 31.3 | | Certification of the Chairman and CEO for IPL | | |
| 31.4 | | Certification of the Vice President-CFO and Treasurer for IPL | | |
| 31.5 | | Certification of the Chairman and CEO for WPL | | |
| 31.6 | | Certification of the Vice President-CFO and Treasurer for WPL | | |
| 32.1 | | Written Statement of the CEO and CFO Pursuant to 18 U.S.C.§1350 for Alliant Energy | | |
| 32.2 | | Written Statement of the CEO and CFO Pursuant to 18 U.S.C.§1350 for IPL | | |
| 32.3 | | Written Statement of the CEO and CFO Pursuant to 18 U.S.C.§1350 for WPL | | |
| 99.1 | | Financial Statements of American Transmission Company LLC | | |
| 101.INS | | Alliant Energy’s XBRL Instance Document | | |
| 101.SCH | | Alliant Energy’s XBRL Taxonomy Extension Schema Document | | |
| 101.CAL | | Alliant Energy’s XBRL Taxonomy Extension Calculation Linkbase Document | | |
| 101.LAB | | Alliant Energy’s XBRL Taxonomy Extension Label Linkbase Document | | |
| 101.PRE | | Alliant Energy’s XBRL Taxonomy Extension Presentation Linkbase Document | | |
| 101.DEF | | Alliant Energy’s XBRL Taxonomy Extension Definition Linkbase Document | | |
197