UNITED STATES
SECURITIES AND EXCHANGE COMMISSION
Washington, D.C. 20549
FORM N-CSR
CERTIFIED SHAREHOLDER REPORT OF REGISTERED
MANAGEMENT INVESTMENT COMPANIES
| | |
| INVESTMENT COMPANY ACT FILE NUMBER: | | 811-09237 |
| |
| EXACT NAME OF REGISTRANT AS SPECIFIED IN CHARTER: | | Calamos Advisors Trust |
| |
| ADDRESS OF PRINCIPAL EXECUTIVE OFFICES: | | 2020 Calamos Court, Naperville |
| | Illinois 60563-2787 |
| |
| NAME AND ADDRESS OF AGENT FOR SERVICE: | | John P Calamos, Sr., Chairman, CEO and Co-CIO |
| | Calamos Advisors LLC, |
| | 2020 Calamos Court, |
| | Naperville, Illinois |
| | 60563-2787 |
| |
| REGISTRANT’S TELEPHONE NUMBER, INCLUDING AREA CODE: | | (630) 245-7200 |
| |
| DATE OF FISCAL YEAR END: | | December 31, 2014 |
| |
| DATE OF REPORTING PERIOD: | | January 1, 2014 through December 31, 2014 |
ITEM 1. REPORT TO SHAREHOLDERS.

Experience and Foresight
About Calamos Investments
For over 35 years, we have helped investors like you manage and build wealth to meet long-term objectives. Because investors have different time horizons, risk tolerances and goals, we offer investment portfolios to suit a variety of asset allocation needs. For example, our mutual funds include equity, fixed income and alternative funds. We offer U.S. funds, as well as global and international choices.
We are dedicated to helping our clients build and protect wealth. We understand when you entrust us with your assets, you also entrust us with your achievements, goals and aspirations. We believe we best honor this trust by making investment decisions guided by integrity, by discipline and by our conscientious research.
We believe that an active, risk-conscious approach is essential for wealth creation. In the 1970s, we pioneered the use of convertible securities as a means to manage risk in volatile markets. We followed with strategies that combine convertibles and stocks, with the aim of participating in equity market upside with potentially less volatility than an all-stock portfolio. In the 1990s, we introduced our first stock fund, which invests in growth companies both large and small. Across our funds, our investment process seeks to manage risk at multiple levels and draws upon our experience investing through many market cycles. In a rapidly changing environment, we believe that this active management is essential.
We are global in our perspective. We believe globalization offers tremendous opportunities for countries and companies all over the world. In our U.S., global and international portfolios, we are seeking to capitalize on the potential growth of the global economy.
We believe there are opportunities in all markets. Our history traces back to the 1970s, a period of significant volatility and economic concerns. We have invested through multiple market cycles, each with its own challenges. Out of this experience comes our belief that the flipside of volatility is opportunity.
Letter to Contract Owners

JOHN P. CALAMOS, SR.
CEO and Global Co-CIO
Dear Contract Holder:
Welcome to your annual report for the 12-month period ended December 31, 2014. In this report, you will find commentary from the Calamos Investment Management Team, as well as a listing of portfolio holdings, financial statements and highlights, and detailed information about the performance and positioning of the Calamos Growth and Income Portfolio.
This portfolio takes a risk-managed approach to capturing stock market upside over full market cycles. To accomplish this, our investment management team seeks out stocks and convertible securities that meet our rigorous fundamental criteria and also reflect long-term thematic opportunities. Our approach differs from many “balanced” offerings that attempt to mitigate stock market risk by pairing stocks solely with traditional fixed-income securities.
Because they combine attributes of stocks and fixed-income securities, convertible securities provide investors with a unique tool for participating in stock market upside with potentially less downside volatility. But like any tool, how convertibles are used determines the result. We attempt to capitalize on the opportunity within the convertible market through an active approach that is guided by more than 30 years of experience. Additionally, convertibles have been historically less sensitive to rising interest rates compared to many types of traditional bonds. While interest rates are likely to stay low through much of 2015, we believe investors should always invest ahead of the curve—especially as history has shown that rates can rise suddenly and steeply.
Market Review
During 2014, the U.S. stock market advanced, with the S&P 500 Index returning 13.7%. The convertible securities market participated in a substantial measure of this upside, as measured by the BofA Merrill Lynch All U.S. Convertibles Index, which returned 9.4%. Still, the adage, “every bull market climbs a wall of worry” held true as stocks surmounted a range of concerns, including Federal Reserve Chair Janet Yellen’s comments that interest rates might rise sooner than anticipated and fears that Europe would slip back into recession. As the year progressed, renewed concerns about the Fed’s timeline for raising rates created more headwinds, as did Russia’s bellicose stance toward Ukraine. During the fourth quarter, markets were unsettled by the potential for
Letter to Contract Owners
an Ebola pandemic and anxiety about declining oil prices as OPEC kept production high in the face of mounting global growth concerns.
Outlook
Because of its focus on risk-managed stock market participation, we believe Calamos Growth and Income Portfolio is particularly well suited to the investment environment we expect in 2015. In our view, stocks and convertibles may continue to advance in 2015, supported by accommodative monetary policy, steady economic expansion and attractive stock prices. Growth-oriented securities are especially attractive to us, as we believe we remain in the middle innings of the U.S. economic recovery. Still, investors should be prepared for volatility as markets work through the impact of slowing global growth, price declines in oil and other commodities, and geopolitical uncertainties.
There has been much debate about the benefits and detriments of the recent fall in oil prices. Falling prices may well be a sign of slowing global demand and may create pockets of weakness in select industries and regions of the U.S. However, we believe the negative economic impacts of declining oil prices may be contained, at least in the United States, and we expect steady GDP growth in 2015, likely in the range of 2.5% to 3.0%.
In the past, energy crises typically have not been catalysts for U.S. recessions, and the diversification in the U.S. economy has provided a degree of resilience. The recent strength in job growth, auto sales, and housing further suggests that a U.S. recession is not imminent. We believe that the Federal Reserve has expressed its willingness to take a “patient” approach in the face of falling energy prices and weakening global economic conditions. If the energy crisis were to infect other sectors of the economy, the Fed has considerable latitude to forestall rate increases, given the lack of inflationary pressures.
Moreover, we believe increased energy independence in the Americas should have a positive long-term economic impact for the U.S., due to reduced foreign policy spending, a benefit the markets do not appear to perceive—yet. We anticipate that there would also be benefits if Russia retreated from the provocative stance that characterized its foreign policy in 2014.
Our team continues to identify many opportunities within the stock and convertible markets. As we will discuss at greater length in the pages that follow, we continue to favor secular and cyclical growth opportunities. In regard to convertible securities, economic expansion in the U.S., rising equity markets, and volatility (which can increase investor demand for the asset class) can support issuance in 2015.
| | | | |
| 2 | | CALAMOS GROWTH AND INCOME PORTFOLIO ANNUAL REPORT | | |
Letter to Contract Owners
On behalf of all of us at Calamos Investments, I thank you for your continued trust. I invite you to visit us at www.calamos.com for our most recent outlook, portfolio insights and commentary from our investment team.
Sincerely,

John P. Calamos, Sr.
CEO and Global Co-CIO,
Calamos Advisors LLC
Before investing, carefully consider a fund’s investment objectives, risks, charges and expenses. Please see the prospectus containing this and other information or call 800.582.6959. Please read the prospectus carefully. Performance data represents past performance, which is no guarantee of future results. Current performance may be lower or higher than the performance quoted.
The S&P 500 Index is an unmanaged index generally considered representative of the U.S. stock market. The BofA Merrill Lynch All U.S. Convertibles Index represents the U.S. convertible securities market. Source: Lipper, Inc.
Unmanaged index returns assume reinvestment of any and all distributions and, unlike fund returns, do not reflect fees, expenses or sales charges. Investors cannot invest directly in an index. The information contained herein is based on internal research derived from various sources and does not purport to be statements of all material facts relating to the securities mentioned. The information contained herein, while not guaranteed as to the accuracy or completeness, has been obtained from sources we believe to be reliable. There are certain risks involved with investing in convertible securities in addition to market risk, such as call risk, dividend risk, liquidity risk and default risk, that should be carefully considered prior to investing. This information is being provided for informational purposes only and should not be considered investment advice or an offer to buy or sell any security in the portfolio.
This report is intended for informational purposes only and should not be considered investment advice.
Investment Team Discussion
| | | | |
| SECTOR WEIGHTINGS | |
Information Technology | | | 22.0 | % |
Financials | | | 17.4 | |
Consumer Discretionary | | | 14.9 | |
Health Care | | | 13.1 | |
Industrials | | | 11.3 | |
Consumer Staples | | | 7.6 | |
Energy | | | 6.7 | |
Utilities | | | 2.0 | |
Materials | | | 1.2 | |
| | | | | |
Sector weightings are subject to change daily and are calculated as a percentage of net assets. The table excludes cash or cash equivalents, any government/sovereign bonds or broad based index hedging securities the Portfolio may hold.
CALAMOS GROWTH AND INCOME PORTFOLIO
INVESTMENT TEAM DISCUSSION
What is the Portfolio’s investment strategy?
Calamos Growth and Income Portfolio invests primarily in a combination of U.S. stocks and convertible securities to offer a total return-oriented investment that seeks to keep a consistent balance of risk and reward through full market cycles. As we focus on managing volatility, our goal is for the Portfolio to participate in a greater portion of equity market upside than downside over the long term.
Please discuss the Portfolio’s lower-volatility* characteristics.
We believe the Portfolio’s historical lower-volatility characteristics are a result of our focused efforts to participate in equity market upside with less volatility than the market as a whole. Indeed, since its inception, the Portfolio has experienced 28% less volatility than the S&P 500 Index, as measured by beta.
Beta, a common statistic for volatility, measures an investment’s historic volatility versus a market index, which is assigned a beta of 1.0. An investment with half the volatility of that index would have a beta of 0.5, while an investment with a beta of 2.0 would have been twice as volatile as the market.
Since its inception, the Portfolio has therefore outperformed the broader equity market, as measured by the S&P 500 Index, with less volatility than the equity markets. Please note that past performance does not indicate future results and that beta is one of many measures of risk.
While our strategy is compared to an all-equity benchmark, we typically invest a portion of the Portfolio in securities that exhibit less volatility, such as convertible bonds. This approach tends to capture less downside, which is a critical part of our risk-management process, but it can also cause the Portfolio return to lag the benchmark return during periods of strong market performance. Through this focus on risk management, we have been able to provide investors a less-volatile equity investment, as measured by beta, which has outperformed the passive benchmark going back to inception.
What factors influenced performance over the period?
The Growth and Income Portfolio uses common stocks and convertible securities to offer investors a defensive, more-conservative and lower-volatility equity option. Our goal is to outperform the all-equity S&P 500 Index over a full market cycle, with less risk. During the most recent 12-month period, the Portfolio delivered solid absolute gains, though it trailed the equity-only index. Overall, the market broadly trended higher over the 12-month period, but not without a few dramatic bouts of volatility. Relative to the S&P 500 Index, the Portfolio generally kept pace throughout much of the year and held its value well during the downturn from mid-September to mid-October. However, as the equity market swiftly recovered and ran to an all-time high, the Portfolio did not fully participate on the upside. Longer term, this approach has
| * | The Portfolio’s historical performance has exhibited lower volatility, as measured by beta and standard deviation, over the life of the Portfolio. The Portfolio’s investment objective does not seek to reduce volatility, and as a result, the Portfolio may experience volatility in some market conditions. (Source for beta and standard deviation is Morningstar, Inc.) |
| | | | |
| 4 | | CALAMOS GROWTH AND INCOME PORTFOLIO ANNUAL REPORT | | |
Investment Team Discussion
proven its value in more difficult market environments, but the past few years have been largely “risk-on”, where risk-management benefits have not been as evident.
Beginning in early spring, the market saw a strong rotation out of higher-growth companies and into more-defensive companies with lower valuations. The technology and health care sectors were especially hurt by the sell-off. While economic indicators continued to signal growth for the U.S. economy, the Portfolio remained in a pro-economic growth mode. After the market topped in mid-September, the equity market experienced a swift downturn yet again, with slower-growing and more-defensive sectors serving as safe havens. While the Portfolio fared better than the equity market, the Portfolio’s preference for cyclical growth sectors was not rewarded during this time, as we were underweight areas such as utilities and consumer staples. After recovering from this dip, the market lost its appetite for risk in the final days of the year, as it digested a swift drop in oil prices and renewed concerns over slower global growth.
In this Portfolio, we utilize equity-sensitive securities, such as convertible bonds, which potentially participate in equity market upside, yet limit losses on the downside. We tend to use balanced convertible bonds that fall between the most credit sensitive and equity sensitive. In 2014, however, convertible bonds that had the most equity sensitivity performed best within the convertible universe. It’s important to keep in mind that the most equity-sensitive convertibles also typically carry a higher degree of risk to equity market downside. Therefore, we don’t believe it is prudent to add exposure to these securities along with our common stock holdings. Our preference for more traditional hybrid convertibles, those that offer a combination of equity sensitivity and bond characteristics, slowed performance during the year as equity-sensitive convertibles dominated the market.
From an economic-sector perspective versus the S&P 500 Index, an underweight allocation and selection within the energy sector contributed to performance in the period. In particular, an underweight position to the integrated oil-and-gas industry added value, as companies within this industry underperformed because of the price drop in these commodities. We typically attempt to avoid businesses that are directly linked and susceptible to the price of commodities. In addition, the Portfolio held an underweight allocation to the telecommunication services sector, which helped returns. We have typically been underweight (or even 0%) to this sector primarily due to the lack of growth opportunities and a highly regulated environment.
In general, the Portfolio’s higher-growth holdings did not fare as well as the more value-oriented, slower-growth and lower price-to-earnings holdings within the market during the period. Investors were not willing to pay up for growth and instead were attracted to the perceived safety of more-defensive and higher-yielding areas like utilities and staples. However, we believe as the U.S. economy continues to grow, quality growth equities will be the beneficiaries. A fundamentally driven market environment should favor our higher-growth and more-active approach. In regards to sector-level influences, portfolio selection within financials (more specifically, the asset management and custody banks industries) and technology (Internet software and services industry) detracted from results. In addition, the Portfolio’s positioning and selection within the consumer discretionary sector proved disadvantageous. Weaker fundamentals and fully priced valuations led us to reduce our weight in select holdings.
Investment Team Discussion
GROWTH OF $ 10,000 FOR 10 YEAR PERIOD ENDED 12/31/14
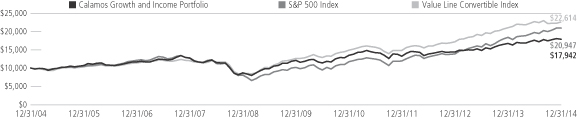
AVERAGE ANNUAL TOTAL RETURN† FOR THE PERIOD ENDED 12/31/14
| | | | | | | | | | | | | | | | | | |
| 1 YEAR | | 3 YEARS | | 5 YEARS | | 10 YEARS |
| | | 6.84% | | | | | 10.48% | | | | | 8.11% | | | | | 6.02% | |
Performance data quoted represents past performance, which is no guarantee of future results. Current performance may be lower or higher than the performance quoted. The principal value and investment return of an investment will fluctuate so that your shares, when redeemed, may be worth more or less than their original cost. Returns are net of all fees and expenses incurred by the Portfolio.
| † | Average annual total return measures net investment income and capital gain or loss from portfolio investments as an annualized average, assuming reinvestment of income and capital gain distributions. Returns do not reflect sales charges, expenses and fees assessed in connection with the variable product. Sales charges, expenses and fees, which are determined by the variable product issuers, will vary and will lower the total return to the contract or policy owner. |
The S&P 500 Index is an unmanaged index generally considered representative of the U.S. stock market. Source: Lipper, Inc.
The Value Line Convertible Index is an equally weighted index of the larger convertibles, representing 90% of the U.S. convertible securities market. Source: Mellon Analytical Solutions, Inc.
Index returns assume reinvestment of dividends and do not reflect deduction of fees and expenses. It is not possible to invest directly in an index.
| | | | |
| 6 | | CALAMOS GROWTH AND INCOME PORTFOLIO ANNUAL REPORT | | |
Investment Team Discussion
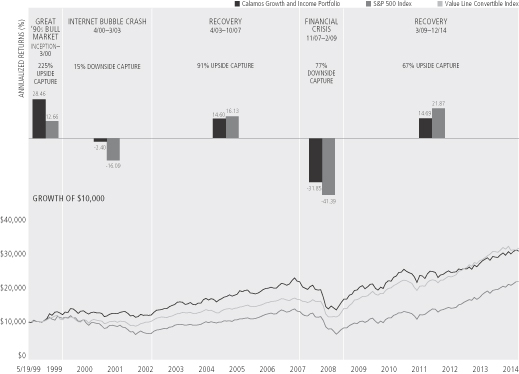
MANAGING RISK OVER MARKET CYCLES
The Growth and Income Portfolio historically has captured a significant amount of upside during bull markets and limited losses when markets have plunged.
Performance data quoted represents past performance, which is no guarantee of future results. Current performance may be lower or higher than the performance quoted. The principal value and return of an investment will fluctuate so that your shares, when redeemed, may be worth more or less than their original cost. Returns are net of all fees and expenses incurred by the Portfolio.
Upside capture ratio measures a manager’s performance in up markets relative to the named index itself. It is calculated by taking the security’s upside capture return and dividing it by the benchmark’s upside capture return. Downside capture ratio measures manager’s performance in down markets as defined by the named index. A down-market is defined as those periods (months or quarters) in which named index return is less than 0. In essence, it tells you what percentage of the down market was captured by the manager. For example, if the ratio is 110%, the manager has captured 110% of the down-market and therefore underperformed the market on the downside. Source: State Street Corporation and Lipper, Inc.
Please describe the Portfolio’s participation in up and down markets since its inception.
There are a variety of ways to express up- and down-market capture, whether it’s calculated daily, monthly, quarterly, or as we look at the markets—in longer-term up- and down-market trends. In the chart above, you can see how the Portfolio performed through a few distinct market periods. In the five major market periods shown, the Portfolio has participated in the upside movements of the equity market while limiting the downside exposure during times of tumult.
How is the Portfolio positioned?
The Portfolio is positioned with an emphasis on both cyclical and secular growth opportunities. Our focus is on higher-growth businesses in sectors such as information technology, health care, consumer discretionary and financials. We expect well-positioned companies to benefit from a variety of macro
Investment Team Discussion
themes, including mobility and innovation, open access to information and entertainment, and productivity enhancements. We strive to invest in firms with an attractive growth profile, increasing return on invested capital, a solid balance sheet, a compelling business model, and alignment with our key themes. We believe the market will likely continue to trend upwards and our growth-oriented positioning is appropriate. The Portfolio’s allocation to equities moved modestly higher in the period, reflecting our overall optimistic market outlook.
The Portfolio’s largest allocations in absolute terms include the information technology, financials, consumer discretionary and health care sectors. Relative to the S&P 500 Index, the Portfolio’s largest overweight allocation is to the information technology sector, and its largest underweight allocations are to consumer staples and telecom services.
Changes to portfolio sector positioning during the period were modest and included an increase to the financials sector. In particular, we added new names to the asset management and custody banks industry as well as the diversified banks group. These areas are likely to benefit from the prospect of higher interest rates. In addition, we reduced our weight to the energy sector as the price of oil has steadily dropped. This was done primarily by paring our exposure to the more cyclical oil-and-gas exploration and production as well as equipment and services industries where the magnitude of a slowdown is unknown.
Do you have any closing thoughts?
We believe we will see continued upside for stocks in 2015, though some factors may cause share prices to encounter volatility. These include the steep drop in oil and gas prices, the disagreement between the European Central Bank and Germany on reforms and growth initiatives, and the timing of interest rate increases in the U.S. The U.S. remains the bright spot on the global landscape with low inflation, solid corporate earnings growth and reasonable valuations. In terms of positives, lower gasoline prices and sustained gains in the labor market have given U.S. consumers the confidence to spend. We continue to believe this sets the stage for growth securities, given their low premium and stronger earnings prospects relative to value. We continue to identify what we believe are great franchises at attractive valuations. Our active management approach should do well in this environment, as we look to benefit from short-term volatility.
Valuations for the convertible bond market are attractive. In this environment, we continue to favor convertibles with a balance of equity and fixed-income characteristics, rather than those which are disproportionately equity or credit sensitive. Given the volatile landscape and the varying degrees of equity sensitivity among individual convertibles, we believe active management serves a critical role in achieving optimal upside appreciation and downside protection. We are confident that our convertible bond investments bring equity market exposure to the Portfolio, along with important risk-dampening characteristics.
| | | | |
| 8 | | CALAMOS GROWTH AND INCOME PORTFOLIO ANNUAL REPORT | | |
Expense Overview
EXPENSE OVERVIEW
As a contract or policy owner, you incur certain costs. Because the Portfolio is a funding vehicle for annuities, policies and eligible plans, you may also incur sales charges and other fees related to your annuity, policy or eligible plan. In addition, the Portfolio incurs transaction costs and ongoing costs, including management fees, and other fund expenses, such as audit, legal and custodian fees.
The examples in this report are based on an investment of $1,000 made at the beginning of the period and held for the entire period from July 1, 2014 to December 31, 2014. It is intended to help you understand the ongoing cost associated with investing in the Portfolio and to compare these costs with the ongoing costs of investing in other mutual funds.
There are two parts to the examples table:
Actual
In this part of the table, you’ll see the actual expenses you would have paid on a $1,000 investment made at the beginning of the period and held for the entire period from July 1, 2014 to December 31, 2014, the period covered by this report. This table also shows the actual returns, after expenses, you would have earned during that time. This table can help you estimate your own expenses. For example, if you invested $8,600 in the Portfolio, simply divide $8,600 by $1,000, then multiply that result by the figure in the “Actual Expenses per $1,000” row. In this example, you would multiply 8.6 by the figure.
Hypothetical
In this part of the table, you’ll see the hypothetical expenses you would have paid on a $1,000 investment from July 1, 2014 to December 31, 2014 and the hypothetical returns, after expenses, you would have earned during that time. The Securities and Exchange Commission (SEC) has established the guidelines for this table, including the assumed 5% annual rate of return before expenses, which is what you’ll see in the table. Note that this table will not help you determine your own expenses, but will help you compare expenses of the Portfolio to the expenses of other mutual funds.
Please note that the expenses shown in the table are meant to highlight your ongoing costs only and do not include any transactional costs, such as sales charges (loads), redemption fees or exchange fees. Therefore, the second line of the table is useful in comparing ongoing costs only and will not help you determine the relative total costs of owning different funds. In addition, if these transactions costs were included, your costs would have been higher.
Expense Overview
| | | | |
| The actual and hypothetical examples assume a $1,000 investment at the beginning of the period, July 1, 2014 and held through December 31, 2014. | |
Actual Expenses per $1,000* | | $ | 7.27 | |
Actual – Ending Balance | | $ | 1,017.60 | |
| | | | |
Hypothetical Expenses per $1,000* | | $ | 7.27 | |
Hypothetical – Ending Value | | $ | 1,018.00 | |
| | | | |
Annualized Expense Ratio | | | 1.43% | |
| * | Expenses are equal to the Portfolio’s annualized expense ratio multiplied by the average account value over the period, multiplied by 184/365. |
| | | | |
| 10 | | CALAMOS GROWTH AND INCOME PORTFOLIO ANNUAL REPORT | | |
Schedule of Investments December 31, 2014
| | | | | | | | | | |
PRINCIPAL AMOUNT | | | | | | | VALUE | |
| | CONVERTIBLE BONDS (22.3%) | |
| | | | | | Consumer Discretionary (6.3%) | |
| | 70,000 | | | | | HomeAway, Inc.* 0.125%, 04/01/19 | | $ | 65,995 | |
| | 200,000 | | | | | Iconix Brand Group, Inc. 1.500%, 03/15/18 | | | 237,600 | |
| | 215,000 | | | | | Jarden Corp.* 1.125%, 03/15/34 | | | 242,331 | |
| | 320,000 | | | | | Liberty Interactive, LLC (Time Warner Cable, Inc., Time Warner, Inc.)§ 0.750%, 03/30/43 | | | 460,177 | |
| | 145,000 | | | | | Liberty Media Corp. 1.375%, 10/15/23 | | | 143,010 | |
| | 115,000 | | | | | MGM Resorts International
4.250%, 04/15/15 | | | 135,544 | |
| | | | | | Priceline Group, Inc. | | | | |
| | 220,000 | | | | | 0.900%, 09/15/21* | | | 211,043 | |
| | 150,000 | | | | | 1.000%, 03/15/18 | | | 198,868 | |
| | 50,000 | | | | | Tesla Motors, Inc.
1.250%, 03/01/21 | | | 45,219 | |
| | | | | | | | | | |
| | | | | | | | | 1,739,787 | |
| | | | | | | | | | |
| | | | | | Energy (0.5%) | |
| | 126,000 | | | | | Helix Energy Solutions Group, Inc.
3.250%, 03/15/32 | | | 139,318 | |
| | | | | | | | | | |
| | | | | | Financials (2.0%) | |
| | | | | | Ares Capital Corp. | | | | |
| | 135,000 | | | | | 4.750%, 01/15/18 | | | 139,687 | |
| | 130,000 | | | | | 5.750%, 02/01/16 | | | 134,104 | |
| | 70,000 | | | | | FXCM, Inc.
2.250%, 06/15/18 | | | 73,497 | |
| | 96,000 | | | | | MGIC Investment Corp.
2.000%, 04/01/20 | | | 141,134 | |
| | 75,000 | | | | | PRA Group, Inc.
3.000%, 08/01/20 | | | 84,719 | |
| | | | | | | | | | |
| | | | | | | | | 573,141 | |
| | | | | | | | | | |
| | | | | | Health Care (5.7%) | |
| | 285,000 | | | | | Anthem, Inc.
2.750%, 10/15/42 | | | 490,435 | |
| | 80,000 | | | | | BioMarin Pharmaceutical, Inc.^
1.500%, 10/15/20 | | | 97,654 | |
| | 130,000 | | | | | Cepheid*
1.250%, 02/01/21 | | | 143,155 | |
| | 35,000 | | | | | Gilead Sciences, Inc.
1.625%, 05/01/16 | | | 144,965 | |
| | 125,000 | | | | | Hologic, Inc.‡
2.000%, 12/15/37 | | | 155,894 | |
| | 350,000 | | | | | Illumina, Inc.*
0.000%, 06/15/19 | | | 387,224 | |
| | 70,000 | | | | | Insulet Corp.
2.000%, 06/15/19 | | | 83,497 | |
| | | | | | | | | | |
PRINCIPAL AMOUNT | | | | | | | VALUE | |
| | 69,000 | | | | | Molina Healthcare, Inc.*
1.625%, 08/15/44 | | $ | 76,763 | |
| | | | | | | | | | |
| | | | | | | | | 1,579,587 | |
| | | | | | | | | | |
| | | | | | Industrials (1.4%) | |
| | 85,000 | | | | | Air Lease Corp.
3.875%, 12/01/18 | | | 116,280 | |
| | 250,000 | | | | | Siemens, AG
1.050%, 08/16/17 | | | 272,910 | |
| | | | | | | | | | |
| | | | | | | | | 389,190 | |
| | | | | | | | | | |
| | | | | | Information Technology (5.4%) | |
| | 85,000 | | | | | Euronet Worldwide, Inc.*
1.500%, 10/01/44 | | | 86,877 | |
| | 120,000 | | | | | Intel Corp.
3.250%, 08/01/39 | | | 208,745 | |
| | 110,000 | | | | | LinkedIn Corp.*
0.500%, 11/01/19 | | | 116,020 | |
| | 75,000 | | | | | NVIDIA Corp.
1.000%, 12/01/18 | | | 86,195 | |
| | 240,000 | | | | | Salesforce.com, Inc.^
0.250%, 04/01/18 | | | 273,629 | |
| | 235,000 | | | | | SanDisk Corp.
0.500%, 10/15/20 | | | 283,134 | |
| | 185,000 | | | | | ServiceNow, Inc.
0.000%, 11/01/18 | | | 210,882 | |
| | 200,000 | | | | | Yahoo!, Inc.
0.000%, 12/01/18 | | | 226,946 | |
| | | | | | | | | | |
| | | | | | | | | 1,492,428 | |
| | | | | | | | | | |
| | | | | | Materials (1.0%) | |
| | 145,000 | | | | | Cemex, SAB de CV
3.250%, 03/15/16 | | | 168,477 | |
| | 120,000 | | | | | RTI International Metals, Inc.
1.625%, 10/15/19 | | | 116,797 | |
| | | | | | | | | | |
| | | | | | | | | 285,274 | |
| | | | | | | | | | |
| | | | | | TOTAL CONVERTIBLE BONDS
(Cost $5,641,274) | | | 6,198,725 | |
| | | | | | | | | | |
| | | | | | | | | | |
| | CORPORATE BONDS (5.6%) | |
| | | | | | Consumer Discretionary (2.7%) | |
| | 200,000 | | | | | Chrysler Group, LLC
8.250%, 06/15/21 | | | 222,250 | |
| | | | | | DISH DBS Corp. | | | | |
| | 70,000 | | | | | 5.875%, 07/15/22 | | | 71,838 | |
| | 70,000 | | | | | 5.125%, 05/01/20 | | | 70,613 | |
| | 140,000 | | | | | Expedia, Inc.
5.950%, 08/15/20 | | | 156,629 | |
| | 60,000 | | | | | Icahn Enterprises, LP
4.875%, 03/15/19 | | | 60,150 | |
| | 140,000 | | | | | L Brands, Inc.
5.625%, 02/15/22 | | | 151,287 | |
| | 20,000 | | | | | PVH Corp.
4.500%, 12/15/22 | | | 19,875 | |
| | | | | | | | | | |
| | | | | | | | | 752,642 | |
| | | | | | | | | | |
| | | | | | |
| See accompanying Notes to Schedule of Investments | | | | | 11 | |
Schedule of Investments December 31, 2014
| | | | | | | | | | |
PRINCIPAL AMOUNT | | | | | | | VALUE | |
| | | | | | | | | | |
| | | | | | Consumer Staples (0.5%) | |
| | 135,000 | | | | | Wal-Mart Stores, Inc.
3.300%, 04/22/24 | | $ | 139,715 | |
| | | | | | | | | | |
| | | | | | Energy (0.2%) | |
| | 54,000 | | | | | EPL Oil & Gas, Inc.
8.250%, 02/15/18 | | | 42,120 | |
| | | | | | | | | | |
| | | | | | Financials (0.3%) | |
| | 70,000 | | | | | Neuberger Berman Group, LLC*
5.875%, 03/15/22 | | | 74,077 | |
| | | | | | | | | | |
| | | | | | Health Care (0.4%) | |
| | 65,000 | | | | | Endo International, PLC*
7.000%, 07/15/19 | | | 67,966 | |
| | 12,000 | | | | | Salix Pharmaceuticals, Ltd.*
6.000%, 01/15/21 | | | 12,368 | |
| | 30,000 | | | | | Universal Health Services, Inc.*
4.750%, 08/01/22 | | | 30,412 | |
| | | | | | | | | | |
| | | | | | | | | 110,746 | |
| | | | | | | | | | |
| | | | | | Industrials (0.2%) | |
| | 59,000 | | | | | Actuant Corp.
5.625%, 06/15/22 | | | 61,434 | |
| | | | | | | | | | |
| | | | | | Information Technology (1.1%) | |
| | 20,000 | | | | | ACI Worldwide, Inc.*
6.375%, 08/15/20 | | | 21,050 | |
| | 65,000 | | | | | Apple, Inc.
3.450%, 05/06/24 | | | 68,179 | |
| | 75,000 | | | | | Brocade Communications Systems, Inc.
4.625%, 01/15/23 | | | 71,953 | |
| | 135,000 | | | | | Google, Inc.
3.375%, 02/25/24 | | | 141,074 | |
| | | | | | | | | | |
| | | | | | | | | 302,256 | |
| | | �� | | | | | | | |
| | | | | | Materials (0.2%) | |
| | 65,000 | | | | | Alcoa, Inc.
5.125%, 10/01/24 | | | 68,656 | |
| | | | | | | | | | |
| | | | | | TOTAL CORPORATE BONDS
(Cost $1,540,684) | | | 1,551,646 | |
| | | | | | | | | | |
| | | | | | | | | | |
NUMBER OF SHARES | | | | | | | VALUE | |
| | CONVERTIBLE PREFERRED STOCKS (9.1%) | |
| | | | | | Energy (1.2%) | |
| | 310 | | | | | Chesapeake Energy Corp.*
5.750% | | | 319,978 | |
| | | | | | | | | | |
| | | | | | Financials (2.9%) | |
| | 6,125 | | | | | Affiliated Managers Group, Inc.
5.150% | | | 379,750 | |
| | 2,000 | | | | | American Tower Corp.
5.250% | | | 229,920 | |
| | | | | | | | | | |
NUMBER OF SHARES | | | | | | | VALUE | |
| | 2,000 | | | | | Crown Castle International Corp.
4.500% | | $ | 205,980 | |
| | | | | | | | | | |
| | | | | | | | | 815,650 | |
| | | | | | | | | | |
| | | | | | Industrials (3.0%) | |
| | 1,100 | | | | | Genesee & Wyoming, Inc.
5.000% | | | 127,655 | |
| | 1,830 | | | | | Stanley Black & Decker, Inc.
6.250% | | | 215,464 | |
| | 8,000 | | | | | United Technologies Corp.
7.500% | | | 490,640 | |
| | | | | | | | | | |
| | | | | | | | | 833,759 | |
| | | | | | | | | | |
| | | | | | Utilities (2.0%) | |
| | 2,800 | | | | | Dominion Resources, Inc.
6.375% | | | 145,628 | |
| | 2,800 | | | | | Exelon Corp.
6.500% | | | 147,000 | |
| | 4,000 | | | | | NextEra Energy, Inc.
5.889% | | | 267,760 | |
| | | | | | | | | | |
| | | | | | | | | 560,388 | |
| | | | | | | | | | |
| | | | | | TOTAL CONVERTIBLE PREFERRED STOCKS
(Cost $2,262,208) | | | 2,529,775 | |
| | | | | | | | | | |
| | | | | | | | | | |
| | COMMON STOCKS (59.2%) | |
| | | | | | Consumer Discretionary (5.9%) | |
| | 430 | | | | | Amazon.com, Inc.#~ | | | 133,451 | |
| | 4,565 | | | | | Home Depot, Inc.~ | | | 479,188 | |
| | 3,610 | | | | | Nike, Inc. - Class B | | | 347,101 | |
| | 2,740 | | | | | Starbucks Corp. | | | 224,817 | |
| | 3,850 | | | | | Twenty-First Century Fox, Inc. | | | 147,859 | |
| | 3,100 | | | | | Walt Disney Company | | | 291,989 | |
| | | | | | | | | | |
| | | | | | | | | 1,624,405 | |
| | | | | | | | | | |
| | | | | | Consumer Staples (7.1%) | |
| | 9,154 | | | | | Coca-Cola Company~ | | | 386,482 | |
| | 2,125 | | | | | Costco Wholesale Corp. | | | 301,219 | |
| | 6,500 | | | | | Mondelez International, Inc. - Class A | | | 236,112 | |
| | 2,925 | | | | | PepsiCo, Inc. | | | 276,588 | |
| | 1,550 | | | | | Philip Morris International, Inc. | | | 126,248 | |
| | 3,635 | | | | | Procter & Gamble Company | | | 331,112 | |
| | 1,650 | | | | | Tyson Foods, Inc. | | | 83,061 | |
| | 3,000 | | | | | Walgreens Boots Alliance Common Stock | | | 228,600 | |
| | | | | | | | | | |
| | | | | | | | | 1,969,422 | |
| | | | | | | | | | |
| | | | | | Energy (4.8%) | |
| | 1,525 | | | | | Anadarko Petroleum Corp. | | | 125,813 | |
| | 1,175 | | | | | Chevron Corp. | | | 131,811 | |
| | 1,200 | | | | | EOG Resources, Inc. | | | 110,484 | |
| | 3,800 | | | | | Exxon Mobil Corp. | | | 351,310 | |
| | 1,950 | | | | | National Oilwell Varco, Inc. | | | 127,783 | |
| | | | |
| 12 | | CALAMOS GROWTH AND INCOME PORTFOLIO ANNUAL REPORT | | See accompanying Notes to Schedule of Investments |
Schedule of Investments December 31, 2014
| | | | | | | | | | |
NUMBER OF SHARES | | | | | | | VALUE | |
| | 4,280 | | | | | Occidental Petroleum Corp. | | $ | 345,011 | |
| | 1,665 | | | | | Schlumberger, Ltd. | | | 142,208 | |
| | | | | | | | | | |
| | | | | | | | | 1,334,420 | |
| | | | | | | | | | |
| | | | | | Financials (12.2%) | |
| | 5,945 | | | | | American International Group, Inc. | | | 332,980 | |
| | 3,000 | | | | | Arthur J. Gallagher & Company~ | | | 141,240 | |
| | 8,600 | | | | | Citigroup, Inc.~ | | | 465,346 | |
| | 915 | | | | | Goldman Sachs Group, Inc. | | | 177,354 | |
| | 11,000 | | | | | JPMorgan Chase & Company~ | | | 688,380 | |
| | 5,154 | | | | | MetLife, Inc. | | | 278,780 | |
| | 5,300 | | | | | State Street Corp. | | | 416,050 | |
| | 2,650 | | | | | T. Rowe Price Group, Inc. | | | 227,529 | |
| | 11,800 | | | | | Wells Fargo & Company | | | 646,876 | |
| | | | | | | | | | |
| | | | | | | | | 3,374,535 | |
| | | | | | | | | | |
| | | | | | Health Care (7.0%) | |
| | 1,960 | | | | | Celgene Corp.#~ | | | 219,246 | |
| | 6,900 | | | | | Johnson & Johnson~ | | | 721,533 | |
| | 3,885 | | | | | Merck & Company, Inc. | | | 220,629 | |
| | 6,700 | | | | | Pfizer, Inc. | | | 208,705 | |
| | 2,550 | | | | | Stryker Corp.~ | | | 240,541 | |
| | 2,935 | | | | | Zimmer Holdings, Inc. | | | 332,888 | |
| | | | | | | | | | |
| | | | | | | | | 1,943,542 | |
| | | | | | | | | | |
| | | | | | Industrials (6.7%) | |
| | 1,680 | | | | | Boeing Company~ | | | 218,366 | |
| | 1,850 | | | | | Cummins, Inc. | | | 266,715 | |
| | 3,850 | | | | | Delta Air Lines, Inc.~ | | | 189,382 | |
| | 4,150 | | | | | Eaton Corp., PLC | | | 282,034 | |
| | 1,300 | | | | | Northrop Grumman Corp. | | | 191,607 | |
| | 3,400 | | | | | Union Pacific Corp. | | | 405,042 | |
| | 2,850 | | | | | United Parcel Service, Inc. - Class B | | | 316,834 | |
| | | | | | | | | | |
| | | | | | | | | 1,869,980 | |
| | | | | | | | | | |
| | | | | | Information Technology (15.5%) | |
| | 2,600 | | | | | Accenture, PLC - Class A | | | 232,206 | |
| | 13,485 | | | | | Apple, Inc.~ | | | 1,488,474 | |
| | 4,850 | | | | | Broadcom Corp. - Class A | | | 210,150 | |
| | 5,420 | | | | | eBay, Inc.#~ | | | 304,170 | |
| | 1,900 | | | | | Facebook, Inc. - Class A#~ | | | 148,238 | |
| | 810 | | | | | Google, Inc. - Class A# | | | 429,835 | |
| | 5,200 | | | | | MasterCard, Inc. - Class A | | | 448,032 | |
| | 11,900 | | | | | Microsoft Corp. | | | 552,755 | |
| | 3,300 | | | | | Oracle Corp. | | | 148,401 | |
| | 2,750 | | | | | QUALCOMM, Inc. | | | 204,408 | |
| | 2,550 | | | | | Texas Instruments, Inc. | | | 136,336 | |
| | | | | | | | | | |
| | | | | | | | | 4,303,005 | |
| | | | | | | | | | |
| | | | | | TOTAL COMMON STOCKS
(Cost $13,201,043) | | | 16,419,309 | |
| | | | | | | | | | |
| | | | | | | | | | |
NUMBER OF SHARES | | | | | | | VALUE | |
| | SHORT TERM INVESTMENT (9.8%) | |
| | 2,705,332 | | | | | Fidelity Prime Money Market Fund - Institutional Class (Cost $2,705,332) | | $ | 2,705,332 | |
| | | | | | | | | | |
NUMBER OF
SHARES/
PRINCIPAL
AMOUNT | | | | | | | VALUE | |
| INVESTMENT OF CASH COLLATERAL FOR SECURITIES
ON LOAN (0.4%) |
|
| | | | | | Federal Home Loan Bank Discount Notes | | | | |
| | 8,934 | | | | | 0.070%, 02/06/15 | | | 8,934 | |
| | 8,934 | | | | | 0.070%, 03/02/15 | | | 8,934 | |
| | 8,934 | | | | | 0.065%, 02/23/15 | | | 8,934 | |
| | 8,934 | | | | | 0.065%, 02/26/15 | | | 8,934 | |
| | 8,934 | | | | | 0.060%, 02/27/15 | | | 8,934 | |
| | 8,934 | | | | | 0.040%, 01/26/15 | | | 8,934 | |
| | 5,315 | | | | | 0.075%, 03/26/15 | | | 5,315 | |
| | 3,076 | | | | | 0.090%, 03/30/15 | | | 3,076 | |
| | 9,736 | | | | | Federal Home Loan Mortgage Corp. Discount Note 0.058%, 01/26/15 | | | 9,736 | |
| | 5,908 | | | | | Fidelity Prime Money Market Fund - Institutional Class | | | 5,908 | |
| | 17,870 | | | | | Goldman Sachs Financial Square Fund | | | 17,870 | |
| | 17,871 | | | | | Morgan Stanley Institutional Liquidity Fund | | | 17,871 | |
| | | | | | | | | | |
| | | | | | TOTAL INVESTMENT OF CASH COLLATERAL FOR SECURITIES ON LOAN (Cost $113,380) | | | 113,380 | |
| | | | | | | | | | |
| TOTAL INVESTMENTS (106.4%)
(Cost $25,463,921) | | | 29,518,167 | |
| | | | | | | | | | |
| |
| | PAYABLE UPON RETURN OF SECURITIES ON LOAN (-0.4%) | | | (113,380 | ) |
| |
| | LIABILITIES, LESS OTHER ASSETS (-6.0%) | | | (1,656,924 | ) |
| | | | | | | | | | |
| |
| | NET ASSETS (100.0%) | | $ | 27,747,863 | |
| | | | | | | | | | |
| | | | | | |
| See accompanying Notes to Schedule of Investments | | | | | 13 | |
Schedule of Investments December 31, 2014
FORWARD FOREIGN CURRENCY CONTRACTS
| | | | | | | | | | | | | | | | |
| | | | | |
COUNTER
PARTY | | LONG CONTRACTS | | SETTLEMENT DATE | | LOCAL CURRENCY | | | CURRENT VALUE | | | UNREALIZED GAIN/
LOSS | |
| JPMorgan Chase Bank N.A. | | British Pound Sterling | | 01/22/15 | | | 10,000 | | | $ | 15,584 | | | $ | 51 | |
| State Street Bank and Trust | | British Pound Sterling | | 01/22/15 | | | 2,000 | | | | 3,117 | | | | (89 | ) |
| UBS AG | | British Pound Sterling | | 01/22/15 | | | 37,000 | | | | 57,661 | | | | (1,100 | ) |
| JPMorgan Chase Bank N.A. | | European Monetary Unit | | 01/22/15 | | | 6,000 | | | | 7,262 | | | | (166 | ) |
| Citibank N.A. | | Mexican Peso | | 01/22/15 | | | 70,000 | | | | 4,740 | | | | 34 | |
| UBS AG | | Mexican Peso | | 01/22/15 | | | 500,000 | | | | 33,855 | | | | (1,448 | ) |
| | | | | | | | | | | | | | | | |
| | | | | | | | | | | | | | $ | (2,718 | ) |
| | | | | | | | | | | | | | | | |
| | | | | |
COUNTER
PARTY | | SHORT CONTRACTS | | SETTLEMENT DATE | | LOCAL CURRENCY | | | CURRENT VALUE | | | UNREALIZED GAIN/
LOSS | |
| Citibank N.A. | | British Pound Sterling | | 01/22/15 | | | 49,000 | | | $ | 76,361 | | | $ | 2,166 | |
| Citibank N.A. | | European Monetary Unit | | 01/22/15 | | | 21,000 | | | | 25,416 | | | | 756 | |
| Northern Trust Company | | European Monetary Unit | | 01/22/15 | | | 54,000 | | | | 65,355 | | | | 2,722 | |
| Barclays Bank PLC | | Mexican Peso | | 01/22/15 | | | 122,000 | | | | 8,261 | | | | 2,519 | |
| JPMorgan Chase Bank N.A. | | Mexican Peso | | 01/22/15 | | | 191,000 | | | | 12,933 | | | | 1,040 | |
| Northern Trust Company | | Mexican Peso | | 01/22/15 | | | 1,691,000 | | | | 114,497 | | | | 11,052 | |
| State Street Bank and Trust | | Mexican Peso | | 01/22/15 | | | 189,000 | | | | 12,797 | | | | 1,000 | |
| | | | | | | | | | | | | | | | |
| | | | | | | | | | | | | | $ | 21,255 | |
| | | | | | | | | | | | | | | | |
NOTES TO SCHEDULE OF INVESTMENTS
| * | Securities issued and sold pursuant to a Rule 144A transaction are excepted from the registration requirement of the Securities Act of 1933, as amended. These securities may only be sold to qualified institutional buyers (“QIBs”), such as the Portfolio. Any resale of these securities must generally be effected through a sale that is registered under the Act or otherwise exempted from such registration requirements. |
| § | Securities exchangeable or convertible into securities of one or more entities that are different than the issuer. Each entity is identified in the parenthetical. |
| ^ | Security, or portion of security, is on loan. |
| ‡ | Variable rate or step bond security. The rate shown is the rate in effect at December 31, 2014. |
| # | Non-income producing security. |
| ~ | Security, or portion of security, is segregated as collateral (or potential collateral for future options transactions) for written options. The aggregate value of such securities is $575,726. |
| | | | |
| 14 | | CALAMOS GROWTH AND INCOME PORTFOLIO ANNUAL REPORT | | See accompanying Notes to Financial Statements |
Statement of Assets and Liabilities December 31, 2014
| | | | |
ASSETS | | | | |
Investments in securities, at value (cost $25,463,921) | | $ | 29,518,167 | |
Cash with custodian (interest bearing) | | | 1,752 | |
Unrealized appreciation on forward foreign currency contracts | | | 26,521 | |
Receivables: | | | | |
Accrued interest and dividends | | | 70,016 | |
Portfolio shares sold | | | 7,964 | |
Prepaid expenses | | | 321 | |
Other assets | | | 97,243 | |
Total assets | | | 29,721,984 | |
LIABILITIES | | | | |
Unrealized depreciation on forward foreign currency contracts | | | 7,984 | |
Payables: | | | | |
Collateral for securities loaned | | | 113,380 | |
Investments purchased | | | 1,692,428 | |
Portfolio shares redeemed | | | 712 | |
Affiliates: | | | | |
Investment advisory fees | | | 17,834 | |
Deferred compensation to trustees | | | 97,243 | |
Financial accounting fees | | | 273 | |
Trustees’ fees and officer compensation | | | 504 | |
Other accounts payable and accrued liabilities | | | 43,763 | |
Total liabilities | | | 1,974,121 | |
NET ASSETS | | $ | 27,747,863 | |
COMPOSITION OF NET ASSETS | | | | |
Paid in capital | | $ | 23,343,273 | |
Undistributed net investment income (loss) | | | (199,399 | ) |
Accumulated net realized gain (loss) on investments and foreign currency transactions | | | 531,206 | |
Unrealized appreciation (depreciation) of investments and foreign currency translations | | | 4,072,783 | |
NET ASSETS | | $ | 27,747,863 | |
Shares outstanding (no par value; unlimited number of shares authorized) | | | 1,866,535 | |
Net asset value and redemption price per share | | $ | 14.87 | |
| | | | | | |
| See accompanying Notes to Financial Statements | | | | | 15 | |
Statement of Operations Year Ended December 31, 2014
| | | | |
INVESTMENT INCOME | | | | |
Interest | | $ | 356,331 | |
Dividends | | | 384,072 | |
Securities lending income | | | 388 | |
Total investment income | | | 740,791 | |
| |
EXPENSES | | | | |
Investment advisory fees | | | 208,482 | |
Audit fees | | | 55,600 | |
Legal fees | | | 42,575 | |
Printing and mailing fees | | | 26,371 | |
Accounting fees | | | 14,047 | |
Trustees’ fees and officer compensation | | | 13,283 | |
Custodian fees | | | 11,498 | |
Transfer agent fees | | | 8,464 | |
Financial accounting fees | | | 3,193 | |
Other | | | 8,403 | |
Total expenses | | | 391,916 | |
NET INVESTMENT INCOME (LOSS) | | | 348,875 | |
| |
REALIZED AND UNREALIZED GAIN (LOSS) | | | | |
Net realized gain (loss) from: | | | | |
Investments, excluding purchased options | | | 2,472,466 | |
Purchased options | | | 17,264 | |
Foreign currency transaction | | | 5,512 | |
Change in net unrealized appreciation/(depreciation) on: | | | | |
Investments, excluding purchased options | | | (968,659 | ) |
Purchased options | | | (81,650 | ) |
Foreign currency translation | | | 28,269 | |
NET GAIN (LOSS) | | | 1,473,202 | |
NET INCREASE (DECREASE) IN NET ASSETS RESULTING FROM OPERATIONS | | $ | 1,822,077 | |
| | | | |
| 16 | | CALAMOS GROWTH AND INCOME PORTFOLIO ANNUAL REPORT | | See accompanying Notes to Financial Statements |
Statements of Changes in Net Assets
| | | | | | | | |
| | | YEAR ENDED DECEMBER 31, | |
| | | 2014 | | | 2013 | |
OPERATIONS | | | | | | | | |
Net investment income (loss) | | $ | 348,875 | | | $ | 367,967 | |
Net realized gain (loss) | | | 2,495,242 | | | | 1,638,919 | |
Change in unrealized appreciation/(depreciation) | | | (1,022,040 | ) | | | 2,087,682 | |
Net increase (decrease) in net assets resulting from operations | | | 1,822,077 | | | | 4,094,568 | |
| | |
DISTRIBUTIONS TO SHAREHOLDERS | | | | | | | | |
Net investment income | | | (270,035 | ) | | | (293,138 | ) |
Net realized gains | | | (2,604,773 | ) | | | (1,216,869 | ) |
Total distributions | | | (2,874,808 | ) | | | (1,510,007 | ) |
| | |
CAPITAL SHARE TRANSACTIONS | | | | | | | | |
Issued | | | 2,287,675 | | | | 1,715,352 | |
Issued in reinvestment of distributions | | | 2,874,808 | | | | 1,510,007 | |
Redeemed | | | (4,532,782 | ) | | | (4,284,058 | ) |
Net increase (decrease) in net assets from capital share transactions | | | 629,701 | | | | (1,058,699 | ) |
TOTAL INCREASE (DECREASE) IN NET ASSETS | | | (423,030 | ) | | | 1,525,862 | |
| | |
NET ASSETS | | | | | | | | |
Beginning of year | | $ | 28,170,893 | | | $ | 26,645,031 | |
End of year | | | 27,747,863 | | | | 28,170,893 | |
Undistributed net investment income (loss) | | $ | (199,399 | ) | | $ | (148,069 | ) |
| | |
CAPITAL SHARE TRANSACTIONS | | | | | | | | |
Shares issued | | | 146,009 | | | | 113,855 | |
Shares issued in reinvestment of distributions | | | 191,691 | | | | 99,764 | |
Shares redeemed | | | (291,465 | ) | | | (287,081 | ) |
Net increase (decrease) in capital shares outstanding | | | 46,235 | | | | (73,462 | ) |
| | | | | | |
| See accompanying Notes to Financial Statements | | | | | 17 | |
Notes to Financial Statements
Note 1 – Organization and Significant Accounting Policies
Organization. CALAMOS ADVISORS TRUST (the “Trust”), a Massachusetts business trust organized February 17, 1999, consists of a single series, Calamos Growth and Income Portfolio (the “Portfolio”), which commenced operations on May 19, 1999. The Trust currently offers the Portfolio’s shares to certain life insurance companies for allocation to certain separate accounts established for the purpose of funding qualified and non-qualified variable annuity contracts and variable life insurance contracts. The Portfolio seeks high long-term total return through growth and current income.
Portfolio Valuation. The valuation of the Portfolio’s investments is in accordance with policies and procedures adopted by and under the ultimate supervision of the board of trustees.
Portfolio securities that are traded on U.S. securities exchanges, except option securities, are valued at the official closing price, which is the last current reported sales price on its principle exchange at the time the Portfolio determines its net asset value (“NAV”). Securities traded in the over-the-counter market and quoted on The NASDAQ Stock Market are valued at the NASDAQ Official Closing Price, as determined by NASDAQ, or lacking a NASDAQ Official Closing Price, the last current reported sale price on NASDAQ at the time a Portfolio determines its NAV. When a last sale or closing price is not available, equity securities, other than option securities, that are traded on a U.S. securities exchange and other equity securities traded in the over-the-counter market are valued at the mean between the most recent bid and asked quotations on its principle exchange in accordance with guidelines adopted by the board of trustees. Each option security traded on a U.S. securities exchange is valued at the mid-point of the consolidated bid/ask quote for the option security, also in accordance with guidelines adopted by the board of trustees. Each over-the-counter option that is not traded through the Options Clearing Corporation is valued based on a quotation provided by the counterparty to such option under the ultimate supervision of the board of trustees.
Fixed income securities, certain convertible preferred securities, and non-exchange traded derivatives are normally valued by independent pricing services or by dealers or brokers who make markets in such securities. Valuations of such fixed income securities, certain convertible preferred securities, and non-exchange traded derivatives consider yield or price of equivalent securities of comparable quality, coupon rate, maturity, type of issue, trading characteristics and other market data and do not rely exclusively upon exchange or over-the-counter prices.
Trading on European and Far Eastern exchanges and over-the-counter markets is typically completed at various times before the close of business on each day on which the New York Stock Exchange (“NYSE”) is open. Each security trading on these exchanges or in over-the-counter markets may be valued utilizing a systematic fair valuation model provided by an independent pricing service approved by the board of trustees. The valuation of each security that meets certain criteria in relation to the valuation model is systematically adjusted to reflect the impact of movement in the U.S. market after the foreign markets close. Securities that do not meet the criteria, or that are principally traded in other foreign markets, are valued as of the last reported sale price at the time the Portfolio determines its NAV, or when reliable market prices or quotations are not readily available, at the mean between the most recent bid and asked quotations as of the close of the appropriate exchange or other designated time. Trading of foreign securities may not take place on every NYSE business day. In addition, trading may take place in various foreign markets on Saturdays or on other days when the NYSE is not open and on which the Portfolio’s NAV is not calculated.
If the pricing committee determines that the valuation of a security in accordance with the methods described above is not reflective of a fair value for such security, the security is valued at a fair value by the pricing committee, under the ultimate supervision of the board of trustees, following the guidelines and/or procedures adopted by the board of trustees.
The Portfolio also may use fair value pricing, pursuant to guidelines adopted by the board of trustees and under the ultimate supervision of the board of trustees, if trading in the security is halted or if the value of a security it holds is materially affected by events occurring before the Portfolio’s pricing time but after the close of the primary market or exchange on which the security is listed. Those procedures may utilize valuations furnished by pricing services approved by the board of trustees, which may be based on market transactions for comparable securities and various relationships between securities that are generally recognized by institutional traders, a computerized matrix system, or appraisals derived from information concerning the securities or similar securities received from recognized dealers in those securities.
When fair value pricing of securities is employed, the prices of securities used by the Portfolio to calculate its NAV may differ from market quotations or official closing prices. In light of the judgment involved in fair valuations, there can be no assurance that a fair value assigned to a particular security is accurate.
| | | | |
| 18 | | CALAMOS GROWTH AND INCOME PORTFOLIO ANNUAL REPORT | | |
Notes to Financial Statements
Investment Transactions. Investment transactions are recorded on a trade date basis as of December 31, 2014. Net realized gains and losses from investment transactions are reported on an identified cost basis. Interest income is recognized using the accrual method and includes accretion of original issue and market discount and amortization of premium. Dividend income is recognized on the ex-dividend date, except that certain dividends from foreign securities are recorded as soon as the information becomes available after the ex-dividend date.
Foreign Currency Translation. Values of investments and other assets and liabilities denominated in foreign currencies are translated into U.S. dollars using a rate quoted by a major bank or dealer in the particular currency market, as reported by a recognized quotation dissemination service.
The Portfolio does not isolate that portion of the results of operations resulting from changes in foreign exchange rates on investments from the fluctuations arising from changes in market prices of securities held. Such fluctuations are included with the net realized and unrealized gain or loss from investments.
Reported net realized foreign currency gains or losses arise from disposition of foreign currency, the difference in the foreign exchange rates between the trade and settlement dates on securities transactions, and the difference between the amounts of dividends, interest and foreign withholding taxes recorded on the ex-date or accrual date and the U.S. dollar equivalent of the amounts actually received or paid. Net unrealized foreign exchange gains and losses arise from changes (due to the changes in the exchange rate) in the value of foreign currency and other assets and liabilities denominated in foreign currencies held at year end.
Allocation of Expenses Among Funds. Expenses directly attributable to the Portfolio are charged to the Portfolio; certain other common expenses of Calamos Advisors Trust, Calamos Investment Trust, Calamos ETF Trust, Calamos Convertible Opportunities and Income Fund, Calamos Convertible and High Income Fund, Calamos Strategic Total Return Fund, Calamos Global Total Return Fund and Calamos Global Dynamic Income Fund are allocated proportionately among each Fund to which the expenses relate in relation to the net assets of each Fund or on another reasonable basis.
Use of Estimates. The preparation of financial statements in conformity with U.S. generally accepted accounting principles requires management to make estimates and assumptions that affect the amounts reported in the financial statements and accompanying notes. Actual results may differ from those estimates.
Income Taxes. No provision has been made for U.S. income taxes because the Trust’s policy is to continue to qualify as a regulated investment company under the Internal Revenue Code of 1986, as amended, and distribute to shareholders substantially all of the Portfolio’s taxable income and net realized gains.
Dividends and distributions paid to shareholders are recorded on the ex-dividend date. The amount of dividends and distributions from net investment income and net realized capital gains is determined in accordance with federal income tax regulations, which may differ from U.S. generally accepted accounting principles. To the extent these “book/tax” differences are permanent in nature, such amounts are reclassified within the capital accounts based on their federal tax-basis treatment. These differences are primarily due to differing treatments for foreign currency transactions, contingent payment debt instruments and methods of amortizing and accreting for fixed income securities. The financial statements are not adjusted for temporary differences.
The Portfolio recognized no liability for uncertain tax positions. A reconciliation is not provided as the beginning and ending amounts of unrecognized benefits are zero, with no interim additions, reductions or settlements. Tax years 2011 – 2014 remain subject to examination by the U.S. and the State of Illinois tax jurisdictions.
Indemnifications. Under the Trust’s organizational documents, the Trust is obligated to indemnify its officers and trustees against certain liabilities incurred by them by reason of having been an officer or trustee of the Trust. In addition, in the normal course of business, the Trust may enter into contracts that provide general indemnifications to other parties. The Portfolio’s maximum exposure under these arrangements is unknown as this would involve future claims that may be made against the Portfolio that have not yet occurred. Currently, the Portfolio’s management expects the risk of material loss in connection to a potential claim to be remote.
Note 2 – Investment Adviser and Transactions With Affiliates Or Certain Other Parties
Pursuant to an investment advisory agreement with Calamos Advisors LLC (“Calamos Advisors”), the Portfolio pays a monthly investment advisory fee based on the average daily net assets of the Portfolio at the annual rate of 0.75%.
Notes to Financial Statements
Pursuant to a financial accounting services agreement, during the period the Portfolio paid Calamos Advisors a fee for financial accounting services payable monthly at the annual rate of 0.0175% on the first $1 billion of combined assets, 0.0150% on the next $1 billion of combined assets and 0.0110% on combined assets above $2 billion (for purposes of this calculation “combined assets” means the sum of the total average daily net assets of Calamos Investment Trust, Calamos ETF Trust, Calamos Advisors Trust and the total average weekly managed assets of Calamos Convertible and High Income Fund, Calamos Strategic Total Return Fund, Calamos Convertible Opportunities and Income Fund, Calamos Global Total Return Fund and Calamos Global Dynamic Income Fund). Financial accounting services include, but are not limited to, the following: managing expenses and expense payment processing; monitoring the calculation of expense accrual amounts; calculating, tracking and reporting tax adjustments on all assets; and monitoring trustee deferred compensation plan accruals and valuations. The Portfolio pays its pro rata share of the financial accounting services fee payable to Calamos Advisors based on its relative portion of combined assets used in calculating the fee.
The Portfolio reimburses Calamos Advisors for a portion of compensation paid to the Trust’s Chief Compliance Officer. This compensation is reported as part of “Trustees’ fees and officer compensation” expense on the Statement of Operations.
Pursuant to an agreement with US Bancorp Fund Services, LLC, the Portfolio’s transfer agent (“US Bancorp”), Calamos Financial Services LLC (“CFS”) provides certain shareholder administrative services to US Bancorp. CFS receives from US Bancorp an annual aggregate fee of $175,000, paid in monthly installments, for providing these services which relate to Calamos Advisors Trust and Calamos Investment Trust. Also, US Bancorp pays license fees to unaffiliated third parties for CFS’ utilization of certain transfer agent and phone systems in providing the shareholder administrative services. The fees paid to CFS and the payment of license fees to third parties are borne by US Bancorp. The Portfolio has not assumed or incurred any additional expenses in connection with CFS providing these services to US Bancorp, and the transfer agency fees payable by the Portfolio to US Bancorp have not increased as a result thereof.
A trustee and certain officers of the Trust are also officers and directors of CFS and Calamos Advisors. Such trustee and officers serve without direct compensation from the Trust. The Portfolio’s Statement of Additional Information contains additional information about the Portfolio’s trustees and is available upon request without charge by calling our toll free number 800.582.6959.
The Trust has adopted a deferred compensation plan (the “Plan”). Under the Plan, a trustee who is not an “interested person” (as defined in the 1940 Act) and has elected to participate in the Plan (a “participating trustee”) may defer receipt of all or a portion of his compensation from the Trust. The deferred compensation payable to the participating trustee is credited to the trustee’s deferral account as of the business day such compensation would have been paid to the participating trustee. The value of amounts deferred for a participating trustee is determined by reference to the change in value of Class I shares of one or more funds of Calamos Investment Trust designated by the participant. The value of the account increases with contributions to the account or with increases in the value of the measuring shares, and the value of the account decreases with withdrawals from the account or with declines in the value of the measuring shares. Deferred compensation of $97,243 is included in “Other assets” on the Statement of Assets and Liabilities at December 31, 2014. The Portfolio’s obligation to make payments under the Plan is a general obligation of the Portfolio and is included in “Payable for deferred compensation to trustees” on the Statement of Assets and Liabilities at December 31, 2014.
Note 3 – Investments
The cost of purchases and proceeds from the sale of long-term investments for the year ended December 31, 2014 were as follows:
| | | | |
| Cost of purchases | | $ | 12,453,764 | |
| Proceeds from sales | | | 14,539,186 | |
The following information is presented on a federal income tax basis as of December 31, 2014. Differences between the cost basis under U.S. generally accepted accounting principles and federal income tax purposes are primarily due to temporary differences.
The cost basis of investments for federal income tax purposes at December 31, 2014 was as follows:
| | | | |
| Cost basis of investments | | $ | 25,495,263 | |
| | | | |
| Gross unrealized appreciation | | | 4,327,248 | |
| Gross unrealized depreciation | | | (304,344 | ) |
| | | | |
| Net unrealized appreciation (depreciation) | | $ | 4,022,904 | |
| | | | |
| | | | |
| 20 | | CALAMOS GROWTH AND INCOME PORTFOLIO ANNUAL REPORT | | |
Notes to Financial Statements
Note 4 – Income Taxes
For the fiscal year ended December 31, 2014, the Portfolio recorded the following permanent reclassifications to reflect tax character. The results of operations and net assets were not affected by these reclassifications.
| | | | |
| Undistributed net investment income/(loss) | | $ | (130,170 | ) |
| Accumulated net realized gain/(loss) on investments | | | 130,170 | |
Distributions for the year were characterized for federal income tax purposes as follows:
| | | | | | | | |
| | | YEAR ENDED
DECEMBER 31, 2014 | | | YEAR ENDED
DECEMBER 31, 2013 | |
| Distributions paid from: | | | | | | | | |
| Ordinary income | | $ | 292,005 | | | $ | 293,138 | |
| Long-term capital gains | | | 2,582,803 | | | | 1,216,869 | |
As of December 31, 2014, the components of accumulated earnings/(loss) on a tax basis were as follows:
| | | | |
| Undistributed ordinary income | | $ | 227,293 | |
| Undistributed capital gains | | | 241,910 | |
| | | | |
| Total undistributed earnings | | | 469,203 | |
| Accumulated capital and other losses | | | — | |
| Net unrealized gains/(losses) | | | 4,041,441 | |
| | | | |
| Total accumulated earnings/(losses) | | | 4,510,644 | |
| Other | | | (106,054 | ) |
| Paid-in capital | | | 23,343,273 | |
| | | | |
| Net assets applicable to common shareholders | | $ | 27,747,863 | |
| | | | |
Note 5 – Derivative Instruments
Foreign Currency Risk. The Portfolio engages in portfolio hedging with respect to changes in currency exchange rates by entering into forward foreign currency contracts to purchase or sell currencies. A forward foreign currency contract is a commitment to purchase or sell a foreign currency at a future date at a negotiated forward rate. Risks associated with such contracts include, among other things, movement in the value of the foreign currency relative to the U.S. dollar and the ability of the counterparty to perform. To mitigate the counterparty risk, the Portfolio may enter into an International Swaps and Derivatives Association, Inc. Master Agreement (“ISDA Master Agreement”) or similar agreement with its derivative contract counterparties. An ISDA Master Agreement is a bilateral agreement between the Portfolio and a counterparty that governs OTC derivatives and foreign exchange contracts and typically contains, among other things, collateral posting terms and netting provisions in the event of a default and/or termination event. Under an ISDA Master Agreement, the Portfolio may, under certain circumstances, offset with the counterparty certain derivative financial instrument’s payables and/or receivables with collateral held and/or posted and create one single net payment. The provisions of the ISDA Master Agreement typically permit a single net payment in the event of default (close-out netting) including the bankruptcy or insolvency of the counterparty. Generally, collateral is exchanged between the Portfolio and the counterparty and the amount of collateral due from the Portfolio or to a counterparty has to exceed a minimum transfer amount threshold before a transfer has to be made. To the extent amounts due to the Portfolio from its counterparties are not fully collateralized, contractually or otherwise, the Portfolio bears the risk of loss from counterparty nonperformance. For financial reporting purposes, the Portfolio does not offset derivative assets and derivative liabilities that are subject to netting arrangements in the Statement of Assets and Liabilities. The net unrealized gain, if any, represents the credit risk to the Portfolio on a forward foreign currency contract. The contracts are valued daily at forward foreign exchange rates. The Portfolio realizes a gain or loss when a position is closed or upon settlement of the contracts. As of December 31, 2014, the Portfolio had outstanding forward foreign currency contracts as listed on the Schedule of Investments.
Equity Risk. The Portfolio may engage in option transactions and in doing so achieves similar objectives to what it would achieve through the sale or purchase of individual securities. A call option, upon payment of a premium, gives the purchaser of the option the right to buy, and the seller of the option the obligation to sell, the underlying security, index or other instrument at the exercise price.
Notes to Financial Statements
A put option gives the purchaser of the option, upon payment of a premium, the right to sell, and the seller the obligation to buy, the underlying security, index, or other instrument at the exercise price.
To seek to offset some of the risk of a potential decline in value of certain long positions, the Portfolio may also purchase put options on individual securities, broad-based securities indexes or certain exchange-traded funds (“ETFs”). The Portfolio may also seek to generate income from option premiums by writing (selling) options on a portion of the equity securities (including securities that are convertible into equity securities) in the Portfolio, on broad-based securities indexes, or certain ETFs.
When the Portfolio purchases an option, it pays a premium and an amount equal to that premium is recorded as an asset. When the Portfolio writes an option, it receives a premium and an amount equal to that premium is recorded as a liability. The asset or liability is adjusted daily to reflect the current market value of the option. If an option expires unexercised, the Portfolio realizes a gain or loss to the extent of the premium received or paid. If an option is exercised, the premium received or paid is recorded as an adjustment to the proceeds from the sale or the cost basis of the purchase. The difference between the premium and the amount received or paid on a closing purchase or sale transaction is also treated as a realized gain or loss. The cost of securities acquired through the exercise of call options is increased by premiums paid. The proceeds from securities sold through the exercise of put options are decreased by the premiums paid. Gain or loss on written options and purchased options is presented separately as net realized gain or loss on written options and net realized gain or loss on purchased options, respectively.
Options written by the Portfolio do not typically give rise to counterparty credit risk since options written obligate the Portfolio and not the counterparty to perform. Exchange traded purchased options have minimal counterparty credit risk to the Portfolio since the exchange’s clearinghouse, as counterparty to such instruments, guarantees against a possible default.
As of December 31, 2014, the Portfolio had outstanding derivative contracts which are reflected on the Statement of Assets and Liabilities as follows:
| | | | | | | | |
| | | ASSET
DERIVATIVES | | | LIABILITY
DERIVATIVES | |
| Gross amounts at fair value: | | | | | | | | |
| Forward foreign currency contracts (1) | | $ | 26,521 | | | $ | 7,984 | |
| | | | |
| | $ | 26,521 | | | $ | 7,984 | |
| | | | |
The following table presents the outstanding derivative contracts, organized by counterparty, that are subject to enforceable master netting agreements as of December 31, 2014:
| | | | | | | | | | | | | | | | | | | | | | |
| | | GROSS AMOUNTS NOT OFFSET
IN THE STATEMENT OF ASSETS AND LIABILITIES | |
| | | | |
| | | GROSS AMOUNTS PRESENTED IN THE
STATEMENT OF ASSETS AND LIABILITIES | | | COLLATERAL PLEDGED | | | NET AMOUNT
RECEIVABLE
IN THE EVENT OF DEFAULT | | | NET AMOUNT
PAYABLE IN
THE EVENT OF DEFAULT | |
| Counterparty | | | | ASSETS | | | LIABILITIES | | | | |
| Barclays Bank PLC | | ISDA | | $ | 2,595 | | | $ | 76 | | | $ | — | | | $ | 2,519 | | | $ | — | |
| Citibank N.A. | | ISDA | | | 3,003 | | | | 46 | | | | — | | | | 2,957 | | | | — | |
| JPMorgan Chase Bank N.A. | | ISDA | | | 1,474 | | | | 550 | | | | — | | | | 924 | | | | — | |
| Northern Trust Company | | ISDA | | | 18,142 | | | | 4,368 | | | | — | | | | 13,774 | | | | — | |
| State Street Bank and Trust | | ISDA | | | 1,000 | | | | 89 | | | | — | | | | 911 | | | | — | |
| UBS AG | | ISDA | | | 307 | | | | 2,855 | | | | — | | | | — | | | | 2,548 | |
| | | |
| | | | $ | 26,521 | | | $ | 7,984 | | | $ | — | | | $ | 21,085 | | | $ | 2,548 | |
| | | |
| (1) | Generally, the Statement of Assets and Liabilities location for Forward foreign currency contracts is Unrealized appreciation on forward foreign currency contracts for asset derivatives and Unrealized depreciation on forward foreign currency contracts for liability derivatives. |
| | | | |
| 22 | | CALAMOS GROWTH AND INCOME PORTFOLIO ANNUAL REPORT | | |
Notes to Financial Statements
For the year ended December 31, 2014, the volume of derivative activity for the Portfolio is reflected below:*
| | | | |
| | | DERIVATIVE ACTIVITY | |
| Forward contracts | | | 2,716,343 | |
| Options purchased | | | 124 | |
| * | Activity during the period is measured by opened number of contracts for options purchased and opened forward foreign currency contracts (measured in notional). |
Note 6 – Securities Lending
The Portfolio may loan one or more of its securities to broker-dealers and banks. Any such loan must be secured by collateral in cash or cash equivalents maintained on a current basis in an amount at least equal to the value of the securities loaned by the Portfolio. The Portfolio continues to receive the equivalent of the interest or dividends paid by the issuer on the securities loaned and also receives an additional return that may be in the form of a fixed fee or a percentage of the collateral. Upon receipt of cash or cash equivalent collateral, the Portfolio’s securities lending agent invests the collateral into short term investments following investment guidelines approved by Calamos Advisors. The Portfolio records the investment of collateral as an asset and the value of the collateral as a liability on the Statement of Assets and Liabilities. If the value of the invested collateral declines below the value of the collateral deposited by the borrower, the Portfolio will record unrealized depreciation equal to the decline in value of the invested collateral. The Portfolio may pay reasonable fees to persons unaffiliated with the Portfolio for services in arranging these loans. The Portfolio has the right to call a loan and obtain the securities loaned at any time. The Portfolio does not have the right to vote the securities during the existence of the loan but could call the loan in an attempt to permit voting of the securities in certain circumstances. Upon return of the securities loaned, the cash or cash equivalent collateral will be returned to the borrower. In the event of bankruptcy or other default of the borrower, the Portfolio could experience both delays in liquidating the loan collateral or recovering the loaned securities and losses, including (a) possible decline in the value of the collateral or in the value of the securities loaned during the period while the Portfolio seeks to enforce its rights thereto, (b) possible subnormal levels of income and lack of access to income during this period, and (c) the expenses of enforcing its rights. In an effort to reduce these risks, the Portfolio’s security lending agent monitors and reports to Calamos Advisors on the creditworthiness of the firms to which the Portfolio lends securities. At December 31, 2014, the Portfolio held securities valued at $110,301 that were on loan to broker-dealers and banks. The Portfolio also held collateral in short term investments of $113,380 and reflected a corresponding liability for such collateral of $113,380.
Note 7 – Fair Value Measurements
Various inputs are used to determine the value of the Portfolio’s investments. These inputs are categorized into three broad levels as follows:
| | • | | Level 1 – Prices are determined using inputs from unadjusted quoted prices from active markets (including securities actively traded on a securities exchange) for identical assets. |
| | • | | Level 2 – Prices are determined using significant observable market inputs other than unadjusted quoted prices, including quoted prices of similar securities, fair value adjustments to quoted foreign securities, interest rates, credit risk, prepayment speeds, and other relevant data. |
| | • | | Level 3 – Prices reflect unobservable market inputs (including the Portfolio’s own judgments about assumptions market participants would use in determining fair value) when observable inputs are unavailable. |
Debt securities are valued based upon evaluated prices received from an independent pricing service or from a dealer or broker who makes markets in such securities. Pricing services utilize various observable market data and as such, debt securities are generally categorized as Level 2. The levels are not necessarily an indication of the risk or liquidity of the Portfolio’s investments. Transfers between the levels for investment securities or other financial instruments are measured at the end of the reporting period.
Notes to Financial Statements
The following is a summary of the inputs used in valuing the Portfolio’s holdings at fair value:
| | | | | | | | | | | | | | | | |
| | | LEVEL 1 | | | LEVEL 2 | | | LEVEL 3 | | | TOTAL | |
| Assets: | | | | | | | | | | | | | | | | |
Convertible Bonds | | $ | — | | | $ | 6,198,725 | | | $ | — | | | $ | 6,198,725 | |
Corporate Bonds | | | — | | | | 1,551,646 | | | | — | | | | 1,551,646 | |
Convertible Preferred Stocks | | | 1,830,047 | | | | 699,728 | | | | — | | | | 2,529,775 | |
Common Stocks | | | 16,419,309 | | | | — | | | | — | | | | 16,419,309 | |
Short Term Investment | | | 2,705,332 | | | | — | | | | — | | | | 2,705,332 | |
Investment of Collateral For Securities Loaned | | | 41,649 | | | | 71,731 | | | | — | | | | 113,380 | |
Forward Foreign Currency Contracts | | | — | | | | 26,521 | | | | — | | | | 26,521 | |
| | | | |
| Total | | $ | 20,996,337 | | | $ | 8,548,351 | | | $ | — | | | $ | 29,544,688 | |
| | | | |
| Liabilities: | | | | | | | | | | | | | | | | |
Collateral For Securities Loaned | | $ | — | | | $ | 113,380 | | | $ | — | | | $ | 113,380 | |
Forward Foreign Currency Contracts | | | — | | | | 7,984 | | | | — | | | | 7,984 | |
| | | | |
| Total | | $ | — | | | $ | 121,364 | | | $ | — | | | $ | 121,364 | |
| | | | |
| | | | |
| 24 | | CALAMOS GROWTH AND INCOME PORTFOLIO ANNUAL REPORT | | |
Financial Highlights
Selected data for a share outstanding throughout each year were as follows:
| | | | | | | | | | | | | | | | | | | | |
| | | Year Ended December 31, | |
| | | 2014 | | | 2013 | | | 2012 | | | 2011 | | | 2010 | |
Net asset value, beginning of year | | | $15.48 | | | | $14.07 | | | | $13.41 | | | | $13.88 | | | | $12.69 | |
Income from investment operations: | | | | | | | | | | | | | | | | | | | | |
Net investment income (loss)(a) | | | 0.20 | | | | 0.20 | | | | 0.21 | | | | 0.18 | | | | 0.21 | |
Net realized and unrealized gain (loss) | | | 0.84 | | | | 2.09 | | | | 0.92 | | | | (0.44 | ) | | | 1.23 | |
Total from investment operations | | | 1.04 | | | | 2.29 | | | | 1.13 | | | | (0.26 | ) | | | 1.44 | |
Distributions: | | | | | | | | | | | | | | | | | | | | |
Dividends from net investment income | | | (0.15 | ) | | | (0.17 | ) | | | (0.29 | ) | | | (0.21 | ) | | | (0.25 | ) |
Dividends from net realized gains | | | (1.50 | ) | | | (0.71 | ) | | | (0.18 | ) | | | — | | | | — | |
Total distributions | | | (1.65 | ) | | | (0.88 | ) | | | (0.47 | ) | | | (0.21 | ) | | | (0.25 | ) |
Net asset value, end of year | | | $14.87 | | | | $15.48 | | | | $14.07 | | | | $13.41 | | | | $13.88 | |
Ratios and supplemental data: | | | | | | | | | | | | | | | | | | | | |
Total return(b) | | | 6.84% | | | | 16.40% | | | | 8.43% | | | | (1.87% | ) | | | 11.59% | |
Net assets, end of year (000) | | | $27,748 | | | | $28,171 | | | | $26,645 | | | | $25,105 | | | | $26,574 | |
Ratios of net expenses to average net assets | | | 1.41% | | | | 1.39% | | | | 1.35% | | | | 1.41% | | | | 1.43% | |
Ratios of gross expenses to average net assets prior to expense reductions | | | 1.41% | | | | 1.39% | | | | 1.35% | | | | 1.41% | | | | 1.43% | |
Ratios of net investment income (loss) to average net assets | | | 1.26% | | | | 1.37% | | | | 1.46% | | | | 1.27% | | | | 1.62% | |
Portfolio turnover rate | | | 47.6% | | | | 63.8% | | | | 44.1% | | | | 55.9% | | | | 55.1% | |
| (a) | Net investment income allocated based on average shares method. |
| (b) | Total return measures net investment income and capital gain or loss from portfolio investments assuming reinvestment of dividends and capital gains distributions. |
Report of Independent Registered Public Accounting Firm
To the Board of Trustees and Shareholders of Calamos Advisors Trust
We have audited the accompanying statement of assets and liabilities, including the schedule of investments, of Calamos Growth and Income Portfolio, the sole portfolio constituting the Calamos Advisors Trust (the “Trust”), as of December 31, 2014, and the related statement of operations for the year then ended, the statements of changes in net assets for each of the two years in the period then ended, and the financial highlights for each of the five years in the period then ended. These financial statements and financial highlights are the responsibility of the Trust’s management. Our responsibility is to express an opinion on these financial statements and financial highlights based on our audits.
We conducted our audits in accordance with the standards of the Public Company Accounting Oversight Board (United States). Those standards require that we plan and perform the audit to obtain reasonable assurance about whether the financial statements and financial highlights are free of material misstatement. The Trust is not required to have, nor were we engaged to perform, an audit of its internal control over financial reporting. Our audits included consideration of internal control over financial reporting as a basis for designing audit procedures that are appropriate in the circumstances, but not for the purpose of expressing an opinion on the effectiveness of the Trust’s internal control over financial reporting. Accordingly, we express no such opinion. An audit also includes examining, on a test basis, evidence supporting the amounts and disclosures in the financial statements, assessing the accounting principles used and significant estimates made by management, as well as evaluating the overall financial statement presentation. Our procedures included confirmation of securities owned as of December 31, 2014, by correspondence with the custodian and brokers; when replies were not received from brokers, we performed other auditing procedures. We believe that our audits provide a reasonable basis for our opinion.
In our opinion, such financial statements and financial highlights referred to above present fairly, in all material respects, the financial position of Calamos Growth and Income Portfolio of the Calamos Advisors Trust as of December 31, 2014, the results of its operations for the year then ended, the changes in its net assets for each of the two years in the period then ended, and the financial highlights for each of the five years in the period then ended, in conformity with accounting principles generally accepted in the United States of America.

Chicago, Illinois
February 5, 2015
| | | | |
| 26 | | CALAMOS GROWTH AND INCOME PORTFOLIO ANNUAL REPORT | | |
Tax Information (Unaudited)
We are providing this information as required by the Internal Revenue Code (Code). The amounts shown may differ from those elsewhere in this report due to differences between tax and financial reporting requirements. In February 2015, shareholders received Form 1099-DIV which included their share of qualified dividends and capital gains distributed during the calendar year 2014. Shareholders are advised to check with their tax advisors for information on the treatment of these amounts on their individual income tax returns.
Under Section 852(b)(3)(C) of the Code, the Portfolio hereby designates $2,582,803 as capital gain dividends for the fiscal year ended December 31, 2014.
Under Section 854(b)(2) of the Code, the Portfolio hereby designates $273,185, or the maximum amount allowable under the Code, as qualified dividends for the fiscal year ended December 31, 2014.
Under Section 854(b)(2) of the Code, the Portfolio hereby designates 53.82% of the ordinary income dividends as income qualifying for the dividends received deduction for the fiscal year ended December 31, 2014.
Trustees and Officers (Unaudited)
The management of the Trust, including general supervision of the duties performed for the Trust under the investment management agreement between the Trust and Calamos Advisors, is the responsibility of its board of trustees. Each trustee elected will hold office for the terms noted below or until such trustee’s earlier resignation, death or removal; however, each trustee who is not an interested person of the Trust shall retire as a trustee at the end of the calendar year in which the trustee attains the age of 75 years.
The following table sets forth each trustee’s name, age at December 31, 2014, position(s) with the Trust, number of portfolios in the Calamos Fund Complex overseen, principal occupation(s) during the past five years and other directorships held, and date first elected or appointed.
| | | | | | |
| NAME AND AGE | | POSITION(S) WITH FUND | | PORTFOLIOS IN FUND COMPLEX^ OVERSEEN | | PRINCIPAL OCCUPATION(S) DURING THE PAST 5 YEARS AND OTHER DIRECTORSHIPS |
| Trustees who are interested persons of the Fund: | | |
| | | | | | |
| John P. Calamos, Sr., 74* | | Trustee and President (since 1988) | | 27 | | Chairman, CEO, and Global Co-Chief Investment Officer, Calamos Asset Management, Inc. (“CAM”), Calamos Investments LLC (“CILLC”), Calamos Advisors LLC and its predecessor (“Calamos Advisors”) and Calamos Wealth Management LLC (“CWM”), and previously Chief Executive Officer, Calamos Financial Services LLC and its predecessor (“CFS”) (until 2013); Director, CAM |
| | | | | | |
| Trustees who are not interested persons of the Fund: | | |
| | | | | | |
| Weston W. Marsh, 64 | | Trustee (since 2002) | | 27 | | Of Counsel and, until December 31, 2005, Partner, Freeborn & Peters LLP (law firm) |
| | | | | | |
| John E. Neal, 64 | | Trustee (since 2001) | | 27 | | Private investor; Director, Equity Residential Trust (publicly-owned REIT) and Creation Investment (private international microfinance company); Partner, Linden LLC (health care private equity) |
| | | | | | |
| William R. Rybak, 63 | | Trustee (since 2002) | | 27 | | Private investor; Director, Christian Brothers Investment Services Inc. (since February 2010); Director, Private Bancorp (since December 2003); formerly Executive Vice President and Chief Financial Officer, Van Kampen Investments, Inc. and subsidiaries (investment manager); Director, Howe Barnes Hoefer & Arnett (until March 2011); Trustee, JNL Series Trust, JNL Investors Series Trust and JNL Variable Fund LLC**; Trustee, Lewis University (since October 2012) |
| | | | | | |
| Stephen B. Timbers, 70 | | Trustee (since 2004); Lead Independent Trustee (since 2005) | | 27 | | Private investor |
| | | | | | |
| David D. Tripple, 70 | | Trustee (since 2006) | | 27 | | Private investor; Trustee, Century Growth Opportunities Fund (since 2010), Century Shares Trust and Century Small Cap Select Fund (since January 2004)*** |
| * | Mr. Calamos is an “interested person” of the Trust as defined in the 1940 Act because he is an officer of the Trust and an affiliate of Calamos Advisors and CFS. |
| ** | Overseeing 104 portfolios in fund complex. |
| *** | Overseeing three portfolios in fund complex. |
| ^ | The Fund Complex consists of CALAMOS Investment Trust, CALAMOS Advisors Trust, CALAMOS ETF Trust, CALAMOS Convertible Opportunities and Income Fund, CALAMOS Convertible and High Income Fund, CALAMOS Strategic Total Return Fund, CALAMOS Global Total Return Fund, CALAMOS Global Dynamic Income Fund and CALAMOS Dynamic Convertible and Income Fund. |
The address of each trustee is 2020 Calamos Court, Naperville, Illinois 60563.
| | | | |
| 28 | | CALAMOS GROWTH AND INCOME PORTFOLIO ANNUAL REPORT | | |
Trustees and Officers (Unaudited)
Officers. The preceding table gives information about John P. Calamos, Sr., who is President and CEO of the Trust. The following table sets forth each other officer’s name, age at December 31, 2014, position with the Trust and date first appointed to that position, and principal occupation(s) during the past five years. Each officer serves until his or her successor is chosen and qualified or until his or her resignation or removal by the board of trustees.
| | | | |
| NAME AND AGE | | POSITION(S) WITH FUND | | PRINCIPAL OCCUPATION(S)
DURING THE PAST 5 YEARS |
| Gary D. Black, 54 | | Vice President
(since September 2012) | | Executive Vice President, Global Co-Chief Investment Officer (since August 2012), CAM, CILLC, Calamos Advisors, and CWM; prior thereto CEO, Chief Investment Officer and Founding Member of Black Capital (2009-2012); prior thereto, CEO of Janus Capital Group (2006-2009) |
| | | | |
| Nimish S. Bhatt, 51 | | Vice President and Chief Financial Officer
(since 2007) | | Senior Vice President (since 2004), Chief Financial Officer (since May 2011), Head of Fund Administration (since November 2011), CAM, CILLC, Calamos Advisors, CWM; Director, Calamos Global Funds plc (since 2007); prior thereto Director of Operations (2004-2011) |
| | | | |
| Curtis Holloway, 47 | | Treasurer (since 2010), Prior thereto Assistant Treasurer
(2007-2010) | | Vice President, Fund Administration, (since 2013) Calamos Advisors; Vice President, Financial Operation Principal and Head of Fund Administration (since 2013), CFS; Treasurer of Calamos Investment Trust, Calamos Advisors Trust, CHI, CHY, CSQ, CGO and CHW (since June 2010); prior thereto Assistant Treasurer (2007-2010) |
| | | | |
| Robert Behan, 50 | | Vice President
(since September 2013) | | Executive Vice President, Head of Global Distribution (since April 2013), CFS; prior thereto Senior Vice President (2009-2013), Head of Global Distribution (March 2013-April 2013); prior thereto Head of US Intermediary Distribution (2010-2013); prior thereto Head of Strategic Partners Team (2010-2010); prior thereto National Accounts/Retirement Services (2009-2010); prior thereto Vice President, Director of Retirement Services (2008-2009) |
| | | | |
| J. Christopher Jackson, 63 | | Vice President and Secretary
(since 2010) | | Senior Vice President, General Counsel and Secretary, CAM, CILLC, Calamos Advisors and CFS (since 2010); Director, Calamos Global Funds plc (since 2011); Director, Calamos Arista Strategic Master Fund Ltd. and Calamos Arista Strategic Fund Ltd. (since 2013); prior thereto Director, U.S. Head of Retail Legal and Co-Global Head of Retail Legal of Deutsche Bank AG (2006-2010); |
| | | | |
| Mark J. Mickey, 63 | | Chief Compliance Officer
(since 2005) | | Chief Compliance Officer, Calamos Funds (since 2005) |
| | | | |
The address of each officer is 2020 Calamos Court, Naperville, Illinois 60563.
A description of the Calamos Proxy Voting Policies and Procedures is available free of charge upon request by calling 800.582.6959, by visiting the Calamos website at www.calamos.com, by writing Calamos at: Calamos Advisors LLC, Attn: Client Services, 2020 Calamos Court, Naperville, IL 60563. The Portfolio’s proxy voting record for the twelve month period ended June 30, 2014, is also available free of charge upon request by calling or writing Calamos Advisors LLC and by visiting the SEC website at http://www.sec.gov. The Portfolio files a complete list of its portfolio holdings with the SEC for the first and third quarters each fiscal year on Form N-Q. The Form N-Q is available free of charge, upon request, by calling or writing Calamos Advisors LLC or by visiting the SEC website. You may also review or, for a fee, copy the form at the SEC’s Public Reference Room in Washington, D.C. 1.800.SEC.0330.
CALAMOS ADVISORS TRUST
This report, including the audited financial statements contained herein, is submitted for general information for the contract owners of the Portfolio. The report is not authorized for distribution to prospective investors in the Portfolio unless it is accompanied by a currently effective prospectus of the Portfolio, and, after March 31, 2015, updated performance data for the most recently completed calendar quarter.

2020 Calamos Court
Naperville, IL 60563-2787
800.582.6959
www.calamos.com
© 2015 Calamos Investments, LLC. All Rights Reserved.
Calamos® and Calamos Investments® are registered trademarks of Calamos Investments, LLC.
KCLSAN 2146 2014
ITEM 2. CODE OF ETHICS.
(a) As of the end of the period covered by this report, the registrant has adopted a code of ethics (the “Code of Ethics”) that applies to its principal executive officer, principal financial officer, principal accounting officer or controller, or person performing similar functions.
(b) No response required.
(c) The registrant has not amended its Code of Ethics as it relates to any element of the code of ethics definition enumerated in paragraph(b) of this Item 2 during the period covered by this report.
(d) The registrant has not granted a waiver or an implicit waiver from its Code of Ethics during the period covered by this report.
(e) Not applicable.
(f) (1) The registrant’s Code of Ethics is attached as an Exhibit hereto.
ITEM 3. AUDIT COMMITTEE FINANCIAL EXPERT.
The registrant’s Board of Trustees has determined that, for the period covered by the shareholder report presented in Item 1 hereto, it has four audit committee financial experts serving on its audit committee, each of whom is an independent Trustee for purpose of this N-CSR item: John E. Neal, William R. Rybak, Stephen B. Timbers and David D. Tripple. Under applicable securities laws, a person who is determined to be an audit committee financial expert will not be deemed an “expert” for any purpose, including without limitation for the purposes of Section 11 of the Securities Act of 1933, as a result of being designated or identified as an audit committee financial expert pursuant to this Item. The designation or identification of a person as an audit committee financial expert does not impose on such person any duties, obligations, or liabilities that are greater than the duties, obligations and liabilities imposed on such person as a member of audit committee and board of directors in the absence of such designation or identification. The designation or identification of a person as an audit committee financial expert pursuant to this Item does not affect the duties, obligations, or liabilities of any other member of the audit committee or board of directors.
ITEM 4. PRINCIPAL ACCOUNTANT FEES AND SERVICES.
| | | | | | | | |
Fiscal Years Ended | | 12/31/2013 | | | 12/31/2014 | |
Audit Fees(a) | | $ | 30,300 | | | $ | 30,300 | |
Audit-Related Fees(b) | | $ | 25,900 | | | $ | 25,600 | |
Tax Fees(c) | | $ | — | | | $ | — | |
All Other Fees(d) | | $ | — | | | $ | — | |
| | | | | | | | |
Total | | $ | 56,200 | | | $ | 55,900 | |
| | | | | | | | |
| (a) | Audit fees are the aggregate fees billed in each of the last two fiscal years for professional services rendered by the principal accountant to the registrant for the audit of the registrant’s annual financial statements or services that are normally provided by the accountant in connection with statutory and regulatory filings or engagements for those fiscal years. |
| (b) | Audit-related fees are the aggregate fees billed in each of the last two fiscal years for assurance and related services rendered by the principal accountant to the registrant that are reasonably related to the performance of the audit of the registrant’s financial statements and are not reported under paragraph (a) of this Item 4. |
| (c) | Tax fees are the aggregate fees billed in each of the last two fiscal years for professional services rendered by the principal accountant to the registrant for tax compliance, tax advice and tax planning. |
| (d) | All other fees are the aggregate fees billed in each of the last two fiscal years for products and services provided by the principal accountant to the registrant, other than the services reported in paragraph (a)-(c) of this Item 4. |
| (e) | (1) Registrant’s audit committee meets with the principal accountants and management to review and pre-approve all audit services to be provided by the principal accountants. |
The audit committee shall pre-approve all non-audit services to be provided by the principal accountants to the registrant, including the fees and other compensation to be paid to the principal accountants; provided that the pre-approval of non-audit services is waived if (i) the services were not recognized by management at the time of the engagement as non-audit services, (ii) the aggregate fees for all non-audit services provided to the registrant are less than 5% of the total fees paid by the registrant to its principal accountants during the fiscal year in which the non-audit services are provided, and (iii) such services are promptly brought to the attention of the audit committee by management and the audit committee approves them prior to the completion of the audit.
The audit committee shall pre-approve all non-audit services to be provided by the principal accountants to the investment adviser or any entity controlling, controlled by or under common control with the adviser that provides ongoing services to the registrant if the engagement relates directly to the operations or financial reporting of the registrant, including the fees and other compensation to be paid to the principal accountants; provided that pre-approval of non-audit services to the adviser or an affiliate of the adviser is not required if (i) the services were not recognized by management at the time of the engagement as non-audit services, (ii) the aggregate fees for all non-audit services provided to the adviser and all entities controlling, controlled by or under common control with the adviser are less than 5% of the total fees for non-audit services requiring pre-approval under paragraph (e)(1) of this Item 4 paid by the registrant, the adviser or its affiliates to the registrant’s principal accountants during the fiscal year in which the non-audit services are provided, and (iii) such services are promptly brought to the attention of the audit committee by management and the audit committee approves them prior to the completion of the audit.
(e) (2) No percentage of the principal accountant’s fees or services described in each of paragraphs (b)–(d) of this Item were approved pursuant to the waiver provision paragraph (c)(7)(i)(C) of Rule 2-01 of Regulation S-X.
(f) No disclosures are required by this Item 4(f).
(g) The following table presents the aggregate non-audit fees billed in each of the last two fiscal years for services rendered by the principal accountant to the registrant and the aggregate non-audit fees billed in each of the last two fiscal years for services rendered by the principal accountant to the investment advisor or any entity controlling, controlled by or under common control of the adviser.
| | | | | | | | |
Fiscal Years Ended | | 12/31/2013 | | | 12/31/2014 | |
Registrant | | $ | — | | | $ | — | |
Investment Adviser | | $ | — | | | $ | — | |
| (h) | No disclosures are required by this Item 4(h). |
ITEM 5. AUDIT COMMITTEE OF LISTED REGISTRANTS.
Not applicable.
ITEM 6. SCHEDULE OF INVESTMENTS
Included in the Report to Shareholders in Item 1.
ITEM 7. DISCLOSURE OF PROXY VOTING POLICIES AND PROCEDURES FOR CLOSED-END MANAGEMENT INVESTMENT COMPANIES.
Not applicable.
ITEM 8. PORTFOLIO MANAGERS OF CLOSED-END MANAGEMENT INVESTMENT COMPANIES.
Not applicable.
ITEM 9. PURCHASES OF EQUITY SECURITIES BY CLOSED-END MANAGEMENT INVESTMENT COMPANY AND AFFILIATED PURCHASERS.
Not applicable.
ITEM 10. SUBMISSION OF MATTERS TO A VOTE OF SECURITY HOLDERS.
No material changes.
ITEM 11. CONTROLS AND PROCEDURES.
a) The registrant’s principal executive officer and principal financial officer have evaluated the registrant’s disclosure controls and procedures within 90 days of this filing and have concluded that the registrant’s disclosure controls and procedures were effective, as of that date, in ensuring that information required to be disclosed by the registrant in this Form N-CSR was recorded, processed, summarized, and reported timely.
b) There were no changes in the registrant’s internal controls over financial reporting (as defined in Rule 30a-3(d) under the Investment Company Act of 1940) that occurred during the second fiscal quarter of the period covered by this report that has materially affected, or is reasonably likely to materially affect, the registrant’s internal control over financial reporting.
ITEM 12. EXHIBITS.
(a)(1) Code of Ethics
(a)(2)(i) Certification of Principal Executive Officer.
(a)(2)(ii) Certification of Principal Financial Officer.
SIGNATURES
Pursuant to the requirements of the Securities Exchange Act of 1934 and the Investment Company Act of 1940, the registrant has duly caused this report to be signed on its behalf by the undersigned, thereunto duly authorized.
| | |
| Calamos Advisors Trust |
| |
| By: | | /s/ John P. Calamos, Sr. |
| Name: | | John P. Calamos, Sr. |
| Title: | | Principal Executive Officer |
| Date: | | February 5, 2015 |
| |
| By: | | /s/ Nimish S. Bhatt |
| Name: | | Nimish S. Bhatt |
| Title: | | Principal Financial Officer |
| Date: | | February 5, 2015 |
Pursuant to the requirements of the Securities Exchange Act of 1934 and the Investment Company Act of 1940, this report has been signed by the following persons on behalf of the registrant and in the capacities and on the dates indicated.
| | |
| Calamos Advisors Trust |
| |
| By: | | /s/ John P. Calamos, Sr. |
| Name: | | John P. Calamos, Sr. |
| Title: | | Principal Executive Officer |
| Date: | | February 5, 2015 |
| |
| By: | | /s/ Nimish S. Bhatt |
| Name: | | Nimish S. Bhatt |
| Title: | | Principal Financial Officer |
| Date: | | February 5, 2015 |