Exhibit 99.2


SUPPLEMENTAL FINANCIAL INFORMATION
As of June 30, 2024
| FORWARD-LOOKING STATEMENTS |  |
This presentation contains “forward-looking statements” within the meaning of the federal securities laws that involve risks and uncertainties, many of which are beyond our control. Our actual results could differ materially and adversely from those anticipated in such forward-looking statements as a result of certain factors, including those set forth in the Quarterly Report on Form 10-Q. Forward-looking statements relate to matters such as our industry, business strategy, goals and expectations concerning our market position, future operations, margins, profitability, capital expenditures, financial condition, liquidity, capital resources, cash flows, dividends, results of operations and other financial and operating information. When used in this presentation, the words “will,” “may,” “believe,” “anticipate,” “intend,” “estimate,” “expect,” “should,” “project,” “plan,” and similar expressions are intended to identify forward-looking statements, although not all forward-looking statements contain such identifying words.
The forward-looking statements contained in this presentation are based on historical performance and management’s current plans, estimates and expectations in light of information currently available to it and are subject to uncertainty and changes in circumstances. There can be no assurance that future developments affecting us will be those that we have anticipated. Actual results may differ materially from these expectations due to the factors, risks and uncertainties described in the Company’s Annual Report on Form 10-K for the fiscal year ended December 31, 2023, as amended to date (“Annual Report”) and the Company’s Quarterly Report on Form 10-Q filed with the SEC on the date hereof (“Quarterly Report”), changes in global, regional or local political, economic, business, competitive, market, regulatory and other factors described in the “Risk Factors” section of the Annual Report and the Quarterly Report, many of which are beyond our control. Should one or more of these risks or uncertainties materialize or should any of our assumptions prove to be incorrect, our actual results may vary in material respects from what we may have expressed or implied by these forward-looking statements. We caution that you should not place undue reliance on any of our forward-looking statements. Any forward-looking statement made by us in this presentation speaks only as of the date on which we make it. Factors or events that could cause our actual results to differ may emerge from time to time, and it is not possible for us to predict all of them. We undertake no obligation to publicly update any forward-looking statement, whether as a result of new information, future developments or otherwise, except as may be required by applicable securities laws.
| COMPANY OVERVIEW | |
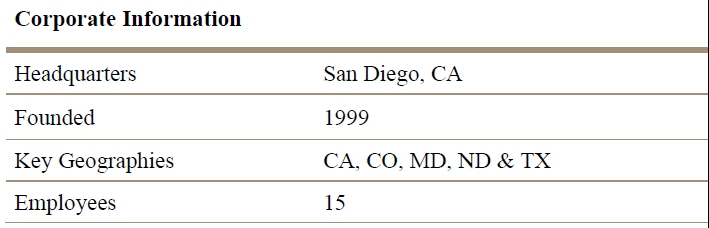
| ● | Presidio Property Trust, Inc. (“Presidio” or the “Company”) was founded in 1999 as NetREIT | | |
| | | | |
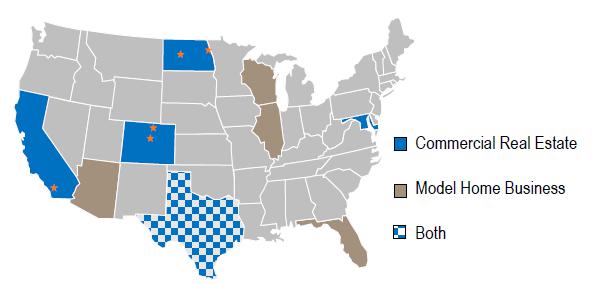
| ● | Presidio is an internally managed real estate company focused on commercial real estate opportunities in often overlooked and regionally dominant markets | | 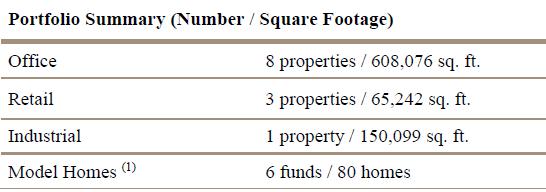 |
| | | |
| ● | The Company acquires, owns, and manages office and industrial real estate assets in markets with strong demographic and economic drivers with attractive going-in cap rates | |
| | | | |
| ● | Presidio’s commercial portfolio currently includes 12 commercial properties with a book value of approximately $92.6 million | | |
| | | | |
| ● | In addition to its commercial real estate holdings, Presidio generates fees and rental income from affiliated entities, which manage and/or own a portfolio of model homes (1) | |  |
| | (1) | The Company holds partial ownership interests in several entities which own model home properties |
| | | |
| | (2) | Includes book value of model homes |
| COMMERCIAL PORTFOLIO | |
| ($ in000’s) Property Location | | Sq., Ft. | | | Date Acquired | | | Year Property Constructed | | | Purchase Price (1) | | | Occupancy | | | Percent Ownership | | | Mortgage On property | |
| Office/Industrial Properties: | | | | | | | | | | | | | | | | | | | | | | | | | | | | |
| Genesis Plaza, San Diego, CA (2) | | | 57,807 | | | | 08/10 | | | | 1989 | | | $ | 10,000 | | | | 100.0 | % | | | 76.4 | % | | $ | 5,876 | |
| Dakota Center, Fargo, ND (3) | | | 119,554 | | | | 05/11 | | | | 1982 | | | | 9,575 | | | | 46.1 | % | | | 100.0 | % | | | 9,091 | |
| Grand Pacific Center, Bismarck, ND (4) | | | 94,943 | | | | 03/14 | | | | 1976 | | | | 5,350 | | | | 89.7 | % | | | 100.0 | % | | | 6,341 | |
| Arapahoe Center, Colorado Springs, CO | | | 79,023 | | | | 12/14 | | | | 2000 | | | | 11,850 | | | | 100.0 | % | | | 100.0 | % | | | 7,336 | |
| West Fargo Industrial, West Fargo, ND | | | 150,099 | | | | 08/15 | | | | 1998/2005 | | | | 7,900 | | | | 100.0 | % | | | 100.0 | % | | | 5,750 | |
| 300 N.P., West Fargo, ND | | | 34,517 | | | | 08/15 | | | | 1922 | | | | 3,850 | | | | 66.4 | % | | | 100.0 | % | | | — | |
| One Park Centre, Westminster CO | | | 69,174 | | | | 08/15 | | | | 1983 | | | | 9,150 | | | | 81.1 | % | | | 100.0 | % | | | 5,982 | |
| Shea Center II, Highlands Ranch, CO | | | 121,306 | | | | 12/15 | | | | 2000 | | | | 25,325 | | | | 69.0 | % | | | 100.0 | % | | | 16,808 | |
| Baltimore, Baltimore, MD | | | 31,752 | | | | 12/21 | | | | 2006 | | | | 8,892 | | | | 100.0 | % | | | 100.0 | % | | | 5,670 | |
| Total Office/Industrial Properties | | | 758,175 | | | | | | | | | | | $ | 91,892 | | | | 82.0 | % | | | | | | $ | 62,854 | |
| | | | | | | | | | | | | | | | | | | | | | | | | | | | | |
| Retail Properties: | | | | | | | | | | | | | | | | | | | | | | | | | | | | |
| Union Town Center, Colorado Springs, CO | | | 44,042 | | | | 12/14 | | | | 2003 | | | | 11,212 | | | | 88.1 | % | | | 100.0 | % | | | 7,791 | |
| Research Parkway, Colorado Springs, CO | | | 10,700 | | | | 08/15 | | | | 2003 | | | | 2,850 | | | | 100.0 | % | | | 100.0 | % | | | 1,558 | |
| Mandolin, Houston, TX (5) | | | 10,500 | | | | 08/21 | | | | 2021 | | | | 4,892 | | | | 100.0 | % | | | 61.3 | % | | | 3,541 | |
| Total Retail Properties | | | 65,242 | | | | | | | | | | | $ | 18,954 | | | | 90.1 | % | | | | | | $ | 12,890 | |
| | | | | | | | | | | | | | | | | | | | | | | | | | | | | |
| | | | 823,417 | | | | | | | | | | | | 110,846 | | | | 82.6 | % | | | | | | $ | 75,744 | |
| (1) | Prior to January 1, 2009, “Purchase Price” includes our acquisition related costs and expenses for the purchase of the property. After January 1, 2009, acquisition related costs and expenses were expensed when incurred. |
| (2) | Genesis Plaza is owned by two tenants-in-common, each of which own 57% and 43%, respectively, and we beneficially own an aggregate of 76.4%, based on our ownership percentages of each tenant-in-common. |
| (3) | The loan on the Dakota Center matured on July 6, 2024. Management has been in negotiations with the special servicer of the loan in modifying and/or extending the loan or possibly selling the building. As of August 12, 2024, the Company and the lender have not yet agreed to the final outcome. The lender is expected to visit the property at the end of August. |
| (4) | Grand Pacific Center, Bismarck, ND, signed a major lease with KLJ Engineering on December 7, 2022 for approximately 33,296 usable square feet, a term of 122 months, and starting annualized rent of $532,736. KLJ Engineering moved into the building during December 2023, and rent commenced on February 28, 2024. |
| (5) | Mandolin is owned by NetREIT Palm Self-Storage LP, through its wholly owned subsidiary NetREIT Highland LLC, and the Company is the sole general partner and owns 61.3% of NetREIT Palm Self-Storage LP. |
| MODEL HOMES PORTFOLIO | |
| Geographic Region | | No. of Properties | | | Aggregate Square Feet | | | Approximate % of Square Feet | | | Current Base Annual Rent | | | Approximate of Aggregate % Annual Rent | |
| Southeast | | | 4 | | | | 9,875 | | | | 4.1 | % | | $ | 170,256 | | | | 5.1 | % |
| Southwest | | | 76 | | | | 231,434 | | | | 95.9 | % | | | 3,181,860 | | | | 94.9 | % |
| Total | | | 80 | | | | 241,309 | | | | 100.0 | % | | $ | 3,352,116 | | | | 100.0 | % |
| CONSOLIDATED BALANCE SHEET | |
Presidio Property Trust, Inc. and Subsidiaries
Consolidated Balance Sheets
| | | June 30, | | | December 31, | |
| | | 2024 | | | 2023 | |
| | | | (Unaudited) | | | | | |
| ASSETS | | | | | | | | |
| Real estate assets and lease intangibles: | | | | | | | | |
| Land | | $ | 19,409,817 | | | $ | 21,660,644 | |
| Buildings and improvements | | | 126,439,142 | | | | 133,829,416 | |
| Tenant improvements | | | 18,823,656 | | | | 17,820,948 | |
| Lease intangibles | | | 3,776,654 | | | | 4,110,139 | |
| Real estate assets and lease intangibles held for investment, cost | | | 168,449,269 | | | | 177,421,147 | |
| Accumulated depreciation and amortization | | | (39,951,401 | ) | | | (38,725,356 | ) |
| Real estate assets and lease intangibles held for investment, net | | | 128,497,868 | | | | 138,695,791 | |
| Real estate assets held for sale, net | | | 2,394,363 | | | | 5,459,993 | |
| Real estate assets, net | | | 130,892,231 | | | | 144,155,784 | |
| Other assets: | | | | | | | | |
| Cash, cash equivalents and restricted cash | | | 8,534,881 | | | | 6,510,428 | |
| Deferred leasing costs, net | | | 1,565,169 | | | | 1,657,055 | |
| Goodwill | | | 1,574,000 | | | | 1,574,000 | |
| Investment in Conduit Pharmaceuticals marketable securities (see Notes 2 & 9) | | | 4,413,989 | | | | 18,318,521 | |
| Deferred tax asset | | | 346,762 | | | | 346,762 | |
| Other assets, net (see Note 6) | | | 3,211,251 | | | | 3,400,088 | |
| Total other assets | | | 19,646,052 | | | | 31,806,854 | |
| TOTAL ASSETS | | $ | 150,538,283 | | | $ | 175,962,638 | |
| LIABILITIES AND EQUITY | | | | | | | | |
| Liabilities: | | | | | | | | |
| Mortgage notes payable, net | | $ | 99,489,045 | | | $ | 103,685,444 | |
| Mortgage notes payable related to properties held for sale, net | | | 1,636,341 | | | | 4,027,829 | |
| Mortgage notes payable, total net | | | 101,125,386 | | | | 107,713,273 | |
| Accounts payable and accrued liabilities | | | 3,501,779 | | | | 4,770,845 | |
| Accrued real estate taxes | | | 1,097,854 | | | | 1,953,087 | |
| Dividends payable | | | 195,310 | | | | 174,011 | |
| Lease liability, net | | | - | | | | 16,086 | |
| Below-market leases, net | | | 10,779 | | | | 13,266 | |
| Total liabilities | | | 105,931,108 | | | | 114,640,568 | |
| Equity: | | | | | | | | |
| Series D Preferred Stock, $0.01 par value per share; 1,000,000 shares authorized; 1,000,000 shares issued and outstanding (liquidation preference $25.00 per share) as of June 30, 2024 and 890,946 shares issued and outstanding as of December 31, 2023 | | | 10,000 | | | | 8,909 | |
| Series A Common Stock, $0.01 par value per share, 100,000,000 shares authorized; 12,418,693 shares and 12,265,061 shares were issued and outstanding at June 30, 2024 and December 31, 2023, respectively | | | 124,187 | | | | 122,651 | |
| Additional paid-in capital | | | 184,402,052 | | | | 182,331,408 | |
| Dividends and accumulated losses | | | (149,663,851 | ) | | | (131,508,785 | ) |
| Total stockholders’ equity before noncontrolling interest | | | 34,872,388 | | | | 50,954,183 | |
| Noncontrolling interest | | | 9,734,787 | | | | 10,367,887 | |
| Total equity | | | 44,607,175 | | | | 61,322,070 | |
| TOTAL LIABILITIES AND EQUITY | | $ | 150,538,283 | | | $ | 175,962,638 | |
| CONSOLIDATED STATEMENT OF OPERATIONS | |
Presidio Property Trust, Inc. and Subsidiaries
Consolidated Statements of Operations
| | | For the Three Months Ended June 30, | | | For the Six Months Ended June 30, | |
| | | 2024 | | | 2023 | | | 2024 | | | 2023 | |
| Revenues: | | | | | | | | | | | | |
| Rental income | | $ | 4,262,942 | | | $ | 4,329,588 | | | $ | 8,682,049 | | | $ | 8,271,641 | |
| Fees and other income | | | 323,599 | | | | 214,284 | | | | 694,554 | | | | 393,723 | |
| Total revenue | | | 4,586,541 | | | | 4,543,872 | | | | 9,376,603 | | | | 8,665,364 | |
| Costs and expenses: | | | | | | | | | | | | | | | | |
| Rental operating costs | | | 1,492,495 | | | | 1,399,159 | | | | 3,056,072 | | | | 2,974,149 | |
| General and administrative | | | 2,202,916 | | | | 1,813,184 | | | | 4,287,366 | | | | 3,777,804 | |
| Depreciation and amortization | | | 1,351,370 | | | | 1,368,829 | | | | 2,702,388 | | | | 2,702,403 | |
| Impairment of real estate assets | | | 101,245 | | | | — | | | | 196,793 | | | | — | |
| Total costs and expenses | | | 5,148,026 | | | | 4,581,172 | | | | 10,242,619 | | | | 9,454,356 | |
| Other income (expense): | | | | | | | | | | | | | | | | |
| Interest expense - mortgage notes | | | (1,525,845 | ) | | | (1,336,415 | ) | | | (3,041,051 | ) | | | (2,204,182 | ) |
| Interest and other income, net | | | 5,206 | | | | 398,085 | | | | 9,852 | | | | 1,140,201 | |
| Gain on sales of real estate, net | | | 811,903 | | | | 1,119,952 | | | | 2,829,998 | | | | 1,537,289 | |
| Net change in Conduit Pharmaceuticals marketable securities (see footnote 9) | | | (10,027,433 | ) | | | — | | | | (13,888,667 | ) | | | — | |
| Income tax expense | | | (81,021 | ) | | | (349,074 | ) | | | (160,586 | ) | | | (497,527 | ) |
| Total other (expense) income, net | | | (10,817,190 | ) | | | (167,452 | ) | | | (14,250,454 | ) | | | (24,219 | ) |
| Net loss | | | (11,378,675 | ) | | | (204,752 | ) | | | (15,116,470 | ) | | | (813,211 | ) |
| Less: Income attributable to noncontrolling interests | | | (469,365 | ) | | | (1,094,852 | ) | | | (1,973,233 | ) | | | (1,481,933 | ) |
| Net loss attributable to Presidio Property Trust, Inc. stockholders | | $ | (11,848,040 | ) | | $ | (1,299,604 | ) | | $ | (17,089,703 | ) | | $ | (2,295,144 | ) |
| Less: Preferred Stock Series D dividends | | | (543,331 | ) | | | (532,285 | ) | | | (1,065,363 | ) | | | (1,067,733 | ) |
| Net loss attributable to Presidio Property Trust, Inc. common stockholders | | $ | (12,391,371 | ) | | $ | (1,831,889 | ) | | $ | (18,155,066 | ) | | $ | (3,362,877 | ) |
| | | | | | | | | | | | | | | | | |
| Net loss per share attributable to Presidio Property Trust, Inc. common stockholders: | | | | | | | | | | | | | | | | |
| Basic & Diluted | | $ | (1.00 | ) | | $ | (0.15 | ) | | $ | (1.47 | ) | | $ | (0.28 | ) |
| | | | | | | | | | | | | | | | | |
| Weighted average number of common shares outstanding - basic & dilutive | | | 12,428,794 | | | | 11,839,359 | | | | 12,360,992 | | | | 11,837,020 | |
| CONSOLIDATED STATEMENT OF CASH FLOWS | |
Presidio Property Trust, Inc. and Subsidiaries
Consolidated Statements of Cash Flows
| | | For the Six Months Ended June 30, | |
| | | 2024 | | | 2023 | |
| Cash flows from operating activities: | | | | | | | | |
| Net loss | | $ | (15,116,470 | ) | | $ | (813,211 | ) |
| Adjustments to reconcile net loss to net cash used in operating activities: | | | | | | | | |
| Depreciation and amortization | | | 2,702,388 | | | | 2,702,403 | |
| Stock compensation | | | 885,029 | | | | 540,501 | |
| Bad debt expense | | | — | | | | 32,729 | |
| Gain on sale of real estate assets, net | | | (2,829,998 | ) | | | (1,537,289 | ) |
| Net change in Conduit Pharmaceuticals fair value marketable securities | | | 13,888,667 | | | | — | |
| Net change in fair value marketable securities | | | 560 | | | | (190,327 | ) |
| Net change in fair value SPAC Trust Account | | | — | | | | (939,522 | ) |
| Impairment of real estate assets | | | 196,793 | | | | — | |
| Amortization of financing costs | | | 214,071 | | | | 187,303 | |
| Amortization of below-market leases | | | (2,487 | ) | | | (2,487 | ) |
| Straight-line rent adjustment | | | (95,603 | ) | | | (240,007 | ) |
| Changes in operating assets and liabilities: | | | | | | | | |
| Other assets | | | 588,867 | | | | (399,159 | ) |
| Accounts payable and accrued liabilities | | | (1,440,070 | ) | | | 239,297 | |
| Accounts payable and accrued liabilities for the SPAC | | | — | | | | (281,723 | ) |
| Accrued real estate taxes | | | (855,233 | ) | | | (902,217 | ) |
| Net cash used in operating activities | | | (1,863,486 | ) | | | (1,603,709 | ) |
| Cash flows from investing activities: | | | | | | | | |
| Real estate acquisitions | | | (5,740,918 | ) | | | (12,932,128 | ) |
| Additions to buildings and tenant improvements | | | (1,213,936 | ) | | | (1,001,836 | ) |
| Investment in marketable securities | | | — | | | | (1,826,458 | ) |
| Proceeds from sale of marketable securities | | | 60,467 | | | | 1,951,095 | |
| Investment of SPAC IPO proceeds into Trust Account | | | — | | | | (389,942 | ) |
| Withdrawals from Trust Account for SPAC taxes | | | — | | | | 792,480 | |
| Withdrawals from Trust Account for Redemption of SPAC Shares | | | — | | | | 114,068,280 | |
| Deferred leasing costs | | | 3,872 | | | | 3,872 | |
| Proceeds from sales of real estate, net | | | 20,058,923 | | | | 4,590,187 | |
| Net cash provided by investing activities | | | 13,168,408 | | | | 105,255,550 | |
| Cash flows from financing activities: | | | | | | | | |
| Proceeds from mortgage notes payable, net of issuance costs | | | 10,663,089 | | | | 12,848,849 | |
| Repayment of mortgage notes payable | | | (17,110,515 | ) | | | (6,417,278 | ) |
| Payment of deferred offering costs | | | (349,589 | ) | | | — | |
| Distributions to noncontrolling interests, net | | | (2,606,333 | ) | | | (1,961,310 | ) |
| Redemption of SPAC shares | | | — | | | | (114,068,280 | ) |
| Issuance of Series D Preferred Stock, net of offering costs | | | 1,195,855 | | | | — | |
| Repurchase of Series A Common Stock, at cost | | | (7,613 | ) | | | — | |
| Repurchase of Series D Preferred Stock, at cost | | | — | | | | (211,872 | ) |
| Dividends paid to Series D Preferred Stockholders | | | (1,065,363 | ) | | | (1,067,733 | ) |
| Dividends paid to Series A Common Stockholders | | | — | | | | (590,151 | ) |
| Net cash used in financing activities | | | (9,280,469 | ) | | | (111,467,775 | ) |
| Net change in cash, cash equivalents and restricted cash | | | 2,024,453 | | | | (7,815,934 | ) |
| Cash, cash equivalents and restricted cash - beginning of period | | | 6,510,428 | | | | 16,516,725 | |
| Cash, cash equivalents and restricted cash - end of period | | $ | 8,534,881 | | | $ | 8,700,791 | |
| Supplemental disclosure of cash flow information: | | | | | | | | |
| Interest paid-mortgage notes payable | | $ | 2,810,393 | | | $ | 2,351,642 | |
| Non-cash investing activities: | | | | | | | | |
| Private warrants from Conduit Pharmaceuticals | | $ | 156,600 | | | $ | — | |
| Non-cash financing activities: | | | | | | | | |
| Accrued excise tax on January 24, 2023 SPAC redemptions | | $ | — | | | $ | 1,140,683 | |
| Dividends payable - Preferred Stock Series D | | $ | 195,310 | | | $ | 177,145 | |
| EBITDAre RECONCILIATION | |
| | | For the Three Months Ended June 30, | | | For the Six Months Ended June, | |
| | | 2024 | | | 2023 | | | 2024 | | | 2023 | |
| Net (loss) income attributable to Presidio Property Trust, Inc. common stockholders | | $ | (12,391,371 | ) | | $ | (1,831,889 | ) | | $ | (18,155,066 | ) | | $ | (3,362,877 | ) |
| Adjustments | | | | | | | | | | | | | | | | |
| Interest Expense | | | 1,525,845 | | | | 1,336,415 | | | | 3,041,051 | | | | 2,204,182 | |
| Depreciation and Amortization | | | 1,350,126 | | | | 1,367,585 | | | | 2,699,901 | | | | 2,699,916 | |
| Asset Impairment | | | 101,245 | | | | — | | | | 196,793 | | | | — | |
| Net loss (gain) on sale of real estate | | | (811,903 | ) | | | (1,119,952 | ) | | | (2,829,998 | ) | | | (1,537,289 | ) |
| Net change in Conduit marketable securities | | | 10,027,433 | | | | — | | | | 13,888,667 | | | | — | |
| Income Taxes | | | 81,021 | | | | 349,074 | | | | 160,586 | | | | 497,527 | |
| | | | | | | | | | | | | | | | | |
| EBITDAre | | $ | (117,604 | ) | | $ | 101,233 | | | $ | (998,067 | ) | | $ | 501,459 | |
| FFO AND CORE FFO RECONCILIATION | |
| | | For the Three Months Ended June 30, | | | For the Six Months Ended June, | |
| | | 2024 | | | 2023 | | | 2024 | | | 2023 | |
| Net (loss) income attributable to Presidio Property Trust, Inc. common stockholders | | $ | (12,391,371 | ) | | $ | (1,831,889 | ) | | $ | (18,155,066 | ) | | $ | (3,362,877 | ) |
| Adjustments: | | | | | | | | | | | | | | | | |
| Income attributable to noncontrolling interests | | | 469,365 | | | | 1,094,852 | | | | 1,973,233 | | | | 1,481,933 | |
| Depreciation and amortization | | | 1,351,370 | | | | 1,368,829 | | | | 2,702,388 | | | | 2,702,403 | |
| Amortization of above and below market leases, net | | | (1,244 | ) | | | (1,244 | ) | | | (2,487 | ) | | | (2,487 | ) |
| Impairment of real estate assets | | | 101,245 | | | | — | | | | 196,793 | | | | — | |
| Net change in Conduit marketable securities | | | 10,027,433 | | | | — | | | | 13,888,667 | | | | — | |
| Loss (gain) on sale of real estate assets, net | | | (811,903 | ) | | | (1,119,952 | ) | | | (2,829,998 | ) | | | (1,537,289 | ) |
| FFO | | $ | (1,255,105 | ) | | $ | (489,404 | ) | | $ | (2,226,471 | ) | | $ | (718,317 | ) |
| Restricted stock compensation | | | 343,107 | | | | 260,845 | | | | 885,029 | | | | 540,501 | |
| Cost associated with Zuma Capital Management | | | 469,552 | | | | — | | | | 565,534 | | | | — | |
| Core FFO | | $ | (442,445 | ) | | $ | (228,558 | ) | | $ | (775,908 | ) | | $ | (177,816 | ) |
| | | | | | | | | | | | | | | | | |
| Weighted average number of common shares outstanding - basic and diluted | | | 12,428,794 | | | | 11,839,359 | | | | 12,360,992 | | | | 11,837,020 | |
| | | | | | | | | | | | | | | | | |
| Core FFO / Wgt Avg Share | | $ | (0.036 | ) | | $ | (0.019 | ) | | $ | (0.063 | ) | | $ | (0.015 | ) |
| | | | | | | | | | | | | | | | | |
| Quarterly Dividends / Share | | $ | — | | | $ | 0.022 | | | $ | — | | | $ | 0.023 | |
| SEGMENT DATA | |
| | | June 30, | | | December 31, | |
| Assets by Reportable Segment: | | 2024 | | | 2023 | |
| Office/Industrial Properties: | | | | | | | | |
| Land, buildings and improvements, net (1) | | $ | 76,768,551 | | | $ | 77,472,724 | |
| Total assets (2) | | $ | 77,076,636 | | | $ | 78,140,372 | |
| Model Home Properties: | | | | | | | | |
| Land, buildings and improvements, net (1) | | $ | 38,253,777 | | | $ | 50,790,147 | |
| Total assets (2) | | $ | 39,538,041 | | | $ | 51,456,292 | |
| Retail Properties: | | | | | | | | |
| Land, buildings and improvements, net (1) | | $ | 15,863,447 | | | $ | 15,877,190 | |
| Total assets (2) | | $ | 16,541,354 | | | $ | 16,539,399 | |
| Reconciliation to Total Assets: | | | | | | | | |
| Total assets for reportable segments | | $ | 133,156,031 | | | $ | 146,136,063 | |
| Other unallocated assets: | | | | | | | | |
| Cash, cash equivalents and restricted cash | | | 2,469,278 | | | | 277,143 | |
| Other assets, net | | | 14,912,974 | | | | 29,549,432 | |
| Total Assets | | $ | 150,538,283 | | | $ | 175,962,638 | |
| (1) | Includes lease intangibles and the land purchase option related to property acquisitions. |
| | |
| (2) | Includes land, buildings and improvements, cash, cash equivalents, and restricted cash, current receivables, deferred rent receivables and deferred leasing costs and other related intangible assets, all shown on a net basis. |
| DEFINITIONS – NON-GAAP MEASUREMENTS | |
EBITDAre - EBITDAre is defined by NAREIT as earnings before interest, taxes, depreciation, and amortization, gain or loss on disposal of depreciated assets, and impairment write-offs.
Funds from Operations (“FFO”) – The Company evaluates performance based on Funds From Operations, which we refer to as FFO, as management believes that FFO represents the most accurate measure of activity and is the basis for distributions paid to equity holders. The Company defines FFO, a non-GAAP measure, as net income or loss (computed in accordance with GAAP), excluding gains (or losses) from sales of property, hedge ineffectiveness, acquisition costs of newly acquired properties that are not capitalized and lease acquisition costs that are not capitalized plus depreciation and amortization, including amortization of acquired above and below market lease intangibles and impairment charges on properties or investments in non-consolidated REITs, and after adjustments to exclude equity in income or losses from, and, to include the proportionate share of FFO from, non-consolidated REITs.
However, because FFO excludes depreciation and amortization as well as the changes in the value of the Company’s properties that result from use or market conditions, each of which have real economic effects and could materially impact the Company’s results from operations, the utility of FFO as a measure of the Company’s performance is limited. In addition, other REITs may not calculate FFO in accordance with the NAREIT definition as the Company does, and, accordingly, the Company’s FFO may not be comparable to other REITs’ FFO. Accordingly, FFO should be considered only as a supplement to net income as a measure of the Company’s performance.
Core Funds from Operations (“Core FFO”) – We calculate Core FFO by using FFO as defined by NAREIT and adjusting for certain other non-core items. We exclude from our Core FFO calculation acquisition costs, loss on early extinguishment of debt, changes in the fair value of the earn-out, changes in fair value of contingent consideration, non-cash warrant dividends, other non-recuring expenses, and the amortization of stock-based compensation.
We believe Core FFO provides a useful metric in comparing operations between reporting periods and in assessing the sustainability of our ongoing operating performance. Other equity REITs may calculate Core FFO differently or not at all, and, accordingly, the Company’s Core FFO may not be comparable to such other REITs’ Core FFO.