 Creditors Meeting Exhibit 99.1 |
 The statements in this presentation relating to matters that are not historical facts are forward-looking statements. These forward-looking statements are based upon assumptions of management which are believed to be reasonable at the time made, and are subject to significant risks and uncertainties. Actual results could differ materially based on factors including, but not limited to, the ability to implement business strategies; availability, cost and price volatility of raw materials and utilities; supply/demand balances; industry production capacities and operating rates; uncertainties associated with the U.S. and worldwide economies; legal, tax and environmental proceedings; cyclical nature of the chemical and refining industries; operating interruptions; current and potential governmental regulatory actions; terrorist acts; international political unrest; competitive products and pricing; technological developments; risks of doing business outside of the U.S.; access to capital markets; and other risk factors. Additional factors that could cause results to differ materially from those described in the forward-looking statements can be found in the Lyondell, Equistar and Millennium Annual Reports on Form 10-K for the year ended December 31, 2007, the LyondellBasell Industries AF S.C.A. Consolidated Financial Statements for the year ended December 31, 2007 (U.S. GAAP), the LyondellBasell AF S.C.A. Management Report for the year ended December 31, 2007 and the LyondellBasell Industries AF S.C.A. (IFRS) Financials statements for the year ended December 2007, each of which is available on the Investor Relations page of the LyondellBasell Industries' website. This presentation contains time sensitive information that is accurate only as of the time hereof. We undertake no obligation to update the information presented herein except to the extent required by law. Disclaimer |
 LyondellBasell Industries • LyondellBasell Industries created on Dec. 20, 2007 – $44.7billion in annual revenues* – More than 60 manufacturing sites – Sales in more than 100 countries – More than 16,000 employees *Combined pro forma 2007 revenues |
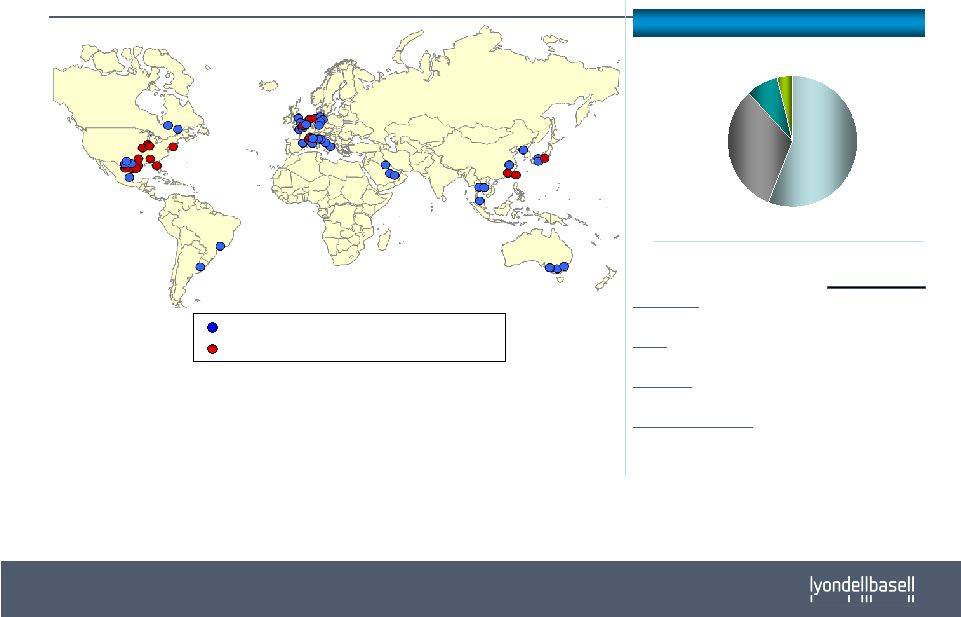 Chemicals Propylene Oxide #1 Fuels Oxy Fuels #2 Polymers Polyolefins #1 Technology & R&D Polyolefin Licensing #1 Polyolefin Catalysts #1 Leading Positions and Extended Geographic Presence • Global geographic diversity • Significant presence in fast growing Asian markets • Well positioned to access cost advantaged feedstock in the Middle East North America Europe JVs ROW Source: LyondellBasell Industries and CMAI Based on 100% of JV capacity. Rankings based on CMAI information except for Polyolefins ranking which is based on internal LyondellBasell Industries information Global Rated Capacity Position Legacy Basell Manufacturing Sites and JVs Legacy Lyondell Manufacturing Sites and JVs 2007 Revenues Including JVs |
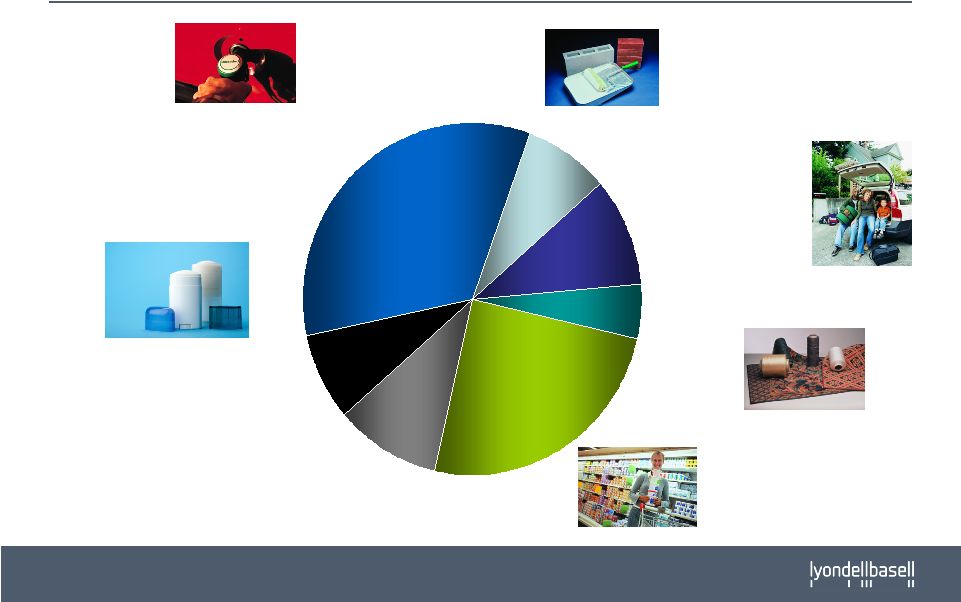 Diverse End Markets Consumer Refining / Fuels Building & Construction Transportation Packaging Textiles / Furnishings Other Note: Estimated based on 2006 revenues |
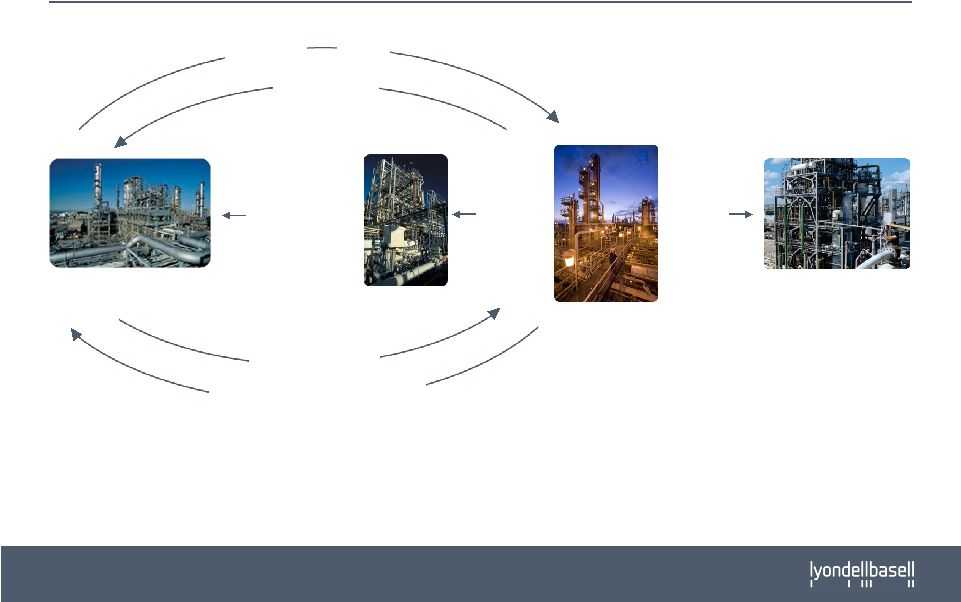 An Integrated System Olefins Hydrogen Olefins C4s Olefins Feed Gasoline Components Gasoline Components Propylene Oxide Plants Polymers Plants Refining Olefins Plants Olefins |
 Near-Term Situation Overview • Since the completion of the LyondellBasell transaction, the Company has experienced numerous challenges: • Economic Decline • Hurricane Ike • Volatility in Crude / Energy markets • Houston Refinery turnaround / crane accident Situation • Significant order decline – Operating at significantly reduced capacity • Significant spread compression – Negative margins experienced • Decline in borrowing base due to declining commodity prices – Inventory – A/R • Extreme Q4 deterioration in profitability • 3 week shut down of Houston operations • Significant unpredictability of expected demand and pricing • Dec. ‘08 Impact Result is significantly reduced EBITDA, cash and availability of working capital finance facilities |
 Unprecedented Q4 Industry Conditions and Volatility Chemicals / Polymers Refining Cost Environment Crude declines continued~$35/bbl - Ethane below fuel value Naphtha below crude equivalent Crude declines continue ~$35/bbl - Production cuts have not stopped decline Demand Environment Continued decline w/o visibility of bottom across all products Operating rates in 50% range No definitive indications of reversal Gasoline very weak Margin Situation Prices collapsed in Nov/Dec Polymers– EU significantly negative Very volatile – ($7.50/bbl) $2.25/bbl - Diesel– $9.00/bbl - $19.40/bbl WTI 211 – $1.80/bbl - $10.85/bbl Hy/lt spread– $5.50/bbl - $19.00/bbl Gasoline |
 LyondellBasell Immediate Response • Olefins – La Porte and Chocolate Bayou idled – Operating Rates – 50% US; 60-65% Europe • Propylene Oxide – 2 POSM plants idled – Operating rates – 50-60% • Polymers – Numerous lines down – Operating rates – 50-55% • Refining – Operating issues continued through early December – Full operating functionality for balance of December Liquidity Actions Late Q4 Operating Actions • Multiple facility shutdowns • Accelerated receipts – Commercial dispute settlement – Hedge settlement – Prepayment discounts – Credit terms tightened • Capex reduced to absolute minimum levels • Accelerated organizational restructuring – 15% manpower reduction target – Eliminate contract personnel • Pursuing asset divestitures |
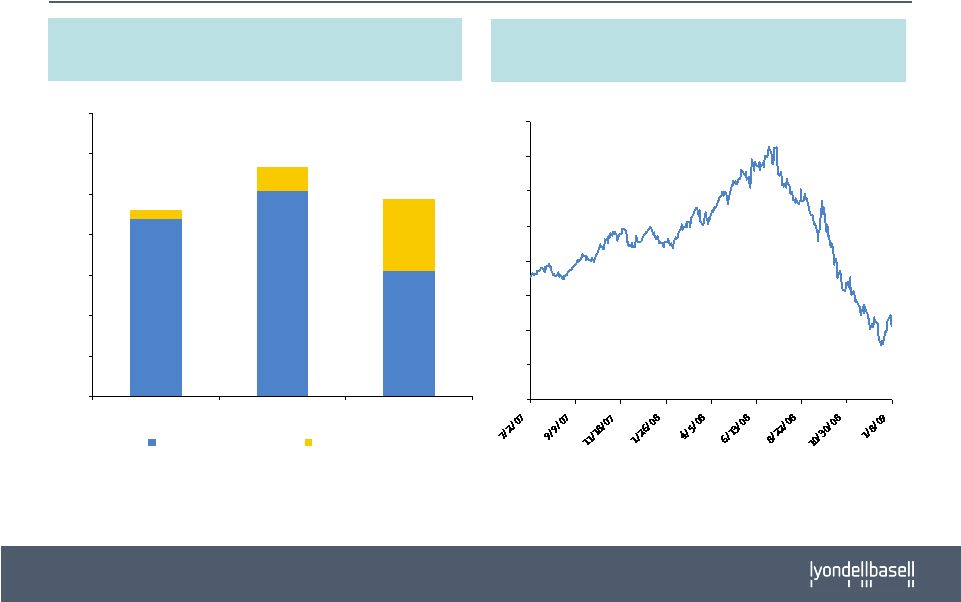 2008 Historical Current Cost EBITDA and WTI Crude Price 880 1,018 621 40 118 358 $0 $200 $400 $600 $800 $1,000 $1,200 $1,400 Q108 Q208 Q308 Actual Current Cost EBITDA Non Recurring Items $920 $1,136 $979 2008 Current Cost EBITDA ($ in millions) Source: Platts (1) Non recurring items include FCCU downtime in Q2 and Hurricane Ike, turnaround and crane incident in Q3 (1) WTI Crude Price ($/bbl) $0 $20 $40 $60 $80 $100 $120 $140 $160 |
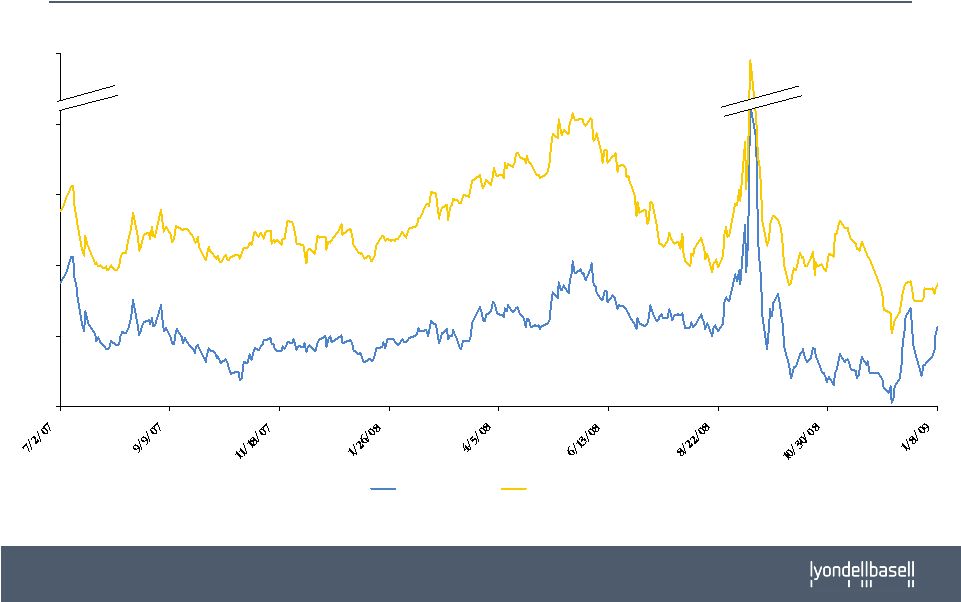 2-1-1 Crack and Maya Spreads ($/bbl) Source: Platts $0 $10 $20 $30 $40 $75 2-1-1 Crack Spread Maya 2-1-1 Spread |
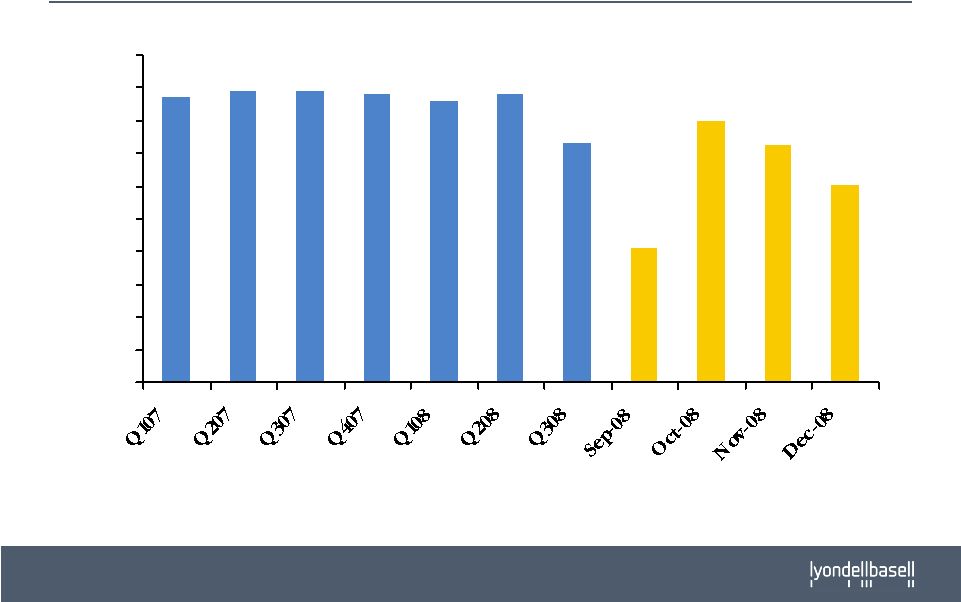 CMAI U.S. Ethylene Operating Rate 87% 89% 89% 88% 86% 88% 73% 41% 80% 73% 60% 0% 10% 20% 30% 40% 50% 60% 70% 80% 90% 100% Source: CMAI |
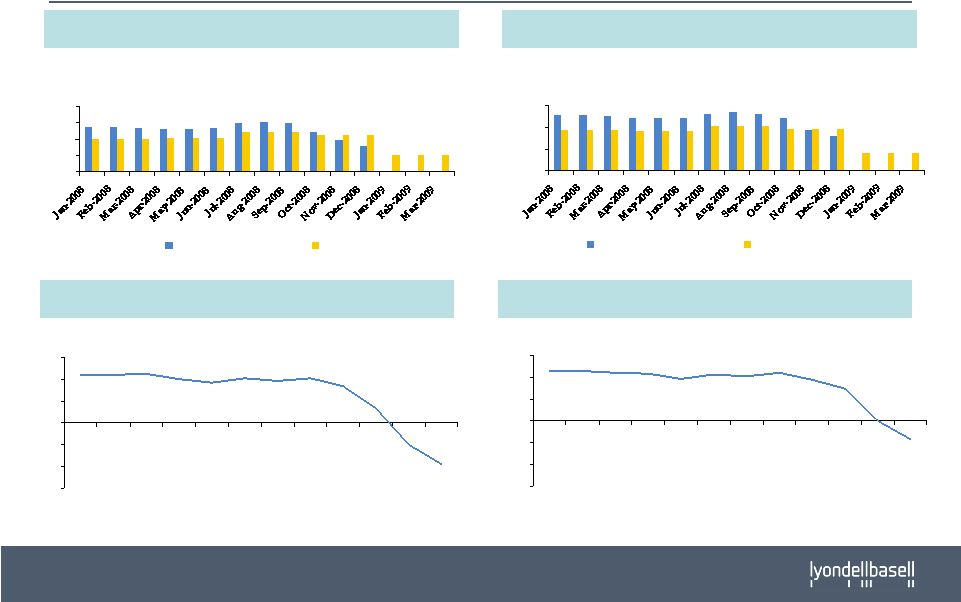 CMAI EU Polymer € 0 € 500 € 1,000 € 1,500 € 2,000 Polyethylene High Density Ethylene € 0 € 500 € 1,000 € 1,500 Polypropylene Homopolymer Propylene Contained Value EU PP-C3 (€/mt) EU PE-C2 (€/mt) -30 -20 -10 0 10 20 30 Jan- 2008 Feb- 2008 Mar- 2008 Apr- 2008 May- 2008 Jun- 2008 Jul- 2008 Aug- 2008 Sep- 2008 Oct- 2008 Nov- 2008 Dec- 2008 -30 -20 -10 0 10 20 30 Jan- 2008 Feb- 2008 Mar- 2008 Apr- 2008 May- 2008 Jun- 2008 Jul- 2008 Aug- 2008 Sep- 2008 Oct- 2008 Nov- 2008 Dec- 2008 EU PP-C3 Margin (¢/lb) EU PE-C2 Margin (¢/lb) Source: CMAI |
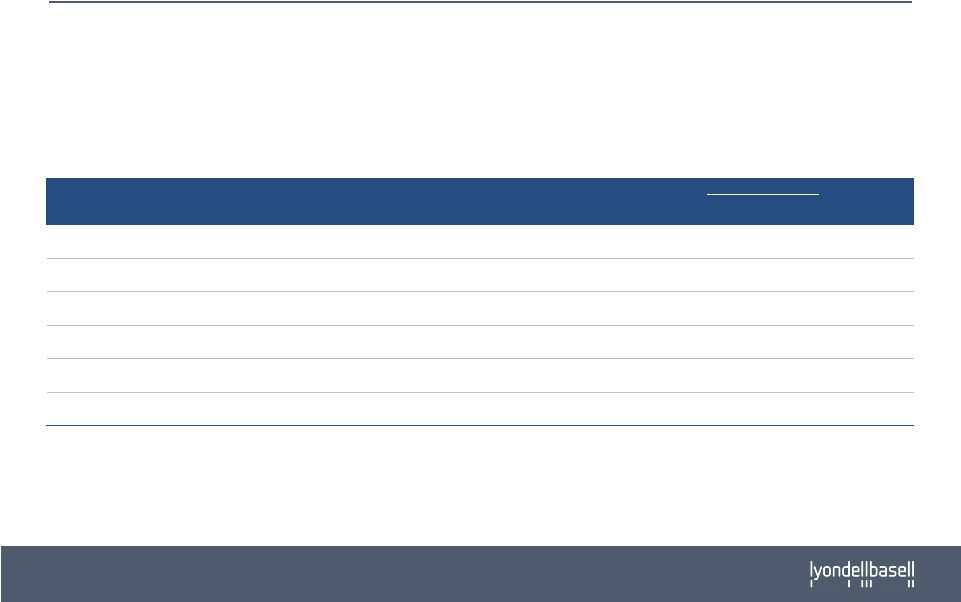 Key Q4 Impacts to Liquidity • Unprofitable late fourth-quarter operations as Chemical & Polymer operating rates and sales declined to approximately 50% of capacity • Losses created by the pass through of higher-priced inventory • Reduction in availability of Working Capital Facilities - $1B+ *Source: Platts, CMAI Change vs. September Units September Price December Price Unit % WTI Crude $/bbl 103.60 41.50 (62.10) (60) NW Europe Naphtha $/tonne 847 258 (589) (70) Gulf Coast Ethane ¢/gal 81 35 (46) (57) Gasoline $/gal 3.12 0.93 (2.19) (70) Polypropylene ¢/ lb 85 46 (39) (46) Polyethylene ¢/lb 97 49 (48) (49) |