
2007 Fixed - Income Investor Update
Fall 2007

Forward Looking Statements
This presentation contains statements that do not directly or exclusively relate to historical facts. These statements
are “forward-looking statements” within the meaning of the Private Securities Litigation Reform Act of 1995. You
can typically identify forward-looking statements by the use of forward-looking words, such as “may,” “could,”
“project,” “believe,” “anticipate,” “expect,” “estimate,” “continue,” “intend,” “potential,” “plan,” “forecast,” and
similar terms. These statements are based upon the Company’s current intentions, assumptions, expectations and
beliefs and are subject to risks, uncertainties and other important factors. Many of these factors are outside the
Company’s control and could cause actual results to differ materially from those expressed or implied by the
Company’s forward-looking statements. These factors include, among others:
–general economic, political and business conditions in the jurisdictions in which the Company’s facilities are
located;
–changes in governmental, legislative or regulatory requirements affecting the Company or the electric or gas
utility, pipeline or power generation industries;
–changes in, and compliance with, environmental laws, regulations, decisions and policies that could increase
operating and capital improvement costs, reduce plant output and/or delay plant construction;
–the outcome of general rate cases and other proceedings conducted by regulatory commissions or other
governmental and legal bodies;
–changes in economic, industry or weather conditions, as well as demographic trends, that could affect
customer growth and usage or supply of electricity and gas;
–changes in prices and availability for both purchases and sales of wholesale electricity, coal, natural gas, other
fuel sources and fuel transportation that could have significant impact on energy costs;
–the financial condition and creditworthiness of the Company’s significant customers and suppliers;
–changes in business strategy or development plans;
–availability, terms and deployment of capital;
2

Forward Looking Statements
–performance of generation facilities, including unscheduled outages or repairs;
–risks relating to nuclear generation;
–the impact of derivative instruments used to mitigate or manage volume and price risk and interest rate risk and
changes in the commodity prices, interest rates and other conditions that affect the value of the derivatives;
–the impact of increases in healthcare costs, changes in interest rates, mortality, morbidity and investment
performance on pension and other postretirement benefits expense, as well as the impact of changes in
legislation on funding requirements;
–changes in MEHC’s and its subsidiaries’ credit ratings;
–unanticipated construction delays, changes in costs, receipt of required permits and authorizations, ability to
fund capital projects and other factors that could affect future generation plants and infrastructure additions;
–the impact of new accounting pronouncements or changes in current accounting estimates and assumptions
on financial results;
–the Company’s ability to successfully integrate future acquired operations into the Company’s business;
–other risks or unforeseen events, including wars, the effects of terrorism, embargos and other catastrophic
events; and
–other business or investment considerations that may be disclosed from time to time in filings with the U.S.
Securities and Exchange Commission (“SEC”) or in other publicly disseminated written documents.
Further details of the potential risks and uncertainties affecting the Company are described in MEHC’s filings
with the SEC, including Item 1A and other discussions contained in such filings. The Company undertakes
no obligation to publicly update or revise any forward-looking statements, whether as a result of new
information, future events or otherwise. The foregoing review of factors should not be construed as exclusive.
3

Topics
•MEHC Growth Summary
•Overview of MidAmerican Energy Holdings Company
•Platform Overviews
4
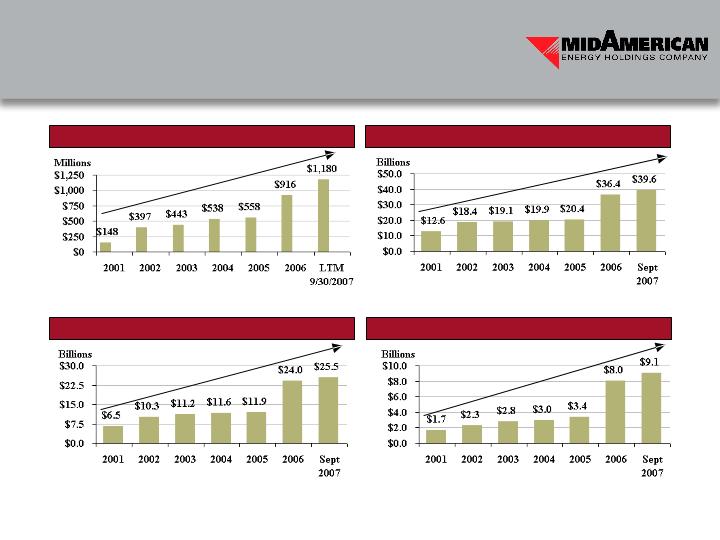
Income from Continuing Operations (1)
Shareholders’ Equity
Property, Plant and Equipment (Net)
Total Assets
CAGR = 43.2%
CAGR = 22.0%
CAGR = 33.7%
CAGR = 26.7%
___________________________
1.2006 includes PacifiCorp since date of acquisition, March 21, 2006
MEHC Growth Summary
5

•18,000 employees
•$39.6 billion in assets
•$12.1 billion in revenue
•6.9 million electric and natural gas customers
•17,500 miles of interstate natural gas pipeline
•16,326 net MW owned in operation or under
construction (58% coal, 23% gas, 16% renewable,
3% nuclear and other)
6

MidAmerican’s Vision and Strategy
•Own and operate a portfolio of high-quality businesses that achieve operational
excellence in all areas
•Operate our businesses in a manner consistent with our principles of:
–customer service
–safety and employee commitment
–environmental RESPECT
–regulatory integrity
–operational excellence
–financial strength
•Plan, execute, measure and correct
•Grow and diversify through internal expansion and disciplined acquisitions
7

As the utility sector enters its first comprehensive capital expenditure build-out
since the 1980’s, many analysts project the industry to be cash flow negative for
the next few years
MEHC has no dividend requirement and therefore its 100% reinvestment of free
cash flow and access to equity capital from Berkshire, even in times of utility
sector and general market stress, clearly differentiates the quality of MEHC’s
credit from its peers
MEHC’s Competitive Advantage
•MEHC’s cash flow is derived from a diversified portfolio of businesses
•Approximately 89% of MEHC’s operating income in 2006 was generated from
rate-regulated businesses
8

Berkshire Continues to Pursue Energy Sector Investment Diversification Through MEHC
•Provides MEHC with a $3.5 billion 5-year equity commitment from ‘AAA’ rated
parent
–Access to capital even in times of utility sector and general market stress; no other utility
has this quality of explicit financial support
–Commitment can only be drawn for two purposes:
•Paying MEHC parent debt when due
•Making equity contributions to any of MEHC’s regulated subsidiaries
•Future M&A activity will not be funded from this equity commitment
Berkshire Equity Commitment
Berkshire’s Energy Sector Strategy
•MEHC serves as the investment vehicle for Berkshire in the energy sector
–Provides opportunities to invest a significant amount of capital
–The PacifiCorp acquisition clearly demonstrates Berkshire’s willingness to make sizable
investments through MEHC
–Future acquisitions will be funded in a credit positive manner
•Berkshire continues to leverage MEHC’s management expertise and ability to
effectively integrate significant acquisitions
9
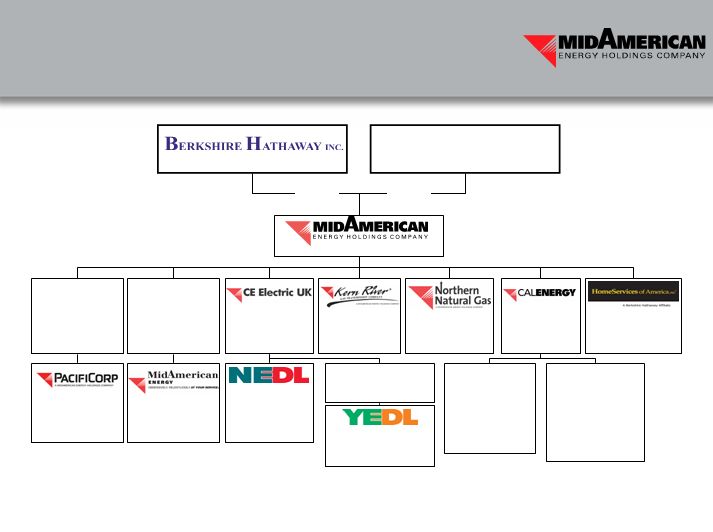
Real Estate
Brokerage
Brokerage
Baa1/BBB+/BBB+
Independent
Electric Power
Producer
Electric Power
Producer
Baa1/BBB-/BBB+
Holding
Company
Company
A2/A/A
Regulated Gas
Transmission
Transmission
PPW Holdings,
LLC
LLC
(No Debt)
Holding
Company
Company
MidAmerican
Funding, LLC
A3/BBB+/A-
Holding
Company
Company
A3/BBB+/A
UK Regulated
Electric
Distribution
Electric
Distribution
A3/BBB+/A
UK Regulated
Electric Distribution
Electric Distribution
Baa1/BBB-/A-
Yorkshire
Power Group
FOREIGN
B2/BB-/NR
CE Casecnan
(Constrained by
Philippine Govt.
Sovereign Rating)
Philippine Govt.
Sovereign Rating)
DOMESTIC
Ba1/BB+/BB+
CE Generation
Baa3/BBB-/NR
Salton Sea Funding
Ba3/BB/NR
Cordova
A3/A-/A-
Regulated Gas
Transmission
Transmission
A3/A-/A-(2)
Regulated
Electric Utility
Electric Utility
Aaa/AAA/AAA
86.6%(1)
Walter Scott10.8%
David Sokol1.6%
Greg Abel1.0%
13.4%(1)
A2/A-/A
Regulated Gas
and Electric
Utility
and Electric
Utility
1.Diluted Ownership
2.PacifiCorp ratings are Senior Secured
10
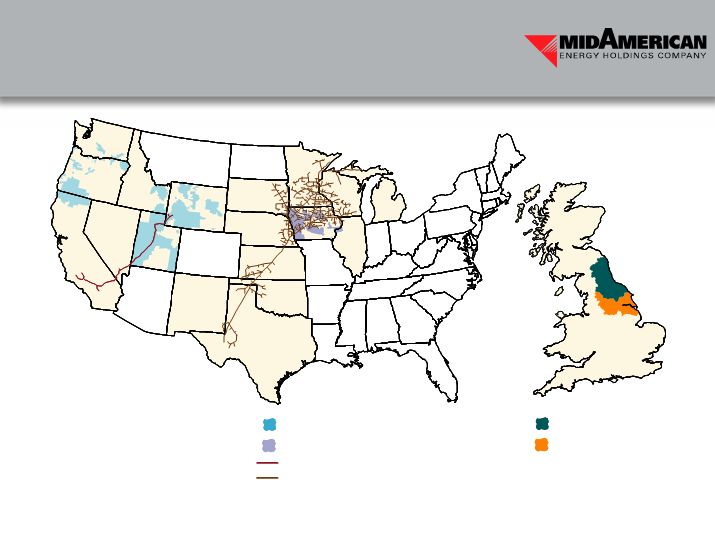
•Customer diversity
•Regulatory diversity
•Weather diversity
•Economic diversity
•Catastrophic-risk diversity
PacifiCorp Service Territory
MidAmerican Energy Company Service
Territory
Kern River Pipeline
Northern Natural Gas Pipeline
NEDL Service Territory
YEDL Service Territory
U.K.
Diversity of Regulated Assets
11
___________________________
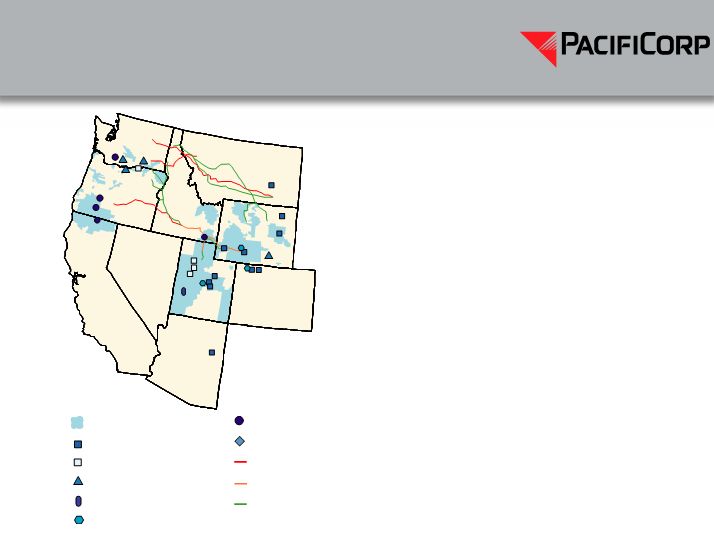
(1)  Includes projects currently under
       construction
PacifiCorp Service Territory
Thermal Plants
Gas-Fueled Thermal Plants
Wind Projects
Geothermal Plants
Coal Mines
Hydro Systems
Generation Developments
500 kV transmission lines
345 kV transmission lines
230 kV transmission lines
CA
NV
AZ
UT
WY
OR
WA
MT
CO
ID
•Headquartered in Portland, Oregon
•6,500 employees
•1.7 million electricity customers
•9,426 net MW owned (1)
•New peak load of approximately 9,775 MW in
July 2007
•Generating capacity by fuel type (1)
–Coal65%
–Natural gas18%
–Hydro12%
–Wind and geothermal5%
12

•General rate cases currently underway in Wyoming and Idaho
•Since acquisition by MEHC, 334.9 MW of renewable wind generation has been acquired
and an additional Marengo expansion announced in October 2007
–Leaning Juniper I100.5 MWCompleted September 2006
–Marengo140.4 MWCompleted August 2007
–Goodnoe Hills94.0 MWExpected Completion 1st Qtr 2008
–Marengo Expansion70.2 MWExpected Completion 2nd Qtr 2008
–Additional renewable energy projects expected to be in-service during 2008
•Lake Side gas generation plant placed in service in September 2007
•Announced plans to build 1,200 miles of transmission between 2010 and 2014 in
Wyoming, Idaho, Oregon and the southwest at an estimated cost of $4 billion
Recent Accomplishments
13

2007 Regulatory Highlights
•Approved settlements of pre-acquisition rate cases have resulted in total revenue increases of more
than $200 million. 2007 state regulatory highlights include:
•Utah (41% of retail revenues)
–UPSC approved a $115 million increase (10%) in two phases, fully effective June, 2007
•Oregon (30% of retail revenues)
–OPUC approved $43 million increase (5%) effective January, 2007
–Seeking recovery of 2008 power costs through annual TAM filing
–Filed in August, 2007 a mechanism to recover costs related to renewable portfolio standard
–Filed in October, 2007 for $27 million surcharge related to SB 408, Oregon’s income tax law
•Wyoming (13% of retail revenues)
–Filed general rate case in June, 2007 seeking annual increase of $36 million (8%)
–WPSC approved recovery of $2.5 million of previously deferred power costs through PCAM
•Washington (8% of retail revenues)
–Authorized $14 million increase (6%) effective June, 2007 and accepted proposed allocation methodology
•Idaho (6% of retail revenues)
–Filed general rate case in June, 2007 requesting annual increase of $18 million (10%)
•California (2% of retail revenues)
–Filed an ECAC application in August, 2007 for updated power costs. Staff has agreed to an increase of $5.4
million (7.1%)
–Filed Post Test Year Adjustment Mechanisms in October 2007 seeking $1.7 million increase (2%) for inflation
and major resource additions. Staff has agreed not to oppose the request
14
___________________________
(1)  Includes projects currently under
       construction
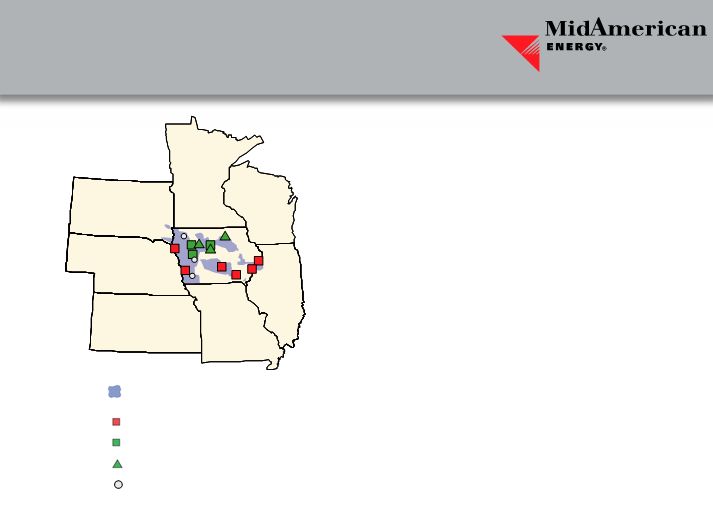
IA
IL
KS
NE
SD
WI
MN
MO
MidAmerican Energy Company Service
Territory
Major Generating Facilities
Wind Project Operations
Wind Project Construction
New Project Development Areas
•Headquartered in Des Moines, Iowa
•3,700 employees
•1.4 million electric and natural gas customers
•5,838 net MW owned (1)
•New peak load of approximately 4,150 MW in
August 2007
•Generating capacity by fuel type (1)
–Coal57%
–Natural gas22%
–Wind13%
–Nuclear7%
–Other1%
15

Recent Accomplishments
•Walter Scott Energy Center Unit 4, a 790 MW advanced supercritical coal facility
began operations June 1, 2007.
–At a cost of approximately $1.4 billion dollars, Unit 4 is one of the largest construction
projects ever undertaken in Iowa or Nebraska
–Named 2007 plant of the year by POWER Magazine
•IUB approved 540 MW of new wind generation to be in service by the end of 2008
with pre-approved rate making principles which will bring total wind generation
resources to 1,122.5 MW
–Century Expansion15 MWExpected Completion 4th Qtr 2007
–Pomeroy II75 MWExpected Completion 4th Qtr 2007
–Charles City75 MWExpected Completion 2nd Qtr 2008
–TBD375 MW
16
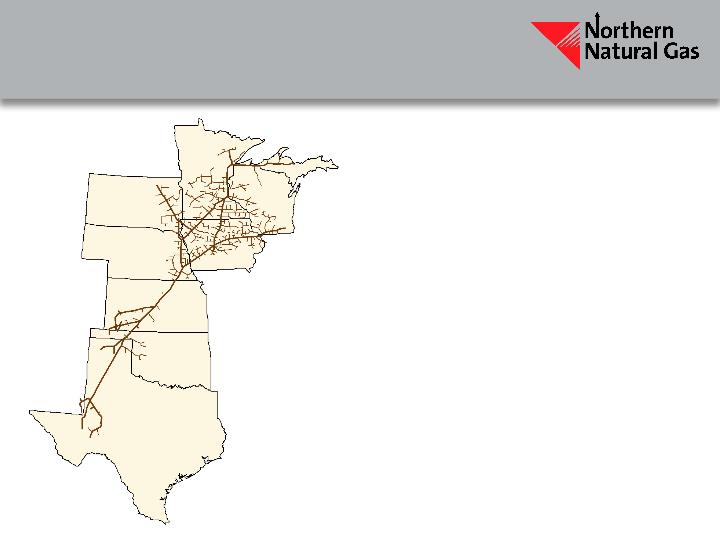
TX
OK
KS
NE
SD
MN
IA
WI
•Headquartered in Omaha, Nebraska
•1,000 employees
•15,800-mile interstate natural gas
transmission pipeline
•Market area design capacity of 4.9 Bcf/d
plus 2.1 Bcf/d field area capacity
•Five natural gas storage facilities with a
total firm capacity of 65 Bcf
17

Recent Accomplishments
•Northern Lights 2007 Project is expected to add more than 400,000 Dth/d of growth
to NNG’s market area transportation business in November 2007, representing 10%
growth in market area
•NNG’s 8 bcf storage expansion project is awaiting approval from the FERC;
construction is expected to be completed in 2008
•Dramatic improvement in customer service rankings in MastioGale pipeline survey
moving from last place in 2003 to 9th out of 41 pipelines in 2007
•NNG (A2/A/A) received a one notch upgrade from Moody’s and Fitch in February
2007
18

Strong Market and Competitive Position
•Provides customers with flexibility to access multiple supply basins
–Hugoton, Anadarko, Permian, Rocky Mountain and Western Canada Basins
•Lowest transportation cost of natural gas to customers in the upper Midwest
•Strategic location in high demand upper Midwest market areas
•Strong barriers to entry given widely dispersed load centers in NNG’s upper Midwest
market area
•Customer base dominated by local distribution companies
•NNG settled its last rate case in 2005
19

CA
NV
AZ
UT
WY
•Headquartered in Salt Lake City, Utah
•160 employees
•1,680-mile interstate natural gas
transmission pipeline
•Delivers natural gas from Rocky
Mountain basins to markets in Utah,
Nevada, California and Arizona
•Greater than 2 Bcf/d peak capacity
20

Recent Accomplishments
•In 2006, Kern River became the largest supplier of natural gas to California, with market share
exceeding 26%
•Final Commission decision on rate case allowed for return on regulated equity of 11.2%
–FERC issued a proposed policy statement allowing the use of MLPs in the proxy group to determine
rate of return
–Proposal included capping distributions of the MLP at earnings
–May impact the return on equity issue in Kern River's rate case
•Filing to increase maximum allowed operating pressure which increases available volumes
–Increase maximum allowable operating pressure from 1,200 psig to 1,333 psig
–Submitted application to the Pipeline Hazardous Materials Safety Administration on August 20, 2007
–Expected final determination during first quarter 2008
–Provides 9.1 bcf of additional seasonal capacity annually
•Ranked 4 out of 41 pipelines in 2007 MastioGale pipeline survey for customer satisfaction, and
experienced zero days of primary firm service interruption
21

Provides Supply Diversity, Operational Reliability,
Competitive Rates and Excellent Customer Service
•Access to economic Rocky Mountain gas supplies in three western states
–170 TCF of proven and undiscovered potential reserves
–Only expanding supply basin in the lower 48 states
•Supply diversity is provided through pipeline interconnects accessing all Rocky
Mountain production basins
•New and efficient pipeline system, low fuel rates and minimal cost associated with
new pipeline safety legislation
•Pipeline load factor averaged 111% during 2005 and 123% during 2006
•Direct service to end users avoids rate stacks of local distribution companies (LDC)
22
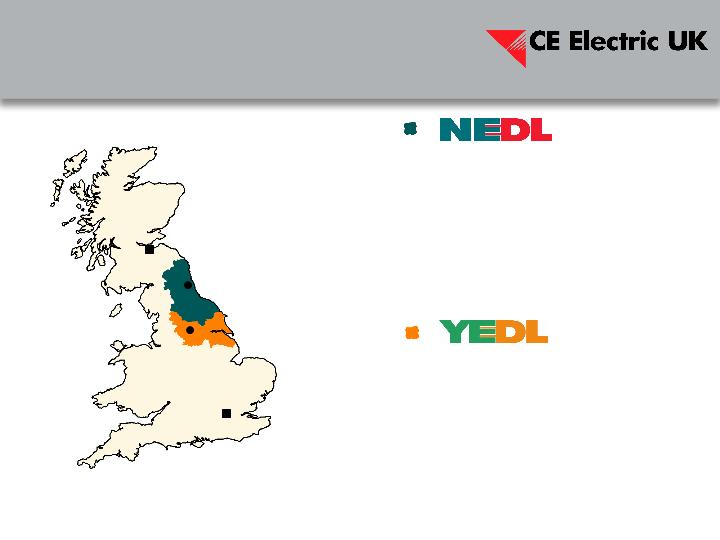
•Headquartered in Newcastle, U.K.
•760 employees
•1.6 million electricity customers
•5,560 square miles of service territory
•26,719 miles of transmission and
distribution line
•Headquartered in Leeds, U.K.
•890 employees
•2.2 million electricity customers
•4,131 square miles of service territory
•34,797 miles of transmission and
distribution line
U.K.
Edinburgh
London
Newcastle
Leeds
23

Recent Accomplishments
•Financial performance remains stable
–Continue to focus on improving network performance and customer satisfaction levels
•Preparations for DPCR5 are well underway
•CE Electric UK Funding Company (Baa1/BBB-/BBB+) received a one notch
upgrade from Moody’s in February 2007
•Northern Electric plc. (A3/BBB-/BBB+) received a one notch upgrade from Moody’s
in February 2007
•Yorkshire Power Finance Ltd (Baa1/BBB-/A-) received a one notch upgrade from
Moody’s in February 2007
24

Distribution Price Control Reviews
•Existing price control in effect through March 31, 2010
•Price controls are set to recover Ofgem’s view of efficient costs over the next five years
•Ofgem takes account of
–Required quality of service outputs
–Operating costs and comparative efficiency
–Future capital expenditure
–Regulatory asset value and depreciation
–Pensions costs
–(Forward) cost of capital
–Tax
–Financial ratios and investment grade rating targets
•U.K. regulation tries to provide strong efficiency incentives for opex and capex
25
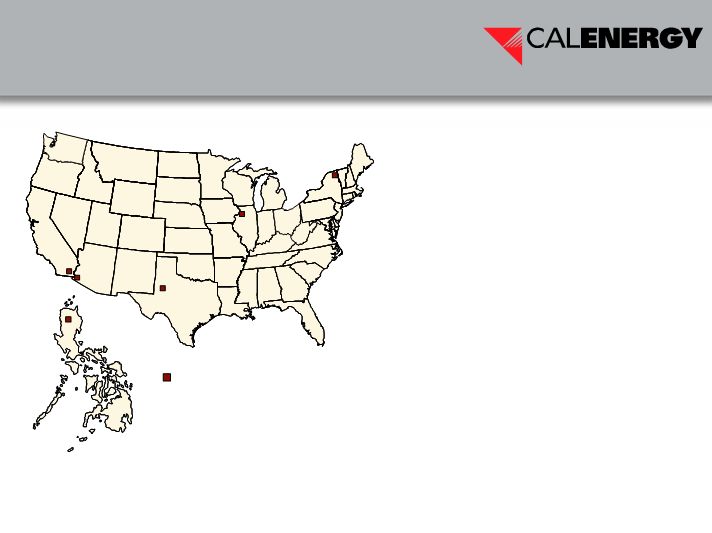
•355 employees
•1,062 net MW owned
•15 plants in the United States and one
facility in the Philippines
–Two remaining Philippine geothermal
plants were transferred to the Philippine
government pursuant to their contracts in
2007
•Generating capacity by fuel type
–Natural gas71%
–Geothermal16%
–Hydro13%
CalEnergy Generation Operations
Philippines
26

Recent Accomplishments
•Remaining Philippine geothermal plants (Luzon and Visayas) were turned over to
PNOC in July 2007
•CalEnergy International earned the 2007 Environmental Excellence award given by
the Philippine Department of Environment and Natural Resources Division
•CE Generation, LLC (Ba1/BB+/BB+) received a two notch upgrade from S&P and a
one notch upgrade from Fitch in December 2006 and January 2007, respectively
•Salton Sea Funding Corp (Baa3/BBB-/NR) received a one notch upgrade from
Moody’s and S&P in January 2007 and December 2006, respectively
27
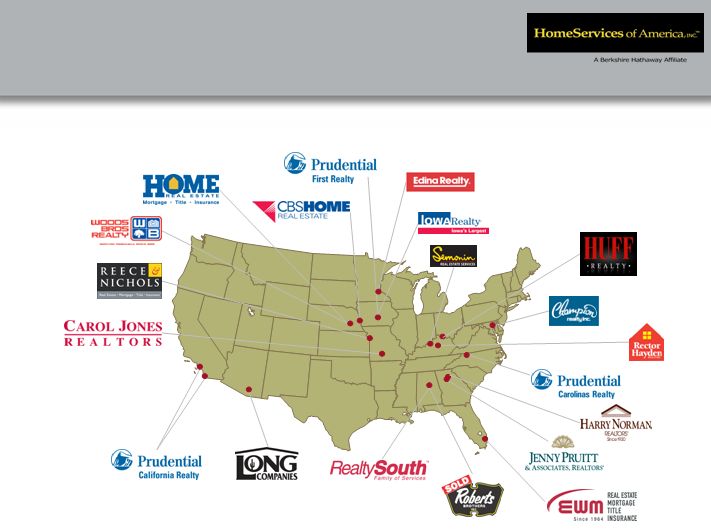
•3,550 employees
•20,000 sales associates
Second-largest full-service residential real estate brokerage firm in the U.S.
28

Recent Accomplishments
•Even though a challenging housing market continues in 2007, expense reductions
have allowed continued profitable operations
•Virtually no subprime mortgage exposure
29
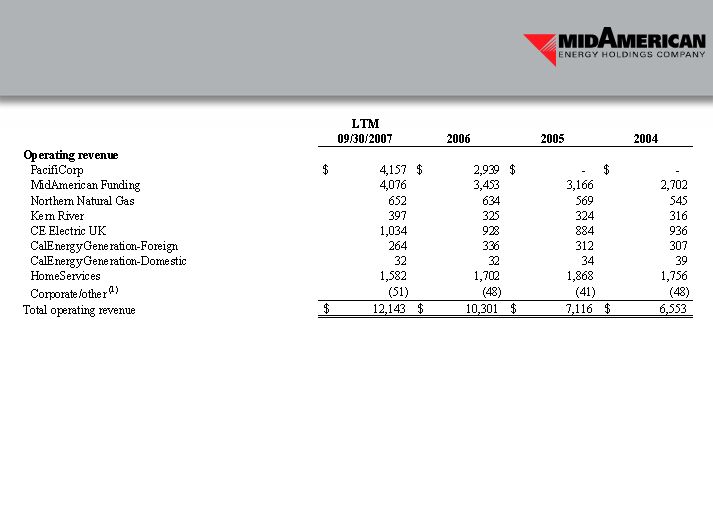
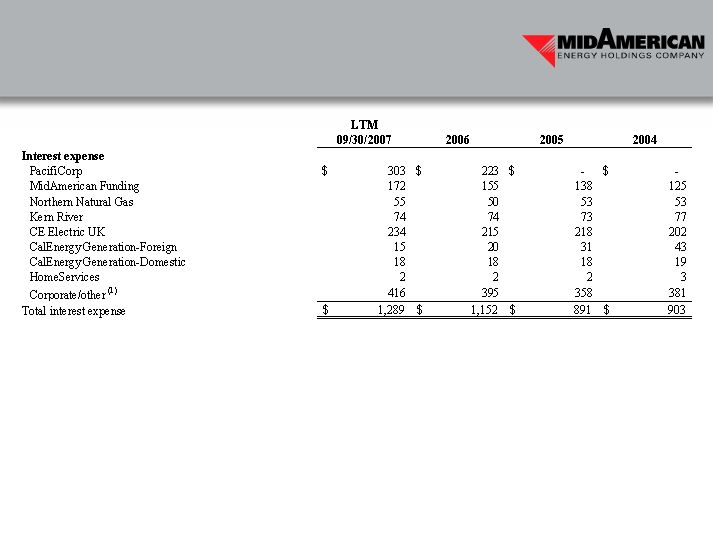
Segment Information (in millions)
(1) The remaining differences between the segment amounts and the consolidated amounts described as “Corporate/other” relate
principally to intersegment eliminations for operating revenue and, for the other items presented, to (i) corporate functions, including
administrative costs, interest expense, corporate cash and related interest income, (ii) intersegment eliminations and
(iii) fair value adjustments relating to acquisitions
30
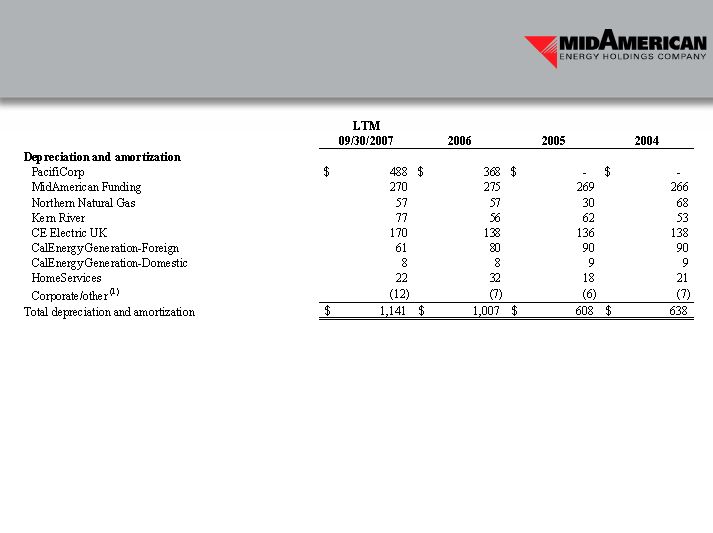
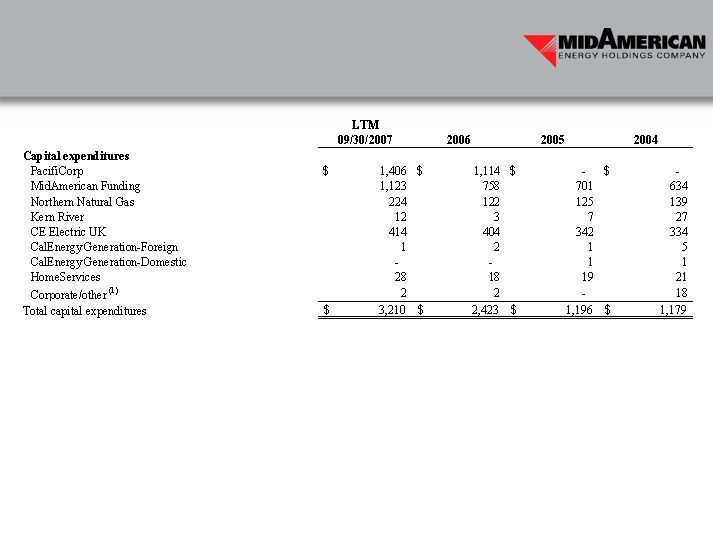
Segment Information (in millions)
(1) The remaining differences between the segment amounts and the consolidated amounts described as “Corporate/other” relate
principally to intersegment eliminations for operating revenue and, for the other items presented, to (i) corporate functions, including
administrative costs, interest expense, corporate cash and related interest income, (ii) intersegment eliminations and
(iii) fair value adjustments relating to acquisitions
31
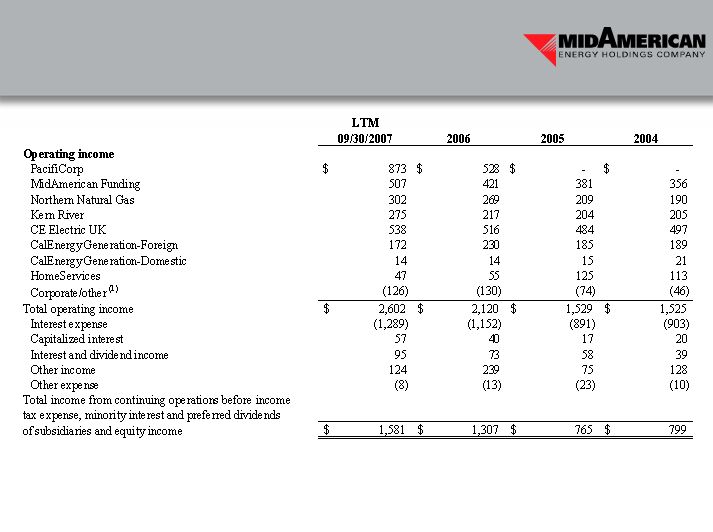
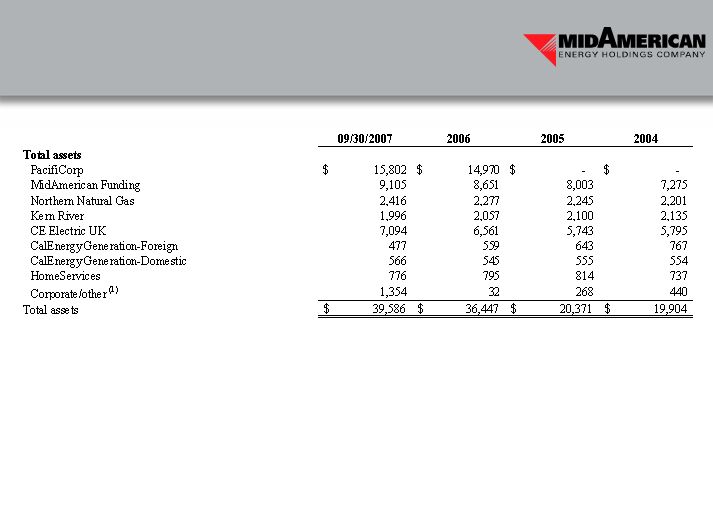
Segment Information (in millions)
(1) The remaining differences between the segment amounts and the consolidated amounts described as “Corporate/other” relate
principally to intersegment eliminations for operating revenue and, for the other items presented, to (i) corporate functions, including
administrative costs, interest expense, corporate cash and related interest income, (ii) intersegment eliminations and
(iii) fair value adjustments relating to acquisitions
32
Segment Information (in millions)
(1) The remaining differences between the segment amounts and the consolidated amounts described as “Corporate/other” relate
principally to intersegment eliminations for operating revenue and, for the other items presented, to (i) corporate functions, including
administrative costs, interest expense, corporate cash and related interest income, (ii) intersegment eliminations and
(iii) fair value adjustments relating to acquisitions
33
Segment Information (in millions)
(1) The remaining differences between the segment amounts and the consolidated amounts described as “Corporate/other” relate
principally to intersegment eliminations for operating revenue and, for the other items presented, to (i) corporate functions, including
administrative costs, interest expense, corporate cash and related interest income, (ii) intersegment eliminations and
(iii) fair value adjustments relating to acquisitions
34
Segment Information (in millions)
(1) The remaining differences between the segment amounts and the consolidated amounts described as “Corporate/other” relate
principally to intersegment eliminations for operating revenue and, for the other items presented, to (i) corporate functions, including
administrative costs, interest expense, corporate cash and related interest income, (ii) intersegment eliminations and
(iii) fair value adjustments relating to acquisitions
35