As filed with the Securities and Exchange Commission on April 1, 2008
Registration No. 333-
UNITED STATES
SECURITIES AND EXCHANGE COMMISSION
Washington, D.C. 20549
FORM N-14
REGISTRATION STATEMENT
UNDER
THE SECURITIES ACT OF 1933
| | | | |
| | Pre-Effective Amendment No. | | ¨ |
| | Post-Effective Amendment No. | | ¨ |
(Check appropriate box or boxes)
Exact Name of Registrant as Specified in Charter:
WELLS FARGO FUNDS TRUST
Area Code and Telephone Number: (800) 552-9612
Address of Principal Executive Offices, including Zip Code:
525 Market Street
San Francisco, California 94163
Name and Address of Agent for Service:
C. David Messman
c/o Wells Fargo Funds Management, LLC
525 Market Street, 12th Floor
San Francisco, California 94105
With copies to:
Marco E. Adelfio, Esq.
Morrison & Foerster LLP
2000 Pennsylvania Ave., N.W.
Suite 5500
Washington, D.C. 20006
It is proposed that this filing will become effective on May 6, 2008 pursuant to Rule 488.
No filing fee is required under the Securities Act of 1933 because an indefinite number of shares of beneficial interest in the Registrant has previously been registered pursuant to Rule 24f-2 under the Investment Company Act of 1940, as amended.

Important Proxy Information
Please take a moment to read.
The enclosed document is a proxy statement with proposals concerning certain Wells Fargo Advantage Funds®. As a shareholder of one or more of the Funds, you are being asked to approve a reorganization of your target Wells Fargo Advantage Fund into an acquiring Wells Fargo Advantage Fund. The following information highlights the principal aspects of the proposal, which is subject to a vote by the target Funds’ shareholders. We encourage you to fully read the enclosed proxy statement.
What am I being asked to vote on?
You are being asked to approve the reorganization of your target Wells Fargo Advantage Fund into an acquiring Wells Fargo Advantage Fund. The Wells Fargo Advantage Funds Board of Trustees (the Board) believes that these reorganizations will benefit shareholders, and it unanimously approved them.
In each reorganization, the target Fund will transfer all of its assets and liabilities to a corresponding acquiring Fund in exchange for shares of the same or a comparable class of the acquiring Fund. The reorganization is expected to be a tax-free exchange. Immediately after the closing of the reorganization, you will hold the shares of an acquiring Fund with a total dollar value equal to the total dollar value of the shares of the target Fund that you held before the closing. The target Funds and the acquiring Funds are listed in the table below:
| | |
WELLS FARGO ADVANTAGE FUNDS
TARGET FUND | | WELLS FARGO ADVANTAGE FUNDS
ACQUIRING FUND |
Balanced Fund | | Asset Allocation Fund |
Corporate Bond Fund | | Income Plus Fund |
High Yield Bond Fund | | High Income Fund |
Intermediate Government Income Fund | | Government Securities Fund |
National Limited-Term Tax-Free Fund | | Short-Term Municipal Bond Fund |
National Tax-Free Fund | | Municipal Bond Fund |
Overseas Fund | | International Equity Fund |
Value Fund | | C&B Large Cap Value Fund |
Why has the Board recommended that I vote in favor of the reorganization?
Among the factors the Board considered in recommending these reorganizations were the following:
| | • | | The combined Funds will have potentially greater investment opportunities and market presence. |
| | • | | The reorganizations will eliminate duplicative expenses and can reduce associated operational costs. |
| | • | | The combined Funds are expected to have enhanced viability due to a larger asset base. A larger asset base can lead to lower expense ratios. |
| | • | | The acquiring Funds have better comparative total return than their corresponding target Funds over most measurement periods, and, in the view of Wells Fargo Funds Management, LLC, the Funds’ advisor, they have the potential for better performance opportunities going forward. |
| | • | | The investment objectives and principal investment strategies of the target and acquiring Funds are relatively compatible. |
| | • | | Shareholders will not bear the expenses incurred by each Fund in connection with the reorganizations. |
| | • | | The reorganizations are expected to be tax-free for federal income tax purposes. |
Whom should I call with questions about the voting process?
If you have any questions about the proxy materials or the proposal, please call your investment professional, trust officer, or Wells Fargo Advantage Funds at 1-800-222-8222. If you have any questions about voting your proxy, you may call our proxy solicitor, The Altman Group, at 1-866-406-2287.
IMPORTANT NOTICE: PLEASE COMPLETE THE ENCLOSED PROXY BALLOT AND RETURN IT AS SOON AS POSSIBLE. FOR YOUR CONVENIENCE YOU MAY VOTE BY MAIL, BY CALLING THE TOLL- FREE TELEPHONE NUMBER PRINTED ON YOUR PROXY BALLOT, OR VIA THE INTERNET ACCORDING TO THE ENCLOSED VOTING INSTRUCTIONS.
WELLS FARGO FUNDS TRUST
525 MARKET STREET
SAN FRANCISCO, CALIFORNIA 94105
[May 6, 2008]
Dear Valued Shareholder:
I am pleased to invite you to a special meeting of shareholders of Wells Fargo Funds Trust’s Balanced Fund, Corporate Bond Fund, High Yield Bond Fund, Intermediate Government Income Fund, National Limited-Term Tax-Free Fund, National Tax-Free Fund, Overseas Fund and Value Fund, to be held at 525 Market Street, 12th Floor, San Francisco, California 94105 on June 30, 2008, at 3:00 p.m. (Pacific Time).
We are seeking your approval of a proposed reorganization of eight funds of Wells Fargo Funds Trust into eight other funds of Wells Fargo Funds Trust (the “Reorganization”). We refer to Wells Fargo Funds Trust as Wells Fargo Advantage Funds®. We refer to the eight funds that are proposed to be reorganized as the Target Funds, and we refer to the eight Funds into which the Target Funds will be reorganized as the Acquiring Funds. We refer to all of them together as the Funds.
The Reorganization arises out of a review by Wells Fargo Funds Management, LLC (“Funds Management”), investment adviser to the Funds, of the continued viability of various Funds of Wells Fargo Advantage Funds, and an evaluation of whether combining Funds with similar investment objectives, principal investments, principal investment strategies or portfolio securities would better serve shareholders. In each reorganization, a Target Fund will transfer all of its assets and liabilities to a corresponding Acquiring Fund in exchange for shares of the same or a comparable class (“Class”) of the corresponding Acquiring Fund in an expected tax-free exchange. The shares of each Acquiring Fund, in turn, will be distributed to the shareholders of each Target Fund in liquidation of the Target Funds. Immediately after the closing of the Reorganization (the “Closing”), each shareholder of each Target Fund will hold the shares of an Acquiring Fund with a total dollar value equal to the total dollar value of the shares of the Target Fund that the shareholder held before the Closing. The following table lists the Target Funds and the corresponding Acquiring Funds that are part of the Reorganization.
| | |
TARGET FUNDS | | ACQUIRING FUNDS |
Balanced Fund | | Asset Allocation Fund |
Corporate Bond Fund | | Income Plus Fund |
High Yield Bond Fund | | High Income Fund |
Intermediate Government Income Fund | | Government Securities Fund |
National Limited-Term Tax-Free Fund | | Short-Term Municipal Bond Fund |
National Tax-Free Fund | | Municipal Bond Fund |
Overseas Fund | | International Equity Fund |
Value Fund | | C&B Large Cap Value Fund |
Some of the potential benefits of the proposed Reorganization are:
| | * | The combined Funds will have potentially greater investment opportunities and market presence. |
| | * | The Reorganization will eliminate duplicative expenses and can reduce associated operational costs. |
1
| | * | The combined Funds should have enhanced viability due to a larger asset base. A larger asset base also can lead to lower expense ratios. |
| | * | The Acquiring Funds have better or comparable comparative total return or yield performance than the Target Funds over most measurement periods and, in Funds Management’s view, better performance opportunities going forward. |
| | * | The expected tax-free nature of the Reorganization for U.S. federal income tax purposes. |
Funds Management has agreed to pay all expenses of each reorganization, so Fund shareholders will not bear these costs.
The overall responsibility for oversight of the Target Funds and Acquiring Funds rests with the Wells Fargo Advantage Funds’ Board of Trustees (the “Board”). The Board has unanimously approved each reorganization and believes that it is in the best interests of each Target Fund’s shareholders.
The Board of Trustees of Wells Fargo Advantage Funds unanimously recommends that you vote your proxy to approve the Reorganization.
Please read the enclosed proxy materials and consider the information provided. We encourage you to complete and mail your proxy ballot promptly. No postage is necessary if you mail it in the United States. Alternatively, you may vote by calling the toll-free number printed on your proxy ballot, or via the Internet according to the enclosed voting instructions. If you have any questions about the proxy materials, or the Reorganization, please call your trust officer, investment professional, or Wells Fargo Advantage Funds’ Investor Services at 1-800-222-8222. If you have any questions about voting your proxy you may call our proxy solicitor, The Altman Group, at 1-866-406-2287. Thank you for your participation in this important initiative. Your vote is important to us, no matter how many shares you own.
Very truly yours,
Karla M. Rabusch
President
Wells Fargo Funds Trust
2
BALANCED FUND
CORPORATE BOND FUND
HIGH YIELD BOND FUND
INTERMEDIATE GOVERNMENT INCOME FUND
NATIONAL LIMITED-TERM TAX-FREE FUND
NATIONAL TAX-FREE FUND
OVERSEAS FUND
VALUE FUND
OF
WELLS FARGO FUNDS TRUST
525 MARKET STREET
SAN FRANCISCO, CALIFORNIA 94105
NOTICE OF SPECIAL MEETING OF SHAREHOLDERS
SCHEDULED FOR JUNE 30, 2008
This is the formal notice and agenda for the special shareholder meeting (the “Meeting”) of the shareholders of each of the Wells Fargo Advantage Funds listed above (the “Funds”). The Meeting will be held at 525 Market Street, 12th Floor, San Francisco, California 94105 on June 30, 2008, at 3:00 p.m. (Pacific Time). At the Meeting, shareholders will be asked to consider and act upon the proposal set forth below and transact such other business as may properly come before the Meeting. The table below lists the proposal on which shareholders will be asked to vote and identifies shareholders entitled to vote on the proposal.
| | |
PROPOSAL | | SHAREHOLDERS ENTITLED TO VOTE |
| Approval of an Agreement and Plan of Reorganization (the “Reorganization Plan”), under which substantially all of the assets of each Target Fund will be transferred to an Acquiring Fund as listed below in exchange for shares of the same or a comparable Class of the corresponding Acquiring Fund having equal value, which will be distributed proportionately to the shareholders of the Target Fund. | | Shareholders of each Target Fund with respect to the applicable reorganization shown below. |
| |
Target Fund | | Corresponding Acquiring Fund |
Balanced Fund | | Asset Allocation Fund |
Corporate Bond Fund | | Income Plus Fund |
High Yield Bond Fund | | High Income Fund |
Intermediate Government Income Fund | | Government Securities Fund |
National Limited-Term Tax-Free Fund | | Short-Term Municipal Bond Fund |
National Tax-Free Fund | | Municipal Bond Fund |
Overseas Fund | | International Equity Fund |
Value Fund | | C&B Large Cap Value Fund |
Shareholders of all Funds may consider and vote upon such other business as may properly come before the Meeting or any adjournment(s).
THE BOARD OF TRUSTEES UNANIMOUSLY RECOMMENDS
THAT YOU VOTE IN FAVOR OF THE PROPOSAL.
Shareholders of record of each Target Fund as of the close of business on April 18, 2008 are entitled to vote at the Meeting or any adjournment(s) thereof. Whether or not you expect to attend the Meeting, please complete and return the enclosed proxy ballot.
1
Please read the enclosed proxy materials and consider the information provided. We encourage you to complete and mail your proxy ballot promptly. No postage is necessary if you mail it in the United States. Alternatively, you may vote by calling the toll-free number printed on your proxy ballot, or via the Internet according to the enclosed voting instructions. If you have any questions about the proxy materials, or the Proposal, please call your trust officer, investment professional, or Wells Fargo Advantage Funds’ Investor Services at 1-800-222-8222. If you have any questions about voting your proxy you may call our proxy solicitor, The Altman Group, at 1-866-406-2287.
|
By Order of the Board of Trustees of Wells Fargo Funds Trust |
|
C. David Messman |
Secretary |
[May 6, 2008]
YOUR VOTE IS VERY IMPORTANT TO US REGARDLESS OF THE NUMBER OF SHARES THAT YOU ARE ENTITLED TO VOTE.
2
WELLS FARGO FUNDS TRUST
525 Market Street
San Francisco, California 94105
1-800-222-8222
COMBINED PROSPECTUS/PROXY STATEMENT
[May 6, 2008]
WHAT IS THIS DOCUMENT AND WHY ARE WE SENDING IT TO YOU?
This document is a combined prospectus and proxy statement, and we refer to it as the Prospectus/Proxy Statement. It contains the information that shareholders of the Target Funds listed in the Notice of Special Meeting of Shareholders should know before voting on the proposed Reorganization, and should be retained for future reference. It is the proxy statement of the Target Funds and also a prospectus for the Acquiring Funds.
HOW WILL THE REORGANIZATION WORK?
The Board has approved the reorganization of each Target Fund, which we refer to as the Reorganization. The Reorganization will involve three steps:
| | * | the transfer of substantially all of the assets and liabilities of the Target Fund to its corresponding Acquiring Fund in exchange for shares of the corresponding Acquiring Fund having equivalent value to the net assets transferred; |
| | * | the pro rata distribution of the same or a comparable Class of shares of the Acquiring Fund to the shareholders of record of the Target Fund as of the effective date of the Reorganization in full redemption of all shares of the Target Fund; and |
| | * | the liquidation and termination of the Target Funds. |
As a result of the Reorganization, shareholders of each Target Fund will hold shares, generally of the same or a comparable Class of the corresponding Acquiring Fund, as described in this Prospectus/Proxy Statement. The total value of the Acquiring Fund shares that you receive in the Reorganization will be the same as the total value of the shares of the Target Fund that you held immediately before the Reorganization. If one of the Target Funds does not approve the Reorganization, that Fund will not participate in the Reorganization. In such a case, the Target Fund will continue its operations beyond the date of the Reorganization and the Wells Fargo Advantage Funds’ Board of Trustees will consider what further action is appropriate, including liquidating and terminating the Target Fund as a series of Wells Fargo Advantage Funds, or considering a different reorganization.
These securities have not been approved or disapproved by the U.S. Securities and Exchange Commission (the “SEC”), nor has the SEC passed upon the accuracy or adequacy of this Prospectus/Proxy Statement. Any representation to the contrary is a criminal offense.
IS ADDITIONAL INFORMATION ABOUT THE FUNDS AND REORGANIZATION PLAN AVAILABLE?
Yes, additional information about the Funds is available in the:
| | • | | Prospectuses for the Target Funds; |
| | • | | Statements of Additional Information, or SAIs, for the Target Funds and the Acquiring Funds; and |
| | • | | Annual and Semi-Annual Reports to shareholders of the Target Funds and, as applicable, Acquiring Funds. |
1
All of these documents are on file with the SEC.
The prospectuses, SAIs, and Annual and Semi-Annual Reports of the Target Funds are incorporated by reference and are legally deemed to be part of this Prospectus/Proxy Statement. The SAI to this Prospectus/Proxy Statement, dated the same date as this Prospectus/Proxy Statement, also is incorporated by reference and is legally deemed to be part of this document. The prospectuses and the most recent Annual Report to shareholders of the Target Funds, containing audited financial statements for the most recent fiscal year, and the most recent Semi-Annual Report to shareholders of the Target Funds have been previously mailed to shareholders. The SAIs of the Acquiring Fund also are incorporated by reference and are legally deemed to be part of this Prospectus/Proxy Statement.
There also is a Reorganization Plan between the Target Funds and the Acquiring Funds that describes the technical details of how the Reorganization will be accomplished. The Reorganization Plan has been filed with the SEC as Exhibit G to this Prospectus/Proxy Statement.
Copies of these documents are available upon request without charge by writing to, calling or visiting our web site:
Wells Fargo Advantage Funds
P.O. Box 8266
Boston, MA 02266-8266
1-800-222-8222
www.wellsfargo.com/advantagefunds
You also may view or obtain these documents from the SEC:
| | |
| In Person: | | At the SEC’s Public Reference Room in Washington, D.C., and regional offices in New York City, at 233 Broadway, and in Chicago, at 175 West Jackson Boulevard, Suite 900 (duplicating fee required) |
| By Phone: | | 1-800-SEC-0330 (duplicating fee required) |
| By Mail: | | Public Reference Section Securities and Exchange Commission 100 F Street, N.E. Washington, DC 20549-0213 (duplicating fee required) |
| By Email: | | publicinfo@sec.gov (duplicating fee required) |
| By Internet: | | www.sec.gov (Information about the Target Funds and Acquiring Funds may be found under Wells Fargo Funds Trust) |
OTHER IMPORTANT THINGS TO NOTE:
| | * | An investment in the Wells Fargo Advantage Funds is not a deposit of Wells Fargo Bank, N.A. (“Wells Fargo Bank”) or any other bank and is not insured or guaranteed by the FDIC or any other government agency. |
| | * | You may lose money by investing in the Funds. |
2
TABLE OF CONTENTS
3
PROPOSAL: APPROVAL OF THE REORGANIZATION PLAN
The Board of Wells Fargo Advantage Funds called this special shareholder meeting to allow shareholders of each Target Fund to consider and vote on the reorganization of each Target Fund into a corresponding Acquiring Fund, as shown in the table below.
| | |
TARGET FUND | | ACQUIRING FUND |
| Balanced Fund | | Asset Allocation Fund |
Investor Class | | Class A |
| |
Corporate Bond Fund Investor Class Advisor Class Institutional Class | | Income Plus Fund Investor Class (new class)* Class A Institutional Class (new class)* |
| |
High Yield Bond Fund Class A Class B Class C | | High Income Fund Class A (formerly Advisor Class)* Class B (new class)* Class C (new class)* |
| |
Intermediate Government Income Fund Class A Class B Class C Administrator Class | | Government Securities Fund Class A (formerly Advisor Class)* Class B (new class)* Class C Administrator Class |
| |
National Limited-Term Tax-Free Fund Class A Class B Class C Administrator Class | | Short-Term Municipal Bond Fund Class A (new class)* Class A (new class)* Class C Class A (new class)* |
| |
National Tax-Free Fund Class A Class B Class C Administrator Class | | Municipal Bond Fund Class A Class B Class C Administrator Class |
| |
Overseas Fund Investor Class Institutional Class | | International Equity Fund Investor Class (new class)* Institutional Class |
| |
Value Fund Class A Class B Class C Investor Class Administrator Class | | C&B Large Cap Value Fund Class A Class B Class C Investor Class (formerly Class D)* Administrator Class |
| * | See “Overview” below for a discussion regarding new share classes and share class modifications. |
Overview
On November 7, 2007, the Board unanimously voted to approve the Reorganization, subject to approval by shareholders of each Target Fund. In the Reorganization, each Target Fund will transfer its assets to its corresponding Acquiring Fund, which will acquire substantially all the assets and assume substantially all the liabilities of the Target Fund. Upon the transfer of assets and assumption of liabilities, the Acquiring Fund will issue shares to the corresponding Target Fund, which shares will be distributed to shareholders in liquidation of the Target Fund. Any shares you own of a Target Fund at the time of the Reorganization will be cancelled and
4
you will receive shares in the same or a comparable Class of the corresponding Acquiring Fund having a value equal to the value of your shares of the Target Fund. The Reorganization is expected to be treated as a tax-free “reorganization” for U.S. federal income tax purposes, as discussed below under “Material U.S. Federal Income Tax Consequences of the Reorganization.” If approved by shareholders, the Reorganization is expected to occur in the third quarter of 2008.
Also on November 7, 2007, the Board unanimously voted to approve the creation of new share classes for certain of the Acquiring Funds in connection with the Reorganization as noted in the chart above. The new classes are expected to commence operations prior to or upon the closing of the Reorganization. In addition, the Board approved share class modifications whereby certain Acquiring Fund share classes will be renamed and modified to assume the features and attributes associated with a different share class as noted in the chart above. The share class modifications are expected to occur on or about June 20, 2008. Since the new share classes and share class modifications will be in effect at the time of the closing of the Reorganization, the new classes and share class modifications are described in this Prospectus/Proxy Statement as if they have already occurred.
Reasons for the Reorganization
The Reorganization arises out of Fund Management’s review of the continued viability of various funds of Wells Fargo Advantage Funds, and evaluation of whether combining Funds with similar investment objectives, principal investments, principal investment strategies or portfolio securities would better serve shareholders. The Board concluded that participation in the Reorganization is in the best interests of each Target Fund and its shareholders. In reaching that conclusion, the Board considered, among other things:
| | 1. | The enhanced viability of the combined Funds due to larger asset size; |
| | 2. | The viability of the Target Funds absent approval of the Reorganization; |
| | 3. | The comparative performance of the Acquiring Funds into which the Target Funds will be reorganized; |
| | 4. | The anticipated effect of the Reorganization on per-share expense ratios, both before and after waivers, of the Target Funds; |
| | 5. | The expected treatment of the Reorganization as a tax-free “reorganization” for U.S. federal income tax purposes; |
| | 6. | The relative compatibility of the investment objectives and principal investment strategies of the Acquiring Funds with those of the Target Funds; |
| | 7. | The anticipated benefits of economies of scale for the Target Funds and enabling greater diversification of investments. |
| | 8. | The potential elimination of duplicative costs and spreading of certain costs across a larger asset base due to combining Funds with compatible investment objectives, principal investments and principal investment strategies; and |
| | 9. | The undertaking by Funds Management to pay all expenses in connection with the Reorganization so that shareholders of the Target Funds and Acquiring Funds will not bear these expenses. |
The Board also concluded that the economic interests of the shareholders of the Target Funds and the Acquiring Funds would not be diluted as a result of the Reorganization because the number of Acquiring Fund shares to be issued to Target Fund shareholders will be calculated based on the respective net asset value of the Funds. For a more complete discussion of the factors considered by Wells Fargo Advantage Funds’ Board in approving the Reorganization, see the section entitled “Board Consideration of the Reorganization” in this Prospectus/Proxy Statement.
5
SUMMARY
The following summary highlights differences between each Target Fund and its corresponding Acquiring Fund. This summary is not complete and does not contain all of the information that you should consider before voting on the Reorganization. For more complete information, please read this Prospectus/Proxy Statement.
Comparison of Current Fees and Pro Forma Fees
The following table shows current annual fund operating expense ratios for each Target Fund and Acquiring Fund, both before (total) and after (net) any contractual expense waivers and reimbursements, and the pro forma annual operating expense ratios for each Acquiring Fund, reflecting the anticipated effects, if any, of the Reorganization on both total and net operating expenses ratios. All expense ratios are shown as a percentage of each Fund’s daily net assets and are as of the Fund’s fiscal year end dates noted below:
| | |
Fund | | Date |
Asset Allocation Fund, Balanced Fund, C&B Large Cap Value Fund, International Equity Fund, Overseas Fund | | September 30, 2007 |
| |
Corporate Bond Fund, Government Securities Fund, High Income Fund, High Yield Bond Fund, Income Plus Fund, Intermediate Government Income Fund | | May 31, 2007 |
| |
Municipal Bond Fund, National Limited-Term Tax-Free Fund, National Tax-Free Fund, Short-Term Municipal Bond Fund | | June 30, 2007 |
| |
Value Fund | | July 31, 2007 |
Two levels of expense ratios are included in the table:
| a) | Total Annual Fund Operating Expense Ratio — the total operating expenses of a fund, including acquired fund fees, if any, representing what a shareholder could potentially pay if no waivers or expense reimbursements were in place. |
| b) | Net Annual Fund Operating Expense Ratio — the expense level a shareholder can expect to actually pay, including acquired fund fees, if any, taking into account any fee waivers or expense reimbursements to which a fund’s adviser has contractually committed. |
| | | | | | | | | | | | | | | | | | | | |
| | | | |
Target Fund/Share
Class(es) | | Current | | | Acquiring Fund/Share Class(es) | | Current | | | Pro Forma | |
| | Total
Annual
Fund
Operating
Expenses* | | | Net Annual
Fund
Operating
Expenses** | | | | Total
Annual
Fund
Operating
Expenses* | | | Net Annual
Fund
Operating
Expenses** | | | Total
Annual
Fund
Operating
Expenses* | | | Net Annual
Fund
Operating
Expenses** | |
Balanced Fund | | | Asset Allocation Fund | | | | | | | |
Investor Class | | 1.57 | % | | 1.25 | % | | Class A | | 1.26 | % | | 1.15 | % | | 1.25 | % | | 1.15 | % |
| | | | | | | |
Corporate Bond Fund | | | | | | | | Income Plus Fund | | | | | | | | | | | | |
Investor Class | | 1.31 | % | | 0.98 | % | | Investor Class (new) | | 1.37 | % | | 0.95 | % | | 1.37 | % | | 0.95 | % |
Advisor Class | | 1.13 | % | | 0.95 | % | | Class A | | 1.35 | % | | 1.01 | % | | 1.24 | % | | 0.91 | % |
Institutional Class | | 0.68 | % | | 0.61 | % | | Institutional Class (new) | | 0.79 | % | | 0.62 | % | | 0.79 | % | | 0.62 | % |
| | | |
High Yield Bond Fund | | | High Income Fund | | | | | | | |
Class A | | 1.28 | % | | 1.16 | % | | Class A (formerly Advisor Class) | | 1.18 | % | | 0.91 | % | | 1.18 | % | | 0.91 | % |
Class B | | 2.03 | % | | 1.91 | % | | Class B (new) | | 1.93 | % | | 1.66 | % | | 1.93 | % | | 1.66 | % |
Class C | | 2.03 | % | | 1.91 | % | | Class C (new) | | 1.93 | % | | 1.66 | % | | 1.93 | % | | 1.66 | % |
6
| | | | | | | | | | | | | | | | | | | | |
| | | | |
Target Fund/Share
Class(es) | | Current | | | Acquiring Fund/Share Class(es) | | Current | | | Pro Forma | |
| | Total
Annual
Fund
Operating
Expenses* | | | Net Annual
Fund
Operating
Expenses** | | | | Total
Annual
Fund
Operating
Expenses* | | | Net Annual
Fund
Operating
Expenses** | | | Total
Annual
Fund
Operating
Expenses* | | | Net Annual
Fund
Operating
Expenses** | |
Intermediate Government Income Fund | | | Government Securities Fund | | | | | | | |
Class A | | 1.09 | % | | 0.95 | % | | Class A (formerly Advisor Class) | | 1.06 | % | | 0.90 | % | | 1.04 | % | | 0.90 | % |
Class B | | 1.84 | % | | 1.70 | % | | Class B (new) | | 1.81 | % | | 1.65 | % | | 1.79 | % | | 1.65 | % |
Class C | | 1.84 | % | | 1.70 | % | | Class C | | 1.81 | % | | 1.79 | % | | 1.79 | % | | 1.65 | % |
Administrator Class | | 0.91 | % | | 0.70 | % | | Administrator Class | | 0.88 | % | | 0.70 | % | | 0.86 | % | | 0.70 | % |
| | | |
National Limited-Term Tax-Free Fund | | | Short-Term Municipal Bond Fund | | | | | | | |
Class A | | 1.12 | % | | 0.81 | % | | Class A (new) | | 1.02 | % | | 0.61 | % | | 1.01 | % | | 0.61 | % |
Class B | | 1.87 | % | | 1.56 | % | | Class A (new) | | 1.02 | % | | 0.61 | % | | 1.01 | % | | 0.61 | % |
Class C | | 1.87 | % | | 1.56 | % | | Class C | | 1.77 | % | | 1.56 | % | | 1.76 | % | | 1.36 | % |
Administrator Class | | 0.94 | % | | 0.61 | % | | Class A (new) | | 1.02 | % | | 0.61 | % | | 1.01 | % | | 0.61 | % |
| | | |
National Tax-Free Fund | | | Municipal Bond Fund | | | | | | | |
Class A | | 1.07 | % | | 0.86 | % | | Class A | | 1.08 | % | | 0.76 | % | | 1.07 | % | | 0.76 | % |
Class B | | 1.82 | % | | 1.61 | % | | Class B | | 1.83 | % | | 1.51 | % | | 1.82 | % | | 1.51 | % |
Class C | | 1.82 | % | | 1.61 | % | | Class C | | 1.83 | % | | 1.51 | % | | 1.82 | % | | 1.51 | % |
Administrator Class | | 0.89 | % | | 0.61 | % | | Administrator Class | | 0.90 | % | | 0.61 | % | | 0.89 | % | | 0.61 | % |
| | | |
Overseas Fund | | | International Equity Fund | | | | | | | |
Investor Class | | 1.91 | % | | 1.46 | % | | Investor Class (new) | | 1.82 | % | | 1.46 | % | | 1.82 | % | | 1.46 | % |
Institutional Class | | 1.34 | % | | 0.95 | % | | Institutional Class | | 1.25 | % | | 1.05 | % | | 1.25 | % | | 0.99 | % |
| | | |
Value Fund | | | C&B Large Cap Value Fund | | | | | | | |
Class A | | 1.71 | % | | 1.21 | % | | Class A | | 1.31 | % | | 1.20 | % | | 1.31 | % | | 1.15 | % |
Class B | | 2.47 | % | | 1.96 | % | | Class B | | 2.06 | % | | 1.95 | % | | 2.06 | % | | 1.90 | % |
Class C | | 2.47 | % | | 1.96 | % | | Class C | | 2.06 | % | | 1.95 | % | | 2.06 | % | | 1.90 | % |
Investor Class | | 1.87 | % | | 1.21 | % | | Investor Class (formerly Class D) | | 1.43 | % | | 1.20 | % | | 1.43 | % | | 1.20 | % |
Administrator Class | | 1.52 | % | | 0.96 | % | | Administrator Class | | 1.13 | % | | 0.95 | % | | 1.13 | % | | 0.95 | % |
| * | Includes for each Fund, except the C&B Large Cap Value Fund, the pro-rata portion of the net operating expenses of any money market fund or other fund held by the Fund. For the C&B Large Cap Value Fund, includes the gross expenses allocated from the master portfolio in which the Fund invests. |
| ** | Funds Management has committed to waive fees and/or reimburse expenses for a specified period to the extent necessary to maintain the Fund’s net annual operating expense ratio as described in Exhibit A. |
In every case except for the Corporate Bond Fund — Investor Class, Advisor Class and Institutional Class into Income Plus Fund — Investor Class, Class A and Institutional Class, and Overseas Fund — Institutional Class into the International Equity Fund — Institutional Class, the Acquiring Fund will have the same or lower total and net annual fund operating expenses than the corresponding Class of the Target Fund. Please see Exhibit A for a breakdown of the specific fees charged to each Target Fund and Acquiring Fund, and more information about expenses.
Funds Management has contractually agreed to maintain the shown pro forma Net Annual Fund Operating Expense Ratio for each of the Acquiring Funds through their next annual registration update occurring after January 31, 2009. These contractual net expense ratios for the Acquiring Funds renew automatically upon expiration of the contractual commitment period, and can only be increased upon approval by the Funds’ Board.
For further discussion regarding the Board of Trustees consideration of the total and net operating expense ratios of the Funds in approving the Reorganization, see the section entitled “Board Consideration of the Reorganization” in this Prospectus/Proxy Statement.
7
Comparison of Investment Objectives, Principal Investments and Principal Investment Strategies
Each Target Fund and its corresponding Acquiring Fund pursue similar investment objectives and hold substantially similar securities, except for the limited differences noted below. As a result, the Reorganization is not expected to cause significant portfolio turnover or transaction expenses from the sale of Target Fund portfolio securities that are incompatible with the investment objective of the Acquiring Fund.
All of the Target Funds and the Acquiring Funds have investment objectives that are classified as non-fundamental, which means that the Board can change them without shareholder approval. Also, the Target Funds and Acquiring Funds have substantially identical “fundamental” investment policies that can only be changed with shareholder approval, except that the National Limited-Term Tax-Free Fund and the National Tax-Free Fund each have a fundamental investment policy to invest at least 80% of their net assets plus investment borrowings, under normal circumstances, in investments the income from which is exempt from federal income tax (including federal alternative minimum tax). In comparison, their two Acquiring Funds, the Short-Term Municipal Bond Fund and the Municipal Bond Fund, respectively, each have a fundamental investment policy to invest at least 80% of their net assets plus investment borrowings, under normal circumstances, in investments the income from which is exempt from federal income tax, but not necessarily the federal alternative minimum tax. In addition, the Asset Allocation Fund has a fundamental investment policy reserving the Fund’s right to concentrate in any industry in which the S&P 500 Index becomes concentrated to the same degree during the same period, and reserving the right to concentrate in obligations of domestic banks (to the extent permitted by the SEC or its staff and as such term is interpreted by the SEC or its staff, whereby the Balanced Fund does not have similar policies). Thus, the Reorganization will not result in a change in the Target Funds’ shareholders’ right to vote to approve changes to the investment objectives or fundamental investment policies of the Fund(s) in which they own shares, except as described above.
Unlike other Acquiring Funds involved in the Reorganization, the C&B Large Cap Value Fund is a gateway feeder fund that does not invest directly in portfolio securities. Rather, the Fund invests in a corresponding portfolio of Wells Fargo Master Trust that has the same investment objective and strategies as the Fund. The C&B Large Cap Value Fund may invest in additional master portfolios, in other Wells Fargo Advantage Funds, or directly in a portfolio of securities. References to the investment activities of the C&B Large Cap Value Fund are intended to refer to the investment activities of the master portfolio in which it invests.
The following charts compare the investment objectives, principal investments and principal investment strategies, of each Target Fund and its corresponding Acquiring Fund, and describe the key differences between the Funds. The charts are presented in summary form and, therefore, do not contain all of the information that you should consider before voting on the Reorganization. A more detailed comparison of the Funds’ investment objectives, principal investments and principal investment strategies, as well as the identity of each Fund’s investment sub-adviser and portfolio managers can be found at Exhibit B. You also can find additional information about a specific Fund’s investment objective, principal investments and principal investment strategies in its SAI, which is incorporated by reference herein. For more complete information, please read this entire document.
8
| | | | |
| | | BALANCED (TARGET FUND) | | ASSET ALLOCATION (ACQUIRING FUND) |
| Investment Objective | | Seeks total return, consisting of capital appreciation and current income. | | Seeks long-term total return, consisting of capital appreciation and current income. |
| | |
| Principal Investments | | The Fund’s target asset allocations are as follows: - 60% of its total assets in equity securities; - 40% of its total assets in fixed income securities; and - up to 10% of its total assets in below investment-grade fixed income securities. | | The Fund’s “neutral” target allocation is as follows: - 60% of its total assets in equity securities; and - 40% of its total assets in fixed income securities. |
| | |
| Principal Investment Strategies | | The Fund invests in both equity and fixed income securities. The equity portion of the Fund’s portfolio consists primarily of securities, including common and preferred stocks and convertible securities, of large-capitalization, dividend-paying, U.S. companies that offer the potential for capital growth, and attempt to balance an investment’s prospects for growth and income with its potential risks. The fixed income portion of the Fund’s portfolio consists primarily of investment-grade bonds of intermediate duration, including U.S. Government obligations, corporate securities and mortgage-backed securities. | | The Fund invests in equity and fixed income securities with an emphasis on equity securities. The Fund does not select individual securities for investment, rather it buys substantially all of the securities of various indexes to replicate such indexes. The Fund invests the equity portion of its assets in common stock to replicate the S&P 500 Index, and invests the fixed income portion of its assets in U.S. Treasury Bonds to replicate the Lehman Brothers 20+ Treasury Index. The Fund seeks to maintain a 95% or better performance correlation with the respective indexes, before fees and expenses, regardless of market conditions. |
| |
| Comparison Summary | | • Both Funds have similar investment objectives, principal investments and strategies, except that: - While each Fund invests 60% of its total assets in equity securities, the equity portion of the Target Fund invests in securities of dividend-paying, large-capitalization companies with an emphasis on value, whereas the equity portion of the Acquiring Fund invests in common stocks to replicate the S&P 500 Index and utilizes an asset allocation model that may recommend a change in the target allocation of the equity portion of the portfolio ranging between 35 and 85 percent of the Fund’s total assets. - While each Fund also invests 40% of its assets in fixed income securities, the fixed income portion of the Target Fund may include investing up to 10% of its total assets in below investment-grade fixed income securities, whereas the fixed income portion of the Acquiring Fund seeks to replicate the Lehman Brothers 20+ Treasury Index by investing in U.S. Treasury Bonds with remaining maturities of 20 years or more, and utilizes an asset allocation model that may recommend a change in the target allocation of the fixed income portion of the portfolio ranging between 15 and 65 percent of the Fund’s total assets. |
9
| | | | |
| | | CORPORATE BOND (TARGET FUND) | | INCOME PLUS (ACQUIRINGFUND) |
| Investment Objective | | Seeks current income while maintaining prospects for capital appreciation. | | Seeks to maximize income while maintaining prospects for capital appreciation. |
| | |
| Principal Investments | | Under normal circumstances, the Fund invests: - at least 80% of its net assets in corporate debt securities; - up to 35% of its total assets in U.S. dollar-denominated debt securities of foreign issuers; and - up to 25% of its total assets in below investment-grade debt securities. | | Under normal circumstances, the Fund invests: - at least 80% of its net assets in income-producing securities; - up to 35% of its total assets in debt securities that are below investment-grade; and - up to 25% of its total assets in debt securities of foreign issuers. |
| | |
| Principal Investment Strategies | | The Fund invests principally in corporate debt securities. The Fund may invest in investment-grade and below investment-grade debt securities (often called “high-yield” securities or “junk bonds”), as well as in debt securities of both domestic and foreign issuers. As part of the Fund’s below investment-grade debt securities investment strategy, the Fund will generally invest in securities that are rated BB through C by Standard & Poor’s, or an equivalent quality rating from another Nationally Recognized Statistical Ratings Organization, or are deemed by the Fund to be of comparable quality. The Fund may use futures, options or swap agreements, as well as other derivatives, to manage risk or to enhance return. Additionally, the Fund may invest in stripped securities. The Fund may also actively trade portfolio securities. | | The Fund invests principally in debt securities, including corporate, mortgage- and asset-backed securities, bank loans and U.S. Government obligations. These securities may have fixed, floating or variable rates and may include debt securities of both domestic and foreign issuers. The Fund invests in both investment-grade and below investment-grade debt securities. Below investment-grade debt securities (often called “high yield” securities or “junk bonds”) offer the potential for higher returns, as they generally carry a higher yield to compensate for the higher risk associated with their investment. As part of the Fund’s below investment-grade debt securities investment strategy, the Fund will generally invest in securities that are rated at least Caa by Moody’s or CCC by Standard & Poor’s, or an equivalent quality rating from another Nationally Recognized Statistical Ratings Organization, or are deemed by the Fund to be of comparable quality. The Fund expects to maintain an average credit quality for this portion of its portfolio equivalent to B or higher. The Fund may also use futures, options or swap agreements, as well as other derivatives, to manage risk or to enhance return. The Fund may actively trade portfolio securities. |
| |
| Comparison Summary | | • The Target Fund invests at least 80% of its net assets in corporate debt securities, whereas the Acquiring Fund invests at least 80% of its net assets in income-producing securities, including corporate, mortgage- and asset-backed securities, bank loans and U.S. Government obligations. • In other respects, both Funds have similar investment objectives, principal investments and strategies, except that: - The Target Fund invests up to 35% of its total assets in U.S. dollar-denominated debt securities of foreign issuers, whereas the Acquiring Fund invests up to 25% of its total assets in debt securities of foreign issuers that do not need to be U.S. dollar-denominated. - The Target Fund invests up to 25% of its total assets in below investment-grade debt securities, whereas the Acquiring Fund may invest a higher percentage, up to 35% of its total assets, in below investment-grade debt securities. In addition, the Target Fund will generally invest in securities that are rated BB through C by Standard & Poor’s, whereas the Acquiring Fund will generally invest in securities rated at least CCC by S&P. - The Target Fund may invest in stripped securities. |
10
| | | | |
| | | HIGH YIELD BOND (TARGET FUND) | | HIGH INCOME (ACQUIRINGFUND) |
| Investment Objective | | Seeks total return, consisting of a high level of current income and capital appreciation. | | Seeks total return, consisting of a high level of current income and capital appreciation. |
| | |
| Principal Investments | | Under normal circumstances, the Fund invests: - at least 80% of its net assets in corporate debt securities that are below investment-grade; and - up to 20% of its net assets in preferred and convertible securities. | | Under normal circumstances, the Fund invests: - at least 80% of its net assets in corporate debt securities that are below investment-grade; - up to 30% of its total assets in U.S. dollar-denominated debt securities of foreign issuers; - up to 20% of its total assets in equities and convertible debt securities; and - up to 10% of its total assets in debt securities that are in default at the time of purchase. |
| | |
| Principal Investment Strategies | | The Fund invests principally in below investment-grade debt securities (often called “high yield” securities or “junk bonds”) of corporate issuers. These include traditional corporate bonds as well as bank loans. These securities may have fixed, floating or variable rates. The Fund will generally invest in below investment-grade debt securities that are rated at least Caa by Moody’s or CCC by Standard & Poor’s, or an equivalent quality rating from another Nationally Recognized Statistical Ratings Organization, or are deemed by the Fund to be of comparable quality. The average credit quality of the Fund’s portfolio is expected to be equivalent to B or higher. The Fund may also use futures, options or swap agreements, as well as other derivatives, to manage risk or to enhance return. The Fund’s portfolio is not managed to a specific maturity or duration. | | The Fund invests principally in below investment-grade debt securities (often called “high-yield” securities or “junk bonds”) of corporate issuers. These include traditional corporate bonds as well as bank loans. These securities may have fixed, floating or variable rates. As part of the Fund’s below investment-grade debt securities investment strategy, the Fund will generally invest in securities that are rated BB through CCC by S&P, or an equivalent quality rating from another Nationally Recognized Statistical Ratings Organization, or are deemed by the Fund to be of comparable quality. The Fund may also use futures, options or swap agreements, as well as other derivatives, to manage risk or to enhance return. Additionally, the Fund may invest in stripped securities. |
| |
| Comparison Summary | | • Both Funds have the same investment objective. • While both Funds invest 80% of their net assets in corporate debt securities that are below investment-grade, the Target Fund expects its portfolio’s average credit quality to be equivalent to B or higher. • The Target Fund invests up to 20% of its net assets in preferred and convertible securities, whereas the Acquiring Fund invests up to 20% of its total assets in equities and convertible debt securities. • The Acquiring Fund also invests up to 10% of its total assets in debt securities that are in default at the time of purchase, and up to 30% of its total assets in U.S. dollar-denominated debt securities of foreign issuers, whereas the Target Fund does not have a principal investment strategy of investing in such securities. • The Acquiring Fund may also invest in stripped securities. |
11
| | | | |
| | | INTERMEDIATE GOVERNMENT INCOME
(TARGET FUND) | | GOVERNMENT SECURITIES (ACQUIRINGFUND) |
| Investment Objective | | Seeks to provide current income consistent with safety of principal. | | Seeks current income. |
| | |
| Principal Investments | | Under normal circumstances, the Fund invests: - at least 80% of its net assets in U.S. Government obligations, including repurchase agreements collateralized by U.S. Government obligations; and - up to 20% of its net assets in non-government mortgage- and asset-backed securities. | | Under normal circumstances, the Fund invests: - at least 80% of its net assets in U.S. Government obligations and repurchase agreements collateralized by U.S. Government obligations; and - up to 20% of its net assets in non-government investment-grade debt securities. |
| | |
| Principal Investment Strategies | | The Fund invests principally in fixed and variable rate U.S. Government obligations, including debt securities issued or guaranteed by the U.S. Treasury, U.S. Government agencies or government-sponsored entities. The Fund will purchase only securities that are rated, at the time of purchase, within the two highest rating categories assigned by a Nationally Recognized Statistical Ratings Organization, or are deemed by the Fund to be of comparable quality. As part of the Fund’s investment strategy, the Fund may invest in stripped securities or enter into mortgage dollar rolls or reverse repurchase agreements. The Fund may also use futures, options or swap agreements, as well as other derivatives, to manage risk or to enhance return. Under normal circumstances, the Fund expects its dollar-weighted average effective duration will be within the range of 3- and 5-year U.S. Treasury notes. As a result, the dollar-weighted average effective maturity of the Fund generally ranges from 3 to 10 years. The Fund may actively trade portfolio securities. | | The Fund invests principally in U.S. Government obligations, including debt securities issued or guaranteed by the U.S. Treasury, U.S. Government agencies or government-sponsored entities. These securities may have fixed, floating or variable rates and also include mortgage-backed securities. As part of the Fund’s mortgage-backed securities investment strategy, the Fund may enter into dollar rolls or invest in stripped securities. The Fund may also use futures, options or swap agreements, as well as other derivatives, to manage risk or to enhance return. The Fund may actively trade portfolio securities. |
| |
| Comparison Summary | | • Both Funds have substantially similar investment objectives, principal investments and strategies, except that: - the Target Fund purchases only securities rated within the two highest rating categories (or of comparable quality), whereas, the Acquiring Fund does not have a similar policy; and - the Target Fund expects its portfolio’s dollar-weighted average effective duration to be within the range of 3- and 5-year U.S. Treasury notes and its portfolio’s dollar-weighted average effective maturity to be within the range of 3- and 10-years, whereas the Acquiring Fund does not have similar policies. |
12
| | | | |
| | | NATIONAL LIMITED-TERM TAX-FREE (TARGET FUND) | | SHORT-TERM MUNICIPAL BOND (ACQUIRINGFUND) |
| Investment Objective | | Seeks current income exempt from federal income taxes, consistent with capital preservation. | | Seeks current income exempt from federal income tax consistent with capital preservation. |
| | |
| Principal Investments | | Under normal circumstances, the Fund invests: - at least 80% of its net assets in municipal securities that pay interest exempt from federal income tax, including federal AMT; - up to 20% of its net assets in securities that pay interest subject to federal income tax, including federal AMT; and - up to 10% of its total assets in below investment-grade municipal securities. | | Under normal circumstances, the Fund invests: - at least 80% of its net assets in municipal securities that pay interest exempt from federal income tax, but not necessarily the federal AMT; - up to 20% of its net assets in securities that pay interest subject to federal AMT; and - up to 15% of its total assets in below investment-grade municipal securities. |
| | |
| Principal Investment Strategies | | The Fund invests principally in municipal securities of states, territories and possessions of the United States that pay interest exempt from federal income tax, including federal alternative minimum tax. Some of the securities may be below investment grade or may be unrated and deemed by the Fund to be of comparable quality. The Fund may also invest a portion of its net assets in securities that pay interest subject to federal AMT. The Fund may use futures, options or swap agreements, as well as other derivatives, to manage risk or to enhance return. Under normal circumstances, the Fund expects its dollar-weighted average effective maturity will be between 1 and 5 years. | | The Fund invests principally in short-term municipal securities of states, territories and possessions of the United States that pay interest exempt from federal income tax, but not necessarily the federal alternative minimum tax. Some of the securities may be below investment grade or may be unrated and deemed by the Fund to be of comparable quality. The Fund may also invest a portion of its total assets in securities that pay interest subject to federal AMT. The Fund may use futures, options or swap agreements, as well as other derivatives, to manage risk or to enhance return. Under normal circumstances, the Fund expects its dollar-weighted average effective maturity will be 3 years or less. The Fund may actively trade portfolio securities. |
| |
| Comparison Summary | | • Both Funds have substantially similar investment objectives, principal investments and strategies, except that: - The Target Fund invests at least 80% of its net assets in municipal securities that pay interest exempt from federal income tax, including federal AMT, whereas the Acquiring Fund invests at least 80% of its net assets in municipal securities that pay interest exempt from federal income tax, but not necessarily the federal AMT, although the Acquiring Fund does have an additional policy limiting its investments in securities that pay interest subject to federal AMT to 20% of its net assets. - While both Funds may invest in below investment-grade municipal securities, the Target Fund may invest up to 10% of its total assets in such securities, whereas the Acquiring Fund may invest up to 15% of its total assets in such securities. - The Target Fund expects its dollar-weighted average effective maturity to be between 1 and 5 years, whereas the Acquiring Fund expects its dollar-weighted average effective maturity to be 3 years or less. |
13
| | | | |
| | | NATIONAL TAX-FREE (TARGET FUND) | | MUNICIPAL BOND (ACQUIRINGFUND) |
| Investment Objective | | Seeks current income exempt from federal income tax. | | Seeks current income exempt from federal income tax. |
| | |
| Principal Investments | | Under normal circumstances, the Fund invests: - at least 80% of its net assets in municipal securities that pay interest exempt from federal income tax, including federal AMT; - up to 20% of its net assets in securities that pay interest subject to federal income tax, including federal AMT; and - up to 10% of its total assets in below investment-grade municipal securities. | | Under normal circumstances, the Fund invests: - at least 80% of its net assets in municipal securities that pay interest exempt from federal income tax, but not necessarily the federal AMT; - up to 20% of its net assets in securities that pay interest subject to federal AMT; and - up to 20% of its total assets in below investment-grade municipal securities. |
| | |
| Principal Investment Strategies | | The Fund invests principally in municipal securities of states, territories and possessions of the United States that pay interest exempt from federal income tax, including federal alternative minimum tax. Some of the securities may be below investment grade or may be unrated and deemed by the Fund to be of comparable quality. The Fund may also invest a portion of its net assets in securities that pay interest subject to federal AMT. The Fund may use futures, options or swap agreements, as well as other derivatives, to manage risk or to enhance return. Under normal circumstances, the Fund expects its dollar-weighted average effective maturity will be greater than 5 years and less than 20 years. | | The Fund invests principally in municipal securities of states, territories and possessions of the United States that pay interest exempt from federal income tax, but not necessarily federal alternative minimum tax. Some of the securities may be below investment grade or may be unrated and deemed by us to be of comparable quality. The Fund may also invest a portion of the Fund’s total assets in securities that pay interest subject to federal AMT. The Fund may use futures, options or swap agreements, as well as other derivatives, to manage risk or to enhance return. Under normal circumstances, the Fund expects its dollar-weighted average effective maturity will be greater than 5 years and less than 20 years. |
| |
| Comparison Summary | | • Both Funds have substantially similar investment objectives, principal investments and strategies, except that: - The Target Fund invests at least 80% of its net assets in municipal securities that pay interest exempt from federal income tax, including federal AMT, whereas the Acquiring Fund invests at least 80% of its net assets in municipal securities that pay interest exempt from federal income tax, but not necessarily the federal AMT, although the Acquiring Fund does have an additional policy limiting its investments in securities that pay interest subject to federal AMT to 20% of its net assets. - While both Funds invest in below investment-grade municipal securities, the Target Fund invests up to 10% of its total assets in such securities, whereas the Acquiring Fund invests up to 20% of its total assets in such securities. |
14
| | | | |
| | | OVERSEAS (TARGET FUND) | | INTERNATIONAL EQUITY (ACQUIRINGFUND) |
| Investment Objective | | Seeks long-term capital appreciation. | | Seeks long-term capital appreciation. |
| | |
| Principal Investments | | Under normal circumstances, the Fund invests: - at least 80% of its net assets in equity securities of foreign issuers; and - up to 20% of its total assets in emerging market equity securities. | | Under normal circumstances, the Fund invests: - at least 80% of its net assets in equity securities of foreign issuers; and - up to 20% of its total assets in emerging market equity securities. |
| | |
| Principal Investment Strategies | | The Fund invests principally in equity securities of foreign issuers. The Fund invests primarily in developed countries, but may invest in emerging markets. Furthermore, the Fund may use futures, options or swap agreements, as well as other derivatives, to manage risk or to enhance return. The Fund invests in companies with strong growth potential that offer good value relative to similar investments. The Fund reserves the right to hedge its foreign currency exposure by purchasing or selling currency futures and foreign currency forward contracts. However, under normal circumstances, the Fund will not engage in extensive foreign currency hedging. | | The Fund invests principally in the equity securities of foreign issuers through the use of three different styles of international equity management: an international growth style, sub-advised by Artisan Partners Limited Partnership; an international value style, sub-advised by LSV Asset Management; and an international blend style, sub-advised by New Star Institutional Managers Limited. The Fund invests primarily in developed countries, but may invest in emerging markets. Furthermore, the Fund may use futures, options or swap agreements, as well as other derivatives, to manage risk or to enhance return. The Fund reserves the right to hedge its foreign currency exposure by purchasing or selling currency futures and foreign currency forward contracts. However, under normal circumstances, the Fund will not engage in extensive foreign currency hedging. |
| |
| Comparison Summary | | • Both Funds have the same investment objectives and principal investments, and also have similar principal investment strategies, except that the Acquiring Fund uses a multi-style investment strategy consisting of an international growth style, an international value style, and an international blend style. |
15
| | | | |
| | | VALUE (TARGET FUND) | | C&B LARGE CAP VALUE (ACQUIRINGFUND) |
| Investment Objective | | Seeks maximum long-term, after-tax total return, consistent with minimizing risk to principal. | | Seeks maximum long-term total return (current income and capital appreciation), consistent with minimizing risk to principal. |
| | |
| Principal Investments | | Under normal circumstances, the Fund invests: - at least 80% of its total assets in equity securities of large-capitalization companies. | | Under normal circumstances, the Fund invests: - at least 80% of its net assets in equity securities of large-capitalization companies. |
| | |
| Principal Investment Strategies | | The Fund invests principally in equity securities of large-capitalization companies, which the Fund defines as companies with market capitalizations of $3 billion or more. The Fund attempts to minimize adverse federal income tax consequences for the Fund’s shareholders by managing the amount of realized gains, through reduced portfolio turnover. The Fund cannot predict the impact of this strategy on the realization of gains or losses but intends to balance these tax considerations with the pursuit of its objective. The Fund manages a relatively focused portfolio of 30 to 50 companies that enables it to provide adequate diversification, while allowing the composition and performance of its portfolio to behave differently than the market. Furthermore, the Fund may use futures, options or swap agreements, as well as other derivatives, to manage risk or to enhance return. | | The Fund is a gateway fund that invests substantially all of its assets in the C&B Large Cap Value Portfolio, a master portfolio with a substantially identical investment objective and substantially similar investment strategies. The Fund may invest in additional master portfolios, in other Wells Fargo Advantage Funds, or directly in a portfolio of securities. The Fund invests principally in equity securities of large-capitalization companies, which it defines as companies with market capitalizations of $3 billion or more. The Fund manages a relatively focused portfolio of 30 to 50 companies that enables it to provide adequate diversification while allowing the composition and performance of its portfolio to behave differently than the market. Furthermore, the Fund may use futures, options or swap agreements, as well as other derivatives, to manage risk or to enhance return. |
| |
| Comparison Summary | | • Both Funds have substantially similar investment objectives, principal investments and strategies, except that the Target Fund seeks to minimize adverse federal income tax consequences through reduced portfolio turnover. • The Acquiring Fund is a gateway fund that invests substantially all of its assets in a master portfolio, whereas the Target Fund is a stand-alone fund that invests directly in a portfolio of securities. |
16
Common and Specific Risk Considerations
Because of the similarities in investment objectives and policies, the Target Funds and the Acquiring Funds, for the most part, are subject to substantially similar investment risks. The following discussion describes the principal risks that may affect the Funds’ portfolios as a whole. The discussion that follows after that compares the principal risks associated with each Target Fund and its corresponding Acquiring Fund (in bold print). Additional information regarding which of the principal risks described below are applicable to each Fund may be found in Exhibit C, as well as in the prospectus for each Target Fund. Each Fund invests directly in a portfolio of securities, except for the C&B Large Cap Value Fund which invests substantially all of its assets in a master portfolio. An investment in a Fund is not a bank deposit, and it is not insured or guaranteed by the Federal Deposit Insurance Corporation (FDIC) or any other government agency.
Active Trading Risk Frequent trading will result in a higher-than-average portfolio turnover ratio and increased trading expenses, and may generate higher short-term capital gains.
Counter-Party Risk When a Fund enters into a repurchase agreement, an agreement where it buys a security in which the seller agrees to repurchase the security at an agreed upon price and time, the Fund is exposed to the risk that the other party will not fulfill its contract obligation. Similarly, the Fund is exposed to the same risk if it engages in a reverse repurchase agreement where a broker-dealer agrees to buy securities and the Fund agrees to repurchase them at a later date.
Currency Hedging Risk An investment transacted in a foreign currency may lose value due to fluctuations in the rate of exchange. To manage currency exposure, a Fund may purchase currency futures or enter into forward currency contracts to “lock in” the U.S. dollar price of the security. A forward currency contract involves an agreement to purchase or sell a specified currency at a specified future price set at the time of the contract. Similar to a forward currency contract, currency futures contracts are standardized for the convenience of market participants and quoted on an exchange. To reduce the risk of one party to the contract defaulting, the accrued profit or loss from a futures contract is calculated and paid on a daily basis rather than on the maturity of the contract.
Debt Securities Risk Debt securities, such as notes and bonds, are subject to credit risk and interest rate risk. Credit risk is the possibility that an issuer of an instrument will be unable to make interest payments or repay principal when due. Changes in the financial strength of an issuer or changes in the credit rating of a security may affect its value. Interest rate risk is the risk that interest rates may increase, which tends to reduce the resale value of certain debt securities, including U.S. Government obligations. Debt securities with longer maturities are generally more sensitive to interest rate changes than those with shorter maturities. Changes in market interest rates do not affect the rate payable on an existing debt security, unless the instrument has adjustable or variable rate features, which can reduce its exposure to interest rate risk. Changes in market interest rates may also extend or shorten the duration of certain types of instruments, such as asset-backed securities, thereby affecting their value and the return on your investment.
Derivatives Risk The term “derivatives” covers a broad range of investments, including futures, options and swap agreements. In general, a derivative refers to any financial instrument whose value is derived, at least in part, from the price of another security or a specified index, asset or rate. For example, a swap agreement is a commitment to make or receive payments based on agreed upon terms, and whose value and payments are derived by changes in the value of an underlying financial instrument. The use of derivatives presents risks different from, and possibly greater than, the risks associated with investing directly in traditional securities. The use of derivatives can lead to losses because of adverse movements in the price or value of the underlying asset, index or rate, which may be magnified by certain features of the derivatives. These risks are heightened when the portfolio manager uses derivatives to enhance a Fund’s return or as a substitute for a position or security, rather than solely to hedge (or offset) the risk of a position or security held by the Fund. The success of management’s derivatives strategies will depend on its ability to assess and predict the impact of market or economic
17
developments on the underlying asset, index or rate and the derivative itself, without the benefit of observing the performance of the derivative under all possible market conditions.
Emerging Markets Risk Emerging markets securities typically present even greater exposure to the risks described under “Foreign Investment Risk” and may be particularly sensitive to certain economic changes. For example, emerging market countries are more often dependent on international trade and are therefore often vulnerable to recessions in other countries. Emerging markets may be under-capitalized and have less developed legal and financial systems than markets in the developed world. Additionally, emerging markets may have volatile currencies and may be more sensitive than more mature markets to a variety of economic factors. Emerging market securities also may be less liquid than securities of more developed countries and could be difficult to sell, particularly during a market downturn.
Foreign Investment Risk Foreign investments, including American Depositary Receipts (ADRs) and similar investments, are subject to more risks than U.S. domestic investments. These additional risks may potentially include lower liquidity, greater price volatility and risks related to adverse political, regulatory, market or economic developments. Foreign companies also may be subject to significantly higher levels of taxation than U.S. companies, including potentially confiscatory levels of taxation, thereby reducing the earnings potential of such foreign companies. In addition, amounts realized on sales or distributions of foreign securities may be subject to high and potentially confiscatory levels of foreign taxation and withholding when compared to comparable transactions in U.S. securities. Investments in foreign securities involve exposure to fluctuations in foreign currency exchange rates. Such fluctuations may reduce the value of the investment. Foreign investments are also subject to risks including potentially higher withholding and other taxes, trade settlement, custodial, and other operational risks and less stringent investor protection and disclosure standards in certain foreign markets. In addition, foreign markets can and often do perform differently from U.S. markets.
Growth Style Investment Risk Growth stocks can perform differently from the market as a whole and from other types of stocks. Growth stocks may be designated as such and purchased based on the premise that the market will eventually reward a given company’s long-term earnings growth with a higher stock price when that company’s earnings grow faster than both inflation and the economy in general. Thus a growth style investment strategy attempts to identify companies whose earnings may or are growing at a rate faster than inflation and the economy. While growth stocks may react differently to issuer, political, market and economic developments than the market as a whole and other types of stocks by rising in price in certain environments, growth stocks also tend to be sensitive to changes in the earnings of their underlying companies and more volatile than other types of stocks, particularly over the short term. Furthermore, growth stocks may be more expensive relative to their current earnings or assets compared to the values of other stocks, and if earnings growth expectations moderate, their valuations may return to more typical norms, causing their stock prices to fall. Finally, during periods of adverse economic and market conditions, the stock prices of growth stocks may fall despite favorable earnings trends.
High Yield Securities Risk High yield securities (sometimes referred to as “junk bonds”) are debt securities that are rated below investment-grade, are unrated and deemed by us to be below investment-grade, or are in default at the time of purchase. These securities have a much greater risk of default (or in the case of bonds currently in default, of not returning principal) and may be more volatile than higher-rated securities of similar maturity. The value of these securities can be affected by overall economic conditions, interest rates, and the creditworthiness of the individual issuers. Additionally, these securities may be less liquid and more difficult to value than higher-rated securities.
Index Tracking Risk The ability to track an index may be affected by, among other things, transaction costs and shareholder purchases and redemptions.
Issuer Risk The value of a security may decline for a number of reasons, which directly relate to the issuer, such as management performance, financial leverage, and reduced demand for the issuer’s goods and services.
18
Leverage Risk Certain transactions may give rise to a form of leverage. Such transactions may include, among others, reverse repurchase agreements, loans of portfolios securities, and the use of when-issued, delayed delivery or forward commitment transactions. The use of derivatives may also create a leveraging risk. The use of leverage may cause a Fund to liquidate portfolio positions when it may not be advantageous to do so. Leveraging, including borrowing, may cause a Fund to be more volatile than if the Fund had not been leveraged. This is because leverage tends to increase a Fund’s exposure to market risk, interest rate risk or other risks by, in effect, increasing assets available for investment.
Liquidity Risk A security may not be sold at the time desired or without adversely affecting the price.
Management Risk We cannot guarantee that a Fund will meet its investment objective. We do not guarantee the performance of a Fund, nor can we assure you that the market value of your investment will not decline. We will not “make good” on any investment loss you may suffer, nor can anyone we contract with to provide services, such as selling agents or investment advisers, offer or promise to make good on any such losses.
Market Risk The market price of securities owned by a Fund may go up or down, sometimes rapidly or unpredictably. Securities may decline in value due to factors affecting securities markets generally or particular industries represented in the securities markets. The value of a security may decline due to general market conditions which are not specifically related to a particular company, such as real or perceived adverse economic conditions, changes in the general outlook for corporate earnings, changes in interest or currency rates or adverse investor sentiment generally. They may also decline due to factors that affect a particular industry or industries, such as labor shortages or increased production costs and competitive conditions within an industry. During a general downturn in the securities markets, multiple asset classes may decline in value simultaneously. Equity securities generally have greater price volatility than debt securities.
Mortgage- and Asset-Backed Securities Risk Mortgage- and asset-backed securities represent interests in “pools” of mortgages or other assets, including consumer loans or receivables held in trust. In addition, mortgage dollar rolls are transactions in which a Fund sells mortgage-backed securities to a dealer and simultaneously agrees to purchase similar securities in the future at a predetermined price. Mortgage- and asset-backed securities, including mortgage dollar roll transactions, are subject to certain additional risks. Rising interest rates tend to extend the duration of these securities, making them more sensitive to changes in interest rates. As a result, in a period of rising interest rates, these securities may exhibit additional volatility. This is known as extension risk. In addition, these securities are subject to prepayment risk. When interest rates decline, borrowers may pay off their debts sooner than expected. This can reduce the returns of a Fund because the Fund will have to reinvest that money at the lower prevailing interest rates. This is known as contraction risk. These securities also are subject to risk of default on the underlying mortgage or assets, particularly during periods of economic downturn.
Multi-Style Management Risk Because certain portions of a Fund’s assets are managed by different portfolio managers using different styles, a Fund could experience overlapping security transactions. Certain portfolio managers may be purchasing securities at the same time other portfolio managers may be selling those same securities. This may lead to higher transaction expenses and may generate higher short-term capital gains compared to a Fund using a single investment management style.
Municipal Securities Risk Municipal securities rely on the creditworthiness or revenue production of their issuers or auxiliary credit enhancement features. Municipal securities may be difficult to obtain because of limited supply, which may increase the cost of such securities and effectively reduce a portfolio’s yield. Typically, less information is available about a municipal issuer than is available for other types of securities issuers. Certain Funds may invest 25% or more of their total assets in municipal securities that are related in such a way that political, economic or business developments affecting one obligation would affect the others. For example, a Fund may own different obligations that pay interest based on the revenue of similar projects. Although a Fund strives to invest in municipal securities and other securities with interest that is exempt from
19
federal income taxes, including federal alternative minimum tax (AMT), some income earned by Fund investments may be subject to such taxes. A Fund takes advantage of tax laws that allow the income from certain investments to be exempted from federal income tax and, in some cases, state individual income tax. Tax authorities are paying increased attention to whether interest on municipal obligations is exempt from taxation, and we cannot assure you that a tax authority will not successfully challenge the exemption of a bond held by the Fund. Capital gains, whether declared by the Fund or realized by the shareholder through the selling of Fund shares, are generally taxable.
Regulatory Risk Changes in government regulations may adversely affect the value of a security. An insufficiently regulated market might also permit inappropriate practices that adversely affect an investment.
Smaller Company Securities Risk Securities of companies with smaller market capitalizations tend to be more volatile and less liquid than larger company stocks. Smaller companies may have no or relatively short operating histories, or be newly public companies. Some of these companies have aggressive capital structures, including high debt levels, or are involved in rapidly growing or changing industries and/or new technologies, which pose additional risks.
Stripped Securities Risk Stripped securities are the separate income or principal components of debt securities. These securities are particularly sensitive to changes in interest rates, and therefore subject to greater fluctuations in price than typical interest bearing debt securities. For example, stripped mortgage-backed securities have greater interest rate risk than mortgage-backed securities with like maturities, and stripped treasury securities have greater interest rate risk than traditional government securities with identical credit ratings.
Tax Suitability Risk Investments managed with a focus on after-tax returns may not provide as high a return before taxes as other investments, and as a result may not be suitable for investors who are not subject to current income tax (for example, those investing through tax-deferred retirement accounts such as an individual retirement account (IRA) or 401(k) plan).
U.S. Government Obligations Risk Securities issued by U.S. Government agencies or government-sponsored entities may not be guaranteed by the U.S. Treasury. The Government National Mortgage Association (GNMA), a wholly owned U.S. Government corporation, is authorized to guarantee, with the full faith and credit of the U.S. Government, the timely payment of principal and interest on securities issued by institutions approved by GNMA and backed by pools of mortgages insured by the Federal Housing Administration or the Department of Veterans Affairs. U.S. Government agencies or government-sponsored entities (i.e., not backed by the full faith and credit of the U.S. Government) include the Federal National Mortgage Association (FNMA) and the Federal Home Loan Mortgage Corporation (FHLMC). Pass-through securities issued by FNMA are guaranteed as to timely payment of principal and interest by FNMA but are not backed by the full faith and credit of the U.S. Government. FHLMC guarantees the timely payment of interest and ultimate collection of principal, but its participation certificates are not backed by the full faith and credit of the U.S. Government. If a government-sponsored entity is unable to meet its obligations, the performance of a Fund that holds securities of the entity will be adversely impacted. U.S. Government obligations are viewed as having minimal or no credit risk but are still subject to interest rate risk.
Value Style Investment Risk Value stocks can perform differently from the market as a whole and from other types of stocks. Value stocks may be purchased based upon the belief that a given security may be out of favor. Value investing seeks to identify stocks that have depressed valuations, based upon a number of factors which are thought to be temporary in nature, and to sell them at superior profits when their prices rise in response to resolution of the issues which caused the valuation of the stock to be depressed. While certain value stocks may increase in value more quickly during periods of anticipated economic upturn, they may also lose value more quickly in periods of anticipated economic downturn. Furthermore, there is the risk that the factors which caused the depressed valuations are longer term or even permanent in nature, and that there will not be any rise in
20
valuation. Finally, there is the increased risk in such situations that such companies may not have sufficient resources to continue as ongoing businesses, which would result in the stock of such companies potentially becoming worthless.
Balanced Fund/Asset Allocation Fund
Both of the Funds are subject to similar risks, including debt securities risk, derivatives risk and U.S. Government obligations risk. The Asset Allocation Fund is also subject to index tracking risk and the risks associated with using an asset allocation model that assesses the relative attractiveness of equity and fixed income investments and recommends changes in the Fund’s target allocations. The Balanced Fund is also subject to foreign investment risk, high yield securities risk, mortgage- and asset-backed securities risk, and value style investment risk. The Balanced Fund is further subject to a greater degree of credit risk based on its actively-managed portfolio of fixed income securities. All of these risks are described above.
Corporate Bond Fund/Income Plus Fund
Both of the Funds are subject to substantially similar risks, including active trading risk, debt securities risk, derivatives risk, foreign investment risk, high yield securities risk. The Income Plus Fund is also subject to currency hedging risk, mortgage- and asset-backed securities risk and U.S. Government obligations risk. In addition, the Income Plus Fund is subject to a greater degree of high yield securities risk based on its higher percentage limit in investments in below investment-grade debt securities. The Corporate Bond Fund is also subject to stripped securities risk and a greater degree of foreign investment risk based on its higher percentage limit on investments in foreign issuers. However, since the Corporate Bond Fund may only invest in U.S. dollar-denominated debt securities of foreign issuers, the Fund minimizes any exposure to currency risk. All of these risks are described above.
High Yield Bond Fund/High Income Fund
Both Funds are subject to substantially similar risks, except that the High Income Fund is also subject to foreign investment risk, stripped securities risk and the risks associated with investments in securities that are in default at the time of purchase. Both of the Funds are primarily subject to counter-party risk, debt securities risk, derivatives risk, high yield securities risk, issuer risk. All of these risks are described above.
Intermediate Government Income Fund/Government Securities Fund
Because both of the Funds follow substantially similar investment policies, there are no material differences in the risks associated with investing in the Funds, except that the Government Securities Fund may have greater exposure to interest rate risk as it does not have policies similar to those of the Intermediate Government Income Fund which provide that the Intermediate Government Income Fund expects its portfolio’s dollar-weighted average effective duration to be within the range of 3- and 5-year U.S. Treasury notes and its portfolio’s dollar-weighted average effective maturity to be within 3 to 10 years. Both of the Funds are primarily subject to debt securities risk, derivatives risk, mortgage- and asset-backed securities risk, stripped securities risk and U.S. Government obligations risk. All of these risks are described above.
National Limited-Term Tax-Free Fund/Short-Term Municipal Bond Fund
Both Funds are subject to substantially similar risks, except that the Short-Term Municipal Bond Fund is also subject to active trading risk and a greater degree of high yield securities risk based on its higher percentage limit on investments in below investment-grade municipal securities. In addition, the National Limited-Term Tax-Free Fund may have slightly greater exposure to interest rate risk as the Fund expects its dollar-weighted average effective maturity to be between 1 and 5 years, whereas the Short-Term Municipal Bond Fund expects its dollar-weighted average effective maturity to be 3 years or less. Both of the Funds are primarily subject to debt securities risk, derivatives risk, high yield securities risk, municipal securities risk. All of these risks are described above.
21
National Tax-Free Fund/Municipal Bond Fund
Both Funds are subject to substantially similar risks, except that the Municipal Bond Fund is also subject to active trading risk and a greater degree of high yield securities risk based on its higher percentage limit on investments in below investment-grade municipal securities. Both of the Funds are primarily subject to debt securities risk, derivatives risk, high yield securities risk, municipal securities risk. All of these risks are described above.
Overseas Fund/International Equity Fund
Because both of the Funds follow substantially similar investment policies and restrictions, there are no material differences in the risks associated with investing in the Funds. Both of the Funds are primarily subject to currency hedging risk, derivatives risk, emerging markets risk, foreign investment risk. Because of its multi-style investment strategy, the International Equity Fund is subject to multi-style management risk and although both of the funds are subject to growth style investment risk and value style investment risk, the International Equity Fund may be subject to such risks to a greater degree given its multi-style investment strategy. All of these risks are described above.
Value Fund/C&B Large Cap Value Fund
Both Funds are subject to substantially similar risks, except that the Value Fund is also subject to tax suitability risk. Both Funds are primarily subject to derivatives risk and value style investment risk, as described above.
Comparison of Performance
The information in this section shows you how each Target Fund and Acquiring Fund has performed and illustrates the variability of a Fund’s returns over time. The tables below provide a comparison of average annual total return information for each Class of the Funds involved in the Reorganization for one-, three-, five- and ten-year periods (or since inception of the Fund, if shorter).
For more information regarding a Fund’s average annual total return, see the “Performance” and “Financial Highlights” of each of the Acquiring Funds and certain of the Target Funds in Exhibit E to this Prospectus/Proxy Statement and each Target Fund’s prospectus.
Please remember that past performance is no guarantee of future results. All returns reflect the effect of fee waivers. Without these fee waivers, the average annual total returns for the Funds would have been lower. Returns reflect applicable sales charges.
Average Annual Total Returns1
As of 12/31/07
| | | | | | | | | | | | |
Fund/Class (inception date) | | 1-Year | | | 3-Years | | | 5-Years | | | 10-Years | |
Balanced Fund Asset Allocation Fund | | | | | | | | | | | | |
Investor Class (12-30-81)2 | | 5.97 | % | | 6.25 | % | | 8.51 | % | | 4.38 | % |
Class A (11-13-86) | | 1.12 | % | | 5.90 | % | | 9.65 | % | | 5.93 | % |
1 | Returns reflect applicable sales charges. |
2 | Performance shown prior to April 11, 2005, for the Investor Class shares reflects the performance of the Investor Class shares of the Strong Balanced Fund. |
22
Average Annual Total Returns1
As of 12/31/07
| | | | | | | | | | | | |
Fund/Class (inception date) | | 1-Year | | | 3-Years | | | 5-Years | | | 10-Years or
Since Inception | |
Corporate Bond Fund | | | | | | | | | | | | |
Income Plus Fund | | | | | | | | | | | | |
Investor Class (12-12-85)2 | | 4.54 | % | | 3.24 | % | | 5.36 | % | | 4.96 | % |
Investor Class (pre-Closing)3 | | 6.24 | % | | 4.30 | % | | 5.56 | % | | 4.78 | % |
Advisor Class (8-31-99)4 | | 4.58 | % | | 3.30 | % | | 5.35 | % | | 4.85 | % |
Class A (7-13-98) | | 1.50 | % | | 2.71 | % | | 4.60 | % | | 4.27 | % |
Institutional Class (8-31-99)5 | | 4.93 | % | | 3.71 | % | | 5.83 | % | | 5.34 | % |
Institutional Class (pre-Closing)3 | | 6.24 | % | | 4.30 | % | | 5.56 | % | | 4.78 | % |
1 | Returns reflect applicable sales charges. |
2 | Performance shown prior to April 11, 2005, for the Investor Class shares reflects the performance of the Investor Class shares of the Strong Corporate Bond Fund. |
3 | Performance shown reflects the performance of the Class A shares,, and includes expenses that are not applicable to and are higher than those of the Investor Class shares and Institutional Class shares, but does not include Class A sales charges. If it did include Class A sales charges, returns would be lower. The Class A shares annual returns are substantially similar to what the Investor Class shares and Institutional Class returns would be because the Investor Class shares Institutional Class shares and Class A shares are invested in the same portfolio and their returns differ only to the extent that they do not have the same sales charges and expenses. |
4 | Performance shown prior to April 11, 2005, for the Advisor Class shares reflects the performance of the Advisor Class shares of the Strong Corporate Bond Fund, the predecessor fund. Performance shown prior to the inception of the Advisor Class shares reflects the performance of the Investor Class shares of the predecessor fund, adjusted to reflect Advisor Class expenses. |
5 | Performance shown prior to April 11, 2005, for the Institutional Class shares reflects the performance of the Institutional Class shares of the Strong Corporate Bond Fund, the predecessor fund. Performance shown prior to the inception of the Institutional Class shares reflect the performance of the Investor Class shares of the predecessor fund, and includes expenses that are not applicable to and are higher than those of the Institutional Class shares. |
Average Annual Total Returns1
As of 12/31/07
| | | | | | | | | | | | |
Fund/Class (inception date) | | 1-Year | | | 3-Years | | | 5-Years | | | Since Inception | |
High Yield Bond Fund | | | | | | | | | | | | |
High Income Fund | | | | | | | | | | | | |
Class A (11-29-02) | | -2.13 | % | | 3.23 | % | | 6.67 | % | | 6.49 | % |
Class A (formerly Advisor Class) (2-29-00)2 | | -1.38 | % | | 3.72 | % | | 8.845 | % | | 3.72 | % |
Class B (11-29-02) | | -3.28 | % | | 3.15 | % | | 6.55 | % | | 6.52 | % |
Class B (pre-Closing)3 | | -2.53 | % | | 3.61 | % | | 8.87 | % | | 3.63 | % |
Class C (11-29-02) | | 0.82 | % | | 4.09 | % | | 6.88 | % | | 6.68 | % |
Class C (pre-Closing)3 | | 1.47 | % | | 4.53 | % | | 9.15 | % | | 3.63 | % |
1 | Returns reflect applicable sales charges. |
2 | Performance shown from April 11, 2005, through December 31, 2007, reflects the performance of the Advisor Class shares, adjusted to reflect Class A sales charges. Performance shown from February 29, 2000 through April 10, 2005, for the Class A shares reflects the performance of the Advisor Class shares, of the Strong High-Yield Bond Fund, the predecessor fund adjusted to reflect Class A sales charges. |
23
| | Performance shown prior to February 29, 2000, of the Class A shares, reflects the performance of the Investor Class shares of the predecessor fund, adjusted to reflect Advisor Class expenses and Class A sales charges. |
3 | Performance shown for the Class B and Class C shares reflects the performance of the Class A shares, and includes expenses that are not applicable to and lower than those of the Class B shares and higher than Class C shares, and are adjusted to reflect Class B and Class C sales charges and expenses. Class A shares incepted on August 31, 1999. Performance shown prior to the inception of the Class A shares reflects the performance of the Investor Class shares of the Strong High-Yield Bond Fund, the predecessor fund, adjusted to reflect Class A expenses. |
Average Annual Total Returns1
As of 12/31/07
| | | | | | | | | | | | |
Fund/Class (inception date) | | 1-Year | | | 3-Years | | | 5-Years | | | 10-Years or
Since Inception | |
Intermediate Government Income Fund | | | | | | | | | | | | |
Government Securities Fund | | | | | | | | | | | | |
Class A (5-2-96) | | 0.90 | % | | 1.94 | % | | 1.87 | % | | 4.32 | % |
Class A (formerly Advisor Class) (8-31-99)2 | | 2.17 | % | | 2.62 | % | | 2.74 | % | | 4.92 | % |
Class B (5-17-96) | | -0.08 | % | | 1.81 | % | | 1.66 | % | | 4.01 | % |
Class B (pre-Closing)3 | | 1.13 | % | | 2.43 | % | | 2.41 | % | | 4.52 | % |
Class C (11-8-99)4 | | 3.95 | % | | 2.75 | % | | 2.03 | % | | 4.00 | % |
Class C (12-26-02)5 | | 5.13 | % | | 2.43 | % | | 2.77 | % | | 4.52 | % |
Administrator Class (11-11-94)6 | | 6.02 | % | | 3.81 | % | | 3.07 | % | | 5.02 | % |
Administrator Class (4-11-05)7 | | 7.19 | % | | 4.48 | % | | 4.00 | % | | 5.77 | % |
1 | Returns reflect applicable sales charges. |
2 | Performance shown from April 11, 2005, through December 31, 2007, reflects the expenses of the Advisor Class shares, adjusted to reflect Class A sales charges. Performance shown from August 31, 1999, through April 10, 2005, for the Class A shares reflects the performance of the Advisor Class shares of the Strong Government Securities Fund, the predecessor Fund, adjusted to reflect Class A sales charges. Performance shown prior to August 31, 1999, of the Class A shares reflects the performance of the Investor Class shares of the predecessor fund, adjusted to reflect Advisor Class expenses and Class A sales charges. |
3 | Performance shown reflects the performance of the Class C shares, and includes expenses that are not applicable to and are higher than those of the Class B shares, adjusted to reflect Class B sales charges. |
4 | Performance shown prior to the inception of the Class C shares reflects the performance of the Class A shares, adjusted to reflect Class C sales charges and expenses. |
5 | Performance shown prior to April 11, 2005, for the Class C shares reflects the performance of the Class C shares of the Strong Government Securities Fund, the predecessor fund, adjusted to reflect Class C sales charges. Performance shown prior to the inception of the Class C shares reflects the performance of the Investor class shares of the predecessor fund, adjusted to reflect Class C sales charges and expenses. |
6 | Prior to April 11, 2005, the Administrator Class was named the Institutional Class. |
7 | Performance shown prior to the inception of the Administrator Class shares reflects the performance of the Institutional Class shares of the Strong Government Securities Fund, the predecessor fund, adjusted to reflect Administrator Class expenses. Performance shown prior to August 31, 1999, for the Administrator Class shares reflects the performance of the Investor Class shares of the predecessor fund, and includes expenses that are not applicable to and are higher than those of the Administrator Class shares. |
24
Average Annual Total Returns1
As of 12/31/07
| | | | | | | | | | | | |
Fund/Class (inception date) | | 1-Year | | | 3-Years | | | 5-Years | | | 10-Years or
Since Inception | |
National Limited-Term Tax-Free Fund | | | | | | | | | | | | |
Short-Term Municipal Bond Fund | | | | | | | | | | | | |
Class A (1-30-04) 2 | | 0.40 | % | | 1.41 | % | | 1.80 | % | | 3.30 | % |
Class A (pre-Closing)3 | | -0.05 | % | | 1.44 | % | | 1.80 | % | | 2.47 | % |
Class B (1-30-04)2 | | -0.27 | % | | 1.36 | % | | 1.65 | % | | 2.83 | % |
Class A (pre-Closing)3 | | -0.05 | % | | 1.44 | % | | 1.80 | % | | 2.47 | % |
Class C (1-30-04)2 | | 1.73 | % | | 1.68 | % | | 1.62 | % | | 2.82 | % |
Class C (1-31-03)4 | | 2.04 | % | | 2.48 | % | | 2.42 | % | | 2.78 | % |
Administrator Class (10-1-96)5 | | 3.75 | % | | 2.70 | % | | 2.66 | % | | 3.86 | % |
Class A (pre-Closing)3 | | -0.05 | % | | 1.44 | % | | 1.80 | % | | 2.47 | % |
1 | Returns reflect applicable sales charges. |
2 | Performance shown prior to the inception of the Class A, Class B, and Class C shares reflects the performance of the Administrator Class shares, adjusted to reflect the Class A, Class B, and Class C sales charges and expenses, as applicable. |
3 | Performance shown reflects the performance of the Class C shares, and includes expenses that are not applicable to and are higher than those of the Class A shares, adjusted to reflect Class A sales charges. |
4 | Performance shown prior to April 11, 2005, for the Class C shares reflects the performance of the Class C shares of the Strong Short-Term Municipal Bond Fund, the predecessor fund. Performance shown prior to the inception of the Class C shares reflects the performance of the Investor Class shares of the predecessor fund, adjusted to reflect Class C sales charges and expenses. |
5 | Prior to April 11, 2005, the Administrator Class was named the Institutional Class. |
Average Annual Total Returns1
As of 12/31/07
| | | | | | | | | | | | |
Fund/Class (inception date) | | 1-Year | | | 3-Years | | | 5-Years | | | 10-Years or
Since Inception | |
National Tax-Free Fund Municipal Bond Fund | | | | | | | | | | | | |
Class A (8-1-89) | | -2.27 | % | | 2.05 | % | | 3.04 | % | | 4.08 | % |
Class A (4-11-05)2 | | -2.33 | % | | 2.69 | % | | 4.97 | % | | 3.86 | % |
Class B (8-6-93) | | -3.43 | % | | 1.91 | % | | 2.84 | % | | 3.78 | % |
Class B (4-11-05)2 | | -3.53 | % | | 2.56 | % | | 4.84 | % | | 3.58 | % |
Class C (11-8-99)3 | | 0.47 | % | | 2.86 | % | | 3.20 | % | | 3.77 | % |
Class C (4-11-05)2 | | 0.36 | % | | 3.47 | % | | 5.15 | % | | 3.57 | % |
Administrator Class (8-2-93)4 | | 2.59 | % | | 3.89 | % | | 4.23 | % | | 4.76 | % |
Administrator Class (4-11-05)5 | | 2.48 | % | | 4.59 | % | | 6.13 | % | | 4.46 | % |
1 | Returns reflect applicable sales charges. |
2 | Performance shown prior to the inception of the Class A, Class B, and Class C shares reflects the performance of the Investor Class shares of the Strong Municipal Bond Fund, adjusted to reflect Class A, Class B, and Class C sales charges and expenses, as applicable. |
3 | Performance shown prior to the inception of the Class C shares reflects performance of the Class A shares, adjusted to reflect Class C sales charges and expenses. |
4 | Prior to April 11, 2005, the Administrator Class was named the Institutional Class. |
25
5 | Performance shown prior to the inception of the Administrator Class shares reflects the performance of the Investor Class shares of the Strong Municipal Bond Fund and includes expenses that are not applicable to and are higher than those of the Administrator Class shares. |
Average Annual Total Returns1
As of 12/31/07
| | | | | | | | | | | | |
Fund/Class (inception date) | | 1-Year | | | 3-Years | | | 5-Years | | | Since
Inception | |
Overseas Fund International Equity Fund | | | | | | | | | | | | |
Investor Class (6-30-98)2 | | 11.88 | % | | 13.10 | % | | 17.73 | % | | 7.56 | % |
Investor Class (pre-Closing)3 | | 10.70 | % | | 15.50 | % | | 17.08 | % | | 7.69 | % |
Institutional Class (12-31-02)4 | | 12.41 | % | | 13.70 | % | | 18.40 | % | | 7.88 | % |
Institutional Class (8-31-06)5 | | 11.19 | % | | 15.90 | % | | 17.40 | % | | 7.93 | % |
1 | Returns reflect applicable sales charges. |
2 | Performance shown prior to April 11, 2005, for the Investor Class shares reflects the performance of the Investor Class shares of the Strong Overseas Fund. |
3 | Performance shown reflects the performance of the Class A shares, and includes expenses that are not applicable to and are higher than those of the Investor Class shares, but do not include Class A sales charges. |
4 | Performance shown prior to April 11, 2005 for the Institutional Class shares reflects the performance of the Institutional Class shares of the Strong Overseas Fund, the predecessor fund. Performance shown prior to the inception of the Institutional Class shares reflects the performance of the Investor Class shares of the predecessor fund, and includes expenses that are not applicable to and are higher than those of the Institutional Class shares. |
5 | Performance shown prior to the inception of the Institutional Class shares reflects the performance of the Administrator Class shares, and includes expenses that are not applicable to and are higher than those of the Institutional Class shares. Performance shown prior to November 8, 1999, for the Institutional Class shares reflects the performance of the Class A shares, and includes expenses that are not applicable to and are higher than those of the Institutional Class shares, but does not include Class A sales charges. If it did include Class A sales charges, returns would be lower. |
Average Annual Total Returns1
As of 12/31/07
| | | | | | | | | | | | |
Fund/Class (inception date) | | 1-Year | | | 3-Years | | | 5-Years | | | 10-Years or
Since Inception | |
Value Fund C&B Large Cap Value Fund | | | | | | | | | | | | |
Class A (7-26-04)2 | | -7.34 | % | | 4.30 | % | | 10.28 | % | | 7.73 | % |
Class A (7-26-04)3 | | -7.66 | % | | 4.04 | % | | 11.08 | % | | 7.78 | % |
Class B (7-26-04)2 | | -7.48 | % | | 4.66 | % | | 10.42 | % | | 7.55 | % |
Class B (7-26-04)3 | | -7.75 | % | | 4.41 | % | | 11.31 | % | | 7.64 | % |
Class C (7-26-04)2 | | -3.47 | % | | 5.59 | % | | 10.71 | % | | 7.57 | % |
Class C (7-26-04)3 | | -3.74 | % | | 5.32 | % | | 11.57 | % | | 7.65 | % |
Investor Class (2-12-97)4 | | -1.72 | % | | 6.39 | % | | 11.52 | % | | 8.34 | % |
Investor Class (formerly Class D) (5-15-90)5 | | -2.11 | % | | 6.07 | % | | 12.37 | % | | 8.41 | % |
Administrator Class (7-26-04)6 | | -1.51 | % | | 6.62 | % | | 11.71 | % | | 8.43 | % |
Administrator Class (7-26-04)7 | | -1.86 | % | | 6.35 | % | | 12.56 | % | | 8.50 | % |
1 | Returns reflect applicable sales charges. |
26
2 | Prior to December 1, 2005, the Wells Fargo Advantage Value Fund was named the Wells Fargo Advantage C&B Tax-Managed Value Fund. Performance shown prior to the inception of the Class A, Class B, and Class C shares reflects the performance of the unnamed share class of the C&B Tax-Managed Value Portfolio, the predecessor fund, adjusted to reflect Class A, Class B, and Class C sales charges and expenses, as applicable. The unnamed share class of the predecessor fund incepted on February 12, 1997. |
3 | Performance shown prior to the inception of the Class A, Class B, and Class C shares reflects the performance of the unnamed share class of the C&B Large Cap Value Portfolio, the predecessor fund, adjusted to reflect Class A, Class B, and Class C sales charges and expenses, as applicable. |
4 | Prior to December 1, 2005, the Wells Fargo Advantage Value Fund — Investor Class was named the Wells Fargo Advantage C&B Tax-Managed Value Fund — Class D shares. Performance shown prior to July 26, 2004, for the Investor Class shares reflects the performance of the unnamed share class of the C&B Tax-Managed Value Portfolio. The unnamed share class of the predecessor fund incepted on February 12, 1997. |
5 | Performance shown from July 26, 2004, through December 31, 2007, reflects the expenses of Class D. Performance shown prior to July 26, 2004, for the Investor Class shares reflects the performance of the unnamed share class of the C&B Large Cap Value Portfolio. |
6 | Prior to December 1, 2005, the Wells Fargo Advantage Value Fund was named the Wells Fargo Advantage C&B Tax-Managed Value Fund. Prior to April 11, 2005, the Administrator Class was named the Institutional Class. Performance shown prior to the inception of the Administrator Class shares reflects the performance of the unnamed share class of the C&B Tax-Managed Value Portfolio, the predecessor fund, and includes expenses that are not applicable to and are higher than those of the Administrator Class. The unnamed share class of the predecessor fund incepted on February 12, 1997. |
7 | Prior to April 11, 2005, the Administrator Class was named the Institutional Class. Performance shown prior to the inception of the Administrator Class shares reflects the performance of the unnamed share class of the C&B Large Cap Value Portfolio, and includes expenses that are not applicable to and are higher than those of the Administrator Class. |
Comparison of Shareholder Account Features and Services
The following describes, and to the extent there are differences, compares the distribution arrangements, pricing policies, class structure, purchase, redemption, and exchange policies, redemption fees, frequent purchases and redemptions of fund shares policies and procedures and distribution policies of the Funds.
Distribution Arrangements. As the principal underwriter for the Funds, Wells Fargo Funds Distributor, LLC (“Funds Distributor”), an affiliate of Funds Management, uses its best efforts to distribute shares of the Funds on a continuous basis. Fund shares may be sold through broker-dealers and others who have entered into sales agreements with the principal underwriter. Administrator Class, Advisor Class, Institutional Class, Investor Class, Class B and Class C shares of the Funds are offered for sale at the next determined net asset value per share (“NAV”). Class A shares are offered for sale at the next determined NAV per share plus, with certain exceptions, an initial sales charge. Class B and Class C shares, and Class A shares on which the initial sales charge has been waived, are subject to a contingent deferred sales charge (“CDSC”), based on a percentage of the original purchase price. A portion of the sales charges payable may be reallowed to retail dealers involved in the transaction.
The Funds that offer Class B and Class C shares have adopted a distribution plan (the “Plan”) under Section 12(b) under the 1940 Act and Rule 12b-1 for their Class B and Class C shares. The Plan was adopted by the Wells Fargo Advantage Funds Board, including a majority of the Trustees who were not “interested persons” (as defined under the 1940 Act) of the Funds and who had no direct or indirect financial interest in the operation of the Plan or in any agreement related to the Plan. Under the Plan and pursuant to the related distribution agreement, the Class B and Class C shares of the Funds pay Funds Distributor on a monthly basis, an annual fee of 0.75% of the average daily net assets attributable to each Class as compensation for distribution-related services or as reimbursement for distribution-related expenses. The actual fee payable by the Funds’ Class B and Class C shares is determined, within such limits, from time to time by mutual agreement between the Funds and
27
Funds Distributor and will not exceed the maximum sales charges payable by mutual funds sold by members of the National Association of Securities Dealers, Inc. (“NASD”) under the Conduct Rules of the NASD. Funds Distributor may enter into selling agreements with one or more selling agents (which may include Wells Fargo Bank, Funds Management and their affiliates) under which such agents may receive compensation for distribution-related services from Funds Distributor, including, but not limited to, commissions or other payments to such agents based on the average daily net assets of Fund shares attributable to their customers. Funds Distributor may retain any portion of the total distribution fee payable to compensate it for distribution-related services provided by it or to reimburse it for other distribution-related expenses.
In addition, the Funds that offer Class A, Class B, Class C, Administrator Class, Advisor Class and Investor Class shares have adopted a shareholder servicing plan and have entered into related shareholder servicing agreements with financial institutions, including Wells Fargo Bank and Funds Management. The shareholder servicing plan and related agreements were adopted by the Wells Fargo Advantage Funds’ Board, including a majority of the Trustees who were not “interested persons” (as defined under the Investment Company Act of 1940 (the “1940 Act”)) of the Funds and who had no direct or indirect financial interest in the operation of the Plan or in any agreement related to the Plan. Under the shareholder servicing plan, each Fund is authorized to make payments up to 0.25% of a Fund’s average daily net assets attributable to Class A, Class B, Class C, Administrator Class, Advisor Class and Investor Class shares. Selling or shareholder servicing agents, in turn, may pay some or all of these amounts to their employees or registered representatives who recommend or sell Fund shares or make investment decisions on behalf of their clients. If and to the extent any shareholder servicing payments are recharacterized as payments for distribution-related services, they are approved and payable under the Plan.
Pricing Policies. The NAV of a mutual fund, plus any applicable sales charges, is the price you pay for buying, selling, or exchanging shares of a Fund.
The NAV for the Funds is calculated each business day as of the close of trading on the New York Stock Exchange (“NYSE”) (generally, 4:00 p.m. Eastern Time). To calculate a Fund’s NAV, the Fund’s assets are valued and totaled, liabilities are subtracted, and the balance, called net assets, is divided by the number of shares outstanding. The price at which a purchase or redemption of Fund shares is effected is based on the next calculation of NAV after the order is placed. Each Fund does not calculate its NAV on days the NYSE is closed for trading, which include New Year’s Day, Martin Luther King, Jr. Day, Washington’s Birthday, Good Friday, Memorial Day, Independence Day, Labor Day, Thanksgiving Day and Christmas Day.
With respect to any portion of a Fund’s assets that may be invested in other mutual funds, the Fund’s NAV is calculated based upon the NAVs of the other mutual funds in which the Fund invests, and the prospectuses for those companies explain the circumstances under which those companies will use fair value pricing and the effects of using fair value pricing.
With respect to any portion of a Fund’s assets invested directly in securities, each Fund’s investments are generally valued at current market prices. Securities are generally valued based on the last sale price during the regular trading session if the security trades on an exchange (“closing price”). Securities that are not traded primarily on an exchange generally are valued using latest quoted bid prices obtained by an independent pricing service. Securities listed on the Nasdaq Stock Market, Inc., however, are valued at the Nasdaq Official Closing Price (“NOCP”), and if no NOCP is available, then at the last reported sales price.
The Funds are required to depart from these general valuation methods and use fair value pricing methods to determine the values of certain investments, if the Funds believe that the closing price or the latest quoted bid price of a security, including securities that trade primarily on a foreign exchange, does not accurately reflect its current value when the Fund calculates its NAV. In addition, the Funds use fair value pricing to determine the value of investments in securities and other assets, including illiquid securities, for which current market quotations are not readily available. The closing price or the latest quoted bid price of a security may not reflect
28
its current value if, among other things, a significant event occurs after the closing price or latest quoted bid price but before a Fund calculates its NAV that materially affects the value of the security. The Funds use various criteria, including a systematic evaluation of U.S. market moves after the close of foreign markets, in deciding whether a foreign security’s market price is still reliable and, if not, what fair market value to assign to the security.
In light of the judgment involved in fair value decisions, there can be no assurance that a fair value assigned to a particular security is accurate or that it reflects the price that a Fund could obtain for such security if it were to sell the security as of the time of fair value pricing. Such fair value pricing may result in NAVs that are higher or lower than NAVs based on the closing price or latest quoted bid price.
See the Funds’ SAIs, which are incorporated by reference herein, for further information.
Class Structure. The Funds offer a total of seven share Classes (Administrator, Advisor, Institutional, Investor, Class A, Class B and Class C), each with a different combination of sales charges, fees, eligibility requirements and other features. Each of these share Classes is described in this Prospectus/Proxy Statement.
The Class B shares of the Intermediate Government Income Fund, High Yield Bond Fund, National Tax-Free Fund, National Limited-Term Tax-Free Fund and Value Fund are closed to new investors and additional investments from existing shareholders, with certain exceptions. The Class B shares of the C&B Large Cap Value Fund, Government Securities Fund, High Income Fund and Municipal Bond Fund are/will be similarly limited, except that each of these Acquiring Funds will issue Class B shares to the shareholders of its corresponding Target Fund Class in order to effectuate the contemplated Reorganization.
Class A
You can buy Class A shares of the Funds at the public offering price (“POP”), which is the NAV plus an up-front sales charge. You may qualify for a reduced sales charge or the sales charge may be waived. The dollar amount of the sales charge is the difference between the POP of the shares purchased (based on the applicable sales charge in the tables below) and the NAV of those shares. Because of rounding in the calculation of the POP, the actual sales charge you pay may be more or less than that calculated using the percentages shown below. Funds Distributor retains the up-front sales charge and the service fee on accounts with no authorized dealer of record. The Funds up-front Class A sales charges are as follows:
| | | | | | |
Equity Funds | |
Amount of purchase | | Front-end sales charge as a %
of public offering price | | | Front-end sales charge as a %
of net amount invested | |
Less than $50,000 | | 5.75 | % | | 6.10 | % |
$50,000 — $99,999 | | 4.75 | % | | 4.99 | % |
$100,000 — $249,999 | | 3.75 | % | | 3.90 | % |
$250,000 — $499,999 | | 2.75 | % | | 2.83 | % |
$500,000 — $999,999 | | 2.00 | % | | 2.04 | % |
$1,000,000 and over | | 0.00 | % | | 0.00 | % |
|
Fixed Income Funds | |
Amount of purchase | | Front-end sales charge as a %
of public offering price | | | Front-end sales charge as a %
of net amount invested | |
Less than $50,000 | | 4.50 | % | | 4.71 | % |
$50,000 — $99,999 | | 4.00 | % | | 4.17 | % |
$100,000 — $249,999 | | 3.50 | % | | 3.63 | % |
$250,000 — $499,999 | | 2.50 | % | | 2.56 | % |
$500,000 — $999,999 | | 2.00 | % | | 2.04 | % |
$1,000,000 and over | | 0.00 | % | | 0.00 | % |
29
| | | | | | |
National Limited-Term Tax-Free Fund | |
Amount of purchase | | Front-end sales charge as a %
of public offering price | | | Front-end sales charge as a
% of net amount invested | |
Less than $50,000 | | 3.00 | % | | 3.09 | % |
$50,000 — $99,999 | | 2.50 | % | | 2.56 | % |
$100,000 — $249,999 | | 2.00 | % | | 2.04 | % |
$250,000 — $499,999 | | 1.50 | % | | 1.52 | % |
$500,000 — $999,999 | | 1.00 | % | | 1.01 | % |
$1,000,000 and over | | 0.00 | % | | 0.00 | % |
If you invest $1 million or more in a single purchase, you are able to purchase Class A shares without an initial sales charge. However, if you sell (redeem) these shares within eighteen months from the date of purchase, you may have to pay a contingent deferred sales charge (“CDSC”) of 1% based on your original purchase price for the shares. You do not have to pay this CDSC if your financial intermediary has made arrangements with Funds Distributor and agrees to waive the commission.
Class A shares of the Funds may be purchased without an or with a reduced initial sales charge as noted below. If you believe you are eligible for any of the following reductions or waivers, it is up to you to ask the selling agent or shareholder servicing agent for the reduction or waiver and to provide appropriate proof of eligibility.
| • | | You pay no sales charges on Fund shares you buy with reinvested distributions. |
| • | | You pay a lower sales charge if you are investing an amount over a breakpoint level. See the Class A sales charge tables above. |
| • | | You pay no sales charges on Fund shares you purchase with the proceeds of a redemption of either Class A or Class B shares of the same Fund within 120 days of the date of the redemption. (Please note, you will still be charged any applicable CDSC on Class B shares you redeem.) |
| • | | By signing a Letter of Intent (“LOI”) prior to purchase, you pay a lower sales charge now in exchange for promising to invest an amount over a specified breakpoint within the next 13 months. Reinvested dividends and capital gains do not count as purchases made during this period. We will hold in escrow shares equal to approximately 5% of the amount you say you intend to buy. If you do not invest the amount specified in the LOI before the expiration date, we will redeem enough escrowed shares to pay the difference between the reduced sales load you paid and the sales load you should have paid. Otherwise, we will release the escrowed shares when you have invested the agreed amount. |
| • | | Rights of Accumulation (“ROA”) allow you to combine Class A, Class B, Class C and WealthBuilder Portfolio shares of any Wells Fargo Advantage Fund already owned (excluding Wells Fargo Advantage money market fund shares, unless you notify us that you previously paid a sales load on these assets) in order to reach breakpoint levels and to qualify for sales load discounts on subsequent purchases of Class A or WealthBuilder Portfolio shares. The purchase amount used in determining the sales charge on your purchase will be calculated by multiplying the maximum public offering price by the number of Class A, Class B, Class C and WealthBuilder Portfolio shares of any Well Fargo Advantage Fund already owned and adding the dollar amount of your current purchase. |
You may aggregate the following types of accounts indicated below to qualify for a volume discount:
| | | | |
| | | Yes | | No |
Can this type of account be aggregated? | | | | |
Individual accounts | | X | | |
Joint accounts | | X | | |
UGMA/UTMA accounts | | X | | |
Trust accounts over which the shareholders has individual or shared authority | | X | | |
Solely owned business accounts | | X | | |
30
| | | | |
| | | Yes | | No |
Retirement Plans | | | | |
Traditional and Roth IRAs | | X | | |
SEP IRAs | | X | | |
SIMPLE IRAs that use the Wells Fargo Advantage Funds prototype agreement* | | | | X |
SIMPLE IRAs that do not use the Wells Fargo Advantage Funds prototype agreement | | X | | |
403(b) Plan accounts | | X | | |
401(k) Plan accounts | | | | X |
| | |
Other Accounts | | | | |
529 Plan accounts* | | | | X |
Accounts held through other brokerage firms | | | | X |
| * | These accounts may be aggregated at the plan level for purposes of establishing eligibility for volume discounts. When plan assets in Fund Class A, Class B, Class C and WealthBuilder Portfolio shares (excluding Wells Fargo Advantage money market fund shares) reach a breakpoint, all plan participants benefit from the reduced sales charge. Participant accounts will not be aggregated with personal accounts. |
Based on the above chart, if you believe that you own Fund shares in one or more accounts that can be combined with your current purchase to achieve a sales charge breakpoint, you must, at the time of your purchase specifically identify those shares to your selling agent or shareholder servicing agent. For an account to qualify for a volume discount, it must be registered in the name of, or held for the shareholder, his or her spouse or domestic partner, as recognized by applicable state law, or his or her children under the age of 21. Class A shares purchased at NAV will not be aggregated with other Fund shares for purposes of receiving a volume discount.
We reserve the right to enter into agreements that reduce or waive sales charges for groups or classes of shareholders. If you own Fund shares as part of another account or package such as an IRA or a sweep account, you should read the materials for that account. Those terms may supercede the terms and conditions discussed here. If you fall into any of the following categories, you can buy Class A shares at NAV:
| | • | | Current and retired employees, directors/trustees and officers of: |
| | • | | Wells Fargo Advantage Funds (including any predecessor funds); |
| | • | | Wells Fargo & Company and its affiliates; and |
| | • | | family members (spouse, domestic partner, parents, grandparents, children, grandchildren and siblings (including step and in-law)) of any of the above. |
| | • | | the Fund’s transfer agent; |
| | • | | broker-dealers who act as selling agents; |
| | • | | family members (spouse, domestic partner, parents, grandparents, children, grandchildren and siblings (including step and in-law)) of any of the above; and |
| | • | | each Fund’s sub-adviser, but only for the Fund(s) for which such sub-adviser provides investment advisory services. |
| | • | | Qualified registered investment advisers who buy through a broker-dealer or service agent who has entered into an agreement with the Fund’s distributor that allows for load-waived Class A purchases. |
| | • | | Investment companies exchanging shares or selling assets pursuant to a reorganization, merger, acquisition, or exchange offer to which the Fund is a party. |
| | • | | Section 529 college savings plan accounts. |
31
| | • | | Insurance company separate accounts. |
| | • | | Fund of Funds, including those advised by Funds Management (Wells Fargo Advantage WealthBuilder PortfoliosSM), subject to review and approval by Funds Management. |
| | • | | Investors who receive annuity payments under either an annuity option or from death proceeds previously invested in a Fund may reinvest such payments or proceeds in the Fund within 120 days of receiving such distribution. |
| | • | | Investors who purchase shares that are to be included in certain retirement, benefit, pension, trust or investment “wrap accounts” or through an omnibus account maintained with a Fund by a broker-dealer. |
Class B
Class B shares are closed to new investors and additional investments from existing shareholders, except that existing shareholders of Class B shares may reinvest any distributions into Class B shares and exchange their Class B shares for Class B shares of other Wells Fargo Advantage Funds (as permitted by the Funds’ exchange policies). No new or subsequent investments, including through automatic investment plans, will be allowed in Class B shares of the Funds, except through a distribution reinvestment or permitted exchange, or, in the case of the Acquiring Funds, to effectuate the contemplated Reorganization. For Class B shares currently outstanding and Class B shares acquired upon reinvestment of dividends, all Class B shares attributes, including associated CDSC schedules, conversion features, any applicable CDSC waivers, and distribution plan and shareholder services plan fees, will continue in effect. Existing shareholders of Class B shares who redeem their shares within six years of the purchase date may pay a CDSC based on how long such shareholders have held their shares. Certain exceptions apply (see “CDSC Waivers”). The CDSC schedules are as follows;
| | | | | | | | |
Equity and Fixed Income Funds | | | | National Limited-Term Tax-Free Fund |
Year | | CDSC | | | | Year | | CDSC |
Year 1 | | 5% | | | | Year 1 | | 3.00% |
Year 2 | | 4% | | | | Year 2 | | 2.00% |
Year 3 | | 3% | | | | Year 3 | | 1.00% |
Year 4 | | 3% | | | | Year 4 | | 0.00% |
Year 5 | | 2% | | | | Year 5 | | A Shares |
Year 6 | | 1% | | | | | | |
Year 7 | | 0% | | | | | | |
Year 8 | | A Shares | | | | | | |
The CDSC percentage you pay on shares purchased prior to June 9, 2003, is applied to the lower of the NAV of the shares on the date of original purchase or the NAV of the shares on the date of redemption. For shares purchased on or after June 9, 2003, the CDSC percentage you pay is applied to the NAV of the shares on the date of original purchase.
To determine whether the CDSC applies to a redemption, the Funds will first redeem shares acquired by reinvestment of any distributions and then will redeem shares in the order in which they were purchased (such that shares held the longest are redeemed first). After shares are held for six years, and three years for the National Limited-Term Tax-Free Fund, the CDSC expires. After shares are held for seven years, and four years for the National Limited-Term Tax-Free Fund, the Class B shares are converted to Class A shares to reduce your future ongoing expenses.
All Target Fund shares exchanged in the Reorganization, except for those Class B shares reorganizing into Class A shares, will continue to be subject to the current Target Funds CDSC schedule. Any shares of the Acquiring Funds purchased after the Reorganization will be subject to the Acquiring Funds CDSC schedule.
32
Class C
You can buy Class C shares at the offering price, which is the NAV without an up-front sales charge. If you sell (redeem) your Class C shares within 1 year of the purchase date, you will pay a CDSC of 1.00%. At the time of purchase, the Fund’s distributor pays sales commissions of up to 1.00% of the purchase price to selling agents and up to 1.00% annually thereafter. The CDSC percentage you pay is applied to the NAV of the shares on the date of original purchase. Class C shares are not available for purchases of $1 million or more.
To determine whether the CDSC applies to a redemption, the Funds will first redeem shares acquired by reinvestment of any distributions and then will redeem shares in the order in which they were purchased (such that shares held the longest are redeemed first). Class C shares do not convert to Class A shares, and therefore continue to pay higher ongoing expenses.
CDSCs may be waived for certain redemptions and distributions.
CDSC Waivers
| • | | You will not be assessed a CDSC on Fund shares you redeem that were purchased with reinvested distributions. |
• | | We waive the CDSC for all redemptions made because of scheduled (Internal Revenue Code Section 72(t)(2) withdrawal schedule) or mandatory (withdrawals generally made after age 70 1/2 according to Internal Revenue Service guidelines) distributions from traditional Individual Retirement Accounts (IRAs) and certain other retirement plans. (See your retirement plan information for details.) |
| • | | We waive the CDSC for redemptions made in the event of the last surviving shareholder’s death or for a disability suffered after purchasing shares. (“Disabled” is defined in Internal Revenue Code Section 72(m)(7).) |
| • | | We waive the CDSC for redemptions made at the direction of Funds Management in order to, for example, complete a merger, or effect a Fund liquidation. |
| • | | For Class B shares purchased after May 18, 1999, for former Norwest Advantage Funds shareholders and after July 17, 1999 for former Stagecoach Funds shareholders, for all Class B shares purchased after November 8, 1999, no CDSC is imposed on withdrawals that meet both of the following circumstances: |
| | • | | withdrawals are made by participating in the Systematic Withdrawal Plan; and |
| | • | | withdrawals may not exceed 10% of your Fund assets (limit for Class B shares calculated annually based on your anniversary date in the Systematic Withdrawal Plan). |
| • | | We waive the Class C shares CDSC if the dealer of record waived its commission with a Fund’s approval. |
| • | | We waive the Class C shares CDSC where a Fund did not pay a sales commission at the time of purchase. |
We also reserve the right to enter into agreements that reduce or eliminate sales charges for groups or classes of shareholders, or for Fund shares included in other investment plans such as “wrap accounts.” If you own Fund shares as part of another account or package, such as an IRA or a sweep account, you should read the terms and conditions that apply for that account. Those terms and conditions may supercede the terms and conditions discussed here. For further information regarding CDSC waivers, contact your selling agent and see the Funds’ SAIs, which are incorporated by reference herein.
Target Fund shareholders who receive shares of an Acquiring Fund in connection with the Reorganization will not pay customary sales charges or other transaction charges for such Acquiring Fund shares. Class B shareholders of the National Limited-Term Tax-Free Fund who receive Class A shares of the Short-Term
33
Municipal Bond Fund as part of the Reorganization will no longer be subject to their existing Class B CDSC schedule. Investor Class shareholders of the Balanced Fund and Administrator Class shareholders of the National Limited-Term Tax-Free Fund who receive Class A shares of the Asset Allocation Fund and Short-Term Municipal Bond Fund, respectively, will be permitted to continue to purchase Class A shares of their respective Acquiring Fund at net asset value, i.e. without paying the customary sales load. All other Target Fund shareholders will be subject to the customary sales loads for future purchases of Acquiring Fund shares.
Information regarding the Funds’ sales charges, breakpoints, and waivers is available free of charge on the Funds Web site (www.wellsfargo.com/advantagefunds).
Administrator Class, Advisor Class, Institutional Class and Investor Class
You can buy Administrator Class, Advisor Class, Institutional Class and Investor Class shares at the offering price, which is the NAV without an up-front sales charge.
Purchase, Redemption, and Exchange Policies. The following chart describes the Funds’ classes that will be distributed in the Reorganization.
| | |
Target Fund Class | | Acquiring Fund Class |
Administrator Class | | Administrator Class or Class A(1) |
Advisor Class | | Class A(2) |
Institutional Class | | Institutional Class |
Investor Class | | Investor Class or Class A(3) |
Class A | | Class A |
Class B | | Class B or Class A(4) |
Class C | | Class C |
(1) | National Limited-Term Tax-Free Fund only. |
(2) | Corporate Bond Fund only. |
(4) | National Limited-Term Tax-Free Fund only. |
The following chart highlights the purchase, redemption, and exchange policies for each relevant Class of the Funds.
| | |
Purchase, Redemption and Exchange Policies | | Target Funds and Acquiring Funds |
| Minimum initial purchase (The Funds may waive the minimum initial investment under certain circumstances.) | | Investor Class: Regular Accounts: $2,500 IRAs, IRA rollovers, Roth IRAs: $1,000 UGMA/UTMA accounts: $1,000 Employee Sponsored Retirement Plans: no minimum Class A, Class B, and Class C: Regular Accounts: $1,000 IRAs, IRA rollovers, Roth IRAs: $250 UGMA/UTMA accounts: $50 Employee Sponsored Retirement Plans: no minimum Advisor Class Regular Accounts: $1,000 IRAs, IRA rollovers, Roth IRAs: $250 Employee Sponsored Retirement Plans: no minimum Institutional Class: $5 million/otherwise dependent on eligibility requirements* Administrator Class: $1 million/otherwise dependent on eligibility requirements** |
34
| | |
Purchase, Redemption and Exchange Policies | | Target Funds and Acquiring Funds |
Subsequent Purchases | | Investor Class, Class A, Class B and Class C: Regular Accounts: $100 IRAs, IRA rollovers, Roth IRAs: $100 UGMA/UTMA accounts: $50 Employee Sponsored Retirement Plans: no minimum Advisor Class: Regular Accounts: $100 IRAs, IRA rollovers, Roth IRAs: $100 Employee Sponsored Retirement Plans: no minimum Administrator Class and Institutional Class: no minimum |
| |
Purchases | | Investor Class, Class A, Class B and Class C: Shares may be purchased by mail, phone, through an Automatic Investment Plan, by Payroll Direct Deposit, at the Investor Center, online, by wire, or through a financial intermediary, subject to certain conditions. Administrator Class, Advisor Class and Institutional Class: Shares may be purchased through certain financial intermediaries and by certain institutions by phone, at the Investor Center, online, by wire, and through a financial intermediary, subject to certain conditions. |
| |
Redemptions | | Investor Class, Class A, Class B and Class C: Redemption requests may be submitted by mail, by phone, by Electronic Funds Transfer, through a Systematic Withdrawal Plan, online, at the Investor Center, by wire, or through a financial intermediary, subject to certain conditions. Administrator Class, Advisor Class and Institutional Class: Redemption requests may be submitted through certain financial intermediaries and by certain institutions by phone, by Electronic Funds Transfer, at the Investor Center, online, by wire, and through a financial intermediary, subject to certain conditions. |
| |
Exchange privileges | | In general, exchanges may be made between like share classes of any Wells Fargo Advantage Fund offered to the general public for investment (i.e. a Fund not closed to new accounts) and, you must exchange at least the minimum initial purchase amount for the new fund. In addition, Class A shares of a non-money market fund may be exchanged for Service Class shares of any money market fund. Class C shares of a non-money market Fund may be exchanged for Class A shares of the Wells Fargo Advantage Money Market Fund. Exchanges may be made through an Automatic Exchange Plan, subject to certain conditions. |
* | The following entities are eligible to purchase Institutional Class shares: employee benefit plan programs that have at least $100 million in plan assets; broker-dealer managed account or wrap programs that charge an asset-based fee and have program assets of at least $100 million; registered investment adviser mutual fund wrap programs that charge an asset-based fee and have program assets of at least $100 million; Internal Revenue Code Section 529 college savings plan accounts; fund of funds including those advised by Funds Management (Wells Fargo Advantage WealthBuilder PortfoliosSM); Investment Management and Trust Departments of Wells Fargo Bank purchasing shares on behalf of their clients; and under certain circumstances and for certain groups as detailed in the Funds’ SAIs. |
35
** | The following entities are eligible to purchase Administrator Class shares: employee benefit plan programs that have at least $10 million in plan assets; broker-dealer managed account or wrap programs that charge an asset-based fee; registered investment adviser mutual fund wrap programs that charge an asset-based fee; Internal Revenue Code Section 529 college savings plan accounts; fund of funds including those advised by Funds Management (Wells Fargo Advantage WealthBuilder PortfoliosSM); Investment Management and Trust Departments of Wells Fargo Bank purchasing shares on behalf of their clients; and under certain circumstances and for certain groups as detailed in the Funds’ SAI. |
If the transfer agent receives your application in proper order before the close of the NYSE, your transactions will be priced at that day’s NAV. If your application is received after the close of trading on the NYSE, it will be priced at the next business day’s NAV. The Funds will process requests to sell shares at the first NAV calculated after a request in proper form is received by the transfer agent. Requests received before the cutoff time are processed on the same business day. The Funds reserve the right to refuse or cancel a purchase or exchange order for any reason, including if the Funds believe that doing so would be in the best interests of a Fund’s shareholders.
We normally will send out checks within one business day, and in any event no more than seven days, after we accept your request to redeem. If you redeem shares recently purchased by check or through Electronic Funds Transfer or the Automatic Investment Plan, you may be required to wait up to seven business days before we will send your redemption proceeds. Our ability to determine with reasonable certainty that investments have been finally collected is greater for investments coming from accounts with banks affiliated with Funds Management than it is for investments coming from accounts with unaffiliated banks. Redemption payments also may be delayed under extraordinary circumstances or as permitted by the SEC in order to protect remaining shareholders. Such extraordinary circumstances are discussed further in the Funds’ SAIs, which are incorporated by reference herein.
Although generally the Funds pay redemption requests in cash, the Funds reserve the right to determine in their sole discretion, whether to satisfy redemption requests by making payment in securities (known as a redemption in kind). In such case, we may pay all or part of the redemption in securities of equal value as permitted under the 1940 Act, and the rules thereunder. The redeeming shareholder should expect to incur transaction costs upon the disposition of the securities received.
If you purchased shares through a packaged investment product or retirement plan, read the directions for selling shares provided by the product or plan. There may be special requirements that supercede the directions in this Prospectus/Proxy Statement.
For a more complete discussion of the Target Funds’ purchase, redemption, and exchange policies, please see the Target Funds’ prospectuses and SAIs, which are incorporated by reference into this Prospectus/Proxy Statement.
Redemption Fees. The following table compares the redemption fees charged on the stated Funds:
| | | | | | | | | | | | |
Target Fund | | Redemption
Fee | | | Holding
Period | | Acquiring Fund | | Redemption
Fee | | | Holding
Period |
High Yield Bond Fund | | 2 | % | | 30 days | | High Income Fund | | 2 | % | | 30 days |
Overseas Fund | | 2 | % | | 30 days | | International Equity Fund | | 2 | % | | 30 days |
Value Fund | | 1 | % | | 365 days | | C&B Large Cap Value Fund | | — | | | — |
Shares of the Acquiring Funds purchased after the Reorganization will be subject to the new fees and holding periods, as shown above. Shares of the Acquiring Funds that are distributed in the Reorganization will not be subject to a redemption fee.
36
The redemption fee for a Fund is intended to compensate the Fund for the increased expenses to longer-term shareholders and the disruptive effect on the Fund’s portfolio caused by short-term investments. This redemption fee is retained by the Fund.
To determine whether the redemption fee applies, the Acquiring Fund will first redeem shares acquired by reinvestment of any distributions of net investment income and realized capital gain, and then will redeem shares in the order in which they were purchased (such that shares held the longest are redeemed first).
Please note that in certain cases, your financial intermediary or the Investor Center will need to be notified in order to waive the redemption fee. The redemption fee will be waived on sales or exchanges of Acquiring Fund shares made under the following circumstances:
| | • | | shares that were purchased with reinvested distributions; |
| | • | | in order to meet scheduled (Internal Revenue Code Section 72(t) withdrawal schedule) or mandatory distributions (withdrawals generally made after age 70 1/2 according to IRS guidelines) from traditional IRAs and certain other retirement plans. (See your retirement plan information for details); |
| | • | | in the event of the last surviving shareholder’s death or for a disability suffered after purchasing shares. (“Disability” is defined in Internal Revenue Code Section 72(m)(7)); |
| | • | | redemptions initiated by a Fund; |
| | • | | conversion of shares from one share class to another in the same Fund; |
| | • | | redemptions in connection with a non-discretionary portfolio rebalancing associated with certain wrap accounts and certain retirement plans; |
| | • | | taking out a distribution or loan from a defined contribution plan; |
| | • | | to effect, through a redemption and subsequent purchase, an account registration change within the same Fund; |
| | • | | due to participation in the Systematic Withdrawal Plan; |
| | • | | Fund of Funds, including those advised by Funds Management (Wells Fargo Advantage WealthBuilder PortfoliosSM), subject to review and approval by Funds Management; |
| | • | | transactions by Section 529 college savings plan accounts; and |
| | • | | if Funds Management determines in its discretion such a waiver is consistent with the best interests of a Fund’s shareholders. |
In addition, certain brokers, retirement plan administrators and/or fee-based program sponsors who maintain underlying shareholder accounts do not have the systems capability to track and assess redemption fees. Though these intermediaries will be asked to assess redemption fees on shareholder and participant accounts and remit these fees to the Fund, there are no assurances that all intermediaries will properly assess redemption fees. Further, a financial intermediary may apply different methodologies than those described above in assessing redemption fees or may impose their own redemption fee that may differ from the Fund’s redemption fee. If you purchase Fund shares through a financial intermediary, you should contact the intermediary for more information about whether and how redemption fees will be applied to your account.
Frequent Purchases and Redemptions of Fund Shares Policies and Procedures. The Funds reserve the right to reject any purchase or exchange order for any reason. The Funds are not designed to serve as vehicles for frequent trading. Purchases or exchanges that a Fund determines could harm the Fund may be rejected.
Excessive trading by Fund shareholders can negatively impact a Fund and its long-term shareholders in several ways, including disrupting Fund investment strategies, increasing transaction costs, decreasing tax efficiency, and diluting the value of shares held by long-term shareholders. Excessive trading in Fund shares can
37
negatively impact a Fund’s long-term performance by requiring it to maintain more assets in cash or to liquidate portfolio holdings at a disadvantageous time. Certain Funds may be more susceptible than others to these negative effects. For example, Funds that have a greater percentage of their investments in non-U.S. securities may be more susceptible than other Funds to arbitrage opportunities resulting from pricing variations due to time zone differences across international financial markets. Similarly, Funds that have a greater percentage of their investments in small company securities may be more susceptible than other Funds to arbitrage opportunities due to the less liquid nature of small company securities. Both types of Funds also may incur higher transaction costs in liquidating portfolio holdings to meet excessive redemption levels. Fair value pricing may reduce these arbitrage opportunities, thereby reducing some of the negative effects of excessive trading.
The Funds actively discourage and take steps to prevent the portfolio disruption and negative effects on long-term shareholders that can result from excessive trading activity by Fund shareholders. The Board has approved the Funds’ policies and procedures, which provide, among other things, that Funds Management may deem trading activity to be excessive if it determines that such trading activity would likely be disruptive to a Fund by increasing expenses or lowering returns. In this regard, the Funds take steps to avoid accommodating frequent purchases and redemptions of shares by Fund shareholders. Funds Management monitors available shareholder trading information across all Funds on a daily basis. Funds Management will temporarily suspend the purchase and exchange privileges of an investor who completes a purchase and redemption in a Fund within 30 calendar days. Such investor will be precluded from investing in the Fund for a period of 30 calendar days.
A financial intermediary through whom you may purchase shares of the Fund may independently attempt to identify excessive trading and take steps to deter such activity. As a result, a financial intermediary may on its own limit or permit trading activity of its customers who invest in Fund shares using standards different from the standards used by Funds Management and discussed in this Prospectus/Proxy Statement. Funds Management may permit a financial intermediary to enforce its own internal policies and procedures concerning frequent trading in instances where Funds Management reasonably believes that the intermediary’s policies and procedures effectively discourage disruptive trading activity. If you purchase Fund shares through a financial intermediary, you should contact the intermediary for more information about whether and how restrictions or limitations on trading activity will be applied to your account.
Certain purchases and redemptions made under the following circumstances will not be factored into Funds Management’s analysis of frequent trading activity including, but not limited to: reinvestment of dividends; retirement plan contributions, loans and distributions (including hardship withdrawals); non-discretionary portfolio rebalancing associated with certain wrap accounts and retirement plans; and transactions in Class 529 shares and funds of funds.
Distribution Policies. The Funds make distributions of net investment income, if any, as shown below and capital gains, if any, at least annually.
| | | | | | |
Fund | | Monthly(1) | | Quarterly | | Annually |
Income Funds and Municipal Income Funds | | X | | | | |
Allocation Funds | | | | X | | |
Equity Funds | | | | | | X |
| (1) | Intermediate Government Income Fund and Income Plus Fund distributions are accrued and paid monthly. All other Income and Municipal Income Funds distributions are accrued daily and paid monthly. |
Distributions from the Funds are automatically reinvested in additional shares unless another option is available and chosen. For the Funds’ Investor Class, Class A, Class B, and Class C shares, other options are to receive checks for these payments, have them automatically invested in another Fund, or have them deposited into your bank account. If checks remain uncashed for six months or are undeliverable by the Post Office, the distributions may be reinvested. Any distribution from a Fund returned because of an invalid banking instruction is sent to the address of record by check, and future distributions are automatically reinvested.
38
General. For more information, please read the Target Funds’ prospectuses and SAIs and the Acquiring Funds’ SAIs, which are incorporated by reference herein.
Compensation to Dealers and Shareholder Servicing Agents
In addition to dealer reallowances and payments made by each Fund for distribution and shareholder servicing, the Fund’s adviser, the distributor or their affiliates make additional payments (“Additional Payments”) to certain selling or shareholder servicing agents for the Fund, which include broker-dealers. These Additional Payments are made in connection with the sale and distribution of shares of the Fund or for services to the Fund and its shareholders. These Additional Payments, which may be significant, are paid by the Fund’s adviser, the distributor or their affiliates, out of their revenues, which generally come directly or indirectly from fees paid by the entire Fund complex.
In return for these Additional Payments, the Fund’s adviser and distributor expect to receive certain marketing or servicing advantages that are not generally available to mutual funds that do not make such payments. Such advantages are expected to include, without limitation, placement of the Fund on a list of mutual funds offered as investment options to the selling agent’s clients (sometimes referred to as “Shelf Space”); access to the selling agent’s registered representatives; and/or ability to assist in training and educating the selling agent’s registered representatives.
Certain selling or shareholder servicing agents receive these Additional Payments to supplement amounts payable by the Fund under the shareholder servicing plans. In exchange, these agents provide services including, but not limited to, establishing and maintaining accounts and records; answering inquiries regarding purchases, exchanges and redemptions; processing and verifying purchase, redemption and exchange transactions; furnishing account statements and confirmations of transactions; processing and mailing monthly statements, prospectuses, shareholder reports and other SEC-required communications; and providing the types of services that might typically be provided by a Fund’s transfer agent (e.g., the maintenance of omnibus or omnibus-like accounts, the use of the National Securities Clearing Corporation for the transmission of transaction information and the transmission of shareholder mailings).
The Additional Payments may create potential conflicts of interests between an investor and a selling agent who is recommending a particular mutual fund over other mutual funds. Before investing, you should consult with your financial consultant and review carefully any disclosure by the selling agent as to what monies they receive from mutual fund advisers and distributors, as well as how your financial consultant is compensated.
The Additional Payments are typically paid in fixed dollar amounts, or based on the number of customer accounts maintained by the selling or shareholder servicing agent, or based on a percentage of sales and/or assets under management, or a combination of the above. The Additional Payments are either up-front or ongoing or both. The Additional Payments differ among selling and shareholder servicing agents. Additional Payments to a selling agent that is compensated based on its customers’ assets typically range between 0.05% and 0.30% in a given year of assets invested in the Fund by the selling agent’s customers. Additional Payments to a selling agent that is compensated based on a percentage of sales typically range between 0.10% and 0.15% of the gross sales of the Fund attributable to the selling agent. In addition, representatives of the Fund’s distributor visit selling agents on a regular basis to educate their registered representatives and to encourage the sale of Fund shares. The costs associated with such visits may be paid for by the Fund’s adviser, distributor, or their affiliates, subject to applicable FINRA regulations.
More information on the FINRA member firms that have received the Additional Payments described in this section is available in the Funds’ SAIs, which are incorporated by reference herein.
39
Comparison of Investment Advisory Fees
Funds Management, a registered investment adviser, serves as the investment adviser for both the Target Funds and the Acquiring Funds. Thus, there will be no change in investment adviser if the Reorganization is approved. Funds Management, an indirect, wholly owned subsidiary of Wells Fargo & Company, was created to assume the mutual fund advisory responsibilities of Wells Fargo Bank and is an affiliate of Wells Fargo Bank. Wells Fargo Bank, which was founded in 1852, is the oldest bank in the western United States and is one of the largest banks in the United States. As adviser, Funds Management is responsible for implementing the investment policies and guidelines for the Funds and for supervising the sub-advisers who are responsible for the day-to-day portfolio management of the Funds. For providing these services, Funds Management is entitled to receive fees as described in the table below. A discussion regarding the basis for the Board’s approval of the investment advisory and sub-advisory agreements for the Asset Allocation Fund, C&B Large Cap Value Fund and International Equity Fund is available in the Funds’ semi-annual report for the fiscal half-year ended March 31, 2007, for the Government Securities Fund, High Income Fund and Income Plus Fund is available in the Funds’ annual report for the fiscal year ended May 31, 2007, and for the Municipal Bond Fund and Short-Term Municipal Bond Fund is available in the Funds’ annual report for the fiscal year ended June 30, 2007.
Wells Fargo & Company is a diversified financial services company providing banking, insurance, investments, mortgage and consumer finance services. The involvement of various subsidiaries of Wells Fargo & Company, including Funds Management, in the management and operation of the Funds and in providing other services or managing other accounts gives rise to certain actual and potential conflicts of interest.
For example, certain investments may be appropriate for a Fund and also for other clients advised by Funds Management and its affiliates, and there may be market or regulatory limits on the amount of investment, which may cause competition for limited positions. Also, various client and proprietary accounts may at times take positions that are adverse to a Fund. Funds Management applies various policies to address these situations, but a Fund may nonetheless incur losses or underperformance during periods when Wells Fargo & Company, its affiliates and their clients achieve profits or outperformance.
Wells Fargo & Company may have interests in or provide services to portfolio companies or Fund shareholders or intermediaries that may not be fully aligned with the interests of all investors. Funds Management and its affiliates serve in multiple roles, including as investment adviser and, for most Wells Fargo Advantage Funds, sub-adviser, as well as administrator, principal underwriter, custodian and securities lending agent.
These are all considerations of which an investor should be aware and which may cause conflicts that could disadvantage a Fund. Funds Management has instituted business and compliance policies, procedures and disclosures that are designed to identify, monitor and mitigate conflicts of interest.
The following chart highlights the annual contractual rate of investment advisory fees payable by each Target Fund and Acquiring Fund as a percentage of the Fund’s average daily net assets.
| | | | |
TARGET FUND/ACQUIRING FUND | | ADVISORY FEE (CONTRACTUAL) |
Balanced Fund | | 0.65% 0.60% 0.55% 0.525% 0.50% | | First $500M Next $500M Next $2B Next $2B Over $5B |
Asset Allocation Fund | | 0.65% 0.60% 0.55% 0.525% 0.50% | | First $500M Next $500M Next $2B Next $2B Over $5B |
40
| | | | |
TARGET FUND/ACQUIRING FUND | | ADVISORY FEE (CONTRACTUAL) |
Corporate Bond Fund | | 0.45% 0.40% 0.35% 0.325% 0.30% | | First $500M Next $500M Next $2B Next $2B Over $5B |
Income Plus Fund | | 0.55% 0.50% 0.45% 0.425% 0.40% | | First $500M Next $500M Next $2B Next $2B Over $5B |
| | |
High Yield Bond Fund | | 0.55% 0.50% 0.45% 0.425% 0.40% | | First $500M Next $500M Next $2B Next $2B Over $5B |
High Income Fund | | 0.55% 0.50% 0.45% 0.425% 0.40% | | First $500M Next $500M Next $2B Next $2B Over $5B |
| | |
Intermediate Government Income Fund | | 0.45% 0.40% 0.35% 0.325% 0.30% | | First $500M Next $500M Next $2B Next $2B Over $5B |
Government Securities Fund | | 0.45% 0.40% 0.35% 0.325% 0.30% | | First $500M Next $500M Next $2B Next $2B Over $5B |
| | |
National Limited-Term Tax-Free Fund | | 0.40% 0.35% 0.30% 0.275% 0.25% | | First $500M Next $500M Next $2B Next $2B Over $5B |
Short-Term Municipal Bond Fund | | 0.40% 0.35% 0.30% 0.275% 0.25% | | First $500M Next $500M Next $2B Next $2B Over $5B |
| | |
National Tax-Free Fund | | 0.40% 0.35% 0.30% 0.275% 0.25% | | First $500M Next $500M Next $2B Next $2B Over $5B |
Municipal Bond Fund | | 0.40% 0.35% 0.30% 0.275% 0.25% | | First $500M Next $500M Next $2B Next $2B Over $5B |
41
| | | | |
TARGET FUND/ACQUIRING FUND | | ADVISORY FEE (CONTRACTUAL) |
Overseas Fund | | 0.95% 0.90% 0.85% 0.825% 0.80% | | First $500M Next $500M Next $2B Next $2B Over $5B |
International Equity Fund | | 0.95% 0.90% 0.85% 0.825% 0.80% | | First $500M Next $500M Next $2B Next $2B Over $5B |
| | |
Value Fund | | 0.70% 0.65% 0.60% 0.575% 0.55% | | First $500M Next $500M Next $2B Next $2B Over $5B |
C&B Large Cap Value Fund1 | | 0.00% | | All asset levels |
1 | Because the C&B Large Cap Value Fund is a gateway feeder fund that invests all of its assets in a single portfolio (the C&B Large Cap Value Portfolio) of Wells Fargo Master Trust, investment advisory services are provided only at the master portfolio level. Accordingly, advisory fees are paid only at the master portfolio level, which current advisory fee rate (contractual) is identical to that of the Value Fund disclosed in the above table. This fee rate would be the proposed advisory fee rate payable to Funds Management as adviser if the C&B Large Cap Value Fund converts into a stand-alone fund. |
Wells Capital Management Incorporated (“Wells Capital Management”), an affiliate of Funds Management and an indirect wholly owned subsidiary of Wells Fargo & Company, is the investment sub-adviser for all of the Target Funds and Acquiring Funds, except for the C&B Large Cap Value Fund, International Equity Fund, Overseas Fund and Value Fund. Accordingly, Wells Capital Management is responsible for the day-to-day investment management activities of these Funds. Wells Capital Management is a registered investment adviser that provides investment advisory services for registered mutual funds, company retirement plans, foundations, endowments, trust companies, and high net-worth individuals.
Artisan Partners Limited Partnership (“Artisan”), a Milwaukee-based registered investment adviser, is one of three investment sub-advisers for the International Equity Fund. In this capacity, it is responsible for the day-to-day investment management of the Fund. Artisan is a registered investment adviser that provides investment management services to other mutual funds, corporate clients, endowments and foundations and multi-employer and public retirement plans.
Cooke & Bieler, L.P. (“Cooke & Bieler”), a Pennsylvania limited parternship, is the investment sub-adviser for the Value Fund, C&B Large Cap Value Fund and master portfolio in which the C&B Large Cap Value Fund invests its assets. Accordingly, Cooke & Bieler is responsible for the day-to-day investment management activities of these Funds. Cooke & Bieler is a registered investment adviser that provides investment management services to corporations, foundations, endowments, pension and profit sharing plans, trusts, estates and other institutions and individuals since 1951.
LSV Asset Management (“LSV”) is one of three investment sub-advisers for the International Equity Fund. In this capacity, it is responsible for the day-to-day investment management of the Fund. LSV is a registered investment adviser that provides investment management services to other mutual funds, corporate clients, endowments and foundations in addition to multi-employer and public retirement plans.
42
New Star Institutional Managers Limited (“New Star”) is a London-based U.S.-registered investment adviser that serves as an investment sub-adviser for the Overseas Fund and one of three investment sub-advisers for the International Equity Fund. In this capacity, it is responsible for the day-to-day investment management of the Funds. New Star provides investment advisory services to foreign- and U.S.-based corporate, endowment and foundation clients.
If the Overseas Fund shareholders approve the Reorganization, they will, in effect, be approving Artisan and LSV as two new investment sub-advisers in addition to New Star. For a description of the portfolio managers for the Target Funds and Acquiring Funds, see Exhibit D.
Dormant Investment Advisory Arrangement. Under the investment advisory contract for the C&B Large Cap Value Fund, Funds Management does not receive any compensation from the Fund under this arrangement as long as the Fund continues to invest, as it does today, substantially all of its assets in a single master portfolio. Under this structure, Funds Management receives only an advisory fee from the master portfolio. If the Fund were to change its investment structure so that it begins to invest substantially all of its assets in two or more master portfolios, Funds Management would be entitled to receive an annual fee of 0.25% of the Fund’s average daily net assets for providing investment advisory services to the Fund, including the determination of the asset allocations of the Fund’s investments in the various master portfolios.
Under the investment advisory contract for the C&B Large Cap Value Fund, Funds Management acts as investment adviser for the Fund’s assets redeemed from a master portfolio and invested directly in a portfolio of securities. Funds Management does not receive compensation under this arrangement as long as the Fund invests substantially all of its assets in a single master portfolio. If the Fund redeems assets from the master portfolio and invests them directly, Funds Management would be entitled to receive an investment advisory fee from the Fund for the management of those assets.
Dormant Multi-Manager Arrangement. The Board has adopted a “multi-manager” arrangement for the C&B Large Cap Value Fund, Government Securities Fund, High Income Fund, Municipal Bond Fund and Short-Term Municipal Bond Fund. Under this arrangement, a Fund and Funds Management may engage one or more sub-advisers to make day-to-day investment decisions for the Fund’s assets. Funds Management would retain ultimate responsibility (subject to the oversight of the Board) for overseeing the sub-advisers and may, at times, recommend to the Board that the Fund: (1) change, add or terminate one or more sub-advisers; (2) continue to retain a sub-adviser even though the sub-adviser’s ownership or corporate structure has changed; or (3) materially change a sub-advisory agreement with a sub-adviser.
Applicable law generally requires a Fund to obtain shareholder approval for most of these types of recommendations, even if the Board approves the proposed action. Under the “multi-manager” arrangement approved by the Board, the Fund will seek exemptive relief, if necessary, from the SEC to permit Funds Management (subject to the Board’s oversight and approval) to make decisions about the Fund’s sub-advisory arrangements without obtaining shareholder approval. The Fund will continue to submit matters to shareholders for their approval to the extent required by applicable law. Meanwhile, this multi-manager arrangement will remain dormant and will not be implemented until shareholders are further notified.
43
Other Principal Service Providers
The service providers for each of the Target Funds and Acquiring Funds are the same, except, that if the Overseas Fund shareholders approve the Reorganization, the Overseas Fund will be approving two new investment sub-advisers in addition to its current investment sub-adviser. The following is a list of principal service providers for the Target Funds and the Acquiring Funds.
| | | | |
Service Providers |
Service | | Target Funds | | Acquiring Funds |
Investment Adviser | | Wells Fargo Funds Management, LLC 525 Market Street San Francisco, CA 94105 | | Wells Fargo Funds Management, LLC 525 Market Street San Francisco, CA 94105 |
| | |
| Sub-Adviser | | Wells Capital Management Incorporated 525 Market Street San Francisco, CA 94105 (Sub-Adviser to each of the Target Funds, except the Overseas Fund and Value Fund) New Star Institutional Managers Limited 1 Knightsbridge Green, London, SW1X 7NE England (Sub-Adviser to the Overseas Fund) Cooke & Bieler, L.P. 1700 Market Street Philadelphia, PA 19103 (Sub-Adviser to the Value Fund) | | Wells Capital Management Incorporated 525 Market Street San Francisco, CA 94105 (Sub-Adviser to each of the Acquiring Funds, except the C&B Large Cap Value Fund and International Equity Fund) Cooke & Bieler, L.P. 1700 Market Street Philadelphia, PA 19103 (Sub-Adviser to the C&B Large Cap Value Fund) Artisan Partners Limited Partnership 875 E. Wisconsin Avenue, Suite 800 Milwaukee, WI 53202 (Sub-Adviser to the International Equity Fund) LSV Asset Management 1 N. Wacker Drive, Suite 4000 Chicago, IL 60606 (Sub-Adviser to the International Equity Fund) New Star Institutional Managers Limited 1 Knightsbridge Green, London, SW1X 7NE England (Sub-Adviser to the International Equity Fund) |
| | |
| Distributor | | Wells Fargo Funds Distributor, LLC 525 Market Street San Francisco, CA 94105 | | Wells Fargo Funds Distributor, LLC 525 Market Street San Francisco, CA 94105 |
| | |
| Administrator | | Wells Fargo Funds Management, LLC | | Wells Fargo Funds Management, LLC |
| | |
| Custodian | | Wells Fargo Bank, N.A. 6th St. & Marquette Minneapolis, MN 55479 | | Wells Fargo Bank, N.A. 6th St. & Marquette Minneapolis, MN 55479 |
| | |
| Fund Accountants | | PFPC, Inc. 400 Bellevue Parkway Wilmington, DE 19809 | | PFPC, Inc. 400 Bellevue Parkway Wilmington, DE 19809 |
| | |
| Transfer Agent and Dividend Disbursing Agent | | Boston Financial Data Services, Inc. 1250 Hancock Street Quincy, MA 02169 | | Boston Financial Data Services, Inc. 1250 Hancock Street Quincy, MA 02169 |
44
Terms of the Reorganization
At the effective time of the Reorganization, each Acquiring Fund will acquire substantially all of the assets and assume substantially all of the liabilities of its corresponding Target Fund in exchange for shares of equal value of such Acquiring Fund. The Reorganization is governed by the Reorganization Plan.
Each Acquiring Fund, for each share class, will issue the number of full and fractional shares determined by dividing the net value of all the assets of each respective Target Fund class by the NAV of one share of the Acquiring Fund class. Based on this calculation, Wells Fargo Advantage Funds will issue shares of each Acquiring Fund class with an aggregate NAVe equal to that of the corresponding Target Fund class. Because the C&B Large Cap Value Fund is a gateway feeder fund that invests all of its assets in a master portfolio of Wells Fargo Master Trust, the Reorganization contemplates that the C&B Large Cap Value Fund will transfer its assets to the master portfolio as an in-kind contribution in exchange for interests in the master portfolio.
The Reorganization Plan, attached as Exhibit G, provides the time for and method of determining the net value of the Target Funds’ assets and the NAV of a share of the Acquiring Funds. To determine the valuation of the assets transferred by each Target Fund and the number of shares of each Acquiring Fund to be transferred, the parties will use the standard valuation methods used by the Acquiring Funds in determining daily NAVs, which are identical to the methods used by the Target Funds. The valuation will be done immediately prior to the closing of the Reorganization, which is expected to occur on or about July 18, 2008, and will be done at the time of day the Target Funds and Acquiring Funds ordinarily calculate their NAVs.
Each Target Fund will distribute the Acquiring Fund shares it receives in the Reorganization to its shareholders. Shareholders of record of each Target Fund will be credited with shares of the corresponding Class of the corresponding Acquiring Fund equal in value to the Target Fund shares that the shareholders hold of record at the effective time of the Reorganization. Each shareholder will also have the right to receive any unpaid distributions that Wells Fargo Advantage Funds declared with respect to the shareholder’s Target Fund shares before the effective time of the Reorganization. At that time or as soon as reasonably practical after the effective time of the Reorganization, Wells Fargo Advantage Funds will dissolve and liquidate each Target Fund, and terminate each Target Fund as a series of Wells Fargo Advantage Funds in accordance with applicable law and its Declaration of Trust.
A majority of the Board may terminate the Reorganization Plan on behalf of a Target or Acquiring Fund under certain circumstances. Completion of the Reorganization is subject to numerous conditions set forth in the Reorganization Plan. An important condition to closing is that Wells Fargo Advantage Funds receives a tax opinion generally to the effect that the Reorganization will qualify as a “reorganization” for U.S. federal income tax purposes. As such, the Reorganization generally will not be taxable for such purposes to the Target Funds, the Acquiring Funds or the Target Funds’ shareholders. Another condition is that each Target Fund distributes all of its previously undistributed taxable income and recognized net capital gains to its shareholders immediately before the closing of the Reorganization. The closing is also conditioned upon both the Target Funds and Acquiring Funds receiving the necessary documents to transfer the assets and liabilities of each Target Fund to its corresponding Acquiring Fund, and to transfer the Acquiring Fund shares back to its corresponding Target Fund in exchange for the assets received.
Board Consideration of the Reorganization
Common Considerations
The Board considered the Reorganization of the Target Funds into the Acquiring Funds at its regular quarterly meetings held on August 8, 2007, and November 7, 2007. Funds Management provided materials on the Reorganization to the Board. Those materials included information on the investment objectives, principal investments and principal investment strategies of the Target Funds and the Acquiring Funds, comparative operating expense ratios, asset size, risk profile and performance information, and an analysis of the projected
45
benefits to Target Fund shareholders from the Reorganization. After discussing and considering these materials, the Board unanimously approved the Reorganization Plan and determined that the Reorganization of the Target Funds into the Acquiring Funds would be in the best interests of each Target Fund and its shareholders. The Board further determined that the interests of existing shareholders of each Fund would not be diluted as a result of the Reorganization. Consequently, the Board unanimously recommends that Target Fund shareholders vote to approve the Reorganization for the following reasons:
The combined Funds are expected to be more viable because Wells Fargo Advantage Funds will be able to concentrate its marketing efforts on the combined Funds, rather than similar but separate Funds in each case. The Target Funds generally have been experiencing net redemptions or flat or uneven asset growth while the Acquiring Funds generally have been experiencing net subscriptions, providing a further indication of their greater viability.
The Reorganization also should permit the combined Funds to diversify more broadly and take advantage of the greater purchasing power that is derived from the inclusion of additional assets. Other potential portfolio management benefits from a larger asset base include reduced trading costs and more efficient cash management.
| | * | | STREAMLINED PRODUCT LINE |
The Reorganization, together with other reorganizations currently in progress, will streamline Wells Fargo Advantage Funds by combining Funds with common or similar investment objectives, principal investments, principal investment strategies or portfolio securities. By reorganizing the Target Funds, Wells Fargo Advantage Funds is able to take steps towards eliminating duplicative costs and improving potential shareholder returns. The elimination of duplicative costs and the spreading of certain costs across a larger asset base also can lead to reductions in net operating expense ratios.
| | * | | GREATER ECONOMIES OF SCALE |
The Target Funds have the potential to benefit from greater economies of scale by, among other things, reorganizing into funds with greater assets, thereby reducing certain fixed costs (such as legal, compliance and board of trustee expenses) as a percentage of fund assets. In addition, as a result of the Reorganization, certain funds may benefit from economies of scale as a result of reaching breakpoints in fee schedules.
| | * | | COMPATIBLE OBJECTIVES AND INVESTMENT STRATEGIES |
As discussed in the section entitled “Comparison of Investment Objectives, Principal Investments and Principal Investment Strategies,” each Acquiring Fund and corresponding Target Fund have compatible investment objectives, principal investments and principal investment strategies. As a result, the Reorganization is not expected to cause significant portfolio turnover or transaction expenses from the sale of securities that are incompatible with the investment objective(s) of the Acquiring Fund. The Reorganization also is not expected to significantly alter the risk/potential return profile of any shareholder’s investment.
| | * | | COMPARATIVE PERFORMANCE |
In each reorganization, the Acquiring Fund has comparable or better total return or yield performance over most measurement periods than the corresponding Target Fund. Shareholders can consult the chart in the section entitled “Comparison of Performance” for Fund-specific performance comparisons.
46
| | * | | TOTAL AND NET OPERATING EXPENSES OF THE FUNDS |
The Board considered the total and net annual fund operating expenses for each Target Fund and corresponding Acquiring Fund. For each reorganization, the Acquiring Fund class will have a lower or equal net operating expense ratio than the corresponding class of the Target Fund, with the exception of the Institutional Class of the Overseas Fund (described more fully in the following sub-section entitled “Specific Considerations”). Thus, with this limited exception, all Target Fund shareholders will pay the same or lower fees as a result of the Reorganization. Shareholders can consult the section entitled “Comparison of Current Fees and Pro Forma Fees” for Fund-specific total and net operating expenses comparisons.
| | * | | EXPECTED TAX-FREE CONVERSION OF THE TARGET FUND SHARES |
The Board also considered the expectation that the Reorganization will be treated as a “reorganization” for U.S. federal income tax purposes. If, prior to the Reorganization, you as a Target Fund shareholder were to redeem your investment in the Target Fund and invest the proceeds in another fund or other investment product, you generally would recognize gain or loss for U.S. federal income tax purposes upon the redemption of the shares. By contrast, by participating in the Reorganization, it is expected that: (1) you will not recognize a taxable gain or a loss on the exchange of your Target Fund shares for shares of the same or a comparable Class of the corresponding Acquiring Fund; (2) you will have the same tax basis in your Acquiring Fund shares as you had in your Target Fund shares; and (3) assuming that you hold your Target Fund shares as a capital asset, the same holding period for your Acquiring Fund shares will include the period for which you held your Target Fund shares. As a shareholder of an open-end fund, you will continue to have the right to redeem any or all of your shares at net asset value at any time. At that time, you generally would recognize a gain or loss for U.S. federal income tax purposes. Shareholders should review the section entitled “Material U.S. Federal Income Tax Consequences of the Reorganization” for the material U.S. federal income tax consequences of the Reorganization.
| | * | | EXPENSES OF THE REORGANIZATION |
Funds Management has agreed to bear all of the expenses of preparing, printing, and mailing the Prospectus/Proxy Statement and related solicitation expenses for the approval of the Reorganization, so shareholders of the Target Funds and Acquiring Funds will not bear these costs.
Specific Considerations
The Board also considered certain factors specific to each Fund in concluding that the proposed Reorganization is in the best interests of each Target Fund’s shareholders. Some of the specific key factors that the Board considered for each reorganization are detailed below.
Balanced Fund/Asset Allocation Fund
The Board considered the duplicative nature of maintaining two Funds that have similar investment objectives, principal investments and principal investment strategies and “neutral” target allocations (60% of total assets in equity securities and 40% of total assets in fixed income securities). The Board considered the Balanced Fund’s continuous net redemptions and decrease in assets over the past several years and its smaller asset base (approximately $129 million) as compared to that of the Asset Allocation Fund (approximately $1.086 billion). The Board considered that the Asset Allocation Fund’s tactical allocation model could recommend a change in the Fund’s equity target allocation to between 35% and 85% of the Fund’s total assets (as compared to a static 60% for the Balanced Fund) and to between 15% and 65% of the Fund’s total assets for the fixed income target allocation (as compared to a static 40% for the Balanced Fund), possibly affecting the risk profile of the Asset Allocation Fund during these periods of deviation from the Fund’s “neutral” target allocations. However, the Board also considered that both Funds’ “neutral” target allocations are the same, that the Asset Allocation
47
Fund’s asset allocation model allows for the Fund to be more flexible in addressing changes in market conditions, and that the Asset Allocation Fund’s sub-adviser does not anticipate making a substantial number of target allocation changes. The Board also considered that the Asset Allocation Fund had better performance over all measurement periods, that both Funds are managed by the same sub-adviser, and that the Balanced Fund’s net operating expenses would be reduced with this reorganization.
Corporate Bond Fund/Income Plus Fund
The Board considered the Corporate Bond Fund’s significant net redemptions and decrease in assets over the past several years, and that the Income Plus Fund had better or comparable performance than the Corporate Bond Fund over all measurement periods. The Board also noted that the same sub-adviser manages both Funds. Although the Board noted that the Income Plus Fund’s asset base was smaller than that of the Corporate Bond Fund (approximately $51 million and $241 million, respectively), the Board recognized that the Corporate Bond Fund’s assets had significantly decreased in the last five years and that the Income Plus Fund was given the highest overall rating (5 stars) by Morningstar. The Board noted that corporate debt investment strategies are a narrow segment of the fixed income market and that the Income Plus Fund’s principal investment strategies include holding mortgage-and asset-backed securities and U.S. Government obligations in addition to corporate debt securities. The Board also considered that the net operating expenses for all share classes of the Corporate Bond Fund would be reduced or would remain the same with this reorganization.
High Yield Bond Fund/High Income Fund
The Board considered the duplicative nature of maintaining two Funds that have the same investment objectives and similar principal investments and principal investment strategies. The Board considered the High Yield Bond Fund’s smaller asset base (approximately $91 million) as compared to that of the High Income Fund (approximately $323 million). The Board noted that the High Income Fund has higher volatility than the High Yield Bond Fund, but considered that both Funds are managed by the same sub-adviser, and that the High Income Fund had better performance over all measurement periods and had a longer operating history. The Board further noted that the net operating expenses for all share classes of the High Yield Bond Fund would be reduced with this reorganization.
Intermediate Government Income Fund/Government Securities Fund
The Board considered the duplicative nature of maintaining two Funds that have substantially similar investment objectives, principal investments and principal investment strategies. The Board considered the Intermediate Government Income Fund’s continuous net redemptions and decrease in assets over the past several years, and the Intermediate Government Income Fund’s smaller asset base (approximately $362 million) as compared to that of the Government Securities Fund (approximately $1.218 billion). The Board noted that the Government Securities Fund has a duration that is one year longer than the Intermediate Government Income Fund, and thus has higher volatility than the Intermediate Government Income Fund, but considered that both Funds are managed by the same sub-adviser, and that the Government Securities Fund had better performance over all measurement periods and had a longer operating history. The Board further noted that the net operating expenses for all share classes of the Intermediate Government Income Fund would be reduced or would remain the same with this reorganization.
National Limited-Term Tax-Free Fund/Short-Term Municipal Bond Fund
The Board considered the duplicative nature of maintaining two Funds that have substantially similar investment objectives, principal investments and principal investment strategies. The Board considered the National Limited-Term Tax-Free Fund’s smaller asset base (approximately $88 million) as compared to that of the Short-Term Municipal Bond Fund (approximately $672 million). The Board also considered that both Funds are managed by the same sub-adviser and portfolio managers, and that the Short-Term Municipal Bond Fund had
48
better performance over all measurement periods, was given the highest overall rating (5 stars) by Morningstar, and had a longer operating history. The Board further noted that the net operating expenses for all share classes of the National Limited-Term Tax-Free Fund would be reduced or would remain the same with this reorganization.
National Tax-Free Fund/Municipal Bond Fund
The Board considered the duplicative nature of maintaining two Funds that have substantially similar investment objectives, principal investments and principal investment strategies. The Board considered the National Tax-Free Fund’s smaller asset base (approximately $258 million) as compared to that of the Municipal Bond Fund (approximately $395 million). The Board noted that the Municipal Bond Fund may invest a higher percentage of its assets in below investment-grade municipal securities (up to 25% of the Fund’s total assets) than the National Tax-Free Fund (up to 10% of total assets), and thus has greater potential exposure to high yield securities risk than the National Tax-Free Fund, but considered that the Municipal Bond Fund’s percentage restriction on below investment-grade municipal securities would be reduced from 25% to 20% of the Fund’s total assets with this reorganization. The Board also considered that both Funds are managed by the same sub-adviser and portfolio managers, and that the Municipal Bond Fund had better or comparable performance over all measurement periods, was given the highest overall rating (5 stars) by Morningstar, and had a longer operating history. The Board further noted that the net operating expenses for all share classes of the National Tax-Free Fund would be reduced or would remain the same with this reorganization.
Overseas Fund/International Equity Fund
The Board considered the duplicative nature of maintaining two Funds that have the same investment objectives and principal investments, and similar principal investment strategies. The Board considered the Overseas Fund’s smaller asset base (approximately $82 million) and the International Equity Fund’s continued growth in net assets, larger asset base (approximately $834 million), comparable or better performance over all measurement periods and longer operating history. The Board noted that the net operating expenses of the Institutional Class of the Overseas Fund would increase from 0.95% to 0.99% with this reorganization, but it considered that the International Equity Fund utilizes a multi-manager approach (Artisan, LSV and New Star) as compared to the Overseas Fund’s single manager approach (New Star). The Board also noted that the current net operating expenses of the International Equity Fund’s Institutional Class would be reduced by 0.06% with this reorganization. The Board further considered that the net operating expenses for the Overseas Fund’s Investor Class would remain the same with this reorganization.
Value Fund/C&B Large Cap Value Fund
The Board considered that the Value Fund’s tax-managed investment strategy has not attracted investor interest and that the tax-managed market is dominated by a few select firms. The Board considered that the C&B Large Cap Value Fund has a substantially similar investment objective and substantially similar principal investments and principal investment strategies as the Value Fund, other than the Value Fund’s tax-managed investment strategy overlay, and that the same sub-adviser and investment team manage both Funds. The Board also considered the Value Fund’s small asset base (approximately $35 million) and inconsistent asset growth and the C&B Large Cap Value Fund’s continued growth in net assets, larger asset base (approximately $984 million), comparable or better performance over all measurement periods and longer operating history. The Board further considered that the net operating expenses for all share classes of the Value Fund would be reduced or would remain the same with this reorganization.
Material U.S. Federal Income Tax Consequences of the Reorganization
The following discussion summarizes the material U.S. federal income tax consequences of the Reorganization, including an investment in Acquiring Fund shares, that are applicable to you as a Target Fund
49
shareholder. It is based on the Internal Revenue Code, applicable U.S. Treasury regulations, judicial authority and administrative rulings and practice, all as of the date of this Prospectus/Proxy Statement and all of which are subject to change, including changes with retroactive effect. The discussion below does not address any state, local or foreign tax consequences of the Reorganization. Your tax treatment may vary depending upon your particular situation. You also may be subject to special rules not discussed below if you are a certain kind of Target Fund shareholder, including, but not limited to: an insurance company; a tax-exempt organization; a financial institution or broker-dealer; a person who is neither a citizen nor resident of the United States or entity that is not organized under the laws of the United States or political subdivision there of; a holder of Target Fund shares as part of a hedge, straddle or conversion transaction; a person that does not hold Target Fund shares as a capital asset at the time of the Reorganization; or an entity taxable as a partnership for U.S. federal income tax purposes.
We have not requested and will not request an advance ruling from the Internal Revenue Service as to the U.S. federal income tax consequences of the Reorganization or any related transaction. The Internal Revenue Service could adopt positions contrary to those discussed below and such positions could be sustained. You are urged to consult with your own tax advisors and financial planners as to the particular tax consequences of the Reorganization to you, including the applicability and effect of any state, local or foreign laws and the effect of possible changes in applicable tax laws.
Qualification of the Reorganization as a Tax-Free “Reorganization” Under the Internal Revenue Code. The obligation of the Funds to consummate the Reorganization is contingent upon their receipt of an opinion from Proskauer Rose LLP, special tax counsel to the Funds, generally to the effect that the Reorganization will qualify as a “reorganization” under Section 368(a) of the Internal Revenue Code with respect to each Acquiring Fund and its corresponding Target Fund, and therefore generally:
i) no gain or loss will be recognized by the Acquiring Fund upon receipt of the corresponding Target Fund’s assets in exchange for the Acquiring Fund shares and the assumption by the Acquiring Fund of the liabilities of the Target Fund;
ii) the Acquiring Fund’s tax basis in the assets of the corresponding Target Fund transferred to the Acquiring Fund in the Reorganization will be the same as the Target Fund’s tax basis in the assets immediately prior to the transfer;
iii) the Acquiring Fund’s holding periods for the assets of the corresponding Target Fund will include the periods during which such assets were held by the Target Fund;
iv) no gain or loss will be recognized by the Target Fund upon the transfer of the Target Fund’s assets to the Acquiring Fund in exchange for Acquiring Fund shares and the assumption by the Acquiring Fund of the liabilities of the Target Fund, or upon distribution of Acquiring Fund shares by the Target Fund to its shareholders in liquidation;
v) no gain or loss will be recognized by the Target Fund’s shareholders upon the exchange of their Target Fund shares for Acquiring Fund shares;
vi) the tax basis of Acquiring Fund shares a Target Fund shareholder receives in connection with the Reorganization will be the same as the tax basis of his or her Target Fund shares exchanged therefor;
vii) a Target Fund shareholder’s holding period for his or her Acquiring Fund shares will include the period for which he or she held the Target Fund shares exchanged therefor; and
viii) the Acquiring Fund will succeed to, and take into account the items of the Target Funds described in Section 381(c) of the Internal Revenue Code, subject to the conditions and limitations specified in the Internal Revenue Code and the U.S. Treasury regulations thereunder.
The tax opinion described above will be based on then-existing law, will be subject to certain assumptions, qualifications and exclusions and will be based in part on the truth and accuracy of certain representations by us on behalf of the Acquiring Funds and the Target Funds.
50
Utilization of Loss Carryforwards and Unrealized Losses. U.S. federal income tax law permits a regulated investment company, such as the Funds, to carry forward net capital losses for a period of up to eight taxable years. A number of the Target Funds are presently entitled to significant net capital loss carryforwards for U.S. federal income tax purposes, as further detailed below. The Reorganization will cause the tax years of the Target Funds to close, resulting in an earlier expiration of net capital loss carryforwards than would otherwise occur. In addition, the Reorganization is expected to result in a limitation on the ability of certain of the Acquiring Funds to use carryforwards of the corresponding Target Funds and, potentially, to use unrealized capital losses inherent in the tax basis of the assets acquired, once realized. These limitations, imposed by Section 382 of the Internal Revenue Code, are imposed on an annual basis. Losses in excess of the limitation may be carried forward, subject to the overall eight-year limitation. The Section 382 limitation as to a particular Target Fund generally will equal the product of the net asset value of the Target Fund immediately prior to the Reorganization and the “long-term tax-exempt rate,” published by the Internal Revenue Service, in effect at such time. As of April 2008, the long-term tax-exempt rate is 4.55%. However, no assurance can be given as to what long-term tax-exempt rate will be in effect at the time of the Reorganization. In certain instances, under Section 384 of the Internal Revenue Code, an Acquiring Fund will also be prohibited from using the corresponding Target Fund’s loss carryforwards and unrealized losses against the unrealized gains of the Acquiring Fund at the time of the Reorganization, to the extent such gains are realized within five years following the Reorganization. While the ability of an Acquiring Fund to absorb the corresponding Target Fund’s losses in the future depends upon a variety of factors that cannot be known in advance, because capital loss carryforwards generally expire eight taxable years following realization, including the short taxable year resulting from the Reorganization, it is expected that substantially all of a Target Fund’s losses may become permanently unavailable where the limitation applies. If an Acquiring Fund is able to utilize net capital loss carryforwards or unrealized losses of the corresponding Target Fund, the tax benefit resulting from those losses will be shared by both the Target Fund and Acquiring Fund shareholders following the Reorganization. Therefore, a Target Fund shareholder may pay more taxes, or pay taxes sooner, than such shareholder otherwise would if the Reorganization did not occur.
In general, the limitation under Section 382 will apply to loss carryforwards and unrealized losses of a Target Fund when its shareholders will hold less than 50% of the outstanding shares of the corresponding Acquiring Fund immediately following the Reorganization. Accordingly, it is expected that the limitation will apply to any losses of: the Balanced Fund, High Yield Bond Fund, Intermediate Government Income Fund, National Limited-Term Tax-Free Fund, National Tax-Free Fund, Overseas Fund and Value Fund. Even if the Reorganization does not result in the limitation on the use of losses, future transactions by the Acquiring Fund may do so.
As of September 30, 2007 and February 29, 2008, respectively, for U.S. federal income tax purposes, the Balanced Fund had capital loss carryforwards of approximately $1,935,302 and no net unrealized capital losses and the Overseas Fund had capital loss carryforwards of approximately $5,827,537 and no net unrealized capital losses. As of May 31, 2007 and February 29, 2008, respectively, for U.S. federal income tax purposes, the High Yield Bond Fund had capital loss carryforwards of approximately $1,136,060 and net unrealized capital losses of approximately $5,720,290 and the Intermediate Government Income Fund had capital loss carryforwards of approximately $45,892,917 and no net unrealized capital losses. As of June 30, 2007 and February 29, 2008, respectively, for U.S. federal income tax purposes, the National Limited Term Tax-Free Fund had capital loss carryforwards of approximately $1,142,163 and net unrealized capital losses of approximately $814,769 and the National Tax-Free Fund had capital loss carryforwards of approximately $4,828,634 and a net unrealized capital loss of approximately $10,131,233. As of July 31, 2007 and February 29, 2008, respectively, for U.S. federal income tax purposes, the Value Fund had no capital loss carryforwards and no net unrealized capital losses.
The Target Fund shareholders will benefit from any capital loss carryforwards and unrealized capital losses of the corresponding Acquiring Fund. An Acquiring Fund’s ability to use its own capital loss carryforwards and unrealized losses, once realized, may be subject to an annual limitation under Section 382 of the Internal Revenue Code as well, such that losses in excess of the limitation cannot be used in the taxable year and must be carried forward. The limitation generally equals the product of the net asset value of the Acquiring Fund
51
immediately prior to the Reorganization and the long-term tax-exempt rate in effect at such time. While the ability of an Acquiring Fund to absorb its losses in the future depends upon a variety of factors that cannot be known in advance, because capital loss carryforwards generally expire eight taxable years following realization, it is expected that substantially all of its losses may become permanently unavailable where the limitation applies. In general, the limitation will apply to an Acquiring Fund when its shareholders will hold less than 50% of its outstanding shares immediately following the Reorganization. Accordingly, it is expected that the limitation will apply to any losses of the Income Plus Fund. As of May 31, 2007 and February 29, 2008, respectively, for U.S. federal income tax purposes, the Income Plus Fund had capital loss carryforwards of approximately $8,360,182 and no net unrealized capital losses. Even if the Reorganization does not result in the limitation on the use of an Acquiring Fund’s losses, prior or future transactions involving an Acquiring Fund may have caused or will cause such limitations to apply.
Status as a Regulated Investment Company. Since its formation, each Fund believes it has qualified as a separate “regulated investment company” under Subchapter M of the Internal Revenue Code. Accordingly, each Fund believes that it has been, and expects to continue to be, relieved of U.S. federal income tax liability to the extent that it makes distributions of its taxable income and gains to its shareholders.
Distribution of Income and Gains. Prior to the Reorganization, each Target Fund’s taxable year will end as a result of the Reorganization and generally is required to declare to its shareholders of record one or more distributions of all of its previously undistributed net investment income and net realized capital gain, including capital gains on any securities disposed of in connection with the Reorganization. Such distributions will be made to such shareholders before or after the Reorganization. A Target Fund shareholder will be required to include any such distributions in his or her taxable income. This may result in the recognition of income that could have been deferred or never realized had the Reorganization not occurred.
Moreover, if an Acquiring Fund has realized net investment income or net capital gains but has not distributed such income or gains prior to the Reorganization and you acquire shares of such Acquiring Fund in the Reorganization, a portion of your subsequent distributions from the Target Fund will, in effect, be a taxable return of part of your investment. Similarly, if you acquire Acquiring Fund shares in the Reorganization when it holds appreciated securities, you will receive a taxable return of part of your investment if, and when, the Acquiring Fund sells the appreciated securities and distributes the realized gain. You should assume that the Acquiring Funds have built up, or have the potential to build up, high levels of unrealized appreciation.
U.S. Federal Income Taxation of an Investment in an Acquiring Fund. The following discussion summarizes the U.S. federal income taxation of an investment in an Acquiring Fund. This discussion is not intended as a substitute for careful tax planning. You should consult your tax advisor about your specific tax situation. Please see the prospectuses and SAIs for the Acquiring Funds for additional federal income tax information.
Qualification as a Regulated Investment Company. Each Acquiring Fund intends to continue to be treated and qualify each year as a regulated investment company under Subchapter M of the Internal Revenue Code. In order to so qualify and receive the special tax treatment accorded regulated investment companies and their shareholders, an Acquiring Fund must, among other things, (a) derive at least 90% of its gross income for each taxable year from (i) dividends, interest, payments with respect to certain securities loans and gains from the sale or other disposition of stock, securities and foreign currencies, or other income (including but not limited to gains from options, futures or forward contracts) derived with respect to its business of investing in such stock, securities, or currencies and (ii) net income derived from interests in “qualified publicly traded partnerships” (as defined below); (b) distribute with respect to each taxable year at least 90% of the sum of its investment company taxable income (as that term is defined in the Internal Revenue Code without regard to the deduction for dividends paid — generally taxable ordinary income and the excess, if any, of short-term capital gains over long-term capital losses), and its net tax-exempt income, for such year; and (c) diversify its holdings so that, at the end of each quarter of the Acquiring Fund’s taxable year (i) at least 50% of the market value of the Acquiring Fund’s assets is represented by cash, cash items, U.S. Government Securities, securities of other regulated
52
investment companies and other securities, limited in respect of any one issuer to a value of not greater than 5% of the value of the Acquiring Fund’s total assets and 10% of the outstanding voting securities of such issuer, and (ii) not more than 25% of the value of its assets is invested (x) in the securities (other than those of the U.S. Government or other regulated investment companies) of any one issuer or of two or more issuers that the Acquiring Fund controls and that are engaged in the same, similar or related trades or businesses or (y) in the securities of one or more qualified publicly traded partnerships. For purposes of meeting this diversification requirement, in the case of the Acquiring Funds’ investments in loan participations, the issuer may be the financial intermediary or the borrower.
In general, for purposes of the 90% gross income requirement described in (a) above, income derived from a partnership will be treated as qualifying income only to the extent such income is attributable to items of income of the partnership which would be qualifying income if realized by the regulated investment company. However, 100% of the net income derived from an interest in a “qualified publicly traded partnership” (defined as a partnership interest (a) that is traded on an established securities market or is readily tradable on a secondary market or the substantial equivalent thereof and (b) derives more than 90% of its income from the qualifying income described in (a)(i) of the preceding paragraph) will be treated as qualifying income. In addition, although in general the passive loss rules of the Internal Revenue Code do not apply to regulated investment companies, such rules do apply to a regulated investment company with respect to items attributable to an interest in a qualified publicly traded partnership.
If an Acquiring Fund qualifies as a regulated investment company that is accorded special tax treatment, the Acquiring Fund will not be subject to federal income tax on income paid to its shareholders in the form of dividends (including Capital Gain Dividends, as defined below). If an Acquiring Fund failed to qualify as a regulated investment company in any taxable year, the Acquiring Fund would be subject to tax on its taxable income at corporate rates (without any deduction for distributions to its shareholders), and all distributions from earnings and profits, including any distributions of net tax-exempt income and net long-term capital gain, would be taxable to shareholders as ordinary income. In addition, the Acquiring Fund could be required to recognize unrealized gains, pay substantial taxes, interest and possibly penalties and make substantial distributions before requalifying as a regulated investment company.
If an Acquiring Fund fails to distribute substantially all of its ordinary income and net capital gain for the calendar year and any retained amount from the prior calendar year, the Acquiring Fund will be subject to a non-deductible 4% excise tax on the undistributed amounts. For these purposes, the Acquiring Fund will be treated as having distributed any amount for which it is subject to income tax. A dividend paid to shareholders by an Acquiring Fund in January of a year generally is deemed to have been paid by the Acquiring Fund on December 31 of the preceding year, if the dividend was declared and payable to shareholders of record on a date in October, November or December of that preceding year. Each Acquiring Fund intends generally to make distributions sufficient to avoid imposition of the 4% excise tax, although there can be no assurance that it will be able to do so.
Distributions. Each Acquiring Fund will distribute, at least annually, any net investment income and net realized capital gains. Distributions of net investment income (other than qualified dividend income and exempt-interest income discussed below) are generally taxable to shareholders as ordinary income. Taxes on distributions of capital gains are determined by how long the Acquiring Fund owned the investments that generated them, rather than how long a shareholder has owned his or her shares. Distributions of each Acquiring Fund’s net capital gain (i.e., the excess of a Fund’s net long-term capital gain over net short-term capital loss), if any, from the sale of investments that the Acquiring Fund owned for more than one year and that are properly designated by the Fund as capital gain dividends (“Capital Gain Dividends”) are taxable as long-term capital gain, regardless of how long a shareholder has held Acquiring Fund shares. For taxable years beginning before January 1, 2011, such distributions will generally be subject to a 15% tax rate, with lower rates applying to taxpayers in the 10% and 15% rate brackets, and will not be eligible for the dividends received deduction. Distribution of gains from the sale of investments that an Acquiring Fund owned for one year or less will be taxable as ordinary income.
53
Distributions of taxable income or capital gains are taxable to Acquiring Fund shareholders whether received in cash or reinvested in additional Acquiring Fund shares. Dividends and distributions on an Acquiring Fund’s shares generally are subject to U.S. federal income tax to the extent they do not exceed the Acquiring Fund’s realized income and gains, even though such dividends and distributions economically may represent a return of a particular shareholder’s investment. Such distributions are likely to occur in respect of shares acquired at a time when the Acquiring Fund’s net asset value reflects gains that are either unrealized, or realized but not distributed. Such realized gains may be required to be distributed even when an Acquiring Fund’s net asset value also reflects unrealized losses.
If an Acquiring Fund makes a distribution in excess of its current and accumulated “earnings and profits” in any taxable year, the excess distribution will be treated as a return of capital to the extent of a shareholder’s tax basis in Acquiring Fund shares, and thereafter as capital gain. A return of capital is not taxable, but it reduces the shareholder’s tax basis in the shares, thus reducing any loss or increasing any gain on a subsequent taxable disposition of those shares.
For taxable years beginning before January 1, 2011, distributions of investment income properly designated by an Acquiring Fund as derived from “qualified dividend income” will be taxed in the hands of an individual at the rates applicable to long-term capital gain, provided holding period and other requirements are met at both the shareholder and Acquiring Fund level. In order for some portion of the dividends received by an Acquiring Fund shareholder to be qualified dividend income, an Acquiring Fund must meet holding period and other requirements with respect to some portion of the dividend paying stocks in its portfolio and the shareholder must meet holding period and other requirements with respect to the Acquiring Fund’s shares. A dividend will not be treated as qualified dividend income (at either the Acquiring Fund or shareholder level) (a) if the dividend is received with respect to any share of stock held for fewer than 61 days during the 121-day period beginning on the date which is 60 days before the date on which such share becomes ex-dividend with respect to such dividend (or, in the case of certain preferred stock, 91 days during the 181-day period beginning 90 days before such date), (b) to the extent that the recipient is under an obligation (whether pursuant to a short sale or otherwise) to make related payments with respect to positions in substantially similar or related property, (c) if the recipient elects to have the dividend income treated as investment income for purposes of the limitation on deductibility of investment interest or (d) if the dividend is received from a foreign corporation that is (i) not eligible for the benefits of a comprehensive income tax treaty with the United States (with the exception of dividends paid on stock of such a foreign corporation readily tradable on an established securities market in the United States) or (ii) treated as a passive foreign investment company.
In general, distributions of investment income designated by an Acquiring Fund as derived from qualified dividend income will be treated as qualified dividend income by a shareholder taxed as an individual provided the shareholder meets the holding period and other requirements described above with respect to the Acquiring Fund’s shares. If the aggregate qualified dividends received by a Fund during any taxable year are 95% or more of its gross income (excluding net long-term capital gain over net short-term capital loss), then 100% of the Acquiring Fund’s dividends (other than dividends properly designated as Capital Gain Dividends) will be eligible to be treated as qualified dividend income. To the extent that an Acquiring Fund makes a distribution of income received by the Acquiring Fund in lieu of dividends (a “substitute payment”) with respect to securities on loan pursuant to a securities lending transaction, such income will not constitute qualified dividend income and thus will not be eligible for taxation at the rates applicable to long-term capital gain. The Acquiring Funds expect to use any such substitute payments to satisfy their expenses, and therefore expect that their receipt of substitute payments will not adversely affect the percentage of distributions qualifying as qualified dividend income.
Dividends of net investment income received by corporate shareholders of the Acquiring Fund will qualify for the 70% dividends received deduction generally available to corporations to the extent of the amount of qualifying dividends received by the Acquiring Fund from domestic corporations for the taxable year. A dividend received by an Acquiring Fund will not be treated as a qualifying dividend (a) if the stock on which the dividend is paid is considered to be “debt-financed” (generally, acquired with borrowed funds), (b) if it has been received
54
with respect to any share of stock that such Acquiring Fund has held for less than 46 days (91 days in the case of certain preferred stock) during the 91-day period beginning on the date which is 45 days before the date on which such share becomes ex-dividend with respect to such dividend (during the 181-day period beginning 90 days before such date in the case of certain preferred stock) or (c) to the extent that such Acquiring Fund is under an obligation (pursuant to a short sale or otherwise) to make related payments with respect to positions in substantially similar or related property. Moreover, the dividends received deduction may be disallowed or reduced (a) if the corporate shareholder fails to satisfy the foregoing requirements with respect to its shares of the Fund or (b) by application of other Internal Revenue Code section limitations.
Short-Term Municipal Bond and Municipal Bond Funds and Exempt-Interest Dividends. Each of the Short Term Municipal Bond Fund and the Municipal Bond Fund (each, a “Municipal Fund”), it is designed to provide investors with tax-exempt interest income. A Municipal Fund will be qualified to pay exempt-interest dividends to its shareholders only if, at the close of each quarter of the Municipal Fund’s taxable year, at least 50% of the total value of the Municipal Fund’s assets consists of obligations, the interest on which is exempt from federal income tax. Such dividends will not exceed, in the aggregate, the net interest a Municipal Fund receives during the taxable year from municipal securities and other securities exempt from the regular federal income tax. An exempt-interest dividend is any dividend or part thereof (other than a Capital Gain Dividend) paid by a Municipal Fund and properly designated as an exempt-interest dividend in a written notice mailed to shareholders not later than 60 days after the close of the Municipal Fund’s taxable year. Generally, exempt-interest dividends will be excluded from gross income for federal income tax purposes, though they may be taxable for federal alternative minimum tax purposes and for state and local tax purposes. For example, exempt-interest dividends attributable to investments in certain “private activity” bonds will be treated as tax preference items in computing the alternative minimum tax. Also, a portion of all other exempt-interest dividends earned by a corporation may be subject to the alternative minimum tax.
Each Municipal Fund will inform investors within 60 days following the end of the Municipal Fund’s fiscal year of the percentage of its distributions designated as tax-exempt. The percentage is applied uniformly to all distributions made during the year regardless of the Municipal Fund’s income that was actually tax-exempt during the period covered by the distribution. If a Municipal Fund makes a distribution in excess of its net investment income and net realized capital gains, if any, in any taxable year, the excess distribution will be treated as ordinary dividend income (not eligible for tax-exempt treatment) to the extent of the Fund’s current and accumulated “earnings and profits” (including earnings and profits arising from tax-exempt income, and also specifically including the amount of any non-deductible expenses arising in connection with such tax-exempt income).
If a shareholder receives an exempt-interest dividend with respect to any share and such share is held by the shareholder for six months or less, any loss on the sale or exchange of such share will be disallowed to the extent of the amount of such exempt-interest dividend. In certain limited instances, the portion of Social Security or Railroad Retirement benefits that may be subject to federal income taxation may be affected by the amount of tax-exempt interest income, including exempt-interest dividends, received by a shareholder. Shareholders who receive Social Security or Railroad Retirement benefits should consult their tax advisers to determine what effect, if any, an investment in a Fund may have on the federal taxation of their benefits.
Part or all of the interest on indebtedness, if any, incurred or continued by a shareholder to purchase or carry shares of a Fund paying exempt-interest dividends is not deductible. The portion of interest that is not deductible is equal to the total interest paid or accrued on the indebtedness, multiplied by the percentage of the Fund’s total distributions (not including distributions from net long-term capital gains) paid to the shareholder that are exempt-interest dividends. Under rules used by the Internal Revenue Service to determine when borrowed funds are considered used for the purpose of purchasing or carrying particular assets, the purchase of shares may be considered to have been made with borrowed funds even though such funds are not directly traceable to the purchase of shares.
55
In general, exempt-interest dividends, if any, attributable to interest received on certain private activity obligations and certain industrial development bonds will not be tax-exempt to any shareholders who are “substantial users” of the facilities financed by such obligations or bonds or who are “related persons” of such substantial users. The exemption from federal income tax for exempt-interest dividends does not necessarily result in exemption for such dividends under the income or other tax laws of any state or local authority. You are advised to consult with your tax advisor about state and local tax matters.
Foreign Taxes, Foreign Currency-Denominated Securities and Related Hedging Transactions. Dividends and interest received by an Acquiring Fund may be subject to income, withholding or other taxes imposed by foreign countries and U.S. possessions that would reduce the yield on the Acquiring Fund’s securities. Tax conventions between certain countries and the United States may reduce or eliminate these taxes. Foreign countries generally do not impose taxes on capital gains with respect to investments by foreign investors.
If foreign taxes are paid by an Acquiring Fund, shareholders generally will not be entitled to claim a credit or deduction with respect to foreign taxes. However, if at the end of an Acquiring Fund’s fiscal year more than 50% of the value of its total assets represents securities of foreign corporations, the Acquiring Fund will be eligible to make an election permitted by the Internal Revenue Code to treat any foreign taxes paid by it on securities it has held for at least the minimum period specified in the Internal Revenue Code as having been paid directly by the Acquiring Fund’s shareholders in connection with the Acquiring Fund’s dividends received by them. Under normal circumstances, more than 50% of the value of the International Equity Fund’s total assets will consist of securities of foreign corporations and it will be eligible to make the election. If the election is made, its shareholders generally will be required to include in U.S. taxable income their pro rata share of such taxes, and those shareholders who are U.S. residents and corporations will be entitled to deduct their share of such taxes. Alternatively, such shareholders who hold the Fund’s shares (without protection from risk of loss) on the ex-dividend date and for at least 15 other days during the 30-day period surrounding the ex-dividend date may be entitled to claim a foreign tax credit for their share of these taxes. If the Fund makes the election, it will report annually to its shareholders the respective amounts per share of the Fund’s income from sources within, and taxes paid to, foreign countries and U.S. possessions. In general a U.S. resident individual generally can claim a foreign tax credit of $300 or ($600 if filing jointly) if he or she has at least such amount of income after other exemptions, deductions and exclusions.
An Acquiring Fund’s transactions in foreign currencies, foreign currency-denominated debt securities and certain foreign currency options, futures contracts and forward contracts (and similar instruments) may give rise to ordinary income or loss to the extent such income or loss results from fluctuations in the value of the foreign currency concerned.
Investment by an Acquiring Fund in “passive foreign investment companies” could subject the Acquiring Fund to a U.S. federal income tax (including interest charges) or other charge on distributions received from the company or on proceeds from the sale of its investment in such a company, which tax cannot be eliminated by making distributions to Acquiring Fund shareholders. However, this tax can be avoided by making an election to mark such investments to market annually or to treat the passive foreign investment company as a “qualified electing fund.” These elections may accelerate the recognition of income (without the receipt of cash) and increase the amount required to be distributed by the Acquiring Fund to avoid taxation. Making either of these elections therefore may require the Acquiring Fund to liquidate other investments (including when it is not advantageous to do so) to meet its distribution requirement, which also may accelerate the recognition of gain and affect the Acquiring Fund’s total return. Dividends paid by passive foreign investment companies will not be eligible to be treated as “qualified dividend income.”
A “passive foreign investment company” is any foreign corporation: (a) 75% or more of the gross income of which for the taxable year is passive income or (b) the average percentage of the assets of which (generally by value, but by adjusted tax basis in certain cases) produce, or are held for the production of, passive income is at least 50%. Generally, passive income for this purpose means dividends, interest (including income equivalent to
56
interest), royalties, rents, annuities, the excess of gain over losses from certain property transactions and commodities transactions and foreign currency gains. Passive income for this purpose does not include rents and royalties received by the foreign corporation from active business and certain income received from related persons.
Selling Shares. Shareholders who sell, exchange or redeem Acquiring Fund shares will generally recognize gain or loss in an amount equal to the difference between their adjusted tax basis in the Acquiring Fund shares and the amount received. In general, any gain or loss realized upon taxable disposition of Acquiring Fund shares will be treated as long-term capital gain or loss if the shares have been held for more than 12 months, and as short-term capital gain or loss if the shares have not been held for more than 12 months. The tax rate generally applicable to net capital gains recognized by individuals and other noncorporate taxpayers is (a) the same as the maximum ordinary income tax rate for short-term capital or (b) for taxable years beginning on or before January 1, 2011, 15% for long-term capital gains (including Capital Gain Dividends) with lower rates applicable to taxpayers in the 10% and 15% tax brackets.
Any loss realized upon a taxable disposition of Acquiring Fund shares held for six months or less will be treated as a long-term capital loss to the extent of any long-term capital gain distributions received (or deemed received) by the shareholder with respect to those Acquiring Fund shares. For purposes of determining whether Acquiring Fund shares have been held for six months or less, the holding period is suspended for any periods during which your risk of loss is diminished as a result of holding one or more other positions in substantially similar or related property, or through certain options or short sales. In addition, any loss recognized on a sale or exchange of Acquiring Fund shares will be disallowed to the extent that Acquiring Fund shareholders replace the disposed of Fund shares with other Fund shares within a period of 61 days beginning 30 days before and ending 30 days after the date of disposition, which could, for example, occur as a result of automatic dividend reinvestment. In such an event, an Acquiring Fund shareholder’s basis in the replacement Acquiring Fund shares will be adjusted to reflect the disallowed loss.
Hedging. If an Acquiring Fund engages in hedging transactions, including hedging transactions in options, futures contracts and straddles, or other similar transactions, it will be subject to special tax rules (including constructive sales, mark-to-market, straddle, wash sale and short sale rules), the effect of which may be to accelerate income to the Acquiring Fund, defer losses to the Acquiring Fund, cause adjustments in the holding periods of the Acquiring Fund’s securities, convert long-term capital gains into short-term capital gains or convert short-term capital losses into long-term capital losses. These rules could therefore affect the amount, timing and character of distributions to shareholders. Each Acquiring Fund will endeavor to make any available elections pertaining to such transactions in a manner believed to be in the best interests of the Fund.
Certain of an Acquiring Fund’s hedging activities (including its transactions, if any, in foreign currencies or foreign currency-denominated instruments) are likely to produce a difference between its book income and the sum of its taxable income and net tax-exempt income (if any). If an Acquiring Fund’s book income exceeds the sum of its taxable income and net tax-exempt income (if any), the distribution (if any) of such excess will be treated as (a) a dividend to the extent of the Acquiring Fund’s remaining earnings and profits (including earnings and profits arising from tax-exempt income), (b) thereafter as a return of capital to the extent of the recipient’s basis in the shares and (c) thereafter as gain from the sale or exchange of a capital asset. If the Acquiring Fund’s book income is less than the sum of its taxable income and net tax-exempt income (if any), the Acquiring Fund could be required to make distributions exceeding book income in order to continue to qualify as a regulated investment company that is accorded special tax treatment.
Discount Securities. An Acquiring Fund’s investment in securities issued at a discount and certain other obligations will (and investments in securities purchased at a discount may) require the Acquiring Fund to accrue and distribute income not yet received. In order to generate sufficient cash to make the requisite distributions, an Acquiring Fund may be required to sell securities in its portfolio that it otherwise would have continued to hold.
57
Backup Withholding. An Acquiring Fund generally is required to withhold and remit to the U.S. Treasury a percentage of the taxable dividends and other distributions paid to and proceeds of share sales, exchanges or redemptions made by any individual shareholder who fails to properly furnish the Acquiring Fund with a correct taxpayer identification number (TIN), who has under-reported dividend or interest income or who fails to certify to the Acquiring Fund that he or she is not subject to such withholding. The backup withholding tax rate is 28% for amounts paid through 2010. The backup withholding rate will be 31% for amounts paid after December 31, 2010, unless Congress enacts tax legislation providing otherwise.
Backup withholding is not an additional tax. Any amounts withheld may be credited against the shareholder’s U.S. federal income tax liability, provided the appropriate information is furnished to the Internal Revenue Service.
In order for a foreign investor to qualify for exemption from the back-up withholding tax rates under income tax treaties, the foreign investor must comply with the special certification and filing requirements. Foreign investors in an Acquiring Fund should consult their tax advisers with respect to such withholding.
Tax Shelter Reporting Regulations. Under Treasury regulations, if a shareholder realizes a loss on disposition of the Acquiring Fund’s shares of $2 million or more for an individual shareholder or $10 million or more for a corporate shareholder, the shareholder must file with the Internal Revenue Service a disclosure statement on Form 8886. Direct shareholders of portfolio securities are in many cases excepted from this reporting requirement, but under current guidance, shareholders of a regulated investment company are not excepted. Future guidance may extend the current exception from this reporting requirement to shareholders of most or all regulated investment companies. The fact that a loss is reportable under these regulations does not affect the legal determination of whether the taxpayer’s treatment of the loss is proper. Shareholders should consult their tax advisers to determine the applicability of these regulations in light of their individual circumstances.
Fees and Expenses of the Reorganization
All fees and expenses, including accounting expenses, legal expenses, proxy expenses, portfolio transfer taxes (if any) or other similar expenses incurred in connection with the completion of the Reorganization will be borne by Funds Management.
Existing and Pro Forma Capitalization
[Tables will be updated through March 31, 2008, for definitive filing.]
The following tables set forth, for each Reorganization, the total net assets, number of shares outstanding and net asset value per share. This information is generally referred to as the “capitalization” of a Fund. The term “pro forma capitalization” means the expected capitalization of an Acquiring Fund after it has combined with the corresponding Target Fund. An asterisk (*) designates the accounting survivor in each combination.
58
Balanced Fund/Asset Allocation Fund
The following table sets forth, as of [December 31, 2007], (i) the unaudited capitalization of the Investor Class shares of the Balanced Fund and the Class A shares of the Asset Allocation Fund, and (ii) the unaudited pro forma combined capitalization of the Class A shares of the Asset Allocation Fund assuming the Reorganization has taken place. The capitalizations are likely to be different on the Closing Date as a result of daily Fund share purchase, redemption, and market activity.
| | | | | | | | |
Fund | | Total Net
Assets ($) | | Shares
Outstanding | | Net Asset Value
Per Share ($) |
Balanced Fund Investor Class | | $ | 124,010,297 | | 5,755,688 | | $ | 21.55 |
| | | |
Asset Allocation Fund Class A | | $ | 878,786,054 | | 40,854,590 | | $ | 21.51 |
| | | |
Pro Forma — Asset Allocation Fund*(1) Class A | | $ | 1,002,796,351 | | 46,620,007 | | $ | 21.51 |
(1) | Assuming the reorganization of the Investor Class shares of the Balanced Fund into the Class A shares of the Asset Allocation Fund. |
Corporate Bond Fund/Income Plus Fund
The following table sets forth, as of [December 31, 2007]: (i) the unaudited capitalization of the Investor Class, Advisor Class and Institutional Class shares of the Corporate Bond Fund and the Investor Class, Class A, and Institutional Class shares of the Income Plus Fund and (ii) the unaudited pro forma combined capitalization of each of the share classes of the Income Plus Fund assuming the Reorganization has taken place. The capitalizations are likely to be different on the Closing Date as a result of daily Fund share purchase, redemption, and market activity.
| | | | | | | | |
Fund | | Total Net
Assets ($) | | Shares
Outstanding | | Net Asset Value
Per Share ($) |
Corporate Bond Fund Investor Class Advisor Class Institutional Class | | $ $ $ | 199,982,571 16,013,513 23,420,026 | | 19,624,942 1,571,870 2,299,120 | | $ $ $ | 10.19 10.19 10.19 |
| | | |
Income Plus Fund Investor Class Class A Institutional Class | | $ | N/A 40,769,018 N/A | | N/A 3,767,312 N/A | | $ | N/A 10.82 N/A |
| | | |
Pro Forma — Income Plus Fund*(1) Investor Class Class A Institutional Class | | $ $ $ | 199,982,571 56,782,531 23,420,026 | | 18,482,678 5,247,923 2,164,513 | | $ $ $ | 10.82 10.82 10.82 |
(1) | Assuming the reorganization of the Investor Class, Advisor Class, and Institutional Class shares of the Corporate Bond Fund into the Investor Class, Class A, and Institutional Class shares, respectively, of the Income Plus Fund. |
59
High Yield Bond Fund/High Income Fund
The following table sets forth, as of [December 31, 2007]: (i) the unaudited capitalization of the Class A, Class B, and Class C shares of the High Yield Bond Fund and the Class A (formerly Advisor Class), Class B and Class C shares of the High Income Fund and (ii) the unaudited pro forma combined capitalization of each of the share classes of the High Income Fund assuming the Reorganization has taken place. The capitalizations are likely to be different on the Closing Date as a result of daily Fund share purchase, redemption, and market activity.
| | | | | | | | |
Fund | | Total Net
Assets ($) | | Shares
Outstanding | | Net Asset Value
Per Share ($) |
High Yield Bond Fund Class A Class B Class C | | $ $ $ | 61,380,629 13,730,008 9,633,982 | | 6,155,746 1,377,046 965,584 | | $ $ $ | 9.97 9.97 9.98 |
| | | |
High Income Fund Class A (formerly Advisor Class) Class B Class C | | $ | 89,300,950 N/A N/A | | 13,961,955 N/A N/A | | $ | 7.49 N/A N/A |
| | | |
Pro Forma — High Income Fund*(1) Class A Class B Class C | | $ $ $ | 150,681,579 13,730,008 9,633,982 | | 20,117,701 1,833,112 1,286,246 | | $ $ $ | 7.49 7.49 7.49 |
(1) | Assuming the reorganization of the Class A, Class B, and Class C shares of the High Yield Bond Fund into the Class A, Class B, and Class C shares, respectively, of the High Income Fund. |
Intermediate Government Income Fund/Government Securities Fund
The following table sets forth, as of [December 31, 2007]: (i) the unaudited capitalization of the Class A, Class B, Class C, and Administrator Class shares of the Intermediate Government Income Fund and the Class A (formerly Advisor Class), Class B, Class C, and Administrator Class shares of the Government Securities Fund and (ii) the unaudited pro forma combined capitalization of each of the share classes of the Government Securities Fund assuming the Reorganization has taken place. The capitalizations are likely to be different on the Closing Date as a result of daily Fund share purchase, redemption, and market activity.
| | | | | | | | |
Fund | | Total Net
Assets ($) | | Shares
Outstanding | | Net Asset Value
Per Share ($) |
Intermediate Government Income Fund Class A Class B Class C Administrator Class | | $ $ $ $ | 110,797,707 11,456,052 7,094,413 219,720,192 | | 10,292,638 1,065,611 661,654 20,422,973 | | $ $ $ $ | 10.76 10.75 10.72 10.76 |
| | | |
Government Securities Fund Class A (formerly Advisor Class) Class B Class C Administrator Class | | $ $ $ | 62,968,289 N/A 1,676,099 148,295,330 | | 5,983,508 N/A 159,301 14,093,893 | | $ $ $ | 10.52 N/A 10.52 10.52 |
60
| | | | | | | | |
Fund | | Total Net
Assets ($) | | Shares
Outstanding | | Net Asset Value
Per Share ($) |
Pro Forma — Government Securities Fund*(1) Class A Class B Class C Administrator Class | | $ $ $ $ | 173,765,996 11,456,052 8,770,512 368,015,522 | | 16,517,680 1,088,978 833,699 34,982,464 | | $ $ $ $ | 10.52 10.52 10.52 10.52 |
(1) | Assuming the reorganization of the Class A, Class B, Class C, and Administrator Class shares of the Intermediate Government Income Fund into the Class A, Class B, Class C, and Administrator Class shares, respectively, of the Government Securities Fund. |
National Limited-Term Tax-Free Fund/Short-Term Municipal Bond Fund
The following table sets forth, as of [December 31, 2007]: (i) the unaudited capitalization of the Class A, Class B, Class C, and Administrator Class shares of the National Limited-Term Tax-Free Fund and the Class A and Class C shares of the Short-Term Municipal Bond Fund and (ii) the unaudited pro forma combined capitalization of each of the share classes of the Short-Term Municipal Bond Fund assuming the Reorganization has taken place. The capitalizations are likely to be different on the Closing Date as a result of daily Fund share purchase, redemption, and market activity.
| | | | | | | | |
Fund | | Total Net
Assets ($) | | Shares
Outstanding | | Net Asset Value
Per Share ($) |
National Limited-Term Tax-Free Fund Class A Class B Class C Administrator Class | | $ $ $ $ | 3,981,304 208,324 605,883 78,410,627 | | 373,495 19,562 56,942 7,358,275 | | $ $ $ $ | 10.66 10.65 10.64 10.66 |
| | | |
Short-Term Municipal Bond Fund Class A Class C | | $ | NA 3,589,453 | | NA 367,148 | | $ | NA 9.78 |
| | | |
Pro Forma — Short-Term Municipal Bond Fund*(1) Class A Class C | | $ $ | 82,600,255 4,195,336 | | 8,437,207 428,971 | | $ $ | 9.79 9.78 |
(1) | Assuming the reorganization of the Class A, Class B, and Administrator Class shares of the National Limited-Term Tax-Free Fund into the Class A shares of the Short-Term Municipal Bond Fund and the Class C shares of the National Limited-Term Tax-Free Fund into the Class C shares of the Short-Term Municipal Bond Fund. |
61
National Tax-Free Fund/Municipal Bond Fund
The following table sets forth, as of [December 31, 2007]: (i) the unaudited capitalization of the Class A, Class B, Class C, and Administrator Class of the National Tax-Free Fund and the Class A, Class B, Class C, and Administrator Class of the Municipal Bond Fund and (ii) the unaudited pro forma combined capitalization of each of the share classes of the Municipal Bond Fund assuming the Reorganization has taken place. The capitalizations are likely to be different on the Closing Date as a result of daily Fund share purchase, redemption, and market activity.
| | | | | | | | |
Fund | | Total Net
Assets ($) | | Shares
Outstanding | | Net Asset Value
Per Share ($) |
National Tax-Free Fund Class A Class B Class C Administrator Class | | $ $ $ $ | 93,030,229 10,735,501 6,816,273 146,645,902 | | 9,044,236 1,043,523 662,843 14,254,848 | | $ $ $ $ | 10.29 10.29 10.28 10.29 |
| | | |
Municipal Bond Fund Class A Class B Class C Administrator Class | | $ $ $ $ | 123,692,639 7,366,082 1,955,754 15,750,745 | | 13,081,330 778,980 206,887 1,666,348 | | $ $ $ $ | 9.46 9.46 9.45 9.45 |
| | | |
Pro Forma — Municipal Bond Fund*(1) Class A Class B Class C Administrator Class | | $ $ $ $ | 216,722,868 18,101,583 8,772,027 162,396,647 | | 22,909,394 1,913,487 928,257 17,184,830 | | $ $ $ $ | 9.46 9.46 9.45 9.45 |
(1) | Assuming the reorganization of the Class A, Class B, Class C, and Administrator Class shares of the National Tax-Free Fund into the Class A, Class B, Class C, and Administrator Class shares, respectively, of the Municipal Bond Fund. |
Overseas Fund/International Equity Fund
The following table sets forth, as of [December 31, 2007]: (i) the unaudited capitalization of the Investor Class and Institutional Class shares of the Overseas Fund, and the Investor Class and Institutional Class shares of the International Equity Fund and (ii) the unaudited pro forma combined capitalization of each of the share classes of the International Equity Fund assuming the Reorganization has taken place. The capitalizations are likely to be different on the Closing Date as a result of daily Fund share purchase, redemption, and market activity.
| | | | | | | | |
Fund | | Total Net
Assets ($) | | Shares
Outstanding | | Net Asset Value
Per Share ($) |
Overseas Fund Investor Class Institutional Class | | $ $ | 69,804,620 8,516,061 | | 5,762,267 700,733 | | $ $ | 12.11 12.15 |
| | | |
International Equity Fund Investor Class Institutional Class | | $ | NA 70,674,846 | | NA 4,212,929 | | $ | NA 16.78 |
| | | |
Pro Forma — International Equity Fund*(1) Investor Class Institutional Class | | $ $ | 69,804,620 79,190,907 | | 4,157,512 4,719,363 | | $ $ | 16.79 16.78 |
(1) | Assuming the reorganization of the Investor Class and Institutional Class shares into the Investor Class and Institutional Class shares, respectively, of the International Equity Fund. |
62
Value Fund/C&B Large Cap Value Fund
The following table sets forth, as of [December 31, 2007]: (i) the unaudited capitalization of the Class A, Class B, Class C, Investor Class, and Administrator Class shares of the Value Fund, and the Class A, Class B, Class C, Investor Class (formerly Class D) and Administrator Class shares of the C&B Large Cap Value Fund and (ii) the unaudited pro forma combined capitalization of each of the share classes of the C&B Large Cap Value Fund assuming the Reorganization has taken place. The capitalizations are likely to be different on the Closing Date as a result of daily Fund share purchase, redemption, and market activity.
| | | | | | | | |
Fund | | Total Net
Assets ($) | | Shares
Outstanding | | Net Asset Value
Per Share ($) |
Value Fund Class A Class B Class C Investor Class Administrator Class | | $ $ $ $ $ | 2,908,256 780,267 410,503 21,750,496 2,974,646 | | 155,391 41,946 22,062 1,165,184 159,219 | | $ $ $ $ $ | 18.72 18.60 18.61 18.67 18.68 |
| | | |
C&B Large Cap Value Fund Class A Class B Class C Investor Class (formerly Class D) Administrator Class | | $ $ $ $ $ | 65,494,153 21,595,922 15,102,282 204,861,664 522,243,425 | | 7,143,453 2,365,208 1,655,965 22,356,760 56,923,361 | | $ $ $ $ $ | 9.17 9.13 9.12 9.16 9.17 |
| | | |
Pro Forma — C&B Large Cap Value Fund*(1) Class A Class B Class C Investor Class Administrator Class | | $ $ $ $ $ | 68,402,409 22,376,189 15,512,785 226,612,160 525,218,071 | | 7,459,368 2,450,842 1,700,963 24,739,319 57,275,689 | | $ $ $ $ $ | 9.17 9.13 9.12 9.16 9.17 |
(1) | Assuming the reorganization of the Class A, Class B, Class C, Investor Class and Administrator Class shares of the Value Fund into the Class A, Class B, Class C, Investor Class and Administrator Class shares, respectively, of the C&B Large Cap Value Fund. |
The Board unanimously recommends that you vote in favor of the Reorganization Plan.
INFORMATION ON VOTING
This Prospectus/Proxy Statement is being provided in connection with the solicitation of proxies by the Board of Wells Fargo Advantage Funds to solicit your vote to approve the proposed Reorganization Plan at a special meeting of shareholders (“Meeting”) of the Target Funds. The Meeting will be held at 525 Market Street, 12th Floor, San Francisco, California, 94105 on June 30, 2008, at 3:00 p.m. (Pacific Time).
You may vote in one of four ways.
| | • | | Complete and sign the enclosed proxy card and mail it to us in the enclosed prepaid return envelope (if mailed in the United States). |
| | • | | Vote on the Internet according to the enclosed voting instructions. |
| | • | | Call the toll-free number printed on your proxy card and follow the instructions provided. |
| | • | | You also may vote in person by attending the Meeting. |
63
Please note that to vote via the Internet or telephone, you will need the “control number” that is printed on your proxy card.
You may revoke a proxy once it is given. If you desire to revoke a proxy, you must submit a later dated proxy or a written notice of revocation to the appropriate Target Fund. You also may give written notice of revocation in person at the Meeting. All properly executed proxies received in time for the Meeting will be voted as specified in the proxy, or, if no specification is made, FOR the proposal.
Only shareholders of record on April 18, 2008, are entitled to receive notice of, and to vote at, the Meeting or at any adjournment thereof. Each whole and fractional share of a Fund held as of the close of business on April 18, 2008, is entitled to a whole or fractional vote. For each such Fund, the presence in person or by proxy of one-third of the outstanding shares of that Fund is required to constitute a quorum. Approval of the Reorganization by any Target Fund requires the vote of a majority of the shares present at the Meeting, provided that a quorum is present.
The election inspectors will count your vote at the Meeting if cast in person or by proxy. The election inspectors will count:
| | • | | votes cast FOR approval of the proposal to determine whether sufficient affirmative votes have been cast; |
| | • | | ballots that are returned without a direction the same as votes cast FOR the proposal; and |
| | • | | abstentions and broker non-votes of shares (in addition to votes cast FOR) to determine whether a quorum is present at the Meeting. Abstentions and broker non-votes are not counted to determine whether a proposal has been approved. |
Broker non-votes are shares held in street name for which the broker indicates that instructions have not been received from the beneficial owners or other persons entitled to vote and for which the broker lacks discretionary voting authority.
The Board knows of no matters other than the proposal described in this Prospectus/Proxy Statement that will be brought before the Meeting. If, however, any other matters properly come before the Meeting, it is the Board’s intention that proxies will be voted on such matters based on the judgment of the person named in the enclosed form of proxy. In the event that a quorum is not present for the Meeting, or in the event that a quorum is present but sufficient votes to approve any proposed item are not received by a Fund, one or more adjournment(s) may be proposed to permit further solicitation of proxies. Any such adjournment(s) will require the affirmative vote of a majority of the shares that are represented at the Meeting in person or by proxy. If a quorum is present, the persons named as proxies will vote those proxies which they are entitled to vote FOR the proposal in favor of such adjournment(s), and will vote those proxies required to be voted AGAINST the proposal against any adjournment(s).
In addition to the solicitation of proxies by mail or expedited delivery service, certain officers and employees of Funds Management or an affiliate, who will not be paid for their services, the Wells Fargo Advantage Funds or a solicitor may solicit proxies by telephone, facsimile, verbal, Internet, or e-mail communication. Funds Management has engaged the proxy solicitation firm of The Altman Group, Inc. who will be paid approximately $161,120, plus out-of-pocket expenses, for its services. Funds Management will bear the expenses incident to the solicitation of proxies in connection with the Meeting, which expenses include the fees and expenses of tabulating the results of the proxy solicitation and the fees and expenses of The Altman Group, Inc. Funds Management also will reimburse upon request persons holding shares as nominees for their reasonable expenses in sending soliciting material to their principals. The Target Funds and the Acquiring Funds will not pay any of the costs associated with the preparation of this Prospectus/Proxy Statement or the solicitation of proxies.
64
OUTSTANDING SHARES
As of April 18, 2008, each class of the Target Funds had the following numbers of shares outstanding:
| | | | |
Name of Fund/Class | | Total Number of Shares
Outstanding | | Number of Shares Outstanding Per
Class |
Balanced Fund | | | | |
Investor Class | | | | |
| | |
Corporate Bond Fund | | | | |
Investor Class | | | | |
Advisor Class | | | | |
Institutional Class | | | | |
| | |
High Yield Bond Fund | | | | |
Class A | | | | |
Class B | | | | |
Class C | | | | |
| | |
Intermediate Government Income Fund | | | | |
Class A | | | | |
Class B | | | | |
Class C | | | | |
Administrator Class | | | | |
| | |
National Limited-Term Tax-Free Fund | | | | |
Class A | | | | |
Class B | | | | |
Class C | | | | |
Administrator Class | | | | |
| | |
National Tax-Free Fund | | | | |
Class A | | | | |
Class B | | | | |
Class C | | | | |
Administrator Class | | | | |
| | |
Overseas Fund | | | | |
Investor Class | | | | |
Institutional Class | | | | |
| | |
Value Fund | | | | |
Class A | | | | |
Class B | | | | |
Class C | | | | |
Investor Class | | | | |
Administrator Class | | | | |
INTEREST OF CERTAIN PERSONS IN THE TRANSACTION
The federal securities laws require that we include information about the shareholders who own 5% or more of the outstanding voting shares of each Target Fund and Acquiring Fund or class of each Target Fund and Acquiring Fund. The following classes of certain Acquiring Funds are newly created classes and will not issue
65
shares until the Reorganization is consummated: Government Securities Fund — Class B; High Income Fund —Class B and Class C; Income Plus Fund — Investor Class and Institutional Class, International Equity Fund —Investor Class and Short-Term Municipal Bond Fund — Class A. To the knowledge of Wells Fargo Advantage Funds, the following persons are the only persons who owned of record or beneficially 5% or more of the outstanding shares of each Target Fund and Acquiring Fund or class of each Target Fund and Acquiring Fund as of April 18, 2008.
| | | | | | | | |
Name of Fund/Class | | Name and Address | | Type of Ownership | | Percentage of Class | | Percentage of Fund |
For purposes of the 1940 Act, any person who owns directly or through one or more controlled companies more than 25% of the voting securities of a company is presumed to “control” such company. Accordingly, to the extent that a shareholder identified in the foregoing table is identified as the beneficial holder of more than 25% of a class or a Fund, or is identified as the holder of record of more than 25% of a class or Fund and has voting and/or investment power, it may be presumed to control such class or Fund.
In addition, Wells Fargo Bank, a wholly owned subsidiary of Wells Fargo & Company, holds certain shares of each Fund, in a trust, agency, custodial, fiduciary or other representative capacity with voting authority. Wells Fargo Bank, intends to pass the voting authority to the plan sponsor or fiduciary, or to hire an independent fiduciary to vote these shares. Such shares, however, may be voted by the proxies for any other matter, including adjournment. [As of April 18, 2008, the Officers and Trustees of Wells Fargo Advantage Funds, as a group, owned less than 1% of the outstanding shares of the Fund.]
ANNUAL MEETING AND SHAREHOLDER MEETINGS
Wells Fargo Advantage Funds does not presently hold annual meetings of shareholders for the election of Trustees and other business unless otherwise required by the 1940 Act. Any shareholder proposal for a shareholder meeting must be presented to the Wells Fargo Advantage Funds within a reasonable time before proxy materials for the next meeting are sent to shareholders. Because Wells Fargo Advantage Funds does not hold regular shareholder meetings, no anticipated date of the next meeting can be provided.
DISSENTERS’ RIGHTS
If the Reorganization is approved at the Meeting, shareholders will not have the right to dissent and obtain payment of the fair value of their shares because the exercise of dissenters’ rights is subject to the forward pricing requirements of Rule 22c-1 under the 1940 Act, which supercedes state law. Shareholders of the Target Funds, however, have the right to redeem their shares at net asset value subject to applicable deferred sales charges and/or redemption fees (if any) until the closing date of the Reorganization. After the Reorganization, shareholders will hold shares of the Acquiring Funds which may also be redeemed at net asset value subject to applicable deferred sales charges and/or redemption fees (if any).
EXHIBIT A — EXPENSE SUMMARIES OF THE TARGET FUNDS AND ACQUIRING FUNDS
The following tables are intended to help you understand the various costs and expenses you will pay as a shareholder in a Fund. The examples are intended to help you compare the costs of investing in the Funds with the cost of investing in other mutual funds. These tables do not reflect charges that may be imposed in connection with an account through which you hold Fund shares. A broker-dealer or financial institution maintaining the account through which you hold Fund shares may charge separate account, service or transaction fees on the purchase or sale of Fund shares that would be in addition to the fees and expenses shown here.
A. Balanced Fund/Asset Allocation Fund
The following comparative fee tables describe the Fund expenses you may pay, both directly and indirectly, if you hold shares of the Funds. The pro forma shareholder fees and operating expenses show the anticipated effects, if any, of the Reorganization. The Total Annual Operating Expenses tables and Examples shown below are based on actual expenses incurred during the Funds’ most recent twelve-month period ended September 30, 2007.
| | | | | | | | | |
| | | Balanced Fund | | | Asset
Allocation
Fund | | | Pro Forma-
Asset Allocation
Fund(1) | |
| | | Investor Class | | | Class A | | | Class A | |
Shareholder Fees (fees paid directly from your investment): | | | | | | | | | |
Maximum sales charge (load) imposed on purchases (as a percentage of the offering price) | | None | | | 5.75 | % | | 5.75 | % |
Maximum deferred sales charge (load) (as a percentage of the NAV at purchase) | | None | | | None | (2) | | None | (2) |
Annual Fund Operating Expenses (expenses that are deducted from Fund assets) | | | | | | | | | |
Management Fees(3) | | 0.65 | % | | 0.62 | % | | 0.61 | % |
Distribution (12b-1) Fees | | 0.00 | % | | 0.00 | % | | 0.00 | % |
Other Expenses(4) | | 0.92 | % | | 0.64 | % | | 0.64 | % |
Total Annual Fund Operating Expenses | | 1.57 | % | | 1.26 | % | | 1.25 | % |
Fee Waivers | | 0.32 | % | | 0.11 | % | | 0.10 | % |
Net Expenses(5) | | 1.25 | % | | 1.15 | % | | 1.15 | % |
(1) | Assuming Reorganization of the Investor Class shares of the Balanced Fund into the Class A shares of the Asset Allocation Fund. |
(2) | Class A shares that are purchased at NAV in amounts of $1,000,000 or more may be assessed a 1.00% contingent deferred sales charge if they are redeemed within eighteen months from the date of purchase. See “A Choice of Share Classes” for further information. |
(3) | Each Fund has a breakpoint schedule under which the management fee will decrease on Fund net assets above designated levels, as shown in the “Comparison of Investment Advisory Fees” section. |
(4) | Includes expenses payable to affiliates of Wells Fargo & Company and may include expenses of any money market or other fund held by the Fund. The Balanced Fund’s other expenses have been adjusted as necessary from amounts incurred during the Fund’s most recent fiscal year to reflect current fees and expenses. |
(5) | Funds Management has committed through January 31, 2009, to waive fees and/or reimburse expenses to the extent necessary to maintain the Fund’s net annual operating expense ratio shown. After this date, the net operating expense ratio may be increased only with approval of the Board of Trustees. |
A-1
Example
This example is intended to help you compare the cost of investing in the Funds with the cost of investing in other mutual funds. The maximum initial sales charge, if any, is reflected in this example. The example assumes that you invest $10,000 in the Fund, reinvest all distributions for the time periods indicated, and then either redeem or do not redeem all of your shares at the end of those periods. The example also assumes that your investment has a 5% return each year and that each Fund’s Total Annual Operating Expenses remain the same. The fee waivers in the Annual Operating Expenses are only reflected for the length of each waiver commitment in each of the following time periods. Although your actual costs may be higher or lower, based on these assumptions, your costs would be:
| | | | | | | | | |
| | | Balanced Fund | | Asset Allocation Fund | | Pro Forma-Asset
Allocation Fund(1) |
| | | Investor Class | | Class A | | Class A |
One Year | | $ | 127 | | $ | 685 | | $ | 685 |
Three Years | | $ | 464 | | $ | 941 | | $ | 939 |
Five Years | | $ | 825 | | $ | 1,217 | | $ | 1,213 |
Ten Years | | $ | 1,840 | | $ | 2,001 | | $ | 1,991 |
(1) | Assuming Reorganization of the Investor Class shares of the Balanced Fund into the Class A shares of the Asset Allocation Fund. |
The example above should not be considered a representation of future expenses. Actual expenses may be greater or less than those shown.
B. Corporate Bond Fund/Income Plus Fund
The following comparative fee tables describe the Fund expenses you may pay, both directly and indirectly, if you hold shares of the Funds. The pro forma shareholder fees and operating expenses show the anticipated effects, if any, of the Reorganization. The Total Annual Operating Expenses tables and Examples shown below are based on actual expenses incurred during the Funds’ most recent twelve-month period ended May 31, 2007.
| | | | | | | | | |
| | | Corporate
Bond Fund | | | Income Plus
Fund | | | Pro Forma-
Income Plus
Fund(1) | |
| | | Investor Class | | | Investor
Class (new) | | | Investor
Class (new) | |
Shareholder Fees (fees paid directly from your investment): | | | | | | | | | |
Maximum sales charge (load) imposed on purchases (as a percentage of the offering price) | | None | | | None | | | None | |
Maximum deferred sales charge (load) (as a percentage of the NAV at purchase) | | None | | | None | | | None | |
Annual Fund Operating Expenses (expenses that are deducted from Fund assets) | | | | | | | | | |
Management Fees(2) | | 0.45 | % | | 0.55 | % | | 0.55 | % |
Distribution (12b-1) Fees | | 0.00 | % | | 0.00 | % | | 0.00 | % |
Other Expenses(3) | | 0.86 | % | | 0.81 | % | | 0.81 | % |
Acquired Fund Fees and Expenses(4) | | 0.00 | % | | 0.01 | % | | 0.01 | % |
Total Annual Fund Operating Expenses | | 1.31 | % | | 1.37 | % | | 1.37 | % |
Fee Waivers | | 0.33 | % | | 0.42 | % | | 0.42 | % |
Net Expenses | | 0.98 | %(5) | | 0.95 | %(6)(7) | | 0.95 | %(6)(8) |
A-2
| | | | | | | | | |
| | | Corporate
Bond Fund | | | Income Plus
Fund | | | Pro Forma-
Income Plus
Fund(1) | |
| | | Advisor Class | | | Class A | | | Class A | |
Shareholder Fees (fees paid directly from your investment): | | | | | | | | | |
Maximum sales charge (load) imposed on purchases (as a percentage of the offering price) | | None | | | 4.50 | % | | 4.50 | % |
Maximum deferred sales charge (load) (as a percentage of the NAV at purchase) | | None | | | None | (9) | | None | (9) |
Annual Fund Operating Expenses (expenses that are deducted from Fund assets) | | | | | | | | | |
Management Fees(2) | | 0.45 | % | | 0.55 | % | | 0.55 | % |
Distribution (12b-1) Fees | | 0.00 | % | | 0.00 | % | | 0.00 | % |
Other Expenses(3) | | 0.68 | % | | 0.79 | % | | 0.68 | % |
Acquired Fund Fees and Expenses(4) | | 0.00 | % | | 0.01 | % | | 0.01 | % |
Total Annual Fund Operating Expenses | | 1.13 | % | | 1.35 | % | | 1.24 | % |
Fee Waivers | | 0.18 | % | | 0.34 | % | | 0.33 | % |
Net Expenses | | 0.95 | %(5) | | 1.01 | %(6)(7) | | 0.91 | %(6)(8) |
| | | | | | | | | |
| | | Corporate
Bond Fund | | | Income
Plus Fund | | | Pro Forma-
Income Plus
Fund(1) | |
| | | Institutional
Class | | | Institutional
Class (new) | | | Institutional
Class (new) | |
Shareholder Fees (fees paid directly from your investment): | | | | | | | | | |
Maximum sales charge (load) imposed on purchases (as a percentage of the offering price) | | None | | | None | | | None | |
Maximum deferred sales charge (load) (as a percentage of the NAV at purchase) | | None | | | None | | | None | |
Annual Fund Operating Expenses (expenses that are deducted from Fund assets) | | | | | | | | | |
Management Fees(2) | | 0.45 | % | | 0.55 | % | | 0.55 | % |
Distribution (12b-1) Fees | | 0.00 | % | | 0.00 | % | | 0.00 | % |
Other Expenses(3) | | 0.23 | % | | 0.23 | % | | 0.23 | % |
Acquired Fund Fees and Expenses(4) | | 0.00 | % | | 0.01 | % | | 0.01 | % |
Total Annual Fund Operating Expenses | | 0.68 | % | | 0.79 | % | | 0.79 | % |
Fee Waivers | | 0.07 | % | | 0.17 | % | | 0.17 | % |
Net Expenses | | 0.61 | %(5) | | 0.62 | %(6)(7) | | 0.62 | %(6)(8) |
(1) | Assuming Reorganization of the Investor, Advisor, and Institutional Class shares of the Corporate Bond Fund into the Investor Class, Class A, and Institutional Class shares, respectively, of the Income Plus Fund. |
(2) | Each Fund has a breakpoint schedule under which the management fee will decrease on Fund net assets above designated levels, as shown in the “Comparison of Investment Advisory Fees” section. |
(3) | Includes expenses payable to affiliates of Wells Fargo & Company and for the Corporate Bond Fund may include expenses of any money market or other fund held by the Fund. |
(4) | Reflects the pro-rata portion of the net operating expenses of any money market fund or other fund held by the Fund. Shareholders indirectly bear these underlying expenses because the NAV and/or distributions paid reflect such underlying expenses. |
(5) | Funds Management has committed through September 30, 2008, to waive fees and/or reimburse expenses to the extent necessary to maintain the Fund’s net annual operating expense ratio shown. After this date, the net operating expense ratio may be increased only with approval of the Board of Trustees. |
(6) | The net operating expense ratios shown here include the expenses of any money market fund or other fund held by the Fund. |
A-3
(7) | Funds Management has committed through September 30, 2009, to waive fees and/or reimburse expenses to the extent necessary to maintain the Fund’s net annual operating expense ratio, excluding the expenses of any money market fund or other fund held by the Fund, at 1.00% for Class A shares, 0.94% for Investor Class shares and 0.61% for Institutional Class shares. After this date, the net operating expense ratio may be increased only with approval of the Board of Trustees. |
(8) | Funds Management has committed through September 30, 2009, to waive fees and/or reimburse expenses to the extent necessary to maintain the Fund’s net annual operating expense ratio, excluding the expenses of any money market fund or other fund held by the Fund, at 1.00% for Class A shares, 0.94% for Investor Class shares and 0.61% for Institutional Class shares. After this date, the net operating expense ratio may be increased only with approval of the Board of Trustees. |
(9) | Class A shares that are purchased at NAV in amounts of $1,000,000 or more may be assessed a 1.00% contingent deferred sales charge if they are redeemed within eighteen months from the date of purchase. See “A Choice of Share Classes” for further information. |
Example
This example is intended to help you compare the cost of investing in the Funds with the cost of investing in other mutual funds. The maximum initial sales charge, if any, is reflected in this example. The example assumes that you invest $10,000 in the Fund, reinvest all distributions for the time periods indicated, and then either redeem or do not redeem all of your shares at the end of those periods. The example also assumes that your investment has a 5% return each year and that each Fund’s Total Annual Operating Expenses remain the same. The fee waivers in the Annual Operating Expenses are only reflected for the length of each waiver commitment in each of the following time periods. Although your actual costs may be higher or lower, based on these assumptions, your costs would be:
| | | | | | | | | |
| | | Corporate Bond Fund | | Income Plus Fund | | Pro Forma-Income Plus
Fund(1) |
| | | Investor Class | | Investor Class (new) | | Investor Class (new) |
One Year | | $ | 100 | | $ | 97 | | $ | 97 |
Three Years | | $ | 383 | | $ | 393 | | $ | 393 |
Five Years | | $ | 687 | | $ | 712 | | $ | 712 |
Ten Years | | $ | 1,550 | | $ | 1,616 | | $ | 1,616 |
| | | | | | | | | |
| | | Corporate Bond Fund | | Income Plus Fund | | Pro Forma-Income Plus
Fund(1) |
| | | Advisor Class | | Class A | | Class A |
One Year | | $ | 97 | | $ | 548 | | $ | 539 |
Three Years | | $ | 341 | | $ | 827 | | $ | 795 |
Five Years | | $ | 605 | | $ | 1,127 | | $ | 1,072 |
Ten Years | | $ | 1,359 | | $ | 1,977 | | $ | 1,859 |
| | | | | | | | | |
| | | Corporate Bond Fund | | Income Plus Fund | | Pro Forma-Income Plus
Fund(1) |
| | | Institutional Class | | Institutional Class (new) | | Institutional Class (new) |
One Year | | $ | 62 | | $ | 63 | | $ | 63 |
Three Years | | $ | 211 | | $ | 236 | | $ | 236 |
Five Years | | $ | 372 | | $ | 423 | | $ | 423 |
Ten Years | | $ | 840 | | $ | 963 | | $ | 963 |
(1) | Assuming Reorganization of the Investor, Advisor, and Institutional Class shares of the Corporate Bond Fund into the Investor Class, Class A, and Institutional Class shares, respectively, of the Income Plus Fund. |
A-4
The example above should not be considered a representation of future expenses. Actual expenses may be greater or less than those shown.
C. High Yield Bond Fund/High Income Fund
The following comparative fee tables describe the Fund expenses you may pay, both directly and indirectly, if you hold shares of the Funds. The pro forma shareholder fees and operating expenses show the anticipated effects, if any, of the Reorganization. The Total Annual Operating Expenses tables and Examples shown below are based on actual expenses incurred during the Funds’ most recent twelve-month period ended May 31, 2007.
| | | | | | | | | |
| | | High Yield
Bond Fund | | | High Income
Fund | | | Pro Forma-
High Income
Fund(1) | |
| | | Class A | | | Class A
(formerly
Advisor Class) | | | Class A
(formerly
Advisor Class) | |
Shareholder Fees (fees paid directly from your investment): | | | | | | | | | |
Maximum sales charge (load) imposed on purchases (as a percentage of the offering price) | | 4.50 | % | | 4.50 | % | | 4.50 | % |
Maximum deferred sales charge (load) (as a percentage of the NAV at purchase) | | None | (9) | | None | (9) | | None | (9) |
Redemption Fee(2) | | 2.00 | % | | 2.00 | % | | 2.00 | % |
Annual Fund Operating Expenses (expenses that are deducted from Fund assets) | | | | | | | | | |
Management Fees(3) | | 0.55 | % | | 0.55 | % | | 0.55 | % |
Distribution (12b-1) Fees | | 0.00 | % | | 0.00 | % | | 0.00 | % |
Other Expenses(4) | | 0.72 | % | | 0.62 | % | | 0.62 | % |
Acquired Fund Fees and Expenses(5) | | 0.01 | % | | 0.01 | % | | 0.01 | % |
Total Annual Fund Operating Expenses | | 1.28 | % | | 1.18 | % | | 1.18 | % |
Fee Waivers | | 0.12 | % | | 0.27 | % | | 0.27 | % |
Net Expenses(6) | | 1.16 | %(7) | | 0.91 | %(8) | | 0.91 | %(8) |
| | | | | | | | | |
| | | High Yield
Bond Fund | | | High Income
Fund | | | Pro Forma-
High Income
Fund(1) | |
| | | Class B | | | Class B (new) | | | Class B (new) | |
Shareholder Fees (fees paid directly from your investment): | | | | | | | | | |
Maximum sales charge (load) imposed on purchases (as a percentage of the offering price) | | None | | | None | | | None | |
Maximum deferred sales charge (load) (as a percentage of the NAV at purchase) | | 5.00 | % | | 5.00 | % | | 5.00 | % |
Redemption Fee(2) | | 2.00 | % | | 2.00 | % | | 2.00 | % |
Annual Fund Operating Expenses (expenses that are deducted from Fund assets) | | | | | | | | | |
Management Fees(3) | | 0.55 | % | | 0.55 | % | | 0.55 | % |
Distribution (12b-1) Fees | | 0.75 | % | | 0.75 | % | | 0.75 | % |
Other Expenses(4) | | 0.72 | % | | 0.62 | % | | 0.62 | % |
Acquired Fund Fees and Expenses(5) | | 0.01 | % | | 0.01 | % | | 0.01 | % |
Total Annual Fund Operating Expenses | | 2.03 | % | | 1.93 | % | | 1.93 | % |
Fee Waivers | | 0.12 | % | | 0.27 | % | | 0.27 | % |
Net Expenses(6) | | 1.91 | %(7) | | 1.66 | %(8) | | 1.66 | %(8) |
A-5
| | | | | | | | | |
| | | High Yield
Bond Fund | | | High Income
Fund | | | Pro Forma-
High Income
Fund(1) | |
| | | Class C | | | Class C (new) | | | Class C (new) | |
Shareholder Fees (fees paid directly from your investment): | | | | | | | | | |
Maximum sales charge (load) imposed on purchases (as a percentage of the offering price) | | None | | | None | | | None | |
Maximum deferred sales charge (load) (as a percentage of the NAV at purchase) | | 1.00 | % | | 1.00 | % | | 1.00 | % |
Redemption Fee(2) | | 2.00 | % | | 2.00 | % | | 2.00 | % |
Annual Fund Operating Expenses (expenses that are deducted from Fund assets) | | | | | | | | | |
Management Fees(3) | | 0.55 | % | | 0.55 | % | | 0.55 | % |
Distribution (12b-1) Fees | | 0.75 | % | | 0.75 | % | | 0.75 | % |
Other Expenses(4) | | 0.72 | % | | 0.62 | % | | 0.62 | % |
Acquired Fund Fees and Expenses(5) | | 0.01 | % | | 0.01 | % | | 0.01 | % |
Total Annual Fund Operating Expenses | | 2.03 | % | | 1.93 | % | | 1.93 | % |
Fee Waivers | | 0.12 | % | | 0.27 | % | | 0.27 | % |
Net Expenses(6) | | 1.91 | %(7) | | 1.66 | %(8) | | 1.66 | %(8) |
(1) | Assuming Reorganization of the Class A, Class B, and Class C shares of the High Yield Bond Fund into the Class A, Class B, and Class C shares, respectively, of the High Income Fund. |
(2) | Deducted from the net proceeds if shares redeemed (or exchanged) within 30 days of purchase. This fee is retained by the Fund. |
(3) | Each Fund has a breakpoint schedule under which the management fee will decrease on Fund net assets above designated levels, as shown in the “Comparison of Investment Advisory Fees” section. |
(4) | Includes expenses payable to affiliates of Wells Fargo & Company and may include expenses of any money market or other fund held by the Fund. |
(5) | Reflects the pro-rata portion of the net operating expenses of any money market fund or other fund held by the Fund. Shareholders indirectly bear these underlying expenses because the NAV and/or distributions paid reflect such underlying expenses. |
(6) | The net operating expense ratios shown here include the expenses of any money market fund or other fund held by the Fund. |
(7) | Funds Management has committed through September 30, 2008, to waive fees and/or reimburse expenses to the extent necessary to maintain the Fund’s net annual operating expense ratio, excluding the expenses of any money market fund or other fund held by the Fund, at 1.15% for Class A shares and 1.90% for Class B and Class C shares., . After this date, the net operating expense ratio may be increased only with approval of the Board of Trustees. |
(8) | Funds Management has committed through September 30, 2009, to waive fees and/or reimburse expenses to the extent necessary to maintain the Fund’s net annual operating expense ratio, excluding the expenses of any money market fund or other fund held by the Fund, at 0.90% for Class A shares and 1.65% for Class B and Class C shares. After this date, the net operating expense ratio may be increased only with approval of the Board of Trustees. |
(9) | Class A shares that are purchased at NAV in amounts of $1,000,000 or more may be assessed a 1.00% contingent deferred sales charge if they are redeemed within eighteen months from the date of purchase. See “A Choice of Share Classes” for further information. |
Example
This example is intended to help you compare the cost of investing in the Funds with the cost of investing in other mutual funds. The maximum initial sales charge, if any, is reflected in this example. The example assumes that you invest $10,000 in the Fund, reinvest all distributions for the time periods indicated, and then either
A-6
redeem or do not redeem all of your shares at the end of those periods. The example also assumes that your investment has a 5% return each year and that each Fund’s Total Annual Operating Expenses remain the same. The fee waivers in the Annual Operating Expenses are only reflected for the length of each waiver commitment in each of the following time periods. Although your actual costs may be higher or lower, based on these assumptions, your costs would be:
| | | | | | | | | |
| | | High Yield Bond Fund | | High Income Fund | | Pro Forma-High Income
Fund(1) |
| | | Class A | | Class A (formerly
Advisor Class) | | Class A (formerly
Advisor Class) |
One Year | | $ | 563 | | $ | 539 | | $ | 539 |
Three Years | | $ | 826 | | $ | 783 | | $ | 783 |
Five Years | | $ | 1,110 | | $ | 1,046 | | $ | 1,046 |
Ten Years | | $ | 1,916 | | $ | 1,798 | | $ | 1,798 |
| | | | | | | | | |
| | | High Yield Bond Fund | | High Income Fund | | Pro Forma-High Income
Fund(1) |
If you redeem your shares | | Class B | | Class B (new) | | Class B (new) |
One Year | | $ | 694 | | $ | 669 | | $ | 669 |
Three Years | | $ | 925 | | $ | 881 | | $ | 881 |
Five Years | | $ | 1,282 | | $ | 1,219 | | $ | 1,219 |
Ten Years | | $ | 2,065 | | $ | 1,950 | | $ | 1,950 |
| | | | | | | | | |
| | | High Yield Bond Fund | | High Income Fund | | Pro Forma-High Income
Fund(1) |
If you do not redeem your shares | | Class B | | Class B (new) | | Class B (new) |
One Year | | $ | 194 | | $ | 169 | | $ | 169 |
Three Years | | $ | 625 | | $ | 581 | | $ | 581 |
Five Years | | $ | 1,082 | | $ | 1,019 | | $ | 1,019 |
Ten Years | | $ | 2,065 | | $ | 1,950 | | $ | 1,950 |
| | | | | | | | | |
| | | High Yield Bond Fund | | High Income Fund | | Pro Forma-High Income
Fund(1) |
If you redeem your shares | | Class C | | Class C (new) | | Class C (new) |
One Year | | $ | 294 | | $ | 269 | | $ | 269 |
Three Years | | $ | 625 | | $ | 581 | | $ | 581 |
Five Years | | $ | 1,082 | | $ | 1,019 | | $ | 1,019 |
Ten Years | | $ | 2,349 | | $ | 2,237 | | $ | 2,237 |
| | | | | | | | | |
| | | High Yield Bond Fund | | High Income Fund | | Pro Forma-High Income
Fund(1) |
If you do not redeem your shares | | Class C | | Class C (new) | | Class C (new) |
One Year | | $ | 194 | | $ | 169 | | $ | 169 |
Three Years | | $ | 625 | | $ | 581 | | $ | 581 |
Five Years | | $ | 1,082 | | $ | 1,019 | | $ | 1,019 |
Ten Years | | $ | 2,349 | | $ | 2,237 | | $ | 2,237 |
(1) | Assuming Reorganization of the Class A, Class B, and Class C shares of the High Yield Bond Fund into the Class A, Class B, and Class C shares, respectively, of the High Income Fund. |
The example above should not be considered a representation of future expenses. Actual expenses may be greater or less than those shown.
A-7
D. Intermediate Government Income Fund/Government Securities Fund
The following comparative fee tables describe the Fund expenses you may pay, both directly and indirectly, if you hold shares of the Funds. The pro forma shareholder fees and operating expenses show the anticipated effects, if any, of the Reorganization. The Total Annual Operating Expenses tables and Examples shown below are based on actual expenses incurred during the Funds’ most recent twelve-month period ended May 31, 2007.
| | | | | | | | | |
| | | Intermediate
Government
Income Fund | | | Government
Securities
Fund | | | Pro Forma-
Government
Securities Fund(1) | |
| | | Class A | | | Class A
(formerly
Advisor Class) | | | Class A
(formerly
Advisor Class) | |
Shareholder Fees (fees paid directly from your investment): | | | | | | | | | |
Maximum sales charge (load) imposed on purchases (as a percentage of the offering price) | | 4.50 | % | | 4.50 | % | | 4.50 | % |
Maximum deferred sales charge (load) (as a percentage of the NAV at purchase) | | None | | | None | (6) | | None | (6) |
Annual Fund Operating Expenses (expenses that are deducted from Fund assets) | | | | | | | | | |
Management Fees(2) | | 0.45 | % | | 0.42 | % | | 0.40 | % |
Distribution (12b-1) Fees | | 0.00 | % | | 0.00 | % | | 0.00 | % |
Other Expenses(3) | | 0.64 | % | | 0.64 | % | | 0.64 | % |
Total Annual Fund Operating Expenses | | 1.09 | % | | 1.06 | % | | 1.04 | % |
Fee Waivers | | 0.14 | % | | 0.16 | % | | 0.14 | % |
Net Expenses | | 0.95 | %(4) | | 0.90 | %(5) | | 0.90 | %(5) |
| | | | | | | | | |
| | | Intermediate
Government
Income Fund | | | Government
Securities
Fund | | | Pro Forma-
Government
Securities Fund(1) | |
| | | Class B | | | Class B (new) | | | Class B (new) | |
Shareholder Fees (fees paid directly from your investment): | | | | | | | | | |
Maximum sales charge (load) imposed on purchases (as a percentage of the offering price) | | None | | | None | | | None | |
Maximum deferred sales charge (load) (as a percentage of the NAV at purchase) | | 5.00 | % | | 5.00 | % | | 5.00 | % |
Annual Fund Operating Expenses (expenses that are deducted from Fund assets) | | | | | | | | | |
Management Fees(2) | | 0.45 | % | | 0.42 | % | | 0.40 | % |
Distribution (12b-1) Fees | | 0.75 | % | | 0.75 | % | | 0.75 | % |
Other Expenses(3) | | 0.64 | % | | 0.64 | % | | 0.64 | % |
Total Annual Fund Operating Expenses | | 1.84 | % | | 1.81 | % | | 1.79 | % |
Fee Waivers | | 0.14 | % | | 0.16 | % | | 0.14 | % |
Net Expenses | | 1.70 | %(4) | | 1.65 | %(5) | | 1.65 | %(5) |
A-8
| | | | | | | | | |
| | | Intermediate
Government
Income Fund | | | Government
Securities
Fund | | | Pro Forma-
Government
Securities Fund(1) | |
| | | Class C | | | Class C | | | Class C | |
Shareholder Fees (fees paid directly from your investment): | | | | | | | | | |
Maximum sales charge (load) imposed on purchases (as a percentage of the offering price) | | None | | | None | | | None | |
Maximum deferred sales charge (load) (as a percentage of the NAV at purchase) | | 1.00 | % | | 1.00 | % | | 1.00 | % |
Annual Fund Operating Expenses (expenses that are deducted from Fund assets) | | | | | | | | | |
Management Fees(2) | | 0.45 | % | | 0.42 | % | | 0.40 | % |
Distribution (12b-1) Fees | | 0.75 | % | | 0.75 | % | | 0.75 | % |
Other Expenses(3) | | 0.64 | % | | 0.64 | % | | 0.64 | % |
Total Annual Fund Operating Expenses | | 1.84 | % | | 1.81 | % | | 1.79 | % |
Fee Waivers | | 0.14 | % | | 0.11 | % | | 0.14 | % |
Net Expenses | | 1.70 | %(4) | | 1.70 | %(5) | | 1.65 | %(5) |
| | | | | | | | | |
| | | Intermediate
Government
Income Fund | | | Government
Securities
Fund | | | Pro Forma-
Government
Securities Fund(1) | |
| | | Administrator
Class | | | Administrator
Class | | | Administrator
Class | |
Shareholder Fees (fees paid directly from your investment): | | | | | | | | | |
Maximum sales charge (load) imposed on purchases (as a percentage of the offering price) | | None | | | None | | | None | |
Maximum deferred sales charge (load) (as a percentage of the NAV at purchase) | | None | | | None | | | None | |
Annual Fund Operating Expenses (expenses that are deducted from Fund assets) | | | | | | | | | |
Management Fees(2) | | 0.45 | % | | 0.42 | % | | 0.40 | % |
Distribution (12b-1) Fees | | 0.00 | % | | 0.00 | % | | 0.00 | % |
Other Expenses(3) | | 0.46 | % | | 0.46 | % | | 0.46 | % |
Total Annual Fund Operating Expenses | | 0.91 | % | | 0.88 | % | | 0.86 | % |
Fee Waivers | | 0.21 | % | | 0.18 | % | | 0.16 | % |
Net Expenses | | 0.70 | %(4) | | 0.70 | %(5) | | 0.70 | %(5) |
(1) | Assuming Reorganization of the Class A, Class B, Class C, and Administrator Class shares of the Intermediate Government Income Fund into the Class A, Class B, Class C, and Administrator Class shares, respectively, of the Government Securities Fund. |
(2) | Each Fund has a breakpoint schedule under which the management fee will decrease on Fund net assets above designated levels, as shown in the “Comparison of Investment Advisory Fees” section. |
(3) | Includes expenses payable to affiliates of Wells Fargo & Company and may include expenses of any money market or other fund held by the Fund. |
(4) | Funds Management has committed through September 30, 2008, to waive fees and/or reimburse expenses to the extent necessary to maintain the Fund’s net annual operating expense ratio shown. After this date, the net operating expense ratio may be increased only with approval of the Board of Trustees. |
(5) | Funds Management has committed through September 30, 2009, to waive fees and/or reimburse expenses to the extent necessary to maintain the Fund’s net annual operating expense ratio shown. After this date, the net operating expense ratio may be increased only with approval of the Board of Trustees. |
A-9
Example
This example is intended to help you compare the cost of investing in the Funds with the cost of investing in other mutual funds. The maximum initial sales charge, if any, is reflected in this example. The example assumes that you invest $10,000 in the Fund, reinvest all distributions for the time periods indicated, and then either redeem or do not redeem all of your shares at the end of those periods. The example also assumes that your investment has a 5% return each year and that each Fund’s Total Annual Operating Expenses remain the same. The fee waivers in the Annual Operating Expenses are only reflected for the length of each waiver commitment in each of the following time periods. Although your actual costs may be higher or lower, based on these assumptions, your costs would be:
| | | | | | | | | |
| | | Intermediate
Government Income
Fund | | Government Securities
Fund | | Pro Forma-Government
Securities Fund(1) |
| | | Class A | | Class A (formerly
Advisor Class) | | Class A (formerly
Advisor Class) |
One Year | | $ | 543 | | $ | 538 | | $ | 538 |
Three Years | | $ | 768 | | $ | 757 | | $ | 753 |
Five Years | | $ | 1,011 | | $ | 994 | | $ | 986 |
Ten Years | | $ | 1,707 | | $ | 1,672 | | $ | 1,653 |
| | | | | | | | | |
| | | Intermediate
Government Income
Fund | | Government Securities
Fund | | Pro Forma-Government
Securities Fund(1) |
If you redeem your shares | | Class B | | Class B (new) | | Class B (new) |
One Year | | $ | 673 | | $ | 668 | | $ | 668 |
Three Years | | $ | 865 | | $ | 854 | | $ | 850 |
Five Years | | $ | 1,182 | | $ | 1,166 | | $ | 1,158 |
Ten Years | | $ | 1,858 | | $ | 1,826 | | $ | 1,813 |
| | | | | | | | | |
| | | Intermediate
Government Income
Fund | | Government Securities
Fund | | Pro Forma-Government
Securities Fund(1) |
If you do not redeem your shares | | Class B | | Class B (new) | | Class B (new) |
One Year | | $ | 173 | | $ | 168 | | $ | 168 |
Three Years | | $ | 565 | | $ | 554 | | $ | 550 |
Five Years | | $ | 982 | | $ | 966 | | $ | 958 |
Ten Years | | $ | 1,858 | | $ | 1,826 | | $ | 1,813 |
| | | | | | | | | |
| | | Intermediate
Government Income
Fund | | Government Securities
Fund | | Pro Forma-Government
Securities Fund(1) |
If you redeem your shares | | Class C | | Class C | | Class C |
One Year | | $ | 273 | | $ | 273 | | $ | 268 |
Three Years | | $ | 565 | | $ | 559 | | $ | 550 |
Five Years | | $ | 982 | | $ | 971 | | $ | 958 |
Ten Years | | $ | 2,147 | | $ | 2,120 | | $ | 2,096 |
| | | | | | | | | |
| | | Intermediate
Government Income
Fund | | Government Securities
Fund | | Pro Forma-Government
Securities Fund(1) |
If you do not redeem your shares | | Class C | | Class C | | Class C |
One Year | | $ | 173 | | $ | 173 | | $ | 168 |
Three Years | | $ | 565 | | $ | 559 | | $ | 550 |
Five Years | | $ | 982 | | $ | 971 | | $ | 958 |
Ten Years | | $ | 2,147 | | $ | 2,120 | | $ | 2,096 |
A-10
| | | | | | | | | |
| | | Intermediate
Government Income
Fund | | Government Securities
Fund | | Pro Forma-Government
Securities Fund(1) |
| | | Administrator Class | | Administrator Class | | Administrator Class |
One Year | | $ | 72 | | $ | 72 | | $ | 72 |
Three Years | | $ | 269 | | $ | 263 | | $ | 259 |
Five Years | | $ | 483 | | $ | 471 | | $ | 462 |
Ten Years | | $ | 1,100 | | $ | 1,069 | | $ | 1,047 |
(1) | Assuming Reorganization of the Class A, Class B, Class C, and Administrator Class shares of the Intermediate Government Income Fund into the Class A, Class B, Class C, and Administrator Class shares, respectively, of the Government Securities Fund. |
The example above should not be considered a representation of future expenses. Actual expenses may be greater or less than those shown.
E. National Limited-Term Tax-Free Fund/Short-Term Municipal Bond Fund
The following comparative fee tables describe the Fund expenses you may pay, both directly and indirectly, if you hold shares of the Funds. The pro forma shareholder fees and operating expenses show the anticipated effects, if any, of the Reorganization. The Total Annual Operating Expenses tables and Examples shown below are based on actual expenses incurred during the Funds’ most recent twelve-month period ended June 30, 2007.
| | | | | | | | | |
| | | National
Limited-Term
Tax-Free Fund | | | Short-Term
Municipal
Bond Fund | | | Pro Forma-
Short-Term
Municipal Bond
Fund(1) | |
| | | Class A | | | Class A (new) | | | Class A (new) | |
Shareholder Fees (fees paid directly from your investment): | | | | | | | | | |
Maximum sales charge (load) imposed on purchases (as a percentage of the offering price) | | 3.00 | % | | 3.00 | % | | 3.00 | % |
Maximum deferred sales charge (load) (as a percentage of the NAV at purchase) | | None | (10) | | None | (10) | | None | (10) |
Annual Fund Operating Expenses (expenses that are deducted from Fund assets) | | | | | | | | | |
Management Fees(2) | | 0.40 | % | | 0.39 | % | | 0.38 | % |
Distribution (12b-1) Fees | | 0.00 | % | | 0.00 | % | | 0.00 | % |
Other Expenses(3) | | 0.71 | % | | 0.62 | % | | 0.62 | % |
Acquired Fund Fees and Expenses(4) | | 0.01 | % | | 0.01 | % | | 0.01 | % |
Total Annual Fund Operating Expenses | | 1.12 | % | | 1.02 | % | | 1.01 | % |
Fee Waivers | | 0.31 | % | | 0.41 | % | | 0.40 | % |
Net Expenses (5) | | 0.81 | %(6) | | 0.61 | %(7) | | 0.61 | %(8) |
A-11
| | | | | | | | | |
| | | National
Limited-Term
Tax-Free Fund | | | Short-Term
Municipal
Bond Fund | | | Pro Forma-
Short-Term
Municipal Bond
Fund(1) | |
| | | Class B | | | Class A (new) | | | Class A (new) | |
Shareholder Fees (fees paid directly from your investment): | | | | | | | | | |
Maximum sales charge (load) imposed on purchases (as a percentage of the offering price) | | None | | | 3.00 | % | | 3.00 | % |
Maximum deferred sales charge (load) (as a percentage of the NAV at purchase) | | 3.00 | % | | None | (10) | | None | (10) |
Annual Fund Operating Expenses (expenses that are deducted from Fund assets) | | | | | | | | | |
Management Fees(2) | | 0.40 | % | | 0.39 | % | | 0.38 | % |
Distribution (12b-1) Fees | | 0.75 | % | | 0.00 | % | | 0.00 | % |
Other Expenses(3) | | 0.71 | % | | 0.62 | % | | 0.62 | % |
Acquired Fund Fees and Expenses(4) | | 0.01 | % | | 0.01 | % | | 0.01 | % |
Total Annual Fund Operating Expenses | | 1.87 | % | | 1.02 | % | | 1.01 | % |
Fee Waivers | | 0.31 | % | | 0.41 | % | | 0.40 | % |
Net Expenses(5) | | 1.56 | %(6) | | 0.61 | %(7) | | 0.61 | %(8) |
| | | | | | | | | |
| | | National
Limited-Term
Tax-Free Fund | | | Short-Term
Municipal
Bond Fund | | | Pro Forma-
Short-Term
Municipal Bond
Fund(1) | |
| | | Class C | | | Class C | | | Class C | |
Shareholder Fees (fees paid directly from your investment): | | | | | | | | | |
Maximum sales charge (load) imposed on purchases (as a percentage of the offering price) | | None | | | None | | | None | |
Maximum deferred sales charge (load) (as a percentage of the NAV at purchase) | | 1.00 | % | | 1.00 | % | | 1.00 | % |
Annual Fund Operating Expenses (expenses that are deducted from Fund assets) | | | | | | | | | |
Management Fees(2) | | 0.40 | % | | 0.39 | % | | 0.38 | % |
Distribution (12b-1) Fees | | 0.75 | % | | 0.75 | % | | 0.75 | % |
Other Expenses(3) | | 0.71 | % | | 0.62 | %(9) | | 0.62 | % |
Acquired Fund Fees and Expenses(4) | | 0.01 | % | | 0.01 | % | | 0.01 | % |
Total Annual Fund Operating Expenses | | 1.87 | % | | 1.77 | % | | 1.76 | % |
Fee Waivers | | 0.31 | % | | 0.21 | % | | 0.40 | % |
Net Expenses(5) | | 1.56 | %(6) | | 1.56 | %(7) | | 1.36 | %(8) |
A-12
| | | | | | | | | |
| | | National
Limited-Term
Tax-Free Fund | | | Short-Term
Municipal
Bond Fund | | | Pro Forma-
Short-Term
Municipal Bond
Fund(1) | |
| | | Administrator
Class | | | Class A (new) | | | Class A (new) | |
Shareholder Fees (fees paid directly from your investment): | | | | | | | | | |
Maximum sales charge (load) imposed on purchases (as a percentage of the offering price) | | None | | | 3.00 | % | | 3.00 | % |
Maximum deferred sales charge (load) (as a percentage of the NAV at purchase) | | None | | | None | (10) | | None | (10) |
Annual Fund Operating Expenses (expenses that are deducted from Fund assets) | | | | | | | | | |
Management Fees(2) | | 0.40 | % | | 0.39 | % | | 0.38 | % |
Distribution (12b-1) Fees | | 0.00 | % | | 0.00 | % | | 0.00 | % |
Other Expenses(3) | | 0.53 | % | | 0.62 | % | | 0.62 | % |
Acquired Fund Fees and Expenses(4) | | 0.01 | % | | 0.01 | % | | 0.01 | % |
Total Annual Fund Operating Expenses | | 0.94 | % | | 1.02 | % | | 1.01 | % |
Fee Waivers | | 0.33 | % | | 0.41 | % | | 0.40 | % |
Net Expenses(5) | | 0.61 | %(6) | | 0.61 | %(7) | | 0.61 | %(8) |
(1) | Assuming Reorganization of the Class A, Class B, and Administrator Class shares of the National Limited-Term Tax-Free Fund into the Class A shares of the Short-Term Municipal Bond Fund, and the Class C shares of the National Limited-Term Tax-Free Fund into the Class C shares of the Short-Term Municipal Bond Fund. |
(2) | Each Fund has a breakpoint schedule under which the management fee will decrease on Fund net assets above designated levels, as shown in the “Comparison of Investment Advisory Fees” section. |
(3) | Includes expenses payable to affiliates of Wells Fargo & Company. |
(4) | Reflects the pro-rata portion of the net operating expenses of any money market fund or other fund held by the Fund. Shareholders indirectly bear these underlying expenses because the NAV and/or distributions paid reflect such underlying expenses. |
(5) | The net operating expense ratio shown here includes the expenses of any money market fund or other fund held by the Fund. |
(6) | Funds Management has committed through October 31, 2008, to waive fees and/or reimburse expenses to the extent necessary to maintain the Fund’s net annual operating expense ratio, excluding the expenses of any money market fund or other fund held by the Fund, at 0.80% for Class A shares, 1.55% for Class B and Class C shares, and 0.60% for Administrator Class shares. After this date, the net operating expense ratio may be increased only with approval of the Board of Trustees. |
(7) | Funds Management has committed through October 31, 2009, to waive fees and/or reimburse expenses to the extent necessary to maintain the Fund’s net annual operating expense ratio, excluding the expenses of any money market fund or other fund held by the Fund, at 0.60% for Class A shares and 1.55% for Class C shares shown. After this date, the net operating expense ratio may be increased only with approval of the Board of Trustees. |
(8) | Funds Management has committed through October 31, 2009, to waive fees and/or reimburse expenses to the extent necessary to maintain the Fund’s net annual operating expense ratio, excluding the expenses of any money market fund or other fund held by the Fund, at 0.60% for Class A shares and 1.35% for Class C shares shown. After this date, the net operating expense ratio may be increased only with approval of the Board of Trustees. |
(9) | Other expenses have been adjusted as necessary from amounts incurred during the Fund’s most recent fiscal year to reflect current fees and expenses. |
(10) | Class A shares that are purchased at NAV in amounts of $1,000,000 or more may be assessed a 0.50% contingent deferred sales charge if they are redeemed within eighteen months from the date of purchase. See “A Choice of Share Classes” for further information. |
A-13
Example
This example is intended to help you compare the cost of investing in the Funds with the cost of investing in other mutual funds. The maximum initial sales charge, if any, is reflected in this example. The example assumes that you invest $10,000 in the Fund, reinvest all distributions for the time periods indicated, and then either redeem or do not redeem all of your shares at the end of those periods. The example also assumes that your investment has a 5% return each year and that each Fund’s Total Annual Operating Expenses remain the same. The fee waivers in the Annual Operating Expenses are only reflected for the length of each waiver commitment in each of the following time periods. Although your actual costs may be higher or lower, based on these assumptions, your costs would be:
| | | | | | | | | |
| | | National Limited-Term
Tax-Free Fund | | Short-Term Municipal
Bond Fund | | Pro Forma-Short-Term
Municipal Bond Fund(1) |
| | | Class A | | Class A (new) | | Class A (new) |
One Year | | $ | 380 | | $ | 360 | | $ | 360 |
Three Years | | $ | 615 | | $ | 576 | | $ | 574 |
Five Years | | $ | 869 | | $ | 809 | | $ | 805 |
Ten Years | | $ | 1,595 | | $ | 1,479 | | $ | 1,468 |
| | | | | | | | | |
| | | National Limited-Term
Tax-Free Fund | | Short-Term Municipal
Bond Fund | | Pro Forma-Short-Term
Municipal Bond Fund(1) |
If you redeem your shares | | Class B | | Class A (new) | | Class A (new) |
One Year | | $ | 459 | | $ | 360 | | $ | 360 |
Three Years | | $ | 658 | | $ | 576 | | $ | 574 |
Five Years | | $ | 895 | | $ | 809 | | $ | 805 |
Ten Years | | $ | 1,616 | | $ | 1,479 | | $ | 1,468 |
| | | | | | | | | |
| | | National Limited-Term
Tax-Free Fund | | Short-Term Municipal
Bond Fund | | Pro Forma-Short-Term
Municipal Bond Fund(1) |
If you do not redeem your shares | | Class B | | Class A (new) | | Class A (new) |
One Year | | $ | 159 | | $ | 360 | | $ | 360 |
Three Years | | $ | 558 | | $ | 576 | | $ | 574 |
Five Years | | $ | 895 | | $ | 809 | | $ | 805 |
Ten Years | | $ | 1,616 | | $ | 1,479 | | $ | 1,468 |
| | | | | | | | | |
| | | National Limited-Term
Tax-Free Fund | | Short-Term Municipal
Bond Fund | | Pro Forma-Short-Term
Municipal Bond Fund(1) |
If you redeem your shares | | Class C | | Class C | | Class C |
One Year | | $ | 259 | | $ | 259 | | $ | 238 |
Three Years | | $ | 558 | | $ | 537 | | $ | 510 |
Five Years | | $ | 982 | | $ | 941 | | $ | 919 |
Ten Years | | $ | 2,165 | | $ | 2,070 | | $ | 2,047 |
| | | | | | | | | |
| | | National Limited-Term
Tax-Free Fund | | Short-Term Municipal
Bond Fund | | Pro Forma-Short-Term
Municipal Bond Fund(1) |
If you do not redeem your shares | | Class C | | Class C | | Class C |
One Year | | $ | 159 | | $ | 159 | | $ | 238 |
Three Years | | $ | 558 | | $ | 537 | | $ | 510 |
Five Years | | $ | 982 | | $ | 941 | | $ | 919 |
Ten Years | | $ | 2,165 | | $ | 2,070 | | $ | 2,047 |
A-14
| | | | | | | | | |
| | | National Limited-Term
Tax-Free Fund | | Short-Term Municipal
Bond Fund | | Pro Forma-Short-Term
Municipal Bond Fund(1) |
| | | Administrator Class | | Class A (new) | | Class A (new) |
One Year | | $ | 62 | | $ | 360 | | $ | 360 |
Three Years | | $ | 267 | | $ | 576 | | $ | 574 |
Five Years | | $ | 488 | | $ | 809 | | $ | 805 |
Ten Years | | $ | 1,124 | | $ | 1,479 | | $ | 1,468 |
(1) | Assuming Reorganization of the Class A, Class B, and Administrator Class shares of the National Limited-Term Tax-Free Fund into the Class A shares of the Short-Term Municipal Bond Fund, and the Class C shares of the National Limited-Term Tax-Free Fund into the Class C shares of the Short-Term Municipal Bond Fund. |
The example above should not be considered a representation of future expenses. Actual expenses may be greater or less than those shown.
F. National Tax-Free Fund/Municipal Bond Fund
The following comparative fee tables describe the Fund expenses you may pay, both directly and indirectly, if you hold shares of the Funds. The pro forma shareholder fees and operating expenses show the anticipated effects, if any, of the Reorganization. The Total Annual Operating Expenses tables and Examples shown below are based on actual expenses incurred during the Funds’ most recent twelve-month period ended June 30, 2007.
| | | | | | | | | |
| | | National Tax-
Free Fund | | | Municipal
Bond Fund | | | Pro Forma-
Municipal Bond
Fund(1) | |
| | | Class A | | | Class A | | | Class A | |
Shareholder Fees (fees paid directly from your investment): | | | | | | | | | |
Maximum sales charge (load) imposed on purchases (as a percentage of the offering price) | | 4.50 | % | | 4.50 | % | | 4.50 | % |
Maximum deferred sales charge (load) (as a percentage of the NAV at purchase) | | None | (8) | | None | (8) | | None | (8) |
Annual Fund Operating Expenses (expenses that are deducted from Fund assets) | | | | | | | | | |
Management Fees(2) | | 0.40 | % | | 0.40 | % | | 0.39 | % |
Distribution (12b-1) Fees | | 0.00 | % | | 0.00 | % | | 0.00 | % |
Other Expenses(3) | | 0.66 | % | | 0.67 | % | | 0.67 | % |
Acquired Fund Fees and Expenses(4) | | 0.01 | % | | 0.01 | % | | 0.01 | % |
Total Annual Fund Operating Expenses | | 1.07 | % | | 1.08 | % | | 1.07 | % |
Fee Waivers | | 0.21 | % | | 0.32 | % | | 0.31 | % |
Net Expenses(5) | | 0.86 | %(6) | | 0.76 | %(7) | | 0.76 | %(7) |
A-15
| | | | | | | | | |
| | | National Tax-
Free Fund | | | Municipal
Bond Fund | | | Pro Forma-
Municipal Bond
Fund(1) | |
| | | Class B | | | Class B | | | Class B | |
Shareholder Fees (fees paid directly from your investment): | | | | | | | | | |
Maximum sales charge (load) imposed on purchases (as a percentage of the offering price) | | None | | | None | | | None | |
Maximum deferred sales charge (load) (as a percentage of the NAV at purchase) | | 5.00 | % | | 5.00 | % | | 5.00 | % |
Annual Fund Operating Expenses (expenses that are deducted from Fund assets) | | | | | | | | | |
Management Fees(2) | | 0.40 | % | | 0.40 | % | | 0.39 | % |
Distribution (12b-1) Fees | | 0.75 | % | | 0.75 | % | | 0.75 | % |
Other Expenses(3) | | 0.66 | % | | 0.67 | % | | 0.67 | % |
Acquired Fund Fees and Expenses(4) | | 0.01 | % | | 0.01 | % | | 0.01 | % |
Total Annual Fund Operating Expenses | | 1.82 | % | | 1.83 | % | | 1.82 | % |
Fee Waivers | | 0.21 | % | | 0.32 | % | | 0.31 | % |
Net Expenses(5) | | 1.61 | %(6) | | 1.51 | %(7) | | 1.51 | %(7) |
| | | | | | | | | |
| | | National Tax-
Free Fund | | | Municipal
Bond Fund | | | Pro Forma-
Municipal Bond
Fund(1) | |
| | | Class C | | | Class C | | | Class C | |
Shareholder Fees (fees paid directly from your investment): | | | | | | | | | |
Maximum sales charge (load) imposed on purchases (as a percentage of the offering price) | | None | | | None | | | None | |
Maximum deferred sales charge (load) (as a percentage of the NAV at purchase) | | 1.00 | % | | 1.00 | % | | 1.00 | % |
Annual Fund Operating Expenses (expenses that are deducted from Fund assets) | | | | | | | | | |
Management Fees(2) | | 0.40 | % | | 0.40 | % | | 0.39 | % |
Distribution (12b-1) Fees | | 0.75 | % | | 0.75 | % | | 0.75 | % |
Other Expenses(3) | | 0.66 | % | | 0.67 | % | | 0.67 | % |
Acquired Fund Fees and Expenses(4) | | 0.01 | % | | 0.01 | % | | 0.01 | % |
Total Annual Fund Operating Expenses | | 1.82 | % | | 1.83 | % | | 1.82 | % |
Fee Waivers | | 0.21 | % | | 0.32 | % | | 0.31 | % |
Net Expenses(5) | | 1.61 | %(6) | | 1.51 | %(7) | | 1.51 | %(7) |
A-16
| | | | | | | | | |
| | | National Tax-
Free Fund | | | Municipal
Bond Fund | | | Pro Forma-
Municipal
Bond Fund(1) | |
| | | Administrator
Class | | | Administrator
Class | | | Administrator
Class | |
Shareholder Fees (fees paid directly from your investment): | | | | | | | | | |
Maximum sales charge (load) imposed on purchases (as a percentage of the offering price) | | None | | | None | | | None | |
Maximum deferred sales charge (load) (as a percentage of the NAV at purchase) | | None | | | None | | | None | |
Annual Fund Operating Expenses (expenses that are deducted from Fund assets) | | | | | | | | | |
Management Fees(2) | | 0.40 | % | | 0.40 | % | | 0.39 | % |
Distribution (12b-1) Fees | | 0.00 | % | | 0.00 | % | | 0.00 | % |
Other Expenses(3) | | 0.48 | % | | 0.49 | % | | 0.49 | % |
Acquired Fund Fees and Expenses(4) | | 0.01 | % | | 0.01 | % | | 0.01 | % |
Total Annual Fund Operating Expenses | | 0.89 | % | | 0.90 | % | | 0.89 | % |
Fee Waivers | | 0.28 | % | | 0.29 | % | | 0.28 | % |
Net Expenses(5) | | 0.61 | %(6) | | 0.61 | %(7) | | 0.61 | %(7) |
(1) | Assuming Reorganization of the Class A, Class B, Class C, and Administrator Class shares of the National Tax-Free Fund into the Class A, Class B, Class C, and Administrator Class shares, respectively, of the Municipal Bond Fund. |
(2) | Each Fund has a breakpoint schedule under which the management fee will decrease on Fund net assets above designated levels, as shown in the “Comparison of Investment Advisory Fees” section. |
(3) | Includes expenses payable to affiliates of Wells Fargo & Company. |
(4) | Reflects the pro-rata portion of the net operating expenses of any money market fund or other fund held by the Fund. Shareholders indirectly bear these underlying expenses because the NAV and/or distributions paid reflect such underlying expenses. |
(5) | The net operating expense ratio shown here includes the expenses of any money market fund or other fund held by the Fund. |
(6) | Funds Management has committed through October 31, 2008, to waive fees and/or reimburse expenses to the extent necessary to maintain the Fund’s net annual operating expense ratio, excluding the expenses of any money market fund or other fund held by the Fund, at 0.85% for Class A shares, 1.60% for Class B and Class C shares and 0.60% for Administrator Class shares. After this date, the net operating expense ratio may be increased only with approval of the Board of Trustees. |
(7) | Funds Management has committed through October 31, 2009, to waive fees and/or reimburse expenses to the extent necessary to maintain the Fund’s net annual operating expense ratio, excluding the expenses of any money market fund or other fund held by the Fund, at 0.75% for Class A shares, 1.50% for Class B and Class C shares, and 0.60% for Administrator Class shares. After this date, the net operating expense ratio may be increased only with approval of the Board of Trustees. |
(8) | Class A shares that are purchased at NAV in amounts of $1,000,000 or more may be assessed a 1.00% contingent deferred sales charge if they are redeemed within eighteen months from the date of purchase. See “A Choice of Share Classes” for further information. |
Example
This example is intended to help you compare the cost of investing in the Funds with the cost of investing in other mutual funds. The maximum initial sales charge, if any, is reflected in this example. The example assumes that you invest $10,000 in the Fund, reinvest all distributions for the time periods indicated, and then either redeem or do not redeem all of your shares at the end of those periods. The example also assumes that your investment has a 5% return each year and that each Fund’s Total Annual Operating Expenses remain the same.
A-17
The fee waivers in the Annual Operating Expenses are only reflected for the length of each waiver commitment in each of the following time periods. Although your actual costs may be higher or lower, based on these assumptions, your costs would be:
| | | | | | | | | |
| | | National Tax-Free Fund | | Municipal Bond Fund | | Pro Forma-Municipal
Bond Fund(1) |
| | | Class A | | Class A | | Class A |
One Year | | $ | 534 | | $ | 648 | | $ | 648 |
Three Years | | $ | 755 | | $ | 869 | | $ | 867 |
Five Years | | $ | 994 | | $ | 1,108 | | $ | 1,104 |
Ten Years | | $ | 1,679 | | $ | 1,793 | | $ | 1,782 |
| | | | | | | | | |
| | | National Tax-Free Fund | | Municipal Bond Fund | | Pro Forma-Municipal
Bond Fund(1) |
If you redeem your shares | | Class B | | Class B | | Class B |
One Year | | $ | 664 | | $ | 654 | | $ | 654 |
Three Years | | $ | 852 | | $ | 845 | | $ | 843 |
Five Years | | $ | 1,166 | | $ | 1,163 | | $ | 1,158 |
Ten Years | | $ | 1,830 | | $ | 1,837 | | $ | 1,831 |
| | | | | | | | | |
| | | National Tax-Free Fund | | Municipal Bond Fund | | Pro Forma-Municipal
Bond Fund(1) |
If you do not redeem your shares | | Class B | | Class B | | Class B |
One Year | | $ | 164 | | $ | 154 | | $ | 154 |
Three Years | | $ | 552 | | $ | 545 | | $ | 543 |
Five Years | | $ | 966 | | $ | 963 | | $ | 958 |
Ten Years | | $ | 1,830 | | $ | 1,837 | | $ | 1,831 |
| | | | | | | | | |
| | | National Tax-Free Fund | | Municipal Bond Fund | | Pro Forma-Municipal
Bond Fund(1) |
If you redeem your shares | | Class C | | Class C | | Class C |
One Year | | $ | 264 | | $ | 254 | | $ | 254 |
Three Years | | $ | 552 | | $ | 545 | | $ | 543 |
Five Years | | $ | 966 | | $ | 963 | | $ | 958 |
Ten Years | | $ | 2,120 | | $ | 2,128 | | $ | 2,117 |
| | | | | | | | | |
| | | National Tax-Free Fund | | Municipal Bond Fund | | Pro Forma-Municipal
Bond Fund(1) |
If you do not redeem your shares | | Class C | | Class C | | Class C |
One Year | | $ | 164 | | $ | 154 | | $ | 154 |
Three Years | | $ | 552 | | $ | 545 | | $ | 543 |
Five Years | | $ | 966 | | $ | 963 | | $ | 958 |
Ten Years | | $ | 2,210 | | $ | 2,128 | | $ | 2,117 |
| | | | | | | | | |
| | | National Tax-Free Fund | | Municipal Bond Fund | | Pro Forma-Municipal
Bond Fund(1) |
If you redeem your shares | | Administrator Class | | Administrator Class | | Administrator Class |
One Year | | $ | 62 | | $ | 62 | | $ | 62 |
Three Years | | $ | 256 | | $ | 258 | | $ | 256 |
Five Years | | $ | 466 | | $ | 471 | | $ | 467 |
Ten Years | | $ | 1,070 | | $ | 1,084 | | $ | 1,073 |
(1) | Assuming Reorganization of the Class A, Class B, Class C, and Administrator Class shares of the National Tax-Free Fund into the Class A, Class B, Class C, and Administrator Class shares, respectively, of the Municipal Bond Fund. |
A-18
The example above should not be considered a representation of future expenses. Actual expenses may be greater or less than those shown.
G. Overseas Fund/International Equity Fund
The following comparative fee tables describe the Fund expenses you may pay, both directly and indirectly, if you hold shares of the Funds. The pro forma shareholder fees and operating expenses show the anticipated effects, if any, of the Reorganization. The Total Annual Operating Expenses tables and Examples shown below are based on actual expenses incurred during the Funds’ most recent twelve-month period ended September 30, 2007.
| | | | | | | | | |
| | | Overseas Fund | | | International
Equity Fund | | | Pro Forma-
International
Equity Fund(1) | |
| | | Investor Class | | | Investor Class
(new) | | | Investor Class
(new) | |
Shareholder Fees (fees paid directly from your investment): | | | | | | | | | |
Maximum sales charge (load) imposed on purchases (as a percentage of the offering price) | | None | | | None | | | None | |
Maximum deferred sales charge (load) (as a percentage of the NAV at purchase) | | None | | | None | | | None | |
Redemption Fee(2) | | 2.00 | % | | 2.00 | % | | 2.00 | % |
Annual Fund Operating Expenses (expenses that are deducted from Fund assets) | | | | | | | | | |
Management Fees(3) | | 0.95 | % | | 0.93 | % | | 0.93 | % |
Distribution (12b-1) Fees | | 0.00 | % | | 0.00 | % | | 0.00 | % |
Other Expenses(4) | | 0.96 | % | | 0.89 | % | | 0.89 | % |
Total Annual Fund Operating Expenses | | 1.91 | % | | 1.82 | % | | 1.82 | % |
Fee Waivers | | 0.45 | % | | 0.36 | % | | 0.36 | % |
Net Expenses(5) | | 1.46 | % | | 1.46 | % | | 1.46 | % |
| | | | | | | | | |
| | | Overseas Fund | | | International
Equity Fund | | | Pro Forma-
International
Equity Fund(1) | |
| | | Institutional
Class | | | Institutional
Class | | | Institutional
Class | |
Shareholder Fees (fees paid directly from your investment): | | | | | | | | | |
Maximum sales charge (load) imposed on purchases (as a percentage of the offering price) | | None | | | None | | | None | |
Maximum deferred sales charge (load) (as a percentage of the NAV at purchase) | | None | | | None | | | None | |
Redemption Fee(2) | | 2.00 | % | | 2.00 | % | | 2.00 | % |
Annual Fund Operating Expenses (expenses that are deducted from Fund assets) | | | | | | | | | |
Management Fees(3) | | 0.95 | % | | 0.93 | % | | 0.93 | % |
Distribution (12b-1) Fees | | 0.00 | % | | 0.00 | % | | 0.00 | % |
Other Expenses(4) | | 0.39 | % | | 0.32 | % | | 0.32 | % |
Total Annual Fund Operating Expenses | | 1.34 | % | | 1.25 | % | | 1.25 | % |
Fee Waivers | | 0.39 | % | | 0.20 | % | | 0.26 | % |
Net Expenses(5) | | 0.95 | % | | 1.05 | % | | 0.99 | % |
(1) | Assuming Reorganization of the Investor Class and Institutional Class shares of the Overseas Fund into the Investor Class and Institutional shares, respectively, of the International Equity Fund. |
(2) | Deducted from the net proceeds if shares redeemed (or exchanged) within 30 days of purchase. This fee is retained by the Fund. |
A-19
(3) | Each Fund has a breakpoint schedule under which the management fee will decrease on Fund net assets above designated levels, as shown in the “Comparison of Investment Advisory Fees” section. |
(4) | Includes expenses payable to affiliates of Wells Fargo & Company and may include expenses of any money market or other fund held by the Fund. |
(5) | Funds Management has committed through January 31, 2009, to waive fees and/or reimburse expenses to the extent necessary to maintain the Fund’s net annual operating expense ratio shown. After this date, the net operating expense ratio may be increased only with approval of the Board of Trustees. |
Example
This example is intended to help you compare the cost of investing in the Funds with the cost of investing in other mutual funds. The maximum initial sales charge, if any, is reflected in this example. The example assumes that you invest $10,000 in the Fund, reinvest all distributions for the time periods indicated, and then either redeem or do not redeem all of your shares at the end of those periods. The example also assumes that your investment has a 5% return each year and that each Fund’s Total Annual Operating Expenses remain the same. The fee waivers in the Annual Operating Expenses are only reflected for the length of each waiver commitment in each of the following time periods. Although your actual costs may be higher or lower, based on these assumptions, your costs would be:
| | | | | | | | | |
| | | Overseas Fund | | International Equity Fund | | Pro Forma-International
Equity Fund(1) |
| | | Investor Class | | Investor Class (new) | | Investor Class (new) |
One Year | | $ | 149 | | $ | 149 | | $ | 149 |
Three Years | | $ | 556 | | $ | 538 | | $ | 538 |
Five Years | | $ | 990 | | $ | 952 | | $ | 952 |
Ten Years | | $ | 2,196 | | $ | 2,108 | | $ | 2,108 |
| | | | | | | | | |
| | | Overseas Fund | | International Equity Fund | | Pro Forma-International
Equity Fund(1) |
| | | Institutional Class | | Institutional Class | | Institutional Class |
One Year | | $ | 97 | | $ | 107 | | $ | 101 |
Three Years | | $ | 386 | | $ | 377 | | $ | 371 |
Five Years | | $ | 697 | | $ | 667 | | $ | 661 |
Ten Years | | $ | 1,579 | | $ | 1,494 | | $ | 1,488 |
(1) | Assuming Reorganization of the Investor Class and Institutional Class shares of the Overseas Fund into the Investor Class and Institutional shares, respectively, of the International Equity Fund. |
The example above should not be considered a representation of future expenses. Actual expenses may be greater or less than those shown.
H. Value Fund/C&B Large Cap Value Fund
The following comparative fee tables describe the Fund expenses you may pay, both directly and indirectly, if you hold shares of the Funds. The pro forma shareholder fees and operating expenses show the anticipated effects, if any, of the Reorganization. The Total Annual Operating Expenses tables and Examples shown below are based on actual expenses incurred during the Value Fund’s most recent twelve-month period ended July 31, 2007 and the C&B Large Cap Value Fund’s most recent twelve month period ended September 30, 2007.
A-20
| | | | | | | | | |
| | | Value Fund | | | C&B Large
Cap Value
Fund | | | Pro Forma-
C&B Large Cap
Value Fund(1) | |
| | | Class A | | | Class A | | | Class A | |
Shareholder Fees (fees paid directly from your investment): | | | | | | | | | |
Maximum sales charge (load) imposed on purchases (as a percentage of the offering price) | | 5.75 | % | | 5.75 | % | | 5.75 | % |
Maximum deferred sales charge (load) (as a percentage of the NAV at purchase) | | None | (10) | | None | (10) | | None | (10) |
Redemption Fee(2) | | 1.00 | % | | None | | | None | |
Annual Fund Operating Expenses (expenses that are deducted from Fund assets) | | | | | | | | | |
Management Fees(3) | | 0.70 | % | | 0.67 | % | | 0.67 | % |
Distribution (12b-1) Fees | | 0.00 | % | | 0.00 | % | | 0.00 | % |
Other Expenses(4) | | 1.00 | % | | 0.64 | % | | 0.64 | % |
Acquired Fund Fees and Expenses(5) | | 0.01 | % | | 0.00 | % | | 0.00 | % |
Total Annual Fund Operating Expenses | | 1.71 | % | | 1.31 | %(6) | | 1.31 | %(6) |
Fee Waivers | | 0.50 | % | | 0.11 | % | | 0.16 | % |
Net Expenses | | 1.21 | %(7)(8) | | 1.20 | %(9) | | 1.15 | %(9) |
| | | | | | | | | |
| | | Value Fund | | | C&B Large
Cap Value
Fund | | | Pro Forma-
C&B Large Cap
Value Fund(1) | |
| | | Class B | | | Class B | | | Class B | |
Shareholder Fees (fees paid directly from your investment): | | | | | | | | | |
Maximum sales charge (load) imposed on purchases (as a percentage of the offering price) | | None | | | None | | | None | |
Maximum deferred sales charge (load) (as a percentage of the NAV at purchase) | | 5.00 | % | | 5.00 | % | | 5.00 | % |
Redemption Fee(2) | | 1.00 | % | | None | | | None | |
Annual Fund Operating Expenses (expenses that are deducted from Fund assets) | | | | | | | | | |
Management Fees(3) | | 0.70 | % | | 0.67 | % | | 0.68 | % |
Distribution (12b-1) Fees | | 0.75 | % | | 0.75 | % | | 0.75 | % |
Other Expenses(4) | | 1.01 | % | | 0.64 | % | | 0.64 | % |
Acquired Fund Fees and Expenses(5) | | 0.01 | % | | 0.00 | % | | 0.00 | % |
Total Annual Fund Operating Expenses | | 2.47 | % | | 2.06 | %(6) | | 2.06 | %(6) |
Fee Waivers | | 0.51 | % | | 0.11 | % | | 0.16 | % |
Net Expenses | | 1.96 | %(7)(8) | | 1.95 | %(9) | | 1.90 | %(9) |
A-21
| | | | | | | | | |
| | | Value Fund | | | C&B Large
Cap Value
Fund | | | Pro Forma-
C&B Large Cap
Value Fund(1) | |
| | | Class C | | | Class C | | | Class C | |
Shareholder Fees (fees paid directly from your investment): | | | | | | | | | |
Maximum sales charge (load) imposed on purchases (as a percentage of the offering price) | | None | | | None | | | None | |
Maximum deferred sales charge (load) (as a percentage of the NAV at purchase) | | 1.00 | % | | 1.00 | % | | 1.00 | % |
Redemption Fee(2) | | 1.00 | % | | None | | | None | |
Annual Fund Operating Expenses (expenses that are deducted from Fund assets) | | | | | | | | | |
Management Fees(3) | | 0.70 | % | | 0.67 | % | | 0.67 | % |
Distribution (12b-1) Fees | | 0.75 | % | | 0.75 | % | | 0.75 | % |
Other Expenses(4) | | 1.01 | % | | 0.64 | % | | 0.64 | % |
Acquired Fund Fees and Expenses(5) | | 0.01 | % | | 0.00 | % | | 0.00 | % |
Total Annual Fund Operating Expenses | | 2.47 | % | | 2.06 | %(6) | | 2.06 | %(6) |
Fee Waivers | | 0.51 | % | | 0.11 | % | | 0.16 | % |
Net Expenses | | 1.96 | %(7)(8) | | 1.95 | %(9) | | 1.90 | %(9) |
| | | | | | | | | |
| | | Value Fund | | | C&B Large
Cap Value
Fund | | | Pro Forma-
C&B Large Cap
Value Fund(1) | |
| | | Investor Class | | | Investor Class
(formerly
Class D) | | | Investor Class
(formerly
Class D) | |
Shareholder Fees (fees paid directly from your investment): | | | | | | | | | |
Maximum sales charge (load) imposed on purchases (as a percentage of the offering price) | | None | | | None | | | None | |
Maximum deferred sales charge (load) (as a percentage of the NAV at purchase) | | None | | | None | | | None | |
Redemption Fee(2) | | 1.00 | % | | None | | | None | |
Annual Fund Operating Expenses (expenses that are deducted from Fund assets) | | | | | | | | | |
Management Fees(3) | | 0.70 | % | | 0.67 | % | | 0.67 | % |
Distribution (12b-1) Fees | | 0.00 | % | | 0.00 | % | | 0.00 | % |
Other Expenses(4) | | 1.16 | % | | 0.76 | % | | 0.76 | % |
Acquired Fund Fees and Expenses(5) | | 0.01 | % | | 0.00 | % | | 0.00 | % |
Total Annual Fund Operating Expenses | | 1.87 | % | | 1.43 | %(6) | | 1.43 | %(6) |
Fee Waivers | | 0.66 | % | | 0.23 | % | | 0.23 | % |
Net Expenses | | 1.21 | %(7)(8) | | 1.20 | %(9) | | 1.20 | %(9) |
A-22
| | | | | | | | | |
| | | Value Fund | | | C&B Large
Cap Value
Fund | | | Pro Forma-
C&B Large Cap
Value Fund(1) | |
| | | Administrator
Class | | | Administrator
Class | | | Administrator
Class | |
Shareholder Fees (fees paid directly from your investment): | | | | | | | | | |
Maximum sales charge (load) imposed on purchases (as a percentage of the offering price) | | None | | | None | | | None | |
Maximum deferred sales charge (load) (as a percentage of the NAV at purchase) | | None | | | None | | | None | |
Redemption Fee(2) | | 1.00 | % | | None | | | None | |
Annual Fund Operating Expenses (expenses that are deducted from Fund assets) | | | | | | | | | |
Management Fees(3) | | 0.70 | % | | 0.67 | % | | 0.67 | % |
Distribution (12b-1) Fees | | 0.00 | % | | 0.00 | % | | 0.00 | % |
Other Expenses(4) | | 0.81 | % | | 0.46 | % | | 0.46 | % |
Acquired Fund Fees and Expenses(5) | | 0.01 | % | | 0.00 | % | | 0.00 | % |
Total Annual Fund Operating Expenses | | 1.52 | % | | 1.13 | %(6) | | 1.13 | %(6) |
Fee Waivers | | 0.56 | % | | 0.18 | % | | 0.18 | % |
Net Expenses | | 0.96 | %(7)(8) | | 0.95 | %(9) | | 0.95 | %(9) |
(1) | Assuming Reorganization of the Class A, Class B, Class C, Investor Class, and Administrator Class shares of the Value Fund into the Class A, Class B, Class C, Investor Class and Administrator Class shares, respectively, of the C&B Large Cap Value Fund. |
(2) | Deducted from the net proceeds if shares redeemed (or exchanged) within 365 days of purchase. This fee is retained by the Fund. |
(3) | Each Fund has a breakpoint schedule under which the management fee will decrease on Fund net assets above designated levels, as shown in the “Comparison of Investment Advisory Fees” section. |
(4) | Includes expenses payable to affiliates of Wells Fargo & Company. |
(5) | Reflects the pro-rata portion of the net operating expenses of any money market fund or other fund held by the Fund. Shareholders indirectly bear these underlying expenses because the NAV and/or distributions paid reflect such underlying expenses. |
(6) | Includes gross expenses allocated from the master portfolio in which the Fund invests. |
(7) | The net operating expense ratio shown here includes the expenses of any money market fund or other fund held by the Fund. |
(8) | Funds Management has committed through November 30, 2008 to waive fees and/or reimburse expenses to the extent necessary to maintain the Fund’s net annual operating expense ratio, excluding the expenses of any money market fund or other fund held by the Fund, at 1.20% for Class A shares, 1.95% for Class B and Class C shares, 1.20% for Investor Class shares and 0.95% for Administrator Class shares. After this date, the net operating expense ratio may be increased only with approval of the Board of Trustees. |
(9) | Funds Management has committed through January 31, 2009, to waive fees and/or reimburse expenses to the extent necessary to maintain the Fund’s net annual operating expense ratio shown. After this date, the net operating expense ratio may be increased only with approval of the Board of Trustees. |
(10) | Class A shares that are purchased at NAV in amounts of $1,000,000 or more may be assessed a 1.00% contingent deferred sales charge if they are redeemed within eighteen months from the date of purchase. See “A Choice of Share Classes” for further information. |
Example
This example is intended to help you compare the cost of investing in the Funds with the cost of investing in other mutual funds. The maximum initial sales charge, if any, is reflected in this example. The example assumes that you invest $10,000 in the Fund, reinvest all distributions for the time periods indicated, and then either
A-23
redeem or do not redeem all of your shares at the end of those periods. The example also assumes that your investment has a 5% return each year and that each Fund’s Total Annual Operating Expenses remain the same. The fee waivers in the Annual Operating Expenses are only reflected for the length of each waiver commitment in each of the following time periods. Although your actual costs may be higher or lower, based on these assumptions, your costs would be:
| | | | | | | | | |
| | | Value Fund | | C&B Large Cap Value
Fund | | Pro Forma-C&B Large
Cap Value Fund(1) |
| | | Class A | | Class A | | Class A |
One Year | | $ | 691 | | $ | 690 | | $ | 685 |
Three Years | | $ | 1,037 | | $ | 956 | | $ | 951 |
Five Years | | $ | 1,406 | | $ | 1,242 | | $ | 1,237 |
Ten Years | | $ | 2,439 | | $ | 2,054 | | $ | 2,050 |
| | | | | | | | | |
| | | Value Fund | | C&B Large Cap Value
Fund | | Pro Forma-C&B Large
Cap Value Fund(1) |
If you redeem your shares | | Class B | | Class B | | Class B |
One Year | | $ | 699 | | $ | 698 | | $ | 693 |
Three Years | | $ | 1,021 | | $ | 935 | | $ | 930 |
Five Years | | $ | 1,470 | | $ | 1,298 | | $ | 1,294 |
Ten Years | | $ | 2,488 | | $ | 2,098 | | $ | 2,094 |
| | | | | | | | | |
| | | Value Fund | | C&B Large Cap Value
Fund | | Pro Forma-C&B Large
Cap Value Fund(1) |
If you do not redeem your shares | | Class B | | Class B | | Class B |
One Year | | $ | 199 | | $ | 198 | | $ | 193 |
Three Years | | $ | 721 | | $ | 635 | | $ | 630 |
Five Years | | $ | 1,270 | | $ | 1,098 | | $ | 1,094 |
Ten Years | | $ | 2,488 | | $ | 2,098 | | $ | 2,094 |
| | | | | | | | | |
| | | Value Fund | | C&B Large Cap Value
Fund | | Pro Forma-C&B Large
Cap Value Fund(1) |
If you redeem your shares | | Class C | | Class C | | Class C |
One Year | | $ | 299 | | $ | 298 | | $ | 293 |
Three Years | | $ | 721 | | $ | 635 | | $ | 633 |
Five Years | | $ | 1,270 | | $ | 1,098 | | $ | 1,099 |
Ten Years | | $ | 2,768 | | $ | 2,381 | | $ | 2,390 |
| | | | | | | | | |
| | | Value Fund | | C&B Large Cap Value
Fund | | Pro Forma-C&B Large
Cap Value Fund(1) |
If you do not redeem your shares | | Class C | | Class C | | Class C |
One Year | | $ | 199 | | $ | 198 | | $ | 193 |
Three Years | | $ | 721 | | $ | 635 | | $ | 630 |
Five Years | | $ | 1,270 | | $ | 1,098 | | $ | 1,094 |
Ten Years | | $ | 2,768 | | $ | 2,381 | | $ | 2,377 |
| | | | | | | | | |
| | | Value Fund | | C&B Large Cap Value
Fund | | Pro Forma-C&B Large
Cap Value Fund(1) |
| | | Investor Class | | Investor Class (formerly
Class D) | | Investor Class (formerly
Class D) |
One Year | | $ | 123 | | $ | 122 | | $ | 122 |
Three Years | | $ | 524 | | $ | 430 | | $ | 430 |
Five Years | | $ | 950 | | $ | 760 | | $ | 760 |
Ten Years | | $ | 2,137 | | $ | 1693 | | $ | 1,693 |
A-24
| | | | | | | | | |
| | | Value Fund | | C&B Large Cap Value
Fund | | Pro Forma-C&B Large
Cap Value Fund(1) |
| | | Administrator Class | | Administrator Class | | Administrator Class |
One Year | | $ | 98 | | $ | 97 | | $ | 97 |
Three Years | | $ | 425 | | $ | 341 | | $ | 341 |
Five Years | | $ | 776 | | $ | 605 | | $ | 605 |
Ten Years | | $ | 1,765 | | $ | 1,359 | | $ | 1,359 |
(11) | Assuming Reorganization of the Class A, Class B, Class C, Investor Class, and Administrator Class shares of the Value Fund into the Class A, Class B, Class C, Investor Class and Administrator Class shares, respectively, of the C&B Large Cap Value Fund. |
A-25
EXHIBIT B — COMPARISON OF INVESTMENT OBJECTIVES, PRINCIPAL INVESTMENTS
AND PRINCIPAL INVESTMENT STRATEGIES, SUB-ADVISERS AND PORTFOLIO MANAGERS OF
THE TARGET FUNDS AND ACQUIRING FUNDS
| | | | | | | | |
| | | BALANCED (TARGET FUND) | | ASSET ALLOCATION (ACQUIRINGFUND) |
| Investment Objective | | Seeks total return, consisting of capital appreciation and current income. | | Seeks long-term total return, consisting of capital appreciation and current income. |
| | |
| Principal Investments | | Under normal circumstances, the Fund invests: - 60% of the Fund’s total assets in equity securities; - 40% of the Fund’s total assets in fixed income securities; and - up to 10% of the Fund’s total assets in below investment-grade fixed income securities. | | The Fund’s “neutral” target allocation is as follows: - 60% of the Fund’s total assets in equity securities; and - 40% of the Fund’s total assets in fixed income securities. Target Allocations |
| | | | | | Neutral Target Allocation | | Target Allocation Ranges |
| | | | Equity Styles | | 60% | | 35–85% |
| | | | Fixed Income Styles | | 40% | | 15–65% |
| | | | |
| | |
| Principal Investment Strategies | | The Fund seeks to achieve its investment objective by investing in both equity and fixed income securities. The Fund primarily invests the equity portion of the its portfolio in securities, including common and preferred stocks and convertible securities, of large-capitalization, dividend-paying, U.S. companies that offer the potential for capital growth, and attempt to balance an investment’s prospects for growth and income with its potential risks. The Fund primarily invests the fixed income portion of its portfolio in investment-grade bonds of intermediate duration, including U.S. Government obligations, corporate securities and mortgage-backed securities. For the equity portion, the Fund invests principally in equity securities of large-capitalization companies that it defines as companies with market capitalizations of $3 billion or more. The Fund focuses on identifying companies that it believes have exceptional valuations, above-market earnings growth, as well as consistency of dividend income and dividend growth. The Fund’s screening process to identify such premier companies involves a search by market capitalization, dividend income, and stability of earnings to refine its selection universe. Additionally, the Fund screens for valuation by utilizing a comparative valuation tool that | | The asset classes we invest in are: Equity Securities—The Fund invests a portion of its assets in common stocks to replicate the S&P 500 Index. The Fund does not individually select common stocks on the basis of traditional investment analysis. Instead, it invests in each company comprising the S&P 500 Index in proportion to its weighting in the S&P 500 Index; and Fixed Income Securities—The Fund invests a portion of its assets in U.S. Treasury Bonds to replicate the Lehman Brothers 20+ Treasury Index. Bonds in this index have remaining maturities of twenty years or more. The Fund invests in equity and fixed income securities with an emphasis on equity securities. The Fund does not select individual securities for investment, rather, it buys substantially all of the securities of various indexes to replicate such indexes. The Fund invests the equity portion of its assets in common stocks to replicate the S&P 500 Index, and invests the fixed income portion of its assets in U.S. Treasury Bonds to replicate the Lehman Brothers 20+ Treasury Index. The Fund seeks to maintain a 95% or better performance correlation with the respective indexes, before fees and expenses, regardless of market conditions. |
B-1
| | | | |
| | | BALANCED (TARGET FUND) | | ASSET ALLOCATION (ACQUIRINGFUND) |
| | ranks a company’s stock against a universe of other companies. This process helps the Fund identify undervalued stocks and allows the Fund to focus its fundamental research on stocks that appear to offer exceptional investment opportunities. The Fund’s fundamental research includes in-depth financial statement analysis that includes looking at a company’s operating characteristics such as earnings and cash flow prospects, profit margin trends, and consistency of revenue growth. Other standard valuation measures are applied to this select group of stocks, such as price to earnings, price to book, price to sales and price to cash flow ratios, both on an absolute and on a relative basis. The Fund believes that its focus on valuation, capitalization size, consistency, and dividend yield all combine to produce a diversified portfolio of high quality stocks. Because few companies meet the Fund’s select screening criteria, it generally follows a low turnover approach and will only sell a stock if it no longer fits its criteria of a premier company. For the fixed income portion, the Fund employs a top-down, macroeconomic outlook to determine the portfolio’s duration, yield curve positioning and sector allocation. Macroeconomic factors considered may include, among others, the pace of economic growth, employment conditions, inflation, monetary and fiscal policy, as well as the influence of international economic and financial conditions. In combination with our top-down, macroeconomic approach, the Fund employs a bottom-up process of fundamental securities analysis to select specific securities for investment. Elements of this evaluation may include duration measurements, historical yield spread relationships, volatility trends, mortgage refinance rates, as well as other factors. The Fund may sell a security due to changes in its outlook, as well as changes in portfolio strategy or cash flow needs. A security may also be sold and replaced with one that presents a better value or risk/reward profile. The Fund may use futures, options or swap agreements, as well as other derivatives, to manage risk or to enhance return. | | The Fund attempts to enhance its returns by using an asset allocation model that employs various analytical techniques, including quantitative techniques, valuation formulas and optimization procedures, to assess the relative attractiveness of equity and fixed income investments and to recommend changes in its target allocations. The Fund does not anticipate making a substantial number of target allocation changes. The Fund uses futures contracts to implement target allocation changes determined by the model, rather than physically reallocating assets among investment styles. The Fund may also use futures, options or swap agreements, as well as other derivatives, to manage risk or to enhance return. The percentage of Fund assets that it invests in different asset classes may temporarily deviate from the Fund’s target allocations due to changes in market values. The Fund may use cash flows or effect transactions to re-establish the target allocations. |
B-2
| | | | |
| | | BALANCED (TARGET FUND) | | ASSET ALLOCATION (ACQUIRINGFUND) |
| | The percentage of Fund assets invested in equity securities or fixed-income securities may temporarily deviate from the percentages indicated above due to changes in market values. The Fund uses the daily cash flows to maintain the target asset allocations, and will rebalance when its assets deviate by a significant percentage from the target asset allocations. | | |
| | |
| Sub-Adviser | | Wells Capital Management Incorporated | | Wells Capital Management Incorporated |
| | |
| Portfolio Managers | | Gary J. Dunn, CFA W. Frank Koster Robert M. Thornburg | | Galen G. Blomster, CFA Gregory T. Genung, CFA Jeffrey P. Mellas |
| | |
| | | CORPORATE BOND (TARGET FUND) | | INCOME PLUS (ACQUIRINGFUND) |
| Investment Objective | | Seeks current income while maintaining prospects for capital appreciation. | | Seeks to maximize income while maintaining prospects for capital appreciation. |
| | |
| Principal Investments | | Under normal circumstances, the Fund invests: - at least 80% of the Fund’s net assets in corporate debt securities; - up to 35% of the Fund’s total assets in U.S. dollar-denominated debt securities of foreign issuers; and - up to 25% of the Fund’s total assets in below investment-grade debt securities. | | Under normal circumstances the Fund invests: - at least 80% of the Fund’s net assets in income-producing securities; - up to 35% of the Fund’s total assets in debt securities that are below investment-grade; and - up to 25% of the Fund’s total assets in debt securities of foreign issuers. |
| | |
| Principal Investment Strategies | | We invest principally in corporate debt securities. We may invest in investment-grade and below investment-grade debt securities (often called “high-yield” securities or “junk bonds”), as well as in debt securities of both domestic and foreign issuers. As part of our below investment-grade debt securities investment strategy, we will generally invest in securities that are rated BB through C by Standard & Poor’s, or an equivalent quality rating from another Nationally Recognized Statistical Ratings Organization, or are deemed by us to be of comparable quality. We may use futures, options or swap agreements, as well as other derivatives, to manage risk or to enhance return. Additionally, we may invest in stripped securities. We begin our investment process with a top-down, macroeconomic view to guide our decision-making. Our macroeconomic view is used to determine the portfolio’s duration, yield curve positioning and industry allocation. We then employ credit analysis to determine which securities to purchase. This analysis includes an assessment of macroeconomic | | We invest principally in debt securities, including corporate, mortgage- and asset-backed securities, bank loans and U.S. Government obligations. These securities may have fixed, floating or variable rates and may include debt securities of both domestic and foreign issuers. We invest in both investment-grade and below investment-grade debt securities. Below investment-grade debt securities (often called “high yield” securities or “junk bonds”) offer the potential for higher returns, as they generally carry a higher yield to compensate for the higher risk associated with their investment. As part of our below investment-grade debt securities investment strategy, we will generally invest in securities that are rated at least Caa by Moody’s or CCC by Standard & Poor’s, or an equivalent quality rating from another Nationally Recognized Statistical Ratings Organization, or are deemed by us to be of comparable quality. We expect to maintain an average credit quality for this portion of the Fund’s portfolio equivalent to B or higher. We may also use futures, options or swap agreements, as well as other derivatives, to manage risk or to enhance return. |
B-3
| | | | |
| | | CORPORATE BOND (TARGET FUND) | | INCOME PLUS (ACQUIRINGFUND) |
| | trends, industry characteristics and corporate earnings. Our credit analysis also considers an issuer’s general financial condition, its competitive position and its management strategies. We may sell a security due to changes in credit characteristics or outlook, as well as changes in portfolio strategy or cash flow needs. A security may also be sold and replaced with one that presents a better value or risk/reward profile. We may actively trade portfolio securities. | | We start our investment process with a top-down, macroeconomic outlook to determine portfolio duration and yield curve positioning as well as industry, sector and credit quality allocations. Macroeconomic factors considered may include, among others, the pace of economic growth, employment conditions, corporate profits, inflation, monetary and fiscal policy, as well as the influence of international economic and financial conditions. Within these parameters, we then apply rigorous credit research to select individual securities that we believe can add value from income and/or the potential for capital appreciation. Our credit research may include an assessment of an issuer’s general financial condition, its competitive positioning and management strength, as well as industry characteristics and other factors. We may sell a security due to changes in credit characteristics or outlook, as well as changes in portfolio strategy or cash flow needs. A security may also be sold and replaced with one that presents a better value or risk/reward profile. We may actively trade portfolio securities. |
| | |
| Sub-Adviser | | Wells Capital Management Incorporated | | Wells Capital Management Incorporated |
| | |
| Portfolio Managers | | D. James Newton II, CFA, CPA Janet S. Rilling, CFA, CPA | | W. Frank Koster Thomas M. Price, CFA Note: In the future, Funds Management intends to add the current portfolio managers of the Target Fund and Michael J. Bray, CFA, to the Acquiring Fund. |
| | |
| | | HIGH YIELD BOND (TARGET FUND) | | HIGH INCOME (ACQUIRINGFUND) |
Investment Objective | | Seeks total return, consisting of a high level of current income and capital appreciation. | | Seeks total return, consisting of a high level of current income and capital appreciation. |
| | |
Principal Investments | | Under normal circumstances, the Fund invests: - at least 80% of the Fund’s net assets in corporate debt securities that are below investment-grade; and - up to 20% of the Fund’s net assets in preferred and convertible securities. | | Under normal circumstances the Fund invests: - at least 80% of the Fund’s net assets in corporate debt securities that are below investment-grade; - up to 30% of the Fund’s total assets in U.S. dollar-denominated debt securities of foreign issuers; - up to 20% of the Fund’s total assets in equities and convertible debt securities; and - up to 10% of the Fund’s total assets in debt securities that are in default at the time of purchase. |
B-4
| | | | |
| | | HIGH YIELD BOND (TARGET FUND) | | HIGH INCOME (ACQUIRINGFUND) |
Principal Investment Strategies | | We invest principally in below investment-grade debt securities (often called “high yield” securities or “junk bonds”) of corporate issuers. These include traditional corporate bonds as well as bank loans. These securities may have fixed, floating or variable rates. We will generally invest in below investment-grade debt securities that are rated at least Caa by Moody’s or CCC by Standard & Poor’s, or an equivalent quality rating from another Nationally Recognized Statistical Ratings Organization, or are deemed by us to be of comparable quality. The average credit quality of the Fund’s portfolio is expected to be equivalent to B or higher. We may also use futures, options or swap agreements, as well as other derivatives, to manage risk or to enhance return. We do not manage the Fund’s portfolio to a specific maturity or duration. We focus on individual security selection (primarily using a bottom-up approach) and seek to identify high yield securities that appear comparatively undervalued. We use our knowledge of various industries to assess the risk/return tradeoff among issuers within particular industries, seeking to identify compelling relative value investments. We analyze the issuers’ long-term prospects and focus on characteristics such as management, asset coverage, free cash flow generation, liquidity and business risk. Our research and analysis highlights industry drivers, competitive position and operating trends with an emphasis on cash flow. We also talk to management, and consult industry contacts, debt and equity analysts, and rating agencies. We purchase securities when attractive risk/reward ideas are identified and sell securities when either the securities become overvalued or circumstances change in a way that adversely affects this risk/return profile. | | We invest principally in below investment-grade debt securities (often called “high-yield” securities or “junk bonds”) of corporate issuers. These include traditional corporate bonds as well as bank loans. These securities may have fixed, floating or variable rates. As part of our below investment-grade debt securities investment strategy, we will generally invest in securities that are rated BB through CCC by S&P, or an equivalent quality rating from another Nationally Recognized Statistical Ratings Organization, or are deemed by us to be of comparable quality. Below investment-grade debt securities offer the potential for higher returns, as they generally carry a higher yield to compensate for the higher risk associated with their investment. We may also use futures, options or swap agreements, as well as other derivatives, to manage risk or to enhance return. Additionally, we may invest in stripped securities. We start our investment process with a top-down, macroeconomic outlook to determine industry and credit quality allocations. Macroeconomic factors considered may include, among others, the pace of economic growth, employment conditions, corporate profits, inflation, monetary and fiscal policy, as well as the influence of international economic and financial conditions. Within these parameters, we then apply rigorous credit research to select individual securities that we believe can add value from income and/or the potential for capital appreciation. Our credit research may include an assessment of an issuer’s general financial condition, its competitive positioning and management strength, as well as industry characteristics and other factors. We may sell a security due to changes in credit characteristics or outlook, as well as changes in portfolio strategy or cash flow needs. A security may also be sold and replaced with one that presents a better value or risk/reward profile. |
| | |
| Sub-Adviser | | Wells Capital Management Incorporated | | Wells Capital Management Incorporated |
| | |
Portfolio Managers | | Niklas Nordenfelt, CFA Phil Susser | | Kevin J. Maas, CFA Thomas M. Price, CFA Michael J. Schueller, CFA |
B-5
| | | | |
| | | INTERMEDIATE GOVERNMENT INCOME (TARGET FUND) | | GOVERNMENT SECURITIES (ACQUIRING FUND) |
| Investment Objective | | Seeks to provide current income consistent with safety of principal. | | Seeks current income. |
| | |
| Principal Investments | | Under normal circumstances, the Fund invests: - at least 80% of the Fund’s net assets in U.S. Government obligations, including repurchase agreements collateralized by U.S. Government obligations; and - up to 20% of the Fund’s net assets in non-government mortgage- and asset-backed securities. | | Under normal circumstances the Fund invests: - at least 80% of the Fund’s net assets in U.S. Government obligations and repurchase agreements collateralized by U.S. Government obligations; and - up to 20% of the Fund’s net assets in non-government investment-grade debt securities. |
| | |
| Principal Investment Strategies | | We invest principally in fixed and variable rate U.S. Government obligations, including debt securities issued or guaranteed by the U.S. Treasury, U.S. Government agencies or government-sponsored entities. We will purchase only securities that are rated, at the time of purchase, within the two highest rating categories assigned by a Nationally Recognized Statistical Ratings Organization, or are deemed by us to be of comparable quality. As part of our investment strategy, we may invest in stripped securities or enter into mortgage dollar rolls or reverse repurchase agreements. We may also use futures, options or swap agreements, as well as other derivatives, to manage risk or to enhance return. Under normal circumstances, we expect the Fund’s dollar-weighted average effective duration will be within the range of 3- and 5-year U.S. Treasury notes. As a result, the dollar-weighted average effective maturity of the Fund generally ranges from 3 to 10 years. We invest in debt securities that we believe offer competitive returns and are undervalued, offering additional income and/or price appreciation potential, relative to other debt securities of similar credit quality and interest rate sensitivity. As part of our investment strategy, we invest in mortgage-backed securities guaranteed by U.S. Government agencies, and to a lesser extent, other securities rated AAA or Aaa, that we believe will sufficiently outperform U.S. Treasuries. We may sell a security that has achieved its desired return or if we believe the security or its sector has become overvalued. We may also sell a security if a more attractive opportunity becomes available or if the security is no longer attractive due to its risk profile or as a result of changes in the overall market environment. We may actively trade portfolio securities. | | We invest principally in U.S. Government obligations, including debt securities issued or guaranteed by the U.S. Treasury, U.S. Government agencies or government-sponsored entities. These securities may have fixed, floating or variable rates and also include mortgage-backed securities. As part of our mortgage-backed securities investment strategy, we may enter into dollar rolls or invest in stripped securities. We may also use futures, options or swap agreements, as well as other derivatives, to manage risk or to enhance return. We employ a top-down, macroeconomic outlook to determine the portfolio’s duration, yield curve positioning and sector allocation. Macroeconomic factors considered may include, among others, the pace of economic growth, employment conditions, inflation, monetary and fiscal policy, as well as the influence of international economic and financial conditions. In combination with our top-down, macroeconomic approach, we employ a bottom-up process of fundamental securities analysis to select the specific securities for investment. Elements of this evaluation may include duration measurements, historical yield spread relationships, volatility trends, mortgage refinance rates, as well as other factors. We may sell a security due to changes in our outlook, as well as changes in portfolio strategy or cash flow needs. A security may also be sold and replaced with one that presents a better value or risk/reward profile. We may actively trade portfolio securities. |
B-6
| | | | |
| | | INTERMEDIATE GOVERNMENT INCOME (TARGET FUND) | | GOVERNMENT SECURITIES (ACQUIRING FUND) |
| Sub-Adviser | | Wells Capital Management Incorporated | | Wells Capital Management Incorporated |
| | |
| Portfolio Manager(s) | | William Stevens | | Michael J. Bray, CFA W. Frank Koster Jay N. Mueller, CFA |
| | |
| | | NATIONAL LIMITED-TERM TAX-FREE (TARGET FUND) | | SHORT-TERM MUNICIPAL BOND (ACQUIRINGFUND) |
| Investment Objective | | Seeks current income exempt from federal income taxes, consistent with capital preservation. | | Seeks current income exempt from federal income tax consistent with capital preservation. |
| | |
| Principal Investments | | Under normal circumstances, the Fund invests: - at least 80% of the Fund’s net assets in municipal securities that pay interest exempt from federal income tax, including federal AMT; - up to 20% of the Fund’s net assets in securities that pay interest subject to federal income tax, including federal AMT; and - up to 10% of the Fund’s total assets in below investment-grade municipal securities. | | Under normal circumstances the Fund invests: - at least 80% of the Fund’s net assets in municipal securities that pay interest exempt from federal income tax, but not necessarily the federal AMT; - up to 20% of the Fund’s net assets in securities that pay interest subject to federal AMT; and - up to 15% of the Fund’s total assets in below investment-grade municipal securities. |
| | |
| Principal Investment Strategies | | We invest principally in municipal securities of states, territories and possessions of the United States that pay interest exempt from federal income tax, including federal alternative minimum tax. Some of the securities may be below investment grade or may be unrated and deemed by us to be of comparable quality. We may also invest a portion of the Fund’s net assets in securities that pay interest subject to federal AMT. We may use futures, options or swap agreements, as well as other derivatives, to manage risk or to enhance return. Under normal circumstances, we expect the Fund’s dollar-weighted average effective maturity to be between 1 and 5 years. We start our investment process with a top-down, macroeconomic outlook to determine portfolio duration and yield curve positioning as well as industry, sector and credit quality allocations. Macroeconomic factors considered may include, among others, the pace of economic growth, employment conditions, inflation, and monetary and fiscal policy. In combination with our top-down macroeconomic approach, we conduct intensive research on individual issuers to uncover solid investment opportunities, especially looking for bonds whose quality | | We invest principally in short-term municipal securities of states, territories and possessions of the United States that pay interest exempt from federal income tax, but not necessarily the federal alternative minimum tax. Some of the securities may be below investment grade or may be unrated and deemed by us to be of comparable quality. We may also invest a portion of the Fund’s total assets in securities that pay interest subject to federal AMT. We may use futures, options or swap agreements, as well as other derivatives, to manage risk or to enhance return. Under normal circumstances, we expect the Fund’s dollar-weighted average effective maturity to be 3 years or less. We start our investment process with a top-down, macroeconomic outlook to determine portfolio duration and yield curve positioning as well as industry, sector and credit quality allocations. Macroeconomic factors considered may include, among others, the pace of economic growth, employment conditions, inflation, and monetary and fiscal policy. In combination with our top-down macroeconomic approach, we conduct intensive research on individual issuers to uncover solid investment opportunities, |
B-7
| | | | |
| | | NATIONAL LIMITED-TERM TAX-FREE (TARGET FUND) | | SHORT-TERM MUNICIPAL BOND (ACQUIRINGFUND) |
| | may be improving. Our security selection is based on several factors including, among others, improving financial trends, positive industry and sector dynamics, improving economic conditions, specific demographic trends and value relative to other securities. We may sell a security due to changes in credit characteristics or outlook, as well as changes in portfolio strategy or cash flow needs. A security may also be sold based on relative value considerations and could be replaced with a security that presents a better value or risk/reward profile. | | especially looking for bonds whose quality may be improving. Our security selection is based on several factors including, among others, improving financial trends, positive industry and sector dynamics, improving economic conditions, specific demographic trends and value relative to other securities. We may sell a security due to changes in credit characteristics or outlook, as well as changes in portfolio strategy or cash flow needs. A security may also be sold based on relative value considerations and could be replaced with a security that presents a better value or risk/reward profile. We may actively trade portfolio securities. |
| | |
| Sub-Adviser | | Wells Capital Management Incorporated | | Wells Capital Management Incorporated |
| | |
| Portfolio Manager(s) | | Lyle J. Fitterer, CFA, CPA | | Wendy Casetta Lyle J. Fitterer, CFA, CPA |
| | |
| | | NATIONAL TAX-FREE (TARGET FUND) | | MUNICIPAL BOND (ACQUIRINGFUND) |
Investment Objective | | Seeks current income exempt from federal income tax. | | Seeks current income exempt from federal income tax. |
| | |
Principal Investments | | Under normal circumstances, the Fund invests: - at least 80% of the Fund’s net assets in municipal securities that pay interest exempt from federal income tax, including federal AMT; - up to 20% of the Fund’s net assets in securities that pay interest subject to federal income tax, including federal AMT; and - up to 10% of the Fund’s total assets in below investment-grade municipal securities. | | Under normal circumstances the Fund invests: - at least 80% of the Fund’s net assets in municipal securities that pay interest exempt from federal income tax, but not necessarily the federal AMT; - up to 20% of the Fund’s net assets in securities that pay interest subject to federal AMT; and - up to 20% of the Fund’s total assets in below investment-grade municipal securities. |
| | |
Principal Investment Strategies | | We invest principally in municipal securities of states, territories and possessions of the United States that pay interest exempt from federal income tax, including federal alternative minimum tax. Some of the securities may be below investment grade or may be unrated and deemed by us to be of comparable quality. We may also invest a portion of the Fund’s net assets in securities that pay interest subject to federal AMT. We may use futures, options or swap agreements, as well as other derivatives, to manage risk or to enhance return. Under normal circumstances, we expect the Fund’s dollar-weighted average effective maturity to be greater than 5 years and less than 20 years. | | We invest principally in municipal securities of states, territories and possessions of the United States that pay interest exempt from federal income tax, but not necessarily federal alternative minimum tax. Some of the securities may be below investment grade or may be unrated and deemed by us to be of comparable quality. We may also invest a portion of the Fund’s total assets in securities that pay interest subject to federal AMT. We may use futures, options or swap agreements, as well as other derivatives, to manage risk or to enhance return. Under normal circumstances, we expect the Fund’s dollar-weighted average effective maturity to be greater than 5 years and less than 20 years. |
B-8
| | | | |
| | | NATIONAL TAX-FREE (TARGET FUND) | | MUNICIPAL BOND (ACQUIRINGFUND) |
| | We start our investment process with a top-down, macroeconomic outlook to determine portfolio duration and yield curve positioning as well as industry, sector and credit quality allocations. Macroeconomic factors considered may include, among others, the pace of economic growth, employment conditions, inflation, and monetary and fiscal policy. In combination with our top-down macroeconomic approach, we conduct intensive research on individual issuers to uncover solid investment opportunities, especially looking for bonds whose quality may be improving. Our security selection is based on several factors including, among others, improving financial trends, positive industry and sector dynamics, improving economic conditions, specific demographic trends and value relative to other securities. We may sell a security due to changes in credit characteristics or outlook, as well as changes in portfolio strategy or cash flow needs. A security may also be sold based on relative value considerations and could be replaced with a security that presents a better value or risk/reward profile. | | We start our investment process with a top-down, macroeconomic outlook to determine portfolio duration and yield curve positioning as well as industry, sector and credit quality allocations. Macroeconomic factors considered may include, among others, the pace of economic growth, employment conditions, inflation, and monetary and fiscal policy. In combination with our top-down macroeconomic approach, we conduct intensive research on individual issuers to uncover solid investment opportunities, especially looking for bonds whose quality may be improving. Our security selection is based on several factors including, among others, improving financial trends, positive industry and sector dynamics, improving economic conditions, specific demographic trends and value relative to other securities. We may sell a security due to changes in credit characteristics or outlook, as well as changes in portfolio strategy or cash flow needs. A security may also be sold based on relative value considerations and could be replaced with a security that presents a better value or risk/reward profile. We may actively trade portfolio securities. |
| | |
Sub-Adviser | | Wells Capital Management Incorporated | | Wells Capital Management Incorporated |
| | |
Portfolio Managers | | Lyle J. Fitterer, CFA, CPA | | Lyle J. Fitterer, CFA, CPA |
| | |
| | | OVERSEAS (TARGET FUND) | | INTERNATIONAL EQUITY (ACQUIRINGFUND) |
Investment Objective | | Seeks long-term capital appreciation. | | Seeks long-term capital appreciation. |
| | |
Principal Investments | | Under normal circumstances, the Fund invests: - at least 80% of the Fund’s net assets in equity securities of foreign issuers; and - up to 20% of the Fund’s total assets in emerging market equity securities. | | Under normal circumstances the Fund invests: - at least 80% of the Fund’s net assets in equity securities of foreign issuers; and - up to 20% of the Fund’s total assets in emerging market equity securities. |
| | |
Principal Investment Strategies | | We invest principally in equity securities of foreign issuers. We invest primarily in developed countries, but may invest in emerging markets. Furthermore, we may use futures, options or swap agreements, as well as other derivatives, to manage risk or to enhance return. | | We invest principally in the equity securities of foreign issuers through the use of three different styles of international equity management: an international growth style, sub-advised by Artisan Partners Limited Partnership; an international value style, sub-advised by LSV Asset Management; and an international blend style, sub-advised by New Star Institutional Managers Limited. We invest |
B-9
| | | | |
| | | OVERSEAS (TARGET FUND) | | INTERNATIONAL EQUITY (ACQUIRINGFUND) |
| | (The following disclosure tracks New Star’s Principal Investment Strategies.) We invest in companies with strong growth potential and offer good value relative to similar investments. These companies typically have distinct competitive advantages, high or improving returns on invested capital, and a potential for positive earnings surprises. We follow a two-phase investment process. In the first phase, we conduct bottom-up research on international growth and value stocks using a combination of company visits, broker research, analyst meetings and financial databases. All stocks considered for purchase are analyzed using an “Economic Value Added” (EVA) methodology, which seeks to identify the factors driving company profitability, such as cost of capital and net operating margin. EVA is a performance measure that provides an estimate of the economic profit of a company by measuring the amount by which earnings exceed or fall short of the required minimum rate of return that could be generated by investing in other securities of comparable risk. In the second phase of the investment process, investment recommendations are combined with sector and country considerations for final stock selections. After a review of fundamentals of all stocks owned, we may choose to sell a holding when it no longer offers attractive growth prospects or to take advantage of a better investment opportunity. We reserve the right to hedge the portfolio’s foreign currency exposure by purchasing or selling currency futures and foreign currency forward contracts. However, under normal circumstances, we will not engage in extensive foreign currency hedging. | | primarily in developed countries, but may invest in emerging markets. Furthermore, we may use futures, options or swap agreements, as well as other derivatives, to manage risk or to enhance return. We reserve the right to hedge the portfolio’s foreign currency exposure by purchasing or selling currency futures and foreign currency forward contracts. However, under normal circumstances, we will not engage in extensive foreign currency hedging. Artisan Partners Limited Partnership (Artisan) Artisan invests in equity securities of foreign issuers by using a bottom-up investment process described below to identify investments in international growth companies, focusing on industries or themes that Artisan believes present accelerating growth prospects. Company visits are a key component of Artisan’s investment process, providing an opportunity to develop an understanding of a company, its management and its current and future strategic plans. Company visits also provide an opportunity to identify, validate or disprove an investment theme. Particular emphasis is placed on researching well-managed companies with dominant or increasing market shares that Artisan believes may lead to sustained earnings growth. Artisan pays careful attention to valuation relative to a company’s market or global industry in choosing investments. Artisan generally purchases securities it believes offer the most compelling potential earnings growth relative to their valuation. Artisan may choose to sell a stock when a company exhibits deteriorating fundamentals, changing circumstances affect the original reasons for its purchase, or to take advantage of a better opportunity. LSV Asset Management (LSV) LSV invests in equity securities of foreign issuers which it believes are undervalued in the marketplace at the time of purchase and show recent positive signals, such as an appreciation in prices and increase in earnings. Factors LSV considers in determining undervaluation include dividend yield, earnings relative to price, cash flow relative to price and book value relative to market value. LSV believes that these securities have the potential to |
B-10
| | | | |
| | | OVERSEAS (TARGET FUND) | | INTERNATIONAL EQUITY (ACQUIRINGFUND) |
| | | | produce future returns if their future growth exceeds the market’s low expectations. LSV uses a quantitative investment model to make investment decisions for the Fund. The investment model is designed to take advantage of judgmental biases that influence the decisions of many investors, such as the tendency to develop a “mindset” about a company or to wrongly equate a good company with a good investment irrespective of price. The investment model ranks securities based on fundamental measures of value (such as the dividend yield) and indicators of near-term recovery (such as recent price appreciation). This investment strategy seeks to manage overall portfolio risk while attempting to increase the expected return. A stock is typically sold if the model indicates a decline in its ranking or if a stock’s relative portfolio weight has appreciated significantly (relative to the benchmark). New Star Institutional Managers Limited (New Star) New Star invests in equity securities of foreign issuers with strong growth potential and that offer good value relative to similar investments. These companies typically have distinct competitive advantages, high or improving returns on invested capital, and a potential for positive earnings surprises (company’s history of meeting earnings targets). New Star follows a two-phase investment process. In the first phase, New Star conducts bottom-up research on international growth and value stocks using a combination of company visits, broker research, analyst meetings and financial databases. All stocks considered for purchase are analyzed using an “Economic Value Added” (EVA) methodology, which seeks to identify the factors driving company profitability, such as cost of capital and net operating margin. EVA is a performance measure that provides an estimate of the economic profit of a company by measuring the amount by which earnings exceed or fall short of the required minimum rate of return that could be generated by investing in other securities of comparable risk. In the second phase of the investment process, investment recommendations are combined |
B-11
| | | | |
| | | OVERSEAS (TARGET FUND) | | INTERNATIONAL EQUITY (ACQUIRINGFUND) |
| | | | with sector and country considerations for final stock selections. After a review of fundamentals of all stocks owned, New Star may choose to sell a holding when it no longer offers favorable growth prospects or to take advantage of a better investment opportunity. |
| | |
| Sub-Adviser(s) | | New Star Institutional Managers Limited | | Artisan Partners Limited Partnership LSV Asset Management New Star Institutional Managers Limited |
| | |
Portfolio Manager | | Mark Beale Brian Coffey Richard Lewis | | Mark Beale Brian Coffey Josef Lakonishok Richard Lewis Puneet Mansharamani, CFA Menno Vermeulen, CFA Mark L. Yockey, CFA |
| | |
| | | VALUE (TARGET FUND) | | C&B LARGE CAP VALUE (ACQUIRINGFUND) |
| Investment Objective | | Seeks maximum long-term, after-tax total return, consistent with minimizing risk to principal of large capitalization companies. | | Seeks maximum long-term total return (current income and capital appreciation), consistent with minimizing risk to principal. |
| | |
| Principal Investments | | Under normal circumstances, the Fund invests: - at least 80% of the Fund’s total assets in equity securities of large-capitalization companies. | | Under normal circumstances the Fund invests: - at least 80% of the Fund’s net assets in equity securities of large-capitalization companies. |
| | |
| Principal Investment Strategies | | We invest principally in equity securities of large-capitalization companies which we define as companies with market capitalizations of $3 billion or more. We attempt to minimize adverse federal income tax consequences for the Fund’s shareholders by managing the amount of realized gains, through reduced portfolio turnover. We cannot predict the impact of this strategy on the realization of gains or losses for the Fund but we intend to balance these tax considerations with the pursuit of the Fund’s objective. We manage a relatively focused portfolio of 30 to 50 companies that enables us to provide adequate diversification while allowing the composition and performance of the portfolio to behave differently than the market. Furthermore, we may use futures, options or swap agreements, as well as other derivatives, to manage risk or to enhance return. We select securities for the portfolio based on an analysis of a company’s financial characteristics and an assessment of the | | The Fund is a gateway fund that invests substantially all of its assets in the C&B Large Cap Value Portfolio, a master portfolio with a substantially identical investment objective and substantially similar investment strategies. We may invest in additional master portfolios, in other Wells Fargo Advantage Funds, or directly in a portfolio of securities. We invest principally in equity securities of large-capitalization companies, which we define as companies with market capitalizations of $3 billion or more. We manage a relatively focused portfolio of 30 to 50 companies that enables us to provide adequate diversification while allowing the composition and performance of the portfolio to behave differently than the market. Furthermore, we may use futures, options or swap agreements, as well as other derivatives, to manage risk or to enhance return. We select securities for the portfolio based on an analysis of a company’s financial characteristics and an assessment of the |
B-12
| | | | |
| | | VALUE (TARGET FUND) | | C&B LARGE CAP VALUE (ACQUIRINGFUND) |
| | quality of a company’s management. In selecting a company, we consider criteria such as return on equity, balance sheet strength, industry leadership position and cash flow projections. We further narrow the universe of acceptable investments by undertaking intensive research including interviews with a company’s top management, customers and suppliers. We believe our assessment of business quality and emphasis on valuation will protect the portfolio’s assets in down markets, while our insistence on strength in leadership, financial condition and cash flow position will produce competitive results in all but the most speculative markets. We regularly review the investments of the portfolio and may sell a portfolio holding when we believe it has achieved its valuation target, there is deterioration in the underlying fundamentals of the business, or we have identified a more attractive investment opportunity. | | quality of a company’s management. In selecting a company, we consider criteria such as return on equity, balance sheet strength, industry leadership position and cash flow projections. We further narrow the universe of acceptable investments by undertaking intensive research including interviews with a company’s top management, customers and suppliers. We believe our assessment of business quality and emphasis on valuation will protect the portfolio’s assets in down markets, while our insistence on strength in leadership, financial condition and cash flow position will produce competitive results in all but the most speculative markets. We regularly review the investments of the portfolio and may sell a portfolio holding when it has achieved its valuation target, there is deterioration in the underlying fundamentals of the business, or we have identified a more attractive investment opportunity. |
| | |
| Sub-Adviser | | Cooke & Bieler, LP | | Cooke & Bieler, LP |
| | |
| Portfolio Managers | | Kermit S. Eck, CFA Daren C. Heitman, CFA Michael M. Meyer, CFA James R. Norris Edward W. O’Connor, CFA R. James O’Neil, CFA Mehul Trivedi, CFA | | Kermit S. Eck, CFA Daren C. Heitman, CFA Michael M. Meyer, CFA James R. Norris Edward W. O’Connor, CFA R. James O’Neil, CFA Mehul Trivedi, CFA |
B-13
EXHIBIT C — COMPARISON OF RISKS
The following tables identify which principal risks are applicable to each Target Fund and Acquiring Fund (in bold print). A detailed definition of each of these risks can be found under the section, “Common and Specific Risk Considerations” in the Prospectus/Proxy Statement.
| | | | | | | | | | | | | | | | | | |
| | | Balanced | | Asset
Allocation | | Corporate
Bond | | Income
Plus | | High Yield
Bond | | High
Income |
Active Trading Risk | | | | | | | | — | | | — | | | | | | | |
Counter-Party Risk | | — | | | — | | | — | | | — | | | — | | | — | |
Currency Hedging Risk | | | | | | | | | | | — | | | | | | | |
Debt Securities Risk | | — | | | — | | | — | | | — | | | — | | | — | |
Derivatives Risk | | — | | | — | | | — | | | — | | | — | | | — | |
Emerging Markets Risk | | | | | | | | | | | | | | | | | | |
Foreign Investment Risk | | — | | | | | | — | | | — | | | | | | — | |
Growth Style Investment Risk | | | | | | | | | | | | | | | | | | |
High Yield Securities Risk | | — | | | | | | — | | | — | | | — | | | — | |
Index Tracking Risk | | | | | — | | | | | | | | | | | | | |
Issuer Risk | | — | | | — | | | — | | | — | | | — | | | — | |
Leverage Risk | | — | | | — | | | — | | | — | | | — | | | — | |
Liquidity Risk | | — | | | — | | | — | | | — | | | — | | | — | |
Management Risk | | — | | | — | | | — | | | — | | | — | | | — | |
Market Risk | | — | | | — | | | — | | | — | | | — | | | — | |
Mortgage- and Asset-Backed Securities Risk | | — | | | | | | | ` | | — | | | | | | | |
Multi-Style Management Risk | | | | | | | | | | | | | | | | | | |
Municipal Securities Risk | | | | | | | | | | | | | | | | | | |
Regulatory Risk | | — | | | — | | | — | | | — | | | — | | | — | |
Smaller Company Risk | | | | | | | | | | | | | | | | | | |
Stripped Securities Risk | | | | | | | | — | | | | | | | | | — | |
Tax Suitability Risk | | | | | | | | | | | | | | | | | | |
U.S. Government Obligations Risk | | — | | | — | | | | | | — | | | | | | | |
Value Style Investment Risk | | — | | | | | | | | | | | | | | | | |
| | | | | | | | | | | | | | | | | | |
| | | Intermediate
Government
Income | | Government
Securities | | National
Limited-
Term
Tax-Free | | Short-
Term
Municipal
Bond | | National
Tax-Free | | Municipal
Bond |
Active Trading Risk | | — | | | — | | | | | | — | | | | | | — | |
Counter-Party Risk | | — | | | — | | | — | | | — | | | — | | | — | |
Currency Hedging Risk | | | | | | | | | | | | | | | | | | |
Debt Securities Risk | | — | | | — | | | — | | | — | | | — | | | — | |
Derivatives Risk | | — | | | — | | | — | | | — | | | — | | | — | |
Emerging Markets Risk | | | | | | | | | | | | | | | | | | |
Foreign Investment Risk | | | | | | | | | | | | | | | | | | |
Growth Style Investment Risk | | | | | | | | | | | | | | | | | | |
High Yield Securities Risk | | | | | | | | — | | | — | | | — | | | — | |
Index Tracking Risk | | | | | | | | | | | | | | | | | | |
Issuer Risk | | — | | | — | | | | | | | | | | | | | |
Leverage Risk | | — | | | — | | | — | | | — | | | — | | | — | |
Liquidity Risk | | — | | | — | | | — | | | — | | | — | | | — | |
Management Risk | | — | | | — | | | — | | | — | | | — | | | — | |
Market Risk | | — | | | — | | | — | | | — | | | — | | | — | |
C-1
| | | | | | | | | | | | | | | | | | |
| | | Intermediate
Government
Income | | Government
Securities | | National
Limited-
Term
Tax-Free | | Short-
Term
Municipal
Bond | | National
Tax-Free | | Municipal
Bond |
Mortgage- and Asset-Backed Securities Risk | | — | | | — | | | | | | | | | | | | | |
Multi-Style Management Risk | | | | | | | | | | | | | | | | | | |
Municipal Securities Risk | | | | | | | | — | | | — | | | — | | | — | |
Regulatory Risk | | — | | | — | | | — | | | — | | | — | | | — | |
Smaller Company Risk | | | | | | | | | | | | | | | | | | |
Stripped Securities Risk | | — | | | — | | | | | | | | | | | | | |
Tax Suitability Risk | | | | | | | | | | | | | | | | | | |
U.S. Government Obligations Risk | | — | | | — | | | | | | | | | | | | | |
Value Style Investment Risk | | | | | | | | | | | | | | | | | | |
| | | | | | | | | | | | |
| | | Overseas | | International
Equity | | Value | | C&B Large
Cap Value |
Active Trading Risk | | | | | | | | | | | | |
Counter-Party Risk | | — | | | — | | | — | | | — | |
Currency Hedging Risk | | — | | | — | | | | | | | |
Debt Securities Risk | | | | | | | | | | | | |
Derivatives Risk | | — | | | — | | | — | | | — | |
Emerging Markets Risk | | — | | | — | | | | | | | |
Foreign Investment Risk | | — | | | — | | | | | | | |
Growth Style Investment Risk | | — | | | — | | | | | | | |
High Yield Securities Risk | | | | | | | | | | | | |
Index Tracking Risk | | | | | | | | | | | | |
Issuer Risk | | — | | | — | | | — | | | — | |
Leverage Risk | | — | | | — | | | — | | | — | |
Liquidity Risk | | — | | | — | | | — | | | — | |
Management Risk | | — | | | — | | | — | | | — | |
Market Risk | | — | | | — | | | — | | | — | |
Mortgage- and Asset-Backed Securities Risk | | | | | | | | | | | | |
Multi-Style Management Risk | | | | | — | | | | | | | |
Municipal Securities Risk | | | | | | | | | | | | |
Regulatory Risk | | — | | | — | | | — | | | — | |
Smaller Company Risk | | — | | | — | | | | | | | |
Stripped Securities Risk | | | | | | | | | | | | |
Tax Suitability Risk | | | | | | | | — | | | | |
U.S. Government Obligations Risk | | | | | | | | | | | | |
Value Style Investment Risk | | — | | | — | | | — | | | — | |
C-2
EXHIBIT D — PORTFOLIO MANAGERS
Mark Beale
International Equity Fund
Overseas Fund
Mr. Beale is jointly responsible for managing the International Equity Fund, which he has managed since 2004, and the Overseas Fund, which he has managed since 2005. Mr. Beale joined New Star in 1982 and is the lead portfolio manager for New Star’s international equity product. He is a member of the Investment Policy and Currency Group. Mr. Beale is Co-Head of Institutional Equity and has oversight of the New Star Team-based approach. Education: B.A., Economic History, University of Sussex, England.
Galen G. Blomster, CFA
Asset Allocation Fund
Mr. Blomster is jointly responsible for managing the Asset Allocation Fund, which he has managed since 2002. He joined Wells Capital Management as Vice President and Director of Research from Norwest Investment Management, where he served as a portfolio manager until the two firms combined investment advisory services under the Wells Capital Management name in 1999. He briefly retired from Wells Capital Management in April 2007, and rejoined the firm in October 2007 as a Principal and Senior Advisor serving in an advisory capacity on the Quantitative Strategies Team. In this role, Mr. Blomster focuses primarily on research and the maintenance and development of the team’s quantitative models. Education: B.S., Dairy/Food Science and Economics, University of Minnesota; M.S. and Ph.D., Purdue University.
Michael J. Bray, CFA
Government Securities Fund
Income Plus Fund (effective at the closing of the Reorganization)
Mr. Bray is jointly responsible for managing the Government Securities Fund, which he has managed since 2005, and, effective at the closing of the Reorganization, will co-manage the Income Plus Fund. Mr. Bray joined Wells Capital Management in 2005 as a portfolio manager on the Customized Fixed Income Team specializing in government, agency and mortgage- and asset-backed securities. Prior to joining Wells Capital Management, Mr. Bray was a principal responsible for multi-currency yield curve arbitrage business at Windward Capital, LLC from 2004 to 2005. From 1996 to 2004, he was the managing director at State Street Research and Management, focusing on mutual fund and institutional account management. Education: B.S., Math and Actuarial Science, University of Connecticut, Storrs; M.B.A., Pennsylvania State University.
Wendy Casetta
Short-Term Municipal Bond Fund
Ms. Casetta is jointly responsible for managing the Short-Term Municipal Bond Fund, which she has managed since 2007. Ms. Casetta joined Wells Capital Management in 2005 as a portfolio manager with the Municipal Fixed Income Team. Prior to joining Wells Capital Management, Ms. Casetta was with Strong Capital Management, where she was a senior research analyst and portfolio manager for the Municipal Credit Research Team since 1998. Education: B.A., Finance, University of Wisconsin-Oshkosh; M.B.A., Business Administration, University of North Florida.
D-1
Brian Coffey
International Equity Fund
Overseas Fund
Mr. Coffey is jointly responsible for managing the International Equity Fund and the Overseas Fund, both of which he has managed since 2006. Mr. Coffey joined New Star in 1988. He has specific regional responsibility for Latin America. He is a member of the Investment Policy Group and leads the efforts for research and stock selection in Latin America. Education: B.Sc., Financial Economics, University of London.
Gary J. Dunn, CFA
Balanced Fund
Mr. Dunn is jointly responsible for managing the Balanced Fund, which he has managed since 2005. He joined Wells Capital Management in 1998 as Principal for its Equity Income Team. Prior to that, he served as Director of Institutional Investments of Norwest Investment Management, which combined investment advisory services with Wells Capital Management in 1999. Education: B.A., Economics, Carroll College.
Kermit S. Eck, CFA
C&B Large Cap Value Fund
Value Fund
Mr. Eck is jointly responsible for managing the C&B Large Cap Value Fund and the Value Fund, both of which he has managed since 1997. Mr. Eck joined Cooke & Bieler in 1992 and currently serves as a partner, portfolio manager and research analyst. Education: B.S., Computer Science, Montana State University; M.B.A., Stanford University.
Lyle J. Fitterer, CFA, CPA
Municipal Bond Fund
National Limited-Term Tax-Free Fund
National Tax-Free Fund
Short-Term Municipal Bond Fund
Mr. Fitterer is responsible for managing the National Limited-Term Tax-Free Fund, which he has managed since 2006. Mr. Fitterer is jointly responsible for managing the Municipal Bond Fund and the Short-Term Municipal Bond Fund, both of which he has managed since 2000, and the National Tax-Free Fund, which he has managed since 2006. Mr. Fitterer joined Wells Capital Management in 2005 as the managing director and head of the Municipal Fixed Income Team and the Customized Fixed Income Team. He is also a senior portfolio manager focusing on managing tax-exempt portfolios. Prior to joining Wells Capital Management, Mr. Fitterer served as director of the Tax-Exempt Fixed Income Team at Strong Capital Management for five years. Education: B.S., Accounting, University of North Dakota.
Gregory T. Genung, CFA
Asset Allocation Fund
Mr. Genung is jointly responsible for managing the Asset Allocation Fund, which he has managed since 2006. Mr. Genung joined Wells Capital Management in 2001, and also manages certain Wells Fargo index and quantitative mutual funds, private accounts and collective trust funds. Education: B.B.A. Finance, and B.A. equivalency, Economics, University of Minnesota, Duluth.
D-2
Daren C. Heitman, CFA
C&B Large Cap Value Fund
Value Fund
Mr. Heitman is jointly responsible for managing the C&B Large Cap Value Fund and the Value Fund, both of which he has managed since 2005. Mr. Heitman joined Cooke & Bieler in 2005 as a portfolio manager. Before joining Cooke & Bieler, Mr. Heitman was with Schneider Capital Management as a senior analyst from 2000 until 2005. Education: B.S., Finance, Iowa State University; M.B.A., University of Chicago.
W. Frank Koster
Balanced Fund
Government Securities Fund
Income Plus Fund
Mr. Koster is jointly responsible for managing the Balanced Fund and the Government Securities Fund, both of which he has managed since 2004, and the Income Plus Fund, which he has managed since 2005. He joined Wells Capital Management (WCM) in 2005 as a Portfolio Manager. Prior to joining WCM, Mr. Koster was with Strong Capital Management, Inc. (SCM), serving first as a Senior Vice President of SCM’s Institutional Business Group. From December 2000 to March 2001, he was a fixed-income product specialist at SCM, and from March 2001 through 2002, a portfolio manager for SCM’s institutional fixed-income accounts. Education: B.S., Economics, College of Wooster.
Josef Lakonishok
International Equity Fund
Dr. Lakonishok is jointly responsible for managing the International Equity Fund, which he has managed since 2004. Dr. Lakonishok has served as CEO, Partner and Portfolio Manager for LSV since its founding in 1994. Education: B.A., Economics and Statistics, Tel Aviv University; M.B.A., Tel Aviv University; M.S. and Ph.D., Business Administration, Cornell University.
Richard Lewis
International Equity Fund
Overseas Fund
Mr. Lewis is jointly responsible for managing the International Equity Fund, which he has managed since 2004, and the Overseas Fund, which he has managed since 2005. Mr. Lewis joined New Star in 1989. Mr. Lewis is a member of the Investment Policy and Currency Group, and has specific regional responsibility for New Star’s European Equity group. Mr. Lewis is Co-Head of Institutional Equity and has oversight of the New Star Team based approach. Education: B.S., Economics and Statistics, Bristol University, England.
Kevin J. Maas, CFA
High Income Fund
Mr. Maas is jointly responsible for managing the High Income Fund, which he has managed since 2007. Mr. Maas joined Wells Capital Management in 2005 as a senior research analyst specializing in taxable high yield securities. Prior to joining Wells Capital Management, Mr. Maas was with Strong Capital Management since 1999 as a high-yield, taxable fixed-income analyst. Education: B.S., Finance, University of Minnesota.
D-3
Puneet Mansharamani, CFA
International Equity Fund
Mr. Mansharamani is jointly responsible for managing the International Equity Fund, which he has managed since 2006. Mr. Mansharamani has served as a Partner and Portfolio Manager of LSV since 2006 and as a Quantitative Analyst since 2000. Education: B.S., Engineering, Delhi University, Delhi College of Engineering; M.S., Engineering, Case Western Reserve University, Case School of Engineering.
Jeffrey P. Mellas
Asset Allocation Fund
Mr. Mellas is jointly responsible for managing the Asset Allocation Fund, which he has managed since 2003. Mr. Mellas joined Wells Capital Management in 2003 as Managing Director of Quantitative Asset Management and Portfolio Manager. In this role, Mr. Mellas oversees quantitative investment management efforts on behalf of institutional separate accounts, mutual investment funds and collective investment funds. Prior to joining Wells Capital Management, Mr. Mellas was with Alliance Capital Management since 1995, as Vice President and Global Portfolio Strategist. Education: B.A., Economics, University of Minnesota; M.B.A., Finance and International Business, New York University. Additional studies: International Management Program at Hâute Etudes Commerçiales, Paris, France, and Université de Valery, Montpellier, France.
Michael M. Meyer, CFA
C&B Large Cap Value Fund
Value Fund
Mr. Meyer is jointly responsible for managing the C&B Large Cap Value Fund, which he has managed since 1993, and the Value Fund, which he has managed since 1997. Mr. Meyer joined Cooke & Bieler in 1993 where he is currently a partner, portfolio manager and research analyst. Education: B.A., Economics, Davidson College; M.B.A., The Wharton School of Business.
Jay N. Mueller, CFA
Government Securities Fund
Mr. Mueller is jointly responsible for managing the Government Securities Fund, which he has managed since 2004. Mr. Mueller joined Wells Capital Management in 2005 as a portfolio manager specializing in macroeconomic analysis. Prior to joining Wells Capital Management, he served as a portfolio manager with Strong Capital Management, Inc. (SCM) since 1991. Additional responsibilities at SCM included serving as director of fixed income from 2002 to 2004. Education: B.A., Economics, University of Chicago.
D. James Newton II, CFA, CPA
Corporate Bond Fund
Income Plus Fund (effective at the closing of the Reorganization)
Mr. Newton is jointly responsible for managing the Corporate Bond Fund, which he has managed since 2005, and, effective at the closing of the Reorganization, will co-manage the Income Plus Fund. Mr. Newton joined Wells Capital Management in 2005 as a portfolio manager and head of investment grade credit research. Prior to joining Wells Capital Management, Mr. Newton served as a high-grade, fixed-income analyst with Strong Capital Management, Inc. (SCM) since 2002. Prior to joining SCM, he was at Northwestern Mutual Life Insurance Company from 1998 to 2002, first as an associate in the Private Placement Department, and later as an investment grade credit analyst and subsequent director in the Public Fixed Income Department. Education: B.A., Economics, Albion College; M.B.A., University of Michigan.
D-4
Niklas Nordenfelt, CFA
High Yield Bond Fund
Mr. Nordenfelt is jointly responsible for managing the High Yield Bond Fund, which he has managed since 2007. Mr. Nordenfelt joined the Sutter High Yield Fixed Income team of Wells Capital Management in February 2003. Prior to being promoted to co-portfolio manager of the High Yield Bond Fund in 2007, he was an investment strategist at Wells Capital Management and was responsible for portfolio analytics, macro-strategy analysis and client portfolio management issues. Before joining Wells Capital Management, Mr. Nordenfelt was at Barclays Global Investors from 1996-2002 where he was a principal and investment strategist working directly with clients on their international and emerging markets equity strategies. Education: B.A., Economics, University of California, Berkeley.
James R. Norris
C&B Large Cap Value Fund
Value Fund
Mr. Norris is jointly responsible for managing the C&B Large Cap Value Fund and the Value Fund, both of which he has managed since 1998. Mr. Norris joined Cooke & Bieler in 1998 where he is currently a partner, portfolio manager and research analyst. Education: B.S., Management, Guilford College; M.B.A., University of North Carolina.
Edward W. O’Connor, CFA
C&B Large Cap Value Fund
Value Fund
Mr. O’Connor is jointly responsible for managing the C&B Large Cap Value Fund and the Value Fund, both of which he has managed since 2002. Mr. O’Connor joined Cooke & Bieler in 2002 where he is currently a partner, portfolio manager and research analyst. Prior to joining Cooke & Bieler, Mr. O’Connor was with Cambiar Investors where he served as an equity analyst and portfolio manager and participated in Cambiar’s 2001 management buyout. Education: B.A., Economics and Philosophy, Colgate University; M.B.A., University of Chicago.
R. James O’Neil, CFA
C&B Large Cap Value Fund
Value Fund
Mr. O’Neil is jointly responsible for managing the C&B Large Cap Value Fund, which he has managed since 1990, and the Value Fund, which he has managed since 1997. Mr. O’Neil joined Cooke & Bieler in 1988 where he is currently a partner, portfolio manager and research analyst since that time. Education: B.A., Economics, Colby College; M.B.A., Harvard School of Business.
Thomas M. Price, CFA
High Income Fund
Income Plus Fund
Mr. Price is jointly responsible for managing the High Income Fund, which he has managed since 1998, and the Income Plus Fund, which he has managed since 2005. Mr. Price joined Wells Capital Management in 2005 as a portfolio manager specializing in taxable high yield securities. Prior to joining Wells Capital Management, Mr. Price was with Strong Capital Management, Inc. (SCM) since 1996 as a fixed income research analyst and, since 1998, as a portfolio manager. Education: B.B.A., Finance, University of Michigan; M.B.A., Finance, Kellogg Graduate School of Management, Northwestern University.
D-5
Janet S. Rilling, CFA, CPA
Corporate Bond Fund
Income Plus Fund (effective at the closing of the Reorganization)
Ms. Rilling is jointly responsible for managing the Corporate Bond Fund, which she has managed since 2000, and, effective at the closing of the Reorganization, will co-manage the Income Plus Fund. Ms. Rilling joined Wells Capital Management in 2005 as a portfolio manager and specializes in investment-grade corporate debt securities. Prior to joining Wells Capital Management, she was a portfolio manager with Strong Capital Management, Inc. (SCM) since 2000 and a research analyst at SCM since 1995. Education: B.A., Accounting and Finance; M.S., Finance, University of Wisconsin.
Michael J. Schueller, CFA
High Income Fund
Mr. Schueller is jointly responsible for managing the High Income Fund, which he has managed since 2007. Mr. Schueller joined Wells Capital Management in 2005 as a senior research analyst specializing in high yield securities and, since 2007, as a portfolio manager. Prior to joining Wells Capital Management, Mr. Schueller was with Strong Capital Management, Inc. (SCM) since 2000 as a leveraged loan trader and, since 2002, a fixed income research analyst. Education: B.A., Economics, University of Minnesota; J.D., University of Wisconsin.
William Stevens
Intermediate Government Income Fund
Mr. Stevens is responsible for managing the Intermediate Government Income Fund, which he has managed since 2005. Mr. Stevens joined Wells Capital Management in 2003 as chief fixed income officer and senior managing director. He currently serves as senior portfolio manager and co-head of the Montgomery Fixed Income Investment Strategies Team. Prior to joining Wells Capital Management, Mr. Stevens was president and chief investment officer of Montgomery Asset Management, with oversight responsibility for all investment related activities, as well as co-head and founder of Montgomery’s Fixed Income Division since 1992. Education: B.A., Economics, Wesleyan University; M.B.A., Harvard Business School.
Phil Susser
High Yield Bond Fund
Mr. Susser is jointly responsible for managing the High Yield Bond Fund, which he has managed since 2004. Mr. Susser joined the Sutter High Yield Fixed Income Team at Wells Capital Management as a senior analyst in 2001. Education: B.A., Economics, University of Pennsylvania; J.D., University of Michigan Law School.
Robert M. Thornburg
Balanced Fund
Mr. Thornburg is jointly responsible for managing the Balanced Fund, which he has managed since 2006. Mr. Thornburg joined Wells Capital Management in 2001, where he has served as a senior equity analyst and portfolio manager for the Premier Value team, providing investment management services for the mutual fund, institutional clients, including retirement plans, foundations, endowments, and corporate portfolios. Education: B.A., Finance, University of Montana.
D-6
Mehul Trivedi, CFA
C&B Large Cap Value Fund
Value Fund
Mr. Trivedi is jointly responsible for managing the C&B Large Cap Value Fund and the Value Fund, both of which he has managed since 1998. He joined Cooke & Bieler in 1998 where he is currently a partner, portfolio manager and research analyst. Education: B.A., International Relations, University of Pennsylvania; B.S., Economics, Wharton School of Business; M.B.A., Wharton School of Business.
Menno Vermuelen, CFA
International Equity Fund
Mr. Vermeulen is jointly responsible for managing the International Equity Fund, which he has managed since 2004. Mr. Vermeulen has served as a Portfolio Manager and Senior Quantitative Analyst for LSV since 1995 and as a Partner for LSV since 1998. Education: M.S., Econometrics, Erasmus University at Rotterdam.
Mark L. Yockey, CFA
International Equity Fund
Mr. Yockey is jointly responsible for managing the International Equity Fund, which he has managed since 2004. Mr. Yockey joined Artisan in 1995 where he is Managing Director and Portfolio Manager for Artisan’s diversified international growth equity portfolios. Education: B.A., Finance, Michigan State University; M.B.A., Finance, Michigan State University.
D-7
EXHIBIT E — PERFORMANCE/FINANCIAL HIGHLIGHTS OF CERTAIN TARGET AND ACQUIRING FUNDS
Asset Allocation Fund
Performance
The following information shows you how the Fund has performed and illustrates the variability of the Fund’s returns over time. The Fund’s average annual total returns are compared to the performance of an appropriate broad-based index. Please remember that past performance before and after taxes is no guarantee of future results.
Calendar Year Total Returns for Class A1 as of 12/31 each year
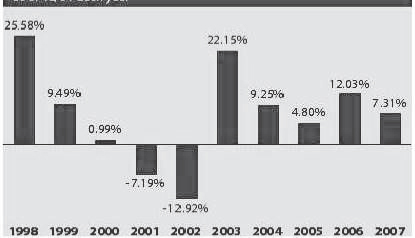
Best and Worst Quarter
| | | | | |
Best Quarter: | | Q4 1998 | | 16.09 | % |
Worst Quarter: | | Q3 2002 | | -12.39 | % |
Average Annual Total Returns
for the period ended December 31, 2007
| | | | | | | | | |
| | | 1 year | | | 5 years | | | 10 years | |
Class A1 | | | | | | | | | |
Returns Before Taxes | | 1.12 | % | | 9.65 | % | | 5.93 | % |
Returns After Taxes on Distributions2 | | -0.72 | % | | 8.22 | % | | 4.06 | % |
Returns After Taxes on Distributions and Sale of Fund Shares2 | | 1.39 | % | | 7.59 | % | | 4.18 | % |
Class B1 Returns before taxes | | 1.51 | % | | 9.86 | % | | 5.77 | % |
Class C1 Returns before taxes | | 5.50 | % | | 10.12 | % | | 5.76 | % |
S&P 500 Index3,4 (reflects no deduction for fees, expenses or taxes) | | 5.49 | % | | 12.82 | % | | 5.91 | % |
Lehman Brothers 20+Treasury Index5 (reflects no deduction for fees, expenses or taxes) | | 10.15 | % | | 6.02 | % | | 7.32 | % |
Asset Allocation Composite Index6 (reflects no deduction for fees, expense or taxes) | | 7.40 | % | | 10.27 | % | | 6.93 | % |
1 | Calendar Year Total Returns in the bar chart do not reflect sales charges. If they did, returns would be lower. Average Annual Total Returns reflect applicable sales charges. Class A shares incepted on November 13, 1986. Class B shares incepted on January 1, 1995. Class C shares incepted on April 1, 1998. |
E-1
| | Performance shown prior to the inception of the Class C shares reflects the performance of the Class A shares, adjusted to reflect Class C sales charges and expenses. |
2 | After-tax returns are calculated using the historical highest individual federal marginal income tax rates and do not reflect the impact of state, local or foreign taxes. Actual after-tax returns depend on an investor’s tax situation and may differ from those shown, and after-tax returns shown are not relevant to tax-exempt investors or investors who hold their Fund shares through tax-deferred arrangements, such as 401(k) Plans or Individual Retirement Accounts. After-tax returns are shown only for the Class A shares. After-tax returns for the Class B and Class C shares will vary. |
3 | The S&P 500 Index consists of 500 stocks chosen for market size, liquidity, and industry group representation. It is a market value-weighted index with each stock’s weight in the Index proportionate to its market value. You cannot invest directly in an index. |
4 | Standard & Poor’s, S&P, S&P 500 Index, Standard & Poor’s 500 and 500 are trademarks of McGraw Hill, Inc. and have been licensed for use by the Fund. The Fund is not sponsored, endorsed, sold or promoted by S&P and S&P makes no representation or warranty regarding the advisability of investing in the Fund. |
5 | The Lehman Brothers 20+Treasury Index is an unmanaged index composed of securities in the U.S. Treasury Index with maturities of 20 years or greater. You cannot invest directly in an index. |
6 | The Asset Allocation Composite Index is weighted 60% in the S&P 500 Index and 40% in the Lehman Brothers 20+ Treasury Index. You cannot invest directly in an index. |
Financial Highlights
The following tables are intended to help you understand the Funds’ financial performance for the past 5 years. Certain information reflects financial results for a single Fund share. Total returns represent the rate you would have earned (or lost) on an investment in the Fund (assuming reinvestment of all distributions). All performance information, along with the report of independent registered public accounting firm and the Funds’ financial statements, is also contained in the Funds’ annual report, a copy of which is available upon request.
E-2
Asset Allocation Fund
Class A Shares — Commenced on November 13, 1986
For a share outstanding throughout each period
| | | | | | | | | | | | | | | | | | | | |
| | | Sept. 30,
2007 | | | Sept. 30,
2006 | | | Sept. 30,
2005 | | | Sept. 30,
2004 | | | Sept. 30,
2003 | |
Net asset value, beginning of period | | $ | 20.94 | | | $ | 19.99 | | | $ | 18.80 | | | $ | 17.50 | | | $ | 14.97 | |
Income from investment operations: | | | | | | | | | | | | | | | | | | | | |
Net investment income (loss) | | | 0.47 | 1 | | | 0.44 | | | | 0.40 | | | | 0.36 | 1 | | | 0.30 | |
Net realized and unrealized gain (loss) on investments | | | 2.58 | | | | 1.16 | | | | 1.64 | | | | 1.57 | | | | 2.53 | |
Total from investment operations | | | 3.05 | | | | 1.60 | | | | 2.04 | | | | 1.93 | | | | 2.83 | |
Less distributions: | | | | | | | | | | | | | | | | | | | | |
Distributions from net investment income | | | (0.47 | ) | | | (0.43 | ) | | | (0.41 | ) | | | (0.36 | ) | | | (0.30 | ) |
Distributions from net realized gain | | | (0.40 | ) | | | (0.22 | ) | | | (0.44 | ) | | | (0.27 | ) | | | 0.00 | |
Total distributions | | | (0.87 | ) | | | (0.65 | ) | | | (0.85 | ) | | | (0.63 | ) | | | (0.30 | ) |
Net asset value, end of period | | $ | 23.12 | | | $ | 20.94 | | | $ | 19.99 | | | $ | 18.80 | | | $ | 17.50 | |
| | | | | | | | | | | | | | | | | | | | |
Total return2 | | | 14.83 | % | | | 8.13 | % | | | 11.03 | % | | | 11.12 | % | | | 19.04 | % |
Ratios/supplemental data: | | | | | | | | | | | | | | | | | | | | |
Net assets, end of period (000s) | | $ | 914,716 | | | $ | 871,848 | | | $ | 934,783 | | | $ | 864,857 | | | $ | 838,683 | |
Ratio of net investment income (loss) to average net assets3 | | | 2.12 | % | | | 2.13 | % | | | 2.06 | % | | | 1.90 | % | | | 1.80 | % |
Ratio of expenses to average net assets prior to waived fees and reimbursed expenses3 | | | 1.25 | % | | | 1.26 | % | | | 1.23 | % | | | 1.34 | % | | | 1.45 | % |
Waived fees and reimbursed expenses3 | | | (0.10 | )% | | | (0.11 | )% | | | (0.08 | )% | | | (0.19 | )% | | | (0.30 | )% |
Ratio of expenses to average net assets after waived fees and expenses3 | | | 1.15 | % | | | 1.15 | % | | | 1.15 | % | | | 1.15 | % | | | 1.15 | % |
Portfolio turnover rate | | | 16 | % | | | 11 | % | | | 6 | % | | | 4 | % | | | 15 | % |
1 | Calculated based upon average shares outstanding. |
2 | Total return calculations do not include any sales charges, and would have been lower had certain expenses not been waived or reimbursed during the periods shown. Returns for periods less than one year are not annualized. |
3 | During each period, various fees and expenses were waived and reimbursed. The ratio of Gross Expenses to Average Net Assets reflects the expense ratio in the absence of any waivers and reimbursements. |
E-3
Corporate Bond
Performance
The following information shows you how the Fund has performed and illustrates the variability of the Fund’s returns over time. The Fund’s average annual total returns are compared to the performance of an appropriate broad-based index. Please remember that past performance before and after taxes is no guarantee of future results.
Effective April 11, 2005, the Strong family of funds reorganized into the Wells Fargo Advantage Funds. As part of this transaction, the Corporate Bond Fund was organized as the successor fund to the Strong Corporate Bond Fund.
Calendar Year Total Returns for the Advisor Class1 as of 12/31 each year
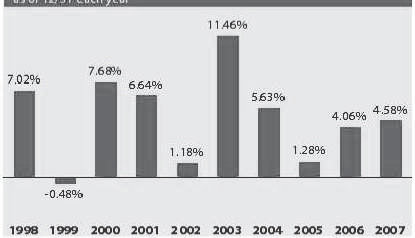
Best and Worst Quarter
| | | | | |
Best Quarter: | | Q2 2003 | | 5.74 | % |
Worst Quarter: | | Q2 2004 | | -3.79 | % |
The Fund’s year-to-date performance through December 31, 2007, was 4.58%.
Average Annual Total Returns
as of 12/31/07
| | | | | | | | | |
| | | 1 year | | | 5 years | | | 10 years | |
Advisor Class1 | | | | | | | | | |
Returns Before Taxes | | 4.58 | % | | 5.35 | % | | 4.85 | % |
Returns After Taxes on Distributions2 | | 2.78 | % | | 3.60 | % | | 2.63 | % |
Returns After Taxes on Distributions and Sale of Fund Shares2 | | 2.95 | % | | 3.55 | % | | 2.75 | % |
Lehman Brothers U.S. Credit Bond Index3 (reflects no deduction for expenses or taxes) | | 5.11 | % | | 4.84 | % | | 6.05 | % |
1 | Advisor Class shares incepted on August 31, 1999. Performance shown prior to April 11, 2005 for the Advisor Class shares reflects the performance of the Advisor Class shares of the Strong Corporate Bond Fund, the predecessor fund. Performance shown prior to the inception of the Advisor Class shares reflects the performance of the Investor Class shares of the predecessor fund, adjusted to reflect Advisor Class expenses. |
E-4
2 | After-tax returns are calculated using the historical highest individual federal marginal income tax rates and do not reflect the impact of state, local or foreign taxes. Actual after-tax returns depend on an investor’s tax situation and may differ from those shown, and after-tax returns shown are not relevant to tax-exempt investors or investors who hold their Fund shares through tax-deferred arrangements, such as 401(k) Plans or Individual Retirement Accounts. |
3 | The Lehman Brothers U.S. Credit Bond Index contains publicly issued U.S. corporate and specified foreign debentures and secured notes that meet the specified maturity, liquidity, and quality requirements. To qualify for inclusion in the Index, bonds must be SEC-registered. You cannot invest directly in an index. |
Financial Highlights
The following tables are intended to help you understand the Funds’ financial performance for the past 5 years. Certain information reflects financial results for a single Fund share. Total returns represent the rate you would have earned (or lost) on an investment in the Fund (assuming reinvestment of all distributions). All performance information, along with the report of independent registered public accounting firm and the Funds’ financial statements, is also contained in the Funds’ annual or semi-annual report, a copy of which is available upon request.
E-5
Corporate Bond Fund
Advisor Class Shares — Commenced on August 31, 1999
For a share outstanding throughout each period
| | | | | | | | | | | | | | | | | | | | | | | | | | | | |
| | | Nov. 30,
2007
(unaudited) | | | May 31,
2007 | | | May 31,
2006 | | | May 31,
20053 | | | Oct. 31,
2004 | | | Oct. 31,
2003 | | | Oct. 31,
2002 | |
For the period ended: | | | | | | | |
Net asset value, beginning of period | | $ | 10.16 | | | $ | 9.96 | | | $ | 10.58 | | | $ | 10.67 | | | $ | 10.42 | | | $ | 9.54 | | | $ | 10.80 | |
Income from investment operations: | | | | | | | | | | | | | | | | | | | | | | | | | | | | |
Net investment income (loss) | | | 0.25 | | | | 0.50 | | | | 0.49 | | | | 0.29 | | | | 0.49 | | | | 0.52 | | | | 0.63 | |
Net realized and unrealized gain (loss) on investments | | | 0.08 | | | | 0.20 | | | | (0.62 | ) | | | (0.09 | ) | | | 0.25 | | | | 0.88 | | | | (1.25 | ) |
Total from investment operations | | | 0.33 | | | | 0.70 | | | | (0.13 | ) | | | 0.20 | | | | 0.74 | | | | 1.40 | | | | (0.62 | ) |
Less distributions: | | | | | | | | | | | | | | | | | | | | | | | | | | | | |
Distributions from net investment income | | | (0.25 | ) | | | (0.50 | ) | | | (0.49 | ) | | | (0.29 | ) | | | (0.49 | ) | | | (0.52 | ) | | | (0.64 | ) |
Distributions from net realized gain | | | 0.00 | | | | 0.00 | | | | 0.00 | | | | 0.00 | | | | 0.00 | | | | 0.00 | | | | 0.00 | |
Total distributions | | | (0.25 | ) | | | (0.50 | ) | | | (0.49 | ) | | | (0.29 | ) | | | (0.49 | ) | | | (0.52 | ) | | | (0.64 | ) |
Net asset value, end of period | | $ | 10.24 | | | $ | 10.16 | | | $ | 9.96 | | | $ | 10.58 | | | $ | 10.67 | | | $ | 10.42 | | | $ | 9.54 | |
| | | | | | | | | | | | | | | | | | | | | | | | | | | | |
Total return1 | | | 3.44 | % | | | 7.15 | % | | | (1.33 | )% | | | 1.85 | % | | | 7.29 | % | | | 14.89 | % | | | (5.84 | )% |
Ratios/supplemental data: | | | | | | | | | | | | | | | | | | | | | | | | | | | | |
Net assets, end of period (000s) | | $ | 15,954 | | | $ | 14,418 | | | $ | 13,899 | | | $ | 17,440 | | | $ | 20,396 | | | $ | 28,663 | | | $ | 30,529 | |
Ratio of net investment income (loss) to average net assets2 | | | 5.00 | % | | | 4.93 | % | | | 4.68 | % | | | 4.60 | % | | | 4.70 | % | | | 5.10 | % | | | 6.40 | % |
Ratio of expenses to average net assets prior to waived fees and reimbursed expenses2 | | | 1.12 | % | | | 1.13 | % | | | 1.11 | % | | | 1.23 | %5 | | | 1.20 | % | | | 1.16 | % | | | 1.15 | % |
Waived fees and reimbursed expenses2 | | | (0.17 | )% | | | (0.16 | )% | | | (0.11 | )% | | | (0.16 | )% | | | (0.08 | )% | | | (0.03 | )% | | | (0.03 | )% |
Ratio of expenses to average net assets after waived fees and reimbursed expenses2 | | | 0.95 | % | | | 0.97 | % | | | 1.00 | % | | | 1.07 | % | | | 1.12 | % | | | 1.13 | % | | | 1.12 | % |
Portfolio turnover rate4 | | | 87 | % | | | 162 | % | | | 157 | % | | | 85 | % | | | 133 | % | | | 205 | % | | | 412 | % |
1 | Total returns do not include any sales charges, and would have been lower had certain expenses not been waived or reimbursed during the periods shown. Total returns for periods of less than one year are not annualized. |
2 | During each period, various fees and expenses were waived and/or reimbursed. The ratio of gross expenses to average net assets reflects the expense ratio in the absence of any waivers and/or reimbursements. |
3 | In 2005, the Fund changed its fiscal year end from October 31 to May 31. Information is shown for a 7-month period from November 1, 2004 to May 31, 2005. |
4 | Calculated on the basis of the Fund as a whole without distinguishing between the classes of shares issued. |
5 | Ratios shown for periods of less than one year are annualized. |
E-6
Income Plus Fund
Performance
The following information shows you how the Fund has performed and illustrates the variability of the Fund’s returns over time. The Fund’s average annual total returns are compared to the performance of an appropriate broad-based index. Please remember that past performance before and after taxes is no guarantee of future results.
Calendar Year Total Returns for Class A1 as of 12/31 each year
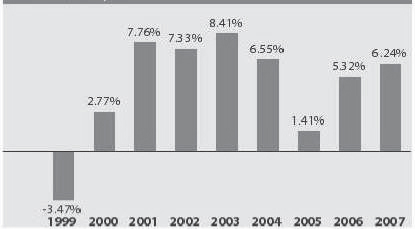
Best and Worst Quarters
| | | | | |
Best Quarter: | | Q2 2003 | | 4.16 | % |
Worst Quarter: | | Q2 2004 | | -1.96 | % |
The Fund’s year-to-date performance through December 31, 2007, was 6.24%.
Average Annual Total Returns
as of 12/31/07
| | | | | | | |
| | | 1 year | | 5 years | | Life of Fund1 | |
Class A1 | | | | | | | |
Returns Before Taxes | | 1.50% | | 4.60% | | 4.27% | |
Returns After Taxes on Distributions2 | | -0.24% | | 2.59% | | 1.90% | |
Returns After Taxes on Distributions and Sale of Fund Shares2 | | 0.94% | | 2.73% | | 2.14% | |
Class B1 Returns Before Taxes | | -0.50% | | 4.44% | | 4.01% | |
Class C1 Returns Before Taxes | | 4.41% | | 4.75% | | 4.00% | |
Lehman Brothers U.S. Universal Bond Index3 (reflects no deduction for fees, expenses or taxes) | | 6.50% | | 4.99% | | 6.08% | 4 |
1 | Calendar Year Total Returns in the bar chart do not reflect sales charges. If they did, returns would be lower. Average Annual Total Returns reflect applicable sales charges. Class A, Class B and Class C shares incepted on July 13, 1998. Returns for the Class A, Class B and Class C shares and the Index shown in the Life of Fund column are as of the inception date. |
2 | After-tax returns are calculated using the historical highest individual federal marginal income tax rates and do not reflect the impact of state, local or foreign taxes. Actual after-tax returns depend on an investor’s tax situation and may differ from those shown, and after-tax returns shown are not relevant to tax-exempt |
E-7
| | investors or investors who hold their Fund shares through tax-deferred arrangements, such as 401(k) Plans or Individual Retirement Accounts. After-tax returns are shown only for Class A shares. After-tax returns for the Class B shares and Class C shares will vary. |
3 | The Lehman Brothers U.S. Universal Bond Index is an unmanaged market value-weighted performance benchmark for the U.S. dollar denominated bond market, which includes investment-grade, high yield, and emerging market debt securities with maturities of one year or more. You cannot invest directly in an index. |
4 | Performance for the Lehman Brothers U.S. Universal Bond Index is as of July 31, 1998, the nearest date to the Fund’s inception date for which data is available. |
E-8
Income Plus Fund
Performance
The following information shows you how the Fund has performed and illustrates the variability of the Fund’s returns over time. The Fund’s average annual total returns are compared to the performance of an appropriate broad-based index. Please remember that past performance before and after taxes is no guarantee of future results.
Calendar Year Total Returns for Investor Class1 as of 12/31 each year
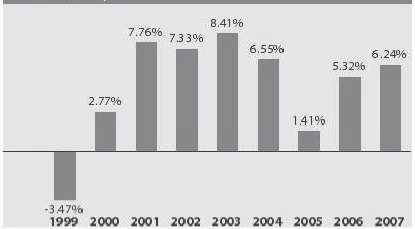
Best and Worst Quarters
| | | | | |
Best Quarter: | | Q2 2003 | | 4.16 | % |
Worst Quarter: | | Q2 2004 | | -1.96 | % |
The Fund’s year-to-date performance through December 31, 2007, was 6.24%.
Average Annual Total Returns
as of 12/31/07
| | | | | | | | | |
| | | 1 year | | | 5 years | | | Life of Fund1 | |
Investor Class1 | | | | | | | | | |
Returns Before Taxes | | 1.50 | % | | 4.60 | % | | 4.27 | % |
Returns After Taxes on Distributions2 | | -0.24 | % | | 2.59 | % | | 1.90 | % |
Returns After Taxes on Distributions and Sale of Fund Shares2 | | 0.94 | % | | 2.73 | % | | 2.14 | % |
Lehman Brothers U.S. Universal Bond Index3 (reflects no deduction for fees, expenses or taxes) | | 6.50 | % | | 4.99 | % | | 6.08 | %4 |
1 | Performance shown for the Investor Class reflects the performance of the Class A shares, and includes sales charges and expenses that are not applicable to and are higher than those of the Investor Class shares. The Class A shares annual returns are substantially similar to what the Investor Class annual returns would be because the Class A and Institutional Class shares are invested in the same portfolio and their returns differ only to the extent that they do not have the same sales charges and expenses. The Class A shares incepted on July 13, 1998. Returns for the Class A shares and the Index shown in the Life of Fund column are as of the Fund inception date. |
2 | After-tax returns are calculated using the historical highest individual federal marginal income tax rates and do not reflect the impact of state, local or foreign taxes. Actual after-tax returns depend on an investor’s tax |
E-9
| | situation and may differ from those shown, and after-tax returns shown are not relevant to tax-exempt investors or investors who hold their Fund shares through tax-deferred arrangements, such as 401(k) Plans or Individual Retirement Accounts |
3 | The Lehman Brothers U.S. Universal Bond Index is an unmanaged market value-weighted performance benchmark for the U.S. dollar denominated bond market, which includes investment-grade, high yield, and emerging market debt securities with maturities of one year or more. You cannot invest directly in an index. |
4 | Performance for the Lehman Brothers U.S. Universal Bond Index is as of July 31, 1998, the nearest date to the Fund’s inception date for which data is available. |
E-10
Income Plus Fund
Performance
The following information shows you how the Fund has performed and illustrates the variability of the Fund’s returns over time. The Fund’s average annual total returns are compared to the performance of an appropriate broad-based index. Please remember that past performance before and after taxes is no guarantee of future results.
Calendar Year Total Returns for Institutional Class1 as of 12/31 each year
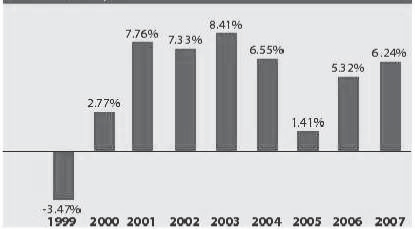
Best and Worst Quarters
| | | | | |
Best Quarter: | | Q2 2003 | | 4.16 | % |
Worst Quarter: | | Q2 2004 | | -1.96 | % |
The Fund’s year-to-date performance through December 31, 2007, was 6.24%.
Average Annual Total Returns
as of 12/31/07
| | | | | | | | | |
| | | 1 year | | | 5 years | | | Life of Fund1 | |
Institutional Class1 | | | | | | | | | |
Returns Before Taxes | | 1.50 | % | | 4.60 | % | | 4.27 | % |
Returns After Taxes on Distributions2 | | -0.24 | % | | 2.59 | % | | 1.90 | % |
Returns After Taxes on Distributions and Sale of Fund Shares2 | | 0.94 | % | | 2.73 | % | | 2.14 | % |
Lehman Brothers U.S. Universal Bond Index3 (reflects no deduction for fees, expenses or taxes) | | 6.50 | % | | 4.99 | % | | 6.08 | %4 |
1 | Performance shown for the Institutional Class reflects the performance of the Class A shares, and includes sales charges and expenses that are not applicable to and are higher than those of the Institutional Class shares. The Class A shares annual returns are substantially similar to what the Institutional Class annual returns would be because the Class A and Institutional Class shares are invested in the same portfolio and their returns differ only to the extent that they do not have the same sales charges and expenses. The Class A shares incepted on July 13, 1998. Returns for the Class A shares and the Index shown in the Life of Fund column are as of the Fund inception date. |
2 | After-tax returns are calculated using the historical highest individual federal marginal income tax rates and do not reflect the impact of state, local or foreign taxes. Actual after-tax returns depend on an investor’s tax |
E-11
| | situation and may differ from those shown, and after-tax returns shown are not relevant to tax-exempt investors or investors who hold their Fund shares through tax-deferred arrangements, such as 401(k) Plans or Individual Retirement Accounts. |
3 | The Lehman Brothers U.S. Universal Bond Index is an unmanaged market value-weighted performance benchmark for the U.S. dollar denominated bond market, which includes investment-grade, high yield, and emerging market debt securities with maturities of one year or more. You cannot invest directly in an index. |
4 | Performance for the Lehman Brothers U.S. Universal Bond Index is as of July 31, 1998, the nearest date to the Fund’s inception date for which data is available. |
Financial Highlights
The following tables are intended to help you understand the Funds’ financial performance for the past 5 years. Certain information reflects financial results for a single Fund share. Total returns represent the rate you would have earned (or lost) on an investment in the Fund (assuming reinvestment of all distributions). All performance information, along with the report of independent registered public accounting firm and the Funds’ financial statements, is also contained in the Funds’ annual or semi-annual report, a copy of which is available upon request.
Income Plus Fund
Class A Shares — Commenced on July 13, 1998
For a share outstanding throughout each period
| | | | | | | | | | | | | | | | | | | | | | | | |
For the period ended: | | November 30,
2007
(unaudited) | | | May 31,
2007 | | | May 31,
2006 | | | May 31,
2005 | | | May 31,
2004 | | | May 31,
2003 | |
Net asset value, beginning of period | | $ | 10.65 | | | $ | 10.49 | | | $ | 10.99 | | | $ | 10.84 | | | $ | 11.31 | | | $ | 10.81 | |
Income from investment operations: | | | | | | | | | | | | | | | | | | | | | | | | |
Net investment income (loss) | | | 0.25 | | | | 0.53 | 4 | | | 0.47 | 4 | | | 0.57 | | | | 0.55 | | | | 0.59 | |
Net realized and unrealized gain (loss) on investments | | | 0.20 | | | | 0.19 | | | | (0.37 | ) | | | 0.20 | | | | (0.39 | ) | | | 0.61 | |
Total from investment operations | | | 0.45 | | | | 0.72 | | | | 0.10 | | | | 0.77 | | | | 0.16 | | | | 1.20 | |
Less distributions: | | | | | | | | | | | | | | | | | | | | | | | | |
Distributions from net investment income | | | (0.26 | ) | | | (0.56 | ) | | | (0.60 | ) | | | (0.62 | ) | | | (0.63 | ) | | | (0.70 | ) |
Distributions from net realized gain | | | 0.00 | | | | 0.00 | | | | 0.00 | | | | 0.00 | | | | 0.00 | | | | 0.00 | |
Total distributions | | | (0.26 | ) | | | (0.56 | ) | | | (0.60 | ) | | | (0.62 | ) | | | (0.63 | ) | | | (0.70 | ) |
Net asset value, end of period | | ($ | 10.84 | ) | | $ | 10.65 | | | $ | 10.49 | | | $ | 10.99 | | | $ | 10.84 | | | $ | 11.31 | |
| | | | | | | | | | | | | | | | | | | | | | | | |
Total return1 | | | 4.30 | % | | | 7.04 | % | | | 0.97 | % | | | 7.27 | % | | | 1.43 | % | | | 11.53 | % |
Ratios/supplemental data: | | | | | | | | | | | | | | | | | | | | | | | | |
Net assets, end of period (000s) | | $ | 39,293 | | | $ | 37,526 | | | $ | 38,995 | | | $ | 42,676 | | | $ | 28,898 | | | $ | 20,815 | |
Ratio of net investment income (loss) to average net assets2 | | | 4.55 | % | | | 4.96 | % | | | 4.38 | % | | | 5.48 | % | | | 4.92 | % | | | 5.42 | % |
Ratio of expenses to average net assets prior to waived fees and reimbursed expenses2 | | | 1.32 | % | | | 1.34 | % | | | 1.29 | % | | | 1.25 | % | | | 1.31 | % | | | 1.32 | % |
Waived fees and reimbursed expenses2 | | | (0.32 | )% | | | (0.34 | )% | | | (0.29 | )% | | | (0.67 | )% | | | (0.63 | )% | | | (0.32 | )% |
Ratio of expenses to average net assets after waived fees and reimbursed expenses2 | | | 1.00 | % | | | 1.00 | % | | | 1.00 | % | | | 0.58 | % | | | 0.68 | % | | | 1.00 | % |
Portfolio turnover rate3 | | | 121 | % | | | 205 | % | | | 171 | % | | | 132 | % | | | 185 | % | | | 130 | % |
E-12
1 | Total returns do not include any sales charges, and would have been lower had certain expenses not been waived or reimbursed during the periods shown. |
2 | During each period, various fees and/or expenses were waived and/or reimbursed. The ratio of gross expenses to average net assets reflects the expense ratio in the absence of any waivers and/or reimbursements. |
3 | Calculated on the basis of the Fund as a whole without distinguishing between the classes of shares issued. |
4 | Per share numbers have been calculated using the average share method, which more appropriately represents the per share data for the period, because the use of undistributed income method did not accord with results of operations. |
E-13
High Income Fund
Performance
The following information shows you how the Fund has performed and illustrates the variability of the Fund’s returns over time. The Fund’s average annual total returns are compared to the performance of an appropriate broad-based index. Please remember that past performance before and after taxes is no guarantee of future results.
Effective April 11, 2005, the Strong family of funds reorganized into the Wells Fargo Advantage Funds. As part of this transaction, the High Income Fund was organized as the successor fund to the Strong High-Yield Bond Fund.
Calendar Year Total Returns for Class A1 as of 12/31 each year. (Effective on or about June 20, 2008, the Advisor Class shares of the High Income Fund will be renamed the Class A shares and modified to assume the features and attributes of Class A shares. See “Overview” in “Proposal: Approval of an Agreement and Plan of Reorganization” section for more information).
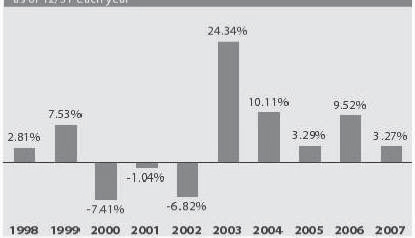
Best and Worst Quarter
| | | | | |
Best Quarter: | | Q2 2003 | | 7.79 | % |
Worst Quarter: | | Q2 2002 | | -9.04 | % |
The Fund’s year-to-date performance through December 31, 2007, was 3.27%.
Average Annual Total Returns
as of 12/31/07
| | | | | | | | | |
| | | 1 year | | | 5 years | | | 10 years | |
Class A1 | | | | | | | | | |
Returns Before Taxes | | -1.38 | % | | 8.84 | % | | 3.72 | % |
Returns After Taxes on Distributions2 | | 0.77 | % | | 7.18 | % | | 0.86 | % |
Returns After Taxes on Distributions and Sale of Fund Shares2 | | 2.11 | % | | 6.91 | % | | 1.45 | % |
Class B1 Returns Before Taxes | | -2.53 | % | | 8.87 | % | | 3.63 | % |
Class C1 Returns Before Taxes | | 1.47 | % | | 9.15 | % | | 3.63 | % |
Lehman Brothers U.S. Corporate High Yield Bond Index3 (reflects no deduction for expenses or taxes) | | 1.87 | % | | 10.90 | % | | 5.51 | % |
E-14
1 | Class A shares incepted on February 29, 2000 (effective on or about June 20, 2008, the Advisor Class shares will be renamed Class A shares). Performance shown from April 11, 2005 through December 31, 2007 reflects the expenses of the Advisor Class shares, adjusted to reflect Class A sales charges. Performance shown from February 29, 2000 through April 10, 2005 for the Class A shares reflects the performance of the Advisor Class shares of the Strong High-Yield Bond Fund, the predecessor fund, adjusted to reflect Class A sales charges. Performance shown prior to February 29, 2000 of the Class A shares, reflects the performance of the Investor Class shares of the predecessor fund, adjusted to reflect Advisor Class expenses and Class A sales charges. |
2 | After-tax returns are calculated using the historical highest individual federal marginal income tax rates and do not reflect the impact of state, local or foreign taxes. Actual after-tax returns depend on an investor’s tax situation and may differ from those shown, and after-tax returns shown are not relevant to tax-exempt investors or investors who hold their Fund shares through tax-deferred arrangements, such as 401(k) Plans or Individual Retirement Accounts. After-tax returns are shown only for the Class A shares. After-tax returns for the Class B shares and Class C shares will vary. |
3 | The Lehman Brothers U.S. Corporate High Yield Bond Index is an unmanaged, U.S. dollar-denominated, nonconvertible, non-investment grade debt index The Index consists of domestic and corporate bonds rated Ba and below with a minimum outstanding amount of $150 million. You cannot invest directly in an index. |
High Income Fund
Financial Highlights
The following tables are intended to help you understand the Funds’ financial performance for the past 5 years. Certain information reflects financial results for a single Fund share. Total returns represent the rate you would have earned (or lost) on an investment in the Fund (assuming reinvestment of all distributions). All performance information, along with the report of independent registered public accounting firm and the Funds’ financial statements, is also contained in the Funds’ annual or semi-annual report, a copy of which is available upon request.
Advisor Class Shares1 Commenced on February 29, 2000 (Effective on or about June 20, 2008, the Advisor Class shares of the High Income Fund will be renamed the Class A shares and modified to assume the features and attributes of Class A shares. See “Overview” in “Proposal: Approval of an Agreement and Plan of Reorganization” section for more information).
E-15
For a share outstanding throughout each period
| | | | | | | | | | | | | | | | | | | | | | | | | | | | |
For the period ended: | | November 30,
2007
(unaudited) | | | May 31,
2007 | | | May 31,
2006 | | | May 31,
20055 | | | Oct. 31,
2004 | | | Oct. 31,
2003 | | | Oct. 31,
2002 | |
Net asset value, beginning of period | | $ | 7.89 | | | $ | 7.63 | | | $ | 7.63 | | | $ | 7.84 | | | $ | 7.49 | | | $ | 6.31 | | | $ | 7.74 | |
Income from investment operations: | | | | | | | | | | | | | | | | | | | | | | | | | | | | |
Net investment income (loss) | | | 0.27 | | | | 0.55 | | | | 0.53 | | | | 0.30 | | | | 0.53 | | | | 0.55 | | | | 0.77 | |
Net realized and unrealized gain (loss) on investments | | | (0.41 | ) | | | 0.26 | | | | 0.02 | | | | (0.21 | ) | | | 0.35 | | | | 1.18 | | | | (1.43 | ) |
Total from investment operations | | | (0.14 | ) | | | 0.81 | | | | 0.55 | | | | 0.09 | | | | 0.88 | | | | 1.73 | | | | (0.66 | ) |
Less distributions: | | | | | | | | | | | | | | | | | | | | | | | | | | | | |
Distributions from net investment income | | | (0.27 | ) | | | (0.55 | ) | | | (0.55 | ) | | | (0.30 | ) | | | (0.53 | ) | | | (0.55 | ) | | | (0.77 | ) |
Distributions from net realized gain | | | 0.00 | | | | 0.00 | | | | 0.00 | | | | 0.00 | | | | 0.00 | | | | 0.00 | | | | 0.00 | |
Total distributions | | | (0.27 | ) | | | (0.55 | ) | | | (0.55 | ) | | | (0.30 | ) | | | (0.53 | ) | | | (0.55 | ) | | | (0.77 | ) |
Net asset value, end of period | | $ | 7.48 | | | $ | 7.89 | | | $ | 7.63 | | | $ | 7.63 | | | $ | 7.84 | | | $ | 7.49 | | | $ | 6.31 | |
| | | | | | | | | | | | | | | | | | | | | | | | | | | | |
Total return2 | | | (1.79 | )% | | | 10.96 | % | | | 7.34 | % | | | 1.16 | % | | | 12.11 | % | | | 28.39 | % | | | (9.44 | )% |
Ratios/supplemental data: | | | | | | | | | | | | | | | | | | | | | | | | | | | | |
Net assets, end of period (000s) | | $ | 107,573 | | | $ | 115,254 | | | $ | 113,433 | | | $ | 17,681 | | | $ | 22,315 | | | $ | 29,587 | | | $ | 17,257 | |
Ratio of net investment income (loss) to average net assets4 | | | 7.03 | % | | | 7.07 | % | | | 6.39 | % | | | 6.59 | % | | | 6.90 | % | | | 7.74 | % | | | 10.45 | % |
Ratio of expenses to average net assets prior to waived fees and reimbursed expenses4 | | | 1.18 | % | | | 1.16 | % | | | 1.17 | % | | | 1.20 | %2 | | | 1.20 | % | | | 1.15 | % | | | 1.20 | % |
Waived fees and reimbursed expenses4 | | | (0.32 | )% | | | (0.30 | )% | | | (0.30 | )% | | | (0.14 | )% | | | (0.07 | )% | | | (0.04 | )% | | | (0.07 | )% |
Ratio of expenses to average net assets after waived fees and reimbursed expenses4 | | | 0.86 | % | | | 0.86 | % | | | 0.87 | % | | | 1.06 | % | | | 1.13 | % | | | 1.11 | % | | | 1.13 | % |
Portfolio turnover rate6 | | | 27 | % | | | 82 | % | | | 98 | % | | | 52 | % | | | 133 | % | | | 172 | % | | | 120 | % |
1 | Class B and Class C shares incepted on March 31, 2008. Performance shown reflects that of the Advisor Class shares. |
2 | Total returns do not include any sales charges, and would have been lower had certain expenses not been waived or reimbursed during the periods shown. Total returns for periods of less than one year are not annualized. |
3 | Ratios shown for periods of less than one year are annualized. |
4 | During each period, various fees and expenses were waived and/or reimbursed. The ratio of gross expenses to average net assets reflects the expense ratio in the absence of any waivers and/or reimbursements. |
5 | In 2005, the Fund changed its fiscal year end from October 31 to May 31. Information is shown for a 7-month period from November 1, 2004 to May 31, 2005. |
6 | Calculated on the basis of the Fund as a whole without distinguishing between the classes of shares issued. |
E-16
Intermediate Government Income Fund
Performance
The following information shows you how the Fund has performed and illustrates the variability of the Fund’s returns over time. The Fund’s average annual total returns are compared to the performance of an appropriate broad-based index. Please remember that past performance before and after taxes is no guarantee of future results.
Calendar Year Total Returns for the Administrator Class1 as of 12/31 each year
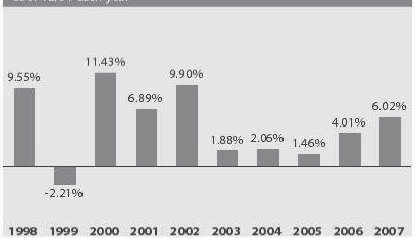
Best and Worst Quarter
| | | | | |
Best Quarter: | | Q3 1998 | | 6.00 | % |
Worst Quarter: | | Q2 2004 | | -2.45 | % |
The Fund’s year-to-date performance through December 31, 2007, was 6.02%.
Average Annual Total Returns
as of 12/31/07
| | | | | | | | | |
| | | 1 year | | | 5 years | | | 10 years | |
Administrator Class1 | | | | | | | | | |
Returns Before Taxes | | 6.02 | % | | 3.07 | % | | 5.02 | % |
Returns After Taxes on Distributions2 | | 4.29 | % | | 1.44 | % | | 2.95 | % |
Returns After Taxes on Distributions and Sale of Fund Shares2 | | 3.88 | % | | 1.66 | % | | 3.01 | % |
Lehman Brothers Intermediate U.S. Government Bond Index3 (reflects no deduction for expenses or taxes) | | 8.47 | % | | 3.69 | % | | 5.55 | % |
1 | Administrator Class shares incepted on November 11, 1994. Prior to April 11, 2005, the Administrator Class was named the Institutional Class. |
2 | After-tax returns are calculated using the historical highest individual federal marginal income tax rates and do not reflect the impact of state, local or foreign taxes. Actual after-tax returns depend on an investor’s tax situation and may differ from those shown, and after-tax returns shown are not relevant to tax-exempt investors or investors who hold their Fund shares through tax-deferred arrangements, such as 401(k) Plans or Individual Retirement Accounts. |
3 | The Lehman Brothers Intermediate U.S. Government Bond Index is an unmanaged index composed of U.S. Government securities with maturities in the one- to ten-year range, including securities issued by the U.S. Treasury and U.S. Government agencies. You cannot invest directly in an index. |
E-17
Financial Highlights
The following tables are intended to help you understand the Funds’ financial performance for the past 5 years. Certain information reflects financial results for a single Fund share. Total returns represent the rate you would have earned (or lost) on an investment in the Fund (assuming reinvestment of all distributions). All performance information, along with the report of independent registered public accounting firm and the Funds’ financial statements, is also contained in the Funds’ annual or semi-annual report, a copy of which is available upon request.
Intermediate Government Income Fund
Administrator Class1 Shares — Commenced on November 11, 1994
For a share outstanding throughout each period
| | | | | | | | | | | | | | | | | | | | | | | | |
For the period ended: | | Nov. 30,
2007
(unaudited) | | | May 31,
2007 | | | May 31,
2006 | | | May 31,
2005 | | | May 31,
2004 | | | May 31,
2003 | |
Net asset value, beginning of period | | $ | 10.55 | | | $ | 10.50 | | | $ | 10.96 | | | $ | 10.94 | | | $ | 11.69 | | | $ | 11.19 | |
Income from investment operations: | | | | | | | | | | | | | | | | | | | | | | | | |
Net investment income (loss) | | | 0.23 | | | | 0.44 | 5 | | | 0.41 | 5 | | | 0.39 | | | | 0.33 | | | | 0.44 | |
Net realized and unrealized gain (loss) on investments | | | 0.24 | | | | 0.10 | | | | (0.42 | ) | | | 0.10 | | | | (0.53 | ) | | | 0.68 | |
Total from investment operations | | | 0.47 | | | | 0.54 | | | | (0.01 | ) | | | 0.49 | | | | (0.20 | ) | | | 1.12 | |
Less distributions: | | | | | | | | | | | | | | | | | | | | | | | | |
Distributions from net investment income | | | (0.25 | ) | | | (0.49 | ) | | | (0.45 | ) | | | (0.47 | ) | | | (0.55 | ) | | | (0.62 | ) |
Distributions from net realized gain | | | 0.00 | | | | 0.00 | | | | 0.00 | | | | 0.00 | | | | 0.00 | | | | 0.00 | |
Total distributions | | | (0.25 | ) | | | (0.49 | ) | | | (0.45 | ) | | | (0.47 | ) | | | (0.55 | ) | | | (0.62 | ) |
Net asset value, end of period | | $ | 10.77 | | | $ | 10.55 | | | $ | 10.50 | | | $ | 10.96 | | | $ | 10.94 | | | $ | 11.69 | |
| | | | | | | | | | | | | | | | | | | | | | | | |
Total return2 | | | 4.52 | % | | | 5.25 | % | | | (0.07 | )% | | | 4.53 | % | | | (1.77 | )% | | | 10.20 | % |
Ratios/supplemental data: | | | | | | | | | | | | | | | | | | | | | | | | |
Net assets, end of period (000s) | | $ | 227,283 | | | $ | 244,227 | | | $ | 399,315 | | | $ | 394,194 | | | $ | 397,390 | | | $ | 472,024 | |
Ratio of net investment income (loss) to average net assets3 | | | 4.24 | % | | | 4.18 | % | | | 3.80 | % | | | 3.53 | % | | | 3.23 | % | | | 3.74 | % |
Ratio of expenses to average net assets prior to waived fees and reimbursed expenses3 | | | 0.93 | % | | | 0.91 | % | | | 0.90 | % | | | 0.76 | % | | | 0.80 | % | | | 0.77 | % |
Waived fees and reimbursed expenses3 | | | (0.23 | )% | | | (0.21 | )% | | | (0.20 | )% | | | (0.06 | )% | | | (0.10 | )% | | | (0.08 | )% |
Ratio of expenses to average net assets after waived fees and reimbursed expenses3 | | | 0.70 | % | | | 0.70 | % | | | 0.70 | % | | | 0.70 | % | | | 0.70 | % | | | 0.69 | % |
Portfolio turnover rate4 | | | 17 | % | | | 142 | % | | | 153 | % | | | 277 | % | | | 178 | % | | | 139 | % |
1 | Formerly named the Institutional Class. |
2 | Total returns do not include any sales charges, and would have been lower had certain expenses not been waived or reimbursed during the periods shown. Returns for periods less than one year are not annualized. |
3 | During each period, various fees and/or expenses were waived and/or reimbursed. The ratio of gross expenses to average net assets reflects the expense ratio in the absence of any waivers and/or reimbursements. |
4 | Calculated on the basis of the Fund as a whole without distinguishing between the classes of shares issued. |
Per share numbers have been calculated using the average share method, which more appropriately represents the per share data for the period, because the use of undistributed income method did not accord with results of operations.
E-18
Government Securities Fund
Performance
The following information shows you how the Fund has performed and illustrates the variability of the Fund’s returns over time. The Fund’s average annual total returns are compared to the performance of an appropriate broad-based index. Please remember that past performance before and after taxes is no guarantee of future results.
Effective April 11, 2005, the Strong family of funds reorganized into the Wells Fargo Advantage Funds. As part of this transaction, the Government Securities Fund was organized as the successor fund to the Strong Government Securities Fund.
Calendar Year Total Returns for the Class A1 as of 12/31 each year (Effective on or about June 20, 2008, the Advisor Class shares of the Government Securities Fund will be renamed the Class A shares and modified to assume the features and attributes of Class A shares. See “Overview” in “Proposal: Approval of an Agreement and Plan of Reorganization” section for more information).
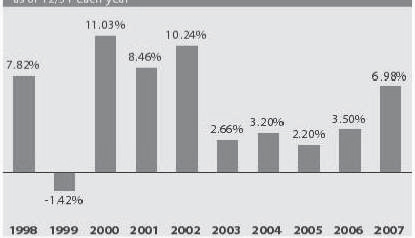
Best and Worst Quarter
| | | | | |
Best Quarter: | | Q3 2002 | | 5.58 | % |
Worst Quarter: | | Q2 2004 | | -2.81 | % |
The Fund’s year-to-date performance through December 31, 2007, was 6.98%.
Average Annual Total Returns
as of 12/31/07
| | | | | | | | | |
| | | 1 year | | | 5 years | | | 10 years | |
Returns Before Taxes | | 2.17 | % | | 2.74 | % | | 4.92 | % |
Returns After Taxes on Distributions2 | | 1.78 | % | | 2.46 | % | | 3.38 | % |
Returns After Taxes on Distributions and Sale of Fund Shares2 | | 2.24 | % | | 2.60 | % | | 3.42 | % |
Class B1 Returns Before Taxes | | 1.13 | % | | 2.41 | % | | 4.52 | % |
Class C1 Returns Before Taxes | | 5.13 | % | | 2.77 | % | | 4.52 | % |
Lehman Brothers Intermediate U.S. Government Bond Index3 (reflects no deduction for expenses or taxes) | | 3.84 | % | | 3.92 | % | | 5.48 | % |
Lehman Brothers U.S. Aggregate Excluding Credit Bond Index4 (reflects no deduction for fees, expenses or taxes) | | 4.36 | % | | 4.76 | % | | N/A | |
E-19
1 | Class A shares incepted on August 31, 1999 (effective on or about June 20, 2008, the Advisor Class shares will be renamed Class A shares). Performance shown from April 11, 2005 through December 31, 2007 reflects the expenses of the Advisor Class shares, adjusted to reflect Class a sales charges. Performance shown from August 31, 1999 through April 10, 2005 for the Class A shares reflects the performance of the Advisor Class shares of the Strong Government Securities Fund, the predecessor fund, adjusted to reflect Class A sales charges. Performance shown prior to August 31, 1999 of the Class A shares reflects the performance of the Investor Class shares of the predecessor fund, adjusted to reflect Advisor Class expenses and Class A sales charges. |
2 | After-tax returns are calculated using the historical highest individual federal marginal income tax rates and do not reflect the impact of state, local or foreign taxes. Actual after-tax returns depend on an investor’s tax situation and may differ from those shown, and after-tax returns shown are not relevant to tax-exempt investors or investors who hold their Fund shares through tax-deferred arrangements, such as 401(k) Plans or Individual Retirement Accounts. After-tax returns are shown only for the Class A shares. After-tax returns for the Class B and Class C shares will vary. |
3 | The Lehman Brothers Intermediate U.S. Government Bond Index is an unmanaged index composed of U.S. Government securities with maturities in the one- to ten-year range, including securities issued by the U.S. Treasury and U.S. Government agencies. You cannot invest directly in an index. |
4 | The Lehman Brothers U.S. Aggregate Excluding Credit Bond Index is composed of the Lehman Brothers U.S. Government Bond Index and the Lehman Brothers U.S. Mortgage-Backed Securities Index and includes Treasury issues, agency issues, and mortgage-backed securities. The limited performance history of the Lehman Brothers U.S. Aggregate Excluding Credit Bond Index does not allow for comparison to all periods of the Fund’s performance. This Index has an inception date of May 1, 2001.You cannot invest directly in an index. |
E-20
Government Securities Fund
Performance
The following information shows you how the Fund has performed and illustrates the variability of the Fund’s returns over time. The Fund’s average annual total returns are compared to the performance of an appropriate broad-based index. Please remember that past performance before and after taxes is no guarantee of future results.
Effective April 11, 2005, the Strong family of funds reorganized into the Wells Fargo Advantage Funds. As part of this transaction, the Government Securities Fund was organized as the successor fund to the Strong Government Securities Fund.
Calendar Year Total Returns for the Administrator Class1 as of 12/31 each year
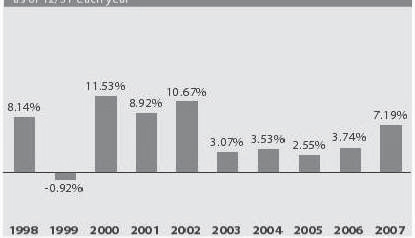
Best and Worst Quarter
| | | | | |
Best Quarter: | | Q3 2002 | | 5.68 | % |
Worst Quarter: | | Q2 2004 | | -2.71 | % |
The Fund’s year-to-date performance through December 31, 2007, was 7.19%.
Average Annual Total Returns
as of 12/31/07
| | | | | | | | | |
| | | 1 year | | | 5 years | | | 10 years | |
Administrator Class1 | | | | | | | | | |
Returns Before Taxes | | 7.19 | % | | 4.00 | % | | 5.77 | % |
Returns After Taxes on Distributions2 | | 5.33 | % | | 2.17 | % | | 3.48 | % |
Returns After Taxes on Distributions and Sale of Fund Shares2 | | 4.63 | % | | 2.34 | % | | 3.53 | % |
Lehman Brothers Intermediate U.S. Government Bond Index3 (reflects no deduction for expenses or taxes) | | 8.47 | % | | 3.69 | % | | 5.55 | % |
Lehman Brothers U.S. Aggregate Excluding Credit Bond Index4 (reflects no deduction for fees, expenses or taxes) | | 7.50 | % | | 4.25 | % | | N/A | |
1 | Administrator Class shares incepted on April 11, 2005. Performance shown prior to the inception of the Administrator Class shares reflects the performance of the Institutional Class shares of the Strong Government Securities Fund, the predecessor fund, adjusted to reflect Administrator Class expenses. |
E-21
| | Performance shown prior to August 31, 1999 for the Administrator Class shares reflects the performance of the Investor Class shares of the predecessor fund, and includes expenses that are not applicable to and are higher than those of the Administrator Class shares. |
2 | After-tax returns are calculated using the historical highest individual federal marginal income tax rates and do not reflect the impact of state, local or foreign taxes. Actual after-tax returns depend on an investor’s tax situation and may differ from those shown, and after-tax returns shown are not relevant to tax-exempt investors or investors who hold their Fund shares through tax-deferred arrangements, such as 401(k) Plans or Individual Retirement Accounts. |
3 | The Lehman Brothers Intermediate U.S. Government Bond Index is an unmanaged index composed of U.S. Government securities with maturities in the one- to ten-year range, including securities issued by the U.S. Treasury and U.S. Government agencies. You cannot invest directly in an index. |
4 | The Lehman Brothers U.S. Aggregate Excluding Credit Bond Index is composed of the Lehman Brothers U.S. Government Bond Index and the Lehman Brothers U.S. Mortgage-Backed Securities Index and includes Treasury issues, agency issues, and mortgage-backed securities. The limited performance history of the Lehman Brothers U.S. Aggregate Excluding Credit Bond Index does not allow for comparison to all periods of the Fund’s performance. This Index has an inception date of May 1, 2001. You cannot invest directly in an index. |
Financial Highlights
The following tables are intended to help you understand the Funds’ financial performance for the past 5 years. Certain information reflects financial results for a single Fund share. Total returns represent the rate you would have earned (or lost) on an investment in the Fund (assuming reinvestment of all distributions). All performance information, along with the report of independent registered public accounting firm and the Funds’ financial statements, is also contained in the Funds’ annual or semi-annual report, a copy of which is available upon request.
Government Securities Fund
Advisor Class Shares Commenced on August 31, 1999 (Effective on or about June 20, 2008, the Advisor Class shares of the Government Securities Fund will be renamed the Class A shares and modified to assume the features and attributes of Class A shares. See “Overview” in “Proposal: Approval of an Agreement and Plan of Reorganization” section for more information).
E-22
For a share outstanding throughout each period
| | | | | | | | | | | | | | | | | | | | | | | | | | | | |
For the period ended: | | November 30,
2007
(unaudited) | | | May 31,
2007 | | | May 31,
2006 | | | May 31,
20053 | | | Oct. 31,
2004 | | | Oct. 31,
2003 | | | Oct. 31,
2002 | |
| | | | | | | |
Net asset value, beginning of period | | $ | 10.22 | | | $ | 10.15 | | | $ | 10.77 | | | $ | 10.93 | | | $ | 11.05 | | | $ | 11.35 | | | $ | 11.25 | |
Income from investment operations: | | | | | | | | | | | | | | | | | | | | | | | | | | | | |
Net investment income (loss) | | | 0.24 | | | | 0.48 | | | | 0.43 | | | | 0.20 | | | | 0.25 | | | | 0.25 | | | | 0.42 | |
Net realized and unrealized gain (loss) on investments | | | 0.34 | | | | 0.09 | | | | (0.51 | ) | | | 0.00 | 4 | | | 0.21 | | | | 0.07 | | | | 0.30 | |
Total from investment operations | | | 0.58 | | | | 0.57 | | | | (0.08 | ) | | | 0.20 | | | | 0.46 | | | | 0.32 | | | | 0.72 | |
Less distributions: | | | | | | | | | | | | | | | | | | | | | | | | | | | | |
Distributions from net investment income | | | (0.25 | ) | | | (0.50 | ) | | | (0.48 | ) | | | (0.24 | ) | | | (0.35 | ) | | | (0.36 | ) | | | (0.46 | ) |
Distributions from net realized gain | | | 0.00 | | | | 0.00 | | | | (0.06 | ) | | | (0.12 | ) | | | (0.23 | ) | | | (0.26 | ) | | | (0.16 | ) |
Total distributions | | | (0.25 | ) | | | (0.50 | ) | | | (0.54 | ) | | | (0.36 | ) | | | (0.58 | ) | | | (0.62 | ) | | | (0.62 | ) |
Net asset value, end of period | | $ | 10.55 | | | $ | 10.22 | | | $ | 10.15 | | | $ | 10.77 | | | $ | 10.93 | | | $ | 11.05 | | | $ | 11.35 | |
| | | | | | | | | | | | | | | | | | | | | | | | | | | | |
Total return1 | | | 5.76 | % | | | 5.71 | % | | | (0.74 | )% | | | 1.85 | % | | | 4.27 | % | | | 2.89 | % | | | 6.77 | % |
Ratios/supplemental data: | | | | | | | | | | | | | | | | | | | | | | | | | | | | |
Net assets, end of period (000s) | | $ | 62,813 | | | $ | 59,760 | | | $ | 60,242 | | | $ | 69,267 | | | $ | 76,283 | | | $ | 120,753 | | | $ | 106,721 | |
Ratio of net investment income (loss) to average net assets2 | | | 4.69 | % | | | 4.64 | % | | | 4.14 | % | | | 3.33 | % | | | 2.57 | % | | | 2.33 | % | | | 3.68 | % |
Ratio of expenses to average net assets prior to waived fees and reimbursed expenses2 | | | 1.05 | % | | | 1.06 | % | | | 1.05 | % | | | 1.16 | %5 | | | 1.18 | % | | | 1.12 | % | | | 1.14 | % |
Waived fees and reimbursed expenses2 | | | (0.15 | )% | | | (0.14 | )% | | | (0.10 | )% | | | (0.09 | )% | | | (0.06 | )% | | | (0.01 | )% | | | (0.04 | )% |
Ratio of expenses to average net assets after waived fees and reimbursed expenses2 | | | 0.90 | % | | | 0.92 | % | | | 0.95 | % | | | 1.07 | % | | | 1.12 | % | | | 1.11 | % | | | 1.10 | % |
Portfolio turnover rate6 | | | 105 | % | | | 159 | % | | | 207 | % | | | 139 | % | | | 390 | % | | | 531 | % | | | 519 | % |
1 | Total returns do not include any sales charges, and would have been lower had certain expenses not been waived or reimbursed during the periods shown. Total returns for periods of less than one year are not annualized. |
2 | During each period, various fees and expenses were waived and/or reimbursed. The ratio of gross expenses to average net assets reflects the expense ratio in the absence of any waivers and/or reimbursements. |
3 | In 2005, the Fund changed its fiscal year end from October 31 to May 31. Information is shown for a 7-month period from November 1, 2004 to May 31, 2005. |
4 | Amount calculated is less than $0.005. |
5 | Ratios shown for periods of less than one year are annualized. |
6 | Calculated on the basis of the Fund as a whole without distinguishing between the classes of shares issued. |
E-23
Financial Highlights
The following tables are intended to help you understand the Funds’ financial performance for the past 5 years. Certain information reflects financial results for a single Fund share. Total returns represent the rate you would have earned (or lost) on an investment in the Fund (assuming reinvestment of all distributions). All performance information, along with the report of independent registered public accounting firm and the Funds’ financial statements, is also contained in the Funds’ annual or semi-annual report, a copy of which is available upon request.
Government Securities Fund
Class C Shares — Commenced on December 26, 2002
For a share outstanding throughout each period
| | | | | | | | | | | | | | | | | | | | | | | | |
For the period ended: | | November 30,
2007
(unaudited) | | | May 31,
2007 | | | May 31,
2006 | | | May 31,
20055 | | | Oct. 31,
2004 | | | Oct. 31,
20032 | |
| | | | | | |
Net asset value, beginning of period | | $ | 10.22 | | | $ | 10.15 | | | $ | 10.77 | | | $ | 10.92 | | | $ | 11.05 | | | $ | 11.14 | |
Income from investment operations: | | | | | | | | | | | | | | | | | | | | | | | | |
Net investment income (loss) | | | 0.20 | | | | 0.40 | | | | 0.35 | | | | 0.12 | | | | 0.15 | | | | 0.19 | |
Net realized and unrealized gain (loss) on investments | | | 0.33 | | | | 0.09 | | | | (0.50 | ) | | | 0.01 | | | | 0.20 | | | | (0.06 | ) |
Total from investment operations | | | 0.53 | | | | 0.49 | | | | (0.15 | ) | | | 0.13 | | | | 0.35 | | | | 0.13 | |
Less distributions: | | | | | | | | | | | | | | | | | | | | | | | | |
Distributions from net investment income | | | (0.21 | ) | | | (0.42 | ) | | | (0.41 | ) | | | (0.16 | ) | | | (0.25 | ) | | | (0.22 | ) |
Distributions from net realized gain | | | 0.00 | | | | 0.00 | | | | (0.06 | ) | | | (0.12 | ) | | | (0.23 | ) | | | 0.00 | |
Total distributions | | | (0.21 | ) | | | (0.42 | ) | | | (0.47 | ) | | | (0.28 | ) | | | (0.48 | ) | | | (0.22 | ) |
Net asset value, end of period | | $ | 10.54 | | | $ | 10.22 | | | $ | 10.15 | | | $ | 10.77 | | | $ | 10.92 | | | $ | 11.05 | |
| | | | | | | | | | | | | | | | | | | | | | | | |
Total return1 | | | 5.24 | % | | | 4.89 | % | | | (1.48 | )% | | | 1.24 | % | | | 3.20 | % | | | 1.18 | % |
Ratios/supplemental data: | | | | | | | | | | | | | | | | | | | | | | | | |
Net assets, end of period (000s) | | $ | 1.587 | | | $ | 1,335 | | | $ | 1,370 | | | $ | 2,257 | | | $ | 2,979 | | | $ | 2,925 | |
Ratio of net investment income (loss) to average net assets4 | | | 3.89 | % | | | 3.87 | % | | | 3.39 | % | | | 2.14 | % | | | 1.65 | % | | | 1.25 | % |
Ratio of expenses to average net assets prior to waived fees and reimbursed expenses3,4 | | | 1.79 | % | | | 1.81 | % | | | 1.80 | % | | | 2.30 | % | | | 2.10 | % | | | 2.17 | % |
Waived fees and reimbursed expenses4 | | | (0.09 | )% | | | (0.11 | )% | | | (0.10 | )% | | | (0.04 | )% | | | (0.04 | )% | | | (0.06 | )% |
Ratio of expenses to average net assets after waived fees and reimbursed expenses4 | | | 1.70 | % | | | 1.70 | % | | | 1.70 | % | | | 2.26 | % | | | 2.06 | % | | | 2.11 | % |
Portfolio turnover rate6 | | | 105 | % | | | 159 | % | | | 207 | % | | | 139 | % | | | 390 | % | | | 531 | % |
1. | Total returns do not include any sales charges, and would have been lower had certain expenses not been waived or reimbursed during the periods shown. Total returns for periods of less than one year are not annualized. |
2. | For the period from December 26, 2002 (commencement of Class) to October 31, 2003. |
3. | Ratios shown for periods of less than one year are annualized. |
4. | During certain periods, various fees and expenses were waived and/or reimbursed. The ratio of gross expenses to average net assets reflects the expense ratio in the absence of any waivers and/or reimbursements. |
5. | In 2005, the Fund changed its fiscal year end from October 31 to May 31. Information is shown for a 7-month period from November 1, 2004 to May 31, 2005. |
6. | Calculated on the basis of the Fund as a whole without distinguishing between the classes of shares issued. |
E-24
Financial Highlights
The following tables are intended to help you understand the Funds’ financial performance for the past 5 years. Certain information reflects financial results for a single Fund share. Total returns represent the rate you would have earned (or lost) on an investment in the Fund (assuming reinvestment of all distributions). All performance information, along with the report of independent registered public accounting firm and the Funds’ financial statements, is also contained in the Funds’ annual or semi-annual report, a copy of which is available upon request.
Government Securities Fund
Administrator Class Shares — Commenced April 11, 2005
For a share outstanding throughout each period
| | | | | | | | | | | | | | | | |
For the period ended: | | November 30,
2007
(unaudited) | | | May 31,
2007 | | | May 31,
2006 | | | May 31,
20052 | |
Net asset value, beginning of period | | $ | 10.22 | | | $ | 10.15 | | | $ | 10.77 | | | $ | 10.61 | |
Income from investment operations: | | | | | | | | | | | | | | | | |
Net investment income (loss) | | | 0.25 | | | | 0.50 | | | | 0.48 | | | | 0.05 | |
Net realized and unrealized gain (loss) on investments | | | 0.34 | | | | 0.09 | | | | (0.53 | ) | | | 0.17 | |
Total from investment operations | | | 0.59 | | | | 0.59 | | | | (0.05 | ) | | | 0.22 | |
Less distributions: | | | | | | | | | | | | | | | | |
Distributions from net investment income | | | (0.26 | ) | | | (0.52 | ) | | | (0.51 | ) | | | (0.06 | ) |
Distributions from net realized gain | | | 0.00 | | | | 0.00 | | | | (0.06 | ) | | | 0.00 | |
Total distributions | | | (0.26 | ) | | | (0.52 | ) | | | (0.57 | ) | | | (0.06 | ) |
Net asset value, end of period | | $ | 10.55 | | | $ | 10.22 | | | $ | 10.15 | | | $ | 10.77 | |
| | | | | | | | | | | | | | | | |
Total return1 | | | 5.86 | % | | | 5.94 | % | | | (0.49 | )% | | | 2.12 | % |
Ratios/supplemental data: | | | | | | | | | | | | | | | | |
Net assets, end of period (000s) | | $ | 148,059 | | | $ | 117,347 | | | $ | 102,434 | | | $ | 60 | |
Ratio of net investment income (loss) to average net assets5 | | | 4.89 | % | | | 4.87 | % | | | 4.50 | % | | | 3.54 | % |
Ratio of expenses to average net assets prior to waived fees and reimbursed expenses5 | | | 0.87 | % | | | 0.88 | % | | | 0.88 | % | | | 0.83 | %3 |
Waived fees and reimbursed expenses5 | | | (0.17 | )% | | | (0.18 | )% | | | (0.18 | )% | | | (0.16 | )% |
Ratio of expenses to average net assets after waived fees and reimbursed expenses5 | | | 0.70 | % | | | 0.70 | % | | | 0.70 | % | | | 0.67 | % |
Portfolio turnover rate4 | | | 105 | % | | | 159 | % | | | 207 | % | | | 139 | % |
1 | Total returns do not include any sales charges, and would have been lower had certain expenses not been waived or reimbursed during the periods shown. Total returns for periods of less than one year are not annualized. |
2 | In 2005, the Fund changed its fiscal year end from October 31 to May 31. For the period from April 11, 2005 (commencement of Class) to May 31, 2005. |
3 | Ratios shown for periods of less than one year are annualized. |
4 | Calculated on the basis of the Fund as a whole without distinguishing between the classes of shares issued. |
5 | During this period, various fees and expenses were waived and/or reimbursed. The ratio of gross expenses to average net assets reflects the expense ratio in the absence of any waivers and/or reimbursements. |
E-25
Short-Term Municipal Bond Fund
Performance
The following information shows you how the Fund has performed and illustrates the variability of the Fund’s returns over time. The Fund’s average annual total returns are compared to the performance of an appropriate broad-based index. Please remember that past performance before and after taxes is no guarantee of future results.
Effective April 11, 2005, the Strong family of funds reorganized into the Wells Fargo Advantage Funds. As part of this transaction, the Short-Term Municipal Bond Fund was organized as the successor fund to the Strong Short-Term Municipal Bond Fund and the Strong Short-Term High Yield Municipal Fund, with the former being the accounting survivor.
Calendar Year Total Returns for Class C1 as of 12/31 each year
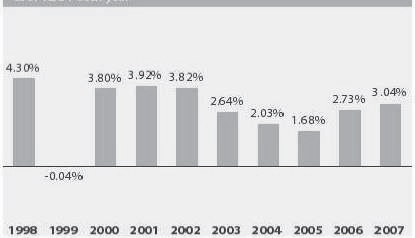
Best and Worst Quarter
| | | | | |
Best Quarter: | | Q2 2002 | | 1.68 | % |
Worst Quarter: | | Q2 1999 | | -1.06 | % |
Average Annual Total Returns
as of 12/31/07
| | | | | | | | | |
| | | 1 year | | | 5 years | | | 10 years | |
Class C1 | | | | | | | | | |
Returns Before Taxes | | 2.04 | % | | 2.42 | % | | 2.78 | % |
Returns After Taxes on Distributions2 | | 2.04 | % | | 2.42 | % | | 2.78 | % |
Returns After Taxes on Distributions and Sale of Fund Shares2 | | 2.39 | % | | 2.43 | % | | 2.88 | % |
Class A1 Returns Before Taxes | | -0.05 | % | | 1.80 | % | | 2.47 | % |
Lehman Brothers 3-Year Municipal Bond Index3 (reflects no deduction for fees, expenses or taxes) | | 5.00 | % | | 2.67 | % | | 3.99 | % |
Lehman Brothers 1- and 3-Year Composite Municipal Bond Index4 (reflects no deduction for fees, expenses or taxes) | | 4.68 | % | | 2.51 | % | | 3.71 | % |
1 | Calendar Year Total Returns in the bar chart do not reflect sales charges. If they did, returns would be lower. Average Annual Total Returns reflect applicable sales charges. Class C shares incepted on |
E-26
| | January 31, 2003. Performance shown prior to April 11, 2005, for the Class C shares reflects the performance of the Class C shares of the Strong Short-Term Municipal Bond Fund, the predecessor fund. Performance shown prior to the inception of the Class C shares reflects the performance of the Investor Class shares of the predecessor fund, adjusted to reflect Class C sales charges and expenses. Performance shown for the Class A shares reflects the performance of the Class C shares, and includes expenses that are not applicable to and are higher than those of Class A shares, adjusted to reflect Class A sales charges. |
2 | After-tax returns are calculated using the historical highest individual federal marginal income tax rates and do not reflect the impact of state, local or foreign taxes. Actual after-tax returns depend on an investor’s tax situation and may differ from those shown, and after-tax returns shown are not relevant to tax-exempt investors or investors who hold their Fund shares through tax-deferred arrangements, such as 401(k) Plans or Individual Retirement Accounts. After-tax returns are shown only for the Class C shares. After-tax returns for the Class A shares will vary. |
3 | The Lehman Brothers 3-Year Municipal Bond Index is the 3-year component of the Lehman Brothers Municipal Bond Index, which is an unmanaged index composed of long-term tax-exempt bonds with a minimum credit rating of Baa. You cannot invest directly in an index. |
4 | The Lehman Brothers 1- and 3-Year Composite Index is a blended index weighted 50% in the Lehman Brothers 1-Year Municipal Bond Index (the 1-2 year component of the Lehman Brothers Municipal Bond Index), and 50% in the Lehman Brothers 3-Year Municipal Bond Index, (the 2-4 year component of the Lehman Brothers Municipal Bond Index). The Lehman Brothers Municipal Bond Index is an unmanaged index composed of long-term tax-exempt bonds with a minimum credit rating of Baa. You cannot invest directly in an index. |
Financial Highlights
The following tables are intended to help you understand the Funds’ financial performance for the past 5 years. Certain information reflects financial results for a single Fund share. Total returns represent the rate you would have earned (or lost) on an investment in the Fund (assuming reinvestment of all distributions). All performance information, along with the report of independent registered public accounting firm and the Funds’ financial statements, is also contained in the Funds’ annual or semi-annual report, a copy of which is available upon request.
E-27
Short-Term Municipal Bond Fund
Class C Shares — Commenced on January 31, 2003
For a share outstanding throughout each period
| | | | | | | | | | | | | | | | | | | | | | | | |
For the period ended: | | December 31,
2007
(unaudited) | | | June 30,
2007 | | | June 30,
2006 | | | June 30,
20054 | | | October 31,
2004 | | | October 31,
20037 | |
Net asset value, beginning of period | | $ | 9.73 | | | $ | 9.73 | | | $ | 9.82 | | | $ | 9.84 | | | $ | 9.83 | | | $ | 9.79 | |
Income from investment operations: | | | | | | | | | | | | | | | | | | | | | | | | |
Net investment income (loss) | | | 0.15 | | | | 0.28 | | | | 0.24 | | | | 0.13 | | | | 0.19 | | | | 0.16 | |
Net realized and unrealized gain (loss) on investments | | | 0.05 | | | | 0.00 | | | | (0.09 | ) | | | (0.02 | ) | | | 0.01 | | | | 0.04 | |
Total income from investment operations | | | 0.20 | | | | 0.28 | | | | 0.15 | | | | 0.11 | | | | 0.20 | | | | 0.20 | |
Less distributions: | | | | | | | | | | | | | | | | | | | | | | | | |
Distributions from net investment income | | | (0.15 | ) | | | (0.28 | ) | | | (0.24 | ) | | | (0.13 | ) | | | (0.19 | ) | | | (0.16 | ) |
Distributions from net realized gain | | | 0.00 | | | | 0.00 | | | | 0.00 | | | | 0.00 | 5 | | | 0.00 | | | | 0.00 | |
Total distributions | | | (0.15 | ) | | | (0.28 | ) | | | (0.24 | ) | | | (0.13 | ) | | | (0.19 | ) | | | (0.16 | ) |
Net asset value, end of period | | $ | 9.78 | | | $ | 9.73 | | | $ | 9.73 | | | $ | 9.82 | | | $ | 9.84 | | | $ | 9.83 | |
| | | | | | | | | | | | | | | | | | | | | | | | |
Total return1 | | | 2.11 | % | | | 2.85 | % | | | 1.57 | % | | | 1.16 | % | | | 2.08 | % | | | 2.10 | % |
Ratios/supplemental data: | | | | | | | | | | | | | | | | | | | | | | | | |
Net assets, end of period (000s) | | $ | 3,589 | | | | 2,847 | | | $ | 4,965 | | | $ | 8,228 | | | $ | 6,982 | | | $ | 2,869 | |
Ratio of net investment income (loss) to average net assets | | | 3.10 | % | | | 2.81 | % | | | 2.46 | % | | | 1.98 | % | | | 1.96 | % | | | 2.05 | % |
Ratio of expenses to average net assets prior to waived fees and reimbursed expenses2 | | | 1.74 | % | | | 1.73 | % | | | 1.74 | % | | | 1.78 | % | | | 1.82 | % | | | 1.91 | % |
Waived fees and reimbursed expenses2 | | | (0.19 | )% | | | (0.18 | )% | | | (0.16 | )% | | | (0.05 | )% | | | (0.03 | )% | | | (0.03 | )% |
Ratio of expenses to average net assets after waived fees and reimbursed expenses2 | | | 1.55 | % | | | 1.55 | % | | | 1.58 | %6 | | | 1.73 | % | | | 1.79 | % | | | 1.88 | % |
Portfolio turnover rate3 | | | 55 | % | | | 126 | % | | | 129 | % | | | 75 | % | | | 69 | % | | | 84 | % |
1 | Total return calculations do not include any sales charges, and would have been lower had certain expenses not been waived or reimbursed during the periods shown. Total returns for periods of less than one year are not annualized. |
2 | During each period, various fees and expenses were waived and/or reimbursed. The ratio of gross expenses to average net assets reflects the expense ratios in the absence of any waivers and/or reimbursements. Ratios shown for periods of less than one year are annualized. |
3 | Calculated on the basis of the Fund as a whole without distinguishing between the classes of shares issued. Portfolio turnover rates shown for periods of less than one year are not annualized. |
4 | In 2005, the Fund changed its fiscal year end from October 31 to June 30. |
5 | Amount calculated is less than $0.005. |
6 | Effective November 1, 2005, the net expense cap changed from 1.60% to 1.55%. However, the net expense reported is the actual expense that occurred during the twelve-month period ended June 30, 2006. |
7 | For the period from January 31, 2003 (commencement of Class) to October 31, 2003. |
E-28
Municipal Bond Fund
Performance
The following information shows you how the Fund has performed and illustrates the variability of the Fund’s returns over time. The Fund’s average annual total returns are compared to the performance of an appropriate broad-based index. Please remember that past performance before and after taxes is no guarantee of future results.
Effective April 11, 2005, the Strong family of funds reorganized into the Wells Fargo Advantage Funds. As part of this transaction, the Municipal Bond Fund was organized as the successor fund to the Strong Municipal Bond Fund and the Strong Advisor Municipal Bond Fund, with the former being the accounting survivor.
Calendar Year Total Returns for Class A1 as of 12/31 each year
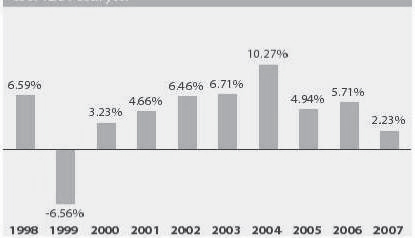
Best and Worst Quarter
| | | | | |
Best Quarter: | | Q3 2004 | | 7.11 | % |
Worst Quarter: | | Q4 1999 | | -3.61 | % |
Average Annual Total Returns
as of 12/31/07
| | | | | | | | | |
| | | 1 year | | | 5 years | | | 10 years | |
Class A1 | | | | | | | | | |
Returns Before Taxes | | -2.33 | % | | 4.97 | % | | 3.86 | % |
Returns After Taxes on Distributions2 | | -2.32 | % | | 4.96 | % | | 3.85 | % |
Returns After Taxes on Distributions and Sale of Fund Shares2 | | -0.09 | % | | 4.89 | % | | 3.93 | % |
Class B1 Returns Before Taxes | | -3.53 | % | | 4.84 | % | | 3.58 | % |
Class C1 Returns Before Taxes | | 0.36 | % | | 5.15 | % | | 3.57 | % |
Lehman Brothers Municipal Bond Index3 (reflects no deduction for fees, expenses or taxes) | | 3.36 | % | | 4.30 | % | | 5.18 | % |
1 | Calendar Year Total Returns in the bar chart do not reflect sales charges. If they did, returns would be lower. Average Annual Total Returns reflect applicable sales charges. Class A, Class B and Class C shares incepted on April 11, 2005. Performance shown prior to the inception of the Class A, Class B and Class C shares reflects the performance of the Investor Class shares of the Strong Municipal Bond Fund, adjusted to reflect Class A, Class B and Class C sales charges and expenses, as applicable. |
E-29
2 | After-tax returns are calculated using the historical highest individual federal marginal income tax rates and do not reflect the impact of state, local or foreign taxes. Actual after-tax returns depend on an investor’s tax situation and may differ from those shown, and after-tax returns shown are not relevant to tax-exempt investors or investors who hold their Fund shares through tax-deferred arrangements, such as 401(k) Plans or Individual Retirement Accounts. After-tax returns are shown only for the Class A shares. After-tax returns for the Class B and Class C shares will vary. |
3 | The Lehman Brothers Municipal Bond Index is an unmanaged index composed of long-term tax-exempt bonds with a minimum credit rating of Baa. You cannot invest directly in an index. |
E-30
Municipal Bond Fund
Performance
The following information shows you how the Fund has performed and illustrates the variability of the Fund’s returns over time. The Fund’s average annual total returns are compared to the performance of an appropriate broad-based index. Please remember that past performance before and after taxes is no guarantee of future results.
Effective April 11, 2005, the Strong family of funds reorganized into the Wells Fargo Advantage Funds. As part of this transaction, the Municipal Bond Fund was organized as the successor fund to the Strong Municipal Bond Fund and the Strong Advisor Municipal Bond Fund, with the former being the accounting survivor.
Calendar Year Total Returns for the Administrator Class1 as of 12/31 each year
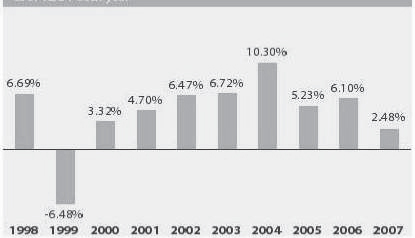
Best and Worst Quarter
| | | | | |
Best Quarter: | | 3Q 2004 | | 7.12 | % |
Worst Quarter: | | 4Q 1999 | | -3.59 | % |
The Fund’s year-to-date performance through December 31, 2007, was 2.48%.
Average Annual Total Returns
as of 12/31/07
| | | | | | | | | |
| | | 1 year | | | 5 years | | | 10 years | |
Administrator Class1 | | | | | | | | | |
Returns Before Taxes | | 2.48 | % | | 6.13 | % | | 4.46 | % |
Returns After Taxes on Distributions2 | | 2.48 | % | | 6.13 | % | | 4.46 | % |
Returns After Taxes on Distributions and Sale of Fund Shares2 | | 3.22 | % | | 5.95 | % | | 4.49 | % |
Lehman Brothers Municipal Bond Index3 (reflects no deduction for expenses or taxes) | | 3.36 | % | | 4.30 | % | | 5.18 | % |
1 | Administrator Class shares incepted on April 11, 2005. Performance shown prior to the inception of the Administrator Class shares reflects the performance of the Investor Class shares of the Strong Municipal Bond Fund, and includes expenses that are not applicable to and are higher than those of the Administrator Class shares. |
E-31
2 | After-tax returns are calculated using the historical highest individual federal marginal income tax rates and do not reflect the impact of state, local or foreign taxes. Actual after-tax returns depend on an investor’s tax situation and may differ from those shown, and after-tax returns shown are not relevant to tax-exempt investors or investors who hold their Fund shares through tax-deferred arrangements, such as 401(k) Plans or Individual Retirement Accounts. |
3 | The Lehman Brothers Municipal Bond Index is an unmanaged index composed of long-term tax-exempt bonds with a minimum credit rating of Baa. You cannot invest directly in an index. |
Financial Highlights
The following tables are intended to help you understand the Funds’ financial performance for the past 5 years. Certain information reflects financial results for a single Fund share. Total returns represent the rate you would have earned (or lost) on an investment in the Fund (assuming reinvestment of all distributions). All performance information, along with the report of independent registered public accounting firm and the Funds’ financial statements, is also contained in the Funds’ annual or semi-annual report, a copy of which is available upon request.
E-32
Municipal Bond Fund
Class A Shares — Commenced on April 11, 2005
For a share outstanding throughout each period
| | | | | | | | | | | | | | | | |
For the period ended: | | December 31,
2007
(unaudited) | | | June 30,
2007 | | | June 30,
2006 | | | June 30,
20054 | |
Net asset value, beginning of period | | $ | 9.50 | | | $ | 9.41 | | | $ | 9.60 | | | $ | 9.43 | |
Income from investment operations: | | | | | | | | | | | | | | | | |
Net investment income (loss) | | | 0.20 | | | | 0.40 | | | | 0.40 | | | | 0.09 | |
Net realized and unrealized gain (loss) on investments | | | (0.04 | ) | | | 0.11 | | | | (0.19 | ) | | | 0.17 | |
Total income from investment operations | | | 0.16 | | | | 0.51 | | | | 0.21 | | | | 0.26 | |
Less distributions: | | | | | | | | | | | | | | | | |
Distributions from net investment income | | | (0.20 | ) | | | (0.40 | ) | | | (0.40 | ) | | | (0.09 | ) |
Distributions from net realized gain | | | 0.00 | | | | (0.02 | ) | | | 0.00 | | | | 0.00 | |
Total distributions | | | (0.20 | ) | | | (0.42 | ) | | | (0.40 | ) | | | (0.09 | ) |
Net asset value, end of period | | $ | 9.46 | | | $ | 9.50 | | | $ | 9.41 | | | $ | 9.60 | |
| | | | | | | | | | | | | | | | |
Total return1 | | | 1.74 | % | | | 5.38 | % | | | 2.20 | % | | | 2.82 | % |
Ratios/supplemental data: | | | | | | | | | �� | | | | | | | |
Net assets, end of period (000s) | | $ | 123,693 | | | $ | 127,411 | | | $ | 134,850 | | | $ | 141,868 | |
Ratio of net investment income (loss) to average net assets | | | 4.24 | % | | | 4.11 | % | | | 4.20 | % | | | 4.48 | % |
Ratio of expenses to average net assets prior to waived fees and reimbursed expenses2 | | | 1.05 | % | | | 1.07 | % | | | 1.08 | % | | | 1.08 | % |
Waived fees and reimbursed expenses2 | | | (0.20 | )% | | | (0.22 | )% | | | (0.23 | )% | | | (0.23 | )% |
Ratio of expenses to average net assets after waived fees and reimbursed expenses2 | | | 0.85 | % | | | 0.85 | % | | | 0.85 | % | | | 0.85 | % |
Portfolio turnover rate3 | | | 95 | % | | | 107 | % | | | 136 | % | | | 68 | % |
1 | Total return calculations do not include any sales charges, and would have been lower had certain expenses not been waived or reimbursed during the periods shown. Total returns for periods of less than one year are not annualized. |
2 | During each period, various fees and/or expenses were waived and/or reimbursed. The ratio of gross expenses to average net assets reflects the expense ratio in the absence of any waivers and/or reimbursements. Ratios shown for periods of less than one year are annualized. |
3 | Calculated on the basis of the Fund as a whole without distinguishing between the classes of shares issued. Portfolio turnover rates shown for periods of less than one year are not annualized. |
4 | For the period from April 11, 2005 (commencement of Class) to June 30, 2005. |
E-33
Financial Highlights
The following tables are intended to help you understand the Funds’ financial performance for the past 5 years. Certain information reflects financial results for a single Fund share. Total returns represent the rate you would have earned (or lost) on an investment in the Fund (assuming reinvestment of all distributions). All performance information, along with the report of independent registered public accounting firm and the Funds’ financial statements, is also contained in the Funds’ annual or semi-annual report, a copy of which is available upon request.
Municipal Bond Fund
Class B Shares — Commenced on April 11, 2005
For a share outstanding throughout each period
| | | | | | | | | | | | | | | | |
For the period ended: | | December 31,
2007
(unaudited) | | | June 30,
2007 | | | June 30,
2006 | | | June 30,
20054 | |
Net asset value, beginning of period | | $ | 9.50 | | | $ | 9.41 | | | $ | 9.60 | | | $ | 9.43 | |
Income from investment operations: | | | | | | | | | | | | | | | | |
Net investment income (loss) | | | 0.17 | | | | 0.32 | | | | 0.33 | | | | 0.08 | |
Net realized and unrealized gain (loss) on investments | | | (0.04 | ) | | | 0.11 | | | | (0.19 | ) | | | 0.17 | |
Total income from investment operations | | | 0.13 | | | | 0.43 | | | | 0.14 | | | | 0.25 | |
Less distributions: | | | | | | | | | | | | | | | | |
Distributions from net investment income | | | (0.17 | ) | | | (0.32 | ) | | | (0.33 | ) | | | (0.08 | ) |
Distributions from net realized gain | | | 0.00 | | | | (0.02 | ) | | | 0.00 | | | | 0.00 | |
Total distributions | | | (0.17 | ) | | | (0.34 | ) | | | (0.33 | ) | | | (0.08 | ) |
Net asset value, end of period | | $ | 9.46 | | | $ | 9.50 | | | $ | 9.41 | | | $ | 9.60 | |
| | | | | | | | | | | | | | | | |
Total return1 | | | 1.36 | % | | | 4.59 | % | | | 1.43 | % | | | 2.65 | % |
Ratios/supplemental data: | | | | | | | | | | | | | | | | |
Net assets, end of period (000s) | | $ | 7,366 | | | $ | 8,642 | | | $ | 12,366 | | | $ | 22,680 | |
Ratio of net investment income (loss) to average net assets | | | 3.49 | % | | | 3.36 | % | | | 3.44 | % | | | 3.74 | % |
Ratio of expenses to average net assets prior to waived fees and reimbursed expenses2 | | | 1.79 | % | | | 1.82 | % | | | 1.83 | % | | | 1.83 | % |
Waived fees and reimbursed expenses2 | | | (0.20 | )% | | | (0.22 | )% | | | (0.22 | )% | | | (0.23 | )% |
Ratio of expenses to average net assets after waived fees and reimbursed expenses2 | | | 1.59 | % | | | 1.60 | % | | | 1.61 | % | | | 1.60 | % |
Portfolio turnover rate3 | | | 95 | % | | | 107 | % | | | 136 | % | | | 68 | % |
1 | Total return calculations do not include any sales charges, and would have been lower had certain expenses not been waived or reimbursed during the periods shown. Total returns for periods of less than one year are not annualized. |
2 | During each period, various fees and/or expenses were waived and/or reimbursed. The ratio of gross expenses to average net assets reflects the expense ratio in the absence of any waivers and/or reimbursements. Ratios shown for periods of less than one year are annualized. |
3 | Calculated on the basis of the Fund as a whole without distinguishing between the classes of shares issued. Portfolio turnover rates shown for periods of less than one year are not annualized. |
4 | For the period from April 11, 2005 (commencement of Class) to June 30, 2005. |
E-34
Financial Highlights
The following tables are intended to help you understand the Funds’ financial performance for the past 5 years. Certain information reflects financial results for a single Fund share. Total returns represent the rate you would have earned (or lost) on an investment in the Fund (assuming reinvestment of all distributions). All performance information, along with the report of independent registered public accounting firm and the Funds’ financial statements, is also contained in the Funds’ annual or semi-annual report, a copy of which is available upon request.
Municipal Bond Fund
Class C Shares — Commenced on April 11, 2005
For a share outstanding throughout each period
| | | | | | | | | | | | | | | | |
For the period ended: | | December 31,
2007
(unaudited) | | | June 30,
2007 | | | June 30,
2006 | | | June 30,
20054 | |
Net asset value, beginning of period | | $ | 9.50 | | | $ | 9.41 | | | $ | 9.60 | | | $ | 9.43 | |
Income from investment operations: | | | | | | | | | | | | | | | | |
Net investment income (loss) | | | 0.17 | | | | 0.32 | | | | 0.33 | | | | 0.08 | |
Net realized and unrealized gain (loss) on investments | | | (0.05 | ) | | | 0.11 | | | | (0.19 | ) | | | 0.17 | |
Total income from investment operations | | | 0.12 | | | | 0.43 | | | | 0.14 | | | | 0.25 | |
Less distributions: | | | | | | | | | | | | | | | | |
Distributions from net investment income | | | (0.17 | ) | | | (0.32 | ) | | | (0.33 | ) | | | (0.08 | ) |
Distributions from net realized gain | | | 0.00 | | | | (0.02 | ) | | | 0.00 | | | | 0.00 | |
Total distributions | | | (0.17 | ) | | | (0.34 | ) | | | (0.33 | ) | | | (0.08 | ) |
Net asset value, end of period | | $ | 9.45 | | | $ | 9.50 | | | $ | 9.41 | | | $ | 9.60 | |
| | | | | | | | | | | | | | | | |
Total return1 | | | 1.25 | % | | | 4.59 | % | | | 1.43 | % | | | 2.65 | % |
Ratios/supplemental data: | | | | | | | | | | | | | | | | |
Net assets, end of period (000s) | | $ | 1,956 | | | $ | 2,146 | | | $ | 1,953 | | | $ | 1,966 | |
Ratio of net investment income (loss) to average net assets | | | 3.49 | % | | | 3.36 | % | | | 3.45 | % | | | 3.73 | % |
Ratio of expenses to average net assets prior to waived fees and reimbursed expenses2 | | | 1.78 | % | | | 1.82 | % | | | 1.84 | % | | | 1.83 | % |
Waived fees and reimbursed expenses2 | | | (0.18 | )% | | | (0.22 | )% | | | (0.23 | )% | | | (0.23 | )% |
Ratio of expenses to average net assets after waived fees and reimbursed expenses2 | | | 1.60 | % | | | 1.60 | % | | | 1.61 | % | | | 1.60 | % |
Portfolio turnover rate3 | | | 95 | % | | | 107 | % | | | 136 | % | | | 68 | % |
1 | Total return calculations do not include any sales charges, and would have been lower had certain expenses not been waived or reimbursed during the periods shown. Total returns for periods of less than one year are not annualized. |
2 | During each period, various fees and/or expenses were waived and/or reimbursed. The ratio of gross expenses to average net assets reflects the expense ratio in the absence of any waivers and/or reimbursements. Ratios shown for periods of less than one year are annualized. |
3 | Calculated on the basis of the Fund as a whole without distinguishing between the classes of shares issued. Portfolio turnover rates shown for periods of less than one year are not annualized. |
4 | For the period from April 11, 2005 (commencement of Class) to June 30, 2005. |
E-35
Financial Highlights
The following tables are intended to help you understand the Funds’ financial performance for the past 5 years. Certain information reflects financial results for a single Fund share. Total returns represent the rate you would have earned (or lost) on an investment in the Fund (assuming reinvestment of all distributions). All performance information, along with the report of independent registered public accounting firm and the Funds’ financial statements, is also contained in the Funds’ annual or semi-annual report, a copy of which is available upon request.
Municipal Bond Fund
Administrator Class Shares — Commenced on April 11, 2005
For a share outstanding throughout each period
| | | | | | | | | | | | | | | | |
For the period ended: | | December 31,
2007
(unaudited) | | | June 30,
2007 | | | June 30,
2006 | | | June 30,
20054 | |
| | | | |
Net asset value, beginning of period | | $ | 9.50 | | | $ | 9.41 | | | $ | 9.60 | | | $ | 9.43 | |
Income from investment operations: | | | | | | | | | | | | | | | | |
Net investment income (loss) | | | 0.22 | | | | 0.43 | | | | 0.43 | | | | 0.10 | |
Net realized and unrealized gain (loss) on investments | | | (0.05 | ) | | | 0.11 | | | | (0.19 | ) | | | 0.17 | |
Total income from investment operations | | | 0.17 | | | | 0.54 | | | | 0.24 | | | | 0.27 | |
Less distributions: | | | | | | | | | | | | | | | | |
Distributions from net investment income | | | (0.22 | ) | | | (0.43 | ) | | | (0.43 | ) | | | (0.10 | ) |
Distributions from net realized gain | | | 0.00 | | | | (0.02 | ) | | | 0.00 | | | | 0.00 | |
Total distributions | | | (0.22 | ) | | | (0.45 | ) | | | (0.43 | ) | | | (0.10 | ) |
Net asset value, end of period | | $ | 9.45 | | | $ | 9.50 | | | $ | 9.41 | | | $ | 9.60 | |
| | | | | | | | | | | | | | | | |
Total return1 | | | 1.80 | % | | | 5.77 | % | | | 2.57 | % | | | 2.90 | % |
Ratios/supplemental data: | | | | | | | | | | | | | | | | |
Net assets, end of period (000s) | | $ | 15,751 | | | $ | 15,926 | | | $ | 16,136 | | | $ | 17,821 | |
Ratio of net investment income (loss) to average net assets | | | 4.58 | % | | | 4.48 | % | | | 4.57 | % | | | 4.87 | % |
Ratio of expenses to average net assets prior to waived fees and reimbursed expenses2 | | | 0.87 | % | | | 0.89 | % | | | 0.90 | % | | | 0.90 | % |
Waived fees and reimbursed expenses2 | | | (0.35 | )% | | | (0.41 | )% | | | (0.42 | )% | | | (0.44 | )% |
Ratio of expenses to average net assets after waived fees and reimbursed expenses2 | | | 0.52 | % | | | 0.48 | % | | | 0.48 | % | | | 0.46 | % |
Portfolio turnover rate3 | | | 95 | % | | | 107 | % | | | 136 | % | | | 68 | % |
1 | Total return calculations do not include any sales charges, and would have been lower had certain expenses not been waived or reimbursed during the periods shown. Total returns for periods of less than one year are not annualized. |
2 | During this period, various fees and/or expenses were waived and/or reimbursed. The ratio of gross expenses to average net assets reflects the expense ratio in the absence of any waivers and/or reimbursements. Ratios for periods of less than one year are annualized. |
3 | Calculated on the basis of the Fund as a whole without distinguishing between the classes of shares issued. Portfolio turnover rates shown for periods of less than one year are not annualized. |
4 | For the period from April 11, 2005 (commencement of Class) to June 30, 2005. |
E-36
International Equity Fund
Performance
The following information shows you how the Fund has performed and illustrates the variability of the Fund’s returns over time. The Fund’s average annual total returns are compared to the performance of an appropriate broad-based index. Please remember that past performance before and after taxes is no guarantee of future results.
Calendar Year Total Returns for Investor Class1 as of 12/31 each year

Best and Worst Quarter
| | | | | |
Best Quarter: | | Q4 1999 | | 33.55 | % |
Worst Quarter: | | Q3 2002 | | -21.81 | % |
Average Annual Total Returns
as of 12/31/07
| | | | | | | | | |
| | | 1 year | | | 5 years | | | 10 years | |
Investor Class1 | | | | | | | | | |
Returns Before Taxes | | 4.34 | % | | 15.70 | % | | 7.05 | % |
Returns After Taxes on Distributions2 | | 2.20 | % | | 15.01 | % | | 6.64 | % |
Returns After Taxes on Distributions and Sale of Fund Shares2 | | 4.97 | % | | 13.63 | % | | 6.08 | % |
MSCI EAFE® Index3 (reflects no deduction for fees, expenses or taxes) | | 11.17 | % | | 21.58 | % | | 20.52 | % |
1 | Institutional Class shares incepted on August 31, 2006. Performance shown prior to the inception of the Institutional Class shares reflects the performance of the Administrator Class shares, and includes expenses that are not applicable to and are higher than those of the Institutional Class shares. Performance shown prior to November 8, 1999, for the Institutional Class shares reflects the performance of the Class A shares, and includes expenses that are not applicable to and are higher than those of the Institutional Class shares, but does not include Class A sales charges. If it did include Class A sales charges, returns would be lower. |
2 | After-tax returns are calculated using the historical highest individual federal marginal income tax rates and do not reflect the impact of state, local or foreign taxes. Actual after-tax returns depend on an investor’s tax situation and may differ from those shown, and after-tax returns shown are not relevant to tax-exempt investors or investors who hold their Fund shares through tax-deferred arrangements, such as 401(k) Plans or Individual Retirement Accounts. |
3 | The Morgan Stanley Capital International Europe, Australasia and Far East (“MSCI EAFE”) IndexSM is an unmanaged group of securities widely regarded by investors to be representations of the stock markets of Europe, Australasia and the Far East. You cannot invest directly in an index. |
E-37
International Equity Fund
Performance
The following information shows you how the Fund has performed and illustrates the variability of the Fund’s returns over time. The Fund’s average annual total returns are compared to the performance of an appropriate broad-based index. Please remember that past performance before and after taxes is no guarantee of future results.
Calendar Year Total Returns for the Institutional Class1 as of 12/31 each year
Best and Worst Quarter
| | | | | |
Best Quarter: | | Q4 1999 | | 33.85 | % |
Worst Quarter: | | Q3 2002 | | -21.81 | % |
Average Annual Total Returns
as of 12/31/07
| | | | | | | | | |
| | | 1 year | | | 5 years | | | 10 years | |
Institutional Class1 | | | | | | | | | |
Returns Before Taxes | | 11.19 | % | | 17.40 | % | | 7.93 | % |
Returns After Taxes on Distributions2 | | 8.74 | % | | 16.57 | % | | 7.45 | % |
Returns After Taxes on Distributions and Sale of Fund Shares2 | | 9.56 | % | | 15.08 | % | | 6.84 | % |
MSCI EAFE® Index3 (reflects no deduction for expenses or taxes) | | 11.17 | % | | 21.58 | % | | 20.52 | % |
1 | Institutional Class shares incepted on August 31, 2006. Performance shown prior to the inception of the Institutional Class shares reflects the performance of the Administrator Class shares, and includes expenses that are not applicable to and are higher than those of the Institutional Class shares. Performance shown prior to November 8, 1999, for the Institutional Class shares reflects the performance of the Class A shares, and includes expenses that are not applicable to and are higher than those of the Institutional Class shares, but does not include Class A sales charges. If it did include Class A sales charges, returns would be lower. |
2 | After-tax returns are calculated using the historical highest individual federal marginal income tax rates and do not reflect the impact of state, local or foreign taxes. Actual after-tax returns depend on an investor’s tax situation and may differ from those shown, and after-tax returns shown are not relevant to tax-exempt investors or investors who hold their Fund shares through tax-deferred arrangements, such as 401(k) Plans or Individual Retirement Accounts. |
3 | The Morgan Stanley Capital International Europe, Australasia and Far East (“MSCI EAFE”) IndexSM is an unmanaged group of securities widely regarded by investors to be representations of the stock markets of Europe, Australasia and the Far East. You cannot invest directly in an index. |
E-38
Financial Highlights
The following tables are intended to help you understand the Funds’ financial performance for the past 5 years. Certain information reflects financial results for a single Fund share. Total returns represent the rate you would have earned (or lost) on an investment in the Fund (assuming reinvestment of all distributions). All performance information, along with the report of independent registered public accounting firm and the Funds’ financial statements, is also contained in the Funds’ annual report, a copy of which is available upon request.
International Equity Fund
Class A Shares — Commenced September 24, 1997
For a share outstanding throughout the period
| | | | | | | | | | | | | | | | | | | | |
For the period ended: | | Sept. 30,
2007 | | | Sept. 30,
2006 | | | Sept. 30,
2005 | | | Sept. 30,
2004 | | | Sept. 30,
2003 | |
Net asset value, beginning of period | | $ | 15.91 | | | $ | 13.69 | | | $ | 11.09 | | | $ | 9.88 | | | $ | 8.46 | |
Income from investment operations: | | | | | | | | | | | | | | | | | | | | |
Net investment income (loss) | | | 0.24 | 1 | | | 0.17 | 1 | | | 0.17 | | | | 0.04 | 1 | | | 0.04 | 1 |
Net realized and unrealized gain (loss) on investments | | | 3.51 | | | | 2.20 | | | | 2.43 | | | | 1.23 | | | | 1.38 | |
Total from investment operations | | | 3.75 | | | | 2.37 | | | | 2.60 | | | | 1.27 | | | | 1.42 | |
Less distributions: | | | | | | | | | | | | | | | | | | | | |
Distributions from net investment income | | | (0.17 | ) | | | (0.15 | ) | | | 0.00 | | | | (0.06 | ) | | | 0.00 | |
Distributions from net realized gain | | | 0.00 | | | | 0.00 | | | | 0.00 | | | | 0.00 | | | | 0.00 | |
Total distributions | | | (0.17 | ) | | | (0.15 | ) | | | 0.00 | | | | (0.06 | ) | | | 0.00 | |
Net asset value, end of period | | $ | 19.49 | | | $ | 15.91 | | | $ | 13.69 | | | $ | 11.09 | | | $ | 9.88 | |
| | | | | | | | | | | | | | | | | | | | |
Total return2 | | | 23.68 | % | | | 17.50 | % | | | 23.48 | % | | | 12.89 | % | | | 16.78 | % |
Ratios/supplemental data: | | | | | | | | | | | | | | | | | | | | |
Net assets, end of period (000s) | | $ | 62,693 | | | $ | 52,243 | | | $ | 57,496 | | | $ | 56,108 | | | $ | 52,762 | |
Ratio of net investment income (loss) to average net assets3 | | | 1.32 | % | | | 1.16 | % | | | 1.24 | % | | | 0.36 | % | | | 0.42 | % |
Ratio of expenses to average net assets prior to waived fees and reimbursed expenses3 | | | 1.70 | % | | | 1.67 | % | | | 1.66 | % | | | 1.71 | % | | | 1.76 | % |
Waived fees and reimbursed expenses3 | | | (0.20 | )% | | | (0.17 | )% | | | (0.16 | )% | | | (0.21 | )% | | | (0.26 | )% |
Ratio of expenses to average net assets after waived fees and expenses3 | | | 1.50 | % | | | 1.50 | % | | | 1.50 | % | | | 1.50 | % | | | 1.50 | % |
Portfolio turnover rate4 | | | 49 | % | | | 44 | % | | | 46 | % | | | 112 | % | | | 73 | % |
1 | Calculated based upon average shares outstanding. |
2 | Total return calculations do not include any sales charges, and would have been lower had certain expenses not been waived or reimbursed during the period shown. Returns for periods of less than one year are not annualized. |
3 | During each period, various fees and expenses were waived and reimbursed as indicated. The ratio of Gross Expenses to Average Net Assets reflects the expense ratio in the absence of any waivers and reimbursements. |
4 | Calculated on the basis of the Fund as a whole without distinguishing between the classes of shares issued. |
E-39
Financial Highlights
The following tables are intended to help you understand the Funds’ financial performance for the past 5 years. Certain information reflects financial results for a single Fund share. Total returns represent the rate you would have earned (or lost) on an investment in the Fund (assuming reinvestment of all distributions). All performance information, along with the report of independent registered public accounting firm and the Funds’ financial statements, is also contained in the Funds’ annual report, a copy of which is available upon request.
International Equity Fund
Institutional Class — Commenced on August 31, 2006
For a share outstanding throughout each period
| | | | | | | | |
For the period ended: | | Sept. 30,
2007 | | | Sept. 30,
20061 | |
Net asset value, beginning of period | | $ | 15.91 | | | $ | 15.84 | |
Income from investment operations: | | | | | | | | |
Net investment income (loss) | | | 0.45 | 2 | | | 0.02 | 2 |
Net realized and unrealized gain (loss) on investments | | | 3.37 | | | | 0.05 | |
Total from investment operations | | | 3.82 | | | | 0.07 | |
Less distributions: | | | | | | | | |
Distributions from net investment income | | | (0.23 | ) | | | 0.00 | |
Distributions from net realized gain | | | 0.00 | | | | 0.00 | |
Total distributions | | | (0.23 | ) | | | 0.00 | |
Net asset value, end of period | | $ | 19.50 | | | $ | 15.91 | |
| | | | | | | | |
Total return3 | | | 24.22 | % | | | 0.44 | % |
Ratios/supplemental data: | | | | | | | | |
Net assets, end of period (000s) | | $ | 69,756 | | | $ | 10 | |
Ratio of net investment income (loss) to average net assets4 | | | 2.43 | % | | | 1.77 | % |
Ratio of expenses to average net assets prior to waived fees and reimbursed expenses4 | | | 1.22 | % | | | 1.29 | % |
Waived fees and reimbursed expenses4 | | | (0.17 | )% | | | (0.40 | )% |
Ratio of expenses to average net assets after waived fees and expenses4 | | | 1.05 | % | | | 0.89 | % |
Portfolio turnover rate5 | | | 49 | % | | | 44 | % |
1 | Commencement of operations. |
2 | Calculated based upon average shares outstanding. |
3 | Total return calculations do not include any sales charges, and would have been lower had certain expenses not been waived or reimbursed during the periods shown. Returns for periods less than one year are not annualized. |
4 | During each period, various fees and expenses were waived and reimbursed as indicated. The ratio of Gross Expenses to Average Net Assets reflects the expense ratio in the absence of any waivers and reimbursements. |
5 | Calculated on the basis of the Fund as a whole without distinguishing between the classes of shares issued. |
E-40
Value Fund
Performance
The following information shows you how the Fund has performed and illustrates the variability of the Fund’s returns over time. The Fund’s average annual total returns are compared to the performance of an appropriate broad-based index. Please remember that past performance before and after taxes is no guarantee of future results.
Effective July 26, 2004, certain portfolios of The Advisors’ Inner Circle Fund reorganized into the Wells Fargo Funds. As part of this transaction, the Value Fund was organized as the successor fund to the C&B Tax-Managed Value Portfolio.
Calendar Year Total Returns for the Investor Class1 as of 12/31 each year
Best and Worst Quarter
| | | | | |
Best Quarter: | | Q2 2003 | | 19.60 | % |
Worst Quarter: | | Q3 2002 | | -14.88 | % |
The Fund’s year-to-date performance through December 31, 2007, was -1.72%.
Average Annual Total Returns
as of 12/31/07
| | | | | | | | | |
| | | 1 year | | | 5 years | | | 10 years | |
Investor Class1 | | | | | | | | | |
Returns Before Taxes | | -1.72 | % | | 11.52 | % | | 8.34 | % |
Returns After Taxes on Distributions2 | | -3.05 | % | | 10.59 | % | | 7.50 | % |
Returns After Taxes on Distributions and Sale of Fund Shares2 | | -0.07 | % | | 9.79 | % | | 7.01 | % |
Russell 1000® Value Index3 (reflects no deduction for expenses or taxes) | | -0.17 | % | | 14.63 | % | | 7.68 | % |
1 | Investor Class shares incepted on February 12, 1997. Prior to December 1, 2005, the Wells Fargo Advantage Value Fund — Investor Class was named the Wells Fargo Advantage C&B Tax-Managed Value Fund — Class D shares. Performance shown prior to July 26, 2004, for the Investor Class shares reflects the performance of the unnamed share class of the C&B Tax-Managed Value Portfolio. |
E-41
2 | After-tax returns are calculated using the historical highest individual federal marginal income tax rates and do not reflect the impact of state, local or foreign taxes. Actual after-tax returns depend on an investor’s tax situation and may differ from those shown, and after-tax returns shown are not relevant to tax-exempt investors or investors who hold their Fund shares through tax-deferred arrangements, such as 401(k) Plans or Individual Retirement Accounts. |
3 | The Russell 1000® Value Index measures the performance of those Russell 1000 companies with lower price-to-book ratios and lower forecasted growth values. You cannot invest directly in an index. |
E-42
Value Fund
Performance
The following information shows you how the Fund has performed and illustrates the variability of the Fund’s returns over time. The Fund’s average annual total returns are compared to the performance of an appropriate broad-based index. Please remember that past performance before and after taxes is no guarantee of future results.
Effective July 26, 2004, certain portfolios of The Advisors’ Inner Circle Fund reorganized into the Wells Fargo Funds. As part of this transaction, the Value Fund was organized as the successor fund to the C&B Tax-Managed Value Portfolio.
Calendar Year Total Returns for the Administrator Class1 as of 12/31 each year
Best and Worst Quarter
| | | | | |
Best Quarter: | | Q2 2003 | | 19.60 | % |
Worst Quarter: | | Q3 2002 | | -14.88 | % |
The Fund’s year-to-date performance through December 31, 2007, was -1.51%.
Average Annual Total Returns1
as of 12/31/07
| | | | | | | | | |
| | | 1 year | | | 5 years | | | 10 years | |
Administrator Class1 | | | | | | | | | |
Returns Before Taxes | | -1.51 | % | | 11.71 | % | | 8.43 | % |
Returns After Taxes on Distributions2 | | -2.93 | % | | 10.71 | % | | 7.56 | % |
Returns After Taxes on Distributions and Sale of Fund Shares2 | | 0.06 | % | | 9.91 | % | | 7.07 | % |
Russell 1000® Value Index3 (reflects no deduction for expenses or taxes) | | -0.17 | % | | 14.63 | % | | 7.68 | % |
1 | Administrator Class shares incepted on July 26, 2004. Prior to December 1, 2005, the Wells Fargo Advantage Value Fund was named the Wells Fargo Advantage C&B Tax-Managed Value Fund. Prior to April 11, 2005, the Administrator Class was named the Institutional Class. Performance shown prior to the inception of the Administrator Class shares reflects the performance of the unnamed share class of the C&B Tax-Managed Value Portfolio, the predecessor fund, and includes expenses that are not applicable to and are |
E-43
| | higher than those of the Administrator Class. The unnamed share class of the predecessor fund incepted on February 12, 1997. Returns for the Administrator Class shares and Index shown in the Life of Fund column are as of the Fund inception date. |
2 | After-tax returns are calculated using the historical highest individual federal marginal income tax rates and do not reflect the impact of state, local or foreign taxes. Actual after-tax returns depend on an investor’s tax situation and may differ from those shown, and after-tax returns shown are not relevant to tax-exempt investors or investors who hold their Fund shares through tax-deferred arrangements, such as 401(k) Plans or Individual Retirement Accounts. |
3 | The Russell 1000® Value Index measures the performance of those Russell 1000 companies with lower price-to-book ratios and lower forecasted growth values. You cannot invest directly in an index. |
E-44
Financial Highlights
The following tables are intended to help you understand the Funds’ financial performance for the past 5 years. Certain information reflects financial results for a single Fund share. Total returns represent the rate you would have earned (or lost) on an investment in the Fund (assuming reinvestment of all distributions). All performance information, along with the report of independent registered public accounting firm and the Funds’ financial statements, is also contained in the Funds’ annual report, a copy of which is available upon request.
Value Fund
Investor Class Shares — Commenced on February 12, 1997
For a share outstanding throughout each period
| | | | | | | | | | | | | | | | | | | | | | | | |
For the period ended: | | July 31,
2007 | | | July 31,
20061 | | | July 31,
20051 | | | Oct. 31,
2004 | | | Oct. 31,
2003 | | | Oct. 31,
2002 | |
Net asset value, beginning of period | | $ | 19.06 | | | $ | 18.85 | | | $ | 17.70 | | | $ | 15.97 | | | $ | 12.94 | | | $ | 13.63 | |
Income from investment operations: | | | | | | | | | | | | | | | | | | | | | | | | |
Net investment income (loss) | | | 0.18 | 2 | | | 0.21 | | | | 0.12 | | | | 0.07 | | | | 0.09 | | | | 0.09 | |
Net realized and unrealized gain (loss) on investments | | | 2.76 | | | | 0.66 | | | | 1.45 | 3 | | | 1.72 | | | | 3.05 | | | | (0.69 | ) |
Total from investment operations | | | 2.94 | | | | 0.87 | | | | 1.57 | | | | 1.79 | | | | 3.14 | | | | (0.60 | ) |
Less distributions: | | | | | | | | | | | | | | | | | | | | | | | | |
Distributions from net investment income | | | (0.20 | ) | | | (0.11 | ) | | | (0.09 | ) | | | (0.05 | ) | | | (0.10 | ) | | | (0.09 | ) |
Distributions from net realized gain | | | (1.33 | ) | | | (0.55 | ) | | | (0.33 | ) | | | 0.00 | | | | (0.01 | ) | | | 0.00 | |
Total from distributions | | | (1.53 | ) | | | (0.66 | ) | | | (0.42 | ) | | | (0.05 | ) | | | (0.11 | ) | | | (0.09 | ) |
Net asset value, end of period | | $ | 20.47 | | | $ | 19.06 | | | $ | 18.85 | | | $ | 17.70 | | | $ | 15.97 | | | $ | 12.94 | |
| | | | | | | | | | | | | | | | | | | | | | | | |
Total return4 | | | 15.48 | % | | | 4.81 | % | | | 8.95 | % | | | 11.19 | % | | | 24.42 | % | | | (4.45 | )% |
Ratios/supplemental data: | | | | | | | | | | | | | | | | | | | | | | | | |
Net assets, end of period (000s) | | $ | 25,987 | | | $ | 17,868 | | | $ | 24,476 | | | $ | 19,913 | | | $ | 9,147 | | | $ | 4,799 | |
Ratio of net investment income (loss) to average net assets | | | 0.89 | % | | | 1.05 | % | | | 0.84 | % | | | 0.39 | % | | | 0.65 | % | | | 0.66 | % |
Ratio of expenses to average net assets prior to waived fees and reimbursed expenses5 | | | 1.91 | % | | | 2.16 | % | | | 1.62 | % | | | 1.51 | % | | | 1.76 | % | | | 2.63 | % |
Waived fees and reimbursed expenses5 | | | (0.71 | )% | | | (0.96 | )% | | | (0.42 | )% | | | (0.29 | )% | | | (0.51 | )% | | | (1.44 | )% |
Ratio of expenses to average net assets after waived fees and expenses5 | | | 1.20 | % | | | 1.20 | % | | | 1.20 | % | | | 1.22 | % | | | 1.25 | % | | | 1.19 | % |
Portfolio turnover rate6 | | | 24 | % | | | 33 | % | | | 32 | % | | | 25 | % | | | 31 | % | | | 32 | % |
1 | In 2005, the Fund changed its fiscal year end from October 31 to July 31. |
2 | Calculated based upon average shares outstanding. |
3 | Includes redemption fee of $0.02. |
4 | Total return calculations do not include any sales charges, and would have been lower had certain expenses not been waived or reimbursed during the periods shown. Returns for periods of less than one year are not annualized. |
5 | During each period, various fees and expenses were waived and reimbursed as indicated. The ratio of Gross Expenses to Average Net Assets reflects the expense ratio in the absence of any waivers and reimbursements. |
6 | Calculated on the basis of the Fund as a whole without distinguishing between the classes of shares issued. Portfolio turnover rates presented for periods of less than one year are not annualized. |
E-45
Financial Highlights
The following tables are intended to help you understand the Funds’ financial performance for the past 5 years. Certain information reflects financial results for a single Fund share. Total returns represent the rate you would have earned (or lost) on an investment in the Fund (assuming reinvestment of all distributions). All performance information, along with the report of independent registered public accounting firm and the Funds’ financial statements, is also contained in the Funds’ annual report, a copy of which is available upon request.
Value Fund
Administrator Class Shares — Commenced on July 26, 2004
For a share outstanding throughout each period
| | | | | | | | | | | | | | | | |
For the period ended: | | July 31,
2007 | | | July 31,
20061 | | | July 31,
20051 | | | Oct. 31,
20042 | |
Net asset value, beginning of period | | $ | 19.09 | | | $ | 18.87 | | | $ | 17.71 | | | $ | 17.06 | |
Income from investment operations: | | | | | | | | | | | | | | | | |
Net investment income (loss) | | | 0.24 | 3 | | | 0.25 | | | | 0.15 | | | | 0.03 | |
Net realized and unrealized gain (loss) on investments | | | 2.76 | | | | 0.68 | | | | 1.45 | 4 | | | 0.62 | |
Total from investment operations | | | 3.00 | | | | 0.93 | | | | 1.60 | | | | 0.65 | |
Less distributions: | | | | | | | | | | | | | | | | |
Distributions from net investment income | | | (0.24 | ) | | | (0.16 | ) | | | (0.11 | ) | | | 0.00 | |
Distributions from net realized gain | | | (1.33 | ) | | | (0.55 | ) | | | (0.33 | ) | | | 0.00 | |
Total from distributions | | | (1.57 | ) | | | (0.71 | ) | | | (0.44 | ) | | | 0.00 | |
Net asset value, end of period | | $ | 20.52 | | | $ | 19.09 | | | $ | 18.87 | | | $ | 17.71 | |
| | | | | | | | | | | | | | | | |
Total return5 | | | 15.79 | % | | | 5.10 | % | | | 9.12 | % | | | 3.81 | % |
Ratios/supplemental data: | | | | | | | | | | | | | | | | |
Net assets, end of period (000s) | | $ | 3,177 | | | $ | 1,967 | | | $ | 1,617 | | | $ | 1,201 | |
Ratio of net investment income (loss) to average net assets | | | 1.15 | % | | | 1.35 | % | | | 1.09 | % | | | 0.77 | % |
Ratio of expenses to average net assets prior to waived fees and reimbursed expenses6 | | | 1.56 | % | | | 1.89 | % | | | 1.36 | % | | | 1.80 | % |
Waived fees and reimbursed expenses6 | | | (0.61 | )% | | | (0.94 | )% | | | (0.41 | )% | | | (0.85 | )% |
Ratio of expenses to average net assets after waived fees and expenses6 | | | 0.95 | % | | | 0.95 | % | | | 0.95 | % | | | 0.95 | % |
Portfolio turnover rate7 | | | 24 | % | | | 33 | % | | | 32 | % | | | 25 | % |
1 | In 2005, the Fund changed its fiscal year end from October 31 to July 31. |
2 | Commencement of operations. |
3 | Calculated based upon average shares outstanding. |
4 | Includes redemption fee of $0.02. |
5 | Total return calculations do not include any sales charges, and would have been lower had certain expenses not been waived or reimbursed during the periods shown. Returns for periods of less than one year are not annualized. |
6 | During each period, various fees and expenses were waived and reimbursed as indicated. The ratio of Gross Expenses to Average Net Assets reflects the expense ratio in the absence of any waivers and reimbursements. |
7 | Calculated on the basis of the Fund as a whole without distinguishing between the classes of shares issued. Portfolio turnover rates presented for periods of less than one year are not annualized. |
E-46
C&B Large Cap Value Fund
Performance
The following information shows you how the Fund has performed and illustrates the variability of the Fund’s returns over time. The Fund’s average annual total returns are compared to the performance of an appropriate broad-based index. Please remember that past performance before and after taxes is no guarantee of future results.
Calendar Year Total Returns for Class A1 as of 12/31 each year
Best and Worst Quarter
| | | | | |
Best Quarter: | | Q2 2003 | | 20.94 | % |
Worst Quarter: | | Q3 2002 | | -17.54 | % |
Average Annual Total Returns
as of 12/31/07
| | | | | | | | | |
| | | 1 year | | | 5 years | | | 10 years | |
Class A1 | | | | | | | | | |
Returns Before Taxes | | -7.66 | % | | 11.08 | % | | 7.78 | % |
Returns After Taxes on Distributions2 | | -8.63 | % | | 10.26 | % | | 5.28 | % |
Returns After Taxes on Distributions and Sale of Fund Shares2 | | -4.30 | % | | 9.32 | % | | 5.49 | % |
Class B1 Returns Before Taxes | | -7.75 | % | | 11.31 | % | | 7.64 | % |
Class C1 Returns Before Taxes | | -3.74 | % | | 11.57 | % | | 7.65 | % |
Russell 1000® Value Index3 (reflects no deduction for fees, expenses or taxes) | | -0.17 | % | | 14.63 | % | | 7.68 | % |
1 | Calendar Year Total Returns in the bar chart do not reflect sales charges. If they did, returns would be lower. Average Annual Total Returns reflect applicable sales charges. Class A, Class B and Class C shares incepted on July 26, 2004. Performance shown prior to the inception of the Class A, Class B and Class C shares reflects the performance of the unnamed share class of the C&B Large Cap Value Portfolio, the predecessor fund, adjusted to reflect Class A, Class B and Class C sales charges and expenses, as applicable. |
2 | After-tax returns are calculated using the historical highest individual federal marginal income tax rates and do not reflect the impact of state, local or foreign taxes. Actual after-tax returns depend on an investor’s tax situation and may differ from those shown, and after-tax returns shown are not relevant to tax-exempt investors or investors who hold their Fund shares through tax-deferred arrangements, such as 401(k) Plans or Individual Retirement Accounts. After-tax returns are shown only for the Class A shares. After-tax returns for the Class B and Class C shares will vary. |
3 | The Russell 1000® Value Index measures the performance of those Russell 1000 companies with lower price-to-book ratios and lower forecasted growth values. You cannot invest directly in an index. |
E-47
C& B Large Cap Value Fund
Performance
The following information shows you how the Fund has performed and illustrates the variability of the Fund’s returns over time. The Fund’s average annual total returns are compared to the performance of an appropriate broad-based index. Please remember that past performance before and after taxes is no guarantee of future results.
Calendar Year Total Returns for Investor Class1 as of 12/31 each year (Effective on or about June 20, 2008, the Class D shares of the C&B Large Cap Value Fund will be renamed the Investor Class shares and modified to assume the features and attributes of Investor Class shares. See “Overview” in “Proposal: Approval of an Agreement and Plan of Reorganization” section for more information).
Best and Worst Quarter
| | | | | |
Best Quarter: | | Q2 2003 | | 20.94 | % |
Worst Quarter: | | Q3 2002 | | -17.54 | % |
Average Annual Total Returns
as of 12/31/07
| | | | | | | | | |
| | | 1 year | | | 5 years | | | 10 years | |
Investor Class1 | | | | | | | | | |
Returns Before Taxes | | -2.11 | % | | 12.37 | % | | 8.41 | % |
Returns After Taxes on Distributions2 | | -3.15 | % | | 11.54 | % | | 5.90 | % |
Returns After Taxes on Distributions and Sale of Fund Shares2 | | -0.65 | % | | 10.48 | % | | 6.05 | % |
Russell 1000® Value Index3 (reflects no deduction for expenses or taxes) | | -0.17 | % | | 14.63 | % | | 7.68 | % |
1 | Investor Class shares incepted on May 15, 1990 (effective on or about June 20, 2008, the Class D shares will be renamed Investor Class shares). Performance shown from July 26, 2004 through December 31, 2007 reflects the expenses of Class D. Performance shown prior to July 26, 2004, for the Investor Class shares reflects the performance of the unnamed share class of the C&B Large Cap Value Portfolio. |
2 | After-tax returns are calculated using the historical highest individual federal marginal income tax rates and do not reflect the impact of state, local or foreign taxes. Actual after-tax returns depend on an investor’s tax situation and may differ from those shown, and after-tax returns shown are not relevant to tax-exempt investors or investors who hold their Fund shares through tax-deferred arrangements, such as 401(k) Plans or Individual Retirement Accounts. |
3 | The Russell 1000® Value Index measures the performance of those Russell 1000 companies with lower price-to-book ratios and lower forecasted growth values. You cannot invest directly in an index. |
E-48
C&B Large Cap Value Fund
Performance
The following information shows you how the Fund has performed and illustrates the variability of the Fund’s returns over time. The Fund’s average annual total returns are compared to the performance of an appropriate broad-based index. Please remember that past performance before and after taxes is no guarantee of future results.
Calendar Year Total Returns for the Administrator Class1 as of 12/31 each year
Best and Worst Quarter
| | | | | |
Best Quarter: | | Q2 2003 | | 20.94 | % |
Worst Quarter: | | Q3 2002 | | -17.54 | % |
Average Annual Total Returns
as of 12/31/07
| | | | | | | | | |
| | | 1 year | | | 5 years | | | 10 years | |
Administrator Class1 | | | | | | | | | |
Returns Before Taxes | | -1.86 | % | | 12.56 | % | | 8.50 | % |
Returns After Taxes on Distributions2 | | -2.99 | % | | 11.67 | % | | 5.96 | % |
Returns After Taxes on Distributions and Sale of Fund Shares2 | | -0.49 | % | | 10.61 | % | | 6.11 | % |
Russell 1000® Value Index3 (reflects no deduction for expenses or taxes) | | -0.17 | % | | 14.63 | % | | 7.68 | % |
1 | Administrator Class shares incepted on July 26, 2004. Prior to April 11, 2005, the Administrator Class was named the Institutional Class. Performance shown prior to the inception of the Administrator Class shares reflects the performance of the unnamed class of shares of the C&B Large Cap Value Portfolio, and includes expenses that are not applicable to and are higher than those of the Administrator Class shares. |
2 | After-tax returns are calculated using the historical highest individual federal marginal income tax rates and do not reflect the impact of state, local or foreign taxes. Actual after-tax returns depend on an investor’s tax situation and may differ from those shown, and after-tax returns shown are not relevant to tax-exempt investors or investors who hold their Fund shares through tax-deferred arrangements, such as 401(k) Plans or Individual Retirement Accounts. |
3 | The Russell 1000® Value Index measures the performance of those Russell 1000 companies with lower price-to-book ratios and lower forecasted growth values. You cannot invest directly in an index. |
E-49
Financial Highlights
The following tables are intended to help you understand the Funds’ financial performance for the past 5 years. Certain information reflects financial results for a single Fund share. Total returns represent the rate you would have earned (or lost) on an investment in the Fund (assuming reinvestment of all distributions). All performance information, along with the report of independent registered public accounting firm and the Funds’ financial statements, is also contained in the Funds’ annual report, a copy of which is available upon request.
C&B Large Cap Value Fund
Class A Shares — Commenced on July 26, 2004
For a share outstanding throughout each period
| | | | | | | | | | | | | | | | |
For the period ended: | | Sept. 30,
2007 | | | Sept. 30,
2006 | | | Sept. 30,
20051 | | | Oct. 31,
20042 | |
Net asset value, beginning of period | | $ | 9.67 | | | $ | 8.62 | | | $ | 8.27 | | | $ | 8.01 | |
Income from investment operations: | | | | | | | | | | | | | | | | |
Net investment income (loss) | | | 0.09 | 3 | | | 0.11 | | | | 0.05 | 3 | | | 0.00 | |
Net realized and unrealized gain (loss) on investments | | | 0.98 | | | | 1.16 | | | | 0.40 | | | | 0.26 | |
Total from investment operations | | | 1.07 | | | | 1.27 | | | | 0.45 | | | | 0.26 | |
Less distributions: | | | | | | | | | | | | | | | | |
Distributions from net investment income | | | (0.11 | ) | | | (0.04 | ) | | | (0.03 | ) | | | 0.00 | |
Distributions from net realized gain | | | (0.44 | ) | | | (0.18 | ) | | | (0.07 | ) | | | 0.00 | |
Total from distributions | | | (0.55 | ) | | | (0.22 | ) | | | (0.10 | ) | | | 0.00 | |
Net asset value, end of period | | $ | 10.19 | | | $ | 9.67 | | | $ | 8.62 | | | $ | 8.27 | |
| | | | | | | | | | | | | | | | |
Total return4 | | | 11.20 | % | | | 15.02 | % | | | 5.45 | % | | | 3.25 | % |
Ratios/supplemental data: | | | | | | | | | | | | | | | | |
Net assets, end of period (000s) | | $ | 72,865 | | | $ | 57,288 | | | $ | 51,719 | | | $ | 11,408 | |
Ratio of net investment income (loss) to average net assets5 | | | 0.94 | % | | | 1.25 | % | | | 0.63 | % | | | 0.18 | % |
Ratio of expenses to average net assets prior to waived fees and reimbursed expenses5,6 | | | 1.30 | % | | | 1.30 | % | | | 1.35 | % | | | 1.60 | % |
Waived fees and reimbursed expenses5 | | | (0.10 | )% | | | (0.10 | )% | | | (0.15 | )% | | | (0.40 | )% |
Ratio of expenses to average net assets after waived fees and expenses5,6 | | | 1.20 | % | | | 1.20 | % | | | 1.20 | % | | | 1.20 | % |
Portfolio turnover rate7 | | | 24 | %8 | | | 29 | %8 | | | 25 | %8 | | | 30 | % |
1 | The Fund changed its fiscal year-end from October 31 to September 30. |
2 | Commencement of operations at beginning of period. |
3 | Calculated based upon average shares outstanding. |
4 | Total return calculations would have been lower had certain gross expenses not been waived or reimbursed during the periods shown. Returns for periods of less than one year are not annualized. |
5 | During each period, various fees and expenses were waived and reimbursed. The ratio of Gross Expenses to Average Net Assets reflects the expense ratio in the absence of any waivers and reimbursements. |
6 | Includes net expenses allocated from Portfolio(s) in which the Fund invests. |
7 | Calculated on the basis of the Fund as a whole without distinguishing between the classes of shares issued. |
8 | Portfolio turnover rate represents the activity from the Fund’s investment in a single Portfolio. |
E-50
Financial Highlights
The following tables are intended to help you understand the Funds’ financial performance for the past 5 years. Certain information reflects financial results for a single Fund share. Total returns represent the rate you would have earned (or lost) on an investment in the Fund (assuming reinvestment of all distributions). All performance information, along with the report of independent registered public accounting firm and the Funds’ financial statements, is also contained in the Funds’ annual report, a copy of which is available upon request.
C&B Large Cap Value Fund
Class B Shares — Commenced on July 26, 2004
For a share outstanding throughout each period
| | | | | | | | | | | | | | | | |
For the period ended: | | Sept. 30,
2007 | | | Sept. 30,
2006 | | | Sept. 30,
20051 | | | Oct. 31,
20042 | |
Net asset value, beginning of period | | $ | 9.58 | | | $ | 8.56 | | | $ | 8.26 | | | $ | 8.01 | |
Income from investment operations: | | | | | | | | | | | | | | | | |
Net investment income (loss) | | | 0.02 | 3 | | | 0.05 | | | | (0.01 | )3 | | | (0.01 | ) |
Net realized and unrealized gain (loss) on investments | | | 0.96 | | | | 1.15 | | | | 0.40 | | | | 0.26 | |
Total from investment operations | | | 0.98 | | | | 1.20 | | | | 0.39 | | | | 0.25 | |
Less distributions: | | | | | | | | | | | | | | | | |
Distributions from net investment income | | | (0.04 | ) | | | 0.00 | | | | (0.02 | ) | | | 0.00 | |
Distributions from net realized gain | | | (0.44 | ) | | | (0.18 | ) | | | (0.07 | ) | | | 0.00 | |
Total from distributions | | | (0.48 | ) | | | (0.18 | ) | | | (0.09 | ) | | | 0.00 | |
Net asset value, end of period | | $ | 10.08 | | | $ | 9.58 | | | $ | 8.56 | | | $ | 8.26 | |
| | | | | | | | | | | | | | | | |
Total return4 | | | 10.33 | % | | | 14.20 | % | | | 4.70 | % | | | 3.12 | % |
Ratios/supplemental data: | | | | | | | | | | | | | | | | |
Net assets, end of period (000s) | | $ | 25,029 | | | $ | 26,082 | | | $ | 24,296 | | | $ | 5,790 | |
Ratio of net investment income (loss) to average net assets5 | | | 0.18 | % | | | 0.48 | % | | | (0.11 | )% | | | (0.60 | )% |
Ratio of expenses to average net assets prior to waived fees and reimbursed expenses5,6 | | | 2.05 | % | | | 2.05 | % | | | 2.10 | % | | | 2.35 | % |
Waived fees and reimbursed expenses5 | | | (0.10 | )% | | | (0.10 | )% | | | (0.15 | )% | | | (0.40 | )% |
Ratio of expenses to average net assets after waived fees and expenses5,6 | | | 1.95 | % | | | 1.95 | % | | | 1.95 | % | | | 1.95 | % |
Portfolio turnover rate7 | | | 24 | %8 | | | 29 | %8 | | | 25 | %8 | | | 30 | % |
1 | The Fund changed its fiscal year-end from October 31 to September 30. |
2 | Commencement of operations at beginning of period. |
3 | Calculated based upon average shares outstanding. |
4 | Total return calculations would have been lower had certain gross expenses not been waived or reimbursed during the periods shown. Returns for periods of less than one year are not annualized. |
5 | During each period, various fees and expenses were waived and reimbursed. The ratio of Gross Expenses to Average Net Assets reflects the expense ratio in the absence of any waivers and reimbursements. |
6 | Includes net expenses allocated from Portfolio(s) in which the Fund invests. |
7 | Calculated on the basis of the Fund as a whole without distinguishing between the classes of shares issued. |
8 | Portfolio turnover rate represents the activity from the Fund’s investment in a single Portfolio. |
E-51
Financial Highlights
The following tables are intended to help you understand the Funds’ financial performance for the past 5 years. Certain information reflects financial results for a single Fund share. Total returns represent the rate you would have earned (or lost) on an investment in the Fund (assuming reinvestment of all distributions). All performance information, along with the report of independent registered public accounting firm and the Funds’ financial statements, is also contained in the Funds’ annual report, a copy of which is available upon request.
C&B Large Cap Value Fund
Class C Shares — Commenced on July 26, 2004
For a share outstanding throughout each period
| | | | | | | | | | | | | | | | |
For the period ended: | | Sept. 30,
2007 | | | Sept. 30,
2006 | | | Sept. 30,
20051 | | | Oct. 31,
20042 | |
Net asset value, beginning of period | | $ | 9.58 | | | $ | 8.56 | | | $ | 8.26 | | | $ | 8.01 | |
Income from investment operations: | | | | | | | | | | | | | | | | |
Net investment income (loss) | | | 0.02 | 3 | | | 0.05 | | | | (0.01 | )3 | | | (0.01 | ) |
Net realized and unrealized gain (loss) on investments | | | 0.96 | | | | 1.15 | | | | 0.40 | | | | 0.26 | |
Total from investment operations | | | 0.98 | | | | 1.20 | | | | 0.39 | | | | 0.25 | |
Less distributions: | | | | | | | | | | | | | | | | |
Distributions from net investment income | | | (0.04 | ) | | | 0.00 | | | | (0.02 | ) | | | 0.00 | |
Distributions from net realized gain | | | (0.44 | ) | | | (0.18 | ) | | | (0.07 | ) | | | 0.00 | |
Total from distributions | | | (0.48 | ) | | | (0.18 | ) | | | (0.09 | ) | | | 0.00 | |
Net asset value, end of period | | $ | 10.08 | | | $ | 9.58 | | | $ | 8.56 | | | $ | 8.26 | |
| | | | | | | | | | | | | | | | |
Total return4 | | | 10.34 | % | | | 14.20 | % | | | 4.71 | % | | | 3.12 | % |
Ratios/supplemental data: | | | | | | | | | | | | | | | | |
Net assets, end of period (000s) | | $ | 16,926 | | | $ | 15,120 | | | $ | 13,075 | | | $ | 2,732 | |
Ratio of net investment income (loss) to average net assets5 | | | 0.19 | % | | | 0.49 | % | | | (0.12 | )% | | | (0.58 | )% |
Ratio of expenses to average net assets prior to waived fees and reimbursed expenses5,6 | | | 2.05 | % | | | 2.05 | % | | | 2.10 | % | | | 2.35 | % |
Waived fees and reimbursed expenses5 | | | (0.10 | )% | | | (0.10 | )% | | | (0.15 | )% | | | (0.40 | )% |
Ratio of expenses to average net assets after waived fees and expenses5,6 | | | 1.95 | % | | | 1.95 | % | | | 1.95 | % | | | 1.95 | % |
Portfolio turnover rate7 | | | 24 | %8 | | | 29 | %8 | | | 25 | %8 | | | 30 | % |
1 | The Fund changed its fiscal year-end from October 31 to September 30. |
2 | Commencement of operations at beginning of period. |
3 | Calculated based upon average shares outstanding. |
4 | Total return calculations would have been lower had certain gross expenses not been waived or reimbursed during the periods shown. Returns for periods of less than one year are not annualized. |
5 | During each period, various fees and expenses were waived and reimbursed. The ratio of Gross Expenses to Average Net Assets reflects the expense ratio in the absence of any waivers and reimbursements. |
6 | Includes net expenses allocated from Portfolio(s) in which the Fund invests. |
7 | Calculated on the basis of the Fund as a whole without distinguishing between the classes of shares issued. |
8 | Portfolio turnover rate represents the activity from the Fund’s investment in a single Portfolio. |
E-52
Financial Highlights
The following tables are intended to help you understand the Funds’ financial performance for the past 5 years. Certain information reflects financial results for a single Fund share. Total returns represent the rate you would have earned (or lost) on an investment in the Fund (assuming reinvestment of all distributions). All performance information, along with the report of independent registered public accounting firm and the Funds’ financial statements, is also contained in the Funds’ annual report, a copy of which is available upon request.
C&B Large Cap Value Fund
Class D Shares Commenced on May 15, 1990 (effective on or about June 20, 2008, the Class D shares of the C&B Large Cap Value Fund will be renamed the Investor Class shares and modified to assume the features and attributes of Investor Class shares. See “Overview” in “Proposal: Approval of an Agreement and Plan of Reorganization” section for more information).
For a share outstanding throughout each period
| | | | | | | | | | | | | | | | | | | | |
For the period ended: | | Sept. 30,
2007 | | | Sept. 30,
2006 | | | Sept. 30,
20051 | | | Oct. 31,
2004 | | | Oct. 31,
2003 | |
Net asset value, beginning of period | | $ | 9.67 | | | $ | 8.62 | | | $ | 8.27 | | | $ | 7.42 | | | $ | 6.49 | |
Income from investment operations: | | | | | | | | | | | | | | | | | | | | |
Net investment income (loss) | | | 0.10 | 2 | | | 0.11 | | | | 0.05 | 2 | | | 0.03 | | | | 0.05 | |
Net realized and unrealized gain (loss) on investments | | | 0.97 | | | | 1.16 | | | | 0.40 | | | | 0.85 | | | | 1.61 | |
Total from investment operations | | | 1.07 | | | | 1.27 | | | | 0.45 | | | | 0.88 | | | | 1.66 | |
Less distributions: | | | | | | | | | | | | | | | | | | | | |
Distributions from net investment income | | | (0.11 | ) | | | (0.04 | ) | | | (0.03 | ) | | | (0.03 | ) | | | (0.05 | ) |
Distributions from net realized gain | | | (0.44 | ) | | | (0.18 | ) | | | (0.07 | ) | | | 0.00 | | | | (0.68 | ) |
Total from distributions | | | (0.55 | ) | | | (0.22 | ) | | | (0.10 | ) | | | (0.03 | ) | | | (0.73 | ) |
Net asset value, end of period | | $ | 10.19 | | | $ | 9.67 | | | $ | 8.62 | | | $ | 8.27 | | | $ | 7.42 | |
| | | | | | | | | | | | | | | | | | | | |
Total return3 | | | 11.20 | % | | | 15.01 | % | | | 5.44 | % | | | 11.88 | % | | | 28.34 | % |
Ratios/supplemental data: | | | | | | | | | | | | | | | | | | | | |
Net assets, end of period (000s) | | $ | 222,142 | | | $ | 163,397 | | | $ | 163,464 | | | $ | 50,790 | | | $ | 20,419 | |
Ratio of net investment income (loss) to average net assets4 | | | 0.95 | % | | | 1.22 | % | | | 0.67 | % | | | 0.40 | % | | | 0.76 | % |
Ratio of expenses to average net assets prior to waived fees and reimbursed expenses4,5 | | | 1.30 | % | | | 1.30 | % | | | 1.35 | % | | | 1.30 | % | | | 1.20 | % |
Waived fees and reimbursed expenses4 | | | (0.10 | )% | | | (0.10 | )% | | | (0.15 | )% | | | (0.14 | )% | | | (0.04 | )% |
Ratio of expenses to average net assets after waived fees and expenses4,5 | | | 1.20 | % | | | 1.20 | % | | | 1.20 | % | | | 1.16 | % | | | 1.16 | % |
Portfolio turnover rate6 | | | 24 | %7 | | | 29 | %7 | | | 25 | %7 | | | 30 | % | | | 26 | % |
1 | The Fund changed its fiscal year-end from October 31 to September 30. |
2 | Calculated based upon average shares outstanding. |
3 | Total return calculations would have been lower had certain gross expenses not been waived or reimbursed during the periods shown. Returns for periods of less than one year are not annualized. |
4 | During each period, various fees and expenses were waived and reimbursed. The ratio of Gross Expenses to Average Net Assets reflects the expense ratio in the absence of any waivers and reimbursements. |
5 | Includes net expenses allocated from Portfolio(s) in which the Fund invests. |
6 | Calculated on the basis of the Fund as a whole without distinguishing between the classes of shares issued. |
7 | Portfolio turnover rate represents the activity from the Fund’s investment in a single Portfolio. |
E-53
Financial Highlights
The following tables are intended to help you understand the Funds’ financial performance for the past 5 years. Certain information reflects financial results for a single Fund share. Total returns represent the rate you would have earned (or lost) on an investment in the Fund (assuming reinvestment of all distributions). All performance information, along with the report of independent registered public accounting firm and the Funds’ financial statements, is also contained in the Funds’ annual report, a copy of which is available upon request.
C&B Large Cap Value Fund
Administrator Class Shares — Commenced on July 26, 2004
For a share outstanding throughout each period
| | | | | | | | | | | | | | | | |
For the period ended: | | Sept. 30,
2007 | | | Sept. 30,
2006 | | | Sept. 30,
20051 | | | Oct. 31,
20042 | |
Net asset value, beginning of period | | $ | 9.69 | | | $ | 8.64 | | | $ | 8.27 | | | $ | 8.01 | |
Income from investment operations: | | | | | | | | | | | | | | | | |
Net investment income (loss) | | | 0.12 | 3 | | | 0.13 | | | | 0.07 | 3 | | | 0.01 | |
Net realized and unrealized gain (loss) on investments | | | 0.98 | | | | 1.16 | | | | 0.41 | | | | 0.25 | |
Total from investment operations | | | 1.10 | | | | 1.29 | | | | 0.48 | | | | 0.26 | |
Less distributions: | | | | | | | | | | | | | | | | |
Distributions from net investment income | | | (0.13 | ) | | | (0.06 | ) | | | (0.04 | ) | | | 0.00 | |
Distributions from net realized gain | | | (0.44 | ) | | | (0.18 | ) | | | (0.07 | ) | | | 0.00 | |
Total from distributions | | | (0.57 | ) | | | (0.24 | ) | | | (0.11 | ) | | | 0.00 | |
Net asset value, end of period | | $ | 10.22 | | | $ | 9.69 | | | $ | 8.64 | | | $ | 8.27 | |
| | | | | | | | | | | | | | | | |
Total return4 | | | 11.52 | % | | | 15.24 | % | | | 5.74 | % | | | 3.37 | % |
Ratios/supplemental data: | | | | | | | | | | | | | | | | |
Net assets, end of period (000s) | | $ | 590,511 | | | $ | 241,435 | | | $ | 201,181 | | | $ | 9,627 | |
Ratio of net investment income (loss) to average net assets5 | | | 1.23 | % | | | 1.48 | % | | | 0.83 | % | | | 0.47 | % |
Ratio of expenses to average net assets prior to waived fees and reimbursed expenses5,6 | | | 1.12 | % | | | 1.12 | % | | | 1.13 | % | | | 1.39 | % |
Waived fees and reimbursed expenses5 | | | (0.17 | )% | | | (0.17 | )% | | | (0.18 | )% | | | (0.44 | )% |
Ratio of expenses to average net assets after waived fees and expenses5,6 | | | 0.95 | % | | | 0.95 | % | | | 0.95 | % | | | 0.95 | % |
Portfolio turnover rate7 | | | 24 | %8 | | | 29 | %8 | | | 25 | %8 | | | 30 | % |
1 | The Fund changed its fiscal year-end from October 31 to September 30. |
2 | Commencement of operations at beginning of period. |
3 | Calculated based upon average shares outstanding. |
4 | Total return calculations would have been lower had certain gross expenses not been waived or reimbursed during the periods shown. Returns for periods of less than one year are not annualized. |
5 | During each period, various fees and expenses were waived and reimbursed. The ratio of Gross Expenses to Average Net Assets reflects the expense ratio in the absence of any waivers and reimbursements. |
6 | Includes net expenses allocated from Portfolio(s) in which the Fund invests. |
7 | Calculated on the basis of the Fund as a whole without distinguishing between the classes of shares issued. |
8 | Portfolio turnover rate represents the activity from the Fund’s investment in a single Portfolio. |
E-54
EXHIBIT F — MANAGEMENT’S DISCUSSION OF FUND PERFORMANCE
WELLS FARGO ADVANTAGE ASSET ALLOCATION FUND
INVESTMENT OBJECTIVE
The Wells Fargo Advantage Asset Allocation Fund (the Fund) seeks long-term total return, consisting of capital appreciation and current income.
INVESTMENT ADVISER
Wells Fargo Funds Management, LLC
SUBADVISER
Wells Capital Management Incorporated
PORTFOLIO MANAGERS
Galen G. Blomster, CFA
Gregory T. Genung, CFA
Jeffrey P. Mellas
FUND INCEPTION
November 13, 1986
PERFORMANCE SUMMARY
12-MONTH TOTAL RETURN AS OF SEPTEMBER 30, 2007
(EXCLUDING SALES CHARGES)
| | | |
Asset Allocation Fund | | 1-Year | |
Class A | | 14.83 | % |
Benchmark | | | |
Asset Allocation Composite Index1 | | 11.33 | % |
S&P 500 Index2 | | 16.44 | % |
Lehman Brothers 20+ Treasury Index3 | | 3.95 | % |
1 | The Asset Allocation Composite Index is weighted 60% in the S&P 500 Index and 40% in the Lehman Brothers 20+ year U.S. Treasury Bond Index. You cannot invest directly in an Index. |
2 | The S&P 500 Index consists of 500 stocks chosen for market size, liquidity, and industry group representation. It is a market value weighted index with each stock’s weight in the Index proportionate to its market value. You cannot invest directly in an Index. |
3 | The Lehman Brothers 20+ Treasury Index is an unmanaged index composed of securities in the U.S. Treasury Index with maturities of 20 years or greater. You cannot invest directly in an Index. |
Figures quoted represent past performance, which is no guarantee of future results and do not reflect the deduction of taxes that a shareholder may pay on fund distributions or the redemption of fund shares. Investment return and principal value of an investment will fluctuate so that an investor’s shares, when redeemed, may be worth more or less than their original cost. Performance shown without sales charges would be lower if sales charges were reflected. Current performance may be lower or higher than the performance data quoted. Current month-end performance is available on the Funds’ Web site — www.wellsfargo.com/advantagefunds.
F-1
For Class A shares, the maximum front-end sales charge is 5.75%. Performance including sales charge assumes the sales charge for the corresponding time period. Net and gross expense ratios for Class A shares are 1.15% and 1.26%. The investment adviser has contractually committed through January 31, 2009, to waive fees and/or reimburse expenses to the extent necessary to maintain this net operating expense ratio. Without these reductions, the Fund’s returns would have been lower.
4 | The chart compares the performance of the Wells Fargo Advantage Asset Allocation Fund Class A and Administrator Class shares for the most recent ten years with the Asset Allocation Composite Index, the S&P 500 Index and the Lehman Brothers 20+ Treasury Index. The chart assumes a hypothetical $10,000 investment in Class A and Administrator Class shares and reflects all operating expenses and, for Class A shares, assumes the maximum initial sales charge of 5.75%. |
MANAGER’S DISCUSSION
Fund highlights
| | • | | The Fund’s solid performance outpaced its composite benchmark. |
| | • | | Stocks outperformed bonds during the period, and the Fund’s emphasis on stocks significantly added to Fund performance. |
| | • | | The bond market had respectable gains, despite trouble from subprime mortgages. |
Even with the slowdown in housing, the U.S. economy was resilient and corporate profits grew at a healthy pace.
The Fund emphasized stocks throughout most of the 12-month period, and this enhanced the performance of the portfolio as stocks significantly outperformed bonds. Continuing problems in the U.S. subprime housing
F-2
market caused extreme market volatility during the last quarter of the period. Stocks subsequently rallied in the final month after the Fed cut short-term rates by a higher-than-expected 50 basis points.
The bond market showed respectable gains during the 12-month period, despite its underperformance compared to stocks. Problems with subprime mortgages spread to the broader fixed-income markets during the final quarter that ended in September. Although subsequent Fed easing reassured the overall bond market, inflation fears were evident in other markets, including higher commodity prices in the commodities markets and continued dollar weakness in the foreign exchange markets, respectively. The portfolio’s 25% Tactical Asset Allocation (TAA) Model shift away from the U. S. Treasury market toward U.S. stocks throughout most of the period helped to reduce the impact of the relatively lackluster returns from the U.S. bond market over the past year.
| | | |
TEN LARGEST HOLDINGS5,6 AS OF SEPTEMBER 30, 2007) | | | |
US Treasury Bond, 6.13%, 11/15/2027 | | 8.68 | % |
US Treasury Bond, 6.25%, 05/15/2030 | | 7.08 | % |
US Treasury Bond, 5.38%, 02/15/2031 | | 6.38 | % |
US Treasury Bond, 5.50%, 08/15/2028 | | 4.22 | % |
US Treasury Bond, 6.13%, 08/15/2029 | | 4.18 | % |
US Treasury Bond, 5.25%, 02/15/2029 | | 4.02 | % |
US Treasury Bond, 5.25%, 11/15/2028 | | 3.93 | % |
Exxon Mobil Corporation | | 2.31 | % |
General Electric Company | | 1.91 | % |
US Treasury Bill, 3.92%, 02/07/2008 | | 1.26 | % |
5 | The ten largest holdings are calculated based on the market value of the securities divided by total market value of the Fund. |
6 | Portfolio holdings, sector distribution and allocations are subject to change. Cash and cash equivalents are not reflected in the calculations of portfolio holdings/allocations. |
F-3
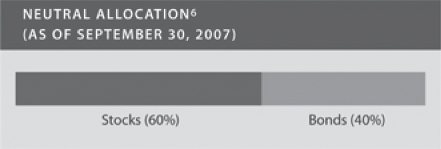
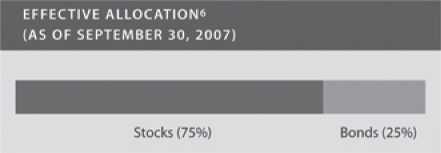
With the most recent shift toward stocks, the portfolio maintained a long position in the S&P 500 Index futures and was short in the long-term U.S. Treasury bond futures.
The stock holdings in the Fund replicate the holdings of the S&P 500 Index, and the bond holdings of the Fund replicate the holdings of the Lehman Brothers 20+ Treasury Bond Index. The TAA Model, which seeks to enhance portfolio returns by shifting assets between stocks and bonds, maintained a 25% shift toward stocks until the quarter that ended in June, when it shifted toward neutral. After remaining at the neutral allocation for a brief period, the TAA Model again identified an opportunity to shift assets in the portfolio toward stocks in the third quarter of 2007, though the shift was more modest at 15% compared to the 25% shift that was in place earlier in the year. To implement an overweight in stocks, the Fund has employed a hedged futures overlay transaction, thus keeping the portfolio’s underlying assets near their long-term strategic asset allocation of 60% stocks and 40% bonds. With the futures overlay, the Fund had an effective allocation of 75% stocks and 25% bonds at the end of the period.
The TAA Model indicates that stocks remain attractive relative to bonds.
The TAA model remains shifted toward stocks. At current levels, U.S. stocks are compellingly attractive relative to U.S. bonds. As a result, the TAA Model has shifted the portfolio allocation from its neutral position of 60% stocks and 40% bonds to its target allocation of 75% stocks and 25% bonds. This position will be maintained until either stocks become more attractive, in which case the shift toward stocks may increase, or until the TAA model indicates that the equilibrium between U.S. stocks and bonds has shifted back to neutral. Should that happen, the portfolio would return to its neutral allocation of 60% stocks and 40% bonds.
F-4
AVERAGE ANNUAL TOTAL RETURN7 (%) (AS OF SEPTEMBER 30, 2007)
| | | | | | | | | | | | | | | | | | | | |
| | | Including Sales Charge | | Excluding Sales Charge | | Expense Ratio |
| | | 6-Month* | | 1-Year | | 5-Year | | 10-Year | | 6-Month* | | 1-Year | | 5-Year | | 10-Year | | Gross8 | | Net9 |
Class A (SFAAX) | | 2.41 | | 8.22 | | 11.45 | | 6.60 | | 8.64 | | 14.83 | | 12.77 | | 7.23 | | 1.26 | | 1.15 |
Class B (SASBX) | | 3.20 | | 9.03 | | 11.66 | | 6.45 | | 8.20 | | 14.03 | | 11.92 | | 6.45 | | 2.01 | | 1.90 |
Class C (WFALX) | | 7.24 | | 12.91 | | 11.91 | | 6.44 | | 8.24 | | 13.91 | | 11.91 | | 6.44 | | 2.01 | | 1.90 |
Administrator Class (WFAIX) | | | | | | | | | | 8.81 | | 15.10 | | 13.05 | | 7.38 | | 1.08 | | 0.90 |
Benchmarks | | | | | | | | | | | | | | | | | | | | |
Asset Allocation Composite Index1 | | | | | | | | | | 6.14 | | 11.33 | | 11.28 | | 7.37 | | | | |
S&P 500 Index2 | | | | | | | | | | 8.44 | | 16.44 | | 15.44 | | 6.58 | | | | |
Lehman Brothers 20+ Treasury Index3 | | | | | | | | | | 2.88 | | 3.95 | | 4.63 | | 7.40 | | | | |
| * | Returns for periods of less than one year are not annualized. |
7 | Performance shown prior to the inception of the Class C shares reflects the performance of the Class A shares, adjusted to reflect Class C sales charges and expenses. Prior to April 11, 2005, the Administrator Class was named the Institutional Class. Performance shown prior to the inception of the Administrator Class reflects the performance of the Class A shares, and includes expenses that are not applicable to and are higher than those of the Administrator Class shares, but does not include Class A sales charges. If it did include Class A sales charges, returns would be lower. |
8 | Reflects the gross expense ratio as stated in the February 1, 2007, prospectus and is based on the Fund’s previous fiscal year expenses as reported in the Financial Highlights. |
9 | The investment adviser has committed through January 31, 2009, to waive fees and/or reimburse expenses to the extent necessary to maintain the net operating expense ratio shown. Without these reductions, the Fund’s returns would have been lower. |
Figures quoted represent past performance, which is no guarantee of future results and do not reflect the deduction of taxes that a shareholder may pay on fund distributions or the redemption of fund shares. Investment return and principal value of an investment will fluctuate so that an investor’s shares, when redeemed, may be worth more or less than their original cost. Performance shown without sales charges would be lower if sales charges were reflected. Current performance may be lower or higher than the performance data quoted. Current month-end performance is available on the Funds’ Web site — www.wellsfargo.com/advantagefunds.
For Class A shares, the maximum front-end sales charge is 5.75%. For Class B shares, the maximum contingent deferred sales charge is 5.00%. For Class C shares, the maximum contingent deferred sales charge is 1.00%. Performance including sales charge assumes the sales charge for the corresponding time period. Administrator Class shares are sold without a front-end sales charge or contingent deferred sales charge.
Balanced funds may invest in stocks and bonds. Stock values fluctuate in response to the activities of individual companies and general market and economic conditions. Bond values fluctuate in response to the financial condition of individual issuers, general market and economic conditions, and changes in interest rates. In general, when interest rates rise, bond values fall and investors may lose principal value. The use of derivatives may reduce returns and/or increase volatility. Consult the Fund’s prospectus for additional information on these and other risks.
F-5
WELLS FARGO ADVANTAGE C&B LARGE CAP VALUE FUND
INVESTMENT OBJECTIVE
The Wells Fargo Advantage C&B Large Cap Value Fund (the Fund) seeks maximum long-term total return (current income and capital appreciation), consistent with minimizing risk to principal.
INVESTMENT ADVISER
Wells Fargo Funds Management, LLC
SUBADVISER
Cooke & Bieler, L.P.
PORTFOLIO MANAGERS
Kermit S. Eck, CFA
Daren C. Heitman, CFA
Michael M. Meyer, CFA
James R. Norris
Edward W. O’Connor, CFA
R. James O’Neil, CFA
Mehul Trivedi, CFA
FUND INCEPTION
May 15, 1990
PERFORMANCE SUMMARY
12-MONTH TOTAL RETURN AS OF SEPTEMBER 30, 2007
(EXCLUDING SALES CHARGES)
| | | |
C&B Large Cap Value Fund | | 1 Year | |
Class A | | 11.20 | % |
Benchmark | | | |
Russell 1000 Value Index1 | | 14.45 | % |
1 | The Russell 1000® Value Index measures performance of those Russell 1000 companies with lower price-to-book ratios and lower forecasted growth values. You cannot invest directly in an Index. |
Figures quoted represent past performance, which is no guarantee of future results and do not reflect the deduction of taxes that a shareholder would pay on fund distributions or the redemptions of fund shares. Investment return and principal value of an investment will fluctuate so that an investor’s shares, when redeemed, may be worth more or less than their original cost. Performance shown without sales charges would be lower if sales charges were reflected. Current performance may be lower or higher than the performance data quoted. Current month-end performance is available on the Funds’ Web site at www.wellsfargo.com/advantagefunds.
For Class A shares, the maximum front-end sales charge is 5.75%. Performance including sales charge assumes the sales charge for the corresponding time period. Net and gross expense ratios for Class A shares are 1.20% and 1.40%. The investment adviser has contractually committed through January 31, 2009, to waive fees and/or reimburse expenses to the extent necessary to maintain this net operating expense ratio. Without these reductions, the Fund’s returns would have been lower.
F-6
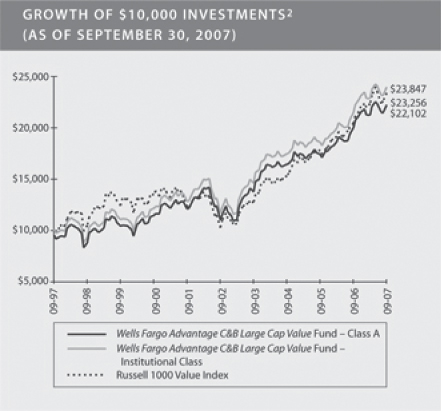
2 | The chart compares the performance of the Wells Fargo Advantage C&B Large Cap Value Fund Class A shares and Institutional Class shares for the most recent ten years with the Russell 1000 Value Index. The chart assumes a hypothetical investment of $10,000 in Class A shares and Institutional Class shares and reflects all operating expenses and, for Class A shares, assumes the maximum initial sales charge of 5.75%. |
MANAGER’S DISCUSSION
Fund highlights
| | • | | The Fund’s solid performance lagged behind its benchmark. |
| | • | | We sold several stocks that had reached their valuation targets so that we could purchase new stocks with more potential for appreciation. |
| | • | | Our hope is that investors will become less complacent and more willing to appropriately price risk. |
The Fund’s relative underperformance was attributable to its underweighting in the energy sector.
Our emphasis on investing in quality businesses with sustainable competitive advantages may at times lead us away from duplicating the sector weightings found in the Fund’s benchmark, the Russell 1000 Value Index. This was true during the last 12 months for us as we positioned the Fund to be underweighted in the energy sector compared to the benchmark. While energy ended up being a positive contributor to the Russell 1000 Value Index, we believe that utilities and commodity-related companies can be fundamentally challenged over the long term by competitive and regulatory constraints. In this case, the Fund’s underweighting in energy explained in large part its underperformance relative to the benchmark.
F-7
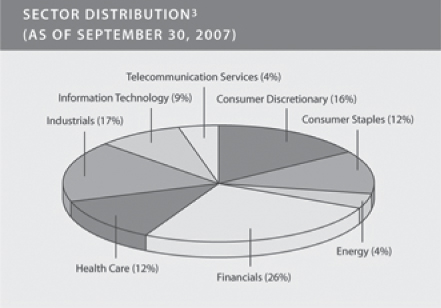
3 | Sector distribution and equity holdings are subject to change. Cash and cash equivalents are not reflected in the calculations of sector distribution and equity holdings. |
More importantly, our strategic stock selection continued to be a positive factor in the Fund’s performance. Positive contributors included Vodafone, McDonald’s, Exxon Mobil, Eaton Corporation, and Illinois Tool Works. Our worst performers included Countrywide Financial, Jones Apparel Group, Molex, Zale, and Avery Dennison.
While the overall market environment was challenging and unpredictable as investors assessed and reassessed their tolerance for risk, we were able to find several suitable stocks for the Fund.
Beyond adding to existing holdings that were temporarily out of favor with Wall Street, we also established new positions in several companies, including Avery Dennison, Diebold, Kohl’s, Wal-Mart Stores, and Williams-Sonoma.
| | | |
TEN LARGEST EQUITY HOLDINGS3,4 (AS OF SEPTEMBER 30, 2007) | | | |
Vodafone Group plc ADR | | 3.73 | % |
Exxon Mobil Corporation | | 3.60 | % |
American Express Company | | 3.40 | % |
American International Group Incorporated | | 3.23 | % |
State Street Corporation | | 3.20 | % |
Bank of America Corporation | | 3.16 | % |
Quest Diagnostics Incorporated | | 3.15 | % |
McDonald’s Corporation | | 3.00 | % |
Omnicom Group Incorporated | | 2.91 | % |
Dover Corporation | | 2.78 | % |
4 | The Ten Largest Equity Holdings are calculated based on the market value of the Master Trust portfolio securities allocable to the Fund divided by total market value of the portfolio of investments of the Fund. See Notes to Financial Statements for a discussion of the Master Trust. |
F-8
To make room for these additions, we eliminated Big Lots, General Dynamics, Hasbro, and Nokia because these companies reached the valuation targets we had set for them. We also sold Freddie Mac and used the proceeds to purchase securities that we believed had more potential for appreciation. Also during the 12-month period, we reevaluated our thesis on Gannett, a newspaper publisher, and sold the position. It had become clear that the Internet had impacted the circulation of this newspaper publisher’s offerings more than we had originally projected. In addition, a small number of holdings were eliminated during the 12-month period as the result of acquisitions and buyouts; they included American Power Conversion, Aramark, and HCA.
We have been concerned for some time about our perception of excessive complacency regarding risk in the financial markets.
As bottom-up stock pickers concerned with good fundamentals, we never know what direction the overall stock market will take in the short term. However, what we can say about the current environment is that we have been concerned for some time about our perception of excessive complacency regarding risk in the financial markets, especially considering the amount of leverage that has been used to finance deals and enhance returns. When it comes to reviewing the history of financial markets, we can find several examples that show how consensus thinking and blind optimism led to significant losses. Nevertheless, we were encouraged when investors recently seemed to be waking up to some of the risks that, by our way of thinking, resulted from excess liquidity, a five-year bull market for stocks, and a global economy that has been aggressively building infrastructure and capacity for some time. While we’re not convinced that the wake-up call was heard by all, especially in light of how quickly investor sentiment seemed to reverse when the Fed took action to lower lending rates and increase liquidity, our hope is that investors will become less complacent and more willing to appropriately price risk than they have in the recent past. If this happens, the market may remain somewhat volatile in the short term with unpredictable returns. While that may not be the preferred scenario, the alternative of watching the market surge followed by a quick decline is less desirable from our point of view.
Either way, our approach will remain the same. Through strict implementation of our high-quality, low-risk investment philosophy, we will diligently research and carefully select attractively valued stocks of financially strong companies with competitively advantaged businesses that generate solid returns, supported by stable cash flows.
AVERAGE ANNUAL TOTAL RETURN5 (%) (AS OF SEPTEMBER 30, 2007)
| | | | | | | | | | | | | | | | | | | | | | | |
| | | Including Sales Charge | | Excluding Sales Charge | | Expense Ratio | |
C&B Large Cap Value Fund | | 6 Months* | | | 1 Year | | 5 Year | | 10 Year | | 6 Months* | | 1 Year | | 5 Year | | 10 Year | | Gross6 | | | Net7 | |
Class A (CBEAX) | | (1.26 | ) | | 4.81 | | 13.85 | | 8.25 | | 4.73 | | 11.20 | | 15.22 | | 8.90 | | 1.40 | % | | 1.20 | % |
Class B (CBEBX) | | (0.65 | ) | | 5.33 | | 14.16 | | 8.13 | | 4.35 | | 10.33 | | 14.39 | | 8.13 | | 2.15 | % | | 1.95 | % |
Class C (CBECX) | | 3.35 | | | 9.34 | | 14.39 | | 8.13 | | 4.35 | | 10.34 | | 14.39 | | 8.13 | | 2.15 | % | | 1.95 | % |
Class D (CBEQX) | | | | | | | | | | | 4.73 | | 11.20 | | 15.22 | | 8.90 | | 1.40 | % | | 1.20 | % |
Administrator Class (CBLLX) | | | | | | | | | | | 4.82 | | 11.52 | | 15.39 | | 8.98 | | 1.22 | % | | 0.95 | % |
Institutional Class (CBLSX) | | | | | | | | | | | 4.90 | | 11.69 | | 15.60 | | 9.08 | | 0.95 | % | | 0.70 | % |
Benchmark | | | | | | | | | | | | | | | | | | | | | | | |
Russell 1000 Value Index1 | | | | | | | | | | | 4.67 | | 14.45 | | 18.07 | | 8.80 | | | | | | |
| * | Returns for periods of less than one year are not annualized. |
5 | Effective December 6, 2004, the Fund is a gateway feeder fund that invests all of its assets in a single master portfolio of the Master Trust with a substantially similar investment objective and substantially similar investment strategies. References to the investment activities of the Fund are intended to refer to the investment activities of the master portfolio in which it invests. Performance shown prior to the inception of |
F-9
| | the Class B and Class C shares reflects the performance of the unnamed share class of the predecessor fund, adjusted to reflect Class B and Class C sales charges and expenses, as applicable. Performance shown prior to the inception of the Class A, Administrator Class and Institutional Class shares reflects the performance of the unnamed share class of the predecessor fund, and includes expenses that are not applicable to and are higher than those of the Class A, Administrator Class and Institutional Class shares. Performance shown prior to July 26, 2004 for the Class D shares reflects the performance of the unnamed share class of the predecessor fund. Prior to April 11, 2005, the Administrator Class was named the Institutional Class and the Institutional Class was named the Select Class. |
6 | Reflects the gross expense ratio as stated in the February 1, 2007, prospectus and is based on the Fund’s previous fiscal year expenses, which includes the gross expenses of the Master Portfolio. The gross expense ratio reported in the Financial Highlights includes only the net expenses of the Master Portfolio. |
7 | The investment adviser has contractually committed through January 31, 2009, to waive fees and/or reimburse expenses to the extent necessary to maintain the net operating expense ratio shown. Without these reductions, the Fund’s returns would have been lower. |
Figures quoted represent past performance, which is no guarantee of future results and do not reflect the deduction of taxes that a shareholder would pay on fund distributions or the redemptions of fund shares. Investment return and principal value of an investment will fluctuate so that an investor’s shares, when redeemed, may be worth more or less than their original cost. Performance shown without sales charges would be lower if sales charges were reflected. Current performance may be lower or higher than the performance data quoted. Current month-end performance is available on the Funds’ Web site at www.wellsfargo.com/advantagefunds.
For Class A shares, the maximum front-end sales charge is 5.75%. For Class B shares, the maximum contingent deferred sales charge is 5.00%. For Class C shares, the maximum contingent deferred sales charge is 1.00%. Performance including sales charge assumes the sales charge for the corresponding time period. Class D, Administrator Class and Institutional Class shares are sold without sales charges or contingent deferred sales charge.
Stock fund values fluctuate in response to the activities of individual companies and general market and economic conditions. The use derivatives may reduce returns and/or increase volatility. Consult the Fund’s prospectus for additional information on these and other risks.
F-10
WELLS FARGO ADVANTAGE GOVERNMENT SECURITIES FUND
INVESTMENT OBJECTIVE
The Wells Fargo Advantage Government Securities Fund (the Fund) seeks current income.
| | |
| INVESTMENT ADVISER | | SUBADVISER |
Wells Fargo Funds Management, LLC | | Wells Capital Management Incorporated |
| |
| FUND MANAGERS | | FUND INCEPTION |
Michael J. Bray, CFA | | 10/29/1986 |
W. Frank Koster | | |
Jay N. Mueller, CFA | | |
HOW DID THE FUND PERFORM OVER THE 12-MONTH REPORTING PERIOD?
The Fund’s Investor Class shares returned 5.55%1 for the 12-month period that ended May 31, 2007, underperforming its benchmark, the Lehman Brothers U.S. Aggregate Excluding Credit Bond Index4, which returned 6.45%. In addition, the Fund outperformed the Lehman Brothers Intermediate U.S. Government Bond Index5, which returned 5.48% during the same period.
1 | Performance shown prior to April 11, 2005 for the Class C, Advisor Class, Institutional Class and Investor Class shares reflects the performance of the Class C, Advisor Class, Institutional Class and Investor Class shares, respectively, of the Strong Government Securities Fund, the predecessor fund. Performance shown prior to the inception of the Class C shares reflects the performance of the Investor Class shares of the predecessor fund, adjusted to reflect Class C sales charges and expenses. Performance shown prior to the inception of the Advisor Class shares reflects the performance of the Investor Class shares of the predecessor fund, adjusted to reflect Advisor Class expenses. Performance shown prior to the inception of the Institutional Class shares reflects the performance of the Investor Class shares of the predecessor fund, and includes expenses that are not applicable to and are higher than those of the Institutional Class shares. Performance shown prior to the inception of the Administrator Class shares reflects the performance of the Institutional Class shares of the predecessor fund, adjusted to reflect Administrator Class expenses. Performance shown prior to August 31, 1999 for the Administrator Class shares reflects the performance of the Investor Class shares of the predecessor fund, and includes expenses that are not applicable to and are higher than those of the Administrator Class shares. |
Figures quoted represent past performance, which is no guarantee of future results. Investment return and principal value of an investment will fluctuate so that an investor’s shares, when redeemed, may be worth more or less than their original cost. Performance shown without sales charges would be lower if sales charges were reflected. Current performance may be lower or higher than the performance data quoted. Current month-end performance is available on the Fund’s Web site — www.wellsfargo.com/advantagefunds.
For Class C shares the maximum contingent deferred sales charge is 1.00%. Performance including sales charges assumes the sales charge for the corresponding time period. Administrator Class, Advisor Class, Institutional Class, and Investor Class shares are sold without a front-end sales charge or contingent deferred sales charge.
WHAT FACTORS AFFECTED THE FUND’S PERFORMANCE?
Interest rates fell substantially during much of the period due in part to a continued retreat in the housing market and investor concern about the subprime mortgage market. The yield of the 10-year U.S. Treasury note fell from 5.12% to 4.46% during the first six months of the period. This move was partially reversed during the second half of the period, and by May 31, 2007, the yield of the 10-year U.S. Treasury had risen to about 4.90%.
F-11
Throughout much of the period, we maintained an interest rate exposure slightly longer than our market-based benchmark. Consequently, we benefited from the decline in interest rates, and the Fund’s duration (sensitivity to interest rates) and yield-curve positioning contributed to performance. While we maintained considerable holdings in mortgage-backed securities (MBS), the Fund was underweighted in MBS relative to its benchmark. Holding fewer mortgage securities reduced the incremental income in the Fund and detracted from performance.
WHAT CHANGES DID YOU MAKE TO THE FUND’S HOLDINGS DURING THE PERIOD?
We carried a slightly longer portfolio duration for much of the period and elected to move to a neutral duration as rates declined and the market adjusted to expectations that the Fed would cut the federal funds rate. We were able to take advantage of the situation because the market’s expectation was not consistent with our outlook. With respect to yield-curve positioning, the yield curve had inverted and long-term interest rates were lower than short-term interest rates. The inverted yield curve prompted us to change the Fund’s neutral duration in order to be well positioned for a steeper yield curve. In addition, we began to add agency debentures and MBS to reduce the Fund’s long-standing, underweighted position in these sectors.
LOOKING AHEAD, WHAT IS YOUR STRATEGIC OUTLOOK?
The U.S. economic expansion entered a mid-cycle slowdown in the second quarter of 2006. While housing and high energy costs remain impediments to growth, we believe that the worst of the slowdown is now behind us. There could be a few more quarters of subtrend growth as the housing sector continues its retrenchment, but we continue to believe that a slide into recessionary conditions is unlikely this year. Recent data on consumer spending, employment, and manufacturing generally support this view.
Against this backdrop, we believe that inflation (excluding the effects of energy costs) is likely to remain close to current levels. Although the Fed has signaled its concern about pressures on the core inflation rate, we believe that the U.S. central bank will leave its overnight rate targets unchanged for the remainder of this year.
Bond fund values fluctuate in response to the financial condition of individual issuers, general market and economic conditions, and changes in interest rates. In general, when interest rates rise, bond fund values fall and investors may lose principal value. The use of derivatives may reduce returns and/or increase volatility. Securities issued by U.S. Government agencies or government-sponsored entities may not be guaranteed by the U.S. Treasury. Active trading results in increased turnover and trading expenses, and may generate higher short-term capital gains. Consult the Fund’s prospectus for additional information on these and other risks. The U.S. Government guarantee applies to certain of the underlying securities and NOT to shares of the Fund.
AVERAGE ANNUAL TOTAL RETURN1 (%) (AS OF MAY 31, 2007)
| | | | | | | | | | | | | | | | | | | | | | | |
| | | Including Sales Charge | | Excluding Sales Charge | | Gross
Expense
Ratio2 | | | Net
Expense
Ratio3 | |
| | | 6-Months* | | | 1-Year | | 5-Year | | 10-Year | | 6-Months* | | 1-Year | | 5-Year | | 10-Year | | |
Class C | | (0.89 | ) | | 3.89 | | 3.09 | | 4.67 | | 0.11 | | 4.89 | | 3.09 | | 4.67 | | 1.80 | % | | 1.70 | % |
Administrator Class | | | | | | | | | | | 0.61 | | 5.94 | | 4.35 | | 5.90 | | 0.88 | % | | 0.70 | % |
Advisor Class | | | | | | | | | | | 0.51 | | 5.71 | | 4.02 | | 5.52 | | 1.05 | % | | 0.90 | % |
Institutional Class | | | | | | | | | | | 0.62 | | 6.17 | | 4.57 | | 6.08 | | 0.60 | % | | 0.48 | % |
Investor Class | | | | | | | | | | | 0.38 | | 5.55 | | 4.07 | | 5.69 | | 1.22 | % | | 0.95 | % |
Benchmarks | | | | | | | | | | | | | | | | | | | | | | | |
Lehman Brothers U.S. Aggregate Excluding Credit Bond Index4 | | 0.79 | | 6.45 | | 4.40 | | N/A | | | | | | |
Lehman Brothers Intermediate U.S. Government Bond Index5 | | 1.01 | | 5.48 | | 3.73 | | 5.43 | | | | | | |
F-12
| * | Returns for periods of less than one year are not annualized. |
2 | Reflects the gross expense ratio as stated in the October 1, 2006, prospectus and is based on the Fund’s previous fiscal year expenses as reported in the Financial Highlights. |
3 | The investment adviser has contractually committed through September 30, 2007, to waive fees and/or reimburse expenses to the extent necessary to maintain the net operating expense ratio shown. Without these reductions, the Fund’s returns would have been lower. |
4 | The Lehman Brothers U.S. Aggregate Excluding Credit Bond Index is composed of the Lehman Brothers U.S. Government Bond Index and the Lehman Brothers U.S. Mortgage-Backed Securities Index and includes Treasury issues, agency issues, and mortgage-backed securities. The limited performance history of the Lehman Brothers U.S. Aggregate Excluding Credit Bond Index does not allow for comparison to all periods of the Fund’s performance. This index has an inception date of May 1, 2001. You cannot invest directly in an Index. |
5 | The Lehman Brothers Intermediate U.S. Government Bond Index is an unmanaged index composed of U.S. Government securities with maturities in the one- to ten year range, including securities issued by the U.S. Treasury and U.S. Government agencies. You cannot invest directly in an Index. |
| | |
PORTFOLIO ALLOCATION6
(AS OF MAY 31, 2007) | | GROWTH OF $10,000 INVESTMENT7
(AS OF MAY 31, 2007) |
| |
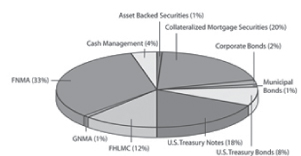
| | 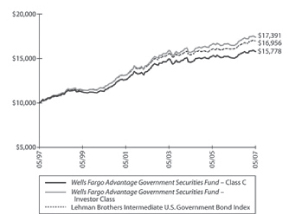
|
6 | Portfolio allocation is subject to change. |
7 | The chart compares the performance of the Wells Fargo Advantage Government Securities Fund Class C and Investor Class shares for the most recent ten years with the Lehman Brothers Intermediate U.S. Government Bond Index. The chart assumes a hypothetical investment of $10,000 in Class C and Investor Class shares, reflects all operating expenses and, for Class C shares, assumes the maximum contingent-deferred sales charge of 1.00%. |
F-13
WELLS FARGO ADVANTAGE HIGH INCOME FUND
INVESTMENT OBJECTIVE
The Wells Fargo Advantage High Income Fund (the Fund) seeks total return, consisting of a high level of current income and capital appreciation.
| | |
| INVESTMENT ADVISER | | SUBADVISER |
Wells Fargo Funds Management, LLC | | Wells Capital Management Incorporated |
| |
| FUND MANAGER | | FUND INCEPTION |
Thomas M. Price, CFA | | 12/28/1995 |
HOW DID THE FUND PERFORM OVER THE 12-MONTH REPORTING PERIOD?
The Fund’s Investor Class shares returned 10.95%1 for the 12-month period that ended May 31, 2007, underperforming its benchmark, the Lehman Brothers U.S. Corporate High Yield Bond Index4, which returned 13.19% during the same period.
1 | Performance shown prior to April 11, 2005 for the Advisor Class, Institutional Class and Investor Class shares reflects the performance of the Advisor Class, Institutional Class and Investor Class shares, respectively, of the Strong High-Yield Bond Fund, the predecessor fund. Performance shown prior to the inception of the Advisor Class shares reflects the performance of the Investor Class shares of the predecessor fund, adjusted to reflect Advisor Class expenses. Performance shown prior to the inception of the Institutional Class shares reflects the performance of the Investor Class shares of the predecessor fund, and includes expenses that are not applicable to and are higher than those of the Institutional Class shares. |
Figures quoted represent past performance, which is no guarantee of future results. Investment return and principal value of an investment will fluctuate so that an investor’s shares, when redeemed, may be worth more or less than their original cost. Current performance may be lower or higher than the performance data quoted. Current month-end performance is available on the Funds’ Web site — www.wellsfargo.com/advantagefunds.
Advisor Class, Institutional Class, and Investor Class shares are sold without a front-end sales charge or contingent deferred sales charge. The Fund has a redemption fee of 2.00% deducted from the net proceeds of shares redeemed or exchanged within 30 days after purchase. Performance data does not reflect the deduction of this fee, which, if reflected, would reduce the performance.
WHAT FACTORS AFFECTED THE FUND’S PERFORMANCE?
The market was much stronger than we expected it to be during the period. Low levels of corporate defaults and global liquidity combined to provide a strong backdrop for high-yield securities. The percentage of U.S. issuers that have defaulted in the prior year, according to Moody’s Investors Service, is below 1.5%, close to the lowest level in the last 25 years. The yield on the 10-year U.S. Treasury note also rallied from 5.12% to 4.89% during the period, providing a positive backdrop for high-yield corporate bond returns.
Several factors contributed to the Fund’s relative underperformance. The largest factor was conservative positioning. High-yield spreads finished the period at all-time tight levels compared to U.S. Treasuries. We don’t believe that the current risk and reward trade-off justifies a neutral or aggressive stance. We maintained a higher than usual cash balance during the first six months of the period. Our positions in bank debt provided solid income but did not experience the same price appreciation enjoyed by most high-yield bonds. We were also conservatively positioned within the riskiest sectors (CCC and lower) of the market, which significantly outperformed. Another important factor was our decision to limit the Fund’s maximum exposure to any one issuer to 3%. General Motors and Ford Motor, along with their finance subsidiaries, represent more than 11% of
F-14
the Fund’s benchmark index. Both issuers significantly outperformed the overall high-yield market during the period. However, we did not believe that having greater exposure would be prudent, because it would require significant concentration of the portfolio in highly correlated companies.
WHAT CHANGES DID YOU MAKE TO THE FUND’S HOLDINGS DURING THE PERIOD?
We have been slowly improving the overall credit quality of the portfolio. We ended the period with just over 5% of the portfolio in investment-grade bonds. Most of the securities were rated BB at the time of purchase and were subsequently upgraded by the ratings agencies. We generally maintain cash balances at 3% or less, but our average cash balance during the period was higher than normal.
The most significant changes we made to the Fund’s industry exposures were to increase positions in finance, communications, utilities, and environmental. We significantly reduced positions in the consumer products, energy, metals, entertainment, and home construction industries. Our view is that the slowdown in the housing industry will continue for some time, so we have sold all of our homebuilding bonds. The changes to the remaining industries were driven by our credit analysis of individual companies, rather than a change in our overall view of performance in any given industry.
We significantly reduced our combined positions in bank debt and floating-rate bonds by approximately 8% during the period, down to 9% of the Fund’s holdings. Most of the reduction was in floating-rate bonds. Although these positions are generating attractive income, they have limited potential for price appreciation relative to fixed-rate bonds.
LOOKING AHEAD, WHAT IS YOUR STRATEGIC OUTLOOK?
We believe that the fundamental backdrop remains favorable for the high-yield market for the near future. We expect default rates to remain low throughout 2007. However, with high-yield spreads at near historically tight levels, we believe that the positive fundamentals are more than reflected in bond prices, and the proper response is to continue to position the Fund accordingly.
Bond fund values fluctuate in response to the financial condition of individual issuers, general market and economic conditions, and changes in interest rates. In general, when interest rates rise, bond fund values fall and investors may lose principal value. High-yield securities have a greater risk of default and tend to be more volatile than higher-rated debt securities. The use of derivatives may reduce returns and/or increase volatility. Active trading results in increased turnover and trading expenses, and may generate higher short-term capital gains. Certain investment strategies tend to increase the total risk of an investment (relative to the broader market). This Fund is exposed to foreign investment risk. Consult the Fund’s prospectus for additional information on these and other risks.
AVERAGE ANNUAL TOTAL RETURN1 (%) (AS OF MAY 31, 2007)
| | | | | | | | | | | | | | |
| | | 6-Months* | | 1-Year | | 5-Year | | 10-Year | | Gross
Expense
Ratio2 | | | Net
Expense
Ratio3 | |
Advisor Class | | 5.41 | | 10.96 | | 8.97 | | 5.32 | | 1.17 | % | | 0.86 | % |
Institutional Class | | 5.76 | | 11.39 | | 9.72 | | 5.89 | | 0.77 | % | | 0.43 | % |
Investor Class | | 5.41 | | 10.95 | | 9.09 | | 5.54 | | 1.34 | % | | 0.86 | % |
Benchmark | | | | | | | | | | | | | | |
Lehman Brothers U.S. Corporate High Yield Bond Index4 | | 5.90 | | 13.19 | | 10.61 | | 6.63 | | | | | | |
| * | Returns for periods of less than one year are not annualized. |
F-15
2 | Reflects the gross expense ratio as stated in the October 1, 2006, prospectus and is based on the Fund’s previous fiscal year expenses as reported in the Financial Highlights. |
3 | The investment adviser has contractually committed through September 30, 2007, to waive fees and/or reimburse expenses to the extent necessary to maintain the net operating expense ratio shown. Without these reductions, the Fund’s returns would have been lower. |
4 | Lehman Brothers U.S. Corporate High Yield Bond Index is an unmanaged, U.S. dollar-denominated, nonconvertible, non-investment grade debt index. The Index consists of domestic and corporate bonds rate Ba and below with a minimum outstanding amount of $150 million. You cannot invest directly in an Index. |
| | |
CREDIT QUALITY5
(AS OF MAY 31, 2007) | | GROWTH OF $10,000 INVESTMENT6
(AS OF MAY 31, 2007) |
| |
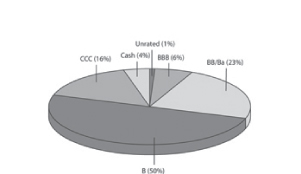 | | 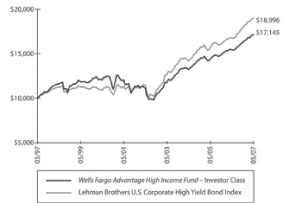 |
5 | The ratings indicated are from Standard & Poor’s and/or Moody’s Investors Service. Allocations are subject to change. |
6 | The chart compares the performance of the Wells Fargo Advantage High Income Fund Investor Class for the most recent ten years with the Lehman Brothers U.S. Corporate High Yield Bond Index. The chart assumes a hypothetical investment of $10,000 in the Investor Class shares and reflects all operating expenses. |
F-16
WELLS FARGO ADVANTAGE INCOME PLUS FUND
INVESTMENT OBJECTIVE
The Wells Fargo Advantage Income Plus Fund (the Fund) seeks to maximize income while maintaining prospects for capital appreciation.
| | |
| INVESTMENT ADVISER | | SUBADVISER |
Wells Fargo Funds Management, LLC | | Wells Capital Management Incorporated |
| |
| FUND MANAGERS | | FUND INCEPTION |
W. Frank Koster | | 07/13/1998 |
Thomas M. Price, CFA | | |
HOW DID THE FUND PERFORM OVER THE 12-MONTH REPORTING PERIOD?
The Fund’s Class A shares returned 7.04% (excluding sales charge) for the 12-month period that ended May 31, 2007, under-performing its benchmark, the Lehman Brothers U.S. Universal Bond Index3 which returned 7.24% during the same period.
Figures quoted represent past performance, which is no guarantee of future results. Investment return and principal value of an investment will fluctuate so that an investor’s shares, when redeemed, may be worth more or less than their original cost. Performance shown without sales charges would be lower if sales charges were reflected. Current performance may be lower or higher than the performance data quoted. Current month-end performance is available on the Fund’s Web site at — www.wellsfargo.com/advantagefunds.
For Class A shares, the maximum front-end sales charge is 4.50%. For Class B shares, the maximum contingent deferred sales charge is 5.00%. For Class C shares, the maximum contingent deferred sales charge is 1.00%. Performance including sales charges assumes the sales charge for the corresponding time period.
WHAT FACTORS AFFECTED THE FUND’S PERFORMANCE?
The Fund’s duration (sensitivity to interest rates) positioning detracted from its performance. We had thought that short- and intermediate-term interest rates would remain relatively stable or even rise. Instead, rates generally fell across the maturity spectrum, which hurt performance because the Fund had a slightly short duration position relative to the benchmark for some of the period. On balance, however, our positioning and opportunistic trading within the mortgage sector added value to the Fund and helped it to outperform the benchmark during the last six months of the period.
While the subprime sector of the mortgage market struggled during the period, we made decisions based on our expectation that the subprime sector will have minimal impact on the larger mortgage-backed securities (MBS) market. There is now a split between MBS pools collateralized by conventional loans and those collateralized by subprime loans.
In corporate bonds, technicals and fundamentals remained strong and defaults were low. Leveraged buyouts and merger and acquisition activity remained strong for corporate securities, adding some risk to that area of the bond market. Our primary focus in the corporate bond market was to identify relative value trades and credit names with improved quality and lower event risk profiles. This strategy contributed to Fund performance.
WHAT CHANGES DID YOU MAKE TO THE FUND’S HOLDINGS DURING THE PERIOD?
Consistent with our current investment strategy to manage the Fund’s risk, we continued to move the Fund’s duration closer to neutral and also reduced our high-yield exposure in the Fund to approximately 10%. We traded opportunistically as the market sold off and rallied, which helped neutralize the negative impact of our previous short duration bias.
F-17
LOOKING AHEAD, WHAT IS YOUR STRATEGIC OUTLOOK?
Despite the steady declines in the auto and housing industries, the overall economy remains healthy. On balance, we believe that Gross Domestic Product growth in the second half of 2007 may be around 2% and inflation will continue at its moderate pace. We expect the core Consumer Price Index and the core Personal Consumption Expenditures deflator to remain above the Fed’s implicit target zone for the remainder of 2007. Measures of consumer confidence are much stronger today than they were 15 years ago when the economy entered the consumer-led recession of 1990 — 1991. In our view, the job market should remain healthy with unemployment hovering around 4.5% through the end of 2007. We believe that the Fed will keep the federal funds rate at 5.25% throughout the remainder of the year and that the next Fed move will likely be sometime in 2008.
Within the high-yield market, default rates will likely increase in 2008 but will remain below long-term averages. Given the current economic and market environment, we expect spreads to widen, but we anticipate total returns will be positive over the remainder of the year. We plan to continue to position the Fund conservatively in the months ahead.
Bond fund values fluctuate in response to the financial condition of individual issuers, general market and economic conditions, and changes in interest rates. In general, when interest rates rise, bond fund values fall and investors may lose principal value. The use of derivatives may reduce returns and/or increase volatility. Active trading results in increased turnover and trading expenses, and may generate higher short-term capital gains. Certain investment strategies tend to increase the total risk of an investment (relative to the broader market). This Fund is exposed to foreign investment risk and high-yield securities risk. Consult the Fund’s prospectus for additional information on these and other risks.
AVERAGE ANNUAL TOTAL RETURN (%) (AS OF MAY 31, 2007)
| | | | | | | | | | | | | | | | | | | | | | | |
| | | Including Sales Charge | | Excluding Sales Charge | | Gross
Expense
Ratio1 | | | Net
Expense
Ratio2 | |
| | | 6-Months* | | | 1-Year | | 5-Year | | Life of Fund | | 6-Months* | | 1-Year | | 5-Year | | Life of Fund | | |
Class A | | (3.02 | ) | | 2.27 | | 4.61 | | 4.04 | | 1.58 | | 7.04 | | 5.57 | | 4.58 | | 1.29 | % | | 1.00 | % |
Class B | | (3.80 | ) | | 1.24 | | 4.43 | | 3.80 | | 1.20 | | 6.24 | | 4.77 | | 3.80 | | 2.04 | % | | 1.75 | % |
Class C | | 0.20 | | | 5.24 | | 4.77 | | 3.80 | | 1.20 | | 6.24 | | 4.77 | | 3.80 | | 2.04 | % | | 1.75 | % |
Benchmark | | | | | | | | | | | | | | | | | | | | | | | |
Lehman Brothers U.S. Universal Bond Index3 | | 1.09 | | 7.24 | | 5.34 | | 5.83 | | | | | | |
| * | Returns for periods of less than one year are not annualized. |
1 | Reflects the gross expense ratio as stated in the October 1, 2006, prospectus and is based on the Fund’s previous fiscal year expenses as reported in the Financial Highlights. |
2 | The investment adviser has contractually committed through September 30, 2007, to waive fees and/or reimburse expenses to the extent necessary to maintain the net operating expense ratio shown. Without these reductions, the Fund’s returns would have been lower. |
3 | The Lehman Brothers U.S. Universal Bond Index is an unmanaged market-value-weighted performance benchmark for the U.S. dollar denominated bond market, which includes investment grade, high yield, and emerging market debt securities with maturities of one year or more. You cannot invest directly in an Index. |
F-18
| | |
| PORTFOLIO ALLOCATION4 (AS OF MAY 31, 2007) | | GROWTH OF $100,000 INVESTMENT5
(AS OF MAY 31, 2007) |
| |
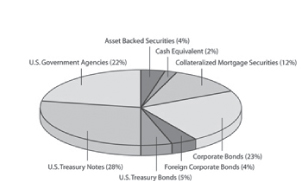
| | 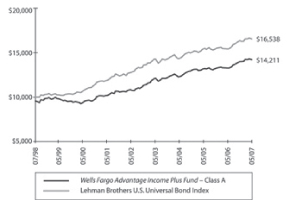
|
4 | Portfolio allocation is subject to change. |
5 | The chart compares the performance of the Wells Fargo Advantage Income Plus Fund Class A shares for the life of the Fund with the Lehman Brothers U.S. Universal Bond Index. The chart assumes a hypothetical $10,000 investment in Class A shares, reflects all operating expenses and assumes the maximum initial sales charge of 4.50%. |
F-19
WELLS FARGO ADVANTAGE INTERNATIONAL EQUITY FUND
INVESTMENT OBJECTIVE
The Wells Fargo Advantage International Equity Fund (the Fund) seeks long-term capital appreciation.
INVESTMENT ADVISER
Wells Fargo Funds Management, LLC
SUBADVISER
Artisan Partners Limited Partnership LSV Asset Management New Star Institutional Managers Limited
PORTFOLIO MANAGERS
Mark Beale
Brian Coffey
Josef Lakonishok
Richard Lewis
Puneet Mansharamani, CFA
Menno Vermeulen, CFA
Robert W. Vishny
Mark L. Yockey, CFA
FUND INCEPTION
September 24, 1997
PERFORMANCE SUMMARY
12-MONTH TOTAL RETURN AS OF SEPTEMBER 30, 2007
(EXCLUDING SALES CHARGES)
| | | |
International Equity Fund | | 1 Year | |
Class A | | 23.68 | % |
Benchmark | | | |
MSCI EAFE® Index1 | | 24.86 | % |
1 | The Morgan Stanley Capital International Europe, Australasia and Far East (“MSCI EAFE”)SM Index is an unmanaged group of securities widely regarded by investors to be representations of the stock markets of Europe, Australasia and the Far East. You cannot invest directly in an Index. |
Figures quoted represent past performance, which is no guarantee of future results and do not reflect the deduction of taxes that a shareholder may pay on fund distributions or the redemption of fund shares. Investment return and principal value of an investment will fluctuate so that an investor’s shares, when redeemed, may be worth more or less than their original cost. Performance shown without sales charges would be lower if sales charges were reflected. Current performance may be lower or higher than the performance data quoted. Current month-end performance is available on the Funds’ Web site — www.wellsfargo.com/advantagefunds.
For Class A shares, the maximum front-end sales charge is 5.75%. Performance including sales charge assumes the sales charge for the corresponding time period. Net and gross expense ratios for Class A shares are
F-20
1.50% and 1.67%. The investment adviser has contractually committed through January 31, 2009, to waive fees and/or reimburse expenses to the extent necessary to maintain the net operating expense ratio shown.
The Fund has a redemption fee of 2.00% deducted from the net proceeds of shares redeemed or exchanged within 30 days after purchase. Performance data does not reflect the deduction of this fee, which, if reflected, would reduce the performance.
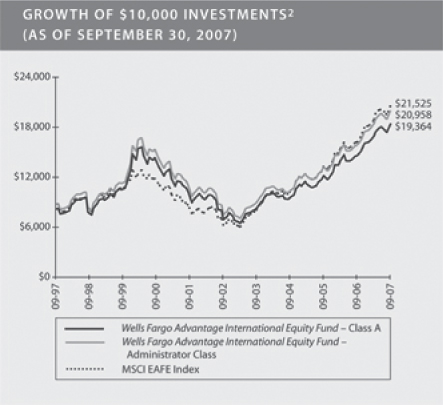
2 | The chart compares the performance of the Wells Fargo Advantage International Equity Fund Class A and Administrator Class shares for the most recent ten years of the Fund with the MSCI EAFE Index. The chart assumes a hypothetical investment of $10,000 in Class A and Administrator Class shares and reflects all operating expenses and, for Class A shares, assumes the maximum initial sales charge of 5.75%. |
The Fund uses three different styles of international equity management: international value style, subadvised by LSV Asset Management (LSV); international core style, subadvised by New Star Institutional Managers Limited (New Star); international growth style, subadvised by Artisan Partners Limited Partnership (Artisan).
MANAGER’S DISCUSSION
Fund highlights
| | • | | The Fund modestly underperformed its benchmark during the past year. |
| | • | | Given the Fund’s diversification, the outperformance of larger cap companies compared to their smaller and mid cap counterparts in the growth category held back the Fund’s performance to some extent. |
| | • | | At the same time, an overweighting in Asia benefited the Fund’s performance. |
F-21
Stock selection and country allocation both affected the Fund’s performance.
The LSV portfolio was helped by an overweighting in materials and telecommunication stocks. The materials sector in particular was driven by global economic growth — especially in emerging markets, which benefited from strong demand for commodities. Also helping was the underweighting in the health care sector, which posted only modest gains overall. Partially offsetting these positive influences were overweightings in financial and consumer discretionary stocks. Both groups struggled in response to the subprime mortgage crisis late in the period.
Individual stocks that added to the LSV portfolio returns included steel companies Nippon Steel, based in Japan; Voestalpine, located in Austria; and Finland’s Rautaruukki. All three companies benefited from strong worldwide steel demand. A number of the industrial holdings also helped, including shipping companies Orient Overseas and Neptune Orient Lines — based in Hong Kong and Singapore, respectively — as well as CITIC Pacific, a Hong Kong — based conglomerate whose infrastructure-related businesses include power generation, aviation, and trading and distribution services. All three stocks more than doubled during the period. Exposure to the automotive industry contributed as well, as our positions in car manufacturers Fiat (Italy) and Daimler (Germany) posted strong returns.
| | | |
TEN LARGEST EQUITY HOLDINGS3,4 (AS OF SEPTEMBER 30, 2007) | | | |
DaimlerChrysler AG | | 1.69 | % |
Vodafone Group plc | | 1.44 | % |
Allianz SE | | 1.37 | % |
Roche Holding AG Genusshein | | 1.23 | % |
Nestle SA | | 1.17 | % |
Telefonica SA | | 1.11 | % |
Lloyds TSB Group plc | | 1.03 | % |
National Grid plc | | 1.03 | % |
Total SA | | 1.02 | % |
ENI SpA | | 1.00 | % |
3 | Ten largest equity holdings and portfolio composition are subject to change. Cash and cash equivalents are not reflected in the calculations of ten largest equity holdings and sector distribution. |
4 | The Ten Largest Equity Holdings are calculated based on the market value of the securities divided by total market value of the portfolio. |
Although being overweighted in the solid-performing telecommunications sector was positive for the LSV portfolio, stock selection within the sector detracted somewhat, with Japanese telecommunications companies NTT and NTT DoCoMo struggling. In addition, several consumer discretionary and financial holdings lagged, such as U.K.-based consumer electronics retailer DSG International and mortgage bank Alliance & Leicester.
The New Star portfolio was overweight in the Pacific Basin, excluding Japan, and in particular was overweight in Hong Kong and Singapore. These markets gained 51% and 63.8%, respectively, during the period, and the impact was positive for performance. The Asia overweight was chiefly financed from a large underweight in the United Kingdom and a modest underweight in Japan.
The negative contribution at the stock level came from Japan and Europe, and its impact was minimized by positive contributions from Australia and Hong Kong. Japanese stock selection was negative as the holdings in financials and housing were disappointing. We reduced exposure to both segments because recovery looked unlikely. Stock selection in Japan improved as we switched toward more cyclical holdings in materials and industrials, but the total impact remained negative. In Europe, the underweight in materials, especially in the United Kingdom, detracted from Fund performance as the large-cap mining companies performed well. The overweight in energy stocks in Europe also hampered performance; the large-cap oil stocks disappointed even as crude oil increased 30%. In
F-22
Australia, the Fund benefited from an overweight in the mining giant Rio Tinto and insurance companies QBE and AXA Asia Pacific. In Hong Kong, holdings in real estate companies Cheung Kong, Hang Lung Properties, and Sun Hung Kai Properties all performed well while returns were further boosted by China Mobile.
The Artisan portfolio benefited from positive stock selection and exposure to emerging markets such as China. Artisan’s demographic and infrastructure themes were key sources of security selection strength in the telecommunications, utilities, financials, and energy sectors. The list of top contributors in those themes and sectors included French industrial conglomerate Bouygues SA, Chinese wireless providers China Mobile Ltd. and China Unicom Limited, French electricity producer Electricite de France, Chinese insurance company China Life Insurance Co., Limited, Russian utility company RAO Unified Energy System, French energy infrastructure company Technip SA and Norwegian energy infrastructure company SeaDrill Ltd. French construction company Alstom, German specialty chemicals company Wacker Chemie AG and Korean Internet and online gaming company NHN Corp. also performed very well. Wacker Chemie and NHN were purchased during the period.
Returns relative to the Index were negatively impacted by low exposure in a strong materials sector and weakness in the consumer finance related holdings in Japan. In the consumer finance industry, the Artisan portfolio was hurt by weakness in Japanese retail affiliated credit card company Credit Saison Co., Ltd., Japanese general leasing company ORIX Corporation and Japanese consumer finance company AIFUL CORPORATION. We sold Aiful due to reduced expectations for future growth.
Changes in the Fund were driven by the three investment styles that include value, core, and growth.
LSV seeks to add value through an individual stock selection process that favors deep value. During the period the Fund’s LSV portfolio’s average market capitalization continued to increase gradually. From a sector perspective, weightings in industrials and telecommunications increased, while allocations to financials and utilities decreased. Even though exposure to financials was reduced somewhat, this sector accounted for the largest part of the portfolio.
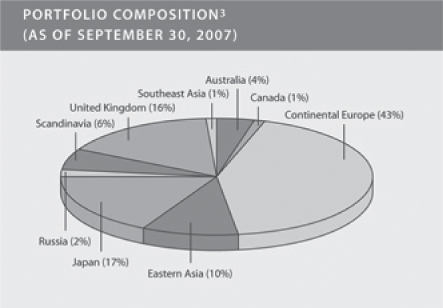
New Star made several changes to the Fund’s core portfolio, which included adding to its position in property developer Cheung Kong and buying a new position in Hang Lung Properties. Despite taking partial profits in China Mobile and Sun Hung Kai Properties in Hong Kong the net effect of New Star’s activity was to increase the Hong Kong exposure from 4.2% to 6.4%. Australian weightings were lifted with the purchase of Woodside Petroleum and Santos in the energy sector while the purchase of Axa Asia Pacific lifted the financials
F-23
exposure. In the United Kingdom, New Star sold the position in HSBC early in the year due to concern over its exposure to the U.S. subsidiary, Household. New Star also reduced the holding in the mobile operator Vodafone after strong gains. Further reductions were made in brewer Scottish & Newcastle and in Royal Dutch Shell. This activity took the United Kingdom exposure from 19.7% to 17.7% by the end of the period. In Japan, though the weighting was lower at 18.2% from 19.6%, we reduced exposure to financials with the sale of insurers Millea and Mitsui Sumitomo and raised exposure in the Real estate segment through purchases of Mitsui Fudosan and Japan East Railways (which has extensive property assets). Similarly in Europe, excluding the United Kingdom, though overall exposure was changed little we reduced holdings in financials with sales of BBVA in Spain, Danske Bank in Denmark, and Commerzbank in Germany. European purchases included Nokia in Finland and Daimler Chrysler and Siemens in Germany as well as Telefonica in Spain. We judged these companies to have more secure earnings than the financials which were sold.
Artisan’s fundamental investment decisions had the largest impact on weightings in the financial sector and Japan, both of which declined considerably. Its list of sales in those two areas included UBS AG, Mizuho Financial Group, Inc., UniCredito Italiano SpA, Fortis, Shinhan Financial Group Co., Ltd., ING Groep N.V., Mitsubishi UFJ Financial Group, Inc. and Axa.
Those sales funded the purchases of securities from other sectors. The largest additions to Artisan’s portfolio were German car and truck manufacturer DaimlerChrysler AG, Wacker Chemie, German pharmaceutical company Bayer AG, Japanese heavy machine manufacturer Mitsubishi Heavy Industries, Ltd. and U.K. utility National Grid PLC.
The Fund leverages the investment expertise of three independent teams. As such, there is wide range of opinion regarding the outlook for the international equity markets.
It is important to note that the Fund is, by design, a diversified vehicle intended to provide broad exposure across international equity markets. LSV’s portfolio is conservatively positioned and will continue to seek investments at significant valuation discount compared to the market, with a bias toward mid cap stocks, relative to the Fund’s benchmark. New Star’s portfolio remains positioned for a possible slowdown in corporate profits and earning expectations. Artisan’s portfolio continues to participate in a scenario of moderating economic growth.
AVERAGE ANNUAL TOTAL RETURN5 (%) (AS OF SEPTEMBER 30, 2007)
| | | | | | | | | | | | | | | | | | | | | | |
| | | Including Sales Charge | | Excluding Sales Charge | | Expense Ratio | |
International Equity Fund | | 6 Months* | | 1 Year | | 5 Year | | 10 Year | | 6 Months* | | 1 Year | | 5 Year | | 10 Year | | Gross6 | | | Net7 | |
Class A (SILAX) | | 1.83 | | 16.58 | | 17.39 | | 6.83 | | 8.04 | | 23.68 | | 18.79 | | 7.47 | | 1.67 | % | | 1.50 | % |
Class B (SILBX) | | 2.61 | | 17.73 | | 17.67 | | 6.66 | | 7.61 | | 22.73 | | 17.88 | | 6.66 | | 2.42 | % | | 2.25 | % |
Class C (WFECX) | | 6.58 | | 21.76 | | 17.87 | | 6.66 | | 7.58 | | 22.76 | | 17.87 | | 6.66 | | 2.42 | % | | 2.25 | % |
Administrator Class (WFIEX) | | | | | | | | | | 8.16 | | 24.00 | | 19.05 | | 7.68 | | 1.49 | % | | 1.25 | % |
Institutional Class (WFISX) | | | | | | | | | | 8.27 | | 24.22 | | 18.83 | | 7.02 | | 1.29 | % | | 1.05 | % |
Benchmark | | | | | | | | | | | | | | | | | | | | | | |
MSCI EAFE® Index1 | | | | | | | | | | 8.72 | | 24.86 | | 23.55 | | 7.97 | | | | | | |
| * | Returns for periods of less than one year are not annualized. |
5 | Performance shown prior to the inception of the Class C shares reflects the performance of the Class A shares, adjusted to reflect Class C sales charges and expenses. Prior to April 11, 2005, the Administrator Class was named the Institutional Class. Performance shown prior to the inception of the Administrator Class reflects the performance of the Class A shares, and includes expenses that are not applicable to and are |
F-24
| | higher than those of the Administrator Class shares, but does not include Class A sales charges. If it did include Class A sales charges, returns would be lower. Performance shown for the Institutional Class shares reflects the performance of the Administrator Class shares, and includes expenses that are not applicable to and are higher than those of the Institutional Class shares. The Administrator Class shares annual returns are substantially similar to what the Institutional Class shares annual returns would be because the Administrator Class shares and Institutional Class shares are invested in the same portfolio and their annual returns differ only to the extent that they do not have the same expenses. |
6 | For Classes A, B, C and Administrator, reflects the gross expense ratio as stated in the February 1, 2007, prospectus and is based on the Fund’s previous fiscal year expenses as reported in the Financial Highlights. For the Institutional Class this is the first full fiscal year for the Fund. The gross expense ratio is as stated in the February 1, 2007, prospectus and is based on estimates for the current fiscal year whereas the gross expense ratio reported in the Financial Highlights is based on actual expenses for the Fund. |
7 | The investment adviser has committed through January 31, 2009, to waive fees and/or reimburse expenses to the extent necessary to maintain the net operating expense ratio shown. Without these reductions, the Fund’s returns would have been lower. |
Figures quoted represent past performance, which is no guarantee of future results and do not reflect the deduction of taxes that a shareholder may pay on fund distributions or the redemption of fund shares. Investment return and principal value of an investment will fluctuate so that an investor’s shares, when redeemed, may be worth more or less than their original cost. Performance shown without sales charges would be lower if sales charges were reflected. Current performance may be lower or higher than the performance data quoted. Current month-end performance is available on the Funds’ Web site — www.wellsfargo.com/advantagefunds.
For Class A shares, the maximum front-end sales charge is 5.75%. For Class B shares, the maximum contingent deferred sales charge is 5.00%. For Class C shares, the maximum contingent deferred sales charge is 1.00%. Performance including sales charge assumes the sales charge for the corresponding time period. Administrator and Institutional Class shares are sold without a front-end sales charge or contingent deferred sales charge.
The Fund has a redemption fee of 2.00% deducted from the net proceeds of shares redeemed or exchanged within 30 days after purchase. Performance data does not reflect the deduction of this fee, which, if reflected, would reduce the performance.
Stock fund values fluctuate in response to the activities of individual companies and general market and economic conditions. Foreign investments are especially volatile, and can rise or fall dramatically due to differences in the political and economic conditions of the host country. These risks are generally intensified in emerging markets. The use of derivatives may reduce returns and/or increase volatility. Certain investment strategies tend to increase the total risk of an investment (relative to the broader market). This fund is exposed to small company investment risk. Consult the Fund’s prospectus for additional information on these and other risks.
F-25
WELLS FARGO ADVANTAGE MUNICIPAL BOND FUND
INVESTMENT OBJECTIVE
The Wells Fargo Advantage Municipal Bond Fund (the Fund) seeks current income exempt from federal income tax.
| | |
| INVESTMENT ADVISER | | SUBADVISER |
Wells Fargo Funds Management, LLC | | Wells Capital Management Incorporated |
| |
| PORTFOLIO MANAGER | | FUND INCEPTION |
Lyle J. Fitterer, CFA, CPA | | 10/23/1986 |
Kenneth M. Salinger, CFA | | |
HOW DID THE FUND PERFORM OVER THE 12-MONTH REPORTING PERIOD?
The Fund’s Investor Class shares returned 5.43%1 for the 12-month period that ended June 30, 2007, outperforming its benchmark, the Lehman Brothers Municipal Bond Index2 , which returned 4.69% during the same period.
Figures quoted represent past performance, which is no guarantee of future results. Investment return and principal value of an investment will fluctuate so that an investor’s shares, when redeemed, may be worth more or less than their original cost. Performance shown without sales charges would be lower if sales charges were reflected. Current performance may be lower or higher than the performance data quoted. Current month-end performance is available at the Funds’ Web site — www.wellsfargo.com/advantagefunds.
For Class A shares, the maximum front-end sales charge is 4.50%. For Class B shares, the maximum contingent deferred sales charge is 5.00%. For Class C shares, the maximum contingent deferred sales charge is 1.00%. Administrator Class and Investor Class shares are sold without a front-end sales charge or contingent deferred sales charge. Currently Classes A, B, C and Administrator shares are closed to new investors.
WHAT FACTORS AFFECTED THE FUND’S PERFORMANCE?
While municipal market yields started and ended the period at similar levels, they traded in a range of 75 to 80 basis points (100 basis points equals 1.00%), even though the federal funds rate remained unchanged at 5.25% throughout the 12-month period. The yield swings were largely in response to economic indicators that alternated from relatively weak late in 2006 to quite healthy in 2007. Market expectations of Fed policy swung from optimistic to neutral in response to the economic data. We attempted to take advantage of these yield movements by increasing the Fund’s interest rate exposure when yields approached the top of the 12-month ranges and reducing that exposure when they fell to near the bottom of those ranges. These portfolio adjustments helped boost the Fund’s performance during the period.
In general, the Fund’s lower-quality holdings continued to help its overall performance. More specifically, the Fund’s tobacco and noninvestment-grade bonds did very well. Within the tobacco sector, outstanding issues continued to be prerefunded, which enhances their value, and demand in the sector remained strong. Overall, noninvestment-grade sectors benefited from the stable economic environment and good market demand.
Housing bonds were one of the poorest performing sectors, with most of the underperformance occurring during the last quarter of the period when interest rates increased very quickly and market volatility increased. This increased volatility makes it harder to determine what prepayments would look like on these bonds, and therefore investors demand a higher yield to own them. Fortunately, the Fund had less exposure than the benchmark, and we also primarily owned bonds that were backed by multifamily projects, which have less prepayment sensitivity. Unlike the taxable market, the municipal housing sector has little or no exposure to the subprime sector and maintains AA or better credit ratings.
F-26
The Fund did benefit from our ability to actively trade higher-quality, new issues. While this did increase the Fund’s turnover, in the end it enhanced total return and also helped us manage the Fund’s long-term tax efficiency.
WHAT CHANGES DID YOU MAKE TO THE FUND’S HOLDINGS DURING THE PERIOD?
We tactically managed the Fund’s duration, its interest rate sensitivity, during the period by decreasing duration when rates moved lower and increasing sensitivity when rates moved higher. At the end of the period, the Fund was positioned with a neutral duration as compared with the benchmark, which is similar to where it was at the beginning of the 12-month period.
One of the bigger changes we made was to increase the Fund’s exposure to bonds rated AAA (primarily by buying insured bonds) and decreasing our exposure to bonds rated BBB. We had several bonds rated BBB that were prerefunded, which resulted in their being upgraded. We also sold several land development deals in response to declines in the housing market. Throughout the period, the Fund’s exposure to tobacco bonds rated BBB declined as several of our deals were prerefunded. However, late in the period when interest rates increased, we were able to add back exposure to some seasoned deals that we believed would be refunded. Finally, even though we increased the Fund’s overall credit quality, we selectively found some value in the charter school, Indian gaming, and correctional facility sectors.
We maintained our underweighted position in New York and California bond issues. Even though both states were upgraded by the rating agencies, their bonds already reflected this positive momentum and we found better opportunities in other states. We also started to look more closely at some of the higher-rated (AA or better) health care deals. There has been a tremendous supply within this sector, and this has caused yield premiums to increase. We are focused on higher-quality hospitals because yield spreads between AA and BBB hospitals remained at historically low levels.
LOOKING AHEAD, WHAT IS YOUR STRATEGIC OUTLOOK?
We believe that the Fed might continue to hold the federal funds rate at 5.25% for the remainder 2007. Within the tax-exempt marketplace, our bias continues to be toward higher-quality assets. However, we will also pay very close attention to our exposure to many of the monoline insurance companies (an insurer writing only a single line of insurance contracts). Many of these firms have exposure to the subprime mortgage market and even to lower-quality corporate bonds. If defaults increase within these sectors, it could impact the credit worthiness of these insurers. Because 45% of municipal bonds are insured, we will always have exposure to these types of bonds. However, our credit research staff looks at all of the underlying ratings to make sure that we are comfortable with the bonds even if the insurer’s credit profile declines.
Bond fund values fluctuate in response to the financial condition of individual issuers, general market and economic conditions, and changes in interest rates. In general, when interest rates rise, bond fund values fall and investors may lose principal value. The use of derivatives may reduce returns and/or increase volatility. Active trading results in increased turnover and trading expenses, and may generate higher short-term capital gains. Certain investment strategies tend to increase the total risk of an investment (relative to the broader market). This Fund is exposed to high-yield securities risk. A portion of the Fund’s income may be subject to federal, state, and/or local income taxes or the alternative minimum tax (AMT). Any capital gains distributions may be taxable. Consult the Fund’s prospectus for additional information on these and other risks.
F-27
AVERAGE ANNUAL TOTAL RETURN1 (%) (AS OF JUNE 30, 2007)
| | | | | | | | | | | | | | | | | | | | | | | | |
| | | Including Sales Charge | | Excluding Sales Charge | | Gross
Expense
Ratio3 | | | Net
Expense
Ratio4 | |
| | | 6-Months* | | | 1-Year | | | 5-Year | | 10 Year | | 6-Months* | | 1-Year | | 5-Year | | 10 Year | | |
Class A | | (3.99 | ) | | 0.67 | | | 5.13 | | 4.42 | | 0.48 | | 5.38 | | 6.10 | | 4.90 | | 1.08 | % | | 0.85 | % |
Class B | | (4.89 | ) | | (0.41 | ) | | 5.02 | | 4.14 | | 0.11 | | 4.59 | | 5.35 | | 4.14 | | 1.83 | % | | 1.60 | % |
Class C | | (0.89 | ) | | 3.59 | | | 5.35 | | 4.14 | | 0.11 | | 4.59 | | 5.35 | | 4.14 | | 1.84 | % | | 1.60 | % |
Administrator Class | | | | | | | | | | | | 0.67 | | 5.77 | | 6.29 | | 5.03 | | 0.90 | % | | 0.48 | % |
Investor Class | | | | | | | | | | | | 0.51 | | 5.43 | | 6.14 | | 4.96 | | 1.25 | % | | 0.80 | % |
Benchmark | | | | | | | | | | | | | | | | | | | | | | | | |
Lehman Brothers Municipal Bond Index2 | | | | | | | | | | | | 0.14 | | 4.69 | | 4.61 | | 5.44 | | | | | | |
| * | Returns for periods of less than one year are not annualized. |
1 | Performance shown prior to April 11, 2005 for the Class A, Class B, Class C, and Investor Class shares reflects the performance of the Investor Class shares of the Strong Municipal Bond Fund, the predecessor fund, adjusted to reflect Class A, Class B and Class C sales charges and expenses, as applicable. Performance shown prior to the inception of the Administrator Class shares reflects the performance of the Investor Class shares of the predecessor fund, and includes expenses that are not applicable to and are higher than those of the Administrator Class shares. |
2 | Lehman Brothers Municipal Bond Index is an unmanaged index composed of long-term tax-exempt bonds with a minimum credit rating of Baa. You cannot invest directly in an Index. |
3 | Reflects the gross expense ratio for Class A, B, and C shares as stated in the November 1, 2006, prospectus and for Administrator and Investor Class shares as stated in the August 15, 2007, supplement to the November 1, 2006, prospectus and is based on the Fund’s previous fiscal year expenses as reported in the Financial Highlights. |
4 | The investment adviser has contractually committed through October 31, 2008, to waive fees and/or reimburse expenses to the extent necessary to maintain the net operating expense ratio shown. Without these reductions, the Fund’s returns would have been lower. |
F-28
| | |
CREDIT QUALITY5
(AS OF JUNE 30, 2007) | | GROWTH OF $10,000 INVESTMENT6 (AS OF JUNE 30, 2007) |
| |
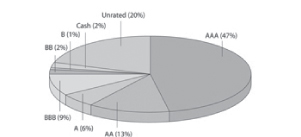
| | 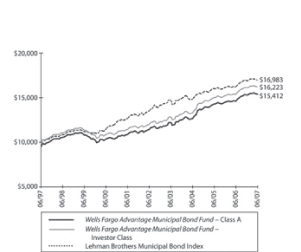
|
| | |
MATURITY DISTRIBUTION5
(AS OF JUNE 30, 2008) | | |
| |
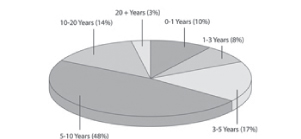
| | |
5 | The ratings indicated are from Standard & Poor’s and/or Moody’s Investors Service. Credit quality and maturity distribution allocations are subject to change. |
6 | The chart compares the performance of the Wells Fargo Advantage Municipal Bond Fund Class A and Investor Class shares for the most recent ten years with the Lehman Brothers Municipal Bond Index. The chart assumes a hypothetical $10,000 investment in Class A and Investor Class shares, reflects all operating expenses and, for Class A shares, assumes the maximum initial sales charge of 4.50%. |
F-29
WELLS FARGO ADVANTAGE SHORT-TERM MUNICIPAL BOND FUND
INVESTMENT OBJECTIVE
The Wells Fargo Advantage Short-Term Municipal Bond Fund (the Fund) seeks current income exempt from federal income tax consistent with capital preservation.
| | |
| INVESTMENT ADVISER | | SUBADVISER |
Wells Fargo Funds Management, LLC | | Wells Capital Management Incorporated |
| |
| PORTFOLIO MANAGER | | FUND INCEPTION |
Lyle J. Fitterer, CFA, CPA | | 12/31/1991 |
HOW DID THE FUND PERFORM OVER THE 12-MONTH REPORTING PERIOD?
The Fund’s Investor Class shares returned 3.76%1 for the 12-month period that ended June 30, 2007, underperforming its benchmark, the Lehman Brothers 3-Year Municipal Bond Index2, which returned 3.85% during the same period.
Figures quoted represent past performance, which is no guarantee of future results. Investment return and principal value of an investment will fluctuate so that an investor’s shares, when redeemed, may be worth more or less than their original cost. Performance shown without sales charges would be lower if sales charges were reflected. Current performance may be lower or higher than the performance data quoted. Current month-end performance is available at the Funds’ Web site — www.wellsfargo.com/advantagefunds.
For Class C shares, the maximum contingent deferred sales charge is 1.00%. Performance including sales charge assumes the sales charge for the period shown. Investor Class shares are sold without a front-end sales charge or contingent deferred sales charge.
WHAT FACTORS AFFECTED THE FUND’S PERFORMANCE?
While municipal market yields started and ended the period at similar levels, they traded in a range of 75 to 80 basis points (100 basis points equals 1.00%), even though the federal funds rate remained unchanged at 5.25% throughout the 12-month period. The yield swings were largely in response to economic indicators that alternated from relatively weak late in 2006 to quite healthy in 2007. Market expectations of Fed policy swung from optimistic to neutral in response to the economic data. We attempted to take advantage of these yield movements by increasing the Fund’s interest rate sensitivity when yields approached the top of the 12-month ranges and reducing that exposure when they fell to near the bottom of those ranges. These portfolio adjustments helped boost the Fund’s performance during the period.
Detracting from performance, there has been a plentiful supply of prerefunded bonds during the period, so yield spreads increased slightly and the bonds underperformed relative to other sectors. We used this as an opportunity to add to the Fund’s exposure, primarily by buying several of the tobacco deals that were prerefunded. Also detracting from performance was an underweight to the longer end of the curve as rates sold off and the curve steepened.
Even though we continued to upgrade the Fund’s overall credit quality, we still had an overweighted position in lower-quality bonds compared to the benchmark. The higher income generated by these bonds combined with good price performance due to investor demand caused the bonds to have very good total returns. Corporate-backed, tobacco, health care, and housing bonds all had solid performance during the period. Several of the Fund’s tobacco bonds were also prerefunded and their ratings increased from BBB to AAA.
F-30
WHAT CHANGES DID YOU MAKE TO THE FUND’S HOLDINGS DURING THE PERIOD?
We increased the Fund’s exposure to bonds rated AAA and AA while simultaneously reducing the Fund’s exposure to the lower-rated A, BB, and BBB bonds. We sold lower-quality bonds in the corporate-backed and hospital sectors and replaced these holdings with prerefunded bonds. We also reduced the Fund’s exposure to insured bonds and added prerefunded bonds.
The Fund’s interest rate exposure (duration) remains at about two years. This is short of our stated benchmark, but we believe that it is more reflective of the duration exposure of our peer group average. Historically, this approach has allowed us to produce good relative returns and less volatility relative to the benchmark. We have also further migrated our yield curve exposure to benefit should the yield curve steepen.
Finally, we recently added to the Fund’s tobacco exposure. We had allowed our position size to dwindle as some of our holdings were prerefunded. However, toward the end of the period, we increased our exposure by purchasing some of the Wisconsin tobacco bonds. The state said that it planned to refund the bonds, but that is somewhat dependant upon interest rates. When rates increased in late June 2007, several holders questioned whether this would ultimately happen, and yield spreads widened. We used this as an opportunity to add to our exposure.
LOOKING AHEAD, WHAT IS YOUR STRATEGIC OUTLOOK?
We believe that the Fed might continue to keep the federal funds rate at 5.25% for the remainder of 2007. Within the tax-exempt marketplace, our bias continues to be toward higher-quality assets. However, we will also pay very close attention to our exposure to many of the monoline insurance companies (an insurer writing only a single line of insurance contracts). Many of these firms have exposure to the subprime mortgage market and even to lower-quality corporate bonds. If defaults increase within these sectors, it could impact the creditworthiness of these insurers. Relative to our benchmark, the Fund is underweighted to the insurers and more recently favored bonds that were prerefunded with U.S. Treasuries or agencies.
Bond fund values fluctuate in response to the financial condition of individual issuers, general market and economic conditions, and changes in interest rates. In general, when interest rates rise, bond fund values fall and investors may lose principal value. Active trading results in increased turnover and trading expenses, and may generate higher short-term capital gains. Certain investment strategies tend to increase the total risk of an investment (relative to the broader market). This Fund is exposed to high-yield securities risk. A portion of the Fund’s income may be subject to federal, state, and/or local income taxes or the alternative minimum tax (AMT). Any capital gains distributions may be taxable. Consult the Fund’s prospectus for additional information on these and other risks.
AVERAGE ANNUAL TOTAL RETURN1 (%) (AS OF JUNE 30, 2007)
| | | | | | | | | | | | | | | | | | | | | | | |
| | | Including Sales Charge | | Excluding Sales Charge | | Gross
Expense
Ratio3 | | | Net
Expense
Ratio4 | |
| | | 6-Months* | | | 1-Year | | 5-Year | | 10 Year | | 6-Months* | | 1-Year | | 5-Year | | 10 Year | | |
Class C | | (0.09 | ) | | 1.85 | | 2.29 | | 2.90 | | 0.91 | | 2.85 | | 2.29 | | 2.90 | | 1.74 | % | | 1.55 | % |
Investor Class | | | | | | | | | | | 1.36 | | 3.76 | | 3.40 | | 4.08 | | 1.15 | % | | 0.66 | % |
Benchmark | | | | | | | | | | | | | | | | | | | | | | | |
Lehman Brothers 3-Year Municipal BondIndex2 | | | | | | | | | | | | | 1.24 | | 3.85 | | 2.56 | | 3.93 | | | | |
| * | Returns for periods of less than one year are not annualized. |
F-31
1 | Performance shown prior to April 11, 2005 for the Class C and Investor Class shares reflects the performance of the Class C and Investor Class shares, respectively, of the Strong Short-Term Municipal Bond Fund, the predecessor fund. Performance shown prior to the inception of the Class C shares reflects the performance of the Investor Class shares of the predecessor fund, adjusted to reflect Class C sales charges and expenses. |
2 | Lehman Brothers 3-Year Municipal Bond Index is the 3-year component of the Lehman Brothers Municipal Bond Index, which is an unmanaged index composed of long-term tax-exempt bonds with a minimum credit rating of Baa. You cannot invest directly in an Index. |
3 | Reflects the gross expense ratio as stated in the November 1, 2006, prospectus for Class C shares and the August 15, 2007, supplement to the November 1, 2006, prospectus for the Investor Class shares and is based on the Fund’s previous fiscal year expenses as reported in the Financial Highlights. |
4 | The investment adviser has contractually committed through October 31, 2008, to waive fees and/or reimburse expenses to the extent necessary to maintain the net operating expense ratio shown. Without these reductions, the Fund’s returns would have been lower. |
| | |
CREDIT QUALITY5
(AS OF JUNE 30, 2007) | | GROWTH OF $10,000 INVESTMENT6
(AS OF JUNE 30, 2007) |
| |
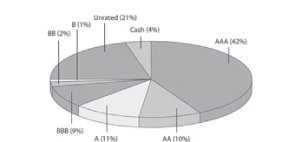 | | 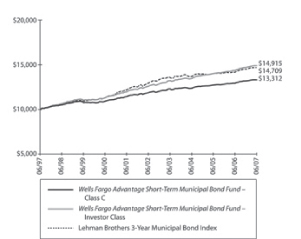
|
| | |
MATURITY DISTRIBUTION5
(AS OF JUNE 30, 2007) | | |
| |
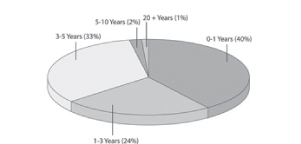
| | |
5 | The ratings indicated are from Standard & Poor’s and/or Moody’s Investors Service. Credit quality and maturity distribution allocations are subject to change. |
6 | The chart compares the performance of the Wells Fargo Advantage Short-Term Municipal Bond Fund Class C and Investor Class shares for the most recent ten years with the Lehman Brothers 3-Year Municipal Bond Index. The chart assumes a hypothetical $10,000 investment in Class C and Investor Class shares, reflects all operating expenses and, for Class C shares, assumes the maximum contingent deferred sales charge of 1.00%. |
F-32
EXHIBIT G — FORM OF AGREEMENT AND PLAN OF REORGANIZATION
WELLS FARGO FUNDS TRUST
Dated as of
This AGREEMENT AND PLAN OF REORGANIZATION (the “Plan”) is made as of this [date], by Wells Fargo Funds Trust (“Funds Trust”), a Delaware statutory trust, for itself and on behalf of each Acquiring Fund and each Target Fund, as indicated in the chart below.
| | |
Target Fund | | Acquiring Fund |
Large Company Core Fund* Class A Class B Class C Class Z Administrator Class | | Growth and Income Fund** Class A (formerly Advisor Class) Class B (new class) Class C (new class) Investor Class Administrator Class |
| |
Equity Index Fund* Class A Class B | | Index Fund Class A (new class) Class B (new class) |
| |
Endeavor Large Cap Fund* Class A Class B Class C | | Capital Growth Fund Class A Class A Class C |
| |
Ultra-Short Duration Bond Fund* Class A Class B Class C Class Z | | Ultra Short-Term Income Fund Class A (formerly Advisor Class) Class A (formerly Advisor Class) Class C (new class) Investor Class |
| |
Overseas Fund Investor Class Institutional Class | | International Equity Fund Investor Class (new class) Institutional Class |
| |
Value Fund Class A Class B Class C Investor Class Administrator Class | | C&B Large Cap Value Fund Class A Class B Class C Investor Class (formerly Class D) Administrator Class |
| |
Balanced Fund Investor Class | | Asset Allocation Fund Class A |
| |
Corporate Bond Fund Investor Class Advisor Class Institutional Class | | Income Plus Fund Investor Class (new class) Class A Institutional Class (new class) |
| |
Intermediate Government Income Fund Class A Class B Class C Administrator Class | | Government Securities Fund Class A (formerly Advisor Class) Class B (new class) Class C Administrator Class |
G-1
| | |
Target Fund | | Acquiring Fund |
High Yield Bond Fund Class A Class B Class C | | High Income Fund Class A (formerly Advisor Class) Class B (new class) Class C (new class) |
| |
National Tax-Free Fund Class A Class B Class C Administrator Class | | Municipal Bond Fund Class A Class B Class C Administrator Class |
| |
National Limited-Term Tax-Free Fund Class A Class B Class C Administrator Class | | Short-Term Municipal Bond Fund Class A (new class) Class A (new class) Class C Class A (new class) |
| * | Are not required to be proxied pursuant to Rule 17a-8 under the 1940 Act. |
| ** | To be renamed Large Company Core Fund as discussed in Tab F. |
WHEREAS, Funds Trust is an open-end management investment company registered with the Securities and Exchange Commission (the “SEC”) under the Investment Company Act of 1940, as amended (the “1940 Act”);
WHEREAS, the parties desire that each Acquiring Fund acquire the assets and assume the liabilities of the corresponding Target Fund in exchange for shares of equal value of the Acquiring Fund and the distribution of the shares of the Acquiring Fund to the shareholders of the Target Fund in connection with the liquidation and termination of the Target Fund (the “Reorganization”); and
WHEREAS, the parties intend that the Reorganization qualify as a “reorganization,” within the meaning of Section 368(a) of the Internal Revenue Code of 1986, as amended (the “Code”), and that each Fund will be a “party to a reorganization,” within the meaning of Section 368(b) of the Code, with respect to the Reorganization;
NOW, THEREFORE, in accordance with the mutual promises described herein, the parties agree as follows:
The following terms shall have the following meanings:
| | |
1933 Act | | The Securities Act of 1933, as amended. |
| |
1934 Act | | The Securities Exchange Act of 1934, as amended. |
| |
Acquiring Class | | The class of the Acquiring Fund’s shares that Funds Trust will issue to the shareholders of the Target Fund Class, as set forth above. |
| |
Acquiring Fund Financial Statements | | The audited financial statements of the Acquiring Fund for its most recently completed fiscal year and the unaudited financial statements of the Acquiring Fund for its most recently completed semi-annual period. |
G-2
| | |
Assets | | All property and assets of any kind and all interests, rights, privileges and powers of or attributable to a Fund, whether or not determinable at the appropriate Effective Time and wherever located. Assets include all cash, cash equivalents, securities, claims (whether absolute or contingent, Known or unknown, accrued or unaccrued or conditional or unmatured), contract rights and receivables (including dividend and interest receivables) owned by a Fund and any deferred or prepaid expense shown as an asset on such Fund’s books. |
| |
Assets List | | A list of securities and other Assets and Known Liabilities of or attributable to the Target Fund as of the date provided. |
| |
Board | | The Board of Trustees of Funds Trust. |
| |
Closing Date | | [Date], or such other date as the parties may agree to in writing with respect to the Reorganization. |
| |
Corresponding Target Class | | The Target share class set forth opposite an Acquiring Class in the chart on the first page of this Plan. |
| |
Effective Time | | 9:00 a.m. Eastern Time on the first business day following the Closing Date of the Reorganization, or such other time and date as the parties may agree to in writing. |
| |
Fund | | The Acquiring Fund or the Target Fund. |
| |
Know, Known or Knowledge | | Known after reasonable inquiry. |
| |
Liabilities | | All liabilities of, allocated or attributable to, a Fund, whether Known or unknown, accrued or unaccrued, absolute or contingent or conditional or unmatured. |
| |
Material Agreements | | The agreements set forth in Schedule A, as it may be amended from time to time. |
| |
Reorganization Documents | | Such bills of sale, assignments, and other instruments of transfer as Funds Trust deems desirable for the Target Fund to transfer to the Acquiring Fund all rights and title to and interest in the Target Fund’s Assets and Liabilities and for the Acquiring Fund to assume the Target Fund’s Assets and Liabilities. |
| |
Schedule A | | Schedule A to this Plan, as may be amended from time to time. |
| |
Target Financial Statements | | The audited financial statements of the Target Fund for its most recently completed fiscal year and the unaudited financial statements of the Target Fund for its most recently completed semi-annual period. |
G-3
| | |
Valuation Time | | The time on the Reorganization’s Closing Date, the business day immediately preceding the Closing Date if the Closing Date is not a business day or such other time as the parties may agree to in writing, that Funds Trust determines the net asset value of the shares of the Acquiring Fund and determines the value of the Assets of or attributable to the Target Fund, net of known Liabilities. Unless otherwise agreed to in writing, the Valuation Time of a Reorganization shall be the time of day then set forth in the Acquiring Fund’s and Target Fund’s Registration Statement on Form N-1A as the time of day at which net asset value is calculated. |
2. Regulatory Filings. Funds Trust shall prepare and file any required filings including, without limitation, filings with state or foreign securities regulatory authorities.
3. Transfer of Target Fund Assets. Funds Trust shall take the following steps with respect to the Reorganization:
(a) At the Effective Time, Funds Trust shall assign, transfer, deliver and convey all of the Target Fund’s Assets to the Acquiring Fund on the bases described in Subsection 3(c) of this Plan. Funds Trust shall then accept the Target Fund’s Assets and assume the Target Fund’s Liabilities such that at and after the Effective Time (i) all of the Target Fund’s Assets at or after the Effective Time shall become and be the Assets of the Acquiring Fund and (ii) all of the Target Fund’s Liabilities at the Effective Time shall attach to the Acquiring Fund, and be enforceable against the Acquiring Fund to the same extent as if initially incurred by the Acquiring Fund.
(b) Within a reasonable time prior to the Closing Date, the Target Fund shall provide, if requested, its Assets List to the Acquiring Fund. The Target Fund may sell any investment on the Assets List prior to the Target Fund’s Valuation Time. After the Target Fund provides the Assets List, the Target Fund will notify the Acquiring Fund of its purchase or incurrence of additional investments or of any additional encumbrances, rights, restrictions or claims not reflected on the Assets List, within a reasonable time period after such purchase or incurrence. Within a reasonable time after receipt of the Assets List and prior to the Closing Date, the Acquiring Fund will advise the Target Fund in writing of any investments shown on the Assets List that the Acquiring Fund has reasonably determined to be impermissible or inconsistent with the investment objective, policies and restrictions of the Acquiring Fund.
(c) Funds Trust shall assign, transfer, deliver and convey the Target Fund’s Assets to the Acquiring Fund at the Reorganization’s Effective Time on the following bases:
(1) In exchange for the transfer of the Assets, Funds Trust shall simultaneously issue and deliver to the Target Fund full and fractional shares of beneficial interest of each Acquiring Class. Funds Trust shall determine the number of shares of each Acquiring Class to issue by dividing the value of the Assets net of Known Liabilities attributable to the Corresponding Target Class by the net asset value of one Acquiring Class share. Based on this calculation, Funds Trust shall issue shares of beneficial interest of each Acquiring Class with an aggregate net asset value equal to the value of the Assets net of Known Liabilities of the Corresponding Target Class. Because the C&B Large Cap Value Fund and Index Fund are feeder funds that invest all of their assets in a master portfolio of Wells Fargo Master Trust, the Reorganization contemplates that the C&B Large Cap Value Fund and Index Fund will transfer their assets to their respective master portfolio as an in-kind contribution in exchange for interests in the master portfolio.
G-4
(2) The parties shall determine the net asset value of the Acquiring Fund shares to be delivered, and the value of the Assets to be conveyed net of Known Liabilities, as of the Valuation Time substantially in accordance with Funds Trust current valuation procedures. The parties shall make all computations to the fourth decimal place or such other decimal place as the parties may agree to in writing.
(3) Funds Trust shall cause its custodian to transfer the Target Fund’s Assets with good and marketable title to the account of the Acquiring Fund. Funds Trust shall cause its custodian to transfer all cash in the form of immediately available funds. Funds Trust shall cause its custodian to transfer any Assets that were not transferred to the Acquiring Fund’s account at the Effective Time to the Acquiring Fund’s account at the earliest practicable date thereafter.
4. Liquidation and Termination of Target Fund and Registration of Shares. Funds Trust also shall take the following steps for the Reorganization:
(a) At or as soon as reasonably practical after the Effective Time, Funds Trust shall dissolve and liquidate the Target Fund, and terminate the Target Fund as an authorized series of Funds Trust, in accordance with applicable law and its Declaration of Trust by transferring to shareholders of record of each Corresponding Target Class full and fractional shares of beneficial interest of the Acquiring Class equal in value to the shares of the Corresponding Target Class held by the shareholder. Each shareholder also shall have the right to receive any unpaid dividends or other distributions that Funds Trust declared with respect to the shareholder’s Corresponding Target Class shares before the Effective Time. Funds Trust shall record on its books the ownership by the shareholders of the Acquiring Fund shares; Funds Trust shall simultaneously redeem and cancel on its books all of the issued and outstanding shares of each Corresponding Target Class. Funds Trust does not issue certificates representing Fund shares, and shall not be responsible for issuing certificates to shareholders of the Target Funds. Funds Trust shall wind up the affairs of the Target Fund.
(b) If a former Target Fund shareholder requests a change in the registration of the shareholder’s Acquiring Fund shares to a person other than the shareholder, Funds Trust shall require the shareholder to (i) furnish Funds Trust an instrument of transfer properly endorsed, accompanied by any required signature guarantees and otherwise in proper form for transfer; and (ii) pay to the Acquiring Fund any transfer or other taxes required by reason of such registration or establish to the reasonable satisfaction of Funds Trust that such tax has been paid or does not apply.
5. Representations, Warranties and Agreements of Funds Trust. Funds Trust, on behalf of itself, and, as appropriate, the Target Fund and the Acquiring Fund, represents and warrants to, and agrees with, the Acquiring Fund and the Target Fund, respectively as follows:
(a) Funds Trust is a statutory trust duly created, validly existing and in good standing under the laws of the State of Delaware. The Board duly established and designated each Fund as a series of Funds Trust and each Acquiring Class as a class of the Acquiring Fund. Funds Trust is an open-end management investment company registered with the SEC under the 1940 Act.
(b) Funds Trust has the power and all necessary federal, state and local qualifications and authorizations to own all of its properties and Assets, to carry on its business as described in its Registration Statement on Form N-1A as filed with the SEC, to enter into this Plan and to consummate the transactions contemplated herein.
(c) The Board has duly authorized execution and delivery of the Plan and the transactions contemplated herein, subject to Target Fund shareholder approvals as required. Duly authorized officers of Funds Trust have executed and delivered the Plan. The Plan represents a valid and binding contract, enforceable in accordance with its terms, subject as to enforcement to bankruptcy, insolvency, reorganization, arrangement, moratorium and other similar laws of general applicability relating to or affecting creditors’ rights and to general equity
G-5
principles. The execution and delivery of this Plan does not, and the consummation of the transactions contemplated by this Plan will not, violate the Declaration of Trust of Funds Trust or any Material Agreement. Funds Trust does not need to take any other action to authorize its officers to effectuate the Plan and the transactions contemplated herein.
(d) Each Fund has qualified as a “regulated investment company” under Part I of Subchapter M of Subtitle A, Chapter 1, of the Code in respect of each taxable year since the commencement of its operations, and will continue to so qualify until the Effective Time.
(e) Funds Trust has duly authorized the Acquiring Fund shares to be issued and delivered to the Target Fund as of the Target Fund’s Effective Time. When issued and delivered, the Acquiring Fund shares shall have been registered for sale under the 1933 Act and shall be duly and validly issued, fully paid and non-assessable, and no shareholder of the Acquiring Fund shall have any preemptive right of subscription or purchase in respect of them. There are no outstanding options, warrants or other rights to subscribe for or purchase any Acquiring Fund shares, nor are there any securities convertible into Acquiring Fund shares.
(f) Each Fund is in compliance in all material respects with all applicable laws, rules and regulations, including, without limitation, the 1940 Act, the 1933 Act, the 1934 Act and all applicable state securities laws. Each Fund is in compliance in all material respects with the investment policies and restrictions applicable to it set forth in the Form N-1A Registration Statement currently in effect. The value of the Assets net of Known Liabilities of the Acquiring Fund has been determined using portfolio valuation methods that comply in all material respects with the requirements of the 1940 Act and the policies of such Acquiring Fund.
(g) Funds Trust does not Know of any claims, actions, suits, investigations or proceedings of any type pending or threatened against Funds Trust or any Fund or its Assets or businesses. There are no facts that Funds Trust currently has reason to believe are likely to form the basis for the institution of any such claim, action, suit, investigation or proceeding against Funds Trust or any Fund. For purposes of this provision, investment underperformance or negative investment performance shall not be deemed to constitute such facts, provided all required performance disclosures have been made. Neither Funds Trust nor any Fund is a party to or subject to the provisions of any order, decree or judgment of any court or governmental body that adversely affects, or is reasonably likely to adversely affect, its financial condition, results of operations, business, properties or Assets or its ability to consummate the transactions contemplated by this Plan.
(h) Funds Trust is not a party to any contracts, agreements, franchises, licenses or permits relating to the Funds except those entered into or granted in the ordinary course of its business, in each case under which no material default exists. All contracts and agreements that are material to the business of the Funds are listed on Schedule A. Funds Trust is not a party to or subject to any employee benefit plan, lease or franchise of any kind or nature whatsoever on behalf of any Fund.
(i) Funds Trust has timely filed all tax returns, for the Funds for all of their taxable years to and including their most recent taxable year required to be filed on or before the date of this Plan, and has paid all taxes payable pursuant to such returns. To the Knowledge of Funds Trust, no such tax return has been or is currently under audit and no assessment has been asserted with respect to any return. Funds Trust will file all of the Fund’s tax returns for all of their taxable periods ending on or before the Closing Date not previously filed on or before their due dates (taking account of any valid extensions thereof).
(j) Since the date of the Target Fund Financial Statements and the Acquiring Fund Financial Statements, there has been no material adverse change in the financial condition, business, properties or Assets of the Target Fund or Acquiring Fund, respectively. For purposes of this provision, investment underperformance, negative investment performance or net redemptions shall not be deemed to constitute such facts, provided all customary performance disclosures have been made.
G-6
(k) The Target Fund Financial Statements and the Acquiring Fund Financial Statements, fairly present the financial position of the Acquiring Fund as of the Fund’s most recent fiscal year-end and the results of the Fund’s operations and changes in the Fund’s net assets for the periods indicated. The Target Fund Financial Statements and the Acquiring Fund Financial Statements have been prepared in accordance with generally accepted accounting principles consistently applied.
(l) To the Knowledge of Funds Trust, neither the Target Fund nor the Acquiring Fund has any Liabilities, whether or not determined or determinable, other than Liabilities disclosed or provided for in the Target Fund Financial Statements and the Acquiring Fund Financial Statements, respectively, or Liabilities incurred in the ordinary course of business.
(m) Except as otherwise provided herein, Funds Trust shall operate the business of each Fund in the ordinary course between the date hereof and the Effective Time, it being agreed that such ordinary course of business will include the declaration and payment of dividends and distributions approved by the Board in anticipation of the Reorganization. Notwithstanding the foregoing, each Fund shall (i) complete all measures prior to the Effective Time to ensure that the Reorganization qualifies as a “reorganization” within the meaning of Section 368(a) of the Code; and (ii) take all other appropriate action necessary to ensure satisfaction of representations in certificates to be provided to Proskauer Rose LLP in connection with their opinion described in Section 6(d), regardless of whether any measures or actions described in this sentence are in the ordinary course.
6. Conditions to Funds Trust Obligations. The obligations of Funds Trust with respect to the Reorganization shall be subject to the following conditions precedent:
(a) As required, the Target Fund shall have obtained the approval of this Plan and the transactions contemplated herein by the vote of a “majority of the outstanding voting securities” (as defined in the 1940 Act) of the Target Fund.
(b) Funds Trust shall have duly executed and delivered the Target Fund Reorganization Documents.
(c) All representations and warranties of Funds Trust made in this Plan that apply to the Reorganization shall be true and correct in all material respects as if made at and as of the Valuation Time and the Effective Time.
(d) Funds Trust on behalf of itself and, as appropriate, the Target Fund and the Acquiring Fund, shall have delivered to Funds Trust/the Acquiring Fund and the Target Fund, respectively, a certificate dated as of the Closing Date and executed in its name by its Treasurer or Secretary stating that the representations and warranties of Funds Trust in this Plan that apply to the Reorganization are true and correct at and as of the Valuation Time.
(e) Funds Trust shall have received an opinion dated as of the Closing Date in a form reasonably satisfactory to it of Proskauer Rose LLP, upon which each Fund and its shareholders may rely, based upon representations reasonably acceptable to Proskauer Rose LLP made in certificates provided by Funds Trust, on behalf of itself and each Fund, the Funds’ affiliates and/or principal shareholders to Proskauer Rose LLP, substantially to the effect that the Reorganization will qualify as a “reorganization” within the meaning of Section 368(a) of the Code, and each Fund will be a “party to a reorganization,” within the meaning of Section 368(b) of the Code, with respect to the Reorganization.
(f) No action, suit or other proceeding shall be threatened or pending before any court or governmental agency in which it is sought to restrain or prohibit or obtain damages or other relief in connection with the Reorganization.
G-7
(g) The SEC shall not have issued any unfavorable advisory report under Section 25(b) of the 1940 Act nor instituted any proceeding seeking to enjoin consummation of the Reorganization under Section 25(c) of the 1940 Act.
(h) Funds Trust shall have performed and complied in all material respects with each of its agreements and covenants required by this Plan to be performed or complied with by it prior to or at the Reorganization’s Valuation Time and Effective Time.
(i) Except to the extent prohibited by Rule 19b-1 under the 1940 Act, prior to the Valuation Time, the Target Fund shall have declared a dividend or dividends, with a record date and ex-dividend date prior to the Valuation Time, which, together with all previous dividends, shall have the effect of distributing to the Target Fund shareholders all of its previously undistributed (i) “investment company taxable income” within the meaning of Section 852(b) of the Code (determined without regard to Section 852(b)(2)(D) of the Code, (ii) amounts equal to, in the aggregate, the excess of (A) the amount specified in Section 852(a)(1)(B)(i) of the Code over (B) the amount specified in Section 852(a)(1)(B)(ii) of the Code, and (iii) net capital gain (within the meaning of Section 1222(11) of the Code), if any, realized in taxable periods or years ending on or before the Effective Time.
(j) The Board of Funds Trust shall not have terminated this Plan with respect to the Reorganization pursuant to Section 8 of this Plan.
7. Survival of Representations and Warranties. The representations and warranties of Funds Trust shall survive the completion of the transactions contemplated herein.
8. Termination of Plan. The Board may terminate this Plan with respect to the Acquiring Fund or Target Fund, as appropriate, by majority vote, if: (i) the conditions precedent set forth in Section 6, are not satisfied on the Closing Date; or (ii) it becomes reasonably apparent to the Board that such conditions precedent will not be satisfied on the Closing Date.
9. Governing Law. This Plan and the transactions contemplated hereby shall be governed, construed and enforced in accordance with the laws of the State of Delaware, except to the extent preempted by federal law, without regard to conflicts of law principles.
10. Expenses. Funds Trust shall cause the expenses of the Reorganization to be borne by Wells Fargo Funds Management, LLC.
11. Amendments. The Reorganization of certain Target Funds, as indicated on the chart on page one of this Plan, requires shareholder approval. Funds Trust may, by agreement in writing authorized by the Board, amend this Plan with respect to the Reorganization at any time, including, with respect to any Target Fund whose shareholders are being asked to approve the Reorganization, before or after such Target Fund’s shareholders approve of the Reorganization. After a Target Fund’s shareholders approve a Reorganization, however, Funds Trust may not amend this Plan in a manner that materially adversely affects the interests of the Target Fund’s shareholders with respect to that Reorganization. This Section shall not preclude Funds Trust from changing the Closing Date or the Effective Time of a Reorganization.
12. Waivers. At any time prior to the Closing Date, Funds Trust may by written instrument signed by it (i) waive the effect of any inaccuracies in the representations and warranties made to it contained herein and (ii) waive compliance with any of the agreements, covenants or conditions made for its benefit contained herein. Funds Trust agrees that any waiver shall apply only to the particular inaccuracy or requirement for compliance waived, and not any other or future inaccuracy or lack of compliance.
G-8
13. Limitation on Liabilities. The obligations of Funds Trust and each Fund shall not bind any of the Trustees, shareholders, nominees, officers, agents, or employees of Funds Trust personally, but shall bind only the Assets and property of the particular Fund. The execution and delivery of this Plan by the officers of Funds Trust shall not be deemed to have been made by any of them individually or to impose any liability on any of them personally, but shall bind only the Assets and the property of the Acquiring Fund or the Target Fund, as appropriate.
14. General. This Plan supersedes all prior agreements between the parties (written or oral), is intended as a complete and exclusive statement of the terms of the agreement between the parties and may not be changed or terminated orally. The headings contained in this Plan are for reference only and shall not affect in any way the meaning or interpretation of this Plan. Nothing in this Plan, expressed or implied, confers upon any other person any rights or remedies under or by reason of this Plan. Neither party may assign or transfer any right or obligation under this Plan without the written consent of the other party.
IN WITNESS WHEREOF, the parties hereto have caused their duly authorized officers designated below to execute this Plan as of the date first written above.
WELLS FARGO FUNDS TRUST
for itself and on behalf of the Target Funds
and on behalf of the Acquiring Funds
ATTEST:
| | | | | | | | |
| | By: | | |
| Name: | | C. David Messman | | | | Name: | | Karla M. Rabusch |
| Title: | | Secretary | | | | Title: | | President |
G-9
SCHEDULE A
MATERIAL AGREEMENTS
The following agreements shall be Material Agreements:
Amended and Restated Investment Advisory Agreement between Wells Fargo Funds Management, LLC (“Wells Fargo Funds Management”) and Wells Fargo Funds Trust, dated August 6, 2003, and amended October 1, 2005, with Schedule A amended November 7, 2007.
Investment Sub-Advisory Agreement among Wells Fargo Funds Trust, Wells Fargo Funds Management, and Artisan Partners Limited Partnership, dated February 1, 2005.
Investment Sub-Advisory Agreement among Wells Fargo Funds Trust, Wells Fargo Funds Management, and Cooke & Bieler, L.P., dated March 24, 2004, with Appendix A amended November 8, 2005.
Investment Sub-Advisory Agreement among Wells Fargo Funds Trust, Wells Fargo Funds Management, and LSV Asset Management, dated February 1, 2005.
Investment Sub-Advisory Agreement among Wells Fargo Funds Trust, Wells Fargo Funds Management, and New Star Institutional Managers Limited, dated February 1, 2005, with Appendix A amended April 11, 2005.
Investment Sub-Advisory Agreement among Wells Fargo Funds Trust, Wells Fargo Funds Management, and Wells Capital Management Incorporated, dated March 1, 2001, with Appendix A and Schedule A amended March 30, 2007.
Distribution Agreement between Wells Fargo Funds Distributor, LLC and Wells Fargo Funds Trust, dated April 8, 2005, with Schedule I amended November 7, 2007.
Distribution Plan adopted pursuant to Rule 12b-1 under the Investment Company Act of 1940 approved by the Wells Fargo Funds Trust Board on March 26, 1999, with Appendix A amended November 9, 2007.
Rule 18f-3 Multi-Class Plan adopted by the Board of Wells Fargo Funds Trust on March 26, 1999 and most recently amended November 8, 2006, with Appendix A amended November 9, 2007 and Appendix B amended November 8, 2006.
Amended and Restated Custody Agreement between Wells Fargo Bank, N.A. and Wells Fargo Funds Trust dated August 10, 2004, with Appendix A amended November 7, 2007.
Amended and Restated Accounting Services Agreement among PFPC, Wells Fargo Funds Trust, Wells Fargo Master Trust and Wells Fargo Variable Trust dated May 10, 2006, with Exhibit A amended November 7, 2007.
Administration Agreement between Wells Fargo Funds Management and Wells Fargo Funds Trust dated March 1, 2003, with Appendix A amended November 7, 2007.
Transfer Agency and Service Agreement between Boston Financial Data Services, Inc. and Wells Fargo Funds, dated April 11, 2005, with Schedule A amended November 7, 2007.
Shareholder Servicing Plan adopted by the Board of Wells Fargo Funds Trust adopted on March 26, 1999, with Appendix A amended November 7, 2007.
G-10
Amended and Restated Fee and Expense Agreement among Wells Fargo Funds Trust, Wells Fargo Master Trust and Wells Fargo Funds Management, dated March 30, 2007, with Schedule A amended November 7, 2007.
Amended and Restated Joint Fidelity Bond Allocation Agreement among Wells Fargo Funds Trust, Wells Fargo Variable Trust and Wells Fargo Master Trust dated May 1, 2006, with Appendix A amended November 7, 2007.
Securities Lending Agency Agreement among Wells Fargo Funds Trust, Wells Fargo Master Trust, Wells Fargo Variable Trust, Wells Fargo Funds Management and Wells Fargo Bank, N.A. dated August 9, 2006, with Schedule I amended November 7, 2007.
G-11
Wells Fargo Funds Management, LLC, a wholly owned subsidiary of Wells Fargo & Company, provides investment advisory and administrative services for Wells Fargo Advantage Funds. Other affiliates of Wells Fargo & Company provide subadvisory and other services for the Funds. The Funds are distributed by Wells Fargo Funds Distributor, LLC, Member FINRA/SIPC, an affiliate of Wells Fargo & Company. 109924 05-08
NOT FDIC INSURED • NO BANK GUARANTEE • MAY LOSE VALUE
©2008 Wells Fargo Funds Management, LLC. All rights reserved.
www.wellsfargo.com/advantagefunds
Wells Fargo Advantage Funds (logo)
Important Proxy Information
Please take a moment to read.
The enclosed document is a proxy statement with proposals concerning the Wells Fargo Advantage Life Stage PortfoliosSM. As a shareholder of one of the Portfolios, you are being asked to approve a reorganization of your Wells Fargo Advantage Life Stage Portfolio into another acquiring Wells Fargo Advantage Fund. The following information highlights the principal aspects of the proposal, which is subject to a vote by the target Portfolios’ shareholders. We encourage you to fully read the enclosed proxy statement.
What am I being asked to vote on?
You are being asked to approve the reorganization of your Wells Fargo Advantage Life Stage Portfolio into an acquiring Wells Fargo Advantage Fund. The Wells Fargo Advantage Funds® Board of Trustees (the Board) believes that these reorganizations will benefit shareholders, and it unanimously approved them.
In each reorganization, the Life Stage Portfolio will transfer all of its assets and liabilities to a corresponding acquiring Fund in exchange for shares of the acquiring Fund. The reorganization is expected to be a taxable exchange. (Further information about the potential tax consequences of the proposed reorganization can be found on page XX of the enclosed proxy statement.) Immediately after the closing of the reorganization, you will hold the shares of an acquiring Fund with a total dollar value equal to the total dollar value of the shares of the Life Stage Portfolio that you held before the closing. The acquiring Funds for each proposed reorganization are listed in the table below:
| | |
Wells Fargo Advantage Funds
Target Life Stage Portfolio | | Wells Fargo Advantage Funds
Acquiring Fund |
Life Stage—Conservative Portfolio | | Moderate Balanced Fund |
Life Stage—Moderate Portfolio | | Growth Balanced Fund |
Life Stage—Aggressive Portfolio | | Aggressive Allocation Fund |
Why has the Board recommended that I vote in favor of the reorganization?
Among the factors the Board considered in recommending these reorganizations were the following:
| | • | | The combined Funds will have potentially greater investment opportunities and market presence. |
| | • | | The reorganizations will eliminate duplicative expenses and can reduce associated operational costs. |
| | • | | The combined Funds are expected to have enhanced viability due to a larger asset base. A larger asset base can lead to lower expense ratios. |
| | • | | The acquiring Funds have better comparative total return than their corresponding target Funds over most measurement periods, and, in the view of Wells Fargo Funds Management, LLC, the Funds’ advisor, they have the potential for better performance opportunities going forward. |
| | • | | The investment objectives and principal investment strategies of the target and acquiring Funds are relatively compatible. |
| | • | | Shareholders will not bear the expenses incurred by each Fund in connection with the reorganizations. |
Whom should I call with questions about the voting process?
If you have any questions about the proxy materials or the proposal, please call your investment professional, trust officer, or Wells Fargo Advantage Funds at 1-800-222-8222. If you have any questions about voting your proxy, you may call our proxy solicitor, The Altman Group, at 1-866-406-2287.
IMPORTANT NOTICE: PLEASE COMPLETE THE ENCLOSED PROXY BALLOT AND RETURN IT AS SOON AS POSSIBLE. FOR YOUR CONVENIENCE YOU MAY VOTE BY MAIL, BY CALLING THE TOLL-FREE TELEPHONE NUMBER PRINTED ON YOUR PROXY BALLOT, OR VIA THE INTERNET ACCORDING TO THE ENCLOSED VOTING INSTRUCTIONS.
WELLS FARGO FUNDS TRUST
525 MARKET STREET
SAN FRANCISCO, CALIFORNIA 94105
[May 6, 2008]
Dear Valued Shareholder:
I am pleased to invite you to a special meeting of shareholders of Wells Fargo Funds Trust’s Life Stage – Conservative Portfolio, Life Stage – Moderate Portfolio and Life Stage – Aggressive Portfolio, to be held at 525 Market Street, 12th Floor, San Francisco, California 94105 on June 30, 2008, at 3:00 p.m. (Pacific Time).
We are seeking your approval of a proposed reorganization of three funds of Wells Fargo Funds Trust into three other funds of Wells Fargo Funds Trust (the “Reorganization”). We refer to Wells Fargo Funds Trust as Wells Fargo Advantage Funds. We refer to the three funds that are proposed to be reorganized as the Target Funds, and we refer to the three funds into which the Target Funds will be reorganized as the Acquiring Funds. We refer to each all of them individually as a Fund and to all of them together as the Funds.
The Reorganization arises out of a review by Wells Fargo Funds Management, LLC (“Funds Management”), investment adviser to the Funds, of the continued viability of various Funds of Wells Fargo Advantage Funds, and an evaluation of whether combining Funds with similar investment objectives, principal investments or principal investment strategies would better serve shareholders. In each reorganization, a Target Fund will transfer all of its assets and liabilities to a corresponding Acquiring Fund in exchange for shares of a comparable class (“Class”) of the corresponding Acquiring Fund. The shares of each Acquiring Fund, in turn, will be distributed to the shareholders of each Target Fund in liquidation of the Target Funds. Shareholders of the Target Fund generally will recognize gain or loss for federal tax purposes on the receipt of these Acquiring Fund shares. Immediately after the closing of the Reorganization (the “Closing”), each shareholder of each Target Fund will hold the shares of an Acquiring Fund with a total dollar value equal to the total dollar value of the shares of the Target Fund that the shareholder held before the Closing. The following table lists the Target Funds and the corresponding Acquiring Funds that are part of the Reorganization.
| | |
| TARGET FUNDS | | ACQUIRING FUNDS |
| Life Stage – Conservative Portfolio | | Moderate Balanced Fund |
| Life Stage – Moderate Portfolio | | Growth Balanced Fund |
| Life Stage – Aggressive Portfolio | | Aggressive Allocation Fund |
Some of the potential benefits of the proposed Reorganization are:
| | • | | The combined Funds will have potentially greater investment opportunities and market presence. |
| | • | | The Reorganization will eliminate duplicative expenses and can reduce associated operational costs. |
| | • | | The combined Funds should have enhanced viability due to a larger asset base. A larger asset base also can lead to lower expense ratios. |
| | • | | The Acquiring Funds have better comparative total return performance than the Target Funds over most measurement periods and, in Funds Management’s view, better performance opportunities going forward. |
1
Funds Management has agreed to pay all expenses of each reorganization, so Fund shareholders will not bear these costs.
The overall responsibility for oversight of the Target Funds and Acquiring Funds rests with the Wells Fargo Advantage Funds’ Board of Trustees, which we refer to as the Board. The Board has unanimously approved each reorganization and believes that it is in the best interests of each Target Fund’s shareholders.
The Board of Trustees of Wells Fargo Advantage Funds unanimously recommends that you vote your proxy to approve the Reorganization.
Please read the enclosed proxy materials and consider the information provided. We encourage you to complete and mail your proxy ballot promptly. No postage is necessary if you mail it in the United States. Alternatively, you may vote by calling the toll-free number printed on your proxy ballot, or via the Internet according to the enclosed voting instructions. If you have any questions about the proxy materials, or the Reorganization, please call your trust officer, investment professional, or Wells Fargo Advantage Funds’ Investor Services at 1-800-222-8222. If you have any questions about voting your proxy, you may call our proxy solicitor, The Altman Group, at 1-866-406-2287. Thank you for your participation in this important initiative. Your vote is important to us, no matter how many shares you own.
Very truly yours,
Karla M. Rabusch
President
Wells Fargo Funds Trust
2
LIFE STAGE – CONSERVATIVE PORTFOLIO
LIFE STAGE – MODERATE PORTFOLIO
LIFE STAGE – AGGRESSIVE PORTFOLIO
OF
WELLS FARGO FUNDS TRUST
525 MARKET STREET
SAN FRANCISCO, CALIFORNIA 94105
NOTICE OF SPECIAL MEETING OF SHAREHOLDERS
SCHEDULED FOR JUNE 30, 2008
This is the formal notice and agenda for the special shareholder meeting (the “Meeting”) of the shareholders of each of the Funds of Wells Fargo Advantage Funds listed above. The Meeting will be held at 525 Market Street, 12th Floor, San Francisco, California 94105 on June 30, 2008, at 3:00 p.m. (Pacific Time). At the Meeting, shareholders will be asked to consider and act upon the proposal set forth below and transact such other business as may properly come before the Meeting. The table below lists the proposal on which shareholders will be asked to vote and identifies shareholders entitled to vote on the proposal.
| | |
PROPOSAL | | SHAREHOLDERS ENTITLED TO VOTE |
| Approval of an Agreement and Plan of Reorganization (the “Reorganization Plan”), under which substantially all of the assets of each Target Fund will be transferred to an Acquiring Fund as listed below in exchange for shares of a comparable Class of the corresponding Acquiring Fund having equal value, which will be distributed proportionately to the shareholders of the Target Fund. Upon completion of the transactions contemplated by the Reorganization Plan, the Target Funds will be liquidated and terminated as series of Wells Fargo Advantage Funds. | | Shareholders of each Target Fund with respect to the applicable reorganization shown below. |
| |
| Target Fund | | Corresponding Acquiring Fund |
| |
| Life Stage – Conservative Portfolio | | Moderate Balanced Fund |
| |
| Life Stage – Moderate Portfolio | | Growth Balanced Fund |
| |
| Life Stage – Aggressive Portfolio | | Aggressive Allocation Fund |
Shareholders of all Funds may consider and vote upon such other business as may properly come before the Meeting or any adjournment(s).
THE BOARD OF TRUSTEES OF WELLS FARGO ADVANTAGE FUNDS UNANIMOUSLY RECOMMENDS THAT YOU VOTE IN FAVOR OF THE PROPOSAL.
Shareholders of record of each Target Fund as of the close of business on April 18, 2008 are entitled to vote at the Meeting or any adjournment(s) thereof. Whether or not you expect to attend the Meeting, please complete and return the enclosed proxy ballot.
Please read the enclosed proxy materials and consider the information provided. We encourage you to complete and mail your proxy ballot promptly. No postage is necessary if you mail it in the United States.
1
Alternatively, you may vote by calling the toll-free number printed on your proxy ballot, or via the Internet according to the enclosed voting instructions. If you have any questions about the proxy materials, or the proposal, please call your trust officer, investment professional, or Wells Fargo Advantage Funds’ Investor Services at 1-800-222-8222. If you have any questions about voting your proxy, you may call our proxy solicitor, The Altman Group, at 1-866-406-2287.
By Order of the Board of Trustees of Wells Fargo Funds Trust
C. David Messman
Secretary
[May 6, 2008]
YOUR VOTE IS VERY IMPORTANT TO US REGARDLESS OF THE NUMBER OF SHARES THAT YOU ARE ENTITLED TO VOTE.
2
WELLS FARGO FUNDS TRUST
525 Market Street
San Francisco, California 94105
1-800-222-8222
COMBINED PROSPECTUS/PROXY STATEMENT
[May 6, 2008]
WHAT IS THIS DOCUMENT AND WHY ARE WE SENDING IT TO YOU?
This document is a combined prospectus and proxy statement, and we refer to it as the Prospectus/Proxy Statement. It contains the information that shareholders of the Target Funds listed in the Notice of Special Meeting of Shareholders should know before voting on the proposed Reorganization, and should be retained for future reference. It is the proxy statement of the Target Funds and also a prospectus for the Acquiring Funds.
HOW WILL THE REORGANIZATION WORK?
The Board has approved the reorganization of each Target Fund, which we refer to as the Reorganization. The Reorganization will involve four steps:
| | * | the liquidation of the Target Fund’s holdings; |
| | * | the transfer of substantially all of the assets and liabilities of the Target Fund to its corresponding Acquiring Fund in exchange for shares of the corresponding Acquiring Fund having equivalent value to the net assets transferred; |
| | * | the pro rata distribution of a comparable Class of shares of the Acquiring Fund to the shareholders of record of the Target Fund as of the effective date of the Reorganization in full redemption of all shares of the Target Fund; and |
| | * | the liquidation and termination of the Target Fund. |
As a result of the Reorganization, shareholders of each Target Fund will hold shares of a comparable Class of the corresponding Acquiring Fund, as described in this Prospectus/Proxy Statement. The total value of the Acquiring Fund shares that you receive in the Reorganization will be the same as the total value of the shares of the Target Fund that you held immediately before the Reorganization. Shareholders of each Target Fund generally will recognize gain or loss for federal tax purposes on the receipt of these Acquiring Fund shares. If one of the Target Funds does not approve the Reorganization, that Fund will not participate in the Reorganization. In such a case, the Target Fund will continue its operations beyond the date of the Reorganization and the Wells Fargo Advantage Funds’ Board of Trustees will consider what further action is appropriate, including liquidating and terminating the Target Fund as a series of Wells Fargo Advantage Funds, or considering a different reorganization.
These securities have not been approved or disapproved by the U.S. Securities and Exchange Commission (the “SEC”), nor has the SEC passed upon the accuracy or adequacy of this Prospectus/Proxy Statement. Any representation to the contrary is a criminal offense.
1
IS ADDITIONAL INFORMATION ABOUT THE FUNDS AND REORGANIZATION PLAN AVAILABLE?
Yes, additional information about the Funds is available in the:
| | • | | Prospectus for the Target Funds; |
| | • | | Statements of Additional Information, or SAIs, for the Target Funds and the Acquiring Funds; and |
| | • | | Annual and Semi-Annual Reports to shareholders of the Target Funds and the Acquiring Funds. |
All of these documents are on file with the SEC.
The prospectus, SAI, and Annual and Semi-Annual Reports of the Target Funds are incorporated by reference and are legally deemed to be part of this Prospectus/Proxy Statement. The SAI to this Prospectus/Proxy Statement, dated the same date as this Prospectus/Proxy Statement, also is incorporated by reference and is legally deemed to be part of this document. The prospectus and the most recent Annual Report to shareholders of the Target Funds, containing audited financial statements for the most recent fiscal year, and the most recent Semi-Annual Report to shareholders of the Target Funds have been previously mailed to shareholders. The SAI of the Acquiring Fund is incorporated by reference and is legally deemed to be part of the Prospectus/Proxy Statement.
There also is a Reorganization Plan between the Target Funds and the Acquiring Funds that describes the technical details of how the Reorganization will be accomplished. The Reorganization Plan has been filed with the SEC as Exhibit G to this Prospectus/Proxy Statement.
Copies of these documents are available upon request without charge by writing to, calling or visiting our web site:
Wells Fargo Advantage Funds
P.O. Box 8266
Boston, MA 02266-8266
1-800-222-8222
www.wellsfargo.com/advantagefunds
You also may view or obtain these documents from the SEC:
| In Person: | At the SEC’s Public Reference Room in Washington, D.C., and regional offices in New York City, at 233 Broadway, and in Chicago, at 175 West Jackson Boulevard, Suite 900 (duplicating fee required) |
| By Phone: | 1-800-SEC-0330
(duplicating fee required) |
| By Mail: | Public Reference Section
Securities and Exchange Commission
100 F Street, N.E.
Washington, DC 20549-0213
(duplicating fee required) |
| By Email: | publicinfo@sec.gov
(duplicating fee required) |
| By Internet: | www.sec.gov
(Information about the Target Funds and Acquiring Funds may be found under Wells Fargo Funds Trust) |
2
OTHER IMPORTANT THINGS TO NOTE:
| | * | An investment in the Wells Fargo Advantage Funds is not a deposit of Wells Fargo Bank, N.A. (“Wells Fargo Bank”) or any other bank and is not insured or guaranteed by the FDIC or any other government agency. |
| | * | You may lose money by investing in the Funds. |
3
TABLE OF CONTENTS
4
PROPOSAL: APPROVAL OF AN AGREEMENT AND PLAN OF REORGANIZATION
The Board of Wells Fargo Advantage Funds called this special shareholder meeting to allow shareholders of each Target Fund to consider and vote on the reorganization of each Target Fund into a corresponding Acquiring Fund, as shown in the table below.
| | |
Target Funds | | Acquiring Funds |
Life Stage – Conservative Portfolio
Investor Class | | Moderate Balanced Fund
Administrator Class |
| |
Life Stage – Moderate Portfolio
Investor Class | | Growth Balanced Fund
Administrator Class |
| |
Life Stage – Aggressive Portfolio
Investor Class | | Aggressive Allocation Fund
Administrator Class |
Overview
On November 7, 2007, the Board unanimously voted to approve the Reorganization, subject to approval by shareholders of each Target Fund. In the Reorganization, each Target Fund will transfer its assets to its corresponding Acquiring Fund, which will acquire substantially all the assets and assume substantially all the liabilities of the Target Fund. Upon the transfer of assets and assumption of liabilities, the Acquiring Fund will issue shares to the corresponding Target Fund, which shares will be distributed to shareholders in liquidation of the Target Fund. Any shares you own of a Target Fund at the time of the Reorganization will be cancelled and you will receive shares in a comparable Class of the corresponding Acquiring Fund having a value equal to the value of your shares of the Target Fund dividend. It is not intended that the Reorganization will constitute a tax-free “reorganization” for U.S. federal income tax purposes, with respect to each Target Fund and the corresponding Acquiring Fund, as discussed below under “Material U.S. Federal Income Tax Consequences of the Reorganization.” Accordingly, it is expected that the Reorganization generally will be taxable to Target Fund shareholders. If approved by shareholders, the Reorganization is expected to occur in the third quarter of 2008.
Reasons for the Reorganization
The Reorganization arises out of Fund Management’s review of the continued viability of various funds of Wells Fargo Advantage Funds, and evaluation of whether combining Funds with similar investment objectives, principal investments or principal investment strategies would better serve shareholders. The Board concluded that participation in the Reorganization is in the best interests of each Target Fund and its shareholders. In reaching that conclusion, the Board considered, among other things:
| | 1. | The enhanced viability of the combined Funds due to larger asset size; |
| | 2. | The viability of the Target Funds absent approval of the Reorganization; |
| | 3. | The comparative total return performance of the Acquiring Funds into which the Target Funds will be reorganized; |
| | 4. | The anticipated effect of the Reorganization on per-share expense ratios, both before and after waivers, of the Target Funds; |
| | 5. | The expected treatment of the Reorganization as a taxable event for U.S. federal income tax purposes; |
| | 6. | The relative compatibility of the investment objectives, principal investments and principal investment strategies of the Acquiring Funds with those of the Target Funds; and |
| | 7. | The anticipated benefits of economies of scale for the Target Funds and enabling greater diversification of investments by the master portfolios in which the Acquiring Funds invest. |
5
| | 8. | The potential elimination of duplicative costs and spreading of certain costs across a larger asset base due to combining Funds with compatible investment objectives, principal investments and principal investment strategies; and |
| | 9. | The undertaking by Funds Management to pay all expenses connected with the Reorganization so that shareholders of the Target Funds and Acquiring Funds will not bear these expenses. |
The Board also concluded that the economic interests of the shareholders of the Target Funds and the Acquiring Funds would not be diluted as a result of the Reorganization because the number of Acquiring Fund shares to be issued to Target Fund shareholders will be calculated based on the respective net asset value of the Funds. For a more complete discussion of the factors considered by Wells Fargo Advantage Funds’ Board in approving the Reorganization, see the section entitled “Board Consideration of the Reorganization” in this Prospectus/Proxy Statement.
6
SUMMARY
The following summary highlights differences between each Target Fund and its corresponding Acquiring Fund. This summary is not complete and does not contain all of the information that you should consider before voting on the Reorganization. For more complete information, please read the entire Prospectus/Proxy Statement.
Comparison of Current Fees and Pro Forma Fees
The following table shows current annual fund expense ratios for each Target Fund and Acquiring Fund, both before (total) and after (net) any contractual expense waivers and reimbursements, and the pro forma annual expense ratios for each Acquiring Fund, reflecting the anticipated effects, if any, of the Reorganization on both total and net operating expense ratios. All expense ratios are shown as a percentage of each Fund’s daily net assets and are as of September 30, 2007.
Two levels of expense ratios are included in the table:
| | a) | Total Annual Fund Operating Expenses– the total operating expenses of a fund, representing what a shareholder could potentially pay if no waivers or expense reimbursements were in place. |
| | b) | Net Annual Fund Operating Expenses– the expense level a shareholder can expect to actually pay, taking into account any fee waivers or expense reimbursements to which a fund’s adviser has contractually committed. |
| | | | | | | | | | | | | | |
Target Fund / Share
Class | | Current | | Acquiring Fund / Share
Class | | Current | | Pro Forma |
| | Total
Annual
Fund
Operating
Expenses* | | Net Annual
Fund
Operating
Expenses** | | | Total
Annual
Fund
Operating
Expenses* | | Net Annual
Fund
Operating
Expenses** | | Total
Annual
Fund
Operating
Expenses* | | Net Annual
Fund
Operating
Expenses** |
Life Stage – Conservative Portfolio
Investor Class | | 1.86% | | 1.25% | | Moderate Balanced Fund
Administrator Class | | 1.10% | | 0.90% | | 1.10% | | 0.90% |
| | | | | | | |
Life Stage – Moderate Portfolio
Investor Class | | 1.69% | | 1.35% | | Growth Balanced Fund
Administrator Class | | 1.13% | | 0.95% | | 1.13% | | 0.95% |
| | | | | | | |
Life Stage – Aggressive Portfolio
Investor Class | | 1.73% | | 1.45% | | Aggressive Allocation Fund
Administrator Class | | 1.20% | | 1.00% | | 1.20% | | 1.00% |
| * | Includes the pro-rata portion of the net operating expenses of the underlying funds/master portfolios in which the Fund invests. |
| ** | Funds Management has committed to waive fees and/or reimburse expenses for a specified period as discussed in Exhibit A to the extent necessary to maintain the Fund’s net annual operating expense ratio shown, which, for the Acquiring Funds, includes the underlying master portfolios’ fees and expenses in which the Acquiring Funds invest and for the Target Funds, includes the underlying funds’ expenses. |
In every case the Acquiring Fund will have lower total and net annual fund operating expenses than the corresponding Class of the Target Fund. Please see Exhibit A for a breakdown of the specific fees charged to each Target Fund and Acquiring Fund, and more information about expenses.
Funds Management has contractually agreed to maintain the pro forma Net Annual Fund Operating Expense Ratio for each of the Acquiring Funds through January 31, 2009. These contractual net expense ratios for the Acquiring Funds renew automatically upon expiration of the contractual commitment period, and can only be increased upon approval by the Funds’ Board.
7
For further discussion regarding the Board of Trustees consideration of the total and net operating expense ratios of the Funds in approving the Reorganization, see the section entitled “Board Consideration of the Reorganization” in this Prospectus/Proxy Statement.
Comparison of Investment Objectives, Principal Investments and Principal Investment Strategies
Each Target Fund and its corresponding Acquiring Fund pursue similar investment objectives and hold substantially similar securities, except for the limited differences noted below.
All of the Target Funds and the Acquiring Funds have investment objectives that are classified as non-fundamental, which means that the Board can change them without shareholder approval. Also, the Target Funds and Acquiring Funds have substantially identical “fundamental” investment policies that can only be changed with shareholder approval. Thus, the Reorganization will not result in a change in the Target Funds’ shareholders’ right to vote to approve changes to the investment objectives or fundamental investment policies of the Fund(s) in which they own shares.
Each Acquiring Fund involved in the Reorganization is a gateway blended fund that does not invest directly in portfolio securities. Rather, each Fund invests in several master portfolios of Wells Fargo Master Trust which strategies consist of different equity and fixed income investment styles. Each Acquiring Fund may invest in additional or fewer master portfolios, in other Wells Fargo Advantage Funds, or directly in a portfolio of securities. References to the investment activities of a gateway blended fund are intended to refer to the investment activities of the master portfolio(s) in which it invests.
The following charts compare the investment objective, principal investments and principal investment strategies of each Target Fund and its corresponding Acquiring Fund, and describe the key differences between the Funds. The charts are presented in summary form and, therefore, do not contain all of the information that you should consider before voting on the Reorganization. A more detailed comparison of the Funds’ investment objectives, principal investments and principal investment strategies, as well as the identity of each Fund’s investment sub-adviser and portfolio managers can be found at Exhibit B. You also can find additional information about a specific Fund’s investment objective, principal investments and principal investment strategies in its SAI, which is incorporated by reference herein. For more complete information, please read the entire Prospectus/Proxy Statement.
8
| | | | |
| | | Life Stage–Conservative (Target Fund) | | Moderate Balanced (Acquiring fund) |
| Investment Objective | | Seeks total return, consisting of current income and capital appreciation. | | Seeks total return, consisting of current income and capital appreciation. |
| | |
| Principal Investments | | Under normal circumstances, the Fund invests: - 60% of total assets in bond funds; and - 40% of total assets in stock funds. The percentage of the Fund’s assets invested in stock or bond funds may temporarily deviate from the percentages indicated above due to changes in market values. The adviser rebalances the Fund when the Fund’s assets deviate by a specified percentage from these percentages primarily through the use of daily cash flows. | | The Fund’s “neutral” target allocation is as follows: - 60% of the Fund’s total assets in fixed income securities; and - 40% of the Fund’s total assets in equity securities. |
| | |
| Principal Investment Strategies | | The Fund seeks to achieve its investment objective by allocating 60% of its total assets to affiliated bond funds and 40% of its total assets to affiliated stock funds (the “Underlying Funds”). Stock funds offer greater long-term capital appreciation potential, while bond funds help to moderate portfolio risk and provide income. By investing in several Underlying Funds, the Fund achieves greater diversification. Stock fund holdings are diversified across market capitalization (large- and mid-size companies) and investment styles (“growth” and “value”), in both domestic and foreign markets. Bond fund holdings are also diversified across a range of short- to intermediate-term income-producing securities, which may include, but are not limited to, U.S. Government obligations and corporate debt securities. | | The Fund is a gateway fund that uses a “multi-style” investment approach designed to reduce the price and return volatility of the Fund and to provide more consistent returns. Currently, the Fund’s portfolio combines the different equity and fixed income investment styles of several master portfolios. The Fund attempts to enhance its returns by using an asset allocation model that employs various analytical techniques, including quantitative techniques, valuation formulas and optimization procedures, to assess the relative attractiveness of equity and fixed income investments and to recommend changes in the Fund’s target allocations. The Fund uses futures contracts to implement target allocation changes determined by the model, rather than physically reallocating assets among investment styles. The Fund also may use futures, options or swap agreements, as well as other derivatives, to manage risk or to enhance return. |
| |
| COMPARISON SUMMARY | | • Both Funds have the same investment objectives, and substantially similar principal investments and strategies, except that: - The Acquiring Fund utilizes an asset allocation model to assess the attractiveness of equity v. fixed income investments and recommends changes in the target allocations, ranging between 30 and 50 percent for the Fund’s equity allocation and 50 and 70 percent for the Fund’s fixed income allocation. |
9
| | | | |
| | | Life Stage–Moderate (Target Fund) | | Growth Balanced (Acquiring fund) |
| Investment Objective | | Seeks total return, consisting of capital appreciation and current income. | | Seeks total return, consisting of capital appreciation and current income. |
| | |
| Principal Investments | | Under normal circumstances, the Fund invests: - 60% of total assets in stock funds; and - 40% of total assets in bond funds. The percentage of the Fund’s assets invested in stock or bond funds may temporarily deviate from the percentages indicated above due to changes in market values. The adviser rebalances the Fund when the Fund’s assets deviate by a specified percentage from these percentages primarily through the use of daily cash flows. | | The Fund’s “neutral” target allocation is as follows: - 65% of the Fund’s total assets in equity securities; and - 35% of the Fund’s total assets in fixed income securities. |
| | |
| Principal Investment Strategies | | The Fund seeks to achieve its investment objective by allocating 60% of its total assets to affiliated stock funds and 40% of its total assets to affiliated bond funds (the “Underlying Funds”). Stock funds offer greater long-term capital appreciation potential, while bond funds help to moderate portfolio risk and provide income. By investing in several Underlying Funds, the Fund achieves greater diversification. Stock fund holdings are diversified across market capitalization (large- and mid-size companies) and investment styles (“growth” and “value”), in both domestic and foreign markets. Bond fund holdings are also diversified across a range of short- to intermediate-term income-producing securities, which may include, but are not limited to, U.S. Government obligations and corporate debt securities. | | The Fund is a gateway fund that uses a “multi-style” investment approach designed to reduce the price and return volatility of the Fund and to provide more consistent returns. Currently, the Fund’s portfolio combines the different equity and fixed income investment styles of several master portfolios. The Fund attempts to enhance its returns by using an asset allocation model that employs various analytical techniques, including quantitative techniques, valuation formulas and optimization procedures, to assess the relative attractiveness of equity and fixed income investments and to recommend changes in the Fund’s target allocations. The Fund uses futures contracts to implement target allocation changes determined by the model, rather than physically reallocating assets among investment styles. The Fund also may use futures, options or swap agreements, as well as other derivatives, to manage risk or to enhance return. |
| |
| COMPARISON SUMMARY | | • Both Funds have the same investment objectives, and substantially similar principal investments and strategies, except that: - While both Funds utilize a fund-of-funds approach in allocating their assets between equity and fixed income affiliated funds, the percentage allocations are slightly different: Target Fund: 60% stock / 40% bond; Acquiring Fund: 65% equity / 35% fixed income. - The Acquiring Fund utilizes an asset allocation model to assess the attractiveness of equity v. fixed income investments and recommends changes in the target allocations, ranging between 50 and 80 percent for the Fund’s equity allocation and 20 and 50 percent for the Fund’s fixed income allocation. |
10
| | | | |
| | | Life Stage–Aggressive (Target Fund) | | Aggressive Allocation (Acquiring fund) |
| Investment Objective | | Seeks total return, consisting primarily of capital appreciation with a secondary emphasis on current income. | | Seeks total return, consisting primarily of capital appreciation. |
| | |
| Principal Investments | | Under normal circumstances, the Fund invests: - 80% of total assets in stock funds; and - 20% of total assets in bond funds. The percentage of the Portfolio’s assets invested in stock or bond funds may temporarily deviate from the percentages indicated above due to changes in market values. The adviser rebalances the Fund when the Fund’s assets deviate by a specified percentage from these percentages primarily through the use of daily cash flows. | | The Fund’s “neutral” target allocation is as follows: - 80% of the Fund’s total assets in equity securities; and - 20% of the Fund’s total assets in fixed income securities. |
| | |
| Principal Investment Strategies | | We seek to achieve the Fund’s investment objective by allocating 80% of its total assets to affiliated stock funds and 20% of its total assets to affiliated bond funds (the “Underlying Funds”). Stock funds offer greater long-term capital appreciation potential, while bond funds help to moderate portfolio risk and provide income. By investing in several Underlying Funds, the Portfolio achieves greater diversification. Stock fund holdings are diversified across market capitalization (large- and mid-size companies) and investment styles (“growth” and “value”), in both domestic and foreign markets. Bond fund holdings are also diversified across a range of short- to intermediate-term income-producing securities, which may include, but are not limited to, U.S. Government obligations and corporate debt securities. | | The Fund is a gateway fund that uses a “multi-style” investment approach designed to reduce the price and return volatility of the Fund and to provide more consistent returns. Currently, the Fund’s portfolio combines the different equity and fixed income investment styles of several master portfolios. The Fund attempts to enhance its returns by using an asset allocation model that employs various analytical techniques, including quantitative techniques, valuation formulas and optimization procedures, to assess the relative attractiveness of equity and fixed income investments and to recommend changes in the Fund’s target allocations. The Fund uses futures contracts to implement target allocation changes determined by the model, rather than physically reallocating assets among investment styles. The Fund also may use futures, options or swap agreements, as well as other derivatives, to manage risk or to enhance return. |
| |
| COMPARISON SUMMARY | | • Both Funds have substantially similar investment objectives, principal investments and strategies, except that: - The Acquiring Fund utilizes an asset allocation model to assess the attractiveness of equity v. fixed income investments and recommends changes in the target allocations, ranging between 65 and 95 percent for the Fund’s equity allocation and 5 and 35 percent for the Fund’s fixed income allocation. |
11
Common and Specific Risk Considerations
Because of the similarities in investment objectives and policies, the Target Funds and the Acquiring Funds are subject to substantially similar investment risks. The following discussion describes the principal risks that may affect the Funds’ portfolios as a whole (and indirectly, the portfolios of the master portfolios of Wells Fargo Master Trust in which the Acquiring Funds invest). What follows after that is a discussion which compares the principal risks associated with each Target Fund and its corresponding Acquiring Fund (in bold print). Additional information regarding which of the principal risks described below are applicable to each Fund may be found in Exhibit C, as well as in the prospectus for each Target Fund. An investment in a Fund is not a bank deposit, and it is not insured or guaranteed by the Federal Deposit Insurance Corporation (FDIC) or any other government agency.
Counter-Party Risk When a Fund enters into a repurchase agreement, an agreement where it buys a security in which the seller agrees to repurchase the security at an agreed upon price and time, the Fund is exposed to the risk that the other party will not fulfill its contract obligation. Similarly, the Fund is exposed to the same risk if it engages in a reverse repurchase agreement where a broker-dealer agrees to buy securities and the Fund agrees to repurchase them at a later date.
Debt Securities Risk Debt securities, such as notes and bonds, are subject to credit risk and interest rate risk. Credit risk is the possibility that an issuer of an instrument will be unable to make interest payments or repay principal when due. Changes in the financial strength of an issuer or changes in the credit rating of a security may affect its value. Interest rate risk is the risk that interest rates may increase, which tends to reduce the resale value of certain debt securities, including U.S. Government obligations. Debt securities with longer maturities are generally more sensitive to interest rate changes than those with shorter maturities. Changes in market interest rates do not affect the rate payable on an existing debt security, unless the instrument has adjustable or variable rate features, which can reduce its exposure to interest rate risk. Changes in market interest rates may also extend or shorten the duration of certain types of instruments, such as asset-backed securities, thereby affecting their value and the return on your investment.
Derivatives Risk The term “derivatives” covers a broad range of investments, including futures, options and swap agreements. In general, a derivative refers to any financial instrument whose value is derived, at least in part, from the price of another security or a specified index, asset or rate. For example, a swap agreement is a commitment to make or receive payments based on agreed upon terms, and whose value and payments are derived by changes in the value of an underlying financial instrument. The use of derivatives presents risks different from, and possibly greater than, the risks associated with investing directly in traditional securities. The use of derivatives can lead to losses because of adverse movements in the price or value of the underlying asset, index or rate, which may be magnified by certain features of the derivatives. These risks are heightened when the portfolio manager uses derivatives to enhance a Fund’s return or as a substitute for a position or security, rather than solely to hedge (or offset) the risk of a position or security held by the Fund. The success of management’s derivatives strategies will depend on its ability to assess and predict the impact of market or economic developments on the underlying asset, index or rate and the derivative itself, without the benefit of observing the performance of the derivative under all possible market conditions.
Emerging Markets Risk Emerging markets securities typically present even greater exposure to the risks described under “Foreign Investment Risk” and may be particularly sensitive to certain economic changes. For example, emerging market countries are more often dependent on international trade and are therefore often vulnerable to recessions in other countries. Emerging markets may be under-capitalized and have less developed legal and financial systems than markets in the developed world. Additionally, emerging markets may have volatile currencies and may be more sensitive than more mature markets to a variety of economic factors. Emerging market securities also may be less liquid than securities of more developed countries and could be difficult to sell, particularly during a market downturn.
12
Foreign Investment Risk Foreign investments, including American Depository Receipts (ADRs) and similar investments, are subject to more risks than U.S. domestic investments. These additional risks may potentially include lower liquidity, greater price volatility and risks related to adverse political, regulatory, market or economic developments. Foreign companies also may be subject to significantly higher levels of taxation than U.S. companies, including potentially confiscatory levels of taxation, thereby reducing the earnings potential of such foreign companies. In addition, amounts realized on sales or distributions of foreign securities may be subject to high and potentially confiscatory levels of foreign taxation and withholding when compared to comparable transactions in U.S. securities. Investments in foreign securities involve exposure to fluctuations in foreign currency exchange rates. Such fluctuations may reduce the value of the investment. Foreign investments are also subject to risks including potentially higher withholding and other taxes, trade settlement, custodial, and other operational risks and less stringent investor protection and disclosure standards in certain foreign markets. In addition, foreign markets can and often do perform differently from U.S. markets.
Growth Style Investment Risk Growth stocks can perform differently from the market as a whole and from other types of stocks. Growth stocks may be designated as such and purchased based on the premise that the market will eventually reward a given company’s long-term earnings growth with a higher stock price when that company’s earnings grow faster than both inflation and the economy in general. Thus a growth style investment strategy attempts to identify companies whose earnings may or are growing at a rate faster than inflation and the economy. While growth stocks may react differently to issuer, political, market and economic developments than the market as a whole and other types of stocks by rising in price in certain environments, growth stocks also tend to be sensitive to changes in the earnings of their underlying companies and more volatile than other types of stocks, particularly over the short term. Furthermore, growth stocks may be more expensive relative to their current earnings or assets compared to the values of other stocks, and if earnings growth expectations moderate, their valuations may return to more typical norms, causing their stock prices to fall. Finally, during periods of adverse economic and market conditions, the stock prices of growth stocks may fall despite favorable earnings trends.
High Yield Securities Risk High yield securities (sometimes referred to as “junk bonds”) are debt securities that are rated below investment-grade, are unrated and deemed by us to be below investment-grade, or are in default at the time of purchase. These securities have a much greater risk of default (or in the case of bonds currently in default, of not returning principal) and may be more volatile than higher-rated securities of similar maturity. The value of these securities can be affected by overall economic conditions, interest rates, and the creditworthiness of the individual issuers. Additionally, these securities may be less liquid and more difficult to value than higher-rated securities.
Issuer Risk The value of a security may decline for a number of reasons, which directly relate to the issuer, such as management performance, financial leverage, and reduced demand for the issuer’s goods and services.
Leverage Risk Certain transactions may give rise to a form of leverage. Such transactions may include, among others, reverse repurchase agreements, loans of portfolios securities, and the use of when-issued, delayed delivery or forward commitment transactions. The use of derivatives may also create a leveraging risk. The use of leverage may cause a Fund to liquidate portfolio positions when it may not be advantageous to do so. Leveraging, including borrowing, may cause a Fund to be more volatile than if the Fund had not been leveraged. This is because leverage tends to increase a Fund’s exposure to market risk, interest rate risk or other risks by, in effect, increasing assets available for investment.
Liquidity Risk A security may not be sold at the time desired or without adversely affecting the price.
Management Risk We cannot guarantee that a Fund will meet its investment objective. We do not guarantee the performance of a Fund, nor can we assure you that the market value of your investment will not decline. We will not “make good” on any investment loss you may suffer, nor can anyone we contract with to provide services, such as selling agents or investment advisers, offer or promise to make good on any such losses.
13
Market Risk The market price of securities owned by a Fund may go up or down, sometimes rapidly or unpredictably. Securities may decline in value due to factors affecting securities markets generally or particular industries represented in the securities markets. The value of a security may decline due to general market conditions which are not specifically related to a particular company, such as real or perceived adverse economic conditions, changes in the general outlook for corporate earnings, changes in interest or currency rates or adverse investor sentiment generally. They may also decline due to factors that affect a particular industry or industries, such as labor shortages or increased production costs and competitive conditions within an industry. During a general downturn in the securities markets, multiple asset classes may decline in value simultaneously. Equity securities generally have greater price volatility than debt securities.
Mortgage- and Asset-Backed Securities Risk Mortgage- and asset-backed securities represent interests in “pools” of mortgages or other assets, including consumer loans or receivables held in trust. In addition, mortgage dollar rolls are transactions in which a Fund sells mortgage-backed securities to a dealer and simultaneously agrees to purchase similar securities in the future at a predetermined price. Mortgage- and asset-backed securities, including mortgage dollar roll transactions, are subject to certain additional risks. Rising interest rates tend to extend the duration of these securities, making them more sensitive to changes in interest rates. As a result, in a period of rising interest rates, these securities may exhibit additional volatility. This is known as extension risk. In addition, these securities are subject to prepayment risk. When interest rates decline, borrowers may pay off their debts sooner than expected. This can reduce the returns of a Fund because the Fund will have to reinvest that money at the lower prevailing interest rates. This is known as contraction risk. These securities also are subject to risk of default on the underlying mortgage or assets, particularly during periods of economic downturn.
Multi-Style Management Risk Because certain portions of a Fund’s assets are managed by different portfolio managers using different styles, a Fund could experience overlapping security transactions. Certain portfolio managers may be purchasing securities at the same time other portfolio managers may be selling those same securities. This may lead to higher transaction expenses and may generate higher short-term capital gains compared to a Fund using a single investment management style.
Regulatory Risk Changes in government regulations may adversely affect the value of a security. An insufficiently regulated market might also permit inappropriate practices that adversely affect an investment.
Smaller Company Securities Risk Securities of companies with smaller market capitalizations tend to be more volatile and less liquid than larger company stocks. Smaller companies may have no or relatively short operating histories, or be newly public companies. Some of these companies have aggressive capital structures, including high debt levels, or are involved in rapidly growing or changing industries and/or new technologies, which pose additional risks.
Underlying Funds Risk The risks associated with a Fund include the risks related to each Underlying Fund in which the Fund invests. The Fund seeks to reduce the risk of your investment by diversifying among mutual funds that invest in stocks and, in some cases, bonds and among different fund managers. You still have, however, the risks of investing in various asset classes, such as market risks related to stocks and, in some cases, bonds, as well as the risks of investing in a particular Underlying Fund, such as risks related to the particular investment management style and that the Underlying Fund may underperform other similarly managed funds. To the extent that an Underlying Fund actively trades its securities, the Fund will experience a higher-than-average portfolio turnover ratio and increased trading expenses, and may generate higher short-term capital gains. Investments in the Fund result in your incurring greater expenses than if you were to invest directly in the Underlying Funds in which the Portfolio invests. There can be no assurance that any mutual fund, including an Underlying Fund, will achieve its investment objective.
U.S. Government Obligations Risk Securities issued by U.S. Government agencies or government-sponsored entities may not be guaranteed by the U.S. Treasury. The Government National Mortgage Association
14
(GNMA), a wholly owned U.S. Government corporation, is authorized to guarantee, with the full faith and credit of the U.S. Government, the timely payment of principal and interest on securities issued by institutions approved by GNMA and backed by pools of mortgages insured by the Federal Housing Administration or the Department of Veterans Affairs. U.S. Government agencies or government-sponsored entities (i.e., not backed by the full faith and credit of the U.S. Government) include the Federal National Mortgage Association (FNMA) and the Federal Home Loan Mortgage Corporation (FHLMC). Pass-through securities issued by FNMA are guaranteed as to timely payment of principal and interest by FNMA but are not backed by the full faith and credit of the U.S. Government. FHLMC guarantees the timely payment of interest and ultimate collection of principal, but its participation certificates are not backed by the full faith and credit of the U.S. Government. If a government-sponsored entity is unable to meet its obligations, the performance of an Underlying Fund that holds securities of the entity will be adversely impacted. U.S. Government obligations are viewed as having minimal or no credit risk but are still subject to interest rate risk.
Value Style Investment Risk Value stocks can perform differently from the market as a whole and from other types of stocks. Value stocks may be purchased based upon the belief that a given security may be out of favor. Value investing seeks to identify stocks that have depressed valuations, based upon a number of factors which are thought to be temporary in nature, and to sell them at superior profits when their prices rise in response to resolution of the issues which caused the valuation of the stock to be depressed. While certain value stocks may increase in value more quickly during periods of anticipated economic upturn, they may also lose value more quickly in periods of anticipated economic downturn. Furthermore, there is the risk that the factors which caused the depressed valuations are longer term or even permanent in nature, and that there will not be any rise in valuation. Finally, there is the increased risk in such situations that such companies may not have sufficient resources to continue as ongoing businesses, which would result in the stock of such companies potentially becoming worthless.
Life Stage – Conservative Portfolio/Moderate Balanced Fund
Both Funds are subject to substantially similar risks, except that the Life Stage—Conservative Portfolio is also subject to high yield securities risk, and smaller company securities risk, while the Moderate Balanced Fund is also subject to emerging market risk, all of which are described above. Emerging market securities typically present even greater exposure to foreign investment risk. Both of the Funds are primarily subject to counter-party risk, debt securities risk, derivatives risk, foreign investment risk, growth style investment risk, issuer risk, leverage risk, liquidity risk, management risk, market risk, mortgage- and asset-backed securities risk, multi-style management risk, regulatory risk, U.S. government obligations risk, underlying funds risk, and value style investment risk, as described above. The Moderate Balanced Fund also has risks associated with using an active allocation model as contrasted with a static percentage allocation.
Life Stage – Moderate Portfolio/Growth Balanced Fund
Both Funds are subject to substantially similar risks, except that the Life Stage—Moderate Portfolio is also subject to high yield securities risk, while the Growth Balanced Fund is also subject to emerging market risk, all of which are described above. Emerging market securities typically present even greater exposure to foreign investment risk. Both of the Funds are primarily subject to counter-party risk, debt securities risk, derivatives risk, foreign investment risk, growth style investment risk, issuer risk, leverage risk, liquidity risk, management risk, market risk, mortgage- and asset-backed securities risk, multi-style management risk, regulatory risk, smaller company securities risk, U.S. government obligations risk, underlying funds risk, and value style investment risk, as described above. The Growth Balanced Fund also has risks associated with using an active allocation model as contrasted with a static percentage allocation. In addition, the Growth Balanced Fund’s higher neutral allocation in equity securities makes it subject to a greater degree of market risk.
15
Life Stage – Aggressive Portfolio/Aggressive Allocation Fund
Both Funds are subject to substantially similar risks, except that the Life Stage – Aggressive Portfolio Fund is also subject to high yield securities risk, while the Aggressive Allocation Fund is also subject to emerging market risk, all of which are described above. Emerging market securities typically present even greater exposure to foreign investment risk. Both of the Funds are primarily subject to counter-party risk, debt securities risk, derivatives risk, foreign investment risk, growth style investment risk, issuer risk, leverage risk, management risk, market risk, mortgage- and asset-backed securities risk, multi-style management risk, regulatory risk, smaller company securities risk, U.S. government obligations risk, underlying funds risk, and value style investment risk, as described above. The Aggressive Allocation Fund also has risks associated with using an active allocation model as contrasted with a static percentage allocation.
Comparison of Performance
The information in this section shows you how each Target Fund and Acquiring Fund has performed and illustrates the variability of a Fund’s returns over time. The tables below provide a comparison of average annual total return information for the Investor Class of each Target Fund and the Administrator Class for each Acquiring Fund for one-, five- and ten-year periods (or since inception of the Fund, if shorter).
For more information regarding a Fund’s average annual total return, see the “Performance” of each Fund and “Financial Highlights” of each of the Acquiring Funds in Exhibit E to this Prospectus/Proxy Statement and each Target Fund’s prospectus.
Please remember that past performance is no guarantee of future results. All returns reflect the effect of fee waivers. Without these fee waivers, the average annual total returns for the Funds would have been lower.
Average Annual Total Returns
As of 12/31/07
| | | | | | | | |
Fund/Class (inception date) | | 1-Year | | 3-Years | | 5-Years | | 10-Years or
Since Inception |
Life Stage – Conservative Portfolio | | | | | | | | |
Investor Class (12-31-98)1 | | 5.85% | | 5.81% | | 7.44% | | 4.64% |
Moderate Balanced Fund | | | | | | | | |
Administrator Class (11-11-94)2 | | 6.28% | | 6.44% | | 8.13% | | 6.59% |
1 | Performance shown prior to April 11, 2005, for the Investor Class shares reflects the performance of the Investor Class of the Strong Life Stage Series – Conservative Portfolio. |
2 | Prior to April 11, 2005, the Administrator Class was named the Institutional Class. |
Average Annual Total Returns
As of 12/31/07
| | | | | | | | |
Fund/Class (inception date) | | 1-Year | | 3-Years | | 5-Years | | 10-Years or
Since Inception |
Life Stage – Moderate Portfolio | | | | | | | | |
Investor Class (12-31-98)1 | | 6.49% | | 6.96% | | 9.63% | | 4.88% |
Growth Balanced Fund | | | | | | | | |
Administrator Class (11-11-94)2 | | 6.56% | | 7.88% | | 10.88% | | 7.36% |
1 | Performance shown prior to April 11, 2005, for the Investor Class shares reflects the performance of the Investor Class of the Strong Life Stage Series – Moderate Portfolio. |
2 | Prior to April 11, 2005, the Administrator Class was named the Institutional Class. |
16
Average Annual Total Returns
As of 12/31/07
| | | | | | | | |
Fund/Class (inception date) | | 1-Year | | 3-Years | | 5-Years | | 10-Years or
Since Inception |
Life Stage – Aggressive Portfolio | | | | | | | | |
Investor Class (12-31-98)1 | | 6.81% | | 7.98% | | 11.72% | | 5.11% |
Aggressive Allocation Fund | | | | | | | | |
Administrator Class (12-02-97)2 | | 6.46% | | 8.51% | | 12.13% | | 7.33% |
1 | Performance shown prior to April 11, 2005, for the Investor Class shares reflects the performance of the Investor Class of the Strong Life Stage Series – Aggressive Portfolio. |
2 | Prior to April 11, 2005, the Wells Fargo Advantage Aggressive Allocation Fund – Administrator Class was named the Wells Fargo Strategic Growth Allocation Fund – Institutional Class. |
Comparison of Shareholder Account Features and Services
The following describes, and to the extent there are differences, compares the distribution arrangements, pricing policies, class structure, purchase, redemption, and exchange policies, redemption fees, frequent purchases and redemptions of fund shares policies and procedures and distribution policies of the Funds.
Distribution Arrangements. As the principal underwriter for the Funds, Wells Fargo Funds Distributor (“Funds Distributor”), an affiliate of Funds Management, uses its best efforts to distribute shares of the Funds on a continuous basis. Fund shares may be sold through broker-dealers and others who have entered into sales agreements with the principal underwriter. Administrator Class and Investor Class shares of the Funds are offered for sale at the next determined net asset value per share (“NAV”).
The Target Funds’ Investor Class and the Acquiring Funds’ Administrator Class each has adopted a shareholder servicing plan (the “Plan”) and has entered into related shareholder servicing agreements with financial institutions, including Wells Fargo Bank and Funds Management. The Plan and related agreements were adopted by the Wells Fargo Advantage Funds Board, including a majority of the Trustees who were not “interested persons” (as defined under the Investment Company Act of 1940 (the “1940 Act”)) of the Funds and who had no direct or indirect financial interest in the operation of the Plan or in any agreement related to the Plan. Under the Plan, each Fund is authorized to make payments not to exceed 0.25% of a Fund’s average daily net assets attributable to Administrator Class and Investor Class shares. Selling or shareholder servicing agents, in turn, may pay some or all of these amounts to their employees or registered representatives who recommend or sell Fund shares or make investment decisions on behalf of their clients.
Pricing Policies. The NAV of a mutual fund, plus any applicable sales charges, is the price you pay for buying, selling, or exchanging shares of a Fund.
The NAV for the Funds is calculated each business day as of the close of trading on the New York Stock Exchange (“NYSE”) (generally, 4:00 p.m. Eastern Time). To calculate a Fund’s NAV, the Fund’s assets are valued and totaled, liabilities are subtracted, and the balance, called net assets, is divided by the number of shares outstanding. The price at which a purchase or redemption of Fund shares is effected is based on the next calculation of NAV after the order is placed. Each Fund does not calculate its NAV on days the NYSE is closed for trading, which include New Year’s Day, Martin Luther King, Jr. Day, Washington’s Birthday, Good Friday, Memorial Day, Independence Day, Labor Day, Thanksgiving Day and Christmas Day.
With respect to any portion of a Fund’s assets that may be invested in other mutual funds, the Fund’s NAV is calculated based upon the NAVs of the other mutual funds in which the Fund invests, and the prospectuses for those companies explain the circumstances under which those companies will use fair value pricing and the effects of using fair value pricing.
17
With respect to any portion of a Fund’s assets invested directly in securities, each Fund’s investments are generally valued at current market prices. Securities are generally valued based on the last sale price during the regular trading session if the security trades on an exchange (“closing price”). Securities that are not traded primarily on an exchange generally are valued using latest quoted bid prices obtained by an independent pricing service. Securities listed on the Nasdaq Stock Market, Inc., however, are valued at the Nasdaq Official Closing Price (“NOCP”), and if no NOCP is available, then at the last reported sales price.
The Funds are required to depart from these general valuation methods and use fair value pricing methods to determine the values of certain investments if the Funds believe that the closing price or the latest quoted bid price of a security, including securities that trade primarily on a foreign exchange, does not accurately reflect its current value when the Fund calculates its NAV. In addition, the Funds use fair value pricing to determine the value of investments in securities and other assets, including illiquid securities, for which current market quotations are not readily available. The closing price or the latest quoted bid price of a security may not reflect its current value if, among other things, a significant event occurs after the closing price or latest quoted bid price but before a Fund calculates its NAV that materially affects the value of the security. The Funds use various criteria, including a systematic evaluation of U.S. market moves after the close of foreign markets, in deciding whether a foreign security’s market price is still reliable and, if not, what fair market value to assign to the security.
In light of the judgment involved in fair value decisions, there can be no assurance that a fair value assigned to a particular security is accurate or that it reflects the price that a Fund could obtain for such security if it were to sell the security as of the time of fair value pricing. Such fair value pricing may result in NAVs that are higher or lower than NAVs based on the closing price or latest quoted bid price. See the Funds’ SAIs, which are incorporated by reference herein, for further information.
Class Structure. The Funds offer a total of five share Classes (Administrator, Investor, Class A, Class B and Class C), each with a different combination of sales charges, fees, eligibility requirements and other features. Only the Investor Class and Administrator Class are described in this Prospectus/Proxy Statement.
Administrator Class and Investor Class
You can buy Administrator Class and Investor Class shares at the offering price, which is the NAV without an up-front sales charge.
Purchase, Redemption, and Exchange Policies. The following chart describes the Funds’ classes that are involved in the Reorganization.
| | |
Target Fund Class | | Acquiring Fund Class |
Investor Class | | Administrator Class |
The following chart highlights the purchase, redemption, and exchange policies for each relevant Class of the Funds.
| | | | |
Purchase, Redemption and
Exchange Policies | | Target Funds Investor Class | | Acquiring Funds Administrator Class |
| Minimum initial purchase (The Funds may waive the minimum initial investment under certain circumstances.) | | Regular Accounts: $2,500 IRAs, IRA rollovers, Roth IRAs: $1,000 UGMA/UTMA accounts: $1,000 Employee Sponsored Retirement Plans: no minimum | | $1 million/otherwise dependent on eligibility requirements*; however, Target Fund shareholders are allowed to continue to purchase Administrator Class shares of the Acquiring Fund into which they are reorganized without having to meet the Class’s eligibility requirements |
18
| | | | |
Purchase, Redemption and
Exchange Policies | | Target Funds Investor Class | | Acquiring Funds Administrator Class |
| | |
| Subsequent Purchases | | Regular Accounts: $100 IRAs, IRA rollovers, Roth IRAs: $100 UGMA/UTMA accounts: $50 Employee Sponsored Retirement Plans: no minimum | | no minimum |
| | |
| Purchases | | Shares may be purchased by mail, phone, through an Automatic Investment Plan, by Payroll Direct Deposit, at the Investor Center, online, by wire, or through a financial intermediary, subject to certain conditions. | | Shares may be purchased through certain financial intermediaries and by certain institutions by phone, at the Investor Center, online, by wire, and through a financial intermediary, subject to certain conditions. |
| | |
| Redemptions | | Redemption requests may be submitted by mail, by phone, by Electronic Funds Transfer, through a Systematic Withdrawal Plan, online, at the Investor Center, by wire, or through a financial intermediary, subject to certain conditions. | | Redemption requests may be submitted through certain financial intermediaries and by certain institutions by phone, by Electronic Funds Transfer, at the Investor Center, online, by wire, and through a financial intermediary, subject to certain conditions. |
| | |
| Exchange privileges | | In general, exchanges may be made between like share classes of any Wells Fargo Advantage Fund offered to the general public for investment (i.e. a Fund not closed to new accounts) and, you must exchange at least the minimum initial purchase amount for the new fund. Exchanges may be made through an Automatic Exchange Plan, subject to certain conditions. | | In general, exchanges may be made between like share classes of any Wells Fargo Advantage Fund offered to the general public for investment (i.e. a Fund not closed to new accounts) and, you must exchange at least the minimum initial purchase amount for the new fund. Exchanges may be made through an Automatic Exchange Plan, subject to certain conditions. |
* | The following entities are eligible to purchase Administrator Class shares: employee benefit plan programs that have at least $10 million in plan assets; broker-dealer managed account or wrap programs that charge an asset-based fee; registered investment adviser mutual fund wrap programs that charge an asset-based fee; Internal Revenue Code Section 529 college savings plan accounts; fund of funds including those advised by Funds Management (Wells Fargo Advantage WealthBuilder PortfoliosSM ); Investment Management and Trust Departments of Wells Fargo Bank purchasing shares on behalf of their clients; and under certain circumstances and for certain groups as detailed in the Funds’ SAIs. |
If the transfer agent receives your application in proper order before the close of the NYSE, your transactions will be priced at that day’s NAV. If your application is received after the close of trading on the NYSE, it will be priced at the next business day’s NAV. The Funds will process requests to sell shares at the first NAV calculated after a request in proper form is received by the transfer agent. Requests received before the cutoff time are processed on the same business day. The Funds reserve the right to refuse or cancel a purchase or exchange order for any reason, including if the Funds believe that doing so would be in the best interests of a Fund’s shareholders.
We normally will send out checks within one business day, and in any event no more than seven days, after we accept your request to redeem. If you redeem shares recently purchased by check or through Electronic Funds Transfer or the Automatic Investment Plan, you may be required to wait up to seven business days before we will send your redemption proceeds. Our ability to determine with reasonable certainty that investments have been finally collected is greater for investments coming from accounts with banks affiliated with Funds Management than it is for investments coming from accounts with unaffiliated banks. Redemption payments also may be delayed under extraordinary circumstances or as permitted by the SEC in order to protect remaining shareholders. Such extraordinary circumstances are discussed further in the Funds’ SAIs, which are incorporated by reference herein.
19
Although generally the Funds pay redemption requests in cash, the Funds reserve the right to determine in their sole discretion, whether to satisfy redemption requests by making payment in securities (known as a redemption in kind). In such case, we may pay all or part of the redemption in securities of equal value as permitted under the 1940 Act, and the rules thereunder. The redeeming shareholder should expect to incur transaction costs upon the disposition of the securities received.
If you purchased shares through a packaged investment product or retirement plan, read the directions for selling shares provided by the product or plan. There may be special requirements that supercede the directions in this Prospectus/Proxy Statement.
For a more complete discussion of the Target Funds’ purchase, redemption, and exchange policies, please see the Target Funds’ prospectus and SAI, which are incorporated by reference into this Prospectus/Proxy Statement.
Frequent Purchases and Redemptions of Fund Shares Policies and Procedures. The Funds reserve the right to reject any purchase or exchange order for any reason. The Funds are not designed to serve as vehicles for frequent trading. Purchases or exchanges that a Fund determines could harm the Fund may be rejected.
Excessive trading by Fund shareholders can negatively impact a Fund and its long-term shareholders in several ways, including disrupting Fund investment strategies, increasing transaction costs, decreasing tax efficiency, and diluting the value of shares held by long-term shareholders. Excessive trading in Fund shares can negatively impact a Fund’s long-term performance by requiring it to maintain more assets in cash or to liquidate portfolio holdings at a disadvantageous time. Certain Funds may be more susceptible than others to these negative effects. For example, Funds that have a greater percentage of their investments in non-U.S. securities may be more susceptible than other Funds to arbitrage opportunities resulting from pricing variations due to time zone differences across international financial markets. Similarly, Funds that have a greater percentage of their investments in small company securities may be more susceptible than other Funds to arbitrage opportunities due to the less liquid nature of small company securities. Both types of Funds also may incur higher transaction costs in liquidating portfolio holdings to meet excessive redemption levels. Fair value pricing may reduce these arbitrage opportunities, thereby reducing some of the negative effects of excessive trading.
The Funds actively discourage and take steps to prevent the portfolio disruption and negative effects on long-term shareholders that can result from excessive trading activity by Fund shareholders. The Board has approved the Funds’ policies and procedures, which provide, among other things, that Funds Management may deem trading activity to be excessive if it determines that such trading activity would likely be disruptive to a Fund by increasing expenses or lowering returns. In this regard, the Funds take steps to avoid accommodating frequent purchases and redemptions of shares by Fund shareholders. Funds Management monitors available shareholder trading information across all Funds on a daily basis. Funds Management will temporarily suspend the purchase and exchange privileges of an investor who completes a purchase and redemption in a Fund within 30 calendar days. Such investor will be precluded from investing in the Fund for a period of 30 calendar days.
A financial intermediary through whom you may purchase shares of the Fund may independently attempt to identify excessive trading and take steps to deter such activity. As a result, a financial intermediary may on its own limit or permit trading activity of its customers who invest in Fund shares using standards different from the standards used by Funds Management and discussed in this Prospectus/Proxy Statement. Funds Management may permit a financial intermediary to enforce its own internal policies and procedures concerning frequent trading in instances where Funds Management reasonably believes that the intermediary’s policies and procedures effectively discourage disruptive trading activity. If you purchase Fund shares through a financial intermediary, you should contact the intermediary for more information about whether and how restrictions or limitations on trading activity will be applied to your account.
20
Certain purchases and redemptions made under the following circumstances will not be factored into Funds Management’s analysis of frequent trading activity including, but not limited to: reinvestment of dividends; retirement plan contributions, loans and distributions (including hardship withdrawals); non-discretionary portfolio rebalancing associated with certain wrap accounts and retirement plans; and transactions in Class 529 shares and funds of funds.
Distribution Policies. Each Fund, except the Life Stage – Conservative Portfolio, makes distributions of any net investment income and any realized net capital gains annually. The Life Stage – Conservative Portfolio makes distributions of any net investment income at least quarterly and any realized net capital gains at least annually.
Distributions from the Funds are automatically reinvested in additional shares unless another option is available and chosen. For the Funds’ Investor Class shares, other options are to receive checks for these payments, have them automatically invested in another Fund, or have them deposited into your bank account. If checks remain uncashed for six months or are undeliverable by the Post Office, the distributions may be reinvested. Any distribution from a Fund returned because of an invalid banking instruction is sent to the address of record by check, and future distributions are automatically reinvested.
General. For more information, please read the Target Funds’ prospectus and SAI and the Acquiring Funds’ SAI, which are incorporated by reference herein.
Compensation to Dealers and Shareholder Servicing Agents
In addition to dealer reallowances and payments made by each Fund for distribution and shareholder servicing, the Fund’s adviser, the distributor or their affiliates make additional payments (“Additional Payments”) to certain selling or shareholder servicing agents for the Fund, which include broker-dealers. These Additional Payments are made in connection with the sale and distribution of shares of the Fund or for services to the Fund and its shareholders. These Additional Payments, which may be significant, are paid by the Fund’s adviser, the distributor or their affiliates, out of their revenues, which generally come directly or indirectly from fees paid by the entire Fund complex.
In return for these Additional Payments, the Fund’s adviser and distributor expect to receive certain marketing or servicing advantages that are not generally available to mutual funds that do not make such payments. Such advantages are expected to include, without limitation, placement of the Fund on a list of mutual funds offered as investment options to the selling agent’s clients (sometimes referred to as “Shelf Space”); access to the selling agent’s registered representatives; and/or ability to assist in training and educating the selling agent’s registered representatives.
Certain selling or shareholder servicing agents receive these Additional Payments to supplement amounts payable by the Fund under the shareholder servicing plans. In exchange, these agents provide services including, but not limited to, establishing and maintaining accounts and records; answering inquiries regarding purchases, exchanges and redemptions; processing and verifying purchase, redemption and exchange transactions; furnishing account statements and confirmations of transactions; processing and mailing monthly statements, prospectuses, shareholder reports and other SEC-required communications; and providing the types of services that might typically be provided by a Fund’s transfer agent (e.g., the maintenance of omnibus or omnibus-like accounts, the use of the National Securities Clearing Corporation for the transmission of transaction information and the transmission of shareholder mailings).
The Additional Payments may create potential conflicts of interests between an investor and a selling agent who is recommending a particular mutual fund over other mutual funds. Before investing, you should consult with your financial consultant and review carefully any disclosure by the selling agent as to what monies they receive from mutual fund advisers and distributors, as well as how your financial consultant is compensated.
21
The Additional Payments are typically paid in fixed dollar amounts, or based on the number of customer accounts maintained by the selling or shareholder servicing agent, or based on a percentage of sales and/or assets under management, or a combination of the above. The Additional Payments are either up-front or ongoing or both. The Additional Payments differ among selling and shareholder servicing agents. Additional Payments to a selling agent that is compensated based on its customers’ assets typically range between 0.05% and 0.30% in a given year of assets invested in the Fund by the selling agent’s customers. Additional Payments to a selling agent that is compensated based on a percentage of sales typically range between 0.10% and 0.15% of the gross sales of the Fund attributable to the selling agent. In addition, representatives of the Fund’s distributor visit selling agents on a regular basis to educate their registered representatives and to encourage the sale of Fund shares. The costs associated with such visits may be paid for by the Fund’s adviser, distributor, or their affiliates, subject to applicable FINRA regulations.
More information on the FINRA member firms that have received the Additional Payments described in this section is available in the Funds’ SAIs, which are incorporated herein.
Comparison of Investment Advisory Fees
Funds Management, a registered investment adviser, serves as the investment adviser for both the Target Funds and the Acquiring Funds. Thus, there will be no change in investment adviser if the Reorganization is approved. Funds Management, an indirect, wholly owned subsidiary of Wells Fargo & Company, was created to assume the mutual fund advisory responsibilities of Wells Fargo Bank and is an affiliate of Wells Fargo Bank. Wells Fargo Bank, which was founded in 1852, is the oldest bank in the western United States and is one of the largest banks in the United States. As adviser, Funds Management is responsible for implementing the investment policies and guidelines for the Funds and for supervising the sub-adviser who is responsible for the day-to-day portfolio management of the Acquiring Funds. For providing these services, Funds Management is entitled to receive fees as described in the table below. A discussion regarding the basis for the Board’s approval of the investment advisory and sub-advisory agreements for the Acquiring Funds is available in the Acquiring Funds’ semi-annual report for the fiscal half-year ended March 31, 2007.
Wells Fargo & Company is a diversified financial services company providing banking, insurance, investments, mortgage and consumer finance services. The involvement of various subsidiaries of Wells Fargo & Company, including Funds Management, in the management and operation of the Funds and in providing other services or managing other accounts gives rise to certain actual and potential conflicts of interest.
For example, certain investments may be appropriate for a Fund and also for other clients advised by Funds Management and its affiliates, and there may be market or regulatory limits on the amount of investment, which may cause competition for limited positions. Also, various client and proprietary accounts may at times take positions that are adverse to a Fund. Funds Management applies various policies to address these situations, but a Fund may nonetheless incur losses or underperformance during periods when Wells Fargo & Company, its affiliates and their clients achieve profits or outperformance.
Wells Fargo & Company may have interests in or provide services to portfolio companies or Fund shareholders or intermediaries that may not be fully aligned with the interests of all investors. Funds Management and its affiliates serve in multiple roles, including as investment adviser and, for most Wells Fargo Advantage Funds, sub-adviser, as well as administrator, principal underwriter, custodian and securities lending agent.
These are all considerations of which an investor should be aware and which may cause conflicts that could disadvantage a Fund. Funds Management has instituted business and compliance policies, procedures and disclosures that are designed to identify, monitor and mitigate conflicts of interest.
22
The following chart highlights the annual contractual rate of investment advisory fees payable by each Target Fund and Acquiring Fund as a percentage of the Fund’s average daily net assets.
| | | | |
Target Fund/Acquiring Fund | | Advisory Fee (Contractual) |
Life Stage – Conservative Portfolio | | 0.00% | | All asset levels |
Moderate Balanced Fund | | 0.25% | | All asset levels |
Life Stage – Moderate Portfolio | | 0.00% | | All asset levels |
Growth Balanced Fund | | 0.25% | | All asset levels |
Life Stage – Aggressive Portfolio | | 0.00% | | All asset levels |
Aggressive Allocation Fund | | 0.25% | | All asset levels |
The Target Funds do not have a sub-adviser, but the Acquiring Funds are sub-advised by Wells Capital Management Incorporated (“Wells Capital Management”), an affiliate of Funds Management and an indirect wholly owned subsidiary of Wells Fargo & Company. Accordingly, Wells Capital Management is responsible for the day-to-day investment management activities of the Acquiring Funds. Wells Capital Management is a registered investment adviser that provides investment advisory services for registered mutual funds, company retirement plans, foundations, endowments, trust companies, and high net-worth individuals. If the Target Fund shareholders approve the Reorganization, they will, in effect, be approving Wells Capital Management as an investment sub-adviser.
For a description of the portfolio managers for the Target Funds and Acquiring Funds, see Exhibit D.
Dormant Investment Advisory Arrangements. Under the investment advisory contract for each Acquiring Fund, Funds Management acts as investment adviser for each Fund’s assets redeemed from a master portfolio and invested directly in a portfolio of securities. Funds Management does not receive compensation under this arrangement as long as each Fund invests substantially all of its assets in one or more master portfolios. If a Fund redeems assets from a master portfolio and invests them directly, Funds Management would be entitled to receive an investment advisory fee from the Fund for the management of those assets.
The Acquiring Funds have similar “dormant” sub-advisory arrangements with some or all of the sub-advisers that advise the master portfolios in which each Fund invests. Under these arrangements, if a Fund redeems assets from a master portfolio and invests them directly in a portfolio of securities using the sub-adviser, the sub-adviser would be entitled to receive a sub-advisory fee from Funds Management at the same rate the sub-adviser received from the master portfolio for investing the portion of the Fund’s assets formerly invested in the master portfolio.
Other Principal Service Providers
The service providers for each of the Target Funds and Acquiring Funds are the same, except that the Target Funds do not have an investment sub-adviser while Wells Capital Management serves as an investment sub-adviser to the Acquiring Funds. The following is a list of principal service providers for the Target Funds and the Acquiring Funds.
| | | | |
| Service Providers |
| Service | | Target Funds | | Acquiring Funds |
| | |
| Investment Adviser | | Wells Fargo Funds Management, LLC 525 Market Street San Francisco, CA 94105 | | Wells Fargo Funds Management, LLC 525 Market Street San Francisco, CA 94105 |
| | |
| Sub-Adviser | | None | | Wells Capital Management Incorporated 525 Market Street San Francisco, CA 94105 |
23
| | | | |
| Service Providers |
| Service | | Target Funds | | Acquiring Funds |
| | |
| Distributor | | Wells Fargo Funds Distributor, LLC 525 Market Street San Francisco, CA 94105 | | Wells Fargo Funds Distributor, LLC 525 Market Street San Francisco, CA 94105 |
| | |
| Administrator | | Wells Fargo Funds Management, LLC | | Wells Fargo Funds Management, LLC |
| | |
| Custodian | | Wells Fargo Bank, N.A. 6th St. & Marquette Minneapolis, MN 55479 | | Wells Fargo Bank, N.A. 6th St. & Marquette Minneapolis, MN 55479 |
| | |
| Fund Accountants | | PFPC, Inc. 400 Bellevue parkway Wilmington, DE 19809 | | PFPC, Inc. 400 Bellevue parkway Wilmington, DE 19809 |
| | |
| Transfer Agent and Dividend Disbursing Agent | | Boston Financial Data Services, Inc. 1250 Hancock Street Quincy, MA 02169 | | Boston Financial Data Services, Inc. 1250 Hancock Street Quincy, MA 02169 |
Terms of the Reorganization
At the effective time of the Reorganization, each Acquiring Fund will acquire substantially all of the assets and assume substantially all of the liabilities of its corresponding Target Fund in exchange for shares of equal value of such Acquiring Fund. The Reorganization is governed by the Reorganization Plan.
Each Acquiring Fund, for each share class, will issue the number of full and fractional shares determined by dividing the net value of all the assets of each respective Target Fund class by the NAV of one share of the Acquiring Fund class. Based on this calculation, Wells Fargo Advantage Funds will issue shares of each Acquiring Fund class with an aggregate NAV equal to that of the corresponding Target Fund class.
The Reorganization Plan, attached as Exhibit G, provides the time for and method of determining the net value of the Target Funds’ assets and the NAV of a share of the Acquiring Funds. To determine the valuation of the assets transferred by each Target Fund and the number of shares of each Acquiring Fund to be transferred, the parties will use the standard valuation methods used by the Acquiring Funds in determining daily NAVs, which are identical to the methods used by the Target Funds. The valuation will be done immediately prior to the closing of the Reorganization, which is expected to occur on or about July 18, 2008, and will be done at the time of day the Target Funds and Acquiring Funds ordinarily calculate their NAVs.
Each Target Fund will distribute the Acquiring Fund shares it receives in the Reorganization to its shareholders. Shareholders of record of each Target Fund will be credited with shares of the corresponding Class of the corresponding Acquiring Fund equal in value to the Target Fund shares that the shareholders hold of record at the effective time of the Reorganization. [Each shareholder will also have the right to receive any unpaid distributions that Wells Fargo Advantage Funds declared with respect to the shareholder’s Target Fund shares before the effective time of the Reorganization.] At that time or as soon as reasonably practical after the effective time of the Reorganization, Wells Fargo Advantage Funds will dissolve and liquidate each Target Fund, and terminate each Target Fund as a series of Wells Fargo Advantage Funds in accordance with applicable law and its Declaration of Trust.
A majority of the Board may terminate the Reorganization Plan on behalf of a Target or Acquiring Fund under certain circumstances. Completion of the Reorganization is subject to numerous conditions set forth in the Reorganization Plan. An important condition to closing is that Wells Fargo Advantage Funds receives a tax opinion to the effect that the Reorganization will not qualify as a “reorganization” for U.S. federal income tax purposes, with respect to each Target Fund and the corresponding Acquiring Fund, and it is expected that the
24
Reorganization generally will be taxable for such purposes to the Target Funds’ shareholders. Another condition is that each Target Fund distributes all of its previously undistributed taxable income and recognized net capital gains to its shareholders immediately before the closing of the Reorganization. The closing is also conditioned upon both the Target Funds and Acquiring Funds receiving the necessary documents to transfer the assets and liabilities of each Target Fund to its corresponding Acquiring Fund, and to transfer the Acquiring Fund shares back to its corresponding Target Fund in exchange for the assets received.
Board Consideration of the Reorganization
Common Considerations
The Board considered the Reorganization of the Target Funds into the Acquiring Funds at its regular quarterly meetings held on August 8, 2007, and November 7, 2007. Funds Management provided materials on the Reorganization to the Board. Those materials included information on the investment objectives, principal investments and principal investment strategies of the Target Funds and the Acquiring Funds, comparative operating expense ratios, asset size, risk profile and performance information, and an analysis of the projected benefits to Target Fund shareholders from the Reorganization. After discussing and considering these materials, the Board unanimously approved the Reorganization Plan and determined that the Reorganization of the Target Funds into the Acquiring Funds would be in the best interests of each Target Fund and its shareholders. The Board further determined that the interests of existing shareholders of each Fund would not be diluted as a result of the Reorganization. Consequently, the Board unanimously recommends that Target Fund shareholders vote to approve the Reorganization for the following reasons:
The combined Funds are expected to be more viable because Wells Fargo Advantage Funds will be able to concentrate its marketing efforts on the combined Funds, rather than similar but separate Funds in each case. The Target Funds generally have been experiencing net redemptions or flat or uneven asset growth while the Acquiring Funds generally have been experiencing net subscriptions, providing a further indication of their greater viability.
The Reorganization also should permit the master portfolios owned by the combined Funds to diversify more broadly and take advantage of the greater purchasing power that is derived from the inclusion of additional assets. Other potential portfolio management benefits from a larger asset base include reduced trading costs and more efficient cash management.
| | * | STREAMLINED PRODUCT LINE |
The Reorganization, together with other reorganizations currently in progress, will streamline Wells Fargo Advantage Funds by combining Funds with common or similar investment objectives, principal investments or principal investment strategies. By reorganizing the Target Funds, Wells Fargo Advantage Funds is able to take steps towards eliminating duplicative costs and improving potential shareholder returns. The elimination of duplicative costs and the spreading of certain costs across a larger asset base also can lead to reductions in net operating expense ratios.
| | * | GREATER ECONOMIES OF SCALE |
The Target Funds have the potential to benefit from greater economies of scale by, among other things, reorganizing into funds with greater assets, thereby reducing certain fixed costs (such as legal, compliance and board of trustee expenses) as a percentage of fund assets.
25
| | * | COMPATIBLE OBJECTIVES AND INVESTMENT STRATEGIES |
As discussed in the section entitled “Comparison of Investment Objectives, Principal Investments and Principal Investment Strategies,” each Acquiring Fund and corresponding Target Fund have compatible investment objectives, principal investments and principal investment strategies. The Reorganization also is not expected to significantly alter the risk/potential return profile of any shareholder’s investment, with the exception of possible temporary shifts in risk profiles of the Acquiring Funds based on each Acquiring Fund’s use of an asset allocation model that recommends changes to the Fund’s target allocations that the Target Funds do not employ (described more fully in the following sub-section entitled “Specific Considerations”).
In each reorganization, the Acquiring Fund has better total return performance over most measurement periods than the corresponding Target Fund. Shareholders can consult the chart in the section entitled “Comparison of Performance” for Fund-specific performance comparisons.
| | * | TOTAL AND NET OPERATING EXPENSES OF THE FUNDS |
The Board considered the total and net annual fund operating expenses for each Target Fund and corresponding Acquiring Fund. For each reorganization, the Acquiring Fund class will have a lower net operating expense ratio than the corresponding class of the Target Fund. Thus, all Target Fund shareholders will pay lower fees as a result of the Reorganization. Shareholders can consult the section entitled “Comparison of Current Fees and Pro Forma Fees” for Fund-specific total and net operating expenses comparisons.
| | * | EXPECTED TAXABLE CONVERSION OF THE TARGET FUND SHARES |
The Board noted the expectation that the Reorganization will be taxable to each Target Fund’s shareholders, but also noted that a significant portion of shareholder accounts are in tax-advantaged accounts. Shareholders should review the section entitled “Material U.S. Federal Income Tax Consequences of the Reorganization” for the material U.S. federal income tax consequences of the Reorganization.
| | * | EXPENSES OF THE REORGANIZATION |
Funds Management has agreed to bear all of the expenses of preparing, printing, and mailing the Prospectus/Proxy Statement and related solicitation expenses for the approval of the Reorganization, so shareholders of the Target Funds and Acquiring Funds will not bear these costs.
Specific Considerations
The Board also considered certain factors specific to each Fund in concluding that the proposed Reorganization is in the best interests of each Target Fund’s shareholders. Some of the specific key factors that the Board considered for each reorganization are detailed below.
Life Stage – Conservative Portfolio/Moderate Balanced Fund
The Board considered the duplicative nature of maintaining two Funds that have similar investment objectives, principal investments, principal investment strategies and “neutral” target allocations (60% of total assets in fixed income styles and 40% of total assets in equity styles). The Board also considered the Life Stage – Conservative Portfolio’s continuous net redemptions and decrease in assets over the past several years and its smaller asset base (approximately $9 million) as compared to that of the Moderate Balanced Fund (approximately $549 million). The Board further considered that the Moderate Balanced Fund’s asset allocation model could recommend a change in the Fund’s equity target allocation to between 30% and 50% of the Fund’s total assets (as compared to a static 40% for the Life Stage – Conservative Portfolio) and to between 50% and 70% of the Fund’s total assets for the fixed income target allocation (as compared to a static 60% for the Life
26
Stage – Conservative Portfolio), possibly affecting the risk profile of the Moderate Balanced Fund during periods of deviation from the Fund’s “neutral” target allocations. However, the Board noted that both Funds’ “neutral” target allocations are the same, and that the Moderate Balanced Fund’s asset allocation model allows the Fund to make changes to the target allocations in response to market and other conditions. The Board then considered that the Moderate Balanced Fund had better performance over all measurement periods and had a longer operating history. The Board noted that the Life Stage – Conservative Portfolio has no advisory fee and that the Moderate Balanced Fund has a 0.25% advisory fee, but also noted that the Moderate Balanced Fund has a lower operating expense ratio than the Life Stage – Conservative Portfolio.
Life Stage – Moderate Portfolio/Growth Balanced Fund
The Board considered the duplicative nature of maintaining two Funds that have similar investment objectives, principal investments, principal investment strategies and “neutral” target allocations (60% of total assets in equity styles and 40% of total assets in fixed income styles for the Life Stage – Moderate Portfolio, and 65% of total assets in equity styles and 35% of total assets in fixed income styles for the Growth Balanced Fund). The Board also considered the Life Stage – Conservative Portfolio’s continuous net redemptions and decrease in assets over the past several years and its smaller asset base (approximately $35 million) as compared to that of the Growth Balanced Fund (approximately $1.97 billion). The Board further considered that the Growth Balanced Fund’s asset allocation model could recommend a change in the Fund’s equity target allocation to between 50% and 80% of the Fund’s total assets (as compared to a static 60% for the Life Stage – Moderate Portfolio) and to between 20% and 50% of the Fund’s total assets for the fixed income target allocation (as compared to a static 40% for the Life Stage – Moderate Portfolio), possibly affecting the risk profile of the Growth Balanced Fund during periods of deviation from the Fund’s target allocations. However, the Board noted that both Funds’ “neutral” target allocations are similar, and that the Growth Balanced Fund’s asset allocation model allows the Fund to make changes to the target allocations in response to market and other conditions. The Board then considered that the Growth Balanced Fund had better performance over all measurement periods and had a longer operating history. The Board noted that the Life Stage – Moderate Portfolio has no advisory fee and that the Growth Balanced Fund has a 0.25% advisory fee, but also noted that the Growth Balanced Fund has a lower operating expense ratio than the Life Stage – Moderate Portfolio.
Life Stage – Aggressive Portfolio/Aggressive Allocation Fund
The Board considered the duplicative nature of maintaining two Funds that have similar investment objectives, principal investments, principal investment strategies and “neutral” target allocations (80% of total assets in equity styles and 20% of total assets in fixed income styles). The Board also considered the Life Stage – Aggressive Portfolio’s uneven growth over the past several years and its smaller asset base (approximately $32 million) as compared to that of the Aggressive Allocation Fund (approximately $273 million). The Board further considered that the Aggressive Allocation Fund’s asset allocation model could recommend a change in the Fund’s equity target allocation to between 65% and 95% of the Fund’s total assets (as compared to a static 80% for the Life Stage – Aggressive Portfolio) and to between 5% and 35% of the Fund’s total assets for the fixed income target allocation (as compared to a static 20% for the Life Stage – Aggressive Portfolio), possibly affecting the risk profile of the Aggressive Allocation Fund during periods of deviation from the Fund’s target allocations. However, the Board noted that both Funds’ “neutral” target allocations are the same, and that the Aggressive Allocation Fund’s asset allocation model allows the Fund to make changes to the target allocations in response to market and other conditions. The Board then considered that the Aggressive Allocation Fund had better performance over most measurement periods and had a longer operating history. The Board noted that the Life Stage – Aggressive Portfolio has no advisory fee and that the Aggressive Allocation Fund has a 0.25% advisory fee, but also noted that the Aggressive Allocation Fund has a lower operating expense ratio than the Life Stage – Aggressive Portfolio.
27
Material U.S. Federal Income Tax Consequences of the Reorganization
The following discussion summarizes the material U.S. federal income tax consequences of the Reorganization, including an investment in Acquiring Fund shares, that are applicable to you as a Target Fund shareholder. It is based on the Internal Revenue Code, applicable U.S. Treasury regulations, judicial authority and administrative rulings and practice, all as of the date of this Prospectus/Proxy Statement and all of which are subject to change, including changes with retroactive effect. The discussion below does not address any state, local or foreign tax consequences of the Reorganization and assumes each Target Fund will continue to qualify as a regulated investment company for U.S. federal income tax consequences. Your tax treatment may vary depending upon your particular situation. You also may be subject to special rules not discussed below if you are a certain kind of Target Fund shareholder, including, but not limited to: an insurance company; a tax-exempt organization; a financial institution or broker-dealer; a person who is neither a citizen nor resident of the United States or entity that is not organized under the laws of the United States or political subdivision there of; a holder of Target Fund shares as part of a hedge, straddle or conversion transaction; a person that does not hold Target Fund shares as a capital asset at the time of the Reorganization; an entity taxable as a partnership for U.S. federal income tax purposes; or you hold Target Fund shares through a tax-advantaged account, such as a 401(k) plan.
We have not requested and will not request an advance ruling from the Internal Revenue Service as to the U.S. federal income tax consequences of the Reorganization or any related transaction. The Internal Revenue Service could adopt positions contrary to those discussed below and such positions could be sustained. You are urged to consult with your own tax advisors and financial planners as to the particular tax consequences of the Reorganization to you, including the applicability and effect of any state, local or foreign laws and the effect of possible changes in applicable tax laws.
Treatment of the Reorganization as a Taxable Transaction under the Internal Revenue Code. The obligation of the Funds to consummate the Reorganization is contingent upon their receipt of an opinion from Proskauer Rose LLP, special tax counsel to the Funds, generally to the effect that the Reorganization will not qualify as a “reorganization” under Section 368(a) of the Internal Revenue Code with respect to each Acquiring Fund and its corresponding Target Fund, and therefore generally:
i) the transfer of the assets of the Target Fund to the corresponding Acquiring Fund in exchange for shares of the Acquiring Fund will be treated as a sale of assets by the Target Fund, and the Target Fund will recognize gain or loss on each of the transferred assets in an amount equal to the difference between (a) the fair market value of such assets and (b) the tax basis of such assets;
ii) the Target Fund will be entitled to deductions for dividends paid to its shareholders in an amount sufficient to offset its taxable income and capital gains, including any income and gains recognized in the Reorganization, and therefore will not incur any U.S. federal income tax liability for its last complete taxable year ending on the date of the closing of the Reorganization;
iii) no gain or loss will be recognized by the Acquiring Fund on the receipt of assets of the Target Funds in exchange for the Acquiring Fund’s stock and assumption of the Target Fund’s liabilities;
iv) the Acquiring Fund’s tax basis in the assets of the Target Fund transferred to it will be the fair market value of such assets as of the effective time of the Reorganization;
v) the Acquiring Fund’s holding period for the assets transferred to it by the Target Fund will start the day following the date of the Reorganization;
vi) shareholders of the Target Fund generally will recognize gain or loss on the receipt of shares of the Acquiring Fund they receive in exchange for shares of the Target Fund equal to the difference between (a) the fair market value of the Acquiring Fund’s shares and (b) the Target Fund shareholder’s aggregate tax basis for its shares in the Target Fund;
28
vii) the tax basis in the Acquiring Fund shares received by Target Fund shareholders in exchange for their shares of the Target will be the fair market value of the shares of the Acquiring Fund as of the effective time of the Reorganization;
viii) the Target Fund shareholders’ holding periods for the shares of the Acquiring Fund received in exchange for their Target Fund shares will start the day following the date of the Reorganization; and
ix) each Acquiring Fund will not acquire any capital loss carryforwards of any other tax attributes of the corresponding Target Fund.
The tax opinion described above will be based on then-existing law, will be subject to certain assumptions, qualifications and exclusions and will be based in part on the truth and accuracy of certain representations by us on behalf of the Acquiring Funds and the Target Funds.
Status as a Regulated Investment Company. Since its formation, each of the Acquiring Funds and each of the Target Funds believes it has qualified as a separate “regulated investment company” under Subchapter M of the Internal Revenue Code. Accordingly, each of the Acquiring Funds and each of the Target Funds believes that it has been, and expects to continue to be, relieved of U.S. federal income tax liability to the extent that it makes distributions of its taxable income and gains to its shareholders.
Distribution of Income and Gains. Prior to the Reorganization, if Funds Management reasonably determines that a Target Fund is a personal holding company, such Target Fund’s taxable year will end as a result of the Reorganization and such Fund is generally required to declare to its shareholders of record one or more distributions of all of its previously undistributed net investment income and net realized capital gain, including capital gains on any securities disposed of in connection with the Reorganization. Such distributions will be made to such shareholders before or after the Reorganization. A Target Fund shareholder will be required to include any such distributions in his or her taxable income. This may result in the recognition of income that could have been deferred or never realized had the Reorganization not occurred.
Moreover, if an Acquiring Fund has realized net investment income or net capital gains but has not distributed such income or gains prior to the Reorganization and you acquire shares of such Acquiring Fund in the Reorganization, a portion of your subsequent distributions from the Target Fund will, in effect, be a taxable return of part of your investment. Similarly, if you acquire Acquiring Fund shares in the Reorganization when it holds appreciated securities, you will receive a taxable return of part of your investment if, and when, the Acquiring Fund sells the appreciated securities and distributes the realized gain. You should assume that the Acquiring Funds have built up, or have the potential to build up, high levels of unrealized appreciation.
U.S. Federal Income Taxation of an Investment in an Acquiring Fund. The following discussion summarizes the U.S. federal income taxation of an investment in an Acquiring Fund. This discussion is not intended as a substitute for careful tax planning. You should consult your tax advisor about your specific tax situation. Please see the prospectuses and SAIs for the Acquiring Funds for additional federal income tax information.
Qualification as a Regulated Investment Company. Each Acquiring Fund intends to continue to be treated and qualify each year as a regulated investment company under Subchapter M of the Internal Revenue Code. In order to so qualify and receive the special tax treatment accorded regulated investment companies and their shareholders, an Acquiring Fund must, among other things, (a) derive at least 90% of its gross income for each taxable year from (i) dividends, interest, payments with respect to certain securities loans and gains from the sale or other disposition of stock, securities and foreign currencies, or other income (including but not limited to gains from options, futures or forward contracts) derived with respect to its business of investing in such stock, securities, or currencies and (ii) net income derived from interests in “qualified publicly traded partnerships” (as defined below); (b) distribute with respect to each taxable year at least 90% of the sum of its investment company taxable income (as that term is defined in the Internal Revenue Code without regard to the deduction for dividends paid – generally taxable ordinary income and the excess, if any, of short-term capital gains over
29
long-term capital losses), and its net tax-exempt income, for such year; and (c) diversify its holdings so that, at the end of each quarter of the Acquiring Fund’s taxable year (i) at least 50% of the market value of the Acquiring Fund’s assets is represented by cash, cash items, U.S. Government Securities, securities of other regulated investment companies and other securities, limited in respect of any one issuer to a value of not greater than 5% of the value of the Acquiring Fund’s total assets and 10% of the outstanding voting securities of such issuer and (ii) not more than 25% of the value of its assets is invested (x) in the securities (other than those of the U.S. Government or other regulated investment companies) of any one issuer or of two or more issuers that the Acquiring Fund controls and that are engaged in the same, similar or related trades or businesses or (y) in the securities of one or more qualified publicly traded partnerships. For purposes of meeting this diversification requirement, in the case of the Acquiring Funds’ investments in loan participations, the issuer may be the financial intermediary or the borrower.
In general, for purposes of the 90% gross income requirement described in (a) above, income derived from a partnership will be treated as qualifying income only to the extent such income is attributable to items of income of the partnership which would be qualifying income if realized by the regulated investment company. However, 100% of the net income derived from an interest in a “qualified publicly traded partnership” (defined as a partnership interest (a) that is traded on an established securities market or is readily tradable on a secondary market or the substantial equivalent thereof and (b) derives more than 90% of its income from the qualifying income described in (a)(i) of the preceding paragraph) will be treated as qualifying income. In addition, although in general the passive loss rules of the Internal Revenue Code do not apply to regulated investment companies, such rules do apply to a regulated investment company with respect to items attributable to an interest in a qualified publicly traded partnership.
If an Acquiring Fund qualifies as a regulated investment company that is accorded special tax treatment, the Acquiring Fund will not be subject to federal income tax on income paid to its shareholders in the form of dividends (including Capital Gain Dividends, as defined below). If an Acquiring Fund failed to qualify as a regulated investment company in any taxable year, the Acquiring Fund would be subject to tax on its taxable income at corporate rates (without any deduction for distributions to its shareholders), and all distributions from earnings and profits, including any distributions of net tax-exempt income and net long-term capital gain, would be taxable to shareholders as ordinary income. In addition, the Acquiring Fund could be required to recognize unrealized gains, pay substantial taxes and interest and make substantial distributions before requalifying as a regulated investment company.
If an Acquiring Fund fails to distribute substantially all of its ordinary income and net capital gain for the calendar year and any retained amount from the prior calendar year, the Acquiring Fund will be subject to a non-deductible 4% excise tax on the undistributed amounts. For these purposes, the Acquiring Fund will be treated as having distributed any amount for which it is subject to income tax. A dividend paid to shareholders by an Acquiring Fund in January of a year generally is deemed to have been paid by the Acquiring Fund on December 31 of the preceding year, if the dividend was declared and payable to shareholders of record on a date in October, November or December of that preceding year. Each Acquiring Fund intends generally to make distributions sufficient to avoid imposition of the 4% excise tax, although there can be no assurance that it will be able to do so.
Distributions. Each Acquiring Fund will distribute, at least annually, any net investment income and net realized capital gains. Distributions of net investment income (other than qualified dividend income and exempt-interest income discussed below) are generally taxable to shareholders as ordinary income. Taxes on distributions of capital gains are determined by how long the Acquiring Fund owned the investments that generated them, rather than how long a shareholder has owned his or her shares. Distributions of each Acquiring Fund’s net capital gain (i.e., the excess of a Fund’s net long-term capital gain over net short-term capital loss), if any, from the sale of investments that the Acquiring Fund owned for more than one year and that are properly designated by the Fund as capital gain dividends (“Capital Gain Dividends”) are taxable as long-term capital gain, regardless of how long a shareholder has held Acquiring Fund shares. For taxable years beginning before January 1, 2011,
30
such distributions will generally be subject to a 15% tax rate, with lower rates applying to taxpayers in the 10% and 15% rate brackets, and will not be eligible for the dividends received deduction. Distribution of gains from the sale of investments that an Acquiring Fund owned for one year or less will be taxable as ordinary income. Distributions of taxable income or capital gains are taxable to Acquiring Fund shareholders whether received in cash or reinvested in additional Acquiring Fund shares. Dividends and distributions on an Acquiring Fund’s shares generally are subject to U.S. federal income tax as described herein to the extent they do not exceed the Acquiring Fund’s realized income and gains, even though such dividends and distributions economically may represent a return of a particular shareholder’s investment. Such distributions are likely to occur in respect of shares acquired at a time when the Acquiring Fund’s net asset value reflects gains that are either unrealized, or realized but not distributed. Such realized gains may be required to be distributed even when an Acquiring Fund’s net asset value also reflects unrealized losses.
If an Acquiring Fund makes a distribution in excess of its current and accumulated “earnings and profits” in any taxable year, the excess distribution will be treated as a return of capital to the extent of a shareholder’s tax basis in Acquiring Fund shares, and thereafter as capital gain. A return of capital is not taxable, but it reduces the shareholder’s tax basis in the shares, thus reducing any loss or increasing any gain on a subsequent taxable disposition of those shares.
For taxable years beginning before January 1, 2011, distributions of investment income properly designated by an Acquiring Fund as derived from “qualified dividend income” will be taxed in the hands of an individual at the rates applicable to long-term capital gain, provided holding period and other requirements are met at both the shareholder and Acquiring Fund level. In order for some portion of the dividends received by an Acquiring Fund shareholder to be qualified dividend income, an Acquiring Fund must meet holding period and other requirements with respect to some portion of the dividend paying stocks in its portfolio and the shareholder must meet holding period and other requirements with respect to the Acquiring Fund’s shares. A dividend will not be treated as qualified dividend income (at either the Acquiring Fund or shareholder level) (a) if the dividend is received with respect to any share of stock held for fewer than 61 days during the 121-day period beginning on the date which is 60 days before the date on which such share becomes ex-dividend with respect to such dividend (or, in the case of certain preferred stock, 91 days during the 181-day period beginning 90 days before such date), (b) to the extent that the recipient is under an obligation (whether pursuant to a short sale or otherwise) to make related payments with respect to positions in substantially similar or related property, (c) if the recipient elects to have the dividend income treated as investment income for purposes of the limitation on deductibility of investment interest or (d) if the dividend is received from a foreign corporation that is (i) not eligible for the benefits of a comprehensive income tax treaty with the United States (with the exception of dividends paid on stock of such a foreign corporation readily tradable on an established securities market in the United States) or (ii) treated as a passive foreign investment company.
In general, distributions of investment income designated by an Acquiring Fund as derived from qualified dividend income will be treated as qualified dividend income by a shareholder taxed as an individual provided the shareholder meets the holding period and other requirements described above with respect to the Acquiring Fund’s shares. If the aggregate qualified dividends received by a Fund during any taxable year are 95% or more of its gross income (excluding net long-term capital gain over net short-term capital loss), then 100% of the Acquiring Fund’s dividends (other than dividends properly designated as Capital Gain Dividends) will be eligible to be treated as qualified dividend income. To the extent that an Acquiring Fund makes a distribution of income received by the Acquiring Fund in lieu of dividends (a “substitute payment”) with respect to securities on loan pursuant to a securities lending transaction, such income will not constitute qualified dividend income and thus will not be eligible for taxation at the rates applicable to long-term capital gain. The Acquiring Funds expect to use such substitute payments to satisfy their expenses, and therefore expect that their receipt of substitute payments will not adversely affect the percentage of distributions qualifying as qualified dividend income.
Dividends of net investment income received by corporate shareholders of the Acquiring Fund will qualify for the 70% dividends received deduction generally available to corporations to the extent of the amount of
31
qualifying dividends received by the Acquiring Fund from domestic corporations for the taxable year. A dividend received by an Acquiring Fund will not be treated as a qualifying dividend (a) if the stock on which the dividend is paid is considered to be “debt-financed” (generally, Target with borrowed funds), (b) if it has been received with respect to any share of stock that such Acquiring Fund has held for less than 46 days (91 days in the case of certain preferred stock) during the 91-day period beginning on the date which is 45 days before the date on which such share becomes ex-dividend with respect to such dividend (during the 181-day period beginning 90 days before such date in the case of certain preferred stock) or (c) to the extent that such Acquiring Fund is under an obligation (pursuant to a short sale or otherwise) to make related payments with respect to positions in substantially similar or related property. Moreover, the dividends received deduction may be disallowed or reduced (a) if the corporate shareholder fails to satisfy the foregoing requirements with respect to its shares of the Fund or (b) by application of other Internal Revenue Code section limitations.
Foreign Taxes, Foreign Currency-Denominated Securities and Related Hedging Transactions. Dividends and interest received by an Acquiring Fund may be subject to income, withholding or other taxes imposed by foreign countries and U.S. possessions that would reduce the yield on the Acquiring Fund’s securities. Tax conventions between certain countries and the United States may reduce or eliminate these taxes. Foreign countries generally do not impose taxes on capital gains with respect to investments by foreign investors.
An Acquiring Fund’s transactions in foreign currencies, foreign currency-denominated debt securities and certain foreign currency options, futures contracts and forward contracts (and similar instruments) may give rise to ordinary income or loss to the extent such income or loss results from fluctuations in the value of the foreign currency concerned.
Investment by an Acquiring Fund in “passive foreign investment companies” could subject the Acquiring Fund to a U.S. federal income tax (including interest charges) or other charge on distributions received from the company or on proceeds from the sale of its investment in such a company, which tax cannot be eliminated by making distributions to Acquiring Fund shareholders. However, this tax can be avoided by making an election to mark such investments to market annually or to treat the passive foreign investment company as a “qualified electing fund.” These elections may accelerate the recognition of income (without the receipt of cash) and increase the amount required to be distributed by the Fund to avoid taxation. Making either of these elections therefore may require the Fund to liquidate other investments (including when it is not advantageous to do so) to meet its distribution requirement, which also may accelerate the recognition of gain and affect the Fund’s total return. Dividends paid by passive foreign investment companies will not be eligible to be treated as “qualified dividend income.”
A “passive foreign investment company” is any foreign corporation: (a) 75% or more of the gross income of which for the taxable year is passive income or (b) the average percentage of the assets of which (generally by value, but by adjusted tax basis in certain cases) produce, or are held for the production of, passive income is at least 50%. Generally, passive income for this purpose means dividends, interest (including income equivalent to interest), royalties, rents, annuities, the excess of gain over losses from certain property transactions and commodities transactions and foreign currency gains. Passive income for this purpose does not include rents and royalties received by the foreign corporation from active business and certain income received from related persons.
Selling Shares. Shareholders who sell, exchange or redeem Acquiring Fund shares will generally recognize gain or loss in an amount equal to the difference between their adjusted tax basis in the Acquiring Fund shares and the amount received. In general, any gain or loss realized upon taxable disposition of Acquiring Fund shares will be treated as long-term capital gain or loss if the shares have been held for more than 12 months, and as short-term capital gain or loss if the shares have not been held for more than 12 months. The tax rate generally applicable to net capital gains recognized by individuals and other noncorporate taxpayers is (a) the same as the maximum ordinary income tax rate for short-term capital or (b) for taxable years beginning on or before January 1, 2011, 15% for long-term capital gains (including Capital Gain Dividends) with lower rates applicable to taxpayers in the 10% and 15% tax brackets.
32
Any loss realized upon a taxable disposition of Acquiring Fund shares held for six months or less will be treated as a long-term capital loss to the extent of any long-term capital gain distributions received (or deemed received) by the shareholder with respect to those Acquiring Fund shares. For purposes of determining whether Acquiring Fund shares have been held for six months or less, the holding period is suspended for any periods during which your risk of loss is diminished as a result of holding one or more other positions in substantially similar or related property, or through certain options or short sales. In addition, any loss realized on a sale or exchange of Acquiring Fund shares will be disallowed to the extent that Acquiring Fund shareholders replace the disposed of Fund shares with other Fund shares within a period of 61 days beginning 30 days before and ending 30 days after the date of disposition, which could, for example, occur as a result of automatic dividend reinvestment. In such an event, an Acquiring Fund shareholder’s basis in the replacement Acquiring Fund shares will be adjusted to reflect the disallowed loss.
Hedging. If an Acquiring Fund engages in hedging transactions, including hedging transactions in options, futures contracts and straddles, or other similar transactions, it will be subject to special tax rules (including constructive sales, mark-to-market, straddle, wash sale and short sale rules), the effect of which may be to accelerate income to the Acquiring Fund, defer losses to the Acquiring Fund, cause adjustments in the holding periods of the Acquiring Fund’s securities, convert long-term capital gains into short-term capital gains or convert short-term capital losses into long-term capital losses. These rules could therefore affect the amount, timing and character of distributions to shareholders. Each Acquiring Fund will endeavor to make any available elections pertaining to such transactions in a manner believed to be in the best interests of the Fund.
Certain of an Acquiring Fund’s hedging activities (including its transactions, if any, in foreign currencies or foreign currency-denominated instruments) are likely to produce a difference between its book income and the sum of its taxable income and net tax-exempt income (if any). If an Acquiring Fund’s book income exceeds the sum of its taxable income and net tax-exempt income (if any), the distribution (if any) of such excess will be treated as (a) a dividend to the extent of the Acquiring Fund’s remaining earnings and profits (including earnings and profits arising from tax-exempt income), (b) thereafter as a return of capital to the extent of the recipient’s basis in the shares and (c) thereafter as gain from the sale or exchange of a capital asset. If the Acquiring Fund’s book income is less than the sum of its taxable income and net tax-exempt income (if any), the Acquiring Fund could be required to make distributions exceeding book income in order to continue to qualify as a regulated investment company that is accorded special tax treatment.
Discount Securities. An Acquiring Fund’s investment in securities issued at a discount and certain other obligations will (and investments in securities purchased at a discount may) require the Acquiring Fund to accrue and distribute income not yet received. In order to generate sufficient cash to make the requisite distributions, an Acquiring Fund may be required to sell securities in its portfolio that it otherwise would have continued to hold.
Backup Withholding. An Acquiring Fund generally is required to withhold and remit to the U.S. Treasury a percentage of the taxable dividends and other distributions paid to and proceeds of share sales, exchanges or redemptions made by any individual shareholder who fails to properly furnish the Acquiring Fund with a correct taxpayer identification number (TIN), who has under-reported dividend or interest income or who fails to certify to the Acquiring Fund that he or she is not subject to such withholding. The backup withholding tax rate is 28% for amounts paid through 2010. The backup withholding rate will be 31% for amounts paid after December 31, 2010, unless Congress enacts tax legislation providing otherwise.
Backup withholding is not an additional tax. Any amounts withheld may be credited against the shareholder’s U.S. federal income tax liability, provided the appropriate information is furnished to the Internal Revenue Service.
In order for a foreign investor to qualify for exemption from the back-up withholding tax rates under income tax treaties, the foreign investor must comply with the special certification and filing requirements. Foreign investors in an Acquiring Fund should consult their tax advisers with respect to such withholding.
33
Tax Shelter Reporting Regulations. Under Treasury regulations, if a shareholder realizes a loss on disposition of the Acquiring Fund’s shares of $2 million or more for an individual shareholder or $10 million or more for a corporate shareholder, the shareholder must file with the Internal Revenue Service a disclosure statement on Form 8886. Direct shareholders of portfolio securities are in many cases excepted from this reporting requirement, but under current guidance, shareholders of a regulated investment company are not excepted. Future guidance may extend the current exception from this reporting requirement to shareholders of most or all regulated investment companies. The fact that a loss is reportable under these regulations does not affect the legal determination of whether the taxpayer’s treatment of the loss is proper. Shareholders should consult their tax advisers to determine the applicability of these regulations in light of their individual circumstances.
Fees and Expenses of the Reorganization
All fees and expenses, including accounting expenses, legal expenses, proxy expenses, portfolio transfer taxes (if any) or other similar expenses incurred in connection with the completion of the Reorganization will be borne by Funds Management.
Existing and Pro Forma Capitalization
[Tables will be updated through March 31, 2008 for definitive filing.]
The following tables set forth, for each Reorganization, the total net assets, number of shares outstanding and net asset value per share. This information is generally referred to as the “capitalization” of a Fund. The term “pro forma capitalization” means the expected capitalization of an Acquiring Fund after it has combined with the corresponding Target Fund. An asterisk (*) designates the accounting survivor in each combination.
Life Stage – Conservative Portfolio/Moderate Balanced Fund
The following table sets forth, as of [December 31, 2007], (i) the unaudited capitalization of the Investor Class shares of the Life Stage – Conservative Portfolio and the Administrator Class shares of the Moderate Balanced Fund, and (ii) the unaudited pro forma combined capitalization of Administrator Class shares of the Moderate Balanced Fund assuming the Reorganization has taken place. The capitalizations are likely to be different on the Closing Date as a result of daily Fund share purchase, redemption, and market activity.
| | | | | | | | |
Fund | | Total Net
Assets ($) | | Shares
Outstanding | | Net Asset Value
Per Share ($) |
Life Stage – Conservative Portfolio Investor Class | | $ | 10,173,030 | | 964,638 | | $ | 10.55 |
Moderate Balanced Fund Administrator Class | | $ | 530,579,221 | | 25,888,224 | | $ | 20.50 |
Pro Forma-Moderate Balanced Fund*(1) Administrator Class | | $ | 540,752,251 | | 26,378,159 | | $ | 20.50 |
(1) | Assuming the reorganization of the Investor Class shares of the Life Stage – Conservative Portfolio into the Administrator Class shares of the Moderate Balanced Fund. |
34
Life Stage – Moderate Portfolio/Growth Balanced Fund
The following table sets forth, as of [December 31, 2007], (i) the unaudited capitalization of the Investor Class shares of the Life Stage – Moderate Portfolio and the Administrator Class shares of the Growth Balanced Fund, and (ii) the unaudited pro forma combined capitalization of Administrator Class shares of the Growth Balanced Fund assuming the Reorganization has taken place. The capitalizations are likely to be different on the Closing Date as a result of daily Fund share purchase, redemption, and market activity.
| | | | | | | | |
Fund | | Total Net
Assets ($) | | Shares
Outstanding | | Net Asset Value
Per Share ($) |
Life Stage – Moderate Portfolio Investor Class | | $ | 34,496,278 | | 3,008,575 | | $ | 11.47 |
Growth Balanced Fund Administrator Class | | $ | 1,671,378,399 | | 58,847,058 | | $ | 28.40 |
Pro Forma-Growth Balanced Fund*(1) Administrator Class | | $ | 1,705,874,677 | | 60,066,010 | | $ | 28.40 |
(1) | Assuming the reorganization of the Investor Class shares of the Life Stage – Moderate Portfolio into the Administrator Class shares of the Growth Balanced Fund. |
Life Stage – Aggressive Portfolio/Aggressive Allocation Fund
The following table sets forth, as of [December 31, 2007], (i) the unaudited capitalization of the Investor Class shares of the Life Stage – Aggressive Portfolio and the Administrator Class shares of the Aggressive Allocation Fund, and (ii) the unaudited pro forma combined capitalization of Administrator Class shares of the Aggressive Allocation Fund assuming the Reorganization has taken place. The capitalizations are likely to be different on the Closing Date as a result of daily Fund share purchase, redemption, and market activity.
| | | | | | | | |
Fund | | Total Net
Assets ($) | | Shares
Outstanding | | Net Asset Value
Per Share ($) |
Life Stage – Aggressive Portfolio Investor Class | | $ | 30,191,367 | | 2,470,043 | | $ | 12.22 |
Aggressive Allocation Fund Administrator Class | | $ | 269,140,928 | | 18,312,986 | | $ | 14.70 |
Pro Forma-Aggressive Allocation Fund*(1) Administrator Class | | $ | 299,332,295 | | 20,362,741 | | $ | 14.70 |
(1) | Assuming the reorganization of the Investor Class shares of the Life Stage – Aggressive Portfolio into the Administrator Class shares of the Aggressive Allocation Fund. |
The Board unanimously recommends that you vote in favor of the Reorganization Plan.
INFORMATION ON VOTING
This Prospectus/Proxy Statement is being provided in connection with the solicitation of proxies by the Board of Wells Fargo Advantage Funds to solicit your vote to approve the proposed Reorganization Plan at a special meeting of shareholders (“Meeting”) of the Target Funds. The Meeting will be held at 525 Market Street, 12th Floor, San Francisco, California, 94105 on June 30, 2008, at 3:00 p.m. (Pacific Time).
You may vote in one of four ways.
| | • | | Complete and sign the enclosed proxy card and mail it to us in the enclosed prepaid return envelope (if mailed in the United States). |
| | • | | Vote on the Internet according to the enclosed voting instructions. |
35
| | • | | Call the toll-free number printed on your proxy card and follow the instructions provided. |
| | • | | You also may vote in person by attending the Meeting. |
Please note that to vote via the Internet or telephone, you will need the “control number” that is printed on your proxy card.
You may revoke a proxy once it is given. If you desire to revoke a proxy, you must submit a later dated proxy or a written notice of revocation to the appropriate Target Fund. You also may give written notice of revocation in person at the Meeting. All properly executed proxies received in time for the Meeting will be voted as specified in the proxy, or, if no specification is made, FOR the proposal.
Only shareholders of record on April 18, 2008, are entitled to receive notice of, and to vote at, the Meeting or at any adjournment thereof. Each whole and fractional share of a Fund held as of the close of business on April 18, 2008, is entitled to a whole or fractional vote. For each such Fund, the presence in person or by proxy of one-third of the outstanding shares of that Fund is required to constitute a quorum. Approval of the Reorganization by any Target Fund requires the vote of a majority of the shares present at the Meeting, provided that a quorum is present.
The election inspectors will count your vote at the Meeting if cast in person or by proxy. The election inspectors will count:
| | • | | votes cast FOR approval of the proposal to determine whether sufficient affirmative votes have been cast; |
| | • | | ballots that are returned without a direction the same as votes cast FOR the proposal; and |
| | • | | abstentions and broker non-votes of shares (in addition to votes cast FOR) to determine whether a quorum is present at the Meeting. Abstentions and broker non-votes are not counted to determine whether a proposal has been approved. |
Broker non-votes are shares held in street name for which the broker indicates that instructions have not been received from the beneficial owners or other persons entitled to vote and for which the broker lacks discretionary voting authority.
The Board knows of no matters other than the proposal described in this Prospectus/Proxy Statement that will be brought before the Meeting. If, however, any other matters properly come before the Meeting, it is the Board’s intention that proxies will be voted on such matters based on the judgment of the person named in the enclosed form of proxy. In the event that a quorum is not present for the Meeting, or in the event that a quorum is present but sufficient votes to approve any proposed item are not received by a Fund, one or more adjournment(s) may be proposed to permit further solicitation of proxies. Any such adjournment(s) will require the affirmative vote of a majority of the shares that are represented at the Meeting in person or by proxy. If a quorum is present, the persons named as proxies will vote those proxies which they are entitled to vote FOR the proposal in favor of such adjournment(s), and will vote those proxies required to be voted AGAINST the proposal against any adjournment(s).
In addition to the solicitation of proxies by mail or expedited delivery service, certain officers and employees of Funds Management or an affiliate, who will not be paid for their services, the Wells Fargo Advantage Funds or a solicitor may solicit proxies by telephone, facsimile, verbal, Internet, or e-mail communication. Funds Management has engaged the proxy solicitation firm of The Altman Group, Inc. who will be paid approximately $161,120, plus out-of-pocket expenses, for its services. Funds Management will bear the expenses incident to the solicitation of proxies in connection with the Meeting, which expenses include the fees and expenses of tabulating the results of the proxy solicitation. Funds Management also will reimburse upon request persons holding shares as nominees for their reasonable expenses in sending soliciting material to their principals. The Target Funds and the Acquiring Funds will not pay any of the costs associated with the preparation of this Prospectus/Proxy Statement or the solicitation of proxies.
36
OUTSTANDING SHARES
As of April 18, 2008, each Target Fund had the following numbers of shares outstanding:
| | |
Name of Portfolio/Class | | Total Number of Shares Outstanding |
Life Stage – Conservative Portfolio | | |
Investor Class | | |
Life Stage – Moderate Portfolio | | |
Investor Class | | |
Life Stage – Aggressive Portfolio | | |
Investor Class | | |
INTEREST OF CERTAIN PERSONS IN THE TRANSACTION
The federal securities laws require that we include information about the shareholders who own 5% or more of the outstanding voting shares of each Target Fund and Acquiring Fund or class of each Target Fund and Acquiring Fund. To the knowledge of Wells Fargo Advantage Funds, the following persons are the only persons who owned of record or beneficially 5% or more of the outstanding shares of the Investor Class of the Target Funds and the Administrator Class of the Acquiring Funds as of April 18, 2008.
| | | | | | | | |
Name of Fund/Class | | Name and Address | | Type of
Ownership | | Percentage
of Class | | Percentage
of Fund |
| | | | | | | | |
| | | | | | | | |
For purposes of the 1940 Act, any person who owns directly or through one or more controlled companies more than 25% of the voting securities of a company is presumed to “control” such company. Accordingly, to the extent that a shareholder identified in the foregoing table is identified as the beneficial holder of more than 25% of a class or a Fund, or is identified as the holder of record of more than 25% of a class or Fund and has voting and/or investment power, it may be presumed to control such class or Fund.
In addition, Wells Fargo Bank, a wholly owned subsidiary of Wells Fargo & Company, holds certain shares of each Fund, in a trust, agency, custodial, fiduciary or other representative capacity with voting authority. Wells Fargo Bank intends to pass the voting authority to the plan sponsor or fiduciary, or to hire an independent fiduciary to vote these shares. Such shares, however, may be voted by the proxies for any other matter, including adjournment. [As of April 18, 2008, the Officers and Trustees of Wells Fargo Advantage Funds, as a group, owned less than 1% of the outstanding shares of the Fund.]
ANNUAL MEETING AND SHAREHOLDER MEETINGS
Wells Fargo Advantage Funds does not presently hold annual meetings of shareholders for the election of Trustees and other business unless otherwise required by the 1940 Act. Any shareholder proposal for a shareholder meeting must be presented to Wells Fargo Advantage Funds within a reasonable time before proxy materials for the next meeting are sent to shareholders. Because Wells Fargo Advantage Funds does not hold regular shareholder meetings, no anticipated date of the next meeting can be provided.
37
DISSENTERS’ RIGHTS
If the Reorganization is approved at the Meeting, shareholders will not have the right to dissent and obtain payment of the fair value of their shares because the exercise of dissenters’ rights is subject to the forward pricing requirements of Rule 22c-1 under the 1940 Act, which supercedes state law. Shareholders of the Target Funds, however, have the right to redeem their shares at net asset value subject to applicable deferred sales charges and/or redemption fees (if any) until the closing date of the Reorganization. After the Reorganization, shareholders will hold shares of the Acquiring Funds which may also be redeemed at net asset value subject to applicable deferred sales charges and/or redemption fees (if any).
38
EXHIBIT A — EXPENSE SUMMARIES OF THE TARGET FUNDS AND ACQUIRING FUNDS
The following tables are intended to help you understand the various costs and expenses you will pay as a shareholder in a Fund. The examples are intended to help you compare the costs of investing in the Funds with the cost of investing in other mutual funds. These tables do not reflect charges that may be imposed in connection with an account through which you hold Fund shares. A broker-dealer or financial institution maintaining the account through which you hold Fund shares may charge separate account, service or transaction fees on the purchase or sale of Fund shares that would be in addition to the fees and expenses shown here.
| A. | Life Stage—Conservative Portfolio /Moderate Balanced Fund |
The following comparative fee tables describe the Fund expenses you may pay, both directly and indirectly, if you hold shares of the Funds. The pro forma shareholder fees and operating expenses show the anticipated effects, if any, of the Reorganization. The Total Annual Operating Expenses tables and Examples shown below are based on actual expenses incurred during the twelve-month period ended September 30, 2007.
| | | | | | | | | |
| | | Life Stage –
Conservative
Portfolio | | | Moderate
Balanced
Fund | | | Pro Forma-
Moderate
Balanced
Fund(1) | |
| | | Investor
Class | | | Administrator
Class | | | Administrator
Class | |
Shareholder Fees (fees paid directly from your investment: | | | | | | | | | |
Maximum sales charge (load) imposed on purchases (as a percentage of the offering price) | | None | | | None | | | None | |
Maximum deferred sales charge (load) (as a percentage of the NAV at purchase) | | None | | | None | | | None | |
Annual Fund Operating Expenses (expenses that are deducted from Fund assets) | | | | | | | | | |
Management Fees | | 0.00 | % | | 0.25 | %(2) | | 0.25 | %(2) |
Distribution (12b-1) Fees | | 0.00 | % | | 0.00 | % | | 0.00 | % |
Other Expenses(3) | | 1.22 | % | | 0.43 | % | | 0.43 | % |
Acquired Fund Fees and Expenses | | 0.64 | %(4) | | 0.42 | %(5) | | 0.42 | %(5) |
Total Annual Fund Operating Expenses | | 1.86 | % | | 1.10 | % | | 1.10 | % |
Fee Waivers | | 0.61 | % | | 0.20 | % | | 0.20 | % |
Net Expenses | | 1.25 | %(6) | | 0.90 | %(7) | | 0.90 | %(7) |
| (1) | Assuming Reorganization of the Investor Class shares of the Life Stage – Conservative Portfolio into the Administrator Class shares of the Moderate Balanced Fund. |
| (2) | Reflects the fees charged by Funds Management for providing asset allocation services to the Fund in determining the portion of the Fund’s assets to be invested in each underlying master portfolio. |
| (3) | Includes expenses payable to affiliates of Wells Fargo & Company. Other expenses for the Life Stage – Conservative Portfolio have been adjusted as necessary from amounts incurred during the Fund’s twelve month period ended September 30, 2007, to reflect current fees and expenses. |
| (4) | Reflects the pro-rata portion of the net operating expenses of the Underlying Funds in which the Fund invests. Shareholders indirectly bear these underlying expenses because the NAV and/or distributions paid reflect such underlying expenses. Several factors may affect the Acquired Fund Fees and Expenses, including the following: 1) changes in the Underlying Funds’ expense ratios, 2) changes in the Underlying Funds, and 3) changes in the target allocations of the Underlying Funds. |
| (5) | Reflects the pro-rata portion of the net operating expenses of the underlying master portfolios in which the Fund invests. Shareholders indirectly bear these underlying expenses because the NAV and/or distributions paid reflect such underlying expenses. |
| (6) | Funds Management has committed through June 30, 2008, to waive fees and/or reimburse expenses to the extent necessary to maintain the Fund’s net annual operating expense ratio, including underlying fund expenses, as shown. After this date, the net operating expense ratio may be increased only with approval of the Board of Trustees. |
| (7) | Funds Management has committed through January 31, 2009, to waive fees and/or reimburse expenses to the extent necessary to maintain the Fund’s net annual operating expense ratio, including the underlying master portfolios’ fees and expenses, as shown. After this date, the net operating expense ratio may be increased only with approval of the Board of Trustees. |
A-1
Example
This example is intended to help you compare the cost of investing in the Funds with the cost of investing in other mutual funds and includes expenses allocated from the master portfolios/Underlying Funds in which the Funds invest. The example assumes that you invest $10,000 in the Fund, reinvest all distributions for the time periods indicated, and then either redeem or do not redeem all of your shares at the end of those periods. The example also assumes that your investment has a 5% return each year and that each Fund’s Total Annual Operating Expenses remain the same. The fee waivers shown in the Annual Fund Operating Expenses are only reflected in the first year of each of the following time periods. Although your actual costs may be higher or lower, based on these assumptions, your costs would be:
| | | | | | | | | |
| | | Life Stage –
Conservative
Portfolio | | Moderate
Balanced
Fund | | Pro Forma-
Moderate
Balanced
Fund(1) |
| | | Investor
Class | | Administrator
Class | | Administrator
Class |
One Year | | $ | 127 | | $ | 92 | | $ | 92 |
Three Years | | $ | 526 | | $ | 330 | | $ | 330 |
Five Years | | $ | 949 | | $ | 587 | | $ | 587 |
Ten Years | | $ | 2,130 | | $ | 1,322 | | $ | 1,322 |
| (1) | Assuming Reorganization of the Investor Class shares of the Life Stage – Conservative Portfolio into the Administrator Class shares of the Moderate Balanced Fund. |
The example above should not be considered a representation of future expenses. Actual expenses may be greater or less than those shown.
| B. | Life Stage – Moderate Portfolio/Growth Balanced Fund |
The following comparative fee tables describe the Fund expenses you may pay, both directly and indirectly, if you hold shares of the Funds. The pro forma shareholder fees and operating expenses show the anticipated effects, if any, of the Reorganization. The Total Annual Operating Expenses tables and Examples shown below are based on actual expenses incurred during the twelve-month period ended September 30, 2007.
| | | | | | | | | |
| | | Life Stage –
Moderate
Portfolio | | | Growth
Balanced
Fund | | | Pro Forma-
Growth
Balanced
Fund(1) | |
| | | Investor
Class | | | Administrator
Class | | | Administrator
Class | |
Shareholder Fees (fees paid directly from your investment): | | | | | | | | | |
Maximum sales charge (load) imposed on purchases (as a percentage of the offering price) | | None | | | None | | | None | |
Maximum deferred sales charge (load) (as a percentage of the NAV at purchase) | | None | | | None | | | None | |
Annual Fund Operating Expenses (expenses that are deducted from Fund assets) | | | | | | | | | |
Management Fees | | 0.00 | % | | 0.25 | %(2) | | 0.25 | %(2) |
Distribution (12b-1) Fees | | 0.00 | % | | 0.00 | % | | 0.00 | % |
Other Expenses(3) | | 0.95 | % | | 0.41 | % | | 0.41 | % |
Acquired Fund Fees and Expenses | | 0.74 | %(4) | | 0.47 | %(5) | | 0.47 | %(5) |
Total Annual Fund Operating Expenses | | 1.69 | % | | 1.13 | % | | 1.13 | % |
Fee Waivers | | 0.34 | % | | 0.18 | % | | 0.18 | % |
Net Expenses | | 1.35 | %(6) | | 0.95 | %(7) | | 0.95 | %(7) |
A-2
| (1) | Assuming Reorganization of the Investor Class shares of the Life Stage – Moderate Portfolio into the Administrator Class shares of the Growth Balanced Fund. |
| (2) | Reflects the fees charged by Funds Management for providing asset allocation services to the Fund in determining the portion of the Fund’s assets to be invested in each underlying master portfolio. |
| (3) | Includes expenses payable to affiliates of Wells Fargo & Company. Other expenses for the Life Stage – Moderate Portfolio have been adjusted as necessary from amounts incurred during the Fund’s twelve month period ended September 30, 2007, to reflect current fees and expenses. |
| (4) | Reflects the pro-rata portion of the net operating expenses of the Underlying Funds in which the Fund invests. Shareholders indirectly bear these underlying expenses because the NAV and/or distributions paid reflect such underlying expenses. Several factors may affect the Acquired Fund Fees and Expenses, including the following: 1) changes in the Underlying Funds’ expense ratios, 2) changes in the Underlying Funds, and 3) changes in the target allocations of the Underlying Funds. |
| (5) | Reflects the pro-rata portion of the net operating expenses of the underlying master portfolios in which the Fund invests. Shareholders indirectly bear these underlying expenses because the NAV and/or distributions paid reflect such underlying expenses. |
| (6) | Funds Management has committed through June 30, 2008, to waive fees and/or reimburse expenses to the extent necessary to maintain the Fund’s net annual operating expense ratio, including underlying fund expenses, as shown. After this time, the net operating expense ratio may be increased only with approval of the Board of Trustees. |
| (7) | Funds Management has committed through January 31, 2009, to waive fees and/or reimburse expenses to the extent necessary to maintain the Fund’s net annual operating expense ratio, including the underlying master portfolios’ fees and expenses, as shown. After this date, the net operating expense ratio may be increased only with approval of the Board of Trustees. |
Example
This example is intended to help you compare the cost of investing in the Funds with the cost of investing in other mutual funds and includes expenses allocated from the master portfolios/Underlying Funds in which the Funds invest. The example assumes that you invest $10,000 in the Fund, reinvest all distributions for the time periods indicated, and then either redeem or do not redeem all of your shares at the end of those periods. The example also assumes that your investment has a 5% return each year and that each Fund’s Total Annual Operating Expenses remain the same. The fee waivers shown in the Annual Fund Operating Expenses are only reflected in the first year of each of the following time periods. Although your actual costs may be higher or lower, based on these assumptions, your costs would be:
| | | | | | | | | |
| | | Life Stage –
Moderate
Portfolio | | Growth
Balanced
Fund | | Pro Forma-
Growth
Balanced
Fund(1) |
| | | Investor
Class | | Administrator
Class | | Administrator
Class |
One Year | | $ | 137 | | $ | 97 | | $ | 97 |
Three Years | | $ | 499 | | $ | 341 | | $ | 341 |
Five Years | | $ | 886 | | $ | 605 | | $ | 605 |
Ten Years | | $ | 1,969 | | $ | 1,359 | | $ | 1,359 |
| (1) | Assuming Reorganization of the Investor Class shares of the Life Stage – Moderate Portfolio into the Administrator Class shares of the Growth Balanced Fund. |
The example above should not be considered a representation of future expenses. Actual expenses may be greater or less than those shown.
A-3
| C. | Life Stage Aggressive Portfolio/Aggressive Allocation Fund |
The following comparative fee tables describe the Fund expenses you may pay, both directly and indirectly, if you hold shares of the Funds. The pro forma shareholder fees and operating expenses show the anticipated effects, if any, of the Reorganization. The Total Annual Operating Expenses tables and Examples shown below are based on actual expenses incurred during the twelve-month period ended September 30, 2007.
| | | | | | | | | |
| | | Life Stage –
Aggressive
Portfolio | | | Aggressive
Allocation
Fund | | | Pro Forma-
Aggressive
Allocation
Fund(1) | |
| | | Investor
Class | | | Administrator
Class | | | Administrator
Class | |
Shareholder Fees (fees paid directly from your investment): | | | | | | | | | |
Maximum sales charge (load) imposed on purchases (as a percentage of the offering price) | | None | | | None | | | None | |
Maximum deferred sales charge (load) (as a percentage of the NAV at purchase) | | None | | | None | | | None | |
Annual Fund Operating Expenses (expenses that are deducted from Fund assets) | | | | | | | | | |
Management Fees | | 0.00 | % | | 0.25 | %(2) | | 0.25 | %(2) |
Distribution (12b-1) Fees | | 0.00 | % | | 0.00 | % | | 0.00 | % |
Other Expenses(3) | | 0.89 | % | | 0.44 | % | | 0.44 | % |
Acquired Fund Fees and Expenses | | 0.84 | %(4) | | 0.51 | %(5) | | 0.51 | %(5) |
Total Annual Fund Operating Expenses | | 1.73 | % | | 1.20 | % | | 1.20 | % |
Fee Waivers | | 0.28 | % | | 0.20 | % | | 0.20 | % |
Net Expenses | | 1.45 | %(6) | | 1.00 | %(7) | | 1.00 | %(7) |
| (1) | Assuming Reorganization of the Investor Class shares of the Life Stage – Aggressive Portfolio into the Administrator Class shares of the Aggressive Allocation Fund. |
| (2) | Reflects the fees charged by Funds Management for providing asset allocation services to the Fund in determining the portion of the Fund’s assets to be invested in each underlying master portfolio. |
| (3) | Includes expenses payable to affiliates of Wells Fargo & Company. Other expenses for the Life Stage – Aggressive Portfolio have been adjusted as necessary from amounts incurred during the Fund’s twelve month period ended September 30, 2007, to reflect current fees and expenses. |
| (4) | Adjusted to reflect current acquired fund fees and expenses for the Fund’s twelve month period ended September 30, 2007. Reflects the pro-rata portion of the net operating expenses of the Underlying Funds in which the Fund invests. Shareholders indirectly bear these underlying expenses because the NAV and/or distributions paid reflect such underlying expenses. Several factors may affect the Acquired Fund Fees and Expenses, including the following: 1) changes in the Underlying Funds’ expense ratios, 2) changes in the Underlying Funds, and 3) changes in the target allocations of the Underlying Funds. |
| (5) | Reflects the pro-rata portion of the net operating expenses of the underlying master portfolios in which the Fund invests. Shareholders indirectly bear these underlying expenses because the NAV and/or distributions paid reflect such underlying expenses. |
| (6) | Funds Management has committed through June 30, 2008, to waive fees and/or reimburse expenses to the extent necessary to maintain the Fund’s net annual operating expense ratio, including underlying fund fees and expenses, as shown. After this time, the net operating expense ratio may be increased only with approval of the Board of Trustees. |
| (7) | Funds Management has committed through January 31, 2009, to waive fees and/or reimburse expenses to the extent necessary to maintain the Fund’s net annual operating expense ratio, including the underlying master portfolios’ fees and expenses, as shown. After this date, the net operating expense ratio may be increased only with approval of the Board of Trustees. |
Example
This example is intended to help you compare the cost of investing in the Funds with the cost of investing in other mutual funds and includes expenses allocated from the master portfolios/Underlying Funds in which the Funds invest. The example assumes that you invest $10,000 in the Fund, reinvest all distributions for the time periods indicated, and then either redeem or do not redeem all of your shares at the end of those periods. The example also assumes that your investment has a 5% return each year and that each Fund’s Total Annual
A-4
Operating Expenses remain the same. The fee waivers shown in the Annual Fund Operating Expenses are only reflected in the first year of each of the following time periods. Although your actual costs may be higher or lower, based on these assumptions, your costs would be:
| | | | | | | | | |
| | | Life Stage –
Aggressive
Portfolio | | Aggressive
Allocation
Fund | | Pro Forma-
Aggressive
Allocation
Fund(1) |
| | | Investor
Class | | Administrator
Class | | Administrator
Class |
One Year | | $ | 148 | | $ | 102 | | $ | 102 |
Three Years | | $ | 518 | | $ | 361 | | $ | 361 |
Five Years | | $ | 912 | | $ | 640 | | $ | 640 |
Ten Years | | $ | 2,018 | | $ | 1,437 | | $ | 1,437 |
| (1) | Assuming Reorganization of the Investor Class shares of the Life Stage – Aggressive Portfolio into the Administrator Class shares of the Aggressive Allocation Fund. |
A-5
EXHIBIT B—COMPARISON OF INVESTMENT OBJECTIVES, PRINCIPAL INVESTMENTS AND PRINCIPAL INVESTMENT STRATEGIES, SUB-ADVISERS AND PORTFOLIO MANAGERS OF THE TARGET FUNDS AND ACQUIRING FUNDS
| | | | |
| | | Life Stage–Conservative (Target Fund) | | Moderate Balanced (Acquiring fund) |
| Investment Objective | | Seeks total return, consisting of current income and capital appreciation. | | Seeks total return, consisting of current income and capital appreciation. |
| | |
| Principal Investments | | Under normal circumstances, the Fund invests: • 60% of total assets in bond funds; and • 40% of total assets in stock funds. The percentage of the Fund’s assets invested in stock or bond funds may temporarily deviate from the percentages indicated above due to changes in market values. The adviser rebalances the Fund when the Fund’s assets deviate by a specified percentage from these percentages primarily through the use of daily cash flows. | | The Fund’s “neutral” target allocation is as follows: • 60% of the Fund’s total assets in fixed income securities; and • 40% of the Fund’s total assets in equity securities. |
| | |
| Principal Investment Strategies | | The Fund seeks to achieve its investment objective by allocating 60% of its total assets to affiliated bond funds and 40% of its total assets to affiliated stock funds (the “Underlying Funds”). Stock funds offer greater long-term capital appreciation potential, while bond funds help to moderate portfolio risk and provide income. By investing in several Underlying Funds, the Fund achieves greater diversification. Stock fund holdings are diversified across market capitalization (large- and mid-size companies) and investment styles (“growth” and “value”), in both domestic and foreign markets. Bond fund holdings are also diversified across a range of short- to intermediate-term income-producing securities, which may include, but are not limited to, U.S. Government obligations and corporate debt securities. | | The Fund is a gateway fund that uses a “multi-style” investment approach designed to reduce the price and return volatility of the Fund and to provide more consistent returns. “Style” means either an approach to selecting investments, or a type of investment that is selected for a portfolio. Currently, the Fund’s portfolio combines the different equity and fixed income investment styles of several master portfolios. The Fund may invest in additional or fewer master portfolios, in other Wells Fargo Advantage Funds, or directly in a portfolio of securities. The fixed income portion of the Fund’s portfolio uses different fixed income investment styles. The blending of multiple fixed income investment styles is intended to reduce the price and return volatility of, and provide more consistent returns within, the fixed income portion of the Fund’s portfolio. The equity portion of the Fund’s portfolio uses different equity investment styles. The blending of multiple equity investment styles is intended to reduce the risk associated with the use of a single style, which may move in and out of favor during the course of a market cycle. |
B-1
| | | | |
| | | Life Stage–Conservative (Target Fund) | | Moderate Balanced (Acquiring fund) |
| | | | |
| | | | The Fund attempts to enhance its returns by using an asset allocation model that employs various analytical techniques, including quantitative techniques, valuation formulas and optimization procedures, to assess the relative attractiveness of equity and fixed income investments and to recommend changes in its target allocations. The Fund uses futures contracts to implement target allocation changes determined by the model, rather than physically reallocating assets among investment styles. The Fund also may use futures, options or swap agreements, as well as other derivatives, to manage risk or to enhance return. The Fund considers its absolute level of risk, as well as its risk relative to its benchmark in determining the allocation between the different investment styles. The Fund may make changes to the target allocations at any time in response to market and other conditions. The percentage of Fund assets that it invests in each master portfolio may temporarily deviate from the target allocations due to changes in market value. The Fund may use cash flows or effect transactions to re-establish the target allocations. |
| | |
| Adviser/Sub-Adviser | | Wells Fargo Funds Management, LLC | | Wells Capital Management Incorporated Wells Fargo Funds Management, LLC |
| | |
| Portfolio Managers | | Thomas C. Biwer, CFA Christian L. Chan, CFA Andrew Owen, CFA | | Doug Beath Thomas C. Biwer, CFA Galen G. Blomster, CFA Christian L. Chan, CFA Jeffrey P. Mellas Andrew Owen, CFA |
B-2
| | | | |
| | | Life Stage–Moderate
(Target Fund) | | Growth Balanced
(Acquiring fund) |
| Investment Objective | | Seeks total return, consisting of capital appreciation and current income. | | Seeks total return, consisting of capital appreciation and current income. |
| | |
| Principal Investments | | Under normal circumstances, the Fund invests: • 60% of total assets in stock funds; and • 40% of total assets in bond funds. The percentage of the Fund’s assets invested in stock or bond funds may temporarily deviate from the percentages indicated above due to changes in market values. The adviser rebalances the Fund when the Fund’s assets deviate by a specified percentage from these percentages primarily through the use of daily cash flows. | | The Fund’s “neutral” target allocation is as follows: • 65% of the Fund’s total assets in equity securities; and • 35% of the Fund’s total assets in fixed income securities. |
| | |
| Principal Investment Strategies | | The Fund seeks to achieve its investment objective by allocating 60% of its total assets to affiliated stock funds and 40% of its total assets to affiliated bond funds (the “Underlying Funds”). Stock funds offer greater long-term capital appreciation potential, while bond funds help to moderate portfolio risk and provide income. By investing in several Underlying Funds, the Fund achieves greater diversification. Stock fund holdings are diversified across market capitalization (large- and mid-size companies) and investment styles (“growth” and “value”), in both domestic and foreign markets. Bond fund holdings are also diversified across a range of short- to intermediate-term income-producing securities, which may include, but are not limited to, U.S. Government obligations and corporate debt securities. | | The Fund is a gateway fund that uses a “multi-style” investment approach designed to reduce the price and return volatility of the Fund and to provide more consistent returns. “Style” means either an approach to selecting investments, or a type of investment that is selected for a portfolio. Currently, the Fund’s portfolio combines the different equity and fixed income investment styles of several master portfolios. The Fund may invest in additional or fewer master portfolios, in other Wells Fargo Advantage Funds, or directly in a portfolio of securities. The equity portion of the Fund’s portfolio uses different equity investment styles. The blending of multiple equity investment styles is intended to reduce the risk associated with the use of a single style, which may move in and out of favor during the course of a market cycle. The fixed income portion of the Fund’s portfolio also uses different fixed income investment styles. The blending of multiple fixed income investment styles is intended to reduce the price and return volatility of, and provide more consistent returns within, the fixed income portion of the Fund’s portfolio. |
B-3
| | | | |
| | | Life Stage–Moderate
(Target Fund) | | Growth Balanced
(Acquiring fund) |
| | | | The Fund attempts to enhance its returns by using an asset allocation model that employs various analytical techniques, including quantitative techniques, valuation formulas and optimization procedures, to assess the relative attractiveness of equity and fixed income investments and to recommend changes in its target allocations. The Fund uses futures contracts to implement target allocation changes determined by the model, rather than physically reallocating assets among investment styles. The Fund also may use futures, options or swap agreements, as well as other derivatives, to manage risk or to enhance return. The Fund considers its absolute level of risk, as well as its risk relative to its benchmark in determining the allocation between the different investment styles. The Fund may make changes to the target allocations at any time in response to market and other conditions. The percentage of Fund assets that it invests in each master portfolio may temporarily deviate from the target allocations due to changes in market value. The Fund may use cash flows or effect transactions to re-establish the target allocations. |
| | |
| Adviser/Sub-Adviser | | Wells Fargo Funds Management, LLC | | Wells Capital Management Incorporated Wells Fargo Funds Management, LLC |
| | |
| Portfolio Managers | | Thomas C. Biwer, CFA Christian L. Chan, CFA Andrew Owen, CFA | | Doug Beath Thomas C. Biwer, CFA Galen G. Blomster, CFA Christian L. Chan, CFA Jeffrey P. Mellas Andrew Owen, CFA |
B-4
| | | | |
| | | Life Stage–Aggressive
(Target Fund) | | Aggressive Allocation
(Acquiring fund) |
| Investment Objective | | Seeks total return, consisting primarily of capital appreciation with a secondary emphasis on current income. | | Seeks total return, consisting primarily of capital appreciation. |
| | |
| Principal Investments | | Under normal circumstances, the Fund invests: • 80% of total assets in stock funds; and • 20% of total assets in bond funds. The percentage of the Fund’s assets invested in stock or bond funds may temporarily deviate from the percentages indicated above due to changes in market values. The adviser rebalances the Fund when the Fund’s assets deviate by a specified percentage from these percentages primarily through the use of daily cash flows. | | The Fund’s “neutral” target allocation is as follows: • 80% of the Fund’s total assets in equity securities; and • 20% of the Fund’s total assets in fixed income securities. |
| | |
| Principal Investment Strategies | | The Fund seeks to achieve its investment objective by allocating 80% of its total assets to affiliated stock funds and 20% of its total assets to affiliated bond funds (the “Underlying Funds”). Stock funds offer greater long-term capital appreciation potential, while bond funds help to moderate portfolio risk and provide income. By investing in several Underlying Funds, the Fund achieves greater diversification. Stock fund holdings are diversified across market capitalization (large- and mid-size companies) and investment styles (“growth” and “value”), in both domestic and foreign markets. Bond fund holdings are also diversified across a range of short- to intermediate-term income-producing securities, which may include, but are not limited to, U.S. Government obligations and corporate debt securities. | | The Fund is a gateway fund that uses a “multi-style” investment approach designed to reduce the price and return volatility of the Fund and to provide more consistent returns. “Style” means either an approach to selecting investments, or a type of investment that is selected for a portfolio. Currently, the Fund’s portfolio combines the different equity and fixed income investment styles of several master portfolios. The Fund may invest in additional or fewer master portfolios, in other Wells Fargo Advantage Funds, or directly in a portfolio of securities. The equity portion of the Fund’s portfolio uses different equity investment styles. The blending of multiple equity investment styles is intended to reduce the risk associated with the use of a single style, which may move in and out of favor during the course of a market cycle. The fixed income portion of the Fund’s portfolio uses different fixed income investment styles. The blending of multiple fixed income investment styles is intended to reduce the price and return volatility of, and provide more consistent returns within, the fixed income portion of the Fund. |
B-5
| | | | |
| | | Life Stage–Aggressive
(Target Fund) | | Aggressive Allocation
(Acquiring fund) |
| | | | The Fund attempts to enhance its returns by using an asset allocation model that employs various analytical techniques, including quantitative techniques, valuation formulas and optimization procedures, to assess the relative attractiveness of equity and fixed income investments and to recommend changes in its target allocations. The Fund uses futures contracts to implement target allocation changes determined by the model, rather than physically reallocating assets among investment styles. The Fund also may use futures, options or swap agreements, as well as other derivatives, to manage risk or to enhance return. The Fund considers its absolute level of risk, as well as its risk relative to its benchmark in determining the allocation between the different investment styles. The Fund may make changes to the target allocations at any time in response to market and other conditions. The percentage of Fund assets that it invests in each master portfolio may temporarily deviate from the target allocations due to changes in market value. The Fund may use cash flows or effect transactions to re-establish the target allocations. |
| | |
| Adviser/Sub-Adviser | | Wells Fargo Funds Management, LLC | | Wells Capital Management Incorporated Wells Fargo Funds Management, LLC |
| | |
| Portfolio Managers | | Thomas C. Biwer, CFA Christian L. Chan, CFA Andrew Owen, CFA | | Doug Beath Thomas C. Biwer, CFA Galen G. Blomster, CFA Christian L. Chan, CFA Jeffrey P. Mellas Andrew Owen, CFA |
B-6
EXHIBIT C — COMPARISON OF RISKS
The following tables identify which principal risks are applicable to each Target Fund and Acquiring Fund (in bold print). A detailed definition of each of these risks can be found under the section, “Common and Specific Risk Considerations” in the Prospectus/Proxy Statement.
| | | | | | | | | | | | | | | | | | |
| | | Life Stage –
Conservative
Portfolio | | Moderate
Balanced | | Life Stage –
Moderate
Portfolio | | Growth
Balanced | | Life Stage –
Aggressive
Portfolio | | Aggressive
Allocation |
| Counter-Party Risk | | • | | | • | | | • | | | • | | | • | | | • | |
| | | | | | |
| Debt Securities Risk | | • | | | • | | | • | | | • | | | • | | | • | |
| | | | | | |
| Derivatives Risk | | • | | | • | | | • | | | • | | | • | | | • | |
| | | | | | |
| Emerging Markets Risk | | | | | • | | | | | | • | | | | | | • | |
| | | | | | |
| Foreign Investment Risk | | • | | | • | | | • | | | • | | | • | | | • | |
| | | | | | |
| Growth Style Investment Risk | | • | | | • | | | • | | | • | | | • | | | • | |
| | | | | | |
| High Yield Securities Risk | | • | | | | | | • | | | | | | • | | | | |
| | | | | | |
| Issuer Risk | | • | | | • | | | • | | | • | | | • | | | • | |
| | | | | | |
| Leverage Risk | | • | | | • | | | • | | | • | | | • | | | • | |
| | | | | | |
| Liquidity Risk | | • | | | • | | | • | | | • | | | • | | | • | |
| | | | | | |
| Management Risk | | • | | | • | | | • | | | • | | | • | | | • | |
| | | | | | |
| Market Risk | | • | | | • | | | • | | | • | | | • | | | • | |
| | | | | | |
Mortgage- and Asset-Backed
Securities Risk | | • | | | • | | | • | | | • | | | • | | | • | |
| | | | | | |
| Multi-Style Management Risk | | • | | | • | | | • | | | • | | | • | | | • | |
| | | | | | |
| Regulatory Risk | | • | | | • | | | • | | | • | | | • | | | • | |
| | | | | | |
| Smaller Company Securities Risk | | • | | | | | | • | | | • | | | • | | | • | |
| | | | | | |
| Underlying Funds Risk | | • | | | • | | | • | | | • | | | • | | | • | |
| | | | | | |
| U.S. Government Obligations Risk | | • | | | • | | | • | | | • | | | • | | | • | |
| | | | | | |
| Value Style Investment Risk | | • | | | • | | | • | | | • | | | • | | | • | |
C-1
EX HIBIT D — PORTFOLIO MANAGERS
Doug Beath
Growth Balanced Fund
Moderate Balanced Fund
Aggressive Allocation Fund
Mr. Beath is jointly responsible for managing the Growth Balanced Fund, the Moderate Balanced Fund, and the Aggressive Allocation Fund, all of which he has managed since 2006. Mr. Beath joined Wells Capital Management in July 2006 as a portfolio manager with the Quantitative Asset Management Team. From 2005 to 2006, Mr. Beath was a senior vice president for SMH Research where he represented several independent investment research firms. Prior to that, from 2000 to 2005, Mr. Beath was senior vice president of research with H.C. Wainwright Economics where he provided consultation services to investment management firms and plan sponsors on macroeconomic issues and asset allocation. Education: B.A., Liberal Arts, University of Michigan; M.B.A., Fordham University.
Thomas C. Biwer, CFA
Growth Balanced Fund
Moderate Balanced Fund
Aggressive Allocation Fund
Life Stage — Conservative Portfolio
Life Stage — Moderate Portfolio
Life Stage — Aggressive Portfolio
Mr. Biwer is jointly responsible for managing the Growth Balanced Fund, the Moderate Balanced Fund and the Aggressive Allocation Fund, all of which he has managed since 2005. He participates in determining the asset allocations of the Funds’ investments in various master portfolios. Mr. Biwer is jointly responsible for managing each Life Stage Portfolio, all of which he has managed since 2005. He participates in determining the asset allocations of the Portfolios’ investments in various Underlying Funds or styles. Mr. Biwer joined Funds Management in 2005 as a portfolio manager and a member of the Asset Allocation Team. Prior to joining Funds Management, Mr. Biwer served as an investment manager and portfolio strategist for the Strong Advisor service since 1999. Education: B.S. and M.B.A., University of Illinois.
Galen G. Blomster, CFA
Growth Balanced Fund
Moderate Balanced Fund
Aggressive Allocation Fund
Mr. Blomster is jointly responsible for managing the Growth Balanced Fund and the Moderate Balanced Fund, both of which he has managed since 1989, and is jointly responsible for managing the Aggressive Allocation Fund, which he has managed since 1997. He joined Wells Capital Management as Vice President and Director of Research from Norwest Investment Management, where he served as a Portfolio Manager until the two firms combined investment advisory services under the Wells Capital Management name in 1999. He briefly retired from Wells Capital Management in April 2007, and rejoined the firm in October 2007 as a Principal and Senior Advisor serving in an advisory capacity on the Quantitative Strategies Team. In this role, Mr. Blomster focuses primarily on research and the maintenance and development of the team’s quantitative models. Education: B.S., Dairy/Food Science and Economics, University of Minnesota; M.S. and Ph.D., Purdue University.
D-1
Christian L. Chan, CFA
Growth Balanced Fund
Moderate Balanced Fund
Aggressive Allocation Fund
Life Stage — Conservative Portfolio
Life Stage — Moderate Portfolio
Life Stage — Aggressive Portfolio
Mr. Chan is jointly responsible for managing the Growth Balanced Fund, the Moderate Balanced Fund and the Aggressive Allocation Fund, all of which he has managed since 2005. He participates in determining the asset allocations of the Funds’ investments in various master portfolios. Mr. Chan is jointly responsible for managing each Life Stage Portfolio, all of which he has managed since 2005. He participates in determining the asset allocations of the Portfolios’ investments in various Underlying Funds or styles. Mr. Chan joined Funds Management in 2002 as a member of the Asset Allocation Team and Investment Team. Prior to joining Funds Management, Mr. Chan served as a director in the Investments Department at mPower Advisors, LLC from 1999 to 2001. Education: B.A., American Studies, University of California at Los Angeles.
Jeffrey P. Mellas
Growth Balanced Fund
Moderate Balanced Fund
Aggressive Allocation Fund
Mr. Mellas is jointly responsible for managing the Growth Balanced Fund, the Moderate Balanced Fund, and the Aggressive Allocation Fund, all of which he has managed since 2003. Mr. Mellas joined Wells Capital Management in 2003 as Managing Director of Quantitative Asset Management and Portfolio Manager. In this role, Mr. Mellas oversees quantitative investment management efforts on behalf of institutional separate accounts, mutual investment funds and collective investment funds. Prior to joining Wells Capital Management, Mr. Mellas was with Alliance Capital Management since 1995, as Vice President and Global Portfolio Strategist. Education: B.A., Economics, University of Minnesota; M.B.A., Finance and International Business, New York University. Additional studies: International Management Program at Hâute Etudes Commerçiales, Paris, France, and Université de Valery, Montpellier, France.
Andrew Owen, CFA
Growth Balanced Fund
Moderate Balanced Fund
Aggressive Allocation Fund
Life Stage — Conservative Portfolio
Life Stage — Moderate Portfolio
Life Stage — Aggressive Portfolio
Mr. Owen is jointly responsible for managing the Growth Balanced Fund, the Moderate Balanced Fund and the Aggressive Allocation Fund, all of which he has managed since 2005. He participates in determining the asset allocations of the Funds’ investments in various master portfolios. Mr. Owen is jointly responsible for managing each Life Stage Portfolio, all of which he has managed since 2005. He participates in determining the asset allocations of the Portfolios’ investments in various Underlying Funds or styles. Mr. Owen joined Funds Management in 1996 as a member of the Asset Allocation Team and head of the Investments Team. Education: B.A., University of Pennsylvania; M.B.A., University of Michigan.
D-2
EXHIBIT E – PERFORMANCE/FINANCIAL HIGHLIGHTS OF TARGET AND ACQUIRING FUNDS
Aggressive Allocation Fund
Performance
The following information shows you how the Fund has performed and illustrates the variability of the Fund’s returns over time. The Fund’s average annual total returns are compared to the performance of an appropriate broad-based index. Please remember that past performance before and after taxes is no guarantee of future results.
Calendar Year Total Returns for the Administrator Class1
as of 12/31 each year
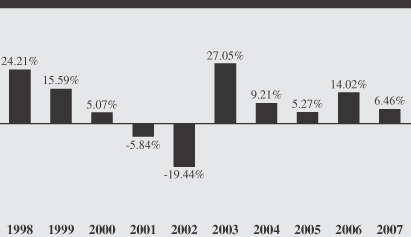
Best and Worst Quarter
| | | | |
Best Quarter: | | Q4 1998 | | 20.01% |
Worst Quarter: | | Q3 2002 | | -18.70% |
Average Annual Total Returns
for the period ended December 31, 2007
| | | | | | |
| | | 1 year | | 5 years | | 10 years |
Administrator Class1 | | | | | | |
Returns Before Taxes | | 6.46% | | 12.13% | | 7.33% |
Returns After Taxes on Distributions2 | | 4.07% | | 10.93% | | 6.42% |
Returns After Taxes on Distributions and Sale of Fund Shares2 | | 5.53% | | 10.11% | | 6.01% |
S&P 500 Index3 | | 5.49% | | 12.82% | | 5.91% |
(reflects no deduction for expenses or taxes) | | | | | | |
Lehman Brothers U.S. Aggregate Bond Index4 | | 6.97% | | 4.42% | | 5.97% |
(reflects no deduction for expenses or taxes) | | | | | | |
Aggressive Allocation Composite Index5 | | 6.00% | | 12.72% | | 6.69% |
(reflects no deduction for expenses or taxes) | | | | | | |
| 1. | Administrator Class shares incepted on December 2, 1997. Prior to April 11, 2005, the Wells Fargo Advantage Aggressive Allocation Fund—Administrator Class was named the Wells Fargo Strategic Growth Allocation Fund—Institutional Class. |
| 2. | After-tax returns are calculated using the historical highest individual federal marginal income tax rates and do not reflect the impact of state, local or foreign taxes. Actual after-tax returns depend on an investor’s tax situation and may differ from those shown, and after-tax returns shown are not relevant to tax-exempt investors or investors who hold their Fund shares through tax-deferred arrangements, such as 401(k) Plans or Individual Retirement Accounts. |
| 3. | The S&P 500 Index consists of 500 stocks chosen for market size, liquidity, and industry group representation. It is a market value-weighted index with each stock’s weight in the Index proportionate to its market value. You cannot invest directly in an index. |
| 4. | The Lehman Brothers U.S. Aggregate Bond Index is composed of the Lehman Brothers U.S Government/Credit Index and the Lehman Brothers U.S. Mortgage-Backed Securities Index, and includes Treasury issues, agency issues, corporate bond issues, and mortgage-backed securities. You cannot invest directly in an index. |
5. | The Aggressive Allocation Composite Index is weighted 20% in the Lehman Brothers US Aggregate Bond Index, 20% in the Russell 1000 ® Value Index, 20% in the S&P 500 Index, 20% in the Russell 1000 ® Growth Index, 12% in the MSCI EAFE Index, and 8% in the Russell 2000 ® Index. You cannot invest directly in an index. |
E-1
Financial Highlights
The following tables are intended to help you understand the Funds’ financial performance for the past 5 years. Certain information reflects financial results for a single Fund share. Total returns represent the rate you would have earned (or lost) on an investment in the Fund (assuming reinvestment of all distributions). All performance information, along with the report of independent registered public accounting firm and the Funds’ financial statements, is also contained in the Funds’ annual report, a copy of which is available upon request.
Aggressive Allocation Fund
Administrator Class Shares—Commenced on December 2, 1997
For a share outstanding throughout each period
| | | | | | | | | | | | | | | | | | | | |
For the period ended: | | Sept. 30,
2007 | | | Sept. 30,
2006 | | | Sept. 30,
2005 | | | Sept. 30,
2004 | | | Sept. 30,
2003 | |
Net asset value, beginning of period | | $ | 15.32 | | | $ | 14.57 | | | $ | 13.09 | | | $ | 11.85 | | | $ | 9.91 | |
Income from investment operations: | | | | | | | | | | | | | | | | | | | | |
Net investment income (loss) | | | 0.23 | | | | 0.22 | | | | 0.19 | | | | 0.14 | | | | 0.10 | |
Net realized and unrealized gain (loss) on investments | | | 2.39 | | | | 1.08 | | | | 1.45 | | | | 1.26 | | | | 2.00 | |
Total from investment operations | | | 2.62 | | | | 1.30 | | | | 1.64 | | | | 1.40 | | | | 2.10 | |
Less distributions: | | | | | | | | | | | | | | | | | | | | |
Distributions from net investment income | | | (0.18 | ) | | | (0.20 | ) | | | (0.16 | ) | | | (0.16 | ) | | | (0.16 | ) |
Distributions from net realized gain | | | (0.84 | ) | | | (0.35 | ) | | | 0.00 | | | | 0.00 | | | | 0.00 | |
Total distributions | | | (1.02 | ) | | | (0.55 | ) | | | (0.16 | ) | | | (0.16 | ) | | | (0.16 | ) |
Net asset value, end of period | | $ | 16.92 | | | $ | 15.32 | | | $ | 14.57 | | | $ | 13.09 | | | $ | 11.85 | |
| | | | | | | | | | | | | | | | | | | | |
Total return1 | | | 17.79 | % | | | 9.14 | % | | | 12.61 | % | | | 11.82 | % | | | 21.36 | % |
Ratios/supplemental data: | | | | | | | | | | | | | | | | | | | | |
Net assets, end of period (000s) | | $ | 273,273 | | | $ | 223,488 | | | $ | 196,484 | | | $ | 170,383 | | | $ | 131,760 | |
Ratio of net investment income (loss) to average net assets2 | | | 1.55 | % | | | 1.55 | % | | | 1.42 | % | | | 1.14 | % | | | 1.20 | % |
Ratio of expenses to average net assets prior to waived fees and reimbursed expenses2 | | | 1.20 | % | | | 1.20 | %3 | | | 1.12 | %3 | | | 1.02 | %3 | | | 1.13 | %3 |
Waived fees and reimbursed expenses2 | | | (0.20 | )% | | | (0.20 | )% | | | (0.12 | )% | | | (0.02 | )% | | | (0.13 | )% |
Ratio of expenses to average net assets after waived fees and expenses2,3 | | | 1.00 | % | | | 1.00 | % | | | 1.00 | % | | | 1.00 | % | | | 1.00 | % |
Portfolio turnover rate4 | | | 58 | % | | | 61 | % | | | 64 | % | | | 42 | % | | | 43 | % |
| 1. | Total return calculations do not include any sales charges, and would have been lower had certain expenses not been waived or reimbursed during the periods shown. Returns for periods less than one year are not annualized. |
| 2. | During each period, various fees and expenses were waived and reimbursed as indicated. The ratio of Gross Expenses to Average Net Assets reflects the expense ratio in the absence of any waivers and reimbursements. |
| 3. | Includes net expenses allocated from the Portfolio(s) in which the Fund invests. |
| 4. | Portfolio turnover rate is calculated by aggregating the results of multiplying the Fund’s investment percentage in the respective Portfolio by the corresponding Portfolio’s portfolio turnover rate. |
E-2
Growth Balanced Fund
Performance
The following information shows you how the Fund has performed and illustrates the variability of the Fund’s returns over time. The Fund’s average annual total returns are compared to the performance of an appropriate broad-based index. Please remember that past performance before and after taxes is no guarantee of future results.
Calendar Year Total Returns for the Administrator Class1
as of 12/31 each year
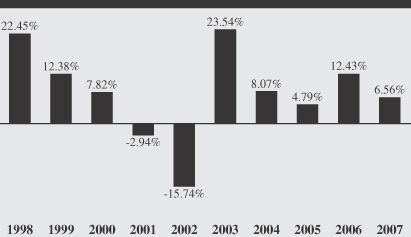
Best and Worst Quarter
| | | | |
Best Quarter: | | Q4 1998 | | 16.86% |
Worst Quarter: | | Q3 2002 | | -15.61% |
Average Annual Total Returns
for the period ended December 31, 2007
| | | | | | |
| | | 1 year | | 5 years | | 10 years |
Administrator Class1 | | | | | | |
Before Taxes | | 6.56% | | 10.88% | | 7.36% |
After Taxes on Distributions2 | | 3.52% | | 9.18% | | 5.66% |
After Taxes on Distributions and Sale of Fund Shares2 | | 5.86% | | 8.76% | | 5.59% |
S&P 500 Index3 | | 5.49% | | 12.82% | | 5.91% |
(reflects no deduction for expenses or taxes) | | | | | | |
Lehman Brothers U.S. Aggregate Bond Index4 | | 6.97% | | 4.42% | | 5.97% |
(reflects no deduction for expenses or taxes) | | | | | | |
Growth Balanced Composite Index5 | | 6.24% | | 11.17% | | 6.68% |
(reflects no deduction for expenses or taxes) | | | | | | |
| 1. | Administrator Class shares incepted on November 11, 1994. Prior to April 11, 2005, the Administrator Class was named the Institutional Class. |
| 2. | After-tax returns are calculated using the historical highest individual federal marginal income tax rates and do not reflect the impact of state, local or foreign taxes. Actual after-tax returns depend on an investor’s tax situation and may differ from those shown, and after-tax returns shown are not relevant to tax-exempt investors or investors who hold their Fund shares through tax-deferred arrangements, such as 401(k) Plans or Individual Retirement Accounts. |
| 3. | The S&P 500 Index consists of 500 stocks chosen for market size, liquidity, and industry group representation. It is a market value-weighted index with each stock’s weight in the Index proportionate to its market value. You cannot invest directly in an index. |
| 4. | The Lehman Brothers U.S. Aggregate Bond Index is composed of the Lehman Brothers U.S Government/Credit Index and the Lehman Brothers U.S. Mortgage-Backed Securities Index, and includes Treasury issues, agency issues, corporate bond issues, and mortgage-backed securities. You cannot invest directly in an index. |
5. | The Growth Balanced Composite Index is weighted 35% in the Lehman Brothers U.S. Aggregate Bond Index, 16.25% in the Russell 1000 ® Value Index, 16.25% in the S&P 500 Index, 16.25% in the Russell 1000 ® Growth Index, 9.75% in the MSCI EAFE Index, and 6.50% in the Russell 2000 ® Index. |
E-3
Financial Highlights
The following tables are intended to help you understand the Funds’ financial performance for the past 5 years. Certain information reflects financial results for a single Fund share. Total returns represent the rate you would have earned (or lost) on an investment in the Fund (assuming reinvestment of all distributions). All performance information, along with the report of independent registered public accounting firm and the Funds’ financial statements, is also contained in the Funds’ annual report, a copy of which is available upon request.
Growth Balanced Fund
Administrator Class Shares—Commenced on November 11, 1994
For a share outstanding throughout each period
| | | | | | | | | | | | | | | | | | | | |
For the period ended: | | Sept. 30,
2007 | | | Sept. 30,
2006 | | | Sept. 30,
2005 | | | Sept. 30,
2004 | | | Sept. 30,
2003 | |
Net asset value, beginning of period | | $ | 30.98 | | | $ | 30.76 | | | $ | 28.41 | | | $ | 26.34 | | | $ | 22.65 | |
Income from investment operations: | | | | | | | | | | | | | | | | | | | | |
Net investment income (loss) | | | 0.70 | | | | 0.62 | | | | 0.56 | | | | 0.45 | 1 | | | 0.35 | |
Net realized and unrealized gain (loss) on investments | | | 3.99 | | | | 1.85 | | | | 2.50 | | | | 2.25 | | | | 3.80 | |
Total from investment operations | | | 4.69 | | | | 2.47 | | | | 3.06 | | | | 2.70 | | | | 4.15 | |
Less distributions: | | | | | | | | | | | | | | | | | | | | |
Distributions from net investment income | | | (0.60 | ) | | | (0.54 | ) | | | (0.50 | ) | | | (0.63 | ) | | | (0.46 | ) |
Distributions from net realized gain | | | (1.78 | ) | | | (1.71 | ) | | | (0.21 | ) | | | 0.00 | | | | 0.00 | |
Total distributions | | | (2.38 | ) | | | (2.25 | ) | | | (0.71 | ) | | | (0.63 | ) | | | (0.46 | ) |
Net asset value, end of period | | $ | 33.29 | | | $ | 30.98 | | | $ | 30.76 | | | $ | 28.41 | | | $ | 26.34 | |
| | | | | | | | | | | | | | | | | | | | |
Total return2 | | | 15.84 | % | | | 8.40 | % | | | 10.87 | % | | | 10.31 | % | | | 18.53 | % |
Ratios/supplemental data: | | | | | | | | | | | | | | | | | | | | |
Net assets, end of period (000s) | | $ | 1,804,249 | | | $ | 1,919,297 | | | $ | 1,848,078 | | | $ | 1,738,782 | | | $ | 1,415,216 | |
Ratio of net investment income (loss) to average net assets3 | | | 2.12 | % | | | 2.13 | % | | | 1.84 | % | | | 1.59 | % | | | 1.69 | % |
Ratio of expenses to average net assets prior to waived fees and reimbursed expenses3 | | | 1.14 | % | | | 1.12 | %4 | | | 1.07 | %4 | | | 0.95 | %4 | | | 1.05 | %4 |
Waived fees and reimbursed expenses3 | | | (0.19 | )% | | | (0.17 | )% | | | (0.12 | )% | | | (0.01 | )% | | | (0.11 | )% |
Ratio of expenses to average net assets after waived fees and expenses3,4 | | | 0.95 | % | | | 0.95 | % | | | 0.95 | % | | | 0.94 | % | | | 0.94 | % |
Portfolio turnover rate5 | | | 75 | % | | | 80 | % | | | 80 | % | | | 51 | % | | | 53 | % |
| 1. | Calculated based upon average shares outstanding. |
| 2. | Total return calculations do not include any sales charges, and would have been lower had certain expenses not been waived or reimbursed during the periods shown. Returns for periods less than one year are not annualized. |
| 3. | During each period, various fees and expenses were waived and reimbursed as indicated. The ratio of Gross Expenses to Average Net Assets reflects the expense ratio in the absence of any waivers and reimbursements. |
| 4. | Includes net expenses allocated from the Portfolio(s) in which the Fund invests. |
| 5. | Portfolio turnover rate is calculated by aggregating the results of multiplying the Fund’s investment percentage in the respective Portfolio by the corresponding Portfolio’s portfolio turnover rate. |
E-4
Moderate Balanced Fund
Performance
The following information shows you how the Fund has performed and illustrates the variability of the Fund’s returns over time. The Fund’s average annual total returns are compared to the performance of an appropriate broad-based index. Please remember that past performance before and after taxes is no guarantee of future results.
Calendar Year Total Returns for the Administrator Class1 as of 12/31 each year
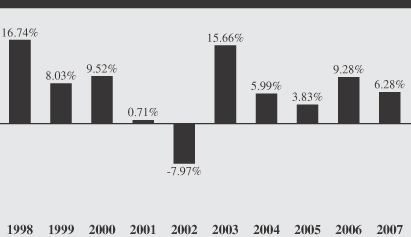
Best and Worst Quarter
| | | | |
Best Quarter: | | Q4 1998 | | 10.19% |
Worst Quarter: | | Q3 2002 | | -9.06% |
Average Annual Total Returns
for the period ended December 31, 2007
| | | | | | | | | |
| | | 1 year | | | 5 years | | | 10 years | |
Administrator Class1 | | | | | | | | | |
Before Taxes | | 6.28 | % | | 8.13 | % | | 6.59 | % |
After Taxes on Distributions2 | | 3.75 | % | | 6.33 | % | | 4.56 | % |
After Taxes on Distributions and Sale of Fund Shares2 | | 5.16 | % | | 6.22 | % | | 4.66 | % |
S&P 500 Index3 | | 5.49 | % | | 12.82 | % | | 5.91 | % |
(reflects no deduction for expenses or taxes) | | | | | | | | | |
Lehman Brothers U.S. Aggregate Bond Index4 | | 6.97 | % | | 4.42 | % | | 5.97 | % |
(reflects no deduction for expenses or taxes) | | | | | | | | | |
Moderate Balanced Allocation Composite Index5 | | 6.41 | % | | 8.36 | % | | 6.26 | % |
(reflects no deduction for expenses or taxes) | | | | | | | | | |
| 1. | Administrator Class shares incepted on November 11, 1994. Prior to April 11, 2005, the Administrator Class was named the Institutional Class. |
| 2. | After-tax returns are calculated using the historical highest individual federal marginal income tax rates and do not reflect the impact of state, local or foreign taxes. Actual after-tax returns depend on an investor’s tax situation and may differ from those shown, and after-tax returns shown are not relevant to tax-exempt investors or investors who hold their Fund shares through tax-deferred arrangements, such as 401(k) Plans or Individual Retirement Accounts. |
| 3. | The S&P 500 Index consists of 500 stocks chosen for market size, liquidity, and industry group representation. It is a market value-weighted index with each stock’s weight in the Index proportionate to its market value. You cannot invest directly in an index. |
| 4. | The Lehman Brothers U.S. Aggregate Bond Index is composed of the Lehman Brothers U.S Government/Credit Index and the Lehman Brothers U.S. Mortgage-Backed Securities Index, and includes Treasury issues, agency issues, corporate bond issues, and mortgage-backed securities. You cannot invest directly in an index. |
5. | The Moderate Balanced Allocation Composite Index is weighted 45% in the Lehman Brothers U.S. Aggregate Bond Index, 15% in the Lehman Brothers 9-12 Month U.S. Treasury Bond Index, 10% in the Russell 1000 ® Value Index, 10% in the S&P 500 Index, 10% in the Russell 1000 ® Growth Index, 6% in the MSCI EAFE Index, and 4% in the Russell 2000 ® Index. You cannot invest directly in an index. |
E-5
Financial Highlights
The following tables are intended to help you understand the Funds’ financial performance for the past 5 years. Certain information reflects financial results for a single Fund share. Total returns represent the rate you would have earned (or lost) on an investment in the Fund (assuming reinvestment of all distributions). All performance information, along with the report of independent registered public accounting firm and the Funds’ financial statements, is also contained in the Funds’ annual report, a copy of which is available upon request.
Moderate Balanced Fund
Administrator Class Shares—Commenced on November 11, 1994
For a share outstanding throughout each period
| | | | | | | | | | | | | | | | | | | | |
For the period ended: | | Sept. 30,
2007 | | | Sept. 30,
2006 | | | Sept. 30,
2005 | | | Sept. 30,
2004 | | | Sept. 30,
2003 | |
Net asset value, beginning of period | | $ | 22.08 | | | $ | 22.32 | | | $ | 21.76 | | | $ | 21.09 | | | $ | 19.47 | |
Income from investment operations: | | | | | | | | | | | | | | | | | | | | |
Net investment income (loss) | | | 0.67 | 1 | | | 0.64 | | | | 0.52 | | | | 0.42 | | | | 0.44 | |
Net realized and unrealized gain (loss) on investments | | | 1.77 | | | | 0.78 | | | | 1.10 | | | | 1.10 | | | | 2.02 | |
Total from investment operations | | | 2.44 | | | | 1.42 | | | | 1.62 | | | | 1.52 | | | | 2.46 | |
Less distributions: | | | | | | | | | | | | | | | | | | | | |
Distributions from net investment income | | | (0.64 | ) | | | (0.56 | ) | | | (0.41 | ) | | | (0.64 | ) | | | (0.64 | ) |
Distributions from net realized gain | | | (0.98 | ) | | | (1.10 | ) | | | (0.65 | ) | | | (0.21 | ) | | | (0.20 | ) |
Total distributions | | | (1.62 | ) | | | (1.66 | ) | | | (1.06 | ) | | | (0.85 | ) | | | (0.84 | ) |
Net asset value, end of period | | $ | 22.90 | | | $ | 22.08 | | | $ | 22.32 | | | $ | 21.76 | | | $ | 21.09 | |
| | | | | | | | | | | | | | | | | | | | |
Total return2 | | | 11.59 | % | | | 6.68 | % | | | 7.57 | % | | | 7.28 | % | | | 12.99 | % |
Ratios/supplemental data: | | | | | | | | | | | | | | | | | | | | |
Net assets, end of period (000s) | | $ | 533,729 | | | $ | 558,601 | | | $ | 557,564 | | | $ | 544,698 | | | $ | 512,460 | |
Ratio of net investment income (loss) to average net asset3 | | | 3.00 | % | | | 2.98 | % | | | 2.34 | % | | | 1.97 | % | | | 2.25 | % |
Ratio of expenses to average net assets prior to waived fees and reimbursed expenses3 | | | 1.10 | % | | | 1.09 | %4 | | | 1.04 | %4 | | | 0.92 | %4 | | | 1.03 | %4 |
Waived fees and reimbursed expenses3 | | | (0.20 | )% | | | (0.19 | )% | | | (0.14 | )% | | | (0.02 | )% | | | (0.14 | )% |
Ratio of expenses to average net assets after waived fees and expenses3,4 | | | 0.90 | % | | | 0.90 | % | | | 0.90 | % | | | 0.90 | % | | | 0.89 | % |
Portfolio turnover rate5 | | | 82 | % | | | 93 | % | | | 91 | % | | | 62 | % | | | 64 | % |
| 1. | Calculated based upon average shares outstanding. |
| 2. | Total return calculations do not include any sales charges, and would have been lower had certain expenses not been waived or reimbursed during the periods shown. Returns for periods less than one year are not annualized. |
| 3. | During each period, various fees and expenses were waived and reimbursed as indicated. The ratio of Gross Expenses to Average Net Assets reflects the expense ratio in the absence of any waivers and reimbursements. |
| 4. | Includes net expenses allocated from the Portfolio(s) in which the Fund invests. |
| 5. | Portfolio turnover rate is calculated by aggregating the results of multiplying the Fund’s investment percentage in the respective Portfolio by the corresponding Portfolio’s portfolio turnover rate. |
E-6
Life Stage—Conservative Portfolio
Performance
The following information shows you how the Portfolio has performed and illustrates the variability of the Portfolio’s returns over time. The Portfolio’s average annual total returns are compared to the performance of an appropriate broad-based index. Please remember that past performance before and after taxes is no guarantee of future results.
Effective April 11, 2005, the Strong family of funds reorganized into the Wells Fargo Advantage Funds. As part of this transaction, the Conservative Portfolio was organized as the successor portfolio to the Strong Life Stage Series – Conservative Portfolio.
Calendar Year Total Returns for the Investor Class1 as of 12/31 each year
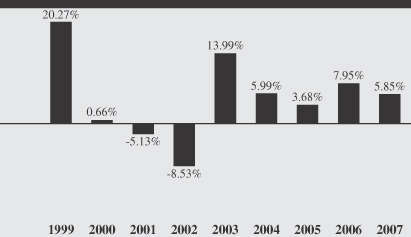
Best and Worst Quarter
| | | | | |
Best Quarter: | | Q4 1999 | | 12.83 | % |
Worst Quarter: | | Q3 2001 | | -7.24 | % |
The Portfolio’s year-to-date performance through December 31, 2007, was 5.85%.
Average Annual Total Returns
as of December 31, 2007
| | | | | | | | | |
| | | 1 year | | | 5 years | | | Life of Portfolio1 | |
Investor Class1 | | | | | | | | | |
Returns Before Taxes | | 5.85 | % | | 7.44 | % | | 4.64 | % |
Returns After Taxes on Distributions2 | | 4.45 | % | | 6.31 | % | | 3.20 | % |
Returns After Taxes on Distributions and Sale of Portfolio Shares2 | | 3.81 | % | | 5.75 | % | | 3.12 | % |
S&P 500 Index3,4 | | 5.50 | % | | 12.82 | % | | 3.65 | % |
(reflects no deduction for expenses or taxes) | | | | | | | | | |
MSCI EAFE Index5 | | 11.17 | % | | 21.59 | % | | 7.47 | % |
(reflects no deduction for expenses or taxes) | | | | | | | | | |
Lehman Brothers U.S. Aggregate Bond Index6 | | 6.97 | % | | 4.42 | % | | 5.68 | % |
(reflects no deduction for expenses or taxes) | | | | | | | | | |
E-7
| 1. | Investor Class shares incepted on December 31, 1998. Performance shown prior to April 11, 2005, for the Investor Class shares reflects the performance of the Investor Class of the Strong Life Stage Series-Conservative Portfolio. Returns for the Investor Class shares and Indices shown in the Life of Portfolio column are as of the Portfolio inception date. |
| 2. | After-tax returns are calculated using the historical highest individual federal marginal income tax rates and do not reflect the impact of state, local or foreign taxes. Actual after-tax returns depend on an investor’s tax situation and may differ from those shown, and after-tax returns shown are not relevant to tax-exempt investors or investors who hold their Portfolio shares through tax-deferred arrangements, such as 401(k) Plans or Individual Retirement Accounts. |
| 3. | The S&P 500 Index consists of 500 stocks chosen for market size, liquidity, and industry group representation. It is a market value-weighted index with each stock’s weight in the Index proportionate to its market value. You cannot invest directly in an index. |
| 4. | Standard & Poor’s, S&P, S&P 500 Index, Standard & Poor’s 500 and 500 are trademarks of McGraw Hill, Inc. and have been licensed for use by the Portfolio. The Portfolio is not sponsored, endorsed, sold or promoted by S&P and S&P makes no representation or warranty regarding the advisability of investing in the Portfolio. |
| 5. | The Morgan Stanley Capital International Europe, Australasia and Far East (“MSCI EAFE”) Index is an unmanaged group of securities widely regarded by investors to be representations of the stock markets of Europe, Australasia and the Far East. You cannot invest directly in an index. |
| 6. | The Lehman Brothers U.S. Aggregate Bond Index is composed of the Lehman Brothers U.S. Government/Credit Index and the Lehman Brothers U.S. Mortgage-Backed Securities Index, and includes Treasury issues, agency issues, corporate bond issues, and mortgage-backed securities. You cannot invest directly in an index. |
E-8
Life Stage – Moderate Portfolio
Performance
The following information shows you how the Portfolio has performed and illustrates the variability of the Portfolio’s returns over time. The Portfolio’s average annual total returns are compared to the performance of an appropriate broad-based index. Please remember that past performance before and after taxes is no guarantee of future results.
Effective April 11, 2005, the Strong family of funds reorganized into the Wells Fargo Advantage Funds. As part of this transaction, the Moderate Portfolio was organized as the successor portfolio to the Strong Life Stage Series – Moderate Portfolio.
Calendar Year Total Returns for the Investor Class1 as of 12/31 each year
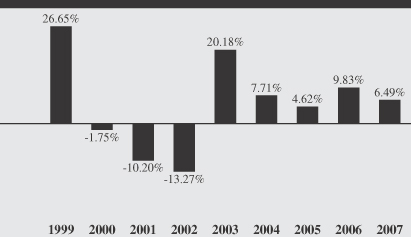
Best and Worst Quarter
| | | | |
Best Quarter: | | Q4 1999 | | 18.81% |
Worst Quarter: | | Q3 2001 | | -10.87% |
The Portfolio’s year-to-date performance through December 31, 2007, was 6.49%.
Average Annual Total Returns
as of December 31, 2007
| | | | | | |
| | | 1 year | | 5 years | | Life of Portfolio1 |
Investor Class1 | | | | | | |
Returns Before Taxes | | 6.49% | | 9.63% | | 4.88% |
Returns After Taxes on Distributions2 | | 5.36% | | 8.71% | | 3.73% |
Returns After Taxes on Distributions and Sale of Portfolio Shares2 | | 4.22% | | 7.82% | | 3.52% |
S&P 500 Index3 | | 5.50% | | 12.82% | | 3.65% |
(reflects no deduction for expenses or taxes) | | | | | | |
MSCI EAFE Index4 | | 11.17% | | 21.59% | | 7.47% |
(reflects no deduction for expenses or taxes) | | | | | | |
Lehman Brothers U.S. Aggregate Bond Index5 | | 6.97% | | 4.42% | | 5.68% |
(reflects no deduction for expenses or taxes) | | | | | | |
E-9
| 1. | Investor Class shares incepted on December 31, 1998. Performance shown prior to April 11, 2005, for the Investor Class shares reflects the performance of the Investor Class shares of the Strong Life Stage Series-Moderate Portfolio. Returns for the Investor Class shares and Indices shown in the Life of Portfolio column are as of the Portfolio inception date. |
| 2. | After-tax returns are calculated using the historical highest individual federal marginal income tax rates and do not reflect the impact of state, local or foreign taxes. Actual after-tax returns depend on an investor’s tax situation and may differ from those shown, and after-tax returns shown are not relevant to tax-exempt investors or investors who hold their Portfolio shares through tax-deferred arrangements, such as 401(k) Plans or Individual Retirement Accounts. |
| 3. | The S&P 500 Index consists of 500 stocks chosen for market size, liquidity, and industry group representation. It is a market value-weighted index with each stock’s weight in the Index proportionate to its market value. You cannot invest directly in an index. |
| 4. | The Morgan Stanley Capital International Europe, Australasia and Far East (“MSCI EAFE”) Index is an unmanaged group of securities widely regarded by investors to be representations of the stock markets of Europe, Australasia and the Far East. You cannot invest directly in an index. |
| 5. | The Lehman Brothers U.S. Aggregate Bond Index is composed of the Lehman Brothers U.S. Government/Credit Index and the Lehman Brothers U.S. Mortgage-Backed Securities Index, and includes Treasury issues, agency issues, corporate bond issues, and mortgage-backed securities. You cannot invest directly in an index. |
E-10
Life Stage – Aggressive Portfolio
Performance
The following information shows you how the Portfolio has performed and illustrates the variability of the Portfolio’s returns over time. The Portfolio’s average annual total returns are compared to the performance of an appropriate broad-based index. Please remember that past performance before and after taxes is no guarantee of future results.
Effective April 11, 2005, the Strong family of funds reorganized into the Wells Fargo Advantage Funds. As part of this transaction, the Aggressive Portfolio was organized as the successor portfolio to the Strong Life Stage Series – Aggressive Portfolio.
Calendar Year Total Returns for the Investor Class1 as of 12/31 each year
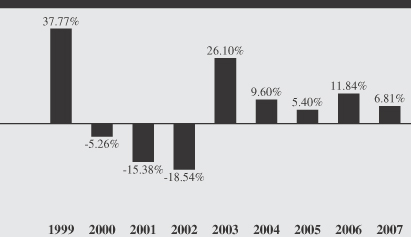
Best and Worst Quarter
| | | | |
Best Quarter: | | Q4 1999 | | 25.02% |
Worst Quarter: | | Q3 2001 | | -14.85% |
The Portfolio’s year-to-date performance through December 31, 2007, was 6.81%.
Average Annual Total Returns
as of December 31, 2007
| | | | | | |
| | | 1 year | | 5 years | | Life of Portfolio1 |
Investor Class1 | | | | | | |
Returns Before Taxes | | 6.81% | | 11.72% | | 5.11% |
Returns After Taxes on Distributions2 | | 5.89% | | 11.02% | | 4.19% |
Returns After Taxes on Distributions and Sale of Portfolio Shares2 | | 4.42% | | 9.81% | | 3.90% |
S&P 500 Index3 | | 5.50% | | 12.82% | | 3.65% |
(reflects no deduction for expenses or taxes) | | | | | | |
MSCI EAFE Index4 | | 11.17% | | 21.59% | | 7.47% |
(reflects no deduction for expenses or taxes) | | | | | | |
Lehman Brothers U.S. Aggregate Bond Index5 | | 6.97% | | 4.42% | | 5.68% |
(reflects no deduction for expenses or taxes) | | | | | | |
E-11
| 1. | Investor Class shares incepted on December 31, 1998. Performance shown prior to April 11, 2005, for the Investor Class shares reflects the performance of the Investor Class shares of the Strong Life Stage Series-Aggressive Portfolio. Returns for the Investor Class shares and Indices shown in the Life of Portfolio column are as of the Portfolio inception date. |
| 2. | After-tax returns are calculated using the historical highest individual federal marginal income tax rates and do not reflect the impact of state, local or foreign taxes. Actual after-tax returns depend on an investor’s tax situation and may differ from those shown, and after-tax returns shown are not relevant to tax-exempt investors or investors who hold their Portfolio shares through tax-deferred arrangements, such as 401(k) Plans or Individual Retirement Accounts. |
| 3. | The S&P 500 Index consists of 500 stocks chosen for market size, liquidity, and industry group representation. It is a market value-weighted index with each stock’s weight in the Index proportionate to its market value. You cannot invest directly in an index. |
| 4. | The Morgan Stanley Capital International Europe, Australasia and Far East (“MSCI EAFE”) Index is an unmanaged group of securities widely regarded by investors to be representations of the stock markets of Europe, Australasia and the Far East. You cannot invest directly in an index. |
| 5. | The Lehman Brothers U.S. Aggregate Bond Index is composed of the Lehman Brothers U.S. Government/Credit Index and the Lehman Brothers U.S. Mortgage-Backed Securities Index, and includes Treasury issues, agency issues, corporate bond issues, and mortgage-backed securities. You cannot invest directly in an index. |
E-12
EXHIBIT F – MANAGEMENT’S DISCUSSION OF FUND PERFORMANCE
Wells Fargo Advantage Aggressive Allocation Fund
INVESTMENT OBJECTIVE
The Wells Fargo Advantage Aggressive Allocation Fund (the Fund) seeks total return, consisting primarily of capital appreciation.
| | |
INVESTMENT ADVISER Wells Fargo Funds Management, LLC SUBADVISER Wells Capital Management Incorporated MASTER PORTFOLIO SUBADVISERS Artisan Partners Limited Partnership Cadence Capital Management Cooke & Bieler, L.P. Galliard Capital Management, Inc. LSV Asset Management New Star Institutional Managers Limited Peregrine Capital Management, Inc. Smith Asset Management Group, L.P. SSgA Funds Management Systematic Financial Management, L.P. Wells Capital Management Incorporated | | PORTFOLIO MANAGERS Doug Beath Thomas C. Biwer, CFA Galen G. Blomster, CFA Christian L. Chan, CFA Jeffrey P. Mellas Andrew Owen, CFA FUND INCEPTION December 2, 1997 |
PERFORMANCE SUMMARY
12-MONTH TOTAL RETURN AS OF SEPTEMBER 30, 2007
| | | |
Aggressive Allocation Fund | | 1-Year | |
Administrator Class | | 17.79 | % |
Benchmark | | | |
Aggressive Allocation Composite Index1 | | 14.95 | % |
S&P 500 Index2 | | 16.44 | % |
Lehman Brothers U.S. Aggregate Index3 | | 5.14 | % |
Figures quoted represent past performance, which is no guarantee of future results and do not reflect the deduction of taxes that a shareholder may pay on fund distributions or the redemption of fund shares. Investment return and principal value of an investment will fluctuate so that an investor’s shares, when redeemed, may be worth more or less than their original cost. Current performance may be lower or higher than the performance data quoted. Current month-end performance is available on the Funds’ Web site – www.wellsfargo.com/advantagefunds.
F-1
Wells Fargo Advantage Aggressive Allocation Fund (continued)
Administrator Class shares are sold without a front-end sales charge or contingent deferred sales charge. Net and gross expense ratios for Administrator shares are 1.00% and 1.20%. The investment adviser has contractually committed through January 31, 2009, to waive fees and/or reimburse expenses to the extent necessary to maintain this net operating expense ratio. Without these reductions, the Fund’s returns would have been lower.
GROWTH OF $10,000 INVESTMENT4
(AS OF SEPTEMBER 30, 2007)
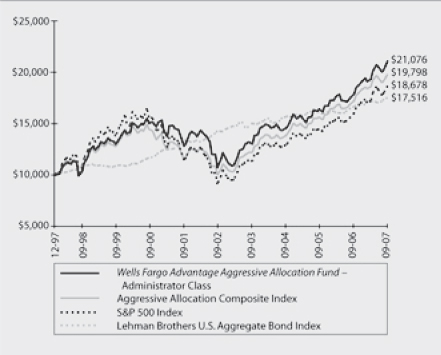
1 | The Aggressive Allocation Composite Index is weighted 20% in the S&P 500 Index, 20% in the Lehman Brothers U.S. Aggregate Index, 20% in the Russell 1000® Value Index, 20% in the Russell 1000® Growth, 12% in the Morgan Stanley Capital International Europe, Australasia and Far East (“MSCI EAFE”) Index, and 8% in the Russell 2000® Index. The Russell 1000® Value Index measures the performance of those Russell 1000 companies with lower price-to-book ratios and lower forecasted growth values. The Russell 1000® Growth Index measures the performance of those Russell 1000 companies with higher price-to-book ratios and higher forecasted growth values. The MSCI EAFE Index is an unmanaged group of securities widely regarded by investors to be representations of the stock markets of Europe, Australasia and the Far East. The Russell 2000® Index measures the performance of the 2,000 smallest companies in the Russell 3000 Index, which represents approximately 8% of the total market capitalization of the Russell 3000 Index. You cannot invest directly in an Index. |
F-2
Wells Fargo Advantage Aggressive Allocation Fund (continued)
MANAGER’S DISCUSSION
Fund highlights
| • | | The Fund’s solid performance outpaced its composite benchmark and the S&P 500 Index as well as the Lehman Brothers U.S. Aggregate Index. |
| • | | Stocks outperformed bonds during the period, and the Fund’s emphasis on stocks significantly added to Fund performance. |
| • | | The bond market had respectable gains, despite trouble from subprime mortgages. |
Even with the slowdown in housing, the U.S. economy was resilient and corporate profits grew at a healthy pace.
The Fund emphasized stocks throughout most of the 12-month period, and this benefited the performance of the portfolio as stocks significantly outperformed bonds. Performance was strong across all equity styles and classes, with each major stock category producing double digit returns. International stocks continued to lead all equity classes, but after several years of underperforming, large cap stocks and growth stocks outperformed their small cap and value stock counterparts. Continuing problems in the U.S. subprime housing market caused extreme market volatility during the last quarter of the period. Stocks subsequently rallied in the final month after the Fed cut short-term rates by a higher-than-expected 50 basis points.
The bond market showed respectable gains during the 12-month period, despite its underperformance compared to stocks. Problems with subprime mortgages spread to the broader fixed-income markets during the final quarter ending in September. Although subsequent Fed easing reassured the overall bond market, inflation fears were evident in other markets, including higher commodity prices in the commodities markets, and continued dollar weakness in the foreign exchange markets, respectively.
TEN LARGEST HOLDINGS5,6
(AS OF SEPTEMBER 30, 2007)
| | | |
Exxon Mobil Corporation | | 1.61 | % |
Microsoft Corporation | | 1.55 | % |
Goldman Sachs Group Incorporated | | 1.51 | % |
Cisco Systems Incorporated | | 1.34 | % |
American International Group Incorporated | | 1.15 | % |
eBay Incorporated | | 1.12 | % |
General Electric Company | | 1.10 | % |
Bank of America Corporation | | 0.97 | % |
Medtronic Incorporated | | 0.96 | % |
Google Incorporated Class A | | 0.88 | % |
2 | The S&P 500 Index consists of 500 stocks chosen for market size, liquidity, and industry group representation. It is a market value weighted index with each stock’s weight in the Index proportionate to its market value. You cannot invest directly in an Index. |
3 | The Lehman Brothers U.S. Aggregate Index includes bonds from the Treasury, government-related, corporate, agency, mortgage-backed securities, and asset-backed securities sectors. You cannot invest directly in an Index. |
4 | The chart compares the performance of the Wells Fargo Advantage Aggressive Allocation Fund Administrator Class shares for the life of the Fund with the Aggressive Allocation Composite Index, the S&P 500 Index and the Lehman Brothers U.S. Aggregate Index. The chart assumes a hypothetical $10,000 investment in Administrator Class shares and reflects all operating expenses. |
F-3
Wells Fargo Advantage Aggressive Allocation Fund (continued)
With the most recent shift toward stocks, the portfolio maintained a long position in the S&P 500 Index futures and was short in the long-term U.S. Treasury bond futures.
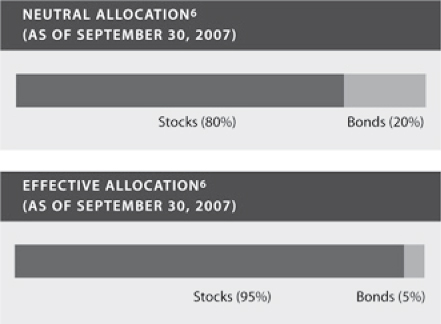
The Tactical Asset Allocation (TAA) Model, which seeks to enhance portfolio returns by shifting assets between stocks and bonds, maintained a 15% shift toward stocks until the quarter that ended in June, when it shifted to neutral. During the final quarter that ended in September, the TAA Model again employed a 15% shift toward stocks. To implement an overweight in stocks, the Fund has employed a hedged futures overlay transaction, thus keeping the portfolio’s underlying assets near their long-term strategic asset allocation of 80% stocks and 20% bonds. With the futures overlay, the Fund had an effective target allocation of 95% stocks and 5% bonds at the end the period.
The TAA Model indicates that stocks remain attractive relative to bonds.
With stocks significantly outperforming long Treasury bonds, the 15% TAA Model shift toward stocks during most of the 12-month period improved the performance of the Fund. While stocks have outperformed the broad bond market, the TAA Model indicates that stocks remain attractive relative to bonds. As a result, the Fund will keep its overweighted position in stocks until the relative valuation between stocks and bonds returns to a more normal level.
5 | The Ten Largest Holdings are calculated based on the market value of the Master Trust portfolio securities allocable to the Fund divided by the total market value of the portfolio of investments of the Fund. See Notes to the Financial Statements for a discussion of the Master Trust. |
6 | Portfolio holdings and portfolio allocations are subject to change. Cash and cash equivalents are not reflected in the calculations of portfolio holdings and portfolio allocations. |
F-4
Wells Fargo Advantage Aggressive Allocation Fund (continued)
AVERAGE ANNUAL TOTAL RETURN7 (%) (AS OF SEPTEMBER 30, 2007)
| | | | | | | | | | | | |
| | | 6-Month* | | 1-Year | | 5-Year | | Life of Fund | | Expense Ratio |
| | | | | | Gross8 | | Net9 |
Administrator Class (NWBEX) | | 9.02 | | 17.79 | | 14.46 | | 7.88 | | 1.20 | | 1.00 |
Benchmarks | | | | | | | | | | | | |
Aggressive Allocation Composite Index1 | | 6.46 | | 14.95 | | 14.64 | | 7.19 | | | | |
S&P 500 Index2 | | 8.44 | | 16.44 | | 15.44 | | 6.57 | | | | |
Lehman Brothers U.S. Aggregate Index3 | | 2.31 | | 5.14 | | 4.13 | | 5.86 | | | | |
| * | Returns for periods of less than one year are not annualized. |
Figures quoted represent past performance, which is no guarantee of future results and do not reflect the deduction of taxes that a shareholder may pay on fund distributions or the redemption of fund shares. Investment return and principal value of an investment will fluctuate so that an investor’s shares, when redeemed, may be worth more or less than their original cost. Current performance may be lower or higher than the performance data quoted. Current month-end performance is available on the Funds’ Web site – www.wellsfargo.com/advantagefunds.
Administrator Class shares are sold without a front-end sales charge or contingent deferred sales charge.
Balanced funds may invest in stocks and bonds. Stock values fluctuate in response to the activities of individual companies and general market and economic conditions. Bond values fluctuate in response to the financial condition of individual issuers, general market and economic conditions, and changes in interest rates. In general, when interest rates rise, bond values fall and investors may lose principal value. The use of derivatives may reduce returns and/or increase volatility. Certain investment strategies tend to increase the total risk of an investment (relative to the broader market). This fund is exposed to foreign investment risk and small company investment risk. Consult the Fund’s prospectus for additional information on these and other risks.
7 | The Fund is a gateway blended Fund that invests all of its assets in two or more master portfolios of the Master Trust in varying proportions. References to the investment activities of the Fund are intended to refer to the investment activities of the master portfolios in which it invests. Prior to April 11, 2005, the Wells Fargo Advantage Aggressive Allocation Fund – Administrator Class was named the Wells Fargo Strategic Growth Allocation Fund – Institutional Class. |
8 | Reflects the gross expense ratio as stated in the February 1, 2007 prospectus and is based on the Fund’s previous fiscal year expenses as reported in the Financial Highlights. |
9 | The investment adviser has committed through January 31, 2009, to waive fees and/or reimburse expenses to the extent necessary to maintain the net operating expense ratio shown. Without these reductions, the Fund’s returns would have been lower. |
F-5
Wells Fargo Advantage Growth Balanced Fund
INVESTMENT OBJECTIVE
The Wells Fargo Advantage Growth Balanced Fund (the Fund) seeks total return, consisting of capital appreciation and current income.
| | |
INVESTMENT ADVISER Wells Fargo Funds Management, LLC SUBADVISER Wells Capital Management Incorporated MASTER PORTFOLIO SUBADVISERS Artisan Partners Limited Partnership Cadence Capital Management Cooke & Bieler, L.P. Galliard Capital Management, Inc. LSV Asset Management New Star Institutional Managers Limited Peregrine Capital Management, Inc. Smith Asset Management Group, L.P. SSgA Funds Management Systematic Financial Management, L.P. Wells Capital Management Incorporated | | PORTFOLIO MANAGERS Doug Beath Thomas C. Biwer, CFA Galen G. Blomster, CFA Christian L. Chan, CFA Jeffrey P. Mellas Andrew Owen, CFA FUND INCEPTION April 30, 1989 |
PERFORMANCE SUMMARY
12-MONTH TOTAL RETURN AS OF SEPTEMBER 30, 2007
(EXCLUDING SALES CHARGES)
| | | |
Growth Balanced Fund | | 1-Year | |
Class A | | 15.55 | % |
Benchmark | | | |
Growth Balanced Allocation Composite Index1 | | 13.09 | % |
S&P 500 Index2 | | 16.44 | % |
Lehman Brothers U.S. Aggregate Index3 | | 5.14 | % |
Figures quoted represent past performance, which is no guarantee of future results and do not reflect the deduction of taxes that a shareholder may pay on fund distributions or the redemption of fund shares. Investment return and principal value of an investment will fluctuate so that an investor’s shares, when redeemed, may be worth more or less than their original cost. Performance shown without sales charges would be lower if sales charges were reflected. Current performance may be lower or higher than the performance data quoted. Current month-end performance is available on the Funds’ Web site – www.wellsfargo.com/advantagefunds.
F-6
Wells Fargo Advantage Growth Balanced Fund (continued)
For Class A shares, the maximum front-end sales charge is 5.75%. Performance including sales charge assumes the sales charge for the corresponding time period. Net and gross expense ratios for Class A shares are 1.20% and 1.30%. The investment adviser has contractually committed through January 31, 2009, to waive fees and/or reimburse expenses to the extent necessary to maintain this net operating expense ratio. Without these reductions, the Fund’s returns would have been lower.
GROWTH OF $10,000 INVESTMENTS4
(AS OF SEPTEMBER 30, 2007)
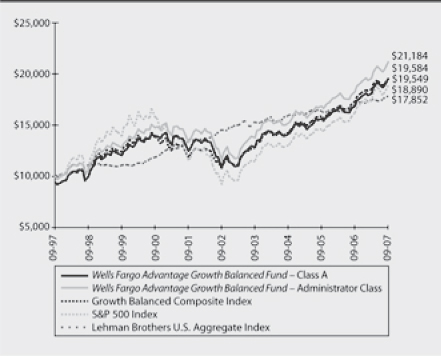
1 | The Growth Balanced Allocation Composite Index is weighted 35% in the Lehman Brothers Aggregate Index, 16.25% in the Russell 1000® Value Index, 16.25% in the S&P 500 Index, 16.25% in the Russell 1000® Growth, 9.75% in the Morgan Stanley Capital International Europe, Australasia and Far East (“MSCI EAFE”) Index, and 6.50% in the Russell 2000® Index. The Russell 1000® Value Index measures the performance of those Russell 1000 companies with lower price-to-book ratios and lower forecasted growth values. The Russell 1000® Growth Index measures the performance of those Russell 1000 companies with higher price-to-book ratios and higher forecasted growth values. The MSCI EAFE Index is an unmanaged group of securities widely regarded by investors to be representations of the stock markets of Europe, Australasia and the Far East. The Russell 2000® Index measures the performance of the 2,000 smallest companies in the Russell 3000® Index, which represents approximately 8% of the total market capitalization of the Russell 3000® Index. You cannot invest directly in an Index. |
F-7
Wells Fargo Advantage Growth Balanced Fund (continued)
MANAGER’S DISCUSSION
Fund highlights
| • | | The Fund outpaced its composite benchmark by more than two percentage points. |
| • | | Stocks outperformed bonds during the period, and the Fund’s emphasis on stocks significantly added to Fund performance. |
| • | | The bond market had respectable gains, despite trouble from subprime mortgages. |
Even with the slowdown in housing, the U.S. economy was resilient and corporate profits grew at a healthy pace.
The Fund emphasized stocks throughout most of the 12-month period, and this benefited the performance of the portfolios as stocks significantly outperformed bonds. Performance was strong across all equity styles and classes, with each major stock category producing double-digit returns. International stocks continued to lead all equity classes, but after several years of underperforming, large cap stocks and growth stocks outperformed their small cap and value counterparts. Continuing problems in the U.S. subprime housing market caused extreme market volatility during the last quarter of the period. Stocks subsequently rallied in the final month after the Fed cut short-term rates by a higher-than-expected 50 basis points.
The bond market showed respectable gains during the 12-month period, despite its underperformance compared to stocks. Problems with subprime mortgages spread to the broader fixed-income markets during the final quarter that ended in September. Although subsequent Fed easing reassured the overall bond market, inflation fears were evident in other markets, including higher commodity prices and dollar weakness.
TEN LARGEST HOLDINGS5,6
AS OF SEPTEMBER 30, 2007)
| | | |
Exxon Mobil Corporation | | 1.32 | % |
Microsoft Corporation | | 1.27 | % |
Goldman Sachs Group Incorporated | | 1.23 | % |
Cisco Systems Incorporated | | 1.10 | % |
American International Group Incorporated | | 0.94 | % |
eBay Incorporated | | 0.92 | % |
General Electric Company | | 0.90 | % |
Bank of America Corporation | | 0.80 | % |
Medtronic Incorporated | | 0.78 | % |
Google Incorporated Class A | | 0.72 | % |
2 | The S&P 500 Index consists of 500 stocks chosen for market size, liquidity, and industry group representation. It is a market value weighted index with each stock’s weight in the Index proportionate to its market value. You cannot invest directly in an Index. |
3 | The Lehman Brothers U.S.Aggregate Index includes bonds from the Treasury, government-related, corporate, agency, mortgage-backed securities, and asset-backed securities sectors. You cannot invest directly in an Index. |
4 | The chart compares the performance of the Wells Fargo Advantage Growth Balanced Fund Class A and Administrator Class shares for the most recent ten years with the Growth Balanced Composite Index, the S&P 500 Index and the Lehman Brothers U.S. Aggregate Index. The chart assumes a hypothetical $10,000 investment in Class A and Administrator Class shares and reflects all operating expenses and, for Class A shares, assumes the maximum initial sales charge of 5.75%. |
F-8
Wells Fargo Advantage Growth Balanced Fund (continued)
With the shift toward stocks, the portfolio maintained a long position in the S&P 500 Index futures and was short in the long-term U.S. Treasury bond futures.
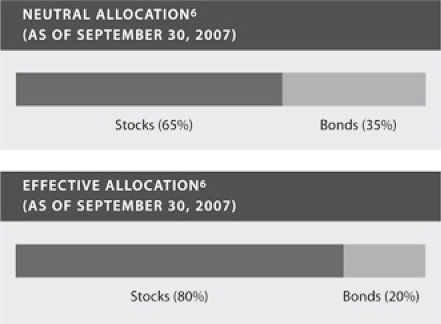
The Tactical Asset Allocation (TAA) Model, which seeks to enhance portfolio returns by shifting assets between stocks and bonds, maintained a 15% shift toward stocks until the quarter that ended in June, when it shifted to neutral. During the final quarter that ended in September, the TAA Model again employed a 15% shift toward stocks. To implement an overweight in stocks, the Fund has employed a hedged futures overlay transaction, thus keeping the portfolio’s underlying assets near their long-term strategic allocation of 65% stocks and 35% bonds. With the futures overlay, the Fund had an effective target allocation of 80% stocks and 20% bonds at the end of the period.
The TAA Model indicates that stocks remain attractive relative to bonds.
With stocks significantly outperforming long Treasury bonds, the 15% TAA Model shift toward stocks during most of the 12-month period improved the performance of the Fund. While stocks have outperformed the broad bond market, the TAA Model indicates that stocks remain attractive relative to bonds. As a result, the Fund will keep its overweighted position in stocks until the relative valuation between stocks and bonds returns to a more normal level.
5 | The ten largest holdings are calculated based on the market value of the Master Trust portfolio securities allocable to the Fund divided by the total market value of the portfolio of investments of the Fund. See Notes to the Financial Statements for a discussion of the Master Trust. |
6 | Portfolio holdings and portfolio allocations are subject to change. Cash and cash equivalents are not reflected in the calculations of portfolio holdings and portfolio allocations. |
F-9
Wells Fargo Advantage Growth Balanced Fund (continued)
AVERAGE ANNUAL TOTAL RETURN7 (%) (AS OF SEPTEMBER 30, 2007)
| | | | | | | | | | | | | | | | | | | | |
| | | Including Sales Charge | | Excluding Sales Charge | | Expense
Ratio |
Growth Balanced Fund | | 6-Month* | | 1-Year | | 5-Year | | 10-Year | | 6-Month* | | 1-Year | | 5-Year | | 10-Year | | Gross8 | | Net9 |
Class A (WFGBX) | | 1.78 | | 8.91 | | 11.12 | | 6.93 | | 7.99 | | 15.55 | | 12.44 | | 7.57 | | 1.30 | | 1.20 |
Class B (NVGRX) | | 2.581 | | 9.69 | | 11.34 | | 6.77 | | 7.58 | | 14.69 | | 11.60 | | 6.77 | | 2.05 | | 1.95 |
Class C (WFGWX) | | 6.59 | | 13.72 | | 11.60 | | 6.79 | | 7.59 | | 14.72 | | 11.60 | | 6.79 | | 2.05 | | 1.95 |
Administrator Class (NVGBX) | | | | | | | | | | 8.09 | | 15.84 | | 12.72 | | 7.79 | | 1.12 | | 0.95 |
Benchmarks | | | | | | | | | | | | | | | | | | | | |
Growth Balanced Composite Index1 | | | | | | | | | | 5.70 | | 13.09 | | 12.66 | | 6.95 | | | | |
S&P 500 Index2 | | | | | | | | | | 8.44 | | 16.44 | | 15.44 | | 6.57 | | | | |
Lehman Brothers U.S. Aggregate Index3 | | | | | | | | | | 2.31 | | 5.14 | | 4.13 | | 5.97 | | | | |
| * | Returns for periods of less than one year are not annualized. |
Figures quoted represent past performance, which is no guarantee of future results and do not reflect the deduction of taxes that a shareholder may pay on fund distributions or the redemption of fund shares. Investment return and principal value of an investment will fluctuate so that an investor’s shares, when redeemed, may be worth more or less than their original cost. Performance shown without sales charges would be lower if sales charges were reflected. Current performance may be lower or higher than the performance data quoted. Current month-end performance is available on the Funds’ Web site – www.wellsfargo.com/advantagefunds.
For Class A shares, the maximum front-end sales charge is 5.75%. For Class B shares, the maximum contingent deferred sales charge is 5.00%. For Class C shares, the maximum contingent deferred sales charge is 1.00%. Performance including sales charge assumes the sales charge for the corresponding time period. Administrator Class shares are sold without a front-end sales charge or contingent deferred sales charge.
Balanced funds may invest in stocks and bonds. Stock values fluctuate in response to the activities of individual companies and general market and economic conditions. Bond values fluctuate in response to the financial condition of individual issuers, general market and economic conditions, and changes in interest rates. In general, when interest rates rise, bond values fall and investors may lose principal value. The use of derivatives may reduce returns and/or increase volatility. Active trading results in increased turnover and trading expenses, and may generate higher short term capital gains. Certain investment strategies tend to increase the total risk of an investment (relative to the broader market). This fund is exposed to foreign investment risk and small company investment risk. Consult the Fund’s prospectus for additional information on these and other risks.
7 | The Fund is a gateway blended Fund that invests all of its assets in two or more master portfolios of the Master Trust in varying proportions. References to the investment activities of the Fund are intended to refer to the investment activities of the master portfolios in which it invests. Performance shown prior to the inception of the Class A, Class B and Class C shares reflects the performance of the Administrator Class shares, adjusted to reflect Class A, Class B and Class C sales charges and expenses, as applicable. |
8 | Reflects the gross expense ratio as stated in the February 1, 2007, prospectus and is based on the Fund’s previous fiscal year expenses as reported in the Financial Highlights. |
9 | The investment adviser has committed through January 31, 2009, to waive fees and/or reimburse expenses to the extent necessary to maintain the net operating expense ratio shown. Without these reductions, the Fund’s returns would have been lower. |
F-10
Wells Fargo Advantage Moderate Balanced Fund
INVESTMENT OBJECTIVE
The Wells Fargo Advantage Moderate Balanced Fund (the Fund) seeks total return, consisting of current income and capital appreciation.
| | |
INVESTMENT ADVISER Wells Fargo Funds Management, LLC SUBADVISER Wells Capital Management Incorporated MASTER PORTFOLIO SUBADVISERS Artisan Partners Limited Partnership Cadence Capital Management Cooke & Bieler, L.P. Galliard Capital Management, Inc. LSV Asset Management New Star Institutional Managers Limited Peregrine Capital Management, Inc. Smith Asset Management Group, L.P. SSgA Funds Management Systematic Financial Management, L.P. Wells Capital Management Incorporated | | PORTFOLIO MANAGERS Doug Beath Thomas C. Biwer, CFA Galen G. Blomster, CFA Christian L. Chan, CFA Jeffrey P. Mellas Andrew Owen, CFA FUND INCEPTION April 30, 1989 |
PERFORMANCE SUMMARY
12-MONTH TOTAL RETURN AS OF SEPTEMBER 30, 2007
(EXCLUDING SALES CHARGES)
| | | |
Moderate Balanced Fund | | 1-Year | |
Class A | | 11.33 | % |
Benchmark | | | |
Growth Balanced Allocation Composite Index1 | | 10.07 | % |
S&P 500 Index2 | | 16.44 | % |
Lehman Brothers U.S. Aggregate Index3 | | 5.14 | % |
Figures quoted represent past performance, which is no guarantee of future results and do not reflect the deduction of taxes that a shareholder may pay on fund distributions or the redemption of fund shares. Investment return and principal value of an investment will fluctuate so that an investor’s shares, when redeemed, may be worth more or less than their original cost. Performance shown without sales charges would be lower if sales charges were reflected. Current performance may be lower or higher than the performance data quoted. Current month-end performance is available on the Funds’ Web site – www.wellsfargo.com/advantagefunds.
F-11
Wells Fargo Advantage Moderate Balanced Fund (continued)
For Class A shares, the maximum front-end sales charge is 5.75%. Performance including sales charge assumes the sales charge for the corresponding time period. Net and gross expense ratios for Class A shares are 1.15% and 1.27%. The investment adviser has contractually committed through January 31, 2009, to waive fees and/or reimburse expenses to the extent necessary to maintain this net operating expense ratio. Without these reductions, the Fund’s returns would have been lower.
GROWTH OF $10,000 INVESTMENTS4
(AS OF SEPTEMBER 30, 2007)
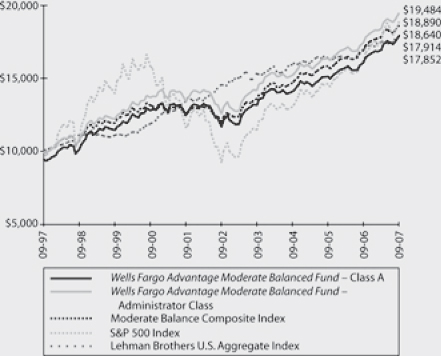
1 | The Moderate Balanced Allocation Composite Index is weighted 45% in the Lehman Brothers U.S. Aggregate Bond Index, 15% in the Lehman Brothers 9-12 Month U.S. Treasury Bond Index, 10% in the Russell 1000® Value Index, 10% in the S&P 500 Index, 10% in the Russell 1000® Growth, 6% in the Morgan Stanley Capital International Europe, Australasia and Far East (“MSCI EAFE”) Index, and 4% in the Russell 2000® Index. The Lehman Brothers 9-12 Month U.S. Treasury Bond Index is an unmanaged index that includes aged U.S. Treasury bills, notes and bonds with a remaining maturity from 1 up to (but not including) 12 months. It excludes zero coupon strips. The Russell 1000® Value Index measures the performance of those Russell 1000 companies with lower price-to-book ratios and lower forecasted growth values. The Russell 1000® Growth Index measures the performance of those Russell 1000 companies with higher price-to book ratios and higher forecasted growth values. The MSCI EAFE Index is an unmanaged group of securities widely regarded by investors to be representations of the stock markets of Europe, Australasia and the Far East. The Russell 2000® Index measures the performance of the 2,000 smallest companies in the Russell 3000® Index, which represents approximately 8% of the total market capitalization of the Russell 3000® Index. You cannot invest directly in an Index. |
F-12
Wells Fargo Advantage Moderate Balanced Fund (continued)
MANAGER’S DISCUSSION
| • | | The Fund’s solid performance outpaced its composite benchmark. |
| • | | Stocks outperformed bonds during the period, and the Fund’s emphasis on stocks significantly added to Fund performance. |
| • | | The bond market had respectable gains, despite trouble from subprime mortgages. |
Even with the slowdown in housing, the U.S. economy was resilient and corporate profits grew at a healthy pace.
The Fund emphasized stocks throughout most of the 12-month period, and this benefited the performance of the portfolio as stocks significantly outperformed bonds. Performance was strong across all equity styles and classes, with each major stock category producing double-digit returns. International stocks continued to lead all equity classes, but after several years of underperforming, large cap stocks and growth stocks outperformed their small cap and value counterparts. Continuing problems in the U.S. subprime housing market caused extreme market volatility during the last quarter of the period. Stocks subsequently rallied in the final month after the Fed cut short-term rates by a higher-than-expected 50 basis points.
The bond market showed respectable gains during the 12-month period, despite its underperformance compared to stocks. Problems with subprime mortgages spread to the broader fixed-income markets during the final quarter that ended in September. Although subsequent Fed easing reassured the overall bond market, inflation fears were evident in other markets, including higher commodity prices and continued dollar weakness.
TEN LARGEST HOLDINGS5,6
AS OF SEPTEMBER 30, 2007)
| | | |
FHLMC, 6.50%, 02/25/2042 | | 0.91 | % |
Exxon Mobil Corporation | | 0.82 | % |
Microsoft Corporation | | 0.79 | % |
Goldman Sachs Group Incorporated | | 0.77 | % |
Cisco Systems Incorporated | | 0.68 | % |
GNMA, 7.06%, 08/16/2042 | | 0.62 | % |
FNMA, 5.50%, 04/25/2035 | | 0.61 | % |
US Treasury Bond, 6.25%, 08/15/2023 | | 0.59 | % |
American International Group Incorporated | | 0.59 | % |
eBay Incorporated | | 0.57 | % |
F-13
Wells Fargo Advantage Moderate Balanced Fund (continued)
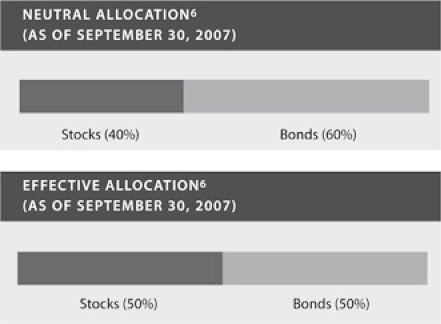
With the most recent shift toward stocks, the portfolio maintained a long position in the S&P 500 Index futures and was short in the long-term U.S. Treasury bond futures.
The Tactical Asset Allocation (TAA) Model, which seeks to enhance portfolio returns by shifting assets between stocks and bonds, maintained a 10% shift toward stocks until the quarter that ended in June, when it shifted toward neutral. During the final quarter that ended in September, the TAA Model again employed a 10% shift toward stocks. To implement an overweight in stocks, the Fund has employed a hedged futures overlay transaction, thus keeping the portfolio’s underlying assets near their long-term strategic allocation of 40% stocks and 60% bonds. With the futures overlay, the Fund had an effective target allocation of 50% stocks and 50% bonds at the end of the period.
The TAA Model indicates that stocks remain attractive relative to bonds.
With stocks significantly outperforming long Treasury bonds, the 10% TAA Model shift toward stocks during most of the 12-month period improved the performance of the Fund. While stocks have outperformed the broad bond market, the TAA Model indicates that stocks remain attractive relative to bonds. As a result, the Fund will keep its overweighted position in stocks until the relative valuation between stocks and bonds returns to a more normal level.
2 | The S&P 500 Index consists of 500 stocks chosen for market size, liquidity, and industry group representation. It is a market value weighted index with each stock’s weight in the Index proportionate to its market value. You cannot invest directly in an Index. |
3 | The Lehman Brothers U.S. Aggregate Index includes bonds from the Treasury, government-related, corporate, agency, mortgage-backed securities, and asset-backed securities sectors. You cannot invest directly in an Index. |
4 | The chart compares the performance of the Wells Fargo Advantage Moderate Balanced Fund Class A and Administrator Class shares for the most recent ten years with the Moderate Balanced Composite Index, the S&P 500 Index and the Lehman Brothers U.S. Aggregate Index. The chart assumes a hypothetical $10,000 investment in Class A and Administrator Class shares and reflects all operating expenses and, for Class A shares, assumes the maximum initial sales charge of 5.75%. |
F-14
Wells Fargo Advantage Moderate Balanced Fund (continued)
5 | The ten largest holdings are calculated based on the market value of the Master Trust portfolio securities allocable to the Fund divided by the total market value of the portfolio of investments of the Fund. See Notes to the Financial Statements for a discussion of the Master Trust. |
6 | Portfolio holdings and allocations are subject to change. Cash and cash equivalents are not reflected in the calculations of portfolio holdings and allocations. |
AVERAGE ANNUAL TOTAL RETURN7 (%) (AS OF SEPTEMBER 30, 2007)
| | | | | | | | | | | | | | | | | | | | | |
| | | Including Sales Charge | | Excluding Sales Charge | | Expense
Ratio |
| | | 6-Month* | | | 1-Year | | 5-Year | | 10-Year | | 6-Month* | | 1-Year | | 5-Year | | 10-Year | | Gross8 | | Net9 |
Class A (WFMAX) | | (0.37 | ) | | 4.93 | | 7.64 | | 6.00 | | 5.71 | | 11.33 | | 8.92 | | 6.63 | | 1.27 | | 1.15 |
Class B (WMOBX) | | 0.33 | | | 5.49 | | 7.82 | | 5.85 | | 5.33 | | 10.49 | | 8.11 | | 5.85 | | 2.02 | | 1.90 |
Class C (WFBCX) | | 4.33 | | | 9.49 | | 8.11 | | 5.84 | | 5.33 | | 10.49 | | 8.11 | | 5.84 | | 2.02 | | 1.90 |
Administrator Class (NVMBX) | | | | | | | | | | | 5.87 | | 11.59 | | 9.19 | | 6.90 | | 1.09 | | 0.90 |
Benchmarks | | | | | | | | | | | | | | | | | | | | | |
Moderate Balanced Composite Index1 | | | | | | | | | | | 4.53 | | 10.07 | | 9.16 | | 6.43 | | | | |
S&P 500 Index2 | | | | | | | | | | | 8.44 | | 16.44 | | 15.44 | | 6.57 | | | | |
Lehman Brothers U.S. Aggregate Index3 | | | | | | | | | | | 2.31 | | 5.14 | | 4.13 | | 5.97 | | | | |
| * | Returns for periods of less than one year are not annualized. |
Figures quoted represent past performance, which is no guarantee of future results and do not reflect the deduction of taxes that a shareholder may pay on fund distributions or the redemption of fund shares. Investment return and principal value of an investment will fluctuate so that an investor’s shares, when redeemed, may be worth more or less than their original cost. Performance shown without sales charges would be lower if sales charges were reflected. Current performance may be lower or higher than the performance data quoted. Current month-end performance is available on the Funds’ Web site – www.wellsfargo.com/advantagefunds.
For Class A shares, the maximum front-end sales charge is 5.75%. For Class B shares, the maximum contingent deferred sales charge is 5.00%. For Class C shares, the maximum contingent deferred sales charge is 1.00%. Performance including sales charge assumes the sales charge for the corresponding time period. Administrator Class shares are sold without a front-end sales charge or contingent deferred sales charge.
Balanced funds may invest in stocks and bonds. Stock values fluctuate in response to the activities of individual companies and general market and economic conditions. Bond values fluctuate in response to the financial condition of individual issuers, general market and economic conditions, and changes in interest rates. In general, when interest rates rise, bond values fall and investors may lose principal value. The use of derivatives may reduce returns and/or increase volatility. Certain investment strategies tend to increase the total risk of an investment (relative to the broader market). This fund is exposed to foreign investment risk. Consult the Fund’s prospectus for additional information on these and other risks.
7 | The Fund is a gateway blended Fund that invests all of its assets in two or more master portfolios of the Master Trust in varying proportions. References to the investment activities of the Fund are intended to refer to the investment activities of the master portfolios in which it invests. Performance shown prior to the inception of the Class A, Class B and Class C shares reflects the performance of the Administrator Class shares, adjusted to reflect Class A, Class B and Class C sales charges and expenses, as applicable. Prior to April 11, 2005, the Administrator Class was named the Institutional Class. |
F-15
Wells Fargo Advantage Moderate Balanced Fund (continued)
8 | Reflects the gross expense ratio as stated in the February 1, 2007, prospectus and is based on the Fund’s previous fiscal year expenses as reported in the Financial Highlights. |
9 | The investment adviser has committed through January 31, 2009, to waive fees and/or reimburse expenses to the extent necessary to maintain the net operating expense ratio shown. Without these reductions, the Fund’s returns would have been lower. |
F-16
EXHIBIT G – FORM OF AGREEMENT AND PLAN OF REORGANIZATION
(Life Stage Portfolios)
WELLS FARGO FUNDS TRUST
Dated as of [Date]
This AGREEMENT AND PLAN OF REORGANIZATION (the “Plan”) is made as of this [Date], by Wells Fargo Funds Trust (“Funds Trust”), a Delaware statutory trust, for itself and on behalf of each Acquiring Fund and each Target Fund, as indicated in the chart below.
| | |
Target Fund | | Acquiring Fund |
Life Stage – Conservative Portfolio Investor Class | | Moderate Balanced Fund Administrator Class |
Life Stage – Moderate Portfolio Investor Class | | Growth Balanced Fund Administrator Class |
Life Stage – Aggressive Portfolio Investor Class | | Aggressive Allocation Fund Administrator Class |
WHEREAS, Funds Trust is an open-end management investment company registered with the Securities and Exchange Commission (the “SEC”) under the Investment Company Act of 1940, as amended (the “1940 Act”);
WHEREAS, the parties desire that each Acquiring Fund acquire the assets and assume the liabilities of the corresponding Target Fund in exchange for shares of equal value of the Acquiring Fund and the distribution of the shares of the Acquiring Fund to the shareholders of the Target Fund in connection with the liquidation and termination of the Target Fund (the “Reorganization”); and
WHEREAS, the parties intend that the transactions contemplated hereunder with respect to each Acquiring Fund and its corresponding Target Fund will be treated as a taxable purchase and sale of the assets of such Target Fund and not as a “reorganization” under Section 368(a) of the Internal Revenue Code of 1986, as amended (the “Code”) “(Taxable Acquisition”)
NOW, THEREFORE, in accordance with the mutual promises described herein, the parties agree as follows:
The following terms shall have the following meanings:
| | |
1933 Act | | The Securities Act of 1933, as amended. |
| |
1934 Act | | The Securities Exchange Act of 1934, as amended. |
| |
Acquiring Class | | The class of the Acquiring Fund’s shares that Funds Trust will issue to the shareholders of the Target Fund Class, as set forth above. |
| |
Acquiring Fund Financial Statements | | The audited financial statements of the Acquiring Fund for its most recently completed fiscal year and the unaudited financial statements of the Acquiring Fund for its most recently completed semi-annual period. |
| |
Assets | | All property and assets of any kind and all interests, rights, privileges and powers of or attributable to a Fund, whether or not determinable at the appropriate Effective Time and wherever located. Assets include all cash, cash equivalents, securities, claims (whether absolute or contingent, Known or unknown, accrued or unaccrued or conditional or unmatured), contract rights and receivables (including dividend and interest receivables) owned by a Fund and any deferred or prepaid expense shown as an asset on such Fund’s books. |
G-1
| | |
Board | | The Board of Trustees of Funds Trust. |
| |
Closing Date | | [Date], or such other date as the parties may agree to in writing with respect to the Reorganization. |
| |
Corresponding Target Class | | The Target share class set forth opposite an Acquiring Class in the chart on the first page of this Plan. |
| |
Effective Time | | 9:00 a.m. Eastern Time on the first business day following the Closing Date of the Reorganization, or such other time and date as the parties may agree to in writing. |
| |
Fund | | The Acquiring Fund or the Target Fund. |
| |
Know, Known or Knowledge | | Known after reasonable inquiry. |
| |
Liabilities | | All liabilities of, allocated or attributable to, a Fund, whether Known or unknown, accrued or unaccrued, absolute or contingent or conditional or unmatured. |
| |
Material Agreements | | The agreements set forth in Schedule A, as it may be amended from time to time. |
| |
Reorganization Documents | | Such bills of sale, assignments, and other instruments of transfer as Funds Trust deems desirable for the Target Fund to transfer to the Acquiring Fund all rights and title to and interest in the Target Fund’s Assets and Liabilities and for the Acquiring Fund to assume the Target Fund’s Assets and Liabilities. |
| |
Schedule A | | Schedule A to this Plan, as may be amended from time to time. |
| |
Target Financial Statements | | The audited financial statements of the Target Fund for its most recently completed fiscal year and the unaudited financial statements of the Target Fund for its most recently completed semi-annual period. |
| |
Valuation Time | | The time on the Reorganization’s Closing Date, the business day immediately preceding the Closing Date if the Closing Date is not a business day or such other time as the parties may agree to in writing, that Funds Trust determines the net asset value of the shares of the Acquiring Fund and determines the value of the Assets of or attributable to the Target Fund, net of known Liabilities. Unless otherwise agreed to in writing, the Valuation Time of a Reorganization shall be the time of day then set forth in the Acquiring Fund’s and Target Fund’s Registration Statement on Form N-1A as the time of day at which net asset value is calculated. |
| | 2. | Regulatory Filings. Funds Trust shall prepare and file any required filings including, without limitation, filings with state or foreign securities regulatory authorities. |
| | 3. | Transfer of Target Fund Assets. Funds Trust shall take the following steps with respect to the Reorganization: |
| | (a) | Within a reasonable time prior to the Closing Date, the Target Fund shall liquidate all its holdings. |
| | (b) | On the Closing Date, the Target Fund shall transfer its Assets to the Acquiring Fund. |
| | (c) | At the Effective Time, Funds Trust shall assign, transfer, deliver and convey all of the Target Fund’s Assets to the Acquiring Fund on the bases described in Subsection 3(d) of this Plan. Funds Trust shall accept the Target Fund’s Assets and assume the Target Fund’s Liabilities such that at and after the Effective Time (i) all of the Target Fund’s Assets at or after the Effective Time shall |
G-2
| | become and be the Assets of the Acquiring Fund and (ii) all of the Target Fund’s Liabilities at the Effective Time shall attach to the Acquiring Fund, and be enforceable against the Acquiring Fund to the same extent as if initially incurred by the Acquiring Fund. |
| | (d) | Funds Trust shall assign, transfer, deliver and convey the Target Fund’s Assets to the Acquiring Fund at the Reorganization’s Effective Time on the following bases: |
| | (1) | In exchange for the transfer of the Assets, Funds Trust shall simultaneously issue and deliver to the Target Fund full and fractional shares of beneficial interest of each Acquiring Class. Funds Trust shall determine the number of shares of each Acquiring Class to issue by dividing the value of the Assets net of Known Liabilities attributable to the Corresponding Target Class by the net asset value of one Acquiring Class share. Based on this calculation, Funds Trust shall issue shares of beneficial interest of each Acquiring Class with an aggregate net asset value equal to the value of the Assets net of Known Liabilities of the Corresponding Target Class. |
| | (2) | The parties shall determine the net asset value of the Acquiring Fund shares to be delivered, and the value of the Assets to be conveyed net of Known Liabilities, as of the Valuation Time substantially in accordance with Funds Trust current valuation procedures. The parties shall make all computations to the fourth decimal place or such other decimal place as the parties may agree to in writing. |
| | (3) | Funds Trust shall cause its custodian to transfer the Target Fund’s Assets with good and marketable title to the account of the Acquiring Fund. Funds Trust shall cause its custodian to transfer all cash in the form of immediately available funds. Funds Trust shall cause its custodian to transfer any Assets that were not transferred to the Acquiring Fund’s account at the Effective Time to the Acquiring Fund’s account at the earliest practicable date thereafter. |
| | 4. | Liquidation and Termination of Target Fund and Registration of Shares. Funds Trust also shall take the following steps for the Reorganization: |
| | (a) | At or as soon as reasonably practicable after the Effective Time, Funds Trust shall dissolve and liquidate the Target Fund, and terminate the Target Fund as an authorized series of Funds Trust, in accordance with applicable law and its Declaration of Trust by transferring to shareholders of record of each Corresponding Target Class full and fractional shares of beneficial interest of the Acquiring Class equal in value to the shares of the Corresponding Target Class held by the shareholder. Each shareholder also shall have the right to receive any unpaid dividends or other distributions that Funds Trust declared with respect to the shareholder’s Corresponding Target Class shares before the Effective Time. Funds Trust shall record on its books the ownership by the shareholders of the Acquiring Fund shares; Funds Trust shall simultaneously redeem and cancel on its books all of the issued and outstanding shares of each Corresponding Target Class. Funds Trust does not issue certificates representing Fund shares, and shall not be responsible for issuing certificates to shareholders of the Target Funds. Funds Trust shall wind up the affairs of the Target Fund. |
| | (b) | If a former Target Fund shareholder requests a change in the registration of the shareholder’s Acquiring Fund shares to a person other than the shareholder, Funds Trust shall require the shareholder to (i) furnish Funds Trust an instrument of transfer properly endorsed, accompanied by any required signature guarantees and otherwise in proper form for transfer; and (ii) pay to the Acquiring Fund any transfer or other taxes required by reason of such registration or establish to the reasonable satisfaction of Funds Trust that such tax has been paid or does not apply. |
| | 5. | Representations, Warranties and Agreements of Funds Trust. Funds Trust, on behalf of itself, and, as appropriate, the Target Fund and the Acquiring Fund, represents and warrants to, and agrees with, the Acquiring Fund and the Target Fund, respectively as follows: |
| | (a) | Funds Trust is a statutory trust duly created, validly existing and in good standing under the laws of the State of Delaware. The Board duly established and designated each Fund as a series of |
G-3
| | Funds Trust and each Acquiring Class as a class of the Acquiring Fund. Funds Trust is an open-end management investment company registered with the SEC under the 1940 Act. |
| | (b) | Funds Trust has the power and all necessary federal, state and local qualifications and authorizations to own all of its properties and Assets, to carry on its business as described in its Registration Statement on Form N-1A as filed with the SEC, to enter into this Plan and to consummate the transactions contemplated herein. |
| | (c) | The Board has duly authorized execution and delivery of the Plan and the transactions contemplated herein, subject to Target Fund shareholder approvals. Duly authorized officers of Funds Trust have executed and delivered the Plan. The Plan represents a valid and binding contract, enforceable in accordance with its terms, subject as to enforcement to bankruptcy, insolvency, reorganization, arrangement, moratorium and other similar laws of general applicability relating to or affecting creditors’ rights and to general equity principles. The execution and delivery of this Plan does not, and the consummation of the transactions contemplated by this Plan will not, violate the Declaration of Trust of Funds Trust or any Material Agreement. Funds Trust does not need to take any other action to authorize its officers to effectuate the Plan and the transactions contemplated herein. |
| | (d) | Each Fund has qualified as a “regulated investment company” under Part I of Subchapter M of Subtitle A, Chapter 1, of the Code in respect of each taxable year since the commencement of its operations, and will continue to so qualify until the Effective Time. |
| | (e) | Funds Trust has duly authorized the Acquiring Fund shares to be issued and delivered to the Target Fund as of the Target Fund’s Effective Time. When issued and delivered, the Acquiring Fund shares shall have been registered for sale under the 1933 Act and shall be duly and validly issued, fully paid and non-assessable, and no shareholder of the Acquiring Fund shall have any preemptive right of subscription or purchase in respect of them. There are no outstanding options, warrants or other rights to subscribe for or purchase any Acquiring Fund shares, nor are there any securities convertible into Acquiring Fund shares. |
| | (f) | Each Fund is in compliance in all material respects with all applicable laws, rules and regulations, including, without limitation, the 1940 Act, the 1933 Act, the 1934 Act and all applicable state securities laws. Each Fund is in compliance in all material respects with the investment policies and restrictions applicable to it set forth in the Form N-1A Registration Statement currently in effect. The value of the Assets net of Known Liabilities of the Acquiring Fund has been determined using portfolio valuation methods that comply in all material respects with the requirements of the 1940 Act and the policies of such Acquiring Fund. |
| | (g) | Funds Trust does not Know of any claims, actions, suits, investigations or proceedings of any type pending or threatened against Funds Trust or any Fund or its Assets or businesses. There are no facts that Funds Trust currently has reason to believe are likely to form the basis for the institution of any such claim, action, suit, investigation or proceeding against Funds Trust or any Fund. For purposes of this provision, investment underperformance or negative investment performance shall not be deemed to constitute such facts, provided all required performance disclosures have been made. Neither Funds Trust nor any Fund is a party to or subject to the provisions of any order, decree or judgment of any court or governmental body that adversely affects, or is reasonably likely to adversely affect, its financial condition, results of operations, business, properties or Assets or its ability to consummate the transactions contemplated by this Plan. |
| | (h) | Funds Trust is not a party to any contracts, agreements, franchises, licenses or permits relating to the Funds except those entered into or granted in the ordinary course of its business, in each case under which no material default exists. All contracts and agreements that are material to the business of the Funds are listed on Schedule A. Funds Trust is not a party to or subject to any employee benefit plan, lease or franchise of any kind or nature whatsoever on behalf of any Fund. |
G-4
| | (i) | Funds Trust has timely filed all tax returns, for the Funds for all of their taxable years to and including their most recent taxable year required to be filed on or before the date of this Plan, and has paid all taxes payable pursuant to such returns. To the Knowledge of Funds Trust, no such tax return has been or is currently under audit and no assessment has been asserted with respect to any return. Funds Trust will file all of the Fund’s tax returns for all of their taxable periods ending on or before the Closing Date not previously filed on or before their due dates (taking account of any valid extensions thereof). |
| | (j) | Since the date of the Target Fund Financial Statements and the Acquiring Fund Financial Statements, there has been no material adverse change in the financial condition, business, properties or Assets of the Target Fund or Acquiring Fund, respectively. For purposes of this provision, investment underperformance, negative investment performance or net redemptions shall not be deemed to constitute such facts, provided all customary performance disclosures have been made. |
| | (k) | The Target Fund Financial Statements and the Acquiring Fund Financial Statements, fairly present the financial position of the Acquiring Fund as of the Fund’s most recent fiscal year-end and the results of the Fund’s operations and changes in the Fund’s net assets for the periods indicated. The Target Fund Financial Statements and the Acquiring Fund Financial Statements have been prepared in accordance with generally accepted accounting principles consistently applied. |
| | (l) | To the Knowledge of Funds Trust, neither the Target Fund nor the Acquiring Fund has any Liabilities, whether or not determined or determinable, other than Liabilities disclosed or provided for in the Target Fund Financial Statements and the Acquiring Fund Financial Statements, respectively, or Liabilities incurred in the ordinary course of business. |
| | (m) | Except as otherwise provided herein, Funds Trust shall operate the business of each Fund in the ordinary course between the date hereof and the Effective Time, it being agreed that such ordinary course of business will include the declaration and payment of dividends and distributions approved by the Board in anticipation of the Reorganization. |
| | 6. | Conditions to Funds Trust Obligations. The obligations of Funds Trust with respect to the Reorganization shall be subject to the following conditions precedent: |
| | (a) | The Target Fund shall have obtained the approval of this Plan and the transactions contemplated herein by the vote of a “majority of the outstanding voting securities” (as defined in the 1940 Act) of the Target Fund. |
| | (b) | Funds Trust shall have duly executed and delivered the Target Fund Reorganization Documents. |
| | (c) | All representations and warranties of Funds Trust made in this Plan that apply to the Reorganization shall be true and correct in all material respects as if made at and as of the Valuation Time and the Effective Time. |
| | (d) | Funds Trust, on behalf of itself and, as appropriate, the Target Fund and the Acquiring Fund, shall have delivered to the Acquiring Fund and the Target Fund, respectively, a certificate dated as of the Closing Date and executed in its name by its Treasurer or Secretary stating that the representations and warranties of Funds Trust in this Plan that apply to the Reorganization are true and correct at and as of the Valuation Time. |
| | (e) | No action, suit or other proceeding shall be threatened or pending before any court or governmental agency in which it is sought to restrain or prohibit or obtain damages or other relief in connection with the Reorganization. |
| | (f) | The SEC shall not have issued any unfavorable advisory report under Section 25(b) of the 1940 Act nor instituted any proceeding seeking to enjoin consummation of the Reorganization under Section 25(c) of the 1940 Act. |
G-5
| | (g) | Funds Trust shall have performed and complied in all material respects with each of its agreements and covenants required by this Plan to be performed or complied with by it prior to or at the Reorganization’s Valuation Time and Effective Time. |
| | (h) | Except to the extent prohibited by Rule 19b-1 under the 1940 Act, prior to the Valuation Time, the Target Fund shall have declared a dividend or dividends, with a record date and ex-dividend date prior to the Valuation Time, which, together with all previous dividends, shall have the effect of distributing to the Target Fund shareholders all of its previously undistributed (i) “investment company taxable income” within the meaning of Section 852(b) of the Code (determined without regard to Section 852(b)(2)(D) of the Code, (ii) amounts equal to, in the aggregate, the excess of (A) the amount specified in Section 852(a)(1)(B)(i) of the Code over (B) the amount specified in Section 852(a)(1)(B)(ii) of the Code, and (iii) net capital gain (within the meaning of Section 1222(11) of the Code), if any, realized in taxable periods or years ending on or before the Effective Time. |
| | (i) | Funds Trust shall have received an opinion dated as of the Closing Date in a form reasonably satisfactory to it of Proskauer Rose LLP, upon which each Fund and its shareholders may rely, based upon representations reasonably acceptable to Proskauer Rose LLP made in certificates provided by Funds Trust, on behalf of itself and each Fund, the Funds’ affiliates and/or principal shareholders to Proskauer Rose LLP, substantially to the effect that the Reorganization with respect to each Acquiring Fund and its corresponding Target Fund will be a Taxable Acquisition. |
| | (j) | The Board of Funds Trust shall not have terminated this Plan with respect to the Reorganization pursuant to Section 8 of this Plan. |
| | 7. | Survival of Representations and Warranties. The representations and warranties of Funds Trust shall survive the completion of the transactions contemplated herein. |
| | 8. | Termination of Plan. The Board may terminate this Plan with respect to the Acquiring Fund or Target Fund, as appropriate, by majority vote if: (i) the conditions precedent set forth in Section 6, are not satisfied on the Closing Date; or (ii) it becomes reasonably apparent to the Board that such conditions precedent will not be satisfied on the Closing Date. |
| | 9. | Governing Law. This Plan and the transactions contemplated hereby shall be governed, construed and enforced in accordance with the laws of the State of Delaware, except to the extent preempted by federal law, without regard to conflicts of law principles. |
| | 10. | Tax Matters. Notwithstanding anything in this Agreement to the contrary, Funds Trust, on behalf of each Fund, shall: (a) complete all measures prior to the Effective Time to ensure that the Reorganization as to each Acquiring Fund and its corresponding Target Fund is a Taxable Acquisition; and (b) take all other appropriate action necessary to ensure satisfaction of representations in certificates to be provided to Proskauer Rose LLP in connection with their opinion described in Section 6(i) and receipt of such opinion, regardless of whether any measures or actions described in this Section 10 are in the ordinary course. In accordance with the foregoing, the terms of this Agreement shall be modified to ensure compliance with the preceding sentence, including, but not limited to, delivery by Funds Trust, on behalf of each Acquiring Fund, of an agreed amount of cash (in lieu of an equal amount of shares of the corresponding Acquiring Class) as partial consideration for the assets of the corresponding Target Fund, the acquisition of securities prior to the Effective Time and settlement thereof after the Effective Time and/or the assumption of less than all of the corresponding Target Fund’s Liabilities by such Acquiring Fund. |
| | 10. | Expenses. Funds Trust shall cause the expenses of the Reorganization to be borne by Wells Fargo Funds Management, LLC. |
G-6
| | 11. | Amendments. Funds Trust may, by agreement in writing authorized by the Board, amend this Plan with respect to the Reorganization at any time before or after the Target Fund’s shareholders approve the Reorganization. After a Target Fund’s shareholders approve a Reorganization, however, Funds Trust may not amend this Plan in a manner that materially adversely affects the interests of the Target Fund’s shareholders with respect to that Reorganization. This Section shall not preclude Funds Trust from changing the Closing Date or the Effective Time of a Reorganization. |
| | 12. | Waivers. At any time prior to the Closing Date, Funds Trust may by written instrument signed by it (i) waive the effect of any inaccuracies in the representations and warranties made to it contained herein and (ii) waive compliance with any of the agreements, covenants or conditions made for its benefit contained herein. Funds Trust agrees that any waiver shall apply only to the particular inaccuracy or requirement for compliance waived, and not any other or future inaccuracy or lack of compliance. |
| | 13. | Limitation on Liabilities. The obligations of Funds Trust and each Fund shall not bind any of the Trustees, shareholders, nominees, officers, agents, or employees of Funds Trust personally, but shall bind only the Assets and property of the particular Fund. The execution and delivery of this Plan by the officers of Funds Trust shall not be deemed to have been made by any of them individually or to impose any liability on any of them personally, but shall bind only the Assets and the property of the Acquiring Fund or the Target Fund, as appropriate. |
| | 14. | General. This Plan supersedes all prior agreements between the parties (written or oral), is intended as a complete and exclusive statement of the terms of the agreement between the parties and may not be changed or terminated orally. The headings contained in this Plan are for reference only and shall not affect in any way the meaning or interpretation of this Plan. Nothing in this Plan, expressed or implied, confers upon any other person any rights or remedies under or by reason of this Plan. Neither party may assign or transfer any right or obligation under this Plan without the written consent of the other party. |
IN WITNESS WHEREOF, the parties hereto have caused their duly authorized officers designated below to execute this Plan as of the date first written above.
| | | | | | |
| | | | | | WELLS FARGO FUNDS TRUST for itself and on behalf of the Target Funds and on behalf of the Acquiring Funds |
ATTEST: | | | | | | |
| | | |
| | | | | By: | | |
| Name: C. David Messman | | | | | | Name: Karla M. Rabusch |
| Title: Secretary | | | | | | Title: President |
G-7
SCHEDULE A
MATERIAL AGREEMENTS
The following agreements shall be Material Agreements:
Amended and Restated Investment Advisory Agreement between Wells Fargo Funds Management, LLC (“Wells Fargo Funds Management”) and Wells Fargo Funds Trust, dated August 6, 2003, and amended October 1, 2005, with Schedule A amended November 7, 2007.
Investment Sub-Advisory Agreement among Wells Fargo Master Trust, Wells Fargo Funds Management, and Artisan Partners Limited Partnership, dated October 6, 2004 and Appendix B dated November 8, 2005.
Investment Sub-Advisory Agreement among Wells Fargo Master Trust, Wells Fargo Funds Management, and Cadence Capital Management, dated August 31, 2005.
Investment Sub-Advisory Agreement among Wells Fargo Master Trust, Wells Fargo Funds Management, and Cooke & Bieler, L.P., dated December 6, 2004, with Appendix A amended October 1, 2005.
Investment Sub-Advisory Agreement among Wells Fargo Funds Trust, Wells Fargo Funds Management, and Galliard Capital Management, Inc., dated March 1, 2001, with Appendix A amended March 31, 2006 and Schedule A dated August 7, 2001.
Investment Sub-Advisory Agreement among Wells Fargo Master Trust, Wells Fargo Funds Management, and Galliard Capital Management, Inc., dated March 1, 2001; with Appendix A amended October 1, 2005 and Schedule A, dated August 7, 2001.
Investment Sub-Advisory Agreement among Wells Fargo Master Trust, Wells Fargo Funds Management, and LSV Asset Management, dated October 31, 2003, with Appendix A amended October 1, 2005.
Investment Sub-Advisory Agreement among Wells Fargo Master Trust, Wells Fargo Funds Management, and New Star Institutional Managers Limited, dated October 6, 2004, with Appendix A and Appendix B amended February 8, 2005.
Amended and Restated Investment Sub-Advisory Agreement among Wells Fargo Master Trust, Wells Fargo Funds Management, and Peregrine Capital Management, Inc., dated March 1, 2001 and amended March 31, 2006, with Schedule A amended May 9, 2007.
Investment Sub-Advisory Agreement among Wells Fargo Funds Trust, Wells Fargo Funds Management, and Smith Asset Management Group, L.P., dated May 31, 2001, with Appendix A amended October 1, 2005 and Schedule A dated November 13, 2003.
Investment Sub-Advisory Agreement among Wells Fargo Master Trust, Wells Fargo Funds Management, and Smith Asset Management Group, L.P., dated March 1, 2001, with Schedule A dated November 13, 2003.
Investment Sub-Advisory Agreement among Wells Fargo Master Trust, Wells Fargo Funds Management, and SSgA Funds Management, Inc., dated May 27, 2005, with Appendix A amended March 31, 2006.
Investment Sub-Advisory Agreement among Wells Fargo Master Trust, Wells Fargo Funds Management, and Systematic Financial Management, L.P., dated August 29, 2003, with Appendix A amended October 1, 2005.
Investment Sub-Advisory Agreement among Wells Fargo Funds Trust, Wells Fargo Funds Management, and Wells Capital Management Incorporated, dated March 1, 2001, with Appendix A and Schedule A amended March 30, 2007.
G-8
Amended and Restated Investment Sub-Advisory Agreement among Wells Fargo Master Trust, Wells Fargo Funds Management, and Wells Capital Management Incorporated, dated March 1, 2001, as amended March 31, 2006, with Appendix A amended November 8, 2006 and Schedule A amended March 30, 2007.
Distribution Agreement between Wells Fargo Funds Distributor, LLC and Wells Fargo Funds Trust, dated April 8, 2005, with Schedule I amended November 7, 2007.
Distribution Plan adopted pursuant to Rule 12b-1 under the Investment Company Act of 1940 approved by the Wells Fargo Funds Trust Board on March 26, 1999, with Appendix A amended November 9, 2007.
Rule 18f-3 Multi-Class Plan adopted by the Board of Wells Fargo Funds Trust on March 26, 1999 and most recently amended November 8, 2006, with Appendix A amended November 9, 2007 and Appendix B amended November 8, 2006.
Amended and Restated Custody Agreement between Wells Fargo Bank, N.A. and Wells Fargo Funds Trust dated August 10, 2004, with Appendix A amended November 7, 2007.
Amended and Restated Accounting Services Agreement among PFPC, Wells Fargo Funds Trust, Wells Fargo Master Trust and Wells Fargo Variable Trust dated May 10, 2006, with Exhibit A amended November 7, 2007.
Administration Agreement between Wells Fargo Funds Management and Wells Fargo Funds Trust dated March 1, 2003, with Appendix A amended November 7, 2007.
Transfer Agency and Service Agreement between Boston Financial Data Services, Inc. and Wells Fargo Funds, dated April 11, 2005, with Schedule A amended November 7, 2007.
Shareholder Servicing Plan adopted by the Board of Wells Fargo Funds Trust adopted on March 26, 1999, with Appendix A amended November 7, 2007.
Amended and Restated Fee and Expense Agreement among Wells Fargo Funds Trust, Wells Fargo Master Trust and Wells Fargo Funds Management, dated March 30, 2007, with Schedule A amended November 7, 2007.
Amended and Restated Joint Fidelity Bond Allocation Agreement among Wells Fargo Funds Trust, Wells Fargo Variable Trust and Wells Fargo Master Trust dated May 1, 2006, with Appendix A amended November 7, 2007.
Securities Lending Agency Agreement among Wells Fargo Funds Trust, Wells Fargo Master Trust, Wells Fargo Variable Trust, Wells Fargo Funds Management and Wells Fargo Bank, N.A. dated August 9, 2006, with Schedule I amended November 7, 2007.
G-9
Wells Fargo Advantage Funds (logo)
Wells Fargo Funds Management, LLC, a wholly owned subsidiary of Wells Fargo & Company, provides investment advisory and administrative services for Wells Fargo Advantage Funds. Other affiliates of Wells Fargo & Company provide subadvisory and other services for the Funds. The Funds are distributed by Wells Fargo Funds Distributor, LLC, Member FINRA/SIPC, an affiliate of Wells Fargo & Company. 109925 05-08
NOT FDIC INSURED • NO BANK GUARANTEE • MAY LOSE VALUE
© 2008 Wells Fargo Funds Management, LLC. All rights reserved.
www.wellsfargo.com/advantagefunds
PART B
STATEMENT OF ADDITIONAL INFORMATION
May [ ], 2008
WELLS FARGO FUNDS TRUST
BALANCED FUND
CORPORATE BOND FUND
HIGH YIELD BOND FUND
INTERMEDIATE GOVERNMENT INCOME FUND
NATIONAL LIMITED-TERM TAX-FREE FUND
NATIONAL TAX-FREE FUND
OVERSEAS FUND
VALUE FUND
525 MARKET STREET
SAN FRANCISCO, CA 94105
June 30, 2008 Special Meeting of the Shareholders
This Statement of Additional Information or SAI is not a prospectus but should be read in conjunction with the Combined Prospectus/Proxy Statement dated May [ ], 2008, which we refer to as the Prospectus/Proxy Statement, for the Special Meeting of Shareholders of the eight Wells Fargo Advantage Funds listed above, which we call the Target Funds to be held on Monday, June 30, 2008. The Prospectus/Proxy Statement may be obtained without charge by calling 1-800-222-8222 or writing to Wells Fargo Advantage Funds, P.O. Box 8266, Boston, MA 02266-8266. Unless otherwise indicated, capitalized terms used herein and not otherwise defined have the same meanings as are given to them in the Prospectus/Proxy Statement.
INCORPORATION OF DOCUMENTS BY REFERENCE
IN STATEMENT OF ADDITIONAL INFORMATION
This SAI consists of this cover page and the following described items, which are hereby incorporated by reference:
| | 1. | The SAI dated February 1, 2008 for the Wells Fargo Advantage Asset Allocation Fund and Wells Fargo Advantage Balanced Fund. Report of the Independent Auditors and audited annual report financial statements of the Wells Fargo Advantage Asset Allocation Fund and Wells Fargo Advantage Balanced Fund, contained in the Annual Report for the fiscal year ended September 30, 2007, as filed with the SEC on December 5, 2007. Unaudited financial report statements of the Wells Fargo Advantage Asset Allocation Fund and Wells Fargo Advantage Balanced Fund, dated as of March 31, 2007. |
| | 2. | The SAI dated March 31, 2008 for the Wells Fargo Advantage Corporate Bond Fund, Wells Fargo Advantage Government Securities Fund, Wells Fargo Advantage High Income Fund, Wells Fargo Advantage High Yield Bond Fund, Wells Fargo Advantage Income Plus Fund and Wells Fargo Advantage Intermediate Government Income Fund. Report of the Independent Auditors and audited annual report financial statements of the Wells Fargo Advantage Corporate Bond Fund, Wells Fargo Advantage Government Securities Fund, Wells Fargo Advantage High Income Fund, Wells Fargo Advantage High Yield Bond Fund, Wells Fargo Advantage Income Plus Fund and Wells Fargo Advantage Intermediate Government Income Fund, contained in the Annual Report for the fiscal year ended May 31, 2007, as filed with the SEC on August 6, 2007. Unaudited financial report statements of the Wells Fargo Advantage Corporate Bond Fund, Wells Fargo Advantage Government Securities Fund, Wells Fargo Advantage High Income Fund, Wells Fargo Advantage High Yield Bond Fund, Wells Fargo Advantage Income Plus Fund and Wells Fargo Advantage Intermediate Government Income Fund, dated as of November 30, 2007. |
| | 3. | The SAI dated March 31, 2008 for the Wells Fargo Advantage Municipal Bond Fund, Wells Fargo Advantage National Limited-Term Tax-Free Fund, Wells Fargo Advantage National Tax-Free Fund and Wells Fargo Advantage Short-Term Municipal Bond Fund. Report of the Independent Auditors and audited annual report financial statements of the Wells Fargo Advantage Municipal Bond Fund, Wells Fargo Advantage National Limited-Term Tax-Free Fund, Wells Fargo Advantage National Tax-Free Fund and Wells Fargo Advantage Short-Term Municipal Bond Fund, contained in the Annual Report for the fiscal year ended June 30, 2007, as filed with the SEC on August 30, 2007. Unaudited financial report statements of the Wells Fargo Advantage Municipal Bond Fund, Wells Fargo Advantage National Limited-Term Tax-Free Fund, Wells Fargo Advantage National Tax-Free Fund and Wells Fargo Advantage Short-Term Municipal Bond Fund, dated as of December 31, 2007. |
| | 4. | The SAI dated March 31, 2008 for the Wells Fargo Advantage Value Fund. Report of the Independent Auditors and audited annual report financial statements of the Wells Fargo Advantage Value Fund, contained in the Annual Report for the fiscal year ended July 31, 2007, as filed with the SEC on October 5, 2007. Unaudited financial report statements of the Wells Fargo Advantage Value Fund, dated as of January 31, 2008. |
| | 5. | The SAI dated March 31, 2008 for the Wells Fargo Advantage C&B Large Cap Value Fund. Report of the Independent Auditors and audited annual report financial statements of the Wells Fargo Advantage C&B Large Cap Value Fund, contained in the Annual Report for the fiscal year ended September 30, 2007, as filed with the SEC on December 5, 2007. Unaudited financial report statements of the Wells Fargo Advantage C&B Large Cap Value Fund, dated as of March 31, 2007. |
| | 6. | The SAI dated March 31, 2008 for the Wells Fargo Advantage International Equity Fund and Wells Fargo Advantage Overseas Fund. Report of the Independent Auditors and audited annual report financial statements of the Wells Fargo Advantage International Equity Fund and Wells Fargo Advantage Overseas Fund, contained in the Annual Report for the fiscal year ended September 30, 2007, as filed with the SEC on December 5, 2007. Unaudited financial report statements of the Wells Fargo Advantage International Equity Fund and Wells Fargo Advantage Overseas Fund, dated as of March 31, 2007. |
Table of Contents
General Information
Explanatory Note to Pro Forma Financial Statements
Pro-Forma Financial Statements and Schedules
Notes to Pro Forma Financial Statements*
| * | THE ACCOMPANYING NOTES ARE AN INTEGRAL PART OF THE PRO FORMA FINANCIAL STATEMENTS AND SCHEDULES. |
General Information
This SAI relates to the reorganization of eight Wells Fargo Funds Trust funds listed below, which we refer to as the Target Funds, with eight other funds of Wells Fargo Funds Trust listed below, which we refer to as the Acquiring Funds.
| | |
TARGET FUND | | ACQUIRING FUND |
Balanced Fund Investor Class | | Asset Allocation Fund Class A |
Corporate Bond Fund Investor Class Advisor Class Institutional Class | | Income Plus Fund Investor Class (new class) Class A Institutional Class (new class) |
High Yield Bond Fund Class A Class B Class C | | High Income Fund Class A (formerly Advisor Class) Class B (new class) Class C (new class) |
Intermediate Government Income Fund Class A Class B Class C Administrator Class | | Government Securities Fund Class A (formerly Advisor Class) Class B (new class) Class C Administrator Class |
National Tax-Free Fund Class A Class B Class C Administrator Class | | Municipal Bond Fund Class A Class B Class C Administrator Class |
National Limited-Term Tax-Free Fund Class A Class B Class C Administrator Class | | Short-Term Municipal Bond Fund Class A (new class) Class A (new class) Class C Class A (new class) |
Overseas Fund Investor Class Institutional Class | | International Equity Fund Investor Class (new class) Institutional Class |
Value Fund Class A Class B Class C Investor Class Administrator Class | | C&B Large Cap Value Fund Class A Class B Class C Investor Class (formerly Class D) Administrator Class |
The reorganization of each Target Fund will involve the following three steps:
| | • | | the transfer of substantially all of the assets and liabilities of the Target Fund to its corresponding Acquiring Fund in exchange for designated classes of the corresponding Acquiring Fund having equivalent value to the net assets transferred; |
| | • | | the pro rata distribution of the Acquiring Fund shares to the shareholders of record of the Target Fund as of the effective date of the reorganization in full redemption of all shares of the Target Fund; and |
| | • | | the liquidation and dissolution of the Target Fund. |
As a result of the Reorganization, shareholders of each Target Fund will become a shareholder of the corresponding Acquiring Fund having the same total value of shares as the shares of the Target Fund that they held immediately before the Reorganization. If a majority of the shares of one of the Target Funds does not approve the Reorganization, that Fund will not participate in the Reorganization. In such a case, the Target Fund will continue its operations beyond the date of the Reorganization and the Board of Trustees of the affected Wells Fargo Advantage Fund will consider what further action is appropriate, including the possible liquidation of the Fund.
For further information about the transaction, see the Prospectus/Proxy Statement.
Pro Forma Financial Statements
Explanatory Note
The Balanced Fund will be reorganized into the Asset Allocation Fund, an existing Fund with assets and liabilities. Pro forma combining financial statements as of September 30, 2007 are included to show the pro forma effect of combining the Balanced Fund into the Asset Allocation Fund.
The Corporate Bond Fund will be reorganized into the Income Plus Fund, an existing Fund with assets and liabilities. Pro forma combining financial statements as of November 30, 2007 are included to show the pro forma effect of combining the Corporate Bond Fund into the Income Plus Fund.
The High Yield Bond Fund will be reorganized into the High Income Fund, an existing Fund with assets and liabilities. Pro forma combining financial statements as of November 30, 2007 are included to show the pro forma effect of combining the High Yield Bond Fund into the High Income Fund.
The Intermediate Government Income Fund will be reorganized into the Government Securities Fund, an existing Fund with assets and liabilities. Pro forma combining financial statements as of November 30, 2007 are included to show the pro forma effect of combining the Intermediate Government Income Fund into the Government Securities Fund.
The National Tax-Free Fund will be reorganized into the Municipal Bond Fund, an existing Fund with assets and liabilities. Pro forma combining financial statements as of December 31, 2007 are included to show the pro forma effect of combining the National Tax-Free Fund into the Municipal Bond Fund.
The National Limited-Term Tax-Free Fund will be reorganized into the Short-Term Municipal Bond Fund, an existing Fund with assets and liabilities. Pro forma combining financial statements as of December 31, 2007 are included to show the pro forma effect of combining the National Limited-Term Tax-Free Fund into the Short-Term Municipal Bond Fund.
The Overseas Fund will be reorganized into the International Equity Fund, an existing Fund with assets and liabilities. Pro forma combining financial statements as of September 30, 2007 are included to show the pro forma effect of combining the Overseas Fund into the International Equity Fund.
Pro Forma financial statements for the Value Fund/C&B Large Cap Value Fund Reorganization are not included because as of [April , 2008], the assets of the Value Fund constituted less than 10% of the assets of the C&B Large Cap Value Fund.
| | |
| Proforma Portfolio of Investments - September 30, 2007 (Unaudited) | | Wells Fargo Advantage Funds |
| | | | | | | | | | | | | | |
| | | Balanced Fund | | Asset Allocation Fund | | Pro Forma Combined |
| | | Shares or
Principal
Amount | | Value
(Note 2) | | Shares or
Principal
Amount | | Value
(Note 2) | | Shares or
Principal
Amount | | Value
(Note 2) |
Agency Notes - Interest Bearing - 0.18% | | | | | | | | | | | | | | |
FHLB , 4.125% , Due 10/19/2007« | | 330,000 | | $ | 329,851 | | | | | | 330,000 | | $ | 329,851 |
FHLMC , 5.125% , Due 8/23/2010« | | 1,830,000 | | | 1,864,075 | | | | | | 1,830,000 | | | 1,864,075 |
| | | | | | | | | | | | | | |
Total Agency Notes (Cost $2,167,521, $0 and $2,167,521, respectively) | | | | | 2,193,926 | | | | — | | | | | 2,193,926 |
| | | | | | | | | | | | | | |
| | | | | | |
Agency Securities - 0.40% | | | | | | | | | | | | | | |
Federal Farm Credit Bank - 0.08% | | | | | | | | | | | | | | |
Federal Farm Credit Bank , 4.125% , Due 7/17/2009« | | 974,000 | | | 969,145 | | | | | | 974,000 | | | 969,145 |
Total Federal Farm Credit Bank | | | | | 969,145 | | | | | | | | | 969,145 |
Federal Home Loan Mortgage Corporation - 0.05% | | | | | | | | | | | | | | |
FHLMC #170151 , 10.50% , Due 1/1/2016 | | 1,434 | | | 1,612 | | | | | | 1,434 | | | 1,612 |
FHLMC #1J1263 , 5.855% , Due 1/1/2036«± | | 512,982 | | | 518,887 | | | | | | 512,982 | | | 518,887 |
FHLMC #254325 , 10.25% , Due 3/1/2015 | | 4,862 | | | 5,074 | | | | | | 4,862 | | | 5,074 |
FHLMC #G11487 , 8.00% , Due 3/1/2016 | | 108,874 | | | 114,314 | | | | | | 108,874 | | | 114,314 |
Total Federal Home Loan Mortgage Corporation | | | | | 639,887 | | | | | | | | | 639,887 |
Federal National Mortgage Association - 0.27% | | | | | | | | | | | | | | |
FNMA #699932 , 5.50% , Due 4/1/2033 | | 679,818 | | | 667,775 | | | | | | 679,818 | | | 667,775 |
FNMA #735613 , 6.00% , Due 2/1/2035« | | 526,118 | | | 529,912 | | | | | | 526,118 | | | 529,912 |
FNMA #863727 , 5.336% , Due 1/1/2036«± | | 1,092,018 | | | 1,095,688 | | | | | | 1,092,018 | | | 1,095,688 |
FNMA #892283 , 5.863% , Due 9/1/2036«± | | 502,507 | | | 507,794 | | | | | | 502,507 | | | 507,794 |
FNMA , 6.00% , Due 5/15/2011« | | 495,000 | | | 519,735 | | | | | | 495,000 | | | 519,735 |
Total Federal National Mortgage Association | | | | | 3,320,904 | | | | | | | | | 3,320,904 |
Government National Mortgage Association - 0.00% | | | | | | | | | | | | | | |
GNMA #780434 , 7.50% , Due 12/15/2007 | | 36 | | | 36 | | | | | | 36 | | | 36 |
Total Government National Mortgage Association | | | | | 36 | | | | | | | | | 36 |
| | | | | | | | | | | | | | |
Total Agency Securities ( Cost $4,921,037, $0 and $4,921,037, respectively) | | | | | 4,929,972 | | | | — | | | | | 4,929,972 |
| | | | | | | | | | | | | | |
| | | | | | |
Asset Backed Securities - 0.25% | | | | | | | | | | | | | | |
Banc of America Securities Auto Trust Series 2006-G1 Class A2 , 5.30% , Due 3/18/2009 | | 816,559 | | | 816,186 | | | | | | 816,559 | | | 816,186 |
Countrywide Home Equity Loan Trust Series 2004-I Class A , 6.0425% , Due 2/15/2034± | | 162,320 | | | 160,087 | | | | | | 162,320 | | | 160,087 |
Countrywide Home Equity Loan Trust Series 2004-Q Class 2A , 6.0525% , Due 12/15/2033± | | 86,689 | | | 84,931 | | | | | | 86,689 | | | 84,931 |
Chase Issuance Trust Series 2005-A6 Class A6 , 5.8225% , Due 7/15/2014± | | 545,000 | | | 537,809 | | | | | | 545,000 | | | 537,809 |
Community Program Loan Trust Series 1987-A Class A4 , 4.50% , Due 10/1/2018 | | 928,068 | | | 918,960 | | | | | | 928,068 | | | 918,960 |
MBNA Credit Card Master Note Trust Series 2006-A4 Class A4 , 5.7425% , Due 9/15/2011± | | 444,000 | | | 442,686 | | | | | | 444,000 | | | 442,686 |
Triad Auto Receivables Owners Trust Series 2006-B Class A2 , 5.36% , Due 11/12/2009 | | 38,201 | | | 38,208 | | | | | | 38,201 | | | 38,208 |
| | | | | | | | | | | | | | |
Total Asset Backed Securities ( Cost $3,021,545, $0 and $3,021,545, respectively ) | | | | | 2,998,867 | | | | — | | | | | 2,998,867 |
| | | | | | | | | | | | | | |
| | | | | | |
Collateralized Mortgage Obligations - 0.68% | | | | | | | | | | | | | | |
Banc of America Alternative Loan Trust Series 2005-10 Class 6A1 , 5.50% , Due 11/25/2020 | | 360,768 | | | 358,062 | | | | | | 360,768 | | | 358,062 |
Chase Mortgage Finance Corporation Series 2005-A1 Class 2A2 , 5.2389% , Due 12/25/2035± | | 526,237 | | | 523,690 | | | | | | 526,237 | | | 523,690 |
Citigroup Mortgage Loan Trust Incorporated Series 2004-HYB4 Class AA , 5.4613% , Due 12/25/2034± | | 54,446 | | | 54,310 | | | | | | 54,446 | | | 54,310 |
Citigroup Mortgage Loan Trust Incorporated Series 2006-NCB1 Class 2A2 , 5.8725% , Due 5/15/2036± | | 300,000 | | | 293,934 | | | | | | 300,000 | | | 293,934 |
Countrywide Alternative Loan Trust Series 2004-30CB Class 3A1 , 5.0% , Due 2/25/2020 | | 552,135 | | | 544,596 | | | | | | 552,135 | | | 544,596 |
Countrywide Alternative Loan Trust Series 2006-0C8 Class 2A1C , 5.1913% , Due 11/25/2036± | | 298,151 | | | 297,905 | | | | | | 298,151 | | | 297,905 |
Credit Suisse First Boston Mortgage Securities Corporation Series 2005-C1 Class A3 , 4.813% , Due 2/15/2038 | | 1,000,000 | | | 983,384 | | | | | | 1,000,000 | | | 983,384 |
FHLMC Structured Pass-Through Securities Series T-57 Class 2A1 , 6.3892% , Due 7/25/2043± | | 168,115 | | | 170,444 | | | | | | 168,115 | | | 170,444 |
FHLMC Structured Pass-Through Securities Series T-59 Class 2A1 , 6.482% , Due 10/25/2043± | | 192,545 | | | 193,629 | | | | | | 192,545 | | | 193,629 |
FNMA Grantor Trust Series 2002-T1 Class A4 , 9.50% , Due 11/25/2031 | | 278,528 | | | 297,796 | | | | | | 278,528 | | | 297,796 |
FNMA Whole Loan Series 2003-W8 Class 4A , 6.417% , Due 11/25/2042± | | 441,158 | | | 456,443 | | | | | | 441,158 | | | 456,443 |
FNMA Whole Loan Series 2004-W15 Class 3A , 6.5428% , Due 6/25/2044± | | 410,222 | | | 421,387 | | | | | | 410,222 | | | 421,387 |
GNMA Series 2004-53 Class KE , 5.00% , Due 8/20/2032 | | 597,432 | | | 593,573 | | | | | | 597,432 | | | 593,573 |
GNMA Series 2007-12 Class C , 5.278% , Due 4/16/2041«± | | 605,000 | | | 578,323 | | | | | | 605,000 | | | 578,323 |
| | |
| Proforma Portfolio of Investments - September 30, 2007 (Unaudited) | | Wells Fargo Advantage Funds |
| | | | | | | | | | | | | |
| | | Balanced Fund | | Asset Allocation Fund | | Pro Forma Combined |
| | | Shares or
Principal
Amount | | Value
(Note 2) | | Shares or
Principal
Amount | | Value
(Note 2) | | Shares or
Principal
Amount | | Value
(Note 2) |
GNMA Series 2007-34 Class A , 4.272% , Due 11/16/2026« | | 377,212 | | 371,216 | | | | | | | 377,212 | | 371,216 |
JPMorgan Alternative Loan Trust Series 2006-A4 Class A2 , 5.95% , Due 9/25/2036± | | 521,656 | | 524,300 | | | | | | | 521,656 | | 524,300 |
JPMorgan Chase Commercial Mortgage Security , 5.794% , Due 2/12/2049± | | 460,000 | | 462,272 | | | | | | | 460,000 | | 462,272 |
JPMorgan Mortgage Trust Series 2005-A2 Class 3A1 , 4.8996% , Due 4/25/2035± | | 221,227 | | 219,074 | | | | | | | 221,227 | | 219,074 |
JPMorgan Mortgage Trust Series 2005-A3 Class 7CA1 , 5.1097% , Due 6/25/2035± | | 236,611 | | 235,918 | | | | | | | 236,611 | | 235,918 |
JPMorgan Mortgage Trust Series 2005-A5 Class 3A1 , 5.382% , Due 8/25/2035± | | 357,234 | | 355,248 | | | | | | | 357,234 | | 355,248 |
Multi Security Asset Trust Series 2005-RR4A Class A1 , 4.38% , Due 11/28/2035†† | | 296,984 | | 292,096 | | | | | | | 296,984 | | 292,096 |
Terwin Mortgage Trust Series 2004-21HE Class 1A1 , 5.6113% , Due 12/25/2034± | | 50,119 | | 48,903 | | | | | | | 50,119 | | 48,903 |
| | | | | | | | | | | | | |
Total Collateralized Mortgage Obligations (Cost $8,350,424, $0 and $8,350,424, respectively ) | | | | 8,276,503 | | | | | — | | | | 8,276,503 |
| | | | | | | | | | | | | |
| | | | | | |
Common Stocks -59.02% | | | | | | | | | | | | | |
Amusement & Recreation Services - 0.12% | | | | | | | | | | | | | |
Harrah’s Entertainment Incorporated | | | | | | 8,923 | | $ | 775,676 | | 8,923 | | 775,676 |
International Game Technology | | | | | | 15,994 | | | 689,341 | | 15,994 | | 689,341 |
Total Amusement & Recreation Services | | — | | — | | | | | 1,465,017 | | | | 1,465,017 |
Apparel & Accessory Stores - 0.23% | | | | | | | | | | | | | |
Abercrombie & Fitch Company Class A« | | | | | | 4,130 | | | 333,291 | | 4,130 | | 333,291 |
Gap Incorporated | | | | | | 23,586 | | | 434,926 | | 23,586 | | 434,926 |
Kohl’s Corporation† | | 6,000 | | 343,980 | | 15,145 | | | 868,263 | | 21,145 | | 1,212,243 |
Limited Brands Incorporated« | | | | | | 15,195 | | | 347,814 | | 15,195 | | 347,814 |
Nordstrom Incorporated | | | | | | 9,427 | | | 442,032 | | 9,427 | | 442,032 |
Total Apparel & Accessory Stores | | | | 343,980 | | | | | 2,426,326 | | | | 2,770,306 |
Apparel & Other Finished Products Made From Fabrics & Similar Materials - 0.07% | | | | | | | | | | | | | |
Jones Apparel Group Incorporated« | | | | | | 4,453 | | | 94,092 | | 4,453 | | 94,092 |
Liz Claiborne Incorporated | | | | | | 4,873 | | | 167,290 | | 4,873 | | 167,290 |
Polo Ralph Lauren Corporation | | | | | | 2,854 | | | 221,899 | | 2,854 | | 221,899 |
VF Corporation | | | | | | 4,235 | | | 341,976 | | 4,235 | | 341,976 |
Total Apparel & Other Finished Products Made From Fabrics & Similar Materials | | | | — | | | | | 825,257 | | | | 825,257 |
Automotive Dealers & Gasoline Service Stations - 0.03% | | | | | | | | | | | | | |
AutoNation IncorporatedǠ | | | | | | 7,222 | | | 127,974 | | 7,222 | | 127,974 |
AutoZone IncorporatedǠ | | | | | | 2,180 | | | 253,185 | | 2,180 | | 253,185 |
Total Automotive Dealers & Gasoline Service Stations | | | | — | | | | | 381,159 | | | | 381,159 |
Automotive Repair, services and Parking - 0.01% | | | | | | | | | | | | | |
Ryder System Incorporated | | | | | | 2,851 | | | 139,699 | | 2,851 | | 139,699 |
Total Automotive Repair, services and Parking | | | | — | | | | | 139,699 | | | | 139,699 |
Biopharmaceuticals - 0.36% | | | | | | | | | | | | | |
Celgene Corporation† | | | | | | 18,240 | | | 1,300,694 | | 18,240 | | 1,300,694 |
Genzyme Corporation† | | | | | | 12,567 | | | 778,651 | | 12,567 | | 778,651 |
Gilead Sciences Incorporated† | | | | | | 44,149 | | | 1,804,370 | | 44,149 | | 1,804,370 |
Teva Pharmaceutical Industries Limited ADR« | | 10,000 | | 444,700 | | | | | | | 10,000 | | 444,700 |
Total Biopharmaceuticals | | | | 444,700 | | | | | 3,883,715 | | | | 4,328,415 |
Building Construction-General Contractors & Operative Builders - 0.06% | | | | | | | | | | | | | |
Centex Corporation« | | | | | | 5,717 | | | 151,901 | | 5,717 | | 151,901 |
D.R. Horton Incorporated | | | | | | 13,023 | | | 166,825 | | 13,023 | | 166,825 |
KB Home« | | | | | | 3,668 | | | 91,920 | | 3,668 | | 91,920 |
Lennar Corporation Class A | | | | | | 6,645 | | | 150,509 | | 6,645 | | 150,509 |
Pulte Homes Incorporated | | | | | | 10,122 | | | 137,760 | | 10,122 | | 137,760 |
Total Building Construction-General Contractors & Operative Builders | | | | — | | | | | 698,915 | | | | 698,915 |
Building Materials, Hardware, Garden Supply & Mobile Home Dealers - 0.49% | | | | | | | | | | | | | |
Home Depot Incorporated | | 8,300 | | 269,252 | | 80,475 | | | 2,610,609 | | 88,775 | | 2,879,861 |
Lowe’s Companies Incorporated | | 25,200 | | 706,104 | | 70,468 | | | 1,974,513 | | 95,668 | | 2,680,617 |
Sherwin-Williams Company« | | | | | | 5,174 | | | 339,984 | | 5,174 | | 339,984 |
Total Building Materials, Hardware, Garden Supply & Mobile Home Dealers | | | | 975,356 | | | | | 4,925,106 | | | | 5,900,462 |
Business Services - 3.60% | | | | | | | | | | | | | |
Adobe Systems Incorporated† | | | | | | 28,044 | | | 1,224,401 | | 28,044 | | 1,224,401 |
Affiliated Computer Services Incorporated Class A† | | | | | | 4,744 | | | 238,339 | | 4,744 | | 238,339 |
Akamai Technologies IncorporatedǠ | | | | | | 7,892 | | | 226,737 | | 7,892 | | 226,737 |
Autodesk Incorporated† | | | | | | 10,961 | | | 547,721 | | 10,961 | | 547,721 |
Automatic Data Processing Incorporated | | 9,200 | | 422,556 | | 25,309 | | | 1,162,442 | | 34,509 | | 1,584,998 |
BMC Software IncorporatedǠ | | | | | | 9,588 | | | 299,433 | | 9,588 | | 299,433 |
CA Incorporated« | | | | | | 18,522 | | | 476,386 | | 18,522 | | 476,386 |
| | |
| Proforma Portfolio of Investments - September 30, 2007 (Unaudited) | | Wells Fargo Advantage Funds |
| | | | | | | | | | | | |
| | | Balanced Fund | | Asset Allocation Fund | | Pro Forma Combined |
| | | Shares or
Principal
Amount | | Value
(Note 2) | | Shares or
Principal
Amount | | Value
(Note 2) | | Shares or
Principal
Amount | | Value
(Note 2) |
Citrix Systems Incorporated† | | | | | | 8,566 | | 345,381 | | 8,566 | | 345,381 |
Cognizant Technology Solutions Corporation Class A | | | | | | 6,891 | | 549,695 | | 6,891 | | 549,695 |
Computer Sciences CorporationǠ | | | | | | 8,292 | | 463,523 | | 8,292 | | 463,523 |
Compuware CorporationǠ | | | | | | 14,442 | | 115,825 | | 14,442 | | 115,825 |
Convergys Corporation† | | | | | | 6,461 | | 112,163 | | 6,461 | | 112,163 |
eBay Incorporated† | | | | | | 54,373 | | 2,121,634 | | 54,373 | | 2,121,634 |
Electronic Arts Incorporated† | | | | | | 14,823 | | 829,940 | | 14,823 | | 829,940 |
Electronic Data Systems Corporation | | | | | | 24,255 | | 529,729 | | 24,255 | | 529,729 |
Equifax Incorporated | | | | | | 6,800 | | 259,216 | | 6,800 | | 259,216 |
Fidelity National Information Services Incorporated | | | | | | 8,096 | | 359,220 | | 8,096 | | 359,220 |
Fiserv Incorporated† | | | | | | 7,953 | | 404,490 | | 7,953 | | 404,490 |
Google Incorporated Class A† | | | | | | 11,008 | | 6,244,508 | | 11,008 | | 6,244,508 |
IMS Health Incorporated | | | | | | 9,292 | | 284,707 | | 9,292 | | 284,707 |
Interpublic Group of Companies IncorporatedǠ | | | | | | 22,468 | | 233,218 | | 22,468 | | 233,218 |
Intuit Incorporated† | | | | | | 16,151 | | 489,375 | | 16,151 | | 489,375 |
Juniper Networks IncorporatedǠ | | | | | | 24,501 | | 896,982 | | 24,501 | | 896,982 |
Microsoft Corporation | | 66,200 | | 1,950,252 | | 384,269 | | 11,320,565 | | 450,469 | | 13,270,817 |
Monster Worldwide Incorporated† | | | | | | 6,308 | | 214,850 | | 6,308 | | 214,850 |
NCR Corporation† | | | | | | 8,602 | | 428,380 | | 8,602 | | 428,380 |
Novell IncorporatedǠ | | | | | | 16,673 | | 127,382 | | 16,673 | | 127,382 |
Omnicom Group Incorporated | | | | | | 15,646 | | 752,416 | | 15,646 | | 752,416 |
Oracle Corporation† | | 41,200 | | 891,980 | | 187,634 | | 4,062,279 | | 228,834 | | 4,954,259 |
Robert Half International Incorporated | | | | | | 7,813 | | 233,296 | | 7,813 | | 233,296 |
Sun Microsystems Incorporated† | | | | | | 168,594 | | 945,812 | | 168,594 | | 945,812 |
Symantec Corporation† | | 45,000 | | 872,100 | | 42,866 | | 830,743 | | 87,866 | | 1,702,843 |
Unisys Corporation† | | | | | | 16,678 | | 110,408 | | 16,678 | | 110,408 |
VeriSign IncorporatedǠ | | | | | | 11,621 | | 392,093 | | 11,621 | | 392,093 |
Yahoo! IncorporatedǠ | | | | | | 64,204 | | 1,723,235 | | 64,204 | | 1,723,235 |
Total Business Services | | | | 4,136,888 | | | | 39,556,524 | | | | 43,693,412 |
Chemicals & Allied Products - 5.84% | | | | | | | | | | | | |
Abbott Laboratories | | 19,000 | | 1,018,780 | | 73,654 | | 3,949,327 | | 92,654 | | 4,968,107 |
Air Products & Chemicals Incorporated | | 10,500 | | 1,026,480 | | 10,297 | | 1,006,635 | | 20,797 | | 2,033,115 |
Amgen Incorporated† | | | | | | 51,792 | | 2,929,873 | | 51,792 | | 2,929,873 |
Avery Dennison Corporation | | | | | | 5,074 | | 289,319 | | 5,074 | | 289,319 |
Avon Products Incorporated« | | | | | | 20,619 | | 773,831 | | 20,619 | | 773,831 |
Barr Pharmaceuticals IncorporatedǠ | | | | | | 5,109 | | 290,753 | | 5,109 | | 290,753 |
Biogen Idec Incorporated† | | | | | | 13,722 | | 910,180 | | 13,722 | | 910,180 |
Bristol-Myers Squibb Company | | | | | | 94,264 | | 2,716,688 | | 94,264 | | 2,716,688 |
Clorox Company | | | | | | 6,594 | | 402,168 | | 6,594 | | 402,168 |
Colgate-Palmolive Company | | | | | | 24,303 | | 1,733,290 | | 24,303 | | 1,733,290 |
Dow Chemical Company | | | | | | 45,278 | | 1,949,671 | | 45,278 | | 1,949,671 |
E.I. du Pont de Nemours & Company | | 13,200 | | 654,192 | | 43,871 | | 2,174,247 | | 57,071 | | 2,828,439 |
Eastman Chemical Company | | | | | | 4,005 | | 267,254 | | 4,005 | | 267,254 |
Ecolab Incorporated | | | | | | 8,300 | | 391,760 | | 8,300 | | 391,760 |
Forest Laboratories Incorporated† | | | | | | 15,067 | | 561,848 | | 15,067 | | 561,848 |
Hospira Incorporated† | | | | | | 7,487 | | 310,336 | | 7,487 | | 310,336 |
International Flavors & Fragrances Incorporated | | | | | | 4,255 | | 224,919 | | 4,255 | | 224,919 |
Johnson & Johnson | | 18,900 | | 1,241,730 | | 137,949 | | 9,063,249 | | 156,849 | | 10,304,979 |
King Pharmaceuticals Incorporated† | | | | | | 11,636 | | 136,374 | | 11,636 | | 136,374 |
Estee Lauder Companies Incorporated Class A | | | | | | 5,462 | | 231,917 | | 5,462 | | 231,917 |
Eli Lilly & Company | | 12,600 | | 717,318 | | 47,031 | | 2,677,475 | | 59,631 | | 3,394,793 |
Monsanto Company | | | | | | 25,996 | | 2,228,897 | | 25,996 | | 2,228,897 |
Mylan Laboratories Incorporated† | | | | | | 11,857 | | 189,238 | | 11,857 | | 189,238 |
PPG Industries Incorporated | | | | | | 7,818 | | 590,650 | | 7,818 | | 590,650 |
Pfizer Incorporated | | 48,500 | | 1,184,855 | | 330,138 | | 8,065,271 | | 378,638 | | 9,250,126 |
Praxair Incorporated | | | | | | 15,243 | | 1,276,754 | | 15,243 | | 1,276,754 |
Procter & Gamble Company | | 24,300 | | 1,709,262 | | 148,731 | | 10,461,739 | | 173,031 | | 12,171,001 |
Rohm & Haas Company« | | 12,900 | | 718,143 | | 6,546 | | 364,416 | | 19,446 | | 1,082,559 |
Schering-Plough Corporation | | | | | | 77,178 | | 2,441,140 | | 77,178 | | 2,441,140 |
Sigma-Aldrich Corporation | | | | | | 6,257 | | 304,967 | | 6,257 | | 304,967 |
Wyeth | | 18,600 | | 828,630 | | 64,084 | | 2,854,942 | | 82,684 | | 3,683,572 |
Total Chemicals & Allied Products | | | | 9,099,390 | | | | 61,769,128 | | | | 70,868,518 |
Coal Mining - 0.08% | | | | | | | | | | | | |
CONSOL Energy Incorporated | | | | | | 8,689 | | 404,907 | | 8,689 | | 404,907 |
Peabody Energy Corporation | | | | | | 12,653 | | 605,699 | | 12,653 | | 605,699 |
Total Coal Mining | | | | — | | | | 1,010,606 | | | | 1,010,606 |
Communications - 2.69% | | | | | | | | | | | | |
AT&T Incorporated | | 29,000 | | 1,226,990 | | 290,670 | | 12,298,248 | | 319,670 | | 13,525,238 |
Alltel Corporation | | 6,300 | | 438,984 | | 16,700 | | 1,163,656 | | 23,000 | | 1,602,640 |
Avaya Incorporated† | | | | | | 21,776 | | 369,321 | | 21,776 | | 369,321 |
CenturyTel Incorporated | | | | | | 5,333 | | 246,491 | | 5,333 | | 246,491 |
Citizens Communications Company | | | | | | 16,215 | | 232,199 | | 16,215 | | 232,199 |
Clear Channel Communications Incorporated | | | | | | 23,730 | | 888,451 | | 23,730 | | 888,451 |
Comcast Corporation Class AǠ | | | | | | 147,295 | | 3,561,593 | | 147,295 | | 3,561,593 |
DIRECTV Group Incorporated† | | | | | | 36,200 | | 878,936 | | 36,200 | | 878,936 |
Embarq Corporation | | | | | | 7,271 | | 404,268 | | 7,271 | | 404,268 |
| | |
| Proforma Portfolio of Investments - September 30, 2007 (Unaudited) | | Wells Fargo Advantage Funds |
| | | | | | | | | | | | |
| | | Balanced Fund | | Asset Allocation Fund | | Pro Forma Combined |
| | | Shares or
Principal
Amount | | Value
(Note 2) | | Shares or
Principal
Amount | | Value
(Note 2) | | Shares or
Principal
Amount | | Value
(Note 2) |
IAC/InterActiveCorpǠ | | | | | | 9,105 | | 270,145 | | 9,105 | | 270,145 |
Qwest Communications International Incorporated« | | | | | | 76,143 | | 697,470 | | 76,143 | | 697,470 |
Sprint Nextel Corporation | | | | | | 135,666 | | 2,577,654 | | 135,666 | | 2,577,654 |
Verizon Communications Incorporated | | 18,300 | | 810,324 | | 138,331 | | 6,125,297 | | 156,631 | | 6,935,621 |
Windstream Corporation | | 9,098 | | 128,464 | | 22,753 | | 321,278 | | 31,851 | | 449,742 |
Total Communications | | | | 2,604,762 | | | | 30,035,007 | | | | 32,639,769 |
Depository Institutions - 5.40% | | | | | | | | | | | | |
BB&T Corporation« | | | | | | 26,305 | | 1,062,459 | | 26,305 | | 1,062,459 |
Bank of America Corporation | | 29,900 | | 1,503,073 | | 211,479 | | 10,631,049 | | 241,379 | | 12,134,122 |
Bank of New York Mellon Corporation | | 17,547 | | 774,525 | | 54,228 | | 2,393,624 | | 71,775 | | 3,168,149 |
Citigroup Incorporated | | 28,300 | | 1,320,761 | | 237,081 | | 11,064,570 | | 265,381 | | 12,385,331 |
Comerica Incorporated | | | | | | 7,292 | | 373,934 | | 7,292 | | 373,934 |
Commerce Bancorp Incorporated | | | | | | 9,162 | | 355,302 | | 9,162 | | 355,302 |
Fifth Third Bancorp | | | | | | 25,530 | | 864,956 | | 25,530 | | 864,956 |
First Horizon National Corporation« | | | | | | 6,016 | | 160,387 | | 6,016 | | 160,387 |
Hudson City Bancorp Incorporated« | | | | | | 25,346 | | 389,821 | | 25,346 | | 389,821 |
Huntington Bancshares Incorporated | | | | | | 17,439 | | 296,114 | | 17,439 | | 296,114 |
JPMorgan Chase & Company | | 35,166 | | 1,611,306 | | 161,272 | | 7,389,483 | | 196,438 | | 9,000,789 |
KeyCorp« | | | | | | 18,556 | | 599,915 | | 18,556 | | 599,915 |
M&T Bank Corporation« | | | | | | 3,574 | | 369,730 | | 3,574 | | 369,730 |
Marshall & Ilsley Corporation | | | | | | 12,703 | | 556,010 | | 12,703 | | 556,010 |
National City Corporation | | | | | | 30,181 | | 757,241 | | 30,181 | | 757,241 |
Northern Trust Corporation« | | | | | | 9,125 | | 604,714 | | 9,125 | | 604,714 |
PNC Financial Services Group | | | | | | 16,299 | | 1,109,962 | | 16,299 | | 1,109,962 |
Regions Financial Corporation | | | | | | 33,549 | | 989,025 | | 33,549 | | 989,025 |
Sovereign Bancorp Incorporated | | | | | | 17,126 | | 291,827 | | 17,126 | | 291,827 |
State Street Corporation | | | | | | 18,563 | | 1,265,254 | | 18,563 | | 1,265,254 |
SunTrust Banks Incorporated« | | | | | | 16,635 | | 1,258,770 | | 16,635 | | 1,258,770 |
Synovus Financial Corporation | | | | | | 15,604 | | 437,692 | | 15,604 | | 437,692 |
US Bancorp | | 27,700 | | 901,081 | | 82,280 | | 2,676,568 | | 109,980 | | 3,577,649 |
Wachovia Corporation | | 15,700 | | 787,355 | | 90,694 | | 4,548,304 | | 106,394 | | 5,335,659 |
Washington Mutual Incorporated« | | | | | | 41,735 | | 1,473,663 | | 41,735 | | 1,473,663 |
Wells Fargo & Company‡ | | | | | | 159,297 | | 5,674,159 | | 159,297 | | 5,674,159 |
Western Union Company« | | | | | | 36,824 | | 772,199 | �� | 36,824 | | 772,199 |
Zions Bancorporation | | | | | | 5,127 | | 352,071 | | 5,127 | | 352,071 |
Total Depository Institutions | | | | 6,898,101 | | | | 58,718,803 | | | | 65,616,904 |
Eating & Drinking Places - 0.45% | | | | | | | | | | | | |
Darden Restaurants Incorporated | | | | | | 6,752 | | 282,639 | | 6,752 | | 282,639 |
McDonald’s Corporation | | | | | | 56,798 | | 3,093,787 | | 56,798 | | 3,093,787 |
Wendy’s International Incorporated | | | | | | 4,162 | | 145,295 | | 4,162 | | 145,295 |
Yum! Brands Incorporated | | | | | | 24,780 | | 838,307 | | 24,780 | | 838,307 |
McDonald’s Corporation | | 20,500 | | 1,116,635 | | | | | | 20,500 | | 1,116,635 |
Total Eating & Drinking Places | | | | 1,116,635 | | | | 4,360,028 | | | | 5,476,663 |
E-Commerce/Services - 0.11% | | | | | | | | | | | | |
Amazon.com IncorporatedǠ | | | | | | 14,565 | | 1,356,730 | | 14,565 | | 1,356,730 |
Total E-Commerce/Services | | | | — | | | | 1,356,730 | | | | 1,356,730 |
Educational Services - 0.03% | | | | | | | | | | | | |
Apollo Group Incorporated Class AǠ | | | | | | 6,771 | | 407,276 | | 6,771 | | 407,276 |
Total Educational Services | | | | — | | | | 407,276 | | | | 407,276 |
Electric, Gas & Sanitary Services - 2.23% | | | | | | | | | | | | |
AES CorporationǠ | | | | | | 31,865 | | 638,575 | | 31,865 | | 638,575 |
Allegheny Energy Incorporated | | | | | | 7,914 | | 413,586 | | 7,914 | | 413,586 |
Allied Waste Industries IncorporatedǠ | | | | | | 13,743 | | 175,223 | | 13,743 | | 175,223 |
Ameren Corporation | | | | | | 9,894 | | 519,435 | | 9,894 | | 519,435 |
American Electric Power Company Incorporated | | | | | | 19,025 | | 876,672 | | 19,025 | | 876,672 |
CenterPoint Energy Incorporated« | | | | | | 15,307 | | 245,371 | | 15,307 | | 245,371 |
CMS Energy Corporation | | | | | | 10,703 | | 180,024 | | 10,703 | | 180,024 |
Consolidated Edison Incorporated« | | | | | | 12,914 | | 597,918 | | 12,914 | | 597,918 |
Constellation Energy Group Incorporated« | | | | | | 8,602 | | 737,966 | | 8,602 | | 737,966 |
Dominion Resources Incorporated | | 8,000 | | 674,400 | | 13,869 | | 1,169,157 | | 21,869 | | 1,843,557 |
DTE Energy Company | | | | | | 8,132 | | 393,914 | | 8,132 | | 393,914 |
Duke Energy Corporation« | | | | | | 60,061 | | 1,122,540 | | 60,061 | | 1,122,540 |
Dynegy Incorporated Class A† | | | | | | 23,618 | | 218,230 | | 23,618 | | 218,230 |
Edison International | | | | | | 15,527 | | 860,972 | | 15,527 | | 860,972 |
El Paso Corporation | | | | | | 33,387 | | 566,577 | | 33,387 | | 566,577 |
Entergy Corporation | | | | | | 9,325 | | 1,009,804 | | 9,325 | | 1,009,804 |
Exelon Corporation | | 12,100 | | 911,856 | | 32,130 | | 2,421,317 | | 44,230 | | 3,333,173 |
FirstEnergy Corporation | | | | | | 14,528 | | 920,204 | | 14,528 | | 920,204 |
FPL Group Incorporated | | 12,100 | | 736,648 | | 19,389 | | 1,180,402 | | 31,489 | | 1,917,050 |
Integrys Energy Group Incorporated | | | | | | 3,621 | | 185,504 | | 3,621 | | 185,504 |
Nicor Incorporated | | | | | | 2,150 | | 92,235 | | 2,150 | | 92,235 |
NiSource Incorporated | | | | | | 13,066 | | 250,083 | | 13,066 | | 250,083 |
PG&E Corporation | | | | | | 16,840 | | 804,952 | | 16,840 | | 804,952 |
Pinnacle West Capital Corporation | | | | | | 4,780 | | 188,858 | | 4,780 | | 188,858 |
PPL Corporation | | | | | | 18,258 | | 845,345 | | 18,258 | | 845,345 |
Progress Energy Incorporated | | | | | | 12,339 | | 578,082 | | 12,339 | | 578,082 |
| | |
| Proforma Portfolio of Investments - September 30, 2007 (Unaudited) | | Wells Fargo Advantage Funds |
| | | | | | | | | | | | |
| | | Balanced Fund | | Asset Allocation Fund | | Pro Forma Combined |
| | | Shares or
Principal
Amount | | Value
(Note 2) | | Shares or
Principal
Amount | | Value
(Note 2) | | Shares or
Principal
Amount | | Value
(Note 2) |
Public Service Enterprise Group Incorporated | | 3,000 | | 263,970 | | 12,118 | | 1,066,263 | | 15,118 | | 1,330,233 |
Questar Corporation | | | | | | 8,227 | | 432,164 | | 8,227 | | 432,164 |
Sempra Energy | | | | | | 12,583 | | 731,324 | | 12,583 | | 731,324 |
Spectra Energy Corporation« | | | | | | 30,126 | | 737,484 | | 30,126 | | 737,484 |
TECO Energy Incorporated | | | | | | 10,034 | | 164,859 | | 10,034 | | 164,859 |
The Southern Company | | | | | | 36,050 | | 1,307,894 | | 36,050 | | 1,307,894 |
TXU Corporation | | | | | | 21,977 | | 1,504,765 | | 21,977 | | 1,504,765 |
Waste Management Incorporated« | | | | | | 24,740 | | 933,688 | | 24,740 | | 933,688 |
Xcel Energy Incorporated | | | | | | 20,010 | | 431,015 | | 20,010 | | 431,015 |
Total Electric, Gas & Sanitary Services | | | | 2,586,874 | | | | 24,502,402 | | | | 27,089,276 |
Electronic & Other Electrical Equipment & Components, Except Computer Equipment - 4.77% | | | | | | | | | | | | |
ADC Telecommunications Incorporated† | | | | | | | | | | — | | — |
Advanced Micro Devices IncorporatedǠ | | | | | | 26,212 | | 345,998 | | 26,212 | | 345,998 |
Altera Corporation« | | | | | | 16,970 | | 408,638 | | 16,970 | | 408,638 |
Analog Devices Incorporated« | | | | | | 14,830 | | 536,253 | | 14,830 | | 536,253 |
Broadcom Corporation Class A† | | | | | | 22,356 | | 814,653 | | 22,356 | | 814,653 |
Ciena CorporationǠ | | | | | | 4,096 | | 155,976 | | 4,096 | | 155,976 |
Cisco Systems Incorporated† | | 48,900 | | 1,619,079 | | 290,284 | | 9,611,303 | | 339,184 | | 11,230,382 |
Cooper Industries Limited Class A | | | | | | 8,754 | | 447,242 | | 8,754 | | 447,242 |
Emerson Electric Company | | 20,600 | | 1,096,332 | | 37,746 | | 2,008,842 | | 58,346 | | 3,105,174 |
General Electric Company | | 60,100 | | 2,488,140 | | 488,321 | | 20,216,489 | | 548,421 | | 22,704,629 |
Harman International Industries Incorporated | | | | | | 3,109 | | 268,991 | | 3,109 | | 268,991 |
Jabil Circuit Incorporated« | | | | | | 9,891 | | 225,910 | | 9,891 | | 225,910 |
JDS Uniphase CorporationǠ | | | | | | 10,087 | | 150,902 | | 10,087 | | 150,902 |
KLA-Tencor Corporation | | | | | | 9,205 | | 513,455 | | 9,205 | | 513,455 |
L-3 Communications Holdings Incorporated | | | | | | 6,007 | | 613,555 | | 6,007 | | 613,555 |
Linear Technology Corporation« | | | | | | 10,580 | | 370,194 | | 10,580 | | 370,194 |
LSI Logic CorporationǠ | | | | | | 34,126 | | 253,215 | | 34,126 | | 253,215 |
MEMC Electronic Materials Incorporated† | | | | | | 10,727 | | 631,391 | | 10,727 | | 631,391 |
Microchip Technology Incorporated | | | | | | 10,362 | | 376,348 | | 10,362 | | 376,348 |
Micron Technology IncorporatedǠ | | | | | | 36,071 | | 400,388 | | 36,071 | | 400,388 |
Molex Incorporated | | | | | | 6,843 | | 184,282 | | 6,843 | | 184,282 |
Motorola Incorporated | | | | | | 110,311 | | 2,044,063 | | 110,311 | | 2,044,063 |
National Semiconductor Corporation | | | | | | 11,457 | | 310,714 | | 11,457 | | 310,714 |
Network Appliance Incorporated† | | | | | | 16,957 | | 456,313 | | 16,957 | | 456,313 |
Nokia Oyj ADR | | 29,100 | | 1,103,763 | | | | | | 29,100 | | 1,103,763 |
Novellus Systems Incorporated† | | | | | | 5,900 | | 160,834 | | 5,900 | | 160,834 |
NVIDIA Corporation† | | | | | | 26,155 | | 947,857 | | 26,155 | | 947,857 |
QLogic CorporationǠ | | | | | | 7,002 | | 94,177 | | 7,002 | | 94,177 |
QUALCOMM Incorporated | | | | | | 79,792 | | 3,372,010 | | 79,792 | | 3,372,010 |
Rockwell Collins Incorporated | | | | | | 7,943 | | 580,157 | | 7,943 | | 580,157 |
Tellabs IncorporatedǠ | | | | | | 20,888 | | 198,854 | | 20,888 | | 198,854 |
Texas Instruments Incorporated | | 23,900 | | 874,501 | | 68,108 | | 2,492,072 | | 92,008 | | 3,366,573 |
Tyco Electronics Limited | | | | | | 23,695 | | 839,514 | | 23,695 | | 839,514 |
Whirlpool Corporation« | | | | | | 3,718 | | 331,284 | | 3,718 | | 331,284 |
Xilinx Incorporated | | | | | | 14,102 | | 368,626 | | 14,102 | | 368,626 |
Total Electronic & Other Electrical Equipment & Components, Except Computer Equipment | | | | 7,181,815 | | | | 50,730,500 | | | | 57,912,315 |
Engineering, Accounting, Research Management & Related Services - 0.15% | | | | | | | | | | | | |
Fluor Corporation« | | | | | | 4,208 | | 605,868 | | 4,208 | | 605,868 |
Moody’s Corporation« | | | | | | 10,557 | | 532,073 | | 10,557 | | 532,073 |
Paychex Incorporated | | | | | | 16,211 | | 664,651 | | 16,211 | | 664,651 |
Total Engineering, Accounting, Research Management & Related Services | | | | — | | | | 1,802,592 | | | | 1,802,592 |
Fabricated Metal Products, Except Machinery & Transportation Equipment - 0.25% | | | | | | | | | | | | |
Ball Corporation | | | | | | 4,880 | | 262,300 | | 4,880 | | 262,300 |
Fortune Brands Incorporated | | 11,000 | | 896,390 | | 7,300 | | 594,877 | | 18,300 | | 1,491,267 |
Illinois Tool Works Incorporated | | | | | | 19,995 | | 1,192,502 | | 19,995 | | 1,192,502 |
Snap-On Incorporated | | | | | | 2,760 | | 136,730 | | 2,760 | | 136,730 |
Total Fabricated Metal Products, Except Machinery & Transportation Equipment | | | | 896,390 | | | | 2,186,409 | | | | 3,082,799 |
Financial Services - 0.02% | | | | | | | | | | | | |
Janus Capital Group Incorporated« | | | | | | 7,522 | | 212,722 | | 7,522 | | 212,722 |
Total Financial Services | | | | — | | | | 212,722 | | | | 212,722 |
Food & Kindred Products - 2.08% | | | | | | | | | | | | |
Anheuser-Busch Companies Incorporated | | | | | | 35,723 | | 1,785,793 | | 35,723 | | 1,785,793 |
Archer Daniels Midland Company | | | | | | 30,672 | | 1,014,630 | | 30,672 | | 1,014,630 |
Campbell Soup Company | | | | | | 10,709 | | 396,233 | | 10,709 | | 396,233 |
The Coca-Cola Company | | 9,500 | | 545,965 | | 94,825 | | 5,449,593 | | 104,325 | �� | 5,995,558 |
Coca-Cola Enterprises Incorporated | | | | | | 13,585 | | 329,029 | | 13,585 | | 329,029 |
ConAgra Foods Incorporated | | | | | | 23,343 | | 609,953 | | 23,343 | | 609,953 |
Constellation Brands Incorporated Class AǠ | | | | | | 9,246 | | 223,846 | | 9,246 | | 223,846 |
General Mills Incorporated | | | | | | 15,736 | | 912,845 | | 15,736 | | 912,845 |
| | |
| Proforma Portfolio of Investments - September 30, 2007 (Unaudited) | | Wells Fargo Advantage Funds |
| | | | | | | | | | | | |
| | | Balanced Fund | | Asset Allocation Fund | | Pro Forma Combined |
| | | Shares or
Principal
Amount | | Value
(Note 2) | | Shares or
Principal
Amount | | Value
(Note 2) | | Shares or
Principal
Amount | | Value
(Note 2) |
H.J. Heinz Company | | | | | | 15,210 | | 702,702 | | 15,210 | | 702,702 |
Hercules Incorporated | | | | | | 5,528 | | 116,199 | | 5,528 | | 116,199 |
The Hershey Company | | | | | | 8,056 | | 373,879 | | 8,056 | | 373,879 |
Kellogg Company« | | | | | | 12,644 | | 708,064 | | 12,644 | | 708,064 |
Kraft Foods Incorporated Class A | | 8,165 | | 281,774 | | 75,144 | | 2,593,219 | | 83,309 | | 2,874,993 |
McCormick & Company Incorporated | | | | | | 6,180 | | 222,295 | | 6,180 | | 222,295 |
Molson Coors Brewing Company | | | | | | 3,248 | | 323,728 | | 3,248 | | 323,728 |
Pepsi Bottling Group Incorporated | | | | | | 6,677 | | 248,184 | | 6,677 | | 248,184 |
PepsiCo Incorporated | | 18,500 | | 1,355,310 | | 77,006 | | 5,641,460 | | 95,506 | | 6,996,770 |
Sara Lee Corporation« | | | | | | 34,530 | | 576,306 | | 34,530 | | 576,306 |
Tyson Foods Incorporated Class A | | | | | | 13,109 | | 233,996 | | 13,109 | | 233,996 |
Wm. Wrigley Jr. Company« | | | | | | 10,353 | | 664,973 | | 10,353 | | 664,973 |
Total Food & Kindred Products | | | | 2,183,049 | | | | 23,126,927 | | | | 25,309,976 |
Food Stores - 0.28% | | | | | | | | | | | | |
Kroger Company | | | | | | 33,718 | | 961,637 | | 33,718 | | 961,637 |
Safeway Incorporated | | 14,000 | | 463,540 | | 20,927 | | 692,893 | | 34,927 | | 1,156,433 |
Starbucks Corporation† | | | | | | 35,520 | | 930,624 | | 35,520 | | 930,624 |
Whole Foods Market Incorporated« | | | | | | 6,623 | | 324,262 | | 6,623 | | 324,262 |
Total Food Stores | | | | 463,540 | | | | 2,909,416 | | | | 3,372,956 |
Forestry - 0.06% | | | | | | | | | | | | |
Weyerhaeuser Company | | | | | | 10,287 | | 743,750 | | 10,287 | | 743,750 |
Total Forestry | | | | — | | | | 743,750 | | | | 743,750 |
Furniture & Fixtures - 0.08% | | | | | | | | | | | | |
Leggett & Platt Incorporated« | | | | | | 8,326 | | 159,526 | | 8,326 | | 159,526 |
Masco Corporation | | | | | | 17,497 | | 405,405 | | 17,497 | | 405,405 |
Newell Rubbermaid Incorporated« | | | | | | 13,168 | | 379,502 | | 13,168 | | 379,502 |
Total Furniture & Fixtures | | | | — | | | | 944,433 | | | | 944,433 |
General Merchandise Stores - 0.95% | | | | | | | | | | | | |
Big Lots IncorporatedǠ | | | | | | 4,850 | | 144,724 | | 4,850 | | 144,724 |
Family Dollar Stores Incorporated« | | | | | | 6,938 | | 184,273 | | 6,938 | | 184,273 |
Macy’s Incorporated | | | | | | 20,661 | | 667,764 | | 20,661 | | 667,764 |
JC Penney Company Incorporated | | | | | | 10,563 | | 669,377 | | 10,563 | | 669,377 |
Sears Holdings CorporationǠ | | | | | | 3,608 | | 458,938 | | 3,608 | | 458,938 |
TJX Companies Incorporated | | | | | | 21,190 | | 615,993 | | 21,190 | | 615,993 |
Target Corporation | | 19,400 | | 1,233,258 | | 40,348 | | 2,564,922 | | 59,748 | | 3,798,180 |
Wal-Mart Stores Incorporated | | | | | | 114,393 | | 4,993,254 | | 114,393 | | 4,993,254 |
Total General Merchandise Stores | | | | 1,233,258 | | | | 10,299,245 | | | | 11,532,503 |
Health Services - 0.16% | | | | | | | | | | | | |
Cardinal Health Incorporated | | | | | | 17,373 | | 1,086,334 | | 17,373 | | 1,086,334 |
Laboratory Corporation of America Holdings† | | | | | | 5,590 | | 437,306 | | 5,590 | | 437,306 |
Manor Care Incorporated« | | | | | | 3,488 | | 224,627 | | 3,488 | | 224,627 |
Tenet Healthcare Corporation† | | | | | | 22,583 | | 75,879 | | 22,583 | | 75,879 |
Watson Pharmaceuticals IncorporatedǠ | | | | | | 4,885 | | 158,274 | | 4,885 | | 158,274 |
Total Health Services | | | | — | | | | 1,982,420 | | | | 1,982,420 |
Holding & Other Investment Offices - 0.65% | | | | | | | | | | | | |
Apartment Investment & Management Company Class A | | | | | | 4,610 | | 208,049 | | 4,610 | | 208,049 |
Archstone-Smith Trust† | | | | | | 10,658 | | 640,972 | | 10,658 | | 640,972 |
AvalonBay Communities Incorporated | | | | | | 3,800 | | 448,628 | | 3,800 | | 448,628 |
Boston Properties Incorporated | | | | | | 5,673 | | 589,425 | | 5,673 | | 589,425 |
Developers Diversified Realty Corporation | | | | | | 5,919 | | 330,695 | | 5,919 | | 330,695 |
Equity Residential | | | | | | 13,207 | | 559,449 | | 13,207 | | 559,449 |
General Growth Properties Incorporated« | | | | | | 11,704 | | 627,568 | | 11,704 | | 627,568 |
Host Hotels & Resorts Incorporated | | | | | | 24,890 | | 558,532 | | 24,890 | | 558,532 |
Kimco Realty Corporation | | | | | | 12,020 | | 543,424 | | 12,020 | | 543,424 |
Plum Creek Timber Company« | | | | | | 8,320 | | 372,403 | | 8,320 | | 372,403 |
ProLogis« | | | | | | 12,246 | | 812,522 | | 12,246 | | 812,522 |
Public Storage Incorporated | | | | | | 5,932 | | 466,552 | | 5,932 | | 466,552 |
Simon Property Group Incorporated | | | | | | 10,646 | | 1,064,600 | | 10,646 | | 1,064,600 |
Vornado Realty Trust« | | | | | | 6,375 | | 697,106 | | 6,375 | | 697,106 |
Total Holding & Other Investment Offices | | | | — | | | | 7,919,925 | | | | 7,919,925 |
Home Furniture, Furnishings & Equipment Stores - 0.11% | | | | | | | | | | | | |
Bed Bath & Beyond Incorporated† | | | | | | 12,932 | | 441,240 | | 12,932 | | 441,240 |
Best Buy Company Incorporated | | | | | | 18,971 | | 873,045 | | 18,971 | | 873,045 |
Circuit City Stores Incorporated | | | | | | 8,031 | | 63,525 | | 8,031 | | 63,525 |
Total Home Furniture, Furnishings & Equipment Stores | | | | — | | | | 1,377,810 | | | | 1,377,810 |
Hotels, Rooming Houses, Camps & Other Lodge Places - 0.20% | | | | | | | | | | | | |
Hilton Hotels Corporation« | | | | | | 18,605 | | 864,946 | | 18,605 | | 864,946 |
Marriott International Incorporated Class A | | | | | | 15,229 | | 662,005 | | 15,229 | | 662,005 |
Starwood Hotels & Resorts Worldwide Incorporated | | | | | | 10,000 | | 607,500 | | 10,000 | | 607,500 |
Wyndham Worldwide Corporation | | | | | | 8,511 | | 278,827 | | 8,511 | | 278,827 |
Total Hotels, Rooming Houses, Camps & Other Lodge Places | | | | — | | | | 2,413,278 | | | | 2,413,278 |
| | |
| Proforma Portfolio of Investments - September 30, 2007 (Unaudited) | | Wells Fargo Advantage Funds |
| | | | | | | | | | | | |
| | | Balanced Fund | | Asset Allocation Fund | | Pro Forma Combined |
| | | Shares or
Principal
Amount | | Value
(Note 2) | | Shares or
Principal
Amount | | Value
(Note 2) | | Shares or
Principal
Amount | | Value
(Note 2) |
Industrial & Commercial Machinery & Computer Equipment - 4.62% | | | | | | | | | | | | |
3M Company | | 9,800 | | 917,084 | | 34,114 | | 3,192,388 | | 43,914 | | 4,109,472 |
American Standard Companies Incorporated | | | | | | 8,649 | | 308,077 | | 8,649 | | 308,077 |
Apple Incorporated† | | | | | | 41,446 | | 6,363,619 | | 41,446 | | 6,363,619 |
Applied Materials Incorporated | | | | | | 65,678 | | 1,359,535 | | 65,678 | | 1,359,535 |
Baker Hughes Incorporated« | | | | | | 15,229 | | 1,376,245 | | 15,229 | | 1,376,245 |
Black & Decker Corporation | | | | | | 3,131 | | 260,812 | | 3,131 | | 260,812 |
Caterpillar Incorporated | | 5,000 | | 392,150 | | 30,461 | | 2,389,056 | | 35,461 | | 2,781,206 |
Cummins Incorporated | | | | | | 4,958 | | 634,079 | | 4,958 | | 634,079 |
Deere & Company | | | | | | 10,574 | | 1,569,393 | | 10,574 | | 1,569,393 |
Dell Incorporated† | | | | | | 108,262 | | 2,988,031 | | 108,262 | | 2,988,031 |
Dover Corporation | | | | | | 9,749 | | 496,712 | | 9,749 | | 496,712 |
Eaton Corporation | | | | | | 6,943 | | 687,635 | | 6,943 | | 687,635 |
EMC Corporation | | | | | | 99,954 | | 2,079,043 | | 99,954 | | 2,079,043 |
Hewlett-Packard Company | | 34,800 | | 1,732,692 | | 122,867 | | 6,117,548 | | 157,667 | | 7,850,240 |
Ingersoll-Rand Company Limited Class A« | | | | | | 13,661 | | 744,115 | | 13,661 | | 744,115 |
Intel Corporation | | 52,500 | | 1,357,650 | | 278,327 | | 7,197,536 | | 330,827 | | 8,555,186 |
International Business Machines Corporation« | | 12,200 | | 1,437,160 | | 64,835 | | 7,637,563 | | 77,035 | | 9,074,723 |
Lexmark International Incorporated† | | | | | | 4,503 | | 187,010 | | 4,503 | | 187,010 |
National Oilwell Varco Incorporated† | | | | | | 8,488 | | 1,226,516 | | 8,488 | | 1,226,516 |
Pall Corporation | | | | | | 5,842 | | 227,254 | | 5,842 | | 227,254 |
Parker Hannifin Corporation« | | | | | | 5,536 | | 619,091 | | 5,536 | | 619,091 |
Pitney Bowes Incorporated« | | | | | | 10,479 | | 475,956 | | 10,479 | | 475,956 |
SanDisk CorporationǠ | | | | | | 10,858 | | 598,276 | | 10,858 | | 598,276 |
Smith International Incorporated | | | | | | 9,556 | | 682,298 | | 9,556 | | 682,298 |
Solectron Corporation† | | | | | | 43,556 | | 169,868 | | 43,556 | | 169,868 |
Stanley Works | | | | | | 3,912 | | 219,581 | | 3,912 | | 219,581 |
Terex Corporation† | | | | | | 4,856 | | 432,281 | | 4,856 | | 432,281 |
Total Industrial & Commercial Machinery & Computer Equipment | | | | 5,836,736 | | | | 50,239,518 | | | | 56,076,254 |
Insurance Agents, Brokers & Service - 0.19% | | | | | | | | | | | | |
AON Corporation« | | | | | | 13,953 | | 625,234 | | 13,953 | | 625,234 |
Humana Incorporated† | | | | | | 8,033 | | 561,346 | | 8,033 | | 561,346 |
Marsh & McLennan Companies Incorporated | | | | | | 25,831 | | 658,691 | | 25,831 | | 658,691 |
UnumProvident Corporation | | | | | | 17,195 | | 420,762 | | 17,195 | | 420,762 |
Total Insurance Agents, Brokers & Service | | | | — | | | | 2,266,033 | | | | 2,266,033 |
Insurance Carriers - 3.30% | | | | | | | | | | | | |
ACE Limited | | | | | | 15,680 | | 949,738 | | 15,680 | | 949,738 |
Aetna Incorporated | | | | | | 24,372 | | 1,322,668 | | 24,372 | | 1,322,668 |
AFLAC Incorporated« | | | | | | 23,280 | | 1,327,891 | | 23,280 | | 1,327,891 |
Allstate Corporation | | 8,000 | | 457,520 | | 27,880 | | 1,594,457 | | 35,880 | | 2,051,977 |
Ambac Financial Group Incorporated« | | | | | | 4,848 | | 304,988 | | 4,848 | | 304,988 |
American International Group Incorporated | | 17,900 | | 1,210,935 | | 122,215 | | 8,267,845 | | 140,115 | | 9,478,780 |
Assurant Incorporated« | | | | | | 4,598 | | 245,993 | | 4,598 | | 245,993 |
Chubb Corporation | | | | | | 18,744 | | 1,005,428 | | 18,744 | | 1,005,428 |
CIGNA Corporation | | | | | | 13,480 | | 718,349 | | 13,480 | | 718,349 |
Cincinnati Financial Corporation | | | | | | 8,197 | | 355,016 | | 8,197 | | 355,016 |
Genworth Financial Incorporated | | | | | | 21,097 | | 648,311 | | 21,097 | | 648,311 |
Hartford Financial Services Group Incorporated | | | | | | 15,140 | | 1,401,207 | | 15,140 | | 1,401,207 |
Leucadia National Corporation | | | | | | 7,846 | | 378,334 | | 7,846 | | 378,334 |
Lincoln National Corporation | | | | | | 12,899 | | 850,947 | | 12,899 | | 850,947 |
Loews Corporation | | | | | | 21,188 | | 1,024,440 | | 21,188 | | 1,024,440 |
MBIA Incorporated« | | | | | | 6,030 | | 368,132 | | 6,030 | | 368,132 |
MetLife Incorporated | | 17,500 | | 1,220,275 | | 35,404 | | 2,468,721 | | 52,904 | | 3,688,996 |
MGIC Investment Corporation« | | | | | | 3,905 | | 126,171 | | 3,905 | | 126,171 |
Principal Financial Group Incorporated | | | | | | 12,658 | | 798,593 | | 12,658 | | 798,593 |
Prudential Financial Incorporated« | | | | | | 21,875 | | 2,134,563 | | 21,875 | | 2,134,563 |
SAFECO Corporation | | | | | | 4,961 | | 303,712 | | 4,961 | | 303,712 |
The Progressive Corporation | | | | | | 34,509 | | 669,820 | | 34,509 | | 669,820 |
The Travelers Companies Incorporated | | 13,900 | | 699,726 | | 31,288 | | 1,575,038 | | 45,188 | | 2,274,764 |
Torchmark Corporation | | | | | | 4,560 | | 284,179 | | 4,560 | | 284,179 |
UnitedHealth Group Incorporated | | 12,000 | | 581,160 | | 63,142 | | 3,057,967 | | 75,142 | | 3,639,127 |
WellPoint Incorporated† | | 9,800 | | 773,416 | | 28,777 | | 2,271,081 | | 38,577 | | 3,044,497 |
XL Capital Limited Class A | | | | | | 8,661 | | 685,951 | | 8,661 | | 685,951 |
Total Insurance Carriers | | | | 4,943,032 | | | | 35,139,540 | | | | 40,082,572 |
Leather & Leather Products - 0.07% | | | | | | | | | | | | |
Coach IncorporatedǠ | | | | | | 17,781 | | 840,508 | | 17,781 | | 840,508 |
Total Leather & Leather Products | | | | — | | | | 840,508 | | | | 840,508 |
Measuring, Analyzing & Controlling Instruments: Photographic, Medical & Optical Goods - 0.93% | | | | | | | | | | | | |
Agilent Technologies IncorporatedǠ | | | | | | 18,422 | | 679,403 | | 18,422 | | 679,403 |
Applera Corporation-Applied Biosystems Group | | | | | | 8,739 | | 302,719 | | 8,739 | | 302,719 |
Bausch & Lomb Incorporated | | | | | | 2,641 | | 169,024 | | 2,641 | | 169,024 |
Becton Dickinson & Company | | 5,500 | | 451,275 | | 11,599 | | 951,698 | | 17,099 | | 1,402,973 |
Boston Scientific Corporation† | | | | | | 63,581 | | 886,955 | | 63,581 | | 886,955 |
| | |
| Proforma Portfolio of Investments - September 30, 2007 (Unaudited) | | Wells Fargo Advantage Funds |
| | | | | | | | | | | | |
| | | Balanced Fund | | Asset Allocation Fund | | Pro Forma Combined |
| | | Shares or
Principal
Amount | | Value
(Note 2) | | Shares or
Principal
Amount | | Value
(Note 2) | | Shares or
Principal
Amount | | Value
(Note 2) |
C.R. Bard Incorporated« | | | | | | 4,925 | | 434,336 | | 4,925 | | 434,336 |
Covidien Limited | | | | | | 23,694 | | 983,301 | | 23,694 | | 983,301 |
Danaher Corporation | | | | | | 11,749 | | 971,760 | | 11,749 | | 971,760 |
Eastman Kodak Company« | | | | | | 13,678 | | 366,023 | | 13,678 | | 366,023 |
Millipore CorporationǠ | | | | | | 2,571 | | 194,882 | | 2,571 | | 194,882 |
PerkinElmer Incorporated | | | | | | 5,781 | | 168,863 | | 5,781 | | 168,863 |
Quest Diagnostics Incorporated | | | | | | 7,450 | | 430,387 | | 7,450 | | 430,387 |
Raytheon Company | | | | | | 20,842 | | 1,330,136 | | 20,842 | | 1,330,136 |
Rockwell Automation Incorporated« | | 11,000 | | 764,610 | | 7,270 | | 505,338 | | 18,270 | | 1,269,948 |
Tektronix Incorporated | | | | | | 3,618 | | 100,363 | | 3,618 | | 100,363 |
Teradyne Incorporated† | | | | | | 9,039 | | 124,738 | | 9,039 | | 124,738 |
Thermo Fisher Scientific Incorporated† | | | | | | 20,330 | | 1,173,448 | | 20,330 | | 1,173,448 |
Waters Corporation† | | | | | | 4,756 | | 318,272 | | 4,756 | | 318,272 |
Total Measuring, Analyzing & Controlling Instruments: Photographic, Medical & Optical Goods | | | | 1,215,885 | | | | 10,091,646 | | | | 11,307,531 |
Medical Equipment & Supplies - 0.37% | | | | | | | | | | | | |
Medtronic Incorporated | | 9,400 | | 530,254 | | 54,051 | | 3,049,017 | | 63,451 | | 3,579,271 |
St. Jude Medical Incorporated† | | | | | | 16,247 | | 716,005 | | 16,247 | | 716,005 |
Varian Medical Systems Incorporated† | | | | | | 6,024 | | 252,345 | | 6,024 | | 252,345 |
Total Medical Equipment & Supplies | | | | 530,254 | | | | 4,017,367 | | | | 4,547,621 |
Medical Management Services - 0.19% | | | | | | | | | | | | |
Coventry Health Care Incorporated† | | | | | | 7,448 | | 463,340 | | 7,448 | | 463,340 |
Express Scripts Incorporated† | | | | | | 12,288 | | 685,916 | | 12,288 | | 685,916 |
Medco Health Solutions IncorporatedǠ | | | | | | 12,904 | | 1,166,393 | | 12,904 | | 1,166,393 |
Total Medical Management Services | | | | — | | | | 2,315,649 | | | | 2,315,649 |
Medical Products - 0.86% | | | | | | | | | | | | |
Allergan Incorporated | | | | | | 14,655 | | 944,808 | | 14,655 | | 944,808 |
Baxter International Incorporated | | | | | | 30,727 | | 1,729,316 | | 30,727 | | 1,729,316 |
Merck & Company Incorporated | | 14,700 | | 759,843 | | 103,723 | | 5,361,442 | | 118,423 | | 6,121,285 |
Stryker Corporation« | | | | | | 11,307 | | 777,469 | | 11,307 | | 777,469 |
Zimmer Holdings Incorporated† | | | | | | 11,256 | | 911,623 | | 11,256 | | 911,623 |
Total Medical Products | | | | 759,843 | | | | 9,724,658 | | | | 10,484,501 |
Metal Mining - 0.24% | | | | | | | | | | | | |
Freeport-McMoRan Copper & Gold Incorporated Class B | | | | | | 18,192 | | 1,908,159 | | 18,192 | | 1,908,159 |
Newmont Mining Corporation | | | | | | 21,519 | | 962,545 | | 21,519 | | 962,545 |
Total Metal Mining | | | | — | | | | 2,870,704 | | | | 2,870,704 |
Mining & Quarrying of Nonmetallic Minerals, Except Fuels - 0.03% | | | | | | | | | | | | |
Vulcan Materials Company | | | | | | 4,553 | | 405,900 | | 4,553 | | 405,900 |
Total Mining & Quarrying of Nonmetallic Minerals, Except Fuels | | | | — | | | | 405,900 | | | | 405,900 |
Miscellaneous Manufacturing Industries - 0.17% | | | | | | | | | | | | |
Hasbro Incorporated | | | | | | 7,624 | | 212,557 | | 7,624 | | 212,557 |
Mattel Incorporated | | | | | | 18,806 | | 441,189 | | 18,806 | | 441,189 |
Tiffany & Company« | | | | | | 6,516 | | 341,113 | | 6,516 | | 341,113 |
Tyco International Limited | | | | | | 23,692 | | 1,050,503 | | 23,692 | | 1,050,503 |
Total Miscellaneous Manufacturing Industries | | | | — | | | | 2,045,362 | | | | 2,045,362 |
Miscellaneous Retail - 0.74% | | | | | | | | | | | | |
CVS Caremark Corporation | | 21,000 | | 832,230 | | 70,578 | | 2,797,006 | | 91,578 | | 3,629,236 |
Costco Wholesale Corporation | | 8,500 | | 521,645 | | 20,871 | | 1,280,853 | | 29,371 | | 1,802,498 |
Dillard’s Incorporated Class A | | | | | | 2,899 | | 63,285 | | 2,899 | | 63,285 |
Office Depot Incorporated† | | | | | | 12,999 | | 268,039 | | 12,999 | | 268,039 |
OfficeMax Incorporated | | | | | | 3,590 | | 123,029 | | 3,590 | | 123,029 |
RadioShack Corporation« | | | | | | 6,566 | | 135,654 | | 6,566 | | 135,654 |
Staples Incorporated | | | | | | 34,025 | | 731,197 | | 34,025 | | 731,197 |
Walgreen Company | | | | | | 47,356 | | 2,237,097 | | 47,356 | | 2,237,097 |
Total Miscellaneous Retail | | | | 1,353,875 | | | | 7,636,160 | | | | 8,990,035 |
Motion Pictures - 0.87% | | | | | | | | | | | | |
Walt Disney Company | | 25,000 | | 859,750 | | 92,502 | | 3,181,144 | | 117,502 | | 4,040,894 |
News Corporation Class A« | | | | | | 110,330 | | 2,426,157 | | 110,330 | | 2,426,157 |
Time Warner Incorporated | | 45,100 | | 828,036 | | 177,734 | | 3,263,196 | | 222,834 | | 4,091,232 |
Total Motion Pictures | | | | 1,687,786 | | | | 8,870,497 | | | | 10,558,283 |
Motor Freight Transportation & Warehousing - 0.50% | | | | | | | | | | | | |
FedEx Corporation | | | | | | 14,715 | | 1,541,396 | | 14,715 | | 1,541,396 |
United Parcel Service Incorporated Class B« | | 9,700 | | 728,470 | | 50,031 | | 3,757,328 | | 59,731 | | 4,485,798 |
Total Motor Freight Transportation & Warehousing | | | | 728,470 | | | | 5,298,724 | | | | 6,027,194 |
Non-Depository Credit Institutions - 1.06% | | | | | | | | | | | | |
American Capital Strategies Limited« | | | | | | 8,956 | | 382,690 | | 8,956 | | 382,690 |
American Express Company | | 14,500 | | 860,865 | | 56,374 | | 3,346,924 | | 70,874 | | 4,207,789 |
CIT Group Incorporated | | | | | | 9,093 | | 365,539 | | 9,093 | | 365,539 |
Capital One Financial Corporation« | | | | | | 19,906 | | 1,322,356 | | 19,906 | | 1,322,356 |
Countrywide Financial Corporation« | | | | | | 27,453 | | 521,882 | | 27,453 | | 521,882 |
Discover Financial Services | | | | | | 22,744 | | 473,075 | | 22,744 | | 473,075 |
Freddie Mac | | | | | | 30,984 | | 1,828,366 | | 30,984 | | 1,828,366 |
Fannie Mae | | | | | | 46,393 | | 2,821,158 | | 46,393 | | 2,821,158 |
SLM CorporationǠ | | | | | | 19,664 | | 976,711 | | 19,664 | | 976,711 |
| | |
| Proforma Portfolio of Investments - September 30, 2007 (Unaudited) | | Wells Fargo Advantage Funds |
| | | | | | | | | | | | |
| | | Balanced Fund | | Asset Allocation Fund | | Pro Forma Combined |
| | | Shares or
Principal
Amount | | Value
(Note 2) | | Shares or
Principal
Amount | | Value
(Note 2) | | Shares or
Principal
Amount | | Value
(Note 2) |
Total Non-Depository Credit Institutions | | | | 860,865 | | | | 12,038,701 | | | | 12,899,566 |
Office Equipment - 0.06% | | | | | | | | | | | | |
Xerox Corporation | | | | | | 44,601 | | 773,381 | | 44,601 | | 773,381 |
Total Office Equipment | | | | — | | | | 773,381 | | | | 773,381 |
Oil & Gas Extraction - 1.97% | | | | | | | | | | | | |
Anadarko Petroleum Corporation« | | | | | | 22,108 | | 1,188,305 | | 22,108 | | 1,188,305 |
Apache Corporation | | | | | | 15,823 | | 1,425,019 | | 15,823 | | 1,425,019 |
BJ Services Company« | | | | | | 13,898 | | 368,992 | | 13,898 | | 368,992 |
Chesapeake Energy Corporation | | | | | | 19,554 | | 689,474 | | 19,554 | | 689,474 |
Devon Energy Corporation | | | | | | 21,255 | | 1,768,416 | | 21,255 | | 1,768,416 |
ENSCO International Incorporated | | | | | | 7,053 | | 395,673 | | 7,053 | | 395,673 |
EOG Resources Incorporated« | | | | | | 11,667 | | 843,874 | | 11,667 | | 843,874 |
Halliburton Company | | 27,800 | | 1,067,520 | | 42,424 | | 1,629,082 | | 70,224 | | 2,696,602 |
Nabors Industries LimitedǠ | | | | | | 13,401 | | 412,349 | | 13,401 | | 412,349 |
Noble Corporation | | | | | | 12,795 | | 627,595 | | 12,795 | | 627,595 |
Occidental Petroleum Corporation | | | | | | 39,592 | | 2,537,055 | | 39,592 | | 2,537,055 |
Rowan Companies Incorporated | | | | | | 5,266 | | 192,630 | | 5,266 | | 192,630 |
Schlumberger Limited« | | 10,300 | | 1,081,500 | | 56,812 | | 5,965,260 | | 67,112 | | 7,046,760 |
Transocean IncorporatedǠ | | | | | | 13,786 | | 1,558,507 | | 13,786 | | 1,558,507 |
Weatherford International Limited† | | | | | | 16,060 | | 1,078,911 | | 16,060 | | 1,078,911 |
XTO Energy Incorporated | | | | | | 18,388 | | 1,137,093 | | 18,388 | | 1,137,093 |
Total Oil & Gas Extraction | | | | 2,149,020 | | | | 21,818,235 | | | | 23,967,255 |
Paper & Allied Products - 0.13% | | | | | | | | | | | | |
Bemis Company Incorporated« | | | | | | 4,980 | | 144,968 | | 4,980 | | 144,968 |
International Paper Company« | | | | | | 20,475 | | 734,438 | | 20,475 | | 734,438 |
MeadWestvaco Corporation | | | | | | 8,741 | | 258,122 | | 8,741 | | 258,122 |
Pactiv Corporation† | | | | | | 6,230 | | 178,552 | | 6,230 | | 178,552 |
Temple-Inland Incorporated | | | | | | 5,050 | | 265,782 | | 5,050 | | 265,782 |
Total Paper & Allied Products | | | | — | | | | 1,581,862 | | | | 1,581,862 |
Personal Services - 0.05% | | | | | | | | | | | | |
H & R Block Incorporated« | | | | | | 15,471 | | 327,676 | | 15,471 | | 327,676 |
Cintas Corporation« | | | | | | 6,429 | | 238,516 | | 6,429 | | 238,516 |
Total Personal Services | | | | — | | | | 566,192 | | | | 566,192 |
Petroleum Refining & Related Industries - 4.39% | | | | | | | | | | | | |
Ashland Incorporated | | | | | | 2,664 | | 160,399 | | 2,664 | | 160,399 |
Chevron Corporation | | 15,700 | | 1,469,206 | | 101,594 | | 9,507,167 | | 117,294 | | 10,976,373 |
ConocoPhillips | | 13,800 | | 1,211,226 | | 77,549 | | 6,806,476 | | 91,349 | | 8,017,702 |
Exxon Mobil Corporation | | 32,300 | | 2,989,688 | | 264,328 | | 24,466,200 | | 296,628 | | 27,455,888 |
Hess Corporation | | | | | | 13,184 | | 877,132 | | 13,184 | | 877,132 |
Marathon Oil Corporation« | | 14,600 | | 832,492 | | 32,460 | | 1,850,869 | | 47,060 | | 2,683,361 |
Murphy Oil Corporation« | | | | | | 8,983 | | 627,822 | | 8,983 | | 627,822 |
Sunoco Incorporated | | | | | | 5,736 | | 405,994 | | 5,736 | | 405,994 |
Tesoro Petroleum Corporation | | | | | | 6,521 | | 300,096 | | 6,521 | | 300,096 |
Valero Energy Corporation | | | | | | 26,394 | | 1,773,149 | | 26,394 | | 1,773,149 |
Total Petroleum Refining & Related Industries | | | | 6,502,612 | | | | 46,775,304 | | | | 53,277,916 |
Pipelines - 0.08% | | | | | | | | | | | | |
The Williams Companies Incorporated | | | | | | 28,606 | | 974,320 | | 28,606 | | 974,320 |
Total Pipelines | | | | — | | | | 974,320 | | | | 974,320 |
Primary Metal Industries - 0.38% | | | | | | | | | | | | |
Alcoa Incorporated | | | | | | 42,132 | | 1,648,204 | | 42,132 | | 1,648,204 |
Allegheny Technologies Incorporated« | | | | | | 4,871 | | 535,566 | | 4,871 | | 535,566 |
Nucor Corporation | | | | | | 13,720 | | 815,928 | | 13,720 | | 815,928 |
Precision Castparts Corporation | | | | | | 6,570 | | 972,229 | | 6,570 | | 972,229 |
United States Steel Corporation | | | | | | 5,633 | | 596,760 | | 5,633 | | 596,760 |
Total Primary Metal Industries | | | | — | | | | 4,568,687 | | | | 4,568,687 |
Printing, Publishing & Allied Industries - 0.39% | | | | | | | | | | | | |
CBS Corporation Class B« | | | | | | 32,642 | | 1,028,223 | | 32,642 | | 1,028,223 |
Dow Jones & Company Incorporated | | | | | | 3,109 | | 185,607 | | 3,109 | | 185,607 |
E.W. Scripps Company Class A« | | | | | | 4,277 | | 179,634 | | 4,277 | | 179,634 |
Gannett Company Incorporated« | | | | | | 11,099 | | 485,028 | | 11,099 | | 485,028 |
McGraw-Hill Companies Incorporated | | | | | | 16,151 | | 822,247 | | 16,151 | | 822,247 |
Meredith Corporation | | | | | | 1,833 | | 105,031 | | 1,833 | | 105,031 |
New York Times Company Class A« | | | | | | 6,859 | | 135,534 | | 6,859 | | 135,534 |
RR Donnelley & Sons Company | | | | | | 10,585 | | 386,988 | | 10,585 | | 386,988 |
Tribune Company« | | | | | | 3,668 | | 100,210 | | 3,668 | | 100,210 |
Viacom Incorporated Class BǠ | | | | | | 32,723 | | 1,275,215 | | 32,723 | | 1,275,215 |
Total Printing, Publishing & Allied Industries | | | | — | | | | 4,703,717 | | | | 4,703,717 |
Railroad Transportation - 0.37% | | | | | | | | | | | | |
Burlington Northern Santa Fe Corporation | | | | | | 14,317 | | 1,162,111 | | 14,317 | | 1,162,111 |
CSX Corporation | | | | | | 20,922 | | 893,997 | | 20,922 | | 893,997 |
Norfolk Southern Corporation | | | | | | 18,758 | | 973,728 | | 18,758 | | 973,728 |
Union Pacific Corporation | | | | | | 12,696 | | 1,435,410 | | 12,696 | | 1,435,410 |
Total Railroad Transportation | | | | — | | | | 4,465,246 | | | | 4,465,246 |
Real Estate - 0.02% | | | | | | | | | | | | |
CB Richard Ellis Group Incorporated Class A† | | | | | | 9,397 | | 261,616 | | 9,397 | | 261,616 |
Total Real Estate | | | | — | | | | 261,616 | | | | 261,616 |
| | |
| Proforma Portfolio of Investments - September 30, 2007 (Unaudited) | | Wells Fargo Advantage Funds |
| | | | | | | | | | | | |
| | | Balanced Fund | | Asset Allocation Fund | | Pro Forma Combined |
| | | Shares or
Principal
Amount | | Value
(Note 2) | | Shares or
Principal
Amount | | Value
(Note 2) | | Shares or
Principal
Amount | | Value
(Note 2) |
Rubber & Miscellaneous Plastics Products - 0.04% | | | | | | | | | | | | |
The Goodyear Tire & Rubber CompanyǠ | | | | | | 10,056 | | 305,803 | | 10,056 | | 305,803 |
Sealed Air Corporation | | | | | | 7,697 | | 196,735 | | 7,697 | | 196,735 |
Total Rubber & Miscellaneous Plastics Products | | | | — | | | | 502,538 | | | | 502,538 |
Security & Commodity Brokers, Dealers, Exchanges & Services - 1.77% | | | | | | | | | | | | |
Ameriprise Financial Incorporated | | | | | | 11,213 | | 707,652 | | 11,213 | | 707,652 |
Bear Stearns Companies Incorporated« | | | | | | 5,534 | | 679,631 | | 5,534 | | 679,631 |
Charles Schwab Corporation | | | | | | 45,169 | | 975,650 | | 45,169 | | 975,650 |
CME Group Incorporated | | | | | | 2,531 | | 1,486,583 | | 2,531 | | 1,486,583 |
E*TRADE Financial CorporationǠ | | | | | | 20,267 | | 264,687 | | 20,267 | | 264,687 |
Federated Investors Incorporated Class B | | | | | | 4,172 | | 165,628 | | 4,172 | | 165,628 |
Franklin Resources Incorporated | | | | | | 7,736 | | 986,340 | | 7,736 | | 986,340 |
Goldman Sachs Group Incorporated | | 4,500 | | 975,330 | | 19,333 | | 4,190,234 | | 23,833 | | 5,165,564 |
InterContinental Exchange Incorporated† | | | | | | 3,302 | | 501,574 | | 3,302 | | 501,574 |
Legg Mason Incorporated | | | | | | 6,327 | | 533,303 | | 6,327 | | 533,303 |
Lehman Brothers Holdings Incorporated | | 7,600 | | 469,148 | | 25,296 | | 1,561,522 | | 32,896 | | 2,030,670 |
Merrill Lynch & Company Incorporated | | 6,700 | | 477,576 | | 41,077 | | 2,927,969 | | 47,777 | | 3,405,545 |
Morgan Stanley | | 12,100 | | 762,300 | | | | | | 12,100 | | 762,300 |
Morgan Stanley« | | | | | | 50,163 | | 3,160,269 | | 50,163 | | 3,160,269 |
T. Rowe Price Group Incorporated« | | | | | | 12,637 | | 703,755 | | 12,637 | | 703,755 |
Total Security & Commodity Brokers, Dealers, Exchanges & Services | | | | 2,684,354 | | | | 18,844,797 | | | | 21,529,151 |
Stone, Clay, Glass & Concrete Products - 0.15% | | | | | | | | | | | | |
Corning Incorporated | | | | | | 74,967 | | 1,847,937 | | 74,967 | | 1,847,937 |
Total Stone, Clay, Glass & Concrete Products | | | | — | | | | 1,847,937 | | | | 1,847,937 |
Tobacco Products - 0.72% | | | | | | | | | | | | |
Altria Group Incorporated | | 11,600 | | 806,548 | | 100,331 | | 6,976,014 | | 111,931 | | 7,782,562 |
Reynolds American Incorporated« | | | | | | 8,154 | | 518,513 | | 8,154 | | 518,513 |
UST Incorporated | | | | | | 7,595 | | 376,712 | | 7,595 | | 376,712 |
Total Tobacco Products | | | | 806,548 | | | | 7,871,239 | | | | 8,677,787 |
Transportation By Air - 0.04% | | | | | | | | | | | | |
Southwest Airlines Company | | | | | | 35,616 | | 527,117 | | 35,616 | | 527,117 |
Total Transportation By Air | | | | — | | | | 527,117 | | | | 527,117 |
Transportation Equipment - 2.05% | | | | | | | | | | | | |
Boeing Company | | | | | | 37,350 | | 3,921,377 | | 37,350 | | 3,921,377 |
Brunswick Corporation« | | | | | | 4,237 | | 96,858 | | 4,237 | | 96,858 |
Ford Motor CompanyǠ | | | | | | 100,064 | | 849,543 | | 100,064 | | 849,543 |
General Dynamics Corporation | | 7,400 | | 625,078 | | 19,335 | | 1,633,227 | | 26,735 | | 2,258,305 |
General Motors Corporation« | | | | | | 26,968 | | 989,726 | | 26,968 | | 989,726 |
Genuine Parts Company | | | | | | 8,098 | | 404,900 | | 8,098 | | 404,900 |
Goodrich Corporation | | | | | | 5,968 | | 407,197 | | 5,968 | | 407,197 |
Harley-Davidson Incorporated | | 3,500 | | 161,735 | | 11,971 | | 553,180 | | 15,471 | | 714,915 |
Honeywell International Incorporated | | 20,800 | | 1,236,976 | | 35,667 | | 2,121,116 | | 56,467 | | 3,358,092 |
ITT Corporation | | | | | | 8,630 | | 586,236 | | 8,630 | | 586,236 |
Johnson Controls Incorporated | | | | | | 9,436 | | 1,114,486 | | 9,436 | | 1,114,486 |
Lockheed Martin Corporation | | | | | | 16,547 | | 1,795,184 | | 16,547 | | 1,795,184 |
Northrop Grumman Corporation | | | | | | 16,379 | | 1,277,562 | | 16,379 | | 1,277,562 |
Paccar Incorporated« | | | | | | 11,847 | | 1,009,957 | | 11,847 | | 1,009,957 |
Textron Incorporated | | | | | | 11,900 | | 740,299 | | 11,900 | | 740,299 |
United Technologies Corporation | | 19,200 | | 1,545,216 | | 47,267 | | 3,804,048 | | 66,467 | | 5,349,264 |
Total Transportation Equipment | | | | 3,569,005 | | | | 21,304,896 | | | | 24,873,901 |
Transportation Services - 0.04% | | | | | | | | | | | | |
C.H. Robinson Worldwide Incorporated | | | | | | 8,225 | | 446,535 | | 8,225 | | 446,535 |
Total Transportation Services | | | | — | | | | 446,535 | | | | 446,535 |
Travel & Recreation - 0.08% | | | | | | | | | | | | |
Carnival Corporation« | | | | | | 20,795 | | 1,007,102 | | 20,795 | | 1,007,102 |
Total Travel & Recreation | | | | — | | | | 1,007,102 | | | | 1,007,102 |
Wholesale Trade Non-Durable Goods - 0.43% | | | | | | | | | | | | |
AmerisourceBergen Corporation | | | | | | 8,586 | | 389,203 | | 8,586 | | 389,203 |
Brown-Forman Corporation Class B« | | | | | | 4,121 | | 308,704 | | 4,121 | | 308,704 |
Dean Foods Company† | | | | | | 6,172 | | 157,880 | | 6,172 | | 157,880 |
McKesson Corporation | | | | | | 14,107 | | 829,351 | | 14,107 | | 829,351 |
Nike Incorporated Class B | | 9,600 | | 563,136 | | 18,426 | | 1,080,869 | | 28,026 | | 1,644,005 |
SUPERVALU Incorporated | | | | | | 10,013 | | 390,607 | | 10,013 | | 390,607 |
Sysco Corporation | | 13,000 | | 462,670 | | 29,070 | | 1,034,601 | | 42,070 | | 1,497,271 |
Total Wholesale Trade Non-Durable Goods | | | | 1,025,806 | | | | 4,191,215 | | | | 5,217,021 |
Wholesale Trade-Durable Goods - 0.16% | | | | | | | | | | | | |
Kimberly-Clark Corporation | | | | | | 20,284 | | 1,425,154 | | 20,284 | | 1,425,154 |
Patterson Companies Incorporated† | | | | | | 6,669 | | 257,490 | | 6,669 | | 257,490 |
W.W. Grainger Incorporated | | | | | | 3,418 | | 311,687 | | 3,418 | | 311,687 |
Total Wholesale Trade-Durable Goods | | | | — | | | | 1,994,331 | | | | 1,994,331 |
| | | | | | | | | | | | |
Total Common Stocks ( Cost $57,664,427, $509,280,832 and $566,945,259, respectively) | | | | 74,818,829 | | | | 641,938,359 | | | | 716,757,188 |
| | | | | | | | | | | | |
| | |
| Proforma Portfolio of Investments - September 30, 2007 (Unaudited) | | Wells Fargo Advantage Funds |
| | | | | | | | | | | | |
| | | Balanced Fund | | Asset Allocation Fund | | Pro Forma Combined |
| | | Shares or
Principal
Amount | | Value
(Note 2) | | Shares or
Principal
Amount | | Value
(Note 2) | | Shares or
Principal
Amount | | Value
(Note 2) |
Corporate Bonds & Notes - 1.08% | | | | | | | | | | | | |
Agricultural Production Crops - 0.02% | | | | | | | | | | | | |
Bunge Limited Finance Corporation , 4.375% , Due 12/15/2008 | | 275,000 | | 272,032 | | | | | | 275,000 | | 272,032 |
Total Agricultural Production Crops | | 275,000 | | 272,032 | | | | — | | | | 272,032 |
Chemicals & Allied Products - 0.02% | | | | | | | | | | | | |
Johnson & Johnson , 5.55% , Due 8/15/2017 | | 185,000 | | 187,937 | | | | | | 185,000 | | 187,937 |
Total Chemicals & Allied Products | | 185,000 | | 187,937 | | | | — | | | | 187,937 |
Communications - 0.15% | | | | | | | | | | | | |
| | | | | | |
British Telecommunications plc , 8.625% , Due 12/15/2010 | | 265,000 | | 291,751 | | | | | | 265,000 | | 291,751 |
Comcast Corporation , 5.875% , Due 2/15/2018 | | 260,000 | | 255,747 | | | | | | 260,000 | | 255,747 |
Telecom Italia Capital SA , 5.25% , Due 11/15/2013 | | 45,000 | | 43,672 | | | | | | 45,000 | | 43,672 |
| | | | | | |
Time Warner Cable Incorporated , 5.85% , Due 5/1/2017†† | | 135,000 | | 131,248 | | | | | | 135,000 | | 131,248 |
Valor Telecommunications Enterprises , 7.75% , Due 2/15/2015 | | 235,000 | | 246,297 | | | | | | 235,000 | | 246,297 |
Verizon (Florida) Incorporated Series F , 6.125% , Due 1/15/2013 | | 235,000 | | 243,078 | | | | | | 235,000 | | 243,078 |
Verizon (Virginia) Incorporated Series A , 4.625% , Due 3/15/2013 | | 275,000 | | 265,460 | | | | | | 275,000 | | 265,460 |
Vodafone Group plc , 7.75% , Due 2/15/2010 | | 280,000 | | 295,630 | | | | | | 280,000 | | 295,630 |
Total Communications | | 1,730,000 | | 1,772,883 | | | | — | | | | 1,772,883 |
Depository Institutions - 0.19% | | | | | | | | | | | | |
Citigroup Incorporated , 6.00% , Due 8/15/2017« | | 375,000 | | 383,709 | | | | | | 375,000 | | 383,709 |
JPMorgan Chase & Company , 5.125% , Due 9/15/2014« | | 545,000 | | 531,576 | | | | | | 545,000 | | 531,576 |
JPMorgan Chase & Company , 6.625% , Due 3/15/2012 | | 300,000 | | 314,903 | | | | | | 300,000 | | 314,903 |
M&T Bank Corporation , 3.85% , Due 4/1/2013±†† | | 250,000 | | 247,695 | | | | | | 250,000 | | 247,695 |
Wachovia Corporation , 5.75% , Due 6/15/2017« | | 510,000 | | 511,932 | | | | | | 510,000 | | 511,932 |
Washington Mutual Bank , 5.125% , Due 1/15/2015 | | 290,000 | | 270,105 | | | | | | 290,000 | | 270,105 |
Total Depository Institutions | | 2,270,000 | | 2,259,920 | | | | — | | | | 2,259,920 |
Electric, Gas & Sanitary Services - 0.11% | | | | | | | | | | | | |
Carolina Power & Light Company , 6.5% , Due 7/15/2012 | | 190,000 | | 199,283 | | | | | | 190,000 | | 199,283 |
CenterPoint Energy Houston Electric LLC Series J2 , 5.70% , Due 3/15/2013« | | 260,000 | | 260,485 | | | | | | 260,000 | | 260,485 |
MidAmerican Energy Holdings , 5.875% , Due 10/1/2012 | | 220,000 | | 223,397 | | | | | | 220,000 | | 223,397 |
PSI Energy Incorporated , 6.05% , Due 6/15/2016 | | 250,000 | | 251,164 | | | | | | 250,000 | | 251,164 |
Southwestern Electric Power , 4.9% , Due 7/1/2015 | | 365,000 | | 339,764 | | | | | | 365,000 | | 339,764 |
Total Electric, Gas & Sanitary Services | | 1,285,000 | | 1,274,093 | | | | — | | | | 1,274,093 |
Electronic & Other Electrical Equipment & Components, Except Computer Equipment - 0.05% | | | | | | | | | | | | |
Cisco Systems Incorporated , 5.50% , Due 2/22/2016« | | 220,000 | | 218,529 | | | | | | 220,000 | | 218,529 |
General Electric Capital Corporation Series MTN , 5.65% , Due 6/9/2014« | | 390,000 | | 394,274 | | | | | | 390,000 | | 394,274 |
Total Electronic & Other Electrical Equipment & Components, Except Computer Equipment | | 610,000 | | 612,803 | | | | — | | | | 612,803 |
Food & Kindred Products - 0.04% | | | | | | | | | | | | |
HJ Heinz Company , 6.428% , Due 12/1/2008†† | | 200,000 | | 203,164 | | | | | | 200,000 | | 203,164 |
Miller Brewing Corporation , 5.50% , Due 8/15/2013†† | | 265,000 | | 259,735 | | | | | | 265,000 | | 259,735 |
Total Food & Kindred Products | | 465,000 | | 462,899 | | | | — | | | | 462,899 |
Food Stores - 0.03% | | | | | | | | | | | | |
Kroger Company , 6.75% , Due 4/15/2012 | | 170,000 | | 178,767 | | | | | | 170,000 | | 178,767 |
Safeway Incorporated , 5.625% , Due 8/15/2014 | | 235,000 | | 231,687 | | | | | | 235,000 | | 231,687 |
Total Food Stores | | 405,000 | | 410,454 | | | | — | | | | 410,454 |
Holding & Other Investment Offices - 0.04% | | | | | | | | | | | | |
ERP Operating LP , 5.125% , Due 3/15/2016 | | 210,000 | | 194,624 | | | | | | 210,000 | | 194,624 |
Simon Property Group LP , 6.375% , Due 11/15/2007 | | 260,000 | | 260,109 | | | | | | 260,000 | | 260,109 |
Total Holding & Other Investment Offices | | 470,000 | | 454,733 | | | | — | | | | 454,733 |
Insurance Carriers - 0.03% | | | | | | | | | | | | |
ING (USA) Global Funding Trust , 4.50% , Due 10/1/2010 | | 250,000 | | 247,445 | | | | | | 250,000 | | 247,445 |
| | | | | | |
Willis North America Incorporated , 6.20% , Due 3/28/2017 | | 175,000 | | 173,639 | | | | | | 175,000 | | 173,639 |
Total Insurance Carriers | | 425,000 | | 421,084 | | | | — | | | | 421,084 |
Measuring, Analyzing & Controlling Instruments: Photographic, Medical & Optical Goods - 0.02% | | | | | | | | | | | | |
Fisher Scientific International Incorporated , 6.125% , Due 7/1/2015 | | 285,000 | | 279,801 | | | | | | 285,000 | | 279,801 |
Total Measuring, Analyzing & Controlling Instruments: Photographic, Medical & Optical Goods | | 285,000 | | 279,801 | | | | — | | | | 279,801 |
Miscellaneous Retail - 0.01% | | | | | | | | | | | | |
CVS Caremark Corporation , 5.75% , Due 6/1/2017 | | 160,000 | | 156,168 | | | | | | 160,000 | | 156,168 |
Total Miscellaneous Retail | | 160,000 | | 156,168 | | | | — | | | | 156,168 |
Non-Depository Credit Institutions - 0.10% | | | | | | | | | | | | |
General Electric Capital Corporation Series MTN , 5.625% , Due 9/15/2017« | | 255,000 | | 254,930 | | | | | | 255,000 | | 254,930 |
General Electric Capital Corporation Series MTNA , 6.50% , Due 12/10/2007 | | 250,000 | | 250,518 | | | | | | 250,000 | | 250,518 |
| | |
| Proforma Portfolio of Investments - September 30, 2007 (Unaudited) | | Wells Fargo Advantage Funds |
| | | | | | | | | | | | |
| | | Balanced Fund | | Asset Allocation Fund | | Pro Forma Combined |
| | | Shares or
Principal
Amount | | Value
(Note 2) | | Shares or
Principal
Amount | | Value
(Note 2) | | Shares or
Principal
Amount | | Value
(Note 2) |
General Motors Acceptance Corporation , 6.875% , Due 9/15/2011« | | 370,000 | | 352,116 | | | | | | 370,000 | | 352,116 |
HSBC Finance Corporation , 5.90% , Due 6/19/2012 | | 405,000 | | 410,179 | | | | | | 405,000 | | 410,179 |
Total Non-Depository Credit Institutions | | 1,280,000 | | 1,267,743 | | | | — | | | | 1,267,743 |
Oil & Gas Extraction - 0.06% | | | | | | | | | | | | |
Halliburton Company , 5.50% , Due 10/15/2010 | | 255,000 | | 257,961 | | | | | | 255,000 | | 257,961 |
Pemex Project Funding Master Trust , 8% , Due 11/15/2011 | | 275,000 | | 300,713 | | | | | | 275,000 | | 300,713 |
XTO Energy Incorporated , 5.30% , Due 6/30/2015 | | 225,000 | | 216,303 | | | | | | 225,000 | | 216,303 |
Total Oil & Gas Extraction | | 755,000 | | 774,977 | | | | — | | | | 774,977 |
Railroad Transportation - 0.03% | | | | | | | | | | | | |
Union Pacific Corporation , 5.75% , Due 10/15/2007 | | 305,000 | | 305,027 | | | | | | 305,000 | | 305,027 |
Total Railroad Transportation | | 305,000 | | 305,027 | | | | — | | | | 305,027 |
Real Estate Investment Trusts (REITS) - 0.03% | | | | | | | | | | | | |
AvalonBay Communities Series MTN , 6.625% , Due 9/15/2011 | | 240,000 | | 249,522 | | | | | | 240,000 | | 249,522 |
International Lease Finance Corporation Series MTN , 5.65% , Due 6/1/2014 | | 175,000 | | 173,050 | | | | | | 175,000 | | 173,050 |
Total Real Estate Investment Trusts (REITS) | | 415,000 | | 422,572 | | | | — | | | | 422,572 |
Security & Commodity Brokers, Dealers, Exchanges & Services - 0.13% | | | | | | | | | | | | |
Discover Financial Services , 6.45% , Due 6/12/2017†† | | 310,000 | | 300,744 | | | | | | 310,000 | | 300,744 |
Goldman Sachs Group Incorporated , 5.125% , Due 1/15/2015 | | 550,000 | | 528,090 | | | | | | 550,000 | | 528,090 |
Lehman Brothers Holdings Incorporated Series MTN , 6.00% , Due 7/19/2012« | | 735,000 | | 746,393 | | | | | | 735,000 | | 746,393 |
Total Security & Commodity Brokers, Dealers, Exchanges & Services | | 1,595,000 | | 1,575,227 | | | | — | | | | 1,575,227 |
Transportation Equipment - 0.02% | | | | | | | | | | | | |
DaimlerChrysler NA Holding Corporation , 7.75% , Due 1/18/2011 | | 190,000 | | 203,551 | | | | | | 190,000 | | 203,551 |
Total Transportation Equipment | | 190,000 | | 203,551 | | | | — | | | | 203,551 |
| | | | | | | | | | | | |
Total Corporate Bonds and Notes (Cost $13,129,751, $0 and $13,129,751, respectively) | | | | 13,113,904 | | | | — | | | | 13,113,904 |
| | | | | | | | | | | | |
| | | | | | |
Foreign Corporate Bonds - 0.13% | | | | | | | | | | | | |
Deutsche Telekom International Finance BV , 8% , Due 6/15/2010 | | 240,000 | | 257,083 | | | | | | 240,000 | | 257,083 |
Diageo Capital plc , 4.375% , Due 5/3/2010 | | 280,000 | | 276,228 | | | | | | 280,000 | | 276,228 |
Encana Corporation , 4.60% , Due 8/15/2009 | | 285,000 | | 283,146 | | | | | | 285,000 | | 283,146 |
Telecom Italia Capital , 4.95% , Due 9/30/2014 | | 280,000 | | 264,646 | | | | | | 280,000 | | 264,646 |
Telefonica Emisiones SAU , 5.984% , Due 6/20/2011 | | 265,000 | | 269,612 | | | | | | 265,000 | | 269,612 |
Thomson Corporation , 5.70% , Due 10/1/2014 | | 255,000 | | 252,838 | | | | | | 255,000 | | 252,838 |
| | | | | | | | | | | | |
Total Foreign Corporate Bonds (Cost $1,610,394, $0 and $1,610,394, respectively) | | | | 1,603,553 | | | | — | | | | 1,603,553 |
| | | | | | | | | | | | |
| | | | | | |
Foreign Government Bonds - 0.03% | | | | | | | | | | | | |
ICICI Bank Limited , 6.625% , Due 10/3/2012†† | | 195,000 | | 194,836 | | | | | | 195,000 | | 194,836 |
United Mexican States , 7.5% , Due 1/14/2012« | | 160,000 | | 174,880 | | | | | | 160,000 | | 174,880 |
United Mexican States , 5.625% , Due 1/15/2017 | | 40,000 | | 39,880 | | | | | | 40,000 | | 39,880 |
| | | | | | | | | | | | |
Total Foreign Government Bonds (Cost $407,144, $0 and $407,144, respectively) | | | | 409,596 | | | | — | | | | 409,596 |
| | | | | | | | | | | | |
| | | | | | |
US Treasury Securities - 36.08% | | | | | | | | | | | | |
US Treasury Bills - 1.23% | | | | | | | | | | | | |
US Treasury Bill , 3.732% , Due 10/25/2007^# | | 10,000 | | 9,975 | | | | | | 10,000 | | 9,975 |
US Treasury Bill , 3.995% , Due 2/7/2008^# | | | | | | 13,525,000 | | 13,338,314 | | 13,525,000 | | 13,338,314 |
US Treasury Bill , 4.168%, Due 02/07/2008^# | | | | | | 95,000 | | 93,689 | | 95,000 | | 93,689 |
US Treasury Bill , 4.625% , Due 3/31/2008 | | 660,000 | | 661,547 | | | | | | 660,000 | | 661,547 |
US Treasury Bill , 4.754% , Due 11/8/2007^# | | | | | | 305,000 | | 303,768 | | 305,000 | | 303,768 |
US Treasury Bill , 4.828% , Due 10/25/2007^# | | 10,000 | | 9,974 | | | | | | 10,000 | | 9,974 |
US Treasury Bill , 4.887% , Due 11/8/2007^# | | | | | | 510,000 | | 507,939 | | 510,000 | | 507,939 |
Total US Treasury Bills | | | �� | 681,496 | | | | 14,243,710 | | | | 14,925,206 |
US Treasury Bonds - 33.79% | | | | | | | | | | | | |
US Treasury Bond , 10.375% , Due 11/15/2012 | | 1,985,000 | | 2,000,352 | | | | | | 1,985,000 | | 2,000,352 |
US Treasury Bond , 5.25% , Due 11/15/2028« | | | | | | 39,694,000 | | 41,604,274 | | 39,694,000 | | 41,604,274 |
US Treasury Bond , 5.25% , Due 2/15/2029« | | | | | | 40,621,000 | | 42,575,886 | | 40,621,000 | | 42,575,886 |
US Treasury Bond , 5.375% , Due 2/15/2031« | | | | | | 63,016,000 | | 67,456,675 | | 63,016,000 | | 67,456,675 |
US Treasury Bond , 5.50% , Due 8/15/2028« | | | | | | 41,381,000 | | 44,665,617 | | 41,381,000 | | 44,665,617 |
US Treasury Bond , 6.125% , Due 11/15/2027« | | | | | | 79,398,000 | | 91,872,140 | | 79,398,000 | | 91,872,140 |
US Treasury Bond , 6.125% , Due 8/15/2029« | | | | | | 37,934,000 | | 44,252,363 | | 37,934,000 | | 44,252,363 |
US Treasury Bond , 6.25% , Due 5/15/2030« | | | | | | 63,017,000 | | 74,911,459 | | 63,017,000 | | 74,911,459 |
US Treasury Bond , 8.75% , Due 5/15/2017« | | 725,000 | | 954,847 | | | | | | 725,000 | | 954,847 |
Total US Treasury Bonds | | | | 2,955,199 | | | | 407,338,414 | | | | 410,293,613 |
US Treasury Notes - 1.07% | | | | | | | | | | | | |
US Treasury Note , 4.25% , Due 10/15/2010« | | 6,676,000 | | 6,718,246 | | | | | | 6,676,000 | | 6,718,246 |
| | |
| Proforma Portfolio of Investments - September 30, 2007 (Unaudited) | | Wells Fargo Advantage Funds |
| | | | | | | | | | | | |
| | | Balanced Fund | | Asset Allocation Fund | | Pro Forma Combined |
| | | Shares or
Principal
Amount | | Value
(Note 2) | | Shares or
Principal
Amount | | Value
(Note 2) | | Shares or
Principal
Amount | | Value
(Note 2) |
US Treasury Note , 4.25% , Due 11/15/2013 | | 755,000 | | 752,817 | | | | | | 755,000 | | 752,817 |
US Treasury Note , 4.50% , Due 2/15/2009« | | 310,000 | | 312,107 | | | | | | 310,000 | | 312,107 |
US Treasury Note , 4.625% , Due 12/31/2011« | | 1,880,000 | | 1,912,900 | | | | | | 1,880,000 | | 1,912,900 |
US Treasury Note , 4.625% , Due 2/15/2017« | | 305,000 | | 306,406 | | | | | | 305,000 | | 306,406 |
US Treasury Note , 4.75% , Due 8/15/2017« | | 625,000 | | 633,399 | | | | | | 625,000 | | 633,399 |
US Treasury Note , 4.875% , Due 6/30/2012« | | 605,000 | | 621,921 | | | | | | 605,000 | | 621,921 |
US Treasury Note , 4.875% , Due 8/15/2016« | | 1,695,000 | | 1,734,727 | | | | | | 1,695,000 | | 1,734,727 |
Total US Treasury Notes | | | | 12,992,523 | | | | — | | | | 12,992,523 |
| | | | | | | | | | | | |
Total US Treasury Securities (Cost $16,779,354, $404,812,098 and $421,591,452, respectively) | | | | 16,629,218 | | | | 421,582,124 | | | | 438,211,342 |
| | | | | | | | | | | | |
| | | | | | |
Collateral for Securities Lending - 44.87% | | | | | | | | | | | | |
Collateral Invested in Other Assets | | | | | | | | | | | | |
Alpine Securitization Corporation , 5.30% , Due 10/3/2007 | | 773,541 | | 773,317 | | 11,753,676 | | 11,750,268 | | 12,527,217 | | 12,523,585 |
American Express Bank FSB Series BKNT , 5.23% , Due 11/21/2007± | | 96,693 | | 96,668 | | 1,469,210 | | 1,468,828 | | 1,565,903 | | 1,565,496 |
American General Finance Corporation , 5.48% , Due 1/18/2008± | | 1,064 | | 1,064 | | 16,161 | | 16,161 | | 17,225 | | 17,225 |
Atlantic Asset Securitization Corporation , 5.30% , Due 10/2/2007†† | | 290,078 | | 290,035 | | 4,407,629 | | 4,406,967 | | 4,697,707 | | 4,697,002 |
Atlantic Asset Securitization Corporation , 5.30% , Due 10/24/2007 | | 314,164 | | 313,112 | | 4,773,609 | | 4,757,617 | | 5,087,773 | | 5,070,729 |
Atlas Capital Funding Corporation , 5.12% , Due 4/25/2008±†† | | 386,771 | | 386,759 | | 5,876,838 | | 5,876,662 | | 6,263,609 | | 6,263,421 |
Atlas Capital Funding Corporation Series MTN1 , 5.03% , Due 10/25/2007±†† | | 241,732 | | 241,734 | | 3,673,024 | | 3,673,061 | | 3,914,756 | | 3,914,795 |
Bank of Montreal , 5.08% , Due 10/22/2007 | | 290,078 | | 290,037 | | 4,407,629 | | 4,407,011 | | 4,697,707 | | 4,697,048 |
Barclays Repurchase Agreement - 102% collateralized (Maturity Value $870,365) , 5.40% , Due 10/1/2007; (Maturity Value for Asset Allocation $13,224,869) | | 870,234 | | 870,234 | | 13,222,886 | | 13,222,886 | | 14,093,120 | | 14,093,120 |
Barton Capital Corporation , 5.23% , Due 10/2/2007 | | 483,463 | | 483,391 | | 7,346,048 | | 7,344,946 | | 7,829,511 | | 7,828,337 |
Barton Capital Corporation , 5.24% , Due 10/15/2007 | | 386,771 | | 385,982 | | 5,876,838 | | 5,864,849 | | 6,263,609 | | 6,250,831 |
BASF Finance Europe NV , 5.35% , Due 10/17/2008±†† | | 483,463 | | 483,507 | | 7,346,048 | | 7,346,709 | | 7,829,511 | | 7,830,216 |
Bear Stearns & Company Incorporated , 5.33% , Due 10/5/2007± | | 241,732 | | 241,732 | | 3,673,024 | | 3,673,024 | | 3,914,756 | | 3,914,756 |
Bear Stearns & Company Incorporated International Repurchase Agreement - 102% collateralized (Maturity Value $483,534) , 5.30% , Due 10/1/2007; (Maturity Value for Asset Allocation $7,347,130) | | 483,463 | | 483,463 | | 7,346,048 | | 7,346,048 | | 7,829,511 | | 7,829,511 |
Bear Stearns & Company Incorporated Repurchase Agreement - 102% collateralized (Maturity Value $1,208,838) , 5.35% , Due 10/1/2007; (Maturity Value for Asset Allocation $18,367,848) | | 1,208,658 | | 1,208,658 | | 18,365,119 | | 18,365,119 | | 19,573,777 | | 19,573,777 |
Bear Stearns & Company Incorporated Series MTN , 5.37% , Due 10/3/2007± | | 466,542 | | 466,542 | | 7,088,936 | | 7,088,936 | | 7,555,478 | | 7,555,478 |
| | | | | | |
BNP Paribas , 5.33% , Due 5/7/2008± | | 290,078 | | 289,872 | | 4,407,629 | | 4,404,499 | | 4,697,707 | | 4,694,371 |
BNP Paribas Repurchase Agreement - 102% collateralized (Maturity Value $483,535) , 5.33% , Due 10/1/2007; (Maturity Value for Asset Allocation $7,347,136) | | 483,463 | | 483,463 | | 7,346,048 | | 7,346,048 | | 7,829,511 | | 7,829,511 |
Cancara Asset Securitization Limited , 5.19% , Due 10/17/2007†† | | 145,039 | | 144,701 | | 2,203,814 | | 2,198,679 | | 2,348,853 | | 2,343,380 |
Chariot Funding LLC , 5.31% , Due 10/9/2007†† | | 145,039 | | 144,869 | | 2,203,814 | | 2,201,236 | | 2,348,853 | | 2,346,105 |
Chariot Funding LLC , 5.37% , Due 10/4/2007†† | | 386,771 | | 386,601 | | 5,876,838 | | 5,874,252 | | 6,263,609 | | 6,260,853 |
Cheyne Finance LLC , 4.98% , Due 2/25/2008±†† | | 275,574 | | 263,997 | | 4,187,247 | | 4,011,341 | | 4,462,821 | | 4,275,338 |
CIT Group Incorporated , 5.67% , Due 12/19/2007± | | 96,693 | | 96,173 | | 1,469,210 | | 1,461,320 | | 1,565,903 | | 1,557,493 |
Citigroup Repurchase Agreement - 102% collateralized (Maturity Value $2,175,907) , 5.33% , Due 10/1/2007; (Maturity Value for Asset Allocation $35,411,123) | | 2,175,585 | | 2,175,585 | | 35,405,881 | | 35,405,881 | | 37,581,466 | | 37,581,466 |
| | | | | | |
Clipper Receivables Corporation , 5.22% , Due 10/1/2007†† | | 48,346 | | 48,346 | | 734,605 | | 734,605 | | 782,951 | | 782,951 |
Cobbler Funding Limited , 5.13% , Due 10/25/2007†† | | | | | | 54,688,984 | | 54,497,572 | | 54,688,984 | | 54,497,572 |
Credit Agricole SA , 5.49% , Due 2/25/2008 | | 217,559 | | 217,428 | | 3,305,721 | | 3,303,738 | | 3,523,280 | | 3,521,166 |
Credit Suisse First Boston (USA) Incorporated Series MTN , 5.97% , Due 10/29/2007± | | 22,143 | | 22,156 | | 336,449 | | 336,654 | | 358,592 | | 358,810 |
| | | | | | |
Credit Suisse First Boston Repurchase Agreement - 102% collateralized (Maturity Value $1,553,512) , 5.35% , Due 10/1/2007; (Maturity Value for Asset Allocation $23,605,044) | | 1,553,281 | | 1,553,281 | | 23,601,537 | | 23,601,537 | | 25,154,818 | | 25,154,818 |
Cullinan Finance Corporation , 5.32% , Due 8/4/2008±†† | | 241,732 | | 241,679 | | 3,673,024 | | 3,672,216 | | 3,914,756 | | 3,913,895 |
Ebbets Funding LLC , 5.90% , Due 10/1/2007†† | | 454,456 | | 454,456 | | 6,905,285 | | 6,905,285 | | 7,359,741 | | 7,359,741 |
Erasmus Capital Corporation , 5.34% , Due 10/10/2007†† | | 193,385 | | 193,132 | | 2,938,419 | | 2,934,570 | | 3,131,804 | | 3,127,702 |
Erasmus Capital Corporation , 5.65% , Due 10/1/2007†† | | 676,849 | | 676,849 | | 10,284,467 | | 10,284,467 | | 10,961,316 | | 10,961,316 |
Fairway Finance Corporation , 5.30% , Due 10/5/2007†† | | 483,463 | | 483,183 | | 7,346,048 | | 7,341,787 | | 7,829,511 | | 7,824,970 |
Fairway Finance Corporation , 5.31% , Due 10/10/2007†† | | 87,023 | | 86,909 | | 1,322,289 | | 1,320,556 | | 1,409,312 | | 1,407,465 |
| | |
| Proforma Portfolio of Investments - September 30, 2007 (Unaudited) | | Wells Fargo Advantage Funds |
| | | | | | | | | | | | |
| | | Balanced Fund | | Asset Allocation Fund | | Pro Forma Combined |
| | | Shares or
Principal
Amount | | Value
(Note 2) | | Shares or
Principal
Amount | | Value
(Note 2) | | Shares or
Principal
Amount | | Value
(Note 2) |
Falcon Asset Securitization Corporation , 5.35% , Due 11/6/2007 | | 145,039 | | 144,279 | | 2,203,814 | | 2,192,266 | | 2,348,853 | | 2,336,545 |
Fountain Square Commercial Funding Corporation , 5.38% , Due 10/31/2007 | | 96,693 | | 96,270 | | 1,469,210 | | 1,462,789 | | 1,565,903 | | 1,559,059 |
Galleon Capital LLC , 5.25% , Due 10/2/2007†† | | 241,732 | | 241,695 | | 3,673,024 | | 3,672,473 | | 3,914,756 | | 3,914,168 |
Galleon Capital LLC , 5.28% , Due 10/1/2007†† | | 290,078 | | 290,078 | | 4,407,629 | | 4,407,629 | | 4,697,707 | | 4,697,707 |
Galleon Capital LLC , 5.34% , Due 10/19/2007 | | 367,432 | | 366,469 | | 5,582,996 | | 5,568,369 | | 5,950,428 | | 5,934,838 |
General Electric Capital Assurance Company , 5.83% , Due 6/16/2008± | | 154,708 | | 154,708 | | 2,350,735 | | 2,350,735 | | 2,505,443 | | 2,505,443 |
ING (USA) Annuity & Life Insurance Company , 5.82% , Due 8/16/2008± | | 338,424 | | 338,424 | | 5,142,233 | | 5,142,233 | | 5,480,657 | | 5,480,657 |
K2 (USA) LLC , 6.11% , Due 10/5/2007 | | 949,522 | | 948,971 | | 14,427,637 | | 14,419,269 | | 15,377,159 | | 15,368,240 |
Kestrel Funding US LLC , 5.10% , Due 2/25/2008±†† | | 348,094 | | 347,773 | | 5,289,154 | | 5,284,288 | | 5,637,248 | | 5,632,061 |
Liberty Light US Capital , 5.02% , Due 11/21/2007±†† | | 24,173 | | 24,143 | | 367,302 | | 366,847 | | 391,475 | | 390,990 |
Liberty Street Funding Corporation , 5.26% , Due 10/9/2007†† | | 386,548 | | 386,096 | | 5,873,459 | | 5,866,587 | | 6,260,007 | | 6,252,683 |
Liquid Funding Limited , 5.70% , Due 6/11/2008±†† | | 725,195 | | 725,790 | | 11,019,071 | | 11,028,107 | | 11,744,266 | | 11,753,897 |
M&I Marshall & Ilsley Bank Series BKNT , 5.53% , Due 2/15/2008± | | 9,669 | | 9,673 | | 146,921 | | 146,978 | | 156,590 | | 156,651 |
Merrill Lynch & Company Incorporated Series MTNB , 5.44% , Due 1/2/2008± | | 7,252 | | 7,251 | | 110,191 | | 110,170 | | 117,443 | | 117,421 |
MetLife Global Funding I , 5.13% , Due 10/21/2008±†† | | 241,732 | | 241,507 | | 3,673,024 | | 3,669,608 | | 3,914,756 | | 3,911,115 |
Morgan Stanley , 5.32% , Due 4/7/2008± | | 145,039 | | 145,039 | | 2,203,814 | | 2,203,814 | | 2,348,853 | | 2,348,853 |
Morgan Stanley , 5.48% , Due 11/9/2007± | | 20,789 | | 20,786 | | 315,880 | | 315,830 | | 336,669 | | 336,616 |
| | | | | | |
Morgan Stanley Repurchase Agreement - 102% collateralized (Maturity Value $1,532,265) , 5.33% , Due 10/1/2007; (Maturity Value for Asset Allocation $23,282,206) | | 1,532,038 | | 1,532,038 | | 23,278,759 | | 23,278,759 | | 24,810,797 | | 24,810,797 |
Morgan Stanley Repurchase Agreement - 102% collateralized (Maturity Value $773,656) , 5.33% , Due 10/1/2007; (Maturity Value for Asset Allocation $11,755,416) | | 773,541 | | 773,541 | | 11,753,676 | | 11,753,676 | | 12,527,217 | | 12,527,217 |
| | | | | | |
Morgan Stanley Series EXL , 5.83% , Due 10/14/2008± | | 148,665 | | 148,509 | | 2,258,910 | | 2,256,538 | | 2,407,575 | | 2,405,047 |
Natexis Banques Populaires , 5.35% , Due 11/9/2007±†† | | 241,732 | | 241,911 | | 3,673,024 | | 3,675,742 | | 3,914,756 | | 3,917,653 |
Nieuw Amsterdam Receivables Corporation , 5.35% , Due 10/1/2007†† | | 570,487 | | 570,487 | | 8,668,336 | | 8,668,336 | | 9,238,823 | | 9,238,823 |
| | | | | | |
Perry Global Funding LLC Series A , 5.59% , Due 10/11/2007 | | 435,117 | | 434,482 | | 6,611,443 | | 6,601,790 | | 7,046,560 | | 7,036,272 |
Premium Asset Trust , 5.50% , Due 7/15/2008±†† | | 172,113 | | 172,306 | | 2,615,193 | | 2,618,122 | | 2,787,306 | | 2,790,428 |
| | | | | | |
Racers Trust Series 2004-6-MM , 5.19% , Due 3/24/2008±†† | | 454,020 | | 453,484 | | 6,898,673 | | 6,890,519 | | 7,352,693 | | 7,344,003 |
Regency Markets #1 LLC , 5.21% , Due 10/12/2007†† | | 642,233 | | 641,205 | | 9,758,490 | | 9,742,876 | | 10,400,723 | | 10,384,081 |
Regency Markets #1 LLC , 5.25% , Due 10/4/2007†† | | 145,039 | | 144,975 | | 2,203,814 | | 2,202,845 | | 2,348,853 | | 2,347,820 |
| | | | | | |
Royal Bank of Scotland Group plc , 5.55% , Due 10/5/2007 | | 193,385 | | 193,389 | | 2,938,419 | | 2,938,478 | | 3,131,804 | | 3,131,867 |
Scaldis Capital Limited , 5.26% , Due 10/4/2007†† | | 773,541 | | 773,201 | | 11,753,676 | | 11,748,505 | | 12,527,217 | | 12,521,706 |
Scaldis Capital Limited , 5.29% , Due 10/22/2007 | | 149,874 | | 149,415 | | 2,277,275 | | 2,270,306 | | 2,427,149 | | 2,419,721 |
Sedna Finance Incorporated Series MTN , 5.33% , Due 10/26/2007±†† | | 174,047 | | 174,028 | | 2,644,577 | | 2,644,286 | | 2,818,624 | | 2,818,314 |
| | | | | | |
Sheffield Receivables Corporation , 5.25% , Due 10/5/2007†† | | 133,436 | | 133,358 | | 2,027,509 | | 2,026,333 | | 2,160,945 | | 2,159,691 |
SLM Corporation , 5.81% , Due 5/12/2008±†† | | 193,385 | | 191,689 | | 2,938,419 | | 2,912,649 | | 3,131,804 | | 3,104,338 |
Stanfield Victoria Funding LLC , 5.36% , Due 4/3/2008±†† | | 386,771 | | 386,635 | | 5,876,838 | | 5,874,781 | | 6,263,609 | | 6,261,416 |
Thames Asset Global Securitization #1 Incorporated , 5.3471% , Due 10/15/2007†† | | 676,849 | | 675,468 | | 10,284,467 | | 10,263,486 | | 10,961,316 | | 10,938,954 |
| | | | | | |
The Travelers Insurance Company , 5.89% , Due 2/8/2008± | | 185,834 | | 185,830 | | 2,823,674 | | 2,823,617 | | 3,009,508 | | 3,009,447 |
| | | | | | |
Thunder Bay Funding Incorporated , 5.31% , Due 10/9/2007 | | 232,933 | | 232,660 | | 3,539,326 | | 3,535,185 | | 3,772,259 | | 3,767,845 |
| | | | | | |
Thunder Bay Funding Incorporated , 5.32% , Due 10/25/2007 | | 145,039 | | 144,531 | | 2,203,814 | | 2,196,101 | | 2,348,853 | | 2,340,632 |
Transamerica Occidental Life Insurance , 5.45% , Due 8/1/2008± | | 966,927 | | 966,927 | | 14,692,095 | | 14,692,095 | | 15,659,022 | | 15,659,022 |
UniCredito Italiano Bank (Ireland) Series LIB , 5.84% , Due 10/8/2008±†† | | 241,732 | | 241,289 | | 3,673,024 | | 3,666,302 | | 3,914,756 | | 3,907,591 |
UniCredito Italiano Bank (New York) Series YCD , 5.62% , Due 12/3/2007± | | 52,214 | | 52,223 | | 793,373 | | 793,513 | | 845,587 | | 845,736 |
UniCredito Italiano Bank (New York) Series YCD , 5.70% , Due 12/13/2007± | | 16,438 | | 16,440 | | 249,766 | | 249,793 | | 266,204 | | 266,233 |
Versailles CDS LLC , 5.39% , Due 10/16/2007 | | 96,693 | | 96,481 | | 1,469,210 | | 1,465,992 | | 1,565,903 | | 1,562,473 |
Versailles CDS LLC , 5.40% , Due 10/23/2007 | | 357,763 | | 356,614 | | 5,436,075 | | 5,418,625 | | 5,793,838 | | 5,775,239 |
Victoria Finance LLC , 5.34% , Due 8/7/2008±†† | | 241,732 | | 241,732 | | 3,673,024 | | 3,673,024 | | 3,914,756 | | 3,914,756 |
Victoria Finance LLC , 5.84% , Due 5/2/2008±†† | | 241,732 | | 241,734 | | 3,673,024 | | 3,673,024 | | 3,914,756 | | 3,914,758 |
World Savings Bank FSB Series BKNT , 5.36% , Due 10/19/2007± | | 967 | | 967 | | 14,692 | | 14,693 | | 15,659 | | 15,660 |
Zela Finance Corporation , 5.32% , Due 10/26/2007 | | 96,693 | | 96,340 | | 1,469,210 | | 1,463,845 | | 1,565,903 | | 1,560,185 |
Total Collateral Invested in Other Assets | | | | 30,131,756 | | | | 514,687,163 | | | | 544,818,919 |
| | |
| Proforma Portfolio of Investments - September 30, 2007 (Unaudited) | | Wells Fargo Advantage Funds |
| | | | | | | | | | | | | | | | | | |
| | | Balanced Fund | | | Asset Allocation Fund | | | Pro Forma Combined | |
| | | Shares or
Principal
Amount | | Value
(Note 2) | | | Shares or
Principal
Amount | | Value
(Note 2) | | | Shares or
Principal
Amount | | Value
(Note 2) | |
Total Collateral for Securities Lending (Cost $30,131,756, $514,687,163 and $544,818,919, respectively) | | | | | 30,131,756 | | | | | | 514,687,163 | | | | | | 544,818,919 | |
| | | | | | | | | | | | | | | | | | |
| | | | | | |
Short-Term Investments (a) - 1.76% | | | | | | | | | | | | | | | | | | |
Mutual Funds - 1.75% | | | | | | | | | | | | | | | | | | |
Wells Fargo Advantage Money Market Trust ‡~ | | 3,032,921 | | | 3,032,921 | | | 18,171,531 | | | 18,171,531 | | | 21,204,452 | | | 21,204,452 | |
Total Mutual Funds | | | | | 3,032,921 | | | | | | 18,171,531 | | | | | | 21,204,452 | |
| | | | | | | | | | | | | | | | | | |
Total Short-Term Investments (Cost $3,032,921, $18,171,531 and $21,204,452, respectively) | | | | | 3,032,921 | | | | | | 18,171,531 | | | | | | 21,204,452 | |
| | | | | | | | | | | | | | | | | | |
| | | | | | |
Total Investments in Securities (Cost $141,216,274, $1,446,951,624 and $1,588,167,898, respectively) 144.48%* | | | | | 158,139,045 | | | | | | 1,596,379,177 | | | | | | 1,754,518,222 | |
Other Assets and Liabilities, Net - (44.48%) | | | | | (29,342,655 | ) | | | | | (510,812,348 | ) | | | | | (540,155,003 | ) |
| | | | | | | | | | | | | | | | | | |
Net Assets - 100.0% | | | | $ | 128,796,390 | | | | | $ | 1,085,566,829 | | | | | $ | 1,214,363,219 | |
| | | | | | | | | | | | | | | | | | |
| « | All or a portion of this security is on loan. (See Note 2) |
| † | Non-income earning securities. |
| ‡ | Security of an affiliate of the fund with a cost of $21,204,452. |
| ± | Variable rate investments. |
| †† | Securities that may be resold to “qualified institutional buyers” under rule 144A or securities offered pursuant to section 4(2) of the Securities Act of 1933, as amended. |
| ^ | Zero coupon bond. Interest rate presented is yield to maturity. |
| # | Security pledged as collateral for futures transactions. (See Note 2) |
| ~ | This Wells Fargo Advantage Fund invests cash balances that it retains for liquidity purposes in a Wells Fargo Advantage Money Market Fund. The fund does not pay an investment advisory fee for such investments. |
| | |
| Proforma Portfolio of Investments - September 30, 2007 (Unaudited) | | Wells Fargo Advantage Funds |
| | | | | | | | | | | | |
| | | Balanced Fund | | Asset Allocation Fund | | Pro Forma Combined |
| | | Shares or
Principal
Amount | | Value
(Note 2) | | Shares or
Principal
Amount | | Value
(Note 2) | | Shares or
Principal
Amount | | Value
(Note 2) |
| * | Cost for federal income tax purposes is substantially the same as for financial reporting purposes. |
The accompanying notes are an integral part of these proforma financial statements.
| | |
| Proforma Statement of Assets and Liabilities - September 30, 2007 (Unaudited) | | Wells Fargo Advantage Funds |
| | | | | | | | | | | | | | | | |
| | | Balanced
Fund | | | Asset
Allocation
Fund | | | Proforma
Adjustments | | | Proforma
Combined | |
Assets | | | | | | | | | | | | | | | | |
Investments | | | | | | | | | | | | | | | | |
In securities, at market value | | $ | 124,974,368 | | | $ | 1,057,846,324 | | | | | | | $ | 1,182,820,692 | |
Collateral for securities loaned | | | 30,131,756 | | | | 514,687,163 | | | | | | | | 544,818,919 | |
Investments in affiliates | | | 3,032,921 | | | | 23,845,690 | | | | | | | | 26,878,611 | |
| | | | | | | | | | | | | | | | |
Total investments at market value (see cost below) | | | 158,139,045 | | | | 1,596,379,177 | | | | — | | | | 1,754,518,222 | |
| | | | | | | | | | | | | | | | |
Cash | | | — | | | | 100,000 | | | | | | | | 100,000 | |
Receivable for Fund shares issued | | | 8,938 | | | | 198,051 | | | | | | | | 206,989 | |
Receivable for investments sold | | | 1,813,172 | | | | 436,017 | | | | | | | | 2,249,189 | |
Receivables for dividends and interest | | | 713,161 | | | | 6,225,002 | | | | | | | | 6,938,163 | |
| | | | | | | | | | | | | | | | |
Total assets | | | 160,674,316 | | | | 1,603,338,247 | | | | — | | | | 1,764,012,563 | |
| | | | | | | | | | | | | | | | |
| | | | |
Liabilities | | | | | | | | | | | | | | | | |
Payable for daily variation margin on futures contracts | | | 891 | | | | 721,469 | | | | | | | | 722,360 | |
Payable for Fund shares redeemed | | | 64,558 | | | | 979,395 | | | | | | | | 1,043,953 | |
Payable for investments purchased | | | 1,477,516 | | | | 324,691 | | | | | | | | 1,802,207 | |
Payable to investment advisor and affiliates | | | 56,008 | | | | 827,610 | | | | | | | | 883,618 | |
Payable for securities loaned | | | 30,131,756 | | | | 514,687,163 | | | | | | | | 544,818,919 | |
Accrued expenses and other liabilities | | | 147,197 | | | | 231,090 | | | | | | | | 378,287 | |
| | | | | | | | | | | | | | | | |
Total liabilities | | | 31,877,926 | | | | 517,771,418 | | | | — | | | | 549,649,344 | |
| | | | | | | | | | | | | | | | |
Total net assets | | $ | 128,796,390 | | | $ | 1,085,566,829 | | | $ | — | | | $ | 1,214,363,219 | |
| | | | | | | | | | | | | | | | |
| | | | |
NET ASSETS CONSIST OF | | | | | | | | | | | | | | | | |
Paid-in capital | | $ | 114,087,434 | | | $ | 930,359,841 | | | | | | | $ | 1,044,447,275 | |
Undistributed net investment income (loss) | | | 45,205 | | | | 356,969 | | | | | | | | 402,174 | |
Undistributed net realized gain (loss) on investments | | | (2,278,111 | ) | | | (81,325 | ) | | | | | | | (2,359,436 | ) |
Net unrealized appreciation (depreciation) of investments, foreign currencies and translation of assets and liabilities denominated in foreign currencies | | | 16,922,771 | | | | 149,427,553 | | | | | | | | 166,350,324 | |
Net unrealized appreciation (depreciation) of futures | | | 19,091 | | | | 5,503,791 | | | | | | | | 5,522,882 | |
| | | | | | | | | | | | | | | | |
Total net assets | | $ | 128,796,390 | | | $ | 1,085,566,829 | | | $ | — | | | $ | 1,214,363,219 | |
| | | | | | | | | | | | | | | | |
| | | | |
COMPUTATION OF NET ASSET VALUE AND OFFERING PRICE PER SHARE1 | | | | | | | | | | | | | | | | |
Net assets – Class A | | | NA | | | $ | 914,716,052 | | | $ | 128,796,390 | 3 | | $ | 1,043,512,442 | |
Shares outstanding – Class A | | | NA | | | | 39,572,395 | | | | 5,562,226 | | | | 45,134,621 | |
Net asset value per share – Class A | | | NA | | | $ | 23.12 | | | | | | | $ | 23.12 | |
Maximum offering price per share – Class A2 | | | NA | | | $ | 24.53 | | | | | | | $ | 24.53 | |
Net assets – Class B | | | NA | | | $ | 85,203,123 | | | | | | | $ | 85,203,123 | |
Shares outstanding – Class B | | | NA | | | | 6,054,751 | | | | | | | | 6,054,751 | |
Net asset value and offering price per share – Class B | | | NA | | | $ | 14.07 | | | | | | | $ | 14.07 | |
Net assets – Class C | | | NA | | | $ | 36,028,221 | | | | | | | $ | 36,028,221 | |
Shares outstanding – Class C | | | NA | | | | 2,560,679 | | | | | | | | 2,560,679 | |
Net asset value and offering price per share – Class C | | | NA | | | $ | 14.07 | | | | | | | $ | 14.07 | |
Net assets – Administrator Class | | | NA | | | $ | 49,619,433 | | | | | | | $ | 49,619,433 | |
Shares outstanding – Administrator Class | | | NA | | | | 2,143,423 | | | | | | | | 2,143,423 | |
Net asset value and offering price per share – Administrator Class | | | NA | | | $ | 23.15 | | | | | | | $ | 23.15 | |
Net assets – Investor Class | | $ | 128,796,390 | | | | NA | | | $ | (128,796,390 | ) 3 | | $ | — | |
Shares outstanding – Investor Class | | | 5,751,279 | | | | NA | | | | (5,751,279 | ) | | | — | |
Net asset value and offering price per share – Investor Class | | $ | 22.39 | | | | NA | | | | | | | $ | — | |
| | | | | | | | | | | | | | | | |
Investments at cost | | $ | 141,216,274 | | | $ | 1,446,951,624 | | | $ | — | | | $ | 1,588,167,898 | |
| | | | | | | | | | | | | | | | |
Securities on loan, at market value | | $ | 29,516,460 | | | $ | 502,956,955 | | | $ | — | | | $ | 532,473,415 | |
| | | | | | | | | | | | | | | | |
1 | Each Fund has an unlimited number of authorized shares. |
2 | Maximum offering price is computed as 100/94.25 of net asset value. On investment of $50,000 or more, the offering price is reduced. |
3 | Investor Class shares of Balanced Fund are exchanged for Class A shares of Asset Allocation Fund in an amount equal to the total value of the Investor Class shares divided by the current per share value of the Class A shares. |
The accompanying notes are an integral part of these proforma financial statements.
| | |
| Proforma Statement of Operations - For the Twelve Months Ended September 30, 2007 (Unaudited) | | Wells Fargo Advantage Funds |
| | | | | | | | | | | | | | | | |
| | | Balanced
Fund | | | Asset
Allocation
Fund | | | Proforma
Adjustments | | | Proforma
Combined | |
Investment Income | | | | | | | | | | | | | | | | |
Dividends(a) | | $ | 1,593,811 | | | $ | 12,306,673 | | | | | | | $ | 13,900,484 | |
Interest | | | 2,643,029 | | | | 21,455,985 | | | | | | | | 24,099,014 | |
Income from affiliated securities | | | 133,335 | | | | 1,824,001 | | | | | | | | 1,957,336 | |
Securities lending income, net | | | 37,538 | | | | 653,587 | | | | | | | | 691,125 | |
| | | | | | | | | | | | | | | | |
Total investment income | | | 4,407,713 | | | | 36,240,246 | | | | — | | | | 40,647,959 | |
| | | | | | | | | | | | | | | | |
| | | | |
Expenses | | | | | | | | | | | | | | | | |
Advisory fees | | | 840,534 | | | | 6,843,294 | | | | (108,450 | )1 | | | 7,575,378 | |
Administration fees | | | | | | | | | | | | | | | | |
Fund Level | | | 646,565 | | | | 554,123 | | | | (580,199 | )1 | | | 620,489 | |
Class A | | | — | | | | 2,502,598 | | | | 369,801 | 1 | | | 2,872,399 | |
Class B | | | — | | | | 296,047 | | | | | | | | 296,047 | |
Class C | | | — | | | | 101,282 | | | | | | | | 101,282 | |
Administrator Class | | | — | | | | 72,557 | | | | | | | | 72,557 | |
Custody fees | | | 25,863 | | | | 221,649 | | | | | | | | 247,512 | |
Shareholder servicing fees | | | 323,282 | | | | 2,770,613 | | | | | | | | 3,093,895 | |
Accounting fees | | | 28,460 | | | | 84,031 | | | | (18,655 | )1 | | | 93,836 | |
Distribution fees | | | | | | | | | | | | | | | | |
Class B | | | — | | | | 792,982 | | | | | | | | 792,982 | |
Class C | | | — | | | | 271,294 | | | | | | | | 271,294 | |
Professional fees | | | 25,640 | | | | 41,500 | | | | (20,797 | )2 | | | 46,343 | |
Registration fees | | | 27,707 | | | | 38,294 | | | | (23,239 | )2 | | | 42,762 | |
Shareholder reports | | | 94,101 | | | | 228,368 | | | | (80,617 | )2 | | | 241,852 | |
Trustees’ fees | | | 8,955 | | | | 8,955 | | | | (7,910 | )2 | | | 10,000 | |
Other fees and expenses | | | 7,302 | | | | 32,122 | | | | (3,554 | )2 | | | 35,870 | |
| | | | | | | | | | | | | | | | |
Total expenses | | | 2,028,409 | | | | 14,859,709 | | | | (473,620 | ) | | | 16,414,498 | |
| | | | | | | | | | | | | | | | |
| | | | |
Less | | | | | | | | | | | | | | | | |
Waived fees and reimbursed expenses | | | (411,977 | ) | | | (1,231,991 | ) | | | 386,397 | | | | (1,257,571 | ) |
Net expenses | | | 1,616,432 | | | | 13,627,718 | | | | (87,223 | ) | | | 15,156,927 | |
| | | | | | | | | | | | | | | | |
Net investment income (loss) | | | 2,791,281 | | | | 22,612,528 | | | | 87,223 | | | | 25,491,032 | |
| | | | | | | | | | | | | | | | |
| | | | |
REALIZED AND UNREALIZED GAIN (LOSS) ON INVESTMENTS | | | | | | | | | | | | | | | | |
| | | | |
Net realized gain (loss) from | | | | | | | | | | | | | | | | |
Securities, foreign currencies and foreign currency translation | | | 4,852,856 | | | | 18,214,367 | | | | | | | | 23,067,223 | |
Futures transactions | | | 12,351 | | | | 40,068,335 | | | | | | | | 40,080,686 | |
| | | | | | | | | | | | | | | | |
Net realized gain (loss) from Investments | | | 4,865,207 | | | | 58,282,702 | | | | — | | | | 63,147,909 | |
| | | | | | | | | | | | | | | | |
| | | | |
Net change in unrealized appreciation (depreciation) of | | | | | | | | | | | | | | | | |
Securities, foreign currencies and foreign currency translation | | | 5,796,671 | | | | 66,248,196 | | | | | | | | 72,044,867 | |
Futures transactions | | | 14,659 | | | | 5,793,678 | | | | | | | | 5,808,337 | |
| | | | | | | | | | | | | | | | |
| | | | |
Net change in unrealized appreciation (depreciation) of investments | | | 5,811,330 | | | | 72,041,874 | | | | — | | | | 77,853,204 | |
| | | | | | | | | | | | | | | | |
Net realized and unrealized gain (loss) on investments | | | 10,676,537 | | | | 130,324,576 | | | | — | | | | 141,001,113 | |
| | | | | | | | | | | | | | | | |
Net increase (decrease) in net assets resulting from operations | | $ | 13,467,818 | | | $ | 152,937,104 | | | $ | 87,223 | | | $ | 166,492,145 | |
| | | | | | | | | | | | | | | | |
a Net of foreign withholding taxes of | | $ | 4,570 | | | $ | — | | | $ | — | | | $ | 4,570 | |
1 | Based on contractual agreements of the surviving fund. |
2 | Estimated cost increases (savings) as a result of merging the funds. |
The accompanying notes are an integral part of these proforma financial statements.
| | |
| Proforma Portfolio of Investments - November 30, 2007 (Unaudited) | | Wells Fargo Advantage Funds |
| | | | | | | | | | | | | | | |
| | | Corporate Bond Fund | | Income Plus Fund | | Pro Forma Combined |
| | | Shares or
Principal
Amount | | Value
(Note 2) | | Shares or
Principal
Amount | | Value
(Note 2) | | Shares or
Principal
Amount | | Value
(Note 2) |
Agency Notes - Interest Bearing - 1.36% | | | | | | | | | | | | | | | |
FHLMC 5.13%, Due 08/23/10« | | | | | | | 1,795,000 | | $ | 1,859,810 | | 1,795,000 | | $ | 1,859,810 |
FNMA 4.75%, Due 11/19/12« | | | | | | | 2,080,000 | | | 2,145,183 | | 2,080,000 | | | 2,145,183 |
| | | | | | | | | | | | | | | |
Total Agency Notes - Interest Bearing (Cost $0, $3,912,497 and $3,912,497, respectively) | | | | | | | | | | 4,004,993 | | | | | 4,004,993 |
| | | | | | | | | | | | | | | |
| | | | | | |
Agency Securities - 6.18% | | | | | | | | | | | | | | | |
Federal Home Loan Mortgage Corporation - 0.51% | | | | | | | | | | | | | | | |
FHLMC TBA 6.00%, Due 12/01/37 | | | | | | | 690,000 | | | 700,350 | | 690,000 | | | 700,350 |
FHLMC #H01396 6.50%, Due 02/01/36 | | | | | | | 385,199 | | | 393,686 | | 385,199 | | | 393,686 |
FHLMC #1J1263 5.85%, Due 01/01/36«± | | | | | | | 399,421 | | | 406,018 | | 399,421 | | | 406,018 |
FHLMC #C00922 8.00%, Due 02/01/30 | | | | | | | 1,842 | | | 1,972 | | 1,842 | | | 1,972 |
FHLMC #170027 14.75%, Due 03/01/10 | | 440 | | $ | 496 | | | | | | | 440 | | | 496 |
FHLMC #170065 14.00%, Due 09/01/12 | | 3,004 | | | 3,435 | | | | | | | 3,004 | | | 3,435 |
Total Federal Home Loan Mortgage Corporation | | | | | 3,931 | | | | | 1,502,026 | | | | | 1,505,957 |
Federal National Mortgage Association - 5.67% | | | | | | | | | | | | | | | |
FNMA TBA 5.00%, Due 12/01/36 | | | | | | | 820,000 | | | 803,600 | | 820,000 | | | 803,600 |
FNMA TBA 5.50%, Due 12/01/21 | | | | | | | 1,265,000 | | | 1,279,625 | | 1,265,000 | | | 1,279,625 |
FNMA TBA 6.00%, Due 12/01/37 | | | | | | | 1,005,000 | | | 1,021,330 | | 1,005,000 | | | 1,021,330 |
FNMA TBA 6.50%, Due 12/01/37 | | | | | | | 1,539,000 | | | 1,582,765 | | 1,539,000 | | | 1,582,765 |
FNMA 6.00%, Due 05/15/11 | | | | | | | 390,000 | | | 418,057 | | 390,000 | | | 418,057 |
FNMA #725715 5.50%, Due 08/01/34« | | | | | | | 1,697,631 | | | 1,703,308 | | 1,697,631 | | | 1,703,308 |
FNMA #735230 5.50%, Due 02/01/35« | | | | | | | 1,380,659 | | | 1,385,277 | | 1,380,659 | | | 1,385,277 |
FNMA #831621 7.00%, Due 07/01/36 | | | | | | | 291,204 | | | 302,281 | | 291,204 | | | 302,281 |
FNMA #863727 5.34%, Due 01/01/36«± | | | | | | | 847,630 | | | 861,132 | | 847,630 | | | 861,132 |
FNMA # 886087 6.50%, Due 07/01/36 | | | | | | | 448,331 | | | 461,175 | | 448,331 | | | 461,175 |
FNMA #886686 6.16%, Due 08/01/36± | | | | | | | 514,924 | | | 524,901 | | 514,924 | | | 524,901 |
FNMA #888022 5.00%, Due 02/01/36« | | | | | | | 479,789 | | | 470,698 | | 479,789 | | | 470,698 |
FNMA #888538 5.50%, Due 01/01/37« | | | | | | | 1,037,758 | | | 1,040,144 | | 1,037,758 | | | 1,040,144 |
FNMA #892283 5.86%, Due 09/01/36«± | | | | | | | 350,409 | | | 355,917 | | 350,409 | | | 355,917 |
FNMA #894157 6.50%, Due 10/01/36 | | | | | | | 436,519 | | | 449,025 | | 436,519 | | | 449,025 |
FNMA #894199 6.50%, Due 10/01/36 | | | | | | | 305,270 | | | 314,015 | | 305,270 | | | 314,015 |
FNMA #895998 6.50%, Due 07/01/36 | | | | | | | 257,770 | | | 265,155 | | 257,770 | | | 265,155 |
FNMA #900560 6.50%, Due 09/01/36 | | | | | | | 185,106 | | | 190,409 | | 185,106 | | | 190,409 |
FNMA #902200 6.50%, Due 11/01/36 | | | | | | | 197,240 | | | 202,891 | | 197,240 | | | 202,891 |
Fannie Mae #915784 6.50%, Due 07/01/37 | | | | | | | 604,923 | | | 618,441 | | 604,923 | | | 618,441 |
FNMA #918447 5.50%, Due 05/01/22 | | | | | | | 832,851 | | | 842,621 | | 832,851 | | | 842,621 |
FNMA 6.50%, Due 07/01/37 | | | | | | | 772,157 | | | 789,411 | | 772,157 | | | 789,411 |
FNMA #943768 6.50%, Due 10/01/37 | | | | | | | 295,000 | | | 301,592 | | 295,000 | | | 301,592 |
FNMA #953472 6.50%, Due 10/01/37 | | | | | | | 549,998 | | | 562,288 | | 549,998 | | | 562,288 |
Total Federal Home Loan Mortgage Corporation | | | | | | | | | | 16,746,058 | | | | | 16,746,058 |
Government National Mortgage Association - 0.00% | | | | | | | | | | | | | | | |
GNMA #45265 15.00%, Due 08/15/11 | | 1,682 | | | 1,964 | | | | | | | 1,682 | | | 1,964 |
GNMA #53809 15.00%, Due 02/15/12 | | 1,047 | | | 1,234 | | | | | | | 1,047 | | | 1,234 |
GNMA #54340 15.00%, Due 05/15/12 | | 1,481 | | | 1,747 | | | | | | | 1,481 | | | 1,747 |
GNMA #516121 7.50%, Due 12/15/29 | | | | | | | 3,013 | | | 3,215 | | 3,013 | | | 3,215 |
Total Government National Mortgage Corporation | | | | | 4,945 | | | | | 3,215 | | | | | 8,160 |
Small Business Administration - 0.00% | | | | | | | | | | | | | | | |
SBA #40013 2.06%, Due 09/30/17††(c)(i) | | 210,287 | | | 5,257 | | | | | | | 210,287 | | | 5,257 |
Total Small Business Administration | | 210,287 | | | 5,257 | | | | | | | 210,287 | | | 5,257 |
| | | | | | | | | | | | | | | |
Total Agency Securities (Cost $572,169, $17,982,966 and $18,555,135, respectively) | | | | | 14,133 | | | | | 18,251,299 | | | | | 18,265,432 |
| | | | | | | | | | | | | | | |
| | | | | | |
Asset Backed Securities - 0.74% | | | | | | | | | | | | | | | |
Countrywide Home Equity Loan Trust Series 2005-I Class 2A 4.88%, Due 02/15/36± | | | | | | | 258,562 | | | 252,309 | | 258,562 | | | 252,309 |
Capital Auto Receivables Asset Trust Series 2007-4 Class A3B 4.63%, Due 11/15/11± | | | | | | | 380,000 | | | 380,000 | | 380,000 | | | 380,000 |
Chase Issuance Trust Series 2005-A6 Class A6 4.72%, Due 07/15/14± | | | | | | | 430,000 | | | 425,091 | | 430,000 | | | 425,091 |
Citibank Credit Card Issuance Trust Series 2005-C1 Class C1 5.50%, Due 03/24/17 | | | | | | | 285,000 | | | 272,777 | | 285,000 | | | 272,777 |
First National Master Note Trust Series 2007-2 Class A 5.54%, Due 11/15/12± | | | | | | | 495,000 | | | 495,000 | | 495,000 | | | 495,000 |
MBNA Credit Card Master Note Trust Series 2006-A4 Class A4 4.64%, Due 09/15/11± | | | | | | | 346,000 | | | 344,883 | | 346,000 | | | 344,883 |
| | | | | | | | | | | | | | | |
Total Asset Backed Securities (Cost $0, $2,195,143 and $2,195,143, respectively) | | | | | | | | | | 2,170,060 | | | | | 2,170,060 |
| | | | | | | | | | | | | | | |
| | | | | | |
Collateralized Mortgage Obligations - 2.30% | | | | | | | | | | | | | | | |
| | |
| Proforma Portfolio of Investments - November 30, 2007 (Unaudited) | | Wells Fargo Advantage Funds |
| | | | | | | | | | | | |
| | | Corporate Bond Fund | | Income Plus Fund | | Pro Forma Combined |
| | | Shares or
Principal
Amount | | Value
(Note 2) | | Shares or
Principal
Amount | | Value
(Note 2) | | Shares or
Principal
Amount | | Value
(Note 2) |
Bank of America Commercial Mortgage Incorporated Series 2004-4 Class XP 0.85%, Due 07/10/42±(c) | | | | | | 5,974,981 | | 110,270 | | 5,974,981 | | 110,270 |
Bank of America Mortgage Securities Series 2005-H Class 2A3 4.80%, Due 09/25/35± | | | | | | 352,749 | | 349,550 | | 352,749 | | 349,550 |
Countrywide Home Loans Mortgage Pass-Through Series 2006-HYB1 Class 2A2A 5.54%, Due 03/20/36± | | | | | | 205,117 | | 204,204 | | 205,117 | | 204,204 |
Chase Mortgage Finance Corporation Series 2005-A1 Class 2A2 5.24%, Due 12/25/35± | | | | | | 397,230 | | 395,338 | | 397,230 | | 395,338 |
Citigroup Mortgage Loan Trust Incorporated Series 2006-NCB1 Class 2A2 4.77%, Due 05/15/36± | | | | | | 500,000 | | 462,017 | | 500,000 | | 462,017 |
Citigroup Mortgage Loan Trust Incorporated Series 2006-WF1 Class A2A 5.70%, Due 03/25/36 | | | | | | 8,232 | | 8,207 | | 8,232 | | 8,207 |
Greenwich Capital Commercial Funding Corporation Series 2006-GG7 Class A4 5.91%, Due 07/10/38± | | | | | | 265,000 | | 274,935 | | 265,000 | | 274,935 |
CS First Boston Mortgage Securities Corporation Series 1998-C2 Class AX 1.08%, Due 11/15/30±(c) | | | | | | 3,152,568 | | 29,127 | | 3,152,568 | | 29,127 |
Credit Suisse Mortgage Capital Certificates Series 2006-C3 Class A3 5.83%, Due 06/15/38± | | | | | | 355,000 | | 366,114 | | 355,000 | | 366,114 |
Countrywide Alternative Loan Trust Series 2006-0C8 Class 2A1C 4.85%, Due 11/25/36± | | | | | | 202,008 | | 200,826 | | 202,008 | | 200,826 |
FNMA Grantor Trust Series 2001-T11 Class B 5.50%, Due 09/25/11 | | | | | | 597,000 | | 615,054 | | 597,000 | | 615,054 |
FNMA Whole Loan Series 2003-W8 Class 4A 6.42%, Due 11/25/42± | | | | | | 321,560 | | 330,127 | | 321,560 | | 330,127 |
First Union National Bank Commercial Mortgage Series 1999-C4 Class A2 7.39%, Due 12/15/31 | | | | | | 289,785 | | 301,071 | | 289,785 | | 301,071 |
GNMA Series 2007-34 Class A 4.27%, Due 11/16/26« | | | | | | 345,703 | | 342,466 | | 345,703 | | 342,466 |
GNMA Series 2007-12 Class C 5.28%, Due 04/16/41«± | | | | | | 485,000 | | 472,756 | | 485,000 | | 472,756 |
JPMorgan Mortgage Trust Series 2005-A5 Class 3A1 5.38%, Due 08/25/35± | | | | | | 468,234 | | 463,275 | | 468,234 | | 463,275 |
JPMorgan Alternative Loan Trust Series 2005-S1 Class 3A1 5.50%, Due 10/25/20 | | | | | | 406,844 | | 402,301 | | 406,844 | | 402,301 |
JPMorgan Alternative Loan Trust Series 2006-A4 Class A2 5.95%, Due 09/25/36± | | | | | | 396,667 | | 388,048 | | 396,667 | | 388,048 |
JPMorgan Chase Commercial Mortgage Security 5.79%, Due 02/12/49± | | | | | | 345,000 | | 351,398 | | 345,000 | | 351,398 |
Mach One Trust Commercial Mortgage Backed Series 2004-1 Class X 1.39%, Due 05/28/40±(c)†† | | | | | | 2,864,654 | | 92,872 | | 2,864,654 | | 92,872 |
Morgan Stanley Capital I Series 2004-RR2 Class X 1.19%, Due 10/28/33±(c)†† | | | | | | 2,172,943 | | 55,714 | | 2,172,943 | | 55,714 |
Saco I Trust Series 2005-2 Class A 4.99%, Due 04/25/35±†† | | | | | | 24,691 | | 21,866 | | 24,691 | | 21,866 |
Salomon Brothers Mortgage Securities VII Series 2000-C2 Class A2 7.46%, Due 07/18/33 | | | | | | 239,049 | | 249,169 | | 239,049 | | 249,169 |
TIAA Real Estate CDO Limited Series 2007-C4 Class A3 6.10%, Due 06/15/49± | | | | | | 305,000 | | 314,714 | | 305,000 | | 314,714 |
| | | | | | | | | | | | |
Total Collateralized Mortgage Obligations (Cost $0, $6,907,416 and $6,907,416, respectively) | | | | | | | | 6,801,419 | | | | 6,801,419 |
| | | | | | | | | | | | |
| | | | | | |
Corporate Bonds & Notes - 64.19% | | | | | | | | | | | | |
Agricultural Production Crops - 0.76% | | | | | | | | | | | | |
Bunge Limited Finance Corporation 4.38%, Due 12/15/08 | | 2,129,000 | | 2,116,347 | | | | | | 2,129,000 | | 2,116,347 |
Cargill Incorporated Series 144 A 6.00%, Due 11/27/17†† | | | | | | 140,000 | | 140,310 | | 140,000 | | 140,310 |
Total Agricultural Production Crops | | | | 2,116,347 | | | | 140,310 | | | | 2,256,657 |
Apparel & Accessory Stores - 0.66% | | | | | | | | | | | | |
JC Penny Company Incorporated Series MTNA 6.88%, Due 10/15/15 | | 1,855,000 | | 1,961,338 | | | | | | 1,855,000 | | 1,961,338 |
Total Apparel & Accessory Stores | | | | 1,961,338 | | | | | | | | 1,961,338 |
Automotive Repair, Services & Parking - 0.47% | | | | | | | | | | | | |
Erac USA Finance Company 6.38%, Due 10/15/17†† | | 1,390,000 | | 1,375,493 | | | | | | 1,390,000 | | 1,375,493 |
Total Automotive Repair, Services & Parking | | | | 1,375,493 | | | | | | | | 1,375,493 |
Business Services - 0.40% | | | | | | | | | | | | |
Deluxe Corporation 7.38%, Due 06/01/15 | | | | | | 100,000 | | 99,250 | | 100,000 | | 99,250 |
Equifax Incorporated 6.30%, Due 07/01/17 | | 945,000 | | 995,827 | | | | | | 945,000 | | 995,827 |
Lamar Media Corporation 6.63%, Due 08/15/15†† | | | | | | 100,000 | | 95,000 | | 100,000 | | 95,000 |
Total Business Services | | | | 995,827 | | | | 194,250 | | | | 1,190,077 |
Casino & Gaming - 0.07% | | | | | | | | | | | | |
MGM Mirage Incorporated 7.63%, Due 01/15/17 | | | | | | 100,000 | | 99,500 | | 100,000 | | 99,500 |
Turning Stone Casino Resort Enterprise 9.13%, Due 12/15/10†† | | | | | | 100,000 | | 100,500 | | 100,000 | | 100,500 |
Total Casino & Gaming | | | | | | | | 200,000 | | | | 200,000 |
Coal Mining - 0.03% | | | | | | | | | | | | |
Foundation PA Coal Company 7.25%, Due 08/01/14« | | | | | | 85,000 | | 81,813 | | 85,000 | | 81,813 |
| | |
| Proforma Portfolio of Investments - November 30, 2007 (Unaudited) | | Wells Fargo Advantage Funds |
| | | | | | | | | | | | |
| | | Corporate Bond Fund | | Income Plus Fund | | Pro Forma Combined |
| | | Shares or
Principal
Amount | | Value
(Note 2) | | Shares or
Principal
Amount | | Value
(Note 2) | | Shares or
Principal
Amount | | Value
(Note 2) |
Total Coal Mining | | | | | | | | 81,813 | | | | 81,813 |
Communications - 10.02% | | | | | | | | | | | | |
AT&T Corporation 8.00%, Due 11/15/31 | | 3,415,000 | | 4,197,226 | | | | | | 3,415,000 | | 4,197,226 |
AT&T Incorporated 6.50%, Due 09/01/37« | | | | | | 215,000 | | 226,467 | | 215,000 | | 226,467 |
Alamosa Delaware Incorporated 8.50%, Due 01/31/12 | | 1,195,000 | | 1,237,671 | | | | | | 1,195,000 | | 1,237,671 |
American Tower Corporation 7.00%, Due 10/15/17†† | | | | | | 100,000 | | 101,750 | | 100,000 | | 101,750 |
CSC Holdings Incorporated Series B 7.63%, Due 04/01/11 | | | | | | 105,000 | | 102,900 | | 105,000 | | 102,900 |
Citizens Communications Company 6.25%, Due 01/15/13 | | | | | | 100,000 | | 96,625 | | 100,000 | | 96,625 |
Comcast Corporation 5.88%, Due 02/15/18 | | 5,010,000 | | 4,996,964 | | 210,000 | | 209,454 | | 5,220,000 | | 5,206,418 |
Cox Communications Incorporated 4.63%, Due 01/15/10 | | 1,200,000 | | 1,196,371 | | | | | | 1,200,000 | | 1,196,371 |
Embarq Corporation 8.00%, Due 06/01/36 | | 1,395,000 | | 1,474,376 | | 180,000 | | 190,242 | | 1,575,000 | | 1,664,618 |
Embarq Corporation 7.08%, Due 06/01/16 | | 955,000 | | 995,998 | | | | | | 955,000 | | 995,998 |
L-3 Communications Corporation 6.38%, Due 10/15/15 | | | | | | 100,000 | | 99,000 | | 100,000 | | 99,000 |
News America Holdings Incorporated 8.25%, Due 08/10/18 | | 1,080,000 | | 1,272,263 | | | | | | 1,080,000 | | 1,272,263 |
Qwest Corporation 8.94%, Due 06/15/13± | | | | | | 200,000 | | 205,500 | | 200,000 | | 205,500 |
Sprint Capital Corporation 6.90%, Due 05/01/19 | | 795,000 | | 781,544 | | | | | | 795,000 | | 781,544 |
Historic TW Incorporated 6.63%, Due 05/15/29 | | 1,590,000 | | 1,546,878 | | | | | | 1,590,000 | | 1,546,878 |
Time Warner Cable Incorporated 5.40%, Due 07/02/12 | | 4,055,000 | | 4,080,092 | | | | | | 4,055,000 | | 4,080,092 |
Qwest Corporation 6.88%, Due 09/15/33 | | 1,390,000 | | 1,264,900 | | | | | | 1,390,000 | | 1,264,900 |
Valor Telecommunications Enterprises 7.75%, Due 02/15/15 | | 1,490,000 | | 1,550,524 | | | | | | 1,490,000 | | 1,550,524 |
| | | | | | |
Verizon (Virginia) Incorporated Series A 4.63%, Due 03/15/13 | | | | | | 195,000 | | 188,402 | | 195,000 | | 188,402 |
Verizon (Florida) Incorporated Series F 6.13%, Due 01/15/13 | | 2,160,000 | | 2,227,236 | | 175,000 | | 180,447 | | 2,335,000 | | 2,407,683 |
Viacom Incorporated 5.75%, Due 04/30/11 | | 1,000,000 | | 1,014,873 | | | | | | 1,000,000 | | 1,014,873 |
Windstream Corporation 8.13%, Due 08/01/13 | | | | | | 45,000 | | 46,294 | | 45,000 | | 46,294 |
Windstream Corporation 8.63%, Due 08/01/16 | | | | | | 80,000 | | 83,000 | | 80,000 | | 83,000 |
Total Communications | | | | 27,836,916 | | | | 1,730,081 | | | | 29,566,997 |
Depository Institutions - 4.21% | | | | | | | | | | | | |
Bank of America Corporation 6.00%, Due 09/01/17 | | 2,500,000 | | 2,550,390 | | | | | | 2,500,000 | | 2,550,390 |
Citigroup Incorporated 5.00%, Due 09/15/14 | | 4,500,000 | | 4,320,117 | | 185,000 | | 177,605 | | 4,685,000 | | 4,497,722 |
JPMorgan Chase & Company 6.63%, Due 03/15/12 | | | | | | 200,000 | | 210,528 | | 200,000 | | 210,528 |
JPMorgan Chase & Company 5.13%, Due 09/15/14« | | 1,775,000 | | 1,747,260 | | 50,000 | | 49,219 | | 1,825,000 | | 1,796,479 |
Manufacturers & Traders Trust Company 3.85%, Due 04/01/13††± | | 1,695,000 | | 1,689,881 | | | | | | 1,695,000 | | 1,689,881 |
SB Treasury Company LLC 9.40%, Due 12/31/49††± | | 995,000 | | 1,017,754 | | | | | | 995,000 | | 1,017,754 |
TIAA Global Markets Incorporated 5.13%, Due 10/10/12†† | | | | | | 240,000 | | 248,263 | | 240,000 | | 248,263 |
Wachovia Corporation 5.75%, Due 06/15/17 | | | | | | 430,000 | | 423,944 | | 430,000 | | 423,944 |
Total Depository Institutions | | | | 11,325,402 | | | | 1,109,559 | | | | 12,434,961 |
Eating & Drinking Places - 1.45% | | | | | | | | | | | | |
ARAMARK Corporation 8.50%, Due 02/01/15 | | | | | | 155,000 | | 155,581 | | 155,000 | | 155,581 |
Darden Restaurants 6.00%, Due 08/15/35 | | 1,540,000 | | 1,394,145 | | | | | | 1,540,000 | | 1,394,145 |
Yum! Brands Incorporated 8.88%, Due 04/15/11 | | 1,210,000 | | 1,337,466 | | | | | | 1,210,000 | | 1,337,466 |
Yum! Brands Incorporated 6.88%, Due 11/15/37 | | 1,425,000 | | 1,392,037 | | | | | | 1,425,000 | | 1,392,037 |
Total Eating & Drinking Places | | | | 4,123,648 | | | | 155,581 | | | | 4,279,229 |
Electric, Gas & Sanitary Services - 11.5% | | | | | | | | | | | | |
| | | | | | |
Allied Waste North America Incorporated 7.13%, Due 05/15/16 | | | | | | 100,000 | | 99,750 | | 100,000 | | 99,750 |
Ameren Corporation 5.40%, Due 02/01/16 | | 1,200,000 | | 1,190,706 | | 220,000 | | 218,296 | | 1,420,000 | | 1,409,002 |
Carolina Power & Light Company 5.15%, Due 04/01/15 | | 2,250,000 | | 2,247,388 | | 150,000 | | 149,826 | | 2,400,000 | | 2,397,214 |
CenterPoint Energy Houston Electric LLC Series J2 5.70%, Due 03/15/13 | | | | | | 315,000 | | 321,461 | | 315,000 | | 321,461 |
Consumers Energy Company Series B 5.38%, Due 04/15/13« | | 3,660,000 | | 3,686,319 | | | | | | 3,660,000 | | 3,686,319 |
Consumers Energy Company 5.15%, Due 02/15/17 | | | | | | 135,000 | | 131,919 | | 135,000 | | 131,919 |
Edison Mission Energy 7.75%, Due 06/15/16 | | | | | | 95,000 | | 95,950 | | 95,000 | | 95,950 |
FPL Energy Caithness Funding 7.65%, Due 12/31/18†† | | 2,555,553 | | 2,819,439 | | | | | | 2,555,553 | | 2,819,439 |
IPALCO Enterprises Incorporated 8.38%, Due 11/14/08 | | 1,735,000 | | 1,761,025 | | | | | | 1,735,000 | | 1,761,025 |
IPALCO Enterprises Incorporated 8.63%, Due 11/14/11 | | 955,000 | | 1,002,750 | | | | | | 955,000 | | 1,002,750 |
Metropolitan Edison Company 4.95%, Due 03/15/13 | | 1,460,000 | | 1,425,611 | | | | | | 1,460,000 | | 1,425,611 |
Midamerican Energy Holdings Company 6.50%, Due 09/15/37 | | 935,000 | | 971,742 | | | | | | 935,000 | | 971,742 |
Monongahela Power Company 6.70%, Due 06/15/14 | | 2,045,000 | | 2,187,498 | | | | | | 2,045,000 | | 2,187,498 |
NRG Energy Incorporated 7.38%, Due 02/01/16 | | | | | | 95,000 | | 93,100 | | 95,000 | | 93,100 |
Nevada Power Company Series L 5.88%, Due 01/15/15 | | | | | | 100,000 | | 100,610 | | 100,000 | | 100,610 |
Nevada Power Company Series M 5.95%, Due 03/15/16 | | | | | | 225,000 | | 226,172 | | 225,000 | | 226,172 |
Nevada Power Company Series N 6.65%, Due 04/01/36 | | 1,550,000 | | 1,584,202 | | | | | | 1,550,000 | | 1,584,202 |
Nevada Power Company Series O 6.50%, Due 05/15/18 | | 1,025,000 | | 1,062,852 | | | | | | 1,025,000 | | 1,062,852 |
NiSource Capital Markets Incorporated 6.78%, Due 12/01/27§ | | 1,405,000 | | 1,405,000 | | | | | | 1,405,000 | | 1,405,000 |
Potomac Edison Company 5.35%, Due 11/15/14 | | 770,000 | | 764,781 | | | | | | 770,000 | | 764,781 |
Public Service Company of Colorado 7.88%, Due 10/01/12 | | | | | | 120,000 | | 136,285 | | 120,000 | | 136,285 |
Public Service Company of Colorado 6.25%, Due 09/01/37 | | 1,405,000 | | 1,471,775 | | | | | | 1,405,000 | | 1,471,775 |
| | |
| Proforma Portfolio of Investments - November 30, 2007 (Unaudited) | | Wells Fargo Advantage Funds |
| | | | | | | | | | | | |
| | | Corporate Bond Fund | | Income Plus Fund | | Pro Forma Combined |
| | | Shares or
Principal
Amount | | Value
(Note 2) | | Shares or
Principal
Amount | | Value
(Note 2) | | Shares or
Principal
Amount | | Value
(Note 2) |
Salton Sea Funding Corporation Series C 7.84%, Due 05/30/10 | | 1,650,778 | | 1,709,215 | | | | | | 1,650,778 | | 1,709,215 |
Salton Sea Funding Corporation Series F 7.48%, Due 11/30/18 | | 1,040,473 | | 1,156,226 | | | | | | 1,040,473 | | 1,156,226 |
Southern California Edison 7.63%, Due 01/15/10 | | 1,550,000 | | 1,649,171 | | | | | | 1,550,000 | | 1,649,171 |
Southern California Edison Company 4.65%, Due 04/01/15 | | | | | | 140,000 | | 135,865 | | 140,000 | | 135,865 |
Southwestern Electric Power 4.90%, Due 07/01/15 | | | | | | 170,000 | | 161,042 | | 170,000 | | 161,042 |
Tennessee Gas Pipeline Company 7.50%, Due 04/01/17 | | 865,000 | | 958,599 | | | | | | 865,000 | | 958,599 |
Tennessee Gas Pipeline Company 8.38%, Due 06/15/32 | | | | | | 160,000 | | 188,616 | | 160,000 | | 188,616 |
Waste Management Incorporated 7.38%, Due 08/01/10 | | 1,465,000 | | 1,563,791 | | 185,000 | | 197,475 | | 1,650,000 | | 1,761,266 |
Westar Energy Incorporated 5.88%, Due 07/15/36 | | 1,165,000 | | 1,083,949 | | | | | | 1,165,000 | | 1,083,949 |
Total Electric, Gas & Sanitary Services | | | | 31,702,039 | | | | 2,256,367 | | | | 33,958,406 |
Executive, Legislative & Gen Government, Except Finance - 0.40% | | | | | | | | | | | | |
Seneca Nation Indians Capital Improvements Authority Series 07-B 6.75%, Due 12/01/13†† | | 1,170,000 | | 1,186,251 | | | | | | 1,170,000 | | 1,186,251 |
Total Executive, Legislative & Gen Government, Except Finance | | | | 1,186,251 | | | | | | | | 1,186,251 |
Fabricated Metal Products, Except Machinery & Transportation Equipment - 0.03% | | | | | | | | | | | | |
Ball Corporation 6.63%, Due 03/15/18 | | | | | | 100,000 | | 98,750 | | 100,000 | | 98,750 |
Total Fabricated Metal Products, Except Machinery & Transportation Equipment | | | | | | | | 98,750 | | | | 98,750 |
Food & Kindred Products - 1.36% | | | | | | | | | | | | |
Bunge Limited Finance Corporation 5.35%, Due 04/15/14 | | | | | | 170,000 | | 169,255 | | 170,000 | | 169,255 |
General Mills Incorporated 5.65%, Due 09/10/12 | | 1,245,000 | | 1,283,581 | | | | | | 1,245,000 | | 1,283,581 |
Kraft Foods Incorporated 6.00%, Due 02/11/13 | | 1,000,000 | | 1,036,395 | | | | | | 1,000,000 | | 1,036,395 |
Miller Brewing Corporation 5.50%, Due 08/15/13†† | | 1,490,000 | | 1,510,260 | | | | | | 1,490,000 | | 1,510,260 |
Total Food & Kindred Products | | | | 3,830,236 | | | | 169,255 | | | | 3,999,491 |
Food Stores - 1.22% | | | | | | | | | | | | |
Delhaize America Incorporated 9.00%, Due 04/15/31 | | 1,552,000 | | 1,843,894 | | | | | | 1,552,000 | | 1,843,894 |
Kroger Company 6.75%, Due 04/15/12 | | | | | | 135,000 | | 144,963 | | 135,000 | | 144,963 |
Safeway Incorporated 7.25%, Due 02/01/31« | | 1,085,000 | | 1,196,861 | | 185,000 | | 204,073 | | 1,270,000 | | 1,400,934 |
Yum! Brands Incorporated 7.70%, Due 07/01/12 | | | | | | 205,000 | | 221,628 | | 205,000 | | 221,628 |
Total Food Stores | | | | 3,040,755 | | | | 570,664 | | | | 3,611,419 |
Forestry - 0.33% | | | | | | | | | | | | |
Plum Creek Timber Company Incorporated 5.88%, Due 11/15/15 | | 1,000,000 | | 987,800 | | | | | | 1,000,000 | | 987,800 |
Total Forestry | | | | 987,800 | | | | | | | | 987,800 |
Health Services - 0.67% | | | | | | | | | | | | |
Coventry Health Care Incorporated 6.30%, Due 08/15/14 | | 1,675,000 | | 1,717,294 | | | | | | 1,675,000 | | 1,717,294 |
DaVita Incorporated 7.25%, Due 03/15/15 | | | | | | 150,000 | | 145,875 | | 150,000 | | 145,875 |
HCA Incorporated 9.25%, Due 11/15/16 | | | | | | 120,000 | | 124,200 | | 120,000 | | 124,200 |
Total Health Services | | | | 1,717,294 | | | | 270,075 | | | | 1,987,369 |
Holding & Other Investment Offices - 2.32% | | | | | | | | | | | | |
Credit Suisse First Boston (USA) Incorporated 4.88%, Due 08/15/10 | | 3,500,000 | | 3,548,174 | | | | | | 3,500,000 | | 3,548,174 |
ERP Operating LP 5.13%, Due 03/15/16 | | | | | | 165,000 | | 156,244 | | 165,000 | | 156,244 |
OMX Timber Finance Investments LLC Series 1 5.42%, Due 01/29/20†† | | 3,075,000 | | 3,143,480 | | | | | | 3,075,000 | | 3,143,480 |
Total Holding & Other Investment Offices | | | | 6,691,654 | | | | 156,244 | | | | 6,847,898 |
Industrial & Commercial Machinery & Computer Equipment - 0.05% | | | | | | | | | | | | |
Case New Holland Incorporated 7.13%, Due 03/01/14 | | | | | | 100,000 | | 99,750 | | 100,000 | | 99,750 |
Grant Prideco Incorporated Series B 6.13%, Due 08/15/15 | | | | | | 50,000 | | 51,250 | | 50,000 | | 51,250 |
Total Industrial & Commercial Machinery & Computer Equipment | | | | | | | | 151,000 | | | | 151,000 |
Insurance Carriers - 2.34% | | | | | | | | | | | | |
Aetna Incorporated 6.75%, Due 12/15/37 | | 1,415,000 | | 1,396,967 | | | | | | 1,415,000 | | 1,396,967 |
WR Berkley Corporation 6.25%, Due 02/15/37 | | 1,215,000 | | 1,143,905 | | | | | | 1,215,000 | | 1,143,905 |
Fund American Companies Incorporated 5.88%, Due 05/15/13 | | 1,210,000 | | 1,237,513 | | | | | | 1,210,000 | | 1,237,513 |
ING (USA) Global Funding Trust 4.50%, Due 10/01/10 | | | | | | 150,000 | | 152,416 | | 150,000 | | 152,416 |
Lincoln National Corporation 6.30%, Due 10/09/37 | | 1,855,000 | | 1,827,813 | | | | | | 1,855,000 | | 1,827,813 |
UNUMProvident Finance Company 6.85%, Due 11/15/15†† | | 1,100,000 | | 1,152,127 | | | | | | 1,100,000 | | 1,152,127 |
Total Insurance Carriers | | | | 6,758,325 | | | | 152,416 | | | | 6,910,741 |
Legal Services - 0.04% | | | | | | | | | | | | |
FTI Consulting Incorporated 7.75%, Due 10/01/16 | | | | | | 100,000 | | 103,750 | | 100,000 | | 103,750 |
Total Legal Services | | | | | | | | 103,750 | | | | 103,750 |
Measuring, Analyzing & Controlling Instruments: Photographic, Medical & Optical Goods - 2.15% | | | | | | | | | | | | |
| | |
| Proforma Portfolio of Investments - November 30, 2007 (Unaudited) | | Wells Fargo Advantage Funds |
| | | | | | | | | | | | |
| | | Corporate Bond Fund | | Income Plus Fund | | Pro Forma Combined |
| | | Shares or
Principal
Amount | | Value
(Note 2) | | Shares or
Principal
Amount | | Value
(Note 2) | | Shares or
Principal
Amount | | Value
(Note 2) |
Fisher Scientific International Incorporated 6.13%, Due 07/01/15 | | 980,000 | | 977,967 | | | | | | 980,000 | | 977,967 |
Thermo Electron Corporation 7.63%, Due 10/30/08 | | 2,000,000 | | 2,046,002 | | | | | | 2,000,000 | | 2,046,002 |
Xerox Corporation 6.88%, Due 08/15/11 | | 2,950,000 | | 3,155,220 | | 155,000 | | 165,783 | | 3,105,000 | | 3,321,003 |
Total Measuring, Analyzing & Controlling Instruments: Photographic, Medical & Optical Goods | | | | 6,179,189 | | | | 165,783 | | | | 6,344,972 |
Miscellaneous Retail - 1.21% | | | | | | | | | | | | |
CVS Caremark Corporation 7.77%, Due 01/10/12†† | | 1,458,843 | | 1,589,077 | | | | | | 1,458,843 | | 1,589,077 |
CVS Lease Pass-Through Series T 6.04%, Due 12/10/28†† | | 1,748,898 | | 1,785,520 | | 186,161 | | 190,059 | | 1,935,059 | | 1,975,579 |
Total Miscellaneous Retail | | | | 3,374,597 | | | | 190,059 | | | | 3,564,656 |
Motion Pictures - 0.37% | | | | | | | | | | | | |
News America Incorporation 6.65%, Due 11/15/37†† | | 1,075,000 | | 1,094,605 | | | | | | 1,075,000 | | 1,094,605 |
Total Motion Pictures | | | | 1,094,605 | | | | | | | | 1,094,605 |
Non-Depository Credit Institutions - 4.97% | | | | | | | | | | | | |
Agua Caliente Band of Cahuilla Indians 6.44%, Due 10/01/16†† | | 1,000,000 | | 999,900 | | | | | | 1,000,000 | | 999,900 |
American Express Bank FSB Series BKN1 5.55%, Due 10/17/12 | | 1,430,000 | | 1,444,313 | | | | | | 1,430,000 | | 1,444,313 |
Capital One Bank 6.50%, Due 06/13/13 | | 1,210,000 | | 1,200,362 | | | | | | 1,210,000 | | 1,200,362 |
Ford Motor Credit Company 7.38%, Due 10/28/09 | | 1,200,000 | | 1,136,159 | | | | | | 1,200,000 | | 1,136,159 |
Ford Motor Credit Company LLC 8.00%, Due 12/15/16 | | | | | | 150,000 | | 131,242 | | 150,000 | | 131,242 |
GMAC LLC 6.13%, Due 01/22/08« | | 1,125,000 | | 1,114,981 | | | | | | 1,125,000 | | 1,114,981 |
GMAC LLC 6.00%, Due 12/15/11 | | 1,420,000 | | 1,206,597 | | | | | | 1,420,000 | | 1,206,597 |
General Electric Capital Corporation Series GMTN 6.15%, Due 08/07/37 | | 935,000 | | 1,000,404 | | 220,000 | | 235,389 | | 1,155,000 | | 1,235,793 |
| | | | | | |
General Electric Capital Corporation 4.13%, Due 03/04/08« | | 2,000,000 | | 1,994,202 | | | | | | 2,000,000 | | 1,994,202 |
General Electric Capital Corporation Series MTNA 5.88%, Due 02/15/12 | | 2,500,000 | | 2,622,028 | | | | | | 2,500,000 | | 2,622,028 |
GMAC LLC 8.00%, Due 11/01/31 | | | | | | 115,000 | | 97,573 | | 115,000 | | 97,573 |
HSBC Finance Corporation 5.90%, Due 06/19/12« | | | | | | 125,000 | | 127,329 | | 125,000 | | 127,329 |
SLM Corporation Series MTN 3.63%, Due 03/17/08 | | 1,382,000 | | 1,352,060 | | | | | | 1,382,000 | | 1,352,060 |
Total Non-Depository Credit Institutions | | | | 14,071,006 | | | | 591,533 | | | | 14,662,539 |
Oil & Gas Extraction - 1.30% | | | | | | | | | | | | |
Chesapeake Energy Corporation 6.38%, Due 06/15/15 | | | | | | 185,000 | | 177,600 | | 185,000 | | 177,600 |
Devon Financing Corporation ULC 7.88%, Due 09/30/31 | | 445,000 | | 541,548 | | | | | | 445,000 | | 541,548 |
Pemex Project Funding Master Trust 6.63%, Due 06/15/35†† | | 1,000,000 | | 1,061,528 | | | | | | 1,000,000 | | 1,061,528 |
Pride International Incorporated 7.38%, Due 07/15/14 | | | | | | 140,000 | | 143,500 | | 140,000 | | 143,500 |
Range Resources Corporation 7.50%, Due 05/15/16 | | | | | | 125,000 | | 126,563 | | 125,000 | | 126,563 |
XTO Energy Incorporated 7.50%, Due 04/15/12 | | 1,455,000 | | 1,615,051 | | | | | | 1,455,000 | | 1,615,051 |
XTO Energy Incorporated 5.30%, Due 06/30/15 | | | | | | 175,000 | | 174,245 | | 175,000 | | 174,245 |
Total Oil & Gas Extraction | | | | 3,218,127 | | | | 621,908 | | | | 3,840,035 |
Paper & Allied Products - 0.09% | | | | | | | | | | | | |
Appleton Papers Incorporated Series B 9.75%, Due 06/15/14 | | | | | | 85,000 | | 83,194 | | 85,000 | | 83,194 |
P.H. Glatfelter Company 7.13%, Due 05/01/16 | | | | | | 90,000 | | 88,200 | | 90,000 | | 88,200 |
Greif Incorporated 6.75%, Due 02/01/17 | | | | | | 95,000 | | 90,013 | | 95,000 | | 90,013 |
Total Paper & Allied Products | | | | | | | | 261,407 | | | | 261,407 |
Personal Services - 0.03% | | | | | | | | | | | | |
Service Corporation International Series WI 7.00%, Due 06/15/17 | | | | | | 100,000 | | 94,250 | | 100,000 | | 94,250 |
Total Personal Services | | | | | | | | 94,250 | | | | 94,250 |
Petroleum Refining & Related Industries - 0.60% | | | | | | | | | | | | |
Amerada Hess Corporation 7.13%, Due 03/15/33 | | 1,500,000 | | 1,679,924 | | | | | | 1,500,000 | | 1,679,924 |
Tesoro Corporation 6.50%, Due 06/01/17†† | | | | | | 100,000 | | 98,750 | | 100,000 | | 98,750 |
Total Petroleum Refining & Related Industries | | | | 1,679,924 | | | | 98,750 | | | | 1,778,674 |
Pharmaceuticals - 0.70% | | | | | | | | | | | | |
Wyeth 6.95%, Due 03/15/11 | | 1,925,000 | | 2,064,670 | | | | | | 1,925,000 | | 2,064,670 |
Total Pharmaceuticals | | | | 2,064,670 | | | | | | | | 2,064,670 |
Pipelines - 1.36% | | | | | | | | | | | | |
| | | | | | |
Enterprise Products Operations Series B 5.60%, Due 10/15/14 | | 1,170,000 | | 1,183,352 | | | | | | 1,170,000 | | 1,183,352 |
Enterprise Products Operating LP 6.30%, Due 09/15/17 | | | | | | 245,000 | | 252,168 | | 245,000 | | 252,168 |
Plains All American Pipeline LP 6.65%, Due 01/15/37 | | 1,180,000 | | 1,215,450 | | 225,000 | | 231,759 | | 1,405,000 | | 1,447,209 |
Texas Eastern Transmission LP 7.00%, Due 07/15/32 | | 910,000 | | 1,024,914 | | | | | | 910,000 | | 1,024,914 |
Williams Companies Incorporated 7.63%, Due 07/15/19 | | | | | | 100,000 | | 110,750 | | 100,000 | | 110,750 |
Total Pipelines | | | | 3,423,716 | | | | 594,677 | | | | 4,018,393 |
Primary Metal Industries - 0.60% | | | | | | | | | | | | |
Belden Incorporated 7.00%, Due 03/15/17 | | | | | | 100,000 | | 98,250 | | 100,000 | | 98,250 |
Corning Incorporated 7.25%, Due 08/15/36 | | 1,490,000 | | 1,670,135 | | | | | | 1,490,000 | | 1,670,135 |
Total Primary Metal Industries | | | | 1,670,135 | | | | 98,250 | | | | 1,768,385 |
Railroad Transportation - 0.43% | | | | | | | | | | | | |
| | |
| Proforma Portfolio of Investments - November 30, 2007 (Unaudited) | | Wells Fargo Advantage Funds |
| | | | | | | | | | | | |
| | | Corporate Bond Fund | | Income Plus Fund | | Pro Forma Combined |
| | | Shares or
Principal
Amount | | Value
(Note 2) | | Shares or
Principal
Amount | | Value
(Note 2) | | Shares or
Principal
Amount | | Value
(Note 2) |
Canadian National Railway Company 6.38%, Due 10/15/11 | | | | | | 100,000 | | 106,516 | | 100,000 | | 106,516 |
Union Pacific Corporation 6.50%, Due 04/15/12 | | 1,080,000 | | 1,149,701 | | | | | | 1,080,000 | | 1,149,701 |
Total Railroad Transportation | | | | 1,149,701 | | | | 106,516 | | | | 1,256,217 |
Real Estate Investment Trusts (REITS) - 3.75% | | | | | | | | | | | | |
AvalonBay Communities Series MTN 6.63%, Due 09/15/11 | | 1,265,000 | | 1,342,133 | | | | | | 1,265,000 | | 1,342,133 |
ERP Operating LP 6.95%, Due 03/02/11« | | 1,075,000 | | 1,141,307 | | | | | | 1,075,000 | | 1,141,307 |
Equity One Incorporated 3.88%, Due 04/15/09 | | 2,785,000 | | 2,749,372 | | | | | | 2,785,000 | | 2,749,372 |
International Lease Finance Corporation Series MTN 5.65%, Due 06/01/14 | | 850,000 | | 864,471 | | 150,000 | | 152,554 | | 1,000,000 | | 1,017,025 |
Liberty Property LP 7.25%, Due 03/15/11 | | 1,880,000 | | 2,005,097 | | | | | | 1,880,000 | | 2,005,097 |
Reckson Operating Partnership LP 6.00%, Due 03/31/16 | | 1,410,000 | | 1,348,965 | | 95,000 | | 90,888 | | 1,505,000 | | 1,439,853 |
Rouse Company 3.63%, Due 03/15/09 | | 1,210,000 | | 1,152,169 | | | | | | 1,210,000 | | 1,152,169 |
Rouse Company LP 6.75%, Due 05/01/13†† | | | | | | 120,000 | | 111,942 | | 120,000 | | 111,942 |
Ventas Realty LP 6.75%, Due 04/01/17« | | | | | | 100,000 | | 98,750 | | 100,000 | | 98,750 |
Total Real Estate Investment Trusts (REITS) | | | | 10,603,514 | | | | 454,134 | | | | 11,057,648 |
Rental Auto/Equipment - 0.03% | | | | | | | | | | | | |
Avis Budget Car Rental LLC 7.75%, Due 05/15/16 | | | | | | 100,000 | | 94,375 | | 100,000 | | 94,375 |
Total Rental Auto/Equipment | | | | | | | | 94,375 | | | | 94,375 |
Security & Commodity Brokers, Dealers, Exchanges & Services - 5.70% | | | | | | | | | | | | |
Blackrock Incorporated New York 6.25%, Due 09/15/17 | | 1,345,000 | | 1,392,240 | | | | | | 1,345,000 | | 1,392,240 |
Goldman Sachs Group Incorporated 5.13%, Due 01/15/15 | | 5,955,000 | | 5,830,993 | | | | | | 5,955,000 | | 5,830,993 |
Lazard Group LLC 7.13%, Due 05/15/15 | | 1,470,000 | | 1,493,250 | | | | | | 1,470,000 | | 1,493,250 |
Lehman Brothers Holdings Incorporated Series MTN 6.00%, Due 07/19/12 | | 1,265,000 | | 1,281,454 | | | | | | 1,265,000 | | 1,281,454 |
Merrill Lynch & Company Incorporated 6.11%, Due 01/29/37 | | 1,805,000 | | 1,573,823 | | | | | | 1,805,000 | | 1,573,823 |
Morgan Stanley 6.75%, Due 04/15/11 | | 5,000,000 | | 5,251,295 | | | | | | 5,000,000 | | 5,251,295 |
Total Security & Commodity Brokers, Dealers, Exchanges & Services | | | | 16,823,055 | | | | | | | | 16,823,055 |
Tobacco Products - 0.95% | | | | | | | | | | | | |
Altria Group Incorporated 7.65%, Due 07/01/08 | | 1,480,000 | | 1,505,567 | | | | | | 1,480,000 | | 1,505,567 |
Reynolds American Incorporated 6.75%, Due 06/15/17 | | 1,135,000 | | 1,190,362 | | 100,000 | | 104,878 | | 1,235,000 | | 1,295,240 |
Total Tobacco Products | | | | 2,695,929 | | | | 104,878 | | | | 2,800,807 |
Transportation By Air - 0.31% | | | | | | | | | | | | |
Continental Airlines Incorporated Series A 5.98%, Due 04/19/22 | | 965,000 | | 927,611 | | | | | | 965,000 | | 927,611 |
Total Transportation By Air | | | | 927,611 | | | | | | | | 927,611 |
Transportation Equipment - 1.31% | | | | | | | | | | | | |
DaimlerChrysler NA Holding Corporation 7.75%, Due 01/18/11 | | | | | | 120,000 | | 128,194 | | 120,000 | | 128,194 |
DaimlerChrysler NA Holding Corporation 6.50%, Due 11/15/13 | | 2,175,000 | | 2,307,147 | | | | | | 2,175,000 | | 2,307,147 |
Goodrich Company 6.29%, Due 07/01/16 | | 1,365,000 | | 1,431,197 | | | | | | 1,365,000 | | 1,431,197 |
Total Transportation Equipment | | | | 3,738,344 | | | | 128,194 | | | | 3,866,538 |
| | | | | | | | | | | | |
Total Corporate Bonds & Notes (Cost $177,398,453, $11,176,811 and $188,575,264, respectively) | | | | 178,363,448 | | | | 11,144,829 | | | | 189,508,277 |
| | | | | | | | | | | | |
| | | | | | |
Foreign Corporate Bonds - 11.97% | | | | | | | | | | | | |
America Movil SA de CV 5.50%, Due 03/01/14 | | 1,515,000 | | 1,511,067 | | | | | | 1,515,000 | | 1,511,067 |
America Movil Sab de CV 5.30%, Due 06/27/08± | | 1,425,000 | | 1,423,504 | | | | | | 1,425,000 | | 1,423,504 |
British Telecom plc 9.13%, Due 12/15/30 | | 2,370,000 | | 3,175,056 | | 160,000 | | 214,350 | | 2,530,000 | | 3,389,406 |
Commonwealth Bank of Australia 6.02%, Due 03/29/49††± | | 1,580,000 | | 1,445,574 | | | | | | 1,580,000 | | 1,445,574 |
Delhaize Group 6.50%, Due 06/15/17 | | 485,000 | | 496,459 | | | | | | 485,000 | | 496,459 |
Diageo Finance BV 3.88%, Due 04/01/11 | | 1,015,000 | | 982,679 | | | | | | 1,015,000 | | 982,679 |
EDP Finance BV 6.00%, Due 02/02/18†† | | 1,425,000 | | 1,438,023 | | | | | | 1,425,000 | | 1,438,023 |
EnCana Corporation 6.63%, Due 08/15/37 | | | | | | 175,000 | | 182,382 | | 175,000 | | 182,382 |
FMC Finance III SA 6.88%, Due 07/15/17†† | | | | | | 100,000 | | 98,000 | | 100,000 | | 98,000 |
Gaz Capital for Gazprom 6.51%, Due 03/07/22†† | | 725,000 | | 695,855 | | | | | | 725,000 | | 695,855 |
Globo Comunicacoes e Participacoes SA 7.25%, Due 04/26/22†† | | 1,485,000 | | 1,433,025 | | | | | | 1,485,000 | | 1,433,025 |
Grupo Televisa SA 6.63%, Due 03/18/25 | | 1,180,000 | | 1,206,378 | | 205,000 | | 209,583 | | 1,385,000 | | 1,415,961 |
HSBC Holdings plc 6.50%, Due 09/15/37 | | | | | | 265,000 | | 249,415 | | 265,000 | | 249,415 |
Ineos Group Holdings plc 8.50%, Due 02/15/16«†† | | | | | | 100,000 | | 90,000 | | 100,000 | | 90,000 |
Nexen Incorporated 5.88%, Due 03/10/35 | | 1,495,000 | | 1,392,752 | | | | | | 1,495,000 | | 1,392,752 |
Novelis Incorporated 7.25%, Due 02/15/15 | | | | | | 140,000 | | 130,550 | | 140,000 | | 130,550 |
Odebrecht Finance Limited 7.50%, Due 10/18/17†† | | 950,000 | | 959,500 | | | | | | 950,000 | | 959,500 |
PCCW HKT Capital Limited 8.00%, Due 11/15/11†† | | 1,410,000 | | 1,557,286 | | | | | | 1,410,000 | | 1,557,286 |
Petrobras International Finance Company 6.13%, Due 10/06/16 | | 960,000 | | 996,000 | | | | | | 960,000 | | 996,000 |
Rogers Wireless Incorporated 6.38%, Due 03/01/14 | | 1,750,000 | | 1,814,069 | | 150,000 | | 155,492 | | 1,900,000 | | 1,969,561 |
SMFG Preferred Capital 6.08%, Due 12/29/49††± | | 1,420,000 | | 1,302,921 | | | | | | 1,420,000 | | 1,302,921 |
Shaw Communications Incorporated 7.20%, Due 12/15/11 | | 1,470,000 | | 1,503,075 | | | | | | 1,470,000 | | 1,503,075 |
Telecom Italia Capital 7.20%, Due 07/18/36 | | 755,000 | | 817,172 | | | | | | 755,000 | | 817,172 |
| | |
| Proforma Portfolio of Investments - November 30, 2007 (Unaudited) | | Wells Fargo Advantage Funds |
| | | | | | | | | | | | |
| | | Corporate Bond Fund | | Income Plus Fund | | Pro Forma Combined |
| | | Shares or
Principal
Amount | | Value
(Note 2) | | Shares or
Principal
Amount | | Value
(Note 2) | | Shares or
Principal
Amount | | Value
(Note 2) |
Telefonica Emisiones SAU 5.98%, Due 06/20/11 | | | | | | 190,000 | | 195,591 | | 190,000 | | 195,591 |
Telefonica Emisiones SAU 7.05%, Due 06/20/36« | | 835,000 | | 927,882 | | | | | | 835,000 | | 927,882 |
Telefonos de Mexico SA 4.50%, Due 11/19/08 | | | | | | 175,000 | | 174,982 | | 175,000 | | 174,982 |
UBS Luxembourg SA for Ojsc Vimpel Communications 8.00%, Due 02/11/10†† | | 1,415,000 | | 1,436,225 | | | | | | 1,415,000 | | 1,436,225 |
Vodafone Group plc 6.15%, Due 02/27/37« | | 1,545,000 | | 1,528,693 | | | | | | 1,545,000 | | 1,528,693 |
Westfield Group 5.70%, Due 10/01/16†† | | 1,440,000 | | 1,413,687 | | | | | | 1,440,000 | | 1,413,687 |
Western Power Distribution Holdings Limited 7.38%, Due 12/15/28†† | | 2,750,000 | | 3,134,511 | | | | | | 2,750,000 | | 3,134,511 |
MUFG Capital Financing 1 Limited 6.35%, Due 07/29/49± | | 1,005,000 | | 964,907 | | 75,000 | | 72,008 | | 1,080,000 | | 1,036,915 |
| | | | | | | | | | | | |
Total Foreign Corporate Bonds (Cost $33,080,375, $1,787,941 and $34,868,316, respectively) | | | | 33,556,300 | | | | 1,772,353 | | | | 35,328,653 |
| | | | | | | | | | | | |
| | | | | | |
Foreign Government Bonds - 2.07% | | | | | | | | | | | | |
United Mexican States 7.50%, Due 01/14/12« | | 4,580,000 | | 5,038,000 | | | | | | 4,580,000 | | 5,038,000 |
United Mexican States 5.63%, Due 01/15/17 | | 930,000 | | 943,020 | | 120,000 | | 121,680 | | 1,050,000 | | 1,064,700 |
| | | | | | | | | | | | |
Total Foreign Government Bonds (Cost $5,594,501, $119,082 and $5,713,583, respectively) | | | | 5,981,020 | | | | 121,680 | | | | 6,102,700 |
| | | | | | | | | | | | |
| | | | | | |
Municipal Bonds & Notes - 2.33% | | | | | | | | | | | | |
Iowa - 0.14% | | | | | | | | | | | | |
Tobacco Settlement Authority of Iowa Series A (Excise Tax Revenue LOC) 6.79%, Due 06/01/10 | | 395,000 | | 404,223 | | | | | | 395,000 | | 404,223 |
Total Iowa | | | | 404,223 | | | | | | | | 404,223 |
Louisiana - 0.44% | | | | | | | | | | | | |
Tobacco Settlement Financing Corporation LA Series 2001A (Other Revenue LOC) 6.36%, Due 05/15/25 | | 1,302,304 | | 1,307,826 | | | | | | 1,302,304 | | 1,307,826 |
Total Louisiana | | | | 1,307,826 | | | | | | | | 1,307,826 |
Massachusetts - 0.39% | | | | | | | | | | | | |
Boston University Massachusetts (College & University Revenue, GO of Institution) 6.25%, Due 10/01/19±§ | | 1,150,000 | | 1,150,000 | | | | | | 1,150,000 | | 1,150,000 |
Total Massachusetts | | | | 1,150,000 | | | | | | | | 1,150,000 |
Oregon - 0.56% | | | | | | | | | | | | |
Cow Creek Band Umqua Tribe of Indians Oregon Series A (Other Revenue) 6.88%, Due 10/01/11 | | 1,720,000 | | 1,660,935 | | | | | | 1,720,000 | | 1,660,935 |
Total Oregon | | | | 1,660,935 | | | | | | | | 1,660,935 |
Virginia - 0.44% | | | | | | | | | | | | |
Tobacco Settlement Financing Corporation VA Series A1 6.71%, Due 06/01/46 | | 1,425,000 | | 1,311,185 | | | | | | 1,425,000 | | 1,311,185 |
Total Virginia | | | | 1,311,185 | | | | | | | | 1,311,185 |
Wisconsin - 0.36% | | | | | | | | | | | | |
| | | | | | |
Dane County WI (Property Tax Revenue) 5.85%, Due 12/01/22 | | 1,000,000 | | 1,052,550 | | | | | | 1,000,000 | | 1,052,550 |
Total Wisconsin | | | | 1,052,550 | | | | | | | | 1,052,550 |
| | | | | | | | | | | | |
Total Municipal Bonds & Notes (Cost $6,986,339, $0 and $6,986,339, respectively) | | | | 6,886,719 | | | | | | | | 6,886,719 |
| | | | | | | | | | | | |
| | | | | | |
US Treasury Securities - 5.72% | | | | | | | | | | | | |
US Treasury Bills - 0.24% | | | | | | | | | | | | |
US Treasury Bill 4.63%, Due 03/31/08« | | | | | | 700,000 | | 703,336 | | 700,000 | | 703,336 |
Total US Treasury Bills | | | | | | | | 703,336 | | | | 703,336 |
US Treasury Bonds - 1.38% | | | | | | | | | | | | |
US Treasury Bond 8.13%, Due 08/15/21« | | | | | | 524,000 | | 727,705 | | 524,000 | | 727,705 |
US Treasury Bond 7.13%, Due 02/15/23« | | | | | | 295,000 | | 384,353 | | 295,000 | | 384,353 |
US Treasury Bond 4.75%, Due 02/15/37« | | 2,315,000 | | 2,444,314 | | 495,000 | | 522,650 | | 2,810,000 | | 2,966,964 |
Total US Treasury Bonds | | | | 2,444,314 | | | | 1,634,708 | | | | 4,079,022 |
US Treasury Notes - 4.10% | | | | | | | | | | | | |
US Treasury Note 4.25%, Due 11/15/13« | | | | | | 1,390,000 | | 1,442,017 | | 1,390,000 | | 1,442,017 |
US Treasury Note 4.25%, Due 10/15/10« | | 395,000 | | 407,899 | | | | | | 395,000 | | 407,899 |
US Treasury Note 3.88%, Due 10/31/12« | | 2,345,000 | | 2,393,366 | | 2,070,000 | | 2,112,694 | | 4,415,000 | | 4,506,060 |
US Treasury Note 4.25%, Due 11/15/17« | | 3,150,000 | | 3,222,352 | | 2,460,000 | | 2,516,504 | | 5,610,000 | | 5,738,856 |
Total US Treasury Notes | | | | 6,023,617 | | | | 6,071,215 | | | | 12,094,832 |
| | | | | | | | | | | | |
Total US Treasury Securities (Cost $8,441,256, $8,182,294 and $16,623,550, respectively) | | | | 8,467,931 | | | | 8,409,259 | | | | 16,877,190 |
| | | | | | | | | | | | |
| | | | | | |
Collateral for Securities Lending - 11.67% | | | | | | | | | | | | |
Collateral Invested in Other Assets | | | | | | | | | | | | |
Alpine Securitization Corporation 4.70%, Due 12/04/07†† | | 201,817 | | 201,791 | | 273,468 | | 273,433 | | 475,285 | | 475,224 |
American General Finance Corporation 5.33%, Due 01/18/08± | | 569 | | 569 | | 771 | | 771 | | 1,340 | | 1,340 |
Amstel Funding Corporation 5.20%, Due 12/04/07 | | 46,573 | | 46,567 | | 63,108 | | 63,100 | | 109,681 | | 109,667 |
Aspen Funding Corporation 4.99%, Due 12/27/07 | | 31,049 | | 30,949 | | 42,072 | | 41,937 | | 73,121 | | 72,886 |
| | |
| Proforma Portfolio of Investments - November 30, 2007 (Unaudited) | | Wells Fargo Advantage Funds |
| | | | | | | | | | | | |
| | | Corporate Bond Fund | | Income Plus Fund | | Pro Forma Combined |
| | | Shares or
Principal
Amount | | Value
(Note 2) | | Shares or
Principal
Amount | | Value
(Note 2) | | Shares or
Principal
Amount | | Value
(Note 2) |
Atlas Capital Funding Corporation 4.78%, Due 04/25/08±†† | | 206,992 | | 206,948 | | 280,480 | | 280,421 | | 487,472 | | 487,369 |
Atomium Funding LLC 5.10%, Due 12/04/07†† | | 206,992 | | 206,965 | | 280,480 | | 280,444 | | 487,472 | | 487,409 |
BASF Finance Europe NV 5.17%, Due 10/17/08±†† | | 258,739 | | 258,369 | | 350,600 | | 350,099 | | 609,339 | | 608,468 |
BNP Paribas 4.85%, Due 11/07/08± | | 155,244 | | 155,244 | | 210,360 | | 210,360 | | 365,604 | | 365,604 |
Barton Capital Corporation 4.75%, Due 12/07/07†† | | 51,748 | | 51,721 | | 70,120 | | 70,084 | | 121,868 | | 121,805 |
CIT Group Incorporated 5.67%, Due 12/19/07± | | 51,748 | | 51,656 | | 70,120 | | 69,995 | | 121,868 | | 121,651 |
CRC Funding LLC 4.90%, Due 12/05/07†† | | 258,739 | | 258,672 | | 350,600 | | 350,509 | | 609,339 | | 609,181 |
Chariot Funding LLC 4.70%, Due 12/05/07†† | | 362,235 | | 362,141 | | 490,840 | | 490,713 | | 853,075 | | 852,854 |
Chariot Funding LLC 5.02%, Due 12/28/07 | | 108,671 | | 108,307 | | 147,252 | | 146,759 | | 255,923 | | 255,066 |
Cheyne Finance LLC 4.61%, Due 02/25/08±†† | | 147,481 | | 132,733 | | 199,842 | | 179,858 | | 347,323 | | 312,591 |
Clipper Receivables Corporation 4.75%, Due 12/03/07 | | 294,963 | | 294,963 | | 399,684 | | 399,684 | | 694,647 | | 694,647 |
Clipper Receivables Corporation 5.13%, Due 12/14/07†† | | 186,292 | | 186,022 | | 252,432 | | 252,066 | | 438,724 | | 438,088 |
Cullinan Finance Corporation 4.76%, Due 08/04/08±†† | | 129,370 | | 128,517 | | 175,300 | | 174,145 | | 304,670 | | 302,662 |
Fairway Finance Corporation 4.73%, Due 12/06/07†† | | 103,496 | | 103,455 | | 140,240 | | 140,185 | | 243,736 | | 243,640 |
Fairway Finance Corporation 5.03%, Due 12/10/07†† | | 175,943 | | 175,783 | | 238,408 | | 238,191 | | 414,351 | | 413,974 |
Falcon Asset Securitization Corporation 5.02%, Due 12/24/07 | | 134,545 | | 134,170 | | 182,312 | | 181,805 | | 316,857 | | 315,975 |
Galleon Capital LLC 4.90%, Due 12/04/07†† | | 206,992 | | 206,965 | | 280,480 | | 280,444 | | 487,472 | | 487,409 |
Galleon Capital LLC 4.82%, Due 12/07/07 | | 181,118 | | 181,023 | | 245,420 | | 245,293 | | 426,538 | | 426,316 |
Kestrel Funding US LLC 4.76%, Due 02/25/08±†† | | 186,292 | | 186,155 | | 252,432 | | 252,245 | | 438,724 | | 438,400 |
Kitty Hawk Funding Corporation 4.74%, Due 12/06/07 | | 388,109 | | 387,958 | | 525,900 | | 525,695 | | 914,009 | | 913,653 |
Liquid Funding Limited 5.70%, Due 06/11/08±†† | | 388,109 | | 388,160 | | 525,900 | | 525,969 | | 914,009 | | 914,129 |
M&I Marshall & Ilsley Bank Series BKNT 4.84%, Due 02/15/08± | | 5,175 | | 5,169 | | 7,012 | | 7,005 | | 12,187 | | 12,174 |
Merrill Lynch & Company Incorporated Series MTNB 5.45%, Due 01/02/08± | | 3,881 | | 3,880 | | 5,259 | | 5,257 | | 9,140 | | 9,137 |
MetLife Global Funding I 4.71%, Due 10/21/08±†† | | 129,370 | | 129,094 | | 175,300 | | 174,927 | | 304,670 | | 304,021 |
Morgan Stanley Series EXL 4.78%, Due 10/15/08± | | 79,562 | | 79,562 | | 107,810 | | 107,810 | | 187,372 | | 187,372 |
Morgan Stanley 4.76%, Due 04/07/08± | | 77,622 | | 77,622 | | 105,180 | | 105,180 | | 182,802 | | 182,802 |
Natexis Banques Populaires 4.90%, Due 09/08/08±†† | | 129,370 | | 129,370 | | 175,300 | | 175,300 | | 304,670 | | 304,670 |
Old Line Funding Corporation 5.06%, Due 12/17/07†† | | 36,224 | | 36,157 | | 49,084 | | 48,994 | | 85,308 | | 85,151 |
Premium Asset Trust 5.29%, Due 07/15/08±†† | | 92,111 | | 92,093 | | 124,814 | | 124,789 | | 216,925 | | 216,882 |
Ranger Funding Corporation 4.86%, Due 12/17/07†† | | 201,817 | | 201,445 | | 273,468 | | 272,965 | | 475,285 | | 474,410 |
Racers Trust Series 2004-6-MM 4.93%, Due 03/22/08±†† | | 242,982 | | 242,982 | | 329,249 | | 329,249 | | 572,231 | | 572,231 |
SLM Corporation 4.66%, Due 05/12/08±†† | | 103,496 | | 102,717 | | 140,240 | | 139,185 | | 243,736 | | 241,902 |
Scaldis Capital Limited 5.06%, Due 12/14/07 | | 36,224 | | 36,171 | | 49,084 | | 49,013 | | 85,308 | | 85,184 |
Solitaire Funding LLC 4.99%, Due 12/26/07 | | 155,244 | | 154,766 | | 210,360 | | 209,712 | | 365,604 | | 364,478 |
Solitaire Funding LLC 4.99%, Due 12/31/07 | | 227,691 | | 226,837 | | 308,528 | | 307,371 | | 536,219 | | 534,208 |
Stanfield Victoria Funding LLC 5.23%, Due 04/03/08±†† | | 206,992 | | 204,522 | | 280,480 | | 277,134 | | 487,472 | | 481,656 |
Thames Asset Global Securitization #1 Incorporated 4.90%, Due 12/07/07†† | | 120,878 | | 120,815 | | 163,793 | | 163,708 | | 284,671 | | 284,523 |
The Travelers Insurance Company 4.74%, Due 02/08/08± | | 99,454 | | 99,452 | | 134,764 | | 134,761 | | 234,218 | | 234,213 |
Transamerica Occidental Life Insurance 4.89%, Due 08/01/08± | | 517,479 | | 517,479 | | 701,200 | | 701,200 | | 1,218,679 | | 1,218,679 |
UniCredito Italiano Bank (New York) Series YCD 5.62%, Due 12/03/07± | | 27,944 | | 27,954 | | 37,865 | | 37,879 | | 65,809 | | 65,833 |
UniCredito Italiano Bank (New York) Series YCD 5.70%, Due 12/13/07± | | 8,797 | | 8,797 | | 11,920 | | 11,921 | | 20,717 | | 20,718 |
UniCredito Italiano Bank (Ireland) Series LIB 4.69%, Due 10/08/08±†† | | 129,370 | | 129,218 | | 175,300 | | 175,095 | | 304,670 | | 304,313 |
Versailles CDS LLC 4.97%, Due 12/05/07 | | 139,719 | | 139,683 | | 189,324 | | 189,275 | | 329,043 | | 328,958 |
Versailles CDS LLC 5.11%, Due 12/11/07 | | 77,622 | | 77,540 | | 105,180 | | 105,069 | | 182,802 | | 182,609 |
Victoria Finance LLC 4.69%, Due 05/02/08±†† | | 129,370 | | 129,370 | | 175,300 | | 175,300 | | 304,670 | | 304,670 |
Victoria Finance LLCVictoria Finance LLC 4.78%, Due 08/07/08±†† | | 129,370 | | 129,370 | | 175,300 | | 175,300 | | 304,670 | | 304,670 |
Credit Agricole SA 5.02%, Due 02/25/08± | | 116,433 | | 116,428 | | 157,770 | | 157,764 | | 274,203 | | 274,192 |
General Electric Capital Assurance Company 4.74%, Due 06/16/08± | | 82,797 | | 82,797 | | 112,192 | | 112,192 | | 194,989 | | 194,989 |
ING (USA) Annuity & Life Insurance Company 4.73%, Due 08/16/08± | | 181,118 | | 181,118 | | 245,420 | | 245,420 | | 426,538 | | 426,538 |
Morgan Stanley Repurchase Agreement - 102% Collateralized (Maturity Value $414,148) 4.77%, Due 12/03/07 | | 413,983 | | 413,983 | | | | | | 413,983 | | 413,983 |
Morgan Stanley Repurchase Agreement - 102% Collateralized (Maturity Value $561,183) 4.77%, Due 12/03/07 | | | | | | 560,960 | | 560,960 | | 560,960 | | 560,960 |
Barclays Repurchase Agreement - 102% Collateralized (Maturity Value $631,335) 4.84%, Due 12/03/07 | | 465,731 | | 465,731 | | 631,080 | | 631,080 | | 1,096,811 | | 1,096,811 |
Citigroup Repurchase Agreement - 102% Collateralized (Maturity Value $1,402,958) 4.77%, Due 12/03/07 | | 1,034,958 | | 1,034,958 | | 1,402,401 | | 1,402,401 | | 2,437,359 | | 2,437,359 |
Merrill Lynch & Company Incorporated Repurchase Agreement - 102% Collateralized (Maturity Value $1,402,956) 4.75%, Due 12/03/07 | | 1,034,958 | | 1,034,958 | | 1,402,401 | | 1,402,401 | | 2,437,359 | | 2,437,359 |
| | |
| Proforma Portfolio of Investments - November 30, 2007 (Unaudited) | | Wells Fargo Advantage Funds |
| | | | | | | | | | | | | | | | | | |
| | | Corporate Bond Fund | | | Income Plus Fund | | | Pro Forma Combined | |
| | | Shares or
Principal
Amount | | Value
(Note 2) | | | Shares or
Principal
Amount | | Value
(Note 2) | | | Shares or
Principal
Amount | | Value
(Note 2) | |
Morgan Stanley Repurchase Agreement - 102% Collateralized (Maturity Value $387,661) 4.77%, Due 12/03/07 | | 387,507 | | | 387,507 | | | | | | | | | 387,507 | | | 387,507 | |
Morgan Stanley Repurchase Agreement - 102% Collateralized (Maturity Value $525,293) 4.77%, Due 12/03/07 | | | | | | | | 525,084 | | | 525,084 | | | 525,084 | | | 525,084 | |
Bear Stearns & Company Incorporated International Repurchase Agreement - 102% Collateralized (Maturity Value $350,738) 4.74%, Due 12/03/07 | | 258,739 | | | 258,739 | | | 350,600 | | | 350,600 | | | 609,339 | | | 609,339 | |
Bear Stearns & Company Incorporated Repurchase Agreement - 102% Collateralized (Maturity Value $1,052,221) 4.79%, Due 12/03/07 | | 776,218 | | | 776,218 | | | 1,051,801 | | | 1,051,801 | | | 1,828,019 | | | 1,828,019 | |
BNP Paribas Repurchase Agreement - 102% Collateralized (Maturity Value $1,402,958) 4.77%, Due 12/03/07 | | 1,034,958 | | | 1,034,958 | | | 1,402,401 | | | 1,402,401 | | | 2,437,359 | | | 2,437,359 | |
Credit Suisse First Boston Repurchase Agreement - 102% Collateralized (Maturity Value $1,753,701) 4.79%, Due 12/03/07 | | 1,293,697 | | | 1,293,697 | | | 1,753,001 | | | 1,753,001 | | | 3,046,698 | | | 3,046,698 | |
| | | | | | | | | | | | | | | | | | |
Total Collateral for Securities Lending (Cost $14,643,708, $19,842,690 and $34,486,398, respectively) | | | | | 14,628,960 | | | | | | 19,822,709 | | | | | | 34,451,669 | |
| | | | | | | | | | | | | | | | | | |
Short-Term Investments - 4.53% | | | | | | | | | | | | | | | | | | |
Mutual Funds - 4.46% | | | | | | | | | | | | | | | | | | |
Wells Fargo Advantage Money Market Trust~‡ | | 6,152,240 | | | 6,152,240 | | | 7,023,270 | | | 7,023,270 | | | 13,175,510 | | | 13,175,510 | |
US Treasury Bills - 0.07% | | | | | | | | | | | | | | | | | | |
US Treasury Bill 4.83%, Due 01/24/08^# | | 210,000 | | | 209,153 | | | | | | | | | 210,000 | | | 209,153 | |
| | | | | | | | | | | | | | | | | | |
Total Short-Term Investments (Cost $6,361,081, $7,023,270 and $13,384,351, respectively) | | | | | 6,361,393 | | | | | | 7,023,270 | | | | | | 13,384,663 | |
| | | | | | | | | | | | | | | | | | |
Total Investments in Securities (Cost $253,077,882, $79,130,110 and $332,207,992, respectively) - 113.06%* | | | | | 254,259,904 | | | | | | 79,521,871 | | | | | | 333,781,775 | |
Other Assets and Liabilities, Net - (13.06%) | | | | | (12,185,068 | ) | | | | | (26,374,519 | ) | | | | | (38,559,587 | ) |
| | | | | | | | | | | | | | | | | | |
Net Assets - 100% | | | | $ | 242,074,836 | | | | | $ | 53,147,352 | | | | | $ | 295,222,188 | |
| | | | | | | | | | | | | | | | | | |
| « | All or a portion of this security is on loan. (See Note 2) |
| ± | Variable rate investments. |
| †† | Securities that may be resold to “qualified institutional buyers” under rule 144A or securities offered pursuant to section 4(2) of the Securities Act of 1933, as amended. |
| (c) | Interest-only securities entitle holders to receive only the interest payments on the underlying mortgages. The principal amount shown is the notional amount of the underlying mortgages. Interest rate disclosed represents the coupon rate. |
| § | These securities are subject to a demand feature which reduces the effective maturity. |
| ~ | This Wells Fargo Advantage Fund invests cash balances that it retains for liquidity purposes in a Wells Fargo Advantage Money Market Fund. The Fund does not pay an investment advisory fee for such investments. |
| ‡ | Security of an affiliate of the Fund with a cost of $13,175,510. |
| * | Cost for federal income tax purposes is substantially the same as for financial reporting purposes. |
| ^ | Zero coupon bond. Interest rate presented is yield to maturity. |
| † | Non-income earning securities. |
The accompanying notes are an integral part of these proforma financial statements.
| | |
| Proforma Statement of Assets and Liabilities - November 30, 2007 (Unaudited) | | Wells Fargo Advantage Funds |
| | | | | | | | | | | | | | | | |
| | | Corporate
Bond Fund | | | Income Plus
Fund | | | Proforma
Adjustments | | | Proforma
Combined | |
Assets | | | | | | | | | | | | | | | | |
Investments | | | | | | | | | | | | | | | | |
In securities, at market value | | $ | 233,478,704 | | | $ | 52,675,892 | | | | | | | $ | 286,154,596 | |
Collateral for securities loaned | | | 14,628,960 | | | | 19,822,709 | | | | | | | | 34,451,669 | |
Investments in affiliates | | | 6,152,240 | | | | 7,023,270 | | | | | | | | 13,175,510 | |
| | | | | | | | | | | | | | | | |
Total investments at market value (see cost below) | | | 254,259,904 | | | | 79,521,871 | | | | — | | | | 333,781,775 | |
| | | | | | | | | | | | | | | | |
Cash | | | — | | | | 5,598 | | | | | | | | 5,598 | |
Receivable for Fund shares issued | | | 141,998 | | | | 107,956 | | | | | | | | 249,954 | |
Receivable for investments sold | | | 7,127,881 | | | | 11,133 | | | | | | | | 7,139,014 | |
Receivables for dividends and interest | | | 3,572,386 | | | | 482,124 | | | | | | | | 4,054,510 | |
| | | | | | | | | | | | | | | | |
Total assets | | | 265,102,169 | | | | 80,128,682 | | | | — | | | | 345,230,851 | |
| | | | | | | | | | | | | | | | |
Liabilities | | | | | | | | | | | | | | | | |
Payable for daily variation margin on futures contracts | | | 2,547 | | | | — | | | | | | | | 2,547 | |
Payable for Fund shares redeemed | | | 67,420 | | | | 133,315 | | | | | | | | 200,735 | |
Payable for investments purchased | | | 6,718,605 | | | | 6,965,112 | | | | | | | | 13,683,717 | |
Dividends payable | | | 1,057,357 | | | | — | | | | | | | | 1,057,357 | |
Payable to investment advisor and affiliates | | | 96,735 | | | | 33,991 | | | | | | | | 130,726 | |
Payable for interest rate swaps/spread locks | | | 5,379 | | | | — | | | | | | | | 5,379 | |
Payable for securities loaned | | | 14,643,708 | | | | 19,842,693 | | | | | | | | 34,486,401 | |
Accrued expenses and other liabilities | | | 435,582 | | | | 6,219 | | | | | | | | 441,801 | |
| | | | | | | | | | | | | | | | |
Total liabilities | | | 23,027,333 | | | | 26,981,330 | | | | — | | | | 50,008,663 | |
| | | | | | | | | | | | | | | | |
Total net assets | | $ | 242,074,836 | | | $ | 53,147,352 | | | $ | — | | | $ | 295,222,188 | |
| | | | | | | | | | | | | | | | |
NET ASSETS CONSIST OF | | | | | | | | | | | | | | | | |
Paid-in capital | | $ | 374,086,541 | | | $ | 61,038,504 | | | | | | | $ | 435,125,045 | |
Undistributed net investment income (loss) | | | (1,305 | ) | | | (117,044 | ) | | | | | | | (118,349 | ) |
Undistributed net realized gain (loss) on investments | | | (133,135,069 | ) | | | (8,165,879 | ) | | | | | | | (141,300,948 | ) |
Net unrealized appreciation (depreciation) of investments, foreign currencies and translation of assets and liabilities denominated in foreign currencies | | | 1,182,022 | | | | 391,771 | | | | | | | | 1,573,793 | |
Net unrealized appreciation (depreciation) of futures | | | (51,974 | ) | | | — | | | | | | | | (51,974 | ) |
Net unrealized appreciation (depreciation) of options, swap agreements, and short sales | | | (5,379 | ) | | | — | | | | | | | | (5,379 | ) |
| | | | | | | | | | | | | | | | |
Total net assets | | $ | 242,074,836 | | | $ | 53,147,352 | | | $ | — | | | $ | 295,222,188 | |
| | | | | | | | | | | | | | | | |
COMPUTATION OF NET ASSET VALUE AND OFFERING PRICE PER SHARE1 | | | | | | | | | | | | | | | | |
Net assets – Class A | | | NA | | | $ | 39,292,613 | | | $ | 15,953,550 | 3 | | $ | 55,246,163 | |
Shares outstanding – Class A | | | NA | | | | 3,624,223 | | | | 1,472,287 | | | | 5,096,510 | |
Net asset value per share – Class A | | | NA | | | $ | 10.84 | | | | | | | $ | 10.84 | |
Maximum offering price per share – Class A2 | | | NA | | | $ | 11.35 | | | | | | | $ | 11.35 | |
Net assets – Class B | | | NA | | | $ | 9,025,713 | | | | | | | $ | 9,025,713 | |
Shares outstanding – Class B | | | NA | | | | 832,299 | | | | | | | | 832,299 | |
Net asset value and offering price per share – Class B | | | NA | | | $ | 10.84 | | | | | | | $ | 10.84 | |
Net assets – Class C | | | NA | | | $ | 4,829,026 | | | | | | | $ | 4,829,026 | |
Shares outstanding – Class C | | | NA | | | | 445,401 | | | | | | | | 445,401 | |
Net asset value and offering price per share – Class C | | | NA | | | $ | 10.84 | | | | | | | $ | 10.84 | |
Net assets – Advisor Class | | $ | 15,953,550 | | | | NA | | | $ | (15,953,550 | )3 | | $ | — | |
Shares outstanding – Advisor Class | | | 1,557,489 | | | | NA | | | | (1,557,489 | ) | | | — | |
Net asset value and offering price per share – Advisor Class | | $ | 10.24 | | | | NA | | | | | | | $ | — | |
Net assets – Institutional Class | | $ | 23,552,388 | | | | NA | | | | | | | $ | 23,552,388 | |
Shares outstanding – Institutional Class | | | 2,299,570 | | | | NA | | | | (126,840 | )4 | | | 2,172,730 | |
Net asset value and offering price per share – Institutional Class | | $ | 10.24 | | | | NA | | | | | | | $ | 10.84 | |
Net assets – Investor Class | | $ | 202,568,898 | | | | NA | | | | | | | $ | 202,568,898 | |
Shares outstanding – Investor Class | | | 19,770,825 | | | | NA | | | | (1,083,657 | )5 | | | 18,687,168 | |
Net asset value and offering price per share – Investor Class | | $ | 10.25 | | | | NA | | | | | | | $ | 10.84 | |
| | | | | | | | | | | | | | | | |
Investments at cost | | $ | 253,077,882 | | | $ | 79,130,110 | | | $ | — | | | $ | 332,207,992 | |
| | | | | | | | | | | | | | | | |
Securities on loan, at market value | | $ | 14,305,637 | | | $ | 19,452,378 | | | $ | — | | | $ | 33,758,015 | |
| | | | | | | | | | | | | | | | |
1 | Each Fund has an unlimited number of authorized shares. |
2 | Maximum offering price is computed as 100/95.50 of net asset value. On investment of $50,000 or more, the offering price is reduced. |
3 | Advisor Class shares of Corporate Bond Fund are exchanged for Class A shares of Income Plus Fund in an amount equal to the total value of the Advisor Class shares divided by the current per share value of the Class A shares. |
4 | Institutional Class shares (“I shares) of Corporate Bond Fund are exchanged for new I shares of Income Plus Fund, to be established upon consummation of the merger, in an amount equal to the total value of the Corporate Bond Fund I shares divided by current per share value of the new Income Plus Fund I shares (presumed to equal the Income Plus Fund A share value in this proforma). |
5 | Investor Class shares (“Inv shares) of Corporate Bond Fund are exchanged for new Inv shares of Income Plus Fund, to be established upon consummation of the merger, in an amount equal to the total value of the Corporate Bond Fund Inv shares divided by current per share value of the new Income Plus Fund I shares (presumed to equal the Income Plus Fund A share value in this proforma). |
The accompanying notes are an integral part of these proforma financial statements.
| | |
| Proforma Statement of Operations - For the Twelve Months Ended November 30, 2007 (Unaudited) | | Wells Fargo Advantage Funds |
| | | | | | | | | | | | | | | | |
| | | Corporate
Bond Fund | | | Income
Plus Fund | | | Proforma
Adjustments | | | Proforma
Combined | |
Investment Income | | | | | | | | | | | | | | | | |
Interest | | $ | 14,877,640 | | | $ | 2,889,409 | | | | | | | $ | 17,767,049 | |
Income from affiliated securities | | | 204,092 | | | | 98,080 | | | | | | | | 302,172 | |
Securities lending income, net | | | 76,688 | | | | 47,869 | | | | | | | | 124,557 | |
| | | | | | | | | | | | | | | | |
Total investment income | | | 15,158,420 | | | | 3,035,358 | | | | — | | | | 18,193,778 | |
| | | | | | | | | | | | | | | | |
Expenses | | | | | | | | | | | | | | | | |
Advisory fees | | | 1,151,894 | | | | 294,068 | | | | (249,321 | )1 | | | 1,196,641 | |
Administration fees | | | | | | | | | | | | | | | | |
Fund Level | | | 127,989 | | | | 26,734 | | | | 606 | 1 | | | 155,329 | |
Class A | | | — | | | | 105,565 | | | | (40,656 | )1 | | | 64,909 | |
Class B | | | — | | | | 30,459 | | | | | | | | 30,459 | |
Class C | | | — | | | | 13,682 | | | | | | | | 13,682 | |
Advisor Class | | | 41,294 | | | | — | | | | 41,294 | 1 | | | 82,588 | |
Institutional Class | | | 17,453 | | | | — | | | | | | | | 17,453 | |
Investor Class | | | 969,877 | | | | — | | | | 95,541 | 1 | | | 1,065,418 | |
Custody fees | | | 51,196 | | | | 10,693 | | | | | | | | 61,889 | |
Shareholder servicing fees | | | 585,401 | | | | 133,666 | | | | (51,516 | )1 | | | 667,551 | |
Accounting fees | | | 51,183 | | | | 22,049 | | | | 11,360 | 1 | | | 84,592 | |
Distribution fees | | | | | | | | | | | | | | | | |
Class B | | | — | | | | 81,589 | | | | | | | | 81,589 | |
Class C | | | — | | | | 36,650 | | | | | | | | 36,650 | |
Professional fees | | | 28,249 | | | | 18,607 | | | | 12,708 | 2 | | | 59,564 | |
Registration fees | | | 27,385 | | | | 27,978 | | | | 22,259 | 2 | | | 77,622 | |
Shareholder reports | | | 58,393 | | | | 13,905 | | | | 18,075 | 2 | | | 90,373 | |
Trustees’ fees | | | 9,134 | | | | 9,134 | | | | 7,226 | 2 | | | 25,494 | |
Other fees and expenses | | | 3,387 | | | | 483 | | | | (224 | )2 | | | 3,646 | |
| | | | | | | | | | | | | | | | |
Total expenses | | | 3,122,835 | | | | 825,262 | | | | (132,648 | ) | | | 3,815,449 | |
| | | | | | | | | | | | | | | | |
Less | | | | | | | | | | | | | | | | |
Waived fees and reimbursed expenses | | | (699,058 | ) | | | (172,086 | ) | | | (12,303 | ) | | | (883,447 | ) |
Net expenses | | | 2,423,777 | | | | 653,176 | | | | (144,951 | ) | | | 2,932,002 | |
| | | | | | | | | | | | | | | | |
Net investment income (loss) | | | 12,734,643 | | | | 2,382,182 | | | | 144,951 | | | | 15,261,776 | |
| | | | | | | | | | | | | | | | |
REALIZED AND UNREALIZED GAIN (LOSS) ON INVESTMENTS | | | | | | | | | | | | | | | | |
| | | | |
Net realized gain (loss) from | | | | | | | | | | | | | | | | |
Securities, foreign currencies and foreign currency translation | | | (577,834 | ) | | | 711,515 | | | | | | | | 133,681 | |
Futures transactions | | | 658,845 | | | | — | | | | | | | | 658,845 | |
Options, swap agreements and short sale transactions | | | 42,754 | | | | — | | | | | | | | 42,754 | |
| | | | | | | | | | | | | | | | |
Net realized gain (loss) from Investments | | | 123,765 | | | | 711,515 | | | | — | | | | 835,280 | |
| | | | | | | | | | | | | | | | |
Net change in unrealized appreciation (depreciation) of Securities, foreign currencies and foreign currency translation | | | (3,385,125 | ) | | | (112,473 | ) | | | | | | | (3,497,598 | ) |
Futures transactions | | | 6,334 | | | | — | | | | | | | | 6,334 | |
Options, swap agreements and short sale transactions | | | (5,379 | ) | | | — | | | | | | | | (5,379 | ) |
| | | | | | | | | | | | | | | | |
Net change in unrealized appreciation (depreciation) of investments | | | (3,384,170 | ) | | | (112,473 | ) | | | — | | | | (3,496,643 | ) |
| | | | | | | | | | | | | | | | |
Net realized and unrealized gain (loss) on investments | | | (3,260,405 | ) | | | 599,042 | | | | — | | | | (2,661,363 | ) |
| | | | | | | | | | | | | | | | |
Net increase (decrease) in net assets resulting from operations | | $ | 9,474,238 | | | $ | 2,981,224 | | | $ | 144,951 | | | $ | 12,600,413 | |
| | | | | | | | | | | | | | | | |
1 | Based on contractual agreements of the surviving fund. |
2 | Estimated cost increases (savings) as a result of merging the funds. |
The accompanying notes are an integral part of these proforma financial statements.
| | |
| Proforma Portfolio of Investments - November 30, 2007 (Unaudited) | | Wells Fargo Advantage Funds |
| | | | | | | | | | | | | | | |
| | | High Yield Bond Fund | | High Income Fund | | Pro Forma Combined |
| | | Shares or
Principal
Amount | | Value
(Note 2) | | Shares or
Principal
Amount | | Value
(Note 2) | | Shares or
Principal
Amount | | Value
(Note 2) |
Asset Backed Securities - 0.13% | | | | | | | | | | | | | | | |
DB Master Finance LLC Series 2006-1 Class M1 8.29%, Due 06/20/31†† | | 500,000 | | $ | 505,695 | | | | | | | 500,000 | | $ | 505,695 |
| | | | | | | | | | | | | | | |
Total Asset Backed Securities (Cost $499,992, $0 and $499,992, respectively) | | | | | 505,695 | | | | | | | | | | 505,695 |
| | | | | | | | | | | | | | | |
Corporate Bonds & Notes - 84.29% | | | | | | | | | | | | | | | |
Agricultural Production Crops - 0.30% | | | | | | | | | | | | | | | |
Dole Food Company Incorporated 7.25%, Due 06/15/10 | | 200,000 | | | 183,000 | | | | | | | 200,000 | | | 183,000 |
Dole Food Company Incorporated 8.63%, Due 05/01/09 | | 425,000 | | | 416,500 | | | | | | | 425,000 | | | 416,500 |
Dole Food Company Incorporated 8.88%, Due 03/15/11« | | 600,000 | | | 559,500 | | | | | | | 600,000 | | | 559,500 |
Total Agricultural Production Crops | | | | | 1,159,000 | | | | | | | | | | 1,159,000 |
Agricultural Production Livestock & Animal Specialized - 0.12% | | | | | | | | | | | | | | | |
Pilgrim’s Pride Corporation 7.63%, Due 05/01/15 | | 300,000 | | | 294,000 | | | | | | | 300,000 | | | 294,000 |
Pilgrim’s Pride Corporation 8.38%, Due 05/01/17« | | 200,000 | | | 196,000 | | | | | | | 200,000 | | | 196,000 |
Total Agricultural Production Livestock & Animal Specialized | | | | | 490,000 | | | | | | | | | | 490,000 |
Amusement & Recreation Services - 1.44% | | | | | | | | | | | | | | | |
Mashantucket Western Pequot Tribe 8.50%, Due 11/15/15†† | | | | | | | 1,690,000 | | $ | 1,690,000 | | 1,690,000 | | | 1,690,000 |
Single Springs Tribal Gaming Authority 9.38%, Due 06/15/15††« | | | | | | | 2,320,000 | | | 2,273,600 | | 2,320,000 | | | 2,273,600 |
Speedway Motorsports Incorporated 6.75%, Due 06/01/13 | | 530,000 | | | 519,400 | | | | | | | 530,000 | | | 519,400 |
Town Sports International Incorporated 9.25%, Due 02/01/14^ | | | | | | | 1,222,000 | | | 1,148,680 | | 1,222,000 | | | 1,148,680 |
Total Amusement & Recreation Services | | | | | 519,400 | | | | | 5,112,280 | | | | | 5,631,680 |
Apparel & Accessory Stores - 0.70% | | | | | | | | | | | | | | | |
Neiman Marcus Group Incorporated 9.00%, Due 10/15/15¥ | | | | | | | 1,855,000 | | | 1,929,200 | | 1,855,000 | | | 1,929,200 |
Payless ShoeSource Incorporated 8.25%, Due 08/01/13 | | 600,000 | | | 558,000 | | | | | | | 600,000 | | | 558,000 |
Phillips Van-Heusen Corporation 7.25%, Due 02/15/11 | | 250,000 | | | 250,000 | | | | | | | 250,000 | | | 250,000 |
Total Apparel & Accessory Stores | | | | | 808,000 | | | | | 1,929,200 | | | | | 2,737,200 |
Apparel & Other Finished Products Made From Fabrics & Similar Materials - 0.72% | | | | | | | | | | | | | | | |
Riddell Bell Holdings Incorporated 8.38%, Due 10/01/12 | | | | | | | 3,070,000 | | | 2,824,400 | | 3,070,000 | | | 2,824,400 |
Total Apparel & Other Finished Products Made From Fabrics & Similar Materials | | | | | | | | | | 2,824,400 | | | | | 2,824,400 |
| | | | | | |
Automotive Dealers & Gasoline Service Stations - 0.40% | | | | | | | | | | | | | | | |
Asbury Automotive Group Incorporated 7.63%, Due 03/15/17 | | 510,000 | | | 461,550 | | | | | | | 510,000 | | | 461,550 |
Group 1 Automotive Incorporated 8.25%, Due 08/15/13 | | 125,000 | | | 123,125 | | | | | | | 125,000 | | | 123,125 |
Sonic Automotive Incorporated Series B 8.63%, Due 08/15/13« | | 575,000 | | | 568,531 | | | | | | | 575,000 | | | 568,531 |
United Auto Group Incorporated 7.75%, Due 12/15/16 | | 425,000 | | | 403,750 | | | | | | | 425,000 | | | 403,750 |
Total Automotive Dealers & Gasoline Service Stations | | | | | 1,556,956 | | | | | | | | | | 1,556,956 |
Automotive Repair, Services & Parking - 0.09% | | | | | | | | | | | | | | | |
Allison Transmission Incorporated 11.00%, Due 11/01/15«†† | | 50,000 | | | 48,125 | | | | | | | 50,000 | | | 48,125 |
Allison Transmission Incorporated 11.25%, Due 11/01/15 | | 220,000 | | | 205,150 | | | | | | | 220,000 | | | 205,150 |
Neff Corporation 10.00%, Due 06/01/15« | | 135,000 | | | 81,000 | | | | | | | 135,000 | | | 81,000 |
Total Automotive Repair, Services & Parking | | | | | 334,275 | | | | | | | | | | 334,275 |
Building Construction-General Contractors & Operative Builders - 0.09% | | | | | | | | | | | | | | | |
Esco Corporation 8.63%, Due 12/15/13†† | | 100,000 | | | 100,500 | | | | | | | 100,000 | | | 100,500 |
Esco Corporation 9.57%, Due 12/15/13±†† | | 250,000 | | | 247,500 | | | | | | | 250,000 | | | 247,500 |
Total Building Construction-General Contractors & Operative Builders | | | | | 348,000 | | | | | | | | | | 348,000 |
Business Services - 5.17% | | | | | | | | | | | | | | | |
Affinity Group Incorporated 10.88%, Due 02/15/12¥ | | 50,000 | | | 50,000 | | | | | | | 50,000 | | | 50,000 |
Affinity Group Incorporated 9.00%, Due 02/15/12 | | 350,000 | | | 330,750 | | | | | | | 350,000 | | | 330,750 |
Deluxe Corporation 7.38%, Due 06/01/15 | | | | | | | 3,295,000 | | | 3,270,288 | | 3,295,000 | | | 3,270,288 |
First Data Corporation 9.88%, Due 09/24/15«†† | | 485,000 | | | 451,050 | | | | | | | 485,000 | | | 451,050 |
Kar Holdings Incorporated 10.00%, Due 05/01/15†† | | 550,000 | | | 499,125 | | | | | | | 550,000 | | | 499,125 |
Lamar Media Corporation 6.63%, Due 08/15/15†† | | 300,000 | | | 285,000 | | | | | | | 300,000 | | | 285,000 |
Lamar Media Corporation 6.63%, Due 08/15/15†† | | | | | | | 2,360,000 | | | 2,242,000 | | 2,360,000 | | | 2,242,000 |
Nco Group Incorporated 11.88%, Due 11/15/14 | | 350,000 | | | 336,000 | | | | | | | 350,000 | | | 336,000 |
Open Solutions Incorporated 9.75%, Due 02/01/15†† | | 475,000 | | | 441,750 | | | | | | | 475,000 | | | 441,750 |
Penhall International Corporation 12.00%, Due 08/01/14†† | | | | | | | 1,680,000 | | | 1,545,600 | | 1,680,000 | | | 1,545,600 |
Rainbow National Services LLC 10.38%, Due 09/01/14†† | | | | | | | 1,490,000 | | | 1,609,200 | | 1,490,000 | | | 1,609,200 |
Rental Service Corporation 9.50%, Due 12/01/14 | | | | | | | 1,705,000 | | | 1,581,388 | | 1,705,000 | | | 1,581,388 |
Seagate Technology HDD Holdings 6.80%, Due 10/01/16 | | 700,000 | | | 689,500 | | | | | | | 700,000 | | | 689,500 |
Sungard Data Systems Incorporated 10.25%, Due 08/15/15« | | 600,000 | | | 618,000 | | | | | | | 600,000 | | | 618,000 |
SunGard Data Systems Incorporated 3.75%, Due 01/15/09 | | 200,000 | | | 193,000 | | | | | | | 200,000 | | | 193,000 |
SunGard Data Systems Incorporated 9.13%, Due 08/15/13 | | 550,000 | | | 559,625 | | 2,610,000 | | | 2,655,675 | | 3,160,000 | | | 3,215,300 |
United Rentals North America Incorporated 7.75%, Due 11/15/13« | | | | | | | 1,310,000 | | | 1,198,650 | | 1,310,000 | | | 1,198,650 |
West Corporation 11.00%, Due 10/15/16« | | | | | | | 1,640,000 | | | 1,640,000 | | 1,640,000 | | | 1,640,000 |
| | |
| Proforma Portfolio of Investments - November 30, 2007 (Unaudited) | | Wells Fargo Advantage Funds |
| | | | | | | | | | | | |
| | | High Yield Bond Fund | | High Income Fund | | Pro Forma Combined |
| | | Shares or
Principal
Amount | | Value
(Note 2) | | Shares or
Principal
Amount | | Value
(Note 2) | | Shares or
Principal
Amount | | Value
(Note 2) |
Total Business Services | | | | 4,453,800 | | | | 15,742,801 | | | | 20,196,601 |
Casino & Gaming - 4.80% | | | | | | | | | | | | |
CCM Merger Incorporated 8.00%, Due 08/01/13†† | | | | | | 2,215,000 | | 2,054,413 | | 2,215,000 | | 2,054,413 |
Chukchansi Economic Development Authority 8.00%, Due 11/15/13†† | | 250,000 | | 245,000 | | | | | | 250,000 | | 245,000 |
Chukchansi Economic Development Authority 8.24%, Due 11/15/12±†† | | 120,000 | | 117,000 | | | | | | 120,000 | | 117,000 |
MGM Mirage Incorporated 6.00%, Due 10/01/09 | | 400,000 | | 396,000 | | | | | | 400,000 | | 396,000 |
MGM Mirage Incorporated 7.63%, Due 01/15/17 | | | | | | 1,980,000 | | 1,970,100 | | 1,980,000 | | 1,970,100 |
MTR Gaming Group Incorporated Series B 9.00%, Due 06/01/12 | | 200,000 | | 190,000 | | | | | | 200,000 | | 190,000 |
Penn National Gaming Incorporated 6.75%, Due 03/01/15 | | | | | | 2,550,000 | | 2,581,875 | | 2,550,000 | | 2,581,875 |
Penn National Gaming Incorporated 6.88%, Due 12/01/11 | | 480,000 | | 478,800 | | | | | | 480,000 | | 478,800 |
Pinnacle Entertainment 8.25%, Due 03/15/12 | | | | | | 1,750,000 | | 1,767,500 | | 1,750,000 | | 1,767,500 |
Pokagon Gaming Authority 10.38%, Due 06/15/14†† | | | | | | 2,490,000 | | 2,664,300 | | 2,490,000 | | 2,664,300 |
River Rock Entertainment Authority 9.75%, Due 11/01/11 | | 100,000 | | 103,000 | | | | | | 100,000 | | 103,000 |
San Pasqual Casino 8.00%, Due 09/15/13†† | | 425,000 | | 418,625 | | | | | | 425,000 | | 418,625 |
Tunica-Biloxi Gaming AU 9.00%, Due 11/15/15†† | | | | | | 1,850,000 | | 1,868,500 | | 1,850,000 | | 1,868,500 |
Turning Stone Casino Resort Enterprise 9.13%, Due 12/15/10†† | | | | | | 2,110,000 | | 2,120,550 | | 2,110,000 | | 2,120,550 |
Waterford Gaming LLC 8.63%, Due 09/15/14†† | | | | | | 1,655,000 | | 1,652,931 | | 1,655,000 | | 1,652,931 |
Wynn Las Vegas LLC 6.63%, Due 12/01/14 | | 134,000 | | 129,980 | | | | | | 134,000 | | 129,980 |
Total Casino & Gaming | | | | 2,078,405 | | | | 16,680,169 | | | | 18,758,574 |
Chemicals & Allied Products - 0.88% | | | | | | | | | | | | |
Equistar Chemicals LP/Equistar Funding Corporation 10.13%, Due 09/01/08 | | 131,000 | | 135,585 | | | | | | 131,000 | | 135,585 |
Huntsman International LLC 7.88%, Due 11/15/14 | | 150,000 | | 160,875 | | | | | | 150,000 | | 160,875 |
Innophos Incorporated 8.88%, Due 08/15/14 | | 265,000 | | 263,675 | | | | | | 265,000 | | 263,675 |
Lyondell Chemical Company 8.00%, Due 09/15/14 | | 167,000 | | 189,128 | | | | | | 167,000 | | 189,128 |
Lyondell Chemical Company 8.25%, Due 09/15/16 | | 278,000 | | 325,955 | | | | | | 278,000 | | 325,955 |
Mosaic Company 7.38%, Due 12/01/14†† | | 250,000 | | 263,750 | | | | | | 250,000 | | 263,750 |
Mosaic Company 7.63%, Due 12/01/16«†† | | 250,000 | | 267,500 | | | | | | 250,000 | | 267,500 |
Mosaic Company 7.63%, Due 12/01/16††« | | | | | | 1,710,000 | | 1,829,700 | | 1,710,000 | | 1,829,700 |
Total Chemicals & Allied Products | | | | 1,606,468 | | | | 1,829,700 | | | | 3,436,168 |
Coal Mining - 1.39% | | | | | | | | | | | | |
Foundation PA Coal Company 7.25%, Due 08/01/14« | | | | | | 3,145,000 | | 3,027,063 | | 3,145,000 | | 3,027,063 |
Massey Energy Company 6.88%, Due 12/15/13 | | | | | | 2,545,000 | | 2,405,025 | | 2,545,000 | | 2,405,025 |
Total Coal Mining | | | | | | | | 5,432,088 | | | | 5,432,088 |
Communications - 12.24% | | | | | | | | | | | | |
American Tower Corporation 7.00%, Due 10/15/17†† | | 320,000 | | 325,600 | | 2,455,000 | | 2,497,963 | | 2,775,000 | | 2,823,563 |
Barrington Broadcasting Group Llc and Barrington Broadcasting Capital Corporation 10.50%, Due 08/15/14 | | 640,000 | | 649,600 | | | | | | 640,000 | | 649,600 |
CCH I LLC/CCH I Capital Corporation 11.00%, Due 10/01/15« | | | | | | 1,635,000 | | 1,422,450 | | 1,635,000 | | 1,422,450 |
CCH II LLC/CCH II Capital Corporation 10.25%, Due 10/01/13 | | | | | | 3,240,000 | | 3,207,600 | | 3,240,000 | | 3,207,600 |
Centennial Communications Corporation 10.00%, Due 01/01/13« | | 600,000 | | 624,000 | | | | | | 600,000 | | 624,000 |
Charter Communication OPT LLC Capital 8.00%, Due 04/30/12†† | | 1,245,000 | | 1,216,988 | | | | | | 1,245,000 | | 1,216,988 |
Charter Communication OPT LLC Capital 8.38%, Due 04/30/14†† | | 525,000 | | 514,500 | | | | | | 525,000 | | 514,500 |
Charter Communications Holdings II LLC/Capital Corporation 10.25%, Due 09/15/10 | | | | | | 1,660,000 | | 1,639,250 | | 1,660,000 | | 1,639,250 |
Citizens Communications Company 6.25%, Due 01/15/13 | | | | | | 2,130,000 | | 2,058,113 | | 2,130,000 | | 2,058,113 |
Citizens Communications Company 7.05%, Due 10/01/46 | | 325,000 | | 264,875 | | | | | | 325,000 | | 264,875 |
Citizens Communications Company 7.13%, Due 03/15/19 | | 35,000 | | 33,425 | | | | | | 35,000 | | 33,425 |
Cricket Communications Incorporated 9.38%, Due 11/01/14 | | 450,000 | | 418,500 | | | | | | 450,000 | | 418,500 |
CSC Holdings Incorporated 7.88%, Due 12/15/07 | | 275,000 | | 275,000 | | | | | | 275,000 | | 275,000 |
CSC Holdings Incorporated Series B 7.63%, Due 04/01/11 | | | | | | 1,730,000 | | 1,695,400 | | 1,730,000 | | 1,695,400 |
DIRECTV Holdings/Finance 6.38%, Due 06/15/15 | | 50,000 | | 48,375 | | | | | | 50,000 | | 48,375 |
DIRECTV Holdings/Finance 8.38%, Due 03/15/13 | | 500,000 | | 518,750 | | | | | | 500,000 | | 518,750 |
Dobson Cellular Systems Incorporated 8.38%, Due 11/01/11 | | 200,000 | | 214,500 | | | | | | 200,000 | | 214,500 |
Dobson Cellular Systems Incorporated 9.88%, Due 11/01/12 | | 400,000 | | 437,000 | | | | | | 400,000 | | 437,000 |
Dobson Communications Corporation 8.88%, Due 10/01/13« | | 380,000 | | 408,500 | | | | | | 380,000 | | 408,500 |
Dobson Communications Corporation 9.61%, Due 10/15/12± | | 250,000 | | 255,000 | | | | | | 250,000 | | 255,000 |
Echostar DBS Corporation 7.13%, Due 02/01/16 | | 350,000 | | 364,438 | | | | | | 350,000 | | 364,438 |
Embarq Corporation 8.00%, Due 06/01/36 | | | | | | 2,645,000 | | 2,795,501 | | 2,645,000 | | 2,795,501 |
Fisher Communications Incorporated 8.63%, Due 09/15/14 | | 300,000 | | 304,500 | | | | | | 300,000 | | 304,500 |
Intelsat Corporation 9.00%, Due 06/15/16 | | 395,000 | | 400,925 | | | | | | 395,000 | | 400,925 |
L-3 Communications Corporation 6.38%, Due 10/15/15 | | 660,000 | | 653,400 | | 1,985,000 | | 1,965,150 | | 2,645,000 | | 2,618,550 |
LBI Media Incorporated 8.50%, Due 08/01/17†† | | 250,000 | | 241,250 | | | | | | 250,000 | | 241,250 |
Mediacom Broadband LLC 8.50%, Due 10/15/15 | | | | | | 3,360,000 | | 2,990,400 | | 3,360,000 | | 2,990,400 |
Metropcs Wireless Incorporated 9.25%, Due 11/01/14 | | 825,000 | | 781,688 | | | | | | 825,000 | | 781,688 |
Nextel Communications Series F 5.95%, Due 03/15/14 | | | | | | 2,620,000 | | 2,440,554 | | 2,620,000 | | 2,440,554 |
| | |
| Proforma Portfolio of Investments - November 30, 2007 (Unaudited) | | Wells Fargo Advantage Funds |
| | | | | | | | | | | | |
| | | High Yield Bond Fund | | High Income Fund | | Pro Forma Combined |
| | | Shares or
Principal
Amount | | Value
(Note 2) | | Shares or
Principal
Amount | | Value
(Note 2) | | Shares or
Principal
Amount | | Value
(Note 2) |
PanAmSat Corporation 9.00%, Due 08/15/14 | | 705,000 | | 715,575 | | | | | | 705,000 | | 715,575 |
Paxson Communications 11.49%, Due 01/15/13††«± | | | | | | 2,320,000 | | 2,302,600 | | 2,320,000 | | 2,302,600 |
Qwest Communications International Incorporated 7.25%, Due 02/15/11 | | 155,000 | | 153,450 | | | | | | 155,000 | | 153,450 |
Qwest Communications International Incorporated Series B 7.50%, Due 02/15/14 | | 785,000 | | 779,113 | | 2,905,000 | | 2,883,213 | | 3,690,000 | | 3,662,326 |
Qwest Corporation 7.50%, Due 10/01/14 | | 150,000 | | 151,875 | | | | | | 150,000 | | 151,875 |
Qwest Corporation 7.63%, Due 06/15/15 | | 480,000 | | 489,600 | | | | | | 480,000 | | 489,600 |
Qwest Corporation 8.94%, Due 06/15/13± | | | | | | 3,380,000 | | 3,472,950 | | 3,380,000 | | 3,472,950 |
RH Donnelley Corporation 8.88%, Due 10/15/17†† | | | | | | 845,000 | | 796,413 | | 845,000 | | 796,413 |
Rural Cellular Corporation 8.25%, Due 03/15/12 | | 200,000 | | 207,500 | | | | | | 200,000 | | 207,500 |
Rural Cellular Corporation 9.88%, Due 02/01/10 | | 1,305,000 | | 1,353,938 | | | | | | 1,305,000 | | 1,353,938 |
Time Warner Telecommunication Holdings 9.25%, Due 02/15/14 | | 300,000 | | 306,750 | | | | | | 300,000 | | 306,750 |
Windstream Corporation 8.13%, Due 08/01/13 | | | | | | 840,000 | | 864,150 | | 840,000 | | 864,150 |
Windstream Corporation 8.63%, Due 08/01/16 | | | | | | 1,630,000 | | 1,691,125 | | 1,630,000 | | 1,691,125 |
Total Communications | | | | 13,108,615 | | | | 34,722,832 | | | | 47,831,447 |
Consumer Services - 0.07% | | | | | | | | | | | | |
Allis-Chalmers Energy Incorporated 8.50%, Due 03/01/17 | | 300,000 | | 288,000 | | | | | | 300,000 | | 288,000 |
Total Consumer Services | | | | 288,000 | | | | | | | | 288,000 |
Depository Institutions - 0.23% | | | | | | | | | | | | |
Chevy Chase Bank FSB 6.88%, Due 12/01/13 | | 950,000 | | 912,000 | | | | | | 950,000 | | 912,000 |
Total Depository Institutions | | | | 912,000 | | | | | | | | 912,000 |
Eating & Drinking Places - 2.00% | | | | | | | | | | | | |
ARAMARK Corporation 8.50%, Due 02/01/15 | | | | | | 3,340,000 | | 3,352,525 | | 3,340,000 | | 3,352,525 |
Beverages & More Incorporated 9.25%, Due 03/01/12†† | | 75,000 | | 75,938 | | | | | | 75,000 | | 75,938 |
Denny’s Corporation/Holdings Incorporated 10.00%, Due 10/01/12 | | 400,000 | | 396,000 | | | | | | 400,000 | | 396,000 |
O’Charleys Incorporated 9.00%, Due 11/01/13 | | 1,400,000 | | 1,386,000 | | | | | | 1,400,000 | | 1,386,000 |
Real Mex Restaurants Incorporated 10.00%, Due 04/01/10Ǥ | | 1,050,000 | | 1,029,000 | | | | | | 1,050,000 | | 1,029,000 |
Sbarro Incorporated 10.38%, Due 02/01/15« | | | | | | 1,820,000 | | 1,583,400 | | 1,820,000 | | 1,583,400 |
Total Eating & Drinking Places | | | | 2,886,938 | | | | 4,935,925 | | | | 7,822,863 |
Educational Services - 0.54% | | | | | | | | | | | | |
Education Management LLC 8.75%, Due 06/01/14 | | | | | | 2,110,000 | | 2,110,000 | | 2,110,000 | | 2,110,000 |
Total Educational Services | | | | | | | | 2,110,000 | | | | 2,110,000 |
Electric, Gas & Sanitary Services - 7.43% | | | | | | | | | | | | |
Allied Waste North America 6.38%, Due 04/15/11« | | 350,000 | | 345,625 | | | | | | 350,000 | | 345,625 |
Allied Waste North America 6.50%, Due 11/15/10 | | 300,000 | | 300,375 | | | | | | 300,000 | | 300,375 |
Allied Waste North America Incorporated 6.88%, Due 06/01/17 | | | | | | 1,720,000 | | 1,692,050 | | 1,720,000 | | 1,692,050 |
Clean Harbors Incorporated 11.25%, Due 07/15/12 | | | | | | 532,000 | | 574,323 | | 532,000 | | 574,323 |
Edison Mission Energy 7.75%, Due 06/15/16 | | | | | | 1,680,000 | | 1,696,800 | | 1,680,000 | | 1,696,800 |
Edison Misson Energy 7.20%, Due 05/15/19 | | | | | | 2,735,000 | | 2,611,925 | | 2,735,000 | | 2,611,925 |
El Paso Corporation 6.88%, Due 06/15/14 | | 100,000 | | 100,293 | | | | | | 100,000 | | 100,293 |
El Paso Corporation 7.00%, Due 06/15/17 | | 475,000 | | 476,031 | | | | | | 475,000 | | 476,031 |
El Paso Performance-Linked Trust 7.75%, Due 07/15/11†† | | 450,000 | | 471,254 | | | | | | 450,000 | | 471,254 |
Ferrellgas Partners LP 6.75%, Due 05/01/14 | | 350,000 | | 339,500 | | | | | | 350,000 | | 339,500 |
Inergy LP/Inergy Finance Corporation 6.88%, Due 12/15/14« | | | | | | 1,770,000 | | 1,708,050 | | 1,770,000 | | 1,708,050 |
Mirant North America LLC 7.38%, Due 12/31/13« | | | | | | 1,950,000 | | 1,954,875 | | 1,950,000 | | 1,954,875 |
Nevada Power Company Series M 5.95%, Due 03/15/16 | | 100,000 | | 100,521 | | | | | | 100,000 | | 100,521 |
Nevada Power Company Series O 6.50%, Due 05/15/18 | | 200,000 | | 207,386 | | | | | | 200,000 | | 207,386 |
Northwest Pipeline Corporation 7.00%, Due 06/15/16 | | 125,000 | | 135,781 | | | | | | 125,000 | | 135,781 |
NRG Energy Incorporated 7.25%, Due 02/01/14 | | 605,000 | | 591,388 | | | | | | 605,000 | | 591,388 |
NRG Energy Incorporated 7.38%, Due 01/15/17 | | 200,000 | | 195,500 | | 2,100,000 | | 2,052,750 | | 2,300,000 | | 2,248,250 |
NRG Energy Incorporated 7.38%, Due 02/01/16 | | 700,000 | | 686,000 | | 3,210,000 | | 3,145,800 | | 3,910,000 | | 3,831,800 |
Sierra Pacific Power Company 6.00%, Due 05/15/16 | | 300,000 | | 303,590 | | | | | | 300,000 | | 303,590 |
Sierra Pacific Power Company Series P 6.75%, Due 07/01/37 | | 200,000 | | 206,304 | | | | | | 200,000 | | 206,304 |
Sierra Pacific Resources 6.75%, Due 08/15/17 | | | | | | 4,980,000 | | 4,835,610 | | 4,980,000 | | 4,835,610 |
Tennessee Gas Pipeline Company 8.38%, Due 06/15/32 | | | | | | 3,480,000 | | 4,102,395 | | 3,480,000 | | 4,102,395 |
Texas Competitive Eletric Holdings Company LLC 10.25%, Due 11/01/15†† | | | | | | 210,000 | | 208,910 | | 210,000 | | 208,910 |
Total Electric, Gas & Sanitary Services | | | | 4,459,548 | | | | 24,583,488 | | | | 29,043,036 |
Energy - 0.27% | | | | | | | | | | | | |
White Pine Hydro Portfolio 7.26%, Due 07/20/15†† | | | | | | 1,000,000 | | 1,040,881 | | 1,000,000 | | 1,040,881 |
Total Energy | | | | | | | | 1,040,881 | | | | 1,040,881 |
Electronic & Other Electrical Equipment & Components, Except Computer Equipment - 0.08% | | | | | | | | | | | | |
Baldor Electric Company 8.63%, Due 02/15/17 | | 325,000 | | 333,125 | | | | | | 325,000 | | 333,125 |
Total Electronic & Other Electrical Equipment & Components, Except Computer Equipment | | | | 333,125 | | | | | | | | 333,125 |
Engineering, Accounting, Research Management & Related Services - 0.86% | | | | | | | | | | | | |
Cornell Companies Incorporated 10.75%, Due 07/01/12 | | 400,000 | | 427,000 | | | | | | 400,000 | | 427,000 |
Lvb Acquisition Merger Sub Incorporated 11.63%, Due 10/15/17†† | | 500,000 | | 493,125 | | | | | | 500,000 | | 493,125 |
| | |
| Proforma Portfolio of Investments - November 30, 2007 (Unaudited) | | Wells Fargo Advantage Funds |
| | | | | | | | | | | | |
| | | High Yield Bond Fund | | High Income Fund | | Pro Forma Combined |
| | | Shares or
Principal
Amount | | Value
(Note 2) | | Shares or
Principal
Amount | | Value
(Note 2) | | Shares or
Principal
Amount | | Value
(Note 2) |
US Oncology Incorporated 9.00%, Due 08/15/12 | | | | | | 2,465,000 | | 2,428,025 | | 2,465,000 | | 2,428,025 |
Total Engineering, Accounting, Research Management & Related Services | | | | 920,125 | | | | 2,428,025 | | | | 3,348,150 |
Fabricated Metal Products, Except Machinery & Transportation Equipment - 0.84% | | | | | | | | | | | | |
Ball Corporation 6.63%, Due 03/15/18 | | | | | | 3,310,000 | | 3,268,625 | | 3,310,000 | | 3,268,625 |
Total Fabricated Metal Products, Except Machinery & Transportation Equipment | | | | | | | | 3,268,625 | | | | 3,268,625 |
Food & Kindred Products - 0.98% | | | | | | | | | | | | |
Constellation Brands Incorporated 7.25%, Due 09/01/16 | | 100,000 | | 93,500 | | | | | | 100,000 | | 93,500 |
Dean Foods Company 6.90%, Due 10/15/17 | | 125,000 | | 108,438 | | | | | | 125,000 | | 108,438 |
Parmalat Bakery Series A2 5.00%, Due 07/09/12††(i) | | | | | | 1,329,852 | | 1,156,971 | | 1,329,852 | | 1,156,971 |
Parmalat Dairy Series A1 5.00%, Due 07/09/10††(i) | | | | | | 1,329,852 | | 1,196,867 | | 1,329,852 | | 1,196,867 |
Pinnacle Foods LLC Corporation 9.25%, Due 04/01/15†† | | | | | | 515,000 | | 466,075 | | 515,000 | | 466,075 |
Reynolds American Incorporated 7.63%, Due 06/01/16 | | 650,000 | | 709,613 | | | | | | 650,000 | | 709,613 |
Smithfield Foods Incorporated 7.75%, Due 07/01/17 | | 95,000 | | 92,150 | | | | | | 95,000 | | 92,150 |
Total Food & Kindred Products | | | | 1,003,701 | | | | 2,819,913 | | | | 3,823,614 |
Health Services - 4.96% | | | | | | | | | | | | |
Alliance Imaging Incorporated 7.25%, Due 12/15/12†† | | | | | | 2,530,000 | | 2,352,900 | | 2,530,000 | | 2,352,900 |
Community Health Systems Incorporated Series WI 8.88%, Due 07/15/15 | | 770,000 | | 777,700 | | | | | | 770,000 | | 777,700 |
Community Health Systems Incorporated Series WI 8.88%, Due 07/15/15 | | | | | | 3,385,000 | | 3,418,850 | | 3,385,000 | | 3,418,850 |
DaVita Incorporated 7.25%, Due 03/15/15 | | | | | | 2,560,000 | | 2,489,600 | | 2,560,000 | | 2,489,600 |
Hca Incorporated 9.13%, Due 11/15/14 | | 250,000 | | 255,625 | | | | | | 250,000 | | 255,625 |
HCA Incorporated 9.25%, Due 11/15/16 | | 950,000 | | 983,250 | | 2,520,000 | | 2,608,200 | | 3,470,000 | | 3,591,450 |
HCA Incorporated 9.63%, Due 11/15/16«¥ | | | | | | 3,360,000 | | 3,494,400 | | 3,360,000 | | 3,494,400 |
Sun Healthcare Group Incorporated 9.13%, Due 04/15/15 | | 200,000 | | 200,500 | | | | | | 200,000 | | 200,500 |
Tenet Healthcare Corporation 6.38%, Due 12/01/11 | | 675,000 | | 607,500 | | | | | | 675,000 | | 607,500 |
Tenet Healthcare Corporation 6.88%, Due 11/15/31 | | 160,000 | | 119,200 | | | | | | 160,000 | | 119,200 |
United Surgical Partners International Incorporated 8.88%, Due 05/01/17 | | 240,000 | | 234,000 | | | | | | 240,000 | | 234,000 |
Vanguard Health Holdings 9.00%, Due 10/01/14 | | | | | | 1,960,000 | | 1,857,100 | | 1,960,000 | | 1,857,100 |
Total Health Services | | | | 3,177,775 | | | | 16,221,050 | | | | 19,398,825 |
Holding & Other Investment Offices - 0.25% | | | | | | | | | | | | |
Bonten Media Acquisition Company 9.00%, Due 06/01/15 | | 85,000 | | 75,225 | | | | | | 85,000 | | 75,225 |
Sheridan Acquisition Corporation 10.25%, Due 08/15/11 | | 905,000 | | 905,000 | | | | | | 905,000 | | 905,000 |
Total Holding & Other Investment Offices | | | | 980,225 | | | | | | | | 980,225 |
Industrial & Commercial Machinery & Computer Equipment - 1.74% | | | | | | | | | | | | |
Actuant Corporation 6.88%, Due 06/15/17††« | | | | | | 1,065,000 | | 1,038,375 | | 1,065,000 | | 1,038,375 |
Case New Holland Incorporated 7.13%, Due 03/01/14 | | | | | | 2,390,000 | | 2,384,025 | | 2,390,000 | | 2,384,025 |
Grant Prideco Incorporated Series B 6.13%, Due 08/15/15 | | | | | | 1,650,000 | | 1,691,250 | | 1,650,000 | | 1,691,250 |
Terex Corporation 8.00%, Due 11/15/17 | | | | | | 1,690,000 | | 1,698,450 | | 1,690,000 | | 1,698,450 |
Total Industrial & Commercial Machinery & Computer Equipment | | | | | | | | 6,812,100 | | | | 6,812,100 |
Insurance Agents, Brokers & Service - 0.11% | | | | | | | | | | | | |
USI Holdings Corporation 9.75%, Due 05/15/15†† | | 500,000 | | 417,500 | | | | | | 500,000 | | 417,500 |
Total Insurance Agents, Brokers & Service | | | | 417,500 | | | | | | | | 417,500 |
Insurance Carriers - 0.21% | | | | | | | | | | | | |
Centene Corporation 7.25%, Due 04/01/14 | | 400,000 | | 390,000 | | | | | | 400,000 | | 390,000 |
MultiPlan Incorporated 10.38%, Due 04/15/16†† | | 450,000 | | 450,000 | | | | | | 450,000 | | 450,000 |
Total Insurance Carriers | | | | 840,000 | | | | | | | | 840,000 |
Justice, Public Order & Safety - 0.98% | | | | | | | | | | | | |
Corrections Corporation of America 6.25%, Due 03/15/13 | | 625,000 | | 617,188 | | 2,600,000 | | 2,567,500 | | 3,225,000 | | 3,184,688 |
Corrections Corporation of America 6.75%, Due 01/31/14 | | 130,000 | | 130,488 | | | | | | 130,000 | | 130,488 |
Geo Group Incorporated 8.25%, Due 07/15/13 | | 525,000 | | 525,000 | | | | | | 525,000 | | 525,000 |
Total Justice, Public Order & Safety | | | | 1,272,676 | | | | 2,567,500 | | | | 3,840,176 |
Legal Services - 0.76% | | | | | | | | | | | | |
FTI Consulting Incorporated 7.75%, Due 10/01/16 | | | | | | 2,855,000 | | 2,962,063 | | 2,855,000 | | 2,962,063 |
Total Legal Services | | | | | | | | 2,962,063 | | | | 2,962,063 |
Local & Sub-Transit & Interurban Highway Pass Transportation - 0.13% | | | | | | | | | | | | |
Rural Metro Corporation 9.88%, Due 03/15/15 | | 515,000 | | 494,400 | | | | | | 515,000 | | 494,400 |
Total Local & Sub-Transit & Interurban Highway Pass Transportation | | | | 494,400 | | | | | | | | 494,400 |
Measuring, Analyzing & Controlling Instruments: Photographic, Medical & Optical Goods - 0.60% | | | | | | | | | | | | |
Cooper Companies Incorporated 7.13%, Due 02/15/15 | | 700,000 | | 679,000 | | | | | | 700,000 | | 679,000 |
Invacare Corporation 9.75%, Due 02/15/15 | | | | | | 1,660,000 | | 1,651,700 | | 1,660,000 | | 1,651,700 |
| | |
| Proforma Portfolio of Investments - November 30, 2007 (Unaudited) | | Wells Fargo Advantage Funds |
| | | | | | | | | | | | |
| | | High Yield Bond Fund | | High Income Fund | | Pro Forma Combined |
| | | Shares or
Principal
Amount | | Value
(Note 2) | | Shares or
Principal
Amount | | Value
(Note 2) | | Shares or
Principal
Amount | | Value
(Note 2) |
Total Measuring, Analyzing & Controlling Instruments: | | | | | | | | | | | | |
Photographic, Medical & Optical Goods | | | | 679,000 | | | | 1,651,700 | | | | 2,330,700 |
Metal Mining - 1.40% | | | | | | | | | | | | |
Freeport-McMoran Copper & Gold Incorporated 8.25%, Due 04/01/15 | | 150,000 | | 160,125 | | | | | | 150,000 | | 160,125 |
Freeport-McMoran Copper & Gold Incorporated 8.38%, Due 04/01/17 | | 780,000 | | 842,400 | | 2,540,000 | | 2,743,200 | | 3,320,000 | | 3,585,600 |
Noranda Aluminum Acquisition Corporation 8.74%, Due 05/15/15††± | | | | | | 2,020,000 | | 1,737,200 | | 2,020,000 | | 1,737,200 |
Total Metal Mining | | | | 1,002,525 | | | | 4,480,400 | | | | 5,482,925 |
Miscellaneous Manufacturing Industries - 1.60% | | | | | | | | | | | | |
ALH Finance LLC/ALH Finance Corporation 8.50%, Due 01/15/13« | | 860,000 | | 808,400 | | 2,405,000 | | 2,260,700 | | 3,265,000 | | 3,069,100 |
Clarke American Corporation 9.50%, Due 05/15/15 | | | | | | 1,735,000 | | 1,492,100 | | 1,735,000 | | 1,492,100 |
Gentek Incorporated 11.00%, Due 08/01/09^^(a) | | | | | | 4,850,000 | | 0 | | 4,850,000 | | 0 |
RBS Global Incorporated & Rexnord LLC 8.88%, Due 09/01/16 | | | | | | 1,730,000 | | 1,678,100 | | 1,730,000 | | 1,678,100 |
Total Miscellaneous Manufacturing Industries | | | | 808,400 | | | | 5,430,900 | | | | 6,239,300 |
Miscellaneous Retail - 0.65% | | | | | | | | | | | | |
AmeriGas Partners LP 7.13%, Due 05/20/16 | | 375,000 | | 360,000 | | | | | | 375,000 | | 360,000 |
AmeriGas Partners LP 7.25%, Due 05/20/15 | | 360,000 | | 349,200 | | | | | | 360,000 | | 349,200 |
Michaels Stores Incorporated 10.00%, Due 11/01/14« | | | | | | 1,680,000 | | 1,654,800 | | 1,680,000 | | 1,654,800 |
Rite Aid Corporation 9.50%, Due 06/15/17†† | | 200,000 | | 172,000 | | | | | | 200,000 | | 172,000 |
Total Miscellaneous Retail | | | | 881,200 | | | | 1,654,800 | | | | 2,536,000 |
Motion Pictures - 0.86% | | | | | | | | | | | | |
AMC Entertainment Incorporated Series B 8.63%, Due 08/15/12 | | 650,000 | | 664,625 | | 2,330,000 | | 2,382,425 | | 2,980,000 | | 3,047,050 |
Muzak Finance Corporation LLC 13.00%, Due 03/15/10 | | 602,000 | | 301,753 | | | | | | 602,000 | | 301,753 |
Total Motion Pictures | | | | 966,378 | | | | 2,382,425 | | | | 3,348,803 |
Motor Freight Transportation & Warehousing - 0.02% | | | | | | | | | | | | |
Trailer Bridge Incorporated 9.25%, Due 11/15/11 | | 70,000 | | 69,913 | | | | | | 70,000 | | 69,913 |
Total Motor Freight Transportation & Warehousing | | | | 69,913 | | | | | | | | 69,913 |
Non-Depository Credit Institutions - 3.75% | | | | | | | | | | | | |
Consolidated Communications Illinois Texas Holdings Incorporated 9.75%, Due 04/01/12 | | 230,000 | | 235,750 | | | | | | 230,000 | | 235,750 |
Ford Motor Credit Company 7.25%, Due 10/25/11 | | 400,000 | | 361,100 | | | | | | 400,000 | | 361,100 |
Ford Motor Credit Company LLC 7.00%, Due 10/01/13 | | 845,000 | | 738,012 | | 1,460,000 | | 1,275,145 | | 2,305,000 | | 2,013,157 |
Ford Motor Credit Company LLC 7.80%, Due 06/01/12 | | | | | | 1,665,000 | | 1,483,890 | | 1,665,000 | | 1,483,890 |
Ford Motor Credit Company LLC 8.00%, Due 12/15/16 | | 550,000 | | 481,222 | | 1,245,000 | | 1,089,312 | | 1,795,000 | | 1,570,534 |
General Motors Acceptance Corporation LLC Series MTN 4.38%, Due 12/10/07 | | 100,000 | | 99,914 | | | | | | 100,000 | | 99,914 |
GMAC LLC 6.63%, Due 05/15/12 | | | | | | 2,110,000 | | 1,787,632 | | 2,110,000 | | 1,787,632 |
GMAC LLC 6.75%, Due 12/01/14 | | 450,000 | | 370,188 | | 2,245,000 | | 1,846,825 | | 2,695,000 | | 2,217,013 |
GMAC LLC 8.00%, Due 11/01/31 | | 1,020,000 | | 865,432 | | 1,140,000 | | 967,248 | | 2,160,000 | | 1,832,680 |
Hexion US Finance Corporation/Hexion Nova Scotia Finance ULC 9.75%, Due 11/15/14 | | | | | | 2,505,000 | | 2,692,875 | | 2,505,000 | | 2,692,875 |
NSG Holdings LLC/NSG Holdings Incorporated 7.75%, Due 12/15/25†† | | 375,000 | | 370,313 | | | | | | 375,000 | | 370,313 |
Total Non-Depository Credit Institutions | | | | 3,521,931 | | | | 11,142,927 | | | | 14,664,858 |
Oil & Gas Extraction - 6.10% | | | | | | | | | | | | |
Caithness Coso Funding Corporation 6.26%, Due 06/15/14†† | | | | | | 2,480,770 | | 2,701,162 | | 2,480,770 | | 2,701,162 |
Calfrac Holdings LP 7.75%, Due 02/15/15«†† | | 350,000 | | 335,125 | | | | | | 350,000 | | 335,125 |
Chesapeake Energy Corporation 6.25%, Due 01/15/18 | | | | | | 1,770,000 | | 1,668,225 | | 1,770,000 | | 1,668,225 |
Chesapeake Energy Corporation 6.38%, Due 06/15/15 | | | | | | 3,450,000 | | 3,312,000 | | 3,450,000 | | 3,312,000 |
Chesapeake Energy Corporation 6.63%, Due 01/15/16« | | 150,000 | | 145,500 | | | | | | 150,000 | | 145,500 |
Chesapeake Energy Corporation 6.88%, Due 11/15/20« | | 650,000 | | 622,375 | | | | | | 650,000 | | 622,375 |
Forest Oil Corporation 7.25%, Due 06/15/19†† | | | | | | 2,550,000 | | 2,524,500 | | 2,550,000 | | 2,524,500 |
Hilcorp Energy 7.75%, Due 11/01/15†† | | 120,000 | | 116,100 | | 2,825,000 | | 2,733,188 | | 2,945,000 | | 2,849,288 |
Key Energy Services Incorporated 8.38%, Due 12/01/14†† | | | | | | 2,530,000 | | 2,536,325 | | 2,530,000 | | 2,536,325 |
Markwest Energy Partners LP Series B 8.50%, Due 07/15/16 | | 225,000 | | 225,563 | | | | | | 225,000 | | 225,563 |
Pride International Incorporated 7.38%, Due 07/15/14 | | | | | | 2,605,000 | | 2,670,125 | | 2,605,000 | | 2,670,125 |
Range Resources Corporation 7.50%, Due 05/15/16 | | | | | | 2,520,000 | | 2,551,500 | | 2,520,000 | | 2,551,500 |
Sabine Pass LNG LP 7.50%, Due 11/30/16 | | 1,700,000 | | 1,606,500 | | | | | | 1,700,000 | | 1,606,500 |
Swift Energy Company 7.13%, Due 06/01/17 | | 100,000 | | 94,500 | | | | | | 100,000 | | 94,500 |
Total Oil & Gas Extraction | | | | 3,145,663 | | | | 20,697,025 | | | | 23,842,688 |
Paper & Allied Products - 3.11% | | | | | | | | | | | | |
Appleton Papers Incorporated Series B 9.75%, Due 06/15/14 | | | | | | 2,135,000 | | 2,089,631 | | 2,135,000 | | 2,089,631 |
Bowater Incorporated 8.69%, Due 03/15/10± | | | | | | 2,120,000 | | 1,865,600 | | 2,120,000 | | 1,865,600 |
Graham Packaging Company Incorporated 8.50%, Due 10/15/12 | | | | | | 2,220,000 | | 2,070,150 | | 2,220,000 | | 2,070,150 |
Graham Packaging Company Incorporated 9.88%, Due 10/15/14« | | 300,000 | | 275,250 | | | | | | 300,000 | | 275,250 |
Greif Incorporated 6.75%, Due 02/01/17 | | | | | | 2,080,000 | | 1,970,800 | | 2,080,000 | | 1,970,800 |
Neenah Paper Incorporated 7.38%, Due 11/15/14 | | 600,000 | | 558,000 | | | | | | 600,000 | | 558,000 |
P.H. Glatfelter Company 7.13%, Due 05/01/16 | | | | | | 1,690,000 | | 1,656,200 | | 1,690,000 | | 1,656,200 |
| | |
| Proforma Portfolio of Investments - November 30, 2007 (Unaudited) | | Wells Fargo Advantage Funds |
| | | | | | | | | | | | |
| | | High Yield Bond Fund | | High Income Fund | | Pro Forma Combined |
| | | Shares or
Principal
Amount | | Value
(Note 2) | | Shares or
Principal
Amount | | Value
(Note 2) | | Shares or
Principal
Amount | | Value
(Note 2) |
Verso Paper Holdings LLC 9.13%, Due 08/01/14« | | | | | | 1,685,000 | | 1,674,469 | | 1,685,000 | | 1,674,469 |
Total Paper & Allied Products | | | | 833,250 | | | | 11,326,850 | | | | 12,160,100 |
Personal Services - 0.69% | | | | | | | | | | | | |
Mac-Gray Corporation 7.63%, Due 08/15/15 | | 350,000 | | 341,250 | | | | | | 350,000 | | 341,250 |
Service Corporation International 7.63%, Due 10/01/18 | | 100,000 | | 99,250 | | | | | | 100,000 | | 99,250 |
Service Corporation International Series WI 7.50%, Due 06/15/17 | | 700,000 | | 659,750 | | 1,680,000 | | 1,583,400 | | 2,380,000 | | 2,243,150 |
Total Personal Services | | | | 1,100,250 | | | | 1,583,400 | | | | 2,683,650 |
Petroleum Refining & Related Industries - 0.41% | | | | | | | | | | | | |
Hilcorp Energy Lp Hilcorp Finance Company 9.00%, Due 06/01/16†† | | 75,000 | | 76,500 | | | | | | 75,000 | | 76,500 |
Tesoro Corporation 6.50%, Due 06/01/17 | | | | | | 1,535,000 | | 1,515,813 | | 1,535,000 | | 1,515,813 |
Total Petroleum Refining & Related Industries | | | | 76,500 | | | | 1,515,813 | | | | 1,592,313 |
Pipelines - 1.58% | | | | | | | | | | | | |
Dynegy Holdings Incorporated 7.75%, Due 06/01/19 | | | | | | 845,000 | | 760,500 | | 845,000 | | 760,500 |
Dynegy Holdings Incorporated 8.38%, Due 05/01/16 | | | | | | 1,690,000 | | 1,624,513 | | 1,690,000 | | 1,624,513 |
Kinder Morgan Incorporated 7.45%, Due 03/01/49 | | 300,000 | | 265,781 | | | | | | 300,000 | | 265,781 |
Williams Companies Incorporated 7.23%, Due 10/01/10±†† | | 400,000 | | 406,000 | | | | | | 400,000 | | 406,000 |
Williams Companies Incorporated 7.63%, Due 07/15/19 | | | | | | 2,505,000 | | 2,774,288 | | 2,505,000 | | 2,774,288 |
Williams Companies Incorporated 8.75%, Due 03/15/32 | | 300,000 | | 362,250 | | | | | | 300,000 | | 362,250 |
Total Pipelines | | | | 1,034,031 | | | | 5,159,301 | | | | 6,193,332 |
Primary Metal Industries - 0.80% | | | | | | | | | | | | |
Aleris International Incorporated 9.00%, Due 12/15/14 | | | | | | 1,695,000 | | 1,457,700 | | 1,695,000 | | 1,457,700 |
Belden Incorporated 7.00%, Due 03/15/17 | | | | | | 1,680,000 | | 1,650,600 | | 1,680,000 | | 1,650,600 |
Total Primary Metal Industries | | | | | | | | 3,108,300 | | | | 3,108,300 |
Printing, Publishing & Allied Industries - 2.55% | | | | | | | | | | | | |
Dex Media Incorporated 8.00%, Due 11/15/13 | | | | | | 2,700,000 | | 2,578,500 | | 2,700,000 | | 2,578,500 |
Dex Media West LLC/Dex Media West Finance Company Series B 9.88%, Due 08/15/13 | | 511,000 | | 530,801 | | | | | | 511,000 | | 530,801 |
Houghton Mifflin Company 7.20%, Due 03/15/11 | | | | | | 1,965,000 | | 1,935,525 | | 1,965,000 | | 1,935,525 |
Idearc Incorporated 8.00%, Due 11/15/16 | | 650,000 | | 607,750 | | | | | | 650,000 | | 607,750 |
Network Communications Incorporated 10.75%, Due 12/01/13 | | | | | | 1,930,000 | | 1,930,000 | | 1,930,000 | | 1,930,000 |
Nielsen Finance Llc Nielsen Finance Company 11.19%, Due 08/01/16^ | | 350,000 | | 242,375 | | | | | | 350,000 | | 242,375 |
Nielsen Finance LLC/Nielsen Finance Company 10.00%, Due 08/01/14 | | 100,000 | | 101,750 | | 1,685,000 | | 1,714,488 | | 1,785,000 | | 1,816,238 |
R.H. Donnelley Corporation Series A-3 8.88%, Due 01/15/16 | | 340,000 | | 321,300 | | | | | | 340,000 | | 321,300 |
Total Printing, Publishing & Allied Industries | | | | 1,803,976 | | | | 8,158,513 | | | | 9,962,489 |
Real Estate Investment Trusts (REITS) - 2.66% | | | | | | | | | | | | |
BF Saul REIT 7.50%, Due 03/01/14 | | 850,000 | | 807,500 | | | | | | 850,000 | | 807,500 |
Host Marriott LP 7.13%, Due 11/01/13 | | 200,000 | | 200,500 | | | | | | 200,000 | | 200,500 |
Host Marriott LP Series M 7.00%, Due 08/15/12 | | 225,000 | | 225,000 | | | | | | 225,000 | | 225,000 |
Host Marriott LP Series Q 6.75%, Due 06/01/16 | | 500,000 | | 496,250 | | | | | | 500,000 | | 496,250 |
Reckson Operating Partnership LP 6.00%, Due 03/31/16 | | | | | | 2,135,000 | | 2,042,582 | | 2,135,000 | | 2,042,582 |
Rouse Company LP 6.75%, Due 05/01/13†† | | | | | | 2,110,000 | | 1,968,318 | | 2,110,000 | | 1,968,318 |
Ventas Realty LP 6.75%, Due 04/01/17« | | | | | | 4,715,000 | | 4,656,063 | | 4,715,000 | | 4,656,063 |
Total Real Estate Investment Trusts (REITS) | | | | 1,729,250 | | | | 8,666,963 | | | | 10,396,213 |
Rental Auto/Equipment - 1.30% | | | | | | | | | | | | |
Avis Budget Car Rental LLC 7.75%, Due 05/15/16« | | | | | | 2,630,000 | | 2,482,063 | | 2,630,000 | | 2,482,063 |
H&E Equipment Services Incorporated 8.38%, Due 07/15/16« | | 500,000 | | 462,500 | | | | | | 500,000 | | 462,500 |
Hertz Corporation 10.50%, Due 01/01/16« | | | | | | 805,000 | | 833,175 | | 805,000 | | 833,175 |
Hertz Corporation 8.88%, Due 01/01/14 | | | | | | 1,315,000 | | 1,315,000 | | 1,315,000 | | 1,315,000 |
Total Rental Auto/Equipment | | | | 462,500 | | | | 4,630,238 | | | | 5,092,738 |
Rubber & Miscellaneous Plastics Products - 0.45% | | | | | | | | | | | | |
The Goodyear Tire & Rubber Company 9.00%, Due 07/01/15« | | | | | | 1,654,000 | | 1,761,510 | | 1,654,000 | | 1,761,510 |
Total Rubber & Miscellaneous Plastics Products | | | | | | | | 1,761,510 | | | | 1,761,510 |
Security & Commodity Brokers, Dealers, Exchanges & Services - 0.45% | | | | | | | | | | | | |
Nuveen Investment Incorporated 10.50%, Due 11/15/15«†† | | 510,000 | | 503,625 | | 1,270,000 | | 1,254,125 | | 1,780,000 | | 1,757,750 |
Total Security & Commodity Brokers, Dealers, Exchanges & Services | | | | 503,625 | | | | 1,254,125 | | | | 1,757,750 |
Stone, Clay, Glass & Concrete Products - 1.17% | | | | | | | | | | | | |
Crown Cork & Seal Company Incorporated 8.00%, Due 04/15/23« | | 400,000 | | 370,000 | | | | | | 400,000 | | 370,000 |
Owens-Brockway Glass Container Incorporated 8.25%, Due 05/15/13 | | 525,000 | | 543,375 | | | | | | 525,000 | | 543,375 |
Owens-Illinois Incorporated 7.80%, Due 05/15/18 | | | | | | 3,680,000 | | 3,661,600 | | 3,680,000 | | 3,661,600 |
Total Stone, Clay, Glass & Concrete Products | | | | 913,375 | | | | 3,661,600 | | | | 4,574,975 |
Textile Mill Products - 1.10% | | | | | | | | | | | | |
Interface Incorporated 9.50%, Due 02/01/14 | | | | | | 2,190,000 | | 2,277,600 | | 2,190,000 | | 2,277,600 |
Perry Ellis International Incorporated Series B 8.88%, Due 09/15/13 | | | | | | 2,095,000 | | 2,032,150 | | 2,095,000 | | 2,032,150 |
Total Textile Mill Products | | | | | | | | 4,309,750 | | | | 4,309,750 |
| | |
| Proforma Portfolio of Investments - November 30, 2007 (Unaudited) | | Wells Fargo Advantage Funds |
| | | | | | | | | | | | |
| | | High Yield Bond Fund | | High Income Fund | | Pro Forma Combined |
| | | Shares or
Principal
Amount | | Value
(Note 2) | | Shares or
Principal
Amount | | Value
(Note 2) | | Shares or
Principal
Amount | | Value
(Note 2) |
Transportation By Air - 0.04% | | | | | | | | | | | | |
Continental Airlines Incorporated Series 00-1 8.50%, Due 05/01/11 | | 150,650 | | 149,144 | | | | | | 150,650 | | 149,144 |
Total Transportation By Air | | | | 149,144 | | | | | | | | 149,144 |
Transportation Equipment - 1.99% | | | | | | | | | | | | |
Altra Industrial Motion Incorporated 9.00%, Due 12/01/11 | | 185,000 | | 185,925 | | | | | | 185,000 | | 185,925 |
Altra Industrial Motion Incorporated 9.00%, Due 12/01/11 | | 40,000 | | 40,200 | | | | | | 40,000 | | 40,200 |
Ford Motor Company 7.45%, Due 07/16/31 | | 275,000 | | 207,625 | | | | | | 275,000 | | 207,625 |
General Motors Corporation 8.38%, Due 07/15/33« | | 960,000 | | 796,800 | | 4,225,000 | | 3,506,750 | | 5,185,000 | | 4,303,550 |
Lear Corporation Series B 8.75%, Due 12/01/16 | | | | | | 1,690,000 | | 1,554,800 | | 1,690,000 | | 1,554,800 |
TransDigm Incorporated 7.75%, Due 07/15/14 | | 125,000 | | 126,250 | | | | | | 125,000 | | 126,250 |
Visteon Corporation 7.00%, Due 03/10/14« | | | | | | 1,740,000 | | 1,344,137 | | 1,740,000 | | 1,344,137 |
Total Transportation Equipment | | | | 1,356,800 | | | | 6,405,687 | | | | 7,762,487 |
Transportation Services - 0.02% | | | | | | | | | | | | |
Sabre Holdings Corporation 8.35%, Due 03/15/16 | | 75,000 | | 65,625 | | | | | | 75,000 | | 65,625 |
Total Transportation Services | | | | 65,625 | | | | | | | | 65,625 |
Water Transportation - 0.21% | | | | | | | | | | | | |
Gulfmark Offshore Incorporated 7.75%, Due 07/15/14 | | 450,000 | | 454,500 | | | | | | 450,000 | | 454,500 |
Overseas Shipholding Group 7.50%, Due 02/15/24 | | 385,000 | | 373,931 | | | | | | 385,000 | | 373,931 |
Total Water Transportation | | | | 828,431 | | | | | | | | 828,431 |
| | | | | | | | | | | | |
Total Corporate Bonds & Notes (Cost $68,203,996, $270,684,827 and $338,888,823, respectively) | | | | 66,380,699 | | | | 263,005,267 | | | | 329,385,966 |
| | | | | | | | | | | | |
Foreign Corporate Bonds - 4.56% | | | | | | | | | | | | |
Abitibi Consolidated Incorporated 5.25%, Due 06/20/08 | | 75,000 | | 73,125 | | | | | | 75,000 | | 73,125 |
Abitibi Consolidated Incorporated 6.95%, Due 04/01/08 | | 180,000 | | 176,850 | | | | | | 180,000 | | 176,850 |
FMC Finance III SA 6.88%, Due 07/15/17†† | | | | | | 1,840,000 | | 1,803,200 | | 1,840,000 | | 1,803,200 |
Ineos Group Holdings plc 8.50%, Due 02/15/16††« | | | | | | 3,090,000 | | 2,781,000 | | 3,090,000 | | 2,781,000 |
Intelsat (Bermuda) Limited 11.25%, Due 06/15/16 | | 425,000 | | 439,875 | | 3,380,000 | | 3,498,300 | | 3,805,000 | | 3,938,175 |
Intelsat (Bermuda) Limited 8.89%, Due 01/15/15± | | | | | | 1,660,000 | | 1,662,075 | | 1,660,000 | | 1,662,075 |
Intelsat (Bermuda) Limited 9.25%, Due 06/15/16 | | | | | | 1,545,000 | | 1,573,969 | | 1,545,000 | | 1,573,969 |
Intelsat Limited 5.25%, Due 11/01/08 | | 825,000 | | 816,750 | | | | | | 825,000 | | 816,750 |
Kinder Morgan Finance Company ULC 6.40%, Due 01/05/36 | | 35,000 | | 29,079 | | | | | | 35,000 | | 29,079 |
Nordic Telephone Company Holdings 8.88%, Due 05/01/16†† | | | | | | 1,830,000 | | 1,857,450 | | 1,830,000 | | 1,857,450 |
Novelis Incorporated 7.25%, Due 02/15/15 | | | | | | 1,765,000 | | 1,645,863 | | 1,765,000 | | 1,645,863 |
NXP BV 7.88%, Due 10/15/14 | | | | | | 840,000 | | 806,400 | | 840,000 | | 806,400 |
NXP BV/NXP Funding LLC 9.50%, Due 10/15/15« | | 325,000 | | 295,750 | | | | | | 325,000 | | 295,750 |
Videotron Ltee 6.88%, Due 01/15/14 | | 365,000 | | 349,488 | | | | | | 365,000 | | 349,488 |
| | | | | | | | | | | | |
Total Foreign Bonds (Cost $2,223,487, $16,163,197 and $18,386,684, respectively) | | | | 2,180,917 | | | | 15,628,257 | | | | 17,809,174 |
| | | | | | | | | | | | |
Term Loans - 7.39% | | | | | | | | | | | | |
Allied Waste Industries Incorporated Term Loan 6.83%, Due 03/28/14 | | 156,130 | | 148,812 | | | | | | 156,130 | | 148,812 |
Allied Waste Industries Incorporated Term Loan 6.28%, Due 01/15/12 | | | | | | 1,824,435 | | 1,738,923 | | 1,824,435 | | 1,738,923 |
Allied Waste Industries Incorporated Term Loan 8.25%, Due 03/28/14 | | 93,870 | | 89,529 | | | | | | 93,870 | | 89,529 |
AZ Chemical US Incorporated 2nd Lien Term Loan 10.86%, Due 02/28/14 | | 250,000 | | 211,250 | | | | | | 250,000 | | 211,250 |
Baldor Electric Company Term Loan 6.97%, Due 01/31/14 | | 77,676 | | 75,942 | | | | | | 77,676 | | 75,942 |
Calpine Corporation Dip Term Loan B 7.48%, Due 03/29/09 | | 1,246,247 | | 1,215,611 | | | | | | 1,246,247 | | 1,215,611 |
Charter Communications Corporation 3rd Lien Term Loan 7.86%, Due 03/01/14 | | 650,000 | | 600,847 | | | | | | 650,000 | | 600,847 |
Charter Communications Operating LLC 1st Lien (Refinance) Term Loan 7.36%, Due 03/06/14± | | 175,000 | | 163,086 | | | | | | 175,000 | | 163,086 |
Covanta Energy Corporation Synthetic LOC Term Loan 5.03%, Due 02/02/14 | | 122,736 | | 117,060 | | | | | | 122,736 | | 117,060 |
Covanta Energy Corporation Term Loan B 6.88%, Due 02/02/14 | | 250,032 | | 238,468 | | | | | | 250,032 | | 238,468 |
CSC Holdings Incorporated Term Loan 6.87%, Due 03/23/13 | | 831,250 | | 787,260 | | | | | | 831,250 | | 787,260 |
Delphi Corporation Term Loan C 7.44%, Due 12/31/07 | | 825,000 | | 820,872 | | | | | | 825,000 | | 820,872 |
Domtar Corporation Term Loan 6.47%, Due 03/05/14 | | 201,563 | | 192,672 | | | | | | 201,563 | | 192,672 |
Dynegy Holdings Incorporated Synthetic LOC Term Loan 6.32%, Due 04/02/13 | | 500,000 | | 468,440 | | | | | | 500,000 | | 468,440 |
Emdeon Business Services LLC 2nd Lien Term Loan 10.20%, Due 05/16/14 | | 500,000 | | 478,750 | | | | | | 500,000 | | 478,750 |
Georgia Pacific Corporation 1st Lien Term Loan B 7.41%, Due 12/20/12 | | | | | | 1,965,000 | | 1,861,602 | | 1,965,000 | | 1,861,602 |
Georgia-Pacific Term Loan B2 7.37%, Due 12/20/12 | | 1,092,963 | | 1,036,945 | | | | | | 1,092,963 | | 1,036,945 |
HCA Incorporated Series B Term Loan 7.45%, Due 11/14/13 | | 397,000 | | 380,227 | | | | | | 397,000 | | 380,227 |
HealthSouth Corporation Senior Secured Term Loan 7.17%, Due 03/10/13 | | | | | | 843,895 | | 812,401 | | 843,895 | | 812,401 |
| | |
| Proforma Portfolio of Investments - November 30, 2007 (Unaudited) | | Wells Fargo Advantage Funds |
| | | | | | | | | | | | |
| | | High Yield Bond Fund | | High Income Fund | | Pro Forma Combined |
| | | Shares or
Principal
Amount | | Value
(Note 2) | | Shares or
Principal
Amount | | Value
(Note 2) | | Shares or
Principal
Amount | | Value
(Note 2) |
Idearc Incorporated Term Loan 7.12%, Due 11/09/14 | | 495,003 | | 472,832 | | | | | | 495,003 | | 472,832 |
JG Wentworth & Company Incorporated Term Loan B 7.61%, Due 03/29/14 | | | | | | 2,000,000 | | 1,865,000 | | 2,000,000 | | 1,865,000 |
Kepler Holdings Term Loan 10.70%, Due 06/30/09 | | 125,000 | | 123,750 | | | | | | 125,000 | | 123,750 |
Key Energy Services Term Loan 7.88%, Due 06/30/12 | | 706,169 | | 703,521 | | | | | | 706,169 | | 703,521 |
Lyondell Chemical Company Term Loan 6.84%, Due 08/16/13 | | | | | | 987,500 | | 978,297 | | 987,500 | | 978,297 |
Nielsen Finance LLC Term Loan 6.90%, Due 08/09/13 | | 174,944 | | 166,197 | | | | | | 174,944 | | 166,197 |
NRG Energy Incorporated Term Loan B1 6.95%, Due 02/01/13 | | 351,811 | | 334,002 | | | | | | 351,811 | | 334,002 |
NRG Energy Incorporated Term Loan L 6.85%, Due 02/02/11 | | 146,421 | | 139,649 | | | | | | 146,421 | | 139,649 |
Oshkosh Truck Corporation Term Loan 7.11%, Due 12/06/13 | | 148,125 | | 142,416 | | | | | | 148,125 | | 142,416 |
Pinnacle Foods Finance LLC Term Loan 8.11%, Due 04/01/14 | | | | | | 1,995,000 | | 1,880,288 | | 1,995,000 | | 1,880,288 |
Railamerica Incorporated T1 RRA Term Loan 7.81%, Due 08/14/08 | | 500,000 | | 486,250 | | | | | | 500,000 | | 486,250 |
RBS Global Incorporated & Rexnord LLC Term Loan 7.86%, Due 06/13/13 | | | | | | 934,426 | | 908,730 | | 934,426 | | 908,730 |
RBS Global Incorporated & Rexnord LLC Term Loan B 7.64%, Due 07/21/13 | | | | | | 278,524 | | 270,865 | | 278,524 | | 270,865 |
Reynolds & Reynolds Company Term Loan 7.53%, Due 10/24/12 | | 250,000 | | 240,625 | | | | | | 250,000 | | 240,625 |
Riverdeep Interactive Learning Term Loan 7.95%, Due 12/20/13 | | 496,554 | | 492,105 | | | | | | 496,554 | | 492,105 |
Sandridge Energy Incorporated Senior Secured Term Loan 8.63%, Due 04/01/15 | | 250,000 | | 248,125 | | | | | | 250,000 | | 248,125 |
SandRidge Energy Incorporated Term Loan 8.63%, Due 03/07/15 | | | | | | 2,000,000 | | 1,985,000 | | 2,000,000 | | 1,985,000 |
Seminole Tribe of FL Term Loan B-1 Delay Draw Term Loan 6.91%, Due 03/05/14 | | 68,016 | | 66,614 | | | | | | 68,016 | | 66,614 |
Seminole Tribe of FL Term Loan B-2 Delay Draw Term Loan 6.88%, Due 03/05/14 | | 229,555 | | 224,821 | | | | | | 229,555 | | 224,821 |
Seminole Tribe of FL Term Loan B-3 Delay Draw Term Loan 6.87%, Due 03/05/14 | | 227,429 | | 222,740 | | | | | | 227,429 | | 222,740 |
Sungard Add-On Term Loan B 7.36%, Due 02/28/14 | | 146,232 | | 138,920 | | | | | | 146,232 | | 138,920 |
Sungard Data Systems Term Loan B 7.36%, Due 02/11/13 | | 601,732 | | 579,546 | | | | | | 601,732 | | 579,546 |
The Goodyear Tire & Rubber Company 2nd Lien Term Loan 6.85%, Due 04/30/14 | | 450,000 | | 420,750 | | | | | | 450,000 | | 420,750 |
Thomson Learning Incorporated Term Loan 8.10%, Due 06/29/14 | | | | | | 2,500,000 | | 2,360,150 | | 2,500,000 | | 2,360,150 |
Toys R Us Term Loan 8.13%, Due 12/01/08 | | 790,000 | | 763,338 | | | | | | 790,000 | | 763,338 |
United Surgical Partners International Incorporated Delay Draw Term Loan 4.67%, Due 04/19/14 | | 24,194 | | 22,863 | | | | | | 24,194 | | 22,863 |
United Surgical Partners International Incorporated Term Loan B 7.38%, Due 04/19/14 | | 125,177 | | 118,293 | | | | | | 125,177 | | 118,293 |
Waste Services Incorporated Tranche B Term Loan 7.38%, Due 04/30/11 | | 667,016 | | 647,005 | | | | | | 667,016 | | 647,005 |
Western Refining Incorporated Term Loan B 6.57%, Due 03/07/14 | | 463,125 | | 444,600 | | | | | | 463,125 | | 444,600 |
| | | | | | | | | | | | |
Total Term Loans (Cost $14,761,653, $15,336,074 and $30,097,727, respectively) | | | | 14,224,733 | | | | 14,661,256 | | | | 28,885,989 |
| | | | | | | | | | | | |
| | | | | | |
Preferred Stocks - 0.00% | | | | | | | | | | | | |
Ion Media Networks Incorporated 0.00%, Due - - | | 1 | | 1,405 | | | | | | 1 | | 1,405 |
| | | | | | | | | | | | |
Total Preferred Stocks (Cost $1,688, $0 and $1,688, respectively) | | | | 1,405 | | | | | | | | 1,405 |
| | | | | | | | | | | | |
| | | | | | |
Collateral for Securities Lending - 11.77% | | | | | | | | | | | | |
Collateral Invested in Money Market Funds - 0.01% | | | | | | | | | | | | |
Premium Asset Trust 4.71%, Due 09/16/08± | | 52,490 | | 52,490 | | | | | | 52,490 | | 52,490 |
Total Collateral Invested in Money Market Funds | | | | 52,490 | | | | | | | | 52,490 |
Collateral Invested in Other Assets - 11.76% | | | | | | | | | | | | |
Amstel Funding Corporation 4.82%, Due 12/04/07 | | 29,394 | | 29,390 | | 130,586 | | 130,569 | | 159,980 | | 159,959 |
Atomium Funding LLC 5.10%, Due 12/04/07†† | | 23,096 | | 23,093 | | 102,603 | | 102,590 | | 125,699 | | 125,683 |
Banco Santander Totta Loan 4.67%, Due 10/15/08±†† | | 52,490 | | 52,384 | | 233,189 | | 232,720 | | 285,679 | | 285,104 |
Bank of Ireland 4.86%, Due 10/14/08±†† | | 52,490 | | 52,389 | | 233,189 | | 232,741 | | 285,679 | | 285,130 |
Barclays Repurchase Agreement - 102% Collateralized (Maturity Value $191,770) 4.84%, Due 12/03/07 | | 191,693 | | 191,693 | | | | | | 191,693 | | 191,693 |
Barclays Repurchase Agreement - 102% Collateralized (Maturity Value $851,948) 4.84%, Due 12/03/07 | | | | | | 851,605 | | 851,605 | | 851,605 | | 851,605 |
Barton Capital Corporation 5.06%, Due 12/12/07†† | | 41,992 | | 41,942 | | 186,551 | | 186,331 | | 228,543 | | 228,273 |
Bear Stearns & Company Incorporated International Repurchase Agreement - 102% Collateralized (Maturity Value $105,021) 4.74%, Due 12/03/07 | | 104,980 | | 104,980 | | | | | | 104,980 | | 104,980 |
Bear Stearns & Company Incorporated International Repurchase Agreement - 102% Collateralized (Maturity Value $466,561) 4.74%, Due 12/03/07 | | | | | | 466,377 | | 466,377 | | 466,377 | | 466,377 |
| | |
| Proforma Portfolio of Investments - November 30, 2007 (Unaudited) | | Wells Fargo Advantage Funds |
| | | | | | | | | | | | |
| | | High Yield Bond Fund | | High Income Fund | | Pro Forma Combined |
| | | Shares or
Principal
Amount | | Value
(Note 2) | | Shares or
Principal
Amount | | Value
(Note 2) | | Shares or
Principal
Amount | | Value
(Note 2) |
Bear Stearns & Company Incorporated Repurchase Agreement - 102% Collateralized (Maturity Value $454,323) 4.79%, Due 12/03/07 | | 454,142 | | 454,142 | | | | | | 454,142 | | 454,142 |
Bear Stearns & Company Incorporated Repurchase Agreement - 102% Collateralized (Maturity Value $2,018,353) 4.79%, Due 12/03/07 | | | | | | 2,017,548 | | 2,017,548 | | 2,017,548 | | 2,017,548 |
BNP Paribas 4.85%, Due 11/07/08± | | 41,992 | | 41,992 | | 186,551 | | 186,551 | | 228,543 | | 228,543 |
Bryant Park Funding LLC 5.01%, Due 12/31/07 | | 94,482 | | 94,127 | | 419,739 | | 418,165 | | 514,221 | | 512,292 |
Bryant Park Funding LLC 5.06%, Due 12/13/07 | | 56,011 | | 55,937 | | 248,831 | | 248,502 | | 304,842 | | 304,439 |
Chariot Funding LLC 4.70%, Due 12/05/07†† | | 16,797 | | 16,792 | | 74,620 | | 74,601 | | 91,417 | | 91,393 |
Chariot Funding LLC 5.02%, Due 12/28/07 | | 114,270 | | 113,887 | | 507,652 | | 505,951 | | 621,922 | | 619,838 |
Cheyne Finance LLC 4.61%, Due 02/25/08±†† | | 136,473 | | 122,826 | | 606,290 | | 545,661 | | 742,763 | | 668,487 |
Cheyne Finance LLC 4.67%, Due 05/19/08±†† | | 104,980 | | 94,482 | | 466,377 | | 419,739 | | 571,357 | | 514,221 |
CIT Group Incorporated 5.67%, Due 12/19/07± | | 20,996 | | 20,959 | | 93,275 | | 93,109 | | 114,271 | | 114,068 |
Citigroup Repurchase Agreement - 102% Collateralized (Maturity Value $622,490) 4.77%, Due 12/03/07 | | 622,243 | | 622,243 | | | | | | 622,243 | | 622,243 |
Citigroup Repurchase Agreement - 102% Collateralized (Maturity Value $2,765,443) 4.77%, Due 12/03/07 | | | | | | 2,764,344 | | 2,764,344 | | 2,764,344 | | 2,764,344 |
Clipper Receivables Corporation 4.75%, Due 12/03/07 | | 125,976 | | 125,976 | | 559,653 | | 559,653 | | 685,629 | | 685,629 |
Clipper Receivables Corporation 5.13%, Due 12/14/07†† | | 113,378 | | 113,214 | | 503,687 | | 502,957 | | 617,065 | | 616,171 |
Comerica Bank 4.67%, Due 02/08/08± | | 10,498 | | 10,477 | | 46,638 | | 46,547 | | 57,136 | | 57,024 |
CRC Funding LLC 4.90%, Due 12/05/07†† | | 159,569 | | 159,527 | | 708,893 | | 708,709 | | 868,462 | | 868,236 |
Credit Suisse First Boston Repurchase Agreement - 102% Collateralized (Maturity Value $525,108) 4.79%, Due 12/03/07 | | 524,898 | | 524,898 | | | | | | 524,898 | | 524,898 |
Credit Suisse First Boston Repurchase Agreement - 102% Collateralized (Maturity Value $2,332,817) 4.79%, Due 12/03/07 | | | | | | 2,331,886 | | 2,331,886 | | 2,331,886 | | 2,331,886 |
Cullinan Finance Corporation 4.57%, Due 02/12/08±†† | | 52,490 | | 52,370 | | 233,189 | | 232,657 | | 285,679 | | 285,027 |
Cullinan Finance Corporation 4.76%, Due 08/04/08±†† | | 157,469 | | 156,432 | | 699,566 | | 694,956 | | 857,035 | | 851,388 |
Cullinan Finance Corporation 4.77%, Due 02/25/08±†† | | 125,976 | | 125,976 | | 559,653 | | 559,653 | | 685,629 | | 685,629 |
Erasmus Capital Corporation 5.15%, Due 12/03/07†† | | 35,693 | | 35,693 | | 158,568 | | 158,568 | | 194,261 | | 194,261 |
Fairway Finance Corporation 4.73%, Due 12/06/07†† | | 62,988 | | 62,963 | | 279,826 | | 279,717 | | 342,814 | | 342,680 |
Fairway Finance Corporation 5.03%, Due 12/10/07†† | | 83,984 | | 83,907 | | 373,102 | | 372,762 | | 457,086 | | 456,669 |
Falcon Asset Securitization Corporation 5.02%, Due 12/24/07 | | 157,469 | | 157,032 | | 699,566 | | 697,621 | | 857,035 | | 854,653 |
FCAR Owner Trust Series I 4.91%, Due 12/13/07 | | 14,697 | | 14,678 | | 65,293 | | 65,207 | | 79,990 | | 79,885 |
Five Finance Incorporated 5.18%, Due 07/09/08±†† | | 209,959 | | 208,265 | | 932,754 | | 925,227 | | 1,142,713 | | 1,133,492 |
Galleon Capital LLC 4.82%, Due 12/07/07 | | 50,390 | | 50,364 | | 223,861 | | 223,745 | | 274,251 | | 274,109 |
Galleon Capital LLC 4.90%, Due 12/04/07†† | | 209,959 | | 209,932 | | 932,754 | | 932,633 | | 1,142,713 | | 1,142,565 |
Goldman Sachs & Company Repurchase Agreement - 102% Collateralized (Maturity Value $2,730) 4.76%, Due 12/03/07 | | 2,729 | | 2,729 | | | | | | 2,729 | | 2,729 |
Goldman Sachs & Company Repurchase Agreement - 102% Collateralized (Maturity Value $12,131) 4.76%, Due 12/03/07 | | | | | | 12,126 | | 12,126 | | 12,126 | | 12,126 |
Greenwich Capital Holdings Repurchase Agreement - 102% Collateralized (Maturity Value $2,730) 4.76%, Due 12/03/07 | | 2,729 | | 2,729 | | | | | | 2,729 | | 2,729 |
Greenwich Capital Holdings Repurchase Agreement - 102% Collateralized (Maturity Value $12,131) 4.76%, Due 12/03/07 | | | | | | 12,126 | | 12,126 | | 12,126 | | 12,126 |
Harrier Finance Funding LLC 4.81%, Due 04/25/08± | | 20,996 | | 20,996 | | 93,275 | | 93,275 | | 114,271 | | 114,271 |
Harrier Finance Funding LLC 5.20%, Due 01/11/08±†† | | 52,490 | | 52,421 | | 233,189 | | 232,881 | | 285,679 | | 285,302 |
Hudson-Thames LLC 5.67%, Due 06/16/08±†† | | 104,980 | | 104,304 | | 466,377 | | 463,374 | | 571,357 | | 567,678 |
ING (USA) Annuity & Life Insurance Company 4.73%, Due 08/16/08± | | 136,473 | | 136,473 | | 606,290 | | 606,290 | | 742,763 | | 742,763 |
Intesa Bank (Ireland) plc Series BKNT 4.80%, Due 10/24/08±†† | | 52,490 | | 52,395 | | 233,189 | | 232,767 | | 285,679 | | 285,162 |
JPMorgan Chase Securities Corporation Repurchase Agreement - 102% Collateralized (Maturity Value $1,115,958) 4.79%, Due 12/03/07 | | 1,115,513 | | 1,115,513 | | | | | | 1,115,513 | | 1,115,513 |
JPMorgan Chase Securities Corporation Repurchase Agreement - 102% Collateralized (Maturity Value $4,957,702) 4.79%, Due 12/03/07 | | | | | | 4,955,724 | | 4,955,724 | | 4,955,724 | | 4,955,724 |
Kestrel Funding US LLC 4.76%, Due 02/25/08±†† | | 120,727 | | 120,637 | | 536,334 | | 535,937 | | 657,061 | | 656,574 |
Kestrel Funding US LLC 4.81%, Due 04/25/08± | | 20,996 | | 20,996 | | 93,275 | | 93,275 | | 114,271 | | 114,271 |
Kitty Hawk Funding Corporation 4.74%, Due 12/06/07 | | 107,342 | | 107,300 | | 476,871 | | 476,685 | | 584,213 | | 583,985 |
Liberty Street Funding Corporation 5.20%, Due 12/03/07†† | | 22,184 | | 22,184 | | 98,555 | | 98,555 | | 120,739 | | 120,739 |
Links Finance LLC 4.76%, Due 08/15/08±†† | | 104,980 | | 104,041 | | 466,377 | | 462,208 | | 571,357 | | 566,249 |
Liquid Funding Limited 5.70%, Due 06/11/08±†† | | 155,370 | | 155,390 | | 690,238 | | 690,328 | | 845,608 | | 845,718 |
Merrill Lynch & Company Incorporated Repurchase Agreement - 102% Collateralized (Maturity Value $6,916) 4.75%, Due 12/03/07 | | 6,913 | | 6,913 | | 30,711 | | 30,711 | | 37,624 | | 37,624 |
Morgan Stanley Repurchase Agreement - 102% Collateralized (Maturity Value $42,009) 4.77%, Due 12/03/07 | | 41,992 | | 41,992 | | | | | | 41,992 | | 41,992 |
Morgan Stanley Repurchase Agreement - 102% Collateralized (Maturity Value $2,327,105) 4.77%, Due 12/03/07 | | | | | | 2,326,180 | | 2,326,180 | | 2,326,180 | | 2,326,180 |
Morgan Stanley Repurchase Agreement - 102% Collateralized (Maturity Value $481,813) 4.77%, Due 12/03/07 | | 481,622 | | 481,622 | | | | | | 481,622 | | 481,622 |
Morgan Stanley Series EXL 4.78%, Due 10/15/08± | | 9,711 | | 9,711 | | 43,140 | | 43,140 | | 52,851 | | 52,851 |
| | |
| Proforma Portfolio of Investments - November 30, 2007 (Unaudited) | | Wells Fargo Advantage Funds |
| | | | | | | | | | | | | | | | | | |
| | | High Yield Bond Fund | | | High Income Fund | | | Pro Forma Combined | |
| | | Shares or
Principal
Amount | | Value
(Note 2) | | | Shares or
Principal
Amount | | Value
(Note 2) | | | Shares or
Principal
Amount | | Value
(Note 2) | |
Newport Funding Corporation 4.72%, Due 12/03/07†† | | 33,593 | | | 33,593 | | | 149,241 | | | 149,241 | | | 182,834 | | | 182,834 | |
Northern Rock plc 4.71%, Due 10/03/08±†† | | 104,980 | | | 103,868 | | | 466,377 | | | 461,438 | | | 571,357 | | | 565,306 | |
Premium Asset Trust 4.71%, Due 09/16/08± | | | | | | | | 233,189 | | | 233,189 | | | 233,189 | | | 233,189 | |
Premium Asset Trust 5.33%, Due 12/21/07±†† | | 59,838 | | | 59,826 | | | 265,835 | | | 265,782 | | | 325,673 | | | 325,608 | |
Racers Trust Series 2004-6-MM 4.93%, Due 03/22/08±†† | | 8,493 | | | 8,493 | | | 37,730 | | | 37,730 | | | 46,223 | | | 46,223 | |
Ranger Funding Corporation 4.86%, Due 12/17/07†† | | 83,984 | | | 83,829 | | | 373,102 | | | 372,415 | | | 457,086 | | | 456,244 | |
Sedna Finance Incorporated 4.63%, Due 04/10/08±†† | | 75,585 | | | 75,281 | | | 335,792 | | | 334,438 | | | 411,377 | | | 409,719 | |
ShipRock Finance Series 2007-4A 4.72%, Due 04/11/08±†† | | 53,540 | | | 53,540 | | | 237,852 | | | 237,852 | | | 291,392 | | | 291,392 | |
Skandinaviska Enskilda Banken AB (New York) 4.67%, Due 02/04/08± | | 52,490 | | | 52,405 | | | 233,189 | | | 232,811 | | | 285,679 | | | 285,216 | |
Skandinaviska Enskilda Banken AB (New York) 4.79%, Due 02/29/08± | | 40,942 | | | 40,917 | | | 181,887 | | | 181,777 | | | 222,829 | | | 222,694 | |
SLM Corporation 4.66%, Due 05/12/08±†† | | 41,992 | | | 41,676 | | | 186,551 | | | 185,148 | | | 228,543 | | | 226,824 | |
Solitaire Funding LLC 4.99%, Due 12/26/07 | | 94,482 | | | 94,191 | | | 419,739 | | | 418,447 | | | 514,221 | | | 512,638 | |
Solitaire Funding LLC 4.99%, Due 12/31/07 | | 104,980 | | | 104,586 | | | 466,377 | | | 464,628 | | | 571,357 | | | 569,214 | |
Stanfield Victoria Funding LLC 4.88%, Due 02/15/08±†† | | 104,980 | | | 104,175 | | | 466,377 | | | 462,805 | | | 571,357 | | | 566,980 | |
Stanfield Victoria Funding LLC 5.23%, Due 04/03/08±†† | | 65,087 | | | 64,311 | | | 289,154 | | | 285,704 | | | 354,241 | | | 350,015 | |
The Travelers Insurance Company 4.74%, Due 02/08/08± | | 12,138 | | | 12,137 | | | 53,923 | | | 53,921 | | | 66,061 | | | 66,058 | |
Thunder Bay Funding Incorporated 4.77%, Due 12/03/07 | | 167,967 | | | 167,967 | | | 746,204 | | | 746,204 | | | 914,171 | | | 914,171 | |
UniCredito Italiano Bank (Ireland) 4.67%, Due 10/14/08± | | 52,490 | | | 52,412 | | | 233,189 | | | 232,843 | | | 285,679 | | | 285,255 | |
UniCredito Italiano Bank (Ireland) Series LIB 4.69%, Due 10/08/08±†† | | 52,490 | | | 52,428 | | | 233,189 | | | 232,916 | | | 285,679 | | | 285,344 | |
Versailles CDS LLC 4.97%, Due 12/05/07 | | 104,980 | | | 104,952 | | | 466,377 | | | 466,256 | | | 571,357 | | | 571,208 | |
Versailles CDS LLC 5.11%, Due 12/11/07 | | 62,988 | | | 62,922 | | | 279,826 | | | 279,532 | | | 342,814 | | | 342,454 | |
Victoria Finance LLC 4.76%, Due 07/28/08±†† | | 90,282 | | | 88,210 | | | 401,084 | | | 391,875 | | | 491,366 | | | 480,085 | |
Victoria Finance LLC 4.78%, Due 08/07/08±†† | | 52,490 | | | 52,490 | | | 233,189 | | | 233,189 | | | 285,679 | | | 285,679 | |
White Pine Finance LLC 4.98%, Due 02/22/08±†† | | 104,980 | | | 104,666 | | | 466,377 | | | 464,990 | | | 571,357 | | | 569,656 | |
Total Collateral Invested in Other Assets | | | | | 8,402,183 | | | | | | 37,560,315 | | | | | | 45,962,498 | |
| | | | | | | | | | | | | | | | | | |
| | | | | | |
Total Collateral for Securities Lending (Cost $8,478,821, $37,667,584 and $46,146,405, respectively) | | | | | 8,454,673 | | | | | | 37,560,315 | | | | | | 46,014,988 | |
| | | | | | | | | | | | | | | | | | |
| | | | | | |
Short-Term Investments - 2.42% | | | | | | | | | | | | | | | | | | |
Mutual Funds | | | | | | | | | | | | | | | | | | |
Wells Fargo Advantage Money Market Trust~‡ | | 182,059 | | | 182,059 | | | 9,273,014 | | | 9,273,014 | | | 9,455,073 | | | 9,455,073 | |
| | | | | | | | | | | | | | | | | | |
Total Short-Term Investments (Cost $182,059, $9,273,014 and $9,455,073, respectively) | | | | | 182,059 | | | | | | 9,273,014 | | | | | | 9,455,073 | |
| | | | | | | | | | | | | | | | | | |
| | | | | | |
Total Investments in Securities (Cost $94,351,696, $349,124,696 and $443,476,392, respectively) - 110.56%* | | | | | 91,930,181 | | | | | | 340,128,109 | | | | | | 432,058,290 | |
Other Asset and Liabilities, Net - (10.56%) | | | | | (5,557,729 | ) | | | | | (35,713,049 | ) | | | | | (41,270,778 | ) |
| | | | | | | | | | | | | | | | | | |
Net Assets - 100% | | | | $ | 86,372,452 | | | | | $ | 304,415,060 | | | | | $ | 390,787,512 | |
| | | | | | | | | | | | | | | | | | |
| « | All or a portion of this security is on loan. (See Note 2) |
| ± | Variable rate investments. |
| †† | Securities that may be resold to “qualified institutional buyers” under rule 144A or securities offered pursuant to section 4(2) of the Securities Act of 1933, as amended. |
| ^ | Zero coupon bond. Interest rate presented is yield to maturity. |
| § | These securities are subject to a demand feature which reduces the effective maturity. |
| ~ | This Wells Fargo Advantage Fund invests cash balances that it retains for liquidity purposes in a Wells Fargo Advantage Money Market Fund. The Fund does not pay an investment advisory fee for such investments. |
| ‡ | Security of an affiliate of the Fund with a cost of $9,455,073. |
| * | Cost for federal income tax purposes is substantially the same as for financial reporting purposes. |
| ¥ | Payment-in-kind (PIK) securities are securities in which the issuer may make interest or dividend payments in cash or additional securities. These additional securities generally have the same terms as the original holdings. |
| ^^ | This security is currently in default with regards to scheduled interest and/or principal payments. |
| (a) | Security fair valued in accordance with the procedures approved by the Board of Trustees. |
The accompanying notes are an integral part of these proforma financial statements.
| | |
| Proforma Statement of Assets and Liabilities - November 30, 2007 (Unaudited) | | Wells Fargo Advantage Funds |
| | | | | | | | | | | | | | | | |
| | | High Yield
Bond Fund | | | High Income
Fund | | | Proforma
Adjustments | | | Proforma
Combined | |
Assets | | | | | | | | | | | | | | | | |
Investments | | | | | | | | | | | | | | | | |
In securities, at market value | | $ | 83,293,449 | | | $ | 293,294,780 | | | | | | | $ | 376,588,229 | |
Collateral for securities loaned | | | 8,454,673 | | | | 37,560,315 | | | | | | | | 46,014,988 | |
Investments in affiliates | | | 182,059 | | | | 9,273,014 | | | | | | | | 9,455,073 | |
| | | | | | | | | | | | | | | | |
Total investments at market value (see cost below) | | | 91,930,181 | | | | 340,128,109 | | | | — | | | | 432,058,290 | |
| | | | | | | | | | | | | | | | |
Cash | | | 50,000 | | | | — | | | | | | | | 50,000 | |
Receivable for Fund shares issued | | | 40,000 | | | | 103,476 | | | | | | | | 143,476 | |
Receivable for investments sold | | | 2,487,480 | | | | 211,050 | | | | | | | | 2,698,530 | |
Receivables for dividends and interest | | | 1,620,059 | | | | 6,595,377 | | | | | | | | 8,215,436 | |
Receivable for interest rate swaps/spread locks | | | 21,323 | | | | — | | | | | | | | 21,323 | |
| | | | | | | | | | | | | | | | |
Total assets | | | 96,149,043 | | | | 347,038,012 | | | | — | | | | 443,187,055 | |
| | | | | | | | | | | | | | | | |
| | | | |
Liabilities | | | | | | | | | | | | | | | | |
Payable for Fund shares redeemed | | | 165,846 | | | | 56,418 | | | | | | | | 222,264 | |
Payable for investments purchased | | | 489,793 | | | | 2,725,225 | | | | | | | | 3,215,018 | |
Dividends payable | | | 524,223 | | | | 1,914,602 | | | | | | | | 2,438,825 | |
Payable to investment advisor and affiliates | | | 75,274 | | | | 124,808 | | | | | | | | 200,082 | |
Payable for securities loaned | | | 8,478,818 | | | | 37,667,582 | | | | | | | | 46,146,400 | |
Accrued expenses and other liabilities | | | 42,637 | | | | 134,317 | | | | | | | | 176,954 | |
| | | | | | | | | | | | | | | | |
Total liabilities | | | 9,776,591 | | | | 42,622,952 | | | | — | | | | 52,399,543 | |
| | | | | | | | | | | | | | | | |
Total net assets | | $ | 86,372,452 | | | $ | 304,415,060 | | | $ | — | | | $ | 390,787,512 | |
| | | | | | | | | | | | | | | | |
| | | | |
NET ASSETS CONSIST OF | | | | | | | | | | | | | | | | |
Paid-in capital | | $ | 90,029,271 | | | $ | 716,501,491 | | | | | | | $ | 806,530,762 | |
Undistributed net investment income (loss) | | | 95,937 | | | | (522 | ) | | | | | | | 95,415 | |
Undistributed net realized gain (loss) on investments | | | (1,352,564 | ) | | | (403,089,322 | ) | | | | | | | (404,441,886 | ) |
Net unrealized appreciation (depreciation) of investments, foreign currencies and translation of assets and liabilities denominated in foreign currencies | | | (2,421,515 | ) | | | (8,996,587 | ) | | | | | | | (11,418,102 | ) |
Net unrealized appreciation (depreciation) of options, swap agreements, and short sales | | | 21,323 | | | | — | | | | | | | | 21,323 | |
| | | | | | | | | | | | | | | | |
Total net assets | | $ | 86,372,452 | | | $ | 304,415,060 | | | $ | — | | | $ | 390,787,512 | |
| | | | | | | | | | | | | | | | |
| | | | |
COMPUTATION OF NET ASSET VALUE AND OFFERING PRICE PER SHARE1 | | | | | | | | | | | | | | | | |
Net assets – Class A | | $ | 62,406,196 | | | | NA | | | $ | 107,572,583 | 3 | | $ | 169,978,779 | |
Shares outstanding – Class A | | | 6,237,853 | | | | NA | | | | 16,486,583 | | | | 22,724,436 | |
Net asset value per share – Class A | | $ | 10.00 | | | | NA | | | | | | | $ | 7.48 | |
Maximum offering price per share – Class A2 | | $ | 10.47 | | | | NA | | | | | | | $ | 7.83 | |
Net assets – Class B | | $ | 14,123,161 | | | | NA | | | | | | | $ | 14,123,161 | |
Shares outstanding – Class B | | | 1,411,779 | | | | NA | | | | 476,344 | 4 | | | 1,888,123 | |
Net asset value and offering price per share – Class B | | $ | 10.00 | | | | NA | | | | | | | $ | 7.48 | |
Net assets – Class C | | $ | 9,843,095 | | | | NA | | | | | | | $ | 9,843,095 | |
Shares outstanding – Class C | | | 983,274 | | | | NA | | | | 332,648 | 5 | | | 1,315,922 | |
Net asset value and offering price per share – Class C | | $ | 10.01 | | | | NA | | | | | | | $ | 7.48 | |
Net assets – Advisor Class | | | NA | | | $ | 107,572,583 | | | $ | (107,572,583 | )3 | | $ | — | |
Shares outstanding – Advisor Class | | | NA | | | | 14,384,845 | | | | (14,384,845 | ) | | | — | |
Net asset value and offering price per share – Advisor Class | | | NA | | | $ | 7.48 | | | | | | | $ | — | |
Net assets – Institutional Class | | | NA | | | $ | 255,252 | | | | | | | $ | 255,252 | |
Shares outstanding – Institutional Class | | | NA | | | | 33,851 | | | | | | | | 33,851 | |
Net asset value and offering price per share – Institutional Class | | | NA | | | $ | 7.54 | | | | | | | $ | 7.54 | |
Net assets – Investor Class | | | NA | | | $ | 196,587,225 | | | | | | | $ | 196,587,225 | |
Shares outstanding – Investor Class | | | NA | | | | 26,191,075 | | | | | | | | 26,191,075 | |
Net asset value and offering price per share – Investor Class | | | NA | | | $ | 7.51 | | | | | | | $ | 7.51 | |
| | | | | | | | | | | | | | | | |
| | | | |
Investments at cost | | $ | 94,351,696 | | | $ | 349,124,696 | | | $ | — | | | $ | 443,476,392 | |
| | | | | | | | | | | | | | | | |
Securities on loan, at market value | | $ | 8,298,971 | | | $ | 36,989,193 | | | $ | — | | | $ | 45,288,164 | |
| | | | | | | | | | | | | | | | |
1 | Each Fund has an unlimited number of authorized shares. |
2 | Maximum offering price is computed as 100/95.50 of net asset value. On investment of $50,000 or more, the offering price is reduced. |
3 | Advisor Class shares of High Income Fund are exchanged for new A shares of High Income Fund, to be established prior to the merger, in an amount equal to the total value of the High Income Fund Advisor shares divided by the current per share value of the new A shares (presumed to equal the High Income Fund Advisor share value in this proforma). Class A shares of High Yield Bond Fund are exchanged for new A shares of High Income Fund in an amount equal to the total value of the High Yield Bond Fund A shares divided by the current per share value of the High Income Fund A shares. |
4 | Class B shares of High Yield Bond Fund are exchanged for new B shares of High Income Fund, to be established upon consummation of the merger, in an amount equal to the total value of the High Yield Bond Fund B shares divided by current per share value of the new High Income Fund B shares (presumed to equal the High Income Fund new A share value in this proforma). |
5 | Class C shares of High Yield Bond Fund are exchanged for new C shares of High Income Fund, to be established upon consummation of the merger, in an amount equal to the total value of the High Yield Bond Fund C shares divided by current per share value of the new High Income Fund C shares (presumed to equal the High Income Fund new A share value in this proforma). |
The accompanying notes are an integral part of these proforma financial statements.
| | |
| Proforma Statement of Operations - For the Twelve Months Ended November 30, 2007 (Unaudited) | | Wells Fargo Advantage Funds |
| | | | | | | | | | | | | | | | |
| | | High Yield
Bond Fund | | | High Income
Fund | | | Proforma
Adjustments | | | Proforma
Combined | |
Investment Income | | | | | | | | | | | | | | | | |
Interest | | $ | 8,084,470 | | | $ | 25,689,168 | | | | | | | $ | 33,773,638 | |
Income from affiliated securities | | | 121,968 | | | | 577,326 | | | | | | | | 699,294 | |
Securities lending income, net | | | 26,593 | | | | 103,940 | | | | | | | | 130,533 | |
| | | | | | | | | | | | | | | | |
Total investment income | | | 8,233,031 | | | | 26,370,434 | | | | — | | | | 34,603,465 | |
| | | | | | | | | | | | | | | | |
| | | | |
Expenses | | | | | | | | | | | | | | | | |
Advisory fees | | | 559,709 | | | | 1,841,968 | | | | | | | | 2,401,677 | |
Administration fees | | | | | | | | | | | | | | | | |
Fund Level | | | 50,882 | | | | 167,452 | | | | | | | | 218,334 | |
Class A | | | 202,857 | | | | — | | | | 328,871 | 1 | | | 531,728 | |
Class B | | | 47,733 | | | | — | | | | | | | | 47,733 | |
Class C | | | 34,352 | | | | — | | | | | | | | 34,352 | |
Advisor Class | | | — | | | | 281,118 | | | | (281,118 | )1 | | | — | |
Institutional Class | | | — | | | | 203 | | | | | | | | 203 | |
Investor Class | | | — | | | | 866,056 | | | | | | | | 866,056 | |
Custody fees | | | 20,352 | | | | 66,980 | | | | | | | | 87,332 | |
Shareholder servicing fees | | | 254,179 | | | | 835,727 | | | | | | | | 1,089,906 | |
Accounting fees | | | 24,294 | | | | 52,671 | | | | (8,285 | )1 | | | 68,680 | |
Distribution fees | | | | | | | | | | | | | | | | |
Class B | | | 127,859 | | | | — | | | | | | | | 127,859 | |
Class C | | | 92,012 | | | | — | | | | | | | | 92,012 | |
Professional fees | | | 26,473 | | | | 31,917 | | | | (16,772 | )2 | | | 41,618 | |
Registration fees | | | 35,031 | | | | 36,813 | | | | (23,842 | )2 | | | 48,002 | |
Shareholder reports | | | 22,940 | | | | 56,522 | | | | (19,866 | )2 | | | 59,596 | |
Trustees’ fees | | | 9,134 | | | | 9,134 | | | | (6,358 | )2 | | | 11,910 | |
Other fees and expenses | | | 3,268 | | | | 12,242 | | | | 453 | 2 | | | 15,963 | |
| | | | | | | | | | | | | | | | |
Total expenses | | | 1,511,075 | | | | 4,258,803 | | | | (26,917 | ) | | | 5,742,961 | |
| | | | | | | | | | | | | | | | |
| | | | |
Less | | | | | | | | | | | | | | | | |
Waived fees and reimbursed expenses | | | (120,705 | ) | | | (1,379,115 | ) | | | (195,492 | ) | | | (1,695,312 | ) |
Net expenses | | | 1,390,370 | | | | 2,879,688 | | | | (222,409 | ) | | | 4,047,649 | |
| | | | | | | | | | | | | | | | |
Net investment income (loss) | | | 6,842,661 | | | | 23,490,746 | | | | 222,409 | | | | 30,555,816 | |
| | | | | | | | | | | | | | | | |
| | | | |
REALIZED AND UNREALIZED GAIN (LOSS) ON INVESTMENTS | | | | | | | | | | | | | | | | |
| | | | |
Net realized gain (loss) from | | | | | | | | | | | | | | | | |
Securities, foreign currencies and foreign currency translation | | | 564,699 | | | | 4,212,903 | | | | | | | | 4,777,602 | |
Futures transactions | | | — | | | | (79,503 | ) | | | | | | | (79,503 | ) |
Options, swap agreements and short sale transactions | | | (7,354 | ) | | | (139,076 | ) | | | | | | | (146,430 | ) |
| | | | | | | | | | | | | | | | |
Net realized gain (loss) from Investments | | | 557,345 | | | | 3,994,324 | | | | — | | | | 4,551,669 | |
| | | | | | | | | | | | | | | | |
| | | | |
Net change in unrealized appreciation (depreciation) of | | | | | | | | | | | | | | | | |
Securities, foreign currencies and foreign currency translation | | | (3,891,799 | ) | | | (15,365,736 | ) | | | | | | | (19,257,535 | ) |
Options, swap agreements and short sale transactions | | | 21,323 | | | | — | | | | | | | | 21,323 | |
| | | | | | | | | | | | | | | | |
| | | | |
Net change in unrealized appreciation (depreciation) of investments | | | (3,870,476 | ) | | | (15,365,736 | ) | | | — | | | | (19,236,212 | ) |
| | | | | | | | | | | | | | | | |
Net realized and unrealized gain (loss) on investments | | | (3,313,131 | ) | | | (11,371,412 | ) | | | — | | | | (14,684,543 | ) |
| | | | | | | | | | | | | | | | |
Net increase (decrease) in net assets resulting from operations | | $ | 3,529,530 | | | $ | 12,119,334 | | | $ | 222,409 | | | $ | 15,871,273 | |
| | | | | | | | | | | | | | | | |
1 | Based on contractual agreements of the surviving fund. |
2 | Estimated cost increases (savings) as a result of merging the funds. |
The accompanying notes are an integral part of these proforma financial statements.
| | |
| Proforma Portfolio of Investments - November 30, 2007 (Unaudited) | | Wells Fargo Advantage Funds |
| | | | | | | | | | | | | |
| | | Intermediate Government
Income Fund | | Government Securities Fund | | Pro Forma Combined |
| | | Shares or
Principal
Amount | | Value
(Note 2) | | Shares or
Principal
Amount | | Value
(Note 2) | | Shares or
Principal
Amount | | Value
(Note 2) |
Agency Notes - Interest Bearing - 4.57% | | | | | | | | | | | | | |
Federal Farm Credit Bank 4.50%, Due 10/17/12 | | | | | | | 3,300,000 | | 3,366,063 | | 3,300,000 | | 3,366,063 |
FHLMC 5.13%, Due 08/23/10« | | | | | | | 42,015,000 | | 43,531,994 | | 42,015,000 | | 43,531,994 |
FNMA 4.75%, Due 11/19/12« | | | | | | | 29,550,000 | | 30,476,038 | | 29,550,000 | | 30,476,038 |
| | | | | | | | | | | | | |
Total Agency Notes - Interest Bearing (Cost $0, $75,470,542 and $75,470,542, respectively) | | | | | — | | | | 77,374,095 | | | | 77,374,095 |
| | | | | | | | | | | | | |
| | | | | | |
Agency Securities - 50.99% | | | | | | | | | | | | | |
Federal Home Loan Mortgage Corporation - 12.55% | | | | | | | | | | | | | |
FHLMC #160053 8.00%, Due 07/01/08 | | | | | | | 4,102 | | 4,137 | | 4,102 | | 4,137 |
FHLMC #170046 14.50%, Due 03/01/11 | | | | | | | 12 | | 14 | | 12 | | 14 |
FHLMC #170053 14.75%, Due 08/01/11 | | | | | | | 122 | | 141 | | 122 | | 141 |
FHLMC #170053 15.00%, Due 08/01/11 | | | | | | | 4,039 | | 4,700 | | 4,039 | | 4,700 |
FHLMC #170069 14.00%, Due 11/01/12 | | | | | | | 246 | | 293 | | 246 | | 293 |
FHLMC #170215 8.00%, Due 02/01/17 | | | | | | | 59,307 | | 62,745 | | 59,307 | | 62,745 |
FHLMC #170235 10.50%, Due 08/01/19 | | | | | | | 82,216 | | 96,042 | | 82,216 | | 96,042 |
FHLMC #182079 8.00%, Due 02/01/10 | | | | | | | 3,944 | | 4,060 | | 3,944 | | 4,060 |
FHLMC #182104 8.00%, Due 12/01/10 | | | | | | | 3,349 | | 3,448 | | 3,349 | | 3,448 |
FHLMC #1B0123 7.28%, Due 09/01/31± | | | | | | | 11,959 | | 12,095 | | 11,959 | | 12,095 |
FHLMC #1B0128 7.28%, Due 09/01/31± | | | | | | | 9,042 | | 9,144 | | 9,042 | | 9,144 |
FHLMC #1B0129 7.34%, Due 09/01/31± | | | | | | | 569,427 | | 576,189 | | 569,427 | | 576,189 |
FHLMC #1G1393 5.93%, Due 12/01/36± | | 9,681,492 | | $ | 9,865,446 | | | | | | 9,681,492 | | 9,865,446 |
FHLMC #1Q0183 5.98%, Due 10/01/36«± | | | | | | | 17,135,512 | | 17,421,156 | | 17,135,512 | | 17,421,156 |
FHLMC #272877 8.00%, Due 08/01/09 | | | | | | | 22,569 | | 22,763 | | 22,569 | | 22,763 |
FHLMC #279063 9.00%, Due 08/01/09 | | | | | | | 49,634 | | 50,267 | | 49,634 | | 50,267 |
FHLMC #552435 10.50%, Due 08/01/20 | | | | | | | 94,291 | | 111,332 | | 94,291 | | 111,332 |
FHLMC #555158 8.50%, Due 05/01/16 | | | | | | | 15,330 | | 15,617 | | 15,330 | | 15,617 |
FHLMC #555503 9.00%, Due 04/01/21 | | | | | | | 463,026 | | 494,479 | | 463,026 | | 494,479 |
FHLMC #555515 8.50%, Due 10/01/13 | | | | | | | 71,776 | | 71,834 | | 71,776 | | 71,834 |
FHLMC #611023 7.17%, Due 10/01/26± | | | | | | | 735,400 | | 743,637 | | 735,400 | | 743,637 |
FHLMC #786210 7.13%, Due 01/01/26± | | | | | | | 192,573 | | 193,463 | | 192,573 | | 193,463 |
FHLMC #786823 7.38%, Due 07/01/29± | | | | | | | 1,181,864 | | 1,205,040 | | 1,181,864 | | 1,205,040 |
FHLMC #789483 7.24%, Due 06/01/32± | | | | | | | 329,632 | | 332,558 | | 329,632 | | 332,558 |
FHLMC #865496 5.97%, Due 05/01/26± | | | | | | | 209,252 | | 214,745 | | 209,252 | | 214,745 |
FHLMC #884009 10.50%, Due 05/01/20 | | | | | | | 189,420 | | 223,640 | | 189,420 | | 223,640 |
FHLMC #A01434 9.00%, Due 06/01/16 | | | | | | | 42,274 | | 44,280 | | 42,274 | | 44,280 |
FHLMC #A01562 9.00%, Due 11/01/18 | | | | | | | 264,263 | | 281,289 | | 264,263 | | 281,289 |
FHLMC #A01607 8.50%, Due 06/01/11 | | | | | | | 13,905 | | 14,067 | | 13,905 | | 14,067 |
FHLMC #A01620 9.00%, Due 04/01/17 | | | | | | | 128,484 | | 136,762 | | 128,484 | | 136,762 |
FHLMC #A01860 8.50%, Due 06/01/17 | | | | | | | 69,796 | | 70,031 | | 69,796 | | 70,031 |
FHLMC #B13066 4.00%, Due 03/01/14« | | 3,478,965 | | | 3,455,125 | | | | | | 3,478,965 | | 3,455,125 |
FHLMC #B13579 5.00%, Due 04/01/19 | | 1,397,033 | | | 1,398,471 | | | | | | 1,397,033 | | 1,398,471 |
FHLMC #B13580 5.00%, Due 04/01/19 | | 1,076,236 | | | 1,077,344 | | | | | | 1,076,236 | | 1,077,344 |
FHLMC #B13654 4.00%, Due 04/01/14« | | 18,583,846 | | | 18,456,840 | | | | | | 18,583,846 | | 18,456,840 |
FHLMC #B15194 5.00%, Due 06/01/19« | | 2,489,446 | | | 2,492,009 | | | | | | 2,489,446 | | 2,492,009 |
FHLMC #B16884 5.00%, Due 10/01/19 | | 2,917,881 | | | 2,920,885 | | | | | | 2,917,881 | | 2,920,885 |
FHLMC #B17855 5.00%, Due 02/01/20« | | 6,677,641 | | | 6,673,625 | | | | | | 6,677,641 | | 6,673,625 |
FHLMC #C01345 7.00%, Due 04/01/32 | | 898,462 | | | 940,426 | | | | | | 898,462 | | 940,426 |
FHLMC #C31808 7.50%, Due 10/01/29 | | 110,818 | | | 118,535 | | | | | | 110,818 | | 118,535 |
FHLMC #C59553 7.50%, Due 11/01/31 | | 898,282 | | | 958,512 | | | | | | 898,282 | | 958,512 |
FHLMC #C65576 7.50%, Due 04/01/32 | | 1,376,370 | | | 1,465,894 | | | | | | 1,376,370 | | 1,465,894 |
FHLMC #E79794 7.00%, Due 10/01/14 | | | | | | | 1,949,140 | | 2,030,871 | | 1,949,140 | | 2,030,871 |
FHLMC #E96459 5.00%, Due 05/01/18 | | 3,184,128 | | | 3,190,582 | | | | | | 3,184,128 | | 3,190,582 |
FHLMC #G00319 9.50%, Due 04/01/25 | | | | | | | 342,009 | | 374,487 | | 342,009 | | 374,487 |
FHLMC #G00683 8.50%, Due 12/01/25 | | 75,677 | | | 81,315 | | | | | | 75,677 | | 81,315 |
FHLMC #G01236 10.00%, Due 10/01/21 | | | | | | | 352,894 | | 396,114 | | 352,894 | | 396,114 |
FHLMC #G08102 6.50%, Due 12/01/35 | | | | | | | 9,797,122 | | 10,084,991 | | 9,797,122 | | 10,084,991 |
FHLMC #G10783 8.50%, Due 06/01/12 | | | | | | | 34,291 | | 36,288 | | 34,291 | | 36,288 |
FHLMC #G11136 6.50%, Due 05/01/11 | | | | | | | 390,842 | | 397,199 | | 390,842 | | 397,199 |
FHLMC #G11200 8.00%, Due 01/01/12 | | | | | | | 272,860 | | 282,807 | | 272,860 | | 282,807 |
FHLMC #G11209 7.50%, Due 12/01/11« | | | | | | | 4,844,000 | | 4,982,164 | | 4,844,000 | | 4,982,164 |
FHLMC #G11345 7.50%, Due 12/01/11 | | | | | | | 1,484,228 | | 1,525,692 | | 1,484,228 | | 1,525,692 |
FHLMC #G11368 7.50%, Due 12/01/12 | | | | | | | 2,947,114 | | 3,039,438 | | 2,947,114 | | 3,039,438 |
FHLMC #G18005 5.00%, Due 08/01/19« | | | | | | | 12,721,304 | | 12,734,401 | | 12,721,304 | | 12,734,401 |
FHLMC #G80106 10.00%, Due 08/17/22 | | | | | | | 1,673,573 | | 1,950,663 | | 1,673,573 | | 1,950,663 |
FHLMC #G80116 10.00%, Due 02/17/25 | | | | | | | 2,710,345 | | 3,117,884 | | 2,710,345 | | 3,117,884 |
FHLMC #G80193 9.50%, Due 09/17/22 | | | | | | | 3,167,673 | | 3,436,849 | | 3,167,673 | | 3,436,849 |
FHLMC #G90023 7.00%, Due 11/17/13 | | | | | | | 469,096 | | 484,911 | | 469,096 | | 484,911 |
FHLMC #H01193 6.50%, Due 08/01/37 | | | | | | | 12,548,543 | | 12,825,022 | | 12,548,543 | | 12,825,022 |
FHLMC #H01792 6.50%, Due 10/01/37 | | | | | | | 4,000,000 | | 4,088,131 | | 4,000,000 | | 4,088,131 |
FHLMC #M90891 3.50%, Due 01/01/09 | | 9,322,619 | | | 9,149,808 | | | | | | 9,322,619 | | 9,149,808 |
FHLMC #N70012 10.50%, Due 08/01/20 | | | | | | | 57,409 | | 67,261 | | 57,409 | | 67,261 |
FHLMC Series MTN 5.00%, Due 12/14/18« | | | | | | | 25,000,000 | | 24,997,100 | | 25,000,000 | | 24,997,100 |
FHLMC TBA 6.00%, Due 12/01/37%% | | | | | | | 40,305,000 | | 40,909,575 | | 40,305,000 | | 40,909,575 |
Total Federal Home Loan Mortgage Corporation | | | | | 62,244,817 | | | | 150,181,816 | | | | 212,426,633 |
| | |
| Proforma Portfolio of Investments - November 30, 2007 (Unaudited) | | Wells Fargo Advantage Funds |
| | | | | | | | | | | | |
| | | Intermediate Government
Income Fund | | Government Securities Fund | | Pro Forma Combined |
| | | Shares or
Principal
Amount | | Value
(Note 2) | | Shares or
Principal
Amount | | Value
(Note 2) | | Shares or
Principal
Amount | | Value
(Note 2) |
Federal National Mortgage Association - 38.03% | | | | | | | | | | | | |
FNMA # 878059 5.50%, Due 03/01/36 | | | | | | 23,839,305 | | 23,883,860 | | 23,839,305 | | 23,883,860 |
FNMA # 886087 6.50%, Due 07/01/36« | | | | | | 11,703,127 | | 12,038,409 | | 11,703,127 | | 12,038,409 |
FNMA #100042 11.00%, Due 10/15/20 | | | | | | 217,084 | | 246,308 | | 217,084 | | 246,308 |
FNMA #100285 9.50%, Due 12/15/20 | | | | | | 385,742 | | 427,397 | | 385,742 | | 427,397 |
FNMA #1376 15.50%, Due 10/01/12 | | | | | | 694 | | 808 | | 694 | | 808 |
FNMA #190180 9.00%, Due 07/01/21 | | | | | | 376,121 | | 406,764 | | 376,121 | | 406,764 |
FNMA #253266 8.00%, Due 05/01/30 | | 105,206 | | 112,319 | | | | | | 105,206 | | 112,319 |
FNMA #253951 7.50%, Due 09/01/31 | | 508,553 | | 542,306 | | | | | | 508,553 | | 542,306 |
FNMA #254218 7.00%, Due 02/01/32 | | 602,144 | | 632,910 | | | | | | 602,144 | | 632,910 |
FNMA #254223 7.50%, Due 02/01/32 | | 201,044 | | 214,387 | | | | | | 201,044 | | 214,387 |
FNMA #254480 7.00%, Due 10/01/32 | | 1,381,946 | | 1,451,103 | | | | | | 1,381,946 | | 1,451,103 |
FNMA #254836 4.00%, Due 07/01/10« | | 6,682,173 | | 6,562,654 | | | | | | 6,682,173 | | 6,562,654 |
FNMA #256314 5.50%, Due 06/01/16 | | 3,685,897 | | 3,742,954 | | | | | | 3,685,897 | | 3,742,954 |
FNMA #256810 6.50%, Due 07/01/37 | | | | | | 12,387,929 | | 12,664,741 | | 12,387,929 | | 12,664,741 |
FNMA #303548 8.50%, Due 02/01/12 | | | | | | 50,214 | | 50,330 | | 50,214 | | 50,330 |
FNMA #313419 8.50%, Due 12/01/26 | | | | | | 690,149 | | 749,187 | | 690,149 | | 749,187 |
FNMA #313864 6.69%, Due 12/01/07 | | 174,980 | | 174,366 | | | | | | 174,980 | | 174,366 |
FNMA #323013 9.00%, Due 10/01/21 | | | | | | 264,374 | | 290,978 | | 264,374 | | 290,978 |
FNMA #323284 8.50%, Due 05/01/17 | | | | | | 1,134,294 | | 1,206,828 | | 1,134,294 | | 1,206,828 |
FNMA #323756 6.20%, Due 05/01/09 | | | | | | 4,929,379 | | 4,947,304 | | 4,929,379 | | 4,947,304 |
FNMA #357464 4.50%, Due 12/01/18« | | 7,804,771 | | 7,701,265 | | | | | | 7,804,771 | | 7,701,265 |
FNMA #364215 7.50%, Due 07/01/15 | | | | | | 35,286 | | 35,582 | | 35,286 | | 35,582 |
FNMA #364217 7.00%, Due 09/01/15 | | | | | | 4,256 | | 4,287 | | 4,256 | | 4,287 |
FNMA #368034 8.00%, Due 11/01/26 | | | | | | 2,927,313 | | 3,173,910 | | 2,927,313 | | 3,173,910 |
FNMA #387402 5.03%, Due 05/01/15« | | 7,116,427 | | 7,200,436 | | | | | | 7,116,427 | | 7,200,436 |
FNMA #387405 5.09%, Due 05/01/15« | | 7,550,459 | | 7,661,146 | | | | | | 7,550,459 | | 7,661,146 |
FNMA #398800 8.00%, Due 06/01/12 | | | | | | 3,548,565 | | 3,687,689 | | 3,548,565 | | 3,687,689 |
FNMA #398805 8.50%, Due 11/01/11 | | | | | | 229,489 | | 242,651 | | 229,489 | | 242,651 |
FNMA #417768 6.50%, Due 03/01/28 | | 150,141 | | 156,039 | | | | | | 150,141 | | 156,039 |
FNMA #426843 11.00%, Due 02/01/19 | | | | | | 180,398 | | 207,450 | | 180,398 | | 207,450 |
FNMA #439935 8.00%, Due 04/01/17 | | | | | | 201,925 | | 212,292 | | 201,925 | | 212,292 |
FNMA #457277 6.14%, Due 10/01/27± | | | | | | 938,784 | | 965,142 | | 938,784 | | 965,142 |
FNMA #458018 12.00%, Due 07/15/14 | | | | | | 433,514 | | 514,603 | | 433,514 | | 514,603 |
FNMA #487758 8.50%, Due 05/01/26 | | | | | | 831,905 | | 900,499 | | 831,905 | | 900,499 |
FNMA #487759 9.50%, Due 07/01/28 | | | | | | 251,142 | | 276,457 | | 251,142 | | 276,457 |
FNMA #516051 9.50%, Due 01/01/21 | | | | | | 226,645 | | 248,181 | | 226,645 | | 248,181 |
FNMA #52 8.50%, Due 07/01/10 | | | | | | 18,998 | | 19,369 | | 18,998 | | 19,369 |
FNMA #535537 9.00%, Due 07/01/28 | | | | | | 344,680 | | 373,617 | | 344,680 | | 373,617 |
FNMA #535573 8.00%, Due 11/01/13 | | | | | | 829,186 | | 848,484 | | 829,186 | | 848,484 |
FNMA #535752 10.00%, Due 12/01/20 | | | | | | 563,955 | | 656,748 | | 563,955 | | 656,748 |
FNMA #538435 7.30%, Due 07/01/26± | | | | | | 1,303,644 | | 1,325,837 | | 1,303,644 | | 1,325,837 |
FNMA #545016 9.00%, Due 11/01/12 | | | | | | 2,146 | | 2,245 | | 2,146 | | 2,245 |
FNMA #545117 7.27%, Due 12/01/40± | | | | | | 197,282 | | 200,237 | | 197,282 | | 200,237 |
FNMA #545187 5.85%, Due 09/01/31± | | | | | | 1,565,414 | | 1,598,266 | | 1,565,414 | | 1,598,266 |
FNMA #545208 7.16%, Due 09/01/31± | | | | | | 217,336 | | 221,613 | | 217,336 | | 221,613 |
FNMA #545460 7.10%, Due 11/01/31± | | | | | | 1,157,919 | | 1,197,226 | | 1,157,919 | | 1,197,226 |
FNMA #54844 5.53%, Due 09/01/27± | | | | | | 2,539,344 | | 2,570,143 | | 2,539,344 | | 2,570,143 |
FNMA #555161 6.00%, Due 12/01/13 | | | | | | 1,436,733 | | 1,473,740 | | 1,436,733 | | 1,473,740 |
FNMA #555569 6.00%, Due 05/01/16 | | | | | | 7,114,898 | | 7,284,077 | | 7,114,898 | | 7,284,077 |
FNMA #555710 4.50%, Due 08/01/18« | | 12,859,047 | | 12,688,513 | | | | | | 12,859,047 | | 12,688,513 |
FNMA #62895 8.75%, Due 01/01/10 | | | | | | 35,479 | | 36,508 | | 35,479 | | 36,508 |
FNMA #635726 7.04%, Due 04/01/32± | | | | | | 649,171 | | 660,766 | | 649,171 | | 660,766 |
FNMA #646643 7.23%, Due 06/01/32± | | | | | | 378,266 | | 385,280 | | 378,266 | | 385,280 |
FNMA #66414 6.61%, Due 09/01/28± | | | | | | 2,011,754 | | 2,031,970 | | 2,011,754 | | 2,031,970 |
FNMA #675479 7.95%, Due 01/01/33± | | | | | | 1,251,031 | | 1,273,514 | | 1,251,031 | | 1,273,514 |
FNMA #675491 8.22%, Due 04/01/33± | | | | | | 413,351 | | 419,172 | | 413,351 | | 419,172 |
FNMA #695514 8.50%, Due 10/01/26 | | | | | | 64,075 | | 68,728 | | 64,075 | | 68,728 |
FNMA #695519 8.50%, Due 11/01/26 | | | | | | 546,364 | | 587,773 | | 546,364 | | 587,773 |
FNMA #70765 9.00%, Due 03/01/21 | | 334,799 | | 362,906 | | | | | | 334,799 | | 362,906 |
FNMA #724438 8.50%, Due 06/01/27 | | | | | | 1,487,092 | | 1,599,968 | | 1,487,092 | | 1,599,968 |
FNMA #724658 8.61%, Due 07/01/33± | | | | | | 315,001 | | 318,103 | | 315,001 | | 318,103 |
FNMA #725249 5.00%, Due 03/01/34« | | | | | | 29,904,319 | | 29,376,283 | | 29,904,319 | | 29,376,283 |
FNMA #725638 5.00%, Due 12/01/18 | | | | | | 6,181,110 | | 6,197,264 | | 6,181,110 | | 6,197,264 |
FNMA #735062 5.50%, Due 08/01/33 | | | | | | 47,998,817 | | 48,200,455 | | 47,998,817 | | 48,200,455 |
FNMA #735613 6.00%, Due 02/01/35« | | | | | | 8,725,326 | | 8,910,265 | | 8,725,326 | | 8,910,265 |
FNMA #739503 5.50%, Due 09/01/33 | | | | | | 16,994,759 | | 17,066,152 | | 16,994,759 | | 17,066,152 |
FNMA #740227 5.50%, Due 09/01/33 | | | | | | 16,415,109 | | 16,484,067 | | 16,415,109 | | 16,484,067 |
FNMA #745678 5.51%, Due 05/01/36«± | | 13,265,054 | | 13,397,714 | | | | | | 13,265,054 | | 13,397,714 |
FNMA #745743 4.00%, Due 05/01/21« | | 10,251,076 | | 9,840,348 | | | | | | 10,251,076 | | 9,840,348 |
FNMA #745816 5.06%, Due 12/01/35± | | | | | | 11,376,109 | | 11,467,535 | | 11,376,109 | | 11,467,535 |
FNMA #787275 4.86%, Due 06/01/34± | | 8,068,318 | | 8,131,104 | | | | | | 8,068,318 | | 8,131,104 |
FNMA #813158 4.99%, Due 12/01/34± | | 4,751,987 | | 4,864,833 | | | | | | 4,751,987 | | 4,864,833 |
FNMA #835168 5.50%, Due 08/01/35 | | | | | | 14,150,939 | | 14,183,483 | | 14,150,939 | | 14,183,483 |
FNMA #873354 5.61%, Due 02/01/21« | | 4,616,803 | | 4,814,296 | | | | | | 4,616,803 | | 4,814,296 |
| | |
| Proforma Portfolio of Investments - November 30, 2007 (Unaudited) | | Wells Fargo Advantage Funds |
| | | | | | | | | | | | |
| | | Intermediate Government
Income Fund | | Government Securities Fund | | Pro Forma Combined |
| | | Shares or
Principal
Amount | | Value
(Note 2) | | Shares or
Principal
Amount | | Value
(Note 2) | | Shares or
Principal
Amount | | Value
(Note 2) |
FNMA #874284 5.43%, Due 01/01/17« | | 11,700,000 | | 11,908,178 | | | | | | 11,700,000 | | 11,908,178 |
FNMA #886686 6.16%, Due 08/01/36± | | | | | | 13,462,414 | | 13,723,249 | | 13,462,414 | | 13,723,249 |
FNMA #886761 7.00%, Due 09/01/36« | | | | | | 4,109,099 | | 4,265,400 | | 4,109,099 | | 4,265,400 |
FNMA #888022 5.00%, Due 02/01/36« | | | | | | 33,051,117 | | 32,424,877 | | 33,051,117 | | 32,424,877 |
FNMA #888538 5.50%, Due 01/01/37« | | | | | | 25,332,941 | | 25,391,202 | | 25,332,941 | | 25,391,202 |
FNMA #892283 5.86%, Due 09/01/36«± | | | | | | 9,544,665 | | 9,694,684 | | 9,544,665 | | 9,694,684 |
FNMA #894157 6.50%, Due 10/01/36 | | | | | | 12,205,742 | | 12,555,423 | | 12,205,742 | | 12,555,423 |
FNMA #894199 6.50%, Due 10/01/36 | | | | | | 8,465,860 | | 8,708,397 | | 8,465,860 | | 8,708,397 |
FNMA #895998 6.50%, Due 07/01/36 | | | | | | 7,175,306 | | 7,380,871 | | 7,175,306 | | 7,380,871 |
FNMA #900560 6.50%, Due 09/01/36 | | | | | | 5,112,636 | | 5,259,108 | | 5,112,636 | | 5,259,108 |
FNMA #902200 6.50%, Due 11/01/36 | | | | | | 5,541,514 | | 5,700,272 | | 5,541,514 | | 5,700,272 |
FNMA #918447 5.50%, Due 05/01/22 | | | | | | 12,088,695 | | 12,230,495 | | 12,088,695 | | 12,230,495 |
FNMA #924858 6.50%, Due 09/01/37 | | | | | | 5,552,515 | | 5,676,588 | | 5,552,515 | | 5,676,588 |
FNMA #943768 6.50%, Due 10/01/37 | | | | | | 8,275,000 | | 8,459,907 | | 8,275,000 | | 8,459,907 |
FNMA #954965 6.50%, Due 09/01/37 | | | | | | 10,338,543 | | 10,569,560 | | 10,338,543 | | 10,569,560 |
FNMA TBA 5.00%, Due 12/01/36%% | | | | | | 22,880,000 | | 22,422,400 | | 22,880,000 | | 22,422,400 |
FNMA TBA 5.50%, Due 12/01/21%% | | | | | | 70,375,000 | | 71,188,676 | | 70,375,000 | | 71,188,676 |
FNMA TBA 6.50%, Due 12/01/36%% | | | | | | 40,527,000 | | 41,679,507 | | 40,527,000 | | 41,679,507 |
Total Federal National Mortgage Association | | | | 102,159,777 | | | | 541,751,161 | | | | 643,910,938 |
Government National Mortgage Association - 0.40% | | | | | | | | | | | | |
GNMA #126600 13.00%, Due 11/15/14 | | | | | | 6,030 | | 7,123 | | 6,030 | | 7,123 |
GNMA #201 14.00%, Due 09/20/14 | | | | | | 5,598 | | 6,605 | | 5,598 | | 6,605 |
GNMA #45629 13.00%, Due 02/15/11 | | | | | | 3,064 | | 3,511 | | 3,064 | | 3,511 |
GNMA #52538 15.00%, Due 07/15/12 | | | | | | 9,556 | | 11,269 | | 9,556 | | 11,269 |
GNMA #56900 15.00%, Due 07/15/12 | | | | | | 32 | | 35 | | 32 | | 35 |
GNMA #780051 9.00%, Due 12/15/09 | | | | | | 3,677 | | 3,688 | | 3,677 | | 3,688 |
GNMA #780104 9.50%, Due 10/20/19 | | | | | | 449,648 | | 488,569 | | 449,648 | | 488,569 |
GNMA #780110 12.50%, Due 04/15/19 | | | | | | 295,514 | | 348,026 | | 295,514 | | 348,026 |
GNMA #780288 8.00%, Due 12/15/23« | | | | | | 2,012,001 | | 2,195,994 | | 2,012,001 | | 2,195,994 |
GNMA #780763 7.50%, Due 12/15/10 | | | | | | 247,402 | | 251,138 | | 247,402 | | 251,138 |
GNMA #780867 8.35%, Due 04/15/20« | | | | | | 1,314,612 | | 1,426,629 | | 1,314,612 | | 1,426,629 |
GNMA #780980 8.40%, Due 05/15/20« | | | | | | 844,753 | | 930,655 | | 844,753 | | 930,655 |
GNMA #8678 5.75%, Due 08/20/20± | | | | | | 616,328 | | 623,616 | | 616,328 | | 623,616 |
GNMA #8714 6.13%, Due 11/20/20± | | | | | | 403,579 | | 410,037 | | 403,579 | | 410,037 |
GNMA #95643 15.00%, Due 09/15/12 | | | | | | 3,401 | | 4,007 | | 3,401 | | 4,007 |
Total Government National Mortgage Association | | | | — | | | | 6,710,902 | | | | 6,710,902 |
Small Business Administration - 0.01% | | | | | | | | | | | | |
| | | | | | |
SBA #440019 Series 1993-1A 2.24%, Due 02/28/18††(c)(i) | | | | | | 2,206,296 | | 91,354 | | 2,206,296 | | 91,354 |
SBA Series 1992-6 Class A 2.90%, Due 10/15/17††(c)(i) | | | | | | 2,893,653 | | 119,815 | | 2,893,653 | | 119,815 |
Total Small Business Administration | | | | — | | | | 211,169 | | | | 211,169 |
| | | | | | | | | | | | |
Total Agency Securities (Cost $163,060,029, $696,240,858 and $859,300,887, respectively) | | | | 164,404,594 | | | | 698,855,048 | | | | 863,259,642 |
| | | | | | | | | | | | |
| | | | | | |
Asset Backed Securities - 0.62% | | | | | | | | | | | | |
Capital Auto Receivables Asset Trust Series 2007-4 Class A3B 4.63%, Due 11/15/11± | | | | | | 10,445,000 | | 10,445,000 | | 10,445,000 | | 10,445,000 |
| | | | | | | | | | | | |
Total Asset Backed Securities (Cost $0, $10,445,000 and $10,445,000, respectively) | | | | — | | | | 10,445,000 | | | | 10,445,000 |
| | | | | | | | | | | | |
| | | | | | |
Collateralized Mortgage Obligations - 27.10% | | | | | | | | | | | | |
Banc of America Alternative Loan Trust Series 2005-10 Class 6A1 5.50%, Due 11/25/20 | | | | | | 7,398,700 | | 7,447,257 | | 7,398,700 | | 7,447,257 |
Countrywide Alternative Loan Trust Series J8 Class 4A1 6.00%, Due 02/25/17 | | | | | | 2,192,573 | | 2,200,568 | | 2,192,573 | | 2,200,568 |
Federal Agricultural Mortgage Corporation Series GS-1001 Class 1 7.00%, Due 01/25/08±(i) | | | | | | 92,340 | | 92,340 | | 92,340 | | 92,340 |
Federal Agricultural Mortgage Corporation Series GS-1002 Class 1 6.71%, Due 07/25/08± | | | | | | 124,668 | | 124,668 | | 124,668 | | 124,668 |
FHA Insured Project Loan #956 2.93%, Due 11/01/12††(a) | | | | | | 1,484,235 | | 1,484,235 | | 1,484,235 | | 1,484,235 |
FHLMC Series 1582 Class A 5.00%, Due 09/15/08± | | | | | | 326,296 | | 325,334 | | 326,296 | | 325,334 |
FHLMC Series 16 Class D 10.00%, Due 10/15/19 | | | | | | 86,604 | | 91,681 | | 86,604 | | 91,681 |
FHLMC Series 3139 Class YD 4.38%, Due 04/15/15« | | 31,561,849 | | 31,415,342 | | | | | | 31,561,849 | | 31,415,342 |
FHLMC Series 3185 Class PA 4.50%, Due 08/15/26« | | 28,254,193 | | 28,211,308 | | | | | | 28,254,193 | | 28,211,308 |
FHLMC Series 3221 Class VA 5.00%, Due 09/15/17« | | | | | | 11,945,352 | | 12,002,548 | | 11,945,352 | | 12,002,548 |
FHLMC Series 3347 Class PA 5.00%, Due 06/15/28 | | 26,496,710 | | 26,609,811 | | | | | | 26,496,710 | | 26,609,811 |
FHLMC Structured Pass-Through Securities Series T-15 Class A6 5.21%, Due 11/25/28± | | | | | | 569,395 | | 571,408 | | 569,395 | | 571,408 |
FHLMC Structured Pass-Through Securities Series T-23 Class A 5.06%, Due 05/25/30± | | | | | | 2,324,030 | | 2,323,406 | | 2,324,030 | | 2,323,406 |
FHLMC Structured Pass-Through Securities Series T-35 Class A 5.06%, Due 09/25/31± | | | | | | 1,119,868 | | 1,119,671 | | 1,119,868 | | 1,119,671 |
FHLMC Structured Pass-Through Securities Series T-42 Class A6 9.50%, Due 02/25/42 | | | | | | 2,585,914 | | 2,848,557 | | 2,585,914 | | 2,848,557 |
| | |
| Proforma Portfolio of Investments - November 30, 2007 (Unaudited) | | Wells Fargo Advantage Funds |
| | | | | | | | | | | | |
| | | Intermediate Government
Income Fund | | Government Securities Fund | | Pro Forma Combined |
| | | Shares or
Principal
Amount | | Value
(Note 2) | | Shares or
Principal
Amount | | Value
(Note 2) | | Shares or
Principal
Amount | | Value
(Note 2) |
FHLMC Structured Pass-Through Securities Series T-55 Class 1A1B 6.50%, Due 03/25/43 | | | | | | 1,341,112 | | 1,343,277 | | 1,341,112 | | 1,343,277 |
FHLMC Structured Pass-Through Securities Series T-55 Class 2A1 6.47%, Due 03/25/43± | | | | | | 1,511,563 | | 1,515,577 | | 1,511,563 | | 1,515,577 |
FHLMC Structured Pass-Through Securities Series T-57 Class 2A1 6.39%, Due 07/25/43± | | | | | | 6,858,017 | | 6,967,638 | | 6,858,017 | | 6,967,638 |
FNMA Grantor Trust Series 2000-T6 Class A2 9.50%, Due 06/25/30 | | | | | | 2,720,660 | | 2,917,575 | | 2,720,660 | | 2,917,575 |
FNMA Grantor Trust Series 2001-T10 Class A3 9.50%, Due 12/25/41 | | | | | | 5,405,859 | | 5,871,676 | | 5,405,859 | | 5,871,676 |
FNMA Grantor Trust Series 2001-T11 Class B 5.50%, Due 09/25/11 | | 23,175,000 | | 23,875,824 | | | | | | 23,175,000 | | 23,875,824 |
FNMA Grantor Trust Series 2001-T12 Class A3 9.50%, Due 08/25/41 | | | | | | 1,349,604 | | 1,463,394 | | 1,349,604 | | 1,463,394 |
FNMA Grantor Trust Series 2001-T8 Class A3 6.51%, Due 07/25/41± | | | | | | 3,354,388 | | 3,382,968 | | 3,354,388 | | 3,382,968 |
FNMA Grantor Trust Series 2002-T11 Class B 5.34%, Due 04/25/12 | | 15,275,044 | | 15,657,116 | | | | | | 15,275,044 | | 15,657,116 |
FNMA Grantor Trust Series 2002-T12 Class A5 6.34%, Due 10/25/41± | | | | | | 3,339,108 | | 3,419,037 | | 3,339,108 | | 3,419,037 |
FNMA Grantor Trust Series 2002-T19 Class A1 6.50%, Due 07/25/42 | | | | | | 11,375,139 | | 11,913,396 | | 11,375,139 | | 11,913,396 |
FNMA Grantor Trust Series 2002-T3 Class B 5.76%, Due 12/25/11 | | | | | | 8,000,000 | | 8,245,420 | | 8,000,000 | | 8,245,420 |
FNMA Grantor Trust Series 2002-T5 Class A1 5.02%, Due 05/25/32± | | | | | | 814,949 | | 814,949 | | 814,949 | | 814,949 |
FNMA Grantor Trust Series 2003-T1 Class B 4.49%, Due 11/25/12 | | 15,000,000 | | 15,182,616 | | | | | | 15,000,000 | | 15,182,616 |
FNMA Grantor Trust Series 2003-T2 Class A1 5.06%, Due 03/25/33± | | | | | | 730,428 | | 730,289 | | 730,428 | | 730,289 |
FNMA Interest Strip Series 161 Class 2 8.50%, Due 07/25/22(c) | | | | | | 241,815 | | 61,108 | | 241,815 | | 61,108 |
| | | | | | |
FNMA Interest Strip Series 265 Class 2 9.00%, Due 03/01/24 | | | | | | 646,195 | | 718,920 | | 646,195 | | 718,920 |
| | | | | | |
FNMA Interest Strip Series B Class 1 6.00%, Due 05/01/09 | | | | | | 56,446 | | 56,231 | | 56,446 | | 56,231 |
| | | | | | |
FNMA Interest Strip Series C Class 1 6.00%, Due 05/01/09 | | | | | | 60,139 | | 59,931 | | 60,139 | | 59,931 |
| | | | | | |
FNMA Interest Strip Series K Class 1 6.00%, Due 11/01/08 | | | | | | 36,325 | | 36,230 | | 36,325 | | 36,230 |
FNMA Series 1988-2 Class Z 10.10%, Due 02/25/18 | | | | | | 336,079 | | 370,721 | | 336,079 | | 370,721 |
FNMA Series 1988-7 Class Z 9.25%, Due 04/25/18 | | | | | | 127,668 | | 136,785 | | 127,668 | | 136,785 |
FNMA Series 1989-10 Class Z 9.50%, Due 03/25/19 | | | | | | 692,625 | | 769,183 | | 692,625 | | 769,183 |
FNMA Series 1989-100 Class Z 8.75%, Due 12/25/19 | | | | | | 525,375 | | 563,769 | | 525,375 | | 563,769 |
FNMA Series 1989-12 Class Y 10.00%, Due 03/25/19 | | | | | | 1,276,299 | | 1,446,382 | | 1,276,299 | | 1,446,382 |
FNMA Series 1989-22 Class G 10.00%, Due 05/25/19 | | | | | | 856,498 | | 965,352 | | 856,498 | | 965,352 |
FNMA Series 1989-63 Class Z 9.40%, Due 10/25/19 | | | | | | 162,006 | | 173,422 | | 162,006 | | 173,422 |
FNMA Series 1989-98 Class E 9.20%, Due 12/25/19 | | | | | | 228,421 | | 245,075 | | 228,421 | | 245,075 |
FNMA Series 1990-144 Class W 9.50%, Due 12/25/20 | | | | | | 415,125 | | 462,941 | | 415,125 | | 462,941 |
FNMA Series 1990-75 Class Z 9.50%, Due 07/25/20 | | | | | | 319,819 | | 357,685 | | 319,819 | | 357,685 |
FNMA Series 1990-84 Class Y 9.00%, Due 07/25/20 | | | | | | 155,654 | | 167,892 | | 155,654 | | 167,892 |
FNMA Series 1990-96 Class Z 9.67%, Due 08/25/20 | | | | | | 668,139 | | 749,914 | | 668,139 | | 749,914 |
FNMA Series 1991-5 Class Z 8.75%, Due 01/25/21 | | | | | | 274,436 | | 300,787 | | 274,436 | | 300,787 |
FNMA Series 1991-85 Class Z 8.00%, Due 06/25/21 | | | | | | 989,614 | | 1,044,243 | | 989,614 | | 1,044,243 |
FNMA Series 1992-45 Class Z 8.00%, Due 04/25/22 | | | | | | 679,191 | | 721,346 | | 679,191 | | 721,346 |
FNMA Series G-8 Class E 9.00%, Due 04/25/21 | | | | | | 610,865 | | 674,583 | | 610,865 | | 674,583 |
FNMA Series G92-30 Class Z 7.00%, Due 06/25/22 | | | | | | 1,403,223 | | 1,474,549 | | 1,403,223 | | 1,474,549 |
FNMA Whole Loan Series 1999-W6 Class A 9.65%, Due 09/25/28± | | | | | | 290,677 | | 308,105 | | 290,677 | | 308,105 |
FNMA Whole Loan Series 2003-W11 Class A1 8.01%, Due 06/25/33± | | | | | | 167,718 | | 169,190 | | 167,718 | | 169,190 |
FNMA Whole Loan Series 2003-W18 Class 1A5 4.61%, Due 08/25/43 | | | | | | 2,422,174 | | 2,410,212 | | 2,422,174 | | 2,410,212 |
FNMA Whole Loan Series 2003-W3 Class 1A4 6.26%, Due 08/25/42± | | | | | | 7,477,461 | | 7,537,091 | | 7,477,461 | | 7,537,091 |
FNMA Whole Loan Series 2003-W5 Class A 5.00%, Due 04/25/33± | | | | | | 1,536,376 | | 1,492,791 | | 1,536,376 | | 1,492,791 |
FNMA Whole Loan Series 2003-W6 Class 6A 6.44%, Due 08/25/42± | | | | | | 6,427,230 | | 6,453,664 | | 6,427,230 | | 6,453,664 |
FNMA Whole Loan Series 2003-W6 Class PT4 9.64%, Due 10/25/42± | | | | | | 6,539,317 | | 7,208,311 | | 6,539,317 | | 7,208,311 |
FNMA Whole Loan Series 2003-W8 Class PT1 10.18%, Due 12/25/42± | | | | | | 3,180,453 | | 3,479,506 | | 3,180,453 | | 3,479,506 |
FNMA Whole Loan Series 2003-W9 Class A 5.02%, Due 06/25/33± | | | | | | 500,945 | | 494,855 | | 500,945 | | 494,855 |
| | |
| Proforma Portfolio of Investments - November 30, 2007 (Unaudited) | | Wells Fargo Advantage Funds |
| | | | | | | | | | | | |
| | | Intermediate Government
Income Fund | | Government Securities Fund | | Pro Forma Combined |
| | | Shares or
Principal
Amount | | Value
(Note 2) | | Shares or
Principal
Amount | | Value
(Note 2) | | Shares or
Principal
Amount | | Value
(Note 2) |
FNMA Whole Loan Series 2004-W15 Class 1A3 7.00%, Due 08/25/44 | | | | | | 6,437,958 | | 6,878,513 | | 6,437,958 | | 6,878,513 |
Four Times Square Trust Series 2000-4Ts Class A2 7.80%, Due 04/15/15†† | | | | | | 9,974,000 | | 10,838,516 | | 9,974,000 | | 10,838,516 |
Freddie Mac Reference REMIC Series R007 Class AC 5.88%, Due 05/15/16« | | | | | | 10,801,991 | | 10,945,407 | | 10,801,991 | | 10,945,407 |
GNMA Series 2004-103 Class C 4.70%, Due 12/16/27«± | | | | | | 12,404,000 | | 12,282,108 | | 12,404,000 | | 12,282,108 |
GNMA Series 2005-23 Class IO 0.96%, Due 06/17/45±(c) | | | | | | 226,041,660 | | 10,516,385 | | 226,041,660 | | 10,516,385 |
GNMA Series 2005-34 Class A 3.96%, Due 09/16/21 | | | | | | 6,271,685 | | 6,196,192 | | 6,271,685 | | 6,196,192 |
GNMA Series 2005-59 Class A 4.39%, Due 05/16/23« | | | | | | 11,592,306 | | 11,502,031 | | 11,592,306 | | 11,502,031 |
GNMA Series 2006-3 Class A 4.21%, Due 01/16/28 | | | | | | 17,386,190 | | 17,206,392 | | 17,386,190 | | 17,206,392 |
GNMA Series 2006-30 Class D 5.41%, Due 04/16/39± | | | | | | 6,019,000 | | 5,951,293 | | 6,019,000 | | 5,951,293 |
GNMA Series 2006-32 Class C 5.52%, Due 11/16/38«± | | | | | | 12,510,000 | | 12,434,706 | | 12,510,000 | | 12,434,706 |
GNMA Series 2006-32 Class XM 0.88%, Due 11/16/45±(c) | | | | | | 82,377,648 | | 3,856,781 | | 82,377,648 | | 3,856,781 |
GNMA Series 2006-68 Class D 5.31%, Due 12/16/37«± | | | | | | 12,520,000 | | 12,304,272 | | 12,520,000 | | 12,304,272 |
GNMA Series 2007-34 Class A 4.27%, Due 11/16/26« | | | | | | 8,459,841 | | 8,380,636 | | 8,459,841 | | 8,380,636 |
Greenwich Capital Commercial Funding Corporation Series 2002-C1 Class XPB 1.99%, Due 01/11/35±††(c) | | | | | | 157,721,500 | | 8,044 | | 157,721,500 | | 8,044 |
| | | | | | |
JPMorgan Chase Commercial Mortgage Securities Corporation Series 2007-CB18 Class A3 5.45%, Due 06/12/47 | | 8,000,000 | | 7,981,341 | | | | | | 8,000,000 | | 7,981,341 |
JPMorgan Mortgage Trust Series 2005-A3 Class 7CA1 5.11%, Due 06/25/35± | | | | | | 6,707,566 | | 6,754,565 | | 6,707,566 | | 6,754,565 |
JPMorgan Residential Mortgage Acceptance Series 2006-R1 Class 1A1 4.94%, Due 09/28/44±†† | | | | | | 7,878,831 | | 7,761,831 | | 7,878,831 | | 7,761,831 |
LB-UBS Commercial Mortgage Trust Series 2006-C7 Class A3 5.35%, Due 11/15/38 | | 10,000,000 | | 9,922,718 | | | | | | 10,000,000 | | 9,922,718 |
Morgan Stanley Capital I Series 2005-HQ5 Class A4 5.17%, Due 01/14/42 | | 14,175,000 | | 13,945,729 | | | | | | 14,175,000 | | 13,945,729 |
Nomura Asset Acceptance Corporation Series 2004-R2 Class A1 6.50%, Due 10/25/34±†† | | | | | | 5,815,840 | | 5,842,375 | | 5,815,840 | | 5,842,375 |
Salomon Brothers Mortgage Securities VII Series 2001-C2 Class X2 1.04%, Due 11/13/11±(c) | | | | | | 125,500,000 | | 1,130,906 | | 125,500,000 | | 1,130,906 |
TIAA Real Estate CDO Limited Series 2007-C4 Class A3 6.10%, Due 06/15/49± | | | | | | 7,160,000 | | 7,388,045 | | 7,160,000 | | 7,388,045 |
Vendee Mortgage Trust Series 1995-1 Class 4 8.88%, Due 02/15/25± | | | | | | 920,623 | | 1,006,746 | | 920,623 | | 1,006,746 |
Vendee Mortgage Trust Series 1995-2C Class 3A 8.79%, Due 06/15/25 | | | | | | 1,391,416 | | 1,525,341 | | 1,391,416 | | 1,525,341 |
Wachovia Bank Commercial Mortgage Trust Series 2002-C2 Class IO3 1.61%, Due 11/15/34±††(c) | | | | | | 90,957,000 | | 3,784 | | 90,957,000 | | 3,784 |
Wachovia Bank Commercial Mortgage Trust Series 2003-C6 Class A4 5.13%, Due 08/15/35± | | 5,000,000 | | 4,947,762 | | | | | | 5,000,000 | | 4,947,762 |
| | | | | | | | | | | | |
Total Collateralized Mortgage Obligations (Cost $176,484,148, $281,151,200 and $457,635,348, respectively) | | | | 177,749,567 | | | | 281,042,512 | | | | 458,792,079 |
| | | | | | | | | | | | |
| | | | | | |
Corporate Bonds & Notes - 1.55% | | | | | | | | | | | | |
Apparel & Accessory Stores - 0.00% | | | | | | | | | | | | |
Sears Roebuck Acceptance 6.70%, Due 04/15/12 | | | | | | 172 | | 175 | | 172 | | 175 |
Total Apparel & Accessory Stores | | | | — | | | | 175 | | | | 175 |
Non-Depository Credit Institutions - 1.55% | | | | | | | | | | | | |
Private Export Funding Corporation Series D 5.87%, Due 07/31/08 | | | | | | 26,000,000 | | 26,248,826 | | 26,000,000 | | 26,248,826 |
Total Non-Depository Credit Institutions | | | | — | | | | 26,248,826 | | | | 26,248,826 |
| | | | | | | | | | | | |
Total Corporate Bonds & Notes (Cost $0, $26,136,522 and $26,136,522, respectively) | | | | — | | | | 26,249,001 | | | | 26,249,001 |
| | | | | | | | | | | | |
| | | | | | |
Foreign Corporate Bonds - 0.38% | | | | | | | | | | | | |
European Investment Bank 4.88%, Due 02/15/36 | | | | | | 6,410,000 | | 6,455,703 | | 6,410,000 | | 6,455,703 |
| | | | | | | | | | | | |
Total Foreign Corporate Bonds (Cost $0, $6,139,073 and $6,139,073, respectively) | | | | — | | | | 6,455,703 | | | | 6,455,703 |
| | | | | | | | | | | | |
| | | | | | |
Municipal Bonds & Notes - 1.81% | | | | | | | | | | | | |
Arkansas - 0.12% | | | | | | | | | | | | |
Arkansas Development Finance Authority (Housing Revenue LOC) 9.75%, Due 11/15/14 | | | | | | 1,753,766 | | 1,951,222 | | 1,753,766 | | 1,951,222 |
Total Arkansas | | | | — | | | | 1,951,222 | | | | 1,951,222 |
Florida - 0.33% | | | | | | | | | | | | |
Seminole Tribe Florida Resort Gaming Facilities Project Prerefunded (Other Revenue) 11.50%, Due 10/01/13§ | | | | | | 5,250,000 | | 5,660,130 | | 5,250,000 | | 5,660,130 |
Total Florida | | | | — | | | | 5,660,130 | | | | 5,660,130 |
Texas - 1.36% | | | | | | | | | | | | |
Retama Texas Development Corporation (Other Revenue LOC) 10.00%, Due 12/15/20 | | | | | | 5,405,000 | | 7,944,755 | | 5,405,000 | | 7,944,755 |
| | |
| Proforma Portfolio of Investments - November 30, 2007 (Unaudited) | | Wells Fargo Advantage Funds |
| | | | | | | | | | | | |
| | | Intermediate Government
Income Fund | | Government Securities Fund | | Pro Forma Combined |
| | | Shares or
Principal
Amount | | Value
(Note 2) | | Shares or
Principal
Amount | | Value
(Note 2) | | Shares or
Principal
Amount | | Value
(Note 2) |
San Antonio TX Electric & Gas System (Electric Revenue) 3.63%, Due 12/01/27±§ | | | | | | 15,000,000 | | 15,042,300 | | 15,000,000 | | 15,042,300 |
Total Texas | | | | — | | | | 22,987,055 | | | | 22,987,055 |
| | | | | | | | | | | | |
Total Municipal Bonds & Notes (Cost $0, $30,630,006 and $30,630,006, respectively) | | | | — | | | | 30,598,407 | | | | 30,598,407 |
| | | | | | | | | | | | |
| | | | | | |
US Treasury Securities - 21.92% | | | | | | | | | | | | |
US Treasury Bills - 0.00% | | | | | | | | | | | | |
US Treasury Bill 3.65%, Due 12/20/07^ | | 65,000 | | 64,889 | | | | | | 65,000 | | 64,889 |
Total US Treasury Bills | | | | 64,889 | | | | — | | | | 64,889 |
US Treasury Bonds - 5.46% | | | | | | | | | | | | |
US Treasury Bond 4.50%, Due 02/15/36« | | 1,000,000 | | 1,013,906 | | | | | | 1,000,000 | | 1,013,906 |
US Treasury Bond 5.00%, Due 05/15/37« | | | | | | 11,025,000 | | 12,106,828 | | 11,025,000 | | 12,106,828 |
US Treasury Bond 5.38%, Due 02/15/31« | | | | | | 5,875,000 | | 6,678,224 | | 5,875,000 | | 6,678,224 |
US Treasury Bond 6.00%, Due 02/15/26« | | | | | | 21,535,000 | | 25,675,448 | | 21,535,000 | | 25,675,448 |
US Treasury Bond 8.75%, Due 05/15/17« | | | | | | 34,340,000 | | 46,978,734 | | 34,340,000 | | 46,978,734 |
Total US Treasury Bonds | | | | 1,013,906 | | | | 91,439,234 | | | | 92,453,140 |
US Treasury Notes - 16.46% | | | | | | | | | | | | |
US Treasury Note 4.88%, Due 08/15/09« | | 1,850,000 | | 1,903,188 | | | | | | 1,850,000 | | 1,903,188 |
US Treasury Note 3.63%, Due 10/31/09 | | | | | | 20,815,000 | | 21,031,289 | | 20,815,000 | | 21,031,289 |
US Treasury Note 4.25%, Due 09/30/12« | | | | | | 79,230,000 | | 82,108,267 | | 79,230,000 | | 82,108,267 |
US Treasury Note 4.25%, Due 11/15/13« | | | | | | 30,045,000 | | 31,169,344 | | 30,045,000 | | 31,169,344 |
US Treasury Note 4.25%, Due 11/15/14« | | | | | | 10,295,000 | | 10,617,522 | | 10,295,000 | | 10,617,522 |
US Treasury Note 4.63%, Due 12/31/11« | | | | | | 64,105,000 | | 67,295,249 | | 64,105,000 | | 67,295,249 |
US Treasury Note 4.63%, Due 02/15/17« | | | | | | 32,555,000 | | 34,177,671 | | 32,555,000 | | 34,177,671 |
US Treasury Note 12.00%, Due 08/15/13« | | | | | | 28,595,000 | | 30,250,393 | | 28,595,000 | | 30,250,393 |
Total US Treasury Notes | | | | 1,903,188 | | | | 276,649,735 | | | | 278,552,923 |
| | | | | | | | | | | | |
Total US Treasury Securities (Cost $2,890,102, $358,829,683 and $361,719,785, respectively) | | | | 2,981,983 | | | | 368,088,969 | | | | 371,070,952 |
| | | | | | | | | | | | |
| | | | | | |
Collateral for Securities Lending - 48.49% | | | | | | | | | | | | |
Collateral Invested in Other Assets | | | | | | | | | | | | |
Alpine Securitization Corporation 4.70%, Due 12/04/07†† | | 2,195,003 | | 2,194,717 | | 8,208,610 | | 8,207,543 | | 10,403,613 | | 10,402,260 |
| | | | | | |
American General Finance Corporation 5.33%, Due 01/18/08± | | 6,191 | | 6,191 | | 23,152 | | 23,154 | | 29,343 | | 29,345 |
Amstel Funding Corporation 5.20%, Due 12/04/07 | | 506,539 | | 506,473 | | 1,894,295 | | 1,894,048 | | 2,400,834 | | 2,400,521 |
Aspen Funding Corporation 4.99%, Due 12/27/07 | | 337,693 | | 336,609 | | 1,262,863 | | 1,258,809 | | 1,600,556 | | 1,595,418 |
| | | | | | |
Atlas Capital Funding Corporation 4.78%, Due 04/25/08±†† | | 2,251,285 | | 2,250,812 | | 8,419,087 | | 8,417,319 | | 10,670,372 | | 10,668,131 |
Atomium Funding LLC 5.10%, Due 12/04/07†† | | 2,251,285 | | 2,250,992 | | 8,419,087 | | 8,417,993 | | 10,670,372 | | 10,668,985 |
Barclays Repurchase Agreement - 102% Collateralized (Maturity Value $18,950,586) 4.84%, Due 12/03/07 | | | | | | 18,942,946 | | 18,942,946 | | 18,942,946 | | 18,942,946 |
Barclays Repurchase Agreement - 102% Collateralized (Maturity Value $5,067,434) 4.84%, Due 12/03/07 | | 5,065,391 | | 5,065,391 | | | | | | 5,065,391 | | 5,065,391 |
Barton Capital Corporation 4.75%, Due 12/07/07†† | | 562,821 | | 562,529 | | 2,104,772 | | 2,103,677 | | 2,667,593 | | 2,666,206 |
BASF Finance Europe NV 5.17%, Due 10/17/08±†† | | 2,814,106 | | 2,810,082 | | 10,523,859 | | 10,508,810 | | 13,337,965 | | 13,318,892 |
Bear Stearns & Company Incorporated International Repurchase Agreement - 102% Collateralized (Maturity Value $10,528,016) 4.74%, Due 12/03/07 | | | | | | 10,523,859 | | 10,523,859 | | 10,523,859 | | 10,523,859 |
Bear Stearns & Company Incorporated International Repurchase Agreement - 102% Collateralized (Maturity Value $2,815,218) 4.74%, Due 12/03/07 | | 2,814,106 | | 2,814,106 | | | | | | 2,814,106 | | 2,814,106 |
Bear Stearns & Company Incorporated Repurchase Agreement - 102% Collateralized (Maturity Value $31,584,178) 4.79%, Due 12/03/07 | | | | | | 31,571,576 | | 31,571,576 | | 31,571,576 | | 31,571,576 |
Bear Stearns & Company Incorporated Repurchase Agreement - 102% Collateralized (Maturity Value $8,445,688) 4.79%, Due 12/03/07 | | 8,442,318 | | 8,442,318 | | | | | | 8,442,318 | | 8,442,318 |
BNP Paribas 4.85%, Due 11/07/08± | | 1,688,464 | | 1,688,464 | | 6,314,315 | | 6,314,315 | | 8,002,779 | | 8,002,779 |
| | | | | | |
BNP Paribas Repurchase Agreement - 102% Collateralized (Maturity Value $42,112,168) 4.77%, Due 12/03/07 | | | | | | 42,095,435 | | 42,095,435 | | 42,095,435 | | 42,095,435 |
| | | | | | |
BNP Paribas Repurchase Agreement - 102% Collateralized (Maturity Value $11,260,898) 4.77%, Due 12/03/07 | | 11,256,424 | | 11,256,424 | | | | | | 11,256,424 | | 11,256,424 |
Chariot Funding LLC 4.70%, Due 12/05/07†† | | 3,939,748 | | 3,938,724 | | 14,733,402 | | 14,729,572 | | 18,673,150 | | 18,668,296 |
Chariot Funding LLC 5.02%, Due 12/28/07 | | 1,181,925 | | 1,177,965 | | 4,420,021 | | 4,405,214 | | 5,601,946 | | 5,583,179 |
Cheyne Finance LLC 4.61%, Due 02/25/08±†† | | 1,604,040 | | 1,443,636 | | 5,998,600 | | 5,398,740 | | 7,602,640 | | 6,842,376 |
CIT Group Incorporated 5.67%, Due 12/19/07± | | 562,821 | | 561,819 | | 2,104,772 | | 2,101,025 | | 2,667,593 | | 2,662,844 |
Citigroup Repurchase Agreement - 102% Collateralized (Maturity Value $45,028,107) 4.77%, Due 12/03/07 | | | | | | 45,010,215 | | 45,010,215 | | 45,010,215 | | 45,010,215 |
Citigroup Repurchase Agreement - 102% Collateralized (Maturity Value $11,294,949) 4.77%, Due 12/03/07 | | 11,290,461 | | 11,290,461 | | | | | | 11,290,461 | | 11,290,461 |
Clipper Receivables Corporation 4.75%, Due 12/03/07 | | 3,208,081 | | 3,208,081 | | 11,997,199 | | 11,997,199 | | 15,205,280 | | 15,205,280 |
Clipper Receivables Corporation 5.13%, Due 12/14/07†† | | 2,026,156 | | 2,023,218 | | 7,577,178 | | 7,566,191 | | 9,603,334 | | 9,589,409 |
| | |
| Proforma Portfolio of Investments - November 30, 2007 (Unaudited) | | Wells Fargo Advantage Funds |
| | | | | | | | | | | | |
| | | Intermediate Government
Income Fund | | Government Securities Fund | | Pro Forma Combined |
| | | Shares or
Principal
Amount | | Value
(Note 2) | | Shares or
Principal
Amount | | Value
(Note 2) | | Shares or
Principal
Amount | | Value
(Note 2) |
CRC Funding LLC 4.90%, Due 12/05/07†† | | 2,814,106 | | 2,813,374 | | 10,523,859 | | 10,521,123 | | 13,337,965 | | 13,334,497 |
Credit Agricole SA 5.02%, Due 02/25/08± | | 1,266,348 | | 1,266,298 | | 4,735,736 | | 4,735,552 | | 6,002,084 | | 6,001,850 |
Credit Suisse First Boston Repurchase Agreement - 102% Collateralized (Maturity Value $52,640,298) 4.79%, Due 12/03/07 | | | | | | 52,619,294 | | 52,619,294 | | 52,619,294 | | 52,619,294 |
Credit Suisse First Boston Repurchase Agreement - 102% Collateralized (Maturity Value $14,076,146) 4.79%, Due 12/03/07 | | 14,070,530 | | 14,070,530 | | | | | | 14,070,530 | | 14,070,530 |
Cullinan Finance Corporation 4.76%, Due 08/04/08±†† | | 1,407,053 | | 1,397,780 | | 5,261,929 | | 5,227,253 | | 6,668,982 | | 6,625,033 |
Fairway Finance Corporation 4.73%, Due 12/06/07†† | | 1,125,642 | | 1,125,203 | | 4,209,544 | | 4,207,902 | | 5,335,186 | | 5,333,105 |
Fairway Finance Corporation 5.03%, Due 12/10/07†† | | 1,913,592 | | 1,911,851 | | 7,156,224 | | 7,149,712 | | 9,069,816 | | 9,061,563 |
| | | | | | |
Falcon Asset Securitization Corporation 5.02%, Due 12/24/07 | | 1,463,335 | | 1,459,267 | | | | | | 1,463,335 | | 1,459,267 |
| | | | | | |
Falcon Asset Securitization Corporation 5.02%, Due 12/24/07 | | | | | | 5,472,407 | | 5,457,193 | | 5,472,407 | | 5,457,193 |
Galleon Capital LLC 4.82%, Due 12/07/07 | | 1,969,874 | | 1,968,850 | | 7,366,701 | | 7,362,870 | | 9,336,575 | | 9,331,720 |
Galleon Capital LLC 4.90%, Due 12/04/07†† | | 2,251,285 | | 2,250,992 | | 8,419,087 | | 8,417,993 | | 10,670,372 | | 10,668,985 |
General Electric Capital Assurance Company 4.74%, Due 06/16/08± | | 900,514 | | 900,514 | | 3,367,635 | | 3,367,635 | | 4,268,149 | | 4,268,149 |
ING (USA) Annuity & Life Insurance Company 4.73%, Due 08/16/08± | | 1,969,874 | | 1,969,874 | | 7,366,701 | | 7,366,701 | | 9,336,575 | | 9,336,575 |
Kestrel Funding US LLC 4.76%, Due 02/25/08±†† | | 2,026,156 | | 2,024,657 | | 7,577,178 | | 7,571,571 | | 9,603,334 | | 9,596,228 |
Kitty Hawk Funding Corporation 4.74%, Due 12/06/07 | | 4,221,159 | | 4,219,513 | | 15,785,788 | | 15,779,632 | | 20,006,947 | | 19,999,145 |
Liquid Funding Limited 5.70%, Due 06/11/08±†† | | 4,221,159 | | 4,221,708 | | 15,785,788 | | 15,787,840 | | 20,006,947 | | 20,009,548 |
M&I Marshall & Ilsley Bank Series BKNT 4.84%, Due 02/15/08± | | 56,282 | | 56,224 | | 210,477 | | 210,258 | | 266,759 | | 266,482 |
| | | | | | |
Merrill Lynch & Company Incorporated 5.45%, Due 01/02/08± | | 42,212 | | 42,198 | | | | | | 42,212 | | 42,198 |
Merrill Lynch & Company Incorporated Repurchase Agreement - 102% Collateralized (Maturity Value $42,112,098) 4.75%, Due 12/03/07 | | | | | | 42,095,435 | | 42,095,435 | | 42,095,435 | | 42,095,435 |
Merrill Lynch & Company Incorporated Repurchase Agreement - 102% Collateralized (Maturity Value $11,260,880) 4.75%, Due 12/03/07 | | 11,256,424 | | 11,256,424 | | | | | | 11,256,424 | | 11,256,424 |
Merrill Lynch & Company Incorporated Series MTNB 5.45%, Due 01/02/08± | | | | | | 157,858 | | 157,806 | | 157,858 | | 157,806 |
MetLife Global Funding I 4.71%, Due 10/21/08±†† | | 1,407,053 | | 1,404,056 | | 5,261,929 | | 5,250,721 | | 6,668,982 | | 6,654,777 |
Morgan Stanley 4.76%, Due 04/07/08± | | 844,232 | | 844,232 | | 3,157,158 | | 3,157,158 | | 4,001,390 | | 4,001,390 |
Morgan Stanley 4.78%, Due 10/15/08± | | 865,338 | | 865,338 | | | | | | 865,338 | | 865,338 |
| | | | | | |
Morgan Stanley Repurchase Agreement - 102% Collateralized (Maturity Value $15,767,560) 4.77%, Due 12/03/07 | | | | | | 15,761,295 | | 15,761,295 | | 15,761,295 | | 15,761,295 |
| | | | | | |
Morgan Stanley Repurchase Agreement - 102% Collateralized (Maturity Value $16,844,867) 4.77%, Due 12/03/07 | | | | | | 16,838,174 | | 16,838,174 | | 16,838,174 | | 16,838,174 |
| | | | | | |
Morgan Stanley Repurchase Agreement - 102% Collateralized (Maturity Value $4,216,284) 4.77%, Due 12/03/07 | | 4,214,609 | | 4,214,609 | | | | | | 4,214,609 | | 4,214,609 |
| | | | | | |
Morgan Stanley Repurchase Agreement - 102% Collateralized (Maturity Value $4,504,360) 4.77%, Due 12/03/07 | | 4,502,570 | | 4,502,570 | | | | | | 4,502,570 | | 4,502,570 |
Morgan Stanley Series EXL 4.78%, Due 10/15/08± | | | | | | 3,236,087 | | 3,236,087 | | 3,236,087 | | 3,236,087 |
Natexis Banques Populaires 4.90%, Due 09/08/08±†† | | 1,407,053 | | 1,407,053 | | 5,261,929 | | 5,261,929 | | 6,668,982 | | 6,668,982 |
Natixis Series YCD 4.84%, Due 01/25/08± | | 2,217,595 | | 2,216,265 | | 26,788,906 | | 26,772,833 | | 29,006,501 | | 28,989,098 |
Old Line Funding Corporation 5.06%, Due 12/17/07†† | | 393,975 | | 393,250 | | 1,473,340 | | 1,470,629 | | 1,867,315 | | 1,863,879 |
Picaros Funding LLC 5.27%, Due 03/07/08†† | | | | | | 35,342,199 | | 34,886,991 | | 35,342,199 | | 34,886,991 |
Premium Asset Trust 5.29%, Due 07/15/08±†† | | 1,001,822 | | 1,001,621 | | 3,746,494 | | 3,745,744 | | 4,748,316 | | 4,747,365 |
Racers Trust Series 2004-6-MM 4.93%, Due 03/22/08±†† | | 2,642,727 | | 2,642,727 | | 9,882,956 | | 9,882,956 | | 12,525,683 | | 12,525,683 |
Ranger Funding Corporation 4.86%, Due 12/17/07†† | | 2,195,003 | | 2,190,964 | | 8,208,610 | | 8,193,506 | | 10,403,613 | | 10,384,470 |
Scaldis Capital Limited 5.06%, Due 12/14/07 | | 393,975 | | 393,404 | | 1,473,340 | | 1,471,204 | | 1,867,315 | | 1,864,608 |
SLM Corporation 4.66%, Due 05/12/08±†† | | 1,125,642 | | 1,117,178 | | 4,209,544 | | 4,177,888 | | 5,335,186 | | 5,295,066 |
Solitaire Funding LLC 4.99%, Due 12/26/07 | | 1,688,464 | | 1,683,263 | | 6,314,315 | | 6,294,867 | | 8,002,779 | | 7,978,130 |
Solitaire Funding LLC 4.99%, Due 12/31/07 | | 2,476,413 | | 2,467,127 | | 9,260,996 | | 9,226,267 | | 11,737,409 | | 11,693,394 |
Stanfield Victoria Funding LLC 5.23%, Due 04/03/08±†† | | 2,251,285 | | 2,224,427 | | 8,419,087 | | 8,318,647 | | 10,670,372 | | 10,543,074 |
Thames Asset Global Securitization #1 Incorporated 4.90%, Due 12/07/07†† | | 1,314,694 | | 1,314,010 | | 4,916,536 | | 4,913,980 | | 6,231,230 | | 6,227,990 |
The Travelers Insurance Company 4.74%, Due 02/08/08± | | 1,081,686 | | 1,081,661 | | 4,045,161 | | 4,045,080 | | 5,126,847 | | 5,126,741 |
Transamerica Occidental Life Insurance 4.89%, Due 08/01/08± | | 5,628,212 | | 5,628,212 | | 21,047,718 | | 21,047,718 | | 26,675,930 | | 26,675,930 |
Unicredito Italiano Bank (Ireland) Series LIB 4.69%, Due 10/08/08±†† | | 1,407,053 | | 1,405,407 | | 5,261,929 | | 5,255,773 | | 6,668,982 | | 6,661,180 |
UniCredito Italiano Bank (New York) Series YCD 5.62%, Due 12/03/07± | | 303,923 | | 304,035 | | 1,136,577 | | 1,136,995 | | 1,440,500 | | 1,441,030 |
UniCredito Italiano Bank (New York) Series YCD 5.70%, Due 12/13/07± | | 95,680 | | 95,681 | | 357,811 | | 357,815 | | 453,491 | | 453,496 |
| | |
| Proforma Portfolio of Investments - November 30, 2007 (Unaudited) | | Wells Fargo Advantage Funds |
| | | | | | | | | | | | | | | |
| | | Intermediate Government
Income Fund | | | Government Securities Fund | | | Pro Forma Combined | |
| | | Shares or
Principal
Amount | | Value
(Note 2) | | | Shares or
Principal
Amount | | Value
(Note 2) | | | Shares or
Principal
Amount | | Value
(Note 2) | |
Versailles CDS LLC 4.97%, Due 12/05/07 | | 1,519,617 | | 1,519,222 | | | 5,682,884 | | 5,681,406 | | | 7,202,501 | | 7,200,628 | |
Versailles CDS LLC 5.11%, Due 12/11/07 | | 844,232 | | 843,345 | | | 3,157,158 | | 3,153,843 | | | 4,001,390 | | 3,997,188 | |
Victoria Finance LLC 4.69%, Due 05/02/08±†† | | 1,407,053 | | 1,407,053 | | | 5,261,929 | | 5,261,929 | | | 6,668,982 | | 6,668,982 | |
Victoria Finance LLC 4.78%, Due 08/07/08±†† | | 1,407,053 | | 1,407,053 | | | 5,261,929 | | 5,261,929 | | | 6,668,982 | | 6,668,982 | |
| | | | | | | | | | | | | | | |
Total Collateral for Securities Lending (Cost $161,518,682, $660,186,634 and $821,705,316, respectively) | | | | 161,358,032 | | | | | 659,586,774 | | | | | 820,944,806 | |
| | | | | | | | | | | | | | | |
| | | | | | |
Short-Term Investments - 3.56% | | | | | | | | | | | | | | | |
Mutual Funds - 3.50% | | | | | | | | | | | | | | | |
Wells Fargo Advantage Money Market Trust~‡ | | 11,294,973 | | 11,294,973 | | | 47,913,460 | | 47,913,460 | | | 59,208,433 | | 59,208,433 | |
US Treasury Bills - 0.06% | | | | | | | | | | | | | | | |
US Treasury Bill 3.86%, Due 01/24/08^# | | | | | | | 1,060,000 | | 1,055,724 | | | 1,060,000 | | 1,055,724 | |
| | | | | | | | | | | | | | | |
Total Short-Term Investments (Cost $11,294,973, $48,967,611 and $60,262,584, respectively) | | | | 11,294,973 | | | | | 48,969,184 | | | | | 60,264,157 | |
| | | | | | | | | | | | | | | |
Total Investments in Securities (Cost $515,247,934, $2,194,197,129 and $2,709,445,063, respectively) - 160.99%* | | | | 517,789,149 | | | | | 2,207,664,693 | | | | | 2,725,453,842 | |
Other Assets and Liabilities, Net - (60.99%) | | | | (160,246,973 | ) | | | | (872,256,992 | ) | | | | (1,032,503,965 | ) |
| | | | | | | | | | | | | | | |
Net Assets - 100% | | | | 357,542,176 | | | | | 1,335,407,701 | | | | | 1,692,949,877 | |
| | | | | | | | | | | | | | | |
| « | All or a portion of this security is on loan. (See Note 2) |
| ± | Variable rate investments. |
| %% | Securities issued on a when-issued (TBA) basis. (See Note 2) |
| †† | Securities that may be resold to “qualified institutional buyers” under rule 144A or securities offered pursuant to section 4(2) of the Securities Act of 1933, as amended. |
| ^ | Zero coupon bond. Interest rate presented is yield to maturity. |
| # | Security pledged as collateral for futures transactions. (See Note 2) |
| (c) | Interest-only securities entitle holders to receive only the interest payments on the underlying mortgages. The principal amount shown is the notional amount of the underlying mortgages. Interest rate disclosed represents the coupon rate. |
| § | These securities are subject to a demand feature which reduces the effective maturity. |
| ~ | This Wells Fargo Advantage Fund invests cash balances that it retains for liquidity purposes in a Wells Fargo Advantage Money Market Fund. The Fund does not pay an investment advisory fee for such investments. |
| ‡ | Security of an affiliate of the Fund with a cost of $59,208,433. |
| * | Cost for federal income tax purposes is substantially the same as for financial reporting purposes. |
The accompanying notes are an integral part of these proforma financial statements.
| | |
| Proforma Statement of Assets and Liabilities - November 30, 2007 (Unaudited) | | Wells Fargo Advantage Funds |
| | | | | | | | | | | | | | | | |
| | | Intermediate
Government
Income Fund | | | Government
Securities
Fund | | | Proforma
Adjustments | | | Proforma
Combined | |
Assets | | | | | | | | | | | | | | | | |
Investments | | | | | | | | | | | | | | | | |
In securities, at market value | | $ | 345,071,255 | | | $ | 1,500,164,459 | | | | | | | $ | 1,845,235,714 | |
Collateral for securities loaned | | | 161,358,032 | | | | 659,586,774 | | | | | | | | 820,944,806 | |
Investments in affiliates | | | 11,359,862 | | | | 47,913,460 | | | | | | | | 59,273,322 | |
| | | | | | | | | | | | | | | | |
Total investments at market value (see cost below) | | | 517,789,149 | | | | 2,207,664,693 | | | | — | | | | 2,725,453,842 | |
| | | | | | | | | | | | | | | | |
Cash | | | 50,000 | | | | — | | | | | | | | 50,000 | |
Variation margin receivable on futures contracts | | | — | | | | 49,234 | | | | | | | | 49,234 | |
Receivable for Fund shares issued | | | 22,088 | | | | 4,335,932 | | | | | | | | 4,358,020 | |
Receivable for investments sold | | | 8,482 | | | | 20,286,381 | | | | | | | | 20,294,863 | |
Receivables for dividends and interest | | | 1,578,655 | | | | 11,531,287 | | | | | | | | 13,109,942 | |
| | | | | | | | | | | | | | | | |
Total assets | | | 519,448,374 | | | | 2,243,867,527 | | | | — | | | | 2,763,315,901 | |
| | | | | | | | | | | | | | | | |
| | | | |
Liabilities | | | | | | | | | | | | | | | | |
Payable for Fund shares redeemed | | | 103,383 | | | | 121,775 | | | | | | | | 225,158 | |
Payable for investments purchased | | | — | | | | 241,206,530 | | | | | | | | 241,206,530 | |
Dividends payable | | | — | | | | 5,863,342 | | | | | | | | 5,863,342 | |
Payable to investment advisor and affiliates | | | 162,672 | | | | 685,423 | | | | | | | | 848,095 | |
Payable for securities loaned | | | 161,518,436 | | | | 660,186,634 | | | | | | | | 821,705,070 | |
Accrued expenses and other liabilities | | | 121,707 | | | | 396,122 | | | | | | | | 517,829 | |
| | | | | | | | | | | | | | | | |
Total liabilities | | | 161,906,198 | | | | 908,459,826 | | | | — | | | | 1,070,366,024 | |
| | | | | | | | | | | | | | | | |
Total net assets | | $ | 357,542,176 | | | $ | 1,335,407,701 | | | $ | — | | | $ | 1,692,949,877 | |
| | | | | | | | | | | | | | | | |
| | | | |
NET ASSETS CONSIST OF | | | | | | | | | | | | | | | | |
Paid-in capital | | $ | 406,023,450 | | | $ | 1,341,229,863 | | | | | | | $ | 1,747,253,313 | |
Undistributed net investment income (loss) | | | (2,029,225 | ) | | | (963,640 | ) | | | | | | | (2,992,865 | ) |
Undistributed net realized gain (loss) on investments | | | (48,993,264 | ) | | | (18,462,416 | ) | | | | | | | (67,455,680 | ) |
Net unrealized appreciation (depreciation) of investments, foreign currencies and translation of assets and liabilities denominated in foreign currencies | | | 2,541,215 | | | | 13,467,564 | | | | | | | | 16,008,779 | |
Net unrealized appreciation (depreciation) of futures | | | — | | | | 136,330 | | | | | | | | 136,330 | |
| | | | | | | | | | | | | | | | |
Total net assets | | $ | 357,542,176 | | | $ | 1,335,407,701 | | | $ | — | | | $ | 1,692,949,877 | |
| | | | | | | | | | | | | | | | |
| | | | |
COMPUTATION OF NET ASSET VALUE AND OFFERING PRICE PER SHARE1 | | | | | | | | | | | | | | | | |
Net assets – Class A | | $ | 111,141,778 | | | | NA | | | $ | 62,812,925 | 3 | | $ | 173,954,703 | |
Shares outstanding – Class A | | | 10,313,192 | | | | NA | | | | 6,175,405 | | | | 16,488,597 | |
Net asset value per share – Class A | | $ | 10.78 | | | | NA | | | | | | | $ | 10.55 | |
Maximum offering price per share – Class A2 | | $ | 11.29 | | | | NA | | | | | | | $ | 11.05 | |
Net assets – Class B | | $ | 12,002,422 | | | | NA | | | | | | | $ | 12,002,422 | |
Shares outstanding – Class B | | | 1,115,335 | | | | NA | | | | 23,415 | 4 | | | 1,138,750 | |
Net asset value and offering price per share – Class B | | $ | 10.76 | | | | NA | | | | | | | $ | 10.54 | |
Net assets – Class C | | $ | 7,114,613 | | | $ | 1,586,879 | | | | | | | $ | 8,701,492 | |
Shares outstanding – Class C | | | 662,864 | | | | 150,489 | | | | 12,216 | 5 | | | 825,569 | |
Net asset value and offering price per share – Class C | | $ | 10.73 | | | $ | 10.54 | | | | | | | $ | 10.54 | |
Net assets – Administrator Class | | $ | 227,283,363 | | | $ | 148,059,359 | | | | | | | $ | 375,342,722 | |
Shares outstanding – Administrator Class | | | 21,101,726 | | | | 14,040,472 | | | | 435,311 | 6 | | | 35,577,509 | |
Net asset value and offering price per share – Administrator Class | | $ | 10.77 | | | $ | 10.55 | | | | | | | $ | 10.55 | |
Net assets – Advisor Class | | | NA | | | $ | 62,812,925 | | | $ | (62,812,925 | )3 | | $ | — | |
Shares outstanding – Advisor Class | | | NA | | | | 5,955,605 | | | | (5,955,605 | ) | | | — | |
Net asset value and offering price per share – Advisor Class | | | NA | | | $ | 10.55 | | | | | | | $ | — | |
Net assets – Institutional Class | | | NA | | | $ | 260,042,307 | | | | | | | $ | 260,042,307 | |
Shares outstanding – Institutional Class | | | NA | | | | 24,675,414 | | | | | | | | 24,675,414 | |
Net asset value and offering price per share – Institutional Class | | | NA | | | $ | 10.54 | | | | | | | $ | 10.54 | |
Net assets – Investor Class | | | NA | | | $ | 862,906,231 | | | | | | | $ | 862,906,231 | |
Shares outstanding – Investor Class | | | NA | | | | 81,768,299 | | | | | | | | 81,768,299 | |
Net asset value and offering price per share – Investor Class | | | NA | | | $ | 10.55 | | | | | | | $ | 10.55 | |
| | | | | | | | | | | | | | | | |
| | | | |
Investments at cost | | $ | 515,247,934 | | | $ | 2,194,197,129 | | | $ | — | | | $ | 2,709,445,063 | |
| | | | | | | | | | | | | | | | |
Securities on loan, at market value | | $ | 158,740,345 | | | $ | 647,506,818 | | | $ | — | | | $ | 806,247,163 | |
| | | | | | | | | | | | | | | | |
1 | Each Fund has an unlimited number of authorized shares. |
2 | Maximum offering price is computed as 100/95.50 of net asset value. On investment of $50,000 or more, the offering price is reduced. |
3 | Advisor Class shares of Government Securities Fund are exchanged for new A shares of Government Securities Fund, to be established prior to the merger, in an amount equal to the total value of the Government Securities Fund Advisor shares divided by the current per share value of the new A shares (presumed to equal the Government Securities Fund Advisor share value in this proforma). Class A shares of Intermediate Government Income Fund are exchanged for new A shares of Government Securities Fund in an amount equal to the total value of the Intermediate Government Income Fund A shares divided by the current per share value of the Government Securities Fund A shares. |
4 | Class B shares of Intermediate Government Income Fund are exchanged for new B shares of Government Securities Fund, to be established upon consummation of the merger, in an amount equal to the total value of the Intermediate Government Income Fund B shares divided by current per share value of the new Government Securities Fund B shares (presumed to equal the Government Securities Fund C share value in this proforma). |
5 | Class C shares of Intermediate Government Income Fund are exchanged for Class C shares of Government Securities Fund in an amount equal to the total value of the Intermediate Government Income Fund C shares divided by the current per share value of the Government Securities Fund C shares. |
6 | Administrator Class shares (“Adm shares”) of Intermediate Government Income Fund are exchanged for Adm shares of Government Securities Fund in an amount equal to the total value of the Intermediate Government Income Fund Adm shares divided by the current per share value of the Government Securities Fund Adm shares. |
The accompanying notes are an integral part of these proforma financial statements.
| | |
| Proforma Statement of Operations - For the Twelve Months Ended November 30, 2007 (Unaudited) | | Wells Fargo Advantage Funds |
| | | | | | | | | | | | | | | | |
| | | Intermediate
Government
Income Fund | | | Government
Securities
Fund | | | Proforma
Adjustments | | | Proforma
Combined | |
Investment Income | | | | | | | | | | | | | | | | |
Interest | | $ | 21,216,480 | | | $ | 61,869,141 | | | | | | | $ | 83,085,621 | |
Income from affiliated securities | | | 65,623 | | | | 1,367,379 | | | | | | | | 1,433,002 | |
Securities lending income, net | | | 194,717 | | | | 795,488 | | | | | | | | 990,205 | |
| | | | | | | | | | | | | | | | |
Total investment income | | | 21,476,820 | | | | 64,032,008 | | | | — | | | | 85,508,828 | |
| | | | | | | | | | | | | | | | |
| | | | |
Expenses | | | | | | | | | | | | | | | | |
Advisory fees | | | 1,961,939 | | | | 4,748,790 | | | | (458,075 | )1 | | | 6,252,654 | |
Administration fees | | | | | | | | | | | | | | | | |
Fund Level | | | 218,823 | | | | 570,817 | | | | (3,547 | )1 | | | 786,093 | |
Class A | | | 319,662 | | | | — | | | | 167,690 | 1 | | | 487,352 | |
Class B | | | 40,951 | | | | — | | | | (134 | )1 | | | 40,817 | |
Class C | | | 21,650 | | | | 3,921 | | | | (100 | )1 | | | 25,471 | |
Administrator Class | | | 301,124 | | | | 118,388 | | | | (1,547 | )1 | | | 417,965 | |
Advisor Class | | | — | | | | 169,694 | | | | (169,694 | )1 | | | — | |
Institutional Class | | | — | | | | 150,471 | | | | | | | | 150,471 | |
Investor Class | | | — | | | | 3,406,338 | | | | | | | | 3,406,338 | |
Custody fees | | | 87,530 | | | | 228,327 | | | | | | | | 315,857 | |
Shareholder servicing fees | | | 1,094,115 | | | | 2,383,863 | | | | 143,392 | 1 | | | 3,621,370 | |
Accounting fees | | | 56,675 | | | | 118,618 | | | | (11,128 | )1 | | | 164,165 | |
Distribution fees | | | | | | | | | | | | | | | | |
Class B | | | 109,689 | | | | — | | | | | | | | 109,689 | |
Class C | | | 57,994 | | | | 10,501 | | | | | | | | 68,495 | |
Professional fees | | | 30,086 | | | | 34,172 | | | | (16,965 | )2 | | | 47,293 | |
Registration fees | | | 43,429 | | | | 64,172 | | | | (18,788 | )2 | | | 88,813 | |
Shareholder reports | | | 80,504 | | | | 213,643 | | | | (73,537 | )2 | | | 220,610 | |
Trustees’ fees | | | 9,134 | | | | 9,134 | | | | (5,627 | )2 | | | 12,641 | |
Other fees and expenses | | | 15,506 | | | | 23,006 | | | | (6,672 | )2 | | | 31,840 | |
| | | | | | | | | | | | | �� | | | |
Total expenses | | | 4,448,811 | | | | 12,253,855 | | | | (454,732 | ) | | | 16,247,934 | |
| | | | | | | | | | | | | | | | |
| | | | |
Less | | | | | | | | | | | | | | | | |
Waived fees and reimbursed expenses | | | (875,290 | ) | | | (2,608,120 | ) | | | 326,085 | | | | (3,157,325 | ) |
Net expenses | | | 3,573,521 | | | | 9,645,735 | | | | (128,647 | ) | | | 13,090,609 | |
| | | | | | | | | | | | | | | | |
Net investment income (loss) | | | 17,903,299 | | | | 54,386,273 | | | | 128,647 | | | | 72,418,219 | |
| | | | | | | | | | | | | | | | |
| | | | |
REALIZED AND UNREALIZED GAIN (LOSS) ON INVESTMENTS | | | | | | | | | | | | | | | | |
| | | | |
Net realized gain (loss) from | | | | | | | | | | | | | | | | |
Securities, foreign currencies and foreign currency translation | | | (815,322 | ) | | | 3,675,981 | | | | | | | | 2,860,659 | |
Futures transactions | | | 203,757 | | | | 416,353 | | | | | | | | 620,110 | |
Options, swap agreements and short sale transactions | | | — | | | | 293,117 | | | | | | | | 293,117 | |
| | | | | | | | | | | | | | | | |
Net realized gain (loss) from Investments | | | (611,565 | ) | | | 4,385,451 | | | | — | | | | 3,773,886 | |
| | | | | | | | | | | | | | | | |
| | | | |
Net change in unrealized appreciation (depreciation) of | | | | | | | | | | | | | | | | |
Securities, foreign currencies and foreign currency translation | | | 3,866,177 | | | | 15,144,917 | | | | | | | | 19,011,094 | |
Futures transactions | | | (194,633 | ) | | | (428,065 | ) | | | | | | | (622,698 | ) |
| | | | | | | | | | | | | | | | |
| | | | |
Net change in unrealized appreciation (depreciation) of investments | | | 3,671,544 | | | | 14,716,852 | | | | — | | | | 18,388,396 | |
| | | | | | | | | | | | | | | | |
Net realized and unrealized gain (loss) on investments | | | 3,059,979 | | | | 19,102,303 | | | | — | | | | 22,162,282 | |
| | | | | | | | | | | | | | | | |
Net increase (decrease) in net assets resulting from operations | | $ | 20,963,278 | | | $ | 73,488,576 | | | $ | 128,647 | | | $ | 94,580,501 | |
| | | | | | | | | | | | | | | | |
1 | Based on contractual agreements of the surviving fund. |
2 | Estimated cost increases (savings) as a result of merging the funds. |
The accompanying notes are an integral part of these proforma financial statements.
| | |
| Proforma Portfolio of Investments - December 31, 2007 (Unaudited) | | Wells Fargo Advantage Funds |
| | | | | | | | | | | | | | | |
| | | National Tax-Free Fund | | Municipal Bond Fund | | Pro Forma Combined |
| | | Shares or
Principal
Amount | | Value
(Note 2) | | Shares or
Principal
Amount | | Value
(Note 2) | | Shares or
Principal
Amount | | Value
(Note 2) |
Municipal Bonds and Notes - 97.18% | | | | | | | | | | | | | | | |
Alabama - 0.31% | | | | | | | | | | | | | | | |
Alabama Drinking Water Finance Revolving Federal Loan Series A (Water Revenue, AMBAC Insured), 4.85,% , Due 8/15/2022 | | 800,000 | | $ | 805,512 | | | | | | | 800,000 | | $ | 805,512 |
Alabama HFA East Lake (MFHR, GNMA), 4.80%, Due 6/20/2032 | | | | | | | 1,310,000 | | $ | 1,224,496 | | 1,310,000 | | | 1,224,496 |
Total Alabama | | | | | 805,512 | | | | | 1,224,496 | | | | | 2,030,008 |
Alaska - 0.13% | | | | | | | | | | | | | | | |
Northern Tobacco Securitization Corporation AK Tobacco Settlement Revenue Asset-Backed Prerefunded (Excise Tax Revenue), 6.20%, Due 6/1/2022§ | | | | | | | 783,000 | | | 819,088 | | 783,000 | | | 819,088 |
Total Alaska | | | | | — | | | | | 819,088 | | | | | 819,088 |
Arizona - 4.99% | | | | | | | | | | | | | | | |
Arizona Health Facilities Authority Phoenix Children’s Hospital Series A, 5.30%, Due 11/15/2008 | | | | | | | 25,000 | | | 25,462 | | 25,000 | | | 25,462 |
Arizona Health Facilities Authority Phoenix Children’s Hospital Series A Prerefunded, 5.50%, Due 11/15/2010§ | | | | | | | 30,000 | | | 31,254 | | 30,000 | | | 31,254 |
Arizona Health Facilities Authority Phoenix Children’s Hospital Series A Prerefunded, 6.13%, Due 11/15/2022§ | | | | | | | 195,000 | | | 205,349 | | 195,000 | | | 205,349 |
Arizona Health Facilities Authority Phoenix Children’s Hospital Series A Prerefunded, 6.25%, Due 11/15/2029§ | | | | | | | 100,000 | | | 105,533 | | 100,000 | | | 105,533 |
Arizona Health Facilities Authority Phoenix Children’s Hospital Series A Prerefunded, 5.38%, Due 2/15/2018§ | | | | | | | 290,000 | | | 314,485 | | 290,000 | | | 314,485 |
| | | | | | |
Arizona Health Facilities Authority Phoenix Children’s Hospital Series A Prerefunded, 5.88%, Due 2/15/2027§ | | | | | | | 85,000 | | | 93,799 | | 85,000 | | | 93,799 |
| | | | | | |
Arizona Health Facilities Authority Phoenix Children’s Hospital Series B (Hospital Revenue), 4.27%, Due 2/1/2042§± | | | | | | | 4,045,000 | | | 3,994,438 | | 4,045,000 | | | 3,994,438 |
| | | | | | |
Arizona HFA Mortgage-Backed Securities Program Series B (Housing Revenue, FHLMC), 5.15%, Due 12/1/2035 | | 1,000,000 | | | 1,033,730 | | 1,500,000 | | | 1,550,595 | | 2,500,000 | | | 2,584,325 |
| | | | | | |
Chandler AZ (Fuel Sales Tax Revenue), 6.00%, Due 7/1/2011 | | 500,000 | | | 546,355 | | | | | | | 500,000 | | | 546,355 |
Estrella AZ Mountain Ranch Community Facilities District (Property Tax Revenue), 5.90%, Due 7/15/2022 | | | | | | | 1,030,000 | | | 1,030,711 | | 1,030,000 | | | 1,030,711 |
Estrella AZ Mountain Ranch Community Facilities District Series B (Property Tax Revenue), 6.20%, Due 7/15/2032 | | 1,000,000 | | | 995,720 | | | | | | | 1,000,000 | | | 995,720 |
Gilbert AZ Water Resource Municipal Property Corporation (Sewer Revenue), 4.90%, Due 4/1/2019 | | | | | | | 2,500,000 | | | 2,507,300 | | 2,500,000 | | | 2,507,300 |
Navajo County AZ Municipal Property Corporation (Lease Revenue, ACA Insured), 5.63%, Due 7/1/2010 | | 215,000 | | | 217,894 | | | | | | | 215,000 | | | 217,894 |
Phoenix AZ & Pima County AZ IDA Series 2007-1 (SFHR, GNMA Insured), 5.25%, Due 8/1/2038 | | 2,491,394 | | | 2,519,048 | | 2,989,673 | | | 3,022,858 | | 5,481,067 | | | 5,541,906 |
| | | | | | |
Phoenix AZ IDA Capital Mall LLC Project Prerefunded (Lease Revenue, AMBAC Insured), 5.38%, Due 9/15/2022§ | | 250,000 | | | 264,505 | | | | | | | 250,000 | | | 264,505 |
Phoenix AZ IDA Statewide Series C (Housing Revenue, GNMA Insured), 5.30%, Due 4/1/2020 | | 35,000 | | | 35,394 | | | | | | | 35,000 | | | 35,394 |
Pima County AZ IDA Acclaim Charter School Project (Educational Facilities Revenue), 5.60%, Due 12/1/2016 | | 400,000 | | | 392,236 | | 510,000 | | | 500,101 | | 910,000 | | | 892,337 |
Pima County AZ IDA Global Water Resources LLC Project (Water & Sewer Revenue), 5.45%, Due 12/1/2017 | | 810,000 | | | 711,577 | | 500,000 | | | 468,455 | | 1,310,000 | | | 1,180,032 |
Pima County AZ IDA Global Water Resources LLC Project (Water & Sewer Revenue), 5.75%, Due 12/1/2032 | | 225,000 | | | 219,175 | | 810,000 | | | 711,577 | | 1,035,000 | | | 930,752 |
Pima County AZ IDA Global Water Resources LLC Project (Water & Wastewater Authority Revenue), 6.55%, Due 12/1/2037 | | 1,400,000 | | | 1,530,522 | | 775,000 | | | 754,935 | | 2,175,000 | | | 2,285,457 |
Pinal County AZ USD #43 (Property Tax Revenue, First Security Bank LOC), 5.00%, Due 7/1/2025 | | 300,000 | | | 318,168 | | | | | | | 300,000 | | | 318,168 |
Scottsdale Waterfront Commerical Community Facilities District AZ (Property Tax Revenue), 6.00%, Due 7/15/2027 | | | | | | | 265,000 | | | 263,786 | | 265,000 | | | 263,786 |
Scottsdale Waterfront Commerical Community Facilities District AZ (Property Tax Revenue), 6.05%, Due 7/15/2032 | | | | | | | 310,000 | | | 306,243 | | 310,000 | | | 306,243 |
Surprise AZ Municipal Property Corporation (Water & Wastewater Authority Revenue), 4.70%, Due 4/1/2022 | | 1,100,000 | | | 1,052,513 | | 1,600,000 | | | 1,530,928 | | 2,700,000 | | | 2,583,441 |
Surprise AZ Municipal Property Corporation (Water & Wastewater Authority Revenue), 4.90%, Due 4/1/2032 | | 725,000 | | | 663,803 | | 725,000 | | | 663,803 | | 1,450,000 | | | 1,327,606 |
Tucson AZ Series 1994C (Fuel Sales Tax Revenue, FGIC Insured), 7.00%, Due 7/1/2012 | | 500,000 | | | 572,055 | | | | | | | 500,000 | | | 572,055 |
Verrado AZ Community Facilities District #1 (Other Revenue), 6.00%, Due 7/15/2013 | | | | | | | 3,425,000 | | | 3,585,461 | | 3,425,000 | | | 3,585,461 |
Total Arizona | | | | | 11,072,695 | | | | | 21,667,073 | | | | | 32,739,768 |
Arkansas - 1.20% | | | | | | | | | | | | | | | |
Cabot AR Sales & Use Tax (Sales Tax Revenue, XLCA Company Insured), 4.60%, Due 12/1/2025 | | 2,000,000 | | | 2,002,560 | | 2,060,000 | | | 2,062,637 | | 4,060,000 | | | 4,065,197 |
| | |
| Proforma Portfolio of Investments - December 31, 2007 (Unaudited) | | Wells Fargo Advantage Funds |
| | | | | | | | | | | | |
| | | National Tax-Free Fund | | Municipal Bond Fund | | Pro Forma Combined |
| | | Shares or
Principal
Amount | | Value
(Note 2) | | Shares or
Principal
Amount | | Value
(Note 2) | | Shares or
Principal
Amount | | Value
(Note 2) |
Howard County AR (Sales Tax Revenue, Radian Insured), 4.25%, Due 6/1/2047 | | 1,220,000 | | 1,023,043 | | 3,355,000 | | 2,813,369 | | 4,575,000 | | 3,836,412 |
Total Arkansas | | | | 3,025,603 | | | | 4,876,006 | | | | 7,901,609 |
California - 12.49% | | | | | | | | | | | | |
| | | | | | |
Access to Loans for Learning Student Loan Corporation Student Loan Program Series D2 (College & University Revenue, Guaranteed Student Loans), 7.85%, Due 7/1/2025 | | 2,500,000 | | 2,596,400 | | | | | | 2,500,000 | | 2,596,400 |
Apple Valley CA Redevelopment Agency Project Area #2 (Other Revenue, AMBAC Insured), 5.00%, Due 6/1/2037 | | 2,850,000 | | 2,914,353 | | | | | | 2,850,000 | | 2,914,353 |
California Infrastructure & Economic Development Bank Series A Capital Appreciation (Economic Development Revenue, ACA Insured), 6.80%, Due12/1/2017^ | | | | | | 1,590,000 | | 819,232 | | 1,590,000 | | 819,232 |
California Infrastructure & Economic Development Bank Capital Appreciation Series A (Other Revenue, ACA Insured), 7.19%, Due 12/1/2022^ | | 350,000 | | 122,028 | | 585,000 | | 203,960 | | 935,000 | | 325,988 |
California Statewide Community Development Authority Community Facilities District 2007-1-Orinda (Special Tax Revenue), 6.00%, Due 9/1/2037 | | | | | | 1,000,000 | | 990,320 | | 1,000,000 | | 990,320 |
California Statewide CDA Retirement Housing Foundation, 5.50%, Due 12/1/2028§± | | 1,850,000 | | 1,850,000 | | 2,900,000 | | 2,900,000 | | 4,750,000 | | 4,750,000 |
California Statewide CDA Eskaton (ACA Insured), 2.50%, Due 5/15/2029§± | | 1,650,000 | | 1,650,000 | | | | | | 1,650,000 | | 1,650,000 |
California Statewide CDA Eskaton Properties Incorporated Convertible (HCFR LOC), 2.50%, Due 5/15/2029§± | | 3,675,000 | | 3,816,635 | | 3,000,000 | | 3,000,000 | | 6,675,000 | | 6,816,635 |
Central Unified School District (Lease Revenue, First Security Bank LOC), 5.00%, Due 8/1/2026 | | 265,000 | | 252,741 | | | | | | 265,000 | | 252,741 |
Daly City CA Housing Development Finance Agency (Housing Revenue), 5.00%, Due 12/15/2037 | | | | | | 420,000 | | 400,571 | | 420,000 | | 400,571 |
| | | | | | |
Dinuba CA Financing Authority (Sewer Revenue), 5.38%, Due 9/1/2038 | | 500,000 | | 450,580 | | 1,500,000 | | 1,351,740 | | 2,000,000 | | 1,802,320 |
Dinuba CA Redevelopment Agency Merged City Redevelopment Project #2 (Other Revenue), 4.45%, Due 10/1/2011 | | | | | | 1,900,000 | | 1,902,717 | | 1,900,000 | | 1,902,717 |
| | | | | | |
El Centro CA Financing Authority Series A (Water Revenue, First Security Bank LOC), 5.00%, Due 10/1/2026 | | 445,000 | | 466,494 | | | | | | 445,000 | | 466,494 |
Fillmore CA PFA Fillmore Water Recycling Financing (Other Revenue, CIFG Insured), 5.25%, Due 5/1/2030 | | 3,900,000 | | 4,285,866 | | | | | | 3,900,000 | | 4,285,866 |
Foothill CA Eastern Transportation Corridor Agency (Toll Road Revenue), 5.25%, Due 7/15/2010 | | 500,000 | | 496,330 | | 1,900,000 | | 1,886,054 | | 2,400,000 | | 2,382,384 |
Hesperia USD CA Capital Improvement Project (Lease Revenue, AMBAC Insured), 5.00%, Due 2/1/2031 | | 680,000 | | 695,422 | | | | | | 680,000 | | 695,422 |
Imperial CA Redevelopment Agency Imperial Redevelopment Project (Special Tax Revenue, AMBAC Insured), 5.00%, Due 12/1/2032 | | 1,810,000 | | 1,833,946 | | 2,700,000 | | 2,740,176 | | 4,510,000 | | 4,574,122 |
Inland CA Empire Tobacco Securitization Authority Series C2 (Other Revenue), 6.95%, Due 6/1/2047^ | | 2,000,000 | | 135,360 | | 3,000,000 | | 203,040 | | 5,000,000 | | 338,400 |
Lodi CA Series A (Sewer Revenue, First Security Bank LOC), 5.00%, Due 10/1/2037 | | 800,000 | | 818,544 | | | | | | 800,000 | | 818,544 |
| | | | | | |
Los Angeles CA HFA Peppermill I & II, 5.13%, Due 4/1/2028 | | | | | | 2,090,000 | | 2,078,881 | | 2,090,000 | | 2,078,881 |
| | | | | | |
Madera County CA Valley Children’s Hospital (HCFR LOC), 6.50%, Due 3/15/2015 | | | | | | 1,000,000 | | 1,133,300 | | 1,000,000 | | 1,133,300 |
Metropolitan Water District of Southern CA Waterworks Series A6 (Water Revenue), 7.93%, Due 8/10/2018§±†† | | 6,900,000 | | 8,886,924 | | | | | | 6,900,000 | | 8,886,924 |
Pico Rivera CA Water Authority Series A (Water Revenue), 5.75%, Due 12/1/2012 | | 570,000 | | 592,179 | | | | | | 570,000 | | 592,179 |
Port Hueneme CA Redevelopment Agency Central Community Project (Tax Incremental Revenue LOC), 5.50%, Due 5/1/2014 | | | | | | 1,800,000 | | 1,940,418 | | 1,800,000 | | 1,940,418 |
Rancho Cucamonga CA Redevelopment Agency Rancho Redevelopment-Housing Set Aside-A (Housing Revenue, MBIA Insured), 5.00%, Due 9/1/2034 | | 2,000,000 | | 2,044,960 | | 1,400,000 | | 1,431,472 | | 3,400,000 | | 3,476,432 |
San Bernardino County CA Financing Authority CT Housing Facilities Project (Other Revenue, MBIA Insured), 5.50%, Due 6/1/2037 | | 3,150,000 | | 3,364,515 | | 4,785,000 | | 5,110,859 | | 7,935,000 | | 8,475,374 |
| | | | | | |
San Francisco CA Airport Improvement United Airlines Incorporated Project (Airport Revenue), 8.00%, Due 7/1/2013 | | 165,000 | | 186,584 | | | | | | 165,000 | | 186,584 |
Santa Rosa CA Rancheria Tachi Yokut Tribe Enterprise (Other Revenue), 5.50%, Due 3/1/2008 | | | | | | 1,400,000 | | 1,400,994 | | 1,400,000 | | 1,400,994 |
Santa Rosa CA Rancheria Tachi Yokut Tribe Enterprise (Other Revenue), 4.50%, Due 3/1/2011 | | 900,000 | | 897,588 | | | | | | 900,000 | | 897,588 |
| | |
| Proforma Portfolio of Investments - December 31, 2007 (Unaudited) | | Wells Fargo Advantage Funds |
| | | | | | | | | | | | |
| | | National Tax-Free Fund | | Municipal Bond Fund | | Pro Forma Combined |
| | | Shares or
Principal
Amount | | Value
(Note 2) | | Shares or
Principal
Amount | | Value
(Note 2) | | Shares or
Principal
Amount | | Value
(Note 2) |
Southern California Logistics Airport Authority Logistics Airport (Airport Revenue), 6.00%, Due 12/1/2032 | | 2,035,000 | | 2,016,685 | | | | | | 2,035,000 | | 2,016,685 |
Southern California Logistics Airport Authority (Airport Revenue), 6.00%, Due 12/1/2037 | | 265,000 | | 260,286 | | 3,535,000 | | 3,472,112 | | 3,800,000 | | 3,732,398 |
Student Education Loan Marketing Corporation CA Series IV D1 (HEFAR, Guaranteed Student Loans), 5.88%, Due 1/1/2018 | | 4,975,000 | | 4,983,557 | | | | | | 4,975,000 | | 4,983,557 |
Tehachapi CA Redevelopment Agency Tehachapi Revedevepment Project (Tax Incremental Revenue, Radian Insured), 5.35%, Due 12/1/2037 | | 655,000 | | 639,522 | | 1,000,000 | | 976,370 | | 1,655,000 | | 1,615,892 |
Travis CA USD (Lease Revenue, MBIA Insured), 5.00%, Due 9/1/2027 | | 620,000 | | 638,650 | | | | | | 620,000 | | 638,650 |
West Sacramento CA Financing Authority Series A (Tax Revenue, XLCA Insured), 5.00%, Due 9/1/2026 | | 1,000,000 | | 1,056,130 | | | | | | 1,000,000 | | 1,056,130 |
| | | | | | |
Total California | | | | 47,952,279 | | | | 33,942,216 | | | | 81,894,495 |
Colorado - 2.44% | | | | | | | | | | | | |
Colorado ECFA Charter School Carbon Valley Academy (Lease Revenue), 5.63%, Due 12/1/2036 | | | | | | 1,170,000 | | 1,058,967 | | 1,170,000 | | 1,058,967 |
Colorado ECFA Union Colony Charter School Project (Educational Facilities Revenue), 5.75%, Due 12/1/2037†† | | 500,000 | | 477,355 | | 590,000 | | 563,279 | | 1,090,000 | | 1,040,634 |
Colorado ECFA Charter School Core Knowledge Project Prerefunded (Lease Revenue), 7.00%, Due 11/1/2029§ | | 200,000 | | 213,822 | | | | | | 200,000 | | 213,822 |
Colorado ECFA Cerebral Palsy Project Series A (Other Revenue), 6.25%, Due 5/1/2036 | | | | | | 1,550,000 | | 1,550,326 | | 1,550,000 | | 1,550,326 |
Colorado ECFA Charter School Banning Lewis (Other Revenue), 6.13%, Due 12/15/2035†† | | 650,000 | | 641,836 | | 850,000 | | 839,324 | | 1,500,000 | | 1,481,160 |
Colorado ECFA Charter School Monument Academy Project (Other Revenue), 5.50%, Due 10/1/2017 | | | | | | 500,000 | | 492,185 | | 500,000 | | 492,185 |
Colorado HFA Series B2 (Housing Revenue), 7.10%, Due 4/1/2017 | | 385,000 | | 397,670 | | | | | | 385,000 | | 397,670 |
Colorado HFA Series D2 (SFHR), 6.90%, Due 4/1/2029 | | 570,000 | | 594,459 | | | | | | 570,000 | | 594,459 |
Colorado HFA Series A2 (Housing Revenue), 7.15%, Due 11/1/2014 | | 20,000 | | 20,325 | | | | | | 20,000 | | 20,325 |
Colorado HFA Series B3 (Housing Revenue, First Security Bank LOC), 6.70%, Due 8/1/2017 | | 1,105,000 | | 1,152,062 | | | | | | 1,105,000 | | 1,152,062 |
Colorado HFA Series A2 (SFHR, MBIA Insured), 6.50%, Due 8/1/2031 | | 810,000 | | 820,862 | | | | | | 810,000 | | 820,862 |
Denver City & County CO The Boston Lofts Project Series A (Housing Revenue, FHA Insured), 5.75%, Due 10/1/2027 | | 500,000 | | 503,665 | | | | | | 500,000 | | 503,665 |
E-470 Public Highway Authority Capital Appreciation Senior Lien Series B (Toll Road Revenue LOC), 4.24%, Due 9/1/2016^ | | | | | | 5,000,000 | | 3,475,750 | | 5,000,000 | | 3,475,750 |
Eagle County CO Airport Terminal Corporate Project Series A (Airport Revenue), 5.15%, Due 5/1/2017 | | 690,000 | | 666,395 | | 800,000 | | 772,632 | | 1,490,000 | | 1,439,027 |
Eagle County CO Airport Terminal Corporation Airport Terminal Improvement Project Series B (Airport Revenue), 5.05%, Due 5/1/2015 | | | | | | 500,000 | | 484,015 | | 500,000 | | 484,015 |
Eagle County CO Airport Terminal Corporation Airport Terminal Improvement Project Series B (Airport Revenue), 5.25%, Due 5/1/2020 | | | | | | 890,000 | | 844,521 | | 890,000 | | 844,521 |
Summit County CO Keystone Resorts Management Project (Other Revenue), 7.38%, Due 9/1/2010 | | 420,000 | | 457,708 | | | | | | 420,000 | | 457,708 |
Total Colorado | | | | 5,946,159 | | | | 10,080,999 | | | | 16,027,158 |
District of Columbia - 0.53% | | | | | | | | | | | | |
District of Columbia Capital Appreciation Mandarin Oriental (Tax Incremental Revenue, First Security Bank LOC), 4.12%, Due 7/1/2015^# | | 3,850,000 | | 2,835,487 | | | | | | 3,850,000 | | 2,835,487 |
| | | | | | |
District of Columbia Tobacco Settlement Financing Corporation, 5.38%, Due 5/15/2010 | | | | | | 410,000 | | 420,840 | | 410,000 | | 420,840 |
District of Columbia Tobacco Settlement Financing Corporation, 5.70%, Due 5/15/2012 | | | | | | 205,000 | | 214,436 | | 205,000 | | 214,436 |
| | | | | | |
Total District of Columbia | | | | 2,835,487 | | | | 635,276 | | | | 3,470,763 |
Florida - 7.05% | | | | | | | | | | | | |
Ave Maria Stewardship Community Development District FL (Other Revenue), 4.80%, Due 11/1/2012 | | 1,275,000 | | 1,172,312 | | 1,875,000 | | 1,723,988 | | 3,150,000 | | 2,896,300 |
Brevard County FL Retirement Housing Funding (HCFR LOC), 5.50%, Due 12/1/2028§± | | 1,950,000 | | 1,950,000 | | 1,050,000 | | 1,050,000 | | 3,000,000 | | 3,000,000 |
Charlotte County FL IDA Bond Anticipation Notes (Other Revenue), 5.75%, Due 10/1/2008 | | 1,300,000 | | 1,292,733 | | 1,980,000 | | 1,968,932 | | 3,280,000 | | 3,261,665 |
Clay County FL Housing Finance Authority Series A2 (Housing Revenue, FNMA), 4.85%, Due 4/1/2028 | | 2,400,000 | | 2,424,432 | | 3,700,000 | | 3,737,666 | | 6,100,000 | | 6,162,098 |
Connerton West Community Development District FL Series B (Other Revenue), 5.13%, Due 5/1/2016 | | 1,350,000 | | 1,209,398 | | 2,125,000 | | 1,903,681 | | 3,475,000 | | 3,113,079 |
| | |
| Proforma Portfolio of Investments - December 31, 2007 (Unaudited) | | Wells Fargo Advantage Funds |
| | | | | | | | | | | | |
| | | National Tax-Free Fund | | Municipal Bond Fund | | Pro Forma Combined |
| | | Shares or
Principal
Amount | | Value
(Note 2) | | Shares or
Principal
Amount | | Value
(Note 2) | | Shares or
Principal
Amount | | Value
(Note 2) |
Florida Development Finance Corporation Learning Gate Community School Project Series A (Educational Facilities Revenue), 6.00%, Due 2/15/2037 | | 600,000 | | 589,500 | | 900,000 | | 884,250 | | 1,500,000 | | 1,473,750 |
Florida Glen Oaks Apartments Project (Housing Revenue, FNMA Insured), 5.90%, Due 2/1/2030 | | 500,000 | | 505,150 | | | | | | 500,000 | | 505,150 |
Florida Housing Financing Corporation Homeowner Mortgage Series 4 (Housing Revenue, GNMA Insured), 4.70%, Due 1/1/2015 | | 500,000 | | 512,585 | | | | | | 500,000 | | 512,585 |
| | | | | | |
Florida Housing Finance Corporation Homeowner Mortgage Series 4 (Housing Revenue, GNMA), 4.70%, Due 7/1/2015 | | | | | | 1,015,000 | | 1,042,101 | | 1,015,000 | | 1,042,101 |
Fountainbleau Lakes FL Community Development District Series B (Special Tax Revenue), 6.00%, Due 5/1/2015 | | 600,000 | | 569,262 | | 900,000 | | 853,893 | | 1,500,000 | | 1,423,155 |
Gulf Breeze FL Miami Beach Local Government Series B (Other Revenue LOC), 4.75%, Due 12/1/2015 | | | | | | 265,000 | | 277,161 | | 265,000 | | 277,161 |
Jacksonville FL Housing Finance Authority AMT Series A-2 (Housing Revenue, Government National Mortgage Association), 5.00%, Due 4/1/2030 | | 2,515,000 | | 2,574,731 | | 3,775,000 | | 3,864,656 | | 6,290,000 | | 6,439,387 |
Lee County FL (Solid Waste Revenue, MBIA Insured), 5.63%, Due 10/1/2013 | | | | | | 2,400,000 | | 2,548,560 | | 2,400,000 | | 2,548,560 |
Miami Dade County FL Industrial Development Authority Airis Miami II LLC Project (IDR, AMBAC Insured), 6.00%, Due 10/15/2025 | | | | | | 1,000,000 | | 1,042,210 | | 1,000,000 | | 1,042,210 |
Orlando FL Housing Authority West Oaks Apartments Projects Puttable (Housing Revenue, FNMA), 5.05%, Due 8/1/2033§ | | | | | | 3,215,000 | | 3,390,571 | | 3,215,000 | | 3,390,571 |
Palm Beach County FL Series A (Housing Revenue, GNMA Insured), 4.85%, Due 4/1/2032 | | 1,835,000 | | 1,843,955 | | | | | | 1,835,000 | | 1,843,955 |
Seminole Indian Tribe of Florida Series A (GO—States, Territories), 5.75%, Due 10/1/2022†† | | | | | | 3,800,000 | | 3,802,698 | | 3,800,000 | | 3,802,698 |
Volusia County FL IDA (HCFR LOC, ACA Insured), 5.50%, Due 12/1/2028§± | | 2,350,000 | | 2,350,000 | | 1,150,000 | | 1,150,000 | | 3,500,000 | | 3,500,000 |
Total Florida | | | | 16,994,058 | | | | 29,240,367 | | | | 46,234,425 |
Georgia - 2.35% | | | | | | | | | | | | |
Atlanta GA Series A Prerefunded (Airport Revenue, FGIC Insured), 5.75%, Due 1/1/2020§ | | 1,000,000 | | 1,051,040 | | 4,940,000 | | 5,780,245 | | 5,940,000 | | 6,831,285 |
East Point GA Housing Authority Bond Laurel Eidge Washington Road Apartments, 5.00%, Due 10/1/2032§± | | | | | | 2,135,000 | | 2,094,093 | | 2,135,000 | | 2,094,093 |
| | | | | | |
Forsyth County GA Hospital Authority Georgia Baptist Health Care System Project (HCFR), 6.38%, Due 10/1/2028 | | | | | | 465,000 | | 564,319 | | 465,000 | | 564,319 |
| | | | | | |
Fulton County GA Concorde Place Apartments Project Series C Prerefunded (Housing Revenue), 6.90%, Due 7/1/2008§ | | 500,000 | | 509,090 | | | | | | 500,000 | | 509,090 |
Georgia State Series B (Other Revenue), 6.25%, Due 3/1/2011 | | | | | | 5,000 | | 5,463 | | 5,000 | | 5,463 |
Georgia Municipal Electric Authority Power Revenue Prerefunded Series Y (Electric Revenue LOC, MBIA Insured), 6.50%, Due 1/1/2017§ | | | | | | 5,000 | | 5,829 | | 5,000 | | 5,829 |
| | | | | | |
Georgia Municipal Electric Authority Power Revenue Series Y (Electric Revenue LOC, MBIA Insured), 6.50%, Due 1/1/2017 | | | | | | 450,000 | | 520,214 | | 450,000 | | 520,214 |
Irwin County GA Municipal Corrections Project Series A (Lease Revenue), 8.00%, Due 8/1/2037 | | 650,000 | | 651,872 | | 1,000,000 | | 1,002,880 | | 1,650,000 | | 1,654,752 |
| | | | | | |
Municipal Electric Authority of Georgia Project One Subseries A (Utilities Revenue LOC), 5.25%, Due 1/1/2014 | | | | | | 2,000,000 | | 2,194,740 | | 2,000,000 | | 2,194,740 |
Thomasville GA Housing Authority Housing Wood VY Apartments Project Series A, 5.10%, Due 12/1/2035§± | | | | | | 1,060,000 | | 1,033,765 | | 1,060,000 | | 1,033,765 |
Total Georgia | | | | 2,212,002 | | | | 13,201,548 | | | | 15,413,550 |
Guam - 0.05% | | | | | | | | | | | | |
Guam Housing Corporation Guaranteed Mortgage-Backed Securities Series A (Housing Revenue, FHLMC Insured), 5.75%, Due 9/1/2031 | | 60,000 | | 63,317 | | | | | | 60,000 | | 63,317 |
Guam Education Financing Foundation Certificates Partnership Guam Public School Facilities Project Series B (Educational Facilities Revenue, ACA Insured), 4.50%, Due 10/1/2026 | | 120,000 | | 99,892 | | 175,000 | | 145,675 | | 295,000 | | 245,567 |
Total Guam | | | | 163,209 | | | | 145,675 | | | | 308,884 |
Hawaii - 0.17% | | | | | | | | | | | | |
Hawaii State (Airport Revenue, FGIC Insured), 5.75%, Due 7/1/2015 | | | | | | 1,000,000 | | 1,050,960 | | 1,000,000 | | 1,050,960 |
Hawaii State Housing Finance & Development Corporation Series A (Housing Revenue, FNMA Insured), 5.75%, Due 7/1/2030 | | 70,000 | | 71,383 | | | | | | 70,000 | | 71,383 |
Total Hawaii | | | | 71,383 | | | | 1,050,960 | | | | 1,122,343 |
| | |
| Proforma Portfolio of Investments - December 31, 2007 (Unaudited) | | Wells Fargo Advantage Funds |
| | | | | | | | | | | | |
| | | National Tax-Free Fund | | Municipal Bond Fund | | Pro Forma Combined |
| | | Shares or
Principal
Amount | | Value
(Note 2) | | Shares or
Principal
Amount | | Value
(Note 2) | | Shares or
Principal
Amount | | Value
(Note 2) |
Idaho - 0.25% | | | | | | | | | | | | |
Idaho IHC Hospitals Incorporated (HCFR), 6.65%, Due 2/15/2021 | | 150,000 | | 190,587 | | | | | | 150,000 | | 190,587 |
Idaho Housing Agency Series C2 (Housing Revenue), 6.35%, Due 7/1/2015 | | 115,000 | | 115,128 | | | | | | 115,000 | | 115,128 |
Idaho Housing & Finance Association Series H2 (Housing Revenue, FHA Insured), 6.15%, Due 1/1/2028 | | 165,000 | | 168,878 | | | | | | 165,000 | | 168,878 |
Idaho Housing & Finance Association Series E-CL I (SFMR), 3.60%, Due 7/1/2033 | | | | | | 1,190,000 | | 1,187,537 | | 1,190,000 | | 1,187,537 |
Total Idaho | | | | 474,593 | | | | 1,187,537 | | | | 1,662,130 |
Illinois - 6.90% | | | | | | | | | | | | |
Aurora IL Series B, 5.85%, Due 12/30/2013 | | | | | | 2,740,000 | | 2,703,996 | | 2,740,000 | | 2,703,996 |
Chicago IL Housing Authority Prerefunded (Housing Revenue), 5.38%, Due 7/1/2019§# | | 2,250,000 | | 2,448,675 | | | | | | 2,250,000 | | 2,448,675 |
Chicago IL Bryne Mawr Belle Project (Housing Revenue, GNMA Insured), 6.13%, Due 6/1/2039 | | 500,000 | | 508,965 | | | | | | 500,000 | | 508,965 |
Chicago IL Paul G. Stewart Phases I & II (Housing Revenue, FHA Insured), 4.20%, Due 9/20/2017 | | 500,000 | | 487,075 | | 870,000 | | 847,511 | | 1,370,000 | | 1,334,586 |
Du Page County IL Special Service Monarch Landing Project (Special Tax Revenue), 5.40%, Due 3/1/2016 | | | | | | 250,000 | | 248,190 | | 250,000 | | 248,190 |
| | | | | | |
Eureka IL Eureka College Project Sesies 1998B (College & University Revenue, MBIA Insured), 7.00%, Due 1/1/2019 | | 1,000,000 | | 1,038,330 | | 1,750,000 | | 1,817,078 | | 2,750,000 | | 2,855,408 |
Hampshire IL Special Service Area #18 Crown Development Project Tamms Farm Series A (Special Tax Revenue), 6.00%, Due 3/1/2044 | | 500,000 | | 468,575 | | 715,000 | | 670,062 | | 1,215,000 | | 1,138,637 |
Harvey IL Series A (Property Tax Revenue), 5.50%, Due 12/1/2027 | | 1,800,000 | | 1,769,976 | | 3,250,000 | | 3,195,790 | | 5,050,000 | | 4,965,766 |
Harvey IL Series A (Property Tax Revenue), 5.63%, Due 12/1/2032 | | 2,090,000 | | 2,046,047 | | 2,745,000 | | 2,687,273 | | 4,835,000 | | 4,733,320 |
Illinois Development Finance Authority Balance Community Rehabilitation Series A, 7.88%, Due 7/1/2020 | | 202,577 | | 167,219 | | | | | | 202,577 | | 167,219 |
Illinois Finance Authority New Money Community Rehabilitation Series A (HCFR, GO), 5.35%, Due 7/1/2027 | | 1,000,000 | | 872,490 | | 410,000 | | 401,165 | | 1,410,000 | | 1,273,655 |
Illinois OSF Healthcare System Prerefunded (HCFR), 6.25%, Due 11/15/2029§ | | 4,000,000 | | 4,259,000 | | | | | | 4,000,000 | | 4,259,000 |
Illinois Financing Authority Charter Schools Uno Charter Series C (Other Revenue, ACA Insured), 5.38%, Due 9/1/2032 | | | | | | 1,450,000 | | 1,265,111 | | 1,450,000 | | 1,265,111 |
Jackson & Williamson Counties IL Community High School District #165 Prerefunded (Property Tax Revenue, AMBAC Insured), 6.25%, Due 12/1/2015§ | | 500,000 | | 528,115 | | | | | | 500,000 | | 528,115 |
McHenry County IL Community High School District #157 (Property Tax Revenue, First Security Bank LOC), 9.00%, Due 12/1/2017 | | 1,000,000 | | 1,366,850 | | | | | | 1,000,000 | | 1,366,850 |
Regional Transportation Authority Series D (Sales Tax Revenue, FGIC Insured), 7.75%, Due 6/1/2019 | | 7,350,000 | | 9,469,593 | | | | | | 7,350,000 | | 9,469,593 |
Rockford IL Faust Lamark Apartments Project Series A Housing & Urban Development (Housing Revenue, MBIA Insured), 6.75%, Due 1/1/2018 | | 905,000 | | 933,155 | | | | | | 905,000 | | 933,155 |
Southwestern IL Development Finance Authority Local Government Program Collinsville Limited (Sales Tax Revenue), 5.00%, Due 3/1/2025 | | 410,000 | | 389,127 | | 615,000 | | 583,690 | | 1,025,000 | | 972,817 |
Southwestern IL Development Finance Authority Local Government Program Collinsville Limited (Sales Tax Revenue), 5.35%, Due 3/1/2031 | | 600,000 | | 573,870 | | 900,000 | | 860,805 | | 1,500,000 | | 1,434,675 |
Tazewell County IL School District #51 (Property Tax Revenue, FGIC Insured), 9.00%, Due 12/1/2023 | | 1,105,000 | | 1,672,340 | | | | | | 1,105,000 | | 1,672,340 |
Vernon Hills IL Town Center Project Series A (Tax Incremental Revenue), 6.25%, Due 12/30/2026 | | | | | | 1,000,000 | | 1,000,740 | | 1,000,000 | | 1,000,740 |
Total Illinois | | | | 28,999,402 | | | | 16,281,411 | | | | 45,280,813 |
Indiana - 0.77% | | | | | | | | | | | | |
Indianapolis IN Local Public Improvement Series B (Other Revenue), 6.00%, Due 1/10/2020 | | 290,000 | | 334,973 | | | | | | 290,000 | | 334,973 |
| | | | | | |
Nobelsville IN Redevelopment Authority Lease Rental Hazel Dell Road Series A (Lease Revenue), 5.00%, Due 2/1/2029 | | 925,000 | | 919,006 | | 1,825,000 | | 1,813,174 | | 2,750,000 | | 2,732,180 |
Valparaiso IN Economic Development Valparaiso Family YMCA (Other Revenue), 6.00%, Due 12/1/2036 | | | | | | 2,000,000 | | 1,950,320 | | 2,000,000 | | 1,950,320 |
Total Indiana | | | | 1,253,979 | | | | 3,763,494 | | | | 5,017,473 |
Iowa - 0.16% | | | | | | | | | | | | |
Coralville IA COP Series D (Other Revenue), 5.00%, Due 6/1/2014 | | 300,000 | | 310,635 | | | | | | 300,000 | | 310,635 |
Coralville IA COP Series D (Other Revenue), 5.25%, Due 6/1/2016 | | 360,000 | | 378,731 | | | | | | 360,000 | | 378,731 |
| | |
| Proforma Portfolio of Investments - December 31, 2007 (Unaudited) | | Wells Fargo Advantage Funds |
| | | | | | | | | | | | |
| | | National Tax-Free Fund | | Municipal Bond Fund | | Pro Forma Combined |
| | | Shares or
Principal
Amount | | Value
(Note 2) | | Shares or
Principal
Amount | | Value
(Note 2) | | Shares or
Principal
Amount | | Value
(Note 2) |
Iowa Finance Authority AMT Mortgage-Backed Securities Program Series D (Housing Revenue, GNMA), 4.30%, Due 7/1/2033 | | | | | | 145,000 | | 145,254 | | 145,000 | | 145,254 |
Iowa Finance Authority Child Services (Other Revenue), 5.00%, Due 6/1/2009 | | | | | | 110,000 | | 109,447 | | 110,000 | | 109,447 |
Iowa Finance Authority Child Services (Other Revenue), 5.00%, Due 6/1/2010 | | | | | | 125,000 | | 123,904 | | 125,000 | | 123,904 |
Total Iowa | | | | 689,366 | | | | 378,605 | | | | 1,067,971 |
Kansas - 3.50% | | | | | | | | | | | | |
Kansas Development Finance Authority Health Facilities Hartford (HCFR LOC), 6.13%, Due 4/1/2012 | | | | | | 355,000 | | 361,791 | | 355,000 | | 361,791 |
City of Olathe KS Special Obligation West Village Center Project (Tax Incremental Revenue), 5.50%, Due 9/1/2026 | | 500,000 | | 463,120 | | 765,000 | | 708,574 | | 1,265,000 | | 1,171,694 |
Overland Park KS Development Corporation First Tier Convention Series A (Other Revenue, AMBAC Insured), 5.13%, Due 1/1/2032 | | 400,000 | | 406,196 | | | | | | 400,000 | | 406,196 |
Overland Park KS Development Corporation Second Tier Convention Series B (Other Revenue, AMBAC Insured), 5.13%, Due 1/1/2032 | | 3,000,000 | | 3,046,470 | | 5,000,000 | | 5,077,450 | | 8,000,000 | | 8,123,920 |
Sedgwick & Shawnee Counties KS Series A2 (Housing Revenue, GNMA Insured), 6.70%, Due 6/1/2029 | | 515,000 | | 521,963 | | | | | | 515,000 | | 521,963 |
Sedgwick & Shawnee Counties KS Mortgage-Backed Securities Series A5 (Housing Revenue LOC), 5.70%, Due 12/1/2036± | | | | | | 725,000 | | 757,415 | | 725,000 | | 757,415 |
| | | | | | |
Sedgwick & Shawnee Counties KS Mortgage-Backed Securities Series A (SFHR, GNMA), 5.40%, Due 12/1/2037 | | 1,345,000 | | 1,398,020 | | 3,250,000 | | 3,378,115 | | 4,595,000 | | 4,776,135 |
Wyandotte County KS United Government Referendum Sales Tax Second Lien Area B (Sales Tax Revenue), 5.00%, Due 12/1/2020 | | 2,000,000 | | 1,977,440 | | 1,750,000 | | 1,730,260 | | 3,750,000 | | 3,707,700 |
Wyandotte County Kansas City KS United Government Transportation Development Strict Legends Village West Project (Other Revenue), 4.88%, Due 10/1/2028 | | 1,385,000 | | 1,244,547 | | 2,130,000 | | 1,913,997 | | 3,515,000 | | 3,158,544 |
Total Kansas | | | | 9,057,756 | | | | 13,927,602 | | | | 22,985,358 |
Kentucky - 0.51% | | | | | | | | | | | | |
Kentucky EDFA Retirement Housing Foundation (HCFR LOC), 5.50%, Due 12/1/2028§± | | | | | | 1,550,000 | | 1,550,000 | | 1,550,000 | | 1,550,000 |
Kentucky EDFA Christian Care Communities Projects, 5.38%, Due 11/20/2035 | | | | | | 1,745,000 | | 1,800,805 | | 1,745,000 | | 1,800,805 |
Total Kentucky | | — | | — | | | | 3,350,805 | | | | 3,350,805 |
Louisiana - 1.11% | | | | | | | | | | | | |
Claiborne Parish LA Law Enforcement District Claiborne Correctional Facilities Project, 6.25%, Due 3/1/2019 | | | | | | 3,185,000 | | 3,218,443 | | 3,185,000 | | 3,218,443 |
Louisiana PFA Black & Gold Facilities Project Series A (HEFAR, CIFG Insured), 5.00%, Due 7/1/2030 | | 1,000,000 | | 1,013,130 | | | | | | 1,000,000 | | 1,013,130 |
Louisiana Public Facilities Authority Black & Gold Facilities Project Series A (College & University Revenue, CIFG Insured), 5.00%, Due 7/1/2032 | | 3,000,000 | | 3,015,780 | | | | | | 3,000,000 | | 3,015,780 |
Total Louisiana | | | | 4,028,910 | | | | 3,218,443 | | | | 7,247,353 |
Massachusetts - 1.31% | | | | | | | | | | | | |
Massachusetts College Building Authority Series (College & University Revenue, Commonwealth of Massachusetts), 7.50%, Due 5/1/2014 | | 2,500,000 | | 2,966,750 | | | | | | 2,500,000 | | 2,966,750 |
Massachusetts State Port Authority Delta Airlines Incorporated Project Series A (Lease Revenue, AMBAC Insured), 5.50%, Due 1/1/2013 | | | | | | 3,500,000 | | 3,678,115 | | 3,500,000 | | 3,678,115 |
Massachusetts State Port Authority Delta Airlines Income Project Series A (Lease Revenue, AMBAC Insured), 5.50%, Due 1/1/2016 | | | | | | 800,000 | | 834,480 | | 800,000 | | 834,480 |
Massachusetts State Port Authority Delta Air Lines Incorporated Project-Series A (Lease Revenue, AMBAC Insured), 5.50%, Due 1/1/2017 | | | | | | 1,000,000 | | 1,040,240 | | 1,000,000 | | 1,040,240 |
Massachusetts Water Pollution Abatement MWRA Program Series A Prerefunded (Water Revenue), 6.00%, Due 8/1/2023§ | | 90,000 | | 94,986 | | | | | | 90,000 | | 94,986 |
Total Massachusetts | | | | 3,061,736 | | | | 5,552,835 | | | | 8,614,571 |
Michigan - 3.00% | | | | | | | | | | | | |
Crescent Academy MI COP (Other Revenue), 5.75%, Due 12/1/2036(i) | | 1,180,000 | | 1,033,432 | | 1,610,000 | | 1,410,022 | | 2,790,000 | | 2,443,454 |
Detroit MI Downtown Development Authority Development Area #1 Project Series A (Tax Incremental Revenue, MBIA Insured), 4.75%, Due 7/1/2025 | | 1,750,000 | | 1,752,748 | | | | | | 1,750,000 | | 1,752,748 |
Flint MI International Academy (Educational Facilities Revenue), 5.75%, Due 10/1/2037 | | 2,580,000 | | 2,487,275 | | 3,950,000 | | 3,808,037 | | 6,530,000 | | 6,295,312 |
| | |
| Proforma Portfolio of Investments - December 31, 2007 (Unaudited) | | Wells Fargo Advantage Funds |
| | | | | | | | | | | | |
| | | National Tax-Free Fund | | Municipal Bond Fund | | Pro Forma Combined |
| | | Shares or
Principal
Amount | | Value
(Note 2) | | Shares or
Principal
Amount | | Value
(Note 2) | | Shares or
Principal
Amount | | Value
(Note 2) |
Michigan Public Educational Facilities Authority Limited Obligation Bradford (Educational Facilities Revenue), 6.50%, Due 9/1/2037 | | 965,000 | | 953,632 | | 1,480,000 | | 1,462,566 | | 2,445,000 | | 2,416,198 |
Michigan Public Educational Facilities Authority Limited Obligation Nataki Talibah (Educational Facilities Revenue), 6.25%, Due 10/1/2023 | | | | | | 1,175,000 | | 1,175,705 | | 1,175,000 | | 1,175,705 |
Michigan State Hospital Finance Authority Daughters Charity (Hospital Revenue), 5.25%, Due 11/1/2015 | | | | | | 1,150,000 | | 1,225,889 | | 1,150,000 | | 1,225,889 |
Star International Academy MI Full Term (Lease Revenue), 6.13%, Due 3/1/2037 | | 560,000 | | 536,222 | | 900,000 | | 861,786 | | 1,460,000 | | 1,398,008 |
Wayland MI Union School District (Property Tax Revenue, FGIC Insured), 8.00%, Due 5/1/2010 | | 2,760,000 | | 2,949,943 | | | | | | 2,760,000 | | 2,949,943 |
Total Michigan | | | | 9,713,252 | | | | 9,944,005 | | | | 19,657,257 |
Minnesota - 1.16% | | | | | | | | | | | | |
Austin MN Housing & RDA Courtyard Residence Project Series A (Housing Revenue), 7.25%, Due 1/1/2032 | | 500,000 | | 515,980 | | | | | | 500,000 | | 515,980 |
Brooklyn Park MN EDFA Huntington Site Development Series A (Tax Incremental Revenue), 5.00%, Due 8/1/2009 | | | | | | 810,000 | | 821,162 | | 810,000 | | 821,162 |
Falcon Height MN Kaleidoscope Charter School Series A (Lease Revenue), 6.00%, Due 11/1/2037 | | | | | | 1,000,000 | | 963,400 | | 1,000,000 | | 963,400 |
Meeker County MN Hospital Facilities-Memorial Hospital Project (Healthcare Facilities Revenue), 5.13%, Due 11/1/2015 | | | | | | 545,000 | | 530,301 | | 545,000 | | 530,301 |
Meeker County MN Hospital Facilities-Memorial Hospital Project (Healthcare Facilities Revenue), 5.25%, Due 11/1/2016 | | | | | | 570,000 | | 555,619 | | 570,000 | | 555,619 |
Meeker County MN Hospital Facilities-Memorial Hospital Project (Healthcare Facilities Revenue), 5.25%, Due 11/1/2017 | | | | | | 330,000 | | 321,694 | | 330,000 | | 321,694 |
Rochester City MN Madonna Towers Incorporated Project Series A (Housing Revenue), 5.50%, Due 11/1/2017 | | | | | | 490,000 | | 484,473 | | 490,000 | | 484,473 |
Rochester City MN Madonna Towers Incorporated Project Series A (Housing Revenue), 5.88%, Due 11/1/2028 | | | | | | 825,000 | | 799,128 | | 825,000 | | 799,128 |
Western Minnesota Municipal Power Agency Series A (Electric Plant Revenue LOC), 5.50%, Due 1/1/2012 | | | | | | 1,000,000 | | 1,043,940 | | 1,000,000 | | 1,043,940 |
Woodbury MN Math Science Academy Project Series A, 7.50%, Due 12/1/2031 | | | | | | 1,500,000 | | 1,604,325 | | 1,500,000 | | 1,604,325 |
Total Minnesota | | | | 515,980 | | | | 7,124,042 | | | | 7,640,022 |
Mississippi - 0.31% | | | | | | | | | | | | |
Gulfport-Biloxi Regional Airport Authority MS Passenger Facilities Series A (Airport Revenue, ACA Insured), 5.00%, Due 10/1/2022 | | | | | | 500,000 | | 465,355 | | 500,000 | | 465,355 |
Mississippi Home Corporation Housing Madonna Manor Apartments #3 (MFHR, GNMA), 5.25%, Due 1/20/2024 | | 520,000 | | 528,819 | | 1,000,000 | | 1,016,960 | | 1,520,000 | | 1,545,779 |
Total Mississippi | | | | 528,819 | | | | 1,482,315 | | | | 2,011,134 |
Missouri - 2.39% | | | | | | | | | | | | |
| | | | | | |
Cass County MO (Hospital Revenue), 5.00%, Due 5/1/2014 | | 370,000 | | 372,168 | | 560,000 | | 563,282 | | 930,000 | | 935,450 |
| | | | | | |
Cass County MO (Hospital Revenue), 5.50%, Due 5/1/2027 | | 900,000 | | 874,890 | | 1,360,000 | | 1,322,056 | | 2,260,000 | | 2,196,946 |
| | | | | | |
Chesterfield Valley Transportation Development District MO (Sales Tax Revenue, CIFG Insured), 4.00%, Due 4/15/2026 | | 1,000,000 | | 1,005,030 | | | | | | 1,000,000 | | 1,005,030 |
| | | | | | |
Cottleville MO COP (Lease Revenue), 5.00%, Due 8/1/2020 | | 300,000 | | 304,863 | | | | | | 300,000 | | 304,863 |
| | | | | | |
Cottleville MO COP (Lease Revenue), 5.10%, Due 8/1/2023 | | 250,000 | | 253,055 | | | | | | 250,000 | | 253,055 |
| | | | | | |
Cottleville MO COP (Lease Revenue), 5.25%, Due 8/1/2031 | | | | | | 600,000 | | 600,630 | | 600,000 | | 600,630 |
Desloge MO US Highway 67 State Street Redevelopment Project, 5.20%, Due 4/15/2020 | | | | | | 975,000 | | 991,019 | | 975,000 | | 991,019 |
Kansas City MO Maincor Project Series A (Tax Incremental Revenue), 5.25%, Due 3/1/2018 | | | | | | 1,000,000 | | 976,090 | | 1,000,000 | | 976,090 |
Lake of the Ozarks MO Community Bridge Corporation, 5.25%, Due 12/1/2014 | | | | | | 3,475,000 | | 3,475,765 | | 3,475,000 | | 3,475,765 |
Ozark MO COP Community Center Project (Lease Revenue), 4.80%, Due 9/1/2023 | | 500,000 | | 494,650 | | | | | | 500,000 | | 494,650 |
Ozark MO COP Community Center Project (Lease Revenue), 5.00%, Due 9/1/2026 | | | | | | 760,000 | | 753,578 | | 760,000 | | 753,578 |
St. Charles County MO IDA Housing Vanderbilt Apartments, 5.00%, Due 2/1/2029§± | | | | | | 3,700,000 | | 3,702,072 | | 3,700,000 | | 3,702,072 |
Total Missouri | | | | 3,304,656 | | | | 12,384,492 | | | | 15,689,148 |
Montana - 0.33% | | | | | | | | | | | | |
Flathead MT Municipal Airport Authority Glacier Park International Airport A (Airport Revenue), 5.00%, Due 6/1/2013 | | 325,000 | | 329,183 | | | | | | 325,000 | | 329,183 |
| | |
| Proforma Portfolio of Investments - December 31, 2007 (Unaudited) | | Wells Fargo Advantage Funds |
| | | | | | | | | | | | |
| | | National Tax-Free Fund | | Municipal Bond Fund | | Pro Forma Combined |
| | | Shares or
Principal
Amount | | Value
(Note 2) | | Shares or
Principal
Amount | | Value
(Note 2) | | Shares or
Principal
Amount | | Value
(Note 2) |
Flathead MT Municipal Airport Authority Glacier Park International Airport Series A (Airport Revenue), 5.00%, Due 6/1/2014 | | | | | | 510,000 | | 516,115 | | 510,000 | | 516,115 |
Flathead MT Municipal Airport Authority Glacier Park International Airport A (Airport Revenue), 5.00%, Due 6/1/2015 | | 535,000 | | 539,596 | | | | | | 535,000 | | 539,596 |
Flathead MT Municipal Airport Authority Glacier Park International Airport Series A (Airport Revenue), 5.00%, Due 6/1/2016 | | | | | | 560,000 | | 563,035 | | 560,000 | | 563,035 |
Flathead MT Municipal Airport Authority Glacier Park International Airport Series B (Airport Revenue), 5.00%, Due 6/1/2023 | | | | | | 195,000 | | 196,398 | | 195,000 | | 196,398 |
Total Montana | | | | 868,779 | | | | 1,275,548 | | | | 2,144,327 |
Nevada - 0.59% | | | | | | | | | | | | |
Reno-Sparks NV Indian Colony Governmental (Other Revenue, US Bank NA LOC), 5.00%, Due 6/1/2024 | | | | | | 2,000,000 | | 1,953,940 | | 2,000,000 | | 1,953,940 |
Reno-Sparks NV Indian Colony Governmental (Other Revenue, US Bank NA LOC), 5.13%, Due 6/1/2027 | | 800,000 | | 777,448 | | 1,200,000 | | 1,166,172 | | 2,000,000 | | 1,943,620 |
Total Nevada | | | | 777,448 | | | | 3,120,112 | | | | 3,897,560 |
New Hampshire -0.02% | | | | | | | | | | | | |
New Hampshire The Memorial Hospital (HCFR), 5.25%, Due 6/1/2026 | | 150,000 | | 141,866 | | | | | | 150,000 | | 141,866 |
Total New Hampshire | | | | 141,866 | | | | — | | | | 141,866 |
New Jersey - 3.21% | | | | | | | | | | | | |
| | | | | | |
Higher Education Student Assistance Authority New Jersey Series A (HEFAR, MBIA Insured), 6.00%, Due 6/1/2015 | | | | | | 2,560,000 | | 2,644,915 | | 2,560,000 | | 2,644,915 |
Higher Education Student Assistance Authority NJ Series A (HEFAR, MBIA Insured), 6.10%, Due 6/1/2016 | | 1,150,000 | | 1,189,848 | | | | | | 1,150,000 | | 1,189,848 |
New Jersey Economic Development Authority Cedar Crest Village Incorporated Facilities Series A Prerefunded (HCFR), 7.25%, Due 11/15/2021§ | | 1,000,000 | | 1,149,660 | | | | | | 1,000,000 | | 1,149,660 |
New Jersey Economic Development Authority Cigarette Tax (Other Revenue), 5.63%, Due 6/15/2018 | | 2,500,000 | | 2,509,075 | | 2,500,000 | | 2,509,075 | | 5,000,000 | | 5,018,150 |
New Jersey Economic Development Authority (Excise Tax Revenue), 5.63%, Due 6/15/2019 | | | | | | 500,000 | | 501,290 | | 500,000 | | 501,290 |
New Jersey Economic Development Authority Cigarette Tax Revenue, 5.75%, Due 6/15/2029 | | | | | | 1,000,000 | | 979,460 | | 1,000,000 | | 979,460 |
New Jersey Economic Development Authority Cigarette Tax Revenue, 5.75%, Due 6/15/2034 | | | | | | 2,000,000 | | 1,944,360 | | 2,000,000 | | 1,944,360 |
New Jersey State Higher Education Assistance Authority Series A (College & University Revenue, AMBAC Insured), 5.15%, Due 6/1/2012 | | 880,000 | | 889,442 | | | | | | 880,000 | | 889,442 |
Tobacco Settlement Financing Corporation NJ (Excise Tax Revenue), 5.75%, Due 6/1/2032 | | 1,000,000 | | 1,071,670 | | | | | | 1,000,000 | | 1,071,670 |
Tobacco Settlement Financing Corporation NJ (Excise Tax Revenue), 6.38%, Due 6/1/2032 | | | | | | 5,000,000 | | 5,660,550 | | 5,000,000 | | 5,660,550 |
Total New Jersey | | | | 6,809,695 | | | | 14,239,650 | | | | 21,049,345 |
New Mexico - 0.68% | | | | | | | | | | | | |
| | | | | | |
Bernalillo County NM (Other Revenue), 5.25%, Due 4/1/2027 | | 1,475,000 | | 1,623,577 | | | | | | 1,475,000 | | 1,623,577 |
New Mexico Mortgage Finance Authority SFMR Series A2 Class I (Housing Revenue, GNMA Insured), 4.40%, Due 1/1/2027 | | 1,400,000 | | 1,419,194 | | | | | | 1,400,000 | | 1,419,194 |
Otero County NM (Jail Facilities Revenue), 5.50%, Due 4/1/2013 | | | | | | 1,485,000 | | 1,442,737 | | 1,485,000 | | 1,442,737 |
Total New Mexico | | | | 3,042,771 | | | | 1,442,737 | | | | 4,485,508 |
New York - 3.73% | | | | | | | | | | | | |
Albany NY Industrial Development Agency Series A Brighter Choice Charter School (Educational Facilities Revenue), 4.55%, Due 4/1/2015 | | | | | | 1,370,000 | | 1,329,558 | | 1,370,000 | | 1,329,558 |
Erie County NY Development Agency Global Concepts Charter School Project (Industrial Development Revenue), 6.25%, Due 10/1/2037 | | 650,000 | | 627,816 | | 950,000 | | 917,577 | | 1,600,000 | | 1,545,393 |
Erie County NY IDAG City School District Buffalo Project Series A (Other Revenue, First Security Bank LOC), 5.75%, Due 5/1/2028 | | 1,200,000 | | 1,354,188 | | | | | | 1,200,000 | | 1,354,188 |
Genesee County NY IDA United Memorial Medical Center Project (HFFA Revenue), 4.75%, Due 12/1/2014 | | 1,190,000 | | 1,130,631 | | 1,775,000 | | 1,686,445 | | 2,965,000 | | 2,817,076 |
Nassau County NY Comb Sewer Districts Series G (Property Tax Revenue LOC), 5.45%, Due 1/15/2015 | | | | | | 1,000,000 | | 1,119,920 | | 1,000,000 | | 1,119,920 |
Nassau County NY IDA, 6.88%, Due 7/1/2010 | | | | | | 200,000 | | 210,390 | | 200,000 | | 210,390 |
New York City NY IDAG Civic Facilities Vaughn College Aeronautics Series A, 5.00%, Due 12/1/2016 | | | | | | 680,000 | | 668,936 | | 680,000 | | 668,936 |
New York City NY IDAG 2006 Project Samaritan AIDS Services (IDR, Citibank NA LOC), 5.00%, Due 11/1/2024 | | | | | | 425,000 | | 434,482 | | 425,000 | | 434,482 |
| | |
| Proforma Portfolio of Investments - December 31, 2007 (Unaudited) | | Wells Fargo Advantage Funds |
| | | | | | | | | | | | |
| | | National Tax-Free Fund | | Municipal Bond Fund | | Pro Forma Combined |
| | | Shares or
Principal
Amount | | Value
(Note 2) | | Shares or
Principal
Amount | | Value
(Note 2) | | Shares or
Principal
Amount | | Value
(Note 2) |
New York NY IDA Special Needs Pooled Series A1, 6.88%, Due 7/1/2010 | | | | | | 950,000 | | 965,409 | | 950,000 | | 965,409 |
New York NY Transitional Finance Authority Future Tax, 5.25%, Due 2/1/2029± | | | | | | 100,000 | | 105,130 | | 100,000 | | 105,130 |
New York State Dormitory Authority City University System Series A (Other Revenue LOC), 5.63%, Due 7/1/2016 | | | | | | 1,000,000 | | 1,106,670 | | 1,000,000 | | 1,106,670 |
| | | | | | |
New York State Dormitory Authority New York University Hospital Center Series B (Hospital Revenue), 5.63%, Due 7/1/2037 | | 400,000 | | 387,260 | | 600,000 | | 580,890 | | 1,000,000 | | 968,150 |
New York State Dormitory Authority Insured Manhattan College Series B (College & University Revenue, Radian Insured), 5.30%, Due 7/1/2037 | | 1,450,000 | | 1,461,629 | | 2,175,000 | | 2,192,444 | | 3,625,000 | | 3,654,073 |
Rockland County NY (Property Tax Revenue), 5.50%, Due 10/15/2014 | | | | | | 1,000,000 | | 1,073,640 | | 1,000,000 | | 1,073,640 |
Rockland County NY (Property Tax Revenue, FGIC Insured), 5.60%, Due 10/15/2015 | | | | | | 1,000,000 | | 1,077,170 | | 1,000,000 | | 1,077,170 |
Seneca Nation Indians NY Capital Improvements Authority Series A (Other Revenue), 5.25%, Due 12/1/2016†† | | 1,125,000 | | 1,139,333 | | 2,000,000 | | 2,025,480 | | 3,125,000 | | 3,164,813 |
Tobacco Settlement Financing Corporation NY Series B1C (Excise Tax Revenue), 5.50%, Due 6/1/2019 | | 2,700,000 | | 2,889,972 | | | | | | 2,700,000 | | 2,889,972 |
Total New York | | | | 8,990,829 | | | | 15,494,141 | | | | 24,484,970 |
North Carolina - 0.50% | | | | | | | | | | | | |
| | | | | | |
Mooreville Town NC (Lease Revenue), 5.00%, Due 9/1/2032 | | 1,280,000 | | 1,288,691 | | 2,000,000 | | 2,013,580 | | 3,280,000 | | 3,302,271 |
Total North Carolina | | | | 1,288,691 | | | | 2,013,580 | | | | 3,302,271 |
North Dakota - 0.42% | | | | | | | | | | | | |
North Dakota State Home Mortgage Financing Program Series C (Housing Revenue), 5.95%, Due 7/1/2017 | | 45,000 | | 45,994 | | | | | | 45,000 | | 45,994 |
North Dakota State Home Mortgage Financing Program Series C (Housing Revenue), 6.10%, Due 7/1/2028 | | 25,000 | | 25,589 | | | | | | 25,000 | | 25,589 |
North Dakota State Housing Finance Agency (Housing Revenue), 4.70%, Due 7/1/2031 | | 1,410,000 | | 1,418,629 | | | | | | 1,410,000 | | 1,418,629 |
Three Affiliated Tribes of the Fort Berthold Reservation ND (Recreational Facilities Revenue), 6.30%, Due 11/15/2010 | | | | | | 1,245,000 | | 1,246,083 | | 1,245,000 | | 1,246,083 |
Total North Dakota | | | | 1,490,212 | | | | 1,246,083 | | | | 2,736,295 |
Ohio - 2.37% | | | | | | | | | | | | |
Deerfield Township OH (Tax Allocation Revenue), 5.00%, Due 12/1/2025 | | 550,000 | | 532,895 | | 850,000 | | 823,565 | | 1,400,000 | | 1,356,460 |
Johnstown OH Mortgage (Sewer Revenue), 6.00%, Due 12/1/2017 | | 250,000 | | 252,863 | | | | | | 250,000 | | 252,863 |
Montgomery County OH Chevy Chase Apartments, 4.95%, Due 11/1/2035§± | | | | | | 3,760,000 | | 3,729,995 | | 3,760,000 | | 3,729,995 |
Ohio Enterprise Bond Series2-A (Economic Development Revenue), 5.50%, Due 12/1/2019 | | 1,800,000 | | 1,789,038 | | 2,700,000 | | 2,683,557 | | 4,500,000 | | 4,472,595 |
Riversouth OH Authority Lazarus Building Redevelopment Series A (Other Revenue), 5.75%, Due 12/1/2027 | | | | | | 1,900,000 | | 1,893,198 | | 1,900,000 | | 1,893,198 |
Toledo-Lucas County OH Port Authority Town Square at Levis Commons (Other Revenue), 5.40%, Due 11/1/2036 | | 1,500,000 | | 1,436,535 | | 2,500,000 | | 2,394,225 | | 4,000,000 | | 3,830,760 |
Total Ohio | | | | 4,011,331 | | | | 11,524,540 | | | | 15,535,871 |
Oklahoma - 1.32% | | | | | | | | | | | | |
Chickasaw Nation OK Health Systems (Healthcare Facilities Revenue), 6.00%, Due 12/1/2025†† | | 500,000 | | 502,755 | | 750,000 | | 754,133 | | 1,250,000 | | 1,256,888 |
Chickasaw Nation OK Health Systems (Healthcare Facilities Revenue), 6.25%, Due 12/1/2032†† | | 1,500,000 | | 1,504,605 | | 2,250,000 | | 2,256,908 | | 3,750,000 | | 3,761,513 |
Comanche County OK Independent School District #4 Geronimo (Educational Facilities Revenue), 6.25%, Due 8/15/2014 | | 1,079,891 | | 1,184,252 | | 1,921,508 | | 2,107,203 | | 3,001,399 | | 3,291,455 |
Oklahoma Housing Finance Agency Single Family Revenue Bond, 6.80%, Due 9/1/2026 | | | | | | 335,000 | | 342,095 | | 335,000 | | 342,095 |
Total Oklahoma | | | | 3,191,612 | | | | 5,460,339 | | | | 8,651,951 |
Oregon - 1.12% | | | | | | | | | | | | |
Jackson County OR Series B (Airport Revenue), 5.13%, Due 12/1/2023 | | 1,285,000 | | 1,303,041 | | 1,925,000 | | 1,952,027 | | 3,210,000 | | 3,255,068 |
Oregon State Health Housing ECFA Aspen Foundation II Series A (HCFR), 6.13%, Due 4/15/2029(i) | | 1,405,000 | | 957,732 | | | | | | 1,405,000 | | 957,732 |
Oregon State Housing & Community Services Department AMT SFMR Program Series B (Housing Revenue), 4.55%, Due 7/1/2027 | | | | | | 1,075,000 | | 1,081,461 | | 1,075,000 | | 1,081,461 |
Oregon State Housing & Community Services Department Series N (Housing Revenue), 3.90%, Due 7/1/2029 | | 1,495,000 | | 1,494,821 | | | | | | 1,495,000 | | 1,494,821 |
Oregon State Housing & Community Services Department Series M (Housing Revenue), 6.20%, Due 7/1/2028 | | 535,000 | | 542,854 | | | | | | 535,000 | | 542,854 |
Total Oregon | | | | 4,298,448 | | | | 3,033,488 | | | | 7,331,936 |
| | |
| Proforma Portfolio of Investments - December 31, 2007 (Unaudited) | | Wells Fargo Advantage Funds |
| | | | | | | | | | | | |
| | | National Tax-Free Fund | | Municipal Bond Fund | | Pro Forma Combined |
| | | Shares or
Principal
Amount | | Value
(Note 2) | | Shares or
Principal
Amount | | Value
(Note 2) | | Shares or
Principal
Amount | | Value
(Note 2) |
Pennsylvania - 2.88% | | | | | | | | | | | | |
Allegheny County PA IDA Propel Schools Homestead Project Series A, 7.50%, Due 12/15/2029 | | | | | | 2,235,000 | | 2,338,056 | | 2,235,000 | | 2,338,056 |
Chester County PA Renaissance Academy Project Series A, 5.63%, Due 10/1/2015 | | | | | | 1,520,000 | | 1,523,298 | | 1,520,000 | | 1,523,298 |
| | | | | | |
Chester County PA Avon Grove Charter School Project Series A (Industrial Development Revenue), 6.38%, Due 12/15/2037 | | | | | | 2,000,000 | | 1,984,060 | | 2,000,000 | | 1,984,060 |
Dauphin County PA Hapsco Western PA Hospital Project B (Hospital Revenue, MBIA Insured), 6.25%, Due 7/1/2016 | | | | | | 3,500,000 | | 3,918,880 | | 3,500,000 | | 3,918,880 |
Delaware Valley PA Regional Financial Authority Local Government Series C, 7.75%, Due 7/1/2027 | | | | | | 925,000 | | 1,287,073 | | 925,000 | | 1,287,073 |
Harrisburg PA Harrisburg University of Science Series A (College & University Revenue), 5.40%, Due 9/1/2016 | | 1,250,000 | | 1,261,088 | | 1,750,000 | | 1,765,523 | | 3,000,000 | | 3,026,611 |
Pennsylvania Housing Finance Agency AMT Series 99A (Housing Revenue), 4.70%, Due 10/1/2017 | | | | | | 300,000 | | 304,107 | | 300,000 | | 304,107 |
Pennsylvania HEFA Allegheny Delaware Valley Series A (HCFR LOC), 5.70%, Due 11/15/2011 | | | | | | 1,880,000 | | 1,995,582 | | 1,880,000 | | 1,995,582 |
Philadelphia PA Franklin Towne Charter High Series A (IDR), 5.00%, Due1/1/2017 | | | | | | 585,000 | | 582,069 | | 585,000 | | 582,069 |
Philadelphia PA First Philadelphia Charter Series A (Other Revenue), 5.85%, Due 8/15/2037 | | 750,000 | | 736,688 | | 1,250,000 | | 1,227,813 | | 2,000,000 | | 1,964,501 |
Total Pennsylvania | | | | 1,997,776 | | | | 16,926,461 | | | | 18,924,237 |
Puerto Rico - 1.89% | | | | | | | | | | | | |
Children’s Trust Tobacco Settlement Asset-Backed Prerefunded (Excise Tax Revenue), 5.75%, Due 7/1/2010§ | | 210,000 | | 218,509 | | | | | | 210,000 | | 218,509 |
Children’s Trust Tobacco Settlement Asset-Backed Prerefunded (Other Revenue), 6.00%, Due 7/1/2010§ | | 300,000 | | 320,475 | | | | | | 300,000 | | 320,475 |
Commonwealth of Puerto Rico (Fuel Sales Tax Revenue LOC), 5.65%, Due 7/1/2015 | | | | | | 1,000,000 | | 1,116,880 | | 1,000,000 | | 1,116,880 |
Commonwealth of Puerto Rico Series A (Property Tax Revenue), 5.00%, Due 7/1/2018 | | | | | | 4,950,000 | | 5,058,950 | | 4,950,000 | | 5,058,950 |
Puerto Rico Commonwealth Aqueduct & Sewer Authority (Sewer Revenue), 10.25%, Due 7/1/2009 | | 5,000 | | 5,263 | | | | | | 5,000 | | 5,263 |
Puerto Rico Public Buildings Authority Government Facilities Series M (Lease Revenue, US Government Guaranteed), 6.25%, Due 7/1/2031 | | 1,600,000 | | 1,814,592 | | 2,500,000 | | 2,835,300 | | 4,100,000 | | 4,649,892 |
Puerto Rico Industrial Tourist Educational Medical & Environmental Control Facilities Financing Authority Ana G. Mendez University, 5.00%, Due 2/1/2010 | | | | | | 1,015,000 | | 1,024,145 | | 1,015,000 | | 1,024,145 |
Total Puerto Rico | | | | 2,358,839 | | | | 10,035,275 | | | | 12,394,114 |
South Carolina - 4.51% | | | | | | | | | | | | |
Charleston Educational Excellence Financing Corporation SC Charleston County School District Project (Lease Revenue), 5.00%, Due 12/1/2018 | | | | | | 2,375,000 | | 2,493,774 | | 2,375,000 | | 2,493,774 |
Connector 2000 Association Incorporated Capital Appreciation Series B, 8.10%, Due 1/1/2027^ | | | | | | 5,000,000 | | 1,106,050 | | 5,000,000 | | 1,106,050 |
Connector 2000 Association Incorporated Capital Appreciation Series B, 8.00%, Due 1/1/2028^ | | | | | | 400,000 | | 83,316 | | 400,000 | | 83,316 |
Connector 2000 Association Incorporated Capital Appreciation Series B, 7.80%, Due 1/1/2032^ | | | | | | 10,350,000 | | 1,649,687 | | 10,350,000 | | 1,649,687 |
Connector 2000 Association Incorporated SC Capital Appreciation Series B (Toll Road Revenue), 7.70%, Due 1/1/2034^ | | 7,800,000 | | 1,093,872 | | | | | | 7,800,000 | | 1,093,872 |
Connector 2000 Association Incorporated SC Capital Appreciation Series B (Toll Road Revenue), 7.45%, Due 1/1/2038^ | | 1,850,000 | | 206,146 | | 2,500,000 | | 278,575 | | 4,350,000 | | 484,721 |
Greenville County SC School District Installment Purchase Building Equity Sooner (Other Revenue), 5.50%, Due 12/1/2016 | | 700,000 | | 784,203 | | | | | | 700,000 | | 784,203 |
| | | | | | |
Greenville County SC School District Building Equity Sooner (Other Revenue, Assured Guaranty), 4.63%, Due 12/1/2020 | | 1,780,000 | | 1,844,863 | | 2,900,000 | | 3,005,676 | | 4,680,000 | | 4,850,539 |
Kershaw County SC Public Schools District Project (Lease Revenue, CIFG Insured), 5.00%, Due 12/1/2020 | | | | | | 1,495,000 | | 1,562,753 | | 1,495,000 | | 1,562,753 |
Lee County SC School Facilites Incorporated Series 2006 (Lease Revenue, Radian Insured), 6.00%, Due 12/1/2031 | | 1,000,000 | | 1,054,980 | | 2,400,000 | | 2,531,952 | | 3,400,000 | | 3,586,932 |
SCAGO Educational Facilities Corporation for School Project (Lease Revenue, Guarantee Agreement), 5.00%, Due 12/1/2015 | | 750,000 | | 816,465 | | | | | | 750,000 | | 816,465 |
| | | | | | |
South Carolina Educational Facilities Authority for Private Nonprofit Institutions Furman University Project (College & University Revenue, AMBAC Insured), 5.50%, Due 10/1/2030 | | | | | | 3,540,000 | | 3,724,399 | | 3,540,000 | | 3,724,399 |
| | | | | | |
South Carolina State Ports Authority, 7.80%, Due 7/1/2009# | | | | | | 1,658,800 | | 1,679,187 | | 1,658,800 | | 1,679,187 |
| | |
| Proforma Portfolio of Investments - December 31, 2007 (Unaudited) | | Wells Fargo Advantage Funds |
| | | | | | | | | | | | |
| | | National Tax-Free Fund | | Municipal Bond Fund | | Pro Forma Combined |
| | | Shares or
Principal
Amount | | Value
(Note 2) | | Shares or
Principal
Amount | | Value
(Note 2) | | Shares or
Principal
Amount | | Value
(Note 2) |
Three Rivers Solid Waste Authority South Carolina Captial Appreciation-Landfill Gas Project (Solid Waste Revenue), 5.51%, Due 10/1/2029^ | | | | | | 1,835,000 | | 562,611 | | 1,835,000 | | 562,611 |
Three Rivers SC Solid Waste Authority Capital Appreciation Landfill Gas Project (Solid Waste Revenue), 5.48%, Due 10/1/2030^ | | 1,835,000 | | 536,389 | | | | | | 1,835,000 | | 536,389 |
Three Rivers SC Solid Waste Authority Capital Appreciation Landfill Gas Project (Solid Waste Revenue), 5.47%, Du 10/1/2031^ | | 1,835,000 | | 509,341 | | | | | | 1,835,000 | | 509,341 |
Three Rivers Solid Waste Authority South Carolina Captial Appreciation-Landfill Gas Project (Solid Waste Revenue), 5.49%, Due 10/1/2032^ | | | | | | 1,835,000 | | 480,843 | | 1,835,000 | | 480,843 |
Tobacco Settlement Revenue Management Authority SC Series B (Other Revenue), 6.00%, Due 5/15/2022 | | 3,500,000 | | 3,569,090 | | | | | | 3,500,000 | | 3,569,090 |
Total South Carolina | | | | 10,415,349 | | | | 19,158,823 | | | | 29,574,172 |
South Dakota - 1.19% | | | | | | | | | | | | |
Lower Brule Sioux Tribe SD Series B Refunding Bond, 5.50%, Due 5/1/2019 | | | | | | 2,000,000 | | 1,887,820 | | 2,000,000 | | 1,887,820 |
| | | | | | |
Lower Brule Sioux Tribe SD Series B, 5.60%, Due 5/1/2020 | | 1,440,000 | | 1,355,486 | | | | | | 1,440,000 | | 1,355,486 |
Sisseton-Wahpeton SD Sioux Tribe Lake Traverse Reservation, 7.00%, Due 11/1/2013(i) | | | | | | 440,000 | | 453,138 | | 440,000 | | 453,138 |
Sisseton-Wahpeton SD Sioux Tribe Lake Traverse Reservation, 7.00%, Due 11/1/2023(i) | | | | | | 1,290,000 | | 1,315,297 | | 1,290,000 | | 1,315,297 |
South Dakota EDFA Pooled Loan Program Midstates Print Series A, 5.50%, Due 4/1/2018 | | | | | | 685,000 | | 703,016 | | 685,000 | | 703,016 |
South Dakota EDFA Pooled Loan Program Angus Incorporated Project Series A, 4.75%, Due 4/1/2010 | | | | | | 275,000 | | 278,729 | | 275,000 | | 278,729 |
South Dakota EDFA Pooled Loan Program Angus Incorporated Project Series A, 5.00%, Due 4/1/2011 | | | | | | 285,000 | | 291,666 | | 285,000 | | 291,666 |
South Dakota EDFA Pooled Loan Program Angus Incorporated Project Series A, 5.25%, Due 4/1/2012 | | | | | | 300,000 | | 310,119 | | 300,000 | | 310,119 |
South Dakota EDFA Pooled Loan Program Angus Incorporated Project Series A, 5.25%, Due 4/1/2013 | | | | | | 320,000 | | 332,451 | | 320,000 | | 332,451 |
South Dakota EDFA Pooled Loan Program McEleeg Project Series B, 5.00%, Due 4/1/2014 | | | | | | 420,000 | | 418,853 | | 420,000 | | 418,853 |
South Dakota Housing Development Authority Series B (Housing Revenue), 4.75%, Due 5/1/2025 | | 480,000 | | 481,286 | | | | | | 480,000 | | 481,286 |
Total South Dakota | | | | 1,836,772 | | | | 5,991,089 | | | | 7,827,861 |
Tennessee - 0.51% | | | | | | | | | | | | |
| | | | | | |
Memphis TN Health Educational & Housing Facility Board Prescott Place Apartments Project, 5.13%, Due 5/1/2038§± | | | | | | 1,075,000 | | 1,070,496 | | 1,075,000 | | 1,070,496 |
| | | | | | |
Shelby County TN Health Educational & Housing Facilities Board Methodist Prerefunded (HCFR), 6.50%, Due 9/1/2021§ | | 750,000 | | 854,715 | | | | | | 750,000 | | 854,715 |
Shelby County TN Health Educational & Housing Facilities Board Methodist Refunded (HCFR), 6.50%, Due 9/1/2021 | | 1,250,000 | | 1,424,525 | | | | | | 1,250,000 | | 1,424,525 |
Total Tennessee | | | | 2,279,240 | | | | 1,070,496 | | | | 3,349,736 |
Texas - 5.01% | | | | | | | | | | | | |
Aransas County TX Naval District #1 (Property Tax Revenue, AMBAC Insured), 4.50%, Due 2/15/2020 | | | | | | 340,000 | | 338,412 | | 340,000 | | 338,412 |
| | | | | | |
Arlington TX Special Obligation Dallas Cowboys Series A (Sales Tax Revenue, MBIA Insured), 5.00%, Due 8/15/2034 | | 3,000,000 | | 3,124,140 | | 5,500,000 | | 5,727,590 | | 8,500,000 | | 8,851,730 |
Austin TX Convention Enterprises Incorporated Convention Center First Tier Series B (Other Revenue), 6.00%, Due 1/1/2009 | | | | | | 200,000 | | 201,928 | | 200,000 | | 201,928 |
Austin TX Convention Enterprises Incorporated Convention Center First Tier Series B (Other Revenue), 6.00%, Due 1/1/2010 | | | | | | 475,000 | | 483,754 | | 475,000 | | 483,754 |
Bexar County TX Revenue Project (Other Revenue, MBIA Insured), 5.75%, Due 8/15/2022 | | 2,110,000 | | 2,211,343 | | | | | | 2,110,000 | | 2,211,343 |
Carroll TX Independent School District (Property Tax Revenue, Permanent School Fund Guaranteed), 6.75%, Due 8/15/2020 | | 325,000 | | 409,923 | | | | | | 325,000 | | 409,923 |
Dallas Fort Worth TX International Airport Facilities Improvement Corporation Series A (Airport Revenue, FGIC Insured), 5.63%, Due 11/1/2021 | | | | | | 5,000,000 | | 5,195,700 | | 5,000,000 | | 5,195,700 |
Galveston TX Property Finance Authority Series A (Housing Revenue), 8.50%, Du ee 9/1/2011 | | 30,000 | | 29,311 | | | | | | 30,000 | | 29,311 |
Garza County TX Public Facilities Corporation, 5.25%, Due 10/1/2016 | | | | | | 1,200,000 | | 1,181,724 | | 1,200,000 | | 1,181,724 |
Garza County TX Public Facilities Corporation, 5.25%, Due 10/1/2017 | | | | | | 755,000 | | 740,278 | | 755,000 | | 740,278 |
| | |
| Proforma Portfolio of Investments - December 31, 2007 (Unaudited) | | Wells Fargo Advantage Funds |
| | | | | | | | | | | | |
| | | National Tax-Free Fund | | Municipal Bond Fund | | Pro Forma Combined |
| | | Shares or
Principal
Amount | | Value
(Note 2) | | Shares or
Principal
Amount | | Value
(Note 2) | | Shares or
Principal
Amount | | Value
(Note 2) |
Garza County TX Public Facilities Corporation (Lease Revenue), 5.50%, Due 10/1/2019 | | 1,400,000 | | 1,385,566 | | | | | | 1,400,000 | | 1,385,566 |
Garza County TX Public Facility Corporation (Lease Revenue), 5.75%, Due 10/1/2025 | | | | | | 2,000,000 | | 1,943,520 | | 2,000,000 | | 1,943,520 |
Longview TX Water & Sewer (Water & Sewer Revenue, MBIA Insured), 5.25%, Due 3/1/2022 | | 310,000 | | 331,530 | | | | | | 310,000 | | 331,530 |
Lufkin TX Health Facilities Development Corporation Memorial Health Systems of East Texas (HFFA Revenue), 5.00%, Due 2/15/2008 | | 315,000 | | 315,627 | | | | | | 315,000 | | 315,627 |
Parmer County Hospital District (HCFR), 5.50%, Due 2/15/2027 | | 340,000 | | 341,343 | | | | | | 340,000 | | 341,343 |
| | | | | | |
Texarkana TX Health Facilities Development Corporation Wadley Regional Medical Center Series B (HCFR, MBIA Insured), 6.00%, Due 10/1/2017 | | 160,000 | | 185,797 | | | | | | 160,000 | | 185,797 |
Texas Municipal Gas Acquisition & Supply Corporation Series C (Other Revenue), 4.79%, Due 12/15/2026§± | | 1,250,000 | | 1,127,813 | | | | | | 1,250,000 | | 1,127,813 |
Texas Municipal Gas Acquisition & Supply Corporation Series C (Other Revenue), 5.27%, Due 12/15/2026± | | | | | | 1,900,000 | | 1,714,275 | | 1,900,000 | | 1,714,275 |
Texas State PFA Charter School Finance Corporation Kipp Incorporated Education Series A (Private School Revenue, ACA Insured), 4.65%, Due 2/15/2019 | | 435,000 | | 400,561 | | | | | | 435,000 | | 400,561 |
Texas State PFA Charter School Finance Corporation Kipp Incorporated Series A (Private School Revenue, ACA Insured), 4.70%, Due 2/15/2020 | | | | | | 530,000 | | 484,987 | | 530,000 | | 484,987 |
Texas State PFA Cosmos Foundation Series A (Other Revenue), 5.00%, Due 2/15/2018 | | 925,000 | | 873,616 | | 1,385,000 | | 1,308,063 | | 2,310,000 | | 2,181,679 |
| | | | | | |
Texas State PFA Charter School Finance Corporation Uplift Education Series A (Other Revenue), 5.75%, Due 12/1/2027 | | 520,000 | | 516,318 | | 870,000 | | 863,840 | | 1,390,000 | | 1,380,158 |
| | | | | | |
Texas State PFA Charter School Finance Corporation Uplift Education Series A (Other Revenue), 5.88%, Due 12/1/2036 | | 330,000 | | 327,033 | | 550,000 | | 545,056 | | 880,000 | | 872,089 |
Texas Housing Authority Student Series B (College & University Revenue), 6.75%, Due1/1/2033†† | | 2,365,000 | | 521,814 | | | | | | 2,365,000 | | 521,814 |
Total Texas | | | | 12,101,735 | | | | 20,729,127 | | | | 32,830,862 |
Utah - 1.34% | | | | | | | | | | | | |
Utah County UT Charter School Ronald Wilson Reagan-Series A (Private School Revenue), 5.75%, Due 2/15/2022 | | | | | | 1,000,000 | | 986,620 | | 1,000,000 | | 986,620 |
Utah State Building Ownership Authority State Facilities Series C (Lease Revenue, First Security Bank LOC), 5.50%, Due 5/15/2019 | | 250,000 | | 280,198 | | | | | | 250,000 | | 280,198 |
Utah State Building Ownership Authority State Facilities Series B (Lease Revenue), 5.25%, Due 5/15/2024 | | 2,500,000 | | 2,632,025 | | | | | | 2,500,000 | | 2,632,025 |
Utah State Charter School Finance Authority Channing Hall Series A (Educational Facilities Revenue), 6.00%, Due 7/15/2037†† | | | | | | 700,000 | | 678,811 | | 700,000 | | 678,811 |
Utah State Charter School Finance Authority Summit Academy Series A (Educational Facilities Revenue), 5.80%, Due 6/15/2038 | | | | | | 2,250,000 | | 2,191,005 | | 2,250,000 | | 2,191,005 |
West Valley City UT Monticello Academy (Educational Facilities Revenue), 6.38%, Due 6/1/2037 | | 800,000 | | 803,696 | | 1,200,000 | | 1,205,544 | | 2,000,000 | | 2,009,240 |
Total Utah | | | | 3,715,919 | | | | 5,061,980 | | | | 8,777,899 |
Virginia - 2.52% | | | | | | | | | | | | |
Marquis Community Development Authority VA (Other Revenue), 5.63%, Due 9/1/2018 | | | | | | 1,855,000 | | 1,842,367 | | 1,855,000 | | 1,842,367 |
Reynolds Crossing Community Development Authority Reynolds Crossing Project (Special Tax Revenue), 5.10%, Due 3/1/2021 | | | | | | 1,894,000 | | 1,750,586 | | 1,894,000 | | 1,750,586 |
| | | | | | |
Tobacco Settlement Financing Corporation Asset-Backed (Excise Tax Revenue), 5.50%, Due 6/1/2026 | | | | | | 8,760,000 | | 9,704,766 | | 8,760,000 | | 9,704,766 |
Watkins Centre Community Development Authority VA (Other Revenue), 5.40%, Due 3/1/2020 | | | | | | 1,150,000 | | 1,109,175 | | 1,150,000 | | 1,109,175 |
White Oak Village VA Shops Community Development Authority (Special Tax Revenue), 5.30%, Due 3/1/2017 | | 250,000 | | 243,613 | | 1,950,000 | | 1,900,178 | | 2,200,000 | | 2,143,791 |
Total Virginia | | | | 243,613 | | | | 16,307,072 | | | | 16,550,685 |
Washington - 4.72% | | | | | | | | | | | | |
| | | | | | |
Clark County WA School District #98 Prerefunded (Property Tax Revenue, MBIA Insured), 6.15%, Due 12/1/2015§ | | 500,000 | | 541,910 | | | | | | 500,000 | | 541,910 |
King County WA Housing Authority Egis Housing Program (Housing Revenue, First Security Bank LOC), 5.00%, Due 12/1/2018 | | 750,000 | | 770,955 | | | | | | 750,000 | | 770,955 |
Okanogan County WA Irrigation District, 4.75%, Due 12/1/2013 | | | | | | 1,200,000 | | 1,226,820 | | 1,200,000 | | 1,226,820 |
| | |
| Proforma Portfolio of Investments - December 31, 2007 (Unaudited) | | Wells Fargo Advantage Funds |
| | | | | | | | | | | | |
| | | National Tax-Free Fund | | Municipal Bond Fund | | Pro Forma Combined |
| | | Shares or
Principal
Amount | | Value (Note 2) | | Shares or
Principal
Amount | | Value (Note 2) | | Shares or
Principal
Amount | | Value (Note 2) |
Quinault WA Indian Nation Refunded Quinault Beach Series A (Other Revenue, ACA Insured), 5.80%, Due 12/1/2015 | | | | | | 205,000 | | 202,306 | | 205,000 | | 202,306 |
| | | | | | |
Seattle WA Series B Prerefunded (Water Revenue, FGIC Insured), 6.00%, Due 7/1/2029§ | | 500,000 | | 526,545 | | | | | | 500,000 | | 526,545 |
| | | | | | |
Tobacco Settlement Authority WA Tobacco Settlement Revenue Asset-Backed, 5.50%, Due 6/1/2012 | | 590,000 | | 613,612 | | | | | | 590,000 | | 613,612 |
| | | | | | |
Tobacco Settlement Authority WA Tobacco Settlement Revenue Asset-Backed, 6.50%, Due 6/1/2026 | | 4,210,000 | | 4,347,036 | | 4,940,000 | | 5,100,797 | | 9,150,000 | | 9,447,833 |
| | | | | | |
Washington State Housing Finance Commission Crista Ministries Project A, 5.35%, Due 7/1/2014 | | | | | | 615,000 | | 618,727 | | 615,000 | | 618,727 |
| | | | | | |
Washington State HCFR Kadlec Medical Center Series A (Hospital Revenue, Guarantee Agreement), 5.00%, Due 12/1/2030 | | | | | | 785,000 | | 794,546 | | 785,000 | | 794,546 |
Washington State Health Care Facilities Authority Series B (Healthcare Facilities Revenue, MBIA Insured), 5.00%, Due 2/15/2027 | | 1,360,000 | | 1,372,335 | | 2,125,000 | | 2,144,274 | | 3,485,000 | | 3,516,609 |
Washington State Health Care Facilities Authority Series C (Health Facilities Financing Authority Revenue, Radian Insured), 5.38%, Due 8/15/2028 | | 1,220,000 | | 1,236,848 | | 1,900,000 | | 1,926,239 | | 3,120,000 | | 3,163,087 |
Washington State Health Care Facilities Authority Series C (Health Facilities Financing Authority Revenue, Radian Insured), 5.50%, Due 8/15/2036 | | 1,600,000 | | 1,626,192 | | 2,500,000 | | 2,540,925 | | 4,100,000 | | 4,167,117 |
Washington State Health Care Facilities Authority VA Mason Medical Series A (Health Facilities Financing Authority Revenue), 6.13%, Due 8/15/2037 | | 2,500,000 | | 2,441,400 | | 3,000,000 | | 2,929,680 | | 5,500,000 | | 5,371,080 |
Total Washington | | | | 13,476,833 | | | | 17,484,314 | | | | 30,961,147 |
West Virginia - 0.33% | | | | | | | | | | | | |
Berkley County WV Public Sewer Berkley County Referendum (Sewer Revenue), 5.00%, Due 10/1/2022 | | 500,000 | | 487,235 | | 500,000 | | 487,235 | | 1,000,000 | | 974,470 |
Ohio County WV Commission Sewage System Fort Henry Centre Financing District Series A (Tax Incremental Revenue), 5.85&, Due 06/01/2034 | | | | | | 600,000 | | 576,606 | | 600,000 | | 576,606 |
Ohio County WV Fort Henry Center Financing District Series A, 5.00%, Due 6/1/2015 | | 400,000 | | 384,404 | | 215,000 | | 211,205 | | 615,000 | | 595,609 |
Total West Virginia | | | | 871,639 | | | | 1,275,046 | | | | 2,146,685 |
Wisconsin - 3.91% | | | | | | | | | | | | |
Badger Tobacco Asset Securitization Corporation WI (Excise Tax Revenue), 5.75%, Due 6/1/2012 | | | | | | 380,000 | | 399,441 | | 380,000 | | 399,441 |
Badger WI Tobacco Asset Securitization Corporation Asset-Backed, 6.00%, Due 6/1/2017 | | 3,235,000 | | 3,286,081 | | 8,250,000 | | 8,380,268 | | 11,485,000 | | 11,666,349 |
Badger WI Tobacco Asset Securitization Corporation Asset-Backed (Other Revenue), 6.13%, Due 6/1/2027 | | | | | | 2,995,000 | | 3,098,140 | | 2,995,000 | | 3,098,140 |
Milwaukee WI RDA Revenue Science Education Consortium Project Series A, 5.75%, Due 8/1/2035 | | | | | | 1,200,000 | | 1,162,860 | | 1,200,000 | | 1,162,860 |
Oshkosh WI Don Evans Incorporated Project, 5.35%, Due 12/1/2010 | | | | | | 520,000 | | 522,168 | | 520,000 | | 522,168 |
Oshkosh WI Don Evans Incorporated Project, 5.50%, Due 12/1/2011 | | | | | | 390,000 | | 392,530 | | 390,000 | | 392,530 |
Southeast Wisconsin Professional Baseball Park District Series A (Sales Tax Revenue, MBIA Insured), 5.50%, Due 12/15/2017 | | | | | | 250,000 | | 285,173 | | 250,000 | | 285,173 |
| | | | | | |
Waukesha County WI Housing Authority The Arboretum Project, 5.00%, Due 12/1/2027§± | | | | | | 3,050,000 | | 2,964,082 | | 3,050,000 | | 2,964,082 |
| | | | | | |
Wisconsin Housing & Economic Development Authority Series D (Housing Revenue, GO of Authority), 5.05%, Due 11/1/2035 | | 2,035,000 | | 1,969,867 | | | | | | 2,035,000 | | 1,969,867 |
Wisconsin Housing & Economic Development Authority Series E, 4.90%, Due 11/1/2035 | | | | | | 3,030,000 | | 3,071,178 | | 3,030,000 | | 3,071,178 |
Wisconsin Housing & Economic Development Authority Series E (Housing Revenue, AMBAC Insured), 4.90%, Due 11/1/2035 | | | | | | 125,000 | | 126,931 | | 125,000 | | 126,931 |
Total Wisconsin | | | | 5,255,948 | | | | 20,402,771 | | | | 25,658,719 |
Wyoming - 1.00% | | | | | | | | | | | | |
Evansville WY Polypipe Incorporated Project (IDR, JPMorgan Chase Bank LOC), 4.65%, Due 12/1/2016 | | 3,000,000 | | 3,025,620 | | 3,500,000 | | 3,529,890 | | 6,500,000 | | 6,555,510 |
Total Wyoming | | | | 3,025,620 | | | | 3,529,890 | | | | 6,555,510 |
| | | | | | | | | | | | |
Total Municipal Bonds (Cost $243,154,180, $394,548,443 and $637,702,623, respectively) | | | | 245,197,801 | | | | 392,301,852 | | | | 637,499,653 |
| | | | | | | | | | | | |
| | |
| Proforma Portfolio of Investments - December 31, 2007 (Unaudited) | | Wells Fargo Advantage Funds |
| | | | | | | | | | | | | | | |
| | | National Tax-Free Fund | | Municipal Bond Fund | | Pro Forma Combined |
| | | Shares or
Principal
Amount | | Value
(Note 2) | | Shares or
Principal
Amount | | Value
(Note 2) | | Shares or
Principal
Amount | | Value
(Note 2) |
Short-Term Investments (a) 1.92% | | | | | | | | | | | | | | | |
Mutual Funds | | | | | | | | | | | | | | | |
Wells Fargo Advantage National Tax-Free Money Market Trust~‡ | | 8,372,754 | | | 8,372,754 | | 4,208,504 | | | 4,208,504 | | 12,581,258 | | | 12,581,258 |
| | | | | | | | | | | | | | | |
| | | | | | |
Total Short-Term Investments (Cost $8,372,754, $4,208,504 and $12,581,258, respectively) | | | | | 8,372,754 | | | | | 4,208,504 | | | | | 12,581,258 |
| | | | | | | | | | | | | | | |
Total Investments in Securities (Cost $251,526,934, $398,756,947 and $650,283,881, respectively) 99.10%* | | | | | 253,570,555 | | | | | 396,510,356 | | | | | 650,080,911 |
Other Assets and Liabilities, Net - 0.90% | | | | | 3,657,350 | | | | | 2,216,116 | | | | | 5,873,466 |
| | | | | | | | | | | | | | | |
Net Assets 100.0% | | | | $ | 257,227,905 | | | | $ | 398,726,472 | | | | $ | 655,954,377 |
| | | | | | | | | | | | | | | |
| § | These securities are subject to a demand feature which reduces the effective maturity. |
| ± | Variable rate investments. |
| ^ | Zero coupon bond. Interest rate presented is yield to maturity. |
| †† | Securities that may be resold to “qualified institutional buyers” under rule 144A or securities offered pursuant to section 4(2) of the Securities Act of 1933, as amended. |
| # | Security pledged as collateral for futures transactions. (See Note 2) |
| ~ | This Wells Fargo Advantage Fund invests cash balances that it retains for liquidity purposes in a Wells Fargo Advantage Money Market Fund. The Fund does not pay an investment advisory fee for such investments. |
| ‡ | Security of an affiliate of the Fund with a cost of $12,581,258 |
| * | Cost for federal income tax purposes is substantially the same as for financial reporting purposes. |
The accompanying notes are an integral part of these proforma financial statements.
| | |
| Proforma Statement of Assets and Liabilities - December 31, 2007 (Unaudited) | | Wells Fargo Advantage Funds |
| | | | | | | | | | | | | | | | |
| | | National
Tax-Free Fund | | | Municipal
Bond Fund | | | Proforma
Adjustments | | | Proforma
Combined | |
Assets | | | | | | | | | | | | | | | | |
Investments | | | | | | | | | | | | | | | | |
In securities, at market value | | $ | 245,197,801 | | | $ | 392,301,852 | | | | | | | $ | 637,499,653 | |
Investments in affiliates | | | 8,372,754 | | | | 4,208,504 | | | | | | | | 12,581,258 | |
| | | | | | | | | | | | | | | | |
Total investments at market value (see cost below) | | | 253,570,555 | | | | 396,510,356 | | | | — | | | | 650,080,911 | |
| | | | | | | | | | | | | | | | |
Cash | | | 50,000 | | | | — | | | | | | | | 50,000 | |
Receivable for Fund shares issued | | | 1,938,331 | | | | 222,629 | | | | | | | | 2,160,960 | |
Receivables for dividends and interest | | | 2,848,923 | | | | 4,212,643 | | | | | | | | 7,061,566 | |
| | | | | | | | | | | | | | | | |
Total assets | | | 258,407,809 | | | | 400,945,628 | | | | — | | | | 659,353,437 | |
| | | | | | | | | | | | | | | | |
| | | | |
Liabilities | | | | | | | | | | | | | | | | |
Payable for daily variation margin on futures contracts | | | 17,188 | | | | 73,125 | | | | | | | | 90,313 | |
Payable for Fund shares redeemed | | | 502 | | | | 28,911 | | | | | | | | 29,413 | |
Payable for investments purchased | | | — | | | | 201,411 | | | | | | | | 201,411 | |
Dividends payable | | | 953,885 | | | | 1,489,262 | | | | | | | | 2,443,147 | |
Payable to investment advisor and affiliates | | | 100,171 | | | | 165,045 | | | | | | | | 265,216 | |
Payable for interest rate swaps/spread locks | | | 44,105 | | | | 68,803 | | | | | | | | 112,908 | |
Accrued expenses and other liabilities | | | 64,053 | | | | 192,599 | | | | | | | | 256,652 | |
| | | | | | | | | | | | | | | | |
Total liabilities | | | 1,179,904 | | | | 2,219,156 | | | | — | | | | 3,399,060 | |
| | | | | | | | | | | | | | | | |
Total net assets | | $ | 257,227,905 | | | $ | 398,726,472 | | | $ | — | | | $ | 655,954,377 | |
| | | | | | | | | | | | | | | | |
| | | | |
NET ASSETS CONSIST OF | | | | | | | | | | | | | | | | |
Paid-in capital | | $ | 258,665,598 | | | $ | 402,192,853 | | | | | | | $ | 660,858,451 | |
Undistributed net investment income (loss) | | | 844,765 | | | | (57,589 | ) | | | | | | | 787,176 | |
Undistributed net realized gain (loss) on investments | | | (4,247,551 | ) | | | (1,003,035 | ) | | | | | | | (5,250,586 | ) |
Net unrealized appreciation (depreciation) of investments, foreign currencies and translation of assets and liabilities denominated in foreign currencies | | | 2,043,621 | | | | (2,246,591 | ) | | | | | | | (202,970 | ) |
Net unrealized appreciation (depreciation) of futures | | | (34,423 | ) | | | (90,363 | ) | | | | | | | (124,786 | ) |
Net unrealized appreciation (depreciation) of options, swap agreements, and short sales | | | (44,105 | ) | | | (68,803 | ) | | | | | | | (112,908 | ) |
| | | | | | | | | | | | | | | | |
Total net assets | | $ | 257,227,905 | | | $ | 398,726,472 | | | $ | — | | | $ | 655,954,377 | |
| | | | | | | | | | | | | | | | |
| | | | |
COMPUTATION OF NET ASSET VALUE AND OFFERING PRICE PER SHARE1 | | | | | | | | | | | | | | | | |
Net assets – Class A | | $ | 93,030,229 | | | $ | 123,692,639 | | | | | | | $ | 216,722,868 | |
Shares outstanding – Class A | | | 9,044,236 | | | | 13,081,330 | | | | 783,828 | 3 | | | 22,909,394 | |
Net asset value per share – Class A | | $ | 10.29 | | | $ | 9.46 | | | | | | | $ | 9.46 | |
Maximum offering price per share – Class A2 | | $ | 10.77 | | | $ | 9.91 | | | | | | | $ | 9.91 | |
Net assets – Class B | | $ | 10,735,501 | | | $ | 7,366,082 | | | | | | | $ | 18,101,583 | |
Shares outstanding – Class B | | | 1,043,523 | | | | 778,980 | | | | 90,984 | 4 | | | 1,913,487 | |
Net asset value and offering price per share – Class B | | $ | 10.29 | | | $ | 9.46 | | | | | | | $ | 9.46 | |
Net assets – Class C | | $ | 6,816,273 | | | $ | 1,955,754 | | | | | | | $ | 8,772,027 | |
Shares outstanding – Class C | | | 662,843 | | | | 206,887 | | | | 58,527 | 5 | | | 928,257 | |
Net asset value and offering price per share – Class C | | $ | 10.28 | | | $ | 9.45 | | | | | | | $ | 9.45 | |
Net assets – Administrator Class | | $ | 146,645,902 | | | $ | 15,750,745 | | | | | | | $ | 162,396,647 | |
Shares outstanding – Administrator Class | | | 14,254,848 | | | | 1,666,348 | | | | 1,263,634 | 6 | | | 17,184,830 | |
Net asset value and offering price per share – Administrator Class | | $ | 10.29 | | | $ | 9.45 | | | | | | | $ | 9.45 | |
Net assets – Investor Class | | | NA | | | $ | 249,961,252 | | | | | | | $ | 249,961,252 | |
Shares outstanding – Investor Class | | | NA | | | | 26,442,983 | | | | | | | | 26,442,983 | |
Net asset value and offering price per share – Investor Class | | | NA | | | $ | 9.45 | | | | | | | $ | 9.45 | |
| | | | | | | | | | | | | | | | |
Investments at cost | | $ | 251,526,934 | | | $ | 398,756,947 | | | $ | — | | | $ | 650,283,881 | |
| | | | | | | | | | | | | | | | |
1 | Each Fund has an unlimited number of authorized shares. |
2 | Maximum offering price is computed as 100/95.50 of net asset value. On investment of $50,000 or more, the offering price is reduced. |
3 | Class A shares of National Tax-Free Fund are exchanged for A shares of Municipal Bond Fund in an amount equal to the total value of the National Tax-Free Fund A shares divided by the current per share value of the Municipal Bond Fund A shares. |
4 | Class B shares of National Tax-Free Fund are exchanged for B shares of Municipal Bond Fund in an amount equal to the total value of the National Tax-Free Fund B shares divided by the current per share value of the Municipal Bond Fund B shares. |
5 | Class C shares of National Tax-Free Fund are exchanged for C shares of Municipal Bond Fund in an amount equal to the total value of the National Tax-Free Fund C shares divided by the current per share value of the Municipal Bond Fund C shares. |
6 | Administrator Class shares (“Adm shares”) of National Tax-Free Fund are exchanged for Adm shares of Municipal Bond Fund in an amount equal to the total value of the National Tax-Free Fund Adm shares divided by the current per share value of the Municipal Bond Fund Adm shares. |
The accompanying notes are an integral part of these proforma financial statements.
| | |
| Proforma Statement of Operations - For the Twelve Months Ended December 31, 2007 (Unaudited) | | Wells Fargo Advantage Funds |
| | | | | | | | | | | | | | | | |
| | | National
Tax-Free Fund | | | Municipal
Bond Fund | | | Proforma
Adjustments | | | Proforma
Combined | |
Investment Income | | | | | | | | | | | | | | | | |
Dividends | | $ | 9,672 | | | $ | — | | | | | | | $ | 9,672 | |
Interest | | | 12,920,414 | | | | 19,354,482 | | | | | | | | 32,274,896 | |
Income from affiliated securities | | | 281,311 | | | | 382,915 | | | | | | | | 664,226 | |
| | | | | | | | | | | | | | | | |
Total investment income | | | 13,211,397 | | | | 19,737,397 | | | | — | | | | 32,948,794 | |
| | | | | | | | | | | | | | | | |
| | | | |
Expenses | | | | | | | | | | | | | | | | |
Advisory fees | | | 1,058,388 | | | | 1,564,576 | | | | (68,468 | )1 | | | 2,554,496 | |
Administration fees | | | | | | | | | | | | | | | | |
Fund Level | | | 132,298 | | | | 195,572 | | | | | | | | 327,870 | |
Class A | | | 253,857 | | | | 357,355 | | | | | | | | 611,212 | |
Class B | | | 38,313 | | | | 24,447 | | | | | | | | 62,760 | |
Class C | | | 19,131 | | | | 5,866 | | | | | | | | 24,997 | |
Administrator Class | | | 153,418 | | | | 16,133 | | | | | | | | 169,551 | |
Investor Class | | | — | | | | 1,043,320 | | | | | | | | 1,043,320 | |
Custody fees | | | 52,920 | | | | 78,229 | | | | | | | | 131,149 | |
Shareholder servicing fees | | | 661,494 | | | | 967,086 | | | | | | | | 1,628,580 | |
Accounting fees | | | 33,025 | | | | 63,612 | | | | 10,031 | 1 | | | 106,668 | |
Distribution fees | | | | | | | | | | | | | | | | |
Class B | | | 102,621 | | | | 65,483 | | | | | | | | 168,104 | |
Class C | | | 51,242 | | | | 15,714 | | | | | | | | 66,956 | |
Professional fees | | | 27,224 | | | | 26,370 | | | | (9,376 | )2 | | | 44,218 | |
Registration fees | | | 42,807 | | | | 45,487 | | | | (12,019 | )2 | | | 76,275 | |
Shareholder reports | | | 34,406 | | | | 56,865 | | | | (22,818 | )2 | | | 68,453 | |
Trustees’ fees | | | 9,133 | | | | 9,133 | | | | (2,951 | )2 | | | 15,315 | |
Other fees and expenses | | | 6,302 | | | | 8,424 | | | | (600 | )2 | | | 14,126 | |
| | | | | | | | | | | | | | | | |
Total expenses | | | 2,676,579 | | | | 4,543,672 | | | | (106,201 | ) | | | 7,114,050 | |
| | | | | | | | | | | | | | | | |
| | | | |
Less | | | | | | | | | | | | | | | | |
Waived fees and reimbursed expenses | | | (656,923 | ) | | | (1,312,418 | ) | | | (106,953 | ) | | | (2,076,294 | ) |
Net expenses | | | 2,019,656 | | | | 3,231,254 | | | | (213,154 | ) | | | 5,037,756 | |
| | | | | | | | | | | | | | | | |
Net investment income (loss) | | | 11,191,741 | | | | 16,506,143 | | | | 213,154 | | | | 27,911,038 | |
| | | | | | | | | | | | | | | | |
| | | | |
REALIZED AND UNREALIZED GAIN (LOSS) ON INVESTMENTS | | | | | | | | | | | | | | | | |
| | | | |
Net realized gain (loss) from | | | | | | | | | | | | | | | | |
Securities, foreign currencies and foreign currency translation | | | 1,533,031 | | | | 5,760,986 | | | | | | | | 7,294,017 | |
Futures transactions | | | 396,758 | | | | 1,072,415 | | | | | | | | 1,469,173 | |
Options, swap agreements and short sale transactions | | | (141,106 | ) | | | (79,123 | ) | | | | | | | (220,229 | ) |
| | | | | | | | | | | | | | | | |
Net realized gain (loss) from Investments | | | 1,788,683 | | | | 6,754,278 | | | | — | | | | 8,542,961 | |
| | | | | | | | | | | | | | | | |
| | | | |
Net change in unrealized appreciation (depreciation) of | | | | | | | | | | | | | | | | |
Securities, foreign currencies and foreign currency translation | | | (6,579,550 | ) | | | (15,047,208 | ) | | | | | | | (21,626,758 | ) |
Futures transactions | | | (219,951 | ) | | | (90,363 | ) | | | | | | | (310,314 | ) |
Options, swap agreements and short sale transactions | | | (44,105 | ) | | | (68,803 | ) | | | | | | | (112,908 | ) |
| | | | | | | | | | | | | | | | |
| | | | |
Net change in unrealized appreciation (depreciation) of investments | | | (6,843,606 | ) | | | (15,206,374 | ) | | | — | | | | (22,049,980 | ) |
| | | | | | | | | | | | | | | | |
Net realized and unrealized gain (loss) on investments | | | (5,054,923 | ) | | | (8,452,096 | ) | | | — | | | | (13,507,019 | ) |
| | | | | | | | | | | | | | | | |
Net increase (decrease) in net assets resulting from operations | | $ | 6,136,818 | | | $ | 8,054,047 | | | $ | 213,154 | | | $ | 14,404,019 | |
| | | | | | | | | | | | | | | | |
1 | Based on contractual agreements of the surviving fund. |
2 | Estimated cost increases (savings) as a result of merging the funds. |
The accompanying notes are an integral part of these proforma financial statements.
| | |
| Proforma Portfolio of Investments - December 31, 2007 (Unaudited) | | Wells Fargo Advantage Funds |
| | | | | | | | | | | | | | | |
| | | National Limited-Term
Tax-Free Fund | | Short-Term Municipal
Bond Fund | | Pro Forma
Combined |
| | | Shares or
Principal
Amount | | Value
(Note 2) | | Shares or
Principal
Amount | | Value
(Note 2) | | Shares or
Principal
Amount | | Value
(Note 2) |
Municipal Bonds and Notes - 98.86% | | | | | | | | | | | | | | | |
Alabama - 0.95% | | | | | | | | | | | | | | | |
Lake Martin AL Area IDA (IDR) , 4.50%, Due 2/1/2010 | | | | | | | 3,945,000 | | $ | 3,959,202 | | 3,945,000 | | $ | 3,959,202 |
Wedowee Chimney Cove AL Improvement District Chimney Cove Project (Other Revenue) , 5.00%, Due 7/1/2037§± | | | | | | | 3,350,000 | | | 3,340,654 | | 3,350,000 | | | 3,340,654 |
Total Alabama | | | | | — | | | | | 7,299,856 | | | | | 7,299,856 |
Alaska - 0.42% | | | | | | | | | | | | | | | |
Alaska Energy Authority (Electric Revenue, First Security Bank LOC) , 7.00%, Due 7/1/2009 | | 380,000 | | $ | 393,167 | | | | | | | 380,000 | | | 393,167 |
Alaska Industrial Development & Export Authority (Utilities Revenue LOC) , 6.00%, Due 1/1/2015 | | | | | | | 460,000 | | | 473,717 | | 460,000 | | | 473,717 |
Northern Tobacco Securitization Corporation AK Tobacco Settlement Revenue Asset-Backed Prerefunded (Excise Tax Revenue) , 6.20%, Due 6/1/2022§ | | 916,000 | | | 958,218 | | 769,000 | | | 804,443 | | 1,685,000 | | | 1,762,661 |
Northern Tobacco Securitization Corporation AK Tobacco Settlement Revenue Asset-Backed Prerefunded (Excise Tax Revenue) , 6.50%, Due 6/1/2031§ | | | | | | | 550,000 | | | 592,004 | | 550,000 | | | 592,004 |
Total Alaska | | | | | 1,351,385 | | | | | 1,870,164 | | | | | 3,221,549 |
Arizona - 3.58% | | | | | | | | | | | | | | | |
| | | | | | |
Arizona Educational Loan Marketing Corporation Junior Subordinate Series , 6.30%, Due 12/1/2008 | | | | | | | 2,150,000 | | | 2,160,256 | | 2,150,000 | | | 2,160,256 |
Arizona Health Facilities Authority Phoenix Children’s Hospital Series B (Hospital Revenue) , 4.27%, Due 2/1/2042§± | | 1,275,000 | | | 1,259,063 | | 9,900,000 | | | 9,776,250 | | 11,175,000 | | | 11,035,313 |
Estrella Mountain AZ Ranch Community Facilities District (Property Tax Revenue) , 4.50%, Due 7/15/2009 | | | | | | | 265,000 | | | 265,034 | | 265,000 | | | 265,034 |
Estrella Mountain AZ Ranch Community Facilities District (Property Tax Revenue) , 4.70%, Due 7/15/2010 | | | | | | | 180,000 | | | 180,167 | | 180,000 | | | 180,167 |
Estrella Mountain AZ Ranch Community Facilities District (Property Tax Revenue) , 4.85%, Due 7/15/2011 | | | | | | | 185,000 | | | 185,198 | | 185,000 | | | 185,198 |
Estrella Mountain AZ Ranch Community Facilities District (Property Tax Revenue) , 5.00%, Due 7/15/2012 | | | | | | | 100,000 | | | 100,078 | | 100,000 | | | 100,078 |
Gilbert AZ Water Reserve Municipal Property Corporation Sub Lien (Water Revenue) , 4.75%, Due 10/1/2032 | | 850,000 | | | 873,996 | | 3,350,000 | | | 3,444,571 | | 4,200,000 | | | 4,318,567 |
Pima County AZ Industrial Development Authority Global Water Research Llc Project (Water Revenue) , 5.50%, Due 12/1/2013 | | | | | | | 1,635,000 | | | 1,616,835 | | 1,635,000 | | | 1,616,835 |
Quail Creek Community Facilities Distribution AZ (Other Revenue) , 4.85%, Due 7/15/2012 | | 690,000 | | | 679,892 | | | | | | | 690,000 | | | 679,892 |
Verrado AZ Community Facilities District #1 (Other Revenue) , 4.85%, Due 7/15/2014 | | 675,000 | | | 668,061 | | 1,500,000 | | | 1,484,580 | | 2,175,000 | | | 2,152,641 |
White Mountain AZ Apache Tribe Fort Apache Indian Reservation Fort Apache Timber Equipment Lease , 6.25%, Due 3/4/2012(i) | | | | | | | 2,398,500 | | | 2,412,651 | | 2,398,500 | | | 2,412,651 |
Yavapai County AZ Industrial Development Authority Waste Management Incorporated Project Series A-2 (Other Revenue) , 4.45%, Due 3/1/2028§± | | | | | | | 2,290,000 | | | 2,290,183 | | 2,290,000 | | | 2,290,183 |
Total Arizona | | | | | 3,481,012 | | | | | 23,915,803 | | | | | 27,396,815 |
Arkansas - 0.35% | | | | | | | | | | | | | | | |
| | | | | | |
Arkansas State Development Financial Authority Public Health Laboratory (HCFR, AMBAC Insured) , 3.90%, Due 12/1/2024 | | 540,000 | | | 539,390 | | | | | | | 540,000 | | | 539,390 |
Fayetteville AR (Sales Tax Revenue, First Security Bank LOC) , 4.125%, Due 11/1/2026 | | 500,000 | | | 499,575 | | | | | | | 500,000 | | | 499,575 |
| | | | | | |
Garland County AR Facilities Board , 4.20%, Due 10/1/2009 | | | | | | | 500,000 | | | 493,345 | | 500,000 | | | 493,345 |
| | | | | | |
Garland County AR Facilities Board , 4.30%, Due 10/1/2010 | | | | | | | 495,000 | | | 486,293 | | 495,000 | | | 486,293 |
| | | | | | |
Garland County AR Facilities Board , 4.40%, Due 10/1/2011 | | | | | | | 165,000 | | | 161,586 | | 165,000 | | | 161,586 |
Garland County AR Facilities Board , 4.50%, Due 10/1/2012 | | | | | | | 505,000 | | | 493,572 | | 505,000 | | | 493,572 |
Total Arkansas | | | | | 1,038,965 | | | | | 1,634,796 | | | | | 2,673,761 |
California - 10.61% | | | | | | | | | | | | | | | |
| | | | | | |
ABAG Finance Authority for Nonprofit Corporations San Diego CA Hospital Association Series C , 4.00%, Due 3/1/2008 | | | | | | | 105,000 | | | 105,033 | | 105,000 | | | 105,033 |
California Rural Home Mortgage Finance Authority Mortgage-Backed Program Series C Puttable (Housing Revenue, GNMA Insured) , 4.10%, Due 8/1/2039§ | | | | | | | 2,500,000 | | | 2,524,725 | | 2,500,000 | | | 2,524,725 |
| | |
| Proforma Portfolio of Investments - December 31, 2007 (Unaudited) | | Wells Fargo Advantage Funds |
| | | | | | | | | | | | |
| | | National Limited-Term
Tax-Free Fund | | Short-Term Municipal
Bond Fund | | Pro Forma
Combined |
| | | Shares or
Principal
Amount | | Value
(Note 2) | | Shares or
Principal
Amount | | Value
(Note 2) | | Shares or
Principal
Amount | | Value
(Note 2) |
California Rural Home Mortgage Finance Authority Mortgage-Backed Securities Program Series E (Housing Revenue, GNMA) , 4.35%, Due 2/1/2024 | | | | | | 1,630,000 | | 1,653,619 | | 1,630,000 | | 1,653,619 |
California Rural Home Mortgage Finance Authority Mortgage-Backed Securities Series D (Other Revenue, GNMA) , 4.30%, Due 8/1/2024 | | | | | | 2,500,000 | | 2,545,400 | | 2,500,000 | | 2,545,400 |
California Statewide CDA Eskaton Properties Incorporated (HCFR LOC) , 2.50%, Due 5/15/2029§± | | | | | | 500,000 | | 500,000 | | 500,000 | | 500,000 |
California Statewide CDA Eskaton Properties Incorporated Convertible (HCFR LOC) , 2.50%, Due 5/15/2029§± | | | | | | 4,950,000 | | 4,950,000 | | 4,950,000 | | 4,950,000 |
California Statewide CDA International School Peninsula Project (GO - States, Territories) , 4.60%, Due 11/1/2013 | | 435,000 | | 426,478 | | 595,000 | | 583,344 | | 1,030,000 | | 1,009,822 |
California Statewide CDA Retirement Housing Foundation , 5.50%, Due 12/1/2028§± | | | | | | 4,400,000 | | 4,400,000 | | 4,400,000 | | 4,400,000 |
Dinuba CA Redevelopment Agency Merged City Redevelopment Project #2 (Other Revenue) , 4.45%, Due 10/1/2011 | | | | | | 3,300,000 | | 3,304,719 | | 3,300,000 | | 3,304,719 |
Foothill CA Eastern Transportation Corridor Agency (Toll Road Revenue) , 5.25%, Due 7/15/2010 | | 500,000 | | 496,330 | | 3,400,000 | | 3,375,044 | | 3,900,000 | | 3,871,374 |
Golden State Tobacco Securitization Corporation CA Series 2003 A1 Prerefunded (Excise Tax Revenue) , 6.25%, Due 6/1/2033§ | | 3,095,000 | | 3,391,192 | | 41,530,000 | | 45,504,421 | | 44,625,000 | | 48,895,613 |
Monrovia CA Redevelopment Agency Century Redevelopment Project Area #1 (Tax Incremental Revenue) , 4.40%, Due 6/1/2012 | | 500,000 | | 495,950 | | 2,500,000 | | 2,479,750 | | 3,000,000 | | 2,975,700 |
Oxnard CA Harbor District (Airport Revenue, ACA Insured) , 5.65%, Due 8/1/2014 | | | | | | 1,520,000 | | 1,530,883 | | 1,520,000 | | 1,530,883 |
Santa Rosa CA Rancheria Tachi Yokut Tribe Enterprise (Other Revenue) , 4.50%, Due 3/1/2011 | | | | | | 2,075,000 | | 2,069,439 | | 2,075,000 | | 2,069,439 |
Santa Rosa CA Rancheria Tachi Yokut Tribe Enterprise (Other Revenue) , 5.50%, Due 3/1/2008 | | | | | | 850,000 | | 850,604 | | 850,000 | | 850,604 |
Total California | | | | 4,809,950 | | | | 76,376,981 | | | | 81,186,931 |
Colorado - 2.47% | | | | | | | | | | | | |
Aurora CO Woodridge Apartments Project MFHR , 4.25%, Due 12/20/2040§± | | 1,500,000 | | 1,498,710 | | 12,750,000 | | 12,739,035 | | 14,250,000 | | 14,237,745 |
Colorado ECFA Charter School Renaissance School Project (Lease Revenue) , 5.85%, Due 6/1/2008 | | 55,000 | | 54,897 | | | | | | 55,000 | | 54,897 |
Colorado ECFA Denver Academy Series A , 5.00%, Due 5/1/2008 | | | | | | 395,000 | | 394,700 | | 395,000 | | 394,700 |
Colorado ECFA Pinnacle Charter School Project (Lease Revenue) , 5.25%, Due 12/1/2011 | | 430,000 | | 449,290 | | | | | | 430,000 | | 449,290 |
Colorado Health Facilities Evangelical Unrefunded (HFFA) , 6.25%, Due 12/1/2010 | | 70,000 | | 73,381 | | | | | | 70,000 | | 73,381 |
Colorado Health Facilities Health Evangelical Prerefunded(HFFA) , 6.25%, Due 12/1/2010§ | | 280,000 | | 294,445 | | | | | | 280,000 | | 294,445 |
Colorado Hospital Steamboat Springs Health (HCFR) , 5.3%, Due 9/15/2009 | | 215,000 | | 218,115 | | | | | | 215,000 | | 218,115 |
Denver City & County CO (Housing Revenue) , 7.00%, Due 8/1/2010 | | 530,000 | | 563,236 | | | | | | 530,000 | | 563,236 |
Eagle County CO Airport Terminal Project Series A (Airport Revenue) , 5.00%, Due 5/1/2011 | | 780,000 | | 773,464 | | 750,000 | | 743,715 | | 1,530,000 | | 1,517,179 |
Meridian Metropolitan District CO Series A (Property Tax Revenue, Radian Insured) , 5.375%, Due 12/1/2013 | | 1,115,000 | | 1,151,249 | | | | | | 1,115,000 | | 1,151,249 |
Total Colorado | | | | 5,076,787 | | | | 13,877,450 | | | | 18,954,237 |
Connecticut - 1.07% | | | | | | | | | | | | |
Connecticut State Health & Educational Facility Authority Hospital For Special Care Series D (Educational Facilities Revenue, Radian Insured) , 4.15%, Due 7/1/1937§± | | 750,000 | | 750,000 | | 4,750,000 | | 4,750,000 | | 5,500,000 | | 5,500,000 |
Connecticut State HEFA New Opportunities for Waterbury Series A (Lease Revenue LOC) , 6.75%, Due 7/1/2013 | | | | | | 815,000 | | 826,011 | | 815,000 | | 826,011 |
Mashantucket Western Pequot Tribe CT Subseries B (Special Tax Revenue) , 3.94%, Due 9/1/2009^ | | | | | | 2,000,000 | | 1,874,080 | | 2,000,000 | | 1,874,080 |
Total Connecticut | | | | 750,000 | | | | 7,450,091 | | | | 8,200,091 |
Delaware - 0.55% | | | | | | | | | | | | |
Delaware State Christiana Care Health Services (HCFR, AMBAC Insured) , 5.25%, Due 10/1/2010 | | | | | | 2,660,000 | | 2,795,873 | | 2,660,000 | | 2,795,873 |
Delaware State Housing Authority Senior Single Family Mortage Series D-1 (Housing Revenue) , 4.625%, Due 1/1/2023 | | | | | | 1,425,000 | | 1,439,321 | | 1,425,000 | | 1,439,321 |
Total Delaware | | | | — | | | | 4,235,194 | | | | 4,235,194 |
| | |
| Proforma Portfolio of Investments - December 31, 2007 (Unaudited) | | Wells Fargo Advantage Funds |
| | | | | | | | | | | | |
| | | National Limited-Term
Tax-Free Fund | | Short-Term Municipal
Bond Fund | | Pro Forma
Combined |
| | | Shares or
Principal
Amount | | Value
(Note 2) | | Shares or
Principal
Amount | | Value
(Note 2) | | Shares or
Principal
Amount | | Value
(Note 2) |
District of Columbia - 0.23% | | | | | | | | | | | | |
District of Columbia Housing Finance Agency Wesley House Apartments Project B (Housing Revenue) , 4.10%, Due 3/1/2009 | | | | | | 1,000,000 | | 1,005,510 | | 1,000,000 | | 1,005,510 |
District of Columbia Tobacco Settlement Financing Corporation , 5.375%, Due 5/15/2010 | | | | | | 740,000 | | 759,566 | | 740,000 | | 759,566 |
Total District of Columbia | | | | — | | | | 1,765,076 | | | | 1,765,076 |
Florida - 5.25% | | | | | | | | | | | | |
Arcadia FL Housing Authority Arcadia Oaks Association Limited Project (Housing Revenue, GIC-Rabobank Nederland LOC) , 4.25%, Due 1/1/2012 | | | | | | 2,800,000 | | 2,796,948 | | 2,800,000 | | 2,796,948 |
Ave Maria Stewardship Community Development District FL (Other Revenue) , 4.80%, Due 11/1/2012 | | 400,000 | | 367,784 | | 3,250,000 | | 2,988,245 | | 3,650,000 | | 3,356,029 |
Boynton Beach FL (Water Revenue, FGIC Insured) , 5.00%, Due 11/1/2012 | | 630,000 | | 654,835 | | | | | | 630,000 | | 654,835 |
Bradford County FL Sante Fe Healthcare Facilities Project (HCFR) , 6.00%, Due 11/15/2009 | | 80,000 | | 82,619 | | | | | | 80,000 | | 82,619 |
Brevard County FL HFA Series B (Housing Revenue LOC) , 6.50%, Due 9/1/2022 | | | | | | 133,000 | | 139,032 | | 133,000 | | 139,032 |
Brevard County FL Retirement Housing Funding (HCFR LOC) , 5.50%, Due 12/1/2028§± | | | | | | 3,400,000 | | 3,400,000 | | 3,400,000 | | 3,400,000 |
Broward County FL Health Facilities Authority Catholic Health Services (HCFR, SunTrust Bank LOC) , 5.50%, Due 8/15/2014 | | 500,000 | | 522,595 | | | | | | 500,000 | | 522,595 |
Charlotte County FL IDA Bond Anticipation Notes (Other Revenue) , 5.75%, Due 10/1/2008 | | 710,000 | | 706,031 | | 3,370,000 | | 3,351,162 | | 4,080,000 | | 4,057,193 |
Citizens Property Insurance Corporation FL High Risk Account Series A (Other Revenue, MBIA Insured) , 5.00%, Due 3/1/2012 | | 1,000,000 | | 1,053,400 | | | | | | 1,000,000 | | 1,053,400 |
Citizens Property Insurance Corporation Florida High Risk Account Series A (Other Revenue, MBIA Insured) , 5.00%, Due 3/1/2011 | | | | | | 1,550,000 | | 1,618,433 | | 1,550,000 | | 1,618,433 |
Connerton West Community Development District FL Series B (Other Revenue) , 5.125%, Due 5/1/2016 | | | | | | 1,500,000 | | 1,343,775 | | 1,500,000 | | 1,343,775 |
Escambia County FL HFA Multi County Program Series A1 (SFHR, FHLMC) , 4.15%, Due 10/1/2021 | | | | | | 1,200,000 | | 1,217,244 | | 1,200,000 | | 1,217,244 |
Escambia County FL HFA Multi County Program Series A2 (Housing Revenue LOC) , 6.95%, Due 4/1/2024 | | | | | | 770,000 | | 798,867 | | 770,000 | | 798,867 |
Highlands County FL Health Facilities Authority Adventist Health System Series G (HCFR LOC) , 5.00%, Due 11/15/2009 | | | | | | 435,000 | | 444,566 | | 435,000 | | 444,566 |
Highlands County FL Health Facilities Authority Adventist Health System Series G (HCFR LOC) , 5.00%, Due 11/15/2010 | | | | | | 400,000 | | 411,720 | | 400,000 | | 411,720 |
Hillsborough County FL (Sewer Revenue) , 6.20%, Due 12/1/2008 | | 265,000 | | 269,147 | | | | | | 265,000 | | 269,147 |
Jacksonville FL Economic Development Commission Metropolitan Parking Solutions Project (IDR LOC) , 3.625%, Due 10/1/2008 | | | | | | 455,000 | | 450,373 | | 455,000 | | 450,373 |
Jacksonville FL Economic Development Commission Metropolitan Parking Solutions Project (IDR LOC) , 3.80%, Due 10/1/2009 | | | | | | 5,000 | | 4,893 | | 5,000 | | 4,893 |
Lee County FL IDA Shell Partnership Alliance Community Project (HCFR) , 5.00%, Due 11/15/2009 | | | | | | 1,000,000 | | 1,007,760 | | 1,000,000 | | 1,007,760 |
Manatee County FL HFA Single Family Subseries 2 (Housing Revenue LOC) , 6.50%, Due 11/1/2023 | | | | | | 155,000 | | 157,072 | | 155,000 | | 157,072 |
Miami Dade County FL School Board Series B (Lease Revenue, MBIA Insured) , 5.50%, Due 5/1/2030§± | | | | | | 2,500,000 | | 2,654,275 | | 2,500,000 | | 2,654,275 |
Orange County FL Orlando Regional Series B (HCFR, Radian Insured) , 6.74%, Due 10/27/2022§± | | | | | | 2,800,000 | | 2,800,000 | | 2,800,000 | | 2,800,000 |
| | | | | | |
Punta Gorda FL Housing Authority Gulf Breeze Apartments Series B (Housing Revenue) , 4.125%, Due 7/1/2010 | | | | | | 1,700,000 | | 1,709,027 | | 1,700,000 | | 1,709,027 |
South Broward Hospital District FL Series A (Hospital Revenue, MBIA Insured) , 5.00%, Due 5/1/2011 | | 1,000,000 | | 1,049,970 | | 1,610,000 | | 1,690,452 | | 2,610,000 | | 2,740,422 |
St. Johns County FL IDA Health Care Glenmoor St. Johns Project Series A Prerefunded (Nursing Home Revenue) , 8.00%, Due 1/1/2017§ | | | | | | 650,000 | | 713,895 | | 650,000 | | 713,895 |
Tax Exempt Municipal Infrastructure Trust Certificates FL Series 2004 C Class A , 4.05%, Due 11/1/2008 | | | | | | 1,448,000 | | 1,441,441 | | 1,448,000 | | 1,441,441 |
Volusia County FL IDA (HCFR LOC, ACA Insured) , 5.50%, Due 12/1/2028§± | | 1,450,000 | | 1,450,000 | | 2,900,000 | | 2,900,000 | | 4,350,000 | | 4,350,000 |
Total Florida | | | | 6,156,381 | | | | 34,039,180 | | | | 40,195,561 |
| | |
| Proforma Portfolio of Investments - December 31, 2007 (Unaudited) | | Wells Fargo Advantage Funds |
| | | | | | | | | | | | |
| | | National Limited-Term
Tax-Free Fund | | Short-Term Municipal
Bond Fund | | Pro Forma
Combined |
| | | Shares or
Principal
Amount | | Value
(Note 2) | | Shares or
Principal
Amount | | Value
(Note 2) | | Shares or
Principal
Amount | | Value
(Note 2) |
Georgia - 0.65% | | | | | | | | | | | | |
Atlanta GA Series A (Water Revenue LOC) , 5.50%, Due 11/1/2011 | | | | | | 1,000,000 | | 1,075,200 | | 1,000,000 | | 1,075,200 |
Dalton GA School District Equipment Lease Purchase , 4.20%, Due 8/1/2013(i) | | | | | | 2,097,579 | | 2,099,173 | | 2,097,579 | | 2,099,173 |
Dalton GA School District Lease #996-021203 Series B , 4.20%, Due 8/1/2013(i) | | | | | | 776,996 | | 777,586 | | 776,996 | | 777,586 |
Gainesville GA School District Equipment Lease Purchase , 4.20%, Due 3/1/2013(i) | | | | | | 650,821 | | 651,029 | | 650,821 | | 651,029 |
Putnam County GA School District Equipment Lease Purchase , 4.20%, Due 3/1/2013(i) | | | | | | 389,276 | | 389,401 | | 389,276 | | 389,401 |
Total Georgia | | | | — | | | | 4,992,389 | | | | 4,992,389 |
Hawaii - 0.41% | | | | | | | | | | | | |
Hawaii State (Airport Revenue, FGIC Insured) , 5.75%, Due 7/1/2015 | | | | | | 3,000,000 | | 3,152,880 | | 3,000,000 | | 3,152,880 |
Total Hawaii | | | | — | | | | 3,152,880 | | | | 3,152,880 |
Illinois - 3.27% | | | | | | | | | | | | |
| | | | | | |
Aurora IL (Tax Allocation Revenue) , 5.00%, Due 12/30/2010 | | 1,050,000 | | 1,044,236 | | | | | | 1,050,000 | | 1,044,236 |
Aurora IL Series B , 4.90%, Due 12/30/2011 | | | | | | 2,850,000 | | 2,823,011 | | 2,850,000 | | 2,823,011 |
| | | | | | |
Aurora IL Tax Incremental Revenue , 5.00%, Due 12/30/2008 | | | | | | 940,000 | | 939,455 | | 940,000 | | 939,455 |
| | | | | | |
Aurora IL Tax Incremental Revenue , 5.00%, Due 12/30/2009 | | | | | | 990,000 | | 988,515 | | 990,000 | | 988,515 |
Chicago IL Junior Lien Near South Redevelopment Project Series A (Tax Revenue, Aca Insured) , 5.00%, Due 11/15/2010 | | | | | | 750,000 | | 737,970 | | 750,000 | | 737,970 |
Chicago IL Series 2E (Housing Revenue, GNMA) , 4.375%, Due 12/1/2017 | | | | | | 1,215,000 | | 1,235,363 | | 1,215,000 | | 1,235,363 |
Chicago IL Series A (Property Tax Revenue, MBIA Insured) , 5.375%, Due 1/1/2013 | | 1,200,000 | | 1,273,092 | | | | | | 1,200,000 | | 1,273,092 |
Chicago IL Series C (Housing Revenue, GNMA) , 4.20%, Due 6/1/2022 | | | | | | 1,485,000 | | 1,505,196 | | 1,485,000 | | 1,505,196 |
Chicago IL Series E (Housing Revenue, GNMA) , 4.15%, Due 6/1/2022 | | | | | | 2,200,000 | | 2,225,762 | | 2,200,000 | | 2,225,762 |
Cook County IL School District #159 Matteson-Richton Park (Other Revenue) , 6.00%, Due 4/1/2008 | | | | | | 1,640,000 | | 1,650,168 | | 1,640,000 | | 1,650,168 |
Illinois Chicago Charter School Project (Educational Facilities Revenue) , 4.50%, Due 12/1/2012 | | 200,000 | | 197,736 | | 400,000 | | 395,472 | | 600,000 | | 593,208 |
Illinois Chicago Charter School Project (Educational Facilities Revenue) , 5.00%, Due 12/1/2014 | | 360,000 | | 361,656 | | | | | | 360,000 | | 361,656 |
Illinois Finance Authority Community Rehabilitation Providers Series A , 5.375%, Due 7/1/2009 | | | | | | 270,000 | | 274,447 | | 270,000 | | 274,447 |
Illinois Finance Authority New Money Community Rehabilitation Series A (Other Revenue) , 4.75%, Due 7/1/2010 | | | | | | 1,480,000 | | 1,493,527 | | 1,480,000 | | 1,493,527 |
Illinois Finance Authority New Money Community Rehabilitation Series A (Other Revenue) , 4.80%, Due 7/1/2011 | | | | | | 1,440,000 | | 1,458,504 | | 1,440,000 | | 1,458,504 |
Illinois Finance Authority New Money Community Rehabilitation Series A (Other Revenue) , 4.85%, Due 7/1/2012 | | | | | | 1,000,000 | | 1,011,680 | | 1,000,000 | | 1,011,680 |
Illinois Finance Authority Primary Health Care Centers , 4.625%, Due 7/1/2008 | | | | | | 110,000 | | 109,473 | | 110,000 | | 109,473 |
Illinois Health Facilities Authority Decatur Memorial Hospital (Hospital Revenue) , 5.50%, Due 10/1/2010 | | | | | | 1,050,000 | | 1,094,174 | | 1,050,000 | | 1,094,174 |
Illinois Health Facilities Authority Memorial Medical Center Systems Project (HCFR LOC) , 5.25%, Due 10/1/2009 | | | | | | 385,000 | | 393,362 | | 385,000 | | 393,362 |
Illinois Housing Development Authority (Housing Revenue, First Security Bank LOC) , 4.375%, Due 7/1/2015 | | | | | | 100,000 | | 100,783 | | 100,000 | | 100,783 |
Illinois Lutheran General Health Systems Series A (HCFR, First Security Bank LOC) , 6.125%, Due 4/1/2012 | | 645,000 | | 680,875 | | | | | | 645,000 | | 680,875 |
Illinois Methodist Medical Center (HFFA Revenue, MBIA Insured) , 5.50%, Due 11/15/2010 | | 500,000 | | 514,525 | | | | | | 500,000 | | 514,525 |
North Chicago IL (Property Tax Revenue, FGIC Insured) , 5.75%, Due 1/1/2010 | | 800,000 | | 840,016 | | | | | | 800,000 | | 840,016 |
Salem IL Americana Building Products , 4.30%, Due 4/1/2017§± | | | | | | 1,355,000 | | 1,355,000 | | 1,355,000 | | 1,355,000 |
Upper Illinois River Valley Development Authority Morris Hospital , 6.05%, Due 12/1/2011 | | | | | | 280,000 | | 297,478 | | 280,000 | | 297,478 |
Total Illinois | | | | 4,912,136 | | | | 20,089,340 | | | | 25,001,476 |
Indiana - 1.38% | | | | | | | | | | | | |
Beech Grove IN School Building Corporation (Lease Revenue, MBIA Insured) , 6.25%, Due 7/5/2016 | | | | | | 765,000 | | 864,305 | | 765,000 | | 864,305 |
| | |
| Proforma Portfolio of Investments - December 31, 2007 (Unaudited) | | Wells Fargo Advantage Funds |
| | | | | | | | | | | | |
| | | National Limited-Term
Tax-Free Fund | | Short-Term Municipal
Bond Fund | | Pro Forma
Combined |
| | | Shares or
Principal
Amount | | Value
(Note 2) | | Shares or
Principal
Amount | | Value
(Note 2) | | Shares or
Principal
Amount | | Value
(Note 2) |
Indiana Bond Bank BMA Index Series B (Other Revenue) , 3.64%, Due 10/15/2009± | | | | | | 2,000,000 | | 1,998,000 | | 2,000,000 | | 1,998,000 |
Indiana Bond Bank BMA Index Series B (Other Revenue) , 3.66%, Due 10/15/2010± | | | | | | 3,670,000 | | 3,666,330 | | 3,670,000 | | 3,666,330 |
Jeffersonville IN Building Corporation Series A (Other Revenue) , 4.00%, Due 8/15/2012 | | | | | | 595,000 | | 596,226 | | 595,000 | | 596,226 |
Jeffersonville IN Building Corporation Series B (Other Revenue) , 4.00%, Due 8/15/2012 | | | | | | 280,000 | | 280,577 | | 280,000 | | 280,577 |
Shelby County IN Jail Building Corporation , 5.40%, Due 7/15/2008 | | | | | | 1,045,000 | | 1,046,965 | | 1,045,000 | | 1,046,965 |
Valparaiso IN Valparaiso Family YMCA (Other Revenue) , 4.70%, Due 12/1/2009 | | | | | | 650,000 | | 647,134 | | 650,000 | | 647,134 |
West Baden Springs IN Town Hall Special Revenue BAN (Other Revenue) , 5.00%, Due 11/1/2011 | | | | | | 1,500,000 | | 1,504,845 | | 1,500,000 | | 1,504,845 |
Total Indiana | | | | — | | | | 10,604,382 | | | | 10,604,382 |
Iowa - 2.51% | | | | | | | | | | | | |
Muscatine IA (Electric Revenue) , 9.70%, Due 1/1/2013 | | | | | | 490,000 | | 553,597 | | 490,000 | | 553,597 |
Tobacco Settlement Authority IA Tobacco Settlement Revenue Asset-Backed Series B (Excise Tax Revenue LOC) , 5.50%, Due 6/1/2011 | | 2,000,000 | | 2,140,340 | | 2,180,000 | | 2,332,971 | | 4,180,000 | | 4,473,311 |
Tobacco Settlement Authority IA Tobacco Settlement Revenue Asset-Backed Series B Prerefunded (Excise Tax Revenue LOC) , 5.3%, Due 6/1/2025§ | | | | | | 10,775,000 | | 11,453,502 | | 10,775,000 | | 11,453,502 |
Tobacco Settlement Authority IA Tobacco Settlement Revenue Asset-Backed Series B Prerefunded (Excise Tax Revenue LOC) , 5.50%, Due 6/1/2012§ | | | | | | 180,000 | | 193,937 | | 180,000 | | 193,937 |
Tobacco Settlement Authority IA Tobacco Settlement Revenue Asset-Backed Series B Prerefunded (Excise Tax Revenue LOC) , 5.50%, Due 6/1/2013§ | | | | | | 1,895,000 | | 2,041,730 | | 1,895,000 | | 2,041,730 |
Tobacco Settlement Authority IA Tobacco Settlement Revenue Asset-Backed Series B Prerefunded (Excise Tax Revenue LOC) , 5.50%, Due 6/1/2014§ | | | | | | 460,000 | | 495,618 | | 460,000 | | 495,618 |
Total Iowa | | | | 2,140,340 | | | | 17,071,355 | | | | 19,211,695 |
Kansas - 2.68% | | | | | | | | | | | | |
City of Olathe KS Special Obligation West Village Center Project (Other Revenue) , 5.00%, Due 3/1/2011 | | | | | | 225,000 | | 224,465 | | 225,000 | | 224,465 |
City of Olathe KS Special Obligation West Village Center Project (Other Revenue) , 5.00%, Due 9/1/2009 | | | | | | 100,000 | | 99,962 | | 100,000 | | 99,962 |
City of Olathe KS Special Obligation West Village Center Project (Other Revenue) , 5.00%, Due 9/1/2010 | | | | | | 205,000 | | 204,783 | | 205,000 | | 204,783 |
City of Olathe KS Special Obligation West Village Center Project (Other Revenue) , 5.00%, Due 9/1/2011 | | | | | | 200,000 | | 199,456 | | 200,000 | | 199,456 |
Counties of Sedwick & Shawnee KS Series B5 (Housing Revenue, GNMA) , 4.10%, Due 12/1/2023 | | | | | | 1,945,000 | | 1,972,133 | | 1,945,000 | | 1,972,133 |
Kansas Independent College Finance Authority Revenue Anticipation Notes Bethel University Series B (Other Revenue) , 5.25%, Due 5/1/2008 | | | | | | 1,500,000 | | 1,500,675 | | 1,500,000 | | 1,500,675 |
Kansas Independent College Finance Authority Revenue Anticipation Notes Ottawa University Series E (Other Revenue) , 5.25%, Due 5/1/2008 | | | | | | 3,000,000 | | 3,001,350 | | 3,000,000 | | 3,001,350 |
Kansas Independent College Finance Authority Revenue Anticipation Notes Southwestern (Other Revenue) , 5.25%, Due 5/1/2008 | | | | | | 800,000 | | 800,360 | | 800,000 | | 800,360 |
Manhattan KS Transportation Development District , 4.15%, Due 8/1/2015 | | | | | | 295,000 | | 304,915 | | 295,000 | | 304,915 |
Olathe KS Special Obligation West Village Center Project (Tax Incremental Revenue) , 5.00%, Due 3/1/2012 | | 100,000 | | 99,326 | | | | | | 100,000 | | 99,326 |
Olathe KS Special Obligation West Village Center Project (Tax Incremental Revenue) , 5.00%, Due 9/1/2012 | | 100,000 | | 99,255 | | | | | | 100,000 | | 99,255 |
Wyandotte County KS United Government Referendum Sales Tax Second Lien Area B (Sales Tax Revenue) , 5.00%, Due 12/1/2020 | | 500,000 | | 494,360 | | 3,700,000 | | 3,658,264 | | 4,200,000 | | 4,152,624 |
Wyandotte County KS United Government Special Obligation Sales Tax Second Lien Area B (Other Revenue, Citibank NA LOC) , 3.75%, Due 12/1/2012 | | | | | | 3,735,000 | | 3,723,272 | | 3,735,000 | | 3,723,272 |
Wyandotte County KS United Government Special Obligation Sales Tax Second Lien Area B (Other Revenue, Citibank NA LOC) , 3.85%, Due 12/1/2013 | | | | | | 2,100,000 | | 2,108,421 | | 2,100,000 | | 2,108,421 |
Wyandotte County KS United Government Special Obligation Sales Tax Second Lien Area B , 4.75%, Due 12/1/2016 | | | | | | 2,000,000 | | 1,987,020 | | 2,000,000 | | 1,987,020 |
Total Kansas | | | | 692,941 | | | | 19,785,076 | | | | 20,478,017 |
| | |
| Proforma Portfolio of Investments - December 31, 2007 (Unaudited) | | Wells Fargo Advantage Funds |
| | | | | | | | | | | | |
| | | National Limited-Term
Tax-Free Fund | | Short-Term Municipal
Bond Fund | | Pro Forma
Combined |
| | | Shares or
Principal
Amount | | Value
(Note 2) | | Shares or
Principal
Amount | | Value
(Note 2) | | Shares or
Principal
Amount | | Value
(Note 2) |
Kentucky - 3.01% | | | | | | | | | | | | |
Ashland KY PCR , 5.70%, Due 11/1/2009 | | | | | | 6,340,000 | | 6,633,605 | | 6,340,000 | | 6,633,605 |
Kenton County KY Airport Board (Airport Revenue, MBIA Insured) , 5.625%, Due 3/1/2015 | | | | | | 1,710,000 | | 1,812,412 | | 1,710,000 | | 1,812,412 |
Kenton County KY Airport Board Cincinnati Northern Kentucky Series A (Airport Revenue, XL Capital Assurance Company Insured) , 5.00%, Due 3/1/2012 | | | | | | 2,590,000 | | 2,678,319 | | 2,590,000 | | 2,678,319 |
Kenton County KY Airport Board Cincinnati Northern Kentucky Series A (Airport Revenue, Xl Capital Assurance Company Insured) , 5.00%, Due 3/1/2013 | | | | | | 2,740,000 | | 2,839,024 | | 2,740,000 | | 2,839,024 |
Kenton County KY Airport Board Cincinnati Northern Kentucky Series B (Airport Revenue, XL Capital Assurance Company Insured) , 5.00%, Due 3/1/2012 | | | | | | 5,830,000 | | 6,028,803 | | 5,830,000 | | 6,028,803 |
Kenton County KY Airport Board Series A (Airport Revenue, MBIA Insured) , 5.625%, Due 3/6/2014 | | 475,000 | | 505,581 | | | | | | 475,000 | | 505,581 |
Kentucky EDFA Retirement Housing Foundation (HCFR LOC) , 5.50%, Due 12/1/2028§± | | | | | | 400,000 | | 400,000 | | 400,000 | | 400,000 |
Louisville & Jefferson County KY Regional Airport Authority Series A (Airport Revenue, First Security Bank LOC) , 5.75%, Due 7/1/2015 | | | | | | 2,000,000 | | 2,155,140 | | 2,000,000 | | 2,155,140 |
Total Kentucky | | | | 505,581 | | | | 22,547,303 | | | | 23,052,884 |
Louisiana - 1.07% | | | | | | | | | | | | |
Louisiana PFA Revenue Archdiocese of New Orleans Project (HCFR, CIFG Insured) , 5.00%, Due 7/1/2010 | | 160,000 | | 165,581 | | | | | | 160,000 | | 165,581 |
Louisiana PFA Revenue Archdiocese of New Orleans Project (HCFR, CIFG Insured) , 5.00%, Due 7/1/2012 | | 100,000 | | 105,301 | | | | | | 100,000 | | 105,301 |
Louisiana Public Facilities Authority (Hospital Revenue) , 5.00%, Due 7/1/1930§± | | | | | | 3,625,000 | | 3,625,000 | | 3,625,000 | | 3,625,000 |
New Orleans LA Home Mortgage Authority Special Obligations , 6.25%, Due 1/15/2011 | | | | | | 1,909,000 | | 2,053,072 | | 1,909,000 | | 2,053,072 |
Port New Orleans LA Board Commerce Special Project CG Railway Incorporated (Other Revenue, MBIA Insured) , 5.25%, Due 8/15/2013 | | 910,000 | | 969,705 | | | | | | 910,000 | | 969,705 |
Village of Epps LA , 7.25%, Due 6/1/2009 | | | | | | 1,295,000 | | 1,292,656 | | 1,295,000 | | 1,292,656 |
Total Louisiana | | | | 1,240,587 | | | | 6,970,728 | | | | 8,211,315 |
Maryland - 0.59% | | | | | | | | | | | | |
Maryland Community Development Administration Residential Series H (Housing Revenue) , 4.55%, Due 9/1/2012 | | 400,000 | | 406,152 | | | | | | 400,000 | | 406,152 |
Montgomery County MD Housing Opportunities Aston Woods Apartment Project Series A Puttable (MFHR, FNMA Insured) , 4.90%, Due 5/15/2031 | | 1,000,000 | | 1,024,790 | | 3,000,000 | | 3,074,370 | | 4,000,000 | | 4,099,160 |
Total Maryland | | | | 1,430,942 | | | | 3,074,370 | | | | 4,505,312 |
Massachusetts - 1.96% | | | | | | | | | | | | |
Massachusetts Development Finance Agency Devens Electric Systems (Electric Revenue) , 5.125%, Due 12/1/2011 | | 430,000 | | 437,607 | | | | | | 430,000 | | 437,607 |
Massachusetts Development Finance Agency Developmental Disabilities Incorporated , 6.25%, Due 6/1/2008 | | | | | | 110,000 | | 109,927 | | 110,000 | | 109,927 |
Massachusetts HEFA Caritas Christian Obligation Series B (Healthcare Facilities Revenue) , 6.50%, Due 7/1/2012 | | | | | | 2,250,000 | | 2,340,518 | | 2,250,000 | | 2,340,518 |
Massachusetts HEFA Eye & Ear Infirmary Series B (HCFR LOC) , 5.25%, Due 7/1/2009 | | | | | | 775,000 | | 773,566 | | 775,000 | | 773,566 |
Massachusetts Industrial Finance Agency Senior Living Facility Forge Hill Project Prerefunded (Nursing Home Revenue) , 6.75%, Due 4/1/2030§ | | | | | | 1,000,000 | | 1,027,860 | | 1,000,000 | | 1,027,860 |
Massachusetts Municipal Wholesale Electric Company Power Supply (Electric Revenue, AMBAC Insured) , 5.45%, Due 7/1/2018 | | | | | | 7,000,000 | | 7,011,480 | | 7,000,000 | | 7,011,480 |
Massachusetts State Port Authority Delta Air Lines Incorporated Project-Series A (Lease Revenue, AMBAC Insured) , 5.50%, Due 1/1/2017 | | | | | | 1,000,000 | | 1,040,240 | | 1,000,000 | | 1,040,240 |
Massachusetts State Port Authority Delta Airlines Income Project Series A (Lease Revenue, AMBAC Insured) , 5.50%, Due 1/1/2016 | | | | | | 1,935,000 | | 2,018,399 | | 1,935,000 | | 2,018,399 |
Massachusetts State Port Authority Delta Airlines Incorporated Project Series A (Lease Revenue, AMBAC Insured) , 5.50%, Due 1/1/2013 | | | | | | 230,000 | | 241,705 | | 230,000 | | 241,705 |
Total Massachusetts | | | | 437,607 | | | | 14,563,695 | | | | 15,001,302 |
Michigan - 0.54% | | | | | | | | | | | | |
Comstock Park MI Public Schools School Building & Site (Property Tax Revenue, FGIC Insured) , 7.875%, Due 5/1/2011 | | | | | | 1,145,000 | | 1,257,519 | | 1,145,000 | | 1,257,519 |
| | |
| Proforma Portfolio of Investments - December 31, 2007 (Unaudited) | | Wells Fargo Advantage Funds |
| | | | | | | | | | | | |
| | | National Limited-Term
Tax-Free Fund | | Short-Term Municipal
Bond Fund | | Pro Forma
Combined |
| | | Shares or
Principal
Amount | | Value
(Note 2) | | Shares or
Principal
Amount | | Value
(Note 2) | | Shares or
Principal
Amount | | Value
(Note 2) |
Flint MI International Academy (Educational Facilities Revenue) , 5.00%, Due 10/1/2017 | | 1,000,000 | | 981,030 | | 1,135,000 | | 1,113,469 | | 2,135,000 | | 2,094,499 |
Michigan State Hospital Finance Authority Charity Obligation Group Series A Prerefunded (Hospital Revenue) , 5.125%, Due 11/1/2029§ | | 300,000 | | 310,263 | | | | | | 300,000 | | 310,263 |
Michigan State Housing Development Authorities Limited Obligation Benton Harbor Project (MFHR, Fifth Third Bank LOC) , 4.35%, Due 6/1/2041§± | | 500,000 | | 500,335 | | | | | | 500,000 | | 500,335 |
Total Michigan | | | | 1,791,628 | | | | 2,370,988 | | | | 4,162,616 |
Minnesota - .74% | | | | | | | | | | | | |
Brooklyn Park MN EDFA Huntington Site Development Series A (Other Revenue) , 4.40%, Due 8/1/2008 | | | | | | 715,000 | | 716,530 | | 715,000 | | 716,530 |
Marshall MN Medical Center Avera Marshall Regional Medical Center Project (HCFR) , 4.50%, Due 11/1/2011 | | 290,000 | | 292,729 | | | | | | 290,000 | | 292,729 |
Minnesota State Housing Finance Agency Series A , 5.35%, Due 2/1/2008 | | | | | | 410,000 | | 410,611 | | 410,000 | | 410,611 |
St. Paul MN Housing & RDA Rossy & Richard Shaller Series B (Housing Revenue, Bremer Bank LOC) , 3.92%, Due 3/1/2022§± | | | | | | 515,000 | | 515,000 | | 515,000 | | 515,000 |
Western MN Municipal Power Agency Series A (Electric Revenue) , 6.375%, Due 1/1/2016 | | 695,000 | | 770,296 | | | | | | 695,000 | | 770,296 |
Western MN Municipal Power Agency Series A (Power Revenue, AMBAC Insured) , 5.40%, Due 1/1/2009 | | 600,000 | | 600,828 | | 2,325,000 | | 2,328,209 | | 2,925,000 | | 2,929,037 |
Total Minnesota | | | | 1,663,853 | | | | 3,970,350 | | | | 5,634,203 |
Mississippi - 0.40% | | | | | | | | | | | | |
Mississippi Hospital Equipment & Facilities Authority Mississippi Baptist Health System Incorporated Series A (Hospital Revenue) , 5.00%, Due 8/15/2012 | | 1,000,000 | | 1,034,950 | | | | | | 1,000,000 | | 1,034,950 |
Biloxi MS Housing Authority Bayview Place Estates (Housing Revenue, GIC-Rabobank Nederland LOC) , 4.65%, Due 8/1/2008 | | | | | | 2,000,000 | | 2,000,000 | | 2,000,000 | | 2,000,000 |
Total Mississippi | | | | 1,034,950 | | | | 2,000,000 | | | | 3,034,950 |
Missouri - 1.75% | | | | | | | | | | | | |
Chesterfield Valley Transportation Development District MO (Sales Tax Revenue, CIFG Insured) , 4.00%, Due 4/15/2026 | | 1,250,000 | | 1,256,288 | | 3,000,000 | | 3,015,090 | | 4,250,000 | | 4,271,378 |
Fenton MO Gravois Bluffs Redevelopment Project (Tax Incremental Revenue) , 4.50%, Due 4/1/2021 | | | | | | 1,020,000 | | 1,005,128 | | 1,020,000 | | 1,005,128 |
Hazelwood MO IDA Bottom Road Development Project , 3.875%, Due 8/1/2018 | | | | | | 2,370,000 | | 2,364,596 | | 2,370,000 | | 2,364,596 |
Lake of the Ozarks MO Community Bridge Corporation , 5.25%, Due 12/1/2014 | | | | | | 2,000,000 | | 2,000,440 | | 2,000,000 | | 2,000,440 |
Missouri State Environmental Improvement & Energy Resources Authority American Cyanamid Company , 5.80%, Due 9/1/2009 | | | | | | 800,000 | | 829,360 | | 800,000 | | 829,360 |
Missouri State Housing Development Community Single Family Series B2 , 6.40%, Due 3/1/2029 | | | | | | 110,000 | | 113,113 | | 110,000 | | 113,113 |
Missouri State Housing Development Community Single Family Series D2 , 6.30%, Due 3/1/2029 | | | | | | 180,000 | | 183,470 | | 180,000 | | 183,470 |
St Louis MO Lambert St Louis International Series B (Airport Revenue, FGIC Insured) , 6.00%, Due 7/1/2011 | | | | | | 2,500,000 | | 2,660,125 | | 2,500,000 | | 2,660,125 |
Total Missouri | | | | 1,256,288 | | | | 12,171,322 | | | | 13,427,610 |
Montana - 0.96% | | | | | | | | | | | | |
Flathead MT Municipal Airport Authority Montana Glacier Park International Airport Series A (Airport Revenue) , 5.00%, Due 6/1/2011 | | 135,000 | | 136,982 | | | | | | 135,000 | | 136,982 |
Flathead MT Municipal Airport Authority Montana Glacier Park International Airport Series A (Airport Revenue) , 5.00%, Due 6/1/2012 | | 310,000 | | 313,819 | | | | | | 310,000 | | 313,819 |
Flathead MT Municipal Airport Authority Montana Glacier Park International Airport Series B (Airport Revenue) , 5.00%, Due 6/1/2012 | | 150,000 | | 151,134 | | | | | | 150,000 | | 151,134 |
Montana Health Facilities Authority Benefits Health Care Project (Healthcare Facilities Revenue, AMBAC Insured) , 5.375%, Due 9/1/2011# | | | | | | 1,000,000 | | 1,046,060 | | 1,000,000 | | 1,046,060 |
Montana State Board Housing Series A2 (SFMR) , 4.20%, Due 12/1/2013 | | 305,000 | | 307,410 | | | | | | 305,000 | | 307,410 |
Montana State Board Investment Refunded 1996 Payroll Tax (Other Revenue, MBIA Insured) , 6.875%, Due 6/1/2020 | | | | | | 1,080,000 | | 1,141,063 | | 1,080,000 | | 1,141,063 |
Montana State Board Investment Refunded Balanced 1996 Payroll Tax (Other Revenue, MBIA Insured) , 6.875%, Due 6/1/2020 | | | | | | 2,470,000 | | 2,609,654 | | 2,470,000 | | 2,609,654 |
| | |
| Proforma Portfolio of Investments - December 31, 2007 (Unaudited) | | Wells Fargo Advantage Funds |
| | | | | | | | | | | | |
| | | National Limited-Term
Tax-Free Fund | | Short-Term Municipal
Bond Fund | | Pro Forma
Combined |
| | | Shares or
Principal
Amount | | Value
(Note 2) | | Shares or
Principal
Amount | | Value
(Note 2) | | Shares or
Principal
Amount | | Value
(Note 2) |
Montana State Board Investment Refunded Payroll Tax (Other Revenue, MBIA Insured) , 6.875%, Due 6/1/2020 | | | | | | 1,535,000 | | 1,621,789 | | 1,535,000 | | 1,621,789 |
Total Montana | | | | 909,345 | | | | 6,418,566 | | | | 7,327,911 |
Nebraska - 0.34% | | | | | | | | | | | | |
Blair NE Bond Anticipation Notes Series B (Water Revenue) , 4.65%, Due 6/15/2012 | | | | | | 1,800,000 | | 1,821,186 | | 1,800,000 | | 1,821,186 |
O’Neill NE St. Anthony’s Project , 6.25%, Due 9/1/2012 | | | | | | 755,000 | | 772,788 | | 755,000 | | 772,788 |
Total Nebraska | | | | — | | | | 2,593,974 | | | | 2,593,974 |
Nevada - 0.20% | | | | | | | | | | | | |
Clark County Nevada Passenger Facilities Las Vegas McCarran International Airport (Airport Revenue, MBIA Insured) , 5.375%, Due 7/1/2013 | | | | | | 1,495,000 | | 1,526,246 | | 1,495,000 | | 1,526,246 |
Total Nevada | | | | — | | | | 1,526,246 | | | | 1,526,246 |
New Hampshire - 0.36% | | | | | | | | | | | | |
New Hampshire Business Finance Authority Franklin Regional Hospital Association Project Series A Prerefunded (HCFR) , 6.05%, Due 3/1/2009§ | | | | | | 2,615,000 | | 2,733,564 | | 2,615,000 | | 2,733,564 |
Total New Hampshire | | | | — | | | | 2,733,564 | | | | 2,733,564 |
New Jersey - 10.86% | | | | | | | | | | | | |
City of Bayonne NJ (Property Tax Revenue) , 5.00%, Due 10/24/2008 | | 500,000 | | 504,105 | | 2,600,000 | | 2,621,346 | | 3,100,000 | | 3,125,451 |
New Jersey Economic Development Authority (Excise Tax Revenue) , 5.625%, Due 6/15/2019 | | 250,000 | | 250,645 | | | | | | 250,000 | | 250,645 |
New Jersey Economic Development Authority Cigarette Tax Revenue , 5.625%, Due 6/15/2017 | | | | | | 820,000 | | 820,164 | | 820,000 | | 820,164 |
New Jersey HFFA Jersey City Medical Center (HCFR LOC) , 4.80%, Due 8/1/2021 | | | | | | 2,100,000 | | 2,112,369 | | 2,100,000 | | 2,112,369 |
New Jersey State Higher Education Assistance Authority Series A (Other Revenue, AMBAC Insured) , 5.20%, Due 6/1/2013 | | 995,000 | | 1,000,851 | | | | | | 995,000 | | 1,000,851 |
New Jersey State Highway Authority Garden State Parkway General (Toll Road Revenue) , 6.20%, Due 1/1/2010 | | 225,000 | | 231,444 | | | | | | 225,000 | | 231,444 |
New Jersey State Housing & Mortgage Finance Meadow Brook Apartments Project Series A (MFHR, JPMorgan Chase Bank LOC) , 4.10%, Due 3/15/2040§± | | | | | | 670,000 | | 673,980 | | 670,000 | | 673,980 |
Northeast Monmouth County Regional Sewage Authority Series A (Sewer Revenue, MBIA Insured) , 5.00%, Due 11/1/2010 | | | | | | 2,250,000 | | 2,274,885 | | 2,250,000 | | 2,274,885 |
Tobacco Settlement Financing Corporation NJ (Excise Tax Revenue) , 5.00%, Due 6/1/2013 | | 125,000 | | 135,343 | | | | | | 125,000 | | 135,343 |
Tobacco Settlement Financing Corporation NJ (Excise Tax Revenue) , 5.75%, Due 6/1/2032 | | 3,830,000 | | 4,104,496 | | 39,665,000 | | 42,507,791 | | 43,495,000 | | 46,612,287 |
Tobacco Settlement Financing Corporation NJ (Excise Tax Revenue) , 6.375%, Due 6/1/2032 | | | | | | 21,060,000 | | 23,842,237 | | 21,060,000 | | 23,842,237 |
Weehawken Township NJ Tax Anticipation Notes (Other Revenue) , 4.50%, Due 10/10/2008 | | | | | | 2,000,000 | | 2,011,140 | | 2,000,000 | | 2,011,140 |
Total New Jersey | | | | 6,226,884 | | | | 76,863,912 | | | | 83,090,796 |
New Mexico - 2.33% | | | | | | | | | | | | |
Albuquerque NM MCT Industries Incorporated Project , 3.70%, Due 4/1/2010 | | | | | | 470,000 | | 471,969 | | 470,000 | | 471,969 |
New Mexico Mortgage Finance Authority (Housing Revenue, GNMA Insured) , 4.20%, Due 7/1/2028 | | 1,500,000 | | 1,514,985 | | 12,280,000 | | 12,402,677 | | 13,780,000 | | 13,917,662 |
New Mexico Mortgage Finance Authority , 4.05%, Due 7/1/2026 | | | | | | 655,000 | | 655,262 | | 655,000 | | 655,262 |
New Mexico Mortgage Finance Authority SFMR Series A2 (Housing Revenue LOC) , 7.10%, Due 9/1/2030 | | | | | | 480,000 | | 494,770 | | 480,000 | | 494,770 |
New Mexico Mortgage Finance Authority SFMR Series A2 Class I (Housing Revenue, GNMA Insured) , 4.40%, Due 1/1/2027 | | | | | | 1,000,000 | | 1,013,710 | | 1,000,000 | | 1,013,710 |
New Mexico Mortgage Finance Authority SFMR Series D2 (Housing Revenue LOC) , 6.75%, Due 9/1/2029 | | | | | | 915,000 | | 940,593 | | 915,000 | | 940,593 |
New Mexico Mortgage Finance Authority SFMR Series F2 (Housing Revenue LOC) , 6.80%, Due 3/1/2031 | | | | | | 345,000 | | 354,791 | | 345,000 | | 354,791 |
Total New Mexico | | | | 1,514,985 | | | | 16,333,772 | | | | 17,848,757 |
New York - 4.03% | | | | | | | | | | | | |
Amherst NY IDAG Civic Facilities Series A (IDR, Radian Insured) , 4.20%, Due 10/1/2031§± | | | | | | 2,310,000 | | 2,309,076 | | 2,310,000 | | 2,309,076 |
Brookhaven NY IDAG (Other Revenue, North Fork Bank) , 4.25%, Due 11/1/2037§± | | | | | | 1,360,000 | | 1,370,200 | | 1,360,000 | | 1,370,200 |
Buffalo & Fort Erie NY Public Bridge Authority (Toll Road Revenue, Bank of Nova Scotia) , 4.00%, Due 1/1/2025§± | | | | | | 3,950,000 | | 4,005,379 | | 3,950,000 | | 4,005,379 |
| | |
| Proforma Portfolio of Investments - December 31, 2007 (Unaudited) | | Wells Fargo Advantage Funds |
| | | | | | | | | | | | |
| | | National Limited-Term
Tax-Free Fund | | Short-Term Municipal
Bond Fund | | Pro Forma
Combined |
| | | Shares or
Principal
Amount | | Value
(Note 2) | | Shares or
Principal
Amount | | Value
(Note 2) | | Shares or
Principal
Amount | | Value
(Note 2) |
Monroe County NY Bond Anticipation Notes (Property Tax Revenue) , 4.25%, Due 7/16/2008 | | | | | | 4,000,000 | | 4,026,840 | | 4,000,000 | | 4,026,840 |
Nassau County NY IDA North Shore Health Systems Projects C , 5.625%, Due 11/1/2010 | | | | | | 390,000 | | 399,181 | | 390,000 | | 399,181 |
Nassau County NY IDAG Special Needs Facilities Pooled Program F1 (IDR, ACA Insured) , 4.30%, Due 7/1/2010 | | | | | | 205,000 | | 201,761 | | 205,000 | | 201,761 |
New York City NY IDAG Civic Facilities Vaughn College Aeronautics Series A (College & University Revenue) , 5.00%, Due 12/1/2016 | | 360,000 | | 354,143 | | | | | | 360,000 | | 354,143 |
New York City NY IDAG Civic Facilities Vaughn College Aeronautics Series A , 5.00%, Due 12/1/2016 | | | | | | 1,195,000 | | 1,175,557 | | 1,195,000 | | 1,175,557 |
New York State Dormitory Authority AIDS Long Term Health Care Facilities , 5.00%, Due 11/1/2011 | | | | | | 1,000,000 | | 1,042,280 | | 1,000,000 | | 1,042,280 |
New York State Dormitory Authority Series B (College & University Revenue, CIFG Insured) , 6.00%, Due 11/15/2023§± | | | | | | 8,065,000 | | 8,869,645 | | 8,065,000 | | 8,869,645 |
Niagara NY Frontier Transit Authority Buffalo Niagara International Airport Series A (Airport Revenue, MBIA Insured) , 5.75%, Due 4/1/2011 | | 520,000 | | 539,006 | | | | | | 520,000 | | 539,006 |
Orange County NY IDAG Special Needs Facilities Pooled Program G1 (IDR, ACA Insured) , 4.35%, Due 7/1/2011 | | | | | | 325,000 | | 317,886 | | 325,000 | | 317,886 |
Saratoga County NY IDAG Highpointe at Malta Project Series A Prerefunded (Other Revenue) , 6.875%, Due 6/1/2039§ | | | | | | 2,225,000 | | 2,400,464 | | 2,225,000 | | 2,400,464 |
Suffolk County NY IDA Special Needs Pooled Series C1 , 6.875%, Due 7/1/2010 | | | | | | 110,000 | | 112,472 | | 110,000 | | 112,472 |
Tobacco Settlement Financing Authority Series B1C (Other Revenue) , 5.50%, Due 6/1/2017 | | | | | | 3,500,000 | | 3,685,395 | | 3,500,000 | | 3,685,395 |
Total New York | | | | 893,149 | | | | 29,916,136 | | | | 30,809,285 |
North Carolina - 0.75% | | | | | | | | | | | | |
North Carolina Eastern Municipal Power Agency Series D , 6.00%, Due 1/1/2009 | | | | | | 800,000 | | 809,392 | | 800,000 | | 809,392 |
North Carolina Housing Finance Agency AMT Home Ownership Series 14A (Housing Revenue, AMBAC Insured) , 4.35%, Due 1/1/2028 | | | | | | 1,550,000 | | 1,553,984 | | 1,550,000 | | 1,553,984 |
Pitt County NC Memorial Hospital (Hospital Revenue) , 5.3%, Due 12/1/2009 | | | | | | 1,000,000 | | 1,034,560 | | 1,000,000 | | 1,034,560 |
Pitt County NC Memorial Hospital (Hospital Revenue) , 5.375%, Due 12/1/2010 | | 1,250,000 | | 1,320,100 | | | | | | 1,250,000 | | 1,320,100 |
Sanford NC Water & Sewer (Property Tax Revenue, MBIA Insured) , 4.90%, Due 3/1/2009 | | | | | | 1,025,000 | | 1,036,716 | | 1,025,000 | | 1,036,716 |
Total North Carolina | | | | 1,320,100 | | | | 4,434,652 | | | | 5,754,752 |
Ohio - 1.81% | | | | | | | | | | | | |
American Municipal Power Ohio Incorporated Prepayment Series A (Electric Revenue) , 5.00%, Due 2/1/2010 | | 1,000,000 | | 1,031,010 | | | | | | 1,000,000 | | 1,031,010 |
Buckeye OH Tobacco Settlement Financing Authority Series A1 (Other Revenue) , 5.00%, Due 6/1/2011 | | | | | | 2,000,000 | | 2,041,420 | | 2,000,000 | | 2,041,420 |
Buckeye OH Tobacco Settlement Financing Authority Series A2 (Excise Tax Revenue) , 5.125%, Due 6/1/2024 | | | | | | 1,000,000 | | 945,280 | | 1,000,000 | | 945,280 |
Cuyahoga OH Metropolitan Housing Authority Bond Anticipation Notes (Other Revenue) , 4.00%, Due 3/1/2008 | | | | | | 5,240,000 | | 5,242,987 | | 5,240,000 | | 5,242,987 |
Franklin County OH (Property Tax Revenue) , 5.375%, Due 12/1/2020 | | | | | | 3,755,000 | | 3,896,864 | | 3,755,000 | | 3,896,864 |
Lakewood OH Lakewood Hospital Association , 5.50%, Due 2/15/2008 | | | | | | 700,000 | | 701,470 | | 700,000 | | 701,470 |
Total Ohio | | | | 1,031,010 | | | | 12,828,021 | | | | 13,859,031 |
Oklahoma - 1.42% | | | | | | | | | | | | |
Cherokee Nation of OK Healthcare System Series 2006 (HCFR, ACA Insured) , 4.10%, Due 12/1/2011†† | | | | | | 1,000,000 | | 993,620 | | 1,000,000 | | 993,620 |
Chickasaw Nation OK Health Systems (Healthcare Facilities Revenue) , 5.375%, Due 12/1/2017†† | | | | | | 3,000,000 | | 3,038,280 | | 3,000,000 | | 3,038,280 |
Comanche County OK Independent School District #4 Geronimo (Educational Facilities Revenue) , 6.25%, Due 8/15/2014 | | 687,204 | | 753,615 | | | | | | 687,204 | | 753,615 |
Muskogee OK Industrial Training Educational Facilities Muskogee Public Schools Project (Lease Revenue, Guarantee Agreement) , 4.25%, Due 9/1/2012 | | | | | | 4,490,000 | | 4,645,983 | | 4,490,000 | | 4,645,983 |
Oklahoma State Industrial Authority Revenue , 6.25%, Due 8/15/2015§ | | | | | | 1,325,000 | | 1,404,394 | | 1,325,000 | | 1,404,394 |
Total Oklahoma | | | | 753,615 | | | | 10,082,277 | | | | 10,835,892 |
| | |
| Proforma Portfolio of Investments - December 31, 2007 (Unaudited) | | Wells Fargo Advantage Funds |
| | | | | | | | | | | | |
| | | National Limited-Term
Tax-Free Fund | | Short-Term Municipal
Bond Fund | | Pro Forma
Combined |
| | | Shares or
Principal
Amount | | Value
(Note 2) | | Shares or
Principal
Amount | | Value
(Note 2) | | Shares or
Principal
Amount | | Value
(Note 2) |
Oregon - 0.42% | | | | | | | | | | | | |
Grants Pass OR Urban Renewal Agency Parkway Redevelopment Area (Tax Incremental Revenue) , 5.00%, Due 8/1/2008 | | 190,000 | | 191,286 | | | | | | 190,000 | | 191,286 |
Western Generation Agency Oregon Wauna Cogeneration Project Series B (Electric Revenue) , 5.00%, Due 1/1/2012 | | 500,000 | | 501,255 | | 2,500,000 | | 2,506,275 | | 3,000,000 | | 3,007,530 |
Total Oregon | | | | 692,541 | | | | 2,506,275 | | | | 3,198,816 |
Other - 0.57% | | | | | | | | | | | | |
Charter Mac Equity Issuer Trust , 7.10%, Due 6/30/2009†† | | 500,000 | | 521,345 | | | | | | 500,000 | | 521,345 |
MMA Financial CDD Senior Securitization Trust Beacon Lakes Passthru Certificates C , 3.375%, Due 11/1/2008± | | | | | | 3,854,816 | | 3,828,256 | | 3,854,816 | | 3,828,256 |
Total Other | | | | 521,345 | | | | 3,828,256 | | | | 4,349,601 |
Pennsylvania - 5.39% | | | | | | | | | | | | |
Allegheny County PA Airport Authority Pittsburgh International Airport (Airport Revenue, FGIC Insured) , 6.00%, Due 1/1/2013 | | 350,000 | | 369,467 | | | | | | 350,000 | | 369,467 |
Allegheny County PA Hospital Development Authority Pittsburgh Mercy Health System (Hospital Revenue, AMBAC Insured) , 5.40%, Due 8/15/2009 | | | | | | 930,000 | | 952,441 | | 930,000 | | 952,441 |
Allentown PA Sacred Heart Hospital , 4.75%, Due 7/1/2008 | | | | | | 890,000 | | 884,340 | | 890,000 | | 884,340 |
Chester County PA Renaissance Academy Project Series A , 5.25%, Due 10/1/2010 | | | | | | 1,215,000 | | 1,217,357 | | 1,215,000 | | 1,217,357 |
Cumberland County PA Municipal Authority Wesley Series A Prerefunded (Nursing Home Revenue) , 7.25%, Due 1/1/2035§ | | 1,000,000 | | 1,181,070 | | | | | | 1,000,000 | | 1,181,070 |
Cumberland County PA Munipical Authority Presbyterian Homes Project Series B (Healthcare Facilities Revenue, Radian Insured) , 4.25%, Due 12/1/2026§± | | 750,000 | | 751,110 | | | | | | 750,000 | | 751,110 |
Cumberland County PA Munipical Authority Presbyterian Homes Project Series B (Healthcare Facilities Revenue, Radian Insured) , 4.25%, Due 12/1/2026§± | | | | | | 1,250,000 | | 1,251,850 | | 1,250,000 | | 1,251,850 |
Delaware County PA Hospital Authority Crozner Keystone Obligation Group Series B (Hospital Revenue) , 5.00%, Due 12/15/2008 | | | | | | 1,005,000 | | 1,011,492 | | 1,005,000 | | 1,011,492 |
Delaware County PA Resource Recovery Facility Series A (IDR) , 6.10%, Due 7/1/2013 | | | | | | 3,675,000 | | 3,734,976 | | 3,675,000 | | 3,734,976 |
Delaware River Port Authority PA & NJ Prerefunded (Toll Road Revenue LOC) , 5.45%, Due 1/1/2012§ | | | | | | 3,750,000 | | 3,750,000 | | 3,750,000 | | 3,750,000 |
Gallery Certificate Trust Pennsylvania (Parking Facilities Revenue, First Security Bank LOC) , 4.50%, Due 2/15/2013 | | | | | | 3,155,000 | | 3,157,556 | | 3,155,000 | | 3,157,556 |
Harrisburg PA Authority Resource Recovery Facility Capital Appreciation Limited Obligation Series C , 4.57%, Due 12/15/2010^ | | | | | | 3,250,000 | | 2,843,425 | | 3,250,000 | | 2,843,425 |
Lancaster County PA Hospital Authority Brethren Village Project Series A (Hospital Revenue) , 5.20%, Due 7/1/2012%% | | | | | | 1,075,000 | | 1,074,914 | | 1,075,000 | | 1,074,914 |
Mckean County PA Hospital Authority Bradford Hospital Project (Health Facilities Financing Authority Revenue, ACA Insured) , 5.00%, Due 10/1/2010 | | | | | | 850,000 | | 833,706 | | 850,000 | | 833,706 |
Montgomery County PA IDA Retirement Community Series B (IDR) , 5.00%, Due 11/15/2009 | | | | | | 675,000 | | 686,171 | | 675,000 | | 686,171 |
Pennsylvania HEFAR Gwynedd Mercy College Series P1 (Other Revenue, Radian Insured) , 4.50%, Due 5/1/2037§± | | | | | | 4,200,000 | | 4,200,294 | | 4,200,000 | | 4,200,294 |
Pennsylvania HFA SFMR , 4.37%, Due 6/1/2008± | | | | | | 723,077 | | 723,077 | | 723,077 | | 723,077 |
Pennsylvania Housing Finance Agency Series L (MFHR, GO of Authority) , 4.20%, Due 7/1/2009 | | 500,000 | | 501,480 | | 7,300,000 | | 7,321,608 | | 7,800,000 | | 7,823,088 |
Philadelphia PA Series B (Airport Revenue, FGIC Insured) , 5.50%, Due 6/15/2016 | | | | | | 1,110,000 | | 1,163,003 | | 1,110,000 | | 1,163,003 |
Susquehanna PA Area Regional Airport Authority Aero Harrisburg LLC Project , 5.25%, Due 1/1/2009 | | | | | | 450,000 | | 446,774 | | 450,000 | | 446,774 |
Washington County PA IDA Children’s Home Pittsburgh Project , 4.00%, Due 6/15/2008 | | | | | | 3,175,000 | | 3,156,363 | | 3,175,000 | | 3,156,363 |
Total Pennsylvania | | | | 2,803,127 | | | | 38,409,347 | | | | 41,212,474 |
Puerto Rico - 2.48% | | | | | | | | | | | | |
Children’s Trust Fund Puerto Rico , 4.00%, Due 5/15/2010 | | | | | | 310,000 | | 309,017 | | 310,000 | | 309,017 |
Children’s Trust Fund Puerto Rico Tobacco Settlement Asset-Backed Prerefunded , 5.75%, Due 7/1/2010§ | | 350,000 | | 364,182 | | 2,385,000 | | 2,481,640 | | 2,735,000 | | 2,845,822 |
Municipal Securities Trust Certificates Series 2000-107 Class A (Electric Revenue, First Security Bank LOC) , 3.5%, Due 5/19/2009§±†† | | | | | | 1,500,000 | | 1,500,000 | | 1,500,000 | | 1,500,000 |
| | |
| Proforma Portfolio of Investments - December 31, 2007 (Unaudited) | | Wells Fargo Advantage Funds |
| | | | | | | | | | | | |
| | | National Limited-Term
Tax- Free Fund | | Short-Term Municipal Bond
Fund | | Pro Forma Combined |
| | | Shares or
Principal
Amount | | Value
(Note 2) | | Shares or
Principal
Amount | | Value
(Note 2) | | Shares or
Principal
Amount | | Value
(Note 2) |
Puerto Rico Commonwealth Government Development Bank Series B (Other Revenue) , 5.00%, Due 12/1/2008 | | | | | | 2,375,000 | | 2,407,443 | | 2,375,000 | | 2,407,443 |
Puerto Rico Highway & Transportation Authority (Fuel Sales Tax Revenue, MBIA Insured) , 5.50%, Due 7/1/2013 | | 1,280,000 | | 1,361,818 | | | | | | 1,280,000 | | 1,361,818 |
Puerto Rico Highway & Transportation Authority Series CC (Toll Road Revenue) , 5.00%, Due 7/1/2012 | | 1,020,000 | | 1,059,494 | | | | | | 1,020,000 | | 1,059,494 |
Puerto Rico Housing Financial Corporation Series F8J (Housing Revenue, FHA Insured) , 3.52%, Due 6/1/2021§± | | | | | | 100,000 | | 100,000 | | 100,000 | | 100,000 |
Puerto Rico Housing Public Finance Corporation Commonwelth Approp Series A (Lease Revenue, FGIC Insured) , 5.25%, Due 8/1/2031§± | | | | | | 2,605,000 | | 2,697,660 | | 2,605,000 | | 2,697,660 |
Puerto Rico Industrial Tourist Educational Medical & Environmental Central Facilities Financing Authority Ana G. Mendez University , 5.00%, Due 12/1/2008 | | | | | | 390,000 | | 392,625 | | 390,000 | | 392,625 |
Puerto Rico Industrial Tourist Educational Medical & Environmental Central Facilities Financing Authority Ana G. Mendez University , 5.00%, Due 2/1/2008 | | | | | | 925,000 | | 925,518 | | 925,000 | | 925,518 |
| | | | | | |
Puerto Rico Public Bulidings Authority Government Facilities Series M (Lease Revenue) , 5.50%, Due 7/1/2011 | | | | | | 4,125,000 | | 4,333,478 | | 4,125,000 | | 4,333,478 |
Puerto Rico Public Finance Corporation Series A (Lease Revenue, AMBAC Insured) , 5.25%, Due 8/1/2030§± | | | | | | 1,000,000 | | 1,042,800 | | 1,000,000 | | 1,042,800 |
Total Puerto Rico | | | | 2,785,494 | | | | 16,190,181 | | | | 18,975,675 |
Rhode Island - 0.09% | | | | | | | | | | | | |
Woonsocket RI Housing Authority Capital Funds Housing (Housing Revenue) , 4.50%, Due 9/1/2008 | | 350,000 | | 353,388 | | | | | | 350,000 | | 353,388 |
Woonsocket RI Housing Authority Capital Funds Housing (Housing Revenue) , 4.50%, Due 9/1/2009 | | 365,000 | | 372,986 | | | | | | 365,000 | | 372,986 |
Total Rhode Island | | | | 726,374 | | | | — | | | | 726,374 |
South Carolina - 3.08% | | | | | | | | | | | | |
Berkeley County SC Davol Incorporated International Paper Company Project (IDR) , 5.75%, Due 2/1/2008 | | 345,000 | | 345,324 | | | | | | 345,000 | | 345,324 |
Berkeley County SC School District COP Berkeley School Facilities Group Incorporated (Lease Revenue, MBIA Insured) , 5.15%, Due 2/1/2008 | | 1,000,000 | | 1,001,500 | | | | | | 1,000,000 | | 1,001,500 |
Connector 2000 Association Incorporated Capital Appreciation Series B , 7.4%, Due 1/1/2037^ | | | | | | 18,250,000 | | 2,218,653 | | 18,250,000 | | 2,218,653 |
Connector 2000 Association Incorporated Capital Appreciation Series B , 7.45%, Due 1/1/2038^ | | | | | | 14,500,000 | | 1,615,735 | | 14,500,000 | | 1,615,735 |
Connector 2000 Association Incorporated Capital Appreciation Series B , 7.95%, Due 1/1/2028^ | | 600,000 | | 124,974 | | | | | | 600,000 | | 124,974 |
Connector 2000 Association Incorporated Capital Appreciation Series B , 8.00%, Due 1/1/2028^ | | | | | | 2,835,000 | | 590,502 | | 2,835,000 | | 590,502 |
Connector 2000 Association Incorporated Capital Appreciation Series B , 8.10%, Due 1/1/2027^ | | | | | | 1,350,000 | | 298,634 | | 1,350,000 | | 298,634 |
Greenville County SC Donaldson Industrial Air Park Project A , 5.50%, Due 4/1/2011 | | | | | | 250,000 | | 247,790 | | 250,000 | | 247,790 |
| | | | | | |
South Carolina Jobs Economic Development Authority Palmetto Health (Hospital Revenue) , 4.17%, Due 8/1/2039§± | | 1,000,000 | | 994,000 | | 5,500,000 | | 5,467,000 | | 6,500,000 | | 6,461,000 |
South Carolina Jobs Economic Development Authority Palmetto Health Alliance Series A Prerefunded (Nursing Home Revenue) , 7.125%, Due 12/15/2015§ | | 1,000,000 | | 1,126,820 | | 3,250,000 | | 3,662,165 | | 4,250,000 | | 4,788,985 |
South Carolina Jobs Economic Development Authority Palmetto Health Series C Prerefunded (Hospital Revenue) , 6.875%, Due 8/1/2027§ | | | | | | 1,000,000 | | 1,173,380 | | 1,000,000 | | 1,173,380 |
South Carolina Jobs Economic Development Authority Refunded Palmetto Health Alliance Series A , 5.00%, Due 8/1/2008 | | | | | | 760,000 | | 762,964 | | 760,000 | | 762,964 |
South Carolina State Housing Finance & Development Authority Rural Housing Apartments Series B (Housing Revenue, Gic-Rabobank Nederland LOC) , 4.125%, Due 10/1/2009 | | | | | | 2,380,000 | | 2,390,853 | | 2,380,000 | | 2,390,853 |
South Carolina State Ports Authority , 7.80%, Due 7/1/2009# | | | | | | 1,556,200 | | 1,575,326 | | 1,556,200 | | 1,575,326 |
Total South Carolina | | | | 3,592,618 | | | | 20,003,002 | | | | 23,595,620 |
South Dakota - 0.43% | | | | | | | | | | | | |
Heartland SD Consumers Power District (Electric Revenue, First Security Bank LOC) , 6.00%, Due 1/1/2009 | | 640,000 | | 647,942 | | | | | | 640,000 | | 647,942 |
Lower Brule Sioux Tribe SD Series B (Other Revenue) , 5.15%, Due 5/1/2014 | | 830,000 | | 799,332 | | | | | | 830,000 | | 799,332 |
| | |
| Proforma Portfolio of Investments - December 31, 2007 (Unaudited) | | Wells Fargo Advantage Funds |
| | | | | | | | | | | | |
| | | National Limited-Term
Tax-Free Fund | | Short-Term Municipal Bond
Fund | | Pro Forma Combined |
| | | Shares or
Principal
Amount | | Value
(Note 2) | | Shares or
Principal
Amount | | Value
(Note 2) | | Shares or
Principal
Amount | | Value
(Note 2) |
Rapid City SD Area School District #51-4 Capital Outlay Certifications (Property Tax Revenue, First Security Bank LOC) , 5.00%, Due 1/1/2009 | | 685,000 | | 690,679 | | | | | | 685,000 | | 690,679 |
South Dakota EDFA Angus Incorporated Project A , 4.25%, Due 4/1/2008 | | | | | | 225,000 | | 225,144 | | 225,000 | | 225,144 |
South Dakota EDFA Angus Incorporated Project A , 4.50%, Due 4/1/2009 | | | | | | 260,000 | | 261,586 | | 260,000 | | 261,586 |
South Dakota EDFA McFleeg Project B , 4.375%, Due 4/1/2011 | | | | | | 460,000 | | 453,270 | | 460,000 | | 453,270 |
South Dakota State HEFA (HCFR, ACA Insured) , 5.20%, Due 4/1/2008 | | 200,000 | | 200,534 | | | | | | 200,000 | | 200,534 |
Total South Dakota | | | | 2,338,487 | | | | 940,000 | | | | 3,278,487 |
Tennessee - 0.32% | | | | | | | | | | | | |
Metropolitan Government Nashville & Davidson County TN Industrial Development Board Easter Seal Project (IDR) , 4.05%, Due 8/1/2019§± | | | | | | 1,200,000 | | 1,200,000 | | 1,200,000 | | 1,200,000 |
| | | | | | |
Metropolitan Nashville Airport Authority Improvement Series C (Airport Revenue, FGIC Insured) , 5.375%, Due 7/1/2013 | | 200,000 | | 205,804 | | | | | | 200,000 | | 205,804 |
Sevier County Tennessee Utility District (Utilities Revenue, AMBAC Insured) , 5.40%, Due 5/1/2011 | | | | | | 1,000,000 | | 1,029,600 | | 1,000,000 | | 1,029,600 |
Total Tennessee | | | | 205,804 | | | | 2,229,600 | | | | 2,435,404 |
Texas - 6.64% | | | | | | | | | | | | |
Arlington TX Special Obligation Dallas Cowboys Series A , 5.00%, Due 8/15/2034 | | 1,000,000 | | 1,041,380 | | 1,000,000 | | 1,041,380 | | 2,000,000 | | 2,082,760 |
Austin TX Convention Enterprises Incorporated Convention Center Second Tier Series B Prerefunded (Other Revenue, ZC Specialty Insured) , 5.75%, Due 1/1/2011§ | | | | | | 6,760,000 | | 7,181,013 | | 6,760,000 | | 7,181,013 |
Bexar County TX Revenue Project , 5.75%, Due 8/15/2022 | | | | | | 8,535,000 | | 8,944,936 | | 8,535,000 | | 8,944,936 |
Denison TX Housing Authority Manning Park Plaza (Housing Revenue, HUD Insured) , 5.00%, Due 10/1/2009 | | 105,000 | | 105,371 | | | | | | 105,000 | | 105,371 |
Duncanville TX Hospital Authority Methodist Hospitals Dallas Project (Hospital Revenue, GO of Hospital) , 9.00%, Due 1/1/2010 | | 265,000 | | 279,853 | | | | | | 265,000 | | 279,853 |
Garza County TX Public Facilities Corporation , 5.00%, Due 10/1/2011 | | | | | | 1,220,000 | | 1,211,277 | | 1,220,000 | | 1,211,277 |
Gateway TX Public Facility Corporation Stonegate Villas Apartments Project (Housing Revenue LOC) , 3.875%, Due 1/1/2010 | | | | | | 970,000 | | 977,906 | | 970,000 | | 977,906 |
Harris County TX (Hospital Revenue, MBIA Insured) , 5.75%, Due 2/15/2012§ | | | | | | 5,940,000 | | 6,319,388 | | 5,940,000 | | 6,319,388 |
| | | | | | |
Harris County TX Health Facilities Development Corporation Texas Medical Center Project Series A (Hospital Revenue, First Security Bank LOC) , 5.20%, Due 5/15/2020 | | 1,000,000 | | 1,030,580 | | 2,715,000 | | 2,798,025 | | 3,715,000 | | 3,828,605 |
Houston TX Housing Finance Corporation Series A (SFMR, GNMA Insured) , 6.75%, Due 6/1/2033§± | | 995,000 | | 1,021,019 | | | | | | 995,000 | | 1,021,019 |
Lubbock TX Health Facilities Development Corporation St. Joseph Health System (Hospital Revenue) , 5.25%, Due 7/1/2017 | | | | | | 3,350,000 | | 3,401,188 | | 3,350,000 | | 3,401,188 |
Lufkin TX Health Facilities Development Corporation Memorial Health Systems of East Texas (HFFA Revenue) , 5.00%, Due 2/15/2008 | | 220,000 | | 220,438 | | | | | | 220,000 | | 220,438 |
MFHR Bond Pass Through Certificates Beneficial Ownership Series 14 Park Row Houston TX HFC Puttable (MFHR, Guarantee Agreement) , 5.75%, Due 11/1/2034§ | | | | | | 1,614,000 | | 1,691,359 | | 1,614,000 | | 1,691,359 |
MuniMae Trust Series 2001-9 Class A , 3.90%, Due 8/24/2009§± | | | | | | 5,165,000 | | 5,194,286 | | 5,165,000 | | 5,194,286 |
| | | | | | |
Odessa TX Housing Authority Section 8 Assistance Project Series B (Housing Revenue LOC) , 6.375%, Due 10/1/2011 | | | | | | 1,515,000 | | 1,515,288 | | 1,515,000 | | 1,515,288 |
Sam Rayburn TX Municipal Power Agency (Electric Revenue, MBIA Insured) , 6.00%, Due 9/1/2010 | | 100,000 | | 105,436 | | | | | | 100,000 | | 105,436 |
San Antonio TX Electric & Gas System (Electric Revenue) , 3.625%, Due 12/1/2027§± | | | | | | 6,000,000 | | 6,024,600 | | 6,000,000 | | 6,024,600 |
| | | | | | |
State of Texas Affordable Housing Corporation (State Agency Housing Revenue, GNMA Insured) , 5.50%, Due 9/1/2038 | | 470,000 | | 497,678 | | | | | | 470,000 | | 497,678 |
Texas State Department Housing & Community Affairs Pebble Brook Apartments Project , 4.95%, Due 12/1/2008 | | | | | | 195,000 | | 196,090 | | 195,000 | | 196,090 |
Total Texas | | | | 4,301,755 | | | | 46,496,736 | | | | 50,798,491 |
Utah - 0.10% | | | | | | | | | | | | |
Davis County UT School District , 4.547%, Due 9/7/2008 | | | | | | 576,268 | | 573,600 | | 576,268 | | 573,600 |
| | |
| Proforma Portfolio of Investments - December 31, 2007 (Unaudited) | | Wells Fargo Advantage Funds |
| | | | | | | | | | | | |
| | | National Limited-Term
Tax-Free Fund | | Short-Term Municipal Bond
Fund | | Pro Forma Combined |
| | | Shares or
Principal
Amount | | Value
(Note 2) | | Shares or
Principal
Amount | | Value
(Note 2) | | Shares or
Principal
Amount | | Value
(Note 2) |
Utah Housing Corporation Series D Class 1 (Single Family Mortgage Revenue) , 2.95%, Due 7/1/2033 | | 180,000 | | 179,271 | | | | | | 180,000 | | 179,271 |
Total Utah | | | | 179,271 | | | | 573,600 | | | | 752,871 |
Virgin Islands - 0.20% | | | | | | | | | | | | |
Virgin Islands PFA Senior Lien Loan Notes , 5.50%, Due 10/1/2014 | | | | | | 1,500,000 | | 1,521,660 | | 1,500,000 | | 1,521,660 |
Total Virgin Islands | | | | — | | | | 1,521,660 | | | | 1,521,660 |
Virginia - 0.93% | | | | | | | | | | | | |
Hopewell VA Public Improvements Series A , 5.00%, Due 7/15/2009 | | | | | | 1,700,000 | | 1,702,499 | | 1,700,000 | | 1,702,499 |
King George County VA Industrial Development Authority Waste Management Incorporated Series A (Industrial Development Revenue) , 4.10%, Due 6/1/2023§ | | | | | | 1,500,000 | | 1,493,640 | | 1,500,000 | | 1,493,640 |
Marquis Community Development Authority VA (Other Revenue) , 5.10%, Due 9/1/2013 | | | | | | 3,000,000 | | 2,978,550 | | 3,000,000 | | 2,978,550 |
Virginia College Building Authority Educational Facilities (College & University Revenue) , 4.50%, Due 6/1/2012 | | 395,000 | | 397,236 | | | | | | 395,000 | | 397,236 |
| | | | | | |
Virginia College Building Authority Regent University Project (College & University Revenue) , 5.00%, Due 6/1/2014 | | 535,000 | | 550,948 | | | | | | 535,000 | | 550,948 |
Total Virginia | | | | 948,184 | | | | 6,174,689 | | | | 7,122,873 |
Washington - 3.32% | | | | | | | | | | | | |
King County WA (Property Tax Revenue) , 4.00%, Due 12/1/2009 | | | | | | 2,440,000 | | 2,483,700 | | 2,440,000 | | 2,483,700 |
Ocean Shores WA Local Improvement District Bond Anticipation Notes No 2007-01 (Special Facilities Revenue) , 4.75%, Due 8/1/2011 | | | | | | 2,285,000 | | 2,344,684 | | 2,285,000 | | 2,344,684 |
Port Anacortes WA Series A (Airport Revenue) , 5.125%, Due 9/1/2009 | | 950,000 | | 953,848 | | | | | | 950,000 | | 953,848 |
Port Kalama WA Series B (Airport Revenue) , 5.25%, Due 12/1/2015 | | 500,000 | | 528,820 | | | | | | 500,000 | | 528,820 |
Port Moses Lake WA Series A (Property Tax Revenue, XLCA Insured) , 4.25%, Due 12/1/2011 | | 260,000 | | 266,708 | | | | | | 260,000 | | 266,708 |
Port Moses Lake WA Series A (Property Tax Revenue, XLCA Insured) , 4.25%, Due 12/1/2012 | | 200,000 | | 205,370 | | | | | | 200,000 | | 205,370 |
Port Moses Lake WA Series A (Property Tax Revenue, XLCA Insured) , 4.25%, Due 12/1/2013 | | 185,000 | | 189,882 | | | | | | 185,000 | | 189,882 |
| | | | | | |
Quinault WA Indian Nation Refunded Quinault Beach Series A (Other Revenue, ACA Insured) , 5.80%, Due 12/1/2015 | | 345,000 | | 340,467 | | | | | | 345,000 | | 340,467 |
| | | | | | |
Quincy WA Water & Sewer Revenue , 4.50%, Due 11/1/2008 | | | | | | 590,000 | | 593,186 | | 590,000 | | 593,186 |
| | | | | | |
Quincy WA Water & Sewer Revenue , 4.75%, Due 11/1/2009 | | | | | | 575,000 | | 583,435 | | 575,000 | | 583,435 |
Snohomish County WA Public Hospital District #3 Series A , 6.00%, Due 6/1/2010 | | | | | | 205,000 | | 205,293 | | 205,000 | | 205,293 |
Spokane County WA School District #81 (Property Tax Revenue, MBIA Insured) , 0.00%, Due 12/1/2009^ | | | | | | 2,720,000 | | 2,654,421 | | 2,720,000 | | 2,654,421 |
Tacoma WA Department of Public Utility & Light Division (Electric Revenue) , 4.20%, Due 7/1/2008 | | 555,000 | | 558,391 | | | | | | 555,000 | | 558,391 |
Tobacco Settlement Authority WA Asset-Backed , 5.25%, Due 6/1/2009 | | | | | | 200,000 | | 203,154 | | 200,000 | | 203,154 |
Tobacco Settlement Authority WA Tobacco Settlement Revenue Asset-Backed , 6.50%, Due 6/1/2026 | | 1,760,000 | | 1,817,288 | | 5,955,000 | | 6,148,835 | | 7,715,000 | | 7,966,123 |
Vancouver WA Bond Anticipation Notes Village Park Apartments (Housing Revenue) , 4.20%, Due 3/1/2008 | | 1,000,000 | | 1,000,550 | | | | | | 1,000,000 | | 1,000,550 |
Washington State Health Care Facilities Authority Grays Harbor Community Hospital (HCFR, Radian Insured) , 6.30%, Due 7/1/2030§± | | | | | | 1,900,000 | | 1,900,000 | | 1,900,000 | | 1,900,000 |
| | | | | | |
Washington State Public Power Supply System Nuclear Project #1 Series B (Electric Revenue) , 7.25%, Due 7/1/2009 | | 205,000 | | 212,589 | | | | | | 205,000 | | 212,589 |
Washington State Series A & AT6 (Tax Revenue) , 6.25%, Due 2/1/2011 | | 950,000 | | 990,784 | | | | | | 950,000 | | 990,784 |
Washington State Unrefunded Balance Series 93 A (Property Tax Revenue) , 5.75%, Due 10/1/2012 | | | | | | 1,185,000 | | 1,256,171 | | 1,185,000 | | 1,256,171 |
Total Washington | | | | 7,064,697 | | | | 18,372,879 | | | | 25,437,576 |
West Virginia - 0.42% | | | | | | | | | | | | |
Berkeley County WV Public Sewer (Sewer Revenue) , 4.50%, Due 10/1/2013 | | 630,000 | | 626,491 | | | | | | 630,000 | | 626,491 |
Berkeley County WV Public Sewer (Sewer Revenue) , 4.55%, Due 10/1/2014 | | 545,000 | | 541,839 | | | | | | 545,000 | | 541,839 |
| | |
| Proforma Portfolio of Investments - December 31, 2007 (Unaudited) | | Wells Fargo Advantage Funds |
| | | | | | | | | | | | | | | |
| | | National Limited-Term
Tax-Free Fund | | Short-Term Municipal Bond
Fund | | Pro Forma Combined |
| | | Shares or
Principal
Amount | | Value
(Note 2) | | Shares or
Principal
Amount | | Value
(Note 2) | | Shares or
Principal
Amount | | Value
(Note 2) |
Berkeley County WV Public Sewer Series A (Sewer Revenue) , 4.375%, Due 10/1/2011 | | | | | | | 1,175,000 | | | 1,167,316 | | 1,175,000 | | | 1,167,316 |
Kanawha County WV (Housing Revenue, FGIC Insured) , 7.375%, Due 9/1/2011 | | 200,000 | | | 228,586 | | | | | | | 200,000 | | | 228,586 |
Ohio County WV Building Commission Medical Center , 7.00%, Due 10/1/2010 | | | | | | | 255,000 | | | 269,619 | | 255,000 | | | 269,619 |
| | | | | | |
West Virginia Water Development Authority Sewer Systems Loan Program (Sewer Revenue) , 7.10%, Due 11/1/2009 | | 330,000 | | | 345,002 | | | | | | | 330,000 | | | 345,002 |
Total West Virginia | | | | | 1,741,918 | | | | | 1,436,935 | | | | | 3,178,853 |
Wisconsin - 4.57% | | | | | | | | | | | | | | | |
Badger WI Tobacco Asset Securitization Corporation Asset-Backed (Other Revenue) , 6.125%, Due 6/1/2027 | | 1,765,000 | | | 1,825,783 | | 11,140,000 | | | 11,523,662 | | 12,905,000 | | | 13,349,445 |
Badger WI Tobacco Asset Securitization Corporation Asset-Backed , 5.00%, Due 6/1/2008 | | | | | | | 465,000 | | | 466,795 | | 465,000 | | | 466,795 |
Badger WI Tobacco Asset Securitization Corporation Asset-Backed , 5.00%, Due 6/1/2009 | | | | | | | 735,000 | | | 744,393 | | 735,000 | | | 744,393 |
Badger WI Tobacco Asset Securitization Corporation Asset-Backed , 5.75%, Due 6/1/2011 | | | | | | | 1,805,000 | | | 1,886,694 | | 1,805,000 | | | 1,886,694 |
Badger WI Tobacco Asset Securitization Corporation Asset-Backed , 6.00%, Due 6/1/2017 | | | | | | | 6,450,000 | | | 6,551,846 | | 6,450,000 | | | 6,551,846 |
Freedom WI Sanitation District #1 Bond Anticipation Notes (Other Revenue) , 4.90%, Due 6/1/2011 | | | | | | | 2,875,000 | | | 2,903,721 | | 2,875,000 | | | 2,903,721 |
Kronewetter WI Anticipation Notes (Other Revenue) , 4.75%, Due 3/1/2011 | | | | | | | 2,000,000 | | | 2,018,880 | | 2,000,000 | | | 2,018,880 |
Oshkosh WI Don Evans Incorporated Project , 5.05%, Due 12/1/2008 | | | | | | | 605,000 | | | 605,321 | | 605,000 | | | 605,321 |
Oshkosh WI Don Evans Incorporated Project , 5.20%, Due 12/1/2009 | | | | | | | 650,000 | | | 650,787 | | 650,000 | | | 650,787 |
Stevens Point WI CDA Section 8 , 6.50%, Due 9/1/2009 | | | | | | | 10,000 | | | 10,534 | | 10,000 | | | 10,534 |
Wisconsin HEFA Beaver Dam Communities Hospitals Incorporated Class A , 4.25%, Due 8/15/2008 | | | | | | | 300,000 | | | 298,071 | | 300,000 | | | 298,071 |
Wisconsin HEFA Beaver Dam Communities Hospitals Incorporated Class A , 4.50%, Due 8/15/2009 | | | | | | | 200,000 | | | 197,228 | | 200,000 | | | 197,228 |
Wisconsin HEFA Three Pillars Communities , 5.00%, Due 8/15/2010 | | | | | | | 1,155,000 | | | 1,175,675 | | 1,155,000 | | | 1,175,675 |
| | | | | | |
Wisconsin HEFA Wheaton Franciscan Services Incorporated (HCFR, MBIA Insured) , 6.10%, Due 8/15/2009 | | | | | | | 2,420,000 | | | 2,528,101 | | 2,420,000 | | | 2,528,101 |
Wisconsin Housing & Economic Development Authority Series F , 5.20%, Due 7/1/2018 | | | | | | | 1,555,000 | | | 1,577,843 | | 1,555,000 | | | 1,577,843 |
Total Wisconsin | | | | | 1,825,783 | | | | | 33,139,551 | | | | | 34,965,334 |
Wyoming - 0.40% | | | | | | | | | | | | | | | |
| | | | | | |
Converse County WY Memorial Hospital Project Prerefunded (Nursing Home Revenue) , 9.00%, Due 12/1/2010§ | | | | | | | 2,605,000 | | | 3,038,220 | | 2,605,000 | | | 3,038,220 |
Total Wyoming | | | | | — | | | | | 3,038,220 | | | | | 3,038,220 |
| | | | | | | | | | | | | | | |
Total Municipal Bonds (Cost $82,234,225, $674,357,346 and $756,591,571, respectively) | | | | | 82,147,819 | | | | | 674,420,820 | | | | | 756,568,639 |
| | | | | | | | | | | | | | | |
Short-Term Investments (a) 0.83% | | | | | | | | | | | | | | | |
Muual Funds | | | | | | | | | | | | | | | |
Wells Fargo Advantage National Tax-Free Money Market Trust~‡ | | 305,392 | | | 305,392 | | 6,083,520 | | | 6,083,520 | | 6,388,912 | | | 6,388,912 |
| | | | | | | | | | | | | | | |
Total Short-Term Investments (Cost $305,392, $6,083,520 and $6,388,912, respectively) | | | | | 305,392 | | | | | 6,083,520 | | | | | 6,388,912 |
| | | | | | | | | | | | | | | |
Total Investments in Securities (Cost $82,539,617, $680,440,866 and $762,980,483, respectively) 99.69%* | | | | | 82,453,211 | | | | | 680,504,340 | | | | | 762,957,551 |
Other Assets and Liabilities, Net - 0.31% | | | | | 752,927 | | | | | 1,588,811 | | | | | 2,341,738 |
| | | | | | | | | | | | | | | |
Net Assets 100.00% | | | | $ | 83,206,138 | | | | $ | 682,093,151 | | | | $ | 765,299,289 |
| | | | | | | | | | | | | | | |
| § | These securities are subject to a demand feature which reduces the effective maturity. |
| ± | Variable rate investments. |
| ^ | Zero coupon bond. Interest rate presented is yield to maturity. |
| †† | Securities that may be resold to “qualified institutional buyers” under rule 144A or securities offered pursuant to section 4(2) of the Securities Act of 1933, as amended. |
| # | Security pledged as collateral for futures transactions. (See Note 2) |
| ~ | This Wells Fargo Advantage Fund invests cash balances that it retains for liquidity purposes in a Wells Fargo Advantage Money Market Fund. The Fund does not pay an investment advisory fee for such investments. |
| ‡ | Security of an affiliate of the Fund with a cost of $6,388,912 |
| * | Cost for federal income tax purposes is substantially the same as for financial reporting purposes. |
The accompanying notes are an integral part of these proforma financial statements.
| | |
| Proforma Statement of Assets and Liabilities – December 31, 2007 (Unaudited) | | Wells Fargo Advantage Funds |
| | | | | | | | | | | | | | | | |
| | | National
Limited-Term
Tax-Free Fund | | | Short-Term
Municipal
Bond Fund | | | Proforma
Adjustments | | | Proforma
Combined | |
Assets | | | | | | | | | | | | | | | | |
Investments | | | | | | | | | | | | | | | | |
In securities, at market value | | $ | 82,147,819 | | | $ | 674,420,820 | | | | | | | $ | 756,568,639 | |
Investments in affiliates | | | 305,392 | | | | 6,083,520 | | | | | | | | 6,388,912 | |
| | | | | | | | | | | | | | | | |
Total investments at market value (see cost below) | | | 82,453,211 | | | | 680,504,340 | | | | — | | | | 762,957,551 | |
| | | | | | | | | | | | | | | | |
Cash | | | 50,000 | | | | — | | | | | | | | 50,000 | |
Receivable for Fund shares issued | | | 430 | | | | 2,264,766 | | | | | | | | 2,265,196 | |
Receivable for investments sold | | | — | | | | 813,707 | | | | | | | | 813,707 | |
Receivables for dividends and interest | | | 1,017,750 | | | | 7,514,382 | | | | | | | | 8,532,132 | |
| | | | | | | | | | | | | | | | |
Total assets | | | 83,521,391 | | | | 691,097,195 | | | | — | | | | 774,618,586 | |
| | | | | | | | | | | | | | | | |
Liabilities | | | | | | | | | | | | | | | | |
Payable for daily variation margin on futures contracts | | | — | | | | 72,419 | | | | | | | | 72,419 | |
Payable for Fund shares redeemed | | | — | | | | 444,314 | | | | | | | | 444,314 | |
Payable for investments purchased | | | — | | | | 5,557,094 | | | | | | | | 5,557,094 | |
Dividends payable | | | 280,357 | | | | 2,321,851 | | | | | | | | 2,602,208 | |
Payable to investment advisor and affiliates | | | 15,027 | | | | 242,071 | | | | | | | | 257,098 | |
Payable for interest rate swaps/spread locks | | | 6,572 | | | | 138,356 | | | | | | | | 144,928 | |
Accrued expenses and other liabilities | | | 13,297 | | | | 227,939 | | | | | | | | 241,236 | |
| | | | | | | | | | | | | | | | |
Total liabilities | | | 315,253 | | | | 9,004,044 | | | | — | | | | 9,319,297 | |
| | | | | | | | | | | | | | | | |
Total net assets | | $ | 83,206,138 | | | $ | 682,093,151 | | | $ | — | | | $ | 765,299,289 | |
| | | | | | | | | | | | | | | | |
NET ASSETS CONSIST OF | | | | | | | | | | | | | | | | |
Paid-in capital | | $ | 84,537,760 | | | $ | 693,911,525 | | | | | | | $ | 778,449,285 | |
Undistributed net investment income (loss) | | | (43,790 | ) | | | (131,047 | ) | | | | | | | (174,837 | ) |
Undistributed net realized gain (loss) on investments | | | (1,194,854 | ) | | | (11,532,715 | ) | | | | | | | (12,727,569 | ) |
Net unrealized appreciation (depreciation) of investments, foreign currencies and translation of assets and liabilities denominated in foreign currencies | | | (86,406 | ) | | | 63,474 | | | | | | | | (22,932 | ) |
Net unrealized appreciation (depreciation) of futures | | | — | | | | (79,730 | ) | | | | | | | (79,730 | ) |
Net unrealized appreciation (depreciation) of options, swap agreements, and short sales | | | (6,572 | ) | | | (138,356 | ) | | | | | | | (144,928 | ) |
| | | | | | | | | | | | | | | | |
Total net assets | | $ | 83,206,138 | | | $ | 682,093,151 | | | $ | — | | | $ | 765,299,289 | |
| | | | | | | | | | | | | | | | |
COMPUTATION OF NET ASSET VALUE AND OFFERING PRICE PER SHARE1 | | | | | | | | | | | | | | | | |
Net assets – Class A | | $ | 3,981,304 | | | | NA | | | $ | 78,618,951 | 3,4,6 | | $ | 82,600,255 | |
Shares outstanding – Class A | | | 373,495 | | | | NA | | | | 8,063,712 | | | | 8,437,207 | |
Net asset value per share – Class A | | $ | 10.66 | | | | NA | | | | | | | $ | 9.79 | |
Maximum offering price per share – Class A2 | | $ | 10.99 | | | | NA | | | | | | | $ | 10.09 | |
Net assets – Class B | | $ | 208,324 | | | | NA | | | $ | (208,324 | )4 | | $ | — | |
Shares outstanding – Class B | | | 19,562 | | | | NA | | | | (19,562 | ) | | | — | |
Net asset value and offering price per share – Class B | | $ | 10.65 | | | | NA | | | | | | | $ | — | |
Net assets – Class C | | $ | 605,883 | | | $ | 3,589,453 | | | | | | | $ | 4,195,336 | |
Shares outstanding – Class C | | | 56,942 | | | | 367,148 | | | | 4,881 | 5 | | | 428,971 | |
Net asset value and offering price per share – Class C | | $ | 10.64 | | | $ | 9.78 | | | | | | | $ | 9.78 | |
Net assets – Administrator Class | | $ | 78,410,627 | | | | NA | | | $ | (78,410,627 | )6 | | $ | — | |
Shares outstanding – Administrator Class | | | 7,358,275 | | | | NA | | | | (7,358,275 | ) | | | — | |
Net asset value and offering price per share – Administrator Class | | $ | 10.66 | | | | NA | | | | | | | $ | — | |
Net assets – Investor Class | | | NA | | | $ | 678,503,698 | | | | | | | $ | 678,503,698 | |
Shares outstanding – Investor Class | | | NA | | | | 69,329,850 | | | | | | | | 69,329,850 | |
Net asset value and offering price per share – Investor Class | | | NA | | | $ | 9.79 | | | | | | | $ | 9.79 | |
| | | | | | | | | | | | | | | | |
| | | | |
Investments at cost | | $ | 82,539,617 | | | $ | 680,440,866 | | | $ | — | | | $ | 762,980,483 | |
| | | | | | | | | | | | | | | | |
1 | Each Fund has an unlimited number of authorized shares. |
2 | Maximum offering price is computed as 100/97 of net asset value. On investment of $50,000 or more, the offering price is reduced. |
3 | Class A shares of National Limited-Term Tax-Free Fund are exchanged for new A shares of Short-Term Municipal Bond Fund, to be established upon consummation of the merger, in an amount equal to the total value of the National Limited-Term Tax-Free Fund A shares divided by current per share value of the new Short-Term Municipal Bond Fund A shares (presumed to equal the Short-Term Municipal Bond Fund Investor Class share value in this proforma). |
4 | Class B shares of National Limited-Term Tax-Free Fund are exchanged for new A shares of Short-Term Municipal Bond Fund, to be established upon consummation of the merger, in an amount equal to the total value of the National Limited-Term Tax-Free Fund B shares divided by current per share value of the new Short-Term Municipal Bond Fund A shares (presumed to equal the Short-Term Municipal Bond Fund Investor Class share value in this proforma). |
5 | Class C shares of National Limited-Term Tax-Free Fund are exchanged for C shares of Short-Term Municipal Bond Fund in an amount equal to the total value of the National Limited-Term Tax-Free Fund C shares divided by current per share value of the Short-Term Municipal Bond Fund C shares. |
6 | Administrator Class shares of National Limited-Term Tax-Free Fund are exchanged for new A shares of Short-Term Municipal Bond Fund, to be established upon consummation of the merger, in an amount equal to the total value of the National Limited-Term Tax-Free Fund Adm shares divided by current per share value of the new Short-Term Municipal Bond Fund A shares (presumed to equal the Short-Term Muni Bond Fund Investor Class share value in this proforma). |
The accompanying notes are an integral part of these proforma financial statements.
| | |
Proforma Statement of Operations - For the Twelve Months Ended December 31, 2007 (Unaudited) | | Wells Fargo Advantage Funds |
| | | | | | | | | | | | | | | | |
| | | National
Limited-Term
Tax-Free Fund | | | Short-Term
Municipal
Bond Fund | | | Proforma
Adjustments | | | Proforma
Combined | |
Investment Income | | | | | | | | | | | | | | | | |
Interest | | $ | 3,865,710 | | | $ | 29,770,677 | | | | | | | $ | 33,636,387 | |
Income from affiliated securities | | | 57,237 | | | | 427,615 | | | | | | | | 484,852 | |
| | | | | | | | | | | | | | | | |
Total investment income | | | 3,922,947 | | | | 30,198,292 | | | | — | | | | 34,121,239 | |
| | | | | | | | | | | | | | | | |
Expenses | | | | | | | | | | | | | | | | |
Advisory fees | | | 350,411 | | | | 2,577,040 | | | | (32,248 | )1 | | | 2,895,203 | |
Administration fees | | | | | | | | | | | | | | | | |
Fund Level | | | 43,801 | | | | 332,582 | | | | 1,503 | 1 | | | 377,886 | |
Class A | | | 9,357 | | | | — | | | | 235,198 | 1 | | | 244,555 | |
Class B | | | 873 | | | | — | | | | (873 | )1 | | | — | |
Class C | | | 1,771 | | | | 7,355 | | | | 1,286 | 1 | | | 10,412 | |
Administrator Class | | | 83,316 | | | | — | | | | (83,316 | )1 | | | — | |
Investor Class | | | — | | | | 2,648,368 | | | | | | | | 2,648,368 | |
Custody fees | | | 17,520 | | | | 133,032 | | | | | | | | 150,552 | |
Shareholder servicing fees | | | 218,715 | | | | 1,630,552 | | | | | | | | 1,849,267 | |
Accounting fees | | | 42,293 | | | | 65,696 | | | | (33,638 | )1 | | | 74,351 | |
Distribution fees | | | | | | | | | | | | | | | | |
Class B | | | 2,338 | | | | — | | | | | | | | 2,338 | |
Class C | | | 4,744 | | | | 23,033 | | | | | | | | 27,777 | |
Professional fees | | | 20,802 | | | | 30,671 | | | | (16,761 | )2 | | | 34,712 | |
Registration fees | | | 24,364 | | | | 41,638 | | | | (18,879 | )2 | | | 47,123 | |
Shareholder reports | | | 6,485 | | | | 50,585 | | | | (14,268 | )2 | | | 42,802 | |
Trustees’ fees | | | 9,133 | | | | 9,133 | | | | (7,930 | )2 | | | 10,336 | |
Other fees and expenses | | | 1,091 | | | | 11,414 | | | | 413 | 2 | | | 12,918 | |
| | | | | | | | | | | | | | | | |
Total expenses | | | 837,014 | | | | 7,561,099 | | | | 30,487 | | | | 8,428,600 | |
| | | | | | | | | | | | | | | | |
Less | | | | | | | | | | | | | | | | |
Waived fees and reimbursed expenses | | | (294,001 | ) | | | (3,142,949 | ) | | | (30,487 | ) | | | (3,467,437 | ) |
Net expenses | | | 543,013 | | | | 4,418,150 | | | | — | | | | 4,961,163 | |
| | | | | | | | | | | | | | | | |
Net investment income (loss) | | | 3,379,934 | | | | 25,780,142 | | | | — | | | | 29,160,076 | |
| | | | | | | | | | | | | | | | |
REALIZED AND UNREALIZED GAIN (LOSS) ON INVESTMENTS | | | | | | | | | | | | | | | | |
| | | | |
Net realized gain (loss) from | | | | | | | | | | | | | | | | |
Securities, foreign currencies and foreign currency translation | | | (32,476 | ) | | | (710,904 | ) | | | | | | | (743,380 | ) |
Futures transactions | | | 30,987 | | | | 302,092 | | | | | | | | 333,079 | |
Options, swap agreements and short sale transactions | | | (24,536 | ) | | | (699,031 | ) | | | | | | | (723,567 | ) |
| | | | | | | | | | | | | | | | |
Net realized gain (loss) from Investments | | | (26,025 | ) | | | (1,107,843 | ) | | | — | | | | (1,133,868 | ) |
| | | | | | | | | | | | | | | | |
Net change in unrealized appreciation (depreciation) of | | | | | | | | | | | | | | | | |
Securities, foreign currencies and foreign currency translation | | | (208,143 | ) | | | 1,095,555 | | | | | | | | 887,412 | |
Futures transactions | | | — | | | | (79,730 | ) | | | | | | | (79,730 | ) |
Options, swap agreements and short sale transactions | | | (6,572 | ) | | | (138,356 | ) | | | | | | | (144,928 | ) |
| | | | | | | | | | | | | | | | |
Net change in unrealized appreciation (depreciation) of investments | | | (214,715 | ) | | | 877,469 | | | | — | | | | 662,754 | |
| | | | | | | | | | | | | | | | |
Net realized and unrealized gain (loss) on investments | | | (240,740 | ) | | | (230,374 | ) | | | — | | | | (471,114 | ) |
| | | | | | | | | | | | | | | | |
Net increase (decrease) in net assets resulting from operations | | $ | 3,139,194 | | | $ | 25,549,768 | | | $ | — | | | $ | 28,688,962 | |
| | | | | | | | | | | | | | | | |
1 | Based on contractual agreements of the surviving fund. |
2 | Estimated cost increases (savings) as a result of merging the funds. |
The accompanying notes are an integral part of these proforma financial statements.
| | |
Proforma Portfolio of Investments - September 30, 2007 (Unaudited) | | Wells Fargo Advantage Funds |
| | | | | | | | | | | | | | | |
| | | Overseas Fund | | International Equity Fund | | Pro Forma Combined |
| | | Shares or
Principal
Amount | | Value
(Note 2) | | Shares or
Principal
Amount | | Value
(Note 2) | | Shares or
Principal
Amount | | Value
(Note 2) |
Common Stocks - 96.54% | | | | | | | | | | | | | | | |
Australia - 4.22% | | | | | | | | | | | | | | | |
AXA Asia Pacific Holdings Limited | | 116,905 | | $ | 809,139 | | 411,208 | | $ | 2,846,109 | | 528,113 | | $ | 3,655,248 |
Bluescope Steel Limited | | | | | | | 264,200 | | | 2,520,210 | | 264,200 | | | 2,520,210 |
Boral Limited | | | | | | | 264,000 | | | 1,684,334 | | 264,000 | | | 1,684,334 |
Commonwealth Bank of Australia | | | | | | | 44,000 | | | 2,201,660 | | 44,000 | | | 2,201,660 |
CSR Limited | | | | | | | 192,000 | | | 529,855 | | 192,000 | | | 529,855 |
OneSteel Limited | | | | | | | 222,900 | | | 1,364,755 | | 222,900 | | | 1,364,755 |
Orica Limited | | 29,670 | | | 792,464 | | 104,909 | | | 2,802,042 | | 134,579 | | | 3,594,506 |
Perilya Limited | | | | | | | 253,500 | | | 897,524 | | 253,500 | | | 897,524 |
Qantas Airways | | | | | | | 574,900 | | | 2,846,571 | | 574,900 | | | 2,846,571 |
QBE Insurance Group Limited | | 29,800 | | | 893,775 | | 96,000 | | | 2,879,277 | | 125,800 | | | 3,773,052 |
Rio Tinto Limited | | 14,261 | | | 1,369,471 | | 49,835 | | | 4,785,611 | | 64,096 | | | 6,155,082 |
Santos Limited | | 36,529 | | | 487,831 | | 286,204 | | | 3,822,149 | | 322,733 | | | 4,309,980 |
Telstra Corporation Limited | | | | | | | 340,800 | | | 1,318,504 | | 340,800 | | | 1,318,504 |
Woodside Petroleum Limited | | 17,820 | | | 793,792 | | 67,950 | | | 3,026,834 | | 85,770 | | | 3,820,626 |
Total Australia | | | | | 5,146,472 | | | | | 33,525,435 | | | | | 38,671,907 |
| | | | | | |
Austria - 0.60% | | | | | | | | | | | | | | | |
OMV AG | | 7,570 | | | 505,501 | | 26,625 | | | 1,777,936 | | 34,195 | | | 2,283,437 |
Voestalpine AG | | | | | | | 27,900 | | | 2,410,900 | | 27,900 | | | 2,410,900 |
Wiener Staedtische Allgemeine Versicherung AG | | | | | | | 11,636 | | | 813,022 | | 11,636 | | | 813,022 |
Total Austria | | | | | 505,501 | | | | | 5,001,858 | | | | | 5,507,359 |
| | | | | | |
Belgium - 0.97% | | | | | | | | | | | | | | | |
Delhaize Group | | 9,200 | | | 881,575 | | 40,729 | | | 3,902,792 | | 49,929 | | | 4,784,367 |
Dexia SA | | | | | | | 10,400 | | | 314,985 | | 10,400 | | | 314,985 |
Fortis | | 10,656 | | | 313,774 | | 115,637 | | | 3,405,016 | | 126,293 | | | 3,718,790 |
Umicore | | | | | | | 172 | | | 41,106 | | 172 | | | 41,106 |
Total Belgium | | | | | 1,195,349 | | | | | 7,663,899 | | | | | 8,859,248 |
| | | | | | |
Brazil-0.10% | | | | | | | | | | | | | | | |
Vivo Participacoes SA ADR | | | | | | | 187,890 | | | 931,934 | | 187,890 | | | 931,934 |
Total Brazil | | | | | — | | | | | 931,934 | | | | | 931,934 |
| | | | | | |
Canada - 0.39% | | | | | | | | | | | | | | | |
Canadian Pacific Railway Limited | | | | | | | 50,124 | | | 3,523,216 | | 50,124 | | | 3,523,216 |
Total Canada | | | | | — | | | | | 3,523,216 | | | | | 3,523,216 |
| | | | | | |
China - 1.30% | | | | | | | | | | | | | | | |
China Construction Bank Class H | | | | | | | 2,326,600 | | | 2,121,934 | | 2,326,600 | | | 2,121,934 |
China Life Insurance Company Limited | | | | | | | 595,000 | | | 3,417,451 | | 595,000 | | | 3,417,451 |
China Petroleum & Chemical Corporation (Sinopec) | | | | | | | 1,556,000 | | | 1,943,536 | | 1,556,000 | | | 1,943,536 |
Industrial & Commercial Bank of China Limited Class H | | 1,419,000 | | | 994,816 | | 4,846,000 | | | 3,397,377 | | 6,265,000 | | | 4,392,193 |
Total China | | | | | 994,816 | | | | | 10,880,298 | | | | | 11,875,114 |
| | | | | | |
Denmark - 0.23% | | | | | | | | | | | | | | | |
Danske Bank A/S | | | | | | | 29,700 | | | 1,205,804 | | 29,700 | | | 1,205,804 |
H. Lundbeck A/S | | | | | | | 33,700 | | | 915,358 | | 33,700 | | | 915,358 |
Total Denmark | | | | | — | | | | | 2,121,162 | | | | | 2,121,162 |
| | | | | | |
Finland - 2.41% | | | | | | | | | | | | | | | |
Elcoteq Network Oyj | | | | | | | 22,400 | | | 151,401 | | 22,400 | | | 151,401 |
Fortum Oyj | | 17,900 | | | 656,998 | | 272,051 | | | 9,985,303 | | 289,951 | | | 10,642,301 |
Kemira Oyj | | | | | | | 39,200 | | | 915,593 | | 39,200 | | | 915,593 |
Metso Oyj | | 8,870 | | | 610,904 | | 29,659 | | | 2,042,707 | | 38,529 | | | 2,653,611 |
Nokia Oyj | | 37,900 | | | 1,440,793 | | 105,900 | | | 4,025,858 | | 143,800 | | | 5,466,651 |
Rautaruukki Oyj | | | | | | | 27,100 | | | 1,641,944 | | 27,100 | | | 1,641,944 |
TietoEnator Oyj | | | | | | | 25,200 | | | 565,598 | | 25,200 | | | 565,598 |
Total Finland | | | | | 2,708,695 | | | | | 19,328,404 | | | | | 22,037,099 |
| | | | | | |
France - 11.00% | | | | | | | | | | | | | | | |
Alstom | | 4,300 | | | 874,200 | | 35,972 | | | 7,312,992 | | 40,272 | | | 8,187,192 |
Arkema† | | | | | | | 910 | | | 55,421 | | 910 | | | 55,421 |
BNP Paribas SA | | | | | | | 48,500 | | | 5,307,205 | | 48,500 | | | 5,307,205 |
Bouygues SA | | 7,200 | | | 621,038 | | 92,187 | | | 7,951,620 | | 99,387 | | | 8,572,658 |
Carrefour SA | | 9,572 | | | 670,582 | | 81,810 | | | 5,731,331 | | 91,382 | | | 6,401,913 |
CNP Assurances | | | | | | | 10,000 | | | 1,279,214 | | 10,000 | | | 1,279,214 |
Compagnie de Saint-Gobain | | | | | | | 26,600 | | | 2,776,104 | | 26,600 | | | 2,776,104 |
Compagnie Generale des Etablissements Michelin | | 5,903 | | | 793,587 | | 29,649 | | | 3,985,952 | | 35,552 | | | 4,779,539 |
Credit Agricole SA | | | | | | | 33,900 | | | 1,307,583 | | 33,900 | | | 1,307,583 |
Electricite de France | | | | | | | 52,561 | | | 5,557,470 | | 52,561 | | | 5,557,470 |
| | |
| Proforma Portfolio of Investments - September 30, 2007 (Unaudited) | | Wells Fargo Advantage Funds |
| | | | | | | | | | | | |
| | | Overseas Fund | | International Equity Fund | | Pro Forma Combined |
| | | Shares or
Principal
Amount | | Value
(Note 2) | | Shares or
Principal
Amount | | Value
(Note 2) | | Shares or
Principal
Amount | | Value
(Note 2) |
| LVMH Moet Hennessy Louis Vuitton SA | | 6,984 | | 837,235 | | 65,567 | | 7,860,112 | | 72,551 | | 8,697,347 |
PagesJaunes SA | | 62 | | 1,274 | | | | | | 62 | | 1,274 |
Peugeot SA | | | | | | 16,900 | | 1,394,818 | | 16,900 | | 1,394,818 |
PPR SA | | 2,225 | | 418,609 | | 7,607 | | 1,431,173 | | 9,832 | | 1,849,782 |
Publicis Groupe | | 15,808 | | 650,092 | | 54,059 | | 2,223,134 | | 69,867 | | 2,873,226 |
Rallye SA | | | | | | 14,600 | | 1,040,939 | | 14,600 | | 1,040,939 |
Renault SA | | | | | | 14,500 | | 2,101,114 | | 14,500 | | 2,101,114 |
Sanofi-Aventis | | 9,700 | | 821,324 | | 71,200 | | 6,028,684 | | 80,900 | | 6,850,008 |
Societe Generale | | | | | | 10,600 | | 1,778,733 | | 10,600 | | 1,778,733 |
Technip SA | | 9,659 | | 863,579 | | 80,818 | | 7,225,668 | | 90,477 | | 8,089,247 |
Total SA | | 18,316 | | 1,489,225 | | 100,600 | | 8,179,515 | | 118,916 | | 9,668,740 |
Valeo SA | | | | | | 26,899 | | 1,496,669 | | 26,899 | | 1,496,669 |
Vinci SA | | | | | | 60,038 | | 4,690,616 | | 60,038 | | 4,690,616 |
Vivendi Universal SA | | 20,830 | | 879,191 | | 120,955 | | 5,105,260 | | 141,785 | | 5,984,451 |
Total France | | | | 8,919,936 | | | | 91,821,327 | | | | 100,741,263 |
| | | | | | |
Germany - 11.06% | | | | | | | | | | | | |
Allianz SE | | 4,400 | | 1,028,020 | | 47,244 | | 11,038,129 | | 51,644 | | 12,066,149 |
Altana AG | | | | | | 6,900 | | 166,279 | | 6,900 | | 166,279 |
Arcandor AG | | 18,800 | | 629,446 | | 65,600 | | 2,196,364 | | 84,400 | | 2,825,810 |
BASF AG | | | | | | 39,300 | | 5,435,840 | | 39,300 | | 5,435,840 |
Bayer AG | | | | | | 80,176 | | 6,381,703 | | 80,176 | | 6,381,703 |
Bayerische Motoren Werke AG | | | | | | 14,300 | | 922,285 | | 14,300 | | 922,285 |
Celesio AG | | | | | | 3,049 | | 192,429 | | 3,049 | | 192,429 |
Commerzbank AG | | 11,674 | | 472,593 | | 39,781 | | 1,610,436 | | 51,455 | | 2,083,029 |
DaimlerChrysler AG | | 13,000 | | 1,309,473 | | 134,495 | | 13,547,501 | | 147,495 | | 14,856,974 |
Deutsche Bank AG | | 8,500 | | 1,095,453 | | 53,200 | | 6,856,245 | | 61,700 | | 7,951,698 |
Deutsche Lufthansa AG | | | | | | 66,800 | | 1,921,254 | | 66,800 | | 1,921,254 |
Deutsche Telekom AG | | | | | | 237,935 | | 4,675,305 | | 237,935 | | 4,675,305 |
E.ON AG | | 5,100 | | 942,928 | | 19,900 | | 3,679,268 | | 25,000 | | 4,622,196 |
Fraport AG | | | | | | 42,273 | | 2,922,925 | | 42,273 | | 2,922,925 |
GEA Group AG | | 15,451 | | 543,536 | | 54,201 | | 1,906,684 | | 69,652 | | 2,450,220 |
Heidelberger Druckmaschinen AG | | | | | | 26,900 | | 1,176,820 | | 26,900 | | 1,176,820 |
IVG Immobilien AG | | | | | | 20,293 | | 756,405 | | 20,293 | | 756,405 |
Linde AG | | | | | | 35,538 | | 4,413,302 | | 35,538 | | 4,413,302 |
Muenchener Rueckversicherungs Gesellschaft AG | | | | | | 13,300 | | 2,555,920 | | 13,300 | | 2,555,920 |
RWE AG | | | | | | 21,776 | | 2,738,729 | | 21,776 | | 2,738,729 |
Siemens AG | | 6,100 | | 838,686 | | 43,977 | | 6,046,375 | | 50,077 | | 6,885,061 |
Thyssenkrupp AG | | | | | | 74,400 | | 4,737,989 | | 74,400 | | 4,737,989 |
TUI AG | | | | | | 28,200 | | 757,587 | | 28,200 | | 757,587 |
United Internet AG | | | | | | 59,960 | | 1,350,038 | | 59,960 | | 1,350,038 |
Wacker Chemie AG | | | | | | 27,539 | | 6,445,231 | | 27,539 | | 6,445,231 |
Total Germany | | | | 6,860,135 | | | | 94,431,043 | | | | 101,291,178 |
| | | | | | |
Greece - 0.40% | | | | | | | | | | | | |
Alpha Bank AE | | 27,552 | | 960,189 | | 76,628 | | 2,670,491 | | 104,180 | | 3,630,680 |
Total Greece | | | | 960,189 | | | | 2,670,491 | | | | 3,630,680 |
| | | | | | |
Hong Kong - 7.01% | | | | | | | | | | | | |
Bank of East Asia Limited | | | | | | 534,200 | | 2,996,086 | | 534,200 | | 2,996,086 |
Cheung Kong Holdings Limited | | 70,000 | | 1,154,383 | | 240,000 | | 3,957,884 | | 310,000 | | 5,112,267 |
China Merchants Holdings International Company (Hong Kong) Limited | | | | | | 414,600 | | 2,578,633 | | 414,600 | | 2,578,633 |
China Mobile (Hong Kong) Limited | | 84,000 | | 1,375,535 | | 427,900 | | 7,007,039 | | 511,900 | | 8,382,574 |
China Netcom Group Corporation (Hong Kong) Limited | | | | | | 821,700 | | 2,198,571 | | 821,700 | | 2,198,571 |
China Resources Land (Hong Kong) Limited | | | | | | 1,320,200 | | 2,751,177 | | 1,320,200 | | 2,751,177 |
China Unicom (Hong Kong) Limited | | | | | | 2,805,100 | | 5,802,274 | | 2,805,100 | | 5,802,274 |
CITIC Pacific Limited | | | | | | 421,000 | | 2,686,134 | | 421,000 | | 2,686,134 |
Denway Motors Limited | | | | | | 2,106,500 | | 1,222,086 | | 2,106,500 | | 1,222,086 |
Guangdong Investment Limited | | 1,264,000 | | 866,639 | | 2,527,000 | | 1,732,592 | | 3,791,000 | | 2,599,231 |
Hang Lung Properties Limited | | 211,000 | | 944,551 | | 728,000 | | 3,258,926 | | 939,000 | | 4,203,477 |
Hutchinson Whampoa Limited | | | | | | 473,700 | | 5,066,750 | | 473,700 | | 5,066,750 |
NWS Holdings Limited | | | | | | 596,732 | | 1,403,199 | | 596,732 | | 1,403,199 |
Orient Overseas International Limited | | | | | | 275,220 | | 2,618,075 | | 275,220 | | 2,618,075 |
Sun Hung Kai Properties Limited | | 52,000 | | 876,271 | | 409,800 | | 6,905,690 | | 461,800 | | 7,781,961 |
Swire Pacific Limited | | | | | | 327,258 | | 3,967,669 | | 327,258 | | 3,967,669 |
Television Broadcasts Limited | | 95,000 | | 570,695 | | 320,000 | | 1,922,342 | | 415,000 | | 2,493,037 |
Tencent Holdings Limited | | | | | | 42,000 | | 271,217 | | 42,000 | | 271,217 |
Total Hong Kong | | | | 5,788,074 | | | | 58,346,344 | | | | 64,134,418 |
| | | | | | |
India - 0.17% | | | | | | | | | | | | |
Infosys Technologies Limited ADR | | 7,400 | | 358,086 | | 25,500 | | 1,233,945 | | 32,900 | | 1,592,031 |
Total India | | | | 358,086 | | | | 1,233,945 | | | | 1,592,031 |
| | |
| Proforma Portfolio of Investments - September 30, 2007 (Unaudited) | | Wells Fargo Advantage Funds |
| | | | | | | | | | | | |
| | | Overseas Fund | | International Equity Fund | | Pro Forma Combined |
| | | Shares or
Principal
Amount | | Value
(Note 2) | | Shares or
Principal
Amount | | Value
(Note 2) | | Shares or
Principal
Amount | | Value
(Note 2) |
| Ireland - 0.52% | | | | | | | | | | | | |
Allied Irish Banks plc | | | | | | 36,500 | | 884,798 | | 36,500 | | 884,798 |
Irish Life & Permanent plc | | | | | | 65,300 | | 1,447,925 | | 65,300 | | 1,447,925 |
| | | | | | |
Connemara Green Marble Quarries plc(a) | | 254,000 | | — | | | | | | 254,000 | | — |
Experian Group Limited | | 51,240 | | 542,006 | | 174,450 | | 1,845,295 | | 225,690 | | 2,387,301 |
Total Ireland | | | | 542,006 | | | | 4,178,018 | | | | 4,720,024 |
| | | | | | |
Italy - 2.40% | | | | | | | | | | | | |
ENI SpA | | 32,800 | | 1,215,577 | | 217,330 | | 8,054,310 | | 250,130 | | 9,269,887 |
Fiat SpA | | | | | | 130,800 | | 3,955,950 | | 130,800 | | 3,955,950 |
Hera SpA | | | | | | 45,030 | | 185,889 | | 45,030 | | 185,889 |
Intesa Sanpaolo | | | | | | 276,875 | | 2,137,886 | | 276,875 | | 2,137,886 |
Mediobanca SpA | | | | | | 76,591 | | 1,675,350 | | 76,591 | | 1,675,350 |
UniCredito Italiano SpA | | 77,300 | | 661,353 | | 290,100 | | 2,481,997 | | 367,400 | | 3,143,350 |
Unione di Banche Italiane Scpa | | | | | | 61,200 | | 1,644,997 | | 61,200 | | 1,644,997 |
Total Italy | | | | 1,876,930 | | | | 20,136,379 | | | | 22,013,309 |
| | | | | | |
Japan - 16.43% | | | | | | | | | | | | |
ACOM Company Limited | | | | | | 9,000 | | 200,583 | | 9,000 | | 200,583 |
Alpine Electronics Incorporated | | | | | | 34,300 | | 505,251 | | 34,300 | | 505,251 |
Alps Electric Company Limited | | | | | | 58,600 | | 705,047 | | 58,600 | | 705,047 |
Asahi Breweries Limited | | | | | | 300 | | 4,571 | | 300 | | 4,571 |
Asahi Kasei Corporation | | | | | | 183,000 | | 1,478,466 | | 183,000 | | 1,478,466 |
Bank of Yokohama Limited | | 51,000 | | 352,092 | | 181,000 | | 1,249,580 | | 232,000 | | 1,601,672 |
Central Glass Company Limited | | | | | | 161,000 | | 811,553 | | 161,000 | | 811,553 |
Chugai Pharmaceutical Company Limited | | | | | | 72,900 | | 1,203,946 | | 72,900 | | 1,203,946 |
Cosmo Oil Company Limited | | | | | | 321,000 | | 1,531,433 | | 321,000 | | 1,531,433 |
Credit Saison Company Limited | | | | | | 135,900 | | 3,502,059 | | 135,900 | | 3,502,059 |
Denki Kagaku Kogyo Kabushiki Kaisha | | | | | | 342,000 | | 1,920,428 | | 342,000 | | 1,920,428 |
East Japan Railway Company | | 110 | | 867,627 | | 351 | | 2,768,520 | | 461 | | 3,636,147 |
FamilyMart Company Limited | | | | | | 49,800 | | 1,298,490 | | 49,800 | | 1,298,490 |
Fanuc Limited | | 8,900 | | 907,317 | | 30,300 | | 3,088,957 | | 39,200 | | 3,996,274 |
Fuji Heavy Industries Limited | | | | | | 174,000 | | 764,985 | | 174,000 | | 764,985 |
Fujitsu Limited | | 68,000 | | 480,703 | | 234,000 | | 1,654,185 | | 302,000 | | 2,134,888 |
Hitachi Capital Corporation | | | | | | 51,100 | | 642,837 | | 51,100 | | 642,837 |
Hokkaido Electric Power Company Incorporated | | | | | | 68,300 | | 1,477,608 | | 68,300 | | 1,477,608 |
Honda Motor Company Limited | | | | | | 61,800 | | 2,076,768 | | 61,800 | | 2,076,768 |
Ibiden Company Limited | | 6,800 | | 572,463 | | 23,300 | | 1,961,529 | | 30,100 | | 2,533,992 |
Inpex Holdings Incorporated | | 78 | | 801,288 | | 265 | | 2,722,326 | | 343 | | 3,523,614 |
Isetan Company Limited | | 57,200 | | 771,365 | | 194,900 | | 2,628,304 | | 252,100 | | 3,399,669 |
Japan Tobacco Incorporated | | | | | | 972 | | 5,339,590 | | 972 | | 5,339,590 |
Jupiter Telecommunications Company Limited† | | | | | | 3,399 | | 2,639,540 | | 3,399 | | 2,639,540 |
Kansai Electric Power Company Incorporated | | | | | | 68,100 | | 1,556,283 | | 68,100 | | 1,556,283 |
Kao Corporation | | 33,000 | | 985,418 | | 106,000 | | 3,165,281 | | 139,000 | | 4,150,699 |
Kirin Brewery Company Limited | | | | | | 130,700 | | 1,729,543 | | 130,700 | | 1,729,543 |
Maeda Road Construction Company Limited | | | | | | 102,000 | | 893,327 | | 102,000 | | 893,327 |
Marubeni Corporation | | | | | | 325,400 | | 2,985,867 | | 325,400 | | 2,985,867 |
Matsushita Electric Industrial Company Limited | | | | | | 77,000 | | 1,444,609 | | 77,000 | | 1,444,609 |
Mitsubishi Chemical Holdings Corporation | | | | | | 180,200 | | 1,568,798 | | 180,200 | | 1,568,798 |
Mitsubishi Corporation | | 32,000 | | 1,014,060 | | 108,500 | | 3,438,297 | | 140,500 | | 4,452,357 |
Mitsubishi Estate Company Limited | | | | | | 72,000 | | 2,062,247 | | 72,000 | | 2,062,247 |
Mitsubishi Heavy Industries Limited | | | | | | 853,600 | | 5,580,931 | | 853,600 | | 5,580,931 |
Mitsubishi UFJ Financial Group Incorporated | | 57 | | 538,117 | | 195 | | 1,840,926 | | 252 | | 2,379,043 |
Mitsui Fudosan Company Limited | | 45,000 | | 1,249,728 | | 218,651 | | 6,072,317 | | 263,651 | | 7,322,045 |
Murata Manufacturing Company Limited | | 14,400 | | 1,038,019 | | 49,100 | | 3,539,355 | | 63,500 | | 4,577,374 |
Nippon Electric Glass Company Limited | | 62,000 | | 998,564 | | 213,000 | | 3,430,549 | | 275,000 | | 4,429,113 |
Nippon Oil Corporation | | | | | | 248,000 | | 2,303,713 | | 248,000 | | 2,303,713 |
Nippon Steel Corporation | | | | | | 12,000 | | 86,397 | | 12,000 | | 86,397 |
Nippon Telegraph & Telephone Corporation | | | | | | 600 | | 2,805,032 | | 600 | | 2,805,032 |
Nissan Motor Company Limited | | | | | | 145,200 | | 1,454,971 | | 145,200 | | 1,454,971 |
Nomura Holdings Incorporated | | 36,600 | | 613,691 | | 283,000 | | 4,745,205 | | 319,600 | | 5,358,896 |
Nomura Research Institute Limited | | 10,700 | | 364,228 | | 36,400 | | 1,239,055 | | 47,100 | | 1,603,283 |
NTT DoCoMo Incorporated | | | | | | 1,800 | | 2,569,973 | | 1,800 | | 2,569,973 |
Oji Paper Company Limited | | | | | | 276,000 | | 1,335,968 | | 276,000 | | 1,335,968 |
Orix Corporation | | | | | | 14,510 | | 3,309,642 | | 14,510 | | 3,309,642 |
Promise Company Limited | | | | | | 19,400 | | 472,903 | | 19,400 | | 472,903 |
Rengo Company Limited | | | | | | 103,000 | | 694,946 | | 103,000 | | 694,946 |
Ricoh Company Limited | | | | | | 66,000 | | 1,396,248 | | 66,000 | | 1,396,248 |
Ryosan Company Limited | | | | | | 43,200 | | 1,081,269 | | 43,200 | | 1,081,269 |
Sankyo Company Limited | | | | | | 31,900 | | 1,291,386 | | 31,900 | | 1,291,386 |
Santen Pharmaceutical Company Limited | | | | | | 36,800 | | 921,081 | | 36,800 | | 921,081 |
| | |
| Proforma Portfolio of Investments - September 30, 2007 (Unaudited) | | Wells Fargo Advantage Funds |
| | | | | | | | | | | | |
| | | Overseas Fund | | International Equity Fund | | Pro Forma Combined |
| | | Shares or
Principal
Amount | | Value
(Note 2) | | Shares or
Principal
Amount | | Value
(Note 2) | | Shares or
Principal
Amount | | Value
(Note 2) |
| Seiko Epson Corporation | | | | | | 11,800 | | 292,265 | | 11,800 | | 292,265 |
Shin-Etsu Chemical Company Limited | | 7,200 | | 497,697 | | 24,600 | | 1,700,466 | | 31,800 | | 2,198,163 |
Showa Shell Sekiyu KK | | | | | | 60,400 | | 776,658 | | 60,400 | | 776,658 |
Sumitomo Bakelite Company Limited | | | | | | 154,000 | | 886,206 | | 154,000 | | 886,206 |
Sumitomo Corporation | | | | | | 137,500 | | 2,657,467 | | 137,500 | | 2,657,467 |
Sumitomo Metal Industries Limited | | 199,000 | | 1,160,754 | | 679,000 | | 3,960,562 | | 878,000 | | 5,121,316 |
Sumitomo Trust & Banking Company Limited | | 51,000 | | 385,836 | | 258,000 | | 1,951,874 | | 309,000 | | 2,337,710 |
Takefuji Corporation | | | | | | 11,800 | | 234,223 | | 11,800 | | 234,223 |
Tanabe Seiyaku Company Limited | | | | | | 155,000 | | 1,956,645 | | 155,000 | | 1,956,645 |
Tokyo Electric Power Company Incorporated | | | | | | 19,900 | | 502,416 | | 19,900 | | 502,416 |
Tokyu Land Corporation | | | | | | 116,500 | | 1,169,412 | | 116,500 | | 1,169,412 |
Toppan Printing Company Limited | | | | | | 96,000 | | 988,708 | | 96,000 | | 988,708 |
Toshiba TEC Corporation | | | | | | 209,000 | | 1,291,864 | | 209,000 | | 1,291,864 |
Toyota Motor Corporation | | 17,000 | | 1,003,439 | | 113,500 | | 6,699,429 | | 130,500 | | 7,702,868 |
Urban Corporation | | | | | | 116,400 | | 1,887,896 | | 116,400 | | 1,887,896 |
Yamaha Motor Company Limited | | 15,500 | | 395,377 | | 53,000 | | 1,351,935 | | 68,500 | | 1,747,312 |
Total Japan | | | | 14,997,783 | | | | 135,500,701 | | | | 150,498,484 |
| | | | | | |
Luxembourg - 0.89% | | | | | | | | | | | | |
Arcelormittal | | 14,288 | | 1,127,694 | | 48,462 | | 3,824,911 | | 62,750 | | 4,952,605 |
RTL Group SA | | | | | | 10,658 | | 1,082,837 | | 10,658 | | 1,082,837 |
Tenaris SA | | | | | | 52,192 | | 1,378,311 | | 52,192 | | 1,378,311 |
Tenaris SA ADR | | | | | | 14,600 | | 768,252 | | 14,600 | | 768,252 |
Total Luxembourg | | | | 1,127,694 | | | | 7,054,311 | | | | 8,182,005 |
| | | | | | |
Mexico - 0.22% | | | | | | | | | | | | |
Grupo Televisa SA ADR | | | | | | 83,700 | | 2,023,029 | | 83,700 | | 2,023,029 |
Total Mexico | | | | — | | | | 2,023,029 | | | | 2,023,029 |
| | | | | | |
Netherlands - 2.83% | | | | | | | | | | | | |
Aegon NV | | | | | | 194,200 | | 3,719,012 | | 194,200 | | 3,719,012 |
ASML Holding NV† | | 22,900 | | 759,208 | | 230,651 | | 7,646,816 | | 253,551 | | 8,406,024 |
ING Groep NV | | 6,400 | | 284,094 | | 111,300 | | 4,940,565 | | 117,700 | | 5,224,659 |
Koninklijke (Royal) KPN NV | | 26,700 | | 463,345 | | 146,300 | | 2,538,852 | | 173,000 | | 3,002,197 |
Randstad Holdings NV | | 8,500 | | 459,489 | | 29,600 | | 1,600,103 | | 38,100 | | 2,059,592 |
Wolters Kluwer NV | | 26,300 | | 780,798 | | 91,100 | | 2,704,590 | | 117,400 | | 3,485,388 |
Total Netherlands | | | | 2,746,934 | | | | 23,149,938 | | | | 25,896,872 |
| | | | | | |
Norway - 1.49% | | | | | | | | | | | | |
Cermaq ASA | | | | | | 74,400 | | 1,380,014 | | 74,400 | | 1,380,014 |
Norsk Hydro ASA | | | | | | 46,800 | | 2,035,632 | | 46,800 | | 2,035,632 |
Orkla ASA | | | | | | 222,802 | | 3,979,751 | | 222,802 | | 3,979,751 |
Renewable Energy Corporation AS† | | | | | | 35,150 | | 1,620,176 | | 35,150 | | 1,620,176 |
Seadrill Limited† | | | | | | 206,300 | | 4,639,717 | | 206,300 | | 4,639,717 |
Total Norway | | | | — | | | | 13,655,290 | | | | 13,655,290 |
| | | | | | |
Portugal - 0.13% | | | | | | | | | | | | |
Banco Comercial Portugues SA | | | | | | 281,300 | | 1,167,253 | | 281,300 | | 1,167,253 |
Total Portugal | | | | — | | | | 1,167,253 | | | | 1,167,253 |
| | | | | | |
Qatar - 0.03% | | | | | | | | | | | | |
Industries Qatar | | | | | | 8,356 | | 293,914 | | 8,356 | | 293,914 |
Total Qater | | | | — | | | | 293,914 | | | | 293,914 |
| | | | | | |
Russia - 1.79% | | | | | | | | | | | | |
Gazprom ADR | | | | | | 15,400 | | 675,290 | | 15,400 | | 675,290 |
Lukoil ADR | | 10,135 | | 844,246 | | 93,002 | | 7,747,067 | | 103,137 | | 8,591,313 |
Mining & Metallurgical Company Norilsk Nickel GDR | | | | | | 7,000 | | 1,904,000 | | 7,000 | | 1,904,000 |
RAO Unified Energy System GDR | | | | | | 27,003 | | 3,267,363 | | 27,003 | | 3,267,363 |
VTB Bank OJSC GDR†† | | 48,803 | | 436,787 | | 169,564 | | 1,517,598 | | 218,367 | | 1,954,385 |
Total Russia | | | | 1,281,033 | | | | 15,111,318 | | | | 16,392,351 |
| | | | | | |
Singapore - 1.01% | | | | | | | | | | | | |
CapitaLand Limited | | 113,000 | | 619,960 | | 395,000 | | 2,167,115 | | 508,000 | | 2,787,075 |
MobilOne Limited | | | | | | 389,791 | | 537,914 | | 389,791 | | 537,914 |
Neptune Orient Lines Limited | | | | | | 398,000 | | 1,419,993 | | 398,000 | | 1,419,993 |
Oversea-Chinese Banking Corporation Limited | | | | | | 117,300 | | 702,773 | | 117,300 | | 702,773 |
Singapore Airlines Limited† | | | | | | 107,333 | | 1,372,826 | | 107,333 | | 1,372,826 |
Singapore Telecommunications Limited | | | | | | 121,000 | | 327,445 | | 121,000 | | 327,445 |
United Overseas Bank Limited | | 34,000 | | 505,823 | | 109,000 | | 1,621,609 | | 143,000 | | 2,127,432 |
Total Singapore | | | | 1,125,783 | | | | 8,149,675 | | | | 9,275,458 |
| | |
| Proforma Portfolio of Investments - September 30, 2007 (Unaudited) | | Wells Fargo Advantage Funds |
| | | | | | | | | | | | |
| | | Overseas Fund | | International Equity Fund | | Pro Forma Combined |
| | | Shares or
Principal
Amount | | Value
(Note 2) | | Shares or
Principal
Amount | | Value
(Note 2) | | Shares or
Principal
Amount | | Value
(Note 2) |
South Africa - 0.16% | | | | | | | | | | | | |
MTN Group Limited | | | | | | 5,973 | | 90,601 | | 5,973 | | 90,601 |
Naspers Limited | | | | | | 50,519 | | 1,400,743 | | 50,519 | | 1,400,743 |
Total South Africa | | | | — | | | | 1,491,344 | | | | 1,491,344 |
| | | | | | |
South Korea - 1.16% | | | | | | | | | | | | |
Hana Financial Group Incorporated | | | | | | 46,239 | | 2,180,084 | | 46,239 | | 2,180,084 |
Kookmin Bank | | | | | | 54,358 | | 4,525,874 | | 54,358 | | 4,525,874 |
NHN Corporation† | | | | | | 17,064 | | 3,949,033 | | 17,064 | | 3,949,033 |
Total South Korea | | | | — | | | | 10,654,991 | | | | 10,654,991 |
| | | | | | |
Spain - 3.00% | | | | | | | | | | | | |
Indra Sistemas SA | | 18,768 | | 507,677 | | 63,799 | | 1,725,773 | | 82,567 | | 2,233,450 |
Banco Bilbao Vizcaya Argentaria SA | | | | | | 61,000 | | 1,429,993 | | 61,000 | | 1,429,993 |
Repsol YPF SA | | | | | | 104,000 | | 3,714,868 | | 104,000 | | 3,714,868 |
Banco Santander Central Hispano SA | | | | | | 210,200 | | 4,085,366 | | 210,200 | | 4,085,366 |
Telefonica SA | | 29,200 | | 817,345 | | 318,459 | | 8,914,073 | | 347,659 | | 9,731,418 |
Industria de Diseno Textil SA | | | | | | 43,426 | | 2,926,482 | | 43,426 | | 2,926,482 |
Gamesa Corporation Tecnologica SA | | | | | | 81,193 | | 3,317,001 | | 81,193 | | 3,317,001 |
Total Spain | | | | 1,325,022 | | | | 26,113,556 | | | | 27,438,578 |
| | | | | | |
Sweden - 1.47% | | | | | | | | | | | | |
Assa Abloy AB Class B | | | | | | 12,400 | | 257,367 | | 12,400 | | 257,367 |
Electrolux AB Class B | | | | | | 40,900 | | 866,351 | | 40,900 | | 866,351 |
Nordea AB | | | | | | 164,600 | | 2,868,450 | | 164,600 | | 2,868,450 |
Skanska AB Class B | | 20,300 | | 402,434 | | 68,800 | | 1,363,914 | | 89,100 | | 1,766,348 |
Swedbank AB | | 15,522 | | 519,078 | | 54,307 | | 1,816,104 | | 69,829 | | 2,335,182 |
Telefonaktiebolaget LM Ericsson Class B | | 181,000 | | 724,663 | | 616,400 | | 2,467,857 | | 797,400 | | 3,192,520 |
Volvo AB Class B | | | | | | 126,500 | | 2,203,508 | | 126,500 | | 2,203,508 |
Total Sweden | | | | 1,646,175 | | | | 11,843,551 | | | | 13,489,726 |
| | | | | | |
Switzerland - 7.48% | | | | | | | | | | | | |
Adecco SA | | | | | | 34,289 | | 2,027,741 | | 34,289 | | 2,027,741 |
Baloise Holding AG | | | | | | 9,900 | | 1,001,692 | | 9,900 | | 1,001,692 |
Ciba Specialty Chemicals AG | | | | | | 16,900 | | 861,512 | | 16,900 | | 861,512 |
Credit Suisse Group | | 10,900 | | 723,702 | | 106,300 | | 7,057,754 | | 117,200 | | 7,781,456 |
Georg Fischer AG | | | | | | 3,100 | | 2,134,121 | | 3,100 | | 2,134,121 |
Holcim Limited | | 8,700 | | 960,979 | | 45,660 | | 5,043,484 | | 54,360 | | 6,004,463 |
Nestle SA | | | | | | 21,019 | | 9,442,076 | | 21,019 | | 9,442,076 |
Novartis AG | | 17,000 | | 938,158 | | 85,000 | | 4,690,788 | | 102,000 | | 5,628,946 |
Novartis AG ADR | | 11,220 | | 616,650 | | | | | | 11,220 | | 616,650 |
Rieter Holding AG | | | | | | 3,600 | | 1,948,035 | | 3,600 | | 1,948,035 |
Roche Holdings AG Genusschein | | 8,463 | | 1,534,498 | | 54,517 | | 9,884,937 | | 62,980 | | 11,419,435 |
Roche Holdings AG - Bearer Shares | | | | | | 5,324 | | 1,113,044 | | 5,324 | | 1,113,044 |
Swiss Reinsurance | | | | | | 54,950 | | 4,894,408 | | 54,950 | | 4,894,408 |
Swisscom AG | | | | | | 5,600 | | 2,129,611 | | 5,600 | | 2,129,611 |
UBS AG | | 12,700 | | 682,860 | | 62,300 | | 3,349,779 | | 75,000 | | 4,032,639 |
Valora Holding AG | | | | | | 2,900 | | 580,125 | | 2,900 | | 580,125 |
Verwaltungs-Und Privat-Bank AG | | | | | | 6,400 | | 1,550,183 | | 6,400 | | 1,550,183 |
Zurich Financial Services AG | | 3,100 | | 929,933 | | 14,800 | | 4,439,680 | | 17,900 | | 5,369,613 |
Total Switzerland | | | | 6,386,780 | | | | 62,148,970 | | | | 68,535,750 |
| | | | | | |
Taiwan - 0.25% | | | | | | | | | | | | |
Taiwan Semiconductor Manufacturing Company Limited ADR | | 47,033 | | 475,974 | | 176,578 | | 1,786,969 | | 223,611 | | 2,262,943 |
Total Taiwan | | | | 475,974 | | | | 1,786,969 | | | | 2,262,943 |
| | | | | | |
United Kingdom - 15.36% | | | | | | | | | | | | |
Alliance & Leicester plc | | | | | | 117,400 | | 1,902,382 | | 117,400 | | 1,902,382 |
AstraZeneca plc | | | | | | 71,300 | | 3,572,586 | | 71,300 | | 3,572,586 |
Aviva plc | | 58,500 | | 880,923 | | 258,624 | | 3,894,493 | | 317,124 | | 4,775,416 |
BAE Systems plc | | 86,000 | | 868,340 | | 317,400 | | 3,204,782 | | 403,400 | | 4,073,122 |
Barclays plc | | 65,000 | | 791,953 | | 582,880 | | 7,101,748 | | 647,880 | | 7,893,701 |
Barratt Developments plc | | | | | �� | 93,600 | | 1,432,458 | | 93,600 | | 1,432,458 |
BP plc | | | | | | 288,400 | | 3,348,617 | | 288,400 | | 3,348,617 |
Bradford & Bingley plc | | | | | | 129,100 | | 800,338 | | 129,100 | | 800,338 |
Brit Insurance Holdings plc | | | | | | 298,800 | | 2,087,736 | | 298,800 | | 2,087,736 |
British Sky Broadcasting plc | | 71,000 | | 1,009,596 | | 244,720 | | 3,479,835 | | 315,720 | | 4,489,431 |
BT Group plc | | | | | | 569,600 | | 3,577,772 | | 569,600 | | 3,577,772 |
DS Smith plc | | | | | | 374,500 | | 1,430,925 | | 374,500 | | 1,430,925 |
DSG International plc | | | | | | 677,500 | | 1,871,317 | | 677,500 | | 1,871,317 |
easyJet plc† | | 37,200 | | 399,202 | | 126,900 | | 1,361,794 | | 164,100 | | 1,760,996 |
EMAP plc | | 39,166 | | 704,373 | | 152,260 | | 2,738,288 | | 191,426 | | 3,442,661 |
| | |
| Proforma Portfolio of Investments - September 30, 2007 (Unaudited) | | Wells Fargo Advantage Funds |
| | | | | | | | | | | | | | | | | | |
| | | Overseas Fund | | | International Equity Fund | | | Pro Forma Combined | |
| | | Shares or
Principal
Amount | | Value
(Note 2) | | | Shares or
Principal
Amount | | Value
(Note 2) | | | Shares or
Principal
Amount | | Value
(Note 2) | |
GKN plc | | | | | | | | 283,000 | | | 2,049,718 | | | 283,000 | | | 2,049,718 | |
GlaxoSmithKline plc | | 28,800 | | | 764,252 | | | 274,180 | | | 7,275,789 | | | 302,980 | | | 8,040,041 | |
GlaxoSmithKline plc ADR | | 19,000 | | | 1,010,800 | | | | | | | | | 19,000 | | | 1,010,800 | |
HBOS plc | | | | | | | | 202,200 | | | 3,783,286 | | | 202,200 | | | 3,783,286 | |
HSBC Holdings plc | | | | | | | | 74,800 | | | 1,384,250 | | | 74,800 | | | 1,384,250 | |
Invesco plc | | 33,100 | | | 447,984 | | | 116,200 | | | 1,572,680 | | | 149,300 | | | 2,020,664 | |
Johnson Matthey plc | | 12,231 | | | 417,159 | | | 41,641 | | | 1,420,238 | | | 53,872 | | | 1,837,397 | |
Legal & General Group plc | | 510,400 | | | 1,395,152 | | | 924,600 | | | 2,527,346 | | | 1,435,000 | | | 3,922,498 | |
Lloyds TSB Group plc | | | | | | | | 743,792 | | | 8,255,732 | | | 743,792 | | | 8,255,732 | |
National Grid plc | | 56,338 | | | 903,695 | | | 514,856 | | | 8,258,596 | | | 571,194 | | | 9,162,291 | |
Northern Foods plc | | | | | | | | 348,700 | | | 697,386 | | | 348,700 | | | 697,386 | |
OAO TMK GDR | | | | | | | | 16,247 | | | 671,001 | | | 16,247 | | | 671,001 | |
Old Mutual plc | | | | | | | | 477,500 | | | 1,566,070 | | | 477,500 | | | 1,566,070 | |
Rolls Royce Group plc | | 67,227 | | | 718,678 | | | 403,222 | | | 4,310,572 | | | 470,449 | | | 5,029,250 | |
Royal & Sun Alliance Insurance Group plc | | | | | | | | 699,200 | | | 2,210,214 | | | 699,200 | | | 2,210,214 | |
Royal Bank of Scotland Group plc | | | | | | | | 93,600 | | | 1,005,401 | | | 93,600 | | | 1,005,401 | |
Royal Dutch Shell plc Class A | | 22,200 | | | 916,143 | | | 125,541 | | | 5,180,788 | | | 147,741 | | | 6,096,931 | |
Royal Dutch Shell plc Class B | | | | | | | | 138,000 | | | 5,680,825 | | | 138,000 | | | 5,680,825 | |
Scottish & Newcastle plc | | | | | | | | 154,930 | | | 1,938,368 | | | 154,930 | | | 1,938,368 | |
Smiths Group plc | | 20,760 | | | 454,056 | | | 90,773 | | | 1,985,365 | | | 111,533 | | | 2,439,421 | |
Standard Chartered plc | | | | | | | | 92,521 | | | 3,028,759 | | | 92,521 | | | 3,028,759 | |
Tate & Lyle plc | | | | | | | | 83,000 | | | 683,515 | | | 83,000 | | | 683,515 | |
Taylor Woodrow plc | | | | | | | | 303,500 | | | 1,712,296 | | | 303,500 | | | 1,712,296 | |
Vodafone Group plc | | 323,260 | | | 1,167,350 | | | 3,200,625 | | | 11,558,031 | | | 3,523,885 | | | 12,725,381 | |
William Morrison Supermarkets plc | | | | | | | | 806,122 | | | 4,655,208 | | | 806,122 | | | 4,655,208 | |
Wolseley plc | | 15,233 | | | 257,592 | | | 53,457 | | | 903,965 | | | 68,690 | | | 1,161,557 | |
Yell Group plc | | 37,200 | | | 326,516 | | | 130,550 | | | 1,145,878 | | | 167,750 | | | 1,472,394 | |
Total United Kingdom | | | | | 13,433,764 | | | | | | 127,266,348 | | | | | | 140,700,112 | |
| | | | | | |
USA - 0.06% | | | | | | | | | | | | | | | | | | |
DryShips Incorporated | | | | | | | | 6,400 | | | 581,440 | | | 6,400 | | | 581,440 | |
Total USA | | | | | — | | | | | | 581,440 | | | | | | 581,440 | |
| | | | | | | | | | | | | | | | | | |
Total Common Stocks (Cost $64,560,579, $612,601,076 and $677,161,655, respectively) | | | | | 80,403,131 | | | | | | 803,786,351 | | | | | | 884,189,482 | |
| | | | | | | | | | | | | | | | | | |
| | | | | | |
Rights - 0.00% | | | | | | | | | | | | | | | | | | |
Citic Pacific Rights† | | | | | | | | 16,840 | | | 12,737 | | | 16,840 | | | 12,737 | |
| | | | | | | | | | | | | | | | | | |
Total Rights | | | | | — | | | | | | 12,737 | | | — | | | 12,737 | |
| | | | | | | | | | | | | | | | | | |
| | | | | | |
Collateral for Securities Lending - 2.93% | | | | | | | | | | | | | | | | | | |
Collateral Invested In Money Market Funds | | | | | | | | | | | | | | | | | | |
Bank of New York Institutional Cash Reserve Fund | | | | | 2,228,673 | | | | | | 24,583,423 | | | | | | 26,812,096 | |
Total Collateral Invested In Money Market Funds | | | | | 2,228,673 | | | | | | 24,583,423 | | | | | | 26,812,096 | |
| | | | | | | | | | | | | | | | | | |
Total Collateral for Securities Lending (Cost $2,228,673, $24,583,423 and $26,812,096, respectively) | | | | | 2,228,673 | | | | | | 24,583,423 | | | | | | 26,812,096 | |
| | | | | | | | | | | | | | | | | | |
| | | | | | |
Short-Term Investments (a) - 3.13% | | | | | | | | | | | | | | | | | | |
Mutual Funds | | | | | | | | | | | | | | | | | | |
Wells Fargo Advantage Money Market Trust~‡ | | | | | 1,681,702 | | | | | | 26,961,219 | | | | | | 28,642,921 | |
Total Mutual Funds | | | | | 1,681,702 | | | | | | 26,961,219 | | | | | | 28,642,921 | |
| | | | | | | | | | | | | | | | | | |
Total Short-Term Investments (Cost $1,681,702, $26,961,219 and $28,642,921, respectively) | | | | | 1,681,702 | | | | | | 26,961,219 | | | | | | 28,642,921 | |
| | | | | | | | | | | | | | | | | | |
Total Investments in Securities (Cost $68,470,954, $664,145,718 and $732,616,672, respectively) 102.60%* | | | | | 84,313,506 | | | | | | 855,343,730 | | | | | | 939,657,236 | |
Other Assets and Liabilities, Net ( -2.60%) | | | | | (2,280,788 | ) | | | | | (21,546,633 | ) | | | | | (23,827,421 | ) |
| | | | | | | | | | | | | | | | | | |
Net Assets 100.0% | | | | $ | 82,032,718 | | | | | $ | 833,797,097 | | | | | $ | 915,829,815 | |
| | | | | | | | | | | | | | | | | | |
| † | Non-income earning securities. |
| (a) | Security fair valued in accordance with the procedures approved by the Board of Trustees. |
| †† | Securities that may be resold to “qualified institutional buyers” under rule 144A or securities offered pursuant to section 4(2) of the Securities Act of 1933, as amended. |
| ~ | This Wells Fargo Advantage Fund invests cash balances that it retains for liquidity purposes in a Wells Fargo Advantage Money Market Fund. The fund does not pay an investment advisory fee for such investments. |
| ‡ | Security of an affiliate of the fund with a cost of $1,681,702, $26,961,219, $28,642,921 respectively) |
| * | Cost for federal income tax purposes is $68,470,954, $664,145,718, and $732,616,672, respectively) |
The accompanying notes are an integral part of these proforma financial statements.
| | |
| Proforma Statement of Assets and Liabilities - September 30, 2007 (Unaudited) | | Wells Fargo Advantage Funds |
| | | | | | | | | | | | | |
| | | Overseas
Fund | | International
Equity Fund | | Proforma
Adjustments | | | Proforma
Combined |
Assets | | | | | | | | | | | | | |
Investments | | | | | | | | | | | | | |
In securities, at market value | | $ | 80,403,131 | | $ | 803,799,088 | | | | | | $ | 884,202,219 |
Collateral for securities loaned | | | 2,228,673 | | | 24,583,423 | | | | | | | 26,812,096 |
Investments in affiliates | | | 1,681,702 | | | 26,961,219 | | | | | | | 28,642,921 |
| | | | | | | | | | | | | |
Total investments at market value (see cost below) | | | 84,313,506 | | | 855,343,730 | | | — | | | | 939,657,236 |
| | | | | | | | | | | | | |
Cash | | | — | | | 50,000 | | | | | | | 50,000 |
Foreign currency, at value | | | — | | | 4,586,332 | | | | | | | 4,586,332 |
Receivable for Fund shares issued | | | 5,095 | | | 96,647 | | | | | | | 101,742 |
Receivable for investments sold | | | 910,679 | | | 6,514,296 | | | | | | | 7,424,975 |
Receivables for dividends and interest | | | 189,170 | | | 2,516,995 | | | | | | | 2,706,165 |
| | | | | | | | | | | | | |
Total assets | | | 85,418,450 | | | 869,108,000 | | | — | | | | 954,526,450 |
| | | | | | | | | | | | | |
| | | | |
Liabilities | | | | | | | | | | | | | |
Payable for Fund shares redeemed | | | 68,949 | | | 245,278 | | | | | | | 314,227 |
Payable for investments purchased | | | 1,034,534 | | | 9,490,283 | | | | | | | 10,524,817 |
Payable to investment advisor and affiliates | | | 49,797 | | | 642,169 | | | | | | | 691,966 |
Payable for securities loaned | | | 2,228,673 | | | 24,583,423 | | | | | | | 26,812,096 |
Accrued expenses and other liabilities | | | 3,779 | | | 349,750 | | | | | | | 353,529 |
| | | | | | | | | | | | | |
Total liabilities | | | 3,385,732 | | | 35,310,903 | | | — | | | | 38,696,635 |
| | | | | | | | | | | | | |
Total net assets | | $ | 82,032,718 | | $ | 833,797,097 | | $ | — | | | $ | 915,829,815 |
| | | | | | | | | | | | | |
| | | | |
NET ASSETS CONSIST OF | | | | | | | | | | | | | |
Paid-in capital | | $ | 64,979,376 | | $ | 573,567,914 | | | | | | $ | 638,547,290 |
Undistributed net investment income (loss) | | | 643,507 | | | 10,211,558 | | | | | | | 10,855,065 |
Undistributed net realized gain (loss) on investments | | | 566,646 | | | 58,717,943 | | | | | | | 59,284,589 |
Net unrealized appreciation (depreciation) of investments, foreign currencies and translation of assets and liabilities denominated in foreign currencies | | | 15,843,189 | | | 191,299,682 | | | | | | | 207,142,871 |
| | | | | | | | | | | | | |
Total net assets | | $ | 82,032,718 | | $ | 833,797,097 | | $ | — | | | $ | 915,829,815 |
| | | | | | | | | | | | | |
| | | | |
COMPUTATION OF NET ASSET VALUE AND OFFERING PRICE PER SHARE1 | | | | | | | | | | | | | |
Net assets – Class A | | | NA | | $ | 62,693,045 | | | | | | $ | 62,693,045 |
Shares outstanding – Class A | | | NA | | | 3,216,672 | | | | | | | 3,216,672 |
Net asset value per share – Class A | | | NA | | $ | 19.49 | | | | | | $ | 19.49 |
Maximum offering price per share – Class A2 | | | NA | | $ | 20.68 | | | | | | $ | 20.68 |
Net assets – Class B | | | NA | | $ | 9,579,347 | | | | | | $ | 9,579,347 |
Shares outstanding – Class B | | | NA | | | 517,123 | | | | | | | 517,123 |
Net asset value and offering price per share – Class B | | | NA | | $ | 18.52 | | | | | | $ | 18.52 |
Net assets – Class C | | | NA | | $ | 1,960,879 | | | | | | $ | 1,960,879 |
Shares outstanding – Class C | | | NA | | | 106,200 | | | | | | | 106,200 |
Net asset value and offering price per share – Class C | | | NA | | $ | 18.46 | | | | | | $ | 18.46 |
Net assets – Administrator Class | | | NA | | $ | 689,807,859 | | | | | | $ | 689,807,859 |
Shares outstanding – Administrator Class | | | NA | | | 35,412,072 | | | | | | | 35,412,072 |
Net asset value and offering price per share – Administrator Class | | | NA | | $ | 19.48 | | | | | | $ | 19.48 |
Net assets – Institutional Class | | $ | 9,080,258 | | $ | 69,755,967 | | | | | | $ | 78,836,225 |
Shares outstanding – Institutional Class | | | 654,093 | | | 3,577,958 | | | (189,168 | )3 | | | 4,042,883 |
Net asset value and offering price per share – Institutional Class | | $ | 13.88 | | $ | 19.50 | | | | | | $ | 19.50 |
Net assets – Investor Class | | $ | 72,952,460 | | | NA | | | | | | $ | 72,952,460 |
Shares outstanding – Investor Class | | | 5,286,099 | | | NA | | | (1,541,106 | )4 | | | 3,744,993 |
Net asset value and offering price per share – Investor Class | | $ | 13.80 | | | NA | | | | | | $ | 19.48 |
| | | | | | | | | | | | | |
Investments at cost | | $ | 68,470,954 | | $ | 664,145,718 | | $ | — | | | $ | 732,616,672 |
| | | | | | | | | | | | | |
Foreign currencies at cost | | $ | — | | $ | 4,513,214 | | $ | — | | | $ | 4,513,214 |
| | | | | | | | | | | | | |
Securities on loan, at market value | | $ | 2,134,561 | | $ | 23,444,573 | | $ | — | | | $ | 25,579,134 |
| | | | | | | | | | | | | |
1 | Each Fund has an unlimited number of authorized shares. |
2 | Maximum offering price is computed as 100/94.25 of net asset value. On investment of $50,000 or more, the offering price is reduced. |
3 | Institutional Class shares (“I shares”) of Overseas Fund are exchanged for I shares of International Equity Fund in an amount equal to the total value of the Overseas Fund I shares divided by the current per share value of the International Equity Fund I shares. |
4 | Investor Class shares (“Inv shares”) of Overseas Fund are exchanged for new Inv shares of International Equity Fund, to be established upon consummation of the merger, in an amount equal to the total value of the Overseas Fund Inv shares divided by current per share value of the new International Equity Fund Inv shares (presumed to equal the International Equity Fund Administrator Class share value in this proforma). |
The accompanying notes are an integral part of these proforma financial statements.
| | |
| Proforma Statement of Operations - For the Twelve Months Ended September 30, 2007 (Unaudited) | | Wells Fargo Advantage Funds |
| | | | | | | | | | | | | | | | |
| | | Overseas
Fund | | | International
Equity Fund | | | Proforma
Adjustments | | | Proforma
Combined | |
Investment Income | | | | | | | | | | | | | | | | |
Dividends(a) | | $ | 1,918,841 | | | $ | 21,408,778 | | | | | | | $ | 23,327,619 | |
Income from affiliated securities | | | 50,914 | | | | 724,667 | | | | | | | | 775,581 | |
Securities lending income, net | | | 38,707 | | | | 497,761 | | | | | | | | 536,468 | |
| | | | | | | | | | | | | | | | |
Total investment income | | | 2,008,462 | | | | 22,631,206 | | | | — | | | | 24,639,668 | |
| | | | | | | | | | | | | | | | |
| | | | |
Expenses | | | | | | | | | | | | | | | | |
Advisory fees | | | 715,961 | | | | 7,578,696 | | | | (16,321 | )1 | | | 8,278,336 | |
Administration fees | | | | | | | | | | | | | | | | |
Fund Level | | | 37,682 | | | | 407,188 | | | | | | | | 444,870 | |
Class A | | | — | | | | 161,031 | | | | | | | | 161,031 | |
Class B | | | — | | | | 36,130 | | | | | | | | 36,130 | |
Class C | | | — | | | | 5,224 | | | | | | | | 5,224 | |
Administrator Class | | | — | | | | 695,999 | | | | | | | | 695,999 | |
Institutional Class | | | 5,787 | | | | 36,876 | | | | | | | | 42,663 | |
Investor Class | | | 272,524 | | | | — | | | | | | | | 272,524 | |
Custody fees | | | 75,364 | | | | 814,376 | | | | | | | | 889,740 | |
Shareholder servicing fees | | | 170,328 | | | | 1,920,699 | | | | 7,408 | 1 | | | 2,098,435 | |
Accounting fees | | | 31,403 | | | | 152,033 | | | | (17,334 | )1 | | | 166,102 | |
Distribution fees | | | | | | | | | | | | | | | | |
Class B | | | — | | | | 96,777 | | | | | | | | 96,777 | |
Class C | | | — | | | | 13,992 | | | | | | | | 13,992 | |
Professional fees | | | 28,660 | | | | 39,764 | | | | (24,980 | )2 | | | 43,444 | |
Registration fees | | | 24,873 | | | | 121,267 | | | | (13,651 | )2 | | | 132,489 | |
Shareholder reports | | | 18,660 | | | | 341,394 | | | | (90,014 | )2 | | | 270,040 | |
Trustees’ fees | | | 8,955 | | | | 8,955 | | | | (8,065 | )2 | | | 9,845 | |
Other fees and expenses | | | 10,150 | | | | 53,884 | | | | (5,225 | )2 | | | 58,809 | |
| | | | | | | | | | | | | | | | |
Total expenses | | | 1,400,347 | | | | 12,484,285 | | | | (168,182 | ) | | | 13,716,450 | |
| | | | | | | | | | | | | | | | |
| | | | |
Less | | | | | | | | | | | | | | | | |
Waived fees and reimbursed expenses | | | (336,755 | ) | | | (2,102,162 | ) | | | 168,182 | | | | (2,270,735 | ) |
Net expenses | | | 1,063,592 | | | | 10,382,123 | | | | — | | | | 11,445,715 | |
| | | | | | | | | | | | | | | | |
Net investment income (loss) | | | 944,870 | | | | 12,249,083 | | | | — | | | | 13,193,953 | |
| | | | | | | | | | | | | | | | |
| | | | |
REALIZED AND UNREALIZED GAIN (LOSS) ON INVESTMENTS | | | | | | | | | | | | | | | | |
Net realized gain (loss) from Securities, foreign currencies and foreign currency translation | | | 8,380,783 | | | | 112,938,262 | | | | | | | | 121,319,045 | |
| | | | | | | | | | | | | | | | |
Net realized gain (loss) from Investments | | | 8,380,783 | | | | 112,938,262 | | | | — | | | | 121,319,045 | |
| | | | | | | | | | | | | | | | |
Net change in unrealized appreciation (depreciation) of Securities, foreign currencies and foreign currency translation | | | 6,746,628 | | | | 51,673,148 | | | | | | | | 58,419,776 | |
| | | | | | | | | | | | | | | | |
Net change in unrealized appreciation (depreciation) of investments | | | 6,746,628 | | | | 51,673,148 | | | | — | | | | 58,419,776 | |
| | | | | | | | | | | | | | | | |
Net realized and unrealized gain (loss) on investments | | | 15,127,411 | | | | 164,611,410 | | | | — | | | | 179,738,821 | |
| | | | | | | | | | | | | | | | |
Net increase (decrease) in net assets resulting from operations | | $ | 16,072,281 | | | $ | 176,860,493 | | | $ | — | | | $ | 192,932,774 | |
| | | | | | | | | | | | | | | | |
a Net of foreign withholding taxes of | | $ | 164,835 | | | $ | 1,929,836 | | | $ | — | | | $ | 2,094,671 | |
1 | Based on contractual agreements of the surviving fund. |
2 | Estimated cost increases (savings) as a result of merging the funds. |
The accompanying notes are an integral part of these proforma financial statements.
Balanced Fund/Asset Allocation Fund
Notes to Proforma Financial Statements (Unaudited)
1. BASIS OF COMBINATION
At its November 7, 2007, regular quarterly meeting, the Wells Fargo Funds Trust Board of Trustees (“Board”) unanimously approved a set of initiatives designed to streamline the Wells Fargo Advantage Funds® and standardize share classes across the fund family.
As part of these initiatives the Board unanimously approved the reorganization (“Reorganization”) of the Wells Fargo Advantage Balanced Fund (“Target Fund”) into the Wells Fargo Advantage Asset Allocation Fund (“Acquiring Fund”).
The Reorganization is subject to the satisfaction of certain conditions, including approval by the Target Fund shareholders. A special meeting of the shareholders of the Target Fund is expected to be held in the second quarter of 2008 for the purpose of enabling shareholders to vote on whether to approve the Reorganization.
If shareholders of the Target Fund approve the Reorganization, the Target Fund will transfer all of its assets and liabilities to the Acquiring Fund in exchange for shares of the Acquiring Fund in an amount equal to the then current value of the Target Fund shares. Upon completion of the Reorganization, the Target Fund will liquidate by distributing the Acquiring Fund shares to the Target Fund shareholders, so that Target Fund shareholders would receive shares of a corresponding class of the Acquiring Fund with a total value equal to the then current value of their Target Fund shares, cease operations and dissolve.
The Reorganization is structured as a tax-free transaction and it is anticipated that no gain or loss for federal income tax purposes would be recognized by shareholders as a result of the Reorganization. Shareholders should consult with their own tax advisors regarding the application of tax laws and this transaction to their particular situations. Additionally, Fund shareholders will not incur any sales loads or similar transaction charges or bear any of the costs associated with the Reorganization.
Prior to the Reorganization, Target Fund shareholders may continue to purchase, redeem and exchange their shares subject to the limitations described in each Target Fund’s prospectus. The proposed Reorganization, if approved by shareholders, is expected to occur during the third quarter of 2008.
The unaudited proforma portfolio of investments and statement of assets and liabilities reflect the financial position of the Target Fund and the Acquiring Fund on September 30, 2007. The unaudited proforma statement of operations reflects the results of operations of the Target Fund and the Acquiring Fund for the twelve months ended September 30, 2007. These statements have been derived from the Target Fund’s and the Acquiring Fund’s respective books and records utilized in calculating daily net asset value at the dates indicated above under accounting principles generally accepted in the United States.
The historical cost of investment securities will be carried forward to the surviving entity and results of operations of the Acquiring Fund for pre-reorganization periods will not be restated. The fiscal year end is September 30 for both the Target Fund and the Acquiring Fund. Following the proposed Reorganization, the Acquiring Fund will be the accounting survivor.
2. PORTFOLIO VALUATION
Investments in securities are valued each business day as of the close of regular trading on the New York Stock Exchange, which is usually 4:00 p.m. (Eastern Time). Securities which are traded on a national or foreign securities exchange are valued at the last reported sales price. Securities listed on The NASDAQ Stock Market, Inc. (“NASDAQ”) are valued at the NASDAQ Official Closing Price (“NOCP”), and if no NOCP is available, then at the last reported sales price. If no sales price is shown on NASDAQ, the bid price will be used. In the absence of any sale of securities listed on the NASDAQ, and in the case of other securities, including U.S. Government obligations, but excluding debt securities maturing in 60 days or less, the price will be deemed “stale” and the valuations will be determined in accordance with the Funds’ Fair Valuation Procedures.
Securities denominated in foreign currencies are translated into U.S. dollars using the closing rates of exchange in effect on the day of valuation.
Many securities markets and exchanges outside the U.S. close prior to the close of the New York Stock Exchange and therefore may not fully reflect trading or events that occur after the close of the principal exchange in which the foreign investments are traded but before the close of the New York Stock Exchange. If such trading or events are expected to materially affect the value of the investments, then those investments are fair valued following procedures approved by the Board. These procedures take into account multiple factors including movements in U.S. securities markets after foreign exchanges close. Depending on market activity, such fair valuations may be frequent. In light of the judgment involved in fair value decisions, there can be no assurance that a fair value assigned to a particular security is accurate. Such fair value pricing may result in NAVs that are higher or lower than NAVs based on the closing price or latest quoted bid price.
Debt securities maturing in 60 days or less generally are valued at amortized cost. The amortized cost method involves valuing a security at its cost, plus accretion of discount or minus amortization of premium over the period until maturity, which approximates market value.
Investments which are not valued using any of the methods discussed above are valued at their fair value as determined by the Funds’ Fair Valuation Procedures approved by the Board.
3. CAPITAL SHARES
The proforma net asset value per share assumes the issuance of shares of the Acquiring Fund that would have been issued at September 30, 2007, in connection with the proposed reorganization. The number of shares assumed to be issued is equal to the net asset value of the shares of the Target Fund as of September 30, 2007, divided by the net asset value per share of the shares of the Acquiring Fund as of September 30, 2007. The proforma number of shares outstanding by class for the combined fund consists of the following at September 30, 2007:
| | | | | | |
Class of Shares | | Shares of Acquiring
Fund Pre-
Reorganization | | Additional Shares
Assumed Issued in
Reorganization | | Total Shares
Outstanding Post-
Reorganization |
Class A | | 39,572,395 | | 5,562,226 | | 45,134,621 |
Class B | | 6,054,751 | | 0 | | 6,054,751 |
Class C | | 2,560,679 | | 0 | | 2,560,679 |
Administrator | | 2,143,423 | | 0 | | 2,143,423 |
5. FEDERAL INCOME TAXES
Each fund has qualified as a “regulated investment company”, as defined under Subchapter M of the Internal Revenue Code (the “Code”). After the Reorganization, the Acquiring Fund intends to continue to qualify as a regulated investment company by complying with the provisions applicable to regulated investment companies in the Code, and to make distributions of substantially all of its investment company taxable income and any net realized capital gains (after reduction for capital loss carryforwards) sufficient to relieve it from all, or substantially all, federal income taxes.
Corporate Bond Fund/Income Plus Fund
Notes to Proforma Financial Statements (Unaudited)
1. BASIS OF COMBINATION
At its November 7, 2007, regular quarterly meeting, the Wells Fargo Funds Trust Board of Trustees (“Board”) unanimously approved a set of initiatives designed to streamline the Wells Fargo Advantage Funds® and standardize share classes across the fund family.
As part of these initiatives the Board unanimously approved the reorganization (“Reorganization”)of the Wells Fargo Advantage Corporate Bond Fund (“Target Fund”) into the Wells Fargo Advantage Income Plus Fund (“Acquiring Fund”).
The Reorganization is subject to the satisfaction of certain conditions, including approval by the Target Fund shareholders. A special meeting of the shareholders of the Target Fund is expected to be held in the second quarter of 2008 for the purpose of enabling shareholders to vote on whether to approve the Reorganization.
If shareholders of the Target Fund approve the Reorganization, the Target Fund will transfer all of its assets and liabilities to the Acquiring Fund in exchange for shares of the Acquiring Fund in an amount equal to the then current value of the Target Fund shares. Upon completion of the Reorganization, the Target Fund will liquidate by distributing the Acquiring Fund shares to the Target Fund shareholders, so that Target Fund shareholders would receive shares of a corresponding class of the Acquiring Fund with a total value equal to the then current value of their Target Fund shares, cease operations and dissolve.
The Reorganization is structured as a tax-free transaction and it is anticipated that no gain or loss for federal income tax purposes would be recognized by shareholders as a result of the Reorganization. Shareholders should consult with their own tax advisors regarding the application of tax laws and this transaction to their particular situations. Additionally, Fund shareholders will not incur any sales loads or similar transaction charges or bear any of the costs associated with the Reorganization.
Prior to the Reorganization, Target Fund shareholders may continue to purchase, redeem and exchange their shares subject to the limitations described in each Target Fund’s prospectus. The proposed Reorganization, if approved by shareholders, is expected to occur during the third quarter of 2008.
The unaudited proforma portfolio of investments and statement of assets and liabilities reflect the financial position of the Target Fund and the Acquiring Fund on November 30, 2007. The unaudited proforma statement of operations reflects the results of operations of the Target Fund and the Acquiring Fund for the twelve months ended November 30, 2007. These statements have been derived from the Target Fund’s and the Acquiring Fund’s respective books and records utilized in calculating daily net asset value at the dates indicated above under accounting principles generally accepted in the United States.
The historical cost of investment securities will be carried forward to the surviving entity and results of operations of the Acquiring Fund for pre-reorganization periods will not be restated. The fiscal year end is May 31 for both the Target Fund and the Acquiring Fund. Following the proposed Reorganization, the Acquiring Fund will be the accounting survivor.
2. PORTFOLIO VALUATION
Investments in securities are valued each business day as of the close of regular trading on the New York Stock Exchange, which is usually 4:00 p.m. (Eastern Time). Securities which are traded on a national or foreign securities exchange are valued at the last reported sales price. Securities listed on The NASDAQ Stock Market, Inc. (“NASDAQ”) are valued at the NASDAQ Official Closing Price (“NOCP”), and if no NOCP is available, then at the last reported sales price. If no sales price is shown on NASDAQ, the bid price will be used. In the absence of any sale of securities listed on the NASDAQ, and in the case of other securities, including U.S. Government obligations, but excluding debt securities maturing in 60 days or less, the price will be deemed “stale” and the valuations will be determined in accordance with the Funds’ Fair Valuation Procedures.
Securities denominated in foreign currencies are translated into U.S. dollars using the closing rates of exchange in effect on the day of valuation.
Many securities markets and exchanges outside the U.S. close prior to the close of the New York Stock Exchange and therefore may not fully reflect trading or events that occur after the close of the principal exchange in which the foreign investments are traded but before the close of the New York Stock Exchange. If such trading or events are expected to materially affect the value of the investments, then those investments are fair valued following procedures approved by the Board. These procedures take into account multiple factors including movements in U.S. securities markets after foreign exchanges close. Depending on market activity, such fair valuations may be frequent. In light of the judgment involved in fair value decisions, there can be no assurance that a fair value assigned to a particular security is accurate. Such fair value pricing may result in NAVs that are higher or lower than NAVs based on the closing price or latest quoted bid price.
Debt securities maturing in 60 days or less generally are valued at amortized cost. The amortized cost method involves valuing a security at its cost, plus accretion of discount or minus amortization of premium over the period until maturity, which approximates market value.
Investments which are not valued using any of the methods discussed above are valued at their fair value as determined by the Funds’ Fair Valuation Procedures approved by the Board.
3. CAPITAL SHARES
The proforma net asset value per share assumes the issuance of shares of the Acquiring Fund that would have been issued at November 30, 2007, in connection with the proposed reorganization. The number of shares assumed to be issued is equal to the net asset value of the shares of the Target Fund as of November 30, 2007, divided by the net asset value per share of the shares of the Acquiring Fund as of November 30, 2007. The proforma number of shares outstanding by class for the combined fund consists of the following at November 30, 2007:
| | | | | | |
Class of Shares | | Shares of Acquiring
Fund Pre-
Reorganization | | Additional Shares
Assumed Issued in
Reorganization | | Total Shares
Outstanding Post-
Reorganization |
Class A | | 3,624,223 | | 1,472,287 | | 5,096,510 |
Class B | | 832,299 | | 0 | | 832,299 |
Class C | | 445,401 | | 0 | | 445,401 |
Institutional | | 0 | | 2,172,730 | | 2,172,730 |
Investor | | 0 | | 18,687,168 | | 18,687,168 |
5. FEDERAL INCOME TAXES
Each fund has qualified as a “regulated investment company”, as defined under Subchapter M of the Internal Revenue Code (the “Code”). After the Reorganization, the Acquiring Fund intends to continue to qualify as a regulated investment company by complying with the provisions applicable to regulated investment companies in the Code, and to make distributions of substantially all of its investment company taxable income and any net realized capital gains (after reduction for capital loss carryforwards) sufficient to relieve it from all, or substantially all, federal income taxes.
High Yield Bond Fund/High Income Fund
Notes to Proforma Financial Statements (Unaudited)
1. BASIS OF COMBINATION
At its November 7, 2007, regular quarterly meeting, the Wells Fargo Funds Trust Board of Trustees (“Board”) unanimously approved a set of initiatives designed to streamline the Wells Fargo Advantage Funds® and standardize share classes across the fund family.
As part of these initiatives the Board unanimously approved the reorganization (“Reorganization”) of the Wells Fargo Advantage High Yield Bond Fund (“Target Fund”) into the Wells Fargo Advantage High Income Fund (“Acquiring Fund”).
The Reorganization is subject to the satisfaction of certain conditions, including approval by the Target Fund shareholders. A special meeting of the shareholders of the Target Fund is expected to be held in the second quarter of 2008 for the purpose of enabling shareholders to vote on whether to approve the Reorganization.
If shareholders of the Target Fund approve the Reorganization, the Target Fund will transfer all of its assets and liabilities to the Acquiring Fund in exchange for shares of the Acquiring Fund in an amount equal to the then current value of the Target Fund shares. Upon completion of the Reorganization, the Target Fund will liquidate by distributing the Acquiring Fund shares to the Target Fund shareholders, so that Target Fund shareholders would receive shares of a corresponding class of the Acquiring Fund with a total value equal to the then current value of their Target Fund shares, cease operations and dissolve.
The Reorganization is structured as a tax-free transaction and it is anticipated that no gain or loss for federal income tax purposes would be recognized by shareholders as a result of the Reorganization. Shareholders should consult with their own tax advisors regarding the application of tax laws and this transaction to their particular situations. Additionally, Fund shareholders will not incur any sales loads or similar transaction charges or bear any of the costs associated with the Reorganization.
Prior to the Reorganization, Target Fund shareholders may continue to purchase, redeem and exchange their shares subject to the limitations described in each Target Fund’s prospectus. The proposed Reorganization, if approved by shareholders, is expected to occur during the third quarter of 2008.
The unaudited proforma portfolio of investments and statement of assets and liabilities reflect the financial position of the Target Fund and the Acquiring Fund on November 30, 2007. The unaudited proforma statement of operations reflects the results of operations of the Target Fund and the Acquiring Fund for the twelve months ended November 30, 2007. These statements have been derived from the Target Fund’s and the Acquiring Fund’s respective books and records utilized in calculating daily net asset value at the dates indicated above under accounting principles generally accepted in the United States.
The historical cost of investment securities will be carried forward to the surviving entity and results of operations of the Acquiring Fund for pre-reorganization periods will not be restated. The fiscal year end is May 31 for both the Target Fund and the Acquiring Fund. Following the proposed Reorganization, the Acquiring Fund will be the accounting survivor.
2. PORTFOLIO VALUATION
Investments in securities are valued each business day as of the close of regular trading on the New York Stock Exchange, which is usually 4:00 p.m. (Eastern Time). Securities which are traded on a national or foreign securities exchange are valued at the last reported sales price. Securities listed on The NASDAQ Stock Market, Inc. (“NASDAQ”) are valued at the NASDAQ Official Closing Price (“NOCP”), and if no NOCP is available, then at the last reported sales price. If no sales price is shown on NASDAQ, the bid price will be used. In the absence of any sale of securities listed on the NASDAQ, and in the case of other securities, including U.S. Government obligations, but excluding debt securities maturing in 60 days or less, the price will be deemed “stale” and the valuations will be determined in accordance with the Funds’ Fair Valuation Procedures.
Securities denominated in foreign currencies are translated into U.S. dollars using the closing rates of exchange in effect on the day of valuation.
Many securities markets and exchanges outside the U.S. close prior to the close of the New York Stock Exchange and therefore may not fully reflect trading or events that occur after the close of the principal exchange in which the foreign investments are traded but before the close of the New York Stock Exchange. If such trading or events are expected to materially affect the value of the investments, then those investments are fair valued following procedures approved by the Board. These procedures take into account multiple factors including movements in U.S. securities markets after foreign exchanges close. Depending on market activity, such fair valuations may be frequent. In light of the judgment involved in fair value decisions, there can be no assurance that a fair value assigned to a particular security is accurate. Such fair value pricing may result in NAVs that are higher or lower than NAVs based on the closing price or latest quoted bid price.
Debt securities maturing in 60 days or less generally are valued at amortized cost. The amortized cost method involves valuing a security at its cost, plus accretion of discount or minus amortization of premium over the period until maturity, which approximates market value.
Investments which are not valued using any of the methods discussed above are valued at their fair value as determined by the Funds’ Fair Valuation Procedures approved by the Board.
3. CAPITAL SHARES
The proforma net asset value per share assumes the issuance of shares of the Acquiring Fund that would have been issued at November 30, 2007, in connection with the proposed reorganization. The number of shares assumed to be issued is equal to the net asset value of the shares of the Target Fund as of November 30, 2007, divided by the net asset value per share of the shares of the Acquiring Fund as of November 30, 2007. The proforma number of shares outstanding by class for the combined fund consists of the following at November 30, 2007:
| | | | | | | |
Class of Shares | | Shares of Acquiring
Fund Pre-
Reorganization | | Additional Shares
Assumed Issued in
Reorganization | | | Total Shares
Outstanding Post-
Reorganization |
Class A | | 0 | | 22,724,436 | | | 22,724,436 |
Class B | | 0 | | 1,888,123 | | | 1,888,123 |
Class C | | 0 | | 1,315,922 | | | 1,315,922 |
Advisor | | 14,384,845 | | (14,384,845 | ) | | 0 |
Institutional | | 33,851 | | 0 | | | 33,851 |
Investor | | 26,191,075 | | 0 | | | 26,191,075 |
5. FEDERAL INCOME TAXES
Each fund has qualified as a “regulated investment company”, as defined under Subchapter M of the Internal Revenue Code (the “Code”). After the Reorganization, the Acquiring Fund intends to continue to qualify as a regulated investment company by complying with the provisions applicable to regulated investment companies in the Code, and to make distributions of substantially all of its investment company taxable income and any net realized capital gains (after reduction for capital loss carryforwards) sufficient to relieve it from all, or substantially all, federal income taxes.
Intermediate Government Income Fund/Government Securities Fund
Notes to Proforma Financial Statements (Unaudited)
1. BASIS OF COMBINATION
At its November 7, 2007, regular quarterly meeting, the Wells Fargo Funds Trust Board of Trustees (“Board”) unanimously approved a set of initiatives designed to streamline the Wells Fargo Advantage Funds® and standardize share classes across the fund family.
As part of these initiatives the Board unanimously approved the reorganization (“Reorganization”) of the Wells Fargo Advantage Intermediate Government Income Fund (“Target Fund”) into the Wells Fargo Advantage Government Securities Fund (“Acquiring Fund”).
The Reorganization is subject to the satisfaction of certain conditions, including approval by the Target Fund shareholders. A special meeting of the shareholders of the Target Fund is expected to be held in the second quarter of 2008 for the purpose of enabling shareholders to vote on whether to approve the Reorganization.
If shareholders of the Target Fund approve the Reorganization, the Target Fund will transfer all of its assets and liabilities to the Acquiring Fund in exchange for shares of the Acquiring Fund in an amount equal to the then current value of the Target Fund shares. Upon completion of the Reorganization, the Target Fund will liquidate by distributing the Acquiring Fund shares to the Target Fund shareholders, so that Target Fund shareholders would receive shares of a corresponding class of the Acquiring Fund with a total value equal to the then current value of their Target Fund shares, cease operations and dissolve.
The Reorganization is structured as a tax-free transaction and it is anticipated that no gain or loss for federal income tax purposes would be recognized by shareholders as a result of the Reorganization. Shareholders should consult with their own tax advisors regarding the application of tax laws and this transaction to their particular situations. Additionally, Fund shareholders will not incur any sales loads or similar transaction charges or bear any of the costs associated with the Reorganization.
Prior to the Reorganization, Target Fund shareholders may continue to purchase, redeem and exchange their shares subject to the limitations described in each Target Fund’s prospectus. The proposed Reorganization, if approved by shareholders, is expected to occur during the third quarter of 2008.
The unaudited proforma portfolio of investments and statement of assets and liabilities reflect the financial position of the Target Fund and the Acquiring Fund on November 30, 2007. The unaudited proforma statement of operations reflects the results of operations of the Target Fund and the Acquiring Fund for the twelve months ended November 30, 2007. These statements have been derived from the Target Fund’s and the Acquiring Fund’s respective books and records utilized in calculating daily net asset value at the dates indicated above under accounting principles generally accepted in the United States.
The historical cost of investment securities will be carried forward to the surviving entity and results of operations of the Acquiring Fund for pre-reorganization periods will not be restated. The fiscal year end is May 31 for both the Target Fund and the Acquiring Fund. Following the proposed Reorganization, the Acquiring Fund will be the accounting survivor.
2. PORTFOLIO VALUATION
Investments in securities are valued each business day as of the close of regular trading on the New York Stock Exchange, which is usually 4:00 p.m. (Eastern Time). Securities which are traded on a national or foreign securities exchange are valued at the last reported sales price. Securities listed on The NASDAQ Stock Market, Inc. (“NASDAQ”) are valued at the NASDAQ Official Closing Price (“NOCP”), and if no NOCP is available, then at the last reported sales price. If no sales price is shown on NASDAQ, the bid price will be used. In the absence of any sale of securities listed on the NASDAQ, and in the case of other securities, including U.S. Government obligations, but excluding debt securities maturing in 60 days or less, the price will be deemed “stale” and the valuations will be determined in accordance with the Funds’ Fair Valuation Procedures.
Securities denominated in foreign currencies are translated into U.S. dollars using the closing rates of exchange in effect on the day of valuation.
Many securities markets and exchanges outside the U.S. close prior to the close of the New York Stock Exchange and therefore may not fully reflect trading or events that occur after the close of the principal exchange in which the foreign investments are traded but before the close of the New York Stock Exchange. If such trading or events are expected to materially affect the value of the investments, then those investments are fair valued following procedures approved by the Board. These procedures take into account multiple factors including movements in U.S. securities markets after foreign exchanges close. Depending on market activity, such fair valuations may be frequent. In light of the judgment involved in fair value decisions, there can be no assurance that a fair value assigned to a particular security is accurate. Such fair value pricing may result in NAVs that are higher or lower than NAVs based on the closing price or latest quoted bid price.
Debt securities maturing in 60 days or less generally are valued at amortized cost. The amortized cost method involves valuing a security at its cost, plus accretion of discount or minus amortization of premium over the period until maturity, which approximates market value.
Investments which are not valued using any of the methods discussed above are valued at their fair value as determined by the Funds’ Fair Valuation Procedures approved by the Board.
3. CAPITAL SHARES
The proforma net asset value per share assumes the issuance of shares of the Acquiring Fund that would have been issued at November 30, 2007, in connection with the proposed reorganization. The number of shares assumed to be issued is equal to the net asset value of the shares of the Target Fund as of November 30, 2007, divided by the net asset value per share of the shares of the Acquiring Fund as of November 30, 2007. The proforma number of shares outstanding by class for the combined fund consists of the following at November 30, 2007:
| | | | | | | |
Class of Shares | | Shares of Acquiring
Fund Pre-
Reorganization | | Additional Shares
Assumed Issued in
Reorganization | | | Total Shares
Outstanding Post-
Reorganization |
Class A | | 0 | | 16,488,597 | | | 16,488,597 |
Class B | | 0 | | 1,138,750 | | | 1,138,750 |
Class C | | 150,489 | | 675,080 | | | 825,569 |
Administrator | | 14,040,472 | | 21,537,037 | | | 35,577,509 |
Advisor | | 5,955,605 | | (5,955,605 | ) | | 0 |
Institutional | | 24,675,414 | | 0 | | | 24,675,414 |
Investor | | 81,768,299 | | 0 | | | 81,768,299 |
5. FEDERAL INCOME TAXES
Each fund has qualified as a “regulated investment company”, as defined under Subchapter M of the Internal Revenue Code (the “Code”). After the Reorganization, the Acquiring Fund intends to continue to qualify as a regulated investment company by complying with the provisions applicable to regulated investment companies in the Code, and to make distributions of substantially all of its investment company taxable income and any net realized capital gains (after reduction for capital loss carryforwards) sufficient to relieve it from all, or substantially all, federal income taxes.
National Limited-Term Tax-Free Fund/Short-Term Municipal Bond Fund
Notes to Proforma Financial Statements (Unaudited)
1. BASIS OF COMBINATION
At its November 7, 2007, regular quarterly meeting, the Wells Fargo Funds Trust Board of Trustees (“Board”) unanimously approved a set of initiatives designed to streamline the Wells Fargo Advantage Funds® and standardize share classes across the fund family.
As part of these initiatives the Board unanimously approved the reorganization (“Reorganization”) of the Wells Fargo Advantage National Limited-Term Tax-Free Fund (“Target Fund”) into the Wells Fargo Advantage Short-Term Municipal Bond Fund (“Acquiring Fund”).
The Reorganization is subject to the satisfaction of certain conditions, including approval by the Target Fund shareholders. A special meeting of the shareholders of the Target Fund is expected to be held in the second quarter of 2008 for the purpose of enabling shareholders to vote on whether to approve the Reorganization. In connection with the Reorganizations, Class B shares of the National Limited-Term Tax-Free Fund were closed to new investors and additional investments from existing shareholders, effective at the close of business December 20, 2007.
If shareholders of the Target Fund approve the Reorganization, the Target Fund will transfer all of its assets and liabilities to the Acquiring Fund in exchange for shares of the Acquiring Fund in an amount equal to the then current value of the Target Fund shares. Upon completion of the Reorganization, the Target Fund will liquidate by distributing the Acquiring Fund shares to the Target Fund shareholders, so that Target Fund shareholders would receive shares of a corresponding class of the Acquiring Fund with a total value equal to the then current value of their Target Fund shares, cease operations and dissolve.
The Reorganization is structured as a tax-free transaction and it is anticipated that no gain or loss for federal income tax purposes would be recognized by shareholders as a result of the Reorganization. Shareholders should consult with their own tax advisors regarding the application of tax laws and this transaction to their particular situations. Additionally, Fund shareholders will not incur any sales loads or similar transaction charges or bear any of the costs associated with the Reorganization.
Prior to the Reorganization, Target Fund shareholders may continue to purchase, redeem and exchange their shares subject to the limitations described in each Target Fund’s prospectus (except for the Class B shares of the National Limited-Term Tax-Free Fund). The proposed Reorganization, if approved by shareholders, is expected to occur during the third quarter of 2008.
The unaudited proforma portfolio of investments and statement of assets and liabilities reflect the financial position of the Target Fund and the Acquiring Fund on December 31, 2007. The unaudited proforma statement of operations reflects the results of operations of the Target Fund and the Acquiring Fund for the twelve months ended December 31, 2007. These statements have
been derived from the Target Fund’s and the Acquiring Fund’s respective books and records utilized in calculating daily net asset value at the dates indicated above under accounting principles generally accepted in the United States.
The historical cost of investment securities will be carried forward to the surviving entity and results of operations of the Acquiring Fund for pre-reorganization periods will not be restated. The fiscal year end is June 30 for both the Target Fund and the Acquiring Fund. Following the proposed Reorganization, the Acquiring Fund will be the accounting survivor.
2. PORTFOLIO VALUATION
Investments in securities are valued each business day as of the close of regular trading on the New York Stock Exchange, which is usually 4:00 p.m. (Eastern Time). Securities which are traded on a national or foreign securities exchange are valued at the last reported sales price. Securities listed on The NASDAQ Stock Market, Inc. (“NASDAQ”) are valued at the NASDAQ Official Closing Price (“NOCP”), and if no NOCP is available, then at the last reported sales price. If no sales price is shown on NASDAQ, the bid price will be used. In the absence of any sale of securities listed on the NASDAQ, and in the case of other securities, including U.S. Government obligations, but excluding debt securities maturing in 60 days or less, the price will be deemed “stale” and the valuations will be determined in accordance with the Funds’ Fair Valuation Procedures.
Securities denominated in foreign currencies are translated into U.S. dollars using the closing rates of exchange in effect on the day of valuation.
Many securities markets and exchanges outside the U.S. close prior to the close of the New York Stock Exchange and therefore may not fully reflect trading or events that occur after the close of the principal exchange in which the foreign investments are traded but before the close of the New York Stock Exchange. If such trading or events are expected to materially affect the value of the investments, then those investments are fair valued following procedures approved by the Board. These procedures take into account multiple factors including movements in U.S. securities markets after foreign exchanges close. Depending on market activity, such fair valuations may be frequent. In light of the judgment involved in fair value decisions, there can be no assurance that a fair value assigned to a particular security is accurate. Such fair value pricing may result in NAVs that are higher or lower than NAVs based on the closing price or latest quoted bid price.
Debt securities maturing in 60 days or less generally are valued at amortized cost. The amortized cost method involves valuing a security at its cost, plus accretion of discount or minus amortization of premium over the period until maturity, which approximates market value.
Investments which are not valued using any of the methods discussed above are valued at their fair value as determined by the Funds’ Fair Valuation Procedures approved by the Board.
3. CAPITAL SHARES
The proforma net asset value per share assumes the issuance of shares of the Acquiring Fund that would have been issued at December 31, 2007, in connection with the proposed reorganization. The number of shares assumed to be issued is equal to the net asset value of the shares of the Target Fund as of December 31, 2007, divided by the net asset value per share of the shares of the Acquiring Fund as of December 31, 2007. The proforma number of shares outstanding by class for the combined fund consists of the following at December 31, 2007:
| | | | | | |
Class of Shares | | Shares of Acquiring
Fund Pre-
Reorganization | | Additional Shares
Assumed Issued in
Reorganization | | Total Shares
Outstanding Post-
Reorganization |
Class A | | 0 | | 8,437,207 | | 8,437,207 |
Class C | | 367,148 | | 61,823 | | 428,971 |
Investor | | 69,329,850 | | 0 | | 69,329,850 |
5. FEDERAL INCOME TAXES
Each fund has qualified as a “regulated investment company”, as defined under Subchapter M of the Internal Revenue Code (the “Code”). After the Reorganization, the Acquiring Fund intends to continue to qualify as a regulated investment company by complying with the provisions applicable to regulated investment companies in the Code, and to make distributions of substantially all of its investment company taxable income and any net realized capital gains (after reduction for capital loss carryforwards) sufficient to relieve it from all, or substantially all, federal income taxes.
National Tax-Free Fund/Municipal Bond Fund
Notes to Proforma Financial Statements (Unaudited)
1. BASIS OF COMBINATION
At its November 7, 2007, regular quarterly meeting, the Wells Fargo Funds Trust Board of Trustees (“Board”) unanimously approved a set of initiatives designed to streamline the Wells Fargo Advantage Funds® and standardize share classes across the fund family.
As part of these initiatives the Board unanimously approved the reorganization (“Reorganization”) of the Wells Fargo Advantage National Tax-Free Fund (“Target Fund”) into the Wells Fargo Advantage Municipal Bond Fund (“Acquiring Fund”).
The Reorganization is subject to the satisfaction of certain conditions, including approval by the Target Fund shareholders. A special meeting of the shareholders of the Target Fund is expected to be held in the second quarter of 2008 for the purpose of enabling shareholders to vote on whether to approve the Reorganization.
If shareholders of the Target Fund approve the Reorganization, the Target Fund will transfer all of its assets and liabilities to the Acquiring Fund in exchange for shares of the Acquiring Fund in an amount equal to the then current value of the Target Fund shares. Upon completion of the Reorganization, the Target Fund will liquidate by distributing the Acquiring Fund shares to the Target Fund shareholders, so that Target Fund shareholders would receive shares of a corresponding class of the Acquiring Fund with a total value equal to the then current value of their Target Fund shares, cease operations and dissolve.
The Reorganization is structured as a tax-free transaction and it is anticipated that no gain or loss for federal income tax purposes would be recognized by shareholders as a result of the Reorganization. Shareholders should consult with their own tax advisors regarding the application of tax laws and this transaction to their particular situations. Additionally, Fund shareholders will not incur any sales loads or similar transaction charges or bear any of the costs associated with the Reorganization.
Prior to the Reorganization, Target Fund shareholders may continue to purchase, redeem and exchange their shares subject to the limitations described in each Target Fund’s prospectus. The proposed Reorganization, if approved by shareholders, is expected to occur during the third quarter of 2008.
The unaudited proforma portfolio of investments and statement of assets and liabilities reflect the financial position of the Target Fund and the Acquiring Fund on December 31, 2007. The unaudited proforma statement of operations reflects the results of operations of the Target Fund and the Acquiring Fund for the twelve months ended December 31, 2007. These statements have been derived from the Target Fund’s and the Acquiring Fund’s respective books and records utilized in calculating daily net asset value at the dates indicated above under accounting principles generally accepted in the United States.
The historical cost of investment securities will be carried forward to the surviving entity and results of operations of the Acquiring Fund for pre-reorganization periods will not be restated. The fiscal year end is June 30 for both the Target Fund and the Acquiring Fund. Following the proposed Reorganization, the Acquiring Fund will be the accounting survivor.
2. PORTFOLIO VALUATION
Investments in securities are valued each business day as of the close of regular trading on the New York Stock Exchange, which is usually 4:00 p.m. (Eastern Time). Securities which are traded on a national or foreign securities exchange are valued at the last reported sales price. Securities listed on The NASDAQ Stock Market, Inc. (“NASDAQ”) are valued at the NASDAQ Official Closing Price (“NOCP”), and if no NOCP is available, then at the last reported sales price. If no sales price is shown on NASDAQ, the bid price will be used. In the absence of any sale of securities listed on the NASDAQ, and in the case of other securities, including U.S. Government obligations, but excluding debt securities maturing in 60 days or less, the price will be deemed “stale” and the valuations will be determined in accordance with the Funds’ Fair Valuation Procedures.
Securities denominated in foreign currencies are translated into U.S. dollars using the closing rates of exchange in effect on the day of valuation.
Many securities markets and exchanges outside the U.S. close prior to the close of the New York Stock Exchange and therefore may not fully reflect trading or events that occur after the close of the principal exchange in which the foreign investments are traded but before the close of the New York Stock Exchange. If such trading or events are expected to materially affect the value of the investments, then those investments are fair valued following procedures approved by the Board. These procedures take into account multiple factors including movements in U.S. securities markets after foreign exchanges close. Depending on market activity, such fair valuations may be frequent. In light of the judgment involved in fair value decisions, there can be no assurance that a fair value assigned to a particular security is accurate. Such fair value pricing may result in NAVs that are higher or lower than NAVs based on the closing price or latest quoted bid price.
Debt securities maturing in 60 days or less generally are valued at amortized cost. The amortized cost method involves valuing a security at its cost, plus accretion of discount or minus amortization of premium over the period until maturity, which approximates market value.
Investments which are not valued using any of the methods discussed above are valued at their fair value as determined by the Funds’ Fair Valuation Procedures approved by the Board.
3. CAPITAL SHARES
The proforma net asset value per share assumes the issuance of shares of the Acquiring Fund that would have been issued at December 31, 2007, in connection with the proposed reorganization. The number of shares assumed to be issued is equal to the net asset value of the shares of the Target Fund as of December 31, 2007, divided by the net asset value per share of the shares of the Acquiring Fund as of December 31, 2007. The proforma number of shares outstanding by class for the combined fund consists of the following at December 31, 2007:
| | | | | | |
Class of Shares | | Shares of Acquiring
Fund Pre-Reorganization | | Additional Shares
Assumed Issued in
Reorganization | | Total Shares
Outstanding Post-
Reorganization |
Class A | | 13,081,330 | | 9,828,064 | | 22,909,394 |
Class B | | 778,980 | | 1,134,507 | | 1,913,487 |
Class C | | 206,887 | | 721,370 | | 928,257 |
Administrator | | 1,666,348 | | 15,518,482 | | 17,184,830 |
Investor | | 26,442,983 | | 0 | | 26,442,983 |
5. FEDERAL INCOME TAXES
Each fund has qualified as a “regulated investment company”, as defined under Subchapter M of the Internal Revenue Code (the “Code”). After the Reorganization, the Acquiring Fund intends to continue to qualify as a regulated investment company by complying with the provisions applicable to regulated investment companies in the Code, and to make distributions of substantially all of its investment company taxable income and any net realized capital gains (after reduction for capital loss carryforwards) sufficient to relieve it from all, or substantially all, federal income taxes.
Overseas Fund/International Equity Fund
Notes to Proforma Financial Statements (Unaudited)
1. BASIS OF COMBINATION
At its November 7, 2007, regular quarterly meeting, the Wells Fargo Funds Trust Board of Trustees (“Board”) unanimously approved a set of initiatives designed to streamline the Wells Fargo Advantage Funds® and standardize share classes across the fund family.
As part of these initiatives the Board unanimously approved the reorganization (“Reorganization”) of the Wells Fargo Advantage Overseas Fund (“Target Fund”) into the Wells Fargo Advantage International Equity Fund (“Acquiring Fund”).
The Reorganization is subject to the satisfaction of certain conditions, including approval by the Target Fund shareholders. A special meeting of the shareholders of the Target Fund is expected to be held in the second quarter of 2008 for the purpose of enabling shareholders to vote on whether to approve the Reorganization.
If shareholders of the Target Fund approve the Reorganization, the Target Fund will transfer all of its assets and liabilities to the Acquiring Fund in exchange for shares of the Acquiring Fund in an amount equal to the then current value of the Target Fund shares. Upon completion of the Reorganization, the Target Fund will liquidate by distributing the Acquiring Fund shares to the Target Fund shareholders, so that Target Fund shareholders would receive shares of a corresponding class of the Acquiring Fund with a total value equal to the then current value of their Target Fund shares, cease operations and dissolve.
The Reorganization is structured as a tax-free transaction and it is anticipated that no gain or loss for federal income tax purposes would be recognized by shareholders as a result of the Reorganization. Shareholders should consult with their own tax advisors regarding the application of tax laws and this transaction to their particular situations. Additionally, Fund shareholders will not incur any sales loads or similar transaction charges or bear any of the costs associated with the Reorganization.
Prior to the Reorganization, Target Fund shareholders may continue to purchase, redeem and exchange their shares subject to the limitations described in each Target Fund’s prospectus. The proposed Reorganization, if approved by shareholders, is expected to occur during the third quarter of 2008.
The unaudited proforma portfolio of investments and statement of assets and liabilities reflect the financial position of the Target Fund and the Acquiring Fund on September 30, 2007. The unaudited proforma statement of operations reflects the results of operations of the Target Fund and the Acquiring Fund for the twelve months ended September 30, 2007. These statements have been derived from the Target Fund’s and the Acquiring Fund’s respective books and records utilized in calculating daily net asset value at the dates indicated above under accounting principles generally accepted in the United States.
The historical cost of investment securities will be carried forward to the surviving entity and results of operations of the Acquiring Fund for pre-reorganization periods will not be restated. The fiscal year end is September 30 for both the Target Fund and the Acquiring Fund. Following the proposed Reorganization, the Acquiring Fund will be the accounting survivor.
2. PORTFOLIO VALUATION
Investments in securities are valued each business day as of the close of regular trading on the New York Stock Exchange, which is usually 4:00 p.m. (Eastern Time). Securities which are traded on a national or foreign securities exchange are valued at the last reported sales price. Securities listed on The NASDAQ Stock Market, Inc. (“NASDAQ”) are valued at the NASDAQ Official Closing Price (“NOCP”), and if no NOCP is available, then at the last reported sales price. If no sales price is shown on NASDAQ, the bid price will be used. In the absence of any sale of securities listed on the NASDAQ, and in the case of other securities, including U.S. Government obligations, but excluding debt securities maturing in 60 days or less, the price will be deemed “stale” and the valuations will be determined in accordance with the Funds’ Fair Valuation Procedures.
Securities denominated in foreign currencies are translated into U.S. dollars using the closing rates of exchange in effect on the day of valuation.
Many securities markets and exchanges outside the U.S. close prior to the close of the New York Stock Exchange and therefore may not fully reflect trading or events that occur after the close of the principal exchange in which the foreign investments are traded but before the close of the New York Stock Exchange. If such trading or events are expected to materially affect the value of the investments, then those investments are fair valued following procedures approved by the Board. These procedures take into account multiple factors including movements in U.S. securities markets after foreign exchanges close. Depending on market activity, such fair valuations may be frequent. In light of the judgment involved in fair value decisions, there can be no assurance that a fair value assigned to a particular security is accurate. Such fair value pricing may result in NAVs that are higher or lower than NAVs based on the closing price or latest quoted bid price.
Debt securities maturing in 60 days or less generally are valued at amortized cost. The amortized cost method involves valuing a security at its cost, plus accretion of discount or minus amortization of premium over the period until maturity, which approximates market value.
Investments which are not valued using any of the methods discussed above are valued at their fair value as determined by the Funds’ Fair Valuation Procedures approved by the Board.
3. CAPITAL SHARES
The proforma net asset value per share assumes the issuance of shares of the Acquiring Fund that would have been issued at September 30, 2007, in connection with the proposed reorganization. The number of shares assumed to be issued is equal to the net asset value of the shares of the Target Fund as of September 30, 2007, divided by the net asset value per share of the shares of the Acquiring Fund as of September 30, 2007. The proforma number of shares outstanding by class for the combined fund consists of the following at September 30, 2007:
| | | | | | |
Class of Shares | | Shares of Acquiring
Fund Pre-Reorganization | | Additional Shares
Assumed Issued in
Reorganization | | Total Shares
Outstanding Post-
Reorganization |
Class A | | 3,216,672 | | 0 | | 3,216,672 |
Class B | | 517,123 | | 0 | | 517,123 |
Class C | | 106,200 | | 0 | | 106,200 |
Administrator | | 35,412,072 | | 0 | | 35,412,072 |
Institutional | | 3,577,958 | | 464,925 | | 4,042,883 |
Investor | | 0 | | 3,744,993 | | 3,744,993 |
5. FEDERAL INCOME TAXES
Each fund has qualified as a “regulated investment company”, as defined under Subchapter M of the Internal Revenue Code (the “Code”). After the Reorganization, the Acquiring Fund intends to continue to qualify as a regulated investment company by complying with the provisions applicable to regulated investment companies in the Code, and to make distributions of substantially all of its investment company taxable income and any net realized capital gains (after reduction for capital loss carryforwards) sufficient to relieve it from all, or substantially all, federal income taxes.
PART B
STATEMENT OF ADDITIONAL INFORMATION
May [ ], 2008
WELLS FARGO FUNDS TRUST
LIFE STAGE – CONSERVATIVE PORTFOLIO
LIFE STAGE – MODERATE PORTFOLIO
LIFE STAGE – AGGRESSIVE PORTFOLIO
525 MARKET STREET
SAN FRANCISCO, CA 94105
June 30, 2008 Special Meeting of the Shareholders
This Statement of Additional Information or SAI is not a prospectus but should be read in conjunction with the Combined Prospectus/Proxy Statement dated May [ ], 2008, which we refer to as the Prospectus/Proxy Statement, for the Special Meeting of Shareholders of the three Wells Fargo Advantage Funds listed above, which we call the Target Funds to be held on Monday, June 30, 2008. The Prospectus/Proxy Statement may be obtained without charge by calling 1-800-222-8222 or writing to Wells Fargo Advantage Funds, P.O. Box 8266, Boston, MA 02266-8266. Unless otherwise indicated, capitalized terms used herein and not otherwise defined have the same meanings as are given to them in the Prospectus/Proxy Statement.
INCORPORATION OF DOCUMENTS BY REFERENCE
IN STATEMENT OF ADDITIONAL INFORMATION
This SAI consists of this cover page and the following described items, which are hereby incorporated by reference:
| | 1. | The SAI dated July 1, 2007, as supplemented October 1, 2007, December 4, 2007 and February 1, 2008, for the Wells Fargo Advantage Life Stage – Conservative Portfolio, Wells Fargo Advantage Life Stage – Moderate Portfolio and Wells Fargo Advantage Life Stage – Aggressive Portfolio. Report of the Independent Auditors and audited annual report financial statements of the Wells Fargo Advantage Life Stage – Conservative Portfolio, Wells Fargo Advantage Life Stage – Moderate Portfolio and Wells Fargo Advantage Life Stage – Aggressive Portfolio, contained in the Annual Report for the fiscal year ended February 29, 2008, as filed with the SEC on May [1], 2008. Unaudited financial report statements of the Wells Fargo Advantage Life Stage – Conservative Portfolio, Wells Fargo Advantage Life Stage – Moderate Portfolio and Wells Fargo Advantage Life Stage – Aggressive Portfolio, dated as of August 31, 2007. |
| | 2. | The SAI dated February 1, 2008 for the Wells Fargo Advantage Aggressive Allocation Fund, Growth Balanced Fund and Moderate Balanced Fund. Report of the Independent Auditors and audited annual report financial statements of the Wells Fargo Advantage Aggressive Allocation Fund, Growth Balanced Fund and Moderate Balanced Fund, contained in the Annual Report for the fiscal year ended September 30, 2007, as filed with the SEC on December 5, 2007. Unaudited financial report statements of the Wells Fargo Advantage Aggressive Allocation Fund, Growth Balanced Fund and Moderate Balanced Fund, dated as of March 31, 2007. |
Table of Contents
General Information
Explanatory Note to Pro Forma Financial Statements
Pro-Forma Financial Statements and Schedules
Notes to Pro Forma Financial Statements*
| * | THE ACCOMPANYING NOTES ARE AN INTEGRAL PART OF THE PRO FORMA FINANCIAL STATEMENTS AND SCHEDULES. |
General Information
This SAI relates to the reorganization of three Wells Fargo Funds Trust funds listed below, which we refer to as the Target Funds, with three other funds of Wells Fargo Funds Trust listed below, which we refer to as the Acquiring Funds.
| | |
TARGET FUND | | ACQUIRING FUND |
Life Stage – Conservative Portfolio Investor Class | | Moderate Balanced Fund Administrator Class |
Life Stage – Moderate Portfolio Investor Class | | Growth Balanced Fund Administrator Class |
Life Stage – Aggressive Portfolio Investor Class | | Aggressive Allocation Fund Administrator Class |
The reorganization of each Target Fund will involve the following four steps:
| | • | | The liquidation of the Target Fund’s holdings; |
| | • | | the transfer of substantially all of the assets and liabilities of the Target Fund to its corresponding Acquiring Fund in exchange for designated classes of the corresponding Acquiring Fund having equivalent value to the net assets transferred; |
| | • | | the pro rata distribution of the Acquiring Fund shares to the shareholders of record of the Target Fund as of the effective date of the reorganization in full redemption of all shares of the Target Fund; and |
| | • | | the liquidation and dissolution of the Target Fund. |
As a result of the Reorganization, shareholders of each Target Fund will become a shareholder of the corresponding Acquiring Fund having the same total value of shares as the shares of the Target Fund that they held immediately before the Reorganization. If a majority of the shares of one of the Target Funds does not approve the Reorganization, that Fund will not participate in the Reorganization. In such a case, the Target Fund will continue its operations beyond the date of the Reorganization and the Board of Trustees of the affected Wells Fargo Advantage Fund will consider what further action is appropriate, including the possible liquidation of the Fund.
For further information about the transaction, see the Prospectus/Proxy Statement.
Pro Forma Financial Statements
Explanatory Note
Pro Forma financial statements for the Life Stage – Conservative Portfolio/Moderate Balanced Fund Reorganization are not included because as of [April 2008], the assets of the Life Stage – Conservative Portfolio constituted less than 10% of the assets of the Moderate Balanced Fund.
Pro Forma financial statements for the Life Stage – Moderate Portfolio/Growth Balanced Fund Reorganization are not included because as of [April 2008], the assets of the Life Stage – Moderate Portfolio constituted less than 10% of the assets of the Growth Balanced Fund.
The Life Stage – Aggressive Portfolio will be reorganized into the Aggressive Allocation Fund, an existing Fund with assets and liabilities. Pro forma combining financial statements as of September 30, 2007 are included to show the pro forma effect of combining the Life Stage – Aggressive Portfolio into the Aggressive Allocation Fund.
| | |
| Proforma Portfolio of Investments - September 30, 2007 (Unaudited) | | Wells Fargo Advantage Funds |
| | | | | | | | | | | | | | | |
| | | Life Stage-Aggressive
Portfolio | | Aggressive Allocation Fund | | Pro Forma Combined |
| | | Shares or
Principal
Amount | | Value
(Note 2) | | Shares or
Principal
Amount | | Value
(Note 2) | | Shares or
Principal
Amount | | Value
(Note 2) |
Investments in Affiliated Master Portfolios—88.56% | | | | | | | | | | | | | | | |
Wells Fargo Advantage C&B Large Cap Value Portfolio | | | | | | | | | $ | 18,007,958 | | | | $ | 18,007,958 |
Wells Fargo Advantage Disciplined Growth Portfolio | | | | | | | | | | 10,823,972 | | | | | 10,823,972 |
Wells Fargo Advantage Emerging Growth Portfolio | | | | | | | | | | 1,350,334 | | | | | 1,350,334 |
Wells Fargo Advantage Equity Income Portfolio | | | | | | | | | | 17,968,092 | | | | | 17,968,092 |
Wells Fargo Advantage Equity Value Portfolio | | | | | | | | | | 18,012,369 | | | | | 18,012,369 |
Wells Fargo Advantage Index Portfolio | | | | | | | | | | 53,919,442 | | | | | 53,919,442 |
Wells Fargo Advantage Inflation-Protected Bond Portfolio | | | | | | | | | | 5,415,232 | | | | | 5,415,232 |
Wells Fargo Advantage International Core Portfolio | | | | | | | | | | 8,234,262 | | | | | 8,234,262 |
Wells Fargo Advantage International Growth Portfolio | | | | | | | | | | 8,272,162 | | | | | 8,272,162 |
Wells Fargo Advantage International Index Portfolio | | | | | | | | | | 8,241,326 | | | | | 8,241,326 |
Wells Fargo Advantage International Value Portfolio | | | | | | | | | | 8,183,286 | | | | | 8,183,286 |
Wells Fargo Advantage Large Cap Appreciation Portfolio | | | | | | | | | | 5,431,844 | | | | | 5,431,844 |
Wells Fargo Advantage Large Company Growth Portfolio | | | | | | | | | | 37,913,423 | | | | | 37,913,423 |
Wells Fargo Advantage Managed Fixed Income Portfolio | | | | | | | | | | 37,747,113 | | | | | 37,747,113 |
Wells Fargo Advantage Small Cap Index Portfolio | | | | | | | | | | 7,147,412 | | | | | 7,147,412 |
Wells Fargo Advantage Small Company Growth Portfolio | | | | | | | | | | 5,891,726 | | | | | 5,891,726 |
Wells Fargo Advantage Small Company Value Portfolio | | | | | | | | | | 706,807 | | | | | 706,807 |
Wells Fargo Advantage Strategic Small Cap Value Portfolio | | | | | | | | | | 6,428,273 | | | | | 6,428,273 |
Wells Fargo Advantage Total Return Bond Portfolio | | | | | | | | | | 10,784,932 | | | | | 10,784,932 |
| | | | | | | | | | | | | | | |
Total Investments in Affiliated Master Portfolios (Cost $0, $231,263,713 and $231,263,713, respectively) | | | | | — | | | | | 270,479,965 | | | | | 270,479,965 |
| | | | | | | | | | | | | | | |
Investment Companies—10.42% | | | | | | | | | | | | | | | |
Affiliated Bond Funds—2.05% | | | | | | | | | | | | | | | |
Wells Fargo Advantage Government Securities Fund | | 226,733 | | $ | 2,344,416 | | | | | | | 226,733 | | | 2,344,416 |
Wells Fargo Advantage Short-Term Bond Fund | | 277,435 | | | 2,355,424 | | | | | | | 277,435 | | | 2,355,424 |
Wells Fargo Advantage Ultra Short-Term Income Fund | | 174,649 | | | 1,570,095 | | | | | | | 174,649 | | | 1,570,095 |
Total Affiliated Bond Funds | | | | | 6,269,935 | | | | | | | | | | 6,269,935 |
Affiliated Stock Funds 8.37% | | | | | | | | | | | | | | | |
Wells Fargo Advantage Capital Growth Fund | | 315,737 | | | 6,469,457 | | | | | | | 315,737 | | | 6,469,457 |
Wells Fargo Advantage Common Stock Fund | | 278,917 | | | 6,356,517 | | | | | | | 278,917 | | | 6,356,517 |
Wells Fargo Advantage Growth and Income Fund | | 121,702 | | | 3,154,518 | | | | | | | 121,702 | | | 3,154,518 |
Wells Fargo Advantage Overseas Fund | | 234,898 | | | 3,260,387 | | | | | | | 234,898 | | | 3,260,387 |
Wells Fargo U.S. Value Fund | | 330,178 | | | 6,336,111 | | | | | | | 330,178 | | | 6,336,111 |
Total Affiliated Stock Funds | | | | | 25,576,990 | | | | | | | | | | 25,576,990 |
| | | | | | | | | | | | | | | |
Total Investment Companies (Cost $29,059,059, $0 and $28,270,748, respectively) | | | | | 31,846,925 | | | | | — | | | | | 31,846,925 |
| | | | | | | | | | | | | | | |
Short-Term Investments—0.71% | | | | | | | | | | | | | | | |
Mutual Funds—0.01% | | | | | | | | | | | | | | | |
Wells Fargo Money Market Trust | | 39,308 | | | 39,308 | | | | | | | 39,308 | | | 39,308 |
Total Mutual Funds | | | | | 39,308 | | | | | | | | | | 39,308 |
US Treasury Bills—0.70% | | | | | | | | | | | | | | | |
US Treasury Bill , 3.993%, Due 01/07/2008^# | | | | | | | 1,965,000 | | | 1,937,877 | | 1,965,000 | | | 1,937,877 |
US Treasury Bill , 4.168%, Due 01/07/2008^# | | | | | | | 195,000 | | | 192,308 | | 195,000 | | | 192,308 |
Total US Treasury Bills | | | | | | | | | | 2,130,185 | | | | | 2,130,185 |
| | | | | | | | | | | | | | | |
Total Short-Term Investments (Cost $39,308, $2,129,537 and $2,168,845, respectively) | | | | | 39,308 | | | | | 2,130,185 | | | | | 2,169,493 |
| | | | | | | | | | | | | | | |
Total Investments in Securities (Cost $29,098,367, $233,393,250 and $261,703,306, respectively) 99.69% | | | | | 31,886,233 | | | | | 272,610,150 | | | | | 304,496,383 |
Other Assets and Liabilities, Net —0.31% | | | | | 272,804 | | | | | 663,037 | | | | | 935,841 |
| | | | | | | | | | | | | | | |
Net Assets—100.0% | | | | $ | 32,159,037 | | | | $ | 273,273,187 | | | | $ | 305,432,224 |
| | | | | | | | | | | | | | | |
| ^ | Zero coupon bond. Interest rate presented is yield to maturity. |
| # | Security pledged as collateral for futures transactions. (See Note 2) |
| ~ | This Wells Fargo Advantage Fund invests cash balances that it retains for liquidity purposes in a Wells Fargo Advantage Money Market Fund. The fund does not pay an investment advisory fee for such investments. |
The accompanying notes are an integral part of these proforma financial statements.
| | |
| Proforma Statement of Assets and Liabilities - September 30, 2007 (Unaudited) | | Wells Fargo Advantage Funds |
| | | | | | | | | | | | | | |
| | | Life Stage
Aggressive
Portfolio | | | Aggressive
Allocation
Fund | | Proforma
Adjustments | | | Proforma
Combined |
Assets | | | | | | | | | | | | | | |
Investments | | | | | | | | | | | | | | |
In securities, at market value | | $ | 31,886,233 | | | $ | 2,130,185 | | | | | | $ | 34,016,418 |
Investments in affiliated Master Portfolios | | | — | | | | 270,479,965 | | | | | | | 270,479,965 |
| | | | | | | | | | | | | | |
Total investments at market value (see cost below) | | | 31,886,233 | | | | 272,610,150 | | | — | | | | 304,496,383 |
| | | | | | | | | | | | | | |
Cash | | | 250,000 | | | | 896,160 | | | | | | | 1,146,160 |
Receivable for Fund shares issued | | | 1,400 | | | | 204,425 | | | | | | | 205,825 |
Receivables for dividends and interest | | | 27,919 | | | | — | | | | | | | 27,919 |
Prepaid expenses and other assets | | | 1,380 | | | | — | | | | | | | 1,380 |
| | | | | | | | | | | | | | |
Total assets | | | 32,166,932 | | | | 273,710,735 | | | — | | | | 305,877,667 |
| | | | | | | | | | | | | | |
Liabilities | | | | | | | | | | | | | | |
Payable for daily variation margin on futures contracts | | | — | | | | 169,000 | | | | | | | 169,000 |
Payable for Fund shares redeemed | | | 2,609 | | | | 148,537 | | | | | | | 151,146 |
Payable to investment advisor and affiliates | | | 5,286 | | | | 44,061 | | | | | | | 49,347 |
Accrued expenses and other liabilities | | | — | | | | 75,950 | | | | | | | 75,950 |
| | | | | | | | | | | | | | |
Total liabilities | | | 7,895 | | | | 437,548 | | | — | | | | 445,443 |
| | | | | | | | | | | | | | |
Total net assets | | $ | 32,159,037 | | | $ | 273,273,187 | | $ | — | | | $ | 305,432,224 |
| | | | | | | | | | | | | | |
NET ASSETS CONSIST OF | | | | | | | | | | | | | | |
Paid-in capital | | $ | 30,181,283 | | | $ | 210,218,000 | | | | | | $ | 240,399,283 |
Undistributed net investment income (loss) | | | 233,759 | | | | 3,402,524 | | | | | | | 3,636,283 |
Undistributed net realized gain (loss) on investments | | | (1,043,871 | ) | | | 19,151,403 | | | | | | | 18,107,532 |
Net unrealized appreciation (depreciation) of investments, foreign currencies and translation of assets and liabilities denominated in foreign currencies | | | 2,787,866 | | | | 39,216,900 | | | | | | | 42,004,766 |
Net unrealized appreciation (depreciation) of futures | | | — | | | | 1,284,360 | | | | | | | 1,284,360 |
| | | | | | | | | | | | | | |
Total net assets | | $ | 32,159,037 | | | $ | 273,273,187 | | $ | — | | | $ | 305,432,224 |
| | | | | | | | | | | | | | |
COMPUTATION OF NET ASSET VALUE AND OFFERING PRICE PER SHARE1 | | | | | | | | | | | | | | |
Net assets – Administrator Class | | | NA | | | $ | 273,273,187 | | $ | 32,159,034 | 2 | | $ | 305,432,221 |
Shares outstanding – Administrator Class | | | NA | | | | 16,147,881 | | | 1,903,669 | | | | 18,051,550 |
Net asset value and offering price per share – Administrator Class | | | NA | | | $ | 16.92 | | | | | | $ | 16.92 |
Net assets – Investor Class | | $ | 32,159,034 | | | | NA | | $ | (32,159,034 | )2 | | $ | — |
Shares outstanding – Investor Class | | | 2,497,965 | | | | NA | | | (2,497,965 | ) | | | — |
Net asset value and offering price per share – Investor Class | | $ | 12.87 | | | | NA | | | | | | $ | — |
| | | | | | | | | | | | | | |
Investments at cost | | $ | 29,098,367 | | | $ | 233,393,250 | | $ | — | | | $ | 262,491,617 |
| | | | | | | | | | | | | | |
1 | Each Fund has an unlimited number of authorized shares. |
2 | Investor Class shares of Life Stage Aggressive Portfolio are exchanged for Administrator Class shares of Aggressive Allocation Fund in an amount equal to the total value of the Investor Class shares divided by the current per share value of the Administrator Class shares. |
The accompanying notes are an integral part of these proforma financial statements.
| | |
| Proforma Statement of Operations - For the Twelve Months Ended September 30, 2007 (Unaudited) | | Wells Fargo Advantage Funds |
| | | | | | | | | | | | | | | | |
| | | Life Stage
Aggressive
Portfolio | | | Aggressive
Allocation
Fund | | | Proforma
Adjustments | | | Proforma
Combined | |
Investment Income | | | | | | | | | | | | | | | | |
Dividends(a) | | $ | 772,631 | | | $ | — | | | | | | | $ | 772,631 | |
Dividends allocated from affiliated Master Portfolios(a) | | | — | | | | 3,711,800 | | | | | | | | 3,711,800 | |
Interest | | | — | | | | 79,447 | | | | | | | | 79,447 | |
Interest Income allocated from affiliated Master Portfolios | | | — | | | | 2,660,497 | | | | | | | | 2,660,497 | |
Income from affiliated securities | | | 14,095 | | | | — | | | | | | | | 14,095 | |
Expenses allocated from affiliated Master Portfolios | | | — | | | | (1,438,906 | ) | | | | | | | (1,438,906 | ) |
Waivers allocated from affiliated Master Portfolios | | | — | | | | 144,205 | | | | | | | | 144,205 | |
| | | | | | | | | | | | | | | | |
Total investment income | | | 786,726 | | | | 5,157,043 | | | | — | | | | 5,943,769 | |
| | | | | | | | | | | | | | | | |
Expenses | | | | | | | | | | | | | | | | |
Advisory fees | | | — | | | | 630,885 | | | | 78,844 | 1 | | | 709,729 | |
Administration fees | | | | | | | | | | | | | | | | |
Fund Level | | | 149,965 | | | | 126,177 | | | | (134,196 | )1 | | | 141,946 | |
Administrator Class | | | — | | | | 252,354 | | | | 31,538 | 1 | | | 283,892 | |
Shareholder servicing fees | | | 36,956 | | | | 630,885 | | | | | | | | 667,841 | |
Accounting fees | | | 21,890 | | | | 31,804 | | | | (18,002 | )1 | | | 35,692 | |
Professional fees | | | 13,773 | | | | 13,418 | | | | (12,133 | )2 | | | 15,058 | |
Registration fees | | | 15,186 | | | | 17,741 | | | | (13,017 | )2 | | | 19,910 | |
Shareholder reports | | | 24,913 | | | | 28,269 | | | | (13,296 | )2 | | | 39,886 | |
Trustees’ fees | | | 8,694 | | | | 8,955 | | | | (7,599 | ) 2 | | | 10,050 | |
Other fees and expenses | | | 2,645 | | | | 3,515 | | | | (2,215 | ) 2 | | | 3,945 | |
| | | | | | | | | | | | | | | | |
Total expenses | | | 274,022 | | | | 1,744,003 | | | | (90,076 | ) | | | 1,927,949 | |
| | | | | | | | | | | | | | | | |
Less | | | | | | | | | | | | | | | | |
Waived fees and reimbursed expenses | | | (90,701 | ) | | | (513,807 | ) | | | 67,629 | | | | (536,879 | ) |
Net expenses | | | 183,321 | | | | 1,230,196 | | | | (22,447 | ) | | | 1,391,070 | |
| | | | | | | | | | | | | | | | |
Net investment income (loss) | | | 603,405 | | | | 3,926,847 | | | | 22,447 | | | | 4,552,699 | |
| | | | | | | | | | | | | | | | |
REALIZED AND UNREALIZED GAIN (LOSS) ON INVESTMENTS | | | | | | | | | | | | | | | | |
Net realized gain (loss) from | | | | | | | | | | | | | | | | |
Securities, foreign currencies and foreign currency translation | | | 2,757,878 | | | | 3,071 | | | | | | | | 2,760,949 | |
Futures transactions | | | — | | | | 5,416,653 | | | | | | | | 5,416,653 | |
Securities transactions allocated from Master Portfolios | | | — | | | | 15,948,042 | | | | | | | | 15,948,042 | |
Forward foreign currency contracts allocated from Master Portfolios | | | — | | | | 4,641 | | | | | | | | 4,641 | |
Futures transactions allocated from Master Portfolios | | | — | | | | 74,534 | | | | | | | | 74,534 | |
Options, swap agreement and short sale transactions allocated from Master Portfolios | | | — | | | | 416 | | | | | | | | 416 | |
| | | | | | | | | | | | | | | | |
Net realized gain (loss) from Investments | | | 2,757,878 | | | | 21,447,357 | | | | — | | | | 24,205,235 | |
| | | | | | | | | | | | | | | | |
Net change in unrealized appreciation (depreciation) of | | | | | | | | | | | | | | | | |
Securities, foreign currencies and foreign currency translation | | | 1,553,157 | | | | 649 | | | | | | | | 1,553,806 | |
Futures transactions | | | — | | | | 1,374,194 | | | | | | | | 1,374,194 | |
Securities transactions allocated from Master Portfolios | | | — | | | | 13,924,169 | | | | | | | | 13,924,169 | |
Forwards, futures, options, swaps and short sales allocated from Master Portfolios | | | — | | | | (7,844 | ) | | | | | | | (7,844 | ) |
| | | | | | | | | | | | | | | | |
Net change in unrealized appreciation (depreciation) of investments | | | 1,553,157 | | | | 15,291,168 | | | | — | | | | 16,844,325 | |
| | | | | | | | | | | | | | | | |
Net realized and unrealized gain (loss) on investments | | | 4,311,035 | | | | 36,738,525 | | | | — | | | | 41,049,560 | |
| | | | | | | | | | | | | | | | |
Net increase (decrease) in net assets resulting from operations | | $ | 4,914,440 | | | $ | 40,665,372 | | | $ | 22,447 | | | $ | 45,602,259 | |
| | | | | | | | | | | | | | | | |
a Net of foreign withholding taxes of | | $ | — | | | $ | 83,221 | | | $ | — | | | $ | 83,221 | |
1 | Based on contractual agreements of the surviving fund. |
2 | Estimated cost increases (savings) as a result of merging the funds. |
The accompanying notes are an integral part of these proforma financial statements.
Life Stage—Aggressive Portfolio/Aggressive Allocation Fund
Notes to Proforma Financial Statements (Unaudited)
1. BASIS OF COMBINATION
At its November 7, 2007, regular quarterly meeting, the Wells Fargo Funds Trust Board of Trustees (“Board”) unanimously approved a set of initiatives designed to streamline the Wells Fargo Advantage Funds® and standardize share classes across the fund family.
As part of these initiatives the Board unanimously approved the reorganization (“Reorganization”) of the Wells Fargo Advantage Life Stage—Aggressive Portfolio (“Target Fund”) into the Wells Fargo Advantage Aggressive Allocation Fund (“Acquiring Fund”).
The Reorganization is subject to the satisfaction of certain conditions, including approval by the Target Fund shareholders. A special meeting of the shareholders of the Target Fund is expected to be held in the second quarter of 2008 for the purpose of enabling shareholders to vote on whether to approve the Reorganization. In connection with the Reorganizations, the Life Stage—Aggressive Portfolio was closed to new investors effective at the close of business December 20, 2007.
If shareholders of the Target Fund approve the Reorganization, the Target Fund will transfer all of its assets and liabilities to the Acquiring Fund in exchange for shares of the Acquiring Fund in an amount equal to the then current value of the Target Fund shares. Upon completion of the Reorganization, the Target Fund will liquidate by distributing the Acquiring Fund shares to the Target Fund shareholders, so that Target Fund shareholders would receive shares of a corresponding class of the Acquiring Fund with a total value equal to the then current value of their Target Fund shares, cease operations and dissolve.
The Reorganization is structured as a taxable transaction. Detailed information regarding the taxable nature of this transaction will be included in upcoming proxy materials. Shareholders should consult with their own tax advisors regarding the application of tax laws and this transaction to their particular situations. Additionally, Fund shareholders will not incur any sales loads or similar transaction charges or bear any of the costs associated with the Reorganization.
Prior to the Reorganization, Target Fund shareholders may continue to purchase, redeem and exchange their shares subject to the limitations described in each Target Fund’s prospectus. The proposed Reorganization, if approved by shareholders, is expected to occur during the third quarter of 2008.
The unaudited proforma portfolio of investments and statement of assets and liabilities reflect the financial position of the Target Fund and the Acquiring Fund on September 30, 2007. The unaudited proforma statement of operations reflects the results of operations of the Target Fund and the Acquiring Fund for the twelve months ended September 30, 2007. These statements have been derived from the Target Fund’s and the Acquiring Fund’s respective books and records utilized in calculating daily net asset value at the dates indicated above under accounting principles generally accepted in the United States.
The historical cost of investment securities will be carried forward to the surviving entity and results of operations of the Acquiring Fund for pre-reorganization periods will not be restated. The fiscal year ends are February 29 for the Target Fund and September 30 for the Acquiring Fund. Following the proposed Reorganization, the Acquiring Fund will be the accounting survivor.
2. PORTFOLIO VALUATION
Investments in securities are valued each business day as of the close of regular trading on the New York Stock Exchange, which is usually 4:00 p.m. (Eastern Time). Securities which are traded on a national or foreign securities exchange are valued at the last reported sales price. Securities listed on The NASDAQ Stock Market, Inc. (“NASDAQ”) are valued at the NASDAQ Official Closing Price (“NOCP”), and if no NOCP is available, then at the last reported sales price. If no sales price is shown on NASDAQ, the bid price will be used. In the absence of any sale of securities listed on the NASDAQ, and in the case of other securities, including U.S. Government obligations, but excluding debt securities maturing in 60 days or less, the price will be deemed “stale” and the valuations will be determined in accordance with the Funds’ Fair Valuation Procedures.
Securities denominated in foreign currencies are translated into U.S. dollars using the closing rates of exchange in effect on the day of valuation.
Many securities markets and exchanges outside the U.S. close prior to the close of the New York Stock Exchange and therefore may not fully reflect trading or events that occur after the close of the principal exchange in which the foreign investments are traded but before the close of the New York Stock Exchange. If such trading or events are expected to materially affect the value of the investments, then those investments are fair valued following procedures approved by the Board of Trustees. These procedures take into account multiple factors including movements in U.S. securities markets after foreign exchanges close. Depending on market activity, such fair valuations may be frequent. In light of the judgment involved in fair value decisions, there can be no assurance that a fair value assigned to a particular security is accurate. Such fair value pricing may result in NAVs that are higher or lower than NAVs based on the closing price or latest quoted bid price.
Debt securities maturing in 60 days or less generally are valued at amortized cost. The amortized cost method involves valuing a security at its cost, plus accretion of discount or minus amortization of premium over the period until maturity, which approximates market value.
Investments which are not valued using any of the methods discussed above are valued at their fair value as determined by procedures approved by the Board of Trustees.
3. CAPITAL SHARES
The proforma net asset value per share assumes the issuance of shares of the Acquiring Fund that would have been issued at September 30, 2007, in connection with the proposed reorganization. The number of shares assumed to be issued is equal to the net asset value of the shares of the
Target Fund as of September 30, 2007, divided by the net asset value per share of the shares of the Acquiring Fund as of September 30, 2007. The proforma number of shares outstanding for the Administrator Class of the combined fund consists of the following at September 30, 2007:
| | | | | | |
Class of Shares | | Shares of Acquiring
Fund Pre-Reorganization | | Additional Shares
Assumed Issued in
Reorganization | | Total Shares
Outstanding
Post-Reorganization |
Administrator | | 16,147,881 | | 1,903,669 | | 18,051,550 |
5. FEDERAL INCOME TAXES
Each fund has qualified as a “regulated investment company”, as defined under Subchapter M of the Internal Revenue Code (the “Code”). After the Reorganization, the Acquiring Fund intends to continue to qualify as a regulated investment company by complying with the provisions applicable to regulated investment companies in the Code, and to make distributions of substantially all of its investment company taxable income and any net realized capital gains (after reduction for capital loss carryforwards) sufficient to relieve it from all, or substantially all, federal income taxes.
PART C
| | |
Item Nos. | | |
| 15-17 | | Information required to be included in Part C is set forth under the appropriate Item, so numbered, in Part C of this Registration Statement |
THE FOLLOWING ITEMS ARE INCORPORATED BY REFERENCE:
| | 1. | From Post-Effective Amendment No.111 of Wells Fargo Funds Trust, filed July 1, 2007: the Prospectuses dated July 1, 2007, and the SAI dated July 1, 2007, as supplemented October 1, 2007, December 4, 2007 and February 1, 2008, for the Wells Fargo Advantage Life Stage – Conservative Portfolio, Wells Fargo Advantage Life Stage – Moderate Portfolio and Wells Fargo Advantage Life Stage – Aggressive Portfolio. Report of the Independent Auditors and audited annual report financial statements of the Wells Fargo Advantage Life Stage – Conservative Portfolio, Wells Fargo Advantage Life Stage – Moderate Portfolio and Wells Fargo Advantage Life Stage – Aggressive Portfolio, contained in the Annual Report for the fiscal year ended February 29, 2008, as filed with the SEC on May [1], 2008. Unaudited financial report statements of the Wells Fargo Advantage Life Stage – Conservative Portfolio, Wells Fargo Advantage Life Stage – Moderate Portfolio and Wells Fargo Advantage Life Stage – Aggressive Portfolio, dated as of August 31, 2007. |
| | 2. | From Post-Effective Amendment No.118 of Wells Fargo Funds Trust, filed February 1, 2008: the SAI dated February 1, 2008, for the Wells Fargo Advantage Aggressive Allocation Fund, Growth Balanced Fund and Moderate Balanced Fund. Report of the Independent Auditors and audited annual report financial statements of the Wells Fargo Advantage Aggressive Allocation Fund, Growth Balanced Fund and Moderate Balanced Fund, contained in the Annual Report for the fiscal year ended September 30, 2007, as filed with the SEC on December 5, 2007. Unaudited financial report statements of the Wells Fargo Advantage Aggressive Allocation Fund, Growth Balanced Fund and Moderate Balanced Fund, dated as of March 31, 2007. |
| | 3. | From Post-Effective Amendment No.118 of Wells Fargo Funds Trust, filed February 1, 2008: the Prospectus dated February 1, 2008, for the Wells Fargo Advantage Balanced Fund, and the SAI dated February 1, 2008, for the Wells Fargo Advantage Asset Allocation Fund and Wells Fargo Advantage Balanced Fund. Report of the Independent Auditors and audited annual report financial statements of the Wells Fargo Advantage Asset Allocation Fund and Wells Fargo Advantage Balanced Fund, contained in the Annual Report for the fiscal year ended September 30, 2007, as filed with the SEC on December 5, 2007. Unaudited financial report statements of the Wells Fargo Advantage Asset Allocation Fund and Wells Fargo Advantage Balanced Fund, dated as of March 31, 2007. |
| | 4. | From Post-Effective Amendment No.113 of Wells Fargo Funds Trust, filed October 1, 2007: the Prospectuses dated October 1, 2007, for the Wells Fargo Advantage Corporate Bond Fund, Wells Fargo Advantage High Yield Bond Fund and Wells Fargo Advantage Intermediate Government Income Fund, and the SAI dated March 31, 2008, for the Wells Fargo Advantage Corporate Bond Fund, Wells Fargo Advantage Government Securities Fund, Wells Fargo Advantage High Income Fund, Wells Fargo Advantage High Yield Bond Fund, Wells Fargo Advantage Income Plus Fund and Wells Fargo Advantage Intermediate Government Income Fund. Report of the Independent Auditors and audited annual report financial statements of the Wells Fargo Advantage Corporate Bond Fund, Wells Fargo Advantage Government Securities Fund, Wells Fargo Advantage High Income Fund, Wells Fargo Advantage High Yield Bond Fund, Wells Fargo Advantage Income Plus Fund and Wells Fargo Advantage Intermediate Government Income Fund, contained in the Annual Report for the fiscal year ended May 31, 2007, as filed with the SEC on August 6, 2007. Unaudited financial report statements of the Wells Fargo Advantage Corporate Bond Fund, Wells Fargo Advantage Government Securities Fund, Wells Fargo Advantage High Income Fund, Wells Fargo Advantage High Yield Bond Fund, Wells Fargo Advantage Income Plus Fund and Wells Fargo Advantage Intermediate Government Income Fund, dated as of November 30, 2007. |
| | 5. | From Post-Effective Amendment No.114 of Wells Fargo Funds Trust, filed November 1, 2007: the Prospectuses dated November 1, 2007, for the Wells Fargo Advantage National Limited-Term Tax-Free Fund and Wells Fargo Advantage National Tax-Free Fund, and the SAI dated March 31, 2008, for the Wells Fargo Advantage Municipal Bond Fund, Wells Fargo Advantage National Limited-Term Tax-Free Fund, Wells Fargo Advantage National Tax-Free Fund and Wells Fargo Advantage Short-Term Municipal Bond Fund. Report of the Independent Auditors and audited annual report financial statements of the Wells Fargo Advantage Municipal Bond Fund, Wells Fargo Advantage National Limited-Term Tax-Free Fund, Wells Fargo Advantage National Tax-Free Fund and Wells Fargo Advantage Short-Term Municipal Bond Fund, contained in the Annual Report for the fiscal year ended June 30, 2007, as filed with the SEC on August 30, 2007. Unaudited financial report statements of the Wells Fargo Advantage Municipal Bond Fund, Wells Fargo Advantage National Limited-Term Tax-Free Fund, Wells Fargo Advantage National Tax-Free Fund and Wells Fargo Advantage Short-Term Municipal Bond Fund, dated as of December 31, 2007. |
| | 6. | From Post-Effective Amendment No.115 of Wells Fargo Funds Trust, filed December 1, 2007: the Prospectus dated December 1, 2007, and the SAI dated March 31, 2008, for the Wells Fargo Advantage Value Fund. Report of the Independent Auditors and audited annual report financial statements of the Wells Fargo Advantage Value Fund, contained in the Annual Report for the fiscal year ended July 31, 2007, as filed with the SEC on October 5, 2007. Unaudited financial report statements of the Wells Fargo Advantage Value Fund, dated as of January 31, 2008. |
| | 7. | From Post-Effective Amendment No.123 of Wells Fargo Funds Trust, filed March 31, 2008: the SAI dated March 31, 2008, for the Wells Fargo Advantage C&B Large Cap Value Fund. Report of the Independent Auditors and audited annual report financial statements of the Wells Fargo Advantage C&B Large Cap Value Fund, contained in the Annual Report for the fiscal year ended September 30, 2007, as filed with the SEC on December 5, 2007. Unaudited financial report statements of the Wells Fargo Advantage C&B Large Cap Value Fund, dated as of March 31, 2007. |
| | 8. | From Post-Effective Amendment No.118 of Wells Fargo Funds Trust, filed February 1, 2008: the Prospectus dated February 1, 2008, for the Wells Fargo Advantage Overseas Fund and the SAI dated March 31, 2008, for the Wells Fargo Advantage International Equity Fund and Wells Fargo Advantage Overseas Fund. Report of the Independent Auditors and audited annual report financial statements of the Wells Fargo Advantage International Equity Fund and Wells Fargo Advantage Overseas Fund, contained in the Annual Report for the fiscal year ended September 30, 2007, as filed with the SEC on December 5, 2007. Unaudited financial report statements of the Wells Fargo Advantage International Equity Fund and Wells Fargo Advantage Overseas Fund, dated as of March 31, 2007. |
PART C
OTHER INFORMATION
Under the terms of the Amended and Restated Declaration of Trust of the Registrant, incorporated by reference as Exhibit 1 hereto, provides for the indemnification of the Registrant’s Trustees, officers, employees and agents. The following sections of Article IX provide as follows:
Section 1. Limitation of Liability. All persons contracting with or having any claim against the Trust or a particular Series shall look only to the assets of the Trust or such Series, respectively, for payment under such contract or claim; and neither the Trustees nor any of the Trust’s officers, employees or agents, whether past, present or future (each a “Covered Person,” and collectively the “Covered Persons”), shall be personally liable therefor. Notwithstanding any provision in this Article IX, neither the investment adviser, Principal Underwriter or other service providers, nor any officers, employees or other agents of such entities, shall be indemnified pursuant to this Article IX, except that dual officers, employees or other agents of the Trust and such entities shall be entitled to indemnification pursuant to this Article IX but only to the extent that such officer, employee or other agent was acting in his or her capacity as an officer, employee or agent of the Trust in the conduct that gave rise to the claim for indemnification. No Covered Person shall be liable to the Trust or to any Shareholder for any loss, damage or claim incurred by reason of any act performed or omitted by such Covered Person in good faith on behalf of the Trust, a Series or a Class, and in a manner reasonably believed to be within the scope of authority conferred on such Covered Person by this Declaration, except that a Covered Person shall be liable for any loss, damage or claim incurred by reason of such Covered Person’s bad faith, gross negligence, willful misconduct or reckless disregard of the duties involved in the conduct of his or her office.
Section 2. Mandatory Indemnification. (a) Subject only to the express limitations in the 1940 Act, other applicable laws, and sub-paragraph (b) below, the Trust or the appropriate Series shall indemnify each of its Covered Persons to the fullest extent permitted under the 1940 Act and other applicable laws, including, but not limited to, against all liabilities and expenses reasonably incurred or paid by him or her in connection with any claim, action, suit or proceeding in which he or she becomes involved as a party or otherwise by virtue of his or her being or having been a Covered Person and against amounts paid or incurred in the settlement thereof.
As used herein, the words “claim,” “action,” “suit,” or “proceeding” shall apply to all claims, actions, suits or proceedings (civil, criminal or other, including appeals), actual or threatened, and the words “liability” and “expenses” shall include, without limitation, reasonable attorneys’ fees, costs, judgments, amounts paid in settlement, fines, penalties and other liabilities.
(b) Notwithstanding any provision to the contrary contained herein, no Covered Person shall be entitled to indemnification for any liability arising by reason of such Covered Person’s willful misfeasance, bad faith, gross negligence, or the reckless disregard of duties owed to the Trust (“disabling conduct”).
(c) No indemnification or advance shall be made under this Article IX to the extent such indemnification or advance:
would be inconsistent with a provision of the Declaration, or an agreement in effect at the time of accrual of the alleged cause of action asserted in the proceeding in which the expenses were incurred or other amounts were paid which prohibits or otherwise limits indemnification; or
would be inconsistent with any condition expressly imposed by a court in a judgment, order, or approval of a settlement.
(d) Any indemnification under this Article shall be made by the Trust only if authorized in the specific case on a determination that the Covered Person was not liable by reason of disabling conduct by:
| | (i) | a final decision on the merits by a court or other body before whom the proceeding was brought; or |
| | (ii) | in the absence of such a decision, by any reasonable and fair means established in accordance with, and subject to the requirements and limitations of, Section 17(h) of the 1940 Act and any interpretation thereunder by the Commission or its staff. |
(e) The rights of indemnification herein provided may be insured against by policies of insurance maintained by the Trust, shall be severable, shall not be exclusive of or affect any other rights to which any Covered Person may now or hereafter be entitled, and shall inure to the benefit of the heirs, executors and administrators of a Covered Person.
(f) To the maximum extent permitted by the 1940 Act and other applicable laws, expenses in connection with the preparation and presentation of a defense to any claim, action, suit or proceeding of the character described in subsection (a) of this Article IX shall be paid by the Trust or applicable Series from time to time prior to final disposition thereof upon receipt of an undertaking by or on behalf of such Covered Person that such amount will be paid over by him or her to the Trust or applicable Series if it is ultimately determined that he or she is not entitled to indemnification under this Article IX; provided, however, that either (i) such Covered Person shall have provided appropriate security for such undertaking, (ii) the Trust is insured against losses arising out of any such advance payments or (iii) either a majority of the Trustees who are neither Interested Persons of the Trust nor parties to the matter, or independent legal counsel in a written opinion, shall have determined, based upon a review of readily available facts (as opposed to a full trial-type inquiry) that there is reason to believe that such Covered Person will not be disqualified from indemnification under this Article IX; provided, however, that the Trust shall not be obligated to pay the expenses of any agent acting pursuant to a written contract with the Trust, except to the extent required by such contract.
(g) Any repeal or modification of this Article IX shall be prospective only, to the extent that such repeal or modification would, if applied retrospectively, affect any limitation on the liability of any Covered Person in an a manner that would be adverse to such Covered Person or affect any indemnification available to any Covered Person in a manner that would be adverse to such Covered Person with respect to any act or omission which occurred prior to such repeal, modification or adoption.
All references to the “Registration Statement” in the following list of Exhibits refer to the Registrant’s Registration Statement on Form N-1A (File Nos. 333-74295; 811-09253).
| | |
Exhibit Number | | Description |
| (1) | | Amended and Restated Declaration of Trust, incorporated by reference to Post-Effective Amendment No. 83, filed April 11, 2005. |
| |
| (2) | | Not Applicable |
| |
| (3) | | Not Applicable. |
| |
| (4)(a) | | Form of Agreement and Plan of Reorganization, filed herewith. |
| |
| (4)(b) | | Form of Agreement and Plan of Reorganization, filed herewith. |
| |
| (5) | | Not Applicable. |
| | |
Exhibit Number | | Description |
| (6)(a) | | Investment Advisory Agreement with Wells Fargo Funds Management, LLC, incorporated by reference to Post-Effective Amendment No. 87, filed November 1, 2005; Schedule A, incorporated by reference to Post-Effective Amendment No. 119, filed March 1, 2008. |
| |
| (6)(b) | | Investment Sub-Advisory Agreement with Galliard Capital Management, Inc., incorporated by reference to Post-Effective Amendment No. 20, filed May 1, 2001; Schedule A, incorporated by reference to Post-Effective Amendment No. 87, filed November 1, 2005; Appendix A, incorporated by reference to Post-Effective Amendment No. 93, filed June 26, 2006. |
| |
| (6)(c) | | Investment Sub-Advisory Agreement with Peregrine Capital Management, Inc., incorporated by reference to Post-Effective Amendment No. 20, filed May 1, 2001; Schedule A, incorporated by reference to Post-Effective Amendment No. 111, filed June 29, 2007; Appendix A, incorporated by reference to Post-Effective Amendment No. 93, filed June 26, 2006. |
| |
| (6)(d) | | Investment Sub-Advisory Agreement with Schroder Investment Management North America Inc., incorporated by reference to Post-Effective Amendment No. 20, filed May 1, 2001; Schedule A, incorporated by reference to Post-Effective Amendment No. 83, filed April 11, 2005. |
| |
| (6)(e) | | Investment Sub-Advisory Agreement with Smith Asset Management Group, L.P., incorporated by reference to Post-Effective Amendment No. 49, filed November 1, 2002; Appendix A and Schedule A, incorporated by reference to Post-Effective Amendment No. 87, filed November 1, 2005. |
| |
| (6)(f) | | Investment Sub-Advisory Agreement with Wells Capital Management Incorporated, incorporated by reference to Post-Effective Amendment No. 22, filed June 15, 2001; Schedule A, and Appendix A, incorporated by reference to Post-Effective Amendment No. 119, filed March 1, 2008. |
| |
| (6)(g) | | Investment Sub-Advisory Agreement with RCM Capital Management, LLC (formerly Dresdner RCM Global Investors, LLC), incorporated by reference to Post-Effective Amendment No. 32, filed February 8, 2002; Appendix A and Schedule A, incorporated by reference to Post-Effective Amendment No. 119, filed March 1, 2008. |
| |
| (6)(h) | | Investment Sub-Advisory Agreement with Global Index Advisors, Inc., incorporated by reference to Post-Effective Amendment No. 93, filed June 26, 2006. Appendix A and B, incorporated by reference to Post-Effective Amendment No. 111, filed June 29, 2007. |
| | |
Exhibit Number | | Description |
| (6)(i) | | Investment Sub-Advisory Agreement with Systematic Financial Management, L.P., incorporated by reference to Post-Effective Amendment No. 66, filed October 1, 2003; Appendix A and Appendix B, incorporated by reference to Post-Effective Amendment No. 88, filed December 1, 2005. |
| |
| (6)(j) | | Investment Sub-Advisory Agreement with LSV Asset Management, incorporated by reference to Post-Effective Amendment No. 69, filed January 30, 2004; Appendix A, incorporated by reference to Post-Effective Amendment No. 93, filed June 26, 2006. |
| |
| (6)(k) | | Investment Sub-Advisory Agreement with Cooke & Bieler, L.P., incorporated by reference to Post-Effective Amendment No. 74, filed July 26, 2004; Appendix A and Schedule A, incorporated by reference to Post-Effective Amendment No. 88, filed December 1, 2005. |
| |
| (6)(l) | | Investment Sub-Advisory Agreement with Artisan Partners Limited Partnership, incorporated by reference to Post-Effective Amendment No. 82, filed March 1, 2005; Appendix A and Appendix B, incorporated by reference to Post-Effective Amendment No. 88, filed December 1, 2005. |
| |
| (6)(m) | | Investment Sub-Advisory Agreement with LSV Asset Management, incorporated by reference to Post-Effective Amendment No. 82, filed March 1, 2005. |
| |
| (6)(n) | | Investment Sub-Advisory Agreement with New Star Institutional Managers Limited, incorporated by reference to Post-Effective Amendment No. 92, filed May 1, 2006; Appendix A and Schedule A, incorporated by reference to Post-Effective Amendment No. 119, filed March 1, 2008. |
| |
| (6)(o) | | Investment Sub-Advisory Agreement with Matrix Asset Advisors, Inc., incorporated by reference to Post-Effective Amendment No. 83, filed April 11, 2005; Appendix A and Schedule A, incorporated by reference to Post-Effective Amendment No. 119, filed March 1, 2008. |
| |
| (6)(p) | | Sub-Advisory Agreement with Phocas Financial Corporation, incorporated by reference to Post-Effective Amendment No. 122, filed March 21, 2008. |
| |
| (7) | | Distribution Agreement with Wells Fargo Funds Distributor, LLC, incorporated by reference to Post-Effective Amendment No. 84, filed July 1, 2005; Schedule I, incorporated by reference to Post-Effective Amendment No. 118, filed February 1, 2008. |
| |
| (8) | | Not Applicable. |
| | |
Exhibit Number | | Description |
(9)(a) | | Amended and Restated Custody Agreement with Wells Fargo Bank, N.A. incorporated by reference to Post-Effective Amendment No. 83, filed April 11, 2005; Appendix A incorporated by reference to Post-Effective Amendment No. 118, filed February 1, 2008. |
| |
(9)(b) | | Delegation Agreement (17f-5) with Wells Fargo Bank, N.A., incorporated by reference to Post-Effective Amendment No. 93, filed June 26, 2006. Exhibit A incorporated by reference to Post-Effective Amendment No. 118, filed February 1, 2008. |
| |
(9)(c) | | Securities Lending Agency Agreement by and among Wells Fargo Funds Trust, Wells Fargo Master Trust, Wells Fargo Variable Trust, Wells Fargo Funds Management, LLC and Wells Fargo Bank, N.A., incorporated by reference to Post-Effective Amendment No. 100, filed October 2, 2006. Schedule 1, incorporated by reference to Post-Effective Amendment No. 118, filed February 1, 2008. Schedule 2 incorporated by reference to Post-Effective Amendment No. 113, filed October 1, 2007. |
| |
(10)(a) | | Rule 12b-1 Plan, incorporated by reference to Post-Effective Amendment No. 87, filed November 1, 2005; Appendix A, incorporated by reference to Post-Effective Amendment No. 119, filed March 1, 2008. |
| |
(10)(b) | | Rule 18f-3 Plan, incorporated by reference to Post-Effective Amendment No. 111, filed June 29, 2007; Appendix A, incorporated by reference to Post-Effective Amendment No. 119, filed March 1, 2008. |
| |
(11) | | Legal Opinion, to be filed. |
| |
(12) | | See Item 17(3) of this Part C. |
| |
(13)(a) | | Amended and Restated Fee and Expense Agreement between Wells Fargo Funds Trust, Wells Fargo Master Trust and Wells Fargo Funds Management, LLC, incorporated by reference to Post-Effective Amendment No. 32, filed February 8, 2002; Schedule A, incorporated by reference to Post-Effective Amendment No. 119, filed March 1, 2008. |
| |
(13)(b) | | Administration Agreement with Wells Fargo Funds Management, LLC, incorporated by reference to Post-Effective Amendment No. 65, filed August 15, 2003; Appendix A and Schedule A, incorporated by reference to Post-Effective Amendment No. 119, filed March 1, 2008. |
| |
(13)(c) | | Transfer Agency and Service Agreement with Boston Financial Data Services, Inc., incorporated by reference to Post-Effective Amendment No. 92, filed May 1, 2006; Schedule A, incorporated by reference to Post-Effective Amendment No. 119, filed March 1, 2008. |
| | |
Exhibit Number | | Description |
| (13)(d) | | Accounting Services Agreement with PFPC Inc., along with Amended and Restated Letter Agreement, incorporated by reference to Post-Effective Amendment No. 83, filed April 11, 2005; Amendment, incorporated by reference to Post-Effective Amendment No. 88, filed December 1, 2005; Exhibit A, incorporated by reference to Post-Effective Amendment No. 119, filed March 1, 2008. |
| |
| (13)(e) | | Shareholder Servicing Plan, incorporated by reference to Post-Effective Amendment No. 16, filed October 30, 2000; Appendix A, incorporated by reference to Post-Effective Amendment No. 119, filed March 1, 2008. |
| |
| (13)(f) | | Administrative and Shareholder Servicing Agreement, Form of Agreement, incorporated by reference to Post-Effective Amendment No. 111, filed June 29, 2007. |
| |
| (14)(a) | | Consent of Independent Registered Public Accounting Firm, filed herewith. |
| |
| (14)(b) | | Consent of Independent Registered Public Accounting Firm, filed herewith. |
| |
| (15) | | Not Applicable. |
| |
| (16) | | Powers of Attorney, are incorporated by reference to: Post-Effective No. 72, filed June 30, 2004; Post-Effective Amendment No. 90, filed March 1, 2006, and Post-Effective Amendment No. 112, filed July 31, 2007. |
| |
| (17) | | Form of Proxy Ballots, filed herewith. |
| (1) | Wells Fargo Advantage Funds agrees that, prior to any public reoffering of the securities registered through the use of a prospectus which is a part of this registration statement by any person or party who is deemed to be an underwriter within the meaning of Rule 145(c) of the Securities Act of 1933, the reoffering prospectus will contain the information called for by the applicable registration form for the reofferings by persons who may be deemed underwriters, in addition to the information called for by the other items of the applicable form. |
| (2) | The undersigned Registrant agrees that every prospectus that is filed under paragraph (1) above will be filed as part of an amendment to the registration statement and will not be used until the amendment is effective, and that, in determining any liability under the Securities Act of 1933, each post-effective amendment shall be deemed to be a new registration statement for the securities offered therein, and the offering of the securities at that time shall be deemed to be the initial bona fide offering of them. |
| (3) | The undersigned Registrant agrees to file, by post-effective amendment, an opinion of counsel or a copy of an IRS ruling supporting the tax consequences of the Reorganization within a reasonably prompt time after receipt of such opinion or ruling, but in any event no later than one business day after consummation of the Reorganization. |
SIGNATURES
Pursuant to the requirements of the Securities Act of 1933 and the Investment Company Act of 1940, the Registrant has duly caused this Registration Statement on Form N-14 to be signed on its behalf by the undersigned, thereto duly authorized, in the City of San Francisco and State of California on the 1st day of April, 2008.
| | |
| WELLS FARGO FUNDS TRUST |
| |
| By: | | /s/ Carol Lorts |
| | Carol Lorts Assistant Secretary |
Pursuant to the requirements of the Securities Act of 1933, this Registration Statement on Form N-14 has been signed by the following persons in the capacities and on the 1st day of April, 2008.
| | |
SIGNATURES | | TITLE |
| |
| | President and/or Principal Executive Officer |
| Karla M. Rabusch * | | |
| |
| | Treasurer and/or Principal Financial Officer |
| Stephen Leonhardt* | | |
| |
| A Majority of the Trustees* | | |
| | Trustee |
| Thomas S. Goho | | Trustee |
| Peter G. Gordon | | Trustee |
| Olivia S. Mitchell | | Trustee |
| J. Tucker Morse | | Trustee |
| Timothy J. Penny | | Trustee |
Donald C. Willeke | | Trustee |
| | |
| *By: | | /s/ Carol Lorts |
| | Carol Lorts |
| | (Attorney-in-Fact) |
WELLS FARGO FUNDS TRUST
N-14 Exhibit Index
| | |
Exhibit
Number | | Description |
| 4(a) | | Agreement and Plan of Reorganization |
| |
| 4(b) | | Agreement and Plan of Reorganization |
| |
| 14(a) | | Consent of Independent Registered Public Accounting Firm |
| |
| 14(b) | | Consent of Independent Registered Public Accounting Firm |
| |
| 17 | | Form of Proxy Ballots |