Table of Contents

UNITED STATES
SECURITIES AND EXCHANGE COMMISSION
Washington, D.C. 20549
FORMN-CSRS
CERTIFIED SHAREHOLDER REPORT OF REGISTERED
MANAGEMENT INVESTMENT COMPANIES
Investment Company Act file number:811-09253
Wells Fargo Funds Trust
(Exact name of registrant as specified in charter)
525 Market St., San Francisco, CA 94105
(Address of principal executive offices) (Zip code)
Alexander Kymn
Wells Fargo Funds Management, LLC
525 Market St., San Francisco, CA 94105
(Name and address of agent for service)
Registrant’s telephone number, including area code:800-222-8222
Date of fiscal year end: January 31
Registrant is making a filing for 8 of its series:
Wells Fargo 100% Treasury Money Market Fund, Wells Fargo Cash Investment Money Market Fund, Wells Fargo Government Money Market Fund, Wells Fargo Heritage Money Market Fund, Wells Fargo Money Market Fund, Wells Fargo Municipal Cash Management Money Market Fund, Wells Fargo NationalTax-Free Money Market Fund, and Wells Fargo Treasury Plus Money Market Fund.
Date of reporting period: July 31, 2019
Table of Contents
| ITEM 1. | REPORT TO STOCKHOLDERS |
Table of Contents

Semi-Annual Report
July 31, 2019
Retail Money Market Funds
| ∎ | Wells Fargo Money Market Fund |
Beginning on January 1, 2021, as permitted by new regulations adopted by the Securities and Exchange Commission, paper copies of the Wells Fargo Funds’ annual and semi-annual shareholder reports issued after this date will no longer be sent by mail, unless you specifically request paper copies of the reports. Instead, the reports will be made available on the Funds’ website, and you will be notified by mail each time a report is posted and provided with a website address to access the report.
If you already elected to receive shareholder reports electronically, you will not be affected by this change and you need not take any action. You may elect to receive shareholder reports and other communications from the Fund electronically at any time by contacting your financial intermediary (such as a broker-dealer or bank) or, if you are a direct investor, by calling1-800-222-8222 or by enrolling at wellsfargo.com/advantagedelivery.
You may elect to receive all future reports in paper free of charge. If you invest through a financial intermediary, you can contact your financial intermediary to request that you continue to receive paper copies of your shareholder reports; if you invest directly with the Fund, you can call 1-800-222-8222. Your election to receive reports in paper will apply to all Wells Fargo Funds held in your account with your financial intermediary or, if you are a direct investor, to all Wells Fargo Funds that you hold.
Table of Contents
|
Reduce clutter. Save trees. |
Sign up for electronic delivery of prospectuses and shareholder reports atwellsfargo.com/advantagedelivery |
The views expressed and any forward-looking statements are as of July 31, 2019, unless otherwise noted, and are those of the Fund managers and/or Wells Fargo Asset Management. Discussions of individual securities, or the markets generally, or any Wells Fargo Fund are not intended as individual recommendations. Future events or results may vary significantly from those expressed in any forward-looking statements. The views expressed are subject to change at any time in response to changing circumstances in the market. Wells Fargo Asset Management and the Fund disclaim any obligation to publicly update or revise any views expressed or forward-looking statements.
INVESTMENT PRODUCTS: NOT FDIC INSURED ◾ NO BANK GUARANTEE ◾ MAY LOSE VALUE
Retail Money Market Funds | 1
Table of Contents
Letter to shareholders (unaudited)

Andrew Owen
President
Wells Fargo Funds
Dear Shareholder:
We are pleased to offer you this semi-annual report for the Wells Fargo Money Market Fund for the six-month period that ended July 31, 2019. Global stock and bond investors enjoyed gains that came amid continued concerns about global economic growth, international trade, geopolitical tensions, and bouts of market volatility. These concerns grew more intense as the period closed.
For the period, U.S. stocks, based on the S&P 500 Index,1 gained 11.32% and international stocks, as measured by the MSCI ACWI ex USA Index (Net),2 added 4.34%. The MSCI EM Index (Net)3 inched higher by 0.44%. For bond investors, the Bloomberg Barclays U.S. Aggregate Bond Index4 added 5.23%, the Bloomberg Barclays Global Aggregate ex-USD Index5 added 2.33%, the Bloomberg Barclays Municipal Bond Index6 gained 5.15%, and the ICE BofAML U.S. High Yield Index7 added 5.86%.
Concerns for slowing global growth reemerge during the first quarter of 2019.
After the S&P 500 Index’s best monthly performance in 30 years during January and positive returns for other major indices across major asset classes, signs of slowing global growth grew more ominous in February. The Bureau of Economic Analysis announced fourth-quarter 2018 gross domestic product (GDP) grew at an annualized 2.2% rate, down from the levels of the prior two quarters. In a February report, the Bank of England forecast the slowest growth since the financial crisis for 2019. China and the U.S. continued to wrangle over trade issues.
By the end of March 2019, a combination of dovish U.S. Federal Reserve (Fed) sentiment and steady, if not spectacular, U.S. economic and business metrics reinforced investors’ confidence. Monthly job creation data and corporate profits, while less consistent than during 2018, were solid. China announced a roughly $300 billion stimulus package through tax and fee cuts intended to reinvigorate economic growth. During April 2019, favorable sentiment found additional support in reports of sustained low inflation, solid employment data, and first-quarter U.S. GDP of an annualized rate of 3.2%.
| 1 | The S&P 500 Index consists of 500 stocks chosen for market size, liquidity, and industry group representation. It is a market-value-weighted index with each stock’s weight in the index proportionate to its market value. You cannot invest directly in an index. |
| 2 | The Morgan Stanley Capital International (MSCI) All Country World Index (ACWI) ex USA Index (Net) is a free-float-adjusted market-capitalization weighted index that is designed to measure the equity market performance of developed and emerging markets, excluding the U.S. Source: MSCI. MSCI makes no express or implied warranties or representations and shall have no liability whatsoever with respect to any MSCI data contained herein. The MSCI data may not be further redistributed or used as a basis for other indices or any securities or financial products. This report is not approved, reviewed, or produced by MSCI. You cannot invest directly in an index. |
| 3 | The MSCI Emerging Markets (EM) Index (Net) is a free-float-adjusted market-capitalization-weighted index that is designed to measure the equity market performance of emerging markets. You cannot invest directly in an index. |
| 4 | The Bloomberg Barclays U.S. Aggregate Bond Index is a broad-based benchmark that measures the investment-grade, U.S. dollar-denominated, fixed-rate taxable bond market, including Treasuries, government-related and corporate securities, mortgage-backed securities (agency fixed-rate and hybrid adjustable-rate mortgage pass-throughs), asset-backed securities, and commercial mortgage-backed securities. You cannot invest directly in an index. |
| 5 | The Bloomberg Barclays Global Aggregate ex-USD Index is an unmanaged index that provides a broad-based measure of the global investment-grade fixed-income markets excluding the U.S. dollar-denominated debt market. You cannot invest directly in an index. |
| 6 | The Bloomberg Barclays Municipal Bond Index is an unmanaged index composed of long-term tax-exempt bonds with a minimum credit rating of Baa. You cannot invest directly in an index. |
| 7 | The ICE BofAML U.S. High Yield Index is a market-capitalization-weighted index of domestic and Yankee high-yield bonds. The index tracks the performance of high-yield securities traded in the U.S. bond market. You cannot invest directly in an index. Copyright 2019. ICE Data Indices, LLC. All rights reserved. |
2 | Retail Money Market Funds
Table of Contents
Letter to shareholders (unaudited)
During May 2019, markets tumbled on mixed investment signals. In the U.S., partisan wrangling ramped up as Democrats and Republicans set their sights on 2020 presidential politics. The U.K.’s Brexit caused Prime Minister Theresa May to resign. The European Commission downgraded the 2019 growth forecast to 1.2%. The U.S. increased tariffs on products from China, China responded, and then talks broke down. President Donald Trump threatened to turn his foreign policy tariff tool to Mexico over immigration issues.
As had been the case during most of 2019 to date, just as the investment horizon appeared to darken, sentiment turned and U.S. equity markets gained during June and July. The gains, primarily driven by geopolitical and monetary policy events, pushed equity markets to new highs.
President Mario Draghi of the European Central Bank said that if the outlook doesn’t improve, the bank will cut rates or buy more assets to prop up inflation. President Trump backed off of tariff threats against Mexico and China. In the U.S., the Fed implemented a 0.25% federal funds rate cut in July 2019.
Later in July 2019, the U.S. reversed course and threatened to impose higher tariffs on China’s exports after talks failed. China responded with tariff threats of its own and devalued the renminbi, a move that roiled global markets. Despite the accommodative approach of central banks, investors continued to have misgivings about the durability of economic growth globally and a pervasively cautious tone influenced the world’s equity and fixed-income markets.
Don’t let short-term uncertainty derail long-term investment goals.
Periods of investment uncertainty can present challenges, but experience has taught us that maintaining long-term investment goals can be an effective way to plan for the future. To help you create a sound strategy based on your personal goals and risk tolerance, Wells Fargo Funds offers more than 100 mutual funds spanning a wide range of asset classes and investment styles. Although diversification cannot guarantee an investment profit or prevent losses, we believe it can be an effective way to manage investment risk and potentially smooth out overall portfolio performance. We encourage investors to know their investments and to understand that appropriate levels of risk-taking may unlock opportunities.
Thank you for choosing to invest with Wells Fargo Funds. We appreciate your confidence in us and remain committed to helping you meet your financial needs.
Sincerely,

Andrew Owen
President
Wells Fargo Funds
“During May 2019, markets tumbled on mixed investment signals.”
“In the U.S., the Fed implemented a 0.25% federal funds rate cut in July 2019.”
|
For further information about your Fund, contact your investment professional, visit our website at wfam.com,or call us directly at1-800-222-8222. |
Retail Money Market Funds | 3
Table of Contents
Performance highlights (unaudited)
Investment objective
The Fund seeks current income, while preserving capital and liquidity.
Manager
Wells Fargo Funds Management, LLC
Subadviser
Wells Capital Management Incorporated
Wells Capital Management Singapore
Portfolio managers
Michael C. Bird, CFA®‡
Jeffrey L. Weaver, CFA®‡
Laurie White
Average annual total returns (%) as of July 31, 2019
| Including sales charge | Excluding sales charge | Expense ratios1 (%) | ||||||||||||||||||||||||||||||||
| Inception date | 1 year | 5 year | 10 year | 1 year | 5 year | 10 year | Gross | Net2 | ||||||||||||||||||||||||||
| Class A (STGXX) | 7-1-1992 | – | – | – | 1.94 | 0.66 | 0.34 | 0.72 | 0.60 | |||||||||||||||||||||||||
| Class C*3 | 6-30-2010 | 0.18 | 0.31 | 0.16 | 1.18 | 0.31 | 0.16 | 1.47 | 1.35 | |||||||||||||||||||||||||
| Premier Class (WMPXX)4 | 3-31-2016 | – | – | – | 2.34 | 0.94 | 0.47 | 0.33 | 0.20 | |||||||||||||||||||||||||
| Service Class (WMOXX)5 | 6-30-2010 | – | – | – | 2.04 | 0.74 | 0.37 | 0.62 | 0.50 | |||||||||||||||||||||||||
Yield summary (%) as of July 31, 20192
| Class A | Class C* | Premier Class | Service Class | |||||||||||||
| 7-day current yield | 1.90 | 1.15 | 2.30 | 2.00 | ||||||||||||
| 7-day compound yield | 1.92 | 1.16 | 2.33 | 2.02 | ||||||||||||
| 30-day simple yield | 1.93 | 1.18 | 2.33 | 2.03 | ||||||||||||
| 30-day compound yield | 1.95 | 1.18 | 2.35 | 2.05 | ||||||||||||
| * | Class C shares are available only to shareholders making an exchange out of Class C shares of another mutual fund within the Wells Fargo family of funds. |
Figures quoted represent past performance, which is no guarantee of future results, and do not reflect taxes that a shareholder may pay on fund distributions or the redemption of fund shares. Investment returns will fluctuate. The Fund’s yield figures more closely reflect the current earnings of the Fund than the total return figures. Current performance may be lower or higher than the performance data quoted, which assumes the reinvestment of dividends and capital gains. Current month-end performance is available on the Fund’s website,wfam.com.
Class A shares, Premier Class shares, and Service Class shares are sold without a front-end sales charge or contingent deferred sales charge. For Class C shares, the maximum contingent deferred sales charge is 1.00%. Performance including a contingent deferred sales charge assumes the sales charge for the corresponding time period.
For retail money market funds: You could lose money by investing in the Fund. Although the Fund seeks to preserve the value of your investment at $1.00 per share, it cannot guarantee it will do so. The Fund may impose a fee upon sale of your shares or may temporarily suspend your ability to sell shares if the Fund’s liquidity falls below required minimums because of market conditions or other factors. An investment in the Fund is not insured or guaranteed by the Federal Deposit Insurance Corporation or any other government agency. The Fund’s sponsor has no legal obligation to provide financial support to the Fund, and you should not expect that the sponsor will provide financial support to the Fund at any time.
Please see footnotes on page 5.
4 | Retail Money Market Funds
Table of Contents
Performance highlights (unaudited)
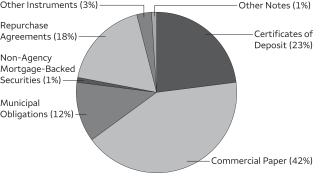
| Portfolio composition as of July 31, 20196 |
 |
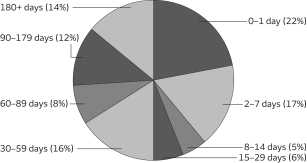
| Effective maturity distribution as of July 31, 20196 |
|
| Weighted average maturity as of July 31, 20197 | ||||
35 days | ||||
| Weighted average life as of July 31, 20198 | ||||
88 days | ||||
| ‡ | CFA® and Chartered Financial Analyst® are trademarks owned by CFA Institute. |
| 1 | Reflects the expense ratios as stated in the most recent prospectuses. The expense ratios shown are subject to change and may differ from the annualized expense ratios shown in the financial highlights of this report. |
| 2 | The manager has contractually committed through May 31, 2020, to waive fees and/or reimburse expenses to the extent necessary to cap the expenses of each class after fee waivers at the amounts shown. Brokerage commissions, stamp duty fees, interest, taxes, acquired fund fees and expenses (if any), and extraordinary expenses are excluded from the expense cap. Prior to or after the commitment expiration date, the cap may be increased or the commitment to maintain the cap may be terminated only with the approval of the Board of Trustees. Without this cap, the Fund’s returns would have been lower. Without waived fees and/or reimbursed expenses, the Fund’s 7-day current yield would have been 1.80%, 1.05%, 2.19%, and 1.90%, and for Class A, Class C, Premier Class, and Service Class, respectively. The expense ratio paid by an investor is the net expense ratio (the total annual fund operating expenses after fee waivers) as stated in the prospectuses. |
| 3 | Historical performance shown for the Class C shares prior to their inception reflects the performance of the former Class B shares. Class B and Class C shares had the same expenses. |
| 4 | Historical performance shown for the Premier Class shares prior to their inception reflects the performance of the Class A shares, and includes the higher expenses applicable to Class A shares. If these expenses had not been included, returns for Premier Class shares would be higher. |
| 5 | Historical performance shown for Service Class shares prior to their inception reflects the performance of the former Investor Class shares, and includes the higher expenses applicable to the former Investor Class shares. If these expenses had not been included, returns for Service Class shares would be higher. |
| 6 | Amounts are calculated based on the total investments of the Fund. These amounts are subject to change and may have changed since the date specified. |
| 7 | Weighted Average Maturity (WAM): WAM is an average of the effective maturities of all securities held in the portfolio, weighted by each security’s percentage of total investments. The maturity of a portfolio security is the period remaining until the date on which the principal amount is unconditionally required to be paid, or in the case of a security called for redemption, the date on which the redemption payment is unconditionally required to be made. WAM calculations allow for the maturities of certain securities with demand features or periodic interest rate resets to be shortened. WAM is a way to measure a fund’s sensitivity to potential interest rate changes. WAM is subject to change and may have changed since the date specified. |
| 8 | Weighted Average Life (WAL): WAL is an average of the final maturities of all securities held in the portfolio, weighted by their percentage of total investments. The maturity of a portfolio security is the period remaining until the date on which the principal amount is unconditionally required to be paid, or in the case of a security called for redemption, the date on which the redemption payment is unconditionally required to be made. In contrast to WAM, the calculation of WAL allows for the maturities of certain securities with demand features to be shortened, but not the periodic interest rate resets. WAL is a way to measure a fund’s potential sensitivity to credit spread changes. WAL is subject to change and may have changed since the date specified. |
Retail Money Market Funds | 5
Table of Contents
As a shareholder of the Fund, you incur two types of costs: (1) transaction costs, including contingent deferred sales charges (if any) on redemptions and (2) ongoing costs, including management fees, distribution (12b-1) and/or shareholder servicing fees, and other Fund expenses. This example is intended to help you understand your ongoing costs (in dollars) of investing in the Fund and to compare these costs with the ongoing costs of investing in other mutual funds.
The example is based on an investment of $1,000 invested at the beginning of the six-month period and held for the entire period from February 1, 2019 to July 31, 2019.
Actual expenses
The “Actual” line of the table below provides information about actual account values and actual expenses. You may use the information in this line, together with the amount you invested, to estimate the expenses that you paid over the period. Simply divide your account value by $1,000 (for example, an $8,600 account value divided by $1,000 = 8.6), then multiply the result by the number in the “Actual” line under the heading entitled “Expenses paid during period” for your applicable class of shares to estimate the expenses you paid on your account during this period.
Hypothetical example for comparison purposes
The “Hypothetical” line of the table below provides information about hypothetical account values and hypothetical expenses based on the Fund’s actual expense ratio and an assumed rate of return of 5% per year before expenses, which is not the Fund’s actual return. The hypothetical account values and expenses may not be used to estimate the actual ending account balance or expenses you paid for the period. You may use this information to compare the ongoing costs of investing in the Fund and other funds. To do so, compare this 5% hypothetical example with the 5% hypothetical examples that appear in the shareholder reports of the other funds.
Please note that the expenses shown in the table are meant to highlight your ongoing costs only. Therefore, the “Hypothetical” line of the table is useful in comparing ongoing costs only and will not help you determine the relative total costs of owning different funds. In addition, if these transactional costs were included, your costs would have been higher.
| Beginning account value 2-1-2019 | Ending account value 7-31-2019 | Expenses paid during the period¹ | Annualized net expense ratio | |||||||||||||
Class A | ||||||||||||||||
Actual | $ | 1,000.00 | $ | 1,010.04 | $ | 2.99 | 0.60 | % | ||||||||
Hypothetical (5% return before expenses) | $ | 1,000.00 | $ | 1,021.82 | $ | 3.01 | 0.60 | % | ||||||||
Class C | ||||||||||||||||
Actual | $ | 1,000.00 | $ | 1,006.29 | $ | 6.72 | 1.35 | % | ||||||||
Hypothetical (5% return before expenses) | $ | 1,000.00 | $ | 1,018.10 | $ | 6.76 | 1.35 | % | ||||||||
Premier Class | ||||||||||||||||
Actual | $ | 1,000.00 | $ | 1,012.04 | $ | 1.00 | 0.20 | % | ||||||||
Hypothetical (5% return before expenses) | $ | 1,000.00 | $ | 1,023.80 | $ | 1.00 | 0.20 | % | ||||||||
Service Class | ||||||||||||||||
Actual | $ | 1,000.00 | $ | 1,010.54 | $ | 2.49 | 0.50 | % | ||||||||
Hypothetical (5% return before expenses) | $ | 1,000.00 | $ | 1,022.32 | $ | 2.51 | 0.50 | % | ||||||||
| 1 | Expenses paid is equal to the annualized net expense ratio of each class multiplied by the average account value over the period, multiplied by the number of days in the most recent fiscal half-year divided by the number of days in the fiscal year (to reflect the one-half-year period). |
6 | Retail Money Market Funds
Table of Contents
Portfolio of investments—July 31, 2019 (unaudited)
Interest rate | Maturity date | Principal | Value | |||||||||||||
| Certificates of Deposit: 22.03% | ||||||||||||||||
ABN Amro Bank NV | 2.46 | % | 10-7-2019 | $ | 8,000,000 | $ | 8,000,000 | |||||||||
ABN Amro Bank NV | 2.59 | 9-6-2019 | 8,000,000 | 8,000,000 | ||||||||||||
Bank of Montreal (3 Month LIBOR +0.06%)± | 2.50 | 3-12-2020 | 4,000,000 | 4,000,000 | ||||||||||||
Bank of Montreal (1 Month LIBOR +0.18%)± | 2.57 | 4-3-2020 | 8,000,000 | 8,000,000 | ||||||||||||
Bank of Montreal (1 Month LIBOR +0.22%)± | 2.58 | 10-4-2019 | 3,000,000 | 3,000,000 | ||||||||||||
Bank of Montreal (1 Month LIBOR +0.18%)± | 2.58 | 5-1-2020 | 2,000,000 | 2,000,000 | ||||||||||||
Bank of Montreal (3 Month LIBOR +0.22%)± | 2.67 | 12-10-2019 | 5,000,000 | 5,000,000 | ||||||||||||
Bank of Nova Scotia (1 Month LIBOR +0.14%)± | 2.38 | 1-27-2020 | 4,000,000 | 4,000,000 | ||||||||||||
Bank of Nova Scotia (3 Month LIBOR +0.05%)± | 2.38 | 4-3-2020 | 7,000,000 | 7,000,000 | ||||||||||||
Bank of Nova Scotia (3 Month LIBOR +0.10%)± | 2.51 | 9-16-2019 | 2,000,000 | 2,000,000 | ||||||||||||
Bank of Nova Scotia (1 Month LIBOR +0.20%)± | 2.53 | 8-14-2019 | 3,000,000 | 3,000,000 | ||||||||||||
Canadian Imperial Bank (1 Month LIBOR +0.18%)± | 2.54 | 4-6-2020 | 5,000,000 | 5,000,000 | ||||||||||||
Canadian Imperial Bank (3 Month LIBOR +0.19%)± | 2.46 | 1-30-2020 | 5,000,000 | 4,999,798 | ||||||||||||
Canadian Imperial Bank (1 Month LIBOR +0.18%)± | 2.54 | 5-4-2020 | 5,000,000 | 5,000,000 | ||||||||||||
Canadian Imperial Bank (1 Month LIBOR +0.18%)± | 2.58 | 5-1-2020 | 4,000,000 | 4,000,000 | ||||||||||||
China Construction Bank Corporation (3 Month LIBOR +0.10%)± | 2.38 | 1-24-2020 | 10,000,000 | 10,000,000 | ||||||||||||
Cooperatieve Rabobank UA (1 Month LIBOR +0.14%)± | 2.50 | 11-7-2019 | 6,000,000 | 6,000,000 | ||||||||||||
Cooperatieve Rabobank UA | 2.46 | 5-20-2020 | 6,000,000 | 6,000,000 | ||||||||||||
Credit Agricole Corporate & Investment Bank (3 Month LIBOR +0.08%) ± | 2.47 | 12-20-2019 | 5,000,000 | 5,000,000 | ||||||||||||
Credit Industriel et Commercial NY (1 Month LIBOR +0.22%)± | 2.49 | 4-24-2020 | 3,000,000 | 3,000,000 | ||||||||||||
Credit Suisse New York (1 Month LIBOR +0.22%)± | 2.58 | 12-9-2019 | 5,000,000 | 5,001,322 | ||||||||||||
DNB Bank ASA (1 Month LIBOR +0.10%)± | 2.47 | 9-9-2019 | 8,000,000 | 8,000,000 | ||||||||||||
DNB Bank ASA (3 Month LIBOR +0.22%)± | 2.77 | 2-10-2020 | 5,100,000 | 5,105,252 | ||||||||||||
HSBC Bank USA NA (3 Month LIBOR +0.13%)± | 2.69 | 8-9-2019 | 2,000,000 | 2,000,000 | ||||||||||||
Mizuho Bank Limited (1 Month LIBOR +0.16%)± | 2.40 | 8-27-2019 | 3,000,000 | 3,000,000 | ||||||||||||
Mizuho Bank Limited (1 Month LIBOR +0.14%)± | 2.50 | 11-8-2019 | 8,000,000 | 8,000,000 | ||||||||||||
Mizuho Bank Limited (1 Month LIBOR +0.16%)± | 2.53 | 9-12-2019 | 6,000,000 | 6,000,000 | ||||||||||||
Mizuho Bank Limited (1 Month LIBOR +0.15%)± | 2.45 | 11-18-2019 | 5,000,000 | 5,000,175 | ||||||||||||
MUFG Bank Limited of New York (3 Month LIBOR +0.18%)± | 2.70 | 2-27-2020 | 4,000,000 | 4,000,000 | ||||||||||||
MUFG Bank Limited of New York (3 Month LIBOR +0.14%)± | 2.70 | 5-11-2020 | 2,000,000 | 2,000,000 | ||||||||||||
Natixis NY (1 Month LIBOR +0.16%)± | 2.42 | 12-23-2019 | 4,000,000 | 4,000,000 | ||||||||||||
Norinchukin Bank | 2.20 | 2-4-2020 | 5,000,000 | 5,000,000 | ||||||||||||
Norinchukin Bank | 2.52 | 8-9-2019 | 3,000,000 | 3,000,000 | ||||||||||||
Norinchukin Bank | 2.54 | 8-1-2019 | 5,000,000 | 5,000,000 | ||||||||||||
Oversea-Chinese Banking Corporation Limited (1 Month LIBOR +0.10%) ± | 2.37 | 10-25-2019 | 5,000,000 | 5,000,000 | ||||||||||||
Oversea-Chinese Banking Corporation Limited (1 Month LIBOR +0.20%) ± | 2.50 | 9-19-2019 | 2,000,000 | 2,000,000 | ||||||||||||
Skandinaviska Enskilda Bank AB (1 Month LIBOR +0.13%)± | 2.50 | 9-12-2019 | 6,000,000 | 6,000,000 | ||||||||||||
Sumitomo Mitsui Banking Corporation (1 Month LIBOR +0.14%)± | 2.50 | 11-5-2019 | 9,000,000 | 9,000,000 | ||||||||||||
Sumitomo Mitsui Trust Bank Limited (1 Month LIBOR +0.12%)± | 2.38 | 10-23-2019 | 4,000,000 | 4,000,000 | ||||||||||||
Sumitomo Mitsui Trust NY | 2.25 | 1-9-2020 | 6,000,000 | 5,999,994 | ||||||||||||
Sumitomo Mitsui Trust NY | 2.25 | 1-13-2020 | 3,000,000 | 2,999,992 | ||||||||||||
Svenska Handelsbanken (3 Month LIBOR +0.27%)± | 2.55 | 10-21-2019 | 5,000,000 | 5,000,725 | ||||||||||||
Svenska Handelsbanken (3 Month LIBOR +0.15%)± | 2.47 | 10-2-2019 | 7,000,000 | 7,000,000 | ||||||||||||
Svenska Handelsbanken (1 Month LIBOR +0.22%)± | 2.48 | 7-22-2020 | 7,000,000 | 7,000,000 | ||||||||||||
Total Certificates of Deposit (Cost $222,107,258) | 222,107,258 | |||||||||||||||
|
| |||||||||||||||
The accompanying notes are an integral part of these financial statements.
Retail Money Market Funds | 7
Table of Contents
Portfolio of investments—July 31, 2019 (unaudited)
Interest rate | Maturity date | Principal | Value | |||||||||||||
Commercial Paper: 43.38% |
| |||||||||||||||
| Asset-Backed Commercial Paper: 26.05% | ||||||||||||||||
Albion Capital Corporation (z) | 2.30 | % | 9-30-2019 | $ | 3,000,000 | $ | 2,988,550 | |||||||||
Alpine Securitization (1 Month LIBOR +0.15%) 144A± | 2.55 | 3-2-2020 | 6,000,000 | 6,000,000 | ||||||||||||
Anglesea Funding LLC (1 Month LIBOR +0.18%) 144A± | 2.48 | 10-15-2019 | 2,000,000 | 2,000,000 | ||||||||||||
Anglesea Funding LLC (1 Month LIBOR +0.18%) 144A± | 2.51 | 10-11-2019 | 8,000,000 | 8,000,000 | ||||||||||||
Anglesea Funding LLC (1 Month LIBOR +0.17%) 144A± | 2.43 | 12-23-2019 | 8,000,000 | 8,000,000 | ||||||||||||
Anglesea Funding LLC (1 Month LIBOR +0.18%) 144A± | 2.58 | 12-27-2019 | 6,000,000 | 6,000,000 | ||||||||||||
Antalis SA 144A(z) | 2.37 | 10-2-2019 | 3,000,000 | 2,987,807 | ||||||||||||
Antalis US Funding Corporation 144A(z) | 2.44 | 8-20-2019 | 6,000,000 | 5,992,305 | ||||||||||||
ANZ New Zealand International Limited of London (1 Month LIBOR +0.13%) 144A± | 2.46 | 8-13-2019 | 8,000,000 | 8,000,127 | ||||||||||||
Atlantic Asset Securitization Corporation (1 Month LIBOR +0.12%) 144A± | 2.39 | 8-21-2019 | 6,000,000 | 6,000,006 | ||||||||||||
Bedford Row Funding Corporation (1 Month LIBOR +0.16%) 144A± | 2.49 | 8-13-2019 | 10,000,000 | 10,000,280 | ||||||||||||
Bedford Row Funding Corporation (1 Month LIBOR +0.24%) 144A± | 2.50 | 7-20-2020 | 5,000,000 | 5,000,000 | ||||||||||||
Bedford Row Funding Corporation (1 Month LIBOR +0.15%) 144A± | 2.54 | 2-3-2020 | 2,000,000 | 2,000,000 | ||||||||||||
Chesham Finance Limited 144A(z) | 2.50 | 8-1-2019 | 9,000,000 | 9,000,000 | ||||||||||||
Collateralized Commercial Paper FLEX Company LLC (1 Month LIBOR +0.20%) 144A± | 2.46 | 6-23-2020 | 5,000,000 | 5,000,000 | ||||||||||||
Collateralized Commercial Paper II Company LLC (3 Month LIBOR +0.27%) 144A± | 2.57 | 1-8-2020 | 5,000,000 | 5,000,000 | ||||||||||||
Collateralized Commercial Paper II Company LLC (3 Month LIBOR +0.26%) 144A± | 2.59 | 12-31-2019 | 3,000,000 | 3,000,000 | ||||||||||||
Concord Minutemen Capital Company 144A(z) | 2.43 | 8-2-2019 | 2,000,000 | 1,999,865 | ||||||||||||
Concord Minutemen Capital Company 144A(z) | 2.70 | 8-1-2019 | 2,000,000 | 2,000,000 | ||||||||||||
Crown Point Capital Company LLC (1 Month LIBOR +0.18%) 144A± | 2.56 | 1-6-2020 | 8,000,000 | 8,000,000 | ||||||||||||
Crown Point Capital Company LLC (1 Month LIBOR +0.20%) 144A± | 2.56 | 11-4-2019 | 9,000,000 | 9,000,000 | ||||||||||||
Glencove Funding LLC (1 Month LIBOR +0.18%) 144A± | 2.49 | 2-11-2020 | 6,000,000 | 6,000,000 | ||||||||||||
Great Bridge Capital Company LLC 144A(z) | 2.58 | 8-16-2019 | 4,000,000 | 3,995,717 | ||||||||||||
Great Bridge Capital Company LLC 144A(z) | 2.47 | 10-3-2019 | 3,000,000 | 2,987,085 | ||||||||||||
Great Bridge Capital Company LLC 144A(z) | 2.48 | 10-8-2019 | 3,000,000 | 2,986,060 | ||||||||||||
Great Bridge Capital Company LLC 144A(z) | 2.48 | 10-10-2019 | 1,000,000 | 995,217 | ||||||||||||
Great Bridge Capital Company LLC 144A(z) | 2.48 | 9-4-2019 | 3,000,000 | 2,993,002 | ||||||||||||
Great Bridge Capital Company LLC 144A(z) | 2.51 | 8-19-2019 | 1,150,000 | 1,148,563 | ||||||||||||
Great Bridge Capital Company LLC 144A(z) | 2.70 | 8-1-2019 | 4,000,000 | 4,000,000 | ||||||||||||
Institutional Secured Funding LLC 144A(z) | 2.54 | 8-1-2019 | 12,000,000 | 12,000,000 | ||||||||||||
Institutional Secured Funding LLC 144A(z) | 2.54 | 8-2-2019 | 12,000,000 | 11,999,153 | ||||||||||||
Kells Funding LLC 144A(z) | 2.39 | 9-11-2019 | 8,000,000 | 7,978,316 | ||||||||||||
Kells Funding LLC 144A(z) | 2.52 | 8-19-2019 | 8,000,000 | 7,990,000 | ||||||||||||
Kells Funding LLC 144A(z) | 2.55 | 8-7-2019 | 2,000,000 | 1,999,157 | ||||||||||||
Kells Funding LLC 144A(z) | 2.61 | 9-19-2019 | 5,000,000 | 4,982,476 | ||||||||||||
Lexington Parker Capital Company LLC 144A(z) | 2.57 | 8-7-2019 | 1,850,000 | 1,849,214 | ||||||||||||
LMA Americas LLC 144A(z) | 2.20 | 1-27-2020 | 2,000,000 | 1,978,421 | ||||||||||||
LMA Americas LLC 144A(z) | 2.20 | 1-28-2020 | 2,000,000 | 1,978,300 | ||||||||||||
Manhattan Asset Funding Company LLC 144A(z) | 2.35 | 8-19-2019 | 6,000,000 | 5,992,950 | ||||||||||||
Manhattan Asset Funding Company LLC 144A(z) | 2.40 | 9-13-2019 | 4,000,000 | 3,988,581 | ||||||||||||
Mountcliff Funding LLC (1 Month LIBOR +0.20%) 144A± | 2.43 | 4-24-2020 | 10,000,000 | 10,000,000 | ||||||||||||
Mountcliff Funding LLC 144A(z) | 2.48 | 8-1-2019 | 12,000,000 | 12,000,000 | ||||||||||||
Nieuw Amsterdam Receivables Corporation 144A(z) | 2.22 | 1-9-2020 | 1,000,000 | 990,161 | ||||||||||||
Regency Markets No.1 LLC 144A(z) | 2.35 | 8-19-2019 | 6,000,000 | 5,992,950 | ||||||||||||
Regency Markets No.1 LLC 144A(z) | 2.42 | 8-14-2019 | 10,000,000 | 9,991,261 | ||||||||||||
The accompanying notes are an integral part of these financial statements.
8 | Retail Money Market Funds
Table of Contents
Portfolio of investments—July 31, 2019 (unaudited)
Interest rate | Maturity date | Principal | Value | |||||||||||||
| Asset-Backed Commercial Paper (continued) | ||||||||||||||||
Regency Markets No.1 LLC 144A(z) | 2.43 | % | 8-15-2019 | $ | 7,000,000 | $ | 6,993,412 | |||||||||
Versailles CDS LLC (1 Month LIBOR +0.20%) 144A± | 2.47 | 9-20-2019 | 4,000,000 | 4,000,000 | ||||||||||||
Victory Receivables 144A(z) | 2.45 | 8-6-2019 | 5,000,000 | 4,998,305 | ||||||||||||
White Plains Capital 144A(z) | 2.64 | 9-4-2019 | 4,000,000 | 3,990,102 | ||||||||||||
| 262,767,343 | ||||||||||||||||
|
| |||||||||||||||
| Financial Company Commercial Paper: 13.13% | ||||||||||||||||
Banco de Credito e Inversiones 144A(z) | 2.44 | 9-23-2019 | 3,000,000 | 2,989,268 | ||||||||||||
Banco de Credito e Inversiones 144A(z) | 2.44 | 9-24-2019 | 1,000,000 | 996,355 | ||||||||||||
Banco de Credito e Inversiones 144A(z) | 2.52 | 10-8-2019 | 3,000,000 | 2,985,833 | ||||||||||||
Banco de Credito e Inversiones 144A(z) | 2.54 | 10-2-2019 | 10,000,000 | 9,956,600 | ||||||||||||
Banco de Credito e Inversiones 144A(z) | 2.57 | 9-25-2019 | 5,000,000 | 4,980,521 | ||||||||||||
Banco Santander Chile 144A(z) | 2.53 | 8-23-2019 | 3,000,000 | 2,995,380 | ||||||||||||
Commonwealth Bank of Australia (1 Month LIBOR +0.17%) 144A± | 2.57 | 4-2-2020 | 5,000,000 | 5,000,000 | ||||||||||||
Commonwealth Bank of Australia (1 Month LIBOR +0.21%) 144A± | 2.54 | 9-16-2019 | 2,000,000 | 2,000,000 | ||||||||||||
Commonwealth Bank of Australia (3 Month LIBOR +0.45%) 144A± | 2.90 | 3-10-2020 | 2,000,000 | 2,004,916 | ||||||||||||
Commonwealth Bank of Australia (3 Month LIBOR +0.60%) 144A± | 3.02 | 12-19-2019 | 4,000,000 | 4,005,065 | ||||||||||||
DBS Bank Limited 144A(z) | 2.27 | 12-3-2019 | 5,000,000 | 4,961,250 | ||||||||||||
DBS Bank Limited 144A(z) | 2.27 | 2-28-2020 | 3,000,000 | 2,960,613 | ||||||||||||
DBS Bank Limited 144A(z) | 2.30 | 11-22-2019 | 7,000,000 | 6,949,903 | ||||||||||||
DZ Bank AG Deutsche Zentral-Genossenschaftsbank (z) | 2.36 | 10-29-2019 | 3,000,000 | 2,982,602 | ||||||||||||
Mizuho Bank Limited | 2.43 | 9-11-2019 | 2,000,000 | 1,994,499 | ||||||||||||
MUFG Bank Limited of New York (z) | 2.28 | 3-6-2020 | 2,975,000 | 2,934,646 | ||||||||||||
National Australia Bank Limited (1 Month LIBOR +0.16%) 144A± | 2.46 | 5-19-2020 | 2,000,000 | 2,000,000 | ||||||||||||
National Australia Bank Limited (1 Month LIBOR +0.13%) 144A± | 2.49 | 2-7-2020 | 4,000,000 | 4,000,000 | ||||||||||||
National Australia Bank Limited (1 Month LIBOR +0.20%) 144A± | 2.60 | 8-2-2019 | 3,000,000 | 3,000,000 | ||||||||||||
Oesterreichische National Bank (z) | 2.23 | 1-10-2020 | 5,000,000 | 4,950,500 | ||||||||||||
Ontario Teachers Finance Trust 144A(z) | 2.10 | 3-12-2020 | 7,000,000 | 6,909,840 | ||||||||||||
Ontario Teachers Finance Trust 144A(z) | 2.20 | 3-6-2020 | 3,000,000 | 2,960,578 | ||||||||||||
Oversea-Chinese Banking Corporation Limited (3 Month LIBOR +0.03%) 144A± | 2.50 | 12-6-2019 | 5,000,000 | 5,000,000 | ||||||||||||
Oversea-Chinese Banking Corporation Limited (3 Month LIBOR +0.04%) 144A± | 2.56 | 2-18-2020 | 3,000,000 | 3,000,000 | ||||||||||||
Sumitomo Mitsui Trust Bank Limited 144A(z) | 2.37 | 10-18-2019 | 6,000,000 | 5,969,450 | ||||||||||||
Sumitomo Mitsui Trust Bank Limited 144A(z) | 2.40 | 9-30-2019 | 10,000,000 | 9,960,333 | ||||||||||||
Toronto Dominion Bank 144A(z) | 2.28 | 8-7-2019 | 5,000,000 | 4,998,100 | ||||||||||||
Toronto Dominion Bank (3 Month LIBOR +0.08%)± | 2.60 | 8-16-2019 | 3,000,000 | 3,000,000 | ||||||||||||
Toronto Dominion Bank (3 Month LIBOR +0.21%) 144A± | 2.68 | 12-6-2019 | 5,000,000 | 5,000,000 | ||||||||||||
Toronto Dominion Bank (1 Month LIBOR +0.37%) 144A± | 2.73 | 11-7-2019 | 3,000,000 | 3,000,000 | ||||||||||||
Westpac Banking Corporation (1 Month LIBOR +0.21%) 144A± | 2.51 | 9-19-2019 | 4,000,000 | 3,999,965 | ||||||||||||
Westpac Banking Corporation (3 Month LIBOR +0.07%) 144A± | 2.65 | 8-2-2019 | 4,000,000 | 4,000,000 | ||||||||||||
| 132,446,217 | ||||||||||||||||
|
| |||||||||||||||
| Other Commercial Paper: 4.20% | ||||||||||||||||
Export Development Corporation (z) | 2.29 | 12-17-2019 | 6,000,000 | 5,948,020 | ||||||||||||
Salt River Project Agricultural Improvement & Power District Subordinated Series D1 (z) | 2.34 | 9-23-2019 | 5,000,000 | 4,982,849 | ||||||||||||
Salt River Project Agricultural Improvement & Power District Subordinated Series D1 (z) | 2.35 | 9-19-2019 | 6,500,000 | 6,479,298 | ||||||||||||
Salt River Project Agricultural Improvement & Power District Subordinated Series D1 (z) | 2.46 | 8-14-2019 | 5,000,000 | 4,995,576 | ||||||||||||
The accompanying notes are an integral part of these financial statements.
Retail Money Market Funds | 9
Table of Contents
Portfolio of investments—July 31, 2019 (unaudited)
Interest rate | Maturity date | Principal | Value | |||||||||||||
| Other Commercial Paper (continued) | ||||||||||||||||
Toyota Credit Canada Incorporated (1 Month LIBOR +0.17%)± | 2.57 | % | 1-27-2020 | $ | 6,000,000 | $ | 6,000,000 | |||||||||
Toyota Finance Australia Limited (1 Month LIBOR +0.17%)± | 2.50 | 12-6-2019 | 4,000,000 | 4,000,000 | ||||||||||||
Toyota Motor Credit Corporation (z) | 2.38 | 11-18-2019 | 6,000,000 | 5,957,127 | ||||||||||||
Toyota Motor Credit Corporation (1 Month LIBOR +0.16%)± | 2.52 | 2-27-2020 | 4,000,000 | 4,000,000 | ||||||||||||
| 42,362,870 | ||||||||||||||||
|
| |||||||||||||||
Total Commercial Paper (Cost $437,576,430) |
| 437,576,430 | ||||||||||||||
|
| |||||||||||||||
Municipal Obligations: 11.54% |
| |||||||||||||||
California: 0.70% |
| |||||||||||||||
| Other Municipal Debt: 0.70% | ||||||||||||||||
Los Angeles Metro Transportation (Transportation Revenue) | 2.35 | 9-23-2019 | 2,000,000 | 2,000,000 | ||||||||||||
State of California (GO Revenue) | 2.48 | 8-12-2019 | 5,000,000 | 5,000,000 | ||||||||||||
| 7,000,000 | ||||||||||||||||
|
| |||||||||||||||
Colorado: 2.07% |
| |||||||||||||||
| Variable Rate Demand Notes ø: 2.07% | ||||||||||||||||
Colorado HFA MFHR Class II Series B (Housing Revenue, FHLB SPA) | 2.47 | 5-1-2052 | 3,895,000 | 3,895,000 | ||||||||||||
Colorado Southern Ute Indian Tribe Reservation Series 2007 (Miscellaneous Revenue) | 2.47 | 1-1-2027 | 5,450,000 | 5,450,000 | ||||||||||||
Colorado Tender Option Bond Trust Receipts/Certificates Series 2017-TPG007 (Health Revenue, Bank of America NA LIQ) 144A | 2.76 | 10-29-2027 | 11,500,000 | 11,500,000 | ||||||||||||
| 20,845,000 | ||||||||||||||||
|
| |||||||||||||||
Georgia: 0.99% |
| |||||||||||||||
| Other Municipal Debt: 0.50% | ||||||||||||||||
Municipal Electric Authority of Georgia (Utility Revenue) | 2.45 | 8-15-2019 | 5,000,000 | 5,000,000 | ||||||||||||
|
| |||||||||||||||
| Variable Rate Demand Note ø: 0.49% | ||||||||||||||||
Macon-Bibb County GA Industrial Authority Kumho Tire Georgia Incorporated Series A (Industrial Development Revenue, Korea Development Bank LOC) | 2.50 | 12-1-2022 | 5,000,000 | 5,000,000 | ||||||||||||
|
| |||||||||||||||
Kentucky: 1.18% |
| |||||||||||||||
| Variable Rate Demand Notes ø: 1.18% | ||||||||||||||||
Kentucky Housing Corporation Series O (Housing Revenue, Kentucky Housing Corporation SPA) | 2.20 | 1-1-2036 | 3,930,000 | 3,930,000 | ||||||||||||
Kentucky Municipal Power Agency Series B002 (Utilities Revenue, AGM Insured, Morgan Stanley Bank LIQ) 144A | 2.38 | 9-1-2037 | 8,000,000 | 8,000,000 | ||||||||||||
| 11,930,000 | ||||||||||||||||
|
| |||||||||||||||
New Hampshire: 0.50% |
| |||||||||||||||
| Variable Rate Demand Note ø: 0.50% | ||||||||||||||||
New Hampshire Business Finance Authority CJ Foods Manufacturing Beaumont Corporation Series A (Industrial Development Revenue, Kookmin Bank LOC) 144A | 2.51 | 10-1-2028 | 5,000,000 | 5,000,000 | ||||||||||||
|
| |||||||||||||||
New Jersey: 0.69% |
| |||||||||||||||
| Variable Rate Demand Note ø: 0.69% | ||||||||||||||||
Jets Stadium Development SeriesA-4B (Miscellaneous Revenue, Sumitomo Mitsui Banking Corporation LOC) 144A | 2.40 | 4-1-2047 | 6,930,000 | 6,930,000 | ||||||||||||
|
| |||||||||||||||
The accompanying notes are an integral part of these financial statements.
10 | Retail Money Market Funds
Table of Contents
Portfolio of investments—July 31, 2019 (unaudited)
Interest rate | Maturity date | Principal | Value | |||||||||||||
New York: 1.34% |
| |||||||||||||||
| Variable Rate Demand Notes ø: 1.34% | ||||||||||||||||
New York HFA Manhattan West Residential Housing Project SeriesB-2 (Housing Revenue, Bank of China LOC) | 2.32 | % | 11-1-2049 | $ | 12,000,000 | $ | 12,000,000 | |||||||||
New York HFA Manhattan West Residential Housing Project SeriesB-2 (Housing Revenue, Bank of China LOC) | 2.43 | 11-1-2049 | 1,500,000 | 1,500,000 | ||||||||||||
| 13,500,000 | ||||||||||||||||
|
| |||||||||||||||
Oregon: 0.69% |
| |||||||||||||||
| Variable Rate Demand Note ø: 0.69% | ||||||||||||||||
Oregon Tender Option Bond Trust Receipts/Certificates Series ZF2515 (Miscellaneous Revenue, Bank of America NA LIQ) 144A | 2.45 | 5-1-2035 | 7,000,000 | 7,000,000 | ||||||||||||
|
| |||||||||||||||
Other: 3.38% |
| |||||||||||||||
| Variable Rate Demand Notes ø: 3.38% | ||||||||||||||||
Columbus GA Housing Development Authority Puttable Floating Option Taxable Notes SeriesTN-024 (Housing Revenue, ACA Insured, Bank of America NA LIQ) 144A | 2.56 | 10-1-2039 | 4,595,000 | 4,595,000 | ||||||||||||
JPMorgan Chase PUTTER/DRIVER Trust Series T0024 Halifax Hospital Medical Center (Health Revenue, JPMorgan Chase & Company LOC, JPMorgan Chase & Company LIQ) 144A | 2.50 | 10-31-2021 | 10,000,000 | 10,000,000 | ||||||||||||
Providence St. Joseph Health Obligation Series 12E (Health Revenue, U.S. Bank NA LOC) | 2.38 | 10-1-2042 | 3,285,000 | 3,285,000 | ||||||||||||
SSAB AB Series A (Miscellaneous Revenue, DNB Banking ASA LOC) | 2.43 | 6-1-2035 | 1,000,000 | 1,000,000 | ||||||||||||
Steadfast Crestavilla LLC Series A (Health Revenue, American AgCredit LOC) | 2.44 | 2-1-2056 | 4,240,000 | 4,240,000 | ||||||||||||
Steadfast Crestavilla LLC Series B (Health Revenue, U.S. Bank NA LOC) | 2.44 | 2-1-2056 | 3,000,000 | 3,000,000 | ||||||||||||
Taxable Municipal Funding Trust (GO Revenue, Barclays Bank plc LOC) 144A | 2.61 | 9-1-2027 | 8,000,000 | 8,000,000 | ||||||||||||
| 34,120,000 | ||||||||||||||||
|
| |||||||||||||||
Total Municipal Obligations (Cost $116,325,000) |
| 116,325,000 | ||||||||||||||
|
| |||||||||||||||
Non-Agency Mortgage-Backed Securities: 0.30% |
| |||||||||||||||
Pepper Residential Securities Trust Series 20A Class A1U2 (1 Month LIBOR +0.32%) 144A± | 2.65 | 3-16-2020 | 3,000,000 | 3,000,000 | ||||||||||||
|
| |||||||||||||||
TotalNon-Agency Mortgage-Backed Securities (Cost $3,000,000) |
| 3,000,000 | ||||||||||||||
|
| |||||||||||||||
Other Instruments: 3.17% |
| |||||||||||||||
Altoona Blair County Development Corporation 144A§øø | 2.39 | 4-1-2035 | 5,850,000 | 5,850,000 | ||||||||||||
Altoona Blair County Development Corporation 144A§øø | 2.39 | 9-1-2038 | 3,000,000 | 3,000,000 | ||||||||||||
Invesco Dynamic Credit Opportunities Fund SeriesW-7 §øø | 2.50 | 6-1-2028 | 5,000,000 | 5,000,000 | ||||||||||||
Mitsubishi UFJ Trust and Banking Corporation 144A§øø | 2.45 | 10-16-2019 | 4,000,000 | 3,997,682 | ||||||||||||
Opus Inspection Incorporated §øø | 2.57 | 1-1-2034 | 6,000,000 | 6,000,000 | ||||||||||||
ROC III CA Crossings Chino Hills Series B §øø | 2.44 | 1-1-2057 | 2,440,000 | 2,440,000 | ||||||||||||
ROC III California Crossings Chino Hills LLC Series A §øø | 2.44 | 1-1-2057 | 1,660,000 | 1,660,000 | ||||||||||||
Toyota Motor Credit Corporation §øø | 2.59 | 5-22-2020 | 4,000,000 | 4,000,000 | ||||||||||||
Total Other Instruments (Cost $31,947,682) |
| 31,947,682 | ||||||||||||||
|
| |||||||||||||||
Other Notes: 1.12% |
| |||||||||||||||
| Corporate Bonds and Notes: 0.99% | ||||||||||||||||
Cellmark Incorporated Secured §øø | 2.57 | 6-1-2038 | 10,000,000 | 10,000,000 | ||||||||||||
| 10,000,000 | ||||||||||||||||
|
| |||||||||||||||
The accompanying notes are an integral part of these financial statements.
Retail Money Market Funds | 11
Table of Contents
Portfolio of investments—July 31, 2019 (unaudited)
Interest rate | Maturity date | Principal | Value | |||||||||||||
| Yankee Corporate Bonds and Notes: 0.13% | ||||||||||||||||
MUFG Bank Limitied of Tokyo 144A | 2.35 | % | 9-8-2019 | $ | 1,300,000 | $ | 1,299,368 | |||||||||
| 1,299,368 | ||||||||||||||||
|
| |||||||||||||||
Total Other Notes (Cost $11,299,368) |
| 11,299,368 | ||||||||||||||
|
| |||||||||||||||
Repurchase Agreements: 17.75% |
| |||||||||||||||
Bank of America Corporation, dated7-31-2019, maturity value $38,052,706 (1) | 2.56 | 8-1-2019 | 38,050,000 | 38,050,000 | ||||||||||||
Bank of Montreal, dated7-31-2019, maturity value $35,002,479 (2) | 2.55 | 8-1-2019 | 35,000,000 | 35,000,000 | ||||||||||||
Bank of Nova Scotia, dated7-31-2019, maturity value $35,002,469 (3) | 2.54 | 8-1-2019 | 35,000,000 | 35,000,000 | ||||||||||||
Credit Agricole SA, dated7-29-2019, maturity value $15,006,767 (4) | 2.32 | 8-5-2019 | 15,000,000 | 15,000,000 | ||||||||||||
Credit Agricole SA, dated7-30-2019, maturity value $10,004,433 (5) | 2.28 | 8-6-2019 | 10,000,000 | 10,000,000 | ||||||||||||
GX Clarke & Company, dated7-31-2019, maturity value $46,003,297 (6) | 2.58 | 8-1-2019 | 46,000,000 | 46,000,000 | ||||||||||||
Total Repurchase Agreements (Cost $179,050,000) |
| 179,050,000 | ||||||||||||||
|
| |||||||||||||||
| Total investments in securities (Cost $1,001,305,738) | 99.29 | % | 1,001,305,738 | |||||
Other assets and liabilities, net | 0.71 | 7,148,153 | ||||||
|
|
|
| |||||
| Total net assets | 100.00 | % | $ | 1,008,453,891 | ||||
|
|
|
| |||||
| ± | Variable rate investment. The rate shown is the rate in effect at period end. |
| (z) | Zero coupon security. The rate represents the current yield to maturity. |
| 144A | The security may be resold in transactions exempt from registration, normally to qualified institutional buyers, pursuant to Rule 144A under the Securities Act of 1933. |
| ø | Variable rate demand notes are subject to a demand feature which reduces the effective maturity. The maturity date shown represents the final maturity date of the security. The interest rate is determined and reset by the issuer daily, weekly, or monthly depending upon the terms of the security. The rate shown is the rate in effect at period end. |
| § | The security is subject to a demand feature which reduces the effective maturity. |
| øø | The interest rate is determined and reset by the issuer periodically depending upon the terms of the security. The rate shown is the rate in effect at period end. |
| ^^ | Collateralized by: |
| (1) | U.S. government securities, 3.00% to 3.50%,3-20-2045 to1-20-2047, fair value including accrued interest is $39,191,500. |
| (2) | U.S. government securities, 2.19% to 5.00%,3-10-2023 to10-20-2068, fair value including accrued interest is $36,049,909. |
| (3) | U.S. government securities, 2.40% to 6.50%,11-1-2020 to8-1-2049, fair value including accrued interest is $36,050,000. |
| (4) | U.S. government securities, 2.50% to 6.00%,1-1-2027 to6-20-2049, fair value including accrued interest is $15,450,000. |
| (5) | U.S. government securities, 3.00% to 5.00%,3-15-2038 to3-20-2049, fair value including accrued interest is $10,300,000. |
| (6) | U.S. government securities, 0.00% to 10.00%,8-2-2019 to5-20-2069, fair value including accrued interest is $47,201,556. |
Abbreviations:
| ACA | ACA Financial Guaranty Corporation |
| AGM | Assured Guaranty Municipal |
| DRIVER | Derivative inversetax-exempt receipts |
| FHLB | Federal Home Loan Bank |
| HFA | Housing Finance Authority |
| LIBOR | London Interbank Offered Rate |
| LIQ | Liquidity agreement |
| LOC | Letter of credit |
| MFHR | Multifamily housing revenue |
| PUTTER | Puttabletax-exempt receipts |
| ROC | Reset option certificates |
| SPA | Standby purchase agreement |
The accompanying notes are an integral part of these financial statements.
12 | Retail Money Market Funds
Table of Contents
Statement of assets and liabilities—July 31, 2019 (unaudited)
Assets | ||||
Investments in unaffiliated securities, at amortized cost | $ | 822,255,738 | ||
Investments in repurchase agreements, at amortized cost | 179,050,000 | |||
Cash | 35,056 | |||
Receivable for Fund shares sold | 4,114,311 | |||
Receivable for investments sold | 3,010,926 | |||
Receivable for interest | 1,466,683 | |||
Prepaid expenses and other assets | 142,014 | |||
|
| |||
Total assets | 1,010,074,728 | |||
|
| |||
Liabilities | ||||
Payable for Fund shares redeemed | 1,208,234 | |||
Administration fees payable | 125,340 | |||
Management fee payable | 78,728 | |||
Dividends payable | 27,920 | |||
Trustees’ fees and expenses payable | 2,302 | |||
Distribution fee payable | 2,198 | |||
Accrued expenses and other liabilities | 176,115 | |||
|
| |||
Total liabilities | 1,620,837 | |||
|
| |||
Total net assets | $ | 1,008,453,891 | ||
|
| |||
Net assets consist of | ||||
Paid-in capital | $ | 1,008,788,009 | ||
Total distributable loss | (334,118 | ) | ||
|
| |||
Total net assets | $ | 1,008,453,891 | ||
|
| |||
Computation of net asset value per share | ||||
Net assets – Class A | $ | 482,746,190 | ||
Shares outstanding – Class A1 | 482,580,807 | |||
Net asset value per share – Class A | $1.00 | |||
Net assets – Class C | $ | 3,337,525 | ||
Shares outstanding – Class C1 | 3,336,362 | |||
Net asset value per share – Class C | $1.00 | |||
Net assets – Premier Class | $ | 510,370,739 | ||
Shares outstanding – Premier Class1 | 510,201,283 | |||
Net asset value per share – Premier Class | $1.00 | |||
Net assets – Service Class | $ | 11,999,437 | ||
Shares outstanding – Service Class1 | 11,995,345 | |||
Net asset value per share – Service Class | $1.00 | |||
| 1 | The Fund has an unlimited number of authorized shares. |
The accompanying notes are an integral part of these financial statements.
Retail Money Market Funds | 13
Table of Contents
Statement of operations—six months ended July 31, 2019 (unaudited)
Investment income | ||||
Interest | $ | 11,857,936 | ||
Expenses | ||||
Management fee | 907,658 | |||
Administration fees | ||||
Class A | 521,456 | |||
Class C | 4,527 | |||
Premier Class | 167,086 | |||
Service Class | 7,066 | |||
Shareholder servicing fees | ||||
Class A | 592,564 | |||
Class C | 5,144 | |||
Service Class | 14,721 | |||
Distribution fee | ||||
Class C | 15,417 | |||
Custody and accounting fees | 12,992 | |||
Professional fees | 25,230 | |||
Registration fees | 99,355 | |||
Shareholder report expenses | 272 | |||
Trustees’ fees and expenses | 14,323 | |||
Other fees and expenses | 2,208 | |||
|
| |||
Total expenses | 2,390,019 | |||
Less: Fee waivers and/or expense reimbursements | (492,932 | ) | ||
|
| |||
Net expenses | 1,897,087 | |||
|
| |||
Net investment income | 9,960,849 | |||
Net realized gains on investments | 784 | |||
|
| |||
Net increase in net assets resulting from operations | $ | 9,961,633 | ||
|
| |||
The accompanying notes are an integral part of these financial statements.
14 | Retail Money Market Funds
Table of Contents
Statement of changes in net assets
| Six months ended July 31, 2019 (unaudited) | Year ended January 31, 2019 | |||||||||||||||
Operations | ||||||||||||||||
Net investment income | $ | 9,960,849 | $ | 9,861,868 | ||||||||||||
Net realized gains on investments | 784 | 10,335 | ||||||||||||||
|
| |||||||||||||||
Net increase in net assets resulting from operations | 9,961,633 | 9,872,203 | ||||||||||||||
|
| |||||||||||||||
Distributions to shareholders from net investment income and net realized gains | ||||||||||||||||
Class A | (4,777,228 | ) | (7,460,070 | ) | ||||||||||||
Class C | (26,178 | ) | (63,691 | ) | ||||||||||||
Premier Class | (5,032,842 | ) | (2,133,009 | ) | ||||||||||||
Service Class | (124,563 | ) | (205,098 | ) | ||||||||||||
|
| |||||||||||||||
Total distributions to shareholders | (9,960,811 | ) | (9,861,868 | ) | ||||||||||||
|
| |||||||||||||||
Capital share transactions | Shares | Shares | ||||||||||||||
Proceeds from shares sold | ||||||||||||||||
Class A | 87,973,308 | 87,973,309 | 189,447,415 | 189,447,415 | ||||||||||||
Class C | 799,488 | 799,488 | 10,651,512 | 10,651,512 | ||||||||||||
Premier Class | 458,136,042 | 458,136,042 | 422,176,563 | 422,176,563 | ||||||||||||
Service Class | 757,512 | 757,512 | 2,334,760 | 2,334,760 | ||||||||||||
|
| |||||||||||||||
| 547,666,351 | 624,610,250 | |||||||||||||||
|
| |||||||||||||||
Reinvestment of distributions | ||||||||||||||||
Class A | 4,719,038 | 4,719,038 | 7,366,361 | 7,366,361 | ||||||||||||
Class C | 25,968 | 25,968 | 62,701 | 62,701 | ||||||||||||
Premier Class | 4,901,408 | 4,901,408 | 2,040,299 | 2,040,299 | ||||||||||||
Service Class | 121,393 | 121,393 | 198,869 | 198,869 | ||||||||||||
|
| |||||||||||||||
| 9,767,807 | 9,668,230 | |||||||||||||||
|
| |||||||||||||||
Payment for shares redeemed | ||||||||||||||||
Class A | (83,946,302 | ) | (83,946,302 | ) | (185,079,647 | ) | (185,079,647 | ) | ||||||||
Class C | (5,714,093 | ) | (5,714,093 | ) | (10,246,505 | ) | (10,246,505 | ) | ||||||||
Premier Class | (248,673,071 | ) | (248,673,071 | ) | (128,480,875 | ) | (128,480,875 | ) | ||||||||
Service Class | (762,523 | ) | (762,524 | ) | (2,556,663 | ) | (2,556,663 | ) | ||||||||
|
| |||||||||||||||
| (339,095,990 | ) | (326,363,690 | ) | |||||||||||||
|
| |||||||||||||||
Net increase in net assets resulting from capital share transactions | 218,338,168 | 307,914,790 | ||||||||||||||
|
| |||||||||||||||
Total increase in net assets | 218,338,990 | 307,925,125 | ||||||||||||||
|
| |||||||||||||||
Net assets | ||||||||||||||||
Beginning of period | 790,114,901 | 482,189,776 | ||||||||||||||
|
| |||||||||||||||
End of period | $ | 1,008,453,891 | $ | 790,114,901 | ||||||||||||
|
| |||||||||||||||
The accompanying notes are an integral part of these financial statements.
Retail Money Market Funds | 15
Table of Contents
(For a share outstanding throughout each period)
| Six months ended July 31, 2019 (unaudited) | Year ended January 31 | |||||||||||||||||||||||
| CLASS A | 2019 | 2018 | 2017 | 2016 | 2015 | |||||||||||||||||||
Net asset value, beginning of period | $1.00 | $1.00 | $1.00 | $1.00 | $1.00 | $1.00 | ||||||||||||||||||
Net investment income | 0.01 | 0.02 | 0.01 | 0.00 | 1 | 0.00 | 1 | 0.00 | 1 | |||||||||||||||
Net realized gains on investments | 0.00 | 1 | 0.00 | 1 | 0.00 | 1 | 0.00 | 1 | 0.00 | 1 | 0.00 | 1 | ||||||||||||
|
|
|
|
|
|
|
|
|
|
|
| |||||||||||||
Total from investment operations | 0.01 | 0.02 | 0.01 | 0.00 | 1 | 0.00 | 1 | 0.00 | 1 | |||||||||||||||
Distributions to shareholders from | ||||||||||||||||||||||||
Net investment income | (0.01 | ) | (0.02 | ) | (0.01 | ) | (0.00 | )1 | (0.00 | )1 | (0.00 | )1 | ||||||||||||
Net asset value, end of period | $1.00 | $1.00 | $1.00 | $1.00 | $1.00 | $1.00 | ||||||||||||||||||
Total return2 | 1.00 | % | 1.61 | % | 0.64 | % | 0.05 | % | 0.01 | % | 0.01 | % | ||||||||||||
Ratios to average net assets (annualized) | ||||||||||||||||||||||||
Gross expenses | 0.70 | % | 0.76 | % | 0.85 | % | 0.83 | % | 0.82 | % | 0.83 | % | ||||||||||||
Net expenses | 0.60 | % | 0.62 | % | 0.65 | % | 0.55 | % | 0.29 | % | 0.19 | % | ||||||||||||
Net investment income | 2.02 | % | 1.60 | % | 0.63 | % | 0.03 | % | 0.01 | % | 0.01 | % | ||||||||||||
Supplemental data | ||||||||||||||||||||||||
Net assets, end of period (000s omitted) | $482,746 | $474,040 | $462,416 | $539,989 | $1,205,785 | $876,562 | ||||||||||||||||||
| 1 | Amount is less than $0.005. |
| 2 | Returns for periods of less than one year are not annualized. |
The accompanying notes are an integral part of these financial statements.
16 | Retail Money Market Funds
Table of Contents
Financial highlights
(For a share outstanding throughout each period)
| Six months ended July 31, 2019 (unaudited) | Year ended January 31 | |||||||||||||||||||||||
| CLASS C | 2019 | 2018 | 2017 | 2016 | 2015 | |||||||||||||||||||
Net asset value, beginning of period | $1.00 | $1.00 | $1.00 | $1.00 | $1.00 | $1.00 | ||||||||||||||||||
Net investment income | 0.01 | 0.01 | 0.00 | 1 | 0.00 | 1 | 0.00 | 1 | 0.00 | 1 | ||||||||||||||
Net realized gains on investments | 0.00 | 1 | 0.00 | 1 | 0.00 | 1 | 0.00 | 1 | 0.00 | 1 | 0.00 | 1 | ||||||||||||
|
|
|
|
|
|
|
|
|
|
|
| |||||||||||||
Total from investment operations | 0.01 | 0.01 | 0.00 | 1 | 0.00 | 1 | 0.00 | 1 | 0.00 | 1 | ||||||||||||||
Distributions to shareholders from | ||||||||||||||||||||||||
Net investment income | (0.01 | ) | (0.01 | ) | (0.00 | )1 | (0.00 | )1 | (0.00 | )1 | (0.00 | )1 | ||||||||||||
Net asset value, end of period | $1.00 | $1.00 | $1.00 | $1.00 | $1.00 | $1.00 | ||||||||||||||||||
Total return2 | 0.63 | % | 0.84 | % | 0.04 | % | 0.01 | % | 0.01 | % | 0.01 | % | ||||||||||||
Ratios to average net assets (annualized) | ||||||||||||||||||||||||
Gross expenses | 1.45 | % | 1.51 | % | 1.60 | % | 1.58 | % | 1.57 | % | 1.58 | % | ||||||||||||
Net expenses | 1.35 | % | 1.37 | % | 1.23 | % | 0.60 | % | 0.29 | % | 0.19 | % | ||||||||||||
Net investment income | 1.27 | % | 0.87 | % | 0.03 | % | 0.01 | % | 0.01 | % | 0.01 | % | ||||||||||||
Supplemental data | ||||||||||||||||||||||||
Net assets, end of period (000s omitted) | $3,338 | $8,229 | $7,763 | $13,293 | $16,617 | $13,628 | ||||||||||||||||||
| 1 | Amount is less than $0.005. |
| 2 | Returns for periods of less than one year are not annualized. Total return calculations do not include any sales charges. |
The accompanying notes are an integral part of these financial statements.
Retail Money Market Funds | 17
Table of Contents
Financial highlights
(For a share outstanding throughout each period)
| Six months ended July 31, 2019 (unaudited) | Year ended January 31 | |||||||||||||||
| PREMIER CLASS | 2019 | 2018 | 2017¹ | |||||||||||||
Net asset value, beginning of period | $1.00 | $1.00 | $1.00 | $1.00 | ||||||||||||
Net investment income | 0.01 | 0.02 | 0.01 | 0.00 | 2 | |||||||||||
Net realized gains on investments | 0.00 | 2 | 0.00 | 2 | 0.00 | 2 | 0.00 | 2 | ||||||||
|
|
|
|
|
|
|
| |||||||||
Total from investment operations | 0.01 | 0.02 | 0.01 | 0.00 | 2 | |||||||||||
Distributions to shareholders from | ||||||||||||||||
Net investment income | (0.01 | ) | (0.02 | ) | (0.01 | ) | (0.00 | )2 | ||||||||
Net asset value, end of period | $1.00 | $1.00 | $1.00 | $1.00 | ||||||||||||
Total return3 | 1.20 | % | 2.03 | % | 1.08 | % | 0.36 | % | ||||||||
Ratios to average net assets (annualized) | ||||||||||||||||
Gross expenses | 0.31 | % | 0.33 | % | 0.45 | % | 0.45 | % | ||||||||
Net expenses | 0.20 | % | 0.20 | % | 0.20 | % | 0.20 | % | ||||||||
Net investment income | 2.41 | % | 2.26 | % | 1.08 | % | 0.43 | % | ||||||||
Supplemental data | ||||||||||||||||
Net assets, end of period (000s omitted) | $510,371 | $295,962 | $101 | $100 | ||||||||||||
| 1 | For the period from March 31, 2016 (commencement of class operations) to January 31, 2017 |
| 2 | Amount is less than $0.005. |
| 3 | Returns for periods of less than one year are not annualized. |
The accompanying notes are an integral part of these financial statements.
18 | Retail Money Market Funds
Table of Contents
Financial highlights
(For a share outstanding throughout each period)
| Six months ended July 31, 2019 (unaudited) | Year ended January 31 | |||||||||||||||||||||||
| SERVICE CLASS | 2019 | 2018 | 2017 | 2016 | 2015 | |||||||||||||||||||
Net asset value, beginning of period | $1.00 | $1.00 | $1.00 | $1.00 | $1.00 | $1.00 | ||||||||||||||||||
Net investment income | 0.01 | 0.02 | 0.01 | 0.00 | 1 | 0.00 | 1 | 0.00 | 1 | |||||||||||||||
Net realized gains on investments | 0.00 | 1 | 0.00 | 1 | 0.00 | 1 | 0.00 | 1 | 0.00 | 1 | 0.00 | 1 | ||||||||||||
|
|
|
|
|
|
|
|
|
|
|
| |||||||||||||
Total from investment operations | 0.01 | 0.02 | 0.01 | 0.00 | 1 | 0.00 | 1 | 0.00 | 1 | |||||||||||||||
Distributions to shareholders from | ||||||||||||||||||||||||
Net investment income | (0.01 | ) | (0.02 | ) | (0.01 | ) | (0.00 | )1 | (0.00 | )1 | (0.00 | )1 | ||||||||||||
Net asset value, end of period | $1.00 | $1.00 | $1.00 | $1.00 | $1.00 | $1.00 | ||||||||||||||||||
Total return2 | 1.05 | % | 1.72 | % | 0.79 | % | 0.11 | % | 0.01 | % | 0.01 | % | ||||||||||||
Ratios to average net assets (annualized) | ||||||||||||||||||||||||
Gross expenses | 0.60 | % | 0.66 | % | 0.74 | % | 0.72 | % | 0.72 | % | 0.73 | % | ||||||||||||
Net expenses | 0.50 | % | 0.50 | % | 0.50 | % | 0.50 | % | 0.28 | % | 0.19 | % | ||||||||||||
Net investment income | 2.12 | % | 1.71 | % | 0.74 | % | 0.05 | % | 0.01 | % | 0.01 | % | ||||||||||||
Supplemental data | ||||||||||||||||||||||||
Net assets, end of period (000s omitted) | $11,999 | $11,884 | $11,910 | $21,602 | $274,245 | $281,157 | ||||||||||||||||||
| 1 | Amount is less than $0.005. |
| 2 | Returns for periods of less than one year are not annualized. |
The accompanying notes are an integral part of these financial statements.
Retail Money Market Funds | 19
Table of Contents
Notes to financial statements (unaudited)
1. ORGANIZATION
Wells Fargo Funds Trust (the “Trust”), a Delaware statutory trust organized on March 10, 1999, is an open-end management investment company registered under the Investment Company Act of 1940, as amended (the “1940 Act”). As an investment company, the Trust follows the accounting and reporting guidance in Financial Accounting Standards Board (“FASB”) Accounting Standards Codification Topic 946, Financial Services – Investment Companies. These financial statements report on the Wells Fargo Money Market Fund (the “Fund”) which is a diversified series of the Trust.
2. SIGNIFICANT ACCOUNTING POLICIES
The following significant accounting policies, which are consistently followed in the preparation of the financial statements of the Fund, are in conformity with U.S. generally accepted accounting principles which require management to make estimates and assumptions that affect the reported amounts of assets and liabilities, disclosure of contingent assets and liabilities at the date of the financial statements, and the reported amounts of revenues and expenses during the reporting period. Actual results could differ from those estimates.
Securities valuation
As permitted under Rule 2a-7 of the 1940 Act, portfolio securities are valued at amortized cost, which approximates fair value. The amortized cost method involves valuing a security at its cost, plus accretion of discount or minus amortization of premium over the period until maturity.
Investments which are not valued using the method discussed above are valued at their fair value, as determined in good faith by the Board of Trustees of the Fund. The Board of Trustees has established a Valuation Committee comprised of the Trustees and has delegated to it the authority to take any actions regarding the valuation of portfolio securities that the Valuation Committee deems necessary or appropriate, including determining the fair value of portfolio securities, unless the determination has been delegated to the Wells Fargo Asset Management Pricing Committee at Wells Fargo Funds Management, LLC (“Funds Management”). The Board of Trustees retains the authority to make or ratify any valuation decisions or approve any changes to the Valuation Procedures as it deems appropriate. On a quarterly basis, the Board of Trustees receives reports on any valuation actions taken by the Valuation Committee or the Wells Fargo Asset Management Pricing Committee which may include items for ratification.
Repurchase agreements
The Fund may invest in repurchase agreements and may participate in pooled repurchase agreement transactions with other funds advised by Funds Management. Repurchase agreements are agreements where the seller of a security to the Fund agrees to repurchase that security from the Fund at a mutually agreed upon time and price. The repurchase agreements must be fully collateralized based on values that are marked-to-market daily. The collateral may be held by an agent bank under a tri-party agreement. It is the custodian’s responsibility to value collateral daily and to take action to obtain additional collateral as necessary to maintain a market value equal to or greater than the resale price. The repurchase agreements are collateralized by securities issued or guaranteed by the U.S. Government, its agencies or instrumentalities. There could be potential loss to the Fund in the event that the Fund is delayed or prevented from exercising its rights to dispose of the collateral, including the risk of a possible decline in the value of the underlying obligations during the period in which the Fund seeks to assert its rights.
When-issued transactions
The Fund may purchase securities on a forward commitment or when-issued basis. The Fund records a when-issued transaction on the trade date and will segregate assets in an amount at least equal in value to the Fund’s commitment to purchase when-issued securities. Securities purchased on a when-issued basis are marked-to-market daily and the Fund begins earning interest on the settlement date. Losses may arise due to changes in the market value of the underlying securities or if the counterparty does not perform under the contract.
Security transactions and income recognition
Securities transactions are recorded on a trade date basis. Realized gains or losses are recorded on the basis of identified cost.
Interest income is accrued daily and bond discounts are accreted and premiums are amortized daily. To the extent debt obligations are placed on non-accrual status, any related interest income may be reduced by writing off interest receivables when the collection of all or a portion of interest has been determined to be doubtful based on consistently applied procedures and the fair value has decreased. If the issuer subsequently resumes interest payments or when the collectability of interest is reasonably assured, the debt obligation is removed from non-accrual status.
20 | Retail Money Market Funds
Table of Contents
Notes to financial statements (unaudited)
Distributions to shareholders
Distributions to shareholders from net investment income are declared daily and paid monthly. Distributions from net realized gains, if any, are recorded on the ex-dividend date and paid at least annually. Such distributions are determined in accordance with income tax regulations and may differ from U.S. generally accepted accounting principles. Dividend sources are estimated at the time of declaration. The tax character of distributions is determined as of the Fund’s fiscal year end. Therefore, a portion of the Fund’s distributions made prior to the Fund’s fiscal year end may be categorized as a tax return of capital at year end.
Federal and other taxes
The Fund intends to continue to qualify as a regulated investment company by distributing substantially all of its investment company taxable income and any net realized capital gains (after reduction for capital loss carryforwards) sufficient to relieve it from all, or substantially all, federal income taxes. Accordingly, no provision for federal income taxes was required.
The Fund’s income and federal excise tax returns and all financial records supporting those returns for the prior three fiscal years are subject to examination by the federal and Delaware revenue authorities. Management has analyzed the Fund’s tax positions taken on federal, state, and foreign tax returns for all open tax years and does not believe that there are any uncertain tax positions that require recognition of a tax liability.
As of July 31, 2019, the cost of investments for federal income tax purposes is substantially the same as for financial reporting purposes.
Class allocations
The separate classes of shares offered by the Fund differ principally in applicable sales charges, distribution, shareholder servicing, and administration fees. Class specific expenses are charged directly to that share class. Investment income, common fund-level expenses, and realized gains (losses) on investments are allocated daily to each class of shares based on the relative proportion of net assets of each class.
3. FAIR VALUATION MEASUREMENTS
Fair value measurements of investments are determined within a framework that has established a fair value hierarchy based upon the various data inputs utilized in determining the value of the Fund’s investments. The three-level hierarchy gives the highest priority to unadjusted quoted prices in active markets for identical assets or liabilities (Level 1) and the lowest priority to unobservable inputs (Level 3). The Fund’s investments are classified within the fair value hierarchy based on the lowest level of input that is significant to the fair value measurement. The inputs are summarized into three broad levels as follows:
| ∎ | Level 1 – quoted prices in active markets for identical securities |
| ∎ | Level 2 – other significant observable inputs (including quoted prices for similar securities, interest rates, prepayment speeds, credit risk, etc.) |
| ∎ | Level 3 – significant unobservable inputs (including the Fund’s own assumptions in determining the fair value of investments) |
The inputs or methodologies used for valuing investments in securities are not necessarily an indication of the risk associated with investing in those securities.
The following is a summary of the inputs used in valuing the Fund’s assets and liabilities as of July 31, 2019:
| Quoted prices (Level 1) | Other significant observable inputs (Level 2) | Significant (Level 3) | Total | |||||||||||||
Assets | ||||||||||||||||
Investments in: | ||||||||||||||||
Certificates of deposit | $ | 0 | $ | 222,107,258 | $ | 0 | $ | 222,107,258 | ||||||||
Commercial paper | 0 | 437,576,430 | 0 | 437,576,430 | ||||||||||||
Municipal obligations | 0 | 116,325,000 | 0 | 116,325,000 | ||||||||||||
Non-agency mortgage-backed securities | 0 | 3,000,000 | 0 | 3,000,000 | ||||||||||||
Other instruments | 0 | 31,947,682 | 0 | 31,947,682 | ||||||||||||
Other notes | 0 | 11,299,368 | 0 | 11,299,368 | ||||||||||||
Repurchase agreements | 0 | 179,050,000 | 0 | 179,050,000 | ||||||||||||
Total assets | $ | 0 | $ | 1,001,305,738 | $ | 0 | $ | 1,001,305,738 | ||||||||
Retail Money Market Funds | 21
Table of Contents
Notes to financial statements (unaudited)
Additional sector, industry or geographic detail is included in the Portfolio of Investments.
For the six months ended July 31, 2019, the Fund did not have any transfers into/out of Level 3.
4. TRANSACTIONS WITH AFFILIATES
Management fee
Funds Management, an indirect wholly owned subsidiary of Wells Fargo & Company (“Wells Fargo”), is the manager of the Fund and provides advisory and fund-level administrative services under an investment management agreement. Under the investment management agreement, Funds Management is responsible for, among other services, implementing the investment objectives and strategies of the Fund, supervising the subadvisers and providing fund-level administrative services in connection with the Fund’s operations. As compensation for its services under the investment management agreement, Funds Management is entitled to receive a management fee at the following annual rate based on the Fund’s average daily net assets:
| Average daily net assets | Management fee | |
First $5 billion | 0.20% | |
Next $5 billion | 0.19 | |
Over $10 billion | 0.18 | |
For the six months ended July 31, 2019, the management fee was equivalent to an annual rate of 0.20% of the Fund’s average daily net assets.
Funds Management has retained the services of certain subadvisers to provide daily portfolio management to the Fund. Wells Capital Management Incorporated (“WellsCap”), an affiliate of Funds Management and an indirect wholly owned subsidiary of Wells Fargo, is the subadviser to the Fund and is entitled to receive a fee from Funds Management at an annual rate starting at 0.05% and declining to 0.01% as the average daily net assets of the Fund increase. Wells Capital Management Singapore, a separately identifiable department of Wells Fargo Bank, N.A, an affiliate of Funds Management and wholly owned subsidiary of Wells Fargo, is also a subadviser to the Fund and is entitled to receive a fee from WellsCap at an annual rate starting at 0.0025% and declining to 0.0005% as the average daily net assets of the Fund increase.
Administration fees
Under a class-level administration agreement, Funds Management provides class-level administrative services to the Fund, which includes paying fees and expenses for services provided by the transfer agent, sub-transfer agents, omnibus account servicers and record-keepers. As compensation for its services under the class-level administration agreement, Funds Management receives an annual fee which is calculated based on the average daily net assets of each class as follows:
| Class-level administration fee | ||
Class A, Class C | 0.22% | |
Premier Class | 0.08 | |
Service Class | 0.12 | |
Waivers and/or expense reimbursements
Funds Management has contractually waived and/or reimbursed management and administration fees to the extent necessary to maintain certain net operating expense ratios for the Fund. When each class of the Fund has exceeded its expense cap, Funds Management has waived fees and/or reimbursed expenses from fund-level expenses on a proportionate basis and then from class specific expenses. When only certain classes exceed their expense caps, waivers and/or reimbursements are applied against class specific expenses before fund-level expenses. Funds Management has committed through May 31, 2020 to waive fees and/or reimburse expenses to the extent necessary to cap the Fund’s expenses at 0.60% for Class A shares, 1.35% for Class C shares, 0.20% for Premier Class shares, and 0.50% for Service Class shares. Prior to or after the commitment expiration date, the cap may be increased or the commitment to maintain the cap may be terminated only with the approval of the Board of Trustees.
22 | Retail Money Market Funds
Table of Contents
Notes to financial statements (unaudited)
Distribution fee
The Trust has adopted a distribution plan for Class C shares of the Fund pursuant to Rule 12b-1 under the 1940 Act. A distribution fee is charged to Class C shares and paid to Wells Fargo Funds Distributor, LLC, the principal underwriter, at an annual rate of 0.75% of the average daily net assets of Class C shares.
In addition, Funds Distributor is also entitled to receive the contingent deferred sales charges from redemptions of Class C shares. No contingent deferred sales charges were incurred by Class C shares for the six months ended July 31, 2019.
Shareholder servicing fees
The Trust has entered into contracts with one or more shareholder servicing agents, whereby Class A, Class C, and Service Class of the Fund are charged a fee at an annual rate of 0.25% of the respective average daily net assets of each class. A portion of these total shareholder servicing fees were paid to affiliates of Wells Fargo.
Interfund transactions
The Fund may purchase or sell portfolio investment securities to certain other Wells Fargo affiliates pursuant to Rule 17a-7 under the 1940 Act and under procedures adopted by the Board of Trustees. The procedures have been designed to ensure that these interfund transactions, which do not incur broker commissions, are effected at current market prices.
5. INDEMNIFICATION
Under the Trust’s organizational documents, the officers and Trustees have been granted certain indemnification rights against certain liabilities that may arise out of performance of their duties to the Trust. Additionally, in the normal course of business, the Trust may enter into contracts with service providers that contain a variety of indemnification clauses. The Trust’s maximum exposure under these arrangements is dependent on future claims that may be made against the Fund and, therefore, cannot be estimated.
6. NEW ACCOUNTING PRONOUNCEMENTS
In August 2018, FASB issued Accounting Standards Update (“ASU”) No. 2018-13, Fair Value Measurement (Topic 820)Disclosure Framework—Changes to the Disclosure Requirements for Fair Value Measurement.ASU 2018-13 updates the disclosure requirements for fair value measurements by modifying or removing certain disclosures and adding certain new disclosures. The amendments are effective for fiscal years, and interim periods within those fiscal years, beginning after December 15, 2019. Early adoption is permitted. Management has adopted the removal and modification of disclosures early, as permitted, and will adopt the additional new disclosures at the effective date.
In March 2017, FASB issued ASU No. 2017-08, Premium Amortization on Purchased Callable Debt Securities. ASU 2017-08 shortens the amortization period for certain callable debt securities held at a premium and requires the premium to be amortized to the earliest call date. The amendments do not require an accounting change for securities held at a discount and discounts will continue to be accreted to the maturity date of the security. ASU 2017-08 is effective for fiscal years beginning after December 15, 2018 and for interim periods within those fiscal years. During the current reporting period, management of the Fund adopted the change in accounting policy which did not have a material impact to the Fund’s financial statements.
Retail Money Market Funds | 23
Table of Contents
PROXY VOTING INFORMATION
A description of the policies and procedures used to determine how to vote proxies relating to portfolio securities is available, upon request, by calling1-800-222-8222, visiting our website atwfam.com, or visiting the SEC website at sec.gov. Information regarding how the proxies related to portfolio securities were voted during the most recent 12-month period ended June 30 is available on the website atwfam.comor by visiting the SEC website at sec.gov.
24 | Retail Money Market Funds
Table of Contents
Other information (unaudited)
BOARD OF TRUSTEES AND OFFICERS
Each of the Trustees and Officers1 listed in the table below acts in identical capacities for each fund in the Wells Fargo family of funds, which consists of 152 mutual funds comprising the Wells Fargo Funds Trust, Wells Fargo Variable Trust, Wells Fargo Master Trust and four closed-end funds (collectively the “Fund Complex”). This table should be read in conjunction with the Prospectus and the Statement of Additional Information2. The mailing address of each Trustee and Officer is 525 Market Street, 12th Floor, San Francisco, CA 94105. Each Trustee and Officer serves an indefinite term, however, each Trustee serves such term until reaching the mandatory retirement age established by the Trustees.
Independent Trustees
| Name and year of birth | Position held and length of service* | Principal occupations during past five years or longer | Current other public company or investment company directorships | |||
| William R. Ebsworth (Born 1957) | Trustee, since 2015 | Retired. From 1984 to 2013, equities analyst, portfolio manager, research director and chief investment officer at Fidelity Management and Research Company in Boston, Tokyo, and Hong Kong, and retired in 2013 as Chief Investment Officer of Fidelity Strategic Advisers, Inc. where he led a team of investment professionals managing client assets. Prior thereto, Board member of Hong Kong Securities Clearing Co., Hong Kong Options Clearing Corp., the Thailand International Fund, Ltd., Fidelity Investments Life Insurance Company, and Empire Fidelity Investments Life Insurance Company. Audit Committee Chair and Investment Committee Chair of the Vincent Memorial Hospital Endowment (non-profit organization). Mr. Ebsworth is a CFA® charterholder. | N/A | |||
| Jane A. Freeman (Born 1953) | Trustee, since 2015; Chair Liaison, since 2018 | Retired. From 2012 to 2014 and 1999 to 2008, Chief Financial Officer of Scientific Learning Corporation. From 2008 to 2012, Ms. Freeman provided consulting services related to strategic business projects. Prior to 1999, Portfolio Manager at Rockefeller & Co. and Scudder, Stevens & Clark. Board member of the Harding Loevner Funds from 1996 to 2014, serving as both Lead Independent Director and chair of the Audit Committee. Board member of the Russell Exchange Traded Funds Trust from 2011 to 2012 and the chair of the Audit Committee. Ms. Freeman is a Board Member of The Ruth Bancroft Garden (non-profit organization). She is also an inactive Chartered Financial Analyst. | N/A | |||
| Isaiah Harris, Jr. (Born 1952) | Trustee, since 2009; Audit Committee Chairman, since 2019 | Retired. Chairman of the Board of CIGNA Corporation since 2009, and Director since 2005. From 2003 to 2011, Director of Deluxe Corporation. Prior thereto, President and CEO of BellSouth Advertising and Publishing Corp. from 2005 to 2007, President and CEO of BellSouth Enterprises from 2004 to 2005 and President of BellSouth Consumer Services from 2000 to 2003. Emeritus member of the Iowa State University Foundation Board of Governors. Emeritus Member of the Advisory Board of Iowa State University School of Business. Advisory Board Member, Palm Harbor Academy (private school). Advisory Board Member, Child Evangelism Fellowship (non-profit). Mr. Harris is a certified public accountant (inactive status). | CIGNA Corporation | |||
| Judith M. Johnson (Born 1949) | Trustee, since 2008; Audit Committee Chairman, from 2009 to 2018 | Retired. Prior thereto, Chief Executive Officer and Chief Investment Officer of Minneapolis Employees Retirement Fund from 1996 to 2008. Ms. Johnson is an attorney, certified public accountant and a certified managerial accountant. | N/A | |||
Retail Money Market Funds | 25
Table of Contents
Other information (unaudited)
| Name and year of birth | Position held and length of service* | Principal occupations during past five years or longer | Current other public company or investment company directorships | |||
| David F. Larcker (Born 1950) | Trustee, since 2009 | James Irvin Miller Professor of Accounting at the Graduate School of Business, Stanford University, Director of the Corporate Governance Research Initiative and Senior Faculty of The Rock Center for Corporate Governance since 2006. From 2005 to 2008, Professor of Accounting at the Graduate School of Business, Stanford University. Prior thereto, Ernst & Young Professor of Accounting at The Wharton School, University of Pennsylvania from 1985 to 2005. | N/A | |||
Olivia S. Mitchell (Born 1953) | Trustee, since 2006; Nominating and Governance Committee Chairman, since 2018 | International Foundation of Employee Benefit Plans Professor, Wharton School of the University of Pennsylvania since 1993. Director of Wharton’s Pension Research Council and Boettner Center on Pensions & Retirement Research, and Research Associate at the National Bureau of Economic Research. Previously, Cornell University Professor from 1978 to 1993. | N/A | |||
| Timothy J. Penny (Born 1951) | Trustee, since 1996; Chairman, since 2018 | President and Chief Executive Officer of Southern Minnesota Initiative Foundation, a non-profit organization, since 2007. Member of the Board of Trustees of NorthStar Education Finance, Inc., a non-profit organization, since 2007. | N/A | |||
| James G. Polisson (Born 1959) | Trustee, since 2018 | Retired. Chief Marketing Officer, Source (ETF) UK Services, Ltd, from 2015 to 2017. From 2012 to 2015, Principal of The Polisson Group, LLC, a management consulting, corporate advisory and principal investing company. Chief Executive Officer and Managing Director at Russell Investments, Global Exchange Traded Funds from 2010 to 2012. Managing Director of Barclays Global Investors from 1998 to 2010 and Global Chief Marketing Officer for iShares and Barclays Global Investors from 2000 to 2010. Trustee of the San Francisco Mechanics’ Institute, a non-profit organization, from 2013 to 2015. Board member of the Russell Exchange Traded Fund Trust from 2011 to 2012. Director of Barclays Global Investors Holdings Deutschland GmbH from 2006 to 2009. Mr. Polisson is an attorney and has a retired status with the Massachusetts and District of Columbia Bar Associations. | N/A | |||
| * | Length of service dates reflect the Trustee’s commencement of service with the Trust’s predecessor entities, where applicable. |
26 | Retail Money Market Funds
Table of Contents
Other information (unaudited)
Officers
| Name and year of birth | Position held and length of service | Principal occupations during past five years or longer | ||
| Andrew Owen (Born 1960) | President, since 2017 | Executive Vice President of Wells Fargo & Company and Head of Affiliated Managers, Wells Fargo Asset Management, since 2014. In addition, Mr. Owen is currently President, Chief Executive Officer and Director of Wells Fargo Funds Management, LLC since 2017. Prior thereto, Executive Vice President responsible for marketing, investments and product development for Wells Fargo Funds Management, LLC, from 2009 to 2014. | ||
| Nancy Wiser1 (Born 1967) | Treasurer, since 2012 | Executive Vice President of Wells Fargo Funds Management, LLC since 2011. Chief Operating Officer and Chief Compliance Officer at LightBox Capital Management LLC, from 2008 to 2011. | ||
| Alexander Kymn (Born 1973) | Secretary and Chief Legal Officer, since 2018 | Senior Company Counsel of Wells Fargo Bank, N.A. since 2018 (previously Senior Counsel from 2007 to 2018). Vice President of Wells Fargo Funds Management, LLC from 2008 to 2014. | ||
| Michael H. Whitaker (Born 1967) | Chief Compliance Officer, since 2016 | Senior Vice President and Chief Compliance Officer since 2016. Senior Vice President and Chief Compliance Officer for Fidelity Investments from 2007 to 2016. | ||
| David Berardi (Born 1975) | Assistant Treasurer, since 2009 | Vice President of Wells Fargo Funds Management, LLC since 2009. Vice President of Evergreen Investment Management Company, LLC from 2008 to 2010. Manager of Fund Reporting and Control for Evergreen Investment Management Company, LLC from 2004 to 2010. | ||
| Jeremy DePalma1 (Born 1974) | Assistant Treasurer, since 2009 | Senior Vice President of Wells Fargo Funds Management, LLC since 2009. Senior Vice President of Evergreen Investment Management Company, LLC from 2008 to 2010 and head of the Fund Reporting and Control Team within Fund Administration from 2005 to 2010. | ||
| 1 | Nancy Wiser acts as Treasurer of 65 funds in the Fund Complex. Jeremy DePalma acts as Treasurer of 87 funds and Assistant Treasurer of 65 funds in the Fund Complex. |
| 2 | The Statement of Additional Information includes additional information about the Trustees and is available, without charge, upon request, by calling1-800-222-8222 or by visiting the website atwfam.com. |
Retail Money Market Funds | 27
Table of Contents
Other information (unaudited)
BOARD CONSIDERATION OF INVESTMENT MANAGEMENT AND SUB-ADVISORY AGREEMENTS:
Wells Fargo Money Market Fund
Under the Investment Company Act of 1940 (the “1940 Act”), the Board of Trustees (the “Board”) of Wells Fargo Funds Trust (the “Trust”) must determine annually whether to approve the continuation of the Trust’s investment management andsub-advisory agreements. In this regard, at an in-person meeting held on May 21-22, 2019 (the “Meeting”), the Board, all the members of which have no direct or indirect interest in the investment management and sub-advisory agreements and are not “interested persons” of the Trust, as defined in the 1940 Act (the “Independent Trustees”), reviewed and approved for Wells Fargo Money Market Fund (the “Fund”): (i) an investment management agreement (the “Management Agreement”) with Wells Fargo Funds Management, LLC (“Funds Management”); (ii) an investment sub-advisory agreement (the “WellsCapSub-Advisory Agreement”) with Wells Capital Management Incorporated (“WellsCap”); and (iii) an investment sub-advisory agreement (the “WellsCap Singapore Sub-Advisory Agreement,” and together with the WellsCap Sub-Advisory Agreement, the “Sub-Advisory Agreements”) with Wells Capital Management Singapore (together with WellsCap, each a “Sub-Adviser” and collectively, the “Sub-Advisers”), each an affiliate of Funds Management. The Management Agreement and the Sub-Advisory Agreements are collectively referred to as the “Advisory Agreements.”
At the Meeting, the Board considered the factors and reached the conclusions described below relating to the selection of Funds Management and the Sub-Advisers and the approval of the Advisory Agreements. Prior to the Meeting, including at an in-person meeting in April 2019, the Trustees conferred extensively among themselves and with representatives of Funds Management about these matters. Also, the Board has adopted a team-based approach, with each team consisting of a sub-set of Trustees, to assist the full Board in the discharge of its duties in reviewing investment performance and other matters throughout the year. The Independent Trustees were assisted in their evaluation of the Advisory Agreements by independent legal counsel, from whom they received separate legal advice and with whom they met separately.
In providing information to the Board, Funds Management and the Sub-Advisers were guided by a detailed set of requests for information submitted to them by independent legal counsel on behalf of the Independent Trustees at the start of the Board’s annual contract renewal process earlier in 2019. In considering and approving the Advisory Agreements, the Trustees considered the information they believed relevant, including but not limited to the information discussed below. The Board considered not only the specific information presented in connection with the Meeting, but also the knowledge gained over time through interaction with Funds Management and the Sub-Advisers about various topics. In this regard, the Board reviewed reports of Funds Management at each of its quarterly meetings, which included, among other things, portfolio reviews and investment performance reports. In addition, the Board and the teams mentioned above confer with portfolio managers at various times throughout the year. The Board did not identify any particular information or consideration that was all-important or controlling, and each individual Trustee may have attributed different weights to various factors.
After its deliberations, the Board unanimously approved the continuation of the Advisory Agreements for a one-year term and determined that the compensation payable to Funds Management and the Sub-Advisers under each of the Advisory Agreements was reasonable. The Board considered the approval of the Advisory Agreements for the Fund as part of its consideration of agreements for funds across the complex, but its approvals were made on a fund-by-fund basis. The following summarizes a number of important, but not necessarily all, factors considered by the Board in support of its approvals.
Nature, extent and quality of services
The Board received and considered various information regarding the nature, extent and quality of services provided to the Fund by Funds Management and the Sub-Advisers under the Advisory Agreements. This information included a description of the investment advisory services and Fund-level administrative services covered by the Management Agreement, as well as, among other things, a summary of the background and experience of senior management of Wells Fargo Asset Management (“WFAM”), of which Funds Management and the Sub-Advisers are a part, a summary of investments made in the business of WFAM, a summary of certain organizational and personnel changes involving Funds Management and the Sub-Advisers, and a description of Funds Management’s and the Sub-Advisers’ business continuity planning programs and of their approaches to data privacy and cybersecurity. The Board received and reviewed information about Funds Management’s role as administrator of the Fund’s liquidity risk management program. The Board also considered the qualifications, background, tenure and responsibilities of each of the portfolio managers primarily responsible for the day-to-day portfolio management of the Fund.
The Board evaluated the ability of Funds Management and the Sub-Advisers to attract and retain qualified investment professionals, including research, advisory and supervisory personnel. The Board further considered the compliance programs and compliance records of Funds Management and the Sub-Advisers. In addition, the Board took into account the full range of services provided to the Fund by Funds Management and its affiliates.
28 | Retail Money Market Funds
Table of Contents
Other information (unaudited)
Fund investment performance and expenses
The Board considered the investment performance results for the Fund over various time periods ended December 31, 2018. The Board considered these results in comparison to the investment performance of funds in a universe that was determined by Broadridge Inc. (“Broadridge”) to be similar to the Fund (the “Universe”), and in comparison to the Fund’s benchmark index and to other comparative data. Broadridge is an independent provider of investment company data. The Board received a description of the methodology used by Broadridge to select the mutual funds in the performance Universe. The Board noted that the investment performance of the Fund (Class A) was in range of the average investment performance of the Universe for all periods under review.
The Board also received and considered information regarding the Fund’s net operating expense ratios and their various components, including actual management fees, custodian and other non-management fees, and Rule 12b-1 and non-Rule 12b-1 shareholder service fees. The Board considered these ratios in comparison to the median ratios of funds in class-specific expense groups that were determined by Broadridge to be similar to the Fund (the “Groups”). The Board received a description of the methodology used by Broadridge to select the mutual funds in the expense Groups and an explanation of how funds comprising expense groups and their expense ratios may vary from year-to-year. Based on the Broadridge reports, the Board noted that the net operating expense ratios of the Fund were lower than, equal to or in range of the median net operating expense ratios of the expense Groups for the Class A, Premier and Service share classes, but higher than the median net operating expenses ratios of the expense Groups for the Class C share class.
The Board took into account the Fund’s investment performance and expense information provided to it among the factors considered in deciding to re-approve the Advisory Agreements.
Investment management and sub-advisory fee rates
The Board reviewed and considered the contractual fee rates payable by the Fund to Funds Management under the Management Agreement, as well as the contractual fee rates payable by the Fund to Funds Management for class-level administrative services under a Class-Level Administration Agreement, which include, among other things, class-level transfer agency and sub-transfer agency costs (collectively, the “Management Rates”). The Board also reviewed and considered the contractual investmentsub-advisory fee rates that are payable by Funds Management to the Sub-Advisers for investment sub-advisory services.
Among other information reviewed by the Board was a comparison of the Fund’s Management Rates with the average contractual investment management fee rates of funds in the expense Groups at a common asset level as well as transfer agency costs of the funds in the expense Groups. The Board noted that the Management Rates of the Fund were lower than or in range of the sum of these average rates for the Fund’s expense Groups for all share classes.
The Board also received and considered information about the portion of the total management fee that was retained by Funds Management after payment of the fees to the Sub-Advisers for sub-advisory services. In assessing the reasonableness of this amount, the Board received and evaluated information about the nature and extent of responsibilities retained and risks assumed by Funds Management and not delegated to or assumed by either of the Sub-Advisers, and about Funds Management’s on-going oversight services. Given the affiliation between Funds Management and the Sub-Advisers, the Board ascribed limited relevance to the allocation of fees between them.
Based on its consideration of the factors and information it deemed relevant, including those described here, the Board determined that the compensation payable to Funds Management under the Management Agreement and to the Sub-Advisers under the Sub-Advisory Agreements was reasonable.
Profitability
The Board received and considered information concerning the profitability of Funds Management, as well as the profitability of both WFAM and Wells Fargo & Co. (“Wells Fargo”) from providing services to the fund family as a whole. The Board noted that the Sub-Advisers’ profitability information with respect to providing services to the Fund and other funds in the family was subsumed in the WFAM and Wells Fargo profitability analysis.
Funds Management reported on the methodologies and estimates used in calculating profitability, including a description of the methodology used to allocate certain expenses. Among other things, the Board noted that the levels of profitability reported on a fund-by-fund basis varied widely, depending on factors such as the size, type and age of fund. Based on its review, the Board did not deem the profits reported by Funds Management, WFAM or Wells Fargo from services provided to the Fund to be at a level that would prevent it from approving the continuation of the Advisory Agreements.
Economies of scale
The Board received and considered information about the potential for Funds Management to experience economies of scale in the provision of management services to the Fund, the difficulties of calculating economies of scale at an individual fund level,
Retail Money Market Funds | 29
Table of Contents
Other information (unaudited)
and the extent to which potential scale benefits are shared with shareholders. The Board noted the existence of breakpoints in the Fund’s management fee structure, which operate generally to reduce the Fund’s expense ratios as the Fund grows in size. The Board considered that in addition to management fee breakpoints, Funds Management shares potential economies of scale from its management business in a variety of ways, including through fee waiver and expense reimbursement arrangements, services that benefit shareholders, competitive management fee rates set at the outset without regard to breakpoints, and investments in the business intended to enhance services available to shareholders.
The Board concluded that Funds Management’s arrangements with respect to the Fund, including contractual breakpoints, constituted a reasonable approach to sharing potential economies of scale with the Fund and its shareholders.
Other benefits to Funds Management and the Sub-Advisers
The Board received and considered information regarding potential “fall-out” or ancillary benefits received by Funds Management and its affiliates, including the Sub-Advisers, as a result of their relationships with the Fund. Ancillary benefits could include, among others, benefits directly attributable to other relationships with the Fund and benefits potentially derived from an increase in Funds Management’s and the Sub-Advisers’ business as a result of their relationships with the Fund. The Board noted that various affiliates of Funds Management may receive distribution-related fees, shareholder servicing payments and sub-transfer agency fees in respect of shares sold or held through them and services provided.
The Board also reviewed information about soft dollar credits earned and utilized by the Sub-Advisers, fees earned by Funds Management and the Sub-Advisers from managing a private investment vehicle for the fund family’s securities lending collateral, and commissions earned by an affiliated broker from portfolio transactions.
Based on its consideration of the factors and information it deemed relevant, including those described here, the Board did not find that any ancillary benefits received by Funds Management and its affiliates, including the Sub-Advisers, were unreasonable.
Conclusion
At the Meeting, after considering the above-described factors and based on its deliberations and its evaluation of the information described above, the Board unanimously approved the continuation of the Advisory Agreements for a one-year term and determined that the compensation payable to Funds Management and the Sub-Advisers under each of the Advisory Agreements was reasonable.
30 | Retail Money Market Funds
Table of Contents
This page is intentionally left blank.
Table of Contents
This page is intentionally left blank.
Table of Contents
For more information
More information about Wells Fargo Funds is available free upon request. To obtain literature, please write, visit the Fund’s website, or call:
Wells Fargo Funds
P.O. Box 219967
Kansas City, MO 64121-9967
Website:wfam.com
Individual investors:1-800-222-8222
Retail investment professionals:1-888-877-9275
Institutional investment professionals:1-866-765-0778

This report and the financial statements contained herein are submitted for the general information of the shareholders of the Fund. If this report is used for promotional purposes, distribution of the report must be accompanied or preceded by a current prospectus. Before investing, please consider the investment objectives, risks, charges, and expenses of the investment. For a current prospectus and, if available, a summary prospectus, containing this information, call1-800-260-5969 or visit the Fund’s website atwfam.com. Read the prospectus carefully before you invest or send money.
Wells Fargo Asset Management (WFAM) is the trade name for certain investment advisory/management firms owned by Wells Fargo & Company. These firms include but are not limited to Wells Capital Management Incorporated and Wells Fargo Funds Management, LLC. Certain products managed by WFAM entities are distributed by Wells Fargo Funds Distributor, LLC (a broker-dealer and Member FINRA).
This material is for general informational and educational purposes only and is NOT intended to provide investment advice or a recommendation of any kind—including a recommendation for any specific investment, strategy, or plan.
INVESTMENT PRODUCTS: NOT FDIC INSURED ◾ NO BANK GUARANTEE ◾ MAY LOSE VALUE
© 2019 Wells Fargo Funds Management, LLC. All rights reserved.
405486 09-19
SA306/SAR306 07-19
Table of Contents

Semi-Annual Report
July 31, 2019
Retail Money Market Funds
| ∎ | Wells Fargo National Tax-Free Money Market Fund |
Beginning on January 1, 2021, as permitted by new regulations adopted by the Securities and Exchange Commission, paper copies of the Wells Fargo Funds’ annual and semi-annual shareholder reports issued after this date will no longer be sent by mail, unless you specifically request paper copies of the reports. Instead, the reports will be made available on the Funds’ website, and you will be notified by mail each time a report is posted and provided with a website address to access the report.
If you already elected to receive shareholder reports electronically, you will not be affected by this change and you need not take any action. You may elect to receive shareholder reports and other communications from the Fund electronically at any time by contacting your financial intermediary (such as a broker-dealer or bank) or, if you are a direct investor, by calling1-800-222-8222 or by enrolling at wellsfargo.com/advantagedelivery.
You may elect to receive all future reports in paper free of charge. If you invest through a financial intermediary, you can contact your financial intermediary to request that you continue to receive paper copies of your shareholder reports; if you invest directly with the Fund, you can call 1-800-222-8222. Your election to receive reports in paper will apply to all Wells Fargo Funds held in your account with your financial intermediary or, if you are a direct investor, to all Wells Fargo Funds that you hold.
Table of Contents
|
Reduce clutter. Save trees. |
Sign up for electronic delivery of prospectuses and shareholder reports atwellsfargo.com/advantagedelivery |
The views expressed and any forward-looking statements are as of July 31, 2019, unless otherwise noted, and are those of the Fund managers and/or Wells Fargo Asset Management. Discussions of individual securities, or the markets generally, or any Wells Fargo Fund are not intended as individual recommendations. Future events or results may vary significantly from those expressed in any forward-looking statements. The views expressed are subject to change at any time in response to changing circumstances in the market. Wells Fargo Asset Management and the Fund disclaim any obligation to publicly update or revise any views expressed or forward-looking statements.
INVESTMENT PRODUCTS: NOT FDIC INSURED ◾ NO BANK GUARANTEE ◾ MAY LOSE VALUE
Retail Money Market Funds | 1
Table of Contents
Letter to shareholders (unaudited)

Andrew Owen
President
Wells Fargo Funds
Dear Shareholder:
We are pleased to offer you this semi-annual report for the Wells Fargo National Tax-Free Money Market Fund for the six-month period that ended July 31, 2019. Global stock and bond investors enjoyed gains that came amid continued concerns about global economic growth, international trade, geopolitical tensions, and bouts of market volatility. These concerns grew more intense as the period closed.
For the period, U.S. stocks, based on the S&P 500 Index,1 gained 11.32% and international stocks, as measured by the MSCI ACWI ex USA Index (Net),2 added 4.34%. The MSCI EM Index (Net)3 inched higher by 0.44%. For bond investors, the Bloomberg Barclays U.S. Aggregate Bond Index4 added 5.23%, the Bloomberg Barclays Global Aggregate ex-USD Index5 added 2.33%, the Bloomberg Barclays Municipal Bond Index6 gained 5.15%, and the ICE BofAML U.S. High Yield Index7 added 5.86%.
Concerns for slowing global growth reemerge during the first quarter of 2019.
After the S&P 500 Index’s best monthly performance in 30 years during January and positive returns for other major indices across major asset classes, signs of slowing global growth grew more ominous in February. The Bureau of Economic Analysis announced fourth-quarter 2018 gross domestic product (GDP) grew at an annualized 2.2% rate, down from the levels of the prior two quarters. In a February report, the Bank of England forecast the slowest growth since the financial crisis for 2019. China and the U.S. continued to wrangle over trade issues.
By the end of March 2019, a combination of dovish U.S. Federal Reserve (Fed) sentiment and steady, if not spectacular, U.S. economic and business metrics reinforced investors’ confidence. Monthly job creation data and corporate profits, while less consistent than during 2018, were solid. China announced a roughly $300 billion stimulus package through tax and fee cuts intended to reinvigorate economic growth. During April 2019, favorable sentiment found additional support in reports of sustained low inflation, solid employment data, and first-quarter U.S. GDP of an annualized rate of 3.2%.
| 1 | The S&P 500 Index consists of 500 stocks chosen for market size, liquidity, and industry group representation. It is a market-value-weighted index with each stock’s weight in the index proportionate to its market value. You cannot invest directly in an index. |
| 2 | The Morgan Stanley Capital International (MSCI) All Country World Index (ACWI) ex USA Index (Net) is a free-float-adjusted market-capitalization weighted index that is designed to measure the equity market performance of developed and emerging markets, excluding the U.S. Source: MSCI. MSCI makes no express or implied warranties or representations and shall have no liability whatsoever with respect to any MSCI data contained herein. The MSCI data may not be further redistributed or used as a basis for other indices or any securities or financial products. This report is not approved, reviewed, or produced by MSCI. You cannot invest directly in an index. |
| 3 | The MSCI Emerging Markets (EM) Index (Net) is a free-float-adjusted market-capitalization-weighted index that is designed to measure the equity market performance of emerging markets. You cannot invest directly in an index. |
| 4 | The Bloomberg Barclays U.S. Aggregate Bond Index is a broad-based benchmark that measures the investment-grade, U.S. dollar-denominated, fixed-rate taxable bond market, including Treasuries, government-related and corporate securities, mortgage-backed securities (agency fixed-rate and hybrid adjustable-rate mortgage pass-throughs), asset-backed securities, and commercial mortgage-backed securities. You cannot invest directly in an index. |
| 5 | The Bloomberg Barclays Global Aggregate ex-USD Index is an unmanaged index that provides a broad-based measure of the global investment-grade fixed-income markets excluding the U.S. dollar-denominated debt market. You cannot invest directly in an index. |
| 6 | The Bloomberg Barclays Municipal Bond Index is an unmanaged index composed of long-term tax-exempt bonds with a minimum credit rating of Baa. You cannot invest directly in an index. |
| 7 | The ICE BofAML U.S. High Yield Index is a market-capitalization-weighted index of domestic and Yankee high-yield bonds. The index tracks the performance of high-yield securities traded in the U.S. bond market. You cannot invest directly in an index. Copyright 2019. ICE Data Indices, LLC. All rights reserved. |
2 | Retail Money Market Funds
Table of Contents
Letter to shareholders (unaudited)
During May 2019, markets tumbled on mixed investment signals. In the U.S., partisan wrangling ramped up as Democrats and Republicans set their sights on 2020 presidential politics. The U.K.’s Brexit caused Prime Minister Theresa May to resign. The European Commission downgraded the 2019 growth forecast to 1.2%. The U.S. increased tariffs on products from China, China responded, and then talks broke down. President Donald Trump threatened to turn his foreign policy tariff tool to Mexico over immigration issues.
As had been the case during most of 2019 to date, just as the investment horizon appeared to darken, sentiment turned and U.S. equity markets gained during June and July. The gains, primarily driven by geopolitical and monetary policy events, pushed equity markets to new highs.
President Mario Draghi of the European Central Bank said that if the outlook doesn’t improve, the bank will cut rates or buy more assets to prop up inflation. President Trump backed off of tariff threats against Mexico and China. In the U.S., the Fed implemented a 0.25% federal funds rate cut in July 2019.
Later in July 2019, the U.S. reversed course and threatened to impose higher tariffs on China’s exports after talks failed. China responded with tariff threats of its own and devalued the renminbi, a move that roiled global markets. Despite the accommodative approach of central banks, investors continued to have misgivings about the durability of economic growth globally and a pervasively cautious tone influenced the world’s equity and fixed-income markets.
Don’t let short-term uncertainty derail long-term investment goals.
Periods of investment uncertainty can present challenges, but experience has taught us that maintaining long-term investment goals can be an effective way to plan for the future. To help you create a sound strategy based on your personal goals and risk tolerance, Wells Fargo Funds offers more than 100 mutual funds spanning a wide range of asset classes and investment styles. Although diversification cannot guarantee an investment profit or prevent losses, we believe it can be an effective way to manage investment risk and potentially smooth out overall portfolio performance. We encourage investors to know their investments and to understand that appropriate levels of risk-taking may unlock opportunities.
Thank you for choosing to invest with Wells Fargo Funds. We appreciate your confidence in us and remain committed to helping you meet your financial needs.
Sincerely,

Andrew Owen
President
Wells Fargo Funds
“During May 2019, markets tumbled on mixed investment signals.”
“In the U.S., the Fed implemented a 0.25% federal funds rate cut in July 2019.”
|
For further information about your Fund, contact your investment professional, visit our website at wfam.com,or call us directly at1-800-222-8222. |
Retail Money Market Funds | 3
Table of Contents
Performance highlights (unaudited)
Investment objective
The Fund seeks current income exempt from federal income tax, while preserving capital and liquidity.
Manager
Wells Fargo Funds Management, LLC
Subadviser
Wells Capital Management Incorporated
Portfolio managers
James Randazzo
Jeffrey L. Weaver, CFA®‡
Average annual total returns (%) as of July 31, 2019
| Expense ratios1 (%) | ||||||||||||||||||||||
| Inception date | 1 year | 5 year | 10 year | Gross | Net2 | |||||||||||||||||
| Class A (NWMXX) | 7-28-2003 | 1.07 | 0.39 | 0.20 | 0.66 | 0.60 | ||||||||||||||||
| Administrator Class (WNTXX) | 4-8-2005 | 1.37 | 0.59 | 0.31 | 0.39 | 0.30 | ||||||||||||||||
| Premier Class (WFNXX) | 11-8-1999 | 1.47 | 0.66 | 0.36 | 0.27 | 0.20 | ||||||||||||||||
| Service Class (MMIXX) | 8-3-1993 | 1.22 | 0.49 | 0.25 | 0.56 | 0.45 | ||||||||||||||||
Yield summary (%) as of July 31, 20192
| Class A | Administrator Class | Premier Class | Service Class | |||||||||||
| 7-day current yield | 0.93 | 1.23 | 1.33 | 1.08 | ||||||||||
| 7-day compound yield | 0.93 | 1.23 | 1.33 | 1.08 | ||||||||||
| 30-day simple yield | 0.89 | 1.19 | 1.29 | 1.04 | ||||||||||
| 30-day compound yield | 0.90 | 1.20 | 1.30 | 1.05 | ||||||||||
Figures quoted represent past performance, which is no guarantee of future results, and do not reflect taxes that a shareholder may pay on fund distributions or the redemption of fund shares. Investment returns will fluctuate. The Fund’s yield figures more closely reflect the current earnings of the Fund than the total return figures. Current performance may be lower or higher than the performance data quoted, which assumes the reinvestment of dividends and capital gains. Current month-end performance is available on the Fund’s website,wfam.com.
Each class is sold without a front-end sales charge or contingent deferred sales charge.
For retail money market funds: You could lose money by investing in the Fund. Although the Fund seeks to preserve the value of your investment at $1.00 per share, it cannot guarantee it will do so. The Fund may impose a fee upon sale of your shares or may temporarily suspend your ability to sell shares if the Fund’s liquidity falls below required minimums because of market conditions or other factors. An investment in the Fund is not insured or guaranteed by the Federal Deposit Insurance Corporation or any other government agency. The Fund’s sponsor has no legal obligation to provide financial support to the Fund, and you should not expect that the sponsor will provide financial support to the Fund at any time.
Please see footnotes on page 5.
4 | Retail Money Market Funds
Table of Contents
Performance highlights (unaudited)
| Revenue source distribution as of July 31, 20193 |
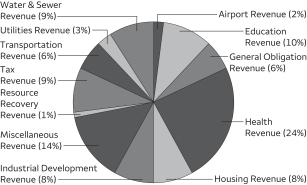 |
| Effective maturity distribution as of July 31, 20193 |
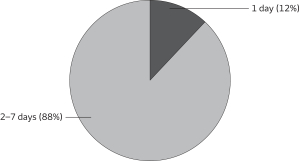 |
| Weighted average maturity as of July 31, 20194 |
6 days |
| Weighted average life as of July 31, 20195 |
6 days |
| ‡ | CFA® and Chartered Financial Analyst® are trademarks owned by CFA Institute. |
| 1 | Reflects the expense ratios as stated in the most recent prospectuses. The expense ratios shown are subject to change and may differ from the annualized expense ratios shown in the financial highlights of this report. |
| 2 | The manager has contractually committed through May 31, 2020, to waive fees and/or reimburse expenses to the extent necessary to cap the expenses of each class after fee waivers at the amounts shown. Brokerage commissions, stamp duty fees, interest, taxes, acquired fund fees and expenses (if any), and extraordinary expenses are excluded from the expense cap. Prior to or after the commitment expiration date, the cap may be increased or the commitment to maintain the cap may be terminated only with the approval of the Board of Trustees. Without this cap, the Fund’s returns would have been lower. Without waived fees and/or reimbursed expenses, the Fund’s 7-day current yield would have been 0.86%, 1.13%, 1.25%, and 0.96% for Class A, Administrator Class, Premier Class, and Service Class respectively. The expense ratio paid by an investor is the net expense ratio (the total annual fund operating expenses after fee waivers) as stated in the prospectuses. |
| 3 | Amounts are calculated based on the total investments of the Fund. These amounts are subject to change and may have changed since the date specified. |
| 4 | Weighted Average Maturity (WAM): WAM is an average of the effective maturities of all securities held in the portfolio, weighted by each security’s percentage of total investments. The maturity of a portfolio security is the period remaining until the date on which the principal amount is unconditionally required to be paid, or in the case of a security called for redemption, the date on which the redemption payment is unconditionally required to be made. WAM calculations allow for the maturities of certain securities with demand features or periodic interest rate resets to be shortened. WAM is a way to measure a fund’s sensitivity to potential interest rate changes. WAM is subject to change and may have changed since the date specified. |
| 5 | Weighted Average Life (WAL): WAL is an average of the final maturities of all securities held in the portfolio, weighted by their percentage of total investments. The maturity of a portfolio security is the period remaining until the date on which the principal amount is unconditionally required to be paid, or in the case of a security called for redemption, the date on which the redemption payment is unconditionally required to be made. In contrast to WAM, the calculation of WAL allows for the maturities of certain securities with demand features to be shortened, but not the periodic interest rate resets. WAL is a way to measure a fund’s potential sensitivity to credit spread changes. WAL is subject to change and may have changed since the date specified. |
Retail Money Market Funds | 5
Table of Contents
As a shareholder of the Fund, you incur ongoing costs, including management fees, shareholder servicing fees, and other Fund expenses. This example is intended to help you understand your ongoing costs (in dollars) of investing in the Fund and to compare these costs with the ongoing costs of investing in other mutual funds.
The example is based on an investment of $1,000 invested at the beginning of the six-month period and held for the entire period from February 1, 2019 to July 31, 2019.
Actual expenses
The “Actual” line of the table below provides information about actual account values and actual expenses. You may use the information in this line, together with the amount you invested, to estimate the expenses that you paid over the period. Simply divide your account value by $1,000 (for example, an $8,600 account value divided by $1,000 = 8.6), then multiply the result by the number in the “Actual” line under the heading entitled “Expenses paid during period” for your applicable class of shares to estimate the expenses you paid on your account during this period.
Hypothetical example for comparison purposes
The “Hypothetical” line of the table below provides information about hypothetical account values and hypothetical expenses based on the Fund’s actual expense ratio and an assumed rate of return of 5% per year before expenses, which is not the Fund’s actual return. The hypothetical account values and expenses may not be used to estimate the actual ending account balance or expenses you paid for the period. You may use this information to compare the ongoing costs of investing in the Fund and other funds. To do so, compare this 5% hypothetical example with the 5% hypothetical examples that appear in the shareholder reports of the other funds.
Please note that the expenses shown in the table are meant to highlight your ongoing costs only. Therefore, the “Hypothetical” line of the table is useful in comparing ongoing costs only and will not help you determine the relative total costs of owning different funds.
| Beginning account value 2-1-2019 | Ending account value 7-31-2019 | Expenses paid during the period¹ | Annualized net expense ratio | |||||||||||||
Class A | ||||||||||||||||
Actual | $ | 1,000.00 | $ | 1,005.47 | $ | 2.98 | 0.60 | % | ||||||||
Hypothetical (5% return before expenses) | $ | 1,000.00 | $ | 1,021.82 | $ | 3.01 | 0.60 | % | ||||||||
Administrator Class | ||||||||||||||||
Actual | $ | 1,000.00 | $ | 1,006.97 | $ | 1.49 | 0.30 | % | ||||||||
Hypothetical (5% return before expenses) | $ | 1,000.00 | $ | 1,023.31 | $ | 1.51 | 0.30 | % | ||||||||
Premier Class | ||||||||||||||||
Actual | $ | 1,000.00 | $ | 1,007.47 | $ | 1.00 | 0.20 | % | ||||||||
Hypothetical (5% return before expenses) | $ | 1,000.00 | $ | 1,023.80 | $ | 1.00 | 0.20 | % | ||||||||
Service Class | ||||||||||||||||
Actual | $ | 1,000.00 | $ | 1,006.22 | $ | 2.24 | 0.45 | % | ||||||||
Hypothetical (5% return before expenses) | $ | 1,000.00 | $ | 1,022.56 | $ | 2.26 | 0.45 | % | ||||||||
| 1 | Expenses paid is equal to the annualized net expense ratio of each class multiplied by the average account value over the period, multiplied by the number of days in the most recent fiscal half-year divided by the number of days in the fiscal year (to reflect the one-half-year period). |
6 | Retail Money Market Funds
Table of Contents
Portfolio of investments—July 31, 2019 (unaudited)
| Shares | Value | |||||||||||||||
Closed End Municipal Bond Funds: 1.18% | ||||||||||||||||
| California: 1.18% | ||||||||||||||||
Nuveen California AMT-Free Quality Municipal Income Fund Variable Rate Demand Preferred Shares Series 4 1.48% 144A |
| 10,000,000 | $ | 10,000,000 | ||||||||||||
|
| |||||||||||||||
Total Closed End Municipal Bond Funds (Cost $10,000,000) |
| 10,000,000 | ||||||||||||||
|
| |||||||||||||||
| Interest rate | Maturity date | Principal | Value | |||||||||||||
| Municipal Obligations: 96.97% |
| |||||||||||||||
Alabama: 0.59% | ||||||||||||||||
| Variable Rate Demand Note ø: 0.59% | ||||||||||||||||
Alabama Federal Aid Highway Finance Authority Series 2016-A Tender Option Bond Trust Receipts/Certificates Series 2016-XF2373 (Tax Revenue, Citibank NA LIQ) 144A | 1.43 | % | 9-1-2024 | $ | 5,000,000 | $ | 5,000,000 | |||||||||
|
| |||||||||||||||
Alaska: 0.28% | ||||||||||||||||
| Variable Rate Demand Note ø: 0.28% | ||||||||||||||||
Alaska Housing Finance Corporation Series B (Housing Revenue, FHLB SPA) | 1.38 | 12-1-2041 | 2,400,000 | 2,400,000 | ||||||||||||
|
| |||||||||||||||
Arizona: 1.57% | ||||||||||||||||
| Variable Rate Demand Notes ø: 1.57% | ||||||||||||||||
Arizona Tender Option Bond Trust Receipts/Floater Certificates Series 2018-XF2537 (Utilities Revenue, Barclays Bank plc LOC, Barclays Bank plc LIQ) 144A | 1.44 | 12-1-2037 | 3,215,000 | 3,215,000 | ||||||||||||
Mesa AZ Utility System Clipper Tax-Exempt Certificate Trust Series 2009-33 (Miscellaneous Revenue, State Street Bank & Trust Company LIQ) | 1.43 | 7-1-2024 | 10,055,000 | 10,055,000 | ||||||||||||
| 13,270,000 | ||||||||||||||||
|
| |||||||||||||||
California: 9.73% | ||||||||||||||||
| Variable Rate Demand Notes ø: 9.73% | ||||||||||||||||
California HFFA Dignity Health Series A (Health Revenue, Barclays Bank plc LOC, Barclays Bank plc LIQ) 144A | 1.52 | 3-1-2042 | 6,730,000 | 6,730,000 | ||||||||||||
California Infrastructure & Economic Development Bank Saddleback Valley Christian Schools Project Series A (Miscellaneous Revenue, East West Bank LOC) 144A | 1.44 | 12-1-2040 | 14,250,000 | 14,250,000 | ||||||||||||
California Municipal Finance Authority High Desert Foundation Project Series 2012A (Education Revenue, Union Bank NA LOC) | 1.44 | 4-1-2042 | 1,150,000 | 1,150,000 | ||||||||||||
California State University Series A Tender Option Bond Trust Receipts/Certificates Series 2017-XF2441 (Education Revenue, JPMorgan Chase & Company LIQ) 144A | 1.38 | 5-1-2024 | 7,670,000 | 7,670,000 | ||||||||||||
California Statewide Community Development Authority Uptown Newport Apartments Series 2017 AA & BB (Housing Revenue, East West Bank LOC) | 1.44 | 3-1-2057 | 6,975,000 | 6,975,000 | ||||||||||||
California Tender Option Bond Trust Receipts/Certificates Series 2017-XF0580 (GO Revenue, TD Bank NA LIQ) 144A | 1.40 | 11-1-2033 | 3,375,000 | 3,375,000 | ||||||||||||
California Tender Option Bond Trust Receipts/Certificates Series 2018-XF0669 (GO Revenue, Royal Bank of Canada LIQ) 144A | 1.41 | 2-1-2026 | 2,500,000 | 2,500,000 | ||||||||||||
California Tender Option Bond Trust Receipts/Certificates Series 2018-XF2630 (Health Revenue, Barclays Bank plc LOC, Barclays Bank plc LIQ) 144A | 1.40 | 8-1-2045 | 2,900,000 | 2,900,000 | ||||||||||||
California Tender Option Bond Trust Receipts/Certificates Series 2018-XG0188 (GO Revenue, Royal Bank of Canada LIQ) 144A | 1.41 | 2-1-2026 | 1,600,000 | 1,600,000 | ||||||||||||
California Tender Option Bond Trust Receipts/Floater Certificates Series 2017-BAML01 (Transportation Revenue, Bank of America NA LIQ) 144A | 1.40 | 4-1-2047 | 18,445,000 | 18,445,000 | ||||||||||||
The accompanying notes are an integral part of these financial statements.
Retail Money Market Funds | 7
Table of Contents
Portfolio of investments—July 31, 2019 (unaudited)
| Interest rate | Maturity date | Principal | Value | |||||||||||||
| Variable Rate Demand Notes ø (continued) | ||||||||||||||||
California Tender Option Bond Trust Receipts/Floater Certificates Series 2018-ZP0159 (GO Revenue, JPMorgan Chase & Company LIQ) 144A | 1.55 | % | 8-1-2022 | $ | 4,500,000 | $ | 4,500,000 | |||||||||
Grossmont CA Union High School District Floaters Series 2015 (GO Revenue, Citibank NA LIQ) 144A | 1.50 | 8-1-2019 | 7,525,000 | 7,525,000 | ||||||||||||
San Francisco City & County CA Public Utilities Commission Series 3153X (Water & Sewer Revenue, Morgan Stanley Bank LIQ) 144A | 1.43 | 11-1-2039 | 2,190,000 | 2,190,000 | ||||||||||||
San Joaquin CA Delta Community College Tender Option Bond Trust Receipts/Certificates Series ZF0180 (GO Revenue, JPMorgan Chase & Company LIQ) 144A | 1.50 | 8-1-2022 | 2,415,000 | 2,415,000 | ||||||||||||
| 82,225,000 | ||||||||||||||||
|
| |||||||||||||||
Colorado: 2.17% | ||||||||||||||||
| Variable Rate Demand Notes ø: 2.17% | ||||||||||||||||
Colorado HFA Catholic Health Initiatives Series 2008-D2 (Health Revenue, Morgan Stanley Bank LIQ) 144A | 1.55 | 10-1-2037 | 9,000,000 | 9,000,000 | ||||||||||||
Colorado RBC Municipal Products Incorporated Trust Series 2018-E123 (Education Revenue, Royal Bank of Canada LOC, Royal Bank of Canada LIQ) 144A | 1.43 | 4-1-2020 | 7,500,000 | 7,500,000 | ||||||||||||
Colorado Tender Option Bond Trust Receipts/Certificates Series 2018-XF0668 (Health Revenue, Royal Bank of Canada LIQ) 144A | 1.43 | 5-15-2026 | 1,875,000 | 1,875,000 | ||||||||||||
| 18,375,000 | ||||||||||||||||
|
| |||||||||||||||
Connecticut: 0.87% | ||||||||||||||||
| Variable Rate Demand Notes ø: 0.87% | ||||||||||||||||
Connecticut Residual Interest Bond Floater Trust Series 2017-016 (Miscellaneous Revenue, Barclays Bank plc LOC, Barclays Bank plc LIQ) 144A | 1.44 | 6-1-2037 | 2,800,000 | 2,800,000 | ||||||||||||
Connecticut Tender Option Bond Trust Receipts/Floater Certificates Series 2017-YX1077 (Tax Revenue, Barclays Bank plc LIQ) 144A | 1.46 | 1-1-2036 | 4,550,000 | 4,550,000 | ||||||||||||
| 7,350,000 | ||||||||||||||||
|
| |||||||||||||||
District of Columbia: 1.42% | ||||||||||||||||
| Variable Rate Demand Notes ø: 1.42% | ||||||||||||||||
District of Columbia Community Connection Real Estate Foundation Issue Series 2007-A (Miscellaneous Revenue, Manufacturers & Traders LOC) | 1.45 | 7-1-2032 | 3,165,000 | 3,165,000 | ||||||||||||
District of Columbia Tender Option Bond Trust Receipts/Certificates Series 2018-XF0621 (Water & Sewer Revenue, Royal Bank of Canada LIQ) 144A | 1.43 | 4-1-2026 | 4,000,000 | 4,000,000 | ||||||||||||
District of Columbia Tender Option Bond Trust Receipts/Certificates Series 2019-ZF2784 (Housing Revenue, FHA Insured, Morgan Stanley Bank LIQ) 144A | 1.44 | 9-1-2039 | 2,800,000 | 2,800,000 | ||||||||||||
District of ColumbiaTender Option Bond Trust Receipts/Certificates Series 2019-ZF2785 (Housing Revenue, FHA Insured, Morgan Stanley Bank LIQ) 144A | 1.44 | 9-1-2039 | 2,070,000 | 2,070,000 | ||||||||||||
| 12,035,000 | ||||||||||||||||
|
| |||||||||||||||
Florida: 8.27% | ||||||||||||||||
| Variable Rate Demand Notes ø: 8.27% | ||||||||||||||||
Florida Tender Option Bond Trust Receipts/Certificates Series2017-ZM0571 (Health Revenue, Morgan Stanley Bank LIQ) 144A | 1.50 | 8-15-2047 | 4,730,000 | 4,730,000 | ||||||||||||
Florida Tender Option Bond Trust Receipts/Certificates Series2018-XF2523 (Health Revenue, Barclays Bank plc LIQ) 144A | 1.52 | 8-15-2047 | 6,000,000 | 6,000,000 | ||||||||||||
Florida Tender Option Bond Trust Receipts/Certificates Series2018-XF2530 (Health Revenue, Citibank NA LIQ) 144A | 1.50 | 8-15-2025 | 3,000,000 | 3,000,000 | ||||||||||||
Florida Tender Option Bond Trust Receipts/Certificates Series2018-XG0173 (Health Revenue, Credit Suisse LIQ) 144A | 1.50 | 10-1-2025 | 6,000,000 | 6,000,000 | ||||||||||||
The accompanying notes are an integral part of these financial statements.
8 | Retail Money Market Funds
Table of Contents
Portfolio of investments—July 31, 2019 (unaudited)
| Interest rate | Maturity date | Principal | Value | |||||||||||||
| Variable Rate Demand Notes ø (continued) | ||||||||||||||||
Florida Tender Option Bond Trust Receipts/Certificates Series2019-XF2817 (Health Revenue, Barclays Bank plc LIQ) 144A | 1.43 | % | 1-1-2046 | $ | 6,400,000 | $ | 6,400,000 | |||||||||
Florida Tender Option Bond Trust Receipts/Floater Certificates Series 2017-XF2517 (Health Revenue, Morgan Stanley Bank LIQ) 144A | 1.50 | 8-15-2047 | 1,500,000 | 1,500,000 | ||||||||||||
Highlands County FL Health Facilities Authority Adventist Health System Series A (Health Revenue) | 1.42 | 11-15-2037 | 5,090,000 | 5,090,000 | ||||||||||||
Highlands County FL Health Facilities Authority Adventist Health System Sunbelt Obligated Group Series 2012 I-2 (Health Revenue, Adventist Health System) | 1.39 | 11-15-2032 | 600,000 | 600,000 | ||||||||||||
Highlands County FL HFA Adventist Health System Series I5 (Health Revenue) | 1.42 | 11-15-2035 | 13,150,000 | 13,150,000 | ||||||||||||
Orange County FL Health Facilities Authority Series 2009C (Health Revenue, TD Bank NA LOC) | 1.39 | 1-1-2037 | 425,000 | 425,000 | ||||||||||||
Orange County FL School Board Certificate of Participation Series 2009A (Miscellaneous Revenue, AGC Insured, Morgan Stanley Bank LIQ) 144A | 1.53 | 8-1-2034 | 3,300,000 | 3,300,000 | ||||||||||||
Orlando & Orange County FL Expressway Authority Series 2007 (Transportation Revenue, BHAC/AGM Insured, Citibank NA LIQ) | 1.43 | 7-1-2042 | 6,000,000 | 6,000,000 | ||||||||||||
Pinellas County FL IDA Neighborly Care Network Project Series 2008 (Miscellaneous Revenue, Branch Banking & Trust LOC) | 1.40 | 8-1-2028 | 2,985,000 | 2,985,000 | ||||||||||||
Saint Lucie County FL Florida Power & Light Company (Industrial Development Revenue) | 1.48 | 9-1-2028 | 5,485,000 | 5,485,000 | ||||||||||||
Seminole County FL Tender Option Bond Trust Receipts/Floater Certificates Series ZF0444 (Tax Revenue, National Insured, JPMorgan Chase & Company LIQ) 144A | 1.55 | 4-1-2027 | 5,250,000 | 5,250,000 | ||||||||||||
| 69,915,000 | ||||||||||||||||
|
| |||||||||||||||
Georgia: 0.44% | ||||||||||||||||
| Variable Rate Demand Note ø: 0.44% | ||||||||||||||||
Georgia Tender Option Bond Trust Receipts/Certificates Series 2017-ZF0589 (Education Revenue, Bank of America NA LIQ) 144A | 1.44 | 6-1-2049 | 3,750,000 | 3,750,000 | ||||||||||||
|
| |||||||||||||||
Illinois: 9.21% | ||||||||||||||||
| Variable Rate Demand Notes ø: 9.21% | ||||||||||||||||
Aurora IL Economic Development Aurora University Series 2004 (Education Revenue, BMO Harris Bank NA LOC) | 1.40 | 3-1-2035 | 7,000,000 | 7,000,000 | ||||||||||||
Chicago IL Education Marine Project Series 1984 (Industrial Development Revenue, FHLB LOC) | 1.50 | 7-1-2023 | 4,200,000 | 4,200,000 | ||||||||||||
Chicago IL O’Hare International 3rd Lien Series C (Airport Revenue, Bank of America NA LOC) | 1.43 | 1-1-2035 | 2,800,000 | 2,800,000 | ||||||||||||
Illinois Educational Facilities Authority Aurora University (Education Revenue, Harris NA LOC) | 1.40 | 3-1-2032 | 4,600,000 | 4,600,000 | ||||||||||||
Illinois Finance Authority Northwest Community Hospital Series C (Health Revenue, JPMorgan Chase & Company LOC) | 1.41 | 7-1-2032 | 475,000 | 475,000 | ||||||||||||
Illinois Finance Authority Series B (Health Revenue, Northern Trust Company LOC) | 1.38 | 2-15-2033 | 1,400,000 | 1,400,000 | ||||||||||||
Illinois Health Facilities Authority Evanston Hospital Corporation Series 1995 (Health Revenue, JPMorgan Chase & Company SPA) | 1.44 | 6-1-2035 | 9,500,000 | 9,500,000 | ||||||||||||
Illinois International Port District Facilities (Airport Revenue, U.S. Bank NA LOC) | 1.55 | 1-1-2023 | 3,950,000 | 3,950,000 | ||||||||||||
Illinois Tender Option Bond Trust Floaters Series 2018-XM0683 (Tax Revenue, Bank of America NA LIQ) 144A | 1.57 | 1-1-2048 | 8,340,000 | 8,340,000 | ||||||||||||
Illinois Tender Option Bond Trust Floaters Series 2018-XF0722 (Tax Revenue, Royal Bank of Canada LIQ) 144A | 1.55 | 7-1-2026 | 7,900,000 | 7,900,000 | ||||||||||||
Illinois Tender Option Bond Trust Receipts/Certificates Series XF2202 (Transportation Revenue, Citibank NA LIQ) 144A | 1.43 | 7-1-2023 | 1,140,000 | 1,140,000 | ||||||||||||
The accompanying notes are an integral part of these financial statements.
Retail Money Market Funds | 9
Table of Contents
Portfolio of investments—July 31, 2019 (unaudited)
| Interest rate | Maturity date | Principal | Value | |||||||||||||
| Variable Rate Demand Notes ø (continued) | ||||||||||||||||
Illinois Tender Option Bond Trust Receipts/Certificates Series ZM0120 (Transportation Revenue, Royal Bank of Canada LIQ) 144A | 1.46 | % | 7-1-2023 | $ | 3,100,000 | $ | 3,100,000 | |||||||||
Illinois Tender Option Bond Trust Receipts/Floater Certificates Series 2017-XG0108 (Tax Revenue, Barclays Bank plc LOC, Barclays Bank plc LIQ) 144A | 1.58 | 4-1-2046 | 11,000,000 | 11,000,000 | ||||||||||||
Illinois Tender Option Bond Trust Receipts/Certificates Series 2019-XF0779 (Tax Revenue, Build America Mutual Assurance Company Insured, TD Bank NA LIQ) 144A | 1.48 | 1-1-2048 | 4,000,000 | 4,000,000 | ||||||||||||
Illinois Tender Option Bond Trust Receipts/Floater Certificates Series 2018-XF0603 (Tax Revenue, Royal Bank of Canada LIQ) 144A | 1.55 | 1-1-2026 | 3,615,000 | 3,615,000 | ||||||||||||
Quad Cities Illinois Regional EDA Augustana College Series 2005 (Education Revenue, Harris NA LOC) | 1.40 | 10-1-2035 | 4,800,000 | 4,800,000 | ||||||||||||
| 77,820,000 | ||||||||||||||||
|
| |||||||||||||||
Indiana: 1.32% | ||||||||||||||||
| Variable Rate Demand Notes ø: 1.32% | ||||||||||||||||
Indiana Certificate of Participation Clipper Tax-Exempt Certificate Trust Series 2009-34 (Miscellaneous Revenue, State Street Bank & Trust Company LIQ) | 1.44 | 7-1-2023 | 9,915,000 | 9,915,000 | ||||||||||||
Indiana Finance Authority Duke Energy Indiana Incorporated Series 2009A-4 (Industrial Development Revenue, Sumitomo Mitsui Banking LOC) | 1.48 | 12-1-2039 | 1,200,000 | 1,200,000 | ||||||||||||
| 11,115,000 | ||||||||||||||||
|
| |||||||||||||||
Iowa: 3.47% | ||||||||||||||||
| Variable Rate Demand Notes ø: 3.47% | ||||||||||||||||
Iowa Finance Authority Midwestern Disaster Area Project (Industrial Development Revenue, Korea Development Bank LOC) | 1.93 | 4-1-2022 | 23,840,000 | 23,840,000 | ||||||||||||
Iowa Finance Authority Mortgage Securities Program Series D (Housing Revenue, GNMA/FNMA/FHLMC Insured, FHLB SPA) | 1.40 | 1-1-2047 | 5,500,000 | 5,500,000 | ||||||||||||
| 29,340,000 | ||||||||||||||||
|
| |||||||||||||||
Kentucky: 0.65% | ||||||||||||||||
| Variable Rate Demand Note ø: 0.65% | ||||||||||||||||
Kentucky Tender Option Bond Trust Receipts/Floater Certificates Series 2018-XG0161 (Tax Revenue, Bank of America NA LOC, AGM Insured, Bank of America NA LIQ) 144A | 1.43 | 12-1-2041 | 5,460,000 | 5,460,000 | ||||||||||||
|
| |||||||||||||||
Louisiana: 1.46% | ||||||||||||||||
| Variable Rate Demand Note ø: 1.46% | ||||||||||||||||
Louisiana Tender Option Bond Trust Receipts/Floater Certificates Series 2018-BAML7002 (Health Revenue, Bank of America NA LOC, Bank of America NA LIQ) 144A | 1.44 | 9-1-2057 | 12,325,000 | 12,325,000 | ||||||||||||
|
| |||||||||||||||
Maryland: 0.39% | ||||||||||||||||
| Variable Rate Demand Note ø: 0.39% | ||||||||||||||||
Maryland Tender Option Bond Trust Receipts/Certificates Series 2018-XF0605 (Education Revenue, Bank of America NA LIQ) 144A | 1.45 | 5-1-2047 | 3,300,000 | 3,300,000 | ||||||||||||
|
| |||||||||||||||
Massachusetts: 0.11% | ||||||||||||||||
| Variable Rate Demand Note ø: 0.11% | ||||||||||||||||
Massachusetts Health & Education Facilities Authority Partners Healthcare Systems Series F3 (Health Revenue, TD Bank NA LOC) | 1.39 | 7-1-2040 | 900,000 | 900,000 | ||||||||||||
|
| |||||||||||||||
The accompanying notes are an integral part of these financial statements.
10 | Retail Money Market Funds
Table of Contents
Portfolio of investments—July 31, 2019 (unaudited)
| Interest rate | Maturity date | Principal | Value | |||||||||||||
Michigan: 1.29% | ||||||||||||||||
| Variable Rate Demand Notes ø: 1.29% | ||||||||||||||||
Michigan Housing Development Authority Series D (Housing Revenue, Industrial and Commercial Bank of China Limited SPA) | 1.41 | % | 6-1-2030 | $ | 1,455,000 | $ | 1,455,000 | |||||||||
St. Joseph MI Hospital Finance Authority Lakeland Hospital Niles & St. Joseph Obligated Group Series 2002 (Health Revenue, AGM Insured, JPMorgan Chase & Company SPA) | 1.50 | 1-1-2032 | 9,460,000 | 9,460,000 | ||||||||||||
| 10,915,000 | ||||||||||||||||
|
| |||||||||||||||
Minnesota: 1.61% | ||||||||||||||||
| Variable Rate Demand Notes ø: 1.61% | ||||||||||||||||
Burnsville MN Bridgeway Apartments Project Series 2003 (Housing Revenue, FNMA LOC, FNMA LIQ) | 1.48 | 10-15-2033 | 2,375,000 | 2,375,000 | ||||||||||||
Forest Lake MN Kilkenny Court Apartments Project Series 2008 (Housing Revenue, FNMA LOC, FNMA LIQ) | 1.49 | 8-15-2038 | 4,500,000 | 4,500,000 | ||||||||||||
Maple Grove MN MFHR Basswood Trails Apartment Project Series 2002 (Housing Revenue, FHLMC LIQ) | 1.48 | 3-1-2029 | 2,340,000 | 2,340,000 | ||||||||||||
Plymouth MN Lancaster Village Apartments Project Series 2001 (Housing Revenue, FNMA LOC, FNMA LIQ) | 1.48 | 9-15-2031 | 2,865,000 | 2,865,000 | ||||||||||||
Rochester MN MFHR Bella Grove Apartments Project Series 2019B (Housing Revenue, United Fidelity Bank LOC) | 1.51 | 5-1-2061 | 1,500,000 | 1,500,000 | ||||||||||||
| 13,580,000 | ||||||||||||||||
|
| |||||||||||||||
Missouri: 3.33% | ||||||||||||||||
| Variable Rate Demand Notes ø: 3.33% | ||||||||||||||||
Missouri Development Finance Board Kauffman Center Performing Arts Project Series 2007-A (Miscellaneous Revenue, PNC Bank NA SPA) | 1.51 | 6-1-2037 | 10,000,000 | 10,000,000 | ||||||||||||
Missouri Tender Option Bond Trust Receipts/Certificates Series 2018-XG0176 (Health Revenue, Royal Bank of Canada LIQ) 144A | 1.50 | 5-15-2041 | 8,000,000 | 8,000,000 | ||||||||||||
Missouri Tender Option Bond Trust Receipts/Certificates Series XF2198 (Water & Sewer Revenue, Citibank NA LIQ) 144A | 1.43 | 5-1-2023 | 2,670,000 | 2,670,000 | ||||||||||||
St. Louis County MO Sewer District Wastewater System Series 2013-B (Water & Sewer Revenue, Morgan Stanley Bank LIQ) 144A | 1.43 | 5-1-2043 | 7,500,000 | 7,500,000 | ||||||||||||
| 28,170,000 | ||||||||||||||||
|
| |||||||||||||||
Nebraska: 1.24% | ||||||||||||||||
| Variable Rate Demand Note ø: 1.24% | ||||||||||||||||
Nebraska Investment Finance Authority MFHR Apple Creek Associates Project Series 1985-A (Housing Revenue, Northern Trust Company LOC) | 2.36 | 9-1-2031 | 10,500,000 | 10,500,000 | ||||||||||||
|
| |||||||||||||||
Nevada: 0.98% | ||||||||||||||||
| Variable Rate Demand Notes ø: 0.98% | ||||||||||||||||
Nevada Tender Option Bond Trust Receipts/Certificates Series 2015-ZF0155 (GO Revenue, JPMorgan Chase & Company LIQ) 144A | 1.58 | 6-1-2020 | 5,000,000 | 5,000,000 | ||||||||||||
Nevada Tender Option Bond Trust Receipts/Certificates Series 2018-ZM0639 (GO Revenue, JPMorgan Chase & Company LIQ) 144A | 1.43 | 12-1-2025 | 3,240,000 | 3,240,000 | ||||||||||||
| 8,240,000 | ||||||||||||||||
|
| |||||||||||||||
New Jersey: 3.15% | ||||||||||||||||
| Variable Rate Demand Notes ø: 3.15% | ||||||||||||||||
New Jersey Tender Option Bond Trust Receipts/Certificates Series 2018-XG0205 (Education Revenue, Barclays Bank plc LOC, Barclays Bank plc LIQ) 144A | 1.43 | 12-15-2034 | 7,500,000 | 7,500,000 | ||||||||||||
The accompanying notes are an integral part of these financial statements.
Retail Money Market Funds | 11
Table of Contents
Portfolio of investments—July 31, 2019 (unaudited)
| Interest rate | Maturity date | Principal | Value | |||||||||||||
| Variable Rate Demand Notes ø (continued) | ||||||||||||||||
New Jersey Tender Option Bond Trust Receipts/Certificates Series 2016-XM0226 (Miscellaneous Revenue, BHAC/National Insured, Bank of America NA LIQ) 144A | 1.40 | % | 7-1-2026 | $ | 3,790,000 | $ | 3,790,000 | |||||||||
New Jersey Tender Option Bond Trust Receipts/Certificates Series 2017-ZF2476 (Education Revenue, Citibank NA LIQ) 144A | 1.41 | 11-1-2021 | 1,000,000 | 1,000,000 | ||||||||||||
New Jersey Tender Option Bond Trust Receipts/Certificates Series 2017-ZF2477 (Education Revenue, Citibank NA LIQ) 144A | 1.41 | 11-1-2021 | 2,000,000 | 2,000,000 | ||||||||||||
New Jersey Tender Option Bond Trust Receipts/Certificates Series 2018-XF2538 (Education Revenue, Barclays Bank plc LOC, Barclays Bank plc LIQ) 144A | 1.43 | 6-15-2040 | 2,810,000 | 2,810,000 | ||||||||||||
New Jersey Tender Option Bond Trust Receipts/Certificates Series 2018-XX1093 (Education Revenue, Barclays Bank plc LOC, Barclays Bank plc LIQ) 144A | 1.43 | 6-15-2031 | 9,500,000 | 9,500,000 | ||||||||||||
| 26,600,000 | ||||||||||||||||
|
| |||||||||||||||
New York: 10.73% | ||||||||||||||||
| Variable Rate Demand Notes ø: 10.73% | ||||||||||||||||
Metropolitan Transportation Authority New York Revenue Bond Series 2015E (Transportation Revenue, PNC Bank NA LOC) | 1.40 | 11-15-2045 | 900,000 | 900,000 | ||||||||||||
Metropolitan Transportation Authority New York Revenue Bond Sub Series 2012A-2 (Transportation Revenue, Bank of Montreal LOC) | 1.53 | 11-15-2041 | 10,500,000 | 10,500,000 | ||||||||||||
New York Battery Park City Authority Refunding Bond Series 2013-C JPMorgan Chase PUTTER/DRIVER Trust Series 5012 (Miscellaneous Revenue, JPMorgan Chase & Company LOC, JPMorgan Chase & Company LIQ) 144A | 1.53 | 11-1-2019 | 4,470,000 | 4,470,000 | ||||||||||||
New York Dormitory Authority Catholic Health Systems Obligated Group Revenue Bond Series 2019B (Health Revenue, Manufacturers & Traders LOC) | 1.40 | 7-1-2048 | 4,425,000 | 4,425,000 | ||||||||||||
New York Dormitory Authority Series 12 Clipper Tax-Exempt Certificate Trust Series 2009-35 (Miscellaneous Revenue, State Street Bank & Trust Company LIQ) 144A | 1.43 | 3-15-2022 | 3,770,000 | 3,770,000 | ||||||||||||
New York HFA Manhattan West Residential Housing Series A (Housing Revenue, Bank of China LOC) | 1.44 | 11-1-2049 | 5,470,000 | 5,470,000 | ||||||||||||
New York HFA Manhattan West Residential Housing Series 2015-A (Housing Revenue, Bank of China LOC) | 1.44 | 11-1-2049 | 9,250,000 | 9,250,000 | ||||||||||||
New York NY Fiscal Subordinate Bond Series 2017A-6 (GO Revenue, Landesbank Hessen-Thüringen SPA) | 1.49 | 8-1-2044 | 8,455,000 | 8,455,000 | ||||||||||||
New York NY Municipal Water Authority Series BB-1 (Water & Sewer Revenue, State Street Bank & Trust Company SPA) | 1.49 | 6-15-2049 | 4,100,000 | 4,100,000 | ||||||||||||
New York NY Municipal Water Finance Authority 2nd Generation Resolution Fiscal Year 2019 Series BB (Water & Sewer Revenue, Industrial and Commercial Bank of China Limited SPA) | 1.42 | 6-15-2051 | 10,000,000 | 10,000,000 | ||||||||||||
New York NY Municipal Water Finance Authority Fiscal 2010 Series CC (Water & Sewer Revenue, Barclays Bank plc SPA) | 1.40 | 6-15-2041 | 1,500,000 | 1,500,000 | ||||||||||||
New York NY Series E (GO Revenue, Bank of America NA LOC) | 1.35 | 8-1-2034 | 900,000 | 900,000 | ||||||||||||
New York NY Transitional Finance Authority Future Tax Secured Tax-Exempt Bond Fiscal 2015 Subordinate Bond Series A-3 (Tax Revenue, Mizuho Bank Limited SPA) | 1.51 | 8-1-2043 | 2,000,000 | 2,000,000 | ||||||||||||
New York Tender Option Bond Trust Receipts/Floater Certificates Series 2019-BAML3002 (Miscellaneous Revenue, Bank of America NA LIQ) 144A | 1.48 | 1-15-2056 | 14,905,377 | 14,905,377 | ||||||||||||
RBC Municipal Products Incorporated Trust Series E-99 (Tax Revenue, Royal Bank of Canada LOC, Royal Bank of Canada LIQ) 144A | 1.43 | 8-1-2021 | 10,000,000 | 10,000,000 | ||||||||||||
| 90,645,377 | ||||||||||||||||
|
| |||||||||||||||
The accompanying notes are an integral part of these financial statements.
12 | Retail Money Market Funds
Table of Contents
Portfolio of investments—July 31, 2019 (unaudited)
| Interest rate | Maturity date | Principal | Value | |||||||||||||
North Carolina: 1.17% |
| |||||||||||||||
| Variable Rate Demand Notes ø: 1.17% | ||||||||||||||||
Charlotte NC Water & Sewer Tender Option Bond Trust Receipts/Certificates Series 2018-XG0170 (Water & Sewer Revenue, Royal Bank of Canada LIQ) 144A | 1.43 | % | 1-1-2026 | $ | 2,430,000 | $ | 2,430,000 | |||||||||
Greensboro NC (GO Revenue, Bank of America NA SPA) | 1.44 | 2-1-2022 | 25,000 | 25,000 | ||||||||||||
North Carolina Tender Option Bond Trust Receipts/Certificates Series 2015-ZM0105 (Education Revenue, Morgan Stanley Bank LIQ) 144A | 1.43 | 10-1-2055 | 2,250,500 | 2,250,500 | ||||||||||||
North Carolina Tender Option Bond Trust Receipts/Certificates Series 2017-ZF2490 (Airport Revenue, Barclays Bank plc LIQ) 144A | 1.43 | 7-1-2042 | 3,750,000 | 3,750,000 | ||||||||||||
University of North Carolina Chapel Hill Series 2009- A (Education Revenue, TD Bank NA SPA) | 1.39 | 2-1-2024 | 1,400,000 | 1,400,000 | ||||||||||||
| 9,855,500 | ||||||||||||||||
|
| |||||||||||||||
Ohio: 6.96% | ||||||||||||||||
| Variable Rate Demand Notes ø: 6.96% | ||||||||||||||||
Allen County OH Catholic Healthcare Series C (Health Revenue, BMO Harris Bank NA LOC) | 1.48 | 6-1-2034 | 10,000,000 | 10,000,000 | ||||||||||||
Montgomery County OH Catholic Health Initiatives Series A (Health Revenue, Morgan Stanley Bank LIQ) 144A | 1.55 | 5-1-2034 | 8,825,000 | 8,825,000 | ||||||||||||
Ohio Capital Facilities Lease Adult Correctional Building Fund Series C (Miscellaneous Revenue) | 1.49 | 10-1-2036 | 7,100,000 | 7,100,000 | ||||||||||||
Ohio Cleveland Health System Obligated Group Series 2019F (Health Revenue, U.S. Bank NA SPA) | 1.48 | 1-1-2052 | 7,900,000 | 7,900,000 | ||||||||||||
Ohio Tender Option Bond Trust Receipts/Certificates Series 2017-XF2438 (Education Revenue, JPMorgan Chase & Company LIQ) 144A | 1.43 | 12-1-2024 | 2,000,000 | 2,000,000 | ||||||||||||
Ohio Tender Option Bond Trust Receipts/Certificates Series 2018-XL0074 (Health Revenue, JPMorgan Chase & Company LIQ) 144A | 1.60 | 8-1-2024 | 5,580,000 | 5,580,000 | ||||||||||||
RBC Municipal Products Incorporated Trust Series E-110 (Water & Sewer Revenue, Royal Bank of Canada LOC, Royal Bank of Canada LIQ) 144A | 1.43 | 10-1-2020 | 8,000,000 | 8,000,000 | ||||||||||||
Tender Option Bond Trust Receipts/Certificates Northeast Regional Ohio Sewer District Wastewater Series 2015-XF0225 (Water & Sewer Revenue, TD Bank NA LIQ) 144A | 1.43 | 3-1-2021 | 9,375,000 | 9,375,000 | ||||||||||||
| 58,780,000 | ||||||||||||||||
|
| |||||||||||||||
Oregon: 0.73% | ||||||||||||||||
| Variable Rate Demand Note ø: 0.73% | ||||||||||||||||
Oregon Health & Science University Series 2012B-3 (Education Revenue, U.S. Bank NA LOC) | 1.47 | 7-1-2042 | 6,185,000 | 6,185,000 | ||||||||||||
|
| |||||||||||||||
Other: 1.89% | ||||||||||||||||
| Variable Rate Demand Notes ø: 1.89% | ||||||||||||||||
Clipper Tax-Exempt Certificate Trust Series 2009-54 (Miscellaneous Revenue, State Street Bank & Trust Company LIQ) | 1.45 | 2-15-2028 | 14,990,000 | 14,990,000 | ||||||||||||
FHLMC MFHR Series M-031 Class A (Housing Revenue, FHLMC LIQ) | 1.43 | 12-15-2045 | 980,000 | 980,000 | ||||||||||||
| 15,970,000 | ||||||||||||||||
|
| |||||||||||||||
Pennsylvania: 2.33% | ||||||||||||||||
| Variable Rate Demand Notes ø: 2.33% | ||||||||||||||||
Butler County PA Hospital Authority Series A (Health Revenue, BMO Harris Bank NA LOC) | 1.41 | 10-1-2042 | 700,000 | 700,000 | ||||||||||||
Pennsylvania Tender Option Bond Trust Receipts/Certificates Series 2016 - ZF0504 (Water & Sewer Revenue, TD Bank NA LIQ) 144A | 1.55 | 8-15-2042 | 4,875,000 | 4,875,000 | ||||||||||||
The accompanying notes are an integral part of these financial statements.
Retail Money Market Funds | 13
Table of Contents
Portfolio of investments—July 31, 2019 (unaudited)
| Interest rate | Maturity date | Principal | Value | |||||||||||||
| Variable Rate Demand Notes ø (continued) | ||||||||||||||||
Pennsylvania Tender Option Bond Trust Receipts/Certificates Series 2018-YX1089 (GO Revenue, Barclays Bank plc LIQ) 144A | 1.43 | % | 3-1-2035 | $ | 2,540,000 | $ | 2,540,000 | |||||||||
South Central General Authority WellSpan Health Obliged Group Revenue Bond Series 2019E (Health Revenue, U.S. Bank NA SPA) | 1.47 | 6-1-2035 | 5,000,000 | 5,000,000 | ||||||||||||
Southcentral Pennsylvania General Authority WellSpan Health Obliged Group Series 2014A Tender Option Bond Trust Receipts/Certificates Series 2015-ZM0081 (Health Revenue, Morgan Stanley Bank LIQ) 144A | 1.43 | 6-1-2044 | 3,000,000 | 3,000,000 | ||||||||||||
Southcentral Pennsylvania WellSpan Health Obligated Group Series 2019C (Health Revenue, Bank of America NA LIQ) | 1.43 | 6-1-2037 | 1,000,000 | 1,000,000 | ||||||||||||
Westmoreland County PA Municipal Authority Service Series 2016 Tender Option Bond Trust Receipts/Certificates Series 2017-ZF0539 (Water & Sewer Revenue, Build America Mutual Assurance Company Insured, TD Bank NA LIQ) 144A | 1.55 | 8-15-2038 | 2,615,000 | 2,615,000 | ||||||||||||
| 19,730,000 | ||||||||||||||||
|
| |||||||||||||||
Rhode Island: 1.18% | ||||||||||||||||
| Variable Rate Demand Note ø: 1.18% | ||||||||||||||||
Narragansett Bay RI Commission Wastewater System Series 2013-A Tender Option Trust Receipts/Certificates Series 2016-XM0140 (Water & Sewer Revenue, Royal Bank of Canada LIQ) 144A | 1.45 | 9-1-2020 | 10,000,000 | 10,000,000 | ||||||||||||
|
| |||||||||||||||
South Carolina: 2.78% | ||||||||||||||||
| Variable Rate Demand Notes ø: 2.78% | ||||||||||||||||
Columbia SC Waterworks Series 2009 (Water & Sewer Revenue, Sumitomo Mitsui Banking LOC) | 1.40 | 2-1-2038 | 1,760,000 | 1,760,000 | ||||||||||||
South Carolina Educational Facilities Authority for Private Non-Profit Institutions Higher Learning Educational Facilities Spartanburg Methodist Series 2005 (Education Revenue, Branch Banking & Trust LOC) | 1.42 | 8-1-2025 | 2,100,000 | 2,100,000 | ||||||||||||
South Carolina Jobs Economic Development Authority Prisma Health Obligated Group Series 2018B (Health Revenue, U.S. Bank NA LOC) | 1.48 | 5-1-2048 | 10,385,000 | 10,385,000 | ||||||||||||
South Carolina Jobs EDA Institutional Business & Home Safety Project Series 2009 (Industrial Development Revenue, Branch Banking & Trust LOC) | 1.44 | 11-1-2034 | 1,265,000 | 1,265,000 | ||||||||||||
South Carolina Tender Option Bond Trust Receipts/Floater Certificates Patriots Energy Group Financing Agency Series 2018-XM0690 (Utilities Revenue, Royal Bank of Canada LIQ) 144A | 1.44 | 10-1-2022 | 8,000,000 | 8,000,000 | ||||||||||||
| 23,510,000 | ||||||||||||||||
|
| |||||||||||||||
Tennessee: 0.39% | ||||||||||||||||
| Variable Rate Demand Note ø: 0.39% | ||||||||||||||||
Sevier County TN Public Building Authority Local Government Public Improvement Series 6-A1 (Miscellaneous Revenue, Branch Banking & Trust SPA) | 1.42 | 6-1-2029 | 3,260,000 | 3,260,000 | ||||||||||||
|
| |||||||||||||||
Texas: 5.93% | ||||||||||||||||
| Variable Rate Demand Notes ø: 5.93% | ||||||||||||||||
Bexar County TX Housing Finance Corporation Palisades Park Apartments Project Series 2009 (Housing Revenue, FHLMC LIQ) | 1.48 | 9-1-2039 | 3,700,000 | 3,700,000 | ||||||||||||
Brazos Harbor TX Industrial Development Corporation BASF Corporation Project Series 2001 (Industrial Development Revenue, BASF SE) | 1.47 | 7-1-2022 | 4,900,000 | 4,900,000 | ||||||||||||
Harris County TX Cultural Educational Facilities Finance Corporation Children’s Hospital Project Series 2009 Citigroup ROC Series 11821 (Health Revenue, Citibank NA LIQ) 144A | 1.46 | 10-1-2039 | 2,000,000 | 2,000,000 | ||||||||||||
The accompanying notes are an integral part of these financial statements.
14 | Retail Money Market Funds
Table of Contents
Portfolio of investments—July 31, 2019 (unaudited)
| Interest rate | Maturity date | Principal | Value | |||||||||||||
| Variable Rate Demand Notes ø (continued) | ||||||||||||||||
Harris County TX Industrial Development Corporation (Industrial Development Revenue) | 1.47 | % | 3-1-2024 | $ | 7,500,000 | $ | 7,500,000 | |||||||||
Harris County TX Series 3060X (Transportation Revenue, Bank of America NA LIQ) 144A | 1.43 | 8-15-2038 | 3,980,000 | 3,980,000 | ||||||||||||
Houston TX Adjustable Refunding First Lien B-3 (Water & Sewer Revenue, Sumitomo Mitsui Banking LOC) | 1.41 | 5-15-2034 | 3,000,000 | 3,000,000 | ||||||||||||
Port Arthur TX Navigation District Industrial Development Corporation Total Petrochemicals USA Incorporated Project (Industrial Development Revenue, Total SA) | 1.47 | 6-1-2041 | 5,000,000 | 5,000,000 | ||||||||||||
Port Corpus Christi TX Solid Waste Disposal Flint Hills Resources Project Series 2002-B (Resource Recovery Revenue, Flint Hills Resources LLC) | 1.44 | 7-1-2029 | 4,200,000 | 4,200,000 | ||||||||||||
Tarrant County TX Cultural Educational Facilities Finance Corporation Christus Health Series 2008-C2 (Health Revenue, Bank of New York Mellon LOC) | 1.44 | 7-1-2047 | 6,405,000 | 6,405,000 | ||||||||||||
Tender Option Bond Trust Series 2019-XM0722 (GO Revenue, JPMorgan Chase & Company LIQ) 144A | 1.43 | 6-15-2025 | 3,670,000 | 3,670,000 | ||||||||||||
Texas Veterans Bonds Series 2018 (GO Revenue, FHLB LIQ) | 1.45 | 12-1-2049 | 4,855,000 | 4,855,000 | ||||||||||||
Texas Veterans Bonds (Miscellaneous Revenue, Sumitomo Mitsui Banking SPA) | 1.47 | 12-1-2047 | 870,000 | 870,000 | ||||||||||||
| 50,080,000 | ||||||||||||||||
|
| |||||||||||||||
Utah: 1.99% | ||||||||||||||||
| Variable Rate Demand Notes ø: 1.99% | ||||||||||||||||
Murray UT City Hospital IHC Health Services Incorporated Series C (Health Revenue) | 1.46 | 5-15-2036 | 5,000,000 | 5,000,000 | ||||||||||||
Murray UT City Hospital IHC Health Services Incorporated Series D (Health Revenue) | 1.46 | 5-15-2036 | 3,000,000 | 3,000,000 | ||||||||||||
Utah Tender Option Bond Trust Receipts/Certificates Series 2018-XG0171 (Health Revenue, Royal Bank of Canada LIQ) 144A | 1.46 | 11-15-2022 | 3,000,000 | 3,000,000 | ||||||||||||
Utah Tender Option Bond Trust Receipts/Floater Certificates Series 2017-ZF0540 (Airport Revenue, JPMorgan Chase & Company LIQ) 144A | 1.60 | 1-1-2025 | 2,700,000 | 2,700,000 | ||||||||||||
Weber County UT Hospital IHC Health Services Series 2000-C (Health Revenue, Bank of New York Mellon SPA) | 1.48 | 2-15-2035 | 3,100,000 | 3,100,000 | ||||||||||||
| 16,800,000 | ||||||||||||||||
|
| |||||||||||||||
Vermont: 0.29% | ||||||||||||||||
| Variable Rate Demand Note ø: 0.29% | ||||||||||||||||
Vermont Educational & Health Buildings Financing Agency Landmark College Project Series 2008-A (Education Revenue, TD Bank NA LOC) | 1.49 | 7-1-2033 | 2,490,000 | 2,490,000 | ||||||||||||
|
| |||||||||||||||
Virginia: 0.86% | ||||||||||||||||
| Variable Rate Demand Notes ø: 0.86% | ||||||||||||||||
Virginia Public Building Authority Public Facilities Refunding Bonds Series 2015B | 1.49 | 8-1-2019 | 2,400,000 | 2,400,000 | ||||||||||||
Virginia Tender Option Bond Trust Receipts/Certificates Series 2017-XG0143 (Transportation Revenue, Citibank NA LIQ) 144A | 1.42 | 5-1-2025 | 4,890,000 | 4,890,000 | ||||||||||||
| 7,290,000 | ||||||||||||||||
|
| |||||||||||||||
Washington: 1.18% |
| |||||||||||||||
| Variable Rate Demand Note ø: 1.18% | ||||||||||||||||
Washington Tender Option Bond Trust Receipts/Floater Certificates Series 2018-XM0681 (Tax Revenue, Citibank NA LIQ) 144A | 1.46 | 7-1-2026 | 10,000,000 | 10,000,000 | ||||||||||||
|
| |||||||||||||||
The accompanying notes are an integral part of these financial statements.
Retail Money Market Funds | 15
Table of Contents
Portfolio of investments—July 31, 2019 (unaudited)
| Interest rate | Maturity date | Principal | Value | |||||||||||||
Wisconsin: 3.43% | ||||||||||||||||
| Variable Rate Demand Notes ø: 3.43% | ||||||||||||||||
Appleton WI Recovery Zone Facilities Foremost Farms Project Series 2010 (Industrial Development Revenue, CoBank ACB LOC) | 1.43 | % | 5-1-2037 | $ | 14,200,000 | $ | 14,200,000 | |||||||||
Milwaukee WI RDA Wisconsin Montessori Society (Education Revenue, U.S. Bank NA LOC) | 1.75 | 7-1-2021 | 250,000 | 250,000 | ||||||||||||
Wisconsin GO Series 2019A (GO Revenue) | 1.54 | 5-1-2029 | 1,500,000 | 1,500,000 | ||||||||||||
Wisconsin PFA Midwestern Disaster Area Program Series 2011 (Industrial Development Revenue, Farm Credit Services of America LOC) | 1.45 | 9-1-2036 | 3,265,000 | 3,265,000 | ||||||||||||
Wisconsin Tender Option Bond Trust Receipts/Certificates Series 2018-XF2634 (Health Revenue, Credit Suisse LIQ) 144A | 1.43 | 8-15-2025 | 2,000,000 | 2,000,000 | ||||||||||||
Wisconsin Tender Option Bond Trust Receipts/Certificates Series 2019-F2823 (Housing Revenue, Mizuho Capital Markets LLC LIQ) 144A | 1.50 | 1-1-2026 | 4,000,000 | 4,000,000 | ||||||||||||
Wisconsin Tender Option Bond Trust Receipts/Floater Certificates Series 2015-XF0127 (Health Revenue, JPMorgan Chase & Company LIQ) 144A | 1.58 | 10-1-2020 | 3,815,000 | 3,815,000 | ||||||||||||
| 29,030,000 | ||||||||||||||||
|
| |||||||||||||||
Wyoming: 1.58% | ||||||||||||||||
| Variable Rate Demand Note ø: 1.58% | ||||||||||||||||
Wyoming Tender Option Bond Trust Receipts/Certificates Series 2018 -XL0070 (Utilities Revenue, Build America Mutual Assurance Company Insured, JPMorgan Chase & Company LIQ) 144A | 1.43 | 1-1-2025 | 13,330,000 | 13,330,000 | ||||||||||||
|
| |||||||||||||||
Total Municipal Obligations (Cost $819,540,877) |
| 819,540,877 | ||||||||||||||
|
| |||||||||||||||
Repurchase Agreements: 1.18% | ||||||||||||||||
Barclays Capital Incorporated, dated 7-31-2019, maturity value $10,000,706 ^^ | 2.54 | 8-1-2019 | 10,000,000 | 10,000,000 | ||||||||||||
|
| |||||||||||||||
Total Repurchase Agreements (Cost $10,000,000) |
| 10,000,000 | ||||||||||||||
|
| |||||||||||||||
| Total investments in securities (Cost $839,540,877) | 99.33 | % | 839,540,877 | |||||
Other assets and liabilities, net | 0.67 | 5,626,300 | ||||||
|
|
|
| |||||
| Total net assets | 100.00 | % | $ | 845,167,177 | ||||
|
|
|
| |||||
| ø | Variable rate demand notes are subject to a demand feature which reduces the effective maturity. The maturity date shown represents the final maturity date of the security. The interest rate is determined and reset by the issuer daily, weekly, or monthly depending upon the terms of the security. The rate shown is the rate in effect at period end. |
| 144A | The security may be resold in transactions exempt from registration, normally to qualified institutional buyers, pursuant to Rule 144A under the Securities Act of 1933. |
| ^^ | Collateralized by U.S. government securities, 1.63% to 1.75%, 6-30-2021 to 7-15-2022, fair value including accrued interest is $10,200,000 |
The accompanying notes are an integral part of these financial statements.
16 | Retail Money Market Funds
Table of Contents
Portfolio of investments—July 31, 2019 (unaudited)
Abbreviations:
| AGC | Assured Guaranty Corporation |
| AGM | Assured Guaranty Municipal |
| AMT | Alternative minimum tax |
| BHAC | Berkshire Hathaway Assurance Corporation |
| DRIVER | Derivative inverse tax-exempt receipts |
| EDA | Economic Development Authority |
| FHA | Federal Housing Administration |
| FHLB | Federal Home Loan Bank |
| FHLMC | Federal Home Loan Mortgage Corporation |
| FNMA | Federal National Mortgage Association |
| GNMA | Government National Mortgage Association |
| GO | General obligation |
| HFA | Housing Finance Authority |
| HFFA | Health Facilities Financing Authority |
| IDA | Industrial Development Authority |
| LIQ | Liquidity agreement |
| LOC | Letter of credit |
| MFHR | Multifamily housing revenue |
| National | National Public Finance Guarantee Corporation |
| PFA | Public Finance Authority |
| PUTTER | Puttable tax-exempt receipts |
| RDA | Redevelopment Authority |
| ROC | Reset option certificates |
| SPA | Standby purchase agreement |
The accompanying notes are an integral part of these financial statements.
Retail Money Market Funds | 17
Table of Contents
Statement of assets and liabilities—July 31, 2019 (unaudited)
Assets | ||||
Investments in unaffiliated securities, at amortized cost | $ | 839,540,877 | ||
Cash | 217,401 | |||
Receivable for investments sold | 5,910,000 | |||
Receivable for Fund shares sold | 2,583,144 | |||
Receivable for interest | 2,251,100 | |||
Prepaid expenses and other assets | 86,002 | |||
|
| |||
Total assets | 850,588,524 | |||
|
| |||
Liabilities | ||||
Payable for Fund shares redeemed | 3,432,356 | |||
Payable for investments purchased | 1,500,000 | |||
Dividends payable | 126,992 | |||
Administration fees payable | 73,682 | |||
Management fee payable | 51,591 | |||
Trustees’ fees and expenses payable | 2,750 | |||
Accrued expenses and other liabilities | 233,976 | |||
|
| |||
Total liabilities | 5,421,347 | |||
|
| |||
Total net assets | $ | 845,167,177 | ||
|
| |||
Net assets consist of | ||||
Paid-in capital | $ | 845,031,927 | ||
Total distributable earnings | 135,250 | |||
|
| |||
Total net assets | $ | 845,167,177 | ||
|
| |||
Computation of net asset value per share | ||||
Net assets – Class A | $ | 94,749,138 | ||
Shares outstanding – Class A1 | 94,726,833 | |||
Net asset value per share – Class A | $1.00 | |||
Net assets – Administrator Class | $ | 122,192,481 | ||
Shares outstanding – Administrator Class1 | 122,163,686 | |||
Net asset value per share – Administrator Class | $1.00 | |||
Net assets – Premier Class | $ | 563,941,163 | ||
Shares outstanding – Premier Class1 | 563,806,356 | |||
Net asset value per share – Premier Class | $1.00 | |||
Net assets – Service Class | $ | 64,284,395 | ||
Shares outstanding – Service Class1 | 64,269,300 | |||
Net asset value per share – Service Class | $1.00 | |||
| 1 | The Fund has an unlimited number of authorized shares. |
The accompanying notes are an integral part of these financial statements.
18 | Retail Money Market Funds
Table of Contents
Statement of operations—six months ended July 31, 2019 (unaudited)
Investment income | ||||
Interest | $ | 7,264,013 | ||
|
| |||
Expenses | ||||
Management fee | 641,160 | |||
Administration fees | ||||
Class A | 107,385 | |||
Administrator Class | 61,852 | |||
Premier Class | 227,533 | |||
Service Class | 38,833 | |||
Shareholder servicing fees | ||||
Class A | 122,028 | |||
Administrator Class | 61,852 | |||
Service Class | 80,475 | |||
Custody and accounting fees | 29,443 | |||
Professional fees | 21,378 | |||
Registration fees | 99,355 | |||
Shareholder report expenses | 18,444 | |||
Trustees’ fees and expenses | 10,965 | |||
Other fees and expenses | 7,149 | |||
|
| |||
Total expenses | 1,527,852 | |||
Less: Fee waivers and/or expense reimbursements | (334,971 | ) | ||
|
| |||
Net expenses | 1,192,881 | |||
|
| |||
Net investment income | 6,071,132 | |||
Net realized gains on investments | 101,891 | |||
|
| |||
Net increase in net assets resulting from operations | $ | 6,173,023 | ||
|
| |||
The accompanying notes are an integral part of these financial statements.
Retail Money Market Funds | 19
Table of Contents
Statement of changes in net assets
Six months ended (unaudited) | Year ended January 31, 2019 | |||||||||||||||
Operations | ||||||||||||||||
Net investment income | $ | 6,071,132 | $ | 10,059,433 | ||||||||||||
Net realized gains on investments | 101,891 | 38,078 | ||||||||||||||
|
| |||||||||||||||
Net increase in net assets resulting from operations | 6,173,023 | 10,097,511 | ||||||||||||||
|
| |||||||||||||||
Distributions to shareholders from net investment income and net realized gains | ||||||||||||||||
Class A | (537,841 | ) | (983,009 | ) | ||||||||||||
Administrator Class | (866,709 | ) | (1,676,616 | ) | ||||||||||||
Premier Class | (4,261,670 | ) | (6,724,447 | ) | ||||||||||||
Service Class | (404,912 | ) | (680,815 | ) | ||||||||||||
|
| |||||||||||||||
Total distributions to shareholders | (6,071,132 | ) | (10,064,887 | ) | ||||||||||||
|
| |||||||||||||||
Capital share transactions | Shares | Shares | ||||||||||||||
Proceeds from shares sold | ||||||||||||||||
Class A | 14,003,115 | 14,003,115 | 35,451,170 | 35,451,170 | ||||||||||||
Administrator Class | 16,688,726 | 16,688,726 | 66,742,195 | 66,742,195 | ||||||||||||
Premier Class | 326,864,033 | 326,864,033 | 1,042,791,893 | 1,042,791,893 | ||||||||||||
Service Class | 2,526,101 | 2,526,101 | 9,248,032 | 9,248,032 | ||||||||||||
|
| |||||||||||||||
| 360,081,975 | 1,154,233,290 | |||||||||||||||
|
| |||||||||||||||
Reinvestment of distributions | ||||||||||||||||
Class A | 523,071 | 523,071 | 958,425 | 958,425 | ||||||||||||
Administrator Class | 846,779 | 846,779 | 1,643,597 | 1,643,597 | ||||||||||||
Premier Class | 3,579,878 | 3,579,878 | 5,170,672 | 5,170,672 | ||||||||||||
Service Class | 127,992 | 127,992 | 226,056 | 226,056 | ||||||||||||
|
| |||||||||||||||
| 5,077,720 | 7,998,750 | |||||||||||||||
|
| |||||||||||||||
Payment for shares redeemed | ||||||||||||||||
Class A | (21,464,308 | ) | (21,464,308 | ) | (54,253,118 | ) | (54,253,118 | ) | ||||||||
Administrator Class | (26,749,382 | ) | (26,749,382 | ) | (69,954,513 | ) | (69,954,513 | ) | ||||||||
Premier Class | (360,540,418 | ) | (360,540,418 | ) | (793,365,730 | ) | (793,365,730 | ) | ||||||||
Service Class | (4,058,602 | ) | (4,058,602 | ) | (10,252,475 | ) | (10,252,475 | ) | ||||||||
|
| |||||||||||||||
| (412,812,710 | ) | (927,825,836 | ) | |||||||||||||
|
| |||||||||||||||
Net increase (decrease) in net assets resulting from capital share transactions | (47,653,015 | ) | 234,406,204 | |||||||||||||
|
| |||||||||||||||
Total increase (decrease) in net assets | (47,551,124 | ) | 234,438,828 | |||||||||||||
|
| |||||||||||||||
Net assets | ||||||||||||||||
Beginning of period | 892,718,301 | 658,279,473 | ||||||||||||||
|
| |||||||||||||||
End of period | $ | 845,167,177 | $ | 892,718,301 | ||||||||||||
|
| |||||||||||||||
The accompanying notes are an integral part of these financial statements.
20 | Retail Money Market Funds
Table of Contents
(For a share outstanding throughout each period)
| Six months ended July 31, 2019 (unaudited) | Year ended January 31 | |||||||||||||||||||||||
| CLASS A | 2019 | 2018 | 2017 | 2016 | 2015 | |||||||||||||||||||
Net asset value, beginning of period | $1.00 | $1.00 | $1.00 | $1.00 | $1.00 | $1.00 | ||||||||||||||||||
Net investment income | 0.01 | 0.01 | 0.00 | 1 | 0.00 | 1 | 0.00 | 1 | 0.00 | 1 | ||||||||||||||
Net realized gains on investments | 0.00 | 1 | 0.00 | 1 | 0.00 | 1 | 0.00 | 1 | 0.00 | 1 | 0.00 | 1 | ||||||||||||
|
|
|
|
|
|
|
|
|
|
|
| |||||||||||||
Total from investment operations | 0.01 | 0.01 | 0.00 | 1 | 0.00 | 1 | 0.00 | 1 | 0.00 | 1 | ||||||||||||||
Distributions to shareholders from | ||||||||||||||||||||||||
Net investment income | (0.01 | ) | (0.01 | ) | (0.00 | )1 | (0.00 | )1 | (0.00 | )1 | (0.00 | )1 | ||||||||||||
Net realized gains | 0.00 | (0.00 | )1 | (0.00 | )1 | (0.00 | )1 | (0.00 | )1 | (0.00 | )1 | |||||||||||||
|
|
|
|
|
|
|
|
|
|
|
| |||||||||||||
Total distributions to shareholders | (0.01 | ) | (0.01 | ) | (0.00 | )1 | (0.00 | )1 | (0.00 | )1 | (0.00 | )1 | ||||||||||||
Net asset value, end of period | $1.00 | $1.00 | $1.00 | $1.00 | $1.00 | $1.00 | ||||||||||||||||||
Total return2 | 0.55 | % | 0.89 | % | 0.35 | % | 0.13 | % | 0.02 | % | 0.02 | % | ||||||||||||
Ratios to average net assets (annualized) | ||||||||||||||||||||||||
Gross expenses | 0.66 | % | 0.66 | % | 0.68 | % | 0.65 | % | 0.63 | % | 0.63 | % | ||||||||||||
Net expenses | 0.60 | % | 0.61 | % | 0.64 | % | 0.39 | % | 0.08 | % | 0.08 | % | ||||||||||||
Net investment income | 1.10 | % | 0.88 | % | 0.30 | % | 0.02 | % | 0.01 | % | 0.01 | % | ||||||||||||
Supplemental data | ||||||||||||||||||||||||
Net assets, end of period (000s omitted) | $94,749 | $101,680 | $119,524 | $135,704 | $172,725 | $123,525 | ||||||||||||||||||
| 1 | Amount is less than $0.005. |
| 2 | Returns for periods of less than one year are not annualized. |
The accompanying notes are an integral part of these financial statements.
Retail Money Market Funds | 21
Table of Contents
Financial highlights
(For a share outstanding throughout each period)
| Six months ended July 31, 2019 (unaudited) | Year ended January 31 | |||||||||||||||||||||||
| ADMINISTRATOR CLASS | 2019 | 2018 | 2017 | 2016 | 2015 | |||||||||||||||||||
Net asset value, beginning of period | $1.00 | $1.00 | $1.00 | $1.00 | $1.00 | $1.00 | ||||||||||||||||||
Net investment income | 0.01 | 0.01 | 0.01 | 0.00 | 1 | 0.00 | 1 | 0.00 | 1 | |||||||||||||||
Net realized gains on investments | 0.00 | 1 | 0.00 | 1 | 0.00 | 1 | 0.00 | 1 | 0.00 | 1 | 0.00 | 1 | ||||||||||||
|
|
|
|
|
|
|
|
|
|
|
| |||||||||||||
Total from investment operations | 0.01 | 0.01 | 0.01 | 0.00 | 1 | 0.00 | 1 | 0.00 | 1 | |||||||||||||||
Distributions to shareholders from | ||||||||||||||||||||||||
Net investment income | (0.01 | ) | (0.01 | ) | (0.01 | ) | (0.00 | )1 | (0.00 | )1 | (0.00 | )1 | ||||||||||||
Net realized gains | 0.00 | (0.00 | )1 | (0.00 | )1 | (0.00 | )1 | (0.00 | )1 | (0.00 | )1 | |||||||||||||
|
|
|
|
|
|
|
|
|
|
|
| |||||||||||||
Total distributions to shareholders | (0.01 | ) | (0.01 | ) | (0.01 | ) | (0.00 | )1 | (0.00 | )1 | (0.00 | )1 | ||||||||||||
Net asset value, end of period | $1.00 | $1.00 | $1.00 | $1.00 | $1.00 | $1.00 | ||||||||||||||||||
Total return2 | 0.70 | % | 1.21 | % | 0.69 | % | 0.33 | % | 0.02 | % | 0.02 | % | ||||||||||||
Ratios to average net assets (annualized) | ||||||||||||||||||||||||
Gross expenses | 0.39 | % | 0.39 | % | 0.41 | % | 0.40 | % | 0.36 | % | 0.36 | % | ||||||||||||
Net expenses | 0.30 | % | 0.30 | % | 0.30 | % | 0.27 | % | 0.08 | % | 0.08 | % | ||||||||||||
Net investment income | 1.40 | % | 1.21 | % | 0.64 | % | 0.22 | % | 0.01 | % | 0.01 | % | ||||||||||||
Supplemental data | ||||||||||||||||||||||||
Net assets, end of period (000s omitted) | $122,192 | $131,395 | $132,964 | $155,448 | $179,171 | $191,766 | ||||||||||||||||||
| 1 | Amount is less than $0.005. |
| 2 | Returns for periods of less than one year are not annualized. |
The accompanying notes are an integral part of these financial statements.
22 | Retail Money Market Funds
Table of Contents
Financial highlights
(For a share outstanding throughout each period)
| Six months ended July 31, 2019 (unaudited) | Year ended January 31 | |||||||||||||||||||||||
| PREMIER CLASS1 | 2019 | 2018 | 2017 | 2016 | 2015 | |||||||||||||||||||
Net asset value, beginning of period | $1.00 | $1.00 | $1.00 | $1.00 | $1.00 | $1.00 | ||||||||||||||||||
Net investment income | 0.01 | 0.01 | 0.01 | 0.00 | 2 | 0.00 | 2 | 0.00 | 2 | |||||||||||||||
Net realized gains on investments | 0.00 | 2 | 0.00 | 2 | 0.00 | 2 | 0.00 | 2 | 0.00 | 2 | 0.00 | 2 | ||||||||||||
|
|
|
|
|
|
|
|
|
|
|
| |||||||||||||
Total from investment operations | 0.01 | 0.01 | 0.01 | 0.00 | 2 | 0.00 | 2 | 0.00 | 2 | |||||||||||||||
Distributions to shareholders from | ||||||||||||||||||||||||
Net investment income | (0.01 | ) | (0.01 | ) | (0.01 | ) | (0.00 | )2 | (0.00 | )2 | (0.00 | )2 | ||||||||||||
Net realized gains | 0.00 | (0.00 | )2 | (0.00 | )2 | (0.00 | )2 | (0.00 | )2 | (0.00 | )2 | |||||||||||||
|
|
|
|
|
|
|
|
|
|
|
| |||||||||||||
Total distributions to shareholders | (0.01 | ) | (0.01 | ) | (0.01 | ) | (0.00 | )2 | (0.00 | )2 | (0.00 | )2 | ||||||||||||
Net asset value, end of period | $1.00 | $1.00 | $1.00 | $1.00 | $1.00 | $1.00 | ||||||||||||||||||
Total return3 | 0.75 | % | 1.31 | % | 0.79 | % | 0.41 | % | 0.02 | % | 0.02 | % | ||||||||||||
Ratios to average net assets (annualized) | ||||||||||||||||||||||||
Gross expenses | 0.27 | % | 0.27 | % | 0.28 | % | 0.25 | % | 0.24 | % | 0.24 | % | ||||||||||||
Net expenses | 0.20 | % | 0.20 | % | 0.20 | % | 0.18 | % | 0.08 | % | 0.08 | % | ||||||||||||
Net investment income | 1.50 | % | 1.31 | % | 0.79 | % | 0.18 | % | 0.01 | % | 0.01 | % | ||||||||||||
Supplemental data | ||||||||||||||||||||||||
Net assets, end of period (000s omitted) | $563,941 | $593,961 | $339,331 | $105,881 | $1,677,748 | $2,269,187 | ||||||||||||||||||
| 1 | Effective April 1, 2016, Institutional Class was renamed Premier Class. |
| 2 | Amount is less than $0.005. |
| 3 | Returns for periods of less than one year are not annualized. |
The accompanying notes are an integral part of these financial statements.
Retail Money Market Funds | 23
Table of Contents
Financial highlights
(For a share outstanding throughout each period)
| Six months ended July 31, 2019 (unaudited) | Year ended January 31 | |||||||||||||||||||||||
| SERVICE CLASS | 2019 | 2018 | 2017 | 2016 | 2015 | |||||||||||||||||||
Net asset value, beginning of period | $1.00 | $1.00 | $1.00 | $1.00 | $1.00 | $1.00 | ||||||||||||||||||
Net investment income | 0.01 | 0.01 | 0.01 | 0.00 | 1 | 0.00 | 1 | 0.00 | 1 | |||||||||||||||
Net realized gains on investments | 0.00 | 1 | 0.00 | 1 | 0.00 | 1 | 0.00 | 1 | 0.00 | 1 | 0.00 | 1 | ||||||||||||
|
|
|
|
|
|
|
|
|
|
|
| |||||||||||||
Total from investment operations | 0.01 | 0.01 | 0.01 | 0.00 | 1 | 0.00 | 1 | 0.00 | 1 | |||||||||||||||
Distributions to shareholders from | ||||||||||||||||||||||||
Net investment income | (0.01 | ) | (0.01 | ) | (0.01 | ) | (0.00 | )1 | (0.00 | )1 | (0.00 | )1 | ||||||||||||
Net realized gains | 0.00 | (0.00 | )1 | (0.00 | )1 | (0.00 | )1 | (0.00 | )1 | (0.00 | )1 | |||||||||||||
|
|
|
|
|
|
|
|
|
|
|
| |||||||||||||
Total distributions to shareholders | (0.01 | ) | (0.01 | ) | (0.01 | ) | (0.00 | )1 | (0.00 | )1 | (0.00 | )1 | ||||||||||||
Net asset value, end of period | $1.00 | $1.00 | $1.00 | $1.00 | $1.00 | $1.00 | ||||||||||||||||||
Total return2 | 0.62 | % | 1.06 | % | 0.54 | % | 0.20 | % | 0.02 | % | 0.02 | % | ||||||||||||
Ratios to average net assets (annualized) | ||||||||||||||||||||||||
Gross expenses | 0.56 | % | 0.56 | % | 0.58 | % | 0.54 | % | 0.53 | % | 0.52 | % | ||||||||||||
Net expenses | 0.45 | % | 0.45 | % | 0.45 | % | 0.32 | % | 0.08 | % | 0.08 | % | ||||||||||||
Net investment income | 1.25 | % | 1.05 | % | 0.49 | % | 0.03 | % | 0.01 | % | 0.01 | % | ||||||||||||
Supplemental data | ||||||||||||||||||||||||
Net assets, end of period (000s omitted) | $64,284 | $65,682 | $66,460 | $73,472 | $162,593 | $139,915 | ||||||||||||||||||
| 1 | Amount is less than $0.005. |
| 2 | Returns for periods of less than one year are not annualized. |
The accompanying notes are an integral part of these financial statements.
24 | Retail Money Market Funds
Table of Contents
Notes to financial statements (unaudited)
1. ORGANIZATION
Wells Fargo Funds Trust (the “Trust”), a Delaware statutory trust organized on March 10, 1999, is an open-end management investment company registered under the Investment Company Act of 1940, as amended (the “1940 Act”). As an investment company, the Trust follows the accounting and reporting guidance in Financial Accounting Standards Board (“FASB”) Accounting Standards Codification Topic 946, Financial Services – Investment Companies. These financial statements report on the Wells Fargo National Tax-Free Money Market Fund (the “Fund”) which is a diversified series of the Trust.
2. SIGNIFICANT ACCOUNTING POLICIES
The following significant accounting policies, which are consistently followed in the preparation of the financial statements of the Fund, are in conformity with U.S. generally accepted accounting principles which require management to make estimates and assumptions that affect the reported amounts of assets and liabilities, disclosure of contingent assets and liabilities at the date of the financial statements, and the reported amounts of revenues and expenses during the reporting period. Actual results could differ from those estimates.
Securities valuation
As permitted under Rule 2a-7 of the 1940 Act, portfolio securities are valued at amortized cost, which approximates fair value. The amortized cost method involves valuing a security at its cost, plus accretion of discount or minus amortization of premium over the period until maturity.
Investments which are not valued using the method discussed above are valued at their fair value, as determined in good faith by the Board of Trustees of the Fund. The Board of Trustees has established a Valuation Committee comprised of the Trustees and has delegated to it the authority to take any actions regarding the valuation of portfolio securities that the Valuation Committee deems necessary or appropriate, including determining the fair value of portfolio securities, unless the determination has been delegated to the Wells Fargo Asset Management Pricing Committee at Wells Fargo Funds Management, LLC (“Funds Management”). The Board of Trustees retains the authority to make or ratify any valuation decisions or approve any changes to the Valuation Procedures as it deems appropriate. On a quarterly basis, the Board of Trustees receives reports on any valuation actions taken by the Valuation Committee or the Wells Fargo Asset Management Pricing Committee which may include items for ratification.
Repurchase agreements
The Fund may invest in repurchase agreements and may participate in pooled repurchase agreement transactions with other funds advised by Funds Management. Repurchase agreements are agreements where the seller of a security to the Fund agrees to repurchase that security from the Fund at a mutually agreed upon time and price. The repurchase agreements must be fully collateralized based on values that are marked-to-market daily. The collateral may be held by an agent bank under a tri-party agreement. It is the custodian’s responsibility to value collateral daily and to take action to obtain additional collateral as necessary to maintain a market value equal to or greater than the resale price. The repurchase agreements are collateralized by securities issued or guaranteed by the U.S. Government, its agencies or instrumentalities. There could be potential loss to the Fund in the event that the Fund is delayed or prevented from exercising its rights to dispose of the collateral, including the risk of a possible decline in the value of the underlying obligations during the period in which the Fund seeks to assert its rights.
Security transactions and income recognition
Securities transactions are recorded on a trade date basis. Realized gains or losses are recorded on the basis of identified cost.
Interest income is accrued daily and bond discounts are accreted and premiums are amortized daily. To the extent debt obligations are placed on non-accrual status, any related interest income may be reduced by writing off interest receivables when the collection of all or a portion of interest has been determined to be doubtful based on consistently applied procedures and the fair value has decreased. If the issuer subsequently resumes interest payments or when the collectability of interest is reasonably assured, the debt obligation is removed from non-accrual status.
Distributions to shareholders
Distributions to shareholders from net investment income are declared daily and paid monthly. Distributions from net realized gains, if any, are recorded on the ex-dividend date and paid at least annually. Such distributions are determined in accordance with income tax regulations and may differ from U.S. generally accepted accounting principles. Dividend sources are estimated at the time of declaration. The tax character of distributions is determined as of the Fund’s fiscal year end. Therefore, a portion of the Fund’s distributions made prior to the Fund’s fiscal year end may be categorized as a tax return of capital at year end.
Retail Money Market Funds | 25
Table of Contents
Notes to financial statements (unaudited)
Federal and other taxes
The Fund intends to continue to qualify as a regulated investment company by distributing substantially all of its investment company taxable and tax-exempt income and any net realized capital gains (after reduction for capital loss carryforwards) sufficient to relieve it from all, or substantially all, federal income taxes. Accordingly, no provision for federal income taxes was required.
The Fund’s income and federal excise tax returns and all financial records supporting those returns for the prior three fiscal years are subject to examination by the federal and Delaware revenue authorities. Management has analyzed the Fund’s tax positions taken on federal, state, and foreign tax returns for all open tax years and does not believe that there are any uncertain tax positions that require recognition of a tax liability.
As of July 31, 2019, the cost of investments for federal income tax purposes is substantially the same as for financial reporting purposes.
Class allocations
The separate classes of shares offered by the Fund differ principally in shareholder servicing and administration fees. Class specific expenses are charged directly to that share class. Investment income, common fund-level expenses, and realized gains (losses) on investments are allocated daily to each class of shares based on the relative proportion of net assets of each class.
3. FAIR VALUATION MEASUREMENTS
Fair value measurements of investments are determined within a framework that has established a fair value hierarchy based upon the various data inputs utilized in determining the value of the Fund’s investments. The three-level hierarchy gives the highest priority to unadjusted quoted prices in active markets for identical assets or liabilities (Level 1) and the lowest priority to unobservable inputs (Level 3). The Fund’s investments are classified within the fair value hierarchy based on the lowest level of input that is significant to the fair value measurement. The inputs are summarized into three broad levels as follows:
| ∎ | Level 1 – quoted prices in active markets for identical securities |
| ∎ | Level 2 – other significant observable inputs (including quoted prices for similar securities, interest rates, prepayment speeds, credit risk, etc.) |
| ∎ | Level 3 – significant unobservable inputs (including the Fund’s own assumptions in determining the fair value of investments) |
The inputs or methodologies used for valuing investments in securities are not necessarily an indication of the risk associated with investing in those securities.
The following is a summary of the inputs used in valuing the Fund’s assets and liabilities as of July 31, 2019:
| Quoted prices (Level 1) | Other significant observable inputs (Level 2) | Significant (Level 3) | Total | |||||||||||||
Assets | ||||||||||||||||
Investments in: | ||||||||||||||||
Closed end municipal bond funds | $ | 0 | $ | 10,000,000 | $ | 0 | $ | 10,000,000 | ||||||||
Municipal obligations | 0 | 819,540,877 | 0 | 819,540,877 | ||||||||||||
Repurchase agreements | 0 | 10,000,000 | 0 | 10,000,000 | ||||||||||||
Total assets | $ | 0 | $ | 839,540,877 | $ | 0 | $ | 839,540,877 | ||||||||
Additional sector, industry or geographic detail is included in the Portfolio of Investments.
For the six months ended July 31, 2019, the Fund did not have any transfers into/out of Level 3.
4. TRANSACTIONS WITH AFFILIATES
Management fee
Funds Management, an indirect wholly owned subsidiary of Wells Fargo & Company (“Wells Fargo”), is the manager of the Fund and provides advisory and fund-level administrative services under an investment management agreement. Under the investment management agreement, Funds Management is responsible for, among other services, implementing the investment objectives and strategies of the Fund, supervising the subadviser and providing fund-level administrative services
26 | Retail Money Market Funds
Table of Contents
Notes to financial statements (unaudited)
in connection with the Fund’s operations. As compensation for its services under the investment management agreement, Funds Management is entitled to receive a management fee at the following annual rate based on the Fund’s average daily net assets:
| Average daily net assets | Management fee | |||
First $5 billion | 0.15 | % | ||
Next $5 billion | 0.14 | |||
Over $10 billion | 0.13 | |||
For the six months ended July 31, 2019 the management fee was equivalent to an annual rate of 0.15% of the Fund’s average daily net assets.
Funds Management has retained the services of a subadviser to provide daily portfolio management to the Fund. The fee for subadvisory services is borne by Funds Management. Wells Capital Management Incorporated, an affiliate of Funds Management and an indirect wholly owned subsidiary of Wells Fargo, is the subadviser to the Fund and is entitled to receive a fee from Funds Management at an annual rate starting at 0.05% and declining to 0.01% as the average daily net assets of the Fund increase.
Administration fees
Under a class-level administration agreement, Funds Management provides class-level administrative services to the Fund, which includes paying fees and expenses for services provided by the transfer agent, sub-transfer agents, omnibus account servicers and record-keepers. As compensation for its services under the class-level administration agreement, Funds Management receives an annual fee which is calculated based on the average daily net assets of each class as follows:
| Class-level administration fee | ||||
Class A | 0.22 | % | ||
Administrator Class | 0.10 | |||
Premier Class | 0.08 | |||
Service Class | 0.12 | |||
Waivers and/or expense reimbursements
Funds Management has contractually waived and/or reimbursed management and administration fees to the extent necessary to maintain certain net operating expense ratios for the Fund. When each class of the Fund has exceeded its expense cap, Funds Management has waived fees and/or reimbursed expenses from fund-level expenses on a proportionate basis and then from class specific expenses. When only certain classes exceed their expense caps, waivers and/or reimbursements are applied against class specific expenses before fund-level expenses. Funds Management has committed through May 31, 2020 to waive fees and/or reimburse expenses to the extent necessary to cap the Fund’s expenses at 0.60% for Class A shares, 0.30% for Administrator Class shares, 0.20% for Premier Class shares, and 0.45% for Service Class shares. Prior to or after the commitment expiration date, the cap may be increased or the commitment to maintain the cap may be terminated only with the approval of the Board of Trustees.
Shareholder servicing fees
The Trust has entered into contracts with one or more shareholder servicing agents, whereby Class A and Service Class of the Fund are charged a fee at an annual rate of 0.25% of the respective average daily net assets of each class. Administrator Class is charged a fee at an annual rate of 0.10% of its average daily net assets. A portion of these total shareholder servicing fees were paid to affiliates of Wells Fargo.
Interfund transactions
The Fund may purchase or sell portfolio investment securities to certain other Wells Fargo affiliates pursuant to Rule 17a-7 under the 1940 Act and under procedures adopted by the Board of Trustees. The procedures have been designed to ensure that these interfund transactions, which do not incur broker commissions, are effected at current market prices. Pursuant to these procedures, the Fund had $249,300,000 and $303,400,000 in interfund purchases and sales, respectively, during the six months ended July 31, 2019.
Retail Money Market Funds | 27
Table of Contents
Notes to financial statements (unaudited)
5. INDEMNIFICATION
Under the Trust’s organizational documents, the officers and Trustees have been granted certain indemnification rights against certain liabilities that may arise out of performance of their duties to the Trust. Additionally, in the normal course of business, the Trust may enter into contracts with service providers that contain a variety of indemnification clauses. The Trust’s maximum exposure under these arrangements is dependent on future claims that may be made against the Fund and, therefore, cannot be estimated.
6. NEW ACCOUNTING PRONOUNCEMENTS
In August 2018, FASB issued Accounting Standards Update (“ASU”) No. 2018-13, Fair Value Measurement (Topic 820)Disclosure Framework—Changes to the Disclosure Requirements for Fair Value Measurement. ASU 2018-13 updates the disclosure requirements for fair value measurements by modifying or removing certain disclosures and adding certain new disclosures. The amendments are effective for fiscal years, and interim periods within those fiscal years, beginning after December 15, 2019. Early adoption is permitted. Management has adopted the removal and modification of disclosures early, as permitted, and will adopt the additional new disclosures at the effective date.
In March 2017, FASB issued ASU No. 2017-08,Premium Amortization on Purchased Callable Debt Securities. ASU 2017-08 shortens the amortization period for certain callable debt securities held at a premium and requires the premium to be amortized to the earliest call date. The amendments do not require an accounting change for securities held at a discount and discounts will continue to be accreted to the maturity date of the security. ASU 2017-08 is effective for fiscal years beginning after December 15, 2018 and for interim periods within those fiscal years. During the current reporting period, management of the Fund adopted the change in accounting policy which did not have a material impact to the Fund’s financial statements.
28 | Retail Money Market Funds
Table of Contents
PROXY VOTING INFORMATION
A description of the policies and procedures used to determine how to vote proxies relating to portfolio securities is available, upon request, by calling1-800-222-8222, visiting our website atwfam.com, or visiting the SEC website at sec.gov. Information regarding how the proxies related to portfolio securities were voted during the most recent 12-month period ended June 30 is available on the website atwfam.comor by visiting the SEC website at sec.gov.
Retail Money Market Funds | 29
Table of Contents
Other information (unaudited)
BOARD OF TRUSTEES AND OFFICERS
Each of the Trustees and Officers1 listed in the table below acts in identical capacities for each fund in the Wells Fargo family of funds, which consists of 152 mutual funds comprising the Wells Fargo Funds Trust, Wells Fargo Variable Trust, Wells Fargo Master Trust and four closed-end funds (collectively the “Fund Complex”). This table should be read in conjunction with the Prospectus and the Statement of Additional Information2. The mailing address of each Trustee and Officer is 525 Market Street, 12th Floor, San Francisco, CA 94105. Each Trustee and Officer serves an indefinite term, however, each Trustee serves such term until reaching the mandatory retirement age established by the Trustees.
Independent Trustees
Name and year of birth | Position held and length of service* | Principal occupations during past five years or longer | Current other public company or investment company directorships | |||
William R. Ebsworth (Born 1957) | Trustee, since 2015 | Retired. From 1984 to 2013, equities analyst, portfolio manager, research director and chief investment officer at Fidelity Management and Research Company in Boston, Tokyo, and Hong Kong, and retired in 2013 as Chief Investment Officer of Fidelity Strategic Advisers, Inc. where he led a team of investment professionals managing client assets. Prior thereto, Board member of Hong Kong Securities Clearing Co., Hong Kong Options Clearing Corp., the Thailand International Fund, Ltd., Fidelity Investments Life Insurance Company, and Empire Fidelity Investments Life Insurance Company. Audit Committee Chair and Investment Committee Chair of the Vincent Memorial Hospital Endowment (non-profit organization). Mr. Ebsworth is a CFA® charterholder. | N/A | |||
Jane A. Freeman (Born 1953) | Trustee, since 2015; Chair Liaison, since 2018 | Retired. From 2012 to 2014 and 1999 to 2008, Chief Financial Officer of Scientific Learning Corporation. From 2008 to 2012, Ms. Freeman provided consulting services related to strategic business projects. Prior to 1999, Portfolio Manager at Rockefeller & Co. and Scudder, Stevens & Clark. Board member of the Harding Loevner Funds from 1996 to 2014, serving as both Lead Independent Director and chair of the Audit Committee. Board member of the Russell Exchange Traded Funds Trust from 2011 to 2012 and the chair of the Audit Committee. Ms. Freeman is a Board Member of The Ruth Bancroft Garden (non-profit organization). She is also an inactive Chartered Financial Analyst. | N/A | |||
Isaiah Harris, Jr. (Born 1952) | Trustee, since 2009; Audit Committee Chairman, since 2019 | Retired. Chairman of the Board of CIGNA Corporation since 2009, and Director since 2005. From 2003 to 2011, Director of Deluxe Corporation. Prior thereto, President and CEO of BellSouth Advertising and Publishing Corp. from 2005 to 2007, President and CEO of BellSouth Enterprises from 2004 to 2005 and President of BellSouth Consumer Services from 2000 to 2003. Emeritus member of the Iowa State University Foundation Board of Governors. Emeritus Member of the Advisory Board of Iowa State University School of Business. Advisory Board Member, Palm Harbor Academy (private school). Advisory Board Member, Child Evangelism Fellowship (non-profit). Mr. Harris is a certified public accountant (inactive status). | CIGNA Corporation | |||
Judith M. Johnson (Born 1949) | Trustee, since 2008; Audit Committee Chairman, from 2009 to 2018 | Retired. Prior thereto, Chief Executive Officer and Chief Investment Officer of Minneapolis Employees Retirement Fund from 1996 to 2008. Ms. Johnson is an attorney, certified public accountant and a certified managerial accountant. | N/A | |||
30 | Retail Money Market Funds
Table of Contents
Other information (unaudited)
Name and year of birth | Position held and length of service* | Principal occupations during past five years or longer | Current other public company or investment company directorships | |||
David F. Larcker (Born 1950) | Trustee, since 2009 | James Irvin Miller Professor of Accounting at the Graduate School of Business, Stanford University, Director of the Corporate Governance Research Initiative and Senior Faculty of The Rock Center for Corporate Governance since 2006. From 2005 to 2008, Professor of Accounting at the Graduate School of Business, Stanford University. Prior thereto, Ernst & Young Professor of Accounting at The Wharton School, University of Pennsylvania from 1985 to 2005. | N/A | |||
Olivia S. Mitchell (Born 1953) | Trustee, since 2006; Nominating and Governance Committee Chairman, since 2018 | International Foundation of Employee Benefit Plans Professor, Wharton School of the University of Pennsylvania since 1993. Director of Wharton’s Pension Research Council and Boettner Center on Pensions & Retirement Research, and Research Associate at the National Bureau of Economic Research. Previously, Cornell University Professor from 1978 to 1993. | N/A | |||
Timothy J. Penny (Born 1951) | Trustee, since 1996; Chairman, since 2018 | President and Chief Executive Officer of Southern Minnesota Initiative Foundation, a non-profit organization, since 2007. Member of the Board of Trustees of NorthStar Education Finance, Inc., a non-profit organization, since 2007. | N/A | |||
James G. Polisson (Born 1959) | Trustee, since 2018 | Retired. Chief Marketing Officer, Source (ETF) UK Services, Ltd, from 2015 to 2017. From 2012 to 2015, Principal of The Polisson Group, LLC, a management consulting, corporate advisory and principal investing company. Chief Executive Officer and Managing Director at Russell Investments, Global Exchange Traded Funds from 2010 to 2012. Managing Director of Barclays Global Investors from 1998 to 2010 and Global Chief Marketing Officer for iShares and Barclays Global Investors from 2000 to 2010. Trustee of the San Francisco Mechanics’ Institute, a non-profit organization, from 2013 to 2015. Board member of the Russell Exchange Traded Fund Trust from 2011 to 2012. Director of Barclays Global Investors Holdings Deutschland GmbH from 2006 to 2009. Mr. Polisson is an attorney and has a retired status with the Massachusetts and District of Columbia Bar Associations. | N/A | |||
| * | Length of service dates reflect the Trustee’s commencement of service with the Trust’s predecessor entities, where applicable. |
Retail Money Market Funds | 31
Table of Contents
Other information (unaudited)
Officers
Name and year of birth | Position held and length of service | Principal occupations during past five years or longer | ||
Andrew Owen (Born 1960) | President, since 2017 | Executive Vice President of Wells Fargo & Company and Head of Affiliated Managers, Wells Fargo Asset Management, since 2014. In addition, Mr. Owen is currently President, Chief Executive Officer and Director of Wells Fargo Funds Management, LLC since 2017. Prior thereto, Executive Vice President responsible for marketing, investments and product development for Wells Fargo Funds Management, LLC, from 2009 to 2014. | ||
Nancy Wiser1 (Born 1967) | Treasurer, since 2012 | Executive Vice President of Wells Fargo Funds Management, LLC since 2011. Chief Operating Officer and Chief Compliance Officer at LightBox Capital Management LLC, from 2008 to 2011. | ||
Alexander Kymn (Born 1973) | Secretary and Chief Legal Officer, since 2018 | Senior Company Counsel of Wells Fargo Bank, N.A. since 2018 (previously Senior Counsel from 2007 to 2018). Vice President of Wells Fargo Funds Management, LLC from 2008 to 2014. | ||
Michael H. Whitaker (Born 1967) | Chief Compliance Officer, since 2016 | Senior Vice President and Chief Compliance Officer since 2016. Senior Vice President and Chief Compliance Officer for Fidelity Investments from 2007 to 2016. | ||
David Berardi (Born 1975) | Assistant Treasurer, since 2009 | Vice President of Wells Fargo Funds Management, LLC since 2009. Vice President of Evergreen Investment Management Company, LLC from 2008 to 2010. Manager of Fund Reporting and Control for Evergreen Investment Management Company, LLC from 2004 to 2010. | ||
Jeremy DePalma1 (Born 1974) | Assistant Treasurer, since 2009 | Senior Vice President of Wells Fargo Funds Management, LLC since 2009. Senior Vice President of Evergreen Investment Management Company, LLC from 2008 to 2010 and head of the Fund Reporting and Control Team within Fund Administration from 2005 to 2010. | ||
| 1 | Nancy Wiser acts as Treasurer of 65 funds in the Fund Complex. Jeremy DePalma acts as Treasurer of 87 funds and Assistant Treasurer of 65 funds in the Fund Complex. |
| 2 | The Statement of Additional Information includes additional information about the Trustees and is available, without charge, upon request, by calling1-800-222-8222 or by visiting the website atwfam.com. |
32 | Retail Money Market Funds
Table of Contents
Other information (unaudited)
BOARD CONSIDERATION OF INVESTMENT MANAGEMENT ANDSUB-ADVISORY AGREEMENTS:
Wells Fargo National Tax-Free Money Market Fund
Under the Investment Company Act of 1940 (the “1940 Act”), the Board of Trustees (the “Board”) of Wells Fargo Funds Trust (the “Trust”) must determine annually whether to approve the continuation of the Trust’s investment management and sub-advisory agreements. In this regard, at an in-person meeting held on May 21-22, 2019 (the “Meeting”), the Board, all the members of which have no direct or indirect interest in the investment management and sub-advisory agreements and are not “interested persons” of the Trust, as defined in the 1940 Act (the “Independent Trustees”), reviewed and approved for Wells Fargo National Tax-Free Money Market Fund (the “Fund”): (i) an investment management agreement (the “Management Agreement”) with Wells Fargo Funds Management, LLC (“Funds Management”); and (ii) an investment sub-advisory agreement (the “Sub-Advisory Agreement”) with Wells Capital Management Incorporated (the “Sub-Adviser”), an affiliate of Funds Management. The Management Agreement and the Sub-Advisory Agreement are collectively referred to as the “Advisory Agreements.”
At the Meeting, the Board considered the factors and reached the conclusions described below relating to the selection of Funds Management and the Sub-Adviser and the approval of the Advisory Agreements. Prior to the Meeting, including at an in-person meeting in April 2019, the Trustees conferred extensively among themselves and with representatives of Funds Management about these matters. Also, the Board has adopted a team-based approach, with each team consisting of a sub-set of Trustees, to assist the full Board in the discharge of its duties in reviewing investment performance and other matters throughout the year. The Independent Trustees were assisted in their evaluation of the Advisory Agreements by independent legal counsel, from whom they received separate legal advice and with whom they met separately.
In providing information to the Board, Funds Management and the Sub-Adviser were guided by a detailed set of requests for information submitted to them by independent legal counsel on behalf of the Independent Trustees at the start of the Board’s annual contract renewal process earlier in 2019. In considering and approving the Advisory Agreements, the Trustees considered the information they believed relevant, including but not limited to the information discussed below. The Board considered not only the specific information presented in connection with the Meeting, but also the knowledge gained over time through interaction with Funds Management and the Sub-Adviser about various topics. In this regard, the Board reviewed reports of Funds Management at each of its quarterly meetings, which included, among other things, portfolio reviews and investment performance reports. In addition, the Board and the teams mentioned above confer with portfolio managers at various times throughout the year. The Board did not identify any particular information or consideration that was all-important or controlling, and each individual Trustee may have attributed different weights to various factors.
After its deliberations, the Board unanimously approved the continuation of the Advisory Agreements for a one-year term and determined that the compensation payable to Funds Management and the Sub-Adviser under each of the Advisory Agreements was reasonable. The Board considered the approval of the Advisory Agreements for the Fund as part of its consideration of agreements for funds across the complex, but its approvals were made on a fund-by-fund basis. The following summarizes a number of important, but not necessarily all, factors considered by the Board in support of its approvals.
Nature, extent and quality of services
The Board received and considered various information regarding the nature, extent and quality of services provided to the Fund by Funds Management and the Sub-Adviser under the Advisory Agreements. This information included a description of the investment advisory services and Fund-level administrative services covered by the Management Agreement, as well as, among other things, a summary of the background and experience of senior management of Wells Fargo Asset Management (“WFAM”), of which Funds Management and the Sub-Adviser are a part, a summary of investments made in the business of WFAM, a summary of certain organizational and personnel changes involving Funds Management and the Sub-Adviser, and a description of Funds Management’s and the Sub-Adviser’s business continuity planning programs and of their approaches to data privacy and cybersecurity. The Board received and reviewed information about Funds Management’s role as administrator of the Fund’s liquidity risk management program. The Board also considered the qualifications, background, tenure and responsibilities of each of the portfolio managers primarily responsible for the day-to-day portfolio management of the Fund.
The Board evaluated the ability of Funds Management and the Sub-Adviser to attract and retain qualified investment professionals, including research, advisory and supervisory personnel. The Board further considered the compliance programs and compliance records of Funds Management and the Sub-Adviser. In addition, the Board took into account the full range of services provided to the Fund by Funds Management and its affiliates.
Retail Money Market Funds | 33
Table of Contents
Other information (unaudited)
Fund investment performance and expenses
The Board considered the investment performance results for the Fund over various time periods ended December 31, 2018. The Board considered these results in comparison to the investment performance of funds in a universe that was determined by Broadridge Inc. (“Broadridge”) to be similar to the Fund (the “Universe”), and in comparison to the Fund’s benchmark index and to other comparative data. Broadridge is an independent provider of investment company data. The Board received a description of the methodology used by Broadridge to select the mutual funds in the performance Universe. The Board noted that the investment performance of the Fund (Administrator Class) was higher than the average investment performance of the Universe for all periods under review.
The Board also received and considered information regarding the Fund’s net operating expense ratios and their various components, including actual management fees, custodian and other non-management fees, and Rule 12b-1 and non-Rule 12b-1 shareholder service fees. The Board considered these ratios in comparison to the median ratios of funds in class-specific expense groups that were determined by Broadridge to be similar to the Fund (the “Groups”). The Board received a description of the methodology used by Broadridge to select the mutual funds in the expense Groups and an explanation of how funds comprising expense groups and their expense ratios may vary from year-to-year. Based on the Broadridge reports, the Board noted that the net operating expense ratios of the Fund were lower than, equal to or in range of the median net operating expense ratios of the expense Groups for each share class.
The Board took into account the Fund’s investment performance and expense information provided to it among the factors considered in deciding to re-approve the Advisory Agreements.
Investment management and sub-advisory fee rates
The Board reviewed and considered the contractual fee rates payable by the Fund to Funds Management under the Management Agreement, as well as the contractual fee rates payable by the Fund to Funds Management for class-level administrative services under a Class-Level Administration Agreement, which include, among other things, class-level transfer agency and sub-transfer agency costs (collectively, the “Management Rates”). The Board also reviewed and considered the contractual investment sub-advisory fee rates that are payable by Funds Management to the Sub-Adviser for investment sub-advisory services.
Among other information reviewed by the Board was a comparison of the Fund’s Management Rates with the average contractual investment management fee rates of funds in the expense Groups at a common asset level as well as transfer agency costs of the funds in the expense Groups. The Board noted that the Management Rates of the Fund were lower than or in range of the sum of these average rates for the Fund’s expense Groups for all share classes.
The Board also received and considered information about the portion of the total management fee that was retained by Funds Management after payment of the fee to the Sub-Adviser for sub-advisory services. In assessing the reasonableness of this amount, the Board received and evaluated information about the nature and extent of responsibilities retained and risks assumed by Funds Management and not delegated to or assumed by the Sub-Adviser, and about Funds Management’s on-going oversight services. Given the affiliation between Funds Management and the Sub-Adviser, the Board ascribed limited relevance to the allocation of fees between them.
The Board also received and considered information about the nature and extent of services offered and fee rates charged by Funds Management and the Sub-Adviser to other types of clients with investment strategies similar to those of the Fund. In this regard, the Board received information about the significantly greater scope of services, and compliance, reporting and other legal burdens and risks of managing proprietary mutual funds compared with those associated with managing assets of other types of clients, including third-party sub-advised fund clients and non-mutual fund clients such as institutional separate accounts.
Based on its consideration of the factors and information it deemed relevant, including those described here, the Board determined that the compensation payable to Funds Management under the Management Agreement and to the Sub-Adviser under the Sub-Advisory Agreement was reasonable.
Profitability
The Board received and considered information concerning the profitability of Funds Management, as well as the profitability of both WFAM and Wells Fargo & Co. (“Wells Fargo”) from providing services to the fund family as a whole. The Board noted that the Sub-Adviser’s profitability information with respect to providing services to the Fund and other funds in the family was subsumed in the WFAM and Wells Fargo profitability analysis.
Funds Management reported on the methodologies and estimates used in calculating profitability, including a description of the methodology used to allocate certain expenses. Among other things, the Board noted that the levels of profitability
34 | Retail Money Market Funds
Table of Contents
Other information (unaudited)
reported on a fund-by-fund basis varied widely, depending on factors such as the size, type and age of fund. Based on its review, the Board did not deem the profits reported by Funds Management, WFAM or Wells Fargo from services provided to the Fund to be at a level that would prevent it from approving the continuation of the Advisory Agreements.
Economies of scale
The Board received and considered information about the potential for Funds Management to experience economies of scale in the provision of management services to the Fund, the difficulties of calculating economies of scale at an individual fund level, and the extent to which potential scale benefits are shared with shareholders. The Board noted the existence of breakpoints in the Fund’s management fee structure, which operate generally to reduce the Fund’s expense ratios as the Fund grows in size. The Board considered that in addition to management fee breakpoints, Funds Management shares potential economies of scale from its management business in a variety of ways, including through fee waiver and expense reimbursement arrangements, services that benefit shareholders, competitive management fee rates set at the outset without regard to breakpoints, and investments in the business intended to enhance services available to shareholders.
The Board concluded that Funds Management’s arrangements with respect to the Fund, including contractual breakpoints, constituted a reasonable approach to sharing potential economies of scale with the Fund and its shareholders.
Other benefits to Funds Management and the Sub-Adviser
The Board received and considered information regarding potential “fall-out” or ancillary benefits received by Funds Management and its affiliates, including the Sub-Adviser, as a result of their relationships with the Fund. Ancillary benefits could include, among others, benefits directly attributable to other relationships with the Fund and benefits potentially derived from an increase in Funds Management’s and the Sub-Adviser’s business as a result of their relationships with the Fund. The Board noted that various affiliates of Funds Management may receive distribution-related fees, shareholder servicing payments and sub-transfer agency fees in respect of shares sold or held through them and services provided.
The Board also reviewed information about soft dollar credits earned and utilized by the Sub-Adviser, fees earned by Funds Management and the Sub-Adviser from managing a private investment vehicle for the fund family’s securities lending collateral, and commissions earned by an affiliated broker from portfolio transactions.
Based on its consideration of the factors and information it deemed relevant, including those described here, the Board did not find that any ancillary benefits received by Funds Management and its affiliates, including the Sub-Adviser, were unreasonable.
Conclusion
At the Meeting, after considering the above-described factors and based on its deliberations and its evaluation of the information described above, the Board unanimously approved the continuation of the Advisory Agreements for a one-year term and determined that the compensation payable to Funds Management and the Sub-Adviser under each of the Advisory Agreements was reasonable.
Retail Money Market Funds | 35
Table of Contents
This page is intentionally left blank.
Table of Contents
For more information
More information about Wells Fargo Funds is available free upon request. To obtain literature, please write, visit the Fund’s website, or call:
Wells Fargo Funds
P.O. Box 219967
Kansas City, MO 64121-9967
Website:wfam.com
Individual investors:1-800-222-8222
Retail investment professionals:1-888-877-9275
Institutional investment professionals:1-866-765-0778

This report and the financial statements contained herein are submitted for the general information of the shareholders of the Fund. If this report is used for promotional purposes, distribution of the report must be accompanied or preceded by a current prospectus. Before investing, please consider the investment objectives, risks, charges, and expenses of the investment. For a current prospectus and, if available, a summary prospectus, containing this information, call1-800-260-5969 or visit the Fund’s website atwfam.com. Read the prospectus carefully before you invest or send money.
Wells Fargo Asset Management (WFAM) is the trade name for certain investment advisory/management firms owned by Wells Fargo & Company. These firms include but are not limited to Wells Capital Management Incorporated and Wells Fargo Funds Management, LLC. Certain products managed by WFAM entities are distributed by Wells Fargo Funds Distributor, LLC (a broker-dealer and Member FINRA).
This material is for general informational and educational purposes only and is NOT intended to provide investment advice or a recommendation of any kind—including a recommendation for any specific investment, strategy, or plan.
INVESTMENT PRODUCTS: NOT FDIC INSURED ◾ NO BANK GUARANTEE ◾ MAY LOSE VALUE
© 2019 Wells Fargo Funds Management, LLC. All rights reserved.
405487 09-19
SA309/SAR309 07-19
Table of Contents

Semi-Annual Report
July 31, 2019
Institutional Money Market Funds
| ∎ | Wells Fargo Cash Investment Money Market Fund |
Beginning on January 1, 2021, as permitted by new regulations adopted by the Securities and Exchange Commission, paper copies of the Wells Fargo Funds’ annual and semi-annual shareholder reports issued after this date will no longer be sent by mail, unless you specifically request paper copies of the reports. Instead, the reports will be made available on the Funds’ website, and you will be notified by mail each time a report is posted and provided with a website address to access the report.
If you already elected to receive shareholder reports electronically, you will not be affected by this change and you need not take any action. You may elect to receive shareholder reports and other communications from the Fund electronically at any time by contacting your financial intermediary (such as a broker-dealer or bank) or, if you are a direct investor, by calling1-800-222-8222 or by enrolling at wellsfargo.com/advantagedelivery.
You may elect to receive all future reports in paper free of charge. If you invest through a financial intermediary, you can contact your financial intermediary to request that you continue to receive paper copies of your shareholder reports; if you invest directly with the Fund, you can call 1-800-222-8222. Your election to receive reports in paper will apply to all Wells Fargo Funds held in your account with your financial intermediary or, if you are a direct investor, to all Wells Fargo Funds that you hold.
Table of Contents
|
Reduce clutter. Save trees. |
Sign up for electronic delivery of prospectuses and shareholder reports atwellsfargo.com/ |
The views expressed and any forward-looking statements are as of July 31, 2019, unless otherwise noted, and are those of the Fund managers and/or Wells Fargo Asset Management. Discussions of individual securities, or the markets generally, or any Wells Fargo Fund are not intended as individual recommendations. Future events or results may vary significantly from those expressed in any forward-looking statements. The views expressed are subject to change at any time in response to changing circumstances in the market. Wells Fargo Asset Management and the Fund disclaim any obligation to publicly update or revise any views expressed or forward-looking statements.
INVESTMENT PRODUCTS: NOT FDIC INSURED ◾ NO BANK GUARANTEE ◾ MAY LOSE VALUE
Institutional Money Market Funds | 1
Table of Contents
Letter to shareholders (unaudited)

Andrew Owen
President
Wells Fargo Funds
Dear Shareholder:
We are pleased to offer you this semi-annual report for the Wells Fargo Cash Investment Money Market Fund for thesix-month period that ended July 31, 2019. Global stock and bond investors enjoyed gains that came amid continued concerns about global economic growth, international trade, geopolitical tensions, and bouts of market volatility. These concerns grew more intense as the period closed.
For the period, U.S. stocks, based on the S&P 500 Index,1 gained 11.32% and international stocks, as measured by the MSCI ACWI ex USA Index (Net),2 added 4.34%. The MSCI EM Index (Net)3 inched higher by 0.44%. For bond investors, the Bloomberg Barclays U.S. Aggregate Bond Index4 added 5.23%, the Bloomberg Barclays Global Aggregateex-USD Index5 added 2.33%, the Bloomberg Barclays Municipal Bond Index6 gained 5.15%, and the ICE BofAML U.S. High Yield Index7 added 5.86%.
Concerns for slowing global growth reemerge during the first quarter of 2019.
After the S&P 500 Index’s best monthly performance in 30 years during January and positive returns for other major indices across major asset classes, signs of slowing global growth grew more ominous in February. The Bureau of Economic Analysis announced fourth-quarter 2018 gross domestic product (GDP) grew at an annualized 2.2% rate, down from the levels of the prior two quarters. In a February report, the Bank of England forecast the slowest growth since the financial crisis for 2019. China and the U.S. continued to wrangle over trade issues.
By the end of March 2019, a combination of dovish U.S. Federal Reserve (Fed) sentiment and steady, if not spectacular, U.S. economic and business metrics reinforced investors’ confidence. Monthly job creation data and corporate profits, while less consistent than during 2018, were solid. China announced a roughly $300 billion stimulus package through tax and fee cuts intended to reinvigorate economic growth. During April 2019, favorable sentiment found additional support in reports of sustained low inflation, solid employment data, and first-quarter U.S. GDP of an annualized rate of 3.2%.
| 1 | The S&P 500 Index consists of 500 stocks chosen for market size, liquidity, and industry group representation. It is a market-value-weighted index with each stock’s weight in the index proportionate to its market value. You cannot invest directly in an index. |
| 2 | The Morgan Stanley Capital International (MSCI) All Country World Index (ACWI) ex USA Index (Net) is a free-float-adjusted market-capitalization weighted index that is designed to measure the equity market performance of developed and emerging markets, excluding the U.S. Source: MSCI. MSCI makes no express or implied warranties or representations and shall have no liability whatsoever with respect to any MSCI data contained herein. The MSCI data may not be further redistributed or used as a basis for other indices or any securities or financial products. This report is not approved, reviewed, or produced by MSCI. You cannot invest directly in an index. |
| 3 | The MSCI Emerging Markets (EM) Index (Net) is a free-float-adjusted market-capitalization-weighted index that is designed to measure the equity market performance of emerging markets. You cannot invest directly in an index. |
| 4 | The Bloomberg Barclays U.S. Aggregate Bond Index is a broad-based benchmark that measures the investment-grade, U.S. dollar-denominated, fixed-rate taxable bond market, including Treasuries, government-related and corporate securities, mortgage-backed securities (agency fixed-rate and hybrid adjustable-rate mortgage pass-throughs), asset-backed securities, and commercial mortgage-backed securities. You cannot invest directly in an index. |
| 5 | The Bloomberg Barclays Global Aggregateex-USD Index is an unmanaged index that provides a broad-based measure of the global investment-grade fixed-income markets excluding the U.S. dollar-denominated debt market. You cannot invest directly in an index. |
| 6 | The Bloomberg Barclays Municipal Bond Index is an unmanaged index composed of long-termtax-exempt bonds with a minimum credit rating of Baa. You cannot invest directly in an index. |
| 7 | The ICE BofAML U.S. High Yield Index is a market-capitalization-weighted index of domestic and Yankee high-yield bonds. The index tracks the performance of high-yield securities traded in the U.S. bond market. You cannot invest directly in an index. Copyright 2019. ICE Data Indices, LLC. All rights reserved. |
2 | Institutional Money Market Funds
Table of Contents
Letter to shareholders (unaudited)
During May 2019, markets tumbled on mixed investment signals. In the U.S., partisan wrangling ramped up as Democrats and Republicans set their sights on 2020 presidential politics. The U.K.’s Brexit caused Prime Minister Theresa May to resign. The European Commission downgraded the 2019 growth forecast to 1.2%. The U.S. increased tariffs on products from China, China responded, and then talks broke down. President Donald Trump threatened to turn his foreign policy tariff tool to Mexico over immigration issues.
As had been the case during most of 2019 to date, just as the investment horizon appeared to darken, sentiment turned and U.S. equity markets gained during June and July. The gains, primarily driven by geopolitical and monetary policy events, pushed equity markets to new highs.
President Mario Draghi of the European Central Bank said that if the outlook doesn’t improve, the bank will cut rates or buy more assets to prop up inflation. President Trump backed off of tariff threats against Mexico and China. In the U.S., the Fed implemented a 0.25% federal funds rate cut in July 2019.
Later in July 2019, the U.S. reversed course and threatened to impose higher tariffs on China’s exports after talks failed. China responded with tariff threats of its own and devalued the renminbi, a move that roiled global markets. Despite the accommodative approach of central banks, investors continued to have misgivings about the durability of economic growth globally and a pervasively cautious tone influenced the world’s equity and fixed-income markets.
Don’t let short-term uncertainty derail long-term investment goals.
Periods of investment uncertainty can present challenges, but experience has taught us that maintaining long-term investment goals can be an effective way to plan for the future. To help you create a sound strategy based on your personal goals and risk tolerance, Wells Fargo Funds offers more than 100 mutual funds spanning a wide range of asset classes and investment styles. Although diversification cannot guarantee an investment profit or prevent losses, we believe it can be an effective way to manage investment risk and potentially smooth out overall portfolio performance. We encourage investors to know their investments and to understand that appropriate levels of risk-taking may unlock opportunities.
Thank you for choosing to invest with Wells Fargo Funds. We appreciate your confidence in us and remain committed to helping you meet your financial needs.
Sincerely,

Andrew Owen
President
Wells Fargo Funds
“During May 2019, markets tumbled on mixed investment signals.”
“In the U.S., the Fed implemented a 0.25% federal funds rate cut in July 2019.”
|
For further information about your Fund, contact your investment professional, visit our website at wfam.com, or call us directly at1-800-222-8222. |
Institutional Money Market Funds | 3
Table of Contents
Performance highlights (unaudited)
Investment objective
The Fund seeks current income, while preserving capital and liquidity.
Manager
Wells Fargo Funds Management, LLC
Subadvisers
Wells Capital Management Incorporated
Wells Capital Management Singapore
Portfolio managers
Michael C. Bird, CFA®‡
Jeffrey L. Weaver, CFA®‡
Laurie White
Average annual total returns (%) as of July 31, 2019
| Expense ratios1 (%) | ||||||||||||||||||||||
| Inception date | 1 year | 5 year | 10 year | Gross | Net2 | |||||||||||||||||
| Administrator Class (WFAXX) | 7-31-2003 | 2.22 | 0.88 | 0.45 | 0.37 | 0.33 | ||||||||||||||||
| Institutional Class (WFIXX) | 10-14-1987 | 2.35 | 0.98 | 0.53 | 0.25 | 0.20 | ||||||||||||||||
| Select Class (WFQXX) | 6-29-2007 | 2.42 | 1.05 | 0.60 | 0.21 | 0.13 | ||||||||||||||||
| Service Class (NWIXX) | 10-14-1987 | 2.05 | 0.75 | 0.38 | 0.54 | 0.50 | ||||||||||||||||
Yield summary (%) as of July 31, 20192
| Administrator Class | Institutional Class | Select Class | Service Class | |||||||||||
| 7-day current yield | 2.18 | 2.31 | 2.38 | 2.01 | ||||||||||
| 7-day compound yield | 2.20 | 2.34 | 2.41 | 2.03 | ||||||||||
| 30-day simple yield | 2.21 | 2.34 | 2.41 | 2.04 | ||||||||||
| 30-day compound yield | 2.23 | 2.36 | 2.44 | 2.06 | ||||||||||
Figures quoted represent past performance, which is no guarantee of future results, and do not reflect taxes that a shareholder may pay on fund distributions or the redemption of fund shares. Investment returns will fluctuate. The Fund’s yield figures more closely reflect the current earnings of the Fund than the total return figures. Current performance may be lower or higher than the performance data quoted, which assumes the reinvestment of dividends and capital gains. Currentmonth-end performance is available on the Fund’s website,wfam.com.
Each class is sold without afront-end sales charge or contingent deferred sales charge.
For floating NAV money market funds: You could lose money by investing in the Fund. Because the share price of the Fund will fluctuate, when you sell your shares they may be worth more or less than what you originally paid for them. The Fund may impose a fee upon sale of your shares or may temporarily suspend your ability to sell shares if the Fund’s liquidity falls below required minimums because of market conditions or other factors. An investment in the Fund is not insured or guaranteed by the Federal Deposit Insurance Corporation or any other government agency. The Fund’s sponsor has no legal obligation to provide financial support to the Fund, and you should not expect that the sponsor will provide financial support to the Fund at any time.
Please see footnotes on page 5.
4 | Institutional Money Market Funds
Table of Contents
Performance highlights (unaudited)
| Portfolio composition as of July 31, 20193 | ||
| ||
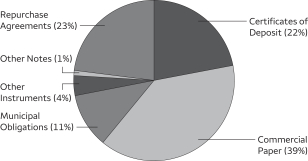
| Effective maturity distribution as of July 31, 20193 |
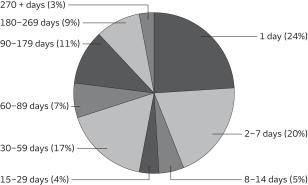 |
| Weighted average maturity as of July 31, 20194 | ||||
25 days | ||||
| Weighted average life as of July 31, 20195 | ||||
64 days | ||||
| ‡ | CFA® and Chartered Financial Analyst®are trademarks owned by CFA Institute. |
| 1 | Reflects the expense ratios as stated in the most recent prospectuses. The expense ratios shown are subject to change and may differ from the annualized expense ratios shown in the financial highlights of this report. |
| 2 | The manager has contractually committed through May 31, 2020, to waive fees and/or reimburse expenses to the extent necessary to cap the expenses of each class after fee waivers at the amounts shown. Brokerage commissions, stamp duty fees, interest, taxes, acquired fund fees and expenses (if any), and extraordinary expenses are excluded from the expense cap. Prior to or after the commitment expiration date, the cap may be increased or the commitment to maintain the cap may be terminated only with the approval of the Board of Trustees. Without this cap, the Fund’s returns would have been lower. Without waived fees and/or reimbursed expenses, the Fund’s7-day current yield would have been 2.14%, 2.26%, 2.30%, and 1.97% for Administrator Class, Institutional Class, Select Class, and Service Class, respectively. The expense ratio paid by an investor is the net expense ratio (the total annual fund operating expenses after fee waivers) as stated in the prospectuses. |
| 3 | Amounts are calculated based on the total investments of the Fund. These amounts are subject to change and may have changed since the date specified. |
| 4 | Weighted Average Maturity (WAM): WAM is an average of the effective maturities of all securities held in the portfolio, weighted by each security’s percentage of total investments. The maturity of a portfolio security is the period remaining until the date on which the principal amount is unconditionally required to be paid, or in the case of a security called for redemption, the date on which the redemption payment is unconditionally required to be made. WAM calculations allow for the maturities of certain securities with demand features or periodic interest rate resets to be shortened. WAM is a way to measure a fund’s sensitivity to potential interest rate changes. WAM is subject to change and may have changed since the date specified. |
| 5 | Weighted Average Life (WAL): WAL is an average of the final maturities of all securities held in the portfolio, weighted by their percentage of total investments. The maturity of a portfolio security is the period remaining until the date on which the principal amount is unconditionally required to be paid, or in the case of a security called for redemption, the date on which the redemption payment is unconditionally required to be made. In contrast to WAM, the calculation of WAL allows for the maturities of certain securities with demand features to be shortened, but not the periodic interest rate resets. WAL is a way to measure a fund’s potential sensitivity to credit spread changes. WAL is subject to change and may have changed since the date specified. |
Institutional Money Market Funds | 5
Table of Contents
As a shareholder of the Fund, you incur ongoing costs, including management fees, shareholder servicing fees, and other Fund expenses. This example is intended to help you understand your ongoing costs (in dollars) of investing in the Fund and to compare these costs with the ongoing costs of investing in other mutual funds.
The example is based on an investment of $1,000 invested at the beginning of thesix-month period and held for the entire period from February 1, 2019 to July 31, 2019.
Actual expenses
The “Actual” line of the table below provides information about actual account values and actual expenses. You may use the information in this line, together with the amount you invested, to estimate the expenses that you paid over the period. Simply divide your account value by $1,000 (for example, an $8,600 account value divided by $1,000 = 8.6), then multiply the result by the number in the “Actual” line under the heading entitled “Expenses paid during period” for your applicable class of shares to estimate the expenses you paid on your account during this period.
Hypothetical example for comparison purposes
The “Hypothetical” line of the table below provides information about hypothetical account values and hypothetical expenses based on the Fund’s actual expense ratio and an assumed rate of return of 5% per year before expenses, which is not the Fund’s actual return. The hypothetical account values and expenses may not be used to estimate the actual ending account balance or expenses you paid for the period. You may use this information to compare the ongoing costs of investing in the Fund and other funds. To do so, compare this 5% hypothetical example with the 5% hypothetical examples that appear in the shareholder reports of the other funds.
Please note that the expenses shown in the table are meant to highlight your ongoing costs only. Therefore, the “Hypothetical” line of the table is useful in comparing ongoing costs only and will not help you determine the relative total costs of owning different funds.
| Beginning account value 2-1-2019 | Ending account value 7-31-2019 | Expenses paid during the period¹ | Annualized net expense ratio | |||||||||||||
Administrator Class | ||||||||||||||||
Actual | $ | 1,000.00 | $ | 1,011.42 | $ | 1.65 | 0.33 | % | ||||||||
Hypothetical (5% return before expenses) | $ | 1,000.00 | $ | 1,023.16 | $ | 1.66 | 0.33 | % | ||||||||
Institutional Class | ||||||||||||||||
Actual | $ | 1,000.00 | $ | 1,012.07 | $ | 1.00 | 0.20 | % | ||||||||
Hypothetical (5% return before expenses) | $ | 1,000.00 | $ | 1,023.80 | $ | 1.00 | 0.20 | % | ||||||||
Select Class | ||||||||||||||||
Actual | $ | 1,000.00 | $ | 1,012.42 | $ | 0.65 | 0.13 | % | ||||||||
Hypothetical (5% return before expenses) | $ | 1,000.00 | $ | 1,024.15 | $ | 0.65 | 0.13 | % | ||||||||
Service Class | ||||||||||||||||
Actual | $ | 1,000.00 | $ | 1,010.56 | $ | 2.49 | 0.50 | % | ||||||||
Hypothetical (5% return before expenses) | $ | 1,000.00 | $ | 1,022.32 | $ | 2.51 | 0.50 | % | ||||||||
| 1 | Expenses paid is equal to the annualized net expense ratio of each class multiplied by the average account value over the period, multiplied by the number of days in the most recent fiscal half-year divided by the number of days in the fiscal year (to reflect theone-half-year period). |
6 | Institutional Money Market Funds
Table of Contents
Portfolio of investments—July 31, 2019 (unaudited)
| Interest rate | Maturity date | Principal | Value | |||||||||||||
| Certificates of Deposit: 22.29% | ||||||||||||||||
ABN Amro Bank NV | 2.46 | % | 10-7-2019 | $ | 15,000,000 | $ | 15,012,449 | |||||||||
ABN Amro Bank NV | 2.59 | 9-6-2019 | 16,000,000 | 16,006,176 | ||||||||||||
Bank of Montreal (3 Month LIBOR +0.06%)± | 2.50 | 3-12-2020 | 7,000,000 | 7,000,394 | ||||||||||||
Bank of Montreal (1 Month LIBOR +0.18%)± | 2.57 | 4-3-2020 | 10,000,000 | 10,000,761 | ||||||||||||
Bank of Montreal (1 Month LIBOR +0.22%)± | 2.58 | 10-4-2019 | 7,000,000 | 7,001,442 | ||||||||||||
Bank of Montreal (1 Month LIBOR +0.18%)± | 2.58 | 5-1-2020 | 5,000,000 | 5,000,738 | ||||||||||||
Bank of Montreal (3 Month LIBOR +0.22%)± | 2.67 | 12-10-2019 | 9,000,000 | 9,006,363 | ||||||||||||
Bank of Nova Scotia (1 Month LIBOR +0.14%)± | 2.38 | 1-27-2020 | 6,000,000 | 6,000,200 | ||||||||||||
Bank of Nova Scotia (3 Month LIBOR +0.05%)± | 2.38 | 4-3-2020 | 13,000,000 | 13,000,812 | ||||||||||||
Bank of Nova Scotia (3 Month LIBOR +0.10%)± | 2.51 | 9-16-2019 | 3,000,000 | 3,000,386 | ||||||||||||
Bank of Nova Scotia (1 Month LIBOR +0.20%)± | 2.53 | 8-14-2019 | 7,000,000 | 7,000,373 | ||||||||||||
Canadian Imperial Bank (3 Month LIBOR +0.19%)± | 2.46 | 1-30-2020 | 10,000,000 | 10,007,385 | ||||||||||||
Canadian Imperial Bank (1 Month LIBOR +0.18%)± | 2.54 | 4-6-2020 | 10,000,000 | 10,001,354 | ||||||||||||
Canadian Imperial Bank (1 Month LIBOR +0.18%)± | 2.58 | 5-1-2020 | 6,000,000 | 6,000,907 | ||||||||||||
China Construction Bank Corporation (3 Month LIBOR +0.10%)± | 2.38 | 1-24-2020 | 15,000,000 | 14,999,971 | ||||||||||||
Cooperatieve Rabobank UA (1 Month LIBOR +0.14%)± | 2.50 | 11-7-2019 | 10,000,000 | 10,001,312 | ||||||||||||
Cooperatieve Rabobank UA | 2.46 | 5-20-2020 | 11,000,000 | 10,999,127 | ||||||||||||
Credit Agricole Corporate & Investment Bank (3 Month LIBOR +0.08%)± | 2.47 | 12-20-2019 | 7,000,000 | 6,999,967 | ||||||||||||
Credit Industriel et Commercial NY (1 Month LIBOR +0.22%)± | 2.49 | 4-24-2020 | 7,000,000 | 7,000,939 | ||||||||||||
Credit Suisse New York (1 Month LIBOR +0.22%)± | 2.58 | 12-9-2019 | 8,000,000 | 8,002,681 | ||||||||||||
DNB Bank ASA (1 Month LIBOR +0.10%)± | 2.47 | 9-9-2019 | 12,000,000 | 12,000,166 | ||||||||||||
DZ Bank AG Deutsche Zentral-Genossenschaftsbank | 2.36 | 10-29-2019 | 7,000,000 | 6,959,288 | ||||||||||||
HSBC Bank USA NA (3 Month LIBOR +0.13%)± | 2.69 | 8-9-2019 | 3,000,000 | 3,000,074 | ||||||||||||
Mizuho Bank Limited (1 Month LIBOR +0.16%)± | 2.40 | 8-27-2019 | 7,000,000 | 7,000,228 | ||||||||||||
Mizuho Bank Limited (1 Month LIBOR +0.14%)± | 2.50 | 11-8-2019 | 12,000,000 | 12,001,168 | ||||||||||||
Mizuho Bank Limited (1 Month LIBOR +0.16%)± | 2.53 | 9-12-2019 | 10,000,000 | 10,000,988 | ||||||||||||
Mizuho Bank Limited | 2.43 | 9-11-2019 | 5,000,000 | 4,987,025 | ||||||||||||
MUFG Bank Limited of New York (3 Month LIBOR +0.18%)± | 2.70 | 2-27-2020 | 7,000,000 | 7,002,342 | ||||||||||||
MUFG Bank Limited of New York (3 Month LIBOR +0.14%)± | 2.70 | 5-11-2020 | 5,000,000 | 4,999,995 | ||||||||||||
Natixis NY (1 Month LIBOR +0.16%)± | 2.42 | 12-23-2019 | 6,000,000 | 6,000,719 | ||||||||||||
Norinchukin Bank | 2.20 | 2-4-2020 | 5,000,000 | 4,999,667 | ||||||||||||
Norinchukin Bank | 2.52 | 8-9-2019 | 5,000,000 | 5,000,361 | ||||||||||||
Norinchukin Bank | 2.54 | 8-1-2019 | 5,000,000 | 5,000,045 | ||||||||||||
Oversea-Chinese Banking Corporation Limited (1 Month LIBOR +0.10%)± | 2.37 | 10-25-2019 | 7,000,000 | 7,000,252 | ||||||||||||
Oversea-Chinese Banking Corporation Limited (1 Month LIBOR +0.20%)± | 2.50 | 9-19-2019 | 6,000,000 | 6,000,952 | ||||||||||||
Skandinaviska Enskilda Bank AB (1 Month LIBOR +0.13%)± | 2.50 | 9-12-2019 | 10,000,000 | 10,000,630 | ||||||||||||
Sumitomo Mitsui Banking Corporation (1 Month LIBOR +0.14%)± | 2.50 | 11-5-2019 | 11,000,000 | 11,001,331 | ||||||||||||
Sumitomo Mitsui Trust Bank Limited (1 Month LIBOR +0.12%)± | 2.38 | 10-23-2019 | 6,000,000 | 6,000,447 | ||||||||||||
Sumitomo Mitsui Trust NY | 2.25 | 1-9-2020 | 14,000,000 | 14,001,117 | ||||||||||||
Sumitomo Mitsui Trust NY | 2.25 | 1-13-2020 | 4,000,000 | 4,000,317 | ||||||||||||
Svenska Handelsbanken (3 Month LIBOR +0.15%)± | 2.47 | 10-2-2019 | 10,000,000 | 10,002,452 | ||||||||||||
Svenska Handelsbanken (1 Month LIBOR +0.22%)± | 2.48 | 7-22-2020 | 8,000,000 | 8,000,749 | ||||||||||||
Svenska Handelsbanken (3 Month LIBOR +0.27%)± | 2.55 | 10-21-2019 | 10,000,000 | 10,005,049 | ||||||||||||
Total Certificates of Deposit (Cost $356,948,791) | 357,009,099 | |||||||||||||||
|
| |||||||||||||||
Commercial Paper: 38.57% | ||||||||||||||||
| Asset-Backed Commercial Paper: 23.87% | ||||||||||||||||
Albion Capital Corporation (z) | 2.30 | 9-30-2019 | 5,000,000 | 4,980,768 | ||||||||||||
Alpine Securitization (1 Month LIBOR +0.15%)±144A | 2.55 | 3-2-2020 | 10,000,000 | 10,000,001 | ||||||||||||
Anglesea Funding LLC (1 Month LIBOR +0.17%)±144A | 2.43 | 12-23-2019 | 12,000,000 | 11,999,998 | ||||||||||||
Anglesea Funding LLC (1 Month LIBOR +0.18%)±144A | 2.48 | 10-15-2019 | 3,000,000 | 3,000,062 | ||||||||||||
Anglesea Funding LLC (1 Month LIBOR +0.18%)±144A | 2.51 | 10-11-2019 | 14,000,000 | 14,002,787 | ||||||||||||
The accompanying notes are an integral part of these financial statements.
Institutional Money Market Funds | 7
Table of Contents
Portfolio of investments—July 31, 2019 (unaudited)
| Interest rate | Maturity date | Principal | Value | |||||||||||||
| Asset-Backed Commercial Paper(continued) | ||||||||||||||||
Anglesea Funding LLC (1 Month LIBOR +0.18%)±144A | 2.58 | % | 12-27-2019 | $ | 10,000,000 | $ | 10,000,310 | |||||||||
Antalis US Funding Corporation (z)144A | 2.44 | 8-20-2019 | 6,000,000 | 5,992,190 | ||||||||||||
Atlantic Asset Securitization Corporation (1 Month LIBOR +0.12%)±144A | 2.39 | 8-21-2019 | 10,000,000 | 10,000,097 | ||||||||||||
Bedford Row Funding Corporation (1 Month LIBOR +0.16%)±144A | 2.49 | 8-13-2019 | 10,000,000 | 10,000,343 | ||||||||||||
Bedford Row Funding Corporation (1 Month LIBOR +0.24%)±144A | 2.50 | 7-20-2020 | 6,000,000 | 6,001,772 | ||||||||||||
Bedford Row Funding Corporation (1 Month LIBOR +0.15%)±144A | 2.54 | 2-3-2020 | 3,000,000 | 2,999,657 | ||||||||||||
Chesham Finance Limited (z)144A | 2.50 | 8-1-2019 | 20,000,000 | 19,998,646 | ||||||||||||
Collateralized Commercial Paper FLEX Company LLC (1 Month LIBOR +0.20%)±144A | 2.46 | 6-23-2020 | 3,000,000 | 3,000,075 | ||||||||||||
Collateralized Commercial Paper II Company LLC (3 Month LIBOR | 2.57 | 1-8-2020 | 8,000,000 | 8,007,236 | ||||||||||||
Collateralized Commercial Paper II Company LLC (3 Month LIBOR | 2.59 | 12-31-2019 | 11,000,000 | 11,010,788 | ||||||||||||
Concord Minutemen Capital Company (z)144A | 2.43 | 8-2-2019 | 3,000,000 | 2,999,595 | ||||||||||||
Concord Minutemen Capital Company (z)144A | 2.70 | 8-1-2019 | 3,000,000 | 2,999,797 | ||||||||||||
Crown Point Capital Company (1 Month LIBOR +0.20%)±144A | 2.56 | 11-4-2019 | 12,000,000 | 12,002,440 | ||||||||||||
Crown Point Capital Company (1 Month LIBOR +0.18%)±144A | 2.56 | 1-6-2020 | 18,000,000 | 18,002,909 | ||||||||||||
Glencove Funding LLC (1 Month LIBOR +0.18%)±144A | 2.49 | 2-11-2020 | 12,000,000 | 12,002,060 | ||||||||||||
Great Bridge Capital Company LLC (z)144A | 2.47 | 10-3-2019 | 5,000,000 | 4,978,862 | ||||||||||||
Great Bridge Capital Company LLC (z)144A | 2.48 | 9-4-2019 | 5,000,000 | 4,988,440 | ||||||||||||
Great Bridge Capital Company LLC (z)144A | 2.48 | 10-8-2019 | 4,000,000 | 3,981,692 | ||||||||||||
Great Bridge Capital Company LLC (z)144A | 2.48 | 10-10-2019 | 2,000,000 | 1,990,565 | ||||||||||||
Great Bridge Capital Company LLC (z)144A | 2.51 | 8-19-2019 | 2,000,000 | 1,997,510 | ||||||||||||
Great Bridge Capital Company LLC(z)144A | 2.58 | 8-16-2019 | 2,750,000 | 2,747,107 | ||||||||||||
Institutional Secured Funding LLC (z)144A | 2.54 | 8-1-2019 | 20,000,000 | 19,998,646 | ||||||||||||
Institutional Secured Funding LLC (z)144A | 2.54 | 8-2-2019 | 20,000,000 | 19,997,299 | ||||||||||||
Kells Funding LLC (z)144A | 2.39 | 9-11-2019 | 12,000,000 | 11,968,528 | ||||||||||||
Kells Funding LLC (z)144A | 2.52 | 8-19-2019 | 8,000,000 | 7,990,394 | ||||||||||||
Kells Funding LLC (z)144A | 2.55 | 8-7-2019 | 3,000,000 | 2,998,641 | ||||||||||||
Kells Funding LLC (z)144A | 2.61 | 9-19-2019 | 8,000,000 | 7,975,111 | ||||||||||||
Lexington Parker Capital Company LLC (z)144A | 2.57 | 8-7-2019 | 3,000,000 | 2,998,676 | ||||||||||||
LMA Americas LLC (z)144A | 2.20 | 1-27-2020 | 3,000,000 | 2,968,500 | ||||||||||||
LMA Americas LLC (z)144A | 2.20 | 1-28-2020 | 3,000,000 | 2,968,355 | ||||||||||||
Manhattan Asset Funding Company LLC (z)144A | 2.35 | 8-19-2019 | 3,000,000 | 2,996,335 | ||||||||||||
Manhattan Asset Funding Company LLC (z)144A | 2.40 | 9-13-2019 | 7,000,000 | 6,980,528 | ||||||||||||
Mountcliff Funding LLC (1 Month LIBOR +0.20%)±144A | 2.43 | 4-24-2020 | 15,000,000 | 15,000,000 | ||||||||||||
Mountcliff Funding LLC (z)144A | 2.48 | 8-1-2019 | 20,000,000 | 19,998,646 | ||||||||||||
Nieuw Amsterdam Receivables Corporation (z)144A | 2.22 | 1-9-2020 | 2,000,000 | 1,980,236 | ||||||||||||
Regency Markets No.1 LLC (z)144A | 2.35 | 8-19-2019 | 6,000,000 | 5,992,574 | ||||||||||||
Regency Markets No.1 LLC (z)144A | 2.42 | 8-14-2019 | 20,000,000 | 19,981,676 | ||||||||||||
Regency Markets No.1 LLC (z)144A | 2.43 | 8-15-2019 | 7,000,000 | 6,993,146 | ||||||||||||
Versailles CDS LLC (1 Month LIBOR +0.20%)±144A | 2.47 | 9-20-2019 | 8,000,000 | 8,000,848 | ||||||||||||
Victory Receivables (z)144A | 2.45 | 8-6-2019 | 6,000,000 | 5,997,614 | ||||||||||||
White Plains Capital (z)144A | 2.64 | 9-4-2019 | 7,000,000 | 6,983,136 | ||||||||||||
White Plains Capital (z)144A | 2.69 | 8-20-2019 | 2,000,000 | 1,997,214 | ||||||||||||
| 382,451,810 | ||||||||||||||||
|
| |||||||||||||||
| Financial Company Commercial Paper: 11.46% | ||||||||||||||||
Banco de Credito e Inversiones (z)144A | 2.44 | 9-23-2019 | 10,000,000 | 9,963,670 | ||||||||||||
Banco de Credito e Inversiones (z)144A | 2.44 | 9-24-2019 | 2,000,000 | 1,992,599 | ||||||||||||
Banco de Credito e Inversiones (z)144A | 2.52 | 10-8-2019 | 7,000,000 | 6,967,210 | ||||||||||||
Banco de Credito e Inversiones (z)144A | 2.53 | 10-2-2019 | 14,000,000 | 13,940,514 | ||||||||||||
Banco de Credito e Inversiones (z)144A | 2.57 | 9-25-2019 | 5,000,000 | 4,981,170 | ||||||||||||
The accompanying notes are an integral part of these financial statements.
8 | Institutional Money Market Funds
Table of Contents
Portfolio of investments—July 31, 2019 (unaudited)
| Interest rate | Maturity date | Principal | Value | |||||||||||||
| Financial Company Commercial Paper(continued) | ||||||||||||||||
Banco Santander Chile (z)144A | 2.53 | % | 8-23-2019 | $ | 3,000,000 | $ | 2,995,285 | |||||||||
Commonwealth Bank of Australia (1 Month LIBOR +0.21%)±144A | 2.54 | 9-16-2019 | 5,000,000 | 5,000,828 | ||||||||||||
Commonwealth Bank of Australia (1 Month LIBOR +0.17%)±144A | 2.57 | 4-2-2020 | 10,000,000 | 9,999,704 | ||||||||||||
Commonwealth Bank of Australia (3 Month LIBOR +0.45%)±144A | 2.90 | 3-10-2020 | 3,000,000 | 3,006,980 | ||||||||||||
Commonwealth Bank of Australia (3 Month LIBOR +0.60%)±144A | 3.02 | 12-19-2019 | 6,000,000 | 6,013,501 | ||||||||||||
DBS Bank Limited (z)144A | 2.27 | 12-3-2019 | 7,000,000 | 6,949,566 | ||||||||||||
DBS Bank Limited (z)144A | 2.27 | 2-28-2020 | 4,000,000 | 3,950,934 | ||||||||||||
DBS Bank Limited (z)144A | 2.30 | 11-22-2019 | 7,000,000 | 6,953,051 | ||||||||||||
National Australia Bank Limited (1 Month LIBOR +0.16%)±144A | 2.46 | 5-19-2020 | 3,000,000 | 2,999,612 | ||||||||||||
National Australia Bank Limited (1 Month LIBOR +0.13%)±144A | 2.49 | 2-7-2020 | 6,000,000 | 6,000,261 | ||||||||||||
National Australia Bank Limited (1 Month LIBOR +0.20%)±144A | 2.60 | 8-2-2019 | 7,000,000 | 7,000,071 | ||||||||||||
Oesterreichische National Bank (z) | 2.23 | 1-10-2020 | 6,000,000 | 5,944,335 | ||||||||||||
Ontario Teachers Finance Trust (z)144A | 2.10 | 3-12-2020 | 7,000,000 | 6,913,156 | ||||||||||||
Ontario Teachers Finance Trust (z)144A | 2.20 | 3-6-2020 | 2,000,000 | 1,975,630 | ||||||||||||
Oversea-Chinese Banking Corporation Limited (3 Month LIBOR +0.03%) ±144A | 2.50 | 12-6-2019 | 7,000,000 | 6,999,971 | ||||||||||||
Oversea-Chinese Banking Corporation Limited (3 Month LIBOR +0.04%) ±144A | 2.56 | 2-18-2020 | 7,000,000 | 6,999,980 | ||||||||||||
Sumitomo Mitsui Trust Bank (z)144A | 2.37 | 10-18-2019 | 3,000,000 | 2,985,168 | ||||||||||||
Sumitomo Mitsui Trust Bank Limited (z)144A | 2.40 | 9-30-2019 | 5,000,000 | 4,981,014 | ||||||||||||
Toronto Dominion Bank (z)144A | 2.28 | 8-7-2019 | 15,000,000 | 14,993,117 | ||||||||||||
Toronto Dominion Bank (3 Month LIBOR +0.21%)±144A | 2.68 | 12-6-2019 | 8,000,000 | 8,005,206 | ||||||||||||
Toronto Dominion Bank (1 Month LIBOR +0.37%)±144A | 2.73 | 11-7-2019 | 7,000,000 | 7,005,212 | ||||||||||||
Westpac Banking Corporation (1 Month LIBOR +0.21%)±144A | 2.51 | 9-19-2019 | 10,000,000 | 10,001,725 | ||||||||||||
Westpac Banking Corporation (3 Month LIBOR +0.07%)±144A | 2.65 | 8-2-2019 | 8,000,000 | 8,000,000 | ||||||||||||
| 183,519,470 | ||||||||||||||||
|
| |||||||||||||||
| Other Commercial Paper: 3.24% | ||||||||||||||||
Export Development Corporation (z) | 2.29 | 12-17-2019 | 4,000,000 | 3,967,242 | ||||||||||||
Salt River Project Agricultural Improvement & Power District Subordinated Series D1 (z) | 2.34 | 9-23-2019 | 5,000,000 | 4,982,267 | ||||||||||||
Salt River Project Agricultural Improvement & Power District Subordinated Series D1 (z) | 2.35 | 9-19-2019 | 8,000,000 | 7,973,757 | ||||||||||||
Salt River Project Agricultural Improvement & Power District Subordinated Series D1 (z) | 2.46 | 8-14-2019 | 6,000,000 | 5,994,364 | ||||||||||||
Toyota Credit Canada Incorporated (1 Month LIBOR +0.17%)± | 2.57 | 1-27-2020 | 7,000,000 | 7,001,276 | ||||||||||||
Toyota Finance Australia Limited (1 Month LIBOR +0.17%)± | 2.50 | 12-6-2019 | 7,000,000 | 7,001,115 | ||||||||||||
Toyota Motor Credit Corporation (z) | 2.38 | 11-18-2019 | 9,000,000 | 8,934,632 | ||||||||||||
Toyota Motor Credit Corporation (1 Month LIBOR +0.16%)± | 2.52 | 2-27-2020 | 6,000,000 | 5,999,560 | ||||||||||||
| 51,854,213 | ||||||||||||||||
|
| |||||||||||||||
Total Commercial Paper (Cost $617,754,151) | 617,825,493 | |||||||||||||||
|
| |||||||||||||||
Municipal Obligations: 11.09% | ||||||||||||||||
California: 0.60% | ||||||||||||||||
| Other Municipal Debt: 0.60% | ||||||||||||||||
Los Angeles Metro Transportation (Transportation Revenue) | 2.35 | 9-23-2019 | 2,000,000 | 1,999,820 | ||||||||||||
State of California (GO Revenue) | 2.48 | 8-12-2019 | 7,500,000 | 7,500,560 | ||||||||||||
| 9,500,380 | ||||||||||||||||
|
| |||||||||||||||
The accompanying notes are an integral part of these financial statements.
Institutional Money Market Funds | 9
Table of Contents
Portfolio of investments—July 31, 2019 (unaudited)
| Interest rate | Maturity date | Principal | Value | |||||||||||||
| Colorado: 3.54% | ||||||||||||||||
| Variable Rate Demand Notes ø: 3.54% | ||||||||||||||||
Colorado HFA MFHR Class II Series B (Housing Revenue, FHLB SPA) | 2.47 | % | 5-1-2052 | $ | 29,505,000 | $ | 29,505,000 | |||||||||
Colorado Tender Option Bond Trust Receipts/Certificates Series 2017-TPG007 (Health Revenue, Bank of America NA LIQ) 144A | 2.76 | 10-29-2027 | 27,180,000 | 27,180,000 | ||||||||||||
| 56,685,000 | ||||||||||||||||
|
| |||||||||||||||
Kentucky: 0.75% | ||||||||||||||||
| Variable Rate Demand Note ø: 0.75% | ||||||||||||||||
Kentucky Municipal Power Agency Series B002 (Utilities Revenue, AGM Insured, Morgan Stanley Bank LIQ) 144A | 2.38 | 9-1-2037 | 12,000,000 | 12,000,000 | ||||||||||||
|
| |||||||||||||||
New Jersey: 1.12% | ||||||||||||||||
| Variable Rate Demand Notes ø: 1.12% | ||||||||||||||||
Jets Stadium Development SeriesA-4B (Miscellaneous Revenue, Sumitomo Mitsui Banking Corporation LOC) 144A | 2.40 | 4-1-2047 | 17,915,000 | 17,915,000 | ||||||||||||
|
| |||||||||||||||
New York: 0.81% | ||||||||||||||||
| Variable Rate Demand Notes ø: 0.81% | ||||||||||||||||
New York HFA Manhattan West Residential Housing Project SeriesB-2 (Housing Revenue, Bank of China LOC) | 2.32 | 11-1-2049 | 3,000,000 | 3,000,000 | ||||||||||||
New York HFA Manhattan West Residential Housing Project SeriesB-2 (Housing Revenue, Bank of China LOC) | 2.43 | 11-1-2049 | 10,000,000 | 10,000,000 | ||||||||||||
| 13,000,000 | ||||||||||||||||
|
| |||||||||||||||
Oregon: 0.56% | ||||||||||||||||
| Variable Rate Demand Note ø: 0.56% | ||||||||||||||||
Oregon Tender Option Bond Trust Receipts/Certificates Series ZF2515 (Miscellaneous Revenue, Bank of America NA LIQ) 144A | 2.45 | 5-1-2035 | 9,000,000 | 9,000,000 | ||||||||||||
|
| |||||||||||||||
Other: 3.72% | ||||||||||||||||
| Variable Rate Demand Notes ø: 3.72% | ||||||||||||||||
Columbus GA Housing Development Authority Puttable Floating Option Taxable Notes SeriesTN-024 (Housing Revenue, ACA Insured, Bank of America NA LIQ) 144A | 2.56 | 10-1-2039 | 5,000,000 | 5,000,000 | ||||||||||||
JPMorgan Chase PUTTER/DRIVER Trust Series T0024 Halifax Hospital Medical Center (Health Revenue, JPMorgan Chase & Company LOC, JPMorgan Chase & Company LIQ) 144A | 2.50 | 10-31-2021 | 10,000,000 | 10,000,000 | ||||||||||||
Providence St. Joseph Health Obligation Series 12E (Health Revenue, U.S. Bank NA LOC) | 2.38 | 10-1-2042 | 9,890,000 | 9,890,000 | ||||||||||||
Providence St. Joseph Health Obligation Series 16G (Health Revenue, Bank of Tokyo-Mitsubishi LOC) | 2.40 | 10-1-2047 | 10,000,000 | 10,000,000 | ||||||||||||
SSAB AB Series A (Miscellaneous Revenue, DNB Banking ASA LOC) | 2.43 | 6-1-2035 | 6,000,000 | 6,000,000 | ||||||||||||
Steadfast Crestavilla LLC Series A (Health Revenue, American AgCredit LOC) | 2.44 | 2-1-2056 | 3,000,000 | 3,000,000 | ||||||||||||
Steadfast Crestavilla LLC Series B (Health Revenue, U.S. Bank NA LOC) | 2.44 | 2-1-2056 | 2,000,000 | 2,000,000 | ||||||||||||
Taxable Municipal Funding Trust (GO Revenue, Barclays Bank plc LOC) 144A | 2.61 | 9-1-2027 | 13,625,000 | 13,625,000 | ||||||||||||
| 59,515,000 | ||||||||||||||||
|
| |||||||||||||||
Total Municipal Obligations (Cost $177,615,000) | 177,615,380 | |||||||||||||||
|
| |||||||||||||||
The accompanying notes are an integral part of these financial statements.
10 | Institutional Money Market Funds
Table of Contents
Portfolio of investments—July 31, 2019 (unaudited)
| Interest rate | Maturity date | Principal | Value | |||||||||||||
| Non-Agency Mortgage-Backed Securities: 0.25% | ||||||||||||||||
Pepper Residential Securities Trust Series 20A Class A1U2 | 2.65 | % | 3-16-2020 | $ | 4,000,000 | $ | 4,006,416 | |||||||||
|
| |||||||||||||||
TotalNon-Agency Mortgage-Backed Securities (Cost $4,000,000) | 4,006,416 | |||||||||||||||
|
| |||||||||||||||
| Other Instruments: 3.97% | ||||||||||||||||
Altoona Blair County Development Corporation 144A§øø | 2.39 | 4-1-2035 | 12,000,000 | 12,000,000 | ||||||||||||
Invesco Dynamic Credit Opportunities Fund SeriesW-7 §øø | 2.50 | 6-1-2028 | 15,000,000 | 15,000,000 | ||||||||||||
Jefferson at Stadium Park-Phase A Owner LLC Series A §øø | 2.44 | 2-1-2057 | 2,000,000 | 2,000,000 | ||||||||||||
Mitsubishi UFJ Trust and Banking Corporation 144A§øø | 2.45 | 10-16-2019 | 12,600,000 | 12,601,615 | ||||||||||||
Opus Inspection Incorporated §øø | 2.57 | 1-1-2034 | 11,000,000 | 11,000,000 | ||||||||||||
ROC III California Crossings Chino Hills LLC Series A §øø | 2.44 | 1-1-2057 | 4,000,000 | 4,000,000 | ||||||||||||
Toyota Motor Credit Corporation §øø | 2.59 | 5-22-2020 | 7,000,000 | 7,000,535 | ||||||||||||
Total Other Instruments (Cost $63,591,894) | 63,602,150 | |||||||||||||||
|
| |||||||||||||||
Other Notes: 1.18% | ||||||||||||||||
| Corporate Bonds and Notes: 1.18% | ||||||||||||||||
Cellmark Incorporated Secured § | 2.57 | 6-1-2038 | 19,000,000 | 19,000,000 | ||||||||||||
|
| |||||||||||||||
Total Other Notes (Cost $19,000,000) | 19,000,000 | |||||||||||||||
|
| |||||||||||||||
| Repurchase Agreements^^: 22.54% | ||||||||||||||||
Bank of America Corporation, dated7-31-2019, maturity value $80,005,689 (1) | 2.56 | 8-1-2019 | 80,000,000 | 80,000,000 | ||||||||||||
Bank of Montreal, dated7-31-2019, maturity value $75,005,313 (2) | 2.55 | 8-1-2019 | 75,000,000 | 75,000,000 | ||||||||||||
Bank of Nova Scotia, dated7-31-2019, maturity value $70,004,939 (3) | 2.54 | 8-1-2019 | 70,000,000 | 70,000,000 | ||||||||||||
Credit Agricole, dated7-31-2019, maturity value $25,009,500 (4) | 2.28 | 8-6-2019 | 25,000,000 | 25,000,000 | ||||||||||||
Credit Agricole, dated7-31-2019, maturity value $40,012,889 (5) | 2.32 | 8-5-2019 | 40,000,000 | 40,000,000 | ||||||||||||
GX Clarke & Company, dated7-31-2019, maturity value $71,005,088 (6) | 2.58 | 8-1-2019 | 71,000,000 | 71,000,000 | ||||||||||||
Total Repurchase Agreements (Cost $361,000,000) | 361,000,000 | |||||||||||||||
|
| |||||||||||||||
| Total investments in securities (Cost $1,599,909,836) | 99.89 | % | 1,600,058,538 | |||||
Other assets and liabilities, net | 0.11 | 1,768,472 | ||||||
|
|
|
| |||||
| Total net assets | 100.00 | % | $ | 1,601,827,010 | ||||
|
|
|
| |||||
| ± | Variable rate investment. The rate shown is the rate in effect at period end. |
| (z) | Zero coupon security. The rate represents the current yield to maturity. |
| 144A | The security may be resold in transactions exempt from registration, normally to qualified institutional buyers, pursuant to Rule 144A under the Securities Act of 1933. |
| ø | Variable rate demand notes are subject to a demand feature which reduces the effective maturity. The maturity date shown represents the final maturity date of the security. The interest rate is determined and reset by the issuer daily, weekly, or monthly depending upon the terms of the security. The rate shown is the rate in effect at period end. |
| § | The security is subject to a demand feature which reduces the effective maturity. |
| øø | The interest rate is determined and reset by the issuer periodically depending upon the terms of the security. The rate shown is the rate in effect at period end. |
| ^^ | Collateralized by: |
| (1) | U.S. government securities, 3.00% to 3.50%,3-20-2045 to1-20-2047, fair value including accrued interest is $82,400,000. |
| (2) | U.S. government securities, 2.19% to 5.00%,3-10-2023 to10-20-2068, fair value including accrued interest is $77,249,804. |
| (3) | U.S. government securities, 2.40% to 6.50%,11-1-2020 to8-1-2049, fair value including accrued interest is $72,100,000. |
| (4) | U.S. government securities, 3.00% to 5.00%,3-15-2038 to3-20-2049, fair value including accrued interest is $25,750,000. |
| (5) | U.S. government securities, 2.50% to 6.00%,1-1-2027 to6-20-2049, fair value including accrued interest is $41,200,000. |
| (6) | U.S. government securities, 0.00% to 10.00%,8-2-2019 to5-20-2069, fair value including accrued interest is $72,854,575. |
The accompanying notes are an integral part of these financial statements.
Institutional Money Market Funds | 11
Table of Contents
Portfolio of investments—July 31, 2019 (unaudited)
Abbreviations:
| ACA | ACA Financial Guaranty Corporation |
| AGM | Assured Guaranty Municipal |
| DRIVER | Derivative inversetax-exempt receipts |
| FHLB | Federal Home Loan Bank |
| HFA | Housing Finance Authority |
| LIBOR | London Interbank Offered Rate |
| LIQ | Liquidity agreement |
| LOC | Letter of credit |
| MFHR | Multifamily housing revenue |
| PUTTER | Puttabletax-exempt receipts |
| ROC | Reset option certificates |
| SPA | Standby purchase agreement |
The accompanying notes are an integral part of these financial statements.
12 | Institutional Money Market Funds
Table of Contents
Statement of assets and liabilities—July 31, 2019 (unaudited)
Assets | ||||
Investments in unaffiliated securities, at value (cost $1,238,909,836) | $ | 1,239,058,538 | ||
Investments in repurchase agreements, at value (cost $361,000,000) | 361,000,000 | |||
Cash | 11,714 | |||
Receivable for Fund shares sold | 150 | |||
Receivable for interest | 2,286,073 | |||
Prepaid expenses and other assets | 98,645 | |||
|
| |||
Total assets | 1,602,455,120 | |||
|
| |||
Liabilities | ||||
Custodian and accounting fees payable | 215,516 | |||
Management fee payable | 120,530 | |||
Shareholder report expenses payable | 94,302 | |||
Administration fees payable | 86,314 | |||
Payable for Fund shares redeemed | 50,000 | |||
Shareholder servicing fees payable | 32,917 | |||
Dividends payable | 2,958 | |||
Trustees’ fees and expenses payable | 2,384 | |||
Accrued expenses and other liabilities | 23,189 | |||
|
| |||
Total liabilities | 628,110 | |||
|
| |||
Total net assets | $ | 1,601,827,010 | ||
|
| |||
Net assets consist of | ||||
Paid-in capital | $ | 1,601,651,471 | ||
Total distributable earnings | 175,539 | |||
|
| |||
Total net assets | $ | 1,601,827,010 | ||
|
| |||
Computation of net asset value per share | ||||
Net assets – Administrator Class | $ | 111,951,265 | ||
Shares outstanding – Administrator Class1 | 111,896,548 | |||
Net asset value per share – Administrator Class | $1.0005 | |||
Net assets – Institutional Class | $ | 639,935,173 | ||
Shares outstanding – Institutional Class1 | 639,621,825 | |||
Net asset value per share – Institutional Class | $1.0005 | |||
Net assets – Select Class | $ | 742,598,481 | ||
Shares outstanding – Select Class1 | 742,212,525 | |||
Net asset value per share – Select Class | $1.0005 | |||
Net assets – Service Class | $ | 107,342,091 | ||
Shares outstanding – Service Class1 | 107,278,898 | |||
Net asset value per share – Service Class | $1.0006 | |||
| 1 | The Fund has an unlimited number of authorized shares. |
The accompanying notes are an integral part of these financial statements.
Institutional Money Market Funds | 13
Table of Contents
Statement of operations—six months ended July 31, 2019 (unaudited)
Investment income | ||||
Interest | $ | 20,098,688 | ||
|
| |||
Expenses | ||||
Management fee | 1,150,272 | |||
Administration fees | ||||
Administrator Class | 59,116 | |||
Institutional Class | 227,798 | |||
Select Class | 143,243 | |||
Service Class | 77,854 | |||
Shareholder servicing fees | ||||
Administrator Class | 59,116 | |||
Service Class | 162,195 | |||
Custody and accounting fees | 41,268 | |||
Professional fees | 20,828 | |||
Registration fees | 18,140 | |||
Shareholder report expenses | 17,255 | |||
Trustees’ fees and expenses | 5,814 | |||
Other fees and expenses | 10,938 | |||
|
| |||
Total expenses | 1,993,837 | |||
Less: Fee waivers and/or expense reimbursements | (439,329 | ) | ||
|
| |||
Net expenses | 1,554,508 | |||
|
| |||
Net investment income | 18,544,180 | |||
|
| |||
Realized and unrealized gains (losses) on investments | ||||
Net realized gains on investments | 2,803 | |||
Net change in unrealized gains (losses) on investments | (723 | ) | ||
|
| |||
Net realized and unrealized gains (losses) on investments | 2,080 | |||
|
| |||
Net increase in net assets resulting from operations | $ | 18,546,260 | ||
|
| |||
The accompanying notes are an integral part of these financial statements.
14 | Institutional Money Market Funds
Table of Contents
Statement of changes in net assets
| Six months ended July 31, 2019 (unaudited) | Year ended January 31, 2019 | |||||||||||||||
Operations |
| |||||||||||||||
Net investment income | $ | 18,544,180 | $ | 28,696,485 | ||||||||||||
Net realized gains on investments | 2,803 | 18,043 | ||||||||||||||
Net change in unrealized gains (losses) on investments | (723 | ) | (7,945 | ) | ||||||||||||
|
| |||||||||||||||
Net increase in net assets resulting from operations | 18,546,260 | 28,706,583 | ||||||||||||||
|
| |||||||||||||||
Distributions to shareholders from net investment income and net realized gains | ||||||||||||||||
Administrator Class | (1,356,812 | ) | (2,465,614 | ) | ||||||||||||
Institutional Class | (6,882,906 | ) | (9,770,370 | ) | ||||||||||||
Select Class | (8,925,320 | ) | (13,889,010 | ) | ||||||||||||
Service Class | (1,379,089 | ) | (2,571,492 | ) | ||||||||||||
|
| |||||||||||||||
Total distributions to shareholders | (18,544,127 | ) | (28,696,486 | ) | ||||||||||||
|
| |||||||||||||||
Capital share transactions | Shares | Shares | ||||||||||||||
Proceeds from shares sold | ||||||||||||||||
Administrator Class | 91,575,913 | 91,621,701 | 208,831,612 | 208,924,052 | ||||||||||||
Institutional Class | 807,166,342 | 807,569,926 | 1,335,820,742 | 1,336,437,928 | ||||||||||||
Select Class | 787,275,507 | 787,693,387 | 3,101,735,175 | 3,103,165,040 | ||||||||||||
Service Class | 296,406,483 | 296,584,327 | 1,098,229,467 | 1,098,801,000 | ||||||||||||
|
| |||||||||||||||
| 1,983,469,341 | 5,747,328,020 | |||||||||||||||
|
| |||||||||||||||
Reinvestment of distributions | ||||||||||||||||
Administrator Class | 1,310,242 | 1,310,897 | 2,416,281 | 2,417,344 | ||||||||||||
Institutional Class | 6,826,120 | 6,829,532 | 9,639,093 | 9,643,341 | ||||||||||||
Select Class | 8,886,029 | 8,890,921 | 13,800,113 | 13,806,425 | ||||||||||||
Service Class | 1,342,578 | 1,343,384 | 2,523,025 | 2,524,353 | ||||||||||||
|
| |||||||||||||||
| 18,374,734 | 28,391,463 | |||||||||||||||
|
| |||||||||||||||
Payment for shares redeemed | ||||||||||||||||
Administrator Class | (117,049,081 | ) | (117,107,606 | ) | (184,686,866 | ) | (184,768,170 | ) | ||||||||
Institutional Class | (692,096,937 | ) | (692,442,985 | ) | (1,467,240,930 | ) | (1,467,914,637 | ) | ||||||||
Select Class | (788,892,669 | ) | (789,319,862 | ) | (3,097,745,586 | ) | (3,099,164,118 | ) | ||||||||
Service Class | (340,853,701 | ) | (341,058,214 | ) | (1,137,900,078 | ) | (1,138,490,122 | ) | ||||||||
|
| |||||||||||||||
| (1,939,928,667 | ) | (5,890,337,047 | ) | |||||||||||||
|
| |||||||||||||||
Net increase (decrease) in net assets resulting from capital share transactions | 61,915,408 | (114,617,564 | ) | |||||||||||||
|
| |||||||||||||||
Total increase (decrease) in net assets | 61,917,541 | (114,607,467 | ) | |||||||||||||
|
| |||||||||||||||
Net assets | ||||||||||||||||
Beginning of period | 1,539,909,469 | 1,654,516,936 | ||||||||||||||
|
| |||||||||||||||
End of period | $ | 1,601,827,010 | $ | 1,539,909,469 | ||||||||||||
|
| |||||||||||||||
The accompanying notes are an integral part of these financial statements.
Institutional Money Market Funds | 15
Table of Contents
(For a share outstanding throughout each period)
| Six months ended July 31, 2019 (unaudited) | Year ended January 31 | |||||||||||||||||||||||
| ADMINISTRATOR CLASS | 2019 | 2018 | 2017 | 20161 | 20151 | |||||||||||||||||||
Net asset value, beginning of period | $1.0005 | $1.0005 | $1.0004 | $1.0000 | $1.00 | $1.00 | ||||||||||||||||||
Net investment income | 0.0114 | 0.0189 | 0.0096 | 0.0029 | 0.00 | 2 | 0.00 | 2 | ||||||||||||||||
Net realized and unrealized gains (losses) on investments | 0.0000 | 3 | 0.0000 | 3 | 0.0001 | 0.0004 | 0.00 | 2 | 0.00 | 2 | ||||||||||||||
|
|
|
|
|
|
|
|
|
|
|
| |||||||||||||
Total from investment operations | 0.0114 | 0.0189 | 0.0097 | 0.0033 | 0.00 | 2 | 0.00 | 2 | ||||||||||||||||
Distributions to shareholders from | ||||||||||||||||||||||||
Net investment income | (0.0114 | ) | (0.0189 | ) | (0.0096 | ) | (0.0029 | ) | (0.00 | )2 | (0.00 | )2 | ||||||||||||
Net asset value, end of period | $1.0005 | $1.0005 | $1.0005 | $1.0004 | $1.00 | $1.00 | ||||||||||||||||||
Total return4 | 1.14 | % | 1.91 | % | 0.97 | % | 0.33 | % | 0.03 | % | 0.01 | % | ||||||||||||
Ratios to average net assets (annualized) | ||||||||||||||||||||||||
Gross expenses | 0.36 | % | 0.37 | % | 0.38 | % | 0.36 | % | 0.35 | % | 0.35 | % | ||||||||||||
Net expenses | 0.33 | % | 0.33 | % | 0.33 | % | 0.33 | % | 0.26 | % | 0.19 | % | ||||||||||||
Net investment income | 2.28 | % | 1.90 | % | 0.96 | % | 0.26 | % | 0.03 | % | 0.01 | % | ||||||||||||
Supplemental data | ||||||||||||||||||||||||
Net assets, end of period (000s omitted) | $111,951 | $136,126 | $109,551 | $118,548 | $297,396 | $396,339 | ||||||||||||||||||
| 1 | Amounts reflect the Fund transacting shares at a fixed NAV rounded to two decimal places. Beginning October 11, 2016, the Fund began selling and redeeming shares of the Fund at a floating NAV rounded to the fourth decimal place. |
| 2 | Amount is less than $0.005. |
| 3 | Amount is less than $0.00005. |
| 4 | Returns for periods of less than one year are not annualized. |
The accompanying notes are an integral part of these financial statements.
16 | Institutional Money Market Funds
Table of Contents
Financial highlights
(For a share outstanding throughout each period)
| Six months ended July 31, 2019 (unaudited) | Year ended January 31 | |||||||||||||||||||||||
| INSTITUTIONAL CLASS | 2019 | 2018 | 2017 | 20161 | 20151 | |||||||||||||||||||
Net asset value, beginning of period | $1.0005 | $1.0005 | $1.0004 | $1.0000 | $1.00 | $1.00 | ||||||||||||||||||
Net investment income | 0.0120 | 0.0202 | 0.0109 | 0.0043 | 0.00 | 2 | 0.00 | 2 | ||||||||||||||||
Net realized and unrealized gains (losses) on investments | 0.0000 | 3 | 0.0000 | 3 | 0.0001 | 0.0003 | 0.00 | 2 | 0.00 | 2 | ||||||||||||||
|
|
|
|
|
|
|
|
|
|
|
| |||||||||||||
Total from investment operations | 0.0120 | 0.0202 | 0.0110 | 0.0046 | 0.00 | 2 | 0.00 | 2 | ||||||||||||||||
Distributions to shareholders from | ||||||||||||||||||||||||
Net investment income | (0.0120 | ) | (0.0202 | ) | (0.0109 | ) | (0.0042 | ) | (0.00 | )2 | (0.00 | )2 | ||||||||||||
Net asset value, end of period | $1.0005 | $1.0005 | $1.0005 | $1.0004 | $1.00 | $1.00 | ||||||||||||||||||
Total return4 | 1.21 | % | 2.04 | % | 1.10 | % | 0.46 | % | 0.09 | % | 0.01 | % | ||||||||||||
Ratios to average net assets (annualized) | ||||||||||||||||||||||||
Gross expenses | 0.24 | % | 0.25 | % | 0.26 | % | 0.23 | % | 0.23 | % | 0.23 | % | ||||||||||||
Net expenses | 0.20 | % | 0.20 | % | 0.20 | % | 0.20 | % | 0.20 | % | 0.19 | % | ||||||||||||
Net investment income | 2.43 | % | 2.01 | % | 1.08 | % | 0.37 | % | 0.10 | % | 0.01 | % | ||||||||||||
Supplemental data | ||||||||||||||||||||||||
Net assets, end of period (000s omitted) | $639,935 | $517,981 | $639,823 | $756,218 | $5,027,125 | $4,320,392 | ||||||||||||||||||
| 1 | Amounts reflect the Fund transacting shares at a fixed NAV rounded to two decimal places. Beginning October 11, 2016, the Fund began selling and redeeming shares of the Fund at a floating NAV rounded to the fourth decimal place. |
| 2 | Amount is less than $0.005. |
| 3 | Amount is less than $0.00005. |
| 4 | Returns for periods of less than one year are not annualized. |
The accompanying notes are an integral part of these financial statements.
Institutional Money Market Funds | 17
Table of Contents
Financial highlights
(For a share outstanding throughout each period)
| Six months ended July 31, 2019 (unaudited) | Year ended January 31 | |||||||||||||||||||||||
| SELECT CLASS | 2019 | 2018 | 2017 | 20161 | 20151 | |||||||||||||||||||
Net asset value, beginning of period | $1.0005 | $1.0005 | $1.0004 | $1.0000 | $1.00 | $1.00 | ||||||||||||||||||
Net investment income | 0.0124 | 0.0209 | 0.0116 | 0.0049 | 0.00 | 2 | 0.00 | 2 | ||||||||||||||||
Net realized and unrealized gains (losses) on investments | 0.0000 | 3 | 0.0000 | 3 | 0.0001 | 0.0004 | 0.00 | 2 | 0.00 | 2 | ||||||||||||||
|
|
|
|
|
|
|
|
|
|
|
| |||||||||||||
Total from investment operations | 0.0124 | 0.0209 | 0.0117 | 0.0053 | 0.00 | 2 | 0.00 | 2 | ||||||||||||||||
Distributions to shareholders from | ||||||||||||||||||||||||
Net investment income | (0.0124 | ) | (0.0209 | ) | (0.0116 | ) | (0.0049 | ) | (0.00 | )2 | (0.00 | )2 | ||||||||||||
Net asset value, end of period | $1.0005 | $1.0005 | $1.0005 | $1.0004 | $1.00 | $1.00 | ||||||||||||||||||
Total return4 | 1.24 | % | 2.11 | % | 1.17 | % | 0.53 | % | 0.16 | % | 0.07 | % | ||||||||||||
Ratios to average net assets (annualized) | ||||||||||||||||||||||||
Gross expenses | 0.20 | % | 0.21 | % | 0.22 | % | 0.19 | % | 0.19 | % | 0.19 | % | ||||||||||||
Net expenses | 0.13 | % | 0.13 | % | 0.13 | % | 0.13 | % | 0.13 | % | 0.13 | % | ||||||||||||
Net investment income | 2.50 | % | 2.08 | % | 1.14 | % | 0.44 | % | 0.16 | % | 0.07 | % | ||||||||||||
Supplemental data | ||||||||||||||||||||||||
Net assets, end of period (000s omitted) | $742,598 | $735,332 | $717,508 | $873,167 | $5,595,704 | $5,889,779 | ||||||||||||||||||
| 1 | Amounts reflect the Fund transacting shares at a fixed NAV rounded to two decimal places. Beginning October 11, 2016, the Fund began selling and redeeming shares of the Fund at a floating NAV rounded to the fourth decimal place. |
| 2 | Amount is less than $0.005. |
| 3 | Amount is less than $0.00005. |
| 4 | Returns for periods of less than one year are not annualized. |
The accompanying notes are an integral part of these financial statements.
18 | Institutional Money Market Funds
Table of Contents
Financial highlights
(For a share outstanding throughout each period)
| Six months ended July 31, 2019 (unaudited) | Year ended January 31 | |||||||||||||||||||||||
| SERVICE CLASS | 2019 | 2018 | 2017 | 20161 | 20151 | |||||||||||||||||||
Net asset value, beginning of period | $1.0006 | $1.0006 | $1.0005 | $1.0000 | $1.00 | $1.00 | ||||||||||||||||||
Net investment income | 0.0104 | 0.0171 | 0.0079 | 0.0011 | 0.00 | 2 | 0.00 | 2 | ||||||||||||||||
Net realized and unrealized gains (losses) on investments | 0.0001 | 0.0001 | 0.0001 | 0.0006 | 0.00 | 2 | 0.00 | 2 | ||||||||||||||||
|
|
|
|
|
|
|
|
|
|
|
| |||||||||||||
Total from investment operations | 0.0105 | 0.0172 | 0.0080 | 0.0017 | 0.00 | 2 | 0.00 | 2 | ||||||||||||||||
Distributions to shareholders from | ||||||||||||||||||||||||
Net investment income | (0.0105 | ) | (0.0172 | ) | (0.0079 | ) | (0.0012 | ) | (0.00 | )2 | (0.00 | )2 | ||||||||||||
Net asset value, end of period | $1.0006 | $1.0006 | $1.0006 | $1.0005 | $1.00 | $1.00 | ||||||||||||||||||
Total return3 | 1.06 | % | 1.73 | % | 0.80 | % | 0.17 | % | 0.01 | % | 0.01 | % | ||||||||||||
Ratios to average net assets (annualized) | ||||||||||||||||||||||||
Gross expenses | 0.53 | % | 0.54 | % | 0.55 | % | 0.52 | % | 0.52 | % | 0.52 | % | ||||||||||||
Net expenses | 0.50 | % | 0.50 | % | 0.50 | % | 0.50 | % | 0.28 | % | 0.19 | % | ||||||||||||
Net investment income | 2.08 | % | 1.71 | % | 0.78 | % | 0.08 | % | 0.01 | % | 0.01 | % | ||||||||||||
Supplemental data | ||||||||||||||||||||||||
Net assets, end of period (000s omitted) | $107,342 | $150,471 | $187,635 | $189,632 | $1,237,014 | $1,438,336 | ||||||||||||||||||
| 1 | Amounts reflect the Fund transacting shares at a fixed NAV rounded to two decimal places. Beginning October 11, 2016, the Fund began selling and redeeming shares of the Fund at a floating NAV rounded to the fourth decimal place. |
| 2 | Amount is less than $0.005. |
| 3 | Returns for periods of less than one year are not annualized. |
The accompanying notes are an integral part of these financial statements.
Institutional Money Market Funds | 19
Table of Contents
Notes to financial statements (unaudited)
1. ORGANIZATION
Wells Fargo Funds Trust (the “Trust”), a Delaware statutory trust organized on March 10, 1999, is anopen-end management investment company registered under the Investment Company Act of 1940, as amended (the “1940 Act”). As an investment company, the Trust follows the accounting and reporting guidance in Financial Accounting Standards Board (“FASB”) Accounting Standards Codification Topic 946,Financial Services – Investment Companies. These financial statements report on the Wells Fargo Cash Investment Money Market Fund (the “Fund”) which is a diversified series of the Trust.
The Fund operates as an institutionalnon-government money market fund. As an institutionalnon-government money market fund, shareholders will transact at a floating net asset value (NAV) rounded to four decimal places in accordance with the valuation policies below.
2. SIGNIFICANT ACCOUNTING POLICIES
The following significant accounting policies, which are consistently followed in the preparation of the financial statements of the Fund, are in conformity with U.S. generally accepted accounting principles which require management to make estimates and assumptions that affect the reported amounts of assets and liabilities, disclosure of contingent assets and liabilities at the date of the financial statements, and the reported amounts of revenues and expenses during the reporting period. Actual results could differ from those estimates.
Securities valuation
Debt securities are valued at the evaluated bid price provided by an independent pricing service (e.g. taking into account various factors, including yields, maturities, or credit ratings) or, if a reliable price is not available, the quoted bid price from an independent broker-dealer.
Investments which are not valued using the method discussed above are valued at their fair value, as determined in good faith by the Board of Trustees of the Fund. The Board of Trustees has established a Valuation Committee comprised of the Trustees and has delegated to it the authority to take any actions regarding the valuation of portfolio securities that the Valuation Committee deems necessary or appropriate, including determining the fair value of portfolio securities, unless the determination has been delegated to the Wells Fargo Asset Management Pricing Committee at Wells Fargo Funds Management, LLC (“Funds Management”). The Board of Trustees retains the authority to make or ratify any valuation decisions or approve any changes to the Valuation Procedures as it deems appropriate. On a quarterly basis, the Board of Trustees receives reports on any valuation actions taken by the Valuation Committee or the Wells Fargo Asset Management Pricing Committee which may include items for ratification.
Repurchase agreements
The Fund may invest in repurchase agreements and may participate in pooled repurchase agreement transactions with other funds advised by Funds Management. Repurchase agreements are agreements where the seller of a security to the Fund agrees to repurchase that security from the Fund at a mutually agreed upon time and price. The repurchase agreements must be fully collateralized based on values that aremarked-to-market daily. The collateral may be held by an agent bank under atri-party agreement. It is the custodian’s responsibility to value collateral daily and to take action to obtain additional collateral as necessary to maintain a market value equal to or greater than the resale price. The repurchase agreements are collateralized by securities issued or guaranteed by the U.S. Government, its agencies or instrumentalities. There could be potential loss to the Fund in the event that the Fund is delayed or prevented from exercising its rights to dispose of the collateral, including the risk of a possible decline in the value of the underlying obligations during the period in which the Fund seeks to assert its rights.
When-issued transactions
The Fund may purchase securities on a forward commitment or when-issued basis. The Fund records a when-issued transaction on the trade date and will segregate assets in an amount at least equal in value to the Fund’s commitment to purchase when-issued securities. Securities purchased on a when-issued basis aremarked-to-market daily and the Fund begins earning interest on the settlement date. Losses may arise due to changes in the market value of the underlying securities or if the counterparty does not perform under the contract.
Security transactions and income recognition
Securities transactions are recorded on a trade date basis. Realized gains or losses are recorded on the basis of identified cost.
Interest income is accrued daily and bond discounts are accreted and premiums are amortized daily. To the extent debt obligations are placed onnon-accrual status, any related interest income may be reduced by writing off interest receivables when the collection of all or a portion of interest has been determined to be doubtful based on consistently applied procedures and the fair value has decreased. If the issuer subsequently resumes interest payments or when the collectability of interest is reasonably assured, the debt obligation is removed fromnon-accrual status.
20 | Institutional Money Market Funds
Table of Contents
Notes to financial statements (unaudited)
Distributions to shareholders
Distributions to shareholders from net investment income are declared daily and paid monthly. Distributions from net realized gains, if any, are recorded on theex-dividend date and paid at least annually. Such distributions are determined in accordance with income tax regulations and may differ from U.S. generally accepted accounting principles. Dividend sources are estimated at the time of declaration. The tax character of distributions is determined as of the Fund’s fiscal year end. Therefore, a portion of the Fund’s distributions made prior to the Fund’s fiscal year end may be categorized as a tax return of capital at year end.
Federal and other taxes
The Fund intends to continue to qualify as a regulated investment company by distributing substantially all of its investment company taxable income and any net realized capital gains (after reduction for capital loss carryforwards) sufficient to relieve it from all, or substantially all, federal income taxes. Accordingly, no provision for federal income taxes was required.
The Fund’s income and federal excise tax returns and all financial records supporting those returns for the prior three fiscal years are subject to examination by the federal and Delaware revenue authorities. Management has analyzed the Fund’s tax positions taken on federal, state, and foreign tax returns for all open tax years and does not believe that there are any uncertain tax positions that require recognition of a tax liability.
As of July 31, 2019, the aggregate cost of all investments for federal income tax purposes was $1,599,909,836 and the unrealized gains (losses) consisted of:
Gross unrealized gains | $ | 165,092 | ||
Gross unrealized losses | (16,390 | ) | ||
Net unrealized gains | $ | 148,702 | ||
Class allocations
The separate classes of shares offered by the Fund differ principally in shareholder servicing and administration fees. Class specific expenses are charged directly to that share class. Investment income, common fund-level expenses, and realized and unrealized gains (losses) on investments are allocated daily to each class of shares based on the relative proportion of net assets of each class.
3. FAIR VALUATION MEASUREMENTS
Fair value measurements of investments are determined within a framework that has established a fair value hierarchy based upon the various data inputs utilized in determining the value of the Fund’s investments. The three-level hierarchy gives the highest priority to unadjusted quoted prices in active markets for identical assets or liabilities (Level 1) and the lowest priority to unobservable inputs (Level 3). The Fund’s investments are classified within the fair value hierarchy based on the lowest level of input that is significant to the fair value measurement. The inputs are summarized into three broad levels as follows:
| ∎ | Level 1 – quoted prices in active markets for identical securities |
| ∎ | Level 2 – other significant observable inputs (including quoted prices for similar securities, interest rates, prepayment speeds, credit risk, etc.) |
| ∎ | Level 3 – significant unobservable inputs (including the Fund’s own assumptions in determining the fair value of investments) |
The inputs or methodologies used for valuing investments in securities are not necessarily an indication of the risk associated with investing in those securities.
Institutional Money Market Funds | 21
Table of Contents
Notes to financial statements (unaudited)
The following is a summary of the inputs used in valuing the Fund’s assets and liabilities as of July 31, 2019:
| Quoted prices (Level 1) | Other significant observable inputs (Level 2) | Significant unobservable inputs (Level 3) | Total | |||||||||||||
Assets | ||||||||||||||||
Investments in: | ||||||||||||||||
Certificates of deposit | $ | 0 | $ | 357,009,099 | $ | 0 | $ | 357,009,099 | ||||||||
Commercial paper | 0 | 617,825,493 | 0 | 617,825,493 | ||||||||||||
Municipal obligations | 0 | 177,615,380 | 0 | 177,615,380 | ||||||||||||
Non-agency mortgage-backed securities | 0 | 4,006,416 | 0 | 4,006,416 | ||||||||||||
Other instruments | 0 | 63,602,150 | 0 | 63,602,150 | ||||||||||||
Other notes | 0 | 19,000,000 | 0 | 19,000,000 | ||||||||||||
Repurchase agreements | 0 | 361,000,000 | 0 | 361,000,000 | ||||||||||||
Total assets | $ | 0 | $ | 1,600,058,538 | $ | 0 | $ | 1,600,058,538 | ||||||||
Additional sector, industry or geographic detail is included in the Portfolio of Investments.
For the six months ended July 31, 2019, the Fund did not have any transfers into/out of Level 3.
4. TRANSACTIONS WITH AFFILIATES
Management fee
Funds Management, an indirect wholly owned subsidiary of Wells Fargo & Company (“Wells Fargo”), is the manager of the Fund and provides advisory and fund-level administrative services under an investment management agreement. Under the investment management agreement, Funds Management is responsible for, among other services, implementing the investment objectives and strategies of the Fund, supervising the subadviser and providing fund-level administrative services in connection with the Fund’s operations. As compensation for its services under the investment management agreement, Funds Management is entitled to receive a management fee at the following annual rate based on the Fund’s average daily net assets:
| Average daily net assets | Management fee | |
First $5 billion | 0.15% | |
Next $5 billion | 0.14 | |
Over $10 billion | 0.13 | |
For the six months ended July 31, 2019, the management fee was equivalent to an annual rate of 0.15% of the Fund’s average daily net assets.
Funds Management has retained the services of certain subadvisers to provide daily portfolio management to the Fund. Wells Capital Management Incorporated (“WellsCap”), an affiliate of Funds Management and an indirect wholly owned subsidiary of Wells Fargo, is a subadviser to the Fund and is entitled to receive a fee from Funds Management at an annual rate starting at 0.05% and declining to 0.01% as the average daily net assets of the Fund increase. Wells Capital Management Singapore, a separately identifiable department of Wells Fargo Bank, N.A., an affiliate of Funds Management and wholly owned subsidiary of Wells Fargo, is also a subadviser to the Fund and is entitled to receive a fee from WellsCap at an annual rate starting at 0.0025% and declining to 0.0005% as the average daily net assets of the Fund increase.
Administration fees
Under a class-level administration agreement, Funds Management provides class-level administrative services to the Fund, which includes paying fees and expenses for services provided by the transfer agent,sub-transfer agents, omnibus account
22 | Institutional Money Market Funds
Table of Contents
Notes to financial statements (unaudited)
servicers and record-keepers. As compensation for its services under the class-level administration agreement, Funds Management receives an annual fee which is calculated based on the average daily net assets of each class as follows:
| Class-level administration fee | ||||
Administrator Class | 0.10 | % | ||
Institutional Class | 0.08 | |||
Select Class | 0.04 | |||
Service Class | 0.12 | |||
Waivers and/or expense reimbursements
Funds Management has contractually waived and/or reimbursed management and administration fees to the extent necessary to maintain certain net operating expense ratios for the Fund. When each class of the Fund has exceeded its expense cap, Funds Management has waived fees and/or reimbursed expenses from fund-level expenses on a proportionate basis and then from class specific expenses. When only certain classes exceed their expense caps, waivers and/or reimbursements are applied against class specific expenses before fund-level expenses. Funds Management has committed through May 31, 2020 to waive fees and/or reimburse expenses to the extent necessary to cap the Fund’s expenses at 0.33% for Administrator Class shares, 0.20% for Institutional Class shares, 0.13% for Select Class shares and 0.50% for Service Class shares. Prior to or after the commitment expiration date, the cap may be increased or the commitment to maintain the cap may be terminated only with the approval of the Board of Trustees.
Shareholder servicing fees
The Trust has entered into contracts with one or more shareholder servicing agents, whereby Administrator Class and Service Class of the Fund are charged a fee at an annual rate of 0.10% and 0.25%, respectively, of their average daily net assets. A portion of these total shareholder servicing fees were paid to affiliates of Wells Fargo.
Interfund transactions
The Fund may purchase or sell portfolio investment securities to certain other Wells Fargo affiliates pursuant to Rule17a-7 under the 1940 Act and under procedures adopted by the Board of Trustees. The procedures have been designed to ensure that these interfund transactions, which do not incur broker commissions, are effected at current market prices.
5. INDEMNIFICATION
Under the Trust’s organizational documents, the officers and Trustees have been granted certain indemnification rights against certain liabilities that may arise out of performance of their duties to the Trust. Additionally, in the normal course of business, the Trust may enter into contracts with service providers that contain a variety of indemnification clauses. The Trust’s maximum exposure under these arrangements is dependent on future claims that may be made against the Fund and, therefore, cannot be estimated.
6. NEW ACCOUNTING PRONOUNCEMENTS
In August 2018, FASB issued Accounting Standards Update (“ASU”)No. 2018-13, Fair Value Measurement (Topic 820)Disclosure Framework—Changes to the Disclosure Requirements for Fair Value Measurement. ASU2018-13 updates the disclosure requirements for fair value measurements by modifying or removing certain disclosures and adding certain new disclosures. The amendments are effective for fiscal years, and interim periods within those fiscal years, beginning after December 15, 2019. Early adoption is permitted. Management has adopted the removal and modification of disclosures early, as permitted, and will adopt the additional new disclosures at the effective date.
In March 2017, FASB issued ASUNo. 2017-08,Premium Amortization on Purchased Callable Debt Securities. ASU2017-08 shortens the amortization period for certain callable debt securities held at a premium and requires the premium to be amortized to the earliest call date. The amendments do not require an accounting change for securities held at a discount and discounts will continue to be accreted to the maturity date of the security. ASU2017-08 is effective for fiscal years beginning after December 15, 2018 and for interim periods within those fiscal years. During the current reporting period, management of the Fund adopted the change in accounting policy which did not have a material impact to the Fund’s financial statements.
Institutional Money Market Funds | 23
Table of Contents
PROXY VOTING INFORMATION
A description of the policies and procedures used to determine how to vote proxies relating to portfolio securities is available, upon request, by calling1-800-222-8222, visiting our website atwfam.com, or visiting the SEC website at sec.gov. Information regarding how the proxies related to portfolio securities were voted during the most recent12-month period ended June 30 is available on the website atwfam.comor by visiting the SEC website at sec.gov.
24 | Institutional Money Market Funds
Table of Contents
Other information (unaudited)
BOARD OF TRUSTEES AND OFFICERS
Each of the Trustees and Officers1 listed in the table below acts in identical capacities for each fund in the Wells Fargo family of funds, which consists of 152 mutual funds comprising the Wells Fargo Funds Trust, Wells Fargo Variable Trust, Wells Fargo Master Trust and fourclosed-end funds (collectively the “Fund Complex”). This table should be read in conjunction with the Prospectus and the Statement of Additional Information2. The mailing address of each Trustee and Officer is 525 Market Street, 12th Floor, San Francisco, CA 94105. Each Trustee and Officer serves an indefinite term, however, each Trustee serves such term until reaching the mandatory retirement age established by the Trustees.
Independent Trustees
Name and year of birth | Position held and length of service* | Principal occupations during past five years or longer | Current other public company or investment directorships | |||
William R. Ebsworth (Born 1957) | Trustee, since 2015 | Retired. From 1984 to 2013, equities analyst, portfolio manager, research director and chief investment officer at Fidelity Management and Research Company in Boston, Tokyo, and Hong Kong, and retired in 2013 as Chief Investment Officer of Fidelity Strategic Advisers, Inc. where he led a team of investment professionals managing client assets. Prior thereto, Board member of Hong Kong Securities Clearing Co., Hong Kong Options Clearing Corp., the Thailand International Fund, Ltd., Fidelity Investments Life Insurance Company, and Empire Fidelity Investments Life Insurance Company. Audit Committee Chair and Investment Committee Chair of the Vincent Memorial Hospital Endowment(non-profit organization). Mr. Ebsworth is a CFA® charterholder. | N/A | |||
Jane A. Freeman (Born 1953) | Trustee, since 2015; Chair Liaison, since 2018 | Retired. From 2012 to 2014 and 1999 to 2008, Chief Financial Officer of Scientific Learning Corporation. From 2008 to 2012, Ms. Freeman provided consulting services related to strategic business projects. Prior to 1999, Portfolio Manager at Rockefeller & Co. and Scudder, Stevens & Clark. Board member of the Harding Loevner Funds from 1996 to 2014, serving as both Lead Independent Director and chair of the Audit Committee. Board member of the Russell Exchange Traded Funds Trust from 2011 to 2012 and the chair of the Audit Committee. Ms. Freeman is a Board Member of The Ruth Bancroft Garden(non-profit organization). She is also an inactive Chartered Financial Analyst. | N/A | |||
Isaiah Harris, Jr. (Born 1952) | Trustee, since 2009; Audit Committee Chairman, since 2019 | Retired. Chairman of the Board of CIGNA Corporation since 2009, and Director since 2005. From 2003 to 2011, Director of Deluxe Corporation. Prior thereto, President and CEO of BellSouth Advertising and Publishing Corp. from 2005 to 2007, President and CEO of BellSouth Enterprises from 2004 to 2005 and President of BellSouth Consumer Services from 2000 to 2003. Emeritus member of the Iowa State University Foundation Board of Governors. Emeritus Member of the Advisory Board of Iowa State University School of Business. Advisory Board Member, Palm Harbor Academy (private school). Advisory Board Member, Child Evangelism Fellowship(non-profit). Mr. Harris is a certified public accountant (inactive status). | CIGNA Corporation | |||
Judith M. Johnson (Born 1949) | Trustee, since 2008; Audit Committee Chairman, from 2009 to 2018 | Retired. Prior thereto, Chief Executive Officer and Chief Investment Officer of Minneapolis Employees Retirement Fund from 1996 to 2008. Ms. Johnson is an attorney, certified public accountant and a certified managerial accountant. | N/A | |||
Institutional Money Market Funds | 25
Table of Contents
Other information (unaudited)
Name and year of birth | Position held and length of service* | Principal occupations during past five years or longer | Current other public company or investment directorships | |||
David F. Larcker (Born 1950) | Trustee, since 2009 | James Irvin Miller Professor of Accounting at the Graduate School of Business, Stanford University, Director of the Corporate Governance Research Initiative and Senior Faculty of The Rock Center for Corporate Governance since 2006. From 2005 to 2008, Professor of Accounting at the Graduate School of Business, Stanford University. Prior thereto, Ernst & Young Professor of Accounting at The Wharton School, University of Pennsylvania from 1985 to 2005. | N/A | |||
Olivia S. Mitchell (Born 1953) | Trustee, since 2006; Nominating and Governance Committee Chairman, since 2018 | International Foundation of Employee Benefit Plans Professor, Wharton School of the University of Pennsylvania since 1993. Director of Wharton’s Pension Research Council and Boettner Center on Pensions & Retirement Research, and Research Associate at the National Bureau of Economic Research. Previously, Cornell University Professor from 1978 to 1993. | N/A | |||
Timothy J. Penny (Born 1951) | Trustee, since 1996; Chairman, since 2018 | President and Chief Executive Officer of Southern Minnesota Initiative Foundation, anon-profit organization, since 2007. Member of the Board of Trustees of NorthStar Education Finance, Inc., anon-profit organization, since 2007. | N/A | |||
James G. Polisson (Born 1959) | Trustee, since 2018 | Retired. Chief Marketing Officer, Source (ETF) UK Services, Ltd, from 2015 to 2017. From 2012 to 2015, Principal of The Polisson Group, LLC, a management consulting, corporate advisory and principal investing company. Chief Executive Officer and Managing Director at Russell Investments, Global Exchange Traded Funds from 2010 to 2012. Managing Director of Barclays Global Investors from 1998 to 2010 and Global Chief Marketing Officer for iShares and Barclays Global Investors from 2000 to 2010. Trustee of the San Francisco Mechanics’ Institute, anon-profit organization, from 2013 to 2015. Board member of the Russell Exchange Traded Fund Trust from 2011 to 2012. Director of Barclays Global Investors Holdings Deutschland GmbH from 2006 to 2009. Mr. Polisson is an attorney and has a retired status with the Massachusetts and District of Columbia Bar Associations. | N/A | |||
| * | Length of service dates reflect the Trustee’s commencement of service with the Trust’s predecessor entities, where applicable. |
26 | Institutional Money Market Funds
Table of Contents
Other information (unaudited)
Officers
Name and year of birth | Position held and length of service | Principal occupations during past five years or longer | ||
Andrew Owen (Born 1960) | President, since 2017 | Executive Vice President of Wells Fargo & Company and Head of Affiliated Managers, Wells Fargo Asset Management, since 2014. In addition, Mr. Owen is currently President, Chief Executive Officer and Director of Wells Fargo Funds Management, LLC since 2017. Prior thereto, Executive Vice President responsible for marketing, investments and product development for Wells Fargo Funds Management, LLC, from 2009 to 2014. | ||
Nancy Wiser1 (Born 1967) | Treasurer, since 2012 | Executive Vice President of Wells Fargo Funds Management, LLC since 2011. Chief Operating Officer and Chief Compliance Officer at LightBox Capital Management LLC, from 2008 to 2011. | ||
Alexander Kymn (Born 1973) | Secretary and Chief Legal Officer, since 2018 | Senior Company Counsel of Wells Fargo Bank, N.A. since 2018 (previously Senior Counsel from 2007 to 2018). Vice President of Wells Fargo Funds Management, LLC from 2008 to 2014. | ||
Michael H. Whitaker (Born 1967) | Chief Compliance Officer, since 2016 | Senior Vice President and Chief Compliance Officer since 2016. Senior Vice President and Chief Compliance Officer for Fidelity Investments from 2007 to 2016. | ||
David Berardi (Born 1975) | Assistant Treasurer, since 2009 | Vice President of Wells Fargo Funds Management, LLC since 2009. Vice President of Evergreen Investment Management Company, LLC from 2008 to 2010. Manager of Fund Reporting and Control for Evergreen Investment Management Company, LLC from 2004 to 2010. | ||
Jeremy DePalma1 (Born 1974) | Assistant Treasurer, since 2009 | Senior Vice President of Wells Fargo Funds Management, LLC since 2009. Senior Vice President of Evergreen Investment Management Company, LLC from 2008 to 2010 and head of the Fund Reporting and Control Team within Fund Administration from 2005 to 2010. | ||
| 1 | Nancy Wiser acts as Treasurer of 65 funds in the Fund Complex. Jeremy DePalma acts as Treasurer of 87 funds and Assistant Treasurer of 65 funds in the Fund Complex. |
| 2 | The Statement of Additional Information includes additional information about the Trustees and is available, without charge, upon request, by calling1-800-222-8222 or by visiting the website atwfam.com. |
Institutional Money Market Funds | 27
Table of Contents
Other information (unaudited)
BOARD CONSIDERATION OF INVESTMENT MANAGEMENT ANDSUB-ADVISORY AGREEMENTS:
Wells Fargo Cash Investment Money Market Fund
Under the Investment Company Act of 1940 (the “1940 Act”), the Board of Trustees (the “Board”) of Wells Fargo Funds Trust (the “Trust”) must determine annually whether to approve the continuation of the Trust’s investment management andsub-advisory agreements. In this regard, at anin-person meeting held on May21-22, 2019 (the “Meeting”), the Board, all the members of which have no direct or indirect interest in the investment management andsub-advisory agreements and are not “interested persons” of the Trust, as defined in the 1940 Act (the “Independent Trustees”), reviewed and approved for Wells Fargo Cash Investment Money Market Fund(the “Fund”): (i) an investment management agreement (the “Management Agreement”) with Wells Fargo Funds Management, LLC (“Funds Management”); (ii) an investmentsub-advisory agreement (the “WellsCapSub-Advisory Agreement”) with Wells Capital Management Incorporated (“WellsCap”); and (iii) an investmentsub-advisory agreement (the “WellsCap SingaporeSub-Advisory Agreement,” and together with the WellsCapSub-Advisory Agreement, the“Sub-Advisory Agreements”) with Wells Capital Management Singapore (together with WellsCap, each a“Sub-Adviser” and collectively, the“Sub-Advisers”), each an affiliate of Funds Management. The Management Agreement and theSub-Advisory Agreements are collectively referred to as the “Advisory Agreements.”
At the Meeting, the Board considered the factors and reached the conclusions described below relating to the selection of Funds Management and theSub-Advisers and the approval of the Advisory Agreements. Prior to the Meeting, including at anin-person meeting in April 2019, the Trustees conferred extensively among themselves and with representatives of Funds Management about these matters. Also, the Board has adopted a team-based approach, with each team consisting of asub-set of Trustees, to assist the full Board in the discharge of its duties in reviewing investment performance and other matters throughout the year. The Independent Trustees were assisted in their evaluation of the Advisory Agreements by independent legal counsel, from whom they received separate legal advice and with whom they met separately.
In providing information to the Board, Funds Management and theSub-Advisers were guided by a detailed set of requests for information submitted to them by independent legal counsel on behalf of the Independent Trustees at the start of the Board’s annual contract renewal process earlier in 2019. In considering and approving the Advisory Agreements, the Trustees considered the information they believed relevant, including but not limited to the information discussed below. The Board considered not only the specific information presented in connection with the Meeting, but also the knowledge gained over time through interaction with Funds Management and theSub-Advisers about various topics. In this regard, the Board reviewed reports of Funds Management at each of its quarterly meetings, which included, among other things, portfolio reviews and investment performance reports. In addition, the Board and the teams mentioned above confer with portfolio managers at various times throughout the year. The Board did not identify any particular information or consideration that wasall-important or controlling, and each individual Trustee may have attributed different weights to various factors.
After its deliberations, the Board unanimously approved the continuation of the Advisory Agreements for aone-year term and determined that the compensation payable to Funds Management and theSub-Advisers under each of the Advisory Agreements was reasonable. The Board considered the approval of the Advisory Agreements for the Fund as part of its consideration of agreements for funds across the complex, but its approvals were made on afund-by-fund basis. The following summarizes a number of important, but not necessarily all, factors considered by the Board in support of its approvals.
Nature, extent and quality of services
The Board received and considered various information regarding the nature, extent and quality of services provided to the Fund by Funds Management and theSub-Advisers under the Advisory Agreements. This information included a description of the investment advisory services and Fund-level administrative services covered by the Management Agreement, as well as, among other things, a summary of the background and experience of senior management of Wells Fargo Asset Management (“WFAM”), of which Funds Management and theSub-Advisers are a part, a summary of investments made in the business of WFAM, a summary of certain organizational and personnel changes involving Funds Management and theSub-Advisers, and a description of Funds Management’s and theSub-Advisers’ business continuity planning programs and of their approaches to data privacy and cybersecurity. The Board received and reviewed information about Funds Management’s role as administrator of the Fund’s liquidity risk management program. The Board also considered the qualifications, background, tenure and responsibilities of each of the portfolio managers primarily responsible for theday-to-day portfolio management of the Fund.
The Board evaluated the ability of Funds Management and theSub-Advisers to attract and retain qualified investment professionals, including research, advisory and supervisory personnel. The Board further considered the compliance programs and compliance records of Funds Management and theSub-Advisers. In addition, the Board took into account the full range of services provided to the Fund by Funds Management and its affiliates.
28 | Institutional Money Market Funds
Table of Contents
Other information (unaudited)
Fund investment performance and expenses
The Board considered the investment performance results for the Fund over various time periods ended December 31, 2018. The Board considered these results in comparison to the investment performance of funds in a universe that was determined by Broadridge Inc. (“Broadridge”) to be similar to the Fund (the “Universe”), and in comparison to the Fund’s benchmark index and to other comparative data. Broadridge is an independent provider of investment company data. The Board received a description of the methodology used by Broadridge to select the mutual funds in the performance Universe. The Board noted that the investment performance of the Fund (Administrator Class) was higher than, equal to or in range of the average investment performance of the Universe for all periods under review.
The Board also received and considered information regarding the Fund’s net operating expense ratios and their various components, including actual management fees, custodian and othernon-management fees, and Rule12b-1 andnon-Rule12b-1 shareholder service fees. The Board considered these ratios in comparison to the median ratios of funds in class-specific expense groups that were determined by Broadridge to be similar to the Fund (the “Groups”). The Board received a description of the methodology used by Broadridge to select the mutual funds in the expense Groups and an explanation of how funds comprising expense groups and their expense ratios may vary fromyear-to-year. Based on the Broadridge reports, the Board noted that the net operating expense ratios of the Fund were equal to or in range of the median net operating expense ratios of the expense Groups for each share class. The Board noted that the net operating expense ratio caps for the Fund’s Administrator Class would be reduced.
The Board took into account the Fund’s investment performance and expense information provided to it among the factors considered in deciding tore-approve the Advisory Agreements.
Investment management andsub-advisory fee rates
The Board reviewed and considered the contractual fee rates payable by the Fund to Funds Management under the Management Agreement, as well as the contractual fee rates payable by the Fund to Funds Management for class-level administrative services under a Class-Level Administration Agreement, which include, among other things, class-level transfer agency andsub-transfer agency costs (collectively, the “Management Rates”). The Board also reviewed and considered the contractual investmentsub-advisory fee rates that are payable by Funds Management to theSub-Advisers for investmentsub-advisory services.
Among other information reviewed by the Board was a comparison of the Fund’s Management Rates with the average contractual investment management fee rates of funds in the expense Groups at a common asset level as well as transfer agency costs of the funds in the expense Groups. The Board noted that the Management Rates of the Fund were equal to or in range of the sum of these average rates for the Fund’s expense Groups for all share classes.
The Board also received and considered information about the portion of the total management fee that was retained by Funds Management after payment of the fees to theSub-Advisers forsub-advisory services. In assessing the reasonableness of this amount, the Board received and evaluated information about the nature and extent of responsibilities retained and risks assumed by Funds Management and not delegated to or assumed by either of theSub-Advisers, and about Funds Management’son-going oversight services. Given the affiliation between Funds Management and theSub-Advisers, the Board ascribed limited relevance to the allocation of fees between them.
The Board also received and considered information about the nature and extent of services offered and fee rates charged by Funds Management and theSub-Advisers to other types of clients with investment strategies similar to those of the Fund. In this regard, the Board received information about the significantly greater scope of services, and compliance, reporting and other legal burdens and risks of managing proprietary mutual funds compared with those associated with managing assets of other types of clients, including third-partysub-advised fund clients andnon-mutual fund clients such as institutional separate accounts.
Based on its consideration of the factors and information it deemed relevant, including those described here, the Board determined that the compensation payable to Funds Management under the Management Agreement and to theSub-Advisers under theSub-Advisory Agreements was reasonable.
Profitability
The Board received and considered information concerning the profitability of Funds Management, as well as the profitability of both WFAM and Wells Fargo & Co. (“Wells Fargo”) from providing services to the fund family as a whole. The Board noted that theSub-Advisers’ profitability information with respect to providing services to the Fund and other funds in the family was subsumed in the WFAM and Wells Fargo profitability analysis.
Institutional Money Market Funds | 29
Table of Contents
Other information (unaudited)
Funds Management reported on the methodologies and estimates used in calculating profitability, including a description of the methodology used to allocate certain expenses. Among other things, the Board noted that the levels of profitability reported on afund-by-fund basis varied widely, depending on factors such as the size, type and age of fund. Based on its review, the Board did not deem the profits reported by Funds Management, WFAM or Wells Fargo from services provided to the Fund to be at a level that would prevent it from approving the continuation of the Advisory Agreements.
Economies of scale
The Board received and considered information about the potential for Funds Management to experience economies of scale in the provision of management services to the Fund, the difficulties of calculating economies of scale at an individual fund level, and the extent to which potential scale benefits are shared with shareholders. The Board noted the existence of breakpoints in the Fund’s management fee structure, which operate generally to reduce the Fund’s expense ratios as the Fund grows in size. The Board considered that in addition to management fee breakpoints, Funds Management shares potential economies of scale from its management business in a variety of ways, including through fee waiver and expense reimbursement arrangements, services that benefit shareholders, competitive management fee rates set at the outset without regard to breakpoints, and investments in the business intended to enhance services available to shareholders.
The Board concluded that Funds Management’s arrangements with respect to the Fund, including contractual breakpoints, constituted a reasonable approach to sharing potential economies of scale with the Fund and its shareholders.
Other benefits to Funds Management and theSub-Advisers
The Board received and considered information regarding potential“fall-out” or ancillary benefits received by Funds Management and its affiliates, including theSub-Advisers, as a result of their relationships with the Fund. Ancillary benefits could include, among others, benefits directly attributable to other relationships with the Fund and benefits potentially derived from an increase in Funds Management’s and theSub-Advisers’ business as a result of their relationships with the Fund. The Board noted that various affiliates of Funds Management may receive distribution-related fees, shareholder servicing payments andsub-transfer agency fees in respect of shares sold or held through them and services provided.
The Board also reviewed information about soft dollar credits earned and utilized by theSub-Advisers, fees earned by Funds Management and theSub-Advisers from managing a private investment vehicle for the fund family’s securities lending collateral, and commissions earned by an affiliated broker from portfolio transactions.
Based on its consideration of the factors and information it deemed relevant, including those described here, the Board did not find that any ancillary benefits received by Funds Management and its affiliates, including theSub-Advisers, were unreasonable.
Conclusion
At the Meeting, after considering the above-described factors and based on its deliberations and its evaluation of the information described above, the Board unanimously approved the continuation of the Advisory Agreements for aone-year term and determined that the compensation payable to Funds Management and theSub-Advisers under each of the Advisory Agreements was reasonable.
30 | Institutional Money Market Funds
Table of Contents
This page is intentionally left blank.
Table of Contents
This page is intentionally left blank.
Table of Contents
For more information
More information about Wells Fargo Funds is available free upon request. To obtain literature, please write, visit the Fund’s website, or call:
Wells Fargo Funds
P.O. Box 219967
Kansas City, MO 64121-9967
Website:wfam.com
Individual investors:1-800-222-8222
Retail investment professionals:1-888-877-9275
Institutional investment professionals:1-866-765-0778

This report and the financial statements contained herein are submitted for the general information of the shareholders of the Fund. If this report is used for promotional purposes, distribution of the report must be accompanied or preceded by a current prospectus. Before investing, please consider the investment objectives, risks, charges, and expenses of the investment. For a current prospectus and, if available, a summary prospectus, containing this information, call1-800-260-5969 or visit the Fund’s website atwfam.com. Read the prospectus carefully before you invest or send money.
Wells Fargo Asset Management (WFAM) is the trade name for certain investment advisory/management firms owned by Wells Fargo & Company. These firms include but are not limited to Wells Capital Management Incorporated and Wells Fargo Funds Management, LLC. Certain products managed by WFAM entities are distributed by Wells Fargo Funds Distributor, LLC (a broker-dealer and Member FINRA).
This material is for general informational and educational purposes only and is NOT intended to provide investment advice or a recommendation of any kind—including a recommendation for any specific investment, strategy, or plan.
INVESTMENT PRODUCTS: NOT FDIC INSURED ◾ NO BANK GUARANTEE ◾ MAY LOSE VALUE
© 2019 Wells Fargo Funds Management, LLC. All rights reserved.
405488 09-19
SA302/SAR302 07-19
Table of Contents

Semi-Annual Report
July 31, 2019
Institutional Money Market Funds
| ∎ | Wells Fargo Heritage Money Market Fund |
Beginning on January 1, 2021, as permitted by new regulations adopted by the Securities and Exchange Commission, paper copies of the Wells Fargo Funds’ annual and semi-annual shareholder reports issued after this date will no longer be sent by mail, unless you specifically request paper copies of the reports. Instead, the reports will be made available on the Funds’ website, and you will be notified by mail each time a report is posted and provided with a website address to access the report.
If you already elected to receive shareholder reports electronically, you will not be affected by this change and you need not take any action. You may elect to receive shareholder reports and other communications from the Fund electronically at any time by contacting your financial intermediary (such as a broker-dealer or bank) or, if you are a direct investor, by calling1-800-222-8222 or by enrolling at wellsfargo.com/advantagedelivery.
You may elect to receive all future reports in paper free of charge. If you invest through a financial intermediary, you can contact your financial intermediary to request that you continue to receive paper copies of your shareholder reports; if you invest directly with the Fund, you can call 1-800-222-8222. Your election to receive reports in paper will apply to all Wells Fargo Funds held in your account with your financial intermediary or, if you are a direct investor, to all Wells Fargo Funds that you hold.
Table of Contents
|
Reduce clutter. Save trees. |
Sign up for electronic delivery of prospectuses and shareholder reports atwellsfargo.com/ |
The views expressed and any forward-looking statements are as of July 31, 2019, unless otherwise noted, and are those of the Fund managers and/or Wells Fargo Asset Management. Discussions of individual securities, or the markets generally, or any Wells Fargo Fund are not intended as individual recommendations. Future events or results may vary significantly from those expressed in any forward-looking statements. The views expressed are subject to change at any time in response to changing circumstances in the market. Wells Fargo Asset Management and the Fund disclaim any obligation to publicly update or revise any views expressed or forward-looking statements.
INVESTMENT PRODUCTS: NOT FDIC INSURED ◾ NO BANK GUARANTEE ◾ MAY LOSE VALUE
Institutional Money Market Funds | 1
Table of Contents
Letter to shareholders (unaudited)

Andrew Owen
President
Wells Fargo Funds
Dear Shareholder:
We are pleased to offer you this semi-annual report for the Wells Fargo Heritage Money Market Fund for thesix-month period that ended July 31, 2019. Global stock and bond investors enjoyed gains that came amid continued concerns about global economic growth, international trade, geopolitical tensions, and bouts of market volatility. These concerns grew more intense as the period closed.
For the period, U.S. stocks, based on the S&P 500 Index,1 gained 11.32% and international stocks, as measured by the MSCI ACWI ex USA Index (Net),2 added 4.34%. The MSCI EM Index (Net)3 inched higher by 0.44%. For bond investors, the Bloomberg Barclays U.S. Aggregate Bond Index4 added 5.23%, the Bloomberg Barclays Global Aggregateex-USD Index5 added 2.33%, the Bloomberg Barclays Municipal Bond Index6 gained 5.15%, and the ICE BofAML U.S. High Yield Index7 added 5.86%.
Concerns for slowing global growth reemerge during the first quarter of 2019.
After the S&P 500 Index’s best monthly performance in 30 years during January and positive returns for other major indices across major asset classes, signs of slowing global growth grew more ominous in February. The Bureau of Economic Analysis announced fourth-quarter 2018 gross domestic product (GDP) grew at an annualized 2.2% rate, down from the levels of the prior two quarters. In a February report, the Bank of England forecast the slowest growth since the financial crisis for 2019. China and the U.S. continued to wrangle over trade issues.
By the end of March 2019, a combination of dovish U.S. Federal Reserve (Fed) sentiment and steady, if not spectacular, U.S. economic and business metrics reinforced investors’ confidence. Monthly job creation data and corporate profits, while less consistent than during 2018, were solid. China announced a roughly $300 billion stimulus package through tax and fee cuts intended to reinvigorate economic growth. During April 2019, favorable sentiment found additional support in reports of sustained low inflation, solid employment data, and first-quarter U.S. GDP of an annualized rate of 3.2%.
| 1 | The S&P 500 Index consists of 500 stocks chosen for market size, liquidity, and industry group representation. It is a market-value-weighted index with each stock’s weight in the index proportionate to its market value. You cannot invest directly in an index. |
| 2 | The Morgan Stanley Capital International (MSCI) All Country World Index (ACWI) ex USA Index (Net) is a free-float-adjusted market-capitalization weighted index that is designed to measure the equity market performance of developed and emerging markets, excluding the U.S. Source: MSCI. MSCI makes no express or implied warranties or representations and shall have no liability whatsoever with respect to any MSCI data contained herein. The MSCI data may not be further redistributed or used as a basis for other indices or any securities or financial products. This report is not approved, reviewed, or produced by MSCI. You cannot invest directly in an index. |
| 3 | The MSCI Emerging Markets (EM) Index (Net) is a free-float-adjusted market-capitalization-weighted index that is designed to measure the equity market performance of emerging markets. You cannot invest directly in an index. |
| 4 | The Bloomberg Barclays U.S. Aggregate Bond Index is a broad-based benchmark that measures the investment-grade, U.S. dollar-denominated, fixed-rate taxable bond market, including Treasuries, government-related and corporate securities, mortgage-backed securities (agency fixed-rate and hybrid adjustable-rate mortgage pass-throughs), asset-backed securities, and commercial mortgage-backed securities. You cannot invest directly in an index. |
| 5 | The Bloomberg Barclays Global Aggregateex-USD Index is an unmanaged index that provides a broad-based measure of the global investment-grade fixed-income markets excluding the U.S. dollar-denominated debt market. You cannot invest directly in an index. |
| 6 | The Bloomberg Barclays Municipal Bond Index is an unmanaged index composed of long-termtax-exempt bonds with a minimum credit rating of Baa. You cannot invest directly in an index. |
| 7 | The ICE BofAML U.S. High Yield Index is a market-capitalization-weighted index of domestic and Yankee high-yield bonds. The index tracks the performance of high-yield securities traded in the U.S. bond market. You cannot invest directly in an index. Copyright 2019. ICE Data Indices, LLC. All rights reserved. |
2 | Institutional Money Market Funds
Table of Contents
Letter to shareholders (unaudited)
During May 2019, markets tumbled on mixed investment signals. In the U.S., partisan wrangling ramped up as Democrats and Republicans set their sights on 2020 presidential politics. The U.K.’s Brexit caused Prime Minister Theresa May to resign. The European Commission downgraded the 2019 growth forecast to 1.2%. The U.S. increased tariffs on products from China, China responded, and then talks broke down. President Donald Trump threatened to turn his foreign policy tariff tool to Mexico over immigration issues.
As had been the case during most of 2019 to date, just as the investment horizon appeared to darken, sentiment turned and U.S. equity markets gained during June and July. The gains, primarily driven by geopolitical and monetary policy events, pushed equity markets to new highs.
President Mario Draghi of the European Central Bank said that if the outlook doesn’t improve, the bank will cut rates or buy more assets to prop up inflation. President Trump backed off of tariff threats against Mexico and China. In the U.S., the Fed implemented a 0.25% federal funds rate cut in July 2019.
Later in July 2019, the U.S. reversed course and threatened to impose higher tariffs on China’s exports after talks failed. China responded with tariff threats of its own and devalued the renminbi, a move that roiled global markets. Despite the accommodative approach of central banks, investors continued to have misgivings about the durability of economic growth globally and a pervasively cautious tone influenced the world’s equity and fixed-income markets.
Don’t let short-term uncertainty derail long-term investment goals.
Periods of investment uncertainty can present challenges, but experience has taught us that maintaining long-term investment goals can be an effective way to plan for the future. To help you create a sound strategy based on your personal goals and risk tolerance, Wells Fargo Funds offers more than 100 mutual funds spanning a wide range of asset classes and investment styles. Although diversification cannot guarantee an investment profit or prevent losses, we believe it can be an effective way to manage investment risk and potentially smooth out overall portfolio performance. We encourage investors to know their investments and to understand that appropriate levels of risk-taking may unlock opportunities.
Thank you for choosing to invest with Wells Fargo Funds. We appreciate your confidence in us and remain committed to helping you meet your financial needs.
Sincerely,

Andrew Owen
President
Wells Fargo Funds
“During May 2019, markets tumbled on mixed investment signals.”
“In the U.S., the Fed implemented a 0.25% federal funds rate cut in July 2019.”
|
For further information about your Fund, contact your investment professional, visit our website at wfam.com,or call us directly at1-800-222-8222. |
Institutional Money Market Funds | 3
Table of Contents
Performance highlights (unaudited)
Investment objective
The Fund seeks current income, while preserving capital and liquidity.
Manager
Wells Fargo Funds Management, LLC
Subadviser
Wells Capital Management Incorporated
Wells Capital Management Singapore
Portfolio managers
Michael C. Bird, CFA®‡
Jeffrey L. Weaver, CFA®‡
Laurie White
Average annual total returns (%) as of July 31, 2019
| Expense ratios1 (%) | ||||||||||||||||||||||
| Inception date | 1 year | 5 year | 10 year | Gross | Net2 | |||||||||||||||||
| Administrator Class (SHMXX) | 6-29-1995 | 2.21 | 0.87 | 0.44 | 0.36 | 0.33 | ||||||||||||||||
| Institutional Class (SHIXX) | 3-31-2000 | 2.36 | 0.97 | 0.52 | 0.24 | 0.20 | ||||||||||||||||
| Select Class (WFJXX) | 6-29-2007 | 2.43 | 1.04 | 0.59 | 0.20 | 0.13 | ||||||||||||||||
| Service Class (WHTXX)3 | 6-30-2010 | 2.12 | 0.80 | 0.41 | 0.53 | 0.43 | ||||||||||||||||
Yield summary (%) as of July 31, 20192
| Administrator Class | Institutional Class | Select Class | Service Class | |||||||||||
| 7-day current yield | 2.18 | 2.31 | 2.38 | 2.08 | ||||||||||
| 7-day compound yield | 2.20 | 2.33 | 2.40 | 2.10 | ||||||||||
| 30-day simple yield | 2.20 | 2.33 | 2.40 | 2.10 | ||||||||||
| 30-day compound yield | 2.23 | 2.36 | 2.43 | 2.12 | ||||||||||
Figures quoted represent past performance, which is no guarantee of future results,and do not reflect taxes that a shareholder may pay on fund distributions or the redemption of fund shares. Investment returns will fluctuate. The Fund’s yield figures more closely reflect the current earnings of the Fund than the total return figures. Current performance may be lower or higher than the performance data quoted, which assumes the reinvestment of dividends and capital gains. Currentmonth-end performance is available on the Fund’s website, wfam.com.
Each class is sold without afront-end sales charge or contingent deferred sales charge.
For floating NAV money market funds: You could lose money by investing in the Fund. Because the share price of the Fund will fluctuate, when you sell your shares they may be worth more or less than what you originally paid for them. The Fund may impose a fee upon sale of your shares or may temporarily suspend your ability to sell shares if the Fund’s liquidity falls below required minimums because of market conditions or other factors. An investment in the Fund is not insured or guaranteed by the Federal Deposit Insurance Corporation or any other government agency. The Fund’s sponsor has no legal obligation to provide financial support to the Fund, and you should not expect that the sponsor will provide financial support to the Fund at any time.
Please see footnotes on page 5.
4 | Institutional Money Market Funds
Table of Contents
Performance highlights (unaudited)
| Portfolio composition as of July 31, 20194 |
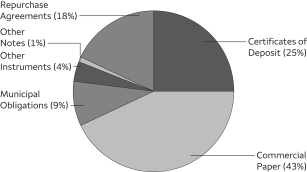 |
| Effective maturity distribution as of July 31, 20194 |
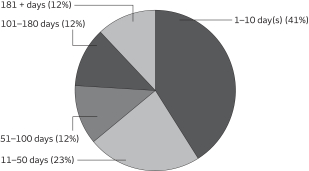 |
| Weighted average maturity as of July 31, 20195 | ||||
27 days | ||||
| Weighted average life as of July 31, 20196 | ||||
71 days | ||||
| ‡ | CFA® and Chartered Financial Analyst®are trademarks owned by CFA Institute. |
| 2 | Reflects the expense ratios as stated in the most recent prospectuses. The expense ratios shown are subject to change and may differ from the annualized expense ratios shown in the financial highlights of this report. |
| 2 | The manager has contractually committed through May 31, 2020, to waive fees and/or reimburse expenses to the extent necessary to cap the expenses of each class after fee waivers at the amounts shown. Brokerage commissions, stamp duty fees, interest, taxes, acquired fund fees and expenses (if any), and extraordinary expenses are excluded from the expense cap. Prior to or after the commitment expiration date, the cap may be increased or the commitment to maintain the cap may be terminated only with the approval of the Board of Trustees. Without this cap, the Fund’s returns would have been lower. Without waived fees and/or reimbursed expenses, the Fund’s7-day current yield would have been 2.16%, 2.28%, 2.32%, and 2.06% for Administrator Class, Institutional Class, Select Class, and Service Class respectively. The expense ratio paid by an investor is the net expense ratio (the total annual fund operating expenses after fee waivers) as stated in the prospectuses. |
| 3 | Historical performance shown for Service Class shares prior to their inception reflects the performance of Administrator Class shares and has not been adjusted to reflect the higher expenses applicable to Service Class shares. If these expenses had been adjusted, returns for Service Class shares would be lower. |
| 4 | Amounts are calculated based on the total investments of the Fund. These amounts are subject to change and may have changed since the date specified. |
| 5 | Weighted Average Maturity (WAM): WAM is an average of the effective maturities of all securities held in the portfolio, weighted by each security’s percentage of total investments. The maturity of a portfolio security is the period remaining until the date on which the principal amount is unconditionally required to be paid, or in the case of a security called for redemption, the date on which the redemption payment is unconditionally required to be made. WAM calculations allow for the maturities of certain securities with demand features or periodic interest rate resets to be shortened. WAM is a way to measure a fund’s sensitivity to potential interest rate changes. WAM is subject to change and may have changed since the date specified. |
| 6 | Weighted Average Life (WAL): WAL is an average of the final maturities of all securities held in the portfolio, weighted by their percentage of total investments. The maturity of a portfolio security is the period remaining until the date on which the principal amount is unconditionally required to be paid, or in the case of a security called for redemption, the date on which the redemption payment is unconditionally required to be made. In contrast to WAM, the calculation of WAL allows for the maturities of certain securities with demand features to be shortened, but not the periodic interest rate resets. WAL is a way to measure a fund’s potential sensitivity to credit spread changes. WAL is subject to change and may have changed since the date specified. |
Institutional Money Market Funds | 5
Table of Contents
As a shareholder of the Fund, you incur ongoing costs, including management fees, shareholder servicing fees, and other Fund expenses. This example is intended to help you understand your ongoing costs (in dollars) of investing in the Fund and to compare these costs with the ongoing costs of investing in other mutual funds.
The example is based on an investment of $1,000 invested at the beginning of thesix-month period and held for the entire period from February 1, 2019 to July 31, 2019.
Actual expenses
The “Actual” line of the table below provides information about actual account values and actual expenses. You may use the information in this line, together with the amount you invested, to estimate the expenses that you paid over the period. Simply divide your account value by $1,000 (for example, an $8,600 account value divided by $1,000 = 8.6), then multiply the result by the number in the “Actual” line under the heading entitled “Expenses paid during period” for your applicable class of shares to estimate the expenses you paid on your account during this period.
Hypothetical example for comparison purposes
The “Hypothetical” line of the table below provides information about hypothetical account values and hypothetical expenses based on the Fund’s actual expense ratio and an assumed rate of return of 5% per year before expenses, which is not the Fund’s actual return. The hypothetical account values and expenses may not be used to estimate the actual ending account balance or expenses you paid for the period. You may use this information to compare the ongoing costs of investing in the Fund and other funds. To do so, compare this 5% hypothetical example with the 5% hypothetical examples that appear in the shareholder reports of the other funds.
Please note that the expenses shown in the table are meant to highlight your ongoing costs only. Therefore, the “Hypothetical” line of the table is useful in comparing ongoing costs only and will not help you determine the relative total costs of owning different funds.
| Beginning account value 2-1-2019 | Ending account value 7-31-2019 | Expenses paid during the period¹ | Annualized net expense ratio | |||||||||||||
Administrator Class | ||||||||||||||||
Actual | $ | 1,000.00 | $ | 1,011.41 | $ | 1.65 | 0.33 | % | ||||||||
Hypothetical (5% return before expenses) | $ | 1,000.00 | $ | 1,023.16 | $ | 1.66 | 0.33 | % | ||||||||
Institutional Class | ||||||||||||||||
Actual | $ | 1,000.00 | $ | 1,012.06 | $ | 1.00 | 0.20 | % | ||||||||
Hypothetical (5% return before expenses) | $ | 1,000.00 | $ | 1,023.80 | $ | 1.00 | 0.20 | % | ||||||||
Select Class | ||||||||||||||||
Actual | $ | 1,000.00 | $ | 1,012.41 | $ | 0.65 | 0.13 | % | ||||||||
Hypothetical (5% return before expenses) | $ | 1,000.00 | $ | 1,024.15 | $ | 0.65 | 0.13 | % | ||||||||
Service Class | ||||||||||||||||
Actual | $ | 1,000.00 | $ | 1,010.91 | $ | 2.14 | 0.43 | % | ||||||||
Hypothetical (5% return before expenses) | $ | 1,000.00 | $ | 1,022.66 | $ | 2.16 | 0.43 | % | ||||||||
| 1 | Expenses paid is equal to the annualized net expense ratio of each class multiplied by the average account value over the period, multiplied by the number of days in the most recent fiscal half-year divided by the number of days in the fiscal year (to reflect theone-half-year period). |
6 | Institutional Money Market Funds
Table of Contents
Portfolio of investments—July 31, 2019 (unaudited)
| Interest rate | Maturity date | Principal | Value | |||||||||||||
| Certificates of Deposit: 24.60% | ||||||||||||||||
ABN Amro Bank NV | 2.46 | % | 10-7-2019 | $ | 77,000,000 | $ | 77,036,439 | |||||||||
ABN Amro Bank NV | 2.59 | 9-6-2019 | 126,000,000 | 126,048,632 | ||||||||||||
Bank of Montreal (3 Month LIBOR +0.06%)± | 2.50 | 3-12-2020 | 39,000,000 | 39,002,195 | ||||||||||||
Bank of Montreal (1 Month LIBOR +0.18%)± | 2.57 | 4-3-2020 | 32,000,000 | 32,002,436 | ||||||||||||
Bank of Montreal (1 Month LIBOR +0.22%)± | 2.58 | 10-4-2019 | 40,000,000 | 40,008,237 | ||||||||||||
Bank of Montreal (1 Month LIBOR +0.18%)± | 2.58 | 5-1-2020 | 58,000,000 | 58,008,566 | ||||||||||||
Bank of Montreal (3 Month LIBOR +0.22%)± | 2.67 | 12-10-2019 | 61,000,000 | 61,043,129 | ||||||||||||
Bank of Nova Scotia (1 Month LIBOR +0.14%)± | 2.38 | 1-27-2020 | 40,000,000 | 40,001,331 | ||||||||||||
Bank of Nova Scotia (3 Month LIBOR +0.05%)± | 2.38 | 4-3-2020 | 55,000,000 | 55,003,434 | ||||||||||||
Bank of Nova Scotia (3 Month LIBOR +0.10%)± | 2.51 | 9-16-2019 | 20,000,000 | 20,002,572 | ||||||||||||
Bank of Nova Scotia (1 Month LIBOR +0.20%)± | 2.53 | 8-14-2019 | 40,000,000 | 40,002,132 | ||||||||||||
Canadian Imperial Bank (1 Month LIBOR +0.18%)± | 2.54 | 4-6-2020 | 35,000,000 | 35,004,740 | ||||||||||||
Canadian Imperial Bank (3 Month LIBOR +0.19%)± | 2.46 | 1-30-2020 | 60,000,000 | 60,044,309 | ||||||||||||
Canadian Imperial Bank (1 Month LIBOR +0.18%)± | 2.54 | 5-4-2020 | 45,000,000 | 45,005,999 | ||||||||||||
Canadian Imperial Bank (1 Month LIBOR +0.18%)± | 2.58 | 5-1-2020 | 40,000,000 | 40,006,050 | ||||||||||||
China Construction Bank Corporation (3 Month LIBOR +0.10%)± | 2.38 | 1-24-2020 | 95,000,000 | 94,999,814 | ||||||||||||
Cooperatieve Rabobank UA (1 Month LIBOR +0.19%)± | 2.46 | 5-20-2020 | 63,000,000 | 62,994,998 | ||||||||||||
Cooperatieve Rabobank UA (1 Month LIBOR +0.14%)± | 2.50 | 11-7-2019 | 59,000,000 | 59,007,740 | ||||||||||||
Credit Agricole Corporate & Investment Bank (3 Month LIBOR +0.08%)± | 2.47 | 12-20-2019 | 38,000,000 | 37,999,823 | ||||||||||||
Credit Industriel et Commercial NY (1 Month LIBOR +0.22%)± | 2.49 | 4-24-2020 | 40,000,000 | 40,005,364 | ||||||||||||
Credit Suisse NY (1 Month LIBOR +0.22%)± | 2.58 | 12-9-2019 | 37,000,000 | 37,012,401 | ||||||||||||
DNB Bank ASA (1 Month LIBOR +0.10%)± | 2.47 | 9-9-2019 | 80,000,000 | 80,001,110 | ||||||||||||
DZ Bank AG Deutsche Zentrall-Genossenschaftsbank (z) | 2.36 | 10-29-2019 | 40,000,000 | 39,767,361 | ||||||||||||
HSBC Bank USA NA (3 Month LIBOR +0.13%)± | 2.69 | 8-9-2019 | 25,000,000 | 25,000,618 | ||||||||||||
Mizuho Bank Limited (1 Month LIBOR +0.16%)± | 2.40 | 8-27-2019 | 40,000,000 | 40,001,303 | ||||||||||||
Mizuho Bank Limited (1 Month LIBOR +0.14%)± | 2.50 | 11-8-2019 | 80,000,000 | 80,007,786 | ||||||||||||
Mizuho Bank Limited (1 Month LIBOR +0.16%)± | 2.53 | 9-12-2019 | 49,000,000 | 49,004,839 | ||||||||||||
Mizuho Bank Limited (z) | 2.43 | 9-11-2019 | 28,000,000 | 27,927,342 | ||||||||||||
Mizuho Bank Limited (1 Month LIBOR +0.15%)± | 2.45 | 11-18-2019 | 45,000,000 | 45,003,087 | ||||||||||||
MUFG Bank Limited (3 Month LIBOR +0.18%)± | 2.70 | 2-27-2020 | 39,000,000 | 39,013,049 | ||||||||||||
MUFG Bank Limited (3 Month LIBOR +0.14%)± | 2.70 | 5-11-2020 | 43,000,000 | 42,999,958 | ||||||||||||
Natixis NY (1 Month LIBOR +0.16%)± | 2.42 | 12-23-2019 | 40,000,000 | 40,004,793 | ||||||||||||
Norinchukin Bank | 2.20 | 2-4-2020 | 30,000,000 | 29,998,000 | ||||||||||||
Norinchukin Bank | 2.52 | 8-9-2019 | 42,100,000 | 42,103,041 | ||||||||||||
Norinchukin Bank | 2.54 | 8-1-2019 | 45,000,000 | 45,000,405 | ||||||||||||
Oversea-Chinese Banking Corporation Limited (1 Month LIBOR +0.10%)± | 2.37 | 10-25-2019 | 38,000,000 | 38,001,370 | ||||||||||||
Oversea-Chinese Banking Corporation Limited (1 Month LIBOR +0.20%)± | 2.50 | 9-19-2019 | 32,000,000 | 32,005,077 | ||||||||||||
Skandinaviska Enskilda Bank AB (1 Month LIBOR +0.13%)± | 2.50 | 9-12-2019 | 59,000,000 | 59,003,718 | ||||||||||||
Sumitomo Mitsui Banking Corporation (1 Month LIBOR +0.14%)± | 2.50 | 11-5-2019 | 80,000,000 | 80,009,682 | ||||||||||||
Sumitomo Mitsui Trust Bank Limited (1 Month LIBOR +0.12%)± | 2.38 | 10-23-2019 | 40,000,000 | 40,002,979 | ||||||||||||
Sumitomo Mitsui Trust NY | 2.25 | 1-9-2020 | 70,000,000 | 70,005,585 | ||||||||||||
Sumitomo Mitsui Trust NY | 2.25 | 1-13-2020 | 35,000,000 | 35,002,772 | ||||||||||||
Svenska Handelsbanken (3 Month LIBOR +0.27%)± | 2.55 | 10-21-2019 | 35,000,000 | 35,017,672 | ||||||||||||
Svenska Handelsbanken (3 Month LIBOR +0.15%)± | 2.47 | 10-2-2019 | 58,000,000 | 58,014,224 | ||||||||||||
Svenska Handelsbanken (1 Month LIBOR +0.22%)± | 2.48 | 7-22-2020 | 60,000,000 | 60,005,618 | ||||||||||||
Total Certificates of Deposit (Cost $2,232,804,861) | 2,233,141,730 | |||||||||||||||
|
| |||||||||||||||
Commercial Paper: 42.71% | ||||||||||||||||
| Asset-Backed Commercial Paper: 26.00% | ||||||||||||||||
Albion Capital Corporation (z) | 2.30 | 9-30-2019 | 22,000,000 | 21,915,379 | ||||||||||||
Alpine Securitization (1 Month LIBOR +0.15%) 144A± | 2.55 | 3-2-2020 | 59,000,000 | 59,000,004 | ||||||||||||
Anglesea Funding LLC (1 Month LIBOR +0.18%) 144A± | 2.48 | 10-15-2019 | 20,000,000 | 20,000,416 | ||||||||||||
The accompanying notes are an integral part of these financial statements.
Institutional Money Market Funds | 7
Table of Contents
Portfolio of investments—July 31, 2019 (unaudited)
| Interest rate | Maturity date | Principal | Value | |||||||||||||
| Asset-Backed Commercial Paper (continued) | ||||||||||||||||
Anglesea Funding LLC (1 Month LIBOR +0.18%) 144A± | 2.51 | % | 10-11-2019 | $ | 38,000,000 | $ | 38,007,565 | |||||||||
Anglesea Funding LLC (1 Month LIBOR +0.17%) 144A± | 2.43 | 12-23-2019 | 80,000,000 | 79,999,987 | ||||||||||||
Anglesea Funding LLC (1 Month LIBOR +0.18%) 144A± | 2.58 | 12-27-2019 | 59,000,000 | 59,001,828 | ||||||||||||
Antalis SA 144A(z) | 2.37 | 10-2-2019 | 11,560,000 | 11,513,532 | ||||||||||||
Antalis US Funding Corporation 144A(z) | 2.44 | 8-20-2019 | 38,000,000 | 37,950,537 | ||||||||||||
Atlantic Asset Securitization Corporation (1 Month LIBOR +0.12%) 144A± | 2.39 | 8-21-2019 | 59,000,000 | 59,000,571 | ||||||||||||
Bedford Row Funding Corporation (1 Month LIBOR +0.24%) 144A± | 2.50 | 7-20-2020 | 39,000,000 | 39,011,517 | ||||||||||||
Bedford Row Funding Corporation (1 Month LIBOR +0.15%) 144A± | 2.54 | 2-3-2020 | 20,000,000 | 19,997,712 | ||||||||||||
Bedford Row Funding Corporation (3 Month LIBOR +0.22%) 144A± | 2.55 | 1-3-2020 | 50,000,000 | 50,037,489 | ||||||||||||
Chesham Finance Limited 144A(z) | 2.50 | 8-1-2019 | 35,000,000 | 34,997,630 | ||||||||||||
Chesham Finance Limited 144A(z) | 2.50 | 8-1-2019 | 76,000,000 | 75,994,853 | ||||||||||||
Chesham Finance Limited 144A(z) | 2.50 | 8-1-2019 | 20,000,000 | 19,998,646 | ||||||||||||
Collateralized Commercial Paper FLEX Company LLC (1 Month LIBOR +0.20%) 144A± | 2.46 | 6-23-2020 | 17,000,000 | 17,000,424 | ||||||||||||
Collateralized Commercial Paper II Company LLC (3 Month LIBOR | 2.57 | 1-8-2020 | 62,000,000 | 62,056,078 | ||||||||||||
Collateralized Commercial Paper II Company LLC (3 Month LIBOR | 2.59 | 12-31-2019 | 61,000,000 | 61,059,825 | ||||||||||||
Concord Minutemen Capital Company 144A(z) | 2.43 | 8-2-2019 | 15,000,000 | 14,997,974 | ||||||||||||
Concord Minutemen Capital Company 144A(z) | 2.70 | 8-1-2019 | 20,395,000 | 20,393,619 | ||||||||||||
Crown Point Capital Company (1 Month LIBOR +0.18%) 144A± | 2.56 | 1-6-2020 | 104,000,000 | 104,016,810 | ||||||||||||
Crown Point Capital Company (1 Month LIBOR +0.20%) 144A± | 2.56 | 11-4-2019 | 84,000,000 | 84,017,078 | ||||||||||||
Glencove Funding LLC (1 Month LIBOR +0.18%) 144A± | 2.49 | 2-11-2020 | 62,000,000 | 62,010,645 | ||||||||||||
Great Bridge Capital Company LLC 144A(z) | 2.47 | 10-3-2019 | 42,000,000 | 41,822,442 | ||||||||||||
Great Bridge Capital Company LLC 144A(z) | 2.48 | 10-8-2019 | 43,000,000 | 42,803,189 | ||||||||||||
Great Bridge Capital Company LLC 144A(z) | 2.48 | 10-10-2019 | 18,000,000 | 17,915,084 | ||||||||||||
Great Bridge Capital Company LLC 144A(z) | 2.48 | 9-4-2019 | 42,000,000 | 41,902,899 | ||||||||||||
Great Bridge Capital Company LLC 144A(z) | 2.48 | 8-5-2019 | 35,000,000 | 34,988,236 | ||||||||||||
Great Bridge Capital Company LLC 144A(z) | 2.51 | 8-19-2019 | 9,000,000 | 8,988,795 | ||||||||||||
Great Bridge Capital Company LLC 144A(z) | 2.70 | 8-1-2019 | 21,000,000 | 20,998,577 | ||||||||||||
Institutional Secured Funding LLC 144A(z) | 2.54 | 8-1-2019 | 98,000,000 | 97,993,363 | ||||||||||||
Institutional Secured Funding LLC 144A(z) | 2.54 | 8-2-2019 | 143,000,000 | 143,009,837 | ||||||||||||
Kells Funding LLC 144A(z) | 2.39 | 9-11-2019 | 60,000,000 | 59,842,640 | ||||||||||||
Kells Funding LLC 144A(z) | 2.52 | 8-19-2019 | 34,000,000 | 33,959,177 | ||||||||||||
Kells Funding LLC 144A(z) | 2.55 | 8-7-2019 | 20,000,000 | 19,990,939 | ||||||||||||
Kells Funding LLC 144A(z) | 2.61 | 9-19-2019 | 37,000,000 | 36,884,889 | ||||||||||||
Legacy Capital Company 144A(z) | 2.35 | 8-23-2019 | 16,194,000 | 16,169,800 | ||||||||||||
Lexington Parker Capital Company LLC 144A(z) | 2.57 | 8-7-2019 | 12,000,000 | 11,994,703 | ||||||||||||
LMA Americas LLC 144A(z) | 2.20 | 1-27-2020 | 20,000,000 | 19,790,000 | ||||||||||||
LMA Americas LLC 144A(z) | 2.20 | 1-28-2020 | 20,000,000 | 19,789,034 | ||||||||||||
Manhattan Asset Funding Company LLC 144A(z) | 2.35 | 8-19-2019 | 16,000,000 | 15,980,451 | ||||||||||||
Manhattan Asset Funding Company LLC 144A(z) | 2.40 | 9-13-2019 | 38,000,000 | 37,894,292 | ||||||||||||
Mountcliff Funding LLC (1 Month LIBOR +0.20%) 144A± | 2.43 | 4-24-2020 | 110,000,000 | 110,000,000 | ||||||||||||
Mountcliff Funding LLC 144A(z) | 2.48 | 8-1-2019 | 118,000,000 | 117,992,009 | ||||||||||||
Nieuw Amsterdam Receivables Corporation 144A(z) | 2.22 | 1-9-2020 | 22,000,000 | 21,782,596 | ||||||||||||
Regency Markets No.1 LLC 144A(z) | 2.35 | 8-19-2019 | 55,722,000 | 55,653,036 | ||||||||||||
Regency Markets No.1 LLC 144A(z) | 2.42 | 8-14-2019 | 74,844,000 | 74,775,426 | ||||||||||||
Regency Markets No.1 LLC 144A(z) | 2.43 | 8-15-2019 | 26,631,000 | 26,604,924 | ||||||||||||
Versailles CDS LLC (1 Month LIBOR +0.20%) 144A± | 2.47 | 9-20-2019 | 38,000,000 | 38,004,028 | ||||||||||||
Victory Receivables 144A(z) | 2.45 | 8-6-2019 | 39,000,000 | 38,984,491 | ||||||||||||
White Plains Capital 144A(z) | 2.48 | 10-4-2019 | 41,000,000 | 40,817,151 | ||||||||||||
White Plains Capital 144A(z) | 2.64 | 9-4-2019 | 44,000,000 | 43,893,997 | ||||||||||||
White Plains Capital 144A(z) | 2.69 | 8-20-2019 | 17,000,000 | 16,976,323 | ||||||||||||
| 2,360,182,447 | ||||||||||||||||
|
| |||||||||||||||
The accompanying notes are an integral part of these financial statements.
8 | Institutional Money Market Funds
Table of Contents
Portfolio of investments—July 31, 2019 (unaudited)
| Interest rate | Maturity date | Principal | Value | |||||||||||||
| Financial Company Commercial Paper: 12.67% | ||||||||||||||||
Banco De Credito E Inversiones 144A(z) | 2.44 | % | 9-23-2019 | $ | 12,000,000 | $ | 11,956,404 | |||||||||
Banco De Credito E Inversiones 144A(z) | 2.44 | 9-24-2019 | 27,000,000 | 26,900,092 | ||||||||||||
Banco De Credito E Inversiones 144A(z) | 2.52 | 10-8-2019 | 65,000,000 | 64,695,519 | ||||||||||||
Banco De Credito E Inversiones 144A(z) | 2.54 | 10-2-2019 | 101,000,000 | 100,570,851 | ||||||||||||
Banco De Credito E Inversiones 144A(z) | 2.57 | 9-25-2019 | 40,000,000 | 39,849,360 | ||||||||||||
Banco Santander Chile 144A(z) | 2.53 | 8-23-2019 | 19,000,000 | 18,970,138 | ||||||||||||
Commonwealth Bank of Australia (1 Month LIBOR +0.17%) 144A± | 2.57 | 4-2-2020 | 35,000,000 | 34,998,965 | ||||||||||||
Commonwealth Bank of Australia (1 Month LIBOR +0.21%) 144A± | 2.54 | 9-16-2019 | 43,000,000 | 43,007,120 | ||||||||||||
Commonwealth Bank of Australia (3 Month LIBOR +0.45%) 144A± | 2.90 | 3-10-2020 | 20,757,000 | 20,805,292 | ||||||||||||
Commonwealth Bank of Australia (3 Month LIBOR +0.60%) 144A± | 3.02 | 12-19-2019 | 40,000,000 | 40,090,005 | ||||||||||||
DBS Bank Limited 144A(z) | 2.27 | 12-3-2019 | 48,000,000 | 47,654,167 | ||||||||||||
DBS Bank Limited 144A(z) | 2.27 | 2-28-2020 | 43,000,000 | 42,472,538 | ||||||||||||
DBS Bank Limited 144A(z) | 2.30 | 11-22-2019 | 47,000,000 | 46,684,771 | ||||||||||||
National Australia Bank Limited (1 Month LIBOR +0.16%) 144A± | 2.46 | 5-19-2020 | 20,000,000 | 19,997,414 | ||||||||||||
National Australia Bank Limited (1 Month LIBOR +0.13%) 144A± | 2.49 | 2-7-2020 | 40,000,000 | 40,001,742 | ||||||||||||
National Australia Bank Limited (1 Month LIBOR +0.20%) 144A± | 2.60 | 8-2-2019 | 40,000,000 | 40,000,404 | ||||||||||||
Ontario Teachers Finance Trust 144A(z) | 2.10 | 3-12-2020 | 46,000,000 | 45,429,313 | ||||||||||||
Ontario Teachers Finance Trust 144A(z) | 2.20 | 3-6-2020 | 10,000,000 | 9,878,151 | ||||||||||||
Oversea-Chinese Banking Corporation Limited (3 Month LIBOR | 2.50 | 12-6-2019 | 38,000,000 | 37,999,841 | ||||||||||||
Oversea-Chinese Banking Corporation Limited (3 Month LIBOR | 2.56 | 2-18-2020 | 40,000,000 | 39,999,888 | ||||||||||||
Sumitomo Mitsui Trust Bank 144A(z) | 2.37 | 10-18-2019 | 21,000,000 | 20,896,174 | ||||||||||||
Sumitomo Mitsui Trust Bank Limited 144A(z) | 2.40 | 9-30-2019 | 10,000,000 | 9,962,028 | ||||||||||||
Toronto Dominion Bank 144A(z) | 2.28 | 8-7-2019 | 55,000,000 | 54,974,761 | ||||||||||||
Toronto Dominion Bank (3 Month LIBOR +0.08%)± | 2.60 | 8-16-2019 | 47,000,000 | 47,001,618 | ||||||||||||
Toronto Dominion Bank (3 Month LIBOR +0.21%) 144A± | 2.68 | 12-6-2019 | 87,000,000 | 87,056,615 | ||||||||||||
Toronto Dominion Bank (1 Month LIBOR +0.37%) 144A± | 2.73 | 11-7-2019 | 40,000,000 | 40,029,783 | ||||||||||||
Westpac Banking Corporation (1 Month LIBOR +0.21%) 144A± | 2.51 | 9-19-2019 | 55,000,000 | 55,009,489 | ||||||||||||
Westpac Banking Corporation (3 Month LIBOR +0.07%) 144A± | 2.65 | 8-2-2019 | 63,000,000 | 63,000,000 | ||||||||||||
| 1,149,892,443 | ||||||||||||||||
|
| |||||||||||||||
| Other Commercial Paper: 4.04% | ||||||||||||||||
Export Development Corporation (z) | 2.29 | 12-17-2019 | 33,200,000 | 32,928,111 | ||||||||||||
Oesterreichische National Bank (z) | 2.23 | 1-10-2020 | 39,000,000 | 38,638,181 | ||||||||||||
Salt River Project Agricultural Improvement & Power District Subordinated Series D1 (z) | 2.34 | 9-23-2019 | 28,000,000 | 27,900,692 | ||||||||||||
Salt River Project Agricultural Improvement & Power District Subordinated Series D1 (z) | 2.35 | 9-19-2019 | 15,000,000 | 14,950,794 | ||||||||||||
Salt River Project Agricultural Improvement & Power District Subordinated Series D1 (z) | 2.35 | 9-20-2019 | 5,000,000 | 4,983,265 | ||||||||||||
Salt River Project Agricultural Improvement & Power District Subordinated Series D1 (z) | 2.46 | 8-14-2019 | 27,700,000 | 27,673,979 | ||||||||||||
Toyota Credit Canada Incorporated (1 Month LIBOR +0.17%)± | 2.57 | 1-27-2020 | 42,000,000 | 42,007,654 | ||||||||||||
Toyota Finance Australia Limited (1 Month LIBOR +0.17%)± | 2.50 | 12-6-2019 | 39,000,000 | 39,006,210 | ||||||||||||
Toyota Motor Credit Corporation (z) | 2.38 | 11-18-2019 | 60,000,000 | 59,564,217 | ||||||||||||
Toyota Motor Credit Corporation (1 Month LIBOR +0.16%)± | 2.52 | 2-27-2020 | 40,000,000 | 39,997,066 | ||||||||||||
Toyota Motor Credit Corporation (3 Month LIBOR +0.07%)± | 2.59 | 5-22-2020 | 39,000,000 | 39,002,980 | ||||||||||||
| 366,653,149 | ||||||||||||||||
|
| |||||||||||||||
Total Commercial Paper (Cost $3,876,174,740) | 3,876,728,039 | |||||||||||||||
|
| |||||||||||||||
The accompanying notes are an integral part of these financial statements.
Institutional Money Market Funds | 9
Table of Contents
Portfolio of investments—July 31, 2019 (unaudited)
| Interest rate | Maturity date | Principal | Value | |||||||||||||
Municipal Obligations: 9.08% | ||||||||||||||||
California: 0.64% | ||||||||||||||||
| Other Municipal Debt: 0.64% | ||||||||||||||||
Los Angeles Metro Transportation (Transportation Revenue) | 2.35 | % | 9-23-2019 | $ | 13,500,000 | $ | 13,498,784 | |||||||||
State of California (GO Revenue) | 2.48 | 8-12-2019 | 44,650,000 | 44,653,335 | ||||||||||||
| 58,152,119 | ||||||||||||||||
|
| |||||||||||||||
Colorado: 1.45% | ||||||||||||||||
| Variable Rate Demand Notes ø: 1.45% | ||||||||||||||||
Colorado HFA MFHR Class II Series B (Housing Revenue, FHLB SPA) | 2.47 | 5-1-2052 | 90,915,000 | 90,915,000 | ||||||||||||
Colorado Southern Ute Indian Tribe Reservation Series 2007 (Miscellaneous Revenue) | 2.47 | 1-1-2027 | 41,040,000 | 41,040,000 | ||||||||||||
| 131,955,000 | ||||||||||||||||
|
| |||||||||||||||
Georgia: 0.13% | ||||||||||||||||
| Other Municipal Debt: 0.08% | ||||||||||||||||
Municipal Electric Authority of Georgia (Utility Revenue) | 2.45 | 8-15-2019 | 7,007,000 | 7,007,048 | ||||||||||||
|
| |||||||||||||||
| Variable Rate Demand Note ø: 0.05% | ||||||||||||||||
Macon-Bibb County GA Industrial Authority Kumho Tire Georgia Incorporated Series A (Industrial Development Revenue, Korea Development LOC) | 2.50 | 12-1-2022 | 5,000,000 | 5,000,000 | ||||||||||||
|
| |||||||||||||||
Kentucky: 0.17% | ||||||||||||||||
| Variable Rate Demand Notes ø: 0.17% | ||||||||||||||||
Kentucky Housing Corporation Series O (Housing Revenue, Kentucky Housing Corporation SPA) | 2.20 | 1-1-2036 | 10,220,000 | 10,220,000 | ||||||||||||
Kentucky Housing Corporation Series T (Housing Revenue, Kentucky Housing Corporation SPA) | 2.20 | 7-1-2037 | 5,140,000 | 5,140,000 | ||||||||||||
| 15,360,000 | ||||||||||||||||
|
| |||||||||||||||
Louisiana: 0.18% | ||||||||||||||||
| Variable Rate Demand Note ø: 0.18% | ||||||||||||||||
East Baton Rouge Parish LA Sewerage Commission Revenue Series 2016-XFT904 (Water & Sewer Revenue, Morgan Stanley Bank LIQ) 144A | 2.38 | 2-1-2045 | 16,280,000 | 16,280,000 | ||||||||||||
|
| |||||||||||||||
Missouri: 0.05% | ||||||||||||||||
| Variable Rate Demand Note ø: 0.05% | ||||||||||||||||
Bridgeton MO IDA Stolze Printing (Industrial Development Revenue, Carrollton Bank LOC) | 2.44 | 12-1-2047 | 4,800,000 | 4,800,000 | ||||||||||||
|
| |||||||||||||||
| New Hampshire: 0.94% | ||||||||||||||||
| Variable Rate Demand Notes ø: 0.94% | ||||||||||||||||
National Finance Authority New Hampshire (Industrial Development Revenue, Kookmin Bank LOC) 144A | 2.51 | 7-1-2029 | 20,000,000 | 20,000,000 | ||||||||||||
New Hampshire Business Finance Authority CJ Foods Manufacturing Beaumont Corporation Series A (Industrial Development Revenue, Kookmin Bank LOC) 144A | 2.51 | 10-1-2028 | 65,000,000 | 65,000,000 | ||||||||||||
| 85,000,000 | ||||||||||||||||
|
| |||||||||||||||
The accompanying notes are an integral part of these financial statements.
10 | Institutional Money Market Funds
Table of Contents
Portfolio of investments—July 31, 2019 (unaudited)
| Interest rate | Maturity date | Principal | Value | |||||||||||||
New Jersey: 0.47% | ||||||||||||||||
| Variable Rate Demand Notes ø: 0.47% | ||||||||||||||||
Jets Stadium Development SeriesA-4B (Miscellaneous Revenue, Sumitomo Mitsui Banking Corporation LOC) 144A | 2.40 | % | 4-1-2047 | $ | 42,555,000 | $ | 42,555,000 | |||||||||
|
| |||||||||||||||
New York: 1.56% | ||||||||||||||||
| Variable Rate Demand Notes ø: 1.56% | ||||||||||||||||
New York Dormitory Authority Personal Income Tax Revenue Series XFT910 (Tax Revenue, Citibank NA LIQ) 144A | 2.45 | 3-15-2040 | 12,000,000 | 12,000,000 | ||||||||||||
New York Dormitory Authority Secondary Issues Floater SeriesB-4 (Tax Revenue, Morgan Stanley Bank LIQ) 144A | 2.40 | 3-15-2040 | 16,000,000 | 16,000,000 | ||||||||||||
New York HFA 572 11th Avenue Series A (Housing Revenue, Bank of China LOC) | 2.48 | 11-1-2049 | 18,650,000 | 18,650,000 | ||||||||||||
New York HFA Manhattan West Residential Housing Project Series B-1 (Housing Revenue, Bank of China LOC) | 2.48 | 11-1-2049 | 23,000,000 | 23,000,000 | ||||||||||||
New York HFA Manhattan West Residential Housing Project SeriesB-2 (Housing Revenue, Bank of China LOC) | 2.32 | 11-1-2049 | 18,425,000 | 18,425,000 | ||||||||||||
New York HFA Manhattan West Residential Housing Project Series B-2 (Housing Revenue, Bank of China LOC) | 2.43 | 11-1-2049 | 37,250,000 | 37,250,000 | ||||||||||||
New York Municipal Water Finance Authority SeriesT-30001-I (Water & Sewer Revenue, Citibank NA LIQ) 144A | 2.45 | 6-15-2044 | 16,000,000 | 16,000,000 | ||||||||||||
| 141,325,000 | ||||||||||||||||
|
| |||||||||||||||
Other: 3.49% | ||||||||||||||||
| Variable Rate Demand Notes ø: 3.49% | ||||||||||||||||
FHLMC MFHR Series M004 Class A (Housing Revenue, FHLMC LIQ) | 2.36 | 1-15-2042 | 39,124,516 | 39,124,516 | ||||||||||||
FHLMC MFHR Series M011 Class A (Housing Revenue, FHLMC LIQ) | 2.36 | 8-15-2021 | 165,000 | 165,000 | ||||||||||||
Fortenbery Children 2017 Irrevocable Trust (Miscellaneous Revenue, FHLB LOC) | 2.43 | 5-1-2037 | 12,275,000 | 12,275,000 | ||||||||||||
Providence St. Joseph Health & Services (Health Revenue, GNMA/FNMA/FHLMC Insured, JPMorgan Chase & Company SPA) | 2.40 | 10-1-2047 | 53,000,000 | 53,000,000 | ||||||||||||
Providence St. Joseph Health Obligation Series 12E (Health Revenue, U.S. Bank NA LOC) | 2.38 | 10-1-2042 | 68,260,000 | 68,260,000 | ||||||||||||
SSAB AB Series A (Miscellaneous Revenue, DNB Banking ASA LOC) | 2.43 | 6-1-2035 | 13,000,000 | 13,000,000 | ||||||||||||
Steadfast Crestavilla LLC Series A (Health Revenue, American AgCredit LOC) | 2.44 | 2-1-2056 | 33,320,000 | 33,320,000 | ||||||||||||
Steadfast Crestavilla LLC Series B (Health Revenue, U.S. Bank NA LOC) | 2.44 | 2-1-2056 | 22,040,000 | 22,040,000 | ||||||||||||
Taxable Municipal Funding Trust (GO Revenue, Barclays Bank plc LOC) 144A | 2.61 | 9-1-2027 | 76,000,000 | 76,000,000 | ||||||||||||
| 317,184,516 | ||||||||||||||||
|
| |||||||||||||||
Total Municipal Obligations (Cost $824,616,516) | 824,618,683 | |||||||||||||||
|
| |||||||||||||||
| Non-Agency Mortgage-Backed Securities: 0.28% | ||||||||||||||||
Pepper Residential Securities Trust Series 20A Class A1U2 | 2.65 | 3-16-2020 | 25,000,000 | 25,040,099 | ||||||||||||
|
| |||||||||||||||
TotalNon-Agency Mortgage-Backed Securities (Cost $25,000,000) | 25,040,099 | |||||||||||||||
|
| |||||||||||||||
| Other Instruments: 4.18% | ||||||||||||||||
Altoona Blair County Development Corporation 144A§øø | 2.39 | 9-1-2038 | 14,850,000 | 14,850,000 | ||||||||||||
Altoona Blair County Development Corporation 144A§øø | 2.39 | 9-1-2038 | 32,000,000 | 32,000,000 | ||||||||||||
ASC Mercer Island LLC §øø | 2.44 | 6-1-2057 | 33,000,000 | 33,000,000 | ||||||||||||
Gerald J Rubin Special Trust Secured §øø | 2.45 | 12-1-2048 | 14,215,000 | 14,215,000 | ||||||||||||
Invesco Dynamic Credit Opportunities Fund SeriesW-7 § | 2.50 | 6-1-2028 | 55,000,000 | 55,000,000 | ||||||||||||
The accompanying notes are an integral part of these financial statements.
Institutional Money Market Funds | 11
Table of Contents
Portfolio of investments—July 31, 2019 (unaudited)
| Interest rate | Maturity date | Principal | Value | |||||||||||||
| Other Instruments (continued) | ||||||||||||||||
Jefferson at Stadium Park-Phase A Owner Series A §øø | 2.44 | % | 2-1-2057 | $ | 47,000,000 | $ | 47,000,000 | |||||||||
Jefferson at Stadium Park-Phase B Owner Series B §øø | 2.44 | 2-1-2057 | 16,750,000 | 16,750,000 | ||||||||||||
Keep Memory Alive §øø | 2.40 | 5-1-2037 | 18,220,000 | 18,220,000 | ||||||||||||
La Mesa Senior Living LP Secured § | 2.44 | 8-1-2057 | 25,925,000 | 25,925,000 | ||||||||||||
Mitsubishi UFJ Trust and Banking Corporation 144A | 2.45 | 10-16-2019 | 12,000,000 | 12,001,538 | ||||||||||||
Opus Group AB §øø | 2.57 | 10-1-2032 | 25,000,000 | 25,000,000 | ||||||||||||
Opus Inspection Incorporated §øø | 2.57 | 1-1-2034 | 28,000,000 | 28,000,000 | ||||||||||||
ROC III CA Crossings Chino Hills LLC Series A §øø | 2.44 | 1-1-2057 | 34,000,000 | 34,000,000 | ||||||||||||
ROC III CA Crossings Chino Hills LLC Series B §øø | 2.44 | 1-1-2057 | 24,000,000 | 24,000,000 | ||||||||||||
Total Other Instruments (Cost $379,951,582) | 379,961,538 | |||||||||||||||
|
| |||||||||||||||
Other Notes: 1.06% | ||||||||||||||||
| Corporate Bonds and Notes: 1.06% | ||||||||||||||||
Cellmark Incorporated Secured §øø | 2.57 | 6-1-2038 | 96,000,000 | 96,000,000 | ||||||||||||
|
| |||||||||||||||
Total Other Notes (Cost $96,000,000) | 96,000,000 | |||||||||||||||
|
| |||||||||||||||
| Repurchase Agreements^^: 17.82% | ||||||||||||||||
Bank of America Corporation, dated7-31-2019, maturity value $381,977,161 (1) | 2.56 | 8-1-2019 | 381,950,000 | 381,950,000 | ||||||||||||
Bank of America Corporation, dated7-31-2019, maturity value $81,205,774 (2) | 2.56 | 8-1-2019 | 81,200,000 | 81,200,000 | ||||||||||||
Bank of Montreal, dated7-31-2019, maturity value $500,035,417 (3) | 2.55 | 8-1-2019 | 500,000,000 | 500,000,000 | ||||||||||||
Bank of Nova Scotia, dated7-31-2019, maturity value $345,024,342 (4) | 2.54 | 8-1-2019 | 345,000,000 | 345,000,000 | ||||||||||||
Credit Agricole SA, dated7-31-2019, maturity value $145,046,722 (5) | 2.32 | 8-5-2019 | 145,000,000 | 145,000,000 | ||||||||||||
Credit Agricole SA, dated7-31-2019, maturity value $165,062,700 (6) | 2.28 | 8-6-2019 | 165,000,000 | 165,000,000 | ||||||||||||
Total Repurchase Agreements (Cost $1,618,150,000) | 1,618,150,000 | |||||||||||||||
|
| |||||||||||||||
| Total investments in securities (Cost $9,052,697,698) | 99.73 | % | 9,053,640,089 | |||||
Other assets and liabilities, net | 0.27 | 24,775,614 | ||||||
|
|
|
| |||||
| Total net assets | 100.00 | % | $ | 9,078,415,703 | ||||
|
|
|
| |||||
| ± | Variable rate investment. The rate shown is the rate in effect at period end. |
| (z) | Zero coupon security. The rate represents the current yield to maturity. |
| 144A | The security may be resold in transactions exempt from registration, normally to qualified institutional buyers, pursuant to Rule 144A under the Securities Act of 1933. |
| ø | Variable rate demand notes are subject to a demand feature which reduces the effective maturity. The maturity date shown represents the final maturity date of the security. The interest rate is determined and reset by the issuer daily, weekly, or monthly depending upon the terms of the security. The rate shown is the rate in effect at period end. |
| § | The security is subject to a demand feature which reduces the effective maturity. |
| øø | The interest rate is determined and reset by the issuer periodically depending upon the terms of the security. The rate shown is the rate in effect at period end. |
| ^^ | Collateralized by: |
(1) U.S. government securities, 3.00% to 3.50%,3-20-2045 to1-20-2047, fair value including accrued interest is $393,408,500. |
(2) U.S. government securities, 4.00% to 4.50%,1-1-2049 to5-1-2049, fair value including accrued interest is $83,636,000. |
(3) U.S. government securities, 2.19% to 5.00%,3-10-2023 to10-20-2068, fair value including accrued interest is $514,998,695. |
(4) U.S. government securities, 2.40% to 6.50%,11-1-2020 to8-1-2049, fair value including accrued interest is $355,350,000. |
(5) U.S. government securities, 2.50% to 6.00%,1-1-2027 to6-20-2049, fair value including accrued interest is $149,350,000. |
(6) U.S. government securities, 3.00% to 5.00%,3-15-2038 to3-20-2049, fair value including accrued interest is $169,950,000. |
The accompanying notes are an integral part of these financial statements.
12 | Institutional Money Market Funds
Table of Contents
Portfolio of investments—July 31, 2019 (unaudited)
Abbreviations:
| FHLB | Federal Home Loan Bank |
| FHLMC | Federal Home Loan Mortgage Corporation |
| FNMA | Federal National Mortgage Association |
| GNMA | Government National Mortgage Association |
| GO | General obligation |
| HFA | Housing Finance Authority |
| IDA | Industrial Development Authority |
| LIQ | Liquidity agreement |
| LOC | Letter of credit |
| MFHR | Multifamily housing revenue |
| ROC | Reset option certificates |
| SPA | Standby purchase agreement |
The accompanying notes are an integral part of these financial statements.
Institutional Money Market Funds | 13
Table of Contents
Statement of assets and liabilities—July 31, 2019 (unaudited)
Assets | ||||
Investments in unaffiliated securities, at value (cost $7,434,547,698) | $ | 7,435,490,089 | ||
Investments in repurchase agreements, at value (cost $1,618,150,000) | 1,618,150,000 | |||
Cash | 37,811 | |||
Receivable for investments sold | 17,869,844 | |||
Receivable for Fund shares sold | 500,175 | |||
Receivable for interest | 12,564,168 | |||
Prepaid expenses and other assets | 136,924 | |||
|
| |||
Total assets | 9,084,749,011 | |||
|
| |||
Liabilities | ||||
Custodian and accounting fees payable | 2,643,134 | |||
Dividends payable | 2,118,930 | |||
Management fee payable | 739,371 | |||
Administration fees payable | 376,470 | |||
Payable for Fund shares redeemed | 5,000 | |||
Trustees’ fees and expenses payable | 2,695 | |||
Accrued expenses and other liabilities | 447,708 | |||
|
| |||
Total liabilities | 6,333,308 | |||
|
| |||
Total net assets | $ | 9,078,415,703 | ||
|
| |||
Net assets consist of | ||||
Paid-in capital | $ | 9,077,758,047 | ||
Total distributable earnings | 657,656 | |||
|
| |||
Total net assets | $ | 9,078,415,703 | ||
|
| |||
Computation of net asset value per share | ||||
Net assets – Administrator Class | $ | 112,809,993 | ||
Shares outstanding – Administrator Class1 | 112,764,024 | |||
Net asset value per share – Administrator Class | $1.0004 | |||
Net assets – Institutional Class | $ | 1,556,739,904 | ||
Shares outstanding – Institutional Class1 | 1,556,169,675 | |||
Net asset value per share – Institutional Class | $1.0004 | |||
Net assets – Select Class | $ | 7,348,389,689 | ||
Shares outstanding – Select Class1 | 7,344,943,767 | |||
Net asset value per share – Select Class | $1.0005 | |||
Net assets – Service Class | $ | 60,476,117 | ||
Shares outstanding – Service Class1 | 60,453,525 | |||
Net asset value per share – Service Class | $1.0004 | |||
| 1 | The Fund has an unlimited number of authorized shares. |
The accompanying notes are an integral part of these financial statements.
14 | Institutional Money Market Funds
Table of Contents
Statement of operations—six months ended July 31, 2019 (unaudited)
Investment income | ||||
Interest | $ | 114,194,053 | ||
|
| |||
Expenses | ||||
Management fee | 6,353,846 | |||
Administration fees | ||||
Administrator Class | 57,292 | |||
Institutional Class | 612,888 | |||
Select Class | 1,403,310 | |||
Service Class | 35,619 | |||
Shareholder servicing fees | ||||
Administrator Class | 57,292 | |||
Service Class | 70,034 | |||
Professional fees | 31,350 | |||
Shareholder report expenses | 10,860 | |||
Trustees’ fees and expenses | 8,319 | |||
Other fees and expenses | 237 | |||
|
| |||
Total expenses | 8,641,047 | |||
Less: Fee waivers and/or expense reimbursements | (2,231,374 | ) | ||
|
| |||
Net expenses | 6,409,673 | |||
|
| |||
Net investment income | 107,784,380 | |||
|
| |||
Realized and unrealized gains (losses) on investments | ||||
Net realized gains on investments | 10,574 | |||
Net change in unrealized gains (losses) on investments | 4,885 | |||
|
| |||
Net realized and unrealized gains (losses) on investments | 15,459 | |||
|
| |||
Net increase in net assets resulting from operations | $ | 107,799,839 | ||
|
| |||
The accompanying notes are an integral part of these financial statements.
Institutional Money Market Funds | 15
Table of Contents
Statement of changes in net assets
| Six months ended July 31, 2019 (unaudited) | Year ended January 31, 2019 | |||||||||||||||
Operations | ||||||||||||||||
Net investment income | $ | 107,784,380 | $ | 159,851,992 | ||||||||||||
Net realized gains on investments | 10,574 | 56,876 | ||||||||||||||
Net change in unrealized gains (losses) on investments | 4,885 | 431,979 | ||||||||||||||
|
| |||||||||||||||
Net increase in net assets resulting from operations | 107,799,839 | 160,340,847 | ||||||||||||||
|
| |||||||||||||||
Distributions to shareholders from net investment income |
| |||||||||||||||
Administrator Class | (1,311,188 | ) | (1,895,476 | ) | ||||||||||||
Institutional Class | (18,538,979 | ) | (28,249,539 | ) | ||||||||||||
Select Class | (87,283,087 | ) | (128,601,249 | ) | ||||||||||||
Service Class | (650,758 | ) | (1,105,728 | ) | ||||||||||||
|
| |||||||||||||||
Total distributions to shareholders | (107,784,012 | ) | (159,851,992 | ) | ||||||||||||
|
| |||||||||||||||
Capital share transactions | Shares | Shares | ||||||||||||||
Proceeds from shares sold | ||||||||||||||||
Administrator Class | 184,278,782 | 184,355,909 | 211,434,343 | 211,501,197 | ||||||||||||
Institutional Class | 3,716,585,730 | 3,718,072,364 | 9,160,087,234 | 9,162,659,933 | ||||||||||||
Select Class | 20,778,747,834 | 20,789,137,208 | 35,980,466,135 | 35,993,622,643 | ||||||||||||
Service Class | 100,617,013 | 100,657,260 | 239,534,792 | 239,602,726 | ||||||||||||
|
| |||||||||||||||
| 24,792,222,741 | 45,607,386,499 | |||||||||||||||
|
| |||||||||||||||
Reinvestment of distributions | ||||||||||||||||
Administrator Class | 1,223,761 | 1,224,286 | 1,713,630 | 1,714,172 | ||||||||||||
Institutional Class | 16,720,108 | 16,726,796 | 23,610,733 | 23,617,570 | ||||||||||||
Select Class | 71,692,888 | 71,728,735 | 104,456,935 | 104,496,372 | ||||||||||||
Service Class | 453,860 | 454,041 | 835,422 | 835,654 | ||||||||||||
|
| |||||||||||||||
| 90,133,858 | 130,663,768 | |||||||||||||||
|
| |||||||||||||||
Payment for shares redeemed |
| |||||||||||||||
Administrator Class | (165,372,789 | ) | (165,442,523 | ) | (213,025,903 | ) | (213,088,180 | ) | ||||||||
Institutional Class | (3,750,018,331 | ) | (3,751,518,338 | ) | (8,715,286,298 | ) | (8,717,706,523 | ) | ||||||||
Select Class | (19,961,829,253 | ) | (19,971,810,168 | ) | (35,343,945,454 | ) | (35,356,866,490 | ) | ||||||||
Service Class | (110,918,058 | ) | (110,962,425 | ) | (231,465,196 | ) | (231,531,059 | ) | ||||||||
|
| |||||||||||||||
| (23,999,733,454 | ) | (44,519,192,252 | ) | |||||||||||||
|
| |||||||||||||||
Net increase in net assets resulting from capital share transactions | 882,623,145 | 1,218,858,015 | ||||||||||||||
|
| |||||||||||||||
Total increase in net assets | 882,638,972 | 1,219,346,870 | ||||||||||||||
|
| |||||||||||||||
Net assets | ||||||||||||||||
Beginning of period | 8,195,776,731 | 6,976,429,861 | ||||||||||||||
|
| |||||||||||||||
End of period | $ | 9,078,415,703 | $ | 8,195,776,731 | ||||||||||||
|
| |||||||||||||||
The accompanying notes are an integral part of these financial statements.
16 | Institutional Money Market Funds
Table of Contents
(For a share outstanding throughout each period)
| Six months ended July 31, 2019 (unaudited) | Year ended January 31 | |||||||||||||||||||||||
| ADMINISTRATOR CLASS | 2019 | 2018 | 2017 | 20161 | 20151 | |||||||||||||||||||
Net asset value, beginning of period | $1.0004 | $1.0003 | $1.0003 | $1.0000 | $1.00 | $1.00 | ||||||||||||||||||
Net investment income | 0.0114 | 0.0188 | 0.0096 | 0.0028 | 0.00 | 2 | 0.00 | 2 | ||||||||||||||||
Net realized and unrealized gains (losses) on investments | 0.0000 | 3 | 0.0001 | 0.0000 | 3 | 0.0003 | 0.00 | 2 | 0.00 | 2 | ||||||||||||||
|
|
|
|
|
|
|
|
|
|
|
| |||||||||||||
Total from investment operations | 0.0114 | 0.0189 | 0.0096 | 0.0031 | 0.00 | 2 | 0.00 | 2 | ||||||||||||||||
Distributions to shareholders from | ||||||||||||||||||||||||
Net investment income | (0.0114 | ) | (0.0188 | ) | (0.0096 | ) | (0.0028 | ) | (0.00 | )2 | (0.00 | )2 | ||||||||||||
Net realized gains | 0.0000 | 0.0000 | (0.0000 | )3 | 0.0000 | 0.00 | 0.00 | |||||||||||||||||
|
|
|
|
|
|
|
|
|
|
|
| |||||||||||||
Total distributions to shareholders | (0.0114 | ) | (0.0188 | ) | (0.0096 | ) | (0.0028 | ) | (0.00 | )2 | (0.00 | )2 | ||||||||||||
Net asset value, end of period | $1.0004 | $1.0004 | $1.0003 | $1.0003 | $1.00 | $1.00 | ||||||||||||||||||
Total return4 | 1.14 | % | 1.91 | % | 0.96 | % | 0.31 | % | 0.03 | % | 0.01 | % | ||||||||||||
Ratios to average net assets (annualized) | ||||||||||||||||||||||||
Gross expenses | 0.35 | % | 0.36 | % | 0.40 | % | 0.35 | % | 0.34 | % | 0.34 | % | ||||||||||||
Net expenses | 0.33 | % | 0.33 | % | 0.32 | % | 0.33 | % | 0.25 | % | 0.19 | % | ||||||||||||
Net investment income | 2.29 | % | 1.87 | % | 0.96 | % | 0.24 | % | 0.03 | % | 0.01 | % | ||||||||||||
Supplemental data | ||||||||||||||||||||||||
Net assets, end of period (000s omitted) | $112,810 | $92,671 | $92,542 | $82,591 | $258,152 | $312,748 | ||||||||||||||||||
| 1 | Amounts reflect the Fund transacting shares at a fixed NAV rounded to two decimal places. Beginning October 11, 2016, the Fund began selling and redeeming shares of the Fund at a floating NAV rounded to the fourth decimal place. |
| 2 | Amount is less than $0.005. |
| 3 | Amount is less than $0.00005. |
| 4 | Returns for periods of less than one year are not annualized. |
The accompanying notes are an integral part of these financial statements.
Institutional Money Market Funds | 17
Table of Contents
Financial highlights
(For a share outstanding throughout each period)
| Six months ended July 31, 2019 (unaudited) | Year ended January 31 | |||||||||||||||||||||||
| INSTITUTIONAL CLASS | 2019 | 2018 | 2017 | 20161 | 20151 | |||||||||||||||||||
Net asset value, beginning of period | $1.0004 | $1.0003 | $1.0003 | $1.0000 | $1.00 | $1.00 | ||||||||||||||||||
Net investment income | 0.0120 | 0.0202 | 0.0108 | 0.0039 | 0.00 | 2 | 0.00 | 2 | ||||||||||||||||
Net realized and unrealized gains (losses) on investments | 0.0000 | 3 | 0.0000 | 3 | 0.0000 | 3 | 0.0005 | 0.00 | 2 | 0.00 | 2 | |||||||||||||
|
|
|
|
|
|
|
|
|
|
|
| |||||||||||||
Total from investment operations | 0.0120 | 0.0202 | 0.0108 | 0.0044 | 0.00 | 2 | 0.00 | 2 | ||||||||||||||||
Distributions to shareholders from | ||||||||||||||||||||||||
Net investment income | (0.0120 | ) | (0.0201 | ) | (0.0108 | ) | (0.0041 | ) | (0.00 | )2 | (0.00 | )2 | ||||||||||||
Net realized gains | 0.0000 | 0.0000 | (0.0000 | )3 | 0.0000 | 0.00 | 0.00 | |||||||||||||||||
|
|
|
|
|
|
|
|
|
|
|
| |||||||||||||
Total distributions to shareholders | (0.0120 | ) | (0.0201 | ) | (0.0108 | ) | (0.0041 | ) | (0.00 | )2 | (0.00 | )2 | ||||||||||||
Net asset value, end of period | $1.0004 | $1.0004 | $1.0003 | $1.0003 | $1.00 | $1.00 | ||||||||||||||||||
Total return4 | 1.21 | % | 2.04 | % | 1.09 | % | 0.44 | % | 0.08 | % | 0.01 | % | ||||||||||||
Ratios to average net assets (annualized) | ||||||||||||||||||||||||
Gross expenses | 0.23 | % | 0.24 | % | 0.28 | % | 0.23 | % | 0.22 | % | 0.22 | % | ||||||||||||
Net expenses | 0.20 | % | 0.20 | % | 0.20 | % | 0.20 | % | 0.20 | % | 0.19 | % | ||||||||||||
Net investment income | 2.42 | % | 2.03 | % | 1.11 | % | 0.36 | % | 0.08 | % | 0.01 | % | ||||||||||||
Supplemental data | ||||||||||||||||||||||||
Net assets, end of period (000s omitted) | $1,556,740 | $1,573,458 | $1,104,814 | $749,052 | $8,252,614 | $9,397,113 | ||||||||||||||||||
| 1 | Amounts reflect the Fund transacting shares at a fixed NAV rounded to two decimal places. Beginning October 11, 2016, the Fund began selling and redeeming shares of the Fund at a floating NAV rounded to the fourth decimal place. |
| 2 | Amount is less than $0.005. |
| 3 | Amount is less than $0.00005. |
| 4 | Returns for periods of less than one year are not annualized. |
The accompanying notes are an integral part of these financial statements.
18 | Institutional Money Market Funds
Table of Contents
Financial highlights
(For a share outstanding throughout each period)
| Six months ended July 31, 2019 (unaudited) | Year ended January 31 | |||||||||||||||||||||||
| SELECT CLASS | 2019 | 2018 | 2017 | 20161 | 20151 | |||||||||||||||||||
Net asset value, beginning of period | $1.0005 | $1.0004 | $1.0004 | $1.0000 | $1.00 | $1.00 | ||||||||||||||||||
Net investment income | 0.0124 | 0.0208 | 0.0116 | 0.0048 | 0.00 | 2 | 0.00 | 2 | ||||||||||||||||
Net realized and unrealized gains (losses) on investments | 0.0000 | 3 | 0.0001 | 0.0000 | 3 | 0.0004 | 0.00 | 2 | 0.00 | 2 | ||||||||||||||
|
|
|
|
|
|
|
|
|
|
|
| |||||||||||||
Total from investment operations | 0.0124 | 0.0209 | 0.0116 | 0.0052 | 0.00 | 2 | 0.00 | 2 | ||||||||||||||||
Distributions to shareholders from | ||||||||||||||||||||||||
Net investment income | (0.0124 | ) | (0.0208 | ) | (0.0116 | ) | (0.0048 | ) | (0.00 | )2 | (0.00 | )2 | ||||||||||||
Net realized gains | 0.0000 | 0.0000 | (0.0000 | )3 | 0.0000 | 0.00 | 0.00 | |||||||||||||||||
|
|
|
|
|
|
|
|
|
|
|
| |||||||||||||
Total distributions to shareholders | (0.0124 | ) | (0.0208 | ) | (0.0116 | ) | (0.0048 | ) | (0.00 | )2 | (0.00 | )2 | ||||||||||||
Net asset value, end of period | $1.0005 | $1.0005 | $1.0004 | $1.0004 | $1.00 | $1.00 | ||||||||||||||||||
Total return4 | 1.24 | % | 2.11 | % | 1.16 | % | 0.52 | % | 0.15 | % | 0.07 | % | ||||||||||||
Ratios to average net assets (annualized) | ||||||||||||||||||||||||
Gross expenses | 0.19 | % | 0.20 | % | 0.24 | % | 0.19 | % | 0.18 | % | 0.18 | % | ||||||||||||
Net expenses | 0.13 | % | 0.13 | % | 0.12 | % | 0.13 | % | 0.13 | % | 0.13 | % | ||||||||||||
Net investment income | 2.49 | % | 2.10 | % | 1.19 | % | 0.43 | % | 0.16 | % | 0.07 | % | ||||||||||||
Supplemental data | ||||||||||||||||||||||||
Net assets, end of period (000s omitted) | $7,348,390 | $6,459,320 | $5,717,659 | $3,386,093 | $37,219,390 | $35,247,440 | ||||||||||||||||||
| 1 | Amounts reflect the Fund transacting shares at a fixed NAV rounded to two decimal places. Beginning October 11, 2016, the Fund began selling and redeeming shares of the Fund at a floating NAV rounded to the fourth decimal place. |
| 2 | Amount is less than $0.005. |
| 3 | Amount is less than $0.00005. |
| 4 | Returns for periods of less than one year are not annualized. |
The accompanying notes are an integral part of these financial statements.
Institutional Money Market Funds | 19
Table of Contents
Financial highlights
(For a share outstanding throughout each period)
| Six months ended July 31, 2019 (unaudited) | Year ended January 31 | |||||||||||||||||||||||
| SERVICE CLASS | 2019 | 2018 | 2017 | 20161 | 20151 | |||||||||||||||||||
Net asset value, beginning of period | $1.0004 | $1.0003 | $1.0003 | $1.0000 | $1.00 | $1.00 | ||||||||||||||||||
Net investment income | 0.0109 | 0.0177 | 0.0085 | 0.0016 | 0.00 | 2 | 0.00 | 2 | ||||||||||||||||
Net realized and unrealized gains (losses) on investments | 0.0000 | 3 | 0.0002 | 0.0000 | 3 | 0.0005 | 0.00 | 2 | 0.00 | 2 | ||||||||||||||
|
|
|
|
|
|
|
|
|
|
|
| |||||||||||||
Total from investment operations | 0.0109 | 0.0179 | 0.0085 | 0.0021 | 0.00 | 2 | 0.00 | 2 | ||||||||||||||||
Distributions to shareholders from | ||||||||||||||||||||||||
Net investment income | (0.0109 | ) | (0.0178 | ) | (0.0085 | ) | (0.0018 | ) | (0.00 | )2 | (0.00 | )2 | ||||||||||||
Net realized gains | 0.0000 | 0.0000 | (0.0000 | )3 | 0.0000 | 0.00 | 0.00 | |||||||||||||||||
|
|
|
|
|
|
|
|
|
|
|
| |||||||||||||
Total distributions to shareholders | (0.0109 | ) | (0.0178 | ) | (0.0085 | ) | (0.0018 | ) | (0.00 | )2 | (0.00 | )2 | ||||||||||||
Net asset value, end of period | $1.0004 | $1.0004 | $1.0003 | $1.0003 | $1.00 | $1.00 | ||||||||||||||||||
Total return4 | 1.09 | % | 1.81 | % | 0.85 | % | 0.21 | % | 0.02 | % | 0.01 | % | ||||||||||||
Ratios to average net assets (annualized) | ||||||||||||||||||||||||
Gross expenses | 0.50 | % | 0.51 | % | 0.55 | % | 0.52 | % | 0.51 | % | 0.50 | % | ||||||||||||
Net expenses | 0.43 | % | 0.43 | % | 0.43 | % | 0.43 | % | 0.27 | % | 0.19 | % | ||||||||||||
Net investment income | 2.19 | % | 1.79 | % | 0.84 | % | 0.13 | % | 0.02 | % | 0.01 | % | ||||||||||||
Supplemental data | ||||||||||||||||||||||||
Net assets, end of period (000s omitted) | $60,476 | $70,327 | $61,415 | $67,439 | $898,288 | $1,124,475 | ||||||||||||||||||
| 1 | Amounts reflect the Fund transacting shares at a fixed NAV rounded to two decimal places. Beginning October 11, 2016, the Fund began selling and redeeming shares of the Fund at a floating NAV rounded to the fourth decimal place. |
| 2 | Amount is less than $0.005. |
| 3 | Amount is less than $0.00005. |
| 4 | Returns for periods of less than one year are not annualized. |
The accompanying notes are an integral part of these financial statements.
20 | Institutional Money Market Funds
Table of Contents
Notes to financial statements (unaudited)
1. ORGANIZATION
Wells Fargo Funds Trust (the “Trust”), a Delaware statutory trust organized on March 10, 1999, is anopen-end management investment company registered under the Investment Company Act of 1940, as amended (the “1940 Act”). As an investment company, the Trust follows the accounting and reporting guidance in Financial Accounting Standards Board (“FASB”) Accounting Standards Codification Topic 946,Financial Services – Investment Companies. These financial statements report on the Wells Fargo Heritage Money Market Fund (the “Fund”) which is a diversified series of the Trust.
The Fund operates as an institutional non-government money market fund. As an institutionalnon-government money market fund, shareholders will transact at a floating net asset value (NAV) rounded to four decimal-places in accordance with the valuation policies below.
2. SIGNIFICANT ACCOUNTING POLICIES
The following significant accounting policies, which are consistently followed in the preparation of the financial statements of the Fund, are in conformity with U.S. generally accepted accounting principles which require management to make estimates and assumptions that affect the reported amounts of assets and liabilities, disclosure of contingent assets and liabilities at the date of the financial statements, and the reported amounts of revenues and expenses during the reporting period. Actual results could differ from those estimates.
Securities valuation
Debt securities are valued at the evaluated bid price provided by an independent pricing service (e.g. taking into account various factors, including yields, maturities, or credit ratings) or, if a reliable price is not available, the quoted bid price from an independent broker-dealer.
Investments which are not valued using the method discussed above are valued at their fair value, as determined in good faith by the Board of Trustees of the Fund. The Board of Trustees has established a Valuation Committee comprised of the Trustees and has delegated to it the authority to take any actions regarding the valuation of portfolio securities that the Valuation Committee deems necessary or appropriate, including determining the fair value of portfolio securities, unless the determination has been delegated to the Wells Fargo Asset Management Pricing Committee at Wells Fargo Funds Management, LLC (“Funds Management”). The Board of Trustees retains the authority to make or ratify any valuation decisions or approve any changes to the Valuation Procedures as it deems appropriate. On a quarterly basis, the Board of Trustees receives reports on any valuation actions taken by the Valuation Committee or the Wells Fargo Asset Management Pricing Committee which may include items for ratification.
Repurchase agreements
The Fund may invest in repurchase agreements and may participate in pooled repurchase agreement transactions with other funds advised by Funds Management. Repurchase agreements are agreements where the seller of a security to the Fund agrees to repurchase that security from the Fund at a mutually agreed upon time and price. The repurchase agreements must be fully collateralized based on values that aremarked-to-market daily. The collateral may be held by an agent bank under atri-party agreement. It is the custodian’s responsibility to value collateral daily and to take action to obtain additional collateral as necessary to maintain a market value equal to or greater than the resale price. The repurchase agreements are collateralized by securities issued or guaranteed by the U.S. Government, its agencies or instrumentalities. There could be potential loss to the Fund in the event that the Fund is delayed or prevented from exercising its rights to dispose of the collateral, including the risk of a possible decline in the value of the underlying obligations during the period in which the Fund seeks to assert its rights.
When-issued transactions
The Fund may purchase securities on a forward commitment or when-issued basis. The Fund records a when-issued transaction on the trade date and will segregate assets in an amount at least equal in value to the Fund’s commitment to purchase when-issued securities. Securities purchased on a when-issued basis aremarked-to-market daily and the Fund begins earning interest on the settlement date. Losses may arise due to changes in the market value of the underlying securities or if the counterparty does not perform under the contract.
Security transactions and income recognition
Securities transactions are recorded on a trade date basis. Realized gains or losses are recorded on the basis of identified cost.
Interest income is accrued daily and bond discounts are accreted and premiums are amortized daily. To the extent debt obligations are placed onnon-accrual status, any related interest income may be reduced by writing off interest receivables when the collection of all or a portion of interest has been determined to be doubtful based on consistently applied procedures and the fair value has decreased. If the issuer subsequently resumes interest payments or when the collectability of interest is reasonably assured, the debt obligation is removed fromnon-accrual status.
Institutional Money Market Funds | 21
Table of Contents
Notes to financial statements (unaudited)
Distributions to shareholders
Distributions to shareholders from net investment income are declared daily and paid monthly. Distributions from net realized gains, if any, are recorded on theex-dividend date and paid at least annually. Such distributions are determined in accordance with income tax regulations and may differ from U.S. generally accepted accounting principles. Dividend sources are estimated at the time of declaration. The tax character of distributions is determined as of the Fund’s fiscal year end. Therefore, a portion of the Fund’s distributions made prior to the Fund’s fiscal year end may be categorized as a tax return of capital at year end.
Federal and other taxes
The Fund intends to continue to qualify as a regulated investment company by distributing substantially all of its investment company taxable income and any net realized capital gains (after reduction for capital loss carryforwards) sufficient to relieve it from all, or substantially all, federal income taxes. Accordingly, no provision for federal income taxes was required.
The Fund’s income and federal excise tax returns and all financial records supporting those returns for the prior three fiscal years are subject to examination by the federal and Delaware revenue authorities. Management has analyzed the Fund’s tax positions taken on federal, state, and foreign tax returns for all open tax years and does not believe that there are any uncertain tax positions that require recognition of a tax liability.
As of July 31, 2019, the aggregate cost of all investments for federal income tax purposes was $9,052,697,701 and the unrealized gains (losses) consisted of:
Gross unrealized gains | $ | 1,031,551 | ||
Gross unrealized losses | (89,163 | ) | ||
Net unrealized gains | $ | 942,388 | ||
Class allocations
The separate classes of shares offered by the Fund differ principally in shareholder servicing and administration fees. Class specific expenses are charged directly to that share class. Investment income, common fund-level expenses, and realized and unrealized gains (losses) on investments are allocated daily to each class of shares based on the relative proportion of net assets of each class.
3. FAIR VALUATION MEASUREMENTS
Fair value measurements of investments are determined within a framework that has established a fair value hierarchy based upon the various data inputs utilized in determining the value of the Fund’s investments. The three-level hierarchy gives the highest priority to unadjusted quoted prices in active markets for identical assets or liabilities (Level 1) and the lowest priority to unobservable inputs (Level 3). The Fund’s investments are classified within the fair value hierarchy based on the lowest level of input that is significant to the fair value measurement. The inputs are summarized into three broad levels as follows:
| ∎ | Level 1 – quoted prices in active markets for identical securities |
| ∎ | Level 2 – other significant observable inputs (including quoted prices for similar securities, interest rates, prepayment speeds, credit risk, etc.) |
| ∎ | Level 3 – significant unobservable inputs (including the Fund’s own assumptions in determining the fair value of investments) |
The inputs or methodologies used for valuing investments in securities are not necessarily an indication of the risk associated with investing in those securities.
22 | Institutional Money Market Funds
Table of Contents
Notes to financial statements (unaudited)
The following is a summary of the inputs used in valuing the Fund’s assets and liabilities as of July 31, 2019:
| Quoted prices (Level 1) | Other significant observable inputs (Level 2) | Significant unobservable inputs (Level 3) | Total | |||||||||||||
Assets | ||||||||||||||||
Investments in: | ||||||||||||||||
Certificates of deposit | $ | 0 | $ | 2,233,141,730 | $ | 0 | $ | 2,233,141,730 | ||||||||
Commercial paper | 0 | 3,876,728,039 | 0 | 3,876,728,039 | ||||||||||||
Municipal obligations | 0 | 824,618,683 | 0 | 824,618,683 | ||||||||||||
Non-agency mortgage-backed securities | 0 | 25,040,099 | 0 | 25,040,099 | ||||||||||||
Other instruments | 0 | 379,961,538 | 0 | 379,961,538 | ||||||||||||
Other notes | 0 | 96,000,000 | 0 | 96,000,000 | ||||||||||||
Repurchase agreements | 0 | 1,618,150,000 | 0 | 1,618,150,000 | ||||||||||||
Total assets | $ | 0 | $ | 9,053,640,089 | $ | 0 | $ | 9,053,640,089 | ||||||||
Additional sector, industry or geographic detail is included in the Portfolio of Investments.
For the six months ended July 31, 2019, the Fund did not have any transfers into/out of Level 3.
4. TRANSACTIONS WITH AFFILIATES
Management fee
Funds Management, an indirect wholly owned subsidiary of Wells Fargo & Company (“Wells Fargo”), is the manager of the Fund and provides advisory and fund-level administrative services under an investment management agreement. Under the investment management agreement, Funds Management is responsible for, among other services, implementing the investment objectives and strategies of the Fund, supervising the applicable subadvisers and providing fund-level administrative services in connection with the Fund’s operations. As compensation for its services under the investment management agreement, Funds Management is entitled to receive a management fee at the following annual rate based on the Fund’s average daily net assets:
| Average daily net assets | Management fee | |
First $5 billion | 0.15% | |
Next $5 billion | 0.14 | |
Over $10 billion | 0.13 | |
For the six months ended July 31, 2019, the management fee was equivalent to an annual rate of 0.15% of the Fund’s average daily net assets.
Funds Management has retained the services of certain subadvisers to provide daily portfolio management to the Fund. Wells Capital Management Incorporated (“WellsCap”), an affiliate of Funds Management and an indirect wholly owned subsidiary of Wells Fargo, is a subadviser to the Fund and is entitled to receive a fee from Funds Management at an annual rate starting at 0.05% and declining to 0.01% as the average daily net assets of the Fund increase. Wells Capital Management Singapore, a separately identifiable department of Wells Fargo Bank, N.A, an affiliate of Funds Management and wholly owned subsidiary of Wells Fargo, is also a subadviser to the Fund and is entitled to receive a fee from WellsCap at an annual rate starting at 0.0025% and declining to 0.0005% as the average daily net assets of the Fund increase.
Institutional Money Market Funds | 23
Table of Contents
Notes to financial statements (unaudited)
Administration fees
Under a class-level administration agreement, Funds Management provides class-level administrative services to the Fund, which includes paying fees and expenses for services provided by the transfer agent,sub-transfer agents, omnibus account servicers and record-keepers. As compensation for its services under the class-level administration agreement, Funds Management receives an annual fee which is calculated based on the average daily net assets of each class as follows:
| Class-level administration fee | ||||
Administrator Class | 0.10 | % | ||
Institutional Class | 0.08 | |||
Select Class | 0.04 | |||
Service Class | 0.12 | |||
Waivers and/or expense reimbursements
Funds Management has contractually waived and/or reimbursed management and administration fees to the extent necessary to maintain certain net operating expense ratios for the Fund. When each class of the Fund has exceeded its expense cap, Funds Management has waived fees and/or reimbursed expenses from fund-level expenses on a proportionate basis and then from class specific expenses. When only certain classes exceed their expense caps, waivers and/or reimbursements are applied against class specific expenses before fund-level expenses. Funds Management has committed through May 31, 2020 to waive fees and/or reimburse expenses to the extent necessary to cap the Fund’s expenses at 0.33% for Administrator Class shares, 0.20% for Institutional Class shares, 0.13% for Select Class shares, and 0.43% for Service Class shares. Prior to or after the commitment expiration date, the cap may be increased or the commitment to maintain the cap may be terminated only with the approval of the Board of Trustees. Prior to May 31, 2019, the Fund’s expenses were capped at 0.35% for Administrator Class shares.
Shareholder servicing fees
The Trust has entered into contracts with one or more shareholder servicing agents, whereby Administrator Class and Service Class of the Fund are charged a fee at an annual rate of 0.10% and 0.25%, respectively, of their average daily net assets. A portion of these total shareholder servicing fees were paid to affiliates of Wells Fargo.
Interfund transactions
The Fund may purchase or sell portfolio investment securities to certain other Wells Fargo affiliates pursuant to Rule17a-7 under the 1940 Act and under procedures adopted by the Board of Trustees. The procedures have been designed to ensure that these interfund transactions, which do not incur broker commissions, are effected at current market prices.
5. INDEMNIFICATION
Under the Trust’s organizational documents, the officers and Trustees have been granted certain indemnification rights against certain liabilities that may arise out of performance of their duties to the Trust. Additionally, in the normal course of business, the Trust may enter into contracts with service providers that contain a variety of indemnification clauses. The Trust’s maximum exposure under these arrangements is dependent on future claims that may be made against the Fund and, therefore, cannot be estimated.
6. NEW ACCOUNTING PRONOUNCEMENTS
In August 2018, FASB issued Accounting Standards Update (“ASU”)No. 2018-13, Fair Value Measurement (Topic 820)Disclosure Framework—Changes to the Disclosure Requirements for Fair Value Measurement. ASU2018-13 updates the disclosure requirements for fair value measurements by modifying or removing certain disclosures and adding certain new disclosures. The amendments are effective for fiscal years, and interim periods within those fiscal years, beginning after December 15, 2019. Early adoption is permitted. Management has adopted the removal and modification of disclosures early, as permitted, and will adopt the additional new disclosures at the effective date.
In March 2017, FASB issued ASUNo. 2017-08,Premium Amortization on Purchased Callable Debt Securities. ASU2017-08
shortens the amortization period for certain callable debt securities held at a premium and requires the premium to be amortized to the earliest call date. The amendments do not require an accounting change for securities held at a discount and discounts will continue to be accreted to the maturity date of the security. ASU2017-08 is effective for fiscal years beginning after December 15, 2018 and for interim periods within those fiscal years. During the current reporting period, management of the Fund adopted the change in accounting policy which did not have a material impact to the Fund’s financial statements.
24 | Institutional Money Market Funds
Table of Contents
PROXY VOTING INFORMATION
A description of the policies and procedures used to determine how to vote proxies relating to portfolio securities is available, upon request, by calling1-800-222-8222, visiting our website atwfam.com, or visiting the SEC website at sec.gov. Information regarding how the proxies related to portfolio securities were voted during the most recent12-month period ended June 30 is available on the website atwfam.comor by visiting the SEC website at sec.gov.
Institutional Money Market Funds | 25
Table of Contents
Other information (unaudited)
BOARD OF TRUSTEES AND OFFICERS
Each of the Trustees and Officers1 listed in the table below acts in identical capacities for each fund in the Wells Fargo family of funds, which consists of 152 mutual funds comprising the Wells Fargo Funds Trust, Wells Fargo Variable Trust, Wells Fargo Master Trust and fourclosed-end funds (collectively the “Fund Complex”). This table should be read in conjunction with the Prospectus and the Statement of Additional Information2. The mailing address of each Trustee and Officer is 525 Market Street, 12th Floor, San Francisco, CA 94105. Each Trustee and Officer serves an indefinite term, however, each Trustee serves such term until reaching the mandatory retirement age established by the Trustees.
Independent Trustees
Name and year of birth | Position held and length of service* | Principal occupations during past five years or longer | Current other public company or investment directorships | |||
William R. Ebsworth (Born 1957) | Trustee, since 2015 | Retired. From 1984 to 2013, equities analyst, portfolio manager, research director and chief investment officer at Fidelity Management and Research Company in Boston, Tokyo, and Hong Kong, and retired in 2013 as Chief Investment Officer of Fidelity Strategic Advisers, Inc. where he led a team of investment professionals managing client assets. Prior thereto, Board member of Hong Kong Securities Clearing Co., Hong Kong Options Clearing Corp., the Thailand International Fund, Ltd., Fidelity Investments Life Insurance Company, and Empire Fidelity Investments Life Insurance Company. Audit Committee Chair and Investment Committee Chair of the Vincent Memorial Hospital Endowment(non-profit organization). Mr. Ebsworth is a CFA® charterholder. | N/A | |||
Jane A. Freeman (Born 1953) | Trustee, since 2015; Chair Liaison, since 2018 | Retired. From 2012 to 2014 and 1999 to 2008, Chief Financial Officer of Scientific Learning Corporation. From 2008 to 2012, Ms. Freeman provided consulting services related to strategic business projects. Prior to 1999, Portfolio Manager at Rockefeller & Co. and Scudder, Stevens & Clark. Board member of the Harding Loevner Funds from 1996 to 2014, serving as both Lead Independent Director and chair of the Audit Committee. Board member of the Russell Exchange Traded Funds Trust from 2011 to 2012 and the chair of the Audit Committee. Ms. Freeman is a Board Member of The Ruth Bancroft Garden(non-profit organization). She is also an inactive Chartered Financial Analyst. | N/A | |||
Isaiah Harris, Jr. (Born 1952) | Trustee, since 2009; Audit Committee Chairman, since 2019 | Retired. Chairman of the Board of CIGNA Corporation since 2009, and Director since 2005. From 2003 to 2011, Director of Deluxe Corporation. Prior thereto, President and CEO of BellSouth Advertising and Publishing Corp. from 2005 to 2007, President and CEO of BellSouth Enterprises from 2004 to 2005 and President of BellSouth Consumer Services from 2000 to 2003. Emeritus member of the Iowa State University Foundation Board of Governors. Emeritus Member of the Advisory Board of Iowa State University School of Business. Advisory Board Member, Palm Harbor Academy (private school). Advisory Board Member, Child Evangelism Fellowship(non-profit). Mr. Harris is a certified public accountant (inactive status). | CIGNA Corporation | |||
Judith M. Johnson (Born 1949) | Trustee, since 2008; Audit Committee Chairman, from 2009 to 2018 | Retired. Prior thereto, Chief Executive Officer and Chief Investment Officer of Minneapolis Employees Retirement Fund from 1996 to 2008. Ms. Johnson is an attorney, certified public accountant and a certified managerial accountant. | N/A | |||
26 | Institutional Money Market Funds
Table of Contents
Other information (unaudited)
Name and year of birth | Position held and length of service* | Principal occupations during past five years or longer | Current other public company or investment directorships | |||
David F. Larcker (Born 1950) | Trustee, since 2009 | James Irvin Miller Professor of Accounting at the Graduate School of Business, Stanford University, Director of the Corporate Governance Research Initiative and Senior Faculty of The Rock Center for Corporate Governance since 2006. From 2005 to 2008, Professor of Accounting at the Graduate School of Business, Stanford University. Prior thereto, Ernst & Young Professor of Accounting at The Wharton School, University of Pennsylvania from 1985 to 2005. | N/A | |||
Olivia S. Mitchell (Born 1953) | Trustee, since 2006; Nominating and Governance Committee Chairman, since 2018 | International Foundation of Employee Benefit Plans Professor, Wharton School of the University of Pennsylvania since 1993. Director of Wharton’s Pension Research Council and Boettner Center on Pensions & Retirement Research, and Research Associate at the National Bureau of Economic Research. Previously, Cornell University Professor from 1978 to 1993. | N/A | |||
Timothy J. Penny (Born 1951) | Trustee, since 1996; Chairman, since 2018 | President and Chief Executive Officer of Southern Minnesota Initiative Foundation, anon-profit organization, since 2007. Member of the Board of Trustees of NorthStar Education Finance, Inc., anon-profit organization, since 2007. | N/A | |||
James G. Polisson (Born 1959) | Trustee, since 2018 | Retired. Chief Marketing Officer, Source (ETF) UK Services, Ltd, from 2015 to 2017. From 2012 to 2015, Principal of The Polisson Group, LLC, a management consulting, corporate advisory and principal investing company. Chief Executive Officer and Managing Director at Russell Investments, Global Exchange Traded Funds from 2010 to 2012. Managing Director of Barclays Global Investors from 1998 to 2010 and Global Chief Marketing Officer for iShares and Barclays Global Investors from 2000 to 2010. Trustee of the San Francisco Mechanics’ Institute, anon-profit organization, from 2013 to 2015. Board member of the Russell Exchange Traded Fund Trust from 2011 to 2012. Director of Barclays Global Investors Holdings Deutschland GmbH from 2006 to 2009. Mr. Polisson is an attorney and has a retired status with the Massachusetts and District of Columbia Bar Associations. | N/A | |||
| * | Length of service dates reflect the Trustee’s commencement of service with the Trust’s predecessor entities, where applicable. |
Institutional Money Market Funds | 27
Table of Contents
Other information (unaudited)
Officers
Name and year of birth | Position held and length of service | Principal occupations during past five years or longer | ||
Andrew Owen (Born 1960) | President, since 2017 | Executive Vice President of Wells Fargo & Company and Head of Affiliated Managers, Wells Fargo Asset Management, since 2014. In addition, Mr. Owen is currently President, Chief Executive Officer and Director of Wells Fargo Funds Management, LLC since 2017. Prior thereto, Executive Vice President responsible for marketing, investments and product development for Wells Fargo Funds Management, LLC, from 2009 to 2014. | ||
Nancy Wiser1 (Born 1967) | Treasurer, since 2012 | Executive Vice President of Wells Fargo Funds Management, LLC since 2011. Chief Operating Officer and Chief Compliance Officer at LightBox Capital Management LLC, from 2008 to 2011. | ||
Alexander Kymn (Born 1973) | Secretary and Chief Legal Officer, since 2018 | Senior Company Counsel of Wells Fargo Bank, N.A. since 2018 (previously Senior Counsel from 2007 to 2018). Vice President of Wells Fargo Funds Management, LLC from 2008 to 2014. | ||
Michael H. Whitaker (Born 1967) | Chief Compliance Officer, since 2016 | Senior Vice President and Chief Compliance Officer since 2016. Senior Vice President and Chief Compliance Officer for Fidelity Investments from 2007 to 2016. | ||
David Berardi (Born 1975) | Assistant Treasurer, since 2009 | Vice President of Wells Fargo Funds Management, LLC since 2009. Vice President of Evergreen Investment Management Company, LLC from 2008 to 2010. Manager of Fund Reporting and Control for Evergreen Investment Management Company, LLC from 2004 to 2010. | ||
Jeremy DePalma1 (Born 1974) | Assistant Treasurer, since 2009 | Senior Vice President of Wells Fargo Funds Management, LLC since 2009. Senior Vice President of Evergreen Investment Management Company, LLC from 2008 to 2010 and head of the Fund Reporting and Control Team within Fund Administration from 2005 to 2010. | ||
| 1 | Nancy Wiser acts as Treasurer of 65 funds in the Fund Complex. Jeremy DePalma acts as Treasurer of 87 funds and Assistant Treasurer of 65 funds in the Fund Complex. |
| 2 | The Statement of Additional Information includes additional information about the Trustees and is available, without charge, upon request, by calling1-800-222-8222 or by visiting the website atwfam.com. |
28 | Institutional Money Market Funds
Table of Contents
Other information (unaudited)
BOARD CONSIDERATION OF INVESTMENT MANAGEMENT ANDSUB-ADVISORY AGREEMENTS:
Wells Fargo Heritage Money Market Fund
Under the Investment Company Act of 1940 (the “1940 Act”), the Board of Trustees (the “Board”) of Wells Fargo Funds Trust (the “Trust”) must determine annually whether to approve the continuation of the Trust’s investment management andsub-advisory agreements. In this regard, at anin-person meeting held on May21-22, 2019 (the “Meeting”), the Board, all the members of which have no direct or indirect interest in the investment management andsub-advisory agreements and are not “interested persons” of the Trust, as defined in the 1940 Act (the “Independent Trustees”), reviewed and approved for Wells Fargo Heritage Money Market Fund(the “Fund”): (i) an investment management agreement (the “Management Agreement”) with Wells Fargo Funds Management, LLC (“Funds Management”); (ii) an investmentsub-advisory agreement (the “WellsCapSub-Advisory Agreement”) with Wells Capital Management Incorporated (“WellsCap”); and (iii) an investmentsub-advisory agreement (the “WellsCap SingaporeSub-Advisory Agreement,” and together with the WellsCapSub-Advisory Agreement, the“Sub-Advisory Agreements”) with Wells Capital Management Singapore (together with WellsCap, each a“Sub-Adviser” and collectively, the“Sub-Advisers”), each an affiliate of Funds Management. The Management Agreement and theSub-Advisory Agreements are collectively referred to as the “Advisory Agreements.”
At the Meeting, the Board considered the factors and reached the conclusions described below relating to the selection of Funds Management and theSub-Advisers and the approval of the Advisory Agreements. Prior to the Meeting, including at anin-person meeting in April 2019, the Trustees conferred extensively among themselves and with representatives of Funds Management about these matters. Also, the Board has adopted a team-based approach, with each team consisting of asub-set of Trustees, to assist the full Board in the discharge of its duties in reviewing investment performance and other matters throughout the year. The Independent Trustees were assisted in their evaluation of the Advisory Agreements by independent legal counsel, from whom they received separate legal advice and with whom they met separately.
In providing information to the Board, Funds Management and theSub-Advisers were guided by a detailed set of requests for information submitted to them by independent legal counsel on behalf of the Independent Trustees at the start of the Board’s annual contract renewal process earlier in 2019. In considering and approving the Advisory Agreements, the Trustees considered the information they believed relevant, including but not limited to the information discussed below. The Board considered not only the specific information presented in connection with the Meeting, but also the knowledge gained over time through interaction with Funds Management and theSub-Advisers about various topics. In this regard, the Board reviewed reports of Funds Management at each of its quarterly meetings, which included, among other things, portfolio reviews and investment performance reports. In addition, the Board and the teams mentioned above confer with portfolio managers at various times throughout the year. The Board did not identify any particular information or consideration that wasall-important or controlling, and each individual Trustee may have attributed different weights to various factors.
After its deliberations, the Board unanimously approved the continuation of the Advisory Agreements for aone-year term and determined that the compensation payable to Funds Management and theSub-Advisers under each of the Advisory Agreements was reasonable. The Board considered the approval of the Advisory Agreements for the Fund as part of its consideration of agreements for funds across the complex, but its approvals were made on afund-by-fund basis. The following summarizes a number of important, but not necessarily all, factors considered by the Board in support of its approvals.
Nature, extent and quality of services
The Board received and considered various information regarding the nature, extent and quality of services provided to the Fund by Funds Management and theSub-Advisers under the Advisory Agreements. This information included a description of the investment advisory services and Fund-level administrative services covered by the Management Agreement, as well as, among other things, a summary of the background and experience of senior management of Wells Fargo Asset Management (“WFAM”), of which Funds Management and theSub-Advisers are a part, a summary of investments made in the business of WFAM, a summary of certain organizational and personnel changes involving Funds Management and theSub-Advisers, and a description of Funds Management’s and theSub-Advisers’ business continuity planning programs and of their approaches to data privacy and cybersecurity. The Board received and reviewed information about Funds Management’s role as administrator of the Fund’s liquidity risk management program. The Board also considered the qualifications, background, tenure and responsibilities of each of the portfolio managers primarily responsible for theday-to-day portfolio management of the Fund.
The Board evaluated the ability of Funds Management and theSub-Advisers to attract and retain qualified investment professionals, including research, advisory and supervisory personnel. The Board further considered the compliance programs and compliance records of Funds Management and theSub-Advisers. In addition, the Board took into account the full range of services provided to the Fund by Funds Management and its affiliates.
Institutional Money Market Funds | 29
Table of Contents
Other information (unaudited)
Fund investment performance and expenses
The Board considered the investment performance results for the Fund over various time periods ended December 31, 2018. The Board considered these results in comparison to the investment performance of funds in a universe that was determined by Broadridge Inc. (“Broadridge”) to be similar to the Fund (the “Universe”), and in comparison to the Fund’s benchmark index and to other comparative data. Broadridge is an independent provider of investment company data. The Board received a description of the methodology used by Broadridge to select the mutual funds in the performance Universe. The Board noted that the investment performance of the Fund (Administrator Class) was higher than or in range of the average investment performance of the Universe for all periods under review.
The Board also received and considered information regarding the Fund’s net operating expense ratios and their various components, including actual management fees, custodian and othernon-management fees, and Rule12b-1 andnon-Rule12b-1 shareholder service fees. The Board considered these ratios in comparison to the median ratios of funds in class-specific expense groups that were determined by Broadridge to be similar to the Fund (the “Groups”). The Board received a description of the methodology used by Broadridge to select the mutual funds in the expense Groups and an explanation of how funds comprising expense groups and their expense ratios may vary fromyear-to-year. Based on the Broadridge reports, the Board noted that the net operating expense ratios of the Fund were equal to or in range of the median net operating expense ratios of the expense Groups for each share class. The Board noted that the net operating expense ratio caps for the Fund’s Administrator Class would be reduced.
The Board took into account the Fund’s investment performance and expense information provided to it among the factors considered in deciding tore-approve the Advisory Agreements.
Investment management andsub-advisory fee rates
The Board reviewed and considered the contractual fee rates payable by the Fund to Funds Management under the Management Agreement, as well as the contractual fee rates payable by the Fund to Funds Management for class-level administrative services under a Class-Level Administration Agreement, which include, among other things, class-level transfer agency andsub-transfer agency costs (collectively, the “Management Rates”). The Board also reviewed and considered the contractual investmentsub-advisory fee rates that are payable by Funds Management to theSub-Advisers for investmentsub-advisory services.
Among other information reviewed by the Board was a comparison of the Fund’s Management Rates with the average contractual investment management fee rates of funds in the expense Groups at a common asset level as well as transfer agency costs of the funds in the expense Groups. The Board noted that the Management Rates of the Fund were in range of the sum of these average rates for the Fund’s expense Groups for all share classes.
The Board also received and considered information about the portion of the total management fee that was retained by Funds Management after payment of the fees to theSub-Advisers forsub-advisory services. In assessing the reasonableness of this amount, the Board received and evaluated information about the nature and extent of responsibilities retained and risks assumed by Funds Management and not delegated to or assumed by either of theSub-Advisers, and about Funds Management’son-going oversight services. Given the affiliation between Funds Management and theSub-Advisers, the Board ascribed limited relevance to the allocation of fees between them.
Based on its consideration of the factors and information it deemed relevant, including those described here, the Board determined that the compensation payable to Funds Management under the Management Agreement and to theSub-Advisers under theSub-Advisory Agreements was reasonable.
Profitability
The Board received and considered information concerning the profitability of Funds Management, as well as the profitability of both WFAM and Wells Fargo & Co. (“Wells Fargo”) from providing services to the fund family as a whole. The Board noted that theSub-Advisers’ profitability information with respect to providing services to the Fund and other funds in the family was subsumed in the WFAM and Wells Fargo profitability analysis.
Funds Management reported on the methodologies and estimates used in calculating profitability, including a description of the methodology used to allocate certain expenses. Among other things, the Board noted that the levels of profitability reported on afund-by-fund basis varied widely, depending on factors such as the size, type and age of fund. Based on its review, the Board did not deem the profits reported by Funds Management, WFAM or Wells Fargo from services provided to the Fund to be at a level that would prevent it from approving the continuation of the Advisory Agreements.
30 | Institutional Money Market Funds
Table of Contents
Other information (unaudited)
Economies of scale
The Board received and considered information about the potential for Funds Management to experience economies of scale in the provision of management services to the Fund, the difficulties of calculating economies of scale at an individual fund level, and the extent to which potential scale benefits are shared with shareholders. The Board noted the existence of breakpoints in the Fund’s management fee structure, which operate generally to reduce the Fund’s expense ratios as the Fund grows in size. The Board considered that in addition to management fee breakpoints, Funds Management shares potential economies of scale from its management business in a variety of ways, including through fee waiver and expense reimbursement arrangements, services that benefit shareholders, competitive management fee rates set at the outset without regard to breakpoints, and investments in the business intended to enhance services available to shareholders.
The Board concluded that Funds Management’s arrangements with respect to the Fund, including contractual breakpoints, constituted a reasonable approach to sharing potential economies of scale with the Fund and its shareholders.
Other benefits to Funds Management and theSub-Advisers
The Board received and considered information regarding potential“fall-out” or ancillary benefits received by Funds Management and its affiliates, including theSub-Advisers, as a result of their relationships with the Fund. Ancillary benefits could include, among others, benefits directly attributable to other relationships with the Fund and benefits potentially derived from an increase in Funds Management’s and theSub-Advisers’ business as a result of their relationships with the Fund. The Board noted that various affiliates of Funds Management may receive distribution-related fees, shareholder servicing payments andsub-transfer agency fees in respect of shares sold or held through them and services provided.
The Board also reviewed information about soft dollar credits earned and utilized by theSub-Advisers, fees earned by Funds Management and theSub-Advisers from managing a private investment vehicle for the fund family’s securities lending collateral, and commissions earned by an affiliated broker from portfolio transactions.
Based on its consideration of the factors and information it deemed relevant, including those described here, the Board did not find that any ancillary benefits received by Funds Management and its affiliates, including theSub-Advisers, were unreasonable.
Conclusion
At the Meeting, after considering the above-described factors and based on its deliberations and its evaluation of the information described above, the Board unanimously approved the continuation of the Advisory Agreements for aone-year term and determined that the compensation payable to Funds Management and theSub-Advisers under each of the Advisory Agreements was reasonable.
Institutional Money Market Funds | 31
Table of Contents
This page is intentionally left blank.
Table of Contents
For more information
More information about Wells Fargo Funds is available free upon request. To obtain literature, please write, visit the Fund’s website, or call:
Wells Fargo Funds
P.O. Box 219967
Kansas City, MO 64121-9967
Website:wfam.com
Individual investors:1-800-222-8222
Retail investment professionals:1-888-877-9275
Institutional investment professionals:1-866-765-0778

This report and the financial statements contained herein are submitted for the general information of the shareholders of the Fund. If this report is used for promotional purposes, distribution of the report must be accompanied or preceded by a current prospectus. Before investing, please consider the investment objectives, risks, charges, and expenses of the investment. For a current prospectus and, if available, a summary prospectus, containing this information, call1-800-260-5969 or visit the Fund’s website atwfam.com. Read the prospectus carefully before you invest or send money.
Wells Fargo Asset Management (WFAM) is the trade name for certain investment advisory/management firms owned by Wells Fargo & Company. These firms include but are not limited to Wells Capital Management Incorporated and Wells Fargo Funds Management, LLC. Certain products managed by WFAM entities are distributed by Wells Fargo Funds Distributor, LLC (a broker-dealer and Member FINRA).
This material is for general informational and educational purposes only and is NOT intended to provide investment advice or a recommendation of any kind—including a recommendation for any specific investment, strategy, or plan.
INVESTMENT PRODUCTS: NOT FDIC INSURED ◾ NO BANK GUARANTEE ◾ MAY LOSE VALUE
© 2019 Wells Fargo Funds Management, LLC. All rights reserved.
405489 09-19
SA304/SAR304 07-19
Table of Contents

Semi-Annual Report
July 31, 2019
Institutional Money Market Funds
| ∎ | Wells Fargo Municipal Cash Management Money Market Fund |
Beginning on January 1, 2021, as permitted by new regulations adopted by the Securities and Exchange Commission, paper copies of the Wells Fargo Funds’ annual and semi-annual shareholder reports issued after this date will no longer be sent by mail, unless you specifically request paper copies of the reports. Instead, the reports will be made available on the Funds’ website, and you will be notified by mail each time a report is posted and provided with a website address to access the report.
If you already elected to receive shareholder reports electronically, you will not be affected by this change and you need not take any action. You may elect to receive shareholder reports and other communications from the Fund electronically at any time by contacting your financial intermediary (such as a broker-dealer or bank) or, if you are a direct investor, by calling1-800-222-8222 or by enrolling at wellsfargo.com/advantagedelivery.
You may elect to receive all future reports in paper free of charge. If you invest through a financial intermediary, you can contact your financial intermediary to request that you continue to receive paper copies of your shareholder reports; if you invest directly with the Fund, you can call 1-800-222-8222. Your election to receive reports in paper will apply to all Wells Fargo Funds held in your account with your financial intermediary or, if you are a direct investor, to all Wells Fargo Funds that you hold.
Table of Contents
|
Reduce clutter. Save trees. |
Sign up for electronic delivery of prospectuses and shareholder reports atwellsfargo.com/advantagedelivery |
The views expressed and any forward-looking statements are as of July 31, 2019, unless otherwise noted, and are those of the Fund managers and/or Wells Fargo Asset Management. Discussions of individual securities, or the markets generally, or any Wells Fargo Fund are not intended as individual recommendations. Future events or results may vary significantly from those expressed in any forward-looking statements. The views expressed are subject to change at any time in response to changing circumstances in the market. Wells Fargo Asset Management and the Fund disclaim any obligation to publicly update or revise any views expressed or forward-looking statements.
INVESTMENT PRODUCTS: NOT FDIC INSURED ◾ NO BANK GUARANTEE ◾ MAY LOSE VALUE
Institutional Money Market Funds | 1
Table of Contents
Letter to shareholders (unaudited)

Andrew Owen
President
Wells Fargo Funds
Dear Shareholder:
We are pleased to offer you this semi-annual report for the Wells Fargo Municipal Cash Management Money Market Fund for the six-month period that ended July 31, 2019. Global stock and bond investors enjoyed gains that came amid continued concerns about global economic growth, international trade, geopolitical tensions, and bouts of market volatility. These concerns grew more intense as the period closed.
For the period, U.S. stocks, based on the S&P 500 Index,1 gained 11.32% and international stocks, as measured by the MSCI ACWI ex USA Index (Net),2 added 4.34%. The MSCI EM Index (Net)3 inched higher by 0.44%. For bond investors, the Bloomberg Barclays U.S. Aggregate Bond Index4 added 5.23%, the Bloomberg Barclays Global Aggregate ex-USD Index5 added 2.33%, the Bloomberg Barclays Municipal Bond Index6 gained 5.15%, and the ICE BofAML U.S. High Yield Index7 added 5.86%.
Concerns for slowing global growth reemerge during the first quarter of 2019.
After the S&P 500 Index’s best monthly performance in 30 years during January and positive returns for other major indices across major asset classes, signs of slowing global growth grew more ominous in February. The Bureau of Economic Analysis announced fourth-quarter 2018 gross domestic product (GDP) grew at an annualized 2.2% rate, down from the levels of the prior two quarters. In a February report, the Bank of England forecast the slowest growth since the financial crisis for 2019. China and the U.S. continued to wrangle over trade issues.
By the end of March 2019, a combination of dovish U.S. Federal Reserve (Fed) sentiment and steady, if not spectacular, U.S. economic and business metrics reinforced investors’ confidence. Monthly job creation data and corporate profits, while less consistent than during 2018, were solid. China announced a roughly $300 billion stimulus package through tax and fee cuts intended to reinvigorate economic growth. During April 2019, favorable sentiment found additional support in reports of sustained low inflation, solid employment data, and first-quarter U.S. GDP of an annualized rate of 3.2%.
| 1 | The S&P 500 Index consists of 500 stocks chosen for market size, liquidity, and industry group representation. It is a market-value-weighted index with each stock’s weight in the index proportionate to its market value. You cannot invest directly in an index. |
| 2 | The Morgan Stanley Capital International (MSCI) All Country World Index (ACWI) ex USA Index (Net) is a free-float-adjusted market-capitalization weighted index that is designed to measure the equity market performance of developed and emerging markets, excluding the U.S. Source: MSCI. MSCI makes no express or implied warranties or representations and shall have no liability whatsoever with respect to any MSCI data contained herein. The MSCI data may not be further redistributed or used as a basis for other indices or any securities or financial products. This report is not approved, reviewed, or produced by MSCI. You cannot invest directly in an index. |
| 3 | The MSCI Emerging Markets (EM) Index (Net) is a free-float-adjusted market-capitalization-weighted index that is designed to measure the equity market performance of emerging markets. You cannot invest directly in an index. |
| 4 | The Bloomberg Barclays U.S. Aggregate Bond Index is a broad-based benchmark that measures the investment-grade, U.S. dollar-denominated, fixed-rate taxable bond market, including Treasuries, government-related and corporate securities, mortgage-backed securities (agency fixed-rate and hybrid adjustable-rate mortgage pass-throughs), asset-backed securities, and commercial mortgage-backed securities. You cannot invest directly in an index. |
| 5 | The Bloomberg Barclays Global Aggregate ex-USD Index is an unmanaged index that provides a broad-based measure of the global investment-grade fixed-income markets excluding the U.S. dollar-denominated debt market. You cannot invest directly in an index. |
| 6 | The Bloomberg Barclays Municipal Bond Index is an unmanaged index composed of long-term tax-exempt bonds with a minimum credit rating of Baa. You cannot invest directly in an index. |
| 7 | The ICE BofAML U.S. High Yield Index is a market-capitalization-weighted index of domestic and Yankee high-yield bonds. The index tracks the performance of high-yield securities traded in the U.S. bond market. You cannot invest directly in an index. Copyright 2019. ICE Data Indices, LLC. All rights reserved. |
2 | Institutional Money Market Funds
Table of Contents
Letter to shareholders (unaudited)
During May 2019, markets tumbled on mixed investment signals. In the U.S., partisan wrangling ramped up as Democrats and Republicans set their sights on 2020 presidential politics. The U.K.’s Brexit caused Prime Minister Theresa May to resign. The European Commission downgraded the 2019 growth forecast to 1.2%. The U.S. increased tariffs on products from China, China responded, and then talks broke down. President Donald Trump threatened to turn his foreign policy tariff tool to Mexico over immigration issues.
As had been the case during most of 2019 to date, just as the investment horizon appeared to darken, sentiment turned and U.S. equity markets gained during June and July. The gains, primarily driven by geopolitical and monetary policy events, pushed equity markets to new highs.
President Mario Draghi of the European Central Bank said that if the outlook doesn’t improve, the bank will cut rates or buy more assets to prop up inflation. President Trump backed off of tariff threats against Mexico and China. In the U.S., the Fed implemented a 0.25% federal funds rate cut in July 2019.
Later in July 2019, the U.S. reversed course and threatened to impose higher tariffs on China’s exports after talks failed. China responded with tariff threats of its own and devalued the renminbi, a move that roiled global markets. Despite the accommodative approach of central banks, investors continued to have misgivings about the durability of economic growth globally and a pervasively cautious tone influenced the world’s equity and fixed-income markets.
Don’t let short-term uncertainty derail long-term investment goals.
Periods of investment uncertainty can present challenges, but experience has taught us that maintaining long-term investment goals can be an effective way to plan for the future. To help you create a sound strategy based on your personal goals and risk tolerance, Wells Fargo Funds offers more than 100 mutual funds spanning a wide range of asset classes and investment styles. Although diversification cannot guarantee an investment profit or prevent losses, we believe it can be an effective way to manage investment risk and potentially smooth out overall portfolio performance. We encourage investors to know their investments and to understand that appropriate levels of risk-taking may unlock opportunities.
Thank you for choosing to invest with Wells Fargo Funds. We appreciate your confidence in us and remain committed to helping you meet your financial needs.
Sincerely,

Andrew Owen
President
Wells Fargo Funds
“During May 2019, markets tumbled on mixed investment signals.”
“In the U.S., the Fed implemented a 0.25% federal funds rate cut in July 2019.”
|
For further information about your Fund, contact your investment professional, visit our website at wfam.com,or call us directly at1-800-222-8222. |
Institutional Money Market Funds | 3
Table of Contents
Performance highlights (unaudited)
Investment objective
The Fund seeks current income exempt from regular federal income tax, while preserving capital and liquidity.
Manager
Wells Fargo Funds Management, LLC
Subadviser
Wells Capital Management Incorporated
Portfolio managers
James Randazzo
Jeffrey L. Weaver, CFA®‡
Average annual total returns (%) as of July 31, 2019
| Expense ratios1 (%) | ||||||||||||||||||||||
| Inception date | 1 year | 5 year | 10 year | Gross | Net2 | |||||||||||||||||
| Administrator Class (WUCXX)3,4 | 7-9-2010 | 1.44 | 0.62 | 0.34 | 0.43 | 0.30 | ||||||||||||||||
| Institutional Class (EMMXX)4 | 11-20-1996 | 1.53 | 0.69 | 0.39 | 0.31 | 0.20 | ||||||||||||||||
| Service Class (EISXX)4 | 11-25-1996 | 1.29 | 0.52 | 0.27 | 0.60 | 0.45 | ||||||||||||||||
Yield summary (%) as of July 31, 20192
| Administrator Class | Institutional Class | Service Class | ||||||||
| 7-day current yield | 1.30 | 1.40 | 1.15 | |||||||
| 7-day compound yield | 1.30 | 1.41 | 1.15 | |||||||
| 30-day simple yield | 1.22 | 1.32 | 1.07 | |||||||
| 30-day compound yield | 1.23 | 1.33 | 1.08 | |||||||
Figures quoted represent past performance, which is no guarantee of future results, and do not reflect taxes that a shareholder may pay on fund distributions or the redemption of fund shares. Investment returns will fluctuate. The Fund’s yield figures more closely reflect the current earnings of the Fund than the total return figures. Current performance may be lower or higher than the performance data quoted, which assumes the reinvestment of dividends and capital gains. Currentmonth-end performance is available on the Fund’s website,wfam.com.
Each class is sold without afront-end sales charge or contingent deferred sales charge.
For floating NAV money market funds: You could lose money by investing in the Fund. Because the share price of the Fund will fluctuate, when you sell your shares they may be worth more or less than what you originally paid for them. The Fund may impose a fee upon sale of your shares or may temporarily suspend your ability to sell shares if the Fund’s liquidity falls below required minimums because of market conditions or other factors. An investment in the Fund is not insured or guaranteed by the Federal Deposit Insurance Corporation or any other government agency. The Fund’s sponsor has no legal obligation to provide financial support to the Fund, and you should not expect that the sponsor will provide financial support to the Fund at any time.
Please see footnotes on page 5.
4 | Institutional Money Market Funds
Table of Contents
Performance highlights (unaudited)
| Revenue source as of July 31, 20195 |
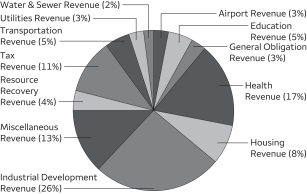 |
| Effective maturity distribution as of July 31, 20195 |
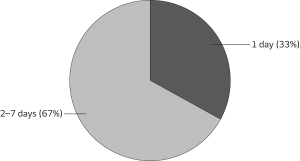 |
| Weighted average maturity as of July 31, 20196 |
5 days |
| Weighted average life as of July 31, 20197 |
5 days |
| ‡ | CFA® and Chartered Financial Analyst® are trademarks owned by CFA Institute. |
| 1 | Reflects the expense ratios as stated in the most recent prospectuses. The expense ratios shown are subject to change and may differ from the annualized expense ratios shown in the financial highlights of this report. |
| 2 | The manager has contractually committed through May 31, 2020, to waive fees and/or reimburse expenses to the extent necessary to cap the expenses of each class after fee waivers at the amounts shown. Brokerage commissions, stamp duty fees, interest, taxes, acquired fund fees and expenses (if any), and extraordinary expenses are excluded from the expense cap. Prior to or after the commitment expiration date, the cap may be increased or the commitment to maintain the cap may be terminated only with the approval of the Board of Trustees. Without this cap, the Fund’s returns would have been lower. Without waived fees and/or reimbursed expenses, the Fund’s7-day current yield would have been 1.17%, 1.29%, and 1.00% for Administrator Class, Institutional Class, and Service Class, respectively. The expense ratio paid by an investor is the net expense ratio (the total annual fund operating expenses after fee waivers) as stated in the prospectuses. |
| 3 | Historical performance shown for Administrator Class shares prior to their inception reflects the performance of Institutional Class shares, and has not been adjusted to include the higher expenses applicable to Administrator Class shares. If these expenses had been included, returns for Administrator Class shares would be lower. |
| 4 | Historical performance shown prior to July 12, 2010, is based on the performance of the Fund’s predecessor, Evergreen Institutional Municipal Money Market Fund. |
| 5 | Amounts are calculated based on the total investments of the Fund. These amounts are subject to change and may have changed since the date specified. |
| 6 | Weighted Average Maturity (WAM): WAM is an average of the effective maturities of all securities held in the portfolio, weighted by each security’s percentage of total investments. The maturity of a portfolio security is the period remaining until the date on which the principal amount is unconditionally required to be paid, or in the case of a security called for redemption, the date on which the redemption payment is unconditionally required to be made. WAM calculations allow for the maturities of certain securities with demand features or periodic interest rate resets to be shortened. WAM is a way to measure a fund’s sensitivity to potential interest rate changes. WAM is subject to change and may have changed since the date specified. |
| 7 | Weighted Average Life (WAL): WAL is an average of the final maturities of all securities held in the portfolio, weighted by their percentage of total investments. The maturity of a portfolio security is the period remaining until the date on which the principal amount is unconditionally required to be paid, or in the case of a security called for redemption, the date on which the redemption payment is unconditionally required to be made. In contrast to WAM, the calculation of WAL allows for the maturities of certain securities with demand features to be shortened, but not the periodic interest rate resets. WAL is a way to measure a fund’s potential sensitivity to credit spread changes. WAL is subject to change and may have changed since the date specified. |
Institutional Money Market Funds | 5
Table of Contents
As a shareholder of the Fund, you incur ongoing costs, including management fees, shareholder servicing fees, and other Fund expenses. This example is intended to help you understand your ongoing costs (in dollars) of investing in the Fund and to compare these costs with the ongoing costs of investing in other mutual funds.
The example is based on an investment of $1,000 invested at the beginning of thesix-month period and held for the entire period from February 1, 2019 to July 31, 2019.
Actual expenses
The “Actual” line of the table below provides information about actual account values and actual expenses. You may use the information in this line, together with the amount you invested, to estimate the expenses that you paid over the period. Simply divide your account value by $1,000 (for example, an $8,600 account value divided by $1,000 = 8.6), then multiply the result by the number in the “Actual” line under the heading entitled “Expenses paid during period” for your applicable class of shares to estimate the expenses you paid on your account during this period.
Hypothetical example for comparison purposes
The “Hypothetical” line of the table below provides information about hypothetical account values and hypothetical expenses based on the Fund’s actual expense ratio and an assumed rate of return of 5% per year before expenses, which is not the Fund’s actual return. The hypothetical account values and expenses may not be used to estimate the actual ending account balance or expenses you paid for the period. You may use this information to compare the ongoing costs of investing in the Fund and other funds. To do so, compare this 5% hypothetical example with the 5% hypothetical examples that appear in the shareholder reports of the other funds.
Please note that the expenses shown in the table are meant to highlight your ongoing costs only. Therefore, the “Hypothetical” line of the table is useful in comparing ongoing costs only and will not help you determine the relative total costs of owning different funds.
| Beginning account value 2-1-2019 | Ending account value 7-31-2019 | Expenses paid during the period¹ | Annualized net expense ratio | |||||||||||||
Administrator Class | ||||||||||||||||
Actual | $ | 1,000.00 | $ | 1,007.47 | $ | 1.49 | 0.30 | % | ||||||||
Hypothetical (5% return before expenses) | $ | 1,000.00 | $ | 1,023.31 | $ | 1.51 | 0.30 | % | ||||||||
Institutional Class | ||||||||||||||||
Actual | $ | 1,000.00 | $ | 1,007.87 | $ | 1.00 | 0.20 | % | ||||||||
Hypothetical (5% return before expenses) | $ | 1,000.00 | $ | 1,023.80 | $ | 1.00 | 0.20 | % | ||||||||
Service Class | ||||||||||||||||
Actual | $ | 1,000.00 | $ | 1,006.62 | $ | 2.24 | 0.45 | % | ||||||||
Hypothetical (5% return before expenses) | $ | 1,000.00 | $ | 1,022.56 | $ | 2.26 | 0.45 | % | ||||||||
| 1 | Expenses paid is equal to the annualized net expense ratio of each class multiplied by the average account value over the period, multiplied by the number of days in the most recent fiscal half-year divided by the number of days in the fiscal year (to reflect theone-half-year period). |
6 | Institutional Money Market Funds
Table of Contents
Portfolio of investments—July 31, 2019 (unaudited)
Interest rate | Maturity date | Principal | Value | |||||||||||||
| Municipal Obligations: 90.65% |
| |||||||||||||||
Alabama: 1.74% |
| |||||||||||||||
| Variable Rate Demand Note ø: 1.74% | ||||||||||||||||
Alabama Tender Option Bond Trust Receipts/Certificates Series 2018-XL0098 (Utilities Revenue, Royal Bank of Canada LIQ) 144A | 1.49 | % | 12-1-2022 | $ | 4,500,000 | $ | 4,500,000 | |||||||||
|
| |||||||||||||||
Arizona: 2.88% |
| |||||||||||||||
| Variable Rate Demand Notes ø: 2.88% | ||||||||||||||||
Maricopa County AZ IDA Solid Waste Disposal Series 2006 (Resource Recovery Revenue, Farm Credit Services of America LOC) | 1.49 | 8-1-2026 | 2,500,000 | 2,500,000 | ||||||||||||
Pinal County AZ IDA Shamrock Farms Project (Resource Recovery Revenue, Farm Credit Services of America LOC) | 1.50 | 8-1-2022 | 3,700,000 | 3,700,000 | ||||||||||||
Pinal County AZ IDA Solid Waste Disposal Feenstra Investments LLC Project Series 2002 (Resource Recovery Revenue, Farm Credit Services of America LOC) | 1.50 | 8-1-2027 | 1,250,000 | 1,250,000 | ||||||||||||
| 7,450,000 | ||||||||||||||||
|
| |||||||||||||||
California: 4.27% |
| |||||||||||||||
| Variable Rate Demand Notes ø: 4.27% | ||||||||||||||||
California PCFA Solid Waste Milk Time Dairy Farms Project (Resource Recovery Revenue, Rabobank LOC) | 1.48 | 11-1-2027 | 1,400,000 | 1,400,000 | ||||||||||||
California Tender Option Bond Trust Receipts/Certificates Series 2018-ZM0642 (Airport Revenue, JPMorgan Chase & Company LIQ) 144A | 1.65 | 5-1-2024 | 4,360,000 | 4,360,000 | ||||||||||||
California Tender Option Bond Trust Receipts/Floater Certificates Series 2017-BAML01 (Transportation Revenue, Bank of America NA LIQ) 144A | 1.40 | 4-1-2047 | 5,000,000 | 5,000,000 | ||||||||||||
Modesto CA MFHR Live Oak Apartments Project (Tax Revenue, FNMA Insured, FNMA LIQ) | 1.32 | 9-15-2024 | 260,000 | 260,000 | ||||||||||||
| 11,020,000 | ||||||||||||||||
|
| |||||||||||||||
Colorado: 0.17% |
| |||||||||||||||
| Variable Rate Demand Note ø: 0.17% | ||||||||||||||||
Town of Hudson CO Series A (Industrial Development Revenue, U.S. Bank NA LOC) | 1.55 | 11-1-2020 | 440,000 | 440,000 | ||||||||||||
|
| |||||||||||||||
Florida: 2.68% |
| |||||||||||||||
| Variable Rate Demand Notes ø: 2.68% | ||||||||||||||||
Florida Tender Option Bond Trust Receipts/Certificates Series 2017-ZM0571 (Health Revenue, Morgan Stanley Bank LIQ) 144A | 1.50 | 8-15-2047 | 500,000 | 500,000 | ||||||||||||
Florida Tender Option Bond Trust Receipts/Floater Certificates Series 2017-XF2517 (Health Revenue, Morgan Stanley Bank LIQ) 144A | 1.50 | 8-15-2047 | 6,420,000 | 6,420,000 | ||||||||||||
| 6,920,000 | ||||||||||||||||
|
| |||||||||||||||
Illinois: 5.81% |
| |||||||||||||||
| Variable Rate Demand Notes ø: 5.81% | ||||||||||||||||
Chicago IL Enterprise Zone Gardner Gibson Project (Industrial Development Revenue, BMO Harris Bank NA LOC) | 1.54 | 7-1-2033 | 1,780,000 | 1,780,000 | ||||||||||||
Illinois Tender Option Bond Trust Receipts/Certificates Series 2019-XF0779 (Tax Revenue, Build America Mutual Assurance Company Insured, TD Bank NA LIQ) 144A | 1.48 | 1-1-2048 | 4,000,000 | 4,000,000 | ||||||||||||
The accompanying notes are an integral part of these financial statements.
Institutional Money Market Funds | 7
Table of Contents
Portfolio of investments—July 31, 2019 (unaudited)
Interest rate | Maturity date | Principal | Value | |||||||||||||
| Variable Rate Demand Notes ø (continued) | ||||||||||||||||
Lake County IL Multi-Family Housing (Housing Revenue, FHLMC LIQ) | 1.52 | % | 11-1-2034 | $ | 4,920,000 | $ | 4,920,000 | |||||||||
Peoria County IL Caterpillar Incorporated Project (Industrial Development Revenue, Caterpillar Incorporated LOC) | 1.55 | 2-1-2030 | 4,300,000 | 4,300,000 | ||||||||||||
| 15,000,000 | ||||||||||||||||
|
| |||||||||||||||
Indiana: 5.76% |
| |||||||||||||||
| Variable Rate Demand Notes ø: 5.76% | ||||||||||||||||
Indiana Certificate of Participation ClipperTax-Exempt Certificate Trust Series2009-34 (Miscellaneous Revenue, State Street Bank & Trust Company LIQ) | 1.44 | 7-1-2023 | 1,380,000 | 1,380,000 | ||||||||||||
Indiana Finance Authority Duke Energy Indiana Incorporated Series2009A-4 (Industrial Development Revenue, Sumitomo Mitsui Banking LOC) | 1.48 | 12-1-2039 | 6,455,000 | 6,455,000 | ||||||||||||
Indiana Tender Option Bond Trust Receipts/Certificates Series 2019-XF0756 (Miscellaneous Revenue, Bank of America NA LIQ) 144A | 1.48 | 2-1-2049 | 1,875,000 | 1,875,000 | ||||||||||||
Jeffersonville IN Economic Development Eagle Steel Products Incorporated Project (Industrial Development Revenue, Bank of America NA LOC) | 1.66 | 12-1-2027 | 2,785,000 | 2,785,000 | ||||||||||||
Noblesville IN Greystone Apartments Project Series B (Housing Revenue, FHLB LOC) | 1.46 | 3-1-2041 | 1,375,000 | 1,375,000 | ||||||||||||
St. Joseph County IN Midcorr Land Development LLC Project (Industrial Development Revenue, PNC Bank NA LOC) | 1.43 | 10-1-2023 | 1,020,000 | 1,020,000 | ||||||||||||
| 14,890,000 | ||||||||||||||||
|
| |||||||||||||||
Iowa: 3.24% |
| |||||||||||||||
| Variable Rate Demand Notes ø: 3.24% | ||||||||||||||||
Iowa Finance Authority John Maassen & Sons Project (Industrial Development Revenue, Farm Credit Services of America LOC) | 1.49 | 11-1-2035 | 2,075,000 | 2,075,000 | ||||||||||||
Iowa Finance Authority Midwestern Disaster Area Project (Industrial Development Revenue, Korea Development Bank LOC) | 1.93 | 4-1-2022 | 6,300,000 | 6,300,000 | ||||||||||||
| 8,375,000 | ||||||||||||||||
|
| |||||||||||||||
Kansas: 0.24% |
| |||||||||||||||
| Variable Rate Demand Note ø: 0.24% | ||||||||||||||||
Nemaha County KS Midwest AG Services LLC Project (Industrial Development Revenue, CoBank ACB LOC) | 1.55 | 11-1-2020 | 610,000 | 610,000 | ||||||||||||
|
| |||||||||||||||
Kentucky: 2.59% |
| |||||||||||||||
| Variable Rate Demand Notes ø: 2.59% | ||||||||||||||||
Jefferson County KY Industrial Building Dant Growth LLC Project Series 2002 (Industrial Development Revenue, Stock Yards Bank & Trust LOC) | 1.43 | 9-1-2022 | 1,000,000 | 1,000,000 | ||||||||||||
Louisville & Jefferson Counties KY Regional Airport Authority UPS Worldwide Forwarding Series B (Industrial Development Revenue, Suntrust Bank LOC) | 1.54 | 1-1-2029 | 5,700,000 | 5,700,000 | ||||||||||||
| 6,700,000 | ||||||||||||||||
|
| |||||||||||||||
Louisiana: 2.71% |
| |||||||||||||||
| Variable Rate Demand Notes ø: 2.71% | ||||||||||||||||
Louisiana Local Government Environmental Facilities CDA Honeywell International Incorporated Project (Industrial Development Revenue, Honeywell International Incorporated LOC) | 1.54 | 12-1-2036 | 4,000,000 | 4,000,000 | ||||||||||||
Tender Option Bond Trust Receipts/Floater Certificates Series 2019-XM0735 (Water & Sewer Revenue, Bank of America NA LOC, Bank of America NA LIQ) 144A | 1.45 | 12-1-2045 | 3,000,000 | 3,000,000 | ||||||||||||
| 7,000,000 | ||||||||||||||||
|
| |||||||||||||||
The accompanying notes are an integral part of these financial statements.
8 | Institutional Money Market Funds
Table of Contents
Portfolio of investments—July 31, 2019 (unaudited)
Interest rate | Maturity date | Principal | Value | |||||||||||||
Michigan: 2.26% |
| |||||||||||||||
| Variable Rate Demand Note ø: 2.26% | ||||||||||||||||
Michigan Tender Option Bond Trust Receipts/Certificates Series 2018-ZM0614 (Education Revenue, Morgan Stanley Bank LIQ) 144A | 1.58 | % | 11-1-2028 | $ | 5,835,000 | $ | 5,835,000 | |||||||||
|
| |||||||||||||||
Minnesota: 3.05% |
| |||||||||||||||
| Variable Rate Demand Notes ø: 3.05% | ||||||||||||||||
Forest Lake MN Kilkenny Court Apartments Project Series 2008 (Housing Revenue, FNMA LOC, FNMA LIQ) | 1.49 | 8-15-2038 | 750,000 | 750,000 | ||||||||||||
Minnesota Tender Option Bond Trust Receipts/Certificates Series 2018-XF2760 (Education Revenue, Morgan Stanley Bank LIQ) 144A | 1.50 | 11-1-2037 | 7,140,000 | 7,140,000 | ||||||||||||
| 7,890,000 | ||||||||||||||||
|
| |||||||||||||||
Mississippi: 2.32% |
| |||||||||||||||
| Variable Rate Demand Note ø: 2.32% | ||||||||||||||||
Mississippi Business Finance Commission Gulf Opportunity Zone Chevron USA Incorporated Project Series A (Industrial Development Revenue, U.S. Bank NA LOC) | 1.48 | 12-1-2030 | 6,000,000 | 6,000,000 | ||||||||||||
|
| |||||||||||||||
Missouri: 3.90% |
| |||||||||||||||
| Variable Rate Demand Notes ø: 3.90% | ||||||||||||||||
Missouri Development Finance Board Kauffman Center For The Performing Arts Series A (Miscellaneous Revenue, PNC Bank NA SPA) | 1.51 | 6-1-2037 | 7,000,000 | 7,000,000 | ||||||||||||
Missouri Tender Option Bond Trust Receipts/Certificates Series 2018-XG0176 (Health Revenue, Royal Bank of Canada LIQ) 144A | 1.50 | 5-15-2041 | 1,895,000 | 1,895,000 | ||||||||||||
St. Charles County MO IDA Kuenz Heating & Sheet Metal Series 2001 (Industrial Development Revenue, U.S. Bank NA LOC) | 1.62 | 4-1-2026 | 1,170,000 | 1,170,000 | ||||||||||||
| 10,065,000 | ||||||||||||||||
|
| |||||||||||||||
Nevada: 1.29% |
| |||||||||||||||
| Variable Rate Demand Note ø: 1.29% | ||||||||||||||||
Nevada Tender Option Bond Trust Receipts/Certificates Series 2018-ZM0634 (GO Revenue, Royal Bank of Canada LIQ) 144A | 1.43 | 12-1-2025 | 3,330,000 | 3,330,000 | ||||||||||||
|
| |||||||||||||||
New Jersey: 2.49% |
| |||||||||||||||
| Variable Rate Demand Note ø: 2.49% | ||||||||||||||||
New Jersey Tender Option Bond Trust Receipts/Certificates Series 2016-XM0226 (Miscellaneous Revenue, BHAC/National Insured, Bank of America NA LIQ) 144A | 1.40 | 7-1-2026 | 6,430,000 | 6,430,000 | ||||||||||||
|
| |||||||||||||||
New York: 7.98% |
| |||||||||||||||
| Variable Rate Demand Notes ø: 7.98% | ||||||||||||||||
Metropolitan Transportation Authority Revenue Bond SubordinatedSeries 2012A-2 (Transportation Revenue, Bank of Montreal LOC) | 1.53 | 11-15-2041 | 2,000,000 | 2,000,000 | ||||||||||||
New York Battery Park City Authority Refunding Bond Series2013-C JPMorgan Chase PUTTER/DRIVER Trust Series 5012 (Miscellaneous Revenue, JPMorgan Chase & Company LOC, JPMorgan Chase & Company LIQ) 144A | 1.53 | 11-1-2019 | 6,400,000 | 6,400,000 | ||||||||||||
New York NY Housing Development Corporation Series A (Housing Revenue, Citibank NA LOC) | 1.47 | 6-1-2037 | 350,000 | 350,000 | ||||||||||||
New York NY Transitional Finance Authority Future Tax SecuredTax-Exempt Bond Fiscal 2015 Subordinate Bonds SeriesA-3 (Tax Revenue, Mizuho Bank Limited SPA) | 1.51 | 8-1-2043 | 6,890,000 | 6,890,000 | ||||||||||||
The accompanying notes are an integral part of these financial statements.
Institutional Money Market Funds | 9
Table of Contents
Portfolio of investments—July 31, 2019 (unaudited)
Interest rate | Maturity date | Principal | Value | |||||||||||||
| Variable Rate Demand Notes ø (continued) | ||||||||||||||||
Triborough Bridge and Tunnel Authority Series2005B-3 (Transportation Revenue, State Street Bank & Trust Company LOC) | 1.45 | % | 1-1-2032 | $ | 4,980,000 | $ | 4,980,000 | |||||||||
| 20,620,000 | ||||||||||||||||
|
| |||||||||||||||
North Carolina: 3.99% |
| |||||||||||||||
| Variable Rate Demand Notes ø: 3.99% | ||||||||||||||||
Charlotte-Mecklenburg NC Hospital Authority Series 2007C (Health Revenue, JPMorgan Chase & Company SPA) | 1.47 | 1-15-2037 | 5,100,000 | 5,100,000 | ||||||||||||
North Carolina Tender Option Bond Trust Receipts/Certificates Series 2017-ZF2490 (Airport Revenue, Barclays Bank plc LIQ) 144A | 1.43 | 7-1-2042 | 3,750,000 | 3,750,000 | ||||||||||||
Rockingham County NC Industrial Facilities & PCFA Innofa USA Project Series 2007 (Industrial Development Revenue, Branch Banking & Trust LOC) | 1.45 | 1-1-2027 | 1,450,000 | 1,450,000 | ||||||||||||
| 10,300,000 | ||||||||||||||||
|
| |||||||||||||||
North Dakota: 0.28% |
| |||||||||||||||
| Variable Rate Demand Note ø: 0.28% | ||||||||||||||||
Mandan ND IDA Cloverdale Foods Company Project (Industrial Development Revenue, BNC National Bank LOC) | 1.67 | 12-1-2022 | 715,000 | 715,000 | ||||||||||||
|
| |||||||||||||||
Ohio: 2.40% |
| |||||||||||||||
| Variable Rate Demand Notes ø: 2.40% | ||||||||||||||||
Ohio Capital Facilities Lease Adult Correctional Building Fund Series C (Miscellaneous Revenue) | 1.49 | 10-1-2036 | 4,200,000 | 4,200,000 | ||||||||||||
RBC Municipal Products Incorporated Trust SeriesE-110 (Water & Sewer Revenue, Royal Bank of Canada LOC, Royal Bank of Canada LIQ) 144A | 1.43 | 10-1-2020 | 2,000,000 | 2,000,000 | ||||||||||||
| 6,200,000 | ||||||||||||||||
|
| |||||||||||||||
Oregon: 0.12% |
| |||||||||||||||
| Variable Rate Demand Note ø: 0.12% | ||||||||||||||||
Portland International Airport Series18-A (Airport Revenue, Bank of China LOC) | 1.47 | 7-1-2026 | 300,000 | 300,000 | ||||||||||||
|
| |||||||||||||||
Other: 0.82% |
| |||||||||||||||
| Variable Rate Demand Note ø: 0.82% | ||||||||||||||||
FHLMC MFHR SeriesM-031 Class A (Housing Revenue, FHLMC LIQ) | 1.43 | 12-15-2045 | 2,110,000 | 2,110,000 | ||||||||||||
|
| |||||||||||||||
Pennsylvania: 6.74% |
| |||||||||||||||
| Variable Rate Demand Notes ø: 6.74% | ||||||||||||||||
Allegheny County PA Hospital Development Authority Series E (Health Revenue, Royal Bank of Canada LOC, Royal Bank of Canada LIQ) 144A | 1.50 | 4-1-2022 | 7,820,000 | 7,820,000 | ||||||||||||
Pennsylvania EDFA SeriesD-7 (Industrial Development Revenue, PNC Bank NA LOC) | 1.43 | 8-1-2022 | 400,000 | 400,000 | ||||||||||||
Philadelphia PA Gas Works Revenue Refunding Bond Series 8 (Utilities Revenue, Barclays Bank plc LOC) | 1.42 | 8-1-2031 | 1,200,000 | 1,200,000 | ||||||||||||
South Central General Authority WellSpan Health Obliged Group Revenue Bond Series 2019E (Health Revenue, U.S. Bank NA SPA) | 1.47 | 6-1-2035 | 8,000,000 | 8,000,000 | ||||||||||||
| 17,420,000 | ||||||||||||||||
|
| |||||||||||||||
The accompanying notes are an integral part of these financial statements.
10 | Institutional Money Market Funds
Table of Contents
Portfolio of investments—July 31, 2019 (unaudited)
Interest rate | Maturity date | Principal | Value | |||||||||||||
South Carolina: 3.48% |
| |||||||||||||||
| Variable Rate Demand Notes ø: 3.48% | ||||||||||||||||
South Carolina Jobs EDA Prisma Health Obligated Group Series 2018B (Health Revenue, U.S. Bank NA LOC) | 1.48 | % | 5-1-2048 | $ | 7,000,000 | $ | 7,000,000 | |||||||||
South Carolina Tender Option Bond Trust Receipts/Floater Certificates Patriots Energy Group Financing Agency Series 2018-XM0690 (Utilities Revenue, Royal Bank of Canada LIQ) 144A | 1.44 | 10-1-2022 | 2,000,000 | 2,000,000 | ||||||||||||
| 9,000,000 | ||||||||||||||||
|
| |||||||||||||||
Tennessee: 2.32% |
| |||||||||||||||
| Variable Rate Demand Note ø: 2.32% | ||||||||||||||||
Shelby County TN Health Educational & Housing Facilities Board Methodist Le Bonheur Series B (Health Revenue, AGM Insured, U.S. Bank NA SPA) | 1.49 | 6-1-2042 | 6,000,000 | 6,000,000 | ||||||||||||
|
| |||||||||||||||
Texas: 3.65% |
| |||||||||||||||
| Variable Rate Demand Notes ø: 3.65% | ||||||||||||||||
Brazos Harbor TX Industrial Development Corporation (Industrial Development Revenue, BASF SE LOC) | 1.52 | 10-1-2036 | 5,000,000 | 5,000,000 | ||||||||||||
Dallam County TX Industrial Development Corporation Dalhart Jersey Ranch Incorporated Series 2008 (Resource Recovery Revenue, CoBank ACB LOC) | 1.50 | 8-1-2039 | 1,430,000 | 1,430,000 | ||||||||||||
Port Arthur TX Navigation District Jefferson County Total Petrochemicals USA Incorporated Project Series2003-C (Industrial Development Revenue, Total SA LOC) | 1.47 | 4-1-2027 | 3,000,000 | 3,000,000 | ||||||||||||
| 9,430,000 | ||||||||||||||||
|
| |||||||||||||||
Virginia: 0.62% |
| |||||||||||||||
| Variable Rate Demand Notes ø: 0.62% | ||||||||||||||||
Chesterfield County VA IDA Super Radiator Coils Project Series A (Industrial Development Revenue, BMO Harris Bank NA LOC) | 1.47 | 4-1-2026 | 1,000,000 | 1,000,000 | ||||||||||||
Virginia Public Building Authority Public Facilities Refunding Bonds Series 2015B (Housing Revenue, Bank of NY Mellon LOC) | 5.00 | 8-1-2019 | 600,000 | 600,000 | ||||||||||||
| 1,600,000 | ||||||||||||||||
|
| |||||||||||||||
Washington: 3.26% |
| |||||||||||||||
| Variable Rate Demand Notes ø: 3.26% | ||||||||||||||||
King County WA Multi-Modal Limited Refunding Bond (GO Revenue, TD Bank NA SPA) | 1.47 | 1-1-2046 | 5,000,000 | 5,000,000 | ||||||||||||
Washington Finance Authority Smith Brothers Farms Incorporated Series 2001 (Industrial Development Revenue, Northwest Farm Credit LOC) | 1.50 | 9-1-2021 | 2,520,000 | 2,520,000 | ||||||||||||
Yakima County WA Solid Waste Disposal George Deruyter & Son Project Series 2006 (Resource Recovery Revenue, Northwest Farm Credit LOC) | 1.50 | 8-1-2026 | 900,000 | 900,000 | ||||||||||||
| 8,420,000 | ||||||||||||||||
|
| |||||||||||||||
West Virginia: 1.05% |
| |||||||||||||||
| Variable Rate Demand Note ø: 1.05% | ||||||||||||||||
West Virginia EDA Collins Hardwood Company LLC (Industrial Development Revenue, American AgCredit LOC) | 1.50 | 10-1-2031 | 2,700,000 | 2,700,000 | ||||||||||||
|
| |||||||||||||||
The accompanying notes are an integral part of these financial statements.
Institutional Money Market Funds | 11
Table of Contents
Portfolio of investments—July 31, 2019 (unaudited)
Interest rate | Maturity date | Principal | Value | |||||||||||||
Wisconsin: 6.54% |
| |||||||||||||||
| Variable Rate Demand Notes ø: 6.54% | ||||||||||||||||
Appleton WI Recovery Zone Facilities Foremost Farms Project Series 2010 (Industrial Development Revenue, CoBank ACB LOC) | 1.43 | % | 5-1-2037 | $ | 6,000,000 | $ | 6,000,000 | |||||||||
Manitowoc WI CDA Regency House Project (Housing Revenue, Bank First National LOC) | 1.62 | 11-1-2020 | 955,000 | 955,000 | ||||||||||||
Sheboygan WI Vortex Liquid Color Project (Industrial Development Revenue, Bank First National LOC) | 1.62 | 11-1-2020 | 550,000 | 550,000 | ||||||||||||
Wisconsin GO Series 2019A (GO Revenue) | 1.54 | 5-1-2029 | 500,000 | 500,000 | ||||||||||||
Wisconsin Tender Option Bond Trust Receipts/Certificates Series 2019-XF2821 (Housing Revenue, Mizuho Bank Limited LOC) 144A | 1.50 | 1-1-2026 | 3,860,000 | 3,860,000 | ||||||||||||
Wisconsin Tender Option Bond Trust Receipts/Certificates Series 2019-F2823 (Housing Revenue, U.S. Bank N.A. LOC) 144A | 1.50 | 1-1-2026 | 5,015,000 | 5,015,000 | ||||||||||||
| 16,880,000 | ||||||||||||||||
|
| |||||||||||||||
Total Municipal Obligations (Cost $234,150,000) |
| 234,150,000 | ||||||||||||||
|
| |||||||||||||||
| Shares | ||||||||||||||||
| Closed End Municipal Bond Funds: 8.40% | ||||||||||||||||
| California: 1.16% | ||||||||||||||||
Nuveen California Dividend Advantage Municipal Fund Variable Rate Demand Preferred Shares Series 3 (Deutsche Bank LIQ) 1.37% 144Aø | 3,000,000 | 3,000,000 | ||||||||||||||
| 3,000,000 | ||||||||||||||||
|
| |||||||||||||||
| Other: 7.24% | ||||||||||||||||
BlackRock MuniYield Quality Fund III Incorporated Variable Rate Demand Preferred Shares (Citibank NA LOC) 1.43% ø | 5,000,000 | 5,000,000 | ||||||||||||||
Nuveen Quality Municipal Income Fund Variable Rate Demand Preferred Shares Series 1-2118 (Barclays Bank LIQ) 1.43% 144Aø | 5,000,000 | 5,000,000 | ||||||||||||||
Western Asset Intermediate Municipal Fund Incorporated Variable Rate Demand Preferred Shares Series 1 (Citibank NA LIQ) 1.43% 144Aø | 5,000,000 | 5,000,000 | ||||||||||||||
Western Asset Municipal Partners Incorporated Variable Rate Demand Preferred Shares Series 1 (Citibank NA LIQ) 1.43% 144Aø | 3,700,000 | 3,700,000 | ||||||||||||||
| 18,700,000 | ||||||||||||||||
|
| |||||||||||||||
Total Closed End Municipal Bond Funds (Cost $21,700,000) |
| 21,700,000 | ||||||||||||||
|
| |||||||||||||||
| Principal | ||||||||||||||||
| Repurchase Agreements: 0.85% | ||||||||||||||||
Barclays Capital Incorporated, dated7-31-2019, maturity value $2,200,155 ^^ | 2.54 | 8-1-2019 | $ | 2,200,000 | 2,200,000 | |||||||||||
|
| |||||||||||||||
Total Repurchase Agreements (Cost $2,200,000) |
| 2,200,000 | ||||||||||||||
|
| |||||||||||||||
| Total investments in securities (Cost $258,050,000) | 99.90 | % | 258,050,000 | |||||
Other assets and liabilities, net | 0.10 | 270,401 | ||||||
|
|
|
| |||||
| Total net assets | 100.00 | % | $ | 258,320,401 | ||||
|
|
|
| |||||
| ø | Variable rate demand notes are subject to a demand feature which reduces the effective maturity. The maturity date shown represents the final maturity date of the security. The interest rate is determined and reset by the issuer daily, weekly, or monthly depending upon the terms of the security. The rate shown is the rate in effect at period end. |
| 144A | The security may be resold in transactions exempt from registration, normally to qualified institutional buyers, pursuant to Rule 144A under the Securities Act of 1933. |
| ^^ | Collateralized by U.S. government securities, 1.63% to 1.75%,6-30-2021 to7-15-2022, fair value including accrued interest is $2,244,000. |
The accompanying notes are an integral part of these financial statements.
12 | Institutional Money Market Funds
Table of Contents
Portfolio of investments—July 31, 2019 (unaudited)
Abbreviations:
| AGM | Assured Guaranty Municipal |
| BHAC | Berkshire Hathaway Assurance Corporation |
| CDA | Community Development Authority |
| DRIVER | Derivative inversetax-exempt receipts |
| EDA | Economic Development Authority |
| EDFA | Economic Development Finance Authority |
| FHLB | Federal Home Loan Bank |
| FHLMC | Federal Home Loan Mortgage Corporation |
| FNMA | Federal National Mortgage Association |
| GO | General obligation |
| IDA | Industrial Development Authority |
| LIQ | Liquidity agreement |
| LOC | Letter of credit |
| MFHR | Multifamily housing revenue |
| National | National Public Finance Guarantee Corporation |
| PCFA | Pollution Control Financing Authority |
| PUTTER | Puttabletax-exempt receipts |
| SPA | Standby purchase agreement |
The accompanying notes are an integral part of these financial statements.
Institutional Money Market Funds | 13
Table of Contents
Statement of assets and liabilities—July 31, 2019 (unaudited)
Assets | ||||
Investments in unaffiliated securities, at value (cost $258,050,000) | $ | 258,050,000 | ||
Cash | 206,971 | |||
Receivable for investments sold | 155,000 | |||
Receivable for interest | 533,355 | |||
Prepaid expenses and other assets | 27,131 | |||
|
| |||
Total assets | 258,972,457 | |||
|
| |||
Liabilities | ||||
Payable for investments purchased | 500,000 | |||
Shareholder report expenses payable | 77,585 | |||
Administration fees payable | 18,492 | |||
Management fee payable | 7,807 | |||
Payable for Fund shares redeemed | 5,497 | |||
Dividends payable | 3,926 | |||
Trustees’ fees and expenses payable | 2,320 | |||
Accrued expenses and other liabilities | 36,429 | |||
|
| |||
Total liabilities | 652,056 | |||
|
| |||
Total net assets | $ | 258,320,401 | ||
|
| |||
Net assets consist of | ||||
Paid-in capital | $ | 258,322,825 | ||
Total distributable loss | (2,424 | ) | ||
|
| |||
Total net assets | $ | 258,320,401 | ||
|
| |||
Computation of net asset value per share | ||||
Net assets – Administrator Class | $ | 6,359,524 | ||
Shares outstanding – Administrator Class1 | 6,355,607 | |||
Net asset value per share – Administrator Class | $1.0006 | |||
Net assets – Institutional Class | $ | 235,670,831 | ||
Shares outstanding – Institutional Class1 | 235,519,484 | |||
Net asset value per share – Institutional Class | $1.0006 | |||
Net assets – Service Class | $ | 16,290,046 | ||
Shares outstanding – Service Class1 | 16,279,774 | |||
Net asset value per share – Service Class | $1.0006 | |||
| 1 | The Fund has an unlimited number of authorized shares. |
The accompanying notes are an integral part of these financial statements.
14 | Institutional Money Market Funds
Table of Contents
Statement of operations—six months ended July 31, 2019 (unaudited)
Investment income | ||||
Interest | $ | 2,461,655 | ||
|
| |||
Expenses | ||||
Management fee | 210,811 | |||
Administration fees |
| |||
Administrator Class | 3,141 | |||
Institutional Class | 103,308 | |||
Service Class | 9,919 | |||
Shareholder servicing fees |
| |||
Administrator Class | 3,141 | |||
Service Class | 20,664 | |||
Custody and accounting fees | 16,060 | |||
Professional fees | 19,397 | |||
Registration fees | 39,326 | |||
Shareholder report expenses | 6,996 | |||
Trustees’ fees and expenses | 13,557 | |||
Other fees and expenses | 11,372 | |||
|
| |||
Total expenses | 457,692 | |||
Less: Fee waivers and/or expense reimbursements | (152,805 | ) | ||
|
| |||
Net expenses | 304,887 | |||
|
| |||
Net investment income | 2,156,768 | |||
Net realized gains on investments | 70,979 | |||
|
| |||
Net increase in net assets resulting from operations | $ | 2,227,747 | ||
|
| |||
The accompanying notes are an integral part of these financial statements.
Institutional Money Market Funds | 15
Table of Contents
Statement of changes in net assets
Six months ended (unaudited) | Year ended January 31, 2019 | |||||||||||||||
Operations | ||||||||||||||||
Net investment income | $ | 2,156,768 | $ | 3,272,934 | ||||||||||||
Net realized gains on investments | 70,979 | 1,837 | ||||||||||||||
|
| |||||||||||||||
Net increase in net assets resulting from operations | 2,227,747 | 3,274,771 | ||||||||||||||
|
| |||||||||||||||
Distributions to shareholders from net investment income and net realized gains | ||||||||||||||||
Administrator Class | (45,282 | ) | (72,091 | ) | ||||||||||||
Institutional Class | (2,004,748 | ) | (3,175,949 | ) | ||||||||||||
Service Class | (106,738 | ) | (225,713 | ) | ||||||||||||
|
| |||||||||||||||
Total distributions to shareholders | (2,156,768 | ) | (3,473,753 | ) | ||||||||||||
|
| |||||||||||||||
Capital share transactions | Shares | Shares | ||||||||||||||
Proceeds from shares sold | ||||||||||||||||
Administrator Class | 0 | 0 | 2,997,003 | 3,000,000 | ||||||||||||
Institutional Class | 2,591,449,010 | 2,592,937,066 | 4,687,583,592 | 4,692,370,298 | ||||||||||||
Service Class | 2,719,047 | 2,720,568 | 11,577,879 | 11,587,521 | ||||||||||||
|
| |||||||||||||||
| 2,595,657,634 | 4,706,957,819 | |||||||||||||||
|
| |||||||||||||||
Reinvestment of distributions | ||||||||||||||||
Administrator Class | 44,536 | 44,561 | 70,709 | 70,768 | ||||||||||||
Institutional Class | 2,003,338 | 2,004,533 | 3,163,888 | 3,166,888 | ||||||||||||
Service Class | 80,133 | 80,179 | 161,224 | 161,362 | ||||||||||||
|
| |||||||||||||||
| 2,129,273 | 3,399,018 | |||||||||||||||
|
| |||||||||||||||
Payment for shares redeemed | ||||||||||||||||
Institutional Class | (2,523,891,813 | ) | (2,525,359,371 | ) | (4,860,642,244 | ) | (4,865,545,794 | ) | ||||||||
Service Class | (5,514,144 | ) | (5,516,957 | ) | (12,079,625 | ) | (12,089,936 | ) | ||||||||
|
| |||||||||||||||
| (2,530,876,328 | ) | (4,877,635,730 | ) | |||||||||||||
|
| |||||||||||||||
Net increase (decrease) in net assets resulting from capital share transactions | 66,910,579 | (167,278,893 | ) | |||||||||||||
|
| |||||||||||||||
Total increase (decrease) in net assets | 66,981,558 | (167,477,875 | ) | |||||||||||||
|
| |||||||||||||||
Net assets | ||||||||||||||||
Beginning of period | 191,338,843 | 358,816,718 | ||||||||||||||
|
| |||||||||||||||
End of period | $ | 258,320,401 | $ | 191,338,843 | ||||||||||||
|
| |||||||||||||||
The accompanying notes are an integral part of these financial statements.
16 | Institutional Money Market Funds
Table of Contents
(For a share outstanding throughout each period)
| Six months ended July 31, 2019 (unaudited) | Year ended January 31 | |||||||||||||||||||||||
| ADMINISTRATOR CLASS | 2019 | 2018 | 2017 | 20161 | 20151 | |||||||||||||||||||
Net asset value, beginning of period | $1.0003 | $1.0010 | $1.0005 | $1.0000 | $1.00 | $1.00 | ||||||||||||||||||
Net investment income | 0.0072 | 0.0125 | 0.0069 | 0.0031 | 0.00 | 2 | 0.00 | 2 | ||||||||||||||||
Net realized and unrealized gains (losses) on investments | 0.0003 | (0.0001 | ) | 0.0005 | 0.0008 | 0.00 | 2 | 0.00 | 2 | |||||||||||||||
|
|
|
|
|
|
|
|
|
|
|
| |||||||||||||
Total from investment operations | 0.0075 | 0.0124 | 0.0074 | 0.0039 | 0.00 | 2 | 0.00 | 2 | ||||||||||||||||
Distributions to shareholders from | ||||||||||||||||||||||||
Net investment income | (0.0072 | ) | (0.0124 | ) | (0.0069 | ) | (0.0030 | ) | (0.00 | )2 | (0.00 | )2 | ||||||||||||
Net realized gains | 0.0000 | (0.0007 | ) | (0.0000 | )3 | (0.0004 | ) | (0.00 | )2 | (0.00 | )2 | |||||||||||||
|
|
|
|
|
|
|
|
|
|
|
| |||||||||||||
Total distributions to shareholders | (0.0072 | ) | (0.0131 | ) | (0.0069 | ) | (0.0034 | ) | (0.00 | )2 | (0.00 | )2 | ||||||||||||
Net asset value, end of period | $1.0006 | $1.0003 | $1.0010 | $1.0005 | $1.00 | $1.00 | ||||||||||||||||||
Total return4 | 0.75 | % | 1.25 | % | 0.74 | % | 0.35 | % | 0.02 | % | 0.02 | % | ||||||||||||
Ratios to average net assets (annualized) | ||||||||||||||||||||||||
Gross expenses | 0.43 | % | 0.44 | % | 0.41 | % | 0.39 | % | 0.37 | % | 0.37 | % | ||||||||||||
Net expenses | 0.30 | % | 0.30 | % | 0.30 | % | 0.27 | % | 0.10 | % | 0.11 | % | ||||||||||||
Net investment income | 1.44 | % | 1.25 | % | 0.68 | % | 0.29 | % | 0.01 | % | 0.01 | % | ||||||||||||
Supplemental data | ||||||||||||||||||||||||
Net assets, end of period (000s omitted) | $6,360 | $6,313 | $3,247 | $3,223 | $3,537 | $3,536 | ||||||||||||||||||
| 1 | Amounts reflect the Fund transacting shares at a fixed NAV rounded to two decimal places. Beginning October 11, 2016, the Fund began selling and redeeming shares of the Fund at a floating NAV rounded to the fourth decimal place. |
| 2 | Amount is less than $0.005. |
| 3 | Amount is less than $0.00005. |
| 4 | Returns for periods of less than one year are not annualized. |
The accompanying notes are an integral part of these financial statements.
Institutional Money Market Funds | 17
Table of Contents
Financial highlights
(For a share outstanding throughout each period)
| Six months ended July 31, 2019 (unaudited) | Year ended January 31 | |||||||||||||||||||||||
| INSTITUTIONAL CLASS | 2019 | 2018 | 2017 | 20161 | 20151 | |||||||||||||||||||
Net asset value, beginning of period | $1.0004 | $1.0011 | $1.0005 | $1.0000 | $1.00 | $1.00 | ||||||||||||||||||
Net investment income | 0.0077 | 2 | 0.0133 | 2 | 0.0080 | 0.0035 | 0.00 | 3 | 0.00 | 3 | ||||||||||||||
Net realized and unrealized gains (losses) on investments | 0.0002 | 0.0001 | 0.0005 | 0.0012 | 0.00 | 3 | 0.00 | 3 | ||||||||||||||||
|
|
|
|
|
|
|
|
|
|
|
| |||||||||||||
Total from investment operations | 0.0079 | 0.0134 | 0.0085 | 0.0047 | 0.00 | 3 | 0.00 | 3 | ||||||||||||||||
Distributions to shareholders from | ||||||||||||||||||||||||
Net investment income | (0.0077 | ) | (0.0134 | ) | (0.0079 | ) | (0.0038 | ) | (0.00 | )3 | (0.00 | )3 | ||||||||||||
Net realized gains | 0.0000 | (0.0007 | ) | (0.0000 | )4 | (0.0004 | ) | (0.00 | )3 | (0.00 | )3 | |||||||||||||
|
|
|
|
|
|
|
|
|
|
|
| |||||||||||||
Total distributions to shareholders | (0.0077 | ) | (0.0141 | ) | (0.0079 | ) | (0.0042 | ) | (0.00 | )3 | (0.00 | )3 | ||||||||||||
Net asset value, end of period | $1.0006 | $1.0004 | $1.0011 | $1.0005 | $1.00 | $1.00 | ||||||||||||||||||
Total return5 | 0.79 | % | 1.35 | % | 0.85 | % | 0.44 | % | 0.02 | % | 0.02 | % | ||||||||||||
Ratios to average net assets (annualized) | ||||||||||||||||||||||||
Gross expenses | 0.31 | % | 0.31 | % | 0.29 | % | 0.26 | % | 0.25 | % | 0.25 | % | ||||||||||||
Net expenses | 0.20 | % | 0.20 | % | 0.20 | % | 0.18 | % | 0.10 | % | 0.11 | % | ||||||||||||
Net investment income | 1.55 | % | 1.32 | % | 0.79 | % | 0.27 | % | 0.01 | % | 0.01 | % | ||||||||||||
Supplemental data | ||||||||||||||||||||||||
Net assets, end of period (000s omitted) | $235,671 | $166,024 | $336,215 | $262,511 | $953,036 | $1,008,667 | ||||||||||||||||||
| 1 | Amounts reflect the Fund transacting shares at a fixed NAV rounded to two decimal places. Beginning October 11, 2016, the Fund began selling and redeeming shares of the Fund at a floating NAV rounded to the fourth decimal place. |
| 2 | Calculated based upon average shares outstanding |
| 3 | Amount is less than $0.005. |
| 4 | Amount is less than $0.00005. |
| 5 | Returns for periods of less than one year are not annualized. |
The accompanying notes are an integral part of these financial statements.
18 | Institutional Money Market Funds
Table of Contents
Financial highlights
(For a share outstanding throughout each period)
| Six months ended July 31, 2019 (unaudited) | Year ended January 31 | |||||||||||||||||||||||
| SERVICE CLASS | 2019 | 2018 | 2017 | 20161 | 20151 | |||||||||||||||||||
Net asset value, beginning of period | $1.0004 | $1.0010 | $1.0005 | $1.0000 | $1.00 | $1.00 | ||||||||||||||||||
Net investment income | 0.0064 | 2 | 0.0109 | 2 | 0.0059 | 0.0037 | 0.00 | 3 | 0.00 | 3 | ||||||||||||||
Net realized and unrealized gains (losses) on investments | 0.0002 | 0.0001 | 0.0000 | 4 | (0.0010 | ) | 0.00 | 3 | 0.00 | 3 | ||||||||||||||
|
|
|
|
|
|
|
|
|
|
|
| |||||||||||||
Total from investment operations | 0.0066 | 0.0110 | 0.0059 | 0.0027 | 0.00 | 3 | 0.00 | 3 | ||||||||||||||||
Distributions to shareholders from | ||||||||||||||||||||||||
Net investment income | (0.0064 | ) | (0.0109 | ) | (0.0054 | ) | (0.0018 | ) | (0.00 | )3 | (0.00 | )3 | ||||||||||||
Net realized gains | 0.0000 | (0.0007 | ) | (0.0000 | )4 | (0.0004 | ) | (0.00 | )3 | (0.00 | )3 | |||||||||||||
|
|
|
|
|
|
|
|
|
|
|
| |||||||||||||
Total distributions to shareholders | (0.0064 | ) | (0.0116 | ) | (0.0054 | ) | (0.0022 | ) | (0.00 | )3 | (0.00 | )3 | ||||||||||||
Net asset value, end of period | $1.0006 | $1.0004 | $1.0010 | $1.0005 | $1.00 | $1.00 | ||||||||||||||||||
Total return5 | 0.66 | % | 1.11 | % | 0.59 | % | 0.23 | % | 0.02 | % | 0.02 | % | ||||||||||||
Ratios to average net assets (annualized) | ||||||||||||||||||||||||
Gross expenses | 0.60 | % | 0.61 | % | 0.58 | % | 0.49 | % | 0.48 | % | 0.47 | % | ||||||||||||
Net expenses | 0.45 | % | 0.45 | % | 0.45 | % | 0.35 | % | 0.10 | % | 0.11 | % | ||||||||||||
Net investment income | 1.29 | % | 1.09 | % | 0.53 | % | 0.09 | % | 0.01 | % | 0.01 | % | ||||||||||||
Supplemental data | ||||||||||||||||||||||||
Net assets, end of period (000s omitted) | $16,290 | $19,001 | $19,355 | $23,962 | $108,484 | $140,465 | ||||||||||||||||||
| 1 | Amounts reflect the Fund transacting shares at a fixed NAV rounded to two decimal places. Beginning October 11, 2016, the Fund began selling and redeeming shares of the Fund at a floating NAV rounded to the fourth decimal place. |
| 2 | Calculated based upon average shares outstanding |
| 3 | Amount is less than $0.005. |
| 4 | Amount is less than $0.00005. |
| 5 | Returns for periods of less than one year are not annualized. |
The accompanying notes are an integral part of these financial statements.
Institutional Money Market Funds | 19
Table of Contents
Notes to financial statements (unaudited)
1. ORGANIZATION
Wells Fargo Funds Trust (the “Trust”), a Delaware statutory trust organized on March 10, 1999, is anopen-end management investment company registered under the Investment Company Act of 1940, as amended (the “1940 Act”). As an investment company, the Trust follows the accounting and reporting guidance in Financial Accounting Standards Board (“FASB”)Accounting Standards Codification Topic 946, Financial Services – Investment Companies. These financial statements report on the Wells Fargo Municipal Cash Management Money Market Fund (the “Fund”) which is a diversified series of the Trust.
The Fund operates as an institutionalnon-government money market fund. As an institutionalnon-government money market fund, shareholders will transact at a floating net asset value (NAV) rounded to four decimal places in accordance with the valuation policies below.
2. SIGNIFICANT ACCOUNTING POLICIES
The following significant accounting policies, which are consistently followed in the preparation of the financial statements of the Fund, are in conformity with U.S. generally accepted accounting principles which require management to make estimates and assumptions that affect the reported amounts of assets and liabilities, disclosure of contingent assets and liabilities at the date of the financial statements, and the reported amounts of revenues and expenses during the reporting period. Actual results could differ from those estimates.
Securities valuation
Debt securities are valued at the evaluated bid price provided by an independent pricing service (e.g. taking into account various factors, including yields, maturities, or credit ratings) or, if a reliable price is not available, the quoted bid price from an independent broker-dealer.
Investments which are not valued using any of the methods discussed above are valued at their fair value, as determined in good faith by the Board of Trustees of the Fund. The Board of Trustees has established a Valuation Committee comprised of the Trustees and has delegated to it the authority to take any actions regarding the valuation of portfolio securities that the Valuation Committee deems necessary or appropriate, including determining the fair value of portfolio securities, unless the determination has been delegated to the Wells Fargo Asset Management Pricing Committee at Wells Fargo Funds Management, LLC (“Funds Management”). The Board of Trustees retains the authority to make or ratify any valuation decisions or approve any changes to the Valuation Procedures as it deems appropriate. On a quarterly basis, the Board of Trustees receives reports on any valuation actions taken by the Valuation Committee or the Wells Fargo Asset Management Pricing Committee which may include items for ratification.
Repurchase agreements
The Fund may invest in repurchase agreements and may participate in pooled repurchase agreement transactions with other funds advised by Funds Management. Repurchase agreements are agreements where the seller of a security to the Fund agrees to repurchase that security from the Fund at a mutually agreed upon time and price. The repurchase agreements must be fully collateralized based on values that aremarked-to-market daily. The collateral may be held by an agent bank under atri-party agreement. It is the custodian’s responsibility to value collateral daily and to take action to obtain additional collateral as necessary to maintain a market value equal to or greater than the resale price. The repurchase agreements are collateralized by securities issued or guaranteed by the U.S. Government, its agencies or instrumentalities. There could be potential loss to the Fund in the event that the Fund is delayed or prevented from exercising its rights to dispose of the collateral, including the risk of a possible decline in the value of the underlying obligations during the period in which the Fund seeks to assert its rights.
Security transactions and income recognition
Securities transactions are recorded on a trade date basis. Realized gains or losses are recorded on the basis of identified cost.
Interest income is accrued daily and bond discounts are accreted and premiums are amortized daily. To the extent debt obligations are placed onnon-accrual status, any related interest income may be reduced by writing off interest receivables when the collection of all or a portion of interest has been determined to be doubtful based on consistently applied procedures and the fair value has decreased. If the issuer subsequently resumes interest payments or when the collectability of interest is reasonably assured, the debt obligation is removed fromnon-accrual status.
Distributions to shareholders
Distributions to shareholders from net investment income are declared daily and paid monthly. Distributions from net realized gains, if any, are recorded on theex-dividend date and paid at least annually. Such distributions are determined in accordance with income tax regulations and may differ from U.S. generally accepted accounting principles. Dividend sources are estimated
20 | Institutional Money Market Funds
Table of Contents
Notes to financial statements (unaudited)
at the time of declaration. The tax character of distributions is determined as of the Fund’s fiscal year end. Therefore, a portion of the Fund’s distributions made prior to the Fund’s fiscal year end may be categorized as a tax return of capital at year end.
Federal and other taxes
The Fund intends to continue to qualify as a regulated investment company by distributing substantially all of its investment company taxable andtax-exempt income and any net realized capital gains (after reduction for capital loss carryforwards) sufficient to relieve it from all, or substantially all, federal income taxes. Accordingly, no provision for federal income taxes was required.
The Fund’s income and federal excise tax returns and all financial records supporting those returns for the prior three fiscal years are subject to examination by the federal and Delaware revenue authorities. Management has analyzed the Fund’s tax positions taken on federal, state, and foreign tax returns for all open tax years and does not believe that there are any uncertain tax positions that require recognition of a tax liability.
As of July 31, 2019, the aggregate cost of all investments for federal income tax purposes was $258,050,000 and the unrealized gains (losses) consisted of:
Gross unrealized gains | $ | 0 | ||
Gross unrealized losses | 0 | |||
Net unrealized gains | $ | 0 | ||
Class allocations
The separate classes of shares offered by the Fund differ principally in shareholder servicing and administration fees. Class specific expenses are charged directly to that share class. Investment income, common fund-level expenses, and realized and unrealized gains (losses) on investments are allocated daily to each class of shares based on the relative proportion of net assets of each class.
3. FAIR VALUATION MEASUREMENTS
Fair value measurements of investments are determined within a framework that has established a fair value hierarchy based upon the various data inputs utilized in determining the value of the Fund’s investments. The three-level hierarchy gives the highest priority to unadjusted quoted prices in active markets for identical assets or liabilities (Level 1) and the lowest priority to unobservable inputs (Level 3). The Fund’s investments are classified within the fair value hierarchy based on the lowest level of input that is significant to the fair value measurement. The inputs are summarized into three broad levels as follows:
| ∎ | Level 1 – quoted prices in active markets for identical securities |
| ∎ | Level 2 – other significant observable inputs (including quoted prices for similar securities, interest rates, prepayment speeds, credit risk, etc.) |
| ∎ | Level 3 – significant unobservable inputs (including the Fund’s own assumptions in determining the fair value of investments) |
The inputs or methodologies used for valuing investments in securities are not necessarily an indication of the risk associated with investing in those securities.
The following is a summary of the inputs used in valuing the Fund’s assets and liabilities as of July 31, 2019:
| Quoted prices (Level 1) | Other significant observable inputs (Level 2) | Significant (Level 3) | Total | |||||||||||||
Assets | ||||||||||||||||
Investments in: | ||||||||||||||||
Municipal obligations | $ | 0 | $ | 234,150,000 | $ | 0 | $ | 234,150,000 | ||||||||
Closed end municipal bond funds | 0 | 21,700,000 | 0 | 21,700,000 | ||||||||||||
Repurchase agreements | 0 | 2,200,000 | 0 | 2,200,000 | ||||||||||||
Total assets | $ | 0 | $ | 258,050,000 | $ | 0 | $ | 258,050,000 | ||||||||
Additional sector, industry or geographic detail is included in the Portfolio of Investments.
For the six months ended July 31, 2019, the Fund did not have any transfers into/out of Level 3.
Institutional Money Market Funds | 21
Table of Contents
Notes to financial statements (unaudited)
4. TRANSACTIONS WITH AFFILIATES
Management fee
Funds Management, an indirect wholly owned subsidiary of Wells Fargo & Company (“Wells Fargo”), is the manager of the Fund and provides advisory and fund-level administrative services under an investment management agreement. Under the investment management agreement, Funds Management is responsible for, among other services, implementing the investment objectives and strategies of the Fund, supervising the subadviser and providing fund-level administrative services in connection with the Fund’s operations. As compensation for its services under the investment management agreement, Funds Management is entitled to receive a management fee at the following annual rate based on the Fund’s average daily net assets:
| Average daily net assets | Management fee | |||
First $5 billion | 0.15 | % | ||
Next $5 billion | 0.14 | |||
Over $10 billion | 0.13 | |||
For the six months ended July 31, 2019, the management fee was equivalent to an annual rate of 0.15% of the Fund’s average daily net assets.
Funds Management has retained the services of a subadviser to provide daily portfolio management to the Fund. The fee for subadvisory services is borne by Funds Management. Wells Capital Management Incorporated, an affiliate of Funds Management and an indirect wholly owned subsidiary of Wells Fargo, is the subadviser to the Fund and is entitled to receive a fee from Funds Management at an annual rate starting at 0.05% and declining to 0.01% as the average daily net assets of the Fund increase.
Administration fees
Under a class-level administration agreement, Funds Management provides class-level administrative services to the Fund, which includes paying fees and expenses for services provided by the transfer agent,sub-transfer agents, omnibus account servicers and record-keepers. As compensation for its services under the class-level administration agreement, Funds Management receives an annual fee which is calculated based on the average daily net assets of each class as follows:
| Class-level administration fee | ||||
Administrator Class | 0.10 | % | ||
Institutional Class | 0.08 | |||
Service Class | 0.12 | |||
Waivers and/or expense reimbursements
Funds Management has contractually waived and/or reimbursed management and administration fees to the extent necessary to maintain certain net operating expense ratios for the Fund. When each class of the Fund has exceeded its expense cap, Funds Management has waived fees and/or reimbursed expenses from fund-level expenses on a proportionate basis and then from class specific expenses. When only certain classes exceed their expense caps, waivers and/or reimbursements are applied against class specific expenses before fund-level expenses. Funds Management has committed through May 31, 2020 to waive fees and/or reimburse expenses to the extent necessary to cap the Fund’s expenses at 0.30% for Administrator Class shares, 0.20% for Institutional Class shares, and 0.45% for Servicer Class shares. Prior to or after the commitment expiration date, the cap may be increased or the commitment to maintain the cap may be terminated only with the approval of the Board of Trustees.
Shareholder servicing fees
The Trust has entered into contracts with one or more shareholder servicing agents. Administrator Class and Service Class of the Fund are charged a fee at an annual rate of 0.10% and 0.25%, respectively, of their average daily net assets. A portion of these total shareholder servicing fees were paid to affiliates of Wells Fargo.
Interfund transactions
The Fund may purchase or sell portfolio investment securities to certain other Wells Fargo affiliates pursuant to Rule17a-7 under the 1940 Act and under procedures adopted by the Board of Trustees. The procedures have been designed to ensure that these interfund transactions, which do not incur broker commissions, are effected at current market prices.
22 | Institutional Money Market Funds
Table of Contents
Notes to financial statements (unaudited)
5. INDEMNIFICATION
Under the Trust’s organizational documents, the officers and Trustees have been granted certain indemnification rights against certain liabilities that may arise out of performance of their duties to the Trust. Additionally, in the normal course of business, the Trust may enter into contracts with service providers that contain a variety of indemnification clauses. The Trust’s maximum exposure under these arrangements is dependent on future claims that may be made against the Fund and, therefore, cannot be estimated.
6. NEW ACCOUNTING PRONOUNCEMENTS
In August 2018, FASB issued Accounting Standards Update (“ASU”)No. 2018-13, Fair Value Measurement (Topic 820)Disclosure Framework—Changes to the Disclosure Requirements for Fair Value Measurement. ASU2018-13 updates the disclosure requirements for fair value measurements by modifying or removing certain disclosures and adding certain new disclosures. The amendments are effective for fiscal years, and interim periods within those fiscal years, beginning after December 15, 2019. Early adoption is permitted. Management has adopted the removal and modification of disclosures early, as permitted, and will adopt the additional new disclosures at the effective date.
In March 2017, FASB issued ASUNo. 2017-08,Premium Amortization on Purchased Callable Debt Securities. ASU2017-08 shortens the amortization period for certain callable debt securities held at a premium and requires the premium to be amortized to the earliest call date. The amendments do not require an accounting change for securities held at a discount and discounts will continue to be accreted to the maturity date of the security. ASU2017-08 is effective for fiscal years beginning after December 15, 2018 and for interim periods within those fiscal years. During the current reporting period, management of the Fund adopted the change in accounting policy which did not have a material impact to the Fund’s financial statements.
Institutional Money Market Funds | 23
Table of Contents
PROXY VOTING INFORMATION
A description of the policies and procedures used to determine how to vote proxies relating to portfolio securities is available, upon request, by calling1-800-222-8222, visiting our website atwfam.com, or visiting the SEC website at sec.gov. Information regarding how the proxies related to portfolio securities were voted during the most recent12-month period ended June 30 is available on the website atwfam.comor by visiting the SEC website at sec.gov.
24 | Institutional Money Market Funds
Table of Contents
Other information (unaudited)
BOARD OF TRUSTEES AND OFFICERS
Each of the Trustees and Officers1 listed in the table below acts in identical capacities for each fund in the Wells Fargo family of funds, which consists of 152 mutual funds comprising the Wells Fargo Funds Trust, Wells Fargo Variable Trust, Wells Fargo Master Trust and fourclosed-end funds (collectively the “Fund Complex”). This table should be read in conjunction with the Prospectus and the Statement of Additional Information2. The mailing address of each Trustee and Officer is 525 Market Street, 12th Floor, San Francisco, CA 94105. Each Trustee and Officer serves an indefinite term, however, each Trustee serves such term until reaching the mandatory retirement age established by the Trustees.
Independent Trustees
Name and year of birth | Position held and length of service* | Principal occupations during past five years or longer | Current other public company or investment company directorships | |||
William R. Ebsworth (Born 1957) | Trustee, since 2015 | Retired. From 1984 to 2013, equities analyst, portfolio manager, research director and chief investment officer at Fidelity Management and Research Company in Boston, Tokyo, and Hong Kong, and retired in 2013 as Chief Investment Officer of Fidelity Strategic Advisers, Inc. where he led a team of investment professionals managing client assets. Prior thereto, Board member of Hong Kong Securities Clearing Co., Hong Kong Options Clearing Corp., the Thailand International Fund, Ltd., Fidelity Investments Life Insurance Company, and Empire Fidelity Investments Life Insurance Company. Audit Committee Chair and Investment Committee Chair of the Vincent Memorial Hospital Endowment(non-profit organization). Mr. Ebsworth is a CFA® charterholder. | N/A | |||
Jane A. Freeman (Born 1953) | Trustee, since 2015; Chair Liaison, since 2018 | Retired. From 2012 to 2014 and 1999 to 2008, Chief Financial Officer of Scientific Learning Corporation. From 2008 to 2012, Ms. Freeman provided consulting services related to strategic business projects. Prior to 1999, Portfolio Manager at Rockefeller & Co. and Scudder, Stevens & Clark. Board member of the Harding Loevner Funds from 1996 to 2014, serving as both Lead Independent Director and chair of the Audit Committee. Board member of the Russell Exchange Traded Funds Trust from 2011 to 2012 and the chair of the Audit Committee. Ms. Freeman is a Board Member of The Ruth Bancroft Garden(non-profit organization). She is also an inactive Chartered Financial Analyst. | N/A | |||
Isaiah Harris, Jr. (Born 1952) | Trustee, since 2009; Audit Committee Chairman, since 2019 | Retired. Chairman of the Board of CIGNA Corporation since 2009, and Director since 2005. From 2003 to 2011, Director of Deluxe Corporation. Prior thereto, President and CEO of BellSouth Advertising and Publishing Corp. from 2005 to 2007, President and CEO of BellSouth Enterprises from 2004 to 2005 and President of BellSouth Consumer Services from 2000 to 2003. Emeritus member of the Iowa State University Foundation Board of Governors. Emeritus Member of the Advisory Board of Iowa State University School of Business. Advisory Board Member, Palm Harbor Academy (private school). Advisory Board Member, Child Evangelism Fellowship(non-profit). Mr. Harris is a certified public accountant (inactive status). | CIGNA Corporation | |||
Judith M. Johnson (Born 1949) | Trustee, since 2008; Audit Committee Chairman, from 2009 to 2018 | Retired. Prior thereto, Chief Executive Officer and Chief Investment Officer of Minneapolis Employees Retirement Fund from 1996 to 2008. Ms. Johnson is an attorney, certified public accountant and a certified managerial accountant. | N/A | |||
Institutional Money Market Funds | 25
Table of Contents
Other information (unaudited)
Name and year of birth | Position held and length of service* | Principal occupations during past five years or longer | Current other public company or investment company directorships | |||
David F. Larcker (Born 1950) | Trustee, since 2009 | James Irvin Miller Professor of Accounting at the Graduate School of Business, Stanford University, Director of the Corporate Governance Research Initiative and Senior Faculty of The Rock Center for Corporate Governance since 2006. From 2005 to 2008, Professor of Accounting at the Graduate School of Business, Stanford University. Prior thereto, Ernst & Young Professor of Accounting at The Wharton School, University of Pennsylvania from 1985 to 2005. | N/A | |||
Olivia S. Mitchell (Born 1953) | Trustee, since 2006; Nominating and Governance Committee Chairman, since 2018 | International Foundation of Employee Benefit Plans Professor, Wharton School of the University of Pennsylvania since 1993. Director of Wharton’s Pension Research Council and Boettner Center on Pensions & Retirement Research, and Research Associate at the National Bureau of Economic Research. Previously, Cornell University Professor from 1978 to 1993. | N/A | |||
Timothy J. Penny (Born 1951) | Trustee, since 1996; Chairman, since 2018 | President and Chief Executive Officer of Southern Minnesota Initiative Foundation, anon-profit organization, since 2007. Member of the Board of Trustees of NorthStar Education Finance, Inc., anon-profit organization, since 2007. | N/A | |||
James G. Polisson (Born 1959) | Trustee, since 2018 | Retired. Chief Marketing Officer, Source (ETF) UK Services, Ltd, from 2015 to 2017. From 2012 to 2015, Principal of The Polisson Group, LLC, a management consulting, corporate advisory and principal investing company. Chief Executive Officer and Managing Director at Russell Investments, Global Exchange Traded Funds from 2010 to 2012. Managing Director of Barclays Global Investors from 1998 to 2010 and Global Chief Marketing Officer for iShares and Barclays Global Investors from 2000 to 2010. Trustee of the San Francisco Mechanics’ Institute, anon-profit organization, from 2013 to 2015. Board member of the Russell Exchange Traded Fund Trust from 2011 to 2012. Director of Barclays Global Investors Holdings Deutschland GmbH from 2006 to 2009. Mr. Polisson is an attorney and has a retired status with the Massachusetts and District of Columbia Bar Associations. | N/A | |||
| * | Length of service dates reflect the Trustee’s commencement of service with the Trust’s predecessor entities, where applicable. |
26 | Institutional Money Market Funds
Table of Contents
Other information (unaudited)
Officers
Name and year of birth | Position held and length of service | Principal occupations during past five years or longer | ||
Andrew Owen (Born 1960) | President, since 2017 | Executive Vice President of Wells Fargo & Company and Head of Affiliated Managers, Wells Fargo Asset Management, since 2014. In addition, Mr. Owen is currently President, Chief Executive Officer and Director of Wells Fargo Funds Management, LLC since 2017. Prior thereto, Executive Vice President responsible for marketing, investments and product development for Wells Fargo Funds Management, LLC, from 2009 to 2014. | ||
Nancy Wiser1 (Born 1967) | Treasurer, since 2012 | Executive Vice President of Wells Fargo Funds Management, LLC since 2011. Chief Operating Officer and Chief Compliance Officer at LightBox Capital Management LLC, from 2008 to 2011. | ||
Alexander Kymn (Born 1973) | Secretary and Chief Legal Officer, since 2018 | Senior Company Counsel of Wells Fargo Bank, N.A. since 2018 (previously Senior Counsel from 2007 to 2018). Vice President of Wells Fargo Funds Management, LLC from 2008 to 2014. | ||
Michael H. Whitaker (Born 1967) | Chief Compliance Officer, since 2016 | Senior Vice President and Chief Compliance Officer since 2016. Senior Vice President and Chief Compliance Officer for Fidelity Investments from 2007 to 2016. | ||
David Berardi (Born 1975) | Assistant Treasurer, since 2009 | Vice President of Wells Fargo Funds Management, LLC since 2009. Vice President of Evergreen Investment Management Company, LLC from 2008 to 2010. Manager of Fund Reporting and Control for Evergreen Investment Management Company, LLC from 2004 to 2010. | ||
Jeremy DePalma1 (Born 1974) | Assistant Treasurer, since 2009 | Senior Vice President of Wells Fargo Funds Management, LLC since 2009. Senior Vice President of Evergreen Investment Management Company, LLC from 2008 to 2010 and head of the Fund Reporting and Control Team within Fund Administration from 2005 to 2010. | ||
| 1 | Nancy Wiser acts as Treasurer of 65 funds in the Fund Complex. Jeremy DePalma acts as Treasurer of 87 funds and Assistant Treasurer of 65 funds in the Fund Complex. |
| 2 | The Statement of Additional Information includes additional information about the Trustees and is available, without charge, upon request, by calling1-800-222-8222 or by visiting the website atwfam.com. |
Institutional Money Market Funds | 27
Table of Contents
Other information (unaudited)
BOARD CONSIDERATION OF INVESTMENT MANAGEMENT ANDSUB-ADVISORY AGREEMENTS:
Wells Fargo Municipal Cash Management Money Market Fund
Under the Investment Company Act of 1940 (the “1940 Act”), the Board of Trustees (the “Board”) of Wells Fargo Funds Trust (the “Trust”) must determine annually whether to approve the continuation of the Trust’s investment management andsub-advisory agreements. In this regard, at anin-person meeting held on May21-22, 2019 (the “Meeting”), the Board, all the members of which have no direct or indirect interest in the investment management andsub-advisory agreements and are not “interested persons” of the Trust, as defined in the 1940 Act (the “Independent Trustees”), reviewed and approved for Wells Fargo Municipal Cash Management Money Market Fund(the “Fund”): (i) an investment management agreement (the “Management Agreement”) with Wells Fargo Funds Management, LLC (“Funds Management”); and (ii) an investmentsub-advisory agreement (the“Sub-Advisory Agreement”) with Wells Capital Management Incorporated (the“Sub-Adviser”), an affiliate of Funds Management. The Management Agreement and theSub-Advisory Agreement are collectively referred to as the “Advisory Agreements.”
At the Meeting, the Board considered the factors and reached the conclusions described below relating to the selection of Funds Management and theSub-Adviser and the approval of the Advisory Agreements. Prior to the Meeting, including at anin-person meeting in April 2019, the Trustees conferred extensively among themselves and with representatives of Funds Management about these matters. Also, the Board has adopted a team-based approach, with each team consisting of asub-set of Trustees, to assist the full Board in the discharge of its duties in reviewing investment performance and other matters throughout the year. The Independent Trustees were assisted in their evaluation of the Advisory Agreements by independent legal counsel, from whom they received separate legal advice and with whom they met separately.
In providing information to the Board, Funds Management and theSub-Adviser were guided by a detailed set of requests for information submitted to them by independent legal counsel on behalf of the Independent Trustees at the start of the Board’s annual contract renewal process earlier in 2019. In considering and approving the Advisory Agreements, the Trustees considered the information they believed relevant, including but not limited to the information discussed below. The Board considered not only the specific information presented in connection with the Meeting, but also the knowledge gained over time through interaction with Funds Management and theSub-Adviser about various topics. In this regard, the Board reviewed reports of Funds Management at each of its quarterly meetings, which included, among other things, portfolio reviews and investment performance reports. In addition, the Board and the teams mentioned above confer with portfolio managers at various times throughout the year. The Board did not identify any particular information or consideration that wasall-important or controlling, and each individual Trustee may have attributed different weights to various factors.
After its deliberations, the Board unanimously approved the continuation of the Advisory Agreements for aone-year term and determined that the compensation payable to Funds Management and theSub-Adviser under each of the Advisory Agreements was reasonable. The Board considered the approval of the Advisory Agreements for the Fund as part of its consideration of agreements for funds across the complex, but its approvals were made on afund-by-fund basis. The following summarizes a number of important, but not necessarily all, factors considered by the Board in support of its approvals.
Nature, extent and quality of services
The Board received and considered various information regarding the nature, extent and quality of services provided to the Fund by Funds Management and theSub-Adviser under the Advisory Agreements. This information included a description of the investment advisory services and Fund-level administrative services covered by the Management Agreement, as well as, among other things, a summary of the background and experience of senior management of Wells Fargo Asset Management (“WFAM”), of which Funds Management and theSub-Adviser are a part, a summary of investments made in the business of WFAM, a summary of certain organizational and personnel changes involving Funds Management and theSub-Adviser, and a description of Funds Management’s and theSub-Adviser’s business continuity planning programs and of their approaches to data privacy and cybersecurity. The Board received and reviewed information about Funds Management’s role as administrator of the Fund’s liquidity risk management program. The Board also considered the qualifications, background, tenure and responsibilities of each of the portfolio managers primarily responsible for theday-to-day portfolio management of the Fund.
The Board evaluated the ability of Funds Management and theSub-Adviser to attract and retain qualified investment professionals, including research, advisory and supervisory personnel. The Board further considered the compliance programs and compliance records of Funds Management and theSub-Adviser. In addition, the Board took into account the full range of services provided to the Fund by Funds Management and its affiliates.
28 | Institutional Money Market Funds
Table of Contents
Other information (unaudited)
Fund investment performance and expenses
The Board considered the investment performance results for the Fund over various time periods ended December 31, 2018. The Board considered these results in comparison to the investment performance of funds in a universe that was determined by Broadridge Inc. (“Broadridge”) to be similar to the Fund (the “Universe”), and in comparison to the Fund’s benchmark index and to other comparative data. Broadridge is an independent provider of investment company data. The Board received a description of the methodology used by Broadridge to select the mutual funds in the performance Universe. The Board noted that the investment performance of the Fund (Institutional Class) was higher than the average investment performance of the Universe for all periods under review.
The Board also received and considered information regarding the Fund’s net operating expense ratios and their various components, including actual management fees, custodian and othernon-management fees, and Rule12b-1 andnon-Rule12b-1 shareholder service fees. The Board considered these ratios in comparison to the median ratios of funds in class-specific expense groups that were determined by Broadridge to be similar to the Fund (the “Groups”). The Board received a description of the methodology used by Broadridge to select the mutual funds in the expense Groups and an explanation of how funds comprising expense groups and their expense ratios may vary fromyear-to-year. Based on the Broadridge reports, the Board noted that the net operating expense ratios of the Fund were equal to or in range of the median net operating expense ratios of the expense Groups for each share class.
The Board took into account the Fund’s investment performance and expense information provided to it among the factors considered in deciding tore-approve the Advisory Agreements.
Investment management andsub-advisory fee rates
The Board reviewed and considered the contractual fee rates payable by the Fund to Funds Management under the Management Agreement, as well as the contractual fee rates payable by the Fund to Funds Management for class-level administrative services under a Class-Level Administration Agreement, which include, among other things, class-level transfer agency andsub-transfer agency costs (collectively, the “Management Rates”). The Board also reviewed and considered the contractual investmentsub-advisory fee rates that are payable by Funds Management to theSub-Adviser for investmentsub-advisory services.
Among other information reviewed by the Board was a comparison of the Fund’s Management Rates with the average contractual investment management fee rates of funds in the expense Groups at a common asset level as well as transfer agency costs of the funds in the expense Groups. The Board noted that the Management Rates of the Fund were lower than or equal to the sum of these average rates for the Fund’s expense Groups for all share classes.
The Board also received and considered information about the portion of the total management fee that was retained by Funds Management after payment of the fee to theSub-Adviser forsub-advisory services. In assessing the reasonableness of this amount, the Board received and evaluated information about the nature and extent of responsibilities retained and risks assumed by Funds Management and not delegated to or assumed by theSub-Adviser, and about Funds Management’son-going oversight services. Given the affiliation between Funds Management and theSub-Adviser, the Board ascribed limited relevance to the allocation of fees between them.
The Board also received and considered information about the nature and extent of services offered and fee rates charged by Funds Management and theSub-Adviser to other types of clients with investment strategies similar to those of the Fund. In this regard, the Board received information about the significantly greater scope of services, and compliance, reporting and other legal burdens and risks of managing proprietary mutual funds compared with those associated with managing assets of other types of clients, including third-partysub-advised fund clients andnon-mutual fund clients such as institutional separate accounts.
Based on its consideration of the factors and information it deemed relevant, including those described here, the Board determined that the compensation payable to Funds Management under the Management Agreement and to theSub-Adviser under theSub-Advisory Agreement was reasonable.
Profitability
The Board received and considered information concerning the profitability of Funds Management, as well as the profitability of both WFAM and Wells Fargo & Co. (“Wells Fargo”) from providing services to the fund family as a whole. The Board noted that theSub-Adviser’s profitability information with respect to providing services to the Fund and other funds in the family was subsumed in the WFAM and Wells Fargo profitability analysis.
Funds Management reported on the methodologies and estimates used in calculating profitability, including a description of the methodology used to allocate certain expenses. Among other things, the Board noted that the levels of profitability
Institutional Money Market Funds | 29
Table of Contents
Other information (unaudited)
reported on afund-by-fund basis varied widely, depending on factors such as the size, type and age of fund. Based on its review, the Board did not deem the profits reported by Funds Management, WFAM or Wells Fargo from services provided to the Fund to be at a level that would prevent it from approving the continuation of the Advisory Agreements.
Economies of scale
The Board received and considered information about the potential for Funds Management to experience economies of scale in the provision of management services to the Fund, the difficulties of calculating economies of scale at an individual fund level, and the extent to which potential scale benefits are shared with shareholders. The Board noted the existence of breakpoints in the Fund’s management fee structure, which operate generally to reduce the Fund’s expense ratios as the Fund grows in size. The Board considered that in addition to management fee breakpoints, Funds Management shares potential economies of scale from its management business in a variety of ways, including through fee waiver and expense reimbursement arrangements, services that benefit shareholders, competitive management fee rates set at the outset without regard to breakpoints, and investments in the business intended to enhance services available to shareholders.
The Board concluded that Funds Management’s arrangements with respect to the Fund, including contractual breakpoints, constituted a reasonable approach to sharing potential economies of scale with the Fund and its shareholders.
Other benefits to Funds Management and theSub-Adviser
The Board received and considered information regarding potential“fall-out” or ancillary benefits received by Funds Management and its affiliates, including theSub-Adviser, as a result of their relationships with the Fund. Ancillary benefits could include, among others, benefits directly attributable to other relationships with the Fund and benefits potentially derived from an increase in Funds Management’s and theSub-Adviser’s business as a result of their relationships with the Fund. The Board noted that various affiliates of Funds Management may receive distribution-related fees, shareholder servicing payments andsub-transfer agency fees in respect of shares sold or held through them and services provided.
The Board also reviewed information about soft dollar credits earned and utilized by theSub-Adviser, fees earned by Funds Management and theSub-Adviser from managing a private investment vehicle for the fund family’s securities lending collateral, and commissions earned by an affiliated broker from portfolio transactions.
Based on its consideration of the factors and information it deemed relevant, including those described here, the Board did not find that any ancillary benefits received by Funds Management and its affiliates, including theSub-Adviser, were unreasonable.
Conclusion
At the Meeting, after considering the above-described factors and based on its deliberations and its evaluation of the information described above, the Board unanimously approved the continuation of the Advisory Agreements for aone-year term and determined that the compensation payable to Funds Management and theSub-Adviser under each of the Advisory Agreements was reasonable.
30 | Institutional Money Market Funds
Table of Contents
This page is intentionally left blank.
Table of Contents
This page is intentionally left blank.
Table of Contents
For more information
More information about Wells Fargo Funds is available free upon request. To obtain literature, please write, visit the Fund’s website, or call:
Wells Fargo Funds
P.O. Box 219967
Kansas City, MO 64121-9967
Website:wfam.com
Individual investors:1-800-222-8222
Retail investment professionals:1-888-877-9275
Institutional investment professionals:1-866-765-0778

This report and the financial statements contained herein are submitted for the general information of the shareholders of the Fund. If this report is used for promotional purposes, distribution of the report must be accompanied or preceded by a current prospectus. Before investing, please consider the investment objectives, risks, charges, and expenses of the investment. For a current prospectus and, if available, a summary prospectus, containing this information, call1-800-260-5969 or visit the Fund’s website atwfam.com. Read the prospectus carefully before you invest or send money.
Wells Fargo Asset Management (WFAM) is the trade name for certain investment advisory/management firms owned by Wells Fargo & Company. These firms include but are not limited to Wells Capital Management Incorporated and Wells Fargo Funds Management, LLC. Certain products managed by WFAM entities are distributed by Wells Fargo Funds Distributor, LLC (a broker-dealer and Member FINRA).
This material is for general informational and educational purposes only and is NOT intended to provide investment advice or a recommendation of any kind—including a recommendation for any specific investment, strategy, or plan.
INVESTMENT PRODUCTS: NOT FDIC INSURED ◾ NO BANK GUARANTEE ◾ MAY LOSE VALUE
© 2019 Wells Fargo Funds Management, LLC. All rights reserved.
405490 09-19
SA307/SAR307 07-19
Table of Contents

Semi-Annual Report
July 31, 2019
Government Money Market Funds
| ∎ | Wells Fargo Government Money Market Fund |
Beginning on January 1, 2021, as permitted by new regulations adopted by the Securities and Exchange Commission, paper copies of the Wells Fargo Funds’ annual and semi-annual shareholder reports issued after this date will no longer be sent by mail, unless you specifically request paper copies of the reports. Instead, the reports will be made available on the Funds’ website, and you will be notified by mail each time a report is posted and provided with a website address to access the report.
If you already elected to receive shareholder reports electronically, you will not be affected by this change and you need not take any action. You may elect to receive shareholder reports and other communications from the Fund electronically at any time by contacting your financial intermediary (such as a broker-dealer or bank) or, if you are a direct investor, by calling1-800-222-8222 or by enrolling at wellsfargo.com/advantagedelivery.
You may elect to receive all future reports in paper free of charge. If you invest through a financial intermediary, you can contact your financial intermediary to request that you continue to receive paper copies of your shareholder reports; if you invest directly with the Fund, you can call 1-800-222-8222. Your election to receive reports in paper will apply to all Wells Fargo Funds held in your account with your financial intermediary or, if you are a direct investor, to all Wells Fargo Funds that you hold.
Table of Contents
|
Reduce clutter. Save trees. |
Sign up for electronic delivery of prospectuses and shareholder reports atwellsfargo.com/advantagedelivery |
The views expressed and any forward-looking statements are as of July 31, 2019, unless otherwise noted, and are those of the Fund managers and/or Wells Fargo Asset Management. Discussions of individual securities, or the markets generally, or any Wells Fargo Fund are not intended as individual recommendations. Future events or results may vary significantly from those expressed in any forward-looking statements. The views expressed are subject to change at any time in response to changing circumstances in the market. Wells Fargo Asset Management and the Fund disclaim any obligation to publicly update or revise any views expressed or forward-looking statements.
INVESTMENT PRODUCTS: NOT FDIC INSURED ◾ NO BANK GUARANTEE ◾ MAY LOSE VALUE
Government Money Market Funds | 1
Table of Contents
Letter to shareholders (unaudited)

Andrew Owen
President
Wells Fargo Funds
Dear Shareholder:
We are pleased to offer you this semi-annual report for the Wells Fargo Government Money Market Fund for the six-month period that ended July 31, 2019. Global stock and bond investors enjoyed gains that came amid continued concerns about global economic growth, international trade, geopolitical tensions, and bouts of market volatility. These concerns grew more intense as the period closed.
For the period, U.S. stocks, based on the S&P 500 Index,1 gained 11.32% and international stocks, as measured by the MSCI ACWI ex USA Index (Net),2 added 4.34%. The MSCI EM Index (Net)3 inched higher by 0.44%. For bond investors, the Bloomberg Barclays U.S. Aggregate Bond Index4 added 5.23%, the Bloomberg Barclays Global Aggregate ex-USD Index5 added 2.33%, the Bloomberg Barclays Municipal Bond Index6 gained 5.15%, and the ICE BofAML U.S. High Yield Index7 added 5.86%.
Concerns for slowing global growth reemerge during the first quarter of 2019.
After the S&P 500 Index’s best monthly performance in 30 years during January and positive returns for other major indices across major asset classes, signs of slowing global growth grew more ominous in February. The Bureau of Economic Analysis announced fourth-quarter 2018 gross domestic product (GDP) grew at an annualized 2.2% rate, down from the levels of the prior two quarters. In a February report, the Bank of England forecast the slowest growth since the financial crisis for 2019. China and the U.S. continued to wrangle over trade issues.
By the end of March 2019, a combination of dovish U.S. Federal Reserve (Fed) sentiment and steady, if not spectacular, U.S. economic and business metrics reinforced investors’ confidence. Monthly job creation data and corporate profits, while less consistent than during 2018, were solid. China announced a roughly $300 billion stimulus package through tax and fee cuts intended to reinvigorate economic growth. During April 2019, favorable sentiment found additional support in reports of sustained low inflation, solid employment data, and first-quarter U.S. GDP of an annualized rate of 3.2%.
| 1 | The S&P 500 Index consists of 500 stocks chosen for market size, liquidity, and industry group representation. It is a market-value-weighted index with each stock’s weight in the index proportionate to its market value. You cannot invest directly in an index. |
| 2 | The Morgan Stanley Capital International (MSCI) All Country World Index (ACWI) ex USA Index (Net) is a free-float-adjusted market-capitalization weighted index that is designed to measure the equity market performance of developed and emerging markets, excluding the U.S. Source: MSCI. MSCI makes no express or implied warranties or representations and shall have no liability whatsoever with respect to any MSCI data contained herein. The MSCI data may not be further redistributed or used as a basis for other indices or any securities or financial products. This report is not approved, reviewed, or produced by MSCI. You cannot invest directly in an index. |
| 3 | The MSCI Emerging Markets (EM) Index (Net) is a free-float-adjusted market-capitalization-weighted index that is designed to measure the equity market performance of emerging markets. You cannot invest directly in an index. |
| 4 | The Bloomberg Barclays U.S. Aggregate Bond Index is a broad-based benchmark that measures the investment-grade, U.S. dollar-denominated, fixed-rate taxable bond market, including Treasuries, government-related and corporate securities, mortgage-backed securities (agency fixed-rate and hybrid adjustable-rate mortgage pass-throughs), asset-backed securities, and commercial mortgage-backed securities. You cannot invest directly in an index. |
| 5 | The Bloomberg Barclays Global Aggregate ex-USD Index is an unmanaged index that provides a broad-based measure of the global investment-grade fixed-income markets excluding the U.S. dollar-denominated debt market. You cannot invest directly in an index. |
| 6 | The Bloomberg Barclays Municipal Bond Index is an unmanaged index composed of long-term tax-exempt bonds with a minimum credit rating of Baa. You cannot invest directly in an index. |
| 7 | The ICE BofAML U.S. High Yield Index is a market-capitalization-weighted index of domestic and Yankee high-yield bonds. The index tracks the performance of high-yield securities traded in the U.S. bond market. You cannot invest directly in an index. Copyright 2019. ICE Data Indices, LLC. All rights reserved. |
2 | Government Money Market Funds
Table of Contents
Letter to shareholders (unaudited)
During May 2019, markets tumbled on mixed investment signals. In the U.S., partisan wrangling ramped up as Democrats and Republicans set their sights on 2020 presidential politics. The U.K.’s Brexit caused Prime Minister Theresa May to resign. The European Commission downgraded the 2019 growth forecast to 1.2%. The U.S. increased tariffs on products from China, China responded, and then talks broke down. President Donald Trump threatened to turn his foreign policy tariff tool to Mexico over immigration issues.
As had been the case during most of 2019 to date, just as the investment horizon appeared to darken, sentiment turned and U.S. equity markets gained during June and July. The gains, primarily driven by geopolitical and monetary policy events, pushed equity markets to new highs.
President Mario Draghi of the European Central Bank said that if the outlook doesn’t improve, the bank will cut rates or buy more assets to prop up inflation. President Trump backed off of tariff threats against Mexico and China. In the U.S., the Fed implemented a 0.25% federal funds rate cut in July 2019.
Later in July 2019, the U.S. reversed course and threatened to impose higher tariffs on China’s exports after talks failed. China responded with tariff threats of its own and devalued the renminbi, a move that roiled global markets. Despite the accommodative approach of central banks, investors continued to have misgivings about the durability of economic growth globally and a pervasively cautious tone influenced the world’s equity and fixed-income markets.
Don’t let short-term uncertainty derail long-term investment goals.
Periods of investment uncertainty can present challenges, but experience has taught us that maintaining long-term investment goals can be an effective way to plan for the future. To help you create a sound strategy based on your personal goals and risk tolerance, Wells Fargo Funds offers more than 100 mutual funds spanning a wide range of asset classes and investment styles. Although diversification cannot guarantee an investment profit or prevent losses, we believe it can be an effective way to manage investment risk and potentially smooth out overall portfolio performance. We encourage investors to know their investments and to understand that appropriate levels of risk-taking may unlock opportunities.
Thank you for choosing to invest with Wells Fargo Funds. We appreciate your confidence in us and remain committed to helping you meet your financial needs.
Sincerely,

Andrew Owen
President
Wells Fargo Funds
“During May 2019, markets tumbled on mixed investment signals.”
“In the U.S., the Fed implemented a 0.25% federal funds rate cut in July 2019.”
|
For further information about your Fund, contact your investment professional, visit our website at wfam.com,or call us directly at1-800-222-8222. |
Government Money Market Funds | 3
Table of Contents
Performance highlights (unaudited)
Investment objective
The Fund seeks current income, while preserving capital and liquidity.
Manager
Wells Fargo Funds Management, LLC
Subadviser
Wells Capital Management Incorporated
Portfolio managers
Michael C. Bird, CFA®‡
Jeffrey L. Weaver, CFA®‡
Laurie White
Average annual total returns (%) as of July 31, 2019
| Expense ratios1 (%) | ||||||||||||||||||||||
| Inception date | 1 year | 5 year | 10 year | Gross | Net2 | |||||||||||||||||
| Class A (WFGXX) | 11-8-1999 | 1.76 | 0.54 | 0.28 | 0.61 | 0.60 | ||||||||||||||||
| Administrator Class (WGAXX) | 7-31-2003 | 2.02 | 0.69 | 0.35 | 0.34 | 0.34 | ||||||||||||||||
| Institutional Class (GVIXX) | 7-28-2003 | 2.16 | 0.79 | 0.40 | 0.22 | 0.20 | ||||||||||||||||
| Select Class (WFFXX)3 | 6-30-2015 | 2.22 | 0.84 | 0.43 | 0.18 | 0.14 | ||||||||||||||||
| Service Class (NWGXX) | 11-16-1987 | 1.86 | 0.60 | 0.30 | 0.51 | 0.50 | ||||||||||||||||
| Sweep Class4 | 6-30-2010 | 1.59 | 0.46 | 0.24 | 0.77 | 0.77 | ||||||||||||||||
Yield summary (%) as of July 31, 20192
| Class A | Administrator Class | Institutional Class | Select Class | Service Class | Sweep Class | |||||||||||||||||
| 7-day current yield | 1.80 | 2.06 | 2.20 | 2.26 | 1.90 | 1.63 | ||||||||||||||||
| 7-day compound yield | 1.81 | 2.08 | 2.22 | 2.28 | 1.92 | 1.65 | ||||||||||||||||
| 30-day simple yield | 1.83 | 2.09 | 2.23 | 2.29 | 1.93 | 1.66 | ||||||||||||||||
| 30-day compound yield | 1.85 | 2.11 | 2.25 | 2.31 | 1.95 | 1.68 | ||||||||||||||||
Figures quoted represent past performance, which is no guarantee of future results, and do not reflect taxes that a shareholder may pay on fund distributions or the redemption of fund shares. Investment returns will fluctuate. The Fund’s yield figures more closely reflect the current earnings of the Fund than the total return figures. Current performance may be lower or higher than the performance data quoted, which assumes the reinvestment of dividends and capital gains. Current month-end performance is available on the Fund’s website,wfam.com.
Each class is sold without a front-end sales charge or contingent deferred sales charge.
For government money market funds: You could lose money by investing in the Fund. Although the Fund seeks to preserve the value of your investment at $1.00 per share, it cannot guarantee it will do so. An investment in the Fund is not insured or guaranteed by the Federal Deposit Insurance Corporation or any other government agency. The Fund’s sponsor has no legal obligation to provide financial support to the Fund, and you should not expect that the sponsor will provide financial support to the Fund at any time.
Please see footnotes on page 5.
4 | Government Money Market Funds
Table of Contents
Performance highlights (unaudited)
| Portfolio composition as of July 31, 20195 |
|
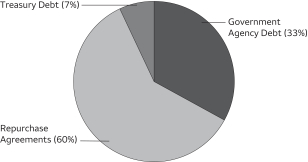
| Effective maturity distribution as of July 31, 20195 |
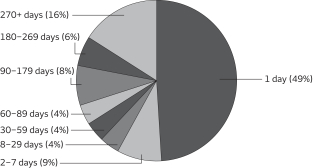 |
| Weighted average maturity as of July 31, 20196 | ||||
25 days | ||||
| Weighted average life as of July 31, 20197 | ||||
105 days | ||||
| ‡ | CFA® and Chartered Financial Analyst® are trademarks owned by CFA Institute. |
| 1 | Reflects the expense ratios as stated in the most recent prospectuses. The expense ratios shown are subject to change and may differ from the annualized expense ratios shown in the financial highlights of this report. |
| 2 | The manager has contractually committed through May 31, 2020, to waive fees and/or reimburse expenses to the extent necessary to cap the expenses of each class after fee waivers at the amounts shown. Brokerage commissions, stamp duty fees, interest, taxes, acquired fund fees and expenses (if any), and extraordinary expenses are excluded from the expense cap. Prior to or after the commitment expiration date, the cap may be increased or the commitment to maintain the cap may be terminated only with the approval of the Board of Trustees. Without this cap, the Fund’s returns would have been lower. Without waived fees and/or reimbursed expenses, the Fund’s 7-day current yield would have been 1.79%, 2.06%, 2.18%, 2.22%, 1.89%, and 1.63% for Class A, Administrator Class, Institutional Class, Select Class, Service Class, and Sweep Class respectively. The expense ratio paid by an investor is the net expense ratio (the total annual fund operating expenses after fee waivers) as stated in the prospectuses. |
| 3 | Historical performance shown for the Select Class shares prior to their inception reflects the performance of the Institutional Class shares, and includes the higher expenses applicable to Institutional Class shares. If these expenses had not been included, returns for Select Class shares would be higher. |
| 4 | Historical performance shown for Sweep Class shares prior to their inception reflects the performance of Service Class shares, and has not been adjusted to include the higher expenses applicable to Sweep Class shares. If these expenses had been included, returns for Sweep Class shares would be lower. |
| 5 | Amounts are calculated based on the total investments of the Fund. These amounts are subject to change and may have changed since the date specified. |
| 6 | Weighted Average Maturity (WAM): WAM is an average of the effective maturities of all securities held in the portfolio, weighted by each security’s percentage of total investments. The maturity of a portfolio security is the period remaining until the date on which the principal amount is unconditionally required to be paid, or in the case of a security called for redemption, the date on which the redemption payment is unconditionally required to be made. WAM calculations allow for the maturities of certain securities with demand features or periodic interest rate resets to be shortened. WAM is a way to measure a fund’s sensitivity to potential interest rate changes. WAM is subject to change and may have changed since the date specified. |
| 7 | Weighted Average Life (WAL): WAL is an average of the final maturities of all securities held in the portfolio, weighted by their percentage of total investments. The maturity of a portfolio security is the period remaining until the date on which the principal amount is unconditionally required to be paid, or in the case of a security called for redemption, the date on which the redemption payment is unconditionally required to be made. In contrast to WAM, the calculation of WAL allows for the maturities of certain securities with demand features to be shortened, but not the periodic interest rate resets. WAL is a way to measure a fund’s potential sensitivity to credit spread changes. WAL is subject to change and may have changed since the date specified. |
Government Money Market Funds | 5
Table of Contents
As a shareholder of the Fund, you incur ongoing costs, including management fees, distribution (12b-1) and/or shareholder servicing fees, and other Fund expenses. This example is intended to help you understand your ongoing costs (in dollars) of investing in the Fund and to compare these costs with the ongoing costs of investing in other mutual funds.
The example is based on an investment of $1,000 invested at the beginning of the six-month period and held for the entire period from February 1, 2019 to July 31, 2019.
Actual expenses
The “Actual” line of the table below provides information about actual account values and actual expenses. You may use the information in this line, together with the amount you invested, to estimate the expenses that you paid over the period. Simply divide your account value by $1,000 (for example, an $8,600 account value divided by $1,000 = 8.6), then multiply the result by the number in the “Actual” line under the heading entitled “Expenses paid during period” for your applicable class of shares to estimate the expenses you paid on your account during this period.
Hypothetical example for comparison purposes
The “Hypothetical” line of the table below provides information about hypothetical account values and hypothetical expenses based on the Fund’s actual expense ratio and an assumed rate of return of 5% per year before expenses, which is not the Fund’s actual return. The hypothetical account values and expenses may not be used to estimate the actual ending account balance or expenses you paid for the period. You may use this information to compare the ongoing costs of investing in the Fund and other funds. To do so, compare this 5% hypothetical example with the 5% hypothetical examples that appear in the shareholder reports of the other funds.
Please note that the expenses shown in the table are meant to highlight your ongoing costs only. Therefore, the “Hypothetical” line of the table is useful in comparing ongoing costs only and will not help you determine the relative total costs of owning different funds.
| Beginning account value 2-1-2019 | Ending account value 7-31-2019 | Expenses paid during the period¹ | Annualized net expense ratio | |||||||||||||
Class A | ||||||||||||||||
Actual | $ | 1,000.00 | $ | 1,009.27 | $ | 2.99 | 0.60 | % | ||||||||
Hypothetical (5% return before expenses) | $ | 1,000.00 | $ | 1,021.82 | $ | 3.01 | 0.60 | % | ||||||||
Administrator Class | ||||||||||||||||
Actual | $ | 1,000.00 | $ | 1,010.58 | $ | 1.69 | 0.34 | % | ||||||||
Hypothetical (5% return before expenses) | $ | 1,000.00 | $ | 1,023.11 | $ | 1.71 | 0.34 | % | ||||||||
Institutional Class | ||||||||||||||||
Actual | $ | 1,000.00 | $ | 1,011.27 | $ | 1.00 | 0.20 | % | ||||||||
Hypothetical (5% return before expenses) | $ | 1,000.00 | $ | 1,023.80 | $ | 1.00 | 0.20 | % | ||||||||
Select Class | ||||||||||||||||
Actual | $ | 1,000.00 | $ | 1,011.57 | $ | 0.70 | 0.14 | % | ||||||||
Hypothetical (5% return before expenses) | $ | 1,000.00 | $ | 1,024.10 | $ | 0.70 | 0.14 | % | ||||||||
Service Class | ||||||||||||||||
Actual | $ | 1,000.00 | $ | 1,009.77 | $ | 2.49 | 0.50 | % | ||||||||
Hypothetical (5% return before expenses) | $ | 1,000.00 | $ | 1,022.32 | $ | 2.51 | 0.50 | % | ||||||||
Sweep Class | ||||||||||||||||
Actual | $ | 1,000.00 | $ | 1,008.44 | $ | 3.83 | 0.77 | % | ||||||||
Hypothetical (5% return before expenses) | $ | 1,000.00 | $ | 1,020.98 | $ | 3.86 | 0.77 | % | ||||||||
| 1 | Expenses paid is equal to the annualized net expense ratio of each class multiplied by the average account value over the period, multiplied by the number of days in the most recent fiscal half-year divided by the number of days in the fiscal year (to reflect the one-half-year period). |
6 | Government Money Market Funds
Table of Contents
Portfolio of investments—July 31, 2019 (unaudited)
Interest rate | Maturity date | Principal | Value | |||||||||||||
| Government Agency Debt: 33.75% | ||||||||||||||||
FFCB (z) | 2.05 | % | 3-3-2020 | $ | 25,000,000 | $ | 24,698,403 | |||||||||
FFCB (U.S. Treasury 3 Month Bill Money Market Yield +0.16%)± | 2.24 | 1-19-2021 | 73,500,000 | 73,478,631 | ||||||||||||
FFCB (U.S. Treasury 3 Month Bill Money Market Yield +0.22%)± | 2.27 | 2-2-2021 | 300,000,000 | 299,982,142 | ||||||||||||
FFCB (1 Month LIBOR +0.03%)± | 2.29 | 8-25-2020 | 150,000,000 | 149,991,871 | ||||||||||||
FFCB (1 Month LIBOR +0.08%)± | 2.32 | 3-29-2021 | 250,000,000 | 249,985,653 | ||||||||||||
FFCB (3 Month LIBOR -0.18%)± | 2.34 | 5-15-2020 | 50,000,000 | 49,998,766 | ||||||||||||
FFCB (3 Month LIBOR -0.06%)± | 2.36 | 3-15-2021 | 75,000,000 | 74,995,208 | ||||||||||||
FFCB (1 Month LIBOR -0.03%)± | 2.37 | 10-1-2019 | 100,000,000 | 99,999,167 | ||||||||||||
FFCB (3 Month LIBOR -0.07%)± | 2.40 | 12-7-2020 | 25,000,000 | 24,998,663 | ||||||||||||
FFCB (1 Month LIBOR +0.04%)± | 2.40 | 2-11-2021 | 175,000,000 | 175,000,000 | ||||||||||||
FFCB (z) | 2.47 | 8-28-2019 | 24,000,000 | 23,956,080 | ||||||||||||
FFCB (3 Month LIBOR -0.07%)±%% | 2.18 | 2-1-2021 | 50,000,000 | 49,997,005 | ||||||||||||
FFCB (U.S. Treasury 3 Month Bill Money Market Yield +0.24%)±%% | 2.32 | 8-2-2021 | 150,000,000 | 150,000,000 | ||||||||||||
FFCB (z) | 2.02 | 4-2-2020 | 20,000,000 | 19,729,139 | ||||||||||||
FFCB (z) | 2.02 | 4-21-2020 | 50,000,000 | 49,270,333 | ||||||||||||
FFCB (z) | 2.04 | 2-14-2020 | 50,000,000 | 49,447,306 | ||||||||||||
FFCB (z) | 2.05 | 12-18-2019 | 24,000,000 | 23,811,887 | ||||||||||||
FFCB (z) | 2.05 | 1-31-2020 | 25,000,000 | 24,742,021 | ||||||||||||
FFCB (z) | 2.05 | 2-6-2020 | 44,000,000 | 43,531,070 | ||||||||||||
FFCB (z) | 2.05 | 2-7-2020 | 18,000,000 | 17,807,150 | ||||||||||||
FFCB (z) | 2.05 | 3-4-2020 | 17,000,000 | 16,793,960 | ||||||||||||
FFCB (z) | 2.05 | 3-20-2020 | 25,000,000 | 24,674,556 | ||||||||||||
FFCB (z) | 2.07 | 11-22-2019 | 25,000,000 | 24,838,347 | ||||||||||||
FFCB (z) | 2.07 | 12-30-2019 | 50,000,000 | 49,570,069 | ||||||||||||
FFCB (z) | 2.07 | 1-6-2020 | 50,000,000 | 49,550,139 | ||||||||||||
FFCB (z) | 2.10 | 1-23-2020 | 15,000,000 | 14,848,333 | ||||||||||||
FFCB (z) | 2.10 | 1-29-2020 | 12,000,000 | 11,874,507 | ||||||||||||
FFCB (z) | 2.12 | 4-16-2020 | 50,000,000 | 49,251,778 | ||||||||||||
FFCB (3 Month LIBOR -0.14%)± | 2.12 | 10-29-2020 | 50,000,000 | 49,957,390 | ||||||||||||
FFCB (z) | 2.13 | 4-1-2020 | 110,000,000 | 108,441,789 | ||||||||||||
FFCB (U.S. Treasury 3 Month Bill Money Market Yield +0.05%)± | 2.13 | 3-23-2020 | 200,000,000 | 199,994,874 | ||||||||||||
FFCB (U.S. Treasury 3 Month Bill Money Market Yield +0.05%)± | 2.13 | 4-16-2020 | 350,000,000 | 349,990,128 | ||||||||||||
FFCB (U.S. Treasury 3 Month Bill Money Market Yield +0.05%)± | 2.13 | 6-18-2020 | 100,000,000 | 99,996,036 | ||||||||||||
FFCB (U.S. Treasury 3 Month Bill Money Market Yield +0.05%)± | 2.13 | 10-21-2020 | 100,000,000 | 99,993,951 | ||||||||||||
FFCB (3 Month LIBOR -0.12%)± | 2.14 | 1-27-2020 | 10,000,000 | 10,004,815 | ||||||||||||
FFCB (U.S. Treasury 3 Month Bill Money Market Yield +0.06%)± | 2.14 | 7-22-2020 | 300,000,000 | 299,988,417 | ||||||||||||
FFCB (U.S. Treasury 3 Month Bill Money Market Yield +0.06%)± | 2.14 | 8-6-2020 | 150,000,000 | 149,997,734 | ||||||||||||
FFCB (U.S. Treasury 3 Month Bill Money Market Yield +0.06%)± | 2.14 | 9-4-2020 | 150,000,000 | 149,992,613 | ||||||||||||
FFCB (1 Month LIBOR -0.11%)± | 2.14 | 10-28-2019 | 75,000,000 | 74,996,387 | ||||||||||||
FFCB (U.S. Treasury 3 Month Bill Money Market Yield +0.06%)± | 2.14 | 10-15-2020 | 100,000,000 | 99,994,031 | ||||||||||||
FFCB (3 Month LIBOR -0.17%)± | 2.14 | 4-9-2020 | 100,000,000 | 99,997,266 | ||||||||||||
FFCB (U.S. Treasury 3 Month Bill Money Market Yield +0.07%)± | 2.15 | 5-15-2020 | 225,000,000 | 225,002,763 | ||||||||||||
FFCB (U.S. Treasury 3 Month Bill Money Market Yield +0.07%)± | 2.15 | 7-24-2020 | 100,000,000 | 99,997,079 | ||||||||||||
FFCB (z) | 2.16 | 12-3-2019 | 50,000,000 | 49,631,444 | ||||||||||||
FFCB (1 Month LIBOR -0.08%)± | 2.16 | 1-30-2020 | 75,000,000 | 74,997,042 | ||||||||||||
FFCB (U.S. Treasury 3 Month Bill Money Market Yield +0.09%)± | 2.17 | 3-26-2020 | 100,000,000 | 99,998,060 | ||||||||||||
FFCB (1 Month LIBOR -0.08%)± | 2.18 | 9-23-2019 | 150,000,000 | 149,999,904 | ||||||||||||
FFCB (1 Month LIBOR -0.08%)± | 2.19 | 10-25-2019 | 208,000,000 | 207,999,242 | ||||||||||||
FFCB (1 Month LIBOR -0.06%)± | 2.19 | 2-27-2020 | 48,500,000 | 48,498,887 | ||||||||||||
FFCB (U.S. Treasury 3 Month Bill Money Market Yield +0.11%)± | 2.19 | 12-28-2020 | 84,000,000 | 83,976,376 | ||||||||||||
FFCB (1 Month LIBOR -0.05%)± | 2.19 | 8-27-2020 | 25,000,000 | 24,990,401 | ||||||||||||
The accompanying notes are an integral part of these financial statements.
Government Money Market Funds | 7
Table of Contents
Portfolio of investments—July 31, 2019 (unaudited)
Interest rate | Maturity date | Principal | Value | |||||||||||||
| Government Agency Debt (continued) | ||||||||||||||||
FFCB (1 Month LIBOR -0.08%)± | 2.19 | % | 11-20-2019 | $ | 150,000,000 | $ | 149,990,729 | |||||||||
FFCB (1 Month LIBOR -0.09%)± | 2.21 | 8-19-2019 | 200,000,000 | 199,999,499 | ||||||||||||
FFCB (U.S. Treasury 3 Month Bill Money Market Yield +0.13%)± | 2.21 | 2-8-2021 | 100,000,000 | 99,908,790 | ||||||||||||
FFCB (3 Month LIBOR -0.06%)± | 2.22 | 10-25-2019 | 42,400,000 | 42,413,674 | ||||||||||||
FFCB (1 Month LIBOR -0.05%)± | 2.22 | 1-22-2020 | 200,000,000 | 199,996,060 | ||||||||||||
FFCB (3 Month LIBOR -0.08%)± | 2.22 | 1-15-2021 | 75,300,000 | 75,300,123 | ||||||||||||
FFCB (1 Month LIBOR -0.10%)± | 2.23 | 8-15-2019 | 118,000,000 | 117,999,658 | ||||||||||||
FFCB (3 Month LIBOR -0.10%)± | 2.23 | 12-28-2020 | 235,000,000 | 234,986,989 | ||||||||||||
FFCB (1 Month LIBOR +0.01%)± | 2.25 | 11-27-2020 | 100,000,000 | 99,996,723 | ||||||||||||
FFCB (1 Month LIBOR -0.10%)± | 2.26 | 10-8-2019 | 116,500,000 | 116,494,913 | ||||||||||||
FFCB (1 Month LIBOR +0.00%)± | 2.27 | 6-25-2020 | 5,000,000 | 5,001,734 | ||||||||||||
FFCB (1 Month LIBOR +0.01%)± | 2.27 | 5-26-2020 | 250,000,000 | 249,991,845 | ||||||||||||
FFCB (3 Month LIBOR -0.20%)± | 2.28 | 3-6-2020 | 75,000,000 | 74,998,222 | ||||||||||||
FFCB (1 Month LIBOR -0.05%)± | 2.28 | 5-14-2020 | 300,000,000 | 299,990,624 | ||||||||||||
FFCB (1 Month LIBOR +0.04%)± | 2.28 | 1-28-2021 | 207,500,000 | 207,500,219 | ||||||||||||
FFCB (1 Month LIBOR -0.08%)± | 2.29 | 11-12-2019 | 100,000,000 | 100,000,047 | ||||||||||||
FFCB (1 Month LIBOR +0.05%)± | 2.29 | 1-27-2020 | 158,500,000 | 158,585,299 | ||||||||||||
FFCB (1 Month LIBOR -0.08%)± | 2.29 | 5-11-2020 | 189,295,000 | 189,218,995 | ||||||||||||
FFCB (1 Month LIBOR -0.10%)± | 2.30 | 12-2-2019 | 37,000,000 | 36,996,534 | ||||||||||||
FFCB (1 Month LIBOR -0.07%)± | 2.30 | 7-9-2020 | 137,000,000 | 136,936,176 | ||||||||||||
FFCB (1 Month LIBOR -0.07%)± | 2.30 | 9-12-2019 | 100,000,000 | 99,999,424 | ||||||||||||
FFCB (3 Month LIBOR -0.13%)± | 2.31 | 9-12-2019 | 100,000,000 | 99,999,540 | ||||||||||||
FFCB (1 Month LIBOR -0.05%)± | 2.31 | 2-7-2020 | 26,530,000 | 26,527,342 | ||||||||||||
FFCB (3 Month LIBOR -0.21%)± | 2.31 | 5-20-2020 | 125,000,000 | 124,927,006 | ||||||||||||
FFCB (1 Month LIBOR +0.01%)± | 2.31 | 8-19-2020 | 250,000,000 | 249,981,109 | ||||||||||||
FFCB (1 Month LIBOR +0.07%)± | 2.31 | 12-28-2020 | 250,000,000 | 250,000,000 | ||||||||||||
FFCB (1 Month LIBOR +0.08%)± | 2.32 | 5-27-2021 | 300,000,000 | 299,983,784 | ||||||||||||
FFCB (1 Month LIBOR -0.05%)± | 2.32 | 3-12-2020 | 250,000,000 | 249,995,411 | ||||||||||||
FFCB (3 Month LIBOR -0.19%)± | 2.33 | 2-28-2020 | 75,000,000 | 75,000,000 | ||||||||||||
FFCB (3 Month LIBOR -0.01%)± | 2.33 | 9-23-2019 | 20,000,000 | 20,005,333 | ||||||||||||
FFCB (1 Month LIBOR -0.03%)± | 2.34 | 4-9-2020 | 250,000,000 | 249,991,416 | ||||||||||||
FFCB (1 Month LIBOR -0.02%)± | 2.34 | 8-5-2020 | 140,000,000 | 139,960,115 | ||||||||||||
FFCB (1 Month LIBOR +0.07%)± | 2.34 | 6-24-2021 | 300,000,000 | 299,977,248 | ||||||||||||
FFCB (1 Month LIBOR +0.03%)± | 2.35 | 12-14-2020 | 50,000,000 | 49,997,204 | ||||||||||||
FFCB (3 Month LIBOR -0.21%)± | 2.36 | 8-6-2020 | 16,500,000 | 16,487,776 | ||||||||||||
FFCB (3 Month LIBOR -0.13%)± | 2.37 | 9-4-2020 | 115,000,000 | 115,000,000 | ||||||||||||
FFCB (3 Month LIBOR -0.15%)± | 2.38 | 3-2-2020 | 100,000,000 | 99,998,835 | ||||||||||||
FFCB (3 Month LIBOR -0.14%)± | 2.39 | 8-28-2019 | 25,000,000 | 25,000,000 | ||||||||||||
FFCB (3 Month LIBOR -0.13%)± | 2.39 | 11-16-2020 | 130,000,000 | 129,990,579 | ||||||||||||
FFCB (3 Month LIBOR -0.13%)± | 2.40 | 8-14-2019 | 100,000,000 | 99,999,858 | ||||||||||||
FFCB (3 Month LIBOR -0.12%)± | 2.40 | 11-30-2020 | 75,000,000 | 75,000,000 | ||||||||||||
FFCB (1 Month LIBOR +0.04%)± | 2.40 | 1-11-2021 | 89,500,000 | 89,493,466 | ||||||||||||
FFCB (3 Month LIBOR -0.16%)± | 2.41 | 5-5-2020 | 50,000,000 | 49,998,371 | ||||||||||||
FFCB (1 Month LIBOR +0.07%)± | 2.43 | 1-8-2021 | 300,000,000 | 299,940,291 | ||||||||||||
FFCB (1 Month LIBOR +0.08%)± | 2.44 | 7-8-2021 | 200,000,000 | 200,000,000 | ||||||||||||
FFCB (3 Month LIBOR -0.13%)± | 2.45 | 8-1-2019 | 100,000,000 | 100,000,000 | ||||||||||||
FFCB (U.S. SOFR +0.08%)± | 2.47 | 6-10-2021 | 40,000,000 | 40,000,000 | ||||||||||||
FFCB (U.S. SOFR +0.10%)± | 2.49 | 5-7-2021 | 84,000,000 | 84,000,000 | ||||||||||||
FFCB (1 Month LIBOR +0.16%)± | 2.56 | 12-2-2019 | 25,000,000 | 25,019,861 | ||||||||||||
FFCB (z) | 2.75 | 11-4-2019 | 67,000,000 | 66,526,161 | ||||||||||||
FHLB (1 Month LIBOR -0.04%)± | 2.22 | 8-26-2019 | 300,000,000 | 300,000,000 | ||||||||||||
The accompanying notes are an integral part of these financial statements.
8 | Government Money Market Funds
Table of Contents
Portfolio of investments—July 31, 2019 (unaudited)
Interest rate | Maturity date | Principal | Value | |||||||||||||
| Government Agency Debt (continued) | ||||||||||||||||
FHLB (1 Month LIBOR -0.03%)± | 2.22 | % | 12-27-2019 | $ | 200,000,000 | $ | 200,000,000 | |||||||||
FHLB (3 Month LIBOR -0.13%)± | 2.29 | 12-16-2019 | 200,000,000 | 200,000,000 | ||||||||||||
FHLB (1 Month LIBOR -0.04%)± | 2.36 | 8-30-2019 | 200,000,000 | 200,000,000 | ||||||||||||
FHLB (z) | 2.39 | 8-30-2019 | 500,000,000 | 499,045,336 | ||||||||||||
FHLB (z) | 2.42 | 8-1-2019 | 400,000,000 | 400,000,000 | ||||||||||||
FHLB (U.S. SOFR +0.03%)± | 2.42 | 12-6-2019 | 140,000,000 | 140,000,000 | ||||||||||||
FHLB (U.S. SOFR +0.04%)± | 2.43 | 2-21-2020 | 110,000,000 | 110,000,000 | ||||||||||||
FHLB (U.S. SOFR +0.07%)± | 2.46 | 3-27-2020 | 247,000,000 | 247,000,000 | ||||||||||||
FHLB (U.S. SOFR +0.05%) %%± | 2.60 | 1-28-2021 | 260,000,000 | 260,000,000 | ||||||||||||
FHLB (3 Month LIBOR -0.26%)± | 2.03 | 10-7-2019 | 75,000,000 | 74,985,279 | ||||||||||||
FHLB (3 Month LIBOR -0.21%)± | 2.08 | 7-6-2020 | 200,000,000 | 200,000,000 | ||||||||||||
FHLB | 2.08 | 12-24-2019 | 100,000,000 | 99,998,688 | ||||||||||||
FHLB (3 Month LIBOR -0.26%)± | 2.08 | 10-11-2019 | 312,400,000 | 312,335,340 | ||||||||||||
FHLB (z) | 2.09 | 11-5-2019 | 200,000,000 | 198,893,334 | ||||||||||||
FHLB (z) | 2.10 | 10-25-2019 | 100,000,000 | 99,506,528 | ||||||||||||
FHLB (z) | 2.10 | 11-4-2019 | 150,000,000 | 149,174,688 | ||||||||||||
FHLB (z) | 2.10 | 12-2-2019 | 50,000,000 | 49,643,813 | ||||||||||||
FHLB (z) | 2.11 | 10-23-2019 | 150,000,000 | 149,273,750 | ||||||||||||
FHLB (3 Month LIBOR -0.16%)± | 2.12 | 10-22-2019 | 150,000,000 | 150,000,000 | ||||||||||||
FHLB (z) | 2.13 | 10-18-2019 | 100,000,000 | 99,541,750 | ||||||||||||
FHLB (z) | 2.15 | 10-16-2019 | 60,000,000 | 59,729,568 | ||||||||||||
FHLB | 2.15 | 7-30-2020 | 200,000,000 | 200,000,000 | ||||||||||||
FHLB (3 Month LIBOR -0.15%)± | 2.17 | 1-2-2020 | 150,000,000 | 150,000,000 | ||||||||||||
FHLB (3 Month LIBOR -0.11%)± | 2.17 | 1-25-2021 | 50,000,000 | 50,000,576 | ||||||||||||
FHLB (z) | 2.17 | 10-2-2019 | 300,000,000 | 298,884,000 | ||||||||||||
FHLB (z) | 2.18 | 9-25-2019 | 450,000,000 | 448,512,249 | ||||||||||||
FHLB (1 Month LIBOR -0.10%)± | 2.18 | 10-21-2019 | 200,000,000 | 200,000,000 | ||||||||||||
FHLB (1 Month LIBOR -0.06%)± | 2.18 | 10-28-2019 | 200,000,000 | 200,000,000 | ||||||||||||
FHLB (U.S. Treasury 3 Month Bill Money Market Yield +0.07%)± | 2.19 | 1-30-2020 | 150,000,000 | 150,000,000 | ||||||||||||
FHLB (3 Month LIBOR -0.14%)± | 2.19 | 12-26-2019 | 225,000,000 | 225,000,000 | ||||||||||||
FHLB (z) | 2.20 | 10-9-2019 | 250,000,000 | 248,950,625 | ||||||||||||
FHLB (3 Month LIBOR -0.21%)± | 2.21 | 6-19-2020 | 200,000,000 | 200,000,000 | ||||||||||||
FHLB (1 Month LIBOR -0.06%)± | 2.21 | 2-20-2020 | 200,000,000 | 200,000,000 | ||||||||||||
FHLB (1 Month LIBOR -0.06%)± | 2.21 | 2-21-2020 | 125,000,000 | 125,000,000 | ||||||||||||
FHLB (3 Month LIBOR -0.14%)± | 2.25 | 12-20-2019 | 250,000,000 | 249,988,337 | ||||||||||||
FHLB (1 Month LIBOR -0.02%)± | 2.25 | 5-26-2020 | 100,000,000 | 99,996,152 | ||||||||||||
FHLB (1 Month LIBOR -0.02%)± | 2.25 | 12-24-2019 | 200,000,000 | 200,000,000 | ||||||||||||
FHLB (1 Month LIBOR +0.00%)± | 2.26 | 10-26-2020 | 230,000,000 | 230,000,231 | ||||||||||||
FHLB (3 Month LIBOR -0.14%)± | 2.27 | 12-18-2020 | 14,010,000 | 13,996,985 | ||||||||||||
FHLB (1 Month LIBOR -0.03%)± | 2.27 | 11-18-2019 | 325,000,000 | 325,000,000 | ||||||||||||
FHLB (1 Month LIBOR -0.05%)± | 2.28 | 12-13-2019 | 100,000,000 | 100,000,000 | ||||||||||||
FHLB (1 Month LIBOR -0.06%)± | 2.28 | 12-16-2019 | 114,100,000 | 114,115,434 | ||||||||||||
FHLB (1 Month LIBOR -0.08%)± | 2.28 | 2-7-2020 | 150,000,000 | 150,000,000 | ||||||||||||
FHLB (1 Month LIBOR -0.06%)± | 2.30 | 8-7-2019 | 35,000,000 | 35,000,176 | ||||||||||||
FHLB (z) | 2.30 | 10-30-2019 | 52,000,000 | 51,703,600 | ||||||||||||
FHLB (z) | 2.30 | 11-1-2019 | 20,100,000 | 19,982,884 | ||||||||||||
FHLB (1 Month LIBOR -0.03%)± | 2.30 | 11-13-2019 | 200,000,000 | 200,000,000 | ||||||||||||
FHLB (1 Month LIBOR -0.05%)± | 2.32 | 10-9-2019 | 150,000,000 | 150,000,000 | ||||||||||||
FHLB (3 Month LIBOR -0.13%)± | 2.32 | 1-13-2020 | 200,000,000 | 200,000,000 | ||||||||||||
FHLB (3 Month LIBOR -0.20%)± | 2.32 | 2-18-2020 | 250,000,000 | 250,000,000 | ||||||||||||
FHLB (3 Month LIBOR -0.20%)± | 2.32 | 11-26-2019 | 100,000,000 | 100,000,000 | ||||||||||||
The accompanying notes are an integral part of these financial statements.
Government Money Market Funds | 9
Table of Contents
Portfolio of investments—July 31, 2019 (unaudited)
Interest rate | Maturity date | Principal | Value | |||||||||||||
| Government Agency Debt (continued) | ||||||||||||||||
FHLB (1 Month LIBOR -0.03%)± | 2.33 | % | 11-8-2019 | $ | 250,000,000 | $ | 250,000,000 | |||||||||
FHLB (3 Month LIBOR -0.12%)± | 2.33 | 12-13-2019 | 150,000,000 | 150,000,000 | ||||||||||||
FHLB (3 Month LIBOR -0.19%)± | 2.33 | 2-20-2020 | 200,000,000 | 200,000,000 | ||||||||||||
FHLB (3 Month LIBOR -0.19%)± | 2.33 | 8-28-2019 | 200,000,000 | 200,000,000 | ||||||||||||
FHLB (z) | 2.34 | 9-6-2019 | 200,000,000 | 199,534,000 | ||||||||||||
FHLB (z) | 2.34 | 9-9-2019 | 200,000,000 | 199,495,166 | ||||||||||||
FHLB (1 Month LIBOR -0.01%)± | 2.36 | 1-7-2020 | 250,000,000 | 250,000,000 | ||||||||||||
FHLB | 2.40 | 6-17-2020 | 200,000,000 | 200,000,000 | ||||||||||||
FHLB (3 Month LIBOR -0.12%)± | 2.41 | 3-5-2020 | 200,000,000 | 200,000,000 | ||||||||||||
FHLB (z) | 2.42 | 8-2-2019 | 400,000,000 | 399,973,224 | ||||||||||||
FHLB (U.S. SOFR +0.03%)± | 2.42 | 3-27-2020 | 141,000,000 | 141,000,000 | ||||||||||||
FHLB (U.S. SOFR +0.03%)± | 2.42 | 7-17-2020 | 278,000,000 | 278,000,000 | ||||||||||||
FHLB (3 Month LIBOR -0.12%)± | 2.44 | 11-1-2019 | 200,000,000 | 200,000,000 | ||||||||||||
FHLB (3 Month LIBOR -0.13%)± | 2.44 | 11-4-2019 | 300,000,000 | 300,000,000 | ||||||||||||
FHLB (U.S. SOFR +0.05%)± | 2.44 | 9-28-2020 | 420,000,000 | 420,000,000 | ||||||||||||
FHLB (U.S. SOFR +0.06%)± | 2.45 | 9-10-2019 | 75,000,000 | 75,000,000 | ||||||||||||
FHLB (U.S. SOFR +0.08%)± | 2.47 | 6-11-2021 | 332,000,000 | 332,000,000 | ||||||||||||
FHLB (z) | 2.49 | 9-4-2019 | 100,000,000 | 99,767,762 | ||||||||||||
FHLB | 2.51 | 5-28-2020 | 150,000,000 | 150,000,000 | ||||||||||||
FHLB | 2.75 | 10-24-2019 | 9,775,000 | 9,775,164 | ||||||||||||
FHLMC | 2.46 | 4-8-2020 | 100,000,000 | 99,981,968 | ||||||||||||
FHLMC (z) | 2.48 | 9-3-2019 | 66,668,000 | 66,518,092 | ||||||||||||
FHLMC | 1.25 | 8-1-2019 | 63,648,000 | 63,648,000 | ||||||||||||
FHLMC | 1.25 | 10-2-2019 | 144,295,000 | 143,938,895 | ||||||||||||
FHLMC | 1.38 | 5-1-2020 | 115,500,000 | 114,957,059 | ||||||||||||
FHLMC (1 Month LIBOR -0.10%)± | 2.26 | 8-8-2019 | 100,000,000 | 100,000,000 | ||||||||||||
FHLMC (U.S. SOFR +0.03%)± | 2.42 | 9-9-2020 | 100,000,000 | 100,000,000 | ||||||||||||
FHLMC | 2.50 | 6-4-2020 | 300,000,000 | 300,018,986 | ||||||||||||
FHLMC | 2.51 | 6-3-2020 | 150,000,000 | 150,000,000 | ||||||||||||
FHLMC | 2.51 | 6-4-2020 | 150,000,000 | 150,000,000 | ||||||||||||
FHLMC | 2.53 | 5-29-2020 | 150,000,000 | 150,000,000 | ||||||||||||
FNMA | 0.88 | 8-2-2019 | 383,635,000 | 383,616,587 | ||||||||||||
FNMA | 1.00 | 8-28-2019 | 41,983,000 | 41,931,251 | ||||||||||||
FNMA | 1.00 | 10-24-2019 | 51,029,000 | 50,828,269 | ||||||||||||
FNMA | 1.50 | 2-28-2020 | 23,150,000 | 23,060,231 | ||||||||||||
FNMA | 1.50 | 6-22-2020 | 97,680,000 | 97,229,037 | ||||||||||||
FNMA | 1.63 | 1-21-2020 | 11,650,000 | 11,618,033 | ||||||||||||
FNMA | 1.65 | 1-17-2020 | 10,500,000 | 10,472,772 | ||||||||||||
FNMA | 1.75 | 9-12-2019 | 50,000,000 | 49,944,065 | ||||||||||||
FNMA (U.S. SOFR +0.07%)± | 2.46 | 10-30-2019 | 25,000,000 | 25,000,000 | ||||||||||||
FNMA (U.S. SOFR +0.10%)± | 2.49 | 4-30-2020 | 15,000,000 | 15,000,000 | ||||||||||||
Overseas Private Investment Corporation (U.S. Treasury 3 Month Bill +0.00%) ±§ | 2.42 | 1-20-2027 | 68,000,000 | 68,000,000 | ||||||||||||
Overseas Private Investment Corporation (U.S. Treasury 3 Month Bill +0.00%) ±§ | 2.31 | 8-15-2019 | 2,000,000 | 2,000,000 | ||||||||||||
Overseas Private Investment Corporation (U.S. Treasury 3 Month Bill +0.00%) ±§ | 2.31 | 11-15-2022 | 18,987,500 | 18,987,500 | ||||||||||||
Overseas Private Investment Corporation (U.S. Treasury 3 Month Bill +0.00%) ±§ | 2.31 | 11-15-2023 | 20,000,000 | 20,000,000 | ||||||||||||
Overseas Private Investment Corporation (U.S. Treasury 3 Month Bill +0.00%) ±§ | 2.31 | 7-19-2027 | 10,000,000 | 10,000,000 | ||||||||||||
The accompanying notes are an integral part of these financial statements.
10 | Government Money Market Funds
Table of Contents
Portfolio of investments—July 31, 2019 (unaudited)
Interest rate | Maturity date | Principal | Value | |||||||||||||
| Government Agency Debt (continued) | ||||||||||||||||
Overseas Private Investment Corporation (U.S. Treasury 3 Month Bill +0.00%) ±§ | 2.31 | % | 9-20-2027 | $ | 25,000,000 | $ | 25,000,000 | |||||||||
Overseas Private Investment Corporation (U.S. Treasury 3 Month Bill +0.00%) ±§ | 2.31 | 6-28-2032 | 30,586,764 | 30,586,763 | ||||||||||||
Overseas Private Investment Corporation (U.S. Treasury 3 Month Bill +0.00%) ±§ | 2.31 | 10-15-2039 | 14,965,000 | 14,965,000 | ||||||||||||
Overseas Private Investment Corporation (U.S. Treasury 3 Month Bill +0.00%) ±§ | 2.31 | 10-15-2039 | 15,000,000 | 15,000,000 | ||||||||||||
Overseas Private Investment Corporation (U.S. Treasury 3 Month Bill +0.00%) ±§ | 2.31 | 7-7-2040 | 19,982,840 | 19,982,840 | ||||||||||||
Overseas Private Investment Corporation (U.S. Treasury 3 Month Bill +0.00%) ±§ | 2.31 | 7-7-2040 | 8,592,621 | 8,592,621 | ||||||||||||
Overseas Private Investment Corporation (U.S. Treasury 3 Month Bill +0.00%) ±§ | 2.31 | 7-7-2040 | 8,492,707 | 8,492,707 | ||||||||||||
Overseas Private Investment Corporation (U.S. Treasury 3 Month Bill +0.00%) ±§ | 2.31 | 7-7-2040 | 10,990,562 | 10,990,562 | ||||||||||||
Overseas Private Investment Corporation (U.S. Treasury 3 Month Bill +0.00%) ±§ | 2.31 | 10-15-2040 | 7,000,000 | 7,000,000 | ||||||||||||
Overseas Private Investment Corporation (U.S. Treasury 3 Month Bill +0.00%) ±§ | 2.40 | 11-15-2025 | 6,600,000 | 6,600,000 | ||||||||||||
Overseas Private Investment Corporation (U.S. Treasury 3 Month Bill +0.00%) ±§ | 2.40 | 10-15-2032 | 21,879,487 | 21,879,487 | ||||||||||||
Overseas Private Investment Corporation (U.S. Treasury 3 Month Bill +0.00%) ±§ | 2.40 | 6-15-2034 | 17,823,504 | 17,823,504 | ||||||||||||
Overseas Private Investment Corporation (U.S. Treasury 3 Month Bill +0.00%) ±§ | 2.41 | 12-15-2019 | 5,544,000 | 5,544,000 | ||||||||||||
Overseas Private Investment Corporation (U.S. Treasury 3 Month Bill +0.00%) ±§ | 2.41 | 7-9-2026 | 65,754,500 | 65,754,500 | ||||||||||||
Overseas Private Investment Corporation (U.S. Treasury 3 Month Bill +0.00%) ±§ | 2.41 | 1-15-2030 | 15,849,057 | 15,849,057 | ||||||||||||
Overseas Private Investment Corporation (U.S. Treasury 3 Month Bill +0.00%) ±§ | 2.42 | 9-2-2031 | 11,605,712 | 11,605,712 | ||||||||||||
Overseas Private Investment Corporation (U.S. Treasury 3 Month Bill +0.00%) ±§ | 2.42 | 9-2-2031 | 8,717,859 | 8,717,859 | ||||||||||||
Overseas Private Investment Corporation (U.S. Treasury 3 Month Bill +0.00%) ±§ | 2.42 | 9-2-2031 | 6,644,529 | 6,644,529 | ||||||||||||
Overseas Private Investment Corporation (U.S. Treasury 3 Month Bill +0.00%) ±§ | 2.42 | 9-2-2031 | 5,800,388 | 5,800,388 | ||||||||||||
Overseas Private Investment Corporation (U.S. Treasury 3 Month Bill +0.00%) ±§ | 2.42 | 9-2-2031 | 9,873,000 | 9,873,000 | ||||||||||||
Overseas Private Investment Corporation (U.S. Treasury 3 Month Bill +0.00%) ±§ | 2.42 | 9-30-2031 | 11,383,010 | 11,383,010 | ||||||||||||
Overseas Private Investment Corporation (U.S. Treasury 3 Month Bill +0.00%) ±§ | 2.42 | 5-15-2033 | 3,755,508 | 3,755,508 | ||||||||||||
Overseas Private Investment Corporation (U.S. Treasury 3 Month Bill +0.00%) ±§ | 2.42 | 1-20-2035 | 12,000,000 | 12,000,000 | ||||||||||||
Overseas Private Investment Corporation (U.S. Treasury 3 Month Bill +0.00%) ±§ | 2.42 | 1-20-2035 | 10,400,000 | 10,400,000 | ||||||||||||
Overseas Private Investment Corporation (U.S. Treasury 3 Month Bill +0.00%) ±§ | 2.42 | 1-20-2035 | 9,900,000 | 9,900,000 | ||||||||||||
Overseas Private Investment Corporation (U.S. Treasury 3 Month Bill +0.00%) ±§ | 2.42 | 1-20-2035 | 4,000,000 | 4,000,000 | ||||||||||||
The accompanying notes are an integral part of these financial statements.
Government Money Market Funds | 11
Table of Contents
Portfolio of investments—July 31, 2019 (unaudited)
Interest rate | Maturity date | Principal | Value | |||||||||||||
| Government Agency Debt (continued) | ||||||||||||||||
Overseas Private Investment Corporation (U.S. Treasury 3 Month Bill +0.00%) ±§ | 2.42 | % | 4-20-2035 | $ | 17,500,000 | $ | 17,500,000 | |||||||||
Overseas Private Investment Corporation (U.S. Treasury 3 Month Bill +0.00%) ±§ | 2.42 | 4-20-2035 | 5,000,000 | 5,000,000 | ||||||||||||
Overseas Private Investment Corporation (U.S. Treasury 3 Month Bill +0.00%) ±§ | 2.42 | 4-20-2035 | 5,000,000 | 5,000,000 | ||||||||||||
Overseas Private Investment Corporation (U.S. Treasury 3 Month Bill +0.00%) ±§ | 2.42 | 1-15-2040 | 11,904,000 | 11,904,000 | ||||||||||||
Overseas Private Investment Corporation (U.S. Treasury 3 Month Bill +0.00%) ±§ | 2.42 | 1-15-2040 | 3,968,000 | 3,968,000 | ||||||||||||
Overseas Private Investment Corporation (U.S. Treasury 3 Month Bill +0.00%) ±§ | 2.42 | 7-15-2040 | 9,791,100 | 9,791,100 | ||||||||||||
Overseas Private Investment Corporation Series 1 (U.S. Treasury 3 Month Bill +0.00%)±§ | 2.42 | 8-15-2026 | 14,338,368 | 14,338,368 | ||||||||||||
Overseas Private Investment Corporation Series 1 (U.S. Treasury 3 Month Bill +0.00%)±§ | 2.42 | 9-30-2031 | 4,481,500 | 4,481,500 | ||||||||||||
Overseas Private Investment Corporation Series 1 (U.S. Treasury 3 Month Bill +0.00%)±§ | 2.42 | 1-15-2040 | 9,920,000 | 9,920,000 | ||||||||||||
Overseas Private Investment Corporation Series 2 (U.S. Treasury 3 Month Bill +0.00%)±§ | 2.31 | 10-10-2025 | 6,191,100 | 6,191,100 | ||||||||||||
Overseas Private Investment Corporation Series 2 (U.S. Treasury 3 Month Bill +0.00%)±§ | 2.31 | 9-20-2038 | 3,926,722 | 3,926,722 | ||||||||||||
Overseas Private Investment Corporation Series 2 (U.S. Treasury 3 Month Bill +0.00%)±§ | 2.42 | 9-30-2031 | 10,486,710 | 10,486,710 | ||||||||||||
Overseas Private Investment Corporation Series 2-2 (U.S. Treasury 3 Month Bill +0.00%)±§ | 2.42 | 7-15-2040 | 3,461,500 | 3,461,500 | ||||||||||||
Overseas Private Investment Corporation Series 3 (U.S. Treasury 3 Month Bill +0.00%)±§ | 2.31 | 10-10-2025 | 8,048,430 | 8,048,430 | ||||||||||||
Overseas Private Investment Corporation Series 3 (U.S. Treasury 3 Month Bill +0.00%)±§ | 2.42 | 7-15-2026 | 4,998,180 | 4,998,180 | ||||||||||||
Overseas Private Investment Corporation Series 4 (U.S. Treasury 3 Month Bill +0.00%)±§ | 2.40 | 11-15-2033 | 23,521,368 | 23,521,368 | ||||||||||||
Overseas Private Investment Corporation Series 4 (U.S. Treasury 3 Month Bill +0.00%)±§ | 2.42 | 9-2-2031 | 3,455,550 | 3,455,550 | ||||||||||||
Overseas Private Investment Corporation Series 4 (U.S. Treasury 3 Month Bill +0.00%)±§ | 2.42 | 9-30-2031 | 6,094,840 | 6,094,840 | ||||||||||||
Overseas Private Investment Corporation Series 4 (U.S. Treasury 3 Month Bill +0.00%)±§ | 2.42 | 1-20-2035 | 9,000,000 | 9,000,000 | ||||||||||||
Overseas Private Investment Corporation Series 5 (U.S. Treasury 3 Month Bill +0.00%)±§ | 2.42 | 9-30-2031 | 6,274,100 | 6,274,100 | ||||||||||||
Overseas Private Investment Corporation Series 6 (U.S. Treasury 3 Month Bill +0.00%)±§ | 2.31 | 7-7-2040 | 4,895,796 | 4,895,796 | ||||||||||||
Overseas Private Investment Corporation Series 6 (U.S. Treasury 3 Month Bill +0.00%)±§ | 2.42 | 9-30-2031 | 6,274,100 | 6,274,100 | ||||||||||||
Overseas Private Investment Corporation Series 6 (U.S. Treasury 3 Month Bill +0.00%)±§ | 2.42 | 4-20-2035 | 8,900,000 | 8,900,000 | ||||||||||||
Overseas Private Investment Corporation Series 7 (U.S. Treasury 3 Month Bill +0.00%)±§ | 2.42 | 9-30-2031 | 3,585,200 | 3,585,200 | ||||||||||||
Overseas Private Investment Corporation Series 7 (U.S. Treasury 3 Month Bill +0.00%)±§ | 2.42 | 1-20-2035 | 2,900,000 | 2,900,000 | ||||||||||||
Overseas Private Investment Corporation Series 8 (U.S. Treasury 3 Month Bill +0.00%)±§ | 2.42 | 9-30-2031 | 13,444,500 | 13,444,500 | ||||||||||||
The accompanying notes are an integral part of these financial statements.
12 | Government Money Market Funds
Table of Contents
Portfolio of investments—July 31, 2019 (unaudited)
Interest rate | Maturity date | Principal | Value | |||||||||||||
| Government Agency Debt (continued) | ||||||||||||||||
Overseas Private Investment Corporation Series 9 (U.S. Treasury 3 Month Bill +0.00%)±§ | 2.40 | % | 5-15-2030 | $ | 24,276,000 | $ | 24,276,000 | |||||||||
Overseas Private Investment Corporation Series 9 (U.S. Treasury 3 Month Bill +0.00%)±§ | 2.42 | 9-30-2031 | 4,212,610 | 4,212,610 | ||||||||||||
Total Government Agency Debt (Cost $27,834,911,901) | 27,834,911,901 | |||||||||||||||
|
| |||||||||||||||
Municipal Obligations: 0.03% | ||||||||||||||||
Washington: 0.01% | ||||||||||||||||
Variable Rate Demand Notes ø: 0.01% | ||||||||||||||||
Washington Housing Finance Commission Eagles Landing Apartments Project Series A (Housing Revenue, FNMA LOC, FNMA LIQ) | 2.40 | 12-15-2036 | 1,295,000 | 1,295,000 | ||||||||||||
Washington Housing Finance Commission Fairwinds Project Series B (Housing Revenue, FHLB LOC) | 2.39 | 7-1-2041 | 2,945,000 | 2,945,000 | ||||||||||||
Washington Housing Finance Commission Fairwinds Redmond Project (Housing Revenue, FHLB LOC) | 2.39 | 7-1-2041 | 4,600,000 | 4,600,000 | ||||||||||||
Washington Housing Finance Commission The Lodge at Eagle Ridge Series B (Housing Revenue, FHLB LOC) | 2.39 | 8-1-2041 | 3,425,000 | 3,425,000 | ||||||||||||
| 12,265,000 | ||||||||||||||||
|
| |||||||||||||||
Wisconsin: 0.02% | ||||||||||||||||
Variable Rate Demand Note ø: 0.02% | ||||||||||||||||
Wisconsin PFA Assisted Living Facilities Brannan Park Project (Housing Revenue, FHLB LOC) | 2.18 | 1-1-2048 | 12,320,000 | 12,320,000 | ||||||||||||
|
| |||||||||||||||
Total Municipal Obligations (Cost $24,585,000) | 24,585,000 | |||||||||||||||
|
| |||||||||||||||
| Repurchase Agreements ^^: 60.17% | ||||||||||||||||
Bank of America Corporation, dated 7-31-2019, maturity value $1,482,005,380 (1) | 2.56 | 8-1-2019 | 1,481,900,000 | 1,481,900,000 | ||||||||||||
Bank of Montreal, dated 7-15-2019, maturity value $350,487,958 (2) | 2.39 | 8-5-2019 | 350,000,000 | 350,000,000 | ||||||||||||
Bank of Nova Scotia, dated 7-31-2019, maturity value $1,855,130,881 (3) | 2.54 | 8-1-2019 | 1,855,000,000 | 1,855,000,000 | ||||||||||||
Barclays Capital Incorporated, dated 7-31-2019, maturity value $1,447,902,150 (4) | 2.54 | 8-1-2019 | 1,447,800,000 | 1,447,800,000 | ||||||||||||
BNP Paribas Securities Corporation, dated 7-18-2019, maturity value $552,062,500 (5) | 2.25 | 9-16-2019 | 550,000,000 | 550,000,000 | ||||||||||||
BNP Paribas Securities Corporation, dated 7-24-2019, maturity value $376,347,292 (6) | 2.23 | 9-20-2019 | 375,000,000 | 375,000,000 | ||||||||||||
BNP Paribas Securities Corporation, dated 7-31-2019, maturity value $100,007,056 (7) | 2.54 | 8-1-2019 | 100,000,000 | 100,000,000 | ||||||||||||
BNP Paribas Securities Corporation, dated 7-31-2019, maturity value $850,060,208 (8) | 2.55 | 8-1-2019 | 850,000,000 | 850,000,000 | ||||||||||||
Citibank NA, dated 7-25-2019, maturity value $250,118,611 (9) | 2.44 | 8-1-2019 | 250,000,000 | 250,000,000 | ||||||||||||
Citibank NA, dated 7-31-2019, maturity value $250,017,778 (10) | 2.56 | 8-1-2019 | 250,000,000 | 250,000,000 | ||||||||||||
Citigroup Global Markets Incorporated, dated 7-30-2019, maturity value $250,110,833 (11) | 2.28 | 8-6-2019 | 250,000,000 | 250,000,000 | ||||||||||||
Citigroup Global Markets Incorporated, dated 7-31-2019, maturity value $1,500,104,583 (12) | 2.51 | 8-1-2019 | 1,500,000,000 | 1,500,000,000 | ||||||||||||
Citigroup Global Markets Incorporated, dated 7-31-2019, maturity value $500,035,556 (13) | 2.56 | 8-1-2019 | 500,000,000 | 500,000,000 | ||||||||||||
Credit Agricole SA, dated 7-18-2019, maturity value | 2.28 | 8-19-2019 | 400,000,000 | 400,000,000 | ||||||||||||
The accompanying notes are an integral part of these financial statements.
Government Money Market Funds | 13
Table of Contents
Portfolio of investments—July 31, 2019 (unaudited)
Interest rate | Maturity date | Principal | Value | |||||||||||||
| Repurchase Agreements ^^ (continued) | ||||||||||||||||
Credit Agricole SA, dated 7-29-2019, maturity value $1,050,473,667 (15) | 2.32 | % | 8-5-2019 | $ | 1,050,000,000 | $ | 1,050,000,000 | |||||||||
Credit Agricole SA, dated 7-30-2019, maturity value $300,133,000 (16) | 2.28 | 8-6-2019 | 300,000,000 | 300,000,000 | ||||||||||||
Daiwa Capital Markets America Incorporated, dated 7-30-2019, maturity value $1,000,443,333 (17) | 2.28 | 8-6-2019 | 1,000,000,000 | 1,000,000,000 | ||||||||||||
Daiwa Capital Markets America Incorporated, dated 7-31-2019, maturity value $500,035,278 (18) | 2.54 | 8-1-2019 | 500,000,000 | 500,000,000 | ||||||||||||
Deutsche Bank Securities, dated 7-31-2019, maturity value $2,000,142,222 (19) | 2.56 | 8-1-2019 | 2,000,000,000 | 2,000,000,000 | ||||||||||||
Fixed Income Clearing Corporation, dated 7-31-2019, maturity value $1,250,078,472 (20) | 2.26 | 8-1-2019 | 1,250,000,000 | 1,250,000,000 | ||||||||||||
Fixed Income Clearing Corporation, dated 7-31-2019, maturity value $1,250,088,194 (21) | 2.54 | 8-1-2019 | 1,250,000,000 | 1,250,000,000 | ||||||||||||
Fixed Income Clearing Corporation, dated 7-31-2019, maturity value $1,750,216,932 (22) | 2.73 | 8-1-2019 | 1,750,084,218 | 1,750,084,218 | ||||||||||||
Fixed Income Clearing Corporation, dated 7-31-2019, maturity value $2,000,138,889 (23) | 2.50 | 8-1-2019 | 2,000,000,000 | 2,000,000,000 | ||||||||||||
Fixed Income Clearing Corporation, dated 7-31-2019, maturity value $750,046,875 (24) | 2.25 | 8-1-2019 | 750,000,000 | 750,000,000 | ||||||||||||
Fixed Income Clearing Corporation, dated 7-31-2019, maturity value $8,500,607,507 (25) | 2.57 | 8-1-2019 | 8,500,000,701 | 8,500,000,701 | ||||||||||||
Goldman Sachs & Company, dated 7-31-2019, maturity value $109,007,600 (26) | 2.51 | 8-1-2019 | 109,000,000 | 109,000,000 | ||||||||||||
Goldman Sachs & Company, dated 7-31-2019, maturity value $370,021,583 (27) | 2.10 | 8-1-2019 | 370,000,000 | 370,000,000 | ||||||||||||
ING Financial Markets LLC, dated 5-6-2019, maturity value $101,258,833 (28) | 2.49 | 11-4-2019 | 100,000,000 | 100,000,000 | ||||||||||||
ING Financial Markets LLC, dated 5-20-2019, maturity value $201,271,000 (29) | 2.46 | 8-21-2019 | 200,000,000 | 200,000,000 | ||||||||||||
ING Financial Markets LLC, dated 6-20-2019, maturity value $201,165,000 (30) | 2.33 | 9-18-2019 | 200,000,000 | 200,000,000 | ||||||||||||
ING Financial Markets LLC, dated 7-12-2019, maturity value $301,620,667 (31) | 2.21 | 10-8-2019 | 300,000,000 | 300,000,000 | ||||||||||||
ING Financial Markets LLC, dated 7-16-2019, maturity value $351,955,236 (32) | 2.21 | 10-15-2019 | 350,000,000 | 350,000,000 | ||||||||||||
ING Financial Markets LLC, dated 7-26-2019, maturity value $200,384,056 (33) | 2.23 | 8-26-2019 | 200,000,000 | 200,000,000 | ||||||||||||
ING Financial Markets LLC, dated 7-29-2019, maturity value $250,464,583 (34) | 2.23 | 8-28-2019 | 250,000,000 | 250,000,000 | ||||||||||||
ING Financial Markets LLC, dated 7-31-2019, maturity value $400,028,333 (35) | 2.55 | 8-1-2019 | 400,000,000 | 400,000,000 | ||||||||||||
ING Financial Markets LLC, dated 7-31-2019, maturity value $400,029,025 (36) | 2.53 | 8-1-2019 | 400,000,914 | 400,000,914 | ||||||||||||
ING Financial Markets LLC, dated 7-31-2019, maturity value $400,175,000 (37) | 2.25 | 8-7-2019 | 400,000,000 | 400,000,000 | ||||||||||||
JPMorgan Securities, dated 7-31-2019, maturity value $500,101,667 (38)§¢øø | 2.44 | 8-3-2019 | 500,000,000 | 500,000,000 | ||||||||||||
Mitsubishi Bank, dated 5-20-2019, maturity value $201,263,889 (39) | 2.50 | 8-19-2019 | 200,000,000 | 200,000,000 | ||||||||||||
Mitsubishi Bank, dated 7-31-2019, maturity value $500,032,639 (40) | 2.35 | 8-1-2019 | 500,000,000 | 500,000,000 | ||||||||||||
Mizuho Bank, dated 7-31-2019, maturity value $650,045,861 (41) | 2.54 | 8-1-2019 | 650,000,000 | 650,000,000 | ||||||||||||
MUFG Securities Canada Limited, dated 7-30-2019, maturity value $250,112,778 (42) | 2.32 | 8-6-2019 | 250,000,000 | 250,000,000 | ||||||||||||
The accompanying notes are an integral part of these financial statements.
14 | Government Money Market Funds
Table of Contents
Portfolio of investments—July 31, 2019 (unaudited)
Interest rate | Maturity date | Principal | Value | |||||||||||||
| Repurchase Agreements ^^ (continued) | ||||||||||||||||
MUFG Securities Canada Limited, dated 7-31-2019, maturity value $1,200,084,000 (43) | 2.52 | % | 8-1-2019 | $ | 1,200,000,000 | $ | 1,200,000,000 | |||||||||
MUFG Securities Canada Limited, dated 7-31-2019, maturity value $250,109,861 (44) | 2.26 | 8-7-2019 | 250,000,000 | 250,000,000 | ||||||||||||
Nomura Securities International Incorporated, dated 7-31-2019, maturity value $2,700,192,000 (45) | 2.56 | 8-1-2019 | 2,700,000,000 | 2,700,000,000 | ||||||||||||
Prudential Insurance Company of America, dated 7-31-2019, maturity value $102,131,012 (46) | 2.56 | 8-1-2019 | 102,123,750 | 102,123,750 | ||||||||||||
Prudential Insurance Company of America, dated 7-31-2019, maturity value $531,761,561 (47) | 2.56 | 8-1-2019 | 531,723,750 | 531,723,750 | ||||||||||||
RBC Capital Markets, dated 7-31-2019, maturity value $250,017,639 (48) | 2.54 | 8-1-2019 | 250,000,000 | 250,000,000 | ||||||||||||
RBC Capital Markets, dated 7-31-2019, maturity value $530,037,100 (49) | 2.52 | 8-1-2019 | 530,000,000 | 530,000,000 | ||||||||||||
RBS Securities Incorporated, dated 7-31-2019, maturity value $650,045,861 (50) | 2.54 | 8-1-2019 | 650,000,000 | 650,000,000 | ||||||||||||
Royal Bank of Canada, dated 7-31-2019, maturity value $1,100,077,611 (51) | 2.54 | 8-1-2019 | 1,100,000,000 | 1,100,000,000 | ||||||||||||
Societe Generale, dated 7-8-2019, maturity value $401,185,000 (52) | 2.37 | 8-22-2019 | 400,000,000 | 400,000,000 | ||||||||||||
Societe Generale, dated 7-31-2019, maturity value $2,000,142,778 (53) | 2.57 | 8-1-2019 | 2,000,000,000 | 2,000,000,000 | ||||||||||||
Standard Chartered Bank, dated 7-31-2019, maturity value $1,125,079,063 (54) | 2.53 | 8-1-2019 | 1,125,000,000 | 1,125,000,000 | ||||||||||||
Standard Chartered Bank, dated 7-31-2019, maturity value $400,028,333 (55) | 2.55 | 8-1-2019 | 400,000,000 | 400,000,000 | ||||||||||||
Sumitomo Mitsui Banking Corporation, dated 7-23-2019, maturity value $194,357,029 (56) | 2.51 | 8-6-2019 | 194,167,500 | 194,167,500 | ||||||||||||
Sumitomo Mitsui Banking Corporation, dated 7-24-2019, maturity value $201,191,663 (57)§¢øø | 2.50 | 8-7-2019 | 200,996,250 | 200,996,250 | ||||||||||||
Sumitomo Mitsui Banking Corporation, dated 7-25-2019, maturity value $620,417,690 (58)§¢øø | 2.49 | 8-8-2019 | 619,817,500 | 619,817,500 | ||||||||||||
Sumitomo Mitsui Banking Corporation, dated 7-26-2019, maturity value $620,355,129 (59)§¢øø | 2.49 | 8-9-2019 | 619,755,000 | 619,755,000 | ||||||||||||
Sumitomo Mitsui Banking Corporation, dated 7-30-2019, maturity value $308,137,869 (60)§¢øø | 2.40 | 8-27-2019 | 307,563,750 | 307,563,750 | ||||||||||||
TD Securities, dated 7-31-2019, maturity value $550,039,111 (61) | 2.56 | 8-1-2019 | 550,000,000 | 550,000,000 | ||||||||||||
Total Repurchase Agreements (Cost $49,619,933,333) | 49,619,933,333 | |||||||||||||||
|
| |||||||||||||||
Treasury Debt: 6.72% | ||||||||||||||||
U.S. Treasury Bill (z)## | 2.03 | 1-23-2020 | 190,000,000 | 188,143,542 | ||||||||||||
U.S. Treasury Bill (z) | 2.04 | 12-26-2019 | 240,000,000 | 238,019,420 | ||||||||||||
U.S. Treasury Bill (z)## | 2.04 | 1-16-2020 | 100,000,000 | 99,056,167 | ||||||||||||
U.S. Treasury Bill (z) | 2.05 | 1-30-2020 | 80,000,000 | 79,173,922 | ||||||||||||
U.S. Treasury Bill (z) | 2.09 | 1-2-2020 | 80,000,000 | 79,291,600 | ||||||||||||
U.S. Treasury Bill (z) | 2.10 | 1-9-2020 | 280,000,000 | 277,397,256 | ||||||||||||
U.S. Treasury Bill (z) | 2.47 | 8-8-2019 | 130,000,000 | 129,938,322 | ||||||||||||
U.S. Treasury Bill (z)## | 2.47 | 8-15-2019 | 200,000,000 | 199,809,950 | ||||||||||||
U.S. Treasury Bill (z) | 2.48 | 8-22-2019 | 100,000,000 | 99,857,083 | ||||||||||||
U.S. Treasury Bill (z) | 2.50 | 8-29-2019 | 125,000,000 | 124,760,347 | ||||||||||||
U.S. Treasury Note | 0.75 | 8-15-2019 | 70,000,000 | 69,950,073 | ||||||||||||
U.S. Treasury Note | 1.13 | 3-31-2020 | 125,000,000 | 124,240,872 | ||||||||||||
U.S. Treasury Note | 1.25 | 2-29-2020 | 370,000,000 | 368,227,412 | ||||||||||||
U.S. Treasury Note | 1.38 | 1-31-2020 | 100,000,000 | 99,630,923 | ||||||||||||
The accompanying notes are an integral part of these financial statements.
Government Money Market Funds | 15
Table of Contents
Portfolio of investments—July 31, 2019 (unaudited)
Interest rate | Maturity date | Principal | Value | |||||||||||||
| Treasury Debt(continued) | ||||||||||||||||
U.S. Treasury Note | 1.38 | % | 2-29-2020 | $ | 100,000,000 | $ | 99,610,591 | |||||||||
U.S. Treasury Note | 1.38 | 4-30-2020 | 50,000,000 | 49,730,859 | ||||||||||||
U.S. Treasury Note | 1.50 | 10-31-2019 | 70,000,000 | 69,821,484 | ||||||||||||
U.S. Treasury Note | 1.50 | 4-15-2020 | 30,000,000 | 29,882,721 | ||||||||||||
U.S. Treasury Note | 1.50 | 5-15-2020 | 80,000,000 | 79,666,786 | ||||||||||||
U.S. Treasury Note (U.S. Treasury 3 Month Bill Money Market Yield +0.05%)± | 2.10 | 10-31-2020 | 500,000,000 | 499,471,800 | ||||||||||||
U.S. Treasury Note (U.S. Treasury 3 Month Bill Money Market Yield +0.12%)± | 2.17 | 1-31-2021 | 1,120,000,000 | 1,119,367,964 | ||||||||||||
U.S. Treasury Note (U.S. Treasury 3 Month Bill Money Market Yield +0.14%)± | 2.19 | 4-30-2021 | 770,000,000 | 769,895,896 | ||||||||||||
U.S. Treasury Note | 2.25 | 2-29-2020 | 50,000,000 | 50,054,792 | ||||||||||||
U.S. Treasury Note | 2.25 | 3-31-2020 | 100,000,000 | 100,130,260 | ||||||||||||
U.S. Treasury Note (U.S. Treasury 3 Month Bill Money Market Yield +0.22%)± | 2.27 | 7-31-2021 | 50,000,000 | 50,000,000 | ||||||||||||
U.S. Treasury Note | 2.38 | 4-30-2020 | 180,000,000 | 180,456,057 | ||||||||||||
U.S. Treasury Note | 2.50 | 5-31-2020 | 130,000,000 | 130,465,097 | ||||||||||||
U.S. Treasury Note | 3.63 | 8-15-2019 | 30,000,000 | 30,011,627 | ||||||||||||
U.S. Treasury Note | 3.63 | 2-15-2020 | 100,000,000 | 100,817,731 | ||||||||||||
Total Treasury Debt (Cost $5,536,880,554) | 5,536,880,554 | |||||||||||||||
|
| |||||||||||||||
| Total investments in securities (Cost $83,016,310,788) | 100.67 | % | 83,016,310,788 | |||||
Other assets and liabilities, net | (0.67 | ) | (548,437,529 | ) | ||||
|
|
|
| |||||
| Total net assets | 100.00 | % | $ | 82,467,873,259 | ||||
|
|
|
| |||||
| (z) | Zero coupon security. The rate represents the current yield to maturity. |
| ± | Variable rate investment. The rate shown is the rate in effect at period end. |
| %% | The security is purchased on a when-issued basis. |
| § | The security is subject to a demand feature which reduces the effective maturity. |
| ø | Variable rate demand notes are subject to a demand feature which reduces the effective maturity. The maturity date shown represents the final maturity date of the security. The interest rate is determined and reset by the issuer daily, weekly, or monthly depending upon the terms of the security. The rate shown is the rate in effect at period end. |
| ¢ | The security represents a long-dated and extendible repurchase agreement which automatically renews on previously set terms. The maturity date represents the next put date. |
| øø | The interest rate is determined and reset by the issuer periodically depending upon the terms of the security. The rate shown is the rate in effect at period end. |
| ## | All or a portion of this security is segregated for when-issued securities. |
| ^^ | Collateralized by: |
| (1) | U.S. government securities, 3.00% to 4.50%, 3-20-2045 to 5-1-2049, fair value including accrued interest is $1,526,357,001. |
| (2) | U.S. government securities, 2.00% to 7.50%, 3-30-2020 to 10-20-2068, fair value including accrued interest is $360,381,096. |
| (3) | U.S. government securities, 2.40% to 6.50%, 11-1-2020 to 8-1-2049, fair value including accrued interest is $1,910,650,000. |
| (4) | U.S. government securities, 1.63% to 1.75%, 6-30-2021 to 7-15-2022, fair value including accrued interest is $1,476,756,026. |
| (5) | U.S. government securities, 0.00% to 7.50%, 9-30-2019 to 6-20-2049, fair value including accrued interest is $563,979,555. |
| (6) | U.S. government securities, 0.00% to 4.50%, 8-20-2019 to 2-15-2048, fair value including accrued interest is $382,500,289. |
| (7) | U.S. government securities, 0.00% to 8.75%, 9-12-2019 to 8-17-2038, fair value including accrued interest is $102,000,000. |
| (8) | U.S. government securities, 0.00% to 7.00%, 12-15-2019 to 6-20-2049, fair value including accrued interest is $870,084,277. |
| (9) | U.S. government securities, 0.00% to 8.60%, 8-15-2019 to 9-15-2065, fair value including accrued interest is $255,166,556. |
| (10) | U.S. government securities, 0.00% to 10.00%, 8-15-2019 to 10-20-2067, fair value including accrued interest is $255,162,010. |
| (11) | U.S. government securities, 0.00% to 11.00%, 8-29-2019 to 7-1-2049, fair value including accrued interest is $255,005,239. |
| (12) | U.S. government securities, 0.00% to 7.13%, 8-15-2019 to 2-15-2049, fair value including accrued interest is $1,530,000,000. |
| (13) | U.S. government securities, 0.63% to 8.13%, 7-15-2020 to 7-15-2021, fair value including accrued interest is $510,000,104. |
| (14) | U.S. government securities, 0.50% to 1.63%, 11-30-2020 to 1-15-2028, fair value including accrued interest is $408,000,011. |
| (15) | U.S. government securities, 2.50% to 6.00%, 1-1-2027 to 6-20-2049, fair value including accrued interest is $1,081,500,001. |
The accompanying notes are an integral part of these financial statements.
16 | Government Money Market Funds
Table of Contents
Portfolio of investments—July 31, 2019 (unaudited)
| (16) | U.S. government securities, 3.00% to 5.00%, 3-15-2038 to 3-20-2049, fair value including accrued interest is $309,000,000. |
| (17) | U.S. government securities, 0.00% to 5.50%, 8-15-2019 to 8-1-2049, fair value including accrued interest is $1,026,543,463. |
| (18) | U.S. government securities, 0.00% to 6.50%, 8-15-2019 to 7-1-2049, fair value including accrued interest is $511,753,652. |
| (19) | U.S. government securities, 0.00% to 7.50%, 6-15-2020 to 8-1-2049, fair value including accrued interest is $2,054,756,714. |
| (20) | U.S. government securities, 1.75% to 2.63%, 11-30-2021 to 12-15-2021, fair value including accrued interest is $1,275,003,870. |
| (21) | U.S. government securities, 0.13% to 2.50%, 3-31-2024 to 2-15-2027, fair value including accrued interest is $1,275,002,368. |
| (22) | U.S. government securities, 2.63% to 2.88%, 2-28-2023 to 4-30-2025, fair value including accrued interest is $1,785,085,902. |
| (23) | U.S. government securities, 2.25% to 3.13%, 5-15-2028 to 2-15-2047, fair value including accrued interest is $2,040,002,300. |
| (24) | U.S. government securities, 1.88% to 2.88%, 6-30-2021 to 3-31-2022, fair value including accrued interest is $765,001,292. |
| (25) | U.S. government securities, 1.63% to 3.75%, 6-30-2020 to 2-15-2049, fair value including accrued interest is $8,670,000,715. |
| (26) | U.S. government securities, 0.75% to 8.50%, 1-1-2020 to 6-15-2053, fair value including accrued interest is $112,269,794. |
| (27) | U.S. government securities, 0.00% to 3.63%, 8-15-2019 to 5-15-2049, fair value including accrued interest is $377,400,000. |
| (28) | U.S. government securities, 2.51% to 5.00%, 11-1-2024 to 5-1-2058, fair value including accrued interest is $103,000,000. |
| (29) | U.S. government securities, 2.35% to 6.50%, 5-1-2023 to 7-1-2052, fair value including accrued interest is $206,000,000. |
| (30) | U.S. government securities, 2.24% to 5.00%, 11-1-2026 to 5-1-2058, fair value including accrued interest is $206,000,000. |
| (31) | U.S. government securities, 2.40% to 6.50%, 3-1-2024 to 5-1-2058, fair value including accrued interest is $309,000,000. |
| (32) | U.S. government securities, 2.77% to 7.00%, 6-1-2025 to 9-1-2057, fair value including accrued interest is $360,500,000. |
| (33) | U.S. government securities, 2.24% to 5.50%, 8-1-2024 to 5-1-2058, fair value including accrued interest is $206,000,001. |
| (34) | U.S. government securities, 2.44% to 5.50%, 12-1-2025 to 5-1-2058, fair value including accrued interest is $257,500,000. |
| (35) | U.S. government securities, 2.21% to 5.50%, 3-1-2025 to 5-1-2058, fair value including accrued interest is $412,000,000. |
| (36) | U.S. government securities, 1.75% to 2.50%, 10-31-2020 to 2-29-2024, fair value including accrued interest is $408,164,198. |
| (37) | U.S. government securities, 2.40% to 6.00%, 7-1-2024 to 9-1-2057, fair value including accrued interest is $412,000,000. |
| (38) | U.S. government securities, 0.00% to 9.38%, 10-15-2020 to 2-15-2048, fair value including accrued interest is $510,087,265. |
| (39) | U.S. government securities, 2.14% to 5.50%, 8-1-2023 to 7-1-2049, fair value including accrued interest is $206,000,000. |
| (40) | U.S. government securities, 0.00% to 5.50%, 10-1-2023 to 7-1-2049, fair value including accrued interest is $514,947,838. |
| (41) | U.S. government securities, 2.00% to 7.00%, 10-1-2019 to 11-1-2048, fair value including accrued interest is $669,500,000. |
| (42) | U.S. government securities, 1.25% to 4.50%, 1-31-2021 to 2-15-2036, fair value including accrued interest is $255,000,003. |
| (43) | U.S. government securities, 1.25% to 3.00%, 9-30-2020 to 2-15-2048, fair value including accrued interest is $1,224,000,000. |
| (44) | U.S. government securities, 1.25% to 3.00%, 11-15-2020 to 11-15-2045, fair value including accrued interest is $255,000,011. |
| (45) | U.S. government securities, 0.00% to 9.00%, 12-1-2019 to 1-20-2069, fair value including accrued interest is $2,780,635,457. |
| (46) | U.S. government securities, 0.00% to 3.00%, 5-15-2020 to 5-15-2045, fair value including accrued interest is $104,166,225. |
| (47) | U.S. government securities, 0.00%, 11-15-2021 to 11-15-2029, fair value is $542,358,225. |
| (48) | U.S. government securities, 0.00% to 6.50%, 9-10-2019 to 5-20-2049, fair value including accrued interest is $257,486,499. |
| (49) | U.S. government securities, 0.00% to 3.63%, 11-30-2019 to 8-15-2048, fair value including accrued interest is $540,600,032. |
| (50) | U.S. government securities, 0.00% to 6.63%, 8-15-2019 to 11-15-2048, fair value including accrued interest is $663,000,007. |
| (51) | U.S. government securities, 2.50% to 7.00%, 11-1-2022 to 6-20-2049, fair value including accrued interest is $1,133,000,001. |
| (52) | U.S. government securities, 0.00% to 2.88%, 8-1-2019 to 8-15-2028, fair value including accrued interest is $408,000,038. |
| (53) | U.S. government securities, 1.55% to 5.00%, 9-30-2021 to 7-20-2067, fair value including accrued interest is $2,059,856,239. |
| (54) | U.S. government securities, 1.38% to 6.00%, 11-30-2019 to 2-15-2049, fair value including accrued interest is $1,147,500,066. |
| (55) | U.S. government securities, 0.00% to 6.50%, 9-12-2019 to 1-20-2064, fair value including accrued interest is $411,804,457. |
| (56) | U.S. government securities, 3.50%, 2-1-2047 to 5-1-2048, fair value including accrued interest is $200,596,447. |
| (57) | U.S. government securities, 1.75% to 2.75%, 1-15-2021 to 1-31-2025, fair value including accrued interest is $205,145,170. |
| (58) | U.S. government securities, 2.00% to 3.50%, 12-1-2046 to 1-15-2021, fair value including accrued interest is $639,985,315. |
| (59) | U.S. government securities, 3.50%, 8-1-2047 to 5-1-2048, fair value including accrued interest is $640,268,888. |
| (60) | U.S. government securities, 3.50%, 12-1-2047, fair value including accrued interest is $317,306,651. |
| (61) | U.S. government securities, 3.50% to 4.50%, 6-15-2039 to 7-1-2049, fair value including accrued interest is $566,500,000. |
Abbreviations:
| FFCB | Federal Farm Credit Banks |
| FHLB | Federal Home Loan Bank |
| FHLMC | Federal Home Loan Mortgage Corporation |
| FNMA | Federal National Mortgage Association |
| LIBOR | London Interbank Offered Rate |
| LIQ | Liquidity agreement |
| LOC | Letter of credit |
| PFA | Public Finance Authority |
| SOFR | Secured Overnight Financing Rate |
The accompanying notes are an integral part of these financial statements.
Government Money Market Funds | 17
Table of Contents
Statement of assets and liabilities—July 31, 2019 (unaudited)
Assets | ||||
Investments in repurchase agreements, at amortized cost | $ | 49,619,933,333 | ||
Investments in unaffiliated securities, at amortized cost | 33,396,377,455 | |||
Cash | 2,175,726 | |||
Receivable for Fund shares sold | 4,182,997 | |||
Receivable for interest | 70,266,721 | |||
Prepaid expenses and other assets | 1,096,351 | |||
|
| |||
Total assets | 83,094,032,583 | |||
|
| |||
Liabilities | ||||
Payable for investments purchased | 539,170,927 | |||
Dividends payable | 69,290,957 | |||
Management fee payable | 7,112,628 | |||
Payable for Fund shares redeemed | 4,063,323 | |||
Administration fees payable | 3,946,539 | |||
Trustees’ fees and expenses payable | 2,176 | |||
Distribution fee payable | 30 | |||
Accrued expenses and other liabilities | 2,572,744 | |||
|
| |||
Total liabilities | 626,159,324 | |||
|
| |||
Total net assets | $ | 82,467,873,259 | ||
|
| |||
Net assets consist of | ||||
Paid-in capital | $ | 82,467,710,121 | ||
Total distributable earnings | 163,138 | |||
|
| |||
Total net assets | $ | 82,467,873,259 | ||
|
| |||
Computation of net asset value per share | ||||
Net assets – Class A | $ | 330,714,150 | ||
Shares outstanding – Class A1 | 330,713,554 | |||
Net asset value per share – Class A | $1.00 | |||
Net assets – Administrator Class | $ | 2,671,694,433 | ||
Shares outstanding – Administrator Class1 | 2,671,686,917 | |||
Net asset value per share – Administrator Class | $1.00 | |||
Net assets – Institutional Class | $ | 27,028,296,788 | ||
Shares outstanding – Institutional Class1 | 27,028,314,333 | |||
Net asset value per share – Institutional Class | $1.00 | |||
Net assets – Select Class | $ | 50,570,164,394 | ||
Shares outstanding – Select Class1 | 50,570,055,992 | |||
Net asset value per share – Select Class | $1.00 | |||
Net assets – Service Class | $ | 1,866,903,419 | ||
Shares outstanding – Service Class1 | 1,866,901,154 | |||
Net asset value per share – Service Class | $1.00 | |||
Net assets – Sweep Class | $ | 100,075 | ||
Shares outstanding – Sweep Class1 | 100,075 | |||
Net asset value per share – Sweep Class | $1.00 | |||
| 1 | The Fund has an unlimited number of authorized shares. |
The accompanying notes are an integral part of these financial statements.
18 | Government Money Market Funds
Table of Contents
Statement of operations—six months ended July 31, 2019 (unaudited)
Investment income | ||||
Interest | $ | 938,909,391 | ||
|
| |||
Expenses | ||||
Management fee | 50,354,563 | |||
Administration fees | ||||
Class A | 350,945 | |||
Administrator Class | 1,293,196 | |||
Institutional Class | 10,632,733 | |||
Select Class | 8,986,307 | |||
Service Class | 1,143,180 | |||
Sweep Class | 14 | |||
Shareholder servicing fees | ||||
Class A | 398,801 | |||
Administrator Class | 1,292,779 | |||
Service Class | 2,370,030 | |||
Sweep Class | 125 | |||
Distribution fee | ||||
Sweep Class | 174 | |||
Custody and accounting fees | 1,097,779 | |||
Professional fees | 29,523 | |||
Registration fees | 199,185 | |||
Shareholder report expenses | 95,568 | |||
Trustees’ fees and expenses | 10,561 | |||
Other fees and expenses | 244,829 | |||
|
| |||
Total expenses | 78,500,292 | |||
Less: Fee waivers and/or expense reimbursements | (10,395,118 | ) | ||
|
| |||
Net expenses | 68,105,174 | |||
|
| |||
Net investment income | 870,804,217 | |||
Net realized losses on investments | (2,695 | ) | ||
|
| |||
Net increase in net assets resulting from operations | $ | 870,801,522 | ||
|
| |||
The accompanying notes are an integral part of these financial statements.
Government Money Market Funds | 19
Table of Contents
Statement of changes in net assets
Six months ended (unaudited) | Year ended January 31, 2019 | |||||||||||||||
Operations | ||||||||||||||||
Net investment income | $ | 870,804,217 | $ | 1,305,787,958 | ||||||||||||
Net realized gains (losses) on investments | (2,695 | ) | 113,882 | |||||||||||||
|
| |||||||||||||||
Net increase in net assets resulting from operations | 870,801,522 | 1,305,901,840 | ||||||||||||||
|
| |||||||||||||||
Distributions to shareholders from net investment income and net realized gains | ||||||||||||||||
Class A | (2,969,385 | ) | (3,957,680 | ) | ||||||||||||
Administrator Class | (27,476,941 | ) | (29,903,434 | ) | ||||||||||||
Institutional Class | (300,488,811 | ) | (426,556,283 | ) | ||||||||||||
Select Class | (521,176,563 | ) | (811,926,883 | ) | ||||||||||||
Service Class | (18,691,675 | ) | (33,480,248 | ) | ||||||||||||
Sweep Class | (842 | ) | (1,208 | ) | ||||||||||||
|
| |||||||||||||||
Total distributions to shareholders | (870,804,217 | ) | (1,305,825,736 | ) | ||||||||||||
|
| |||||||||||||||
Capital share transactions | Shares | Shares | ||||||||||||||
Proceeds from shares sold | ||||||||||||||||
Class A | 128,728,249 | 128,728,249 | 180,404,669 | 180,404,669 | ||||||||||||
Administrator Class | 6,713,911,985 | 6,713,911,985 | 12,061,432,644 | 12,061,432,644 | ||||||||||||
Institutional Class | 97,991,832,692 | 97,991,832,692 | 167,832,722,754 | 167,832,722,754 | ||||||||||||
Select Class | 235,878,444,980 | 235,878,444,980 | 503,603,165,936 | 503,603,165,936 | ||||||||||||
Service Class | 27,011,989,952 | 27,011,989,952 | 67,069,453,268 | 67,069,453,268 | ||||||||||||
|
| |||||||||||||||
| 367,724,907,858 | 750,747,179,271 | |||||||||||||||
|
| |||||||||||||||
Reinvestment of distributions | ||||||||||||||||
Class A | 2,955,691 | 2,955,691 | 3,921,415 | 3,921,415 | ||||||||||||
Administrator Class | 9,195,162 | 9,195,162 | 9,796,111 | 9,796,111 | ||||||||||||
Institutional Class | 95,145,868 | 95,145,868 | 141,402,397 | 141,402,397 | ||||||||||||
Select Class | 341,980,237 | 341,980,237 | 518,390,777 | 518,390,777 | ||||||||||||
Service Class | 2,190,027 | 2,190,027 | 4,616,938 | 4,616,938 | ||||||||||||
|
| |||||||||||||||
| 451,466,985 | 678,127,638 | |||||||||||||||
|
| |||||||||||||||
Payment for shares redeemed | ||||||||||||||||
Class A | (112,588,373 | ) | (112,588,373 | ) | (137,442,666 | ) | (137,442,666 | ) | ||||||||
Administrator Class | (6,462,902,960 | ) | (6,462,902,960 | ) | (11,214,508,321 | ) | (11,214,508,321 | ) | ||||||||
Institutional Class | (97,059,192,027 | ) | (97,059,192,027 | ) | (163,904,920,231 | ) | (163,904,920,231 | ) | ||||||||
Select Class | (230,985,746,548 | ) | (230,985,746,548 | ) | (505,074,881,063 | ) | (505,074,881,063 | ) | ||||||||
Service Class | (27,003,655,519 | ) | (27,003,655,519 | ) | (67,724,591,715 | ) | (67,724,591,715 | ) | ||||||||
|
| |||||||||||||||
| (361,624,085,427 | ) | (748,056,343,996 | ) | |||||||||||||
|
| |||||||||||||||
Net increase in net assets resulting from capital share transactions | 6,552,289,416 | 3,368,962,913 | ||||||||||||||
|
| |||||||||||||||
Total increase in net assets | 6,552,286,721 | 3,369,039,017 | ||||||||||||||
|
| |||||||||||||||
Net assets | ||||||||||||||||
Beginning of period | 75,915,586,538 | 72,546,547,521 | ||||||||||||||
|
| |||||||||||||||
End of period | $ | 82,467,873,259 | $ | 75,915,586,538 | ||||||||||||
|
| |||||||||||||||
The accompanying notes are an integral part of these financial statements.
20 | Government Money Market Funds
Table of Contents
(For a share outstanding throughout each period)
| Six months ended July 31, 2019 (unaudited) | Year ended January 31 | |||||||||||||||||||||||
| CLASS A | 2019 | 2018 | 2017 | 2016 | 2015 | |||||||||||||||||||
Net asset value, beginning of period | $1.00 | $1.00 | $1.00 | $1.00 | $1.00 | $1.00 | ||||||||||||||||||
Net investment income | 0.01 | 0.01 | 0.00 | 1 | 0.00 | 1 | 0.00 | 1 | 0.00 | 1 | ||||||||||||||
Net realized gains (losses) on investments | (0.00 | )2 | 0.00 | 1 | 0.00 | 1 | 0.00 | 1 | 0.00 | 1 | (0.00 | )2 | ||||||||||||
|
|
|
|
|
|
|
|
|
|
|
| |||||||||||||
Total from investment operations | 0.01 | 0.01 | 0.00 | 1 | 0.00 | 1 | 0.00 | 1 | 0.00 | 1 | ||||||||||||||
Distributions to shareholders from | ||||||||||||||||||||||||
Net investment income | (0.01 | ) | (0.01 | ) | (0.00 | )1 | (0.00 | )1 | (0.00 | )1 | (0.00 | )1 | ||||||||||||
Net realized gains | 0.00 | (0.00 | )1 | (0.00 | )1 | 0.00 | 0.00 | (0.00 | )1 | |||||||||||||||
|
|
|
|
|
|
|
|
|
|
|
| |||||||||||||
Total distributions to shareholders | (0.01 | ) | (0.01 | ) | (0.00 | )1 | (0.00 | )1 | (0.00 | )1 | (0.00 | )1 | ||||||||||||
Net asset value, end of period | $1.00 | $1.00 | $1.00 | $1.00 | $1.00 | $1.00 | ||||||||||||||||||
Total return3 | 0.93 | % | 1.38 | % | 0.38 | % | 0.01 | % | 0.01 | % | 0.01 | % | ||||||||||||
Ratios to average net assets (annualized) | ||||||||||||||||||||||||
Gross expenses | 0.61 | % | 0.61 | % | 0.61 | % | 0.61 | % | 0.61 | % | 0.61 | % | ||||||||||||
Net expenses | 0.60 | % | 0.60 | % | 0.61 | % | 0.41 | % | 0.13 | % | 0.09 | % | ||||||||||||
Net investment income | 1.86 | % | 1.39 | % | 0.38 | % | 0.01 | % | 0.01 | % | 0.01 | % | ||||||||||||
Supplemental data | ||||||||||||||||||||||||
Net assets, end of period (000s omitted) | $330,714 | $311,616 | $264,735 | $274,083 | $265,119 | $308,757 | ||||||||||||||||||
| 1 | Amount is less than $0.005. |
| 2 | Amount is more than $(0.005). |
| 3 | Returns for periods of less than one year are not annualized. |
The accompanying notes are an integral part of these financial statements.
Government Money Market Funds | 21
Table of Contents
Financial highlights
(For a share outstanding throughout each period)
| Six months ended July 31, 2019 (unaudited) | Year ended January 31 | |||||||||||||||||||||||
| ADMINISTRATOR CLASS | 2019 | 2018 | 2017 | 2016 | 2015 | |||||||||||||||||||
Net asset value, beginning of period | $1.00 | $1.00 | $1.00 | $1.00 | $1.00 | $1.00 | ||||||||||||||||||
Net investment income | 0.01 | 0.02 | 0.01 | 0.00 | 1 | 0.00 | 1 | 0.00 | 1 | |||||||||||||||
Net realized gains (losses) on investments | (0.00 | )2 | 0.00 | 1 | 0.00 | 1 | 0.00 | 1 | 0.00 | 1 | (0.00 | )2 | ||||||||||||
|
|
|
|
|
|
|
|
|
|
|
| |||||||||||||
Total from investment operations | 0.01 | 0.02 | 0.01 | 0.00 | 1 | 0.00 | 1 | 0.00 | 1 | |||||||||||||||
Distributions to shareholders from | ||||||||||||||||||||||||
Net investment income | (0.01 | ) | (0.02 | ) | (0.01 | ) | (0.00 | )1 | (0.00 | )1 | (0.00 | )1 | ||||||||||||
Net realized gains | 0.00 | (0.00 | )1 | (0.00 | )1 | 0.00 | 0.00 | (0.00 | )1 | |||||||||||||||
|
|
|
|
|
|
|
|
|
|
|
| |||||||||||||
Total distributions to shareholders | (0.01 | ) | (0.02 | ) | (0.01 | ) | (0.00 | )1 | (0.00 | )1 | (0.00 | )1 | ||||||||||||
Net asset value, end of period | $1.00 | $1.00 | $1.00 | $1.00 | $1.00 | $1.00 | ||||||||||||||||||
Total return3 | 1.06 | % | 1.65 | % | 0.65 | % | 0.10 | % | 0.01 | % | 0.01 | % | ||||||||||||
Ratios to average net assets (annualized) | ||||||||||||||||||||||||
Gross expenses | 0.34 | % | 0.34 | % | 0.34 | % | 0.34 | % | 0.34 | % | 0.34 | % | ||||||||||||
Net expenses | 0.34 | % | 0.34 | % | 0.34 | % | 0.31 | % | 0.12 | % | 0.09 | % | ||||||||||||
Net investment income | 2.12 | % | 1.67 | % | 0.72 | % | 0.11 | % | 0.01 | % | 0.01 | % | ||||||||||||
Supplemental data | ||||||||||||||||||||||||
Net assets, end of period (000s omitted) | $2,671,694 | $2,411,490 | $1,554,764 | $443,500 | $382,043 | $644,666 | ||||||||||||||||||
| 1 | Amount is less than $0.005. |
| 2 | Amount is more than $(0.005). |
| 3 | Returns for periods of less than one year are not annualized. |
The accompanying notes are an integral part of these financial statements.
22 | Government Money Market Funds
Table of Contents
Financial highlights
(For a share outstanding throughout each period)
| Six months ended July 31, 2019 (unaudited) | Year ended January 31 | |||||||||||||||||||||||
| INSTITUTIONAL CLASS | 2019 | 2018 | 2017 | 2016 | 2015 | |||||||||||||||||||
Net asset value, beginning of period | $1.00 | $1.00 | $1.00 | $1.00 | $1.00 | $1.00 | ||||||||||||||||||
Net investment income | 0.01 | 0.02 | 0.01 | 0.00 | 1 | 0.00 | 1 | 0.00 | 1 | |||||||||||||||
Net realized gains (losses) on investments | (0.00 | )2 | 0.00 | 1 | 0.00 | 1 | 0.00 | 1 | 0.00 | 1 | (0.00 | )2 | ||||||||||||
|
|
|
|
|
|
|
|
|
|
|
| |||||||||||||
Total from investment operations | 0.01 | 0.02 | 0.01 | 0.00 | 1 | 0.00 | 1 | 0.00 | 1 | |||||||||||||||
Distributions to shareholders from | ||||||||||||||||||||||||
Net investment income | (0.01 | ) | (0.02 | ) | (0.01 | ) | (0.00 | )1 | (0.00 | )1 | (0.00 | )1 | ||||||||||||
Net realized gains | 0.00 | (0.00 | )1 | (0.00 | )1 | 0.00 | 0.00 | (0.00 | )1 | |||||||||||||||
|
|
|
|
|
|
|
|
|
|
|
| |||||||||||||
Total distributions to shareholders | (0.01 | ) | (0.02 | ) | (0.01 | ) | (0.00 | )1 | (0.00 | )1 | (0.00 | )1 | ||||||||||||
Net asset value, end of period | $1.00 | $1.00 | $1.00 | $1.00 | $1.00 | $1.00 | ||||||||||||||||||
Total return3 | 1.13 | % | 1.79 | % | 0.79 | % | 0.24 | % | 0.02 | % | 0.01 | % | ||||||||||||
Ratios to average net assets (annualized) | ||||||||||||||||||||||||
Gross expenses | 0.22 | % | 0.22 | % | 0.22 | % | 0.22 | % | 0.22 | % | 0.22 | % | ||||||||||||
Net expenses | 0.20 | % | 0.20 | % | 0.20 | % | 0.17 | % | 0.12 | % | 0.09 | % | ||||||||||||
Net investment income | 2.26 | % | 1.79 | % | 0.79 | % | 0.25 | % | 0.02 | % | 0.01 | % | ||||||||||||
Supplemental data | ||||||||||||||||||||||||
Net assets, end of period (000s omitted) | $27,028,297 | $26,000,569 | $21,931,321 | $23,242,417 | $14,212,988 | $17,509,698 | ||||||||||||||||||
| 1 | Amount is less than $0.005. |
| 2 | Amount is more than $(0.005). |
| 3 | Returns for periods of less than one year are not annualized. |
The accompanying notes are an integral part of these financial statements.
Government Money Market Funds | 23
Table of Contents
Financial highlights
(For a share outstanding throughout each period)
| Six months ended July 31, 2019 (unaudited) | Year ended January 31 | |||||||||||||||||||
| SELECT CLASS | 2019 | 2018 | 2017 | 20161 | ||||||||||||||||
Net asset value, beginning of period | $1.00 | $1.00 | $1.00 | $1.00 | $1.00 | |||||||||||||||
Net investment income | 0.01 | 0.02 | 0.01 | 0.00 | 2 | 0.00 | 2 | |||||||||||||
Net realized gains (losses) on investments | (0.00 | )3 | 0.00 | 2 | 0.00 | 0.00 | 2 | 0.00 | 2 | |||||||||||
|
|
|
|
|
|
|
|
|
| |||||||||||
Total from investment operations | 0.01 | 0.02 | 0.01 | 0.00 | 2 | 0.00 | 2 | |||||||||||||
Distributions to shareholders from | ||||||||||||||||||||
Net investment income | (0.01 | ) | (0.02 | ) | (0.01 | ) | (0.00 | )2 | (0.00 | )2 | ||||||||||
Net realized gains | 0.00 | (0.00 | )2 | (0.00 | )2 | 0.00 | 0.00 | |||||||||||||
|
|
|
|
|
|
|
|
|
| |||||||||||
Total distributions to shareholders | (0.01 | ) | (0.02 | ) | (0.01 | ) | (0.00 | )2 | (0.00 | )2 | ||||||||||
Net asset value, end of period | $1.00 | $1.00 | $1.00 | $1.00 | $1.00 | |||||||||||||||
Total return4 | 1.16 | % | 1.85 | % | 0.85 | % | 0.30 | % | 0.04 | % | ||||||||||
Ratios to average net assets (annualized) | ||||||||||||||||||||
Gross expenses | 0.18 | % | 0.18 | % | 0.18 | % | 0.18 | % | 0.18 | % | ||||||||||
Net expenses | 0.14 | % | 0.14 | % | 0.14 | % | 0.11 | % | 0.10 | % | ||||||||||
Net investment income | 2.32 | % | 1.82 | % | 0.86 | % | 0.34 | % | 0.08 | % | ||||||||||
Supplemental data | ||||||||||||||||||||
Net assets, end of period (000s omitted) | $50,570,164 | $45,335,385 | $46,288,730 | $38,999,425 | $7,985,195 | |||||||||||||||
| 1 | For the period from June 30, 2015 (commencement of class operations) to January 31, 2016 |
| 2 | Amount is less than $0.005. |
| 3 | Amount is more than $(0.005). |
| 4 | Returns for periods of less than one year are not annualized. |
The accompanying notes are an integral part of these financial statements.
24 | Government Money Market Funds
Table of Contents
Financial highlights
(For a share outstanding throughout each period)
| Six months ended July 31, 2019 (unaudited) | Year ended January 31 | |||||||||||||||||||||||
| SERVICE CLASS | 2019 | 2018 | 2017 | 2016 | 2015 | |||||||||||||||||||
Net asset value, beginning of period | $1.00 | $1.00 | $1.00 | $1.00 | $1.00 | $1.00 | ||||||||||||||||||
Net investment income | 0.01 | 0.01 | 0.00 | 1 | 0.00 | 1 | 0.00 | 1 | 0.00 | 1 | ||||||||||||||
Net realized gains (losses) on investments | (0.00 | )2 | 0.00 | 1 | 0.00 | 1 | 0.00 | 1 | 0.00 | 1 | (0.00 | )2 | ||||||||||||
|
|
|
|
|
|
|
|
|
|
|
| |||||||||||||
Total from investment operations | 0.01 | 0.01 | 0.00 | 1 | 0.00 | 1 | 0.00 | 1 | 0.00 | 1 | ||||||||||||||
Distributions to shareholders from | ||||||||||||||||||||||||
Net investment income | (0.01 | ) | (0.01 | ) | (0.00 | )1 | (0.00 | )1 | (0.00 | )1 | (0.00 | )1 | ||||||||||||
Net realized gains | 0.00 | (0.00 | )1 | (0.00 | )1 | 0.00 | 0.00 | (0.00 | )1 | |||||||||||||||
|
|
|
|
|
|
|
|
|
|
|
| |||||||||||||
Total distributions to shareholders | (0.01 | ) | (0.01 | ) | (0.00 | )1 | (0.00 | )1 | (0.00 | )1 | (0.00 | )1 | ||||||||||||
Net asset value, end of period | $1.00 | $1.00 | $1.00 | $1.00 | $1.00 | $1.00 | ||||||||||||||||||
Total return3 | 0.98 | % | 1.48 | % | 0.49 | % | 0.02 | % | 0.01 | % | 0.01 | % | ||||||||||||
Ratios to average net assets (annualized) | ||||||||||||||||||||||||
Gross expenses | 0.51 | % | 0.51 | % | 0.51 | % | 0.51 | % | 0.51 | % | 0.51 | % | ||||||||||||
Net expenses | 0.50 | % | 0.50 | % | 0.50 | % | 0.40 | % | 0.13 | % | 0.09 | % | ||||||||||||
Net investment income | 1.96 | % | 1.45 | % | 0.48 | % | 0.02 | % | 0.01 | % | 0.01 | % | ||||||||||||
Supplemental data | ||||||||||||||||||||||||
Net assets, end of period (000s omitted) | $1,866,903 | $1,856,426 | $2,506,898 | $2,992,780 | $2,963,813 | $4,129,813 | ||||||||||||||||||
| 1 | Amount is less than $0.005. |
| 2 | Amount is more than $(0.005). |
| 3 | Returns for periods of less than one year are not annualized. |
The accompanying notes are an integral part of these financial statements.
Government Money Market Funds | 25
Table of Contents
Financial highlights
(For a share outstanding throughout each period)
| Six months ended July 31, 2019 (unaudited) | Year ended January 31 | |||||||||||||||||||||||
| SWEEP CLASS | 2019 | 2018 | 2017 | 2016 | 2015 | |||||||||||||||||||
Net asset value, beginning of period | $1.00 | $1.00 | $1.00 | $1.00 | $1.00 | $1.00 | ||||||||||||||||||
Net investment income | 0.01 | 0.01 | 0.00 | 1 | 0.00 | 1 | 0.00 | 1 | 0.00 | 1 | ||||||||||||||
Net realized gains (losses) on investments | (0.00 | )2 | 0.00 | 1 | 0.00 | 1 | 0.00 | 1 | 0.00 | 1 | (0.00 | )2 | ||||||||||||
|
|
|
|
|
|
|
|
|
|
|
| |||||||||||||
Total from investment operations | 0.01 | 0.01 | 0.00 | 1 | 0.00 | 1 | 0.00 | 1 | 0.00 | 1 | ||||||||||||||
Distributions to shareholders from | ||||||||||||||||||||||||
Net investment income | (0.01 | ) | (0.01 | ) | (0.00 | )1 | (0.00 | )1 | (0.00 | )1 | (0.00 | )1 | ||||||||||||
Net realized gains | 0.00 | (0.00 | )1 | (0.00 | )1 | 0.00 | 0.00 | (0.00 | )1 | |||||||||||||||
|
|
|
|
|
|
|
|
|
|
|
| |||||||||||||
Total distributions to shareholders | (0.01 | ) | (0.01 | ) | (0.00 | )1 | (0.00 | )1 | (0.00 | )1 | (0.00 | )1 | ||||||||||||
Net asset value, end of period | $1.00 | $1.00 | $1.00 | $1.00 | $1.00 | $1.00 | ||||||||||||||||||
Total return3 | 0.84 | % | 1.21 | % | 0.24 | % | 0.01 | % | 0.01 | % | 0.01 | % | ||||||||||||
Ratios to average net assets (annualized) | ||||||||||||||||||||||||
Gross expenses | 0.77 | % | 0.77 | % | 0.77 | % | 0.96 | % | 0.96 | % | 0.96 | % | ||||||||||||
Net expenses | 0.77 | % | 0.77 | % | 0.75 | % | 0.38 | % | 0.13 | % | 0.09 | % | ||||||||||||
Net investment income | 1.70 | % | 1.21 | % | 0.24 | % | 0.01 | % | 0.01 | % | 0.01 | % | ||||||||||||
Supplemental data | ||||||||||||||||||||||||
Net assets, end of period (000s omitted) | $100 | $100 | $100 | $100 | $2,977 | $6,615 | ||||||||||||||||||
| 1 | Amount is less than $0.005. |
| 2 | Amount is more than $(0.005). |
| 3 | Returns for periods of less than one year are not annualized. |
The accompanying notes are an integral part of these financial statements.
26 | Government Money Market Funds
Table of Contents
Notes to financial statements (unaudited)
1. ORGANIZATION
Wells Fargo Funds Trust (the “Trust”), a Delaware statutory trust organized on March 10, 1999, is an open-end management investment company registered under the Investment Company Act of 1940, as amended (the “1940 Act”). As an investment company, the Trust follows the accounting and reporting guidance in Financial Accounting Standards Board (“FASB”) Accounting Standards Codification Topic 946, Financial Services – Investment Companies. These financial statements report on the Wells Fargo Government Money Market Fund (the “Fund”) which is a diversified series of the Trust.
2. SIGNIFICANT ACCOUNTING POLICIES
The following significant accounting policies, which are consistently followed in the preparation of the financial statements of the Fund, are in conformity with U.S. generally accepted accounting principles which require management to make estimates and assumptions that affect the reported amounts of assets and liabilities, disclosure of contingent assets and liabilities at the date of the financial statements, and the reported amounts of revenues and expenses during the reporting period. Actual results could differ from those estimates.
Securities valuation
As permitted under Rule 2a-7 of the 1940 Act, portfolio securities are valued at amortized cost, which approximates fair value. The amortized cost method involves valuing a security at its cost, plus accretion of discount or minus amortization of premium over the period until maturity.
Investments which are not valued using the method discussed above are valued at their fair value, as determined in good faith by the Board of Trustees of the Fund. The Board of Trustees has established a Valuation Committee comprised of the Trustees and has delegated to it the authority to take any actions regarding the valuation of portfolio securities that the Valuation Committee deems necessary or appropriate, including determining the fair value of portfolio securities, unless the determination has been delegated to the Wells Fargo Asset Management Pricing Committee at Wells Fargo Funds Management, LLC (“Funds Management”). The Board of Trustees retains the authority to make or ratify any valuation decisions or approve any changes to the Valuation Procedures as it deems appropriate. On a quarterly basis, the Board of Trustees receives reports on any valuation actions taken by the Valuation Committee or the Wells Fargo Asset Management Pricing Committee which may include items for ratification.
Repurchase agreements
The Fund may invest in repurchase agreements and may participate in pooled repurchase agreement transactions with other funds advised by Funds Management. Repurchase agreements are agreements where the seller of a security to the Fund agrees to repurchase that security from the Fund at a mutually agreed upon time and price. The repurchase agreements must be fully collateralized based on values that are marked-to-market daily. The collateral may be held by an agent bank under a tri-party agreement. It is the custodian’s responsibility to value collateral daily and to take action to obtain additional collateral as necessary to maintain a market value equal to or greater than the resale price. The repurchase agreements are collateralized by securities issued or guaranteed by the U.S. Government, its agencies or instrumentalities. There could be potential loss to the Fund in the event that the Fund is delayed or prevented from exercising its rights to dispose of the collateral, including the risk of a possible decline in the value of the underlying obligations during the period in which the Fund seeks to assert its rights.
When-issued transactions
The Fund may purchase securities on a forward commitment or when-issued basis. The Fund records a when-issued transaction on the trade date and will segregate assets in an amount at least equal in value to the Fund’s commitment to purchase when-issued securities. Securities purchased on a when-issued basis are marked-to-market daily and the Fund begins earning interest on the settlement date. Losses may arise due to changes in the market value of the underlying securities or if the counterparty does not perform under the contract.
Security transactions and income recognition
Securities transactions are recorded on a trade date basis. Realized gains or losses are recorded on the basis of identified cost.
Interest income is accrued daily and bond discounts are accreted and premiums are amortized daily. To the extent debt obligations are placed on non-accrual status, any related interest income may be reduced by writing off interest receivables when the collection of all or a portion of interest has been determined to be doubtful based on consistently applied procedures and the fair value has decreased. If the issuer subsequently resumes interest payments or when the collectability of interest is reasonably assured, the debt obligation is removed from non-accrual status.
Distributions to shareholders
Distributions to shareholders from net investment income are declared daily and paid monthly. Distributions from net realized gains, if any, are recorded on the ex-dividend date and paid at least annually. Such distributions are determined in accordance
Government Money Market Funds | 27
Table of Contents
Notes to financial statements (unaudited)
with income tax regulations and may differ from U.S. generally accepted accounting principles. Dividend sources are estimated at the time of declaration. The tax character of distributions is determined as of the Fund’s fiscal year end. Therefore, a portion of the Fund’s distributions made prior to the Fund’s fiscal year end may be categorized as a tax return of capital at year end.
Federal and other taxes
The Fund intends to continue to qualify as a regulated investment company by distributing substantially all of its investment company taxable income and any net realized capital gains (after reduction for capital loss carryforwards) sufficient to relieve it from all, or substantially all, federal income taxes. Accordingly, no provision for federal income taxes was required.
The Fund’s income and federal excise tax returns and all financial records supporting those returns for the prior three fiscal years are subject to examination by the federal and Delaware revenue authorities. Management has analyzed the Fund’s tax positions taken on federal, state, and foreign tax returns for all open tax years and does not believe that there are any uncertain tax positions that require recognition of a tax liability.
As of July 31, 2019, the cost of investments for federal income tax purposes is substantially the same as for financial reporting purposes.
Class allocations
The separate classes of shares offered by the Fund differ principally in distribution, shareholder servicing, and administration fees. Class specific expenses are charged directly to that share class. Investment income, common fund-level expenses, and realized gains (losses) on investments are allocated daily to each class of shares based on the relative proportion of net assets of each class.
3. FAIR VALUATION MEASUREMENTS
Fair value measurements of investments are determined within a framework that has established a fair value hierarchy based upon the various data inputs utilized in determining the value of the Fund’s investments. The three-level hierarchy gives the highest priority to unadjusted quoted prices in active markets for identical assets or liabilities (Level 1) and the lowest priority to unobservable inputs (Level 3). The Fund’s investments are classified within the fair value hierarchy based on the lowest level of input that is significant to the fair value measurement. The inputs are summarized into three broad levels as follows:
| ∎ | Level 1 – quoted prices in active markets for identical securities |
| ∎ | Level 2 – other significant observable inputs (including quoted prices for similar securities, interest rates, prepayment speeds, credit risk, etc.) |
| ∎ | Level 3 – significant unobservable inputs (including the Fund’s own assumptions in determining the fair value of investments) |
The inputs or methodologies used for valuing investments in securities are not necessarily an indication of the risk associated with investing in those securities.
The following is a summary of the inputs used in valuing the Fund’s assets and liabilities as of July 31, 2019:
| Quoted prices (Level 1) | Other significant observable inputs (Level 2) | Significant (Level 3) | Total | |||||||||||||
Assets | ||||||||||||||||
Investments in: | ||||||||||||||||
Government agency debt | $ | 0 | $ | 27,834,911,901 | $ | 0 | $ | 27,834,911,901 | ||||||||
Municipal obligations | 0 | 24,585,000 | 0 | 24,585,000 | ||||||||||||
Repurchase agreements | 0 | 49,619,933,333 | 0 | 49,619,933,333 | ||||||||||||
Treasury debt | 0 | 5,536,880,554 | 0 | 5,536,880,554 | ||||||||||||
Total assets | $ | 0 | $ | 83,016,310,788 | $ | 0 | $ | 83,016,310,788 | ||||||||
Additional sector, industry or geographic detail is included in the Portfolio of Investments.
For the six months ended July 31, 2019, the Fund did not have any transfers into/out of Level 3.
28 | Government Money Market Funds
Table of Contents
Notes to financial statements (unaudited)
4. TRANSACTIONS WITH AFFILIATES
Management fee
Funds Management, an indirect wholly owned subsidiary of Wells Fargo & Company (“Wells Fargo”), is the manager of the Fund and provides advisory and fund-level administrative services under an investment management agreement. Under the investment management agreement, Funds Management is responsible for, among other services, implementing the investment objectives and strategies of the Fund, supervising the subadviser and providing fund-level administrative services in connection with the Fund’s operations. As compensation for its services under the investment management agreement, Funds Management is entitled to receive a management fee at the following annual rate based on the Fund’s average daily net assets:
| Average daily net assets | Management fee | |||
First $5 billion | 0.15 | % | ||
Next $5 billion | 0.14 | |||
Over $10 billion | 0.13 | |||
For the six months ended July 31, 2019, the management fee was equivalent to an annual rate of 0.13% of the Fund’s average daily net assets.
Funds Management has retained the services of a subadviser to provide daily portfolio management to the Fund. The fee for subadvisory services is borne by Funds Management. Wells Capital Management Incorporated, an affiliate of Funds Management and an indirect wholly owned subsidiary of Wells Fargo, is the subadviser to the Fund and is entitled to receive a fee from Funds Management at an annual rate starting at 0.05% and declining to 0.01% as the average daily net assets of the Fund increase.
Administration fees
Under a class-level administration agreement, Funds Management provides class-level administrative services to the Fund, which includes paying fees and expenses for services provided by the transfer agent, sub-transfer agents, omnibus account servicers and record-keepers. As compensation for its services under the class-level administration agreement, Funds Management receives an annual fee which is calculated based on the average daily net assets of each class as follows:
| Class-level administration fee | ||||
Class A | 0.22 | % | ||
Administrator Class | 0.10 | |||
Institutional Class | 0.08 | |||
Select Class | 0.04 | |||
Service Class | 0.12 | |||
Sweep Class | 0.03 | |||
Waivers and/or expense reimbursements
Funds Management has contractually waived and/or reimbursed management and administration fees to the extent necessary to maintain certain net operating expense ratios for the Fund. When each class of the Fund has exceeded its expense cap, Funds Management has waived fees and/or reimbursed expenses from fund-level expenses on a proportionate basis and then from class specific expenses. When only certain classes exceed their expense caps, waivers and/or reimbursements are applied against class specific expenses before fund-level expenses. Funds Management has committed through May 31, 2020 to waive fees and/or reimburse expenses to the extent necessary to cap the Fund’s expenses at 0.60% for Class A shares, 0.34% for Administrator Class shares, 0.20% for Institutional Class shares, 0.14% for Select Class shares, 0.50% for Service Class shares, and 0.77% for Sweep Class shares. Prior to or after the commitment expiration date, the cap may be increased or the commitment to maintain the cap may be terminated only with the approval of the Board of Trustees. Prior to June 1, 2019, the Fund’s expenses were capped at 0.35% for Administrator Class shares.
Distribution fee
The Trust has adopted a distribution plan for Sweep Class shares of the Fund pursuant to Rule 12b-1 under the 1940 Act. A distribution fee is charged to Sweep Class shares and paid to Wells Fargo Funds Distributor, LLC, the principal underwriter, at an annual rate of 0.35% of the average daily net assets of Sweep Class shares.
Government Money Market Funds | 29
Table of Contents
Notes to financial statements (unaudited)
Shareholder servicing fees
The Trust has entered into contracts with one or more shareholder servicing agents, whereby Class A, Service Class, and Sweep Class of the Fund are charged a fee at an annual rate of 0.25% of the respective average daily net assets of each class. Administrator Class is charged a fee at an annual rate of 0.10% of its average daily net assets. A portion of these total shareholder servicing fees were paid to affiliates of Wells Fargo.
Interfund transactions
The Fund may purchase or sell portfolio investment securities to certain other Wells Fargo affiliates pursuant to Rule 17a-7 under the 1940 Act and under procedures adopted by the Board of Trustees. The procedures have been designed to ensure that these interfund transactions, which do not incur broker commissions, are effected at current market prices.
5. INDEMNIFICATION
Under the Trust’s organizational documents, the officers and Trustees have been granted certain indemnification rights against certain liabilities that may arise out of performance of their duties to the Trust. Additionally, in the normal course of business, the Trust may enter into contracts with service providers that contain a variety of indemnification clauses. The Trust’s maximum exposure under these arrangements is dependent on future claims that may be made against the Fund and, therefore, cannot be estimated.
6. NEW ACCOUNTING PRONOUNCEMENTS
In August 2018, FASB issued Accounting Standards Update (“ASU”) No. 2018-13, Fair Value Measurement (Topic 820)Disclosure Framework—Changes to the Disclosure Requirements for Fair Value Measurement. ASU 2018-13 updates the disclosure requirements for fair value measurements by modifying or removing certain disclosures and adding certain new disclosures. The amendments are effective for fiscal years, and interim periods within those fiscal years, beginning after December 15, 2019. Early adoption is permitted. Management has adopted the removal and modification of disclosures early, as permitted, and will adopt the additional new disclosures at the effective date.
In March 2017, FASB issued ASU No. 2017-08,Premium Amortization on Purchased Callable Debt Securities. ASU 2017-08 shortens the amortization period for certain callable debt securities held at a premium and requires the premium to be amortized to the earliest call date. The amendments do not require an accounting change for securities held at a discount and discounts will continue to be accreted to the maturity date of the security. ASU 2017-08 is effective for fiscal years beginning after December 15, 2018 and for interim periods within those fiscal years. During the current reporting period, management of the Fund adopted the change in accounting policy which did not have a material impact to the Fund’s financial statements.
30 | Government Money Market Funds
Table of Contents
PROXY VOTING INFORMATION
A description of the policies and procedures used to determine how to vote proxies relating to portfolio securities is available, upon request, by calling1-800-222-8222, visiting our website atwfam.com, or visiting the SEC website at sec.gov. Information regarding how the proxies related to portfolio securities were voted during the most recent 12-month period ended June 30 is available on the website atwfam.comor by visiting the SEC website at sec.gov.
Government Money Market Funds | 31
Table of Contents
Other information (unaudited)
BOARD OF TRUSTEES AND OFFICERS
Each of the Trustees and Officers1 listed in the table below acts in identical capacities for each fund in the Wells Fargo family of funds, which consists of 152 mutual funds comprising the Wells Fargo Funds Trust, Wells Fargo Variable Trust, Wells Fargo Master Trust and four closed-end funds (collectively the “Fund Complex”). This table should be read in conjunction with the Prospectus and the Statement of Additional Information2. The mailing address of each Trustee and Officer is 525 Market Street, 12th Floor, San Francisco, CA 94105. Each Trustee and Officer serves an indefinite term, however, each Trustee serves such term until reaching the mandatory retirement age established by the Trustees.
Independent Trustees
Name and year of birth | Position held and length of service* | Principal occupations during past five years or longer | Current other public company or investment company directorships | |||
William R. Ebsworth (Born 1957) | Trustee, since 2015 | Retired. From 1984 to 2013, equities analyst, portfolio manager, research director and chief investment officer at Fidelity Management and Research Company in Boston, Tokyo, and Hong Kong, and retired in 2013 as Chief Investment Officer of Fidelity Strategic Advisers, Inc. where he led a team of investment professionals managing client assets. Prior thereto, Board member of Hong Kong Securities Clearing Co., Hong Kong Options Clearing Corp., the Thailand International Fund, Ltd., Fidelity Investments Life Insurance Company, and Empire Fidelity Investments Life Insurance Company. Audit Committee Chair and Investment Committee Chair of the Vincent Memorial Hospital Endowment (non-profit organization). Mr. Ebsworth is a CFA® charterholder. | N/A | |||
Jane A. Freeman (Born 1953) | Trustee, since 2015; Chair Liaison, since 2018 | Retired. From 2012 to 2014 and 1999 to 2008, Chief Financial Officer of Scientific Learning Corporation. From 2008 to 2012, Ms. Freeman provided consulting services related to strategic business projects. Prior to 1999, Portfolio Manager at Rockefeller & Co. and Scudder, Stevens & Clark. Board member of the Harding Loevner Funds from 1996 to 2014, serving as both Lead Independent Director and chair of the Audit Committee. Board member of the Russell Exchange Traded Funds Trust from 2011 to 2012 and the chair of the Audit Committee. Ms. Freeman is a Board Member of The Ruth Bancroft Garden (non-profit organization). She is also an inactive Chartered Financial Analyst. | N/A | |||
Isaiah Harris, Jr. (Born 1952) | Trustee, since 2009; Audit Committee Chairman, since 2019 | Retired. Chairman of the Board of CIGNA Corporation since 2009, and Director since 2005. From 2003 to 2011, Director of Deluxe Corporation. Prior thereto, President and CEO of BellSouth Advertising and Publishing Corp. from 2005 to 2007, President and CEO of BellSouth Enterprises from 2004 to 2005 and President of BellSouth Consumer Services from 2000 to 2003. Emeritus member of the Iowa State University Foundation Board of Governors. Emeritus Member of the Advisory Board of Iowa State University School of Business. Advisory Board Member, Palm Harbor Academy (private school). Advisory Board Member, Child Evangelism Fellowship (non-profit). Mr. Harris is a certified public accountant (inactive status). | CIGNA Corporation | |||
Judith M. Johnson (Born 1949) | Trustee, since 2008; Audit Committee Chairman, from 2009 to 2018 | Retired. Prior thereto, Chief Executive Officer and Chief Investment Officer of Minneapolis Employees Retirement Fund from 1996 to 2008. Ms. Johnson is an attorney, certified public accountant and a certified managerial accountant. | N/A | |||
32 | Government Money Market Funds
Table of Contents
Other information (unaudited)
Name and year of birth | Position held and length of service* | Principal occupations during past five years or longer | Current other public company or investment company directorships | |||
David F. Larcker (Born 1950) | Trustee, since 2009 | James Irvin Miller Professor of Accounting at the Graduate School of Business, Stanford University, Director of the Corporate Governance Research Initiative and Senior Faculty of The Rock Center for Corporate Governance since 2006. From 2005 to 2008, Professor of Accounting at the Graduate School of Business, Stanford University. Prior thereto, Ernst & Young Professor of Accounting at The Wharton School, University of Pennsylvania from 1985 to 2005. | N/A | |||
Olivia S. Mitchell (Born 1953) | Trustee, since 2006; Nominating and Governance Committee Chairman, since 2018 | International Foundation of Employee Benefit Plans Professor, Wharton School of the University of Pennsylvania since 1993. Director of Wharton’s Pension Research Council and Boettner Center on Pensions & Retirement Research, and Research Associate at the National Bureau of Economic Research. Previously, Cornell University Professor from 1978 to 1993. | N/A | |||
Timothy J. Penny (Born 1951) | Trustee, since 1996; Chairman, since 2018 | President and Chief Executive Officer of Southern Minnesota Initiative Foundation, a non-profit organization, since 2007. Member of the Board of Trustees of NorthStar Education Finance, Inc., a non-profit organization, since 2007. | N/A | |||
James G. Polisson (Born 1959) | Trustee, since 2018 | Retired. Chief Marketing Officer, Source (ETF) UK Services, Ltd, from 2015 to 2017. From 2012 to 2015, Principal of The Polisson Group, LLC, a management consulting, corporate advisory and principal investing company. Chief Executive Officer and Managing Director at Russell Investments, Global Exchange Traded Funds from 2010 to 2012. Managing Director of Barclays Global Investors from 1998 to 2010 and Global Chief Marketing Officer for iShares and Barclays Global Investors from 2000 to 2010. Trustee of the San Francisco Mechanics’ Institute, a non-profit organization, from 2013 to 2015. Board member of the Russell Exchange Traded Fund Trust from 2011 to 2012. Director of Barclays Global Investors Holdings Deutschland GmbH from 2006 to 2009. Mr. Polisson is an attorney and has a retired status with the Massachusetts and District of Columbia Bar Associations. | N/A | |||
| * | Length of service dates reflect the Trustee’s commencement of service with the Trust’s predecessor entities, where applicable. |
Government Money Market Funds | 33
Table of Contents
Other information (unaudited)
Officers
Name and year of birth | Position held and length of service | Principal occupations during past five years or longer | ||
Andrew Owen (Born 1960) | President, since 2017 | Executive Vice President of Wells Fargo & Company and Head of Affiliated Managers, Wells Fargo Asset Management, since 2014. In addition, Mr. Owen is currently President, Chief Executive Officer and Director of Wells Fargo Funds Management, LLC since 2017. Prior thereto, Executive Vice President responsible for marketing, investments and product development for Wells Fargo Funds Management, LLC, from 2009 to 2014. | ||
Nancy Wiser1 (Born 1967) | Treasurer, since 2012 | Executive Vice President of Wells Fargo Funds Management, LLC since 2011. Chief Operating Officer and Chief Compliance Officer at LightBox Capital Management LLC, from 2008 to 2011. | ||
Alexander Kymn (Born 1973) | Secretary and Chief Legal Officer, since 2018 | Senior Company Counsel of Wells Fargo Bank, N.A. since 2018 (previously Senior Counsel from 2007 to 2018). Vice President of Wells Fargo Funds Management, LLC from 2008 to 2014. | ||
Michael H. Whitaker (Born 1967) | Chief Compliance Officer, since 2016 | Senior Vice President and Chief Compliance Officer since 2016. Senior Vice President and Chief Compliance Officer for Fidelity Investments from 2007 to 2016. | ||
David Berardi (Born 1975) | Assistant Treasurer, since 2009 | Vice President of Wells Fargo Funds Management, LLC since 2009. Vice President of Evergreen Investment Management Company, LLC from 2008 to 2010. Manager of Fund Reporting and Control for Evergreen Investment Management Company, LLC from 2004 to 2010. | ||
Jeremy DePalma1 (Born 1974) | Assistant Treasurer, since 2009 | Senior Vice President of Wells Fargo Funds Management, LLC since 2009. Senior Vice President of Evergreen Investment Management Company, LLC from 2008 to 2010 and head of the Fund Reporting and Control Team within Fund Administration from 2005 to 2010. | ||
| 1 | Nancy Wiser acts as Treasurer of 65 funds in the Fund Complex. Jeremy DePalma acts as Treasurer of 87 funds and Assistant Treasurer of 65 funds in the Fund Complex. |
| 2 | The Statement of Additional Information includes additional information about the Trustees and is available, without charge, upon request, by calling 1-800-222-8222 or by visiting the website atwfam.com. |
34 | Government Money Market Funds
Table of Contents
Other information (unaudited)
BOARD CONSIDERATION OF INVESTMENT MANAGEMENT AND SUB-ADVISORY AGREEMENTS:
Wells Fargo Government Money Market Fund
Under the Investment Company Act of 1940 (the “1940 Act”), the Board of Trustees (the “Board”) of Wells Fargo Funds Trust (the “Trust”) must determine annually whether to approve the continuation of the Trust’s investment management and sub-advisory agreements. In this regard, at an in-person meeting held on May 21-22, 2019 (the “Meeting”), the Board, all the members of which have no direct or indirect interest in the investment management and sub-advisory agreements and are not “interested persons” of the Trust, as defined in the 1940 Act (the “Independent Trustees”), reviewed and approved for Wells Fargo Government Money Market Fund (the “Fund”): (i) an investment management agreement (the “Management Agreement”) with Wells Fargo Funds Management, LLC (“Funds Management”); and (ii) an investment sub-advisory agreement (the “Sub-Advisory Agreement”) with Wells Capital Management Incorporated (the “Sub-Adviser”), an affiliate of Funds Management. The Management Agreement and the Sub-Advisory Agreement are collectively referred to as the “Advisory Agreements.”
At the Meeting, the Board considered the factors and reached the conclusions described below relating to the selection of Funds Management and the Sub-Adviser and the approval of the Advisory Agreements. Prior to the Meeting, including at an in-person meeting in April 2019, the Trustees conferred extensively among themselves and with representatives of Funds Management about these matters. Also, the Board has adopted a team-based approach, with each team consisting of a sub-set of Trustees, to assist the full Board in the discharge of its duties in reviewing investment performance and other matters throughout the year. The Independent Trustees were assisted in their evaluation of the Advisory Agreements by independent legal counsel, from whom they received separate legal advice and with whom they met separately.
In providing information to the Board, Funds Management and the Sub-Adviser were guided by a detailed set of requests for information submitted to them by independent legal counsel on behalf of the Independent Trustees at the start of the Board’s annual contract renewal process earlier in 2019. In considering and approving the Advisory Agreements, the Trustees considered the information they believed relevant, including but not limited to the information discussed below. The Board considered not only the specific information presented in connection with the Meeting, but also the knowledge gained over time through interaction with Funds Management and the Sub-Adviser about various topics. In this regard, the Board reviewed reports of Funds Management at each of its quarterly meetings, which included, among other things, portfolio reviews and investment performance reports. In addition, the Board and the teams mentioned above confer with portfolio managers at various times throughout the year. The Board did not identify any particular information or consideration that was all-important or controlling, and each individual Trustee may have attributed different weights to various factors.
After its deliberations, the Board unanimously approved the continuation of the Advisory Agreements for a one-year term and determined that the compensation payable to Funds Management and the Sub-Adviser under each of the Advisory Agreements was reasonable. The Board considered the approval of the Advisory Agreements for the Fund as part of its consideration of agreements for funds across the complex, but its approvals were made on a fund-by-fund basis. The following summarizes a number of important, but not necessarily all, factors considered by the Board in support of its approvals.
Nature, extent and quality of services
The Board received and considered various information regarding the nature, extent and quality of services provided to the Fund by Funds Management and the Sub-Adviser under the Advisory Agreements. This information included a description of the investment advisory services and Fund-level administrative services covered by the Management Agreement, as well as, among other things, a summary of the background and experience of senior management of Wells Fargo Asset Management (“WFAM”), of which Funds Management and the Sub-Adviser are a part, a summary of investments made in the business of WFAM, a summary of certain organizational and personnel changes involving Funds Management and the Sub-Adviser, and a description of Funds Management’s and the Sub-Adviser’s business continuity planning programs and of their approaches to data privacy and cybersecurity. The Board received and reviewed information about Funds Management’s role as administrator of the Fund’s liquidity risk management program. The Board also considered the qualifications, background, tenure and responsibilities of each of the portfolio managers primarily responsible for the day-to-day portfolio management of the Fund.
The Board evaluated the ability of Funds Management and the Sub-Adviser to attract and retain qualified investment professionals, including research, advisory and supervisory personnel. The Board further considered the compliance programs and compliance records of Funds Management and the Sub-Adviser. In addition, the Board took into account the full range of services provided to the Fund by Funds Management and its affiliates.
Government Money Market Funds | 35
Table of Contents
Other information (unaudited)
Fund investment performance and expenses
The Board considered the investment performance results for the Fund over various time periods ended December 31, 2018. The Board considered these results in comparison to the investment performance of funds in a universe that was determined by Broadridge Inc. (“Broadridge”) to be similar to the Fund (the “Universe”), and in comparison to the Fund’s benchmark index and to other comparative data. Broadridge is an independent provider of investment company data. The Board received a description of the methodology used by Broadridge to select the mutual funds in the performance Universe. The Board noted that the investment performance of the Fund (Administrator Class) was higher than or in range of the average investment performance of the Universe for all periods under review. The Board also noted that the investment performance of the Fund was higher than its benchmark index, the Lipper U.S. Government Money Market Funds, for all periods under review.
The Board also received and considered information regarding the Fund’s net operating expense ratios and their various components, including actual management fees, custodian and other non-management fees, and Rule 12b-1 and non-Rule 12b-1 shareholder service fees. The Board considered these ratios in comparison to the median ratios of funds in class-specific expense groups that were determined by Broadridge to be similar to the Fund (the “Groups”). The Board received a description of the methodology used by Broadridge to select the mutual funds in the expense Groups and an explanation of how funds comprising expense groups and their expense ratios may vary from year-to-year. Based on the Broadridge reports, the Board noted that the net operating expense ratios of the Fund were lower than, equal to or in range of the median net operating expense ratios of the expense Groups for each share class. The Board noted that the net operating expense ratio caps for the Fund’s Administrator Class would be reduced.
The Board took into account the Fund’s investment performance and expense information provided to it among the factors considered in deciding to re-approve the Advisory Agreements.
Investment management and sub-advisory fee rates
The Board reviewed and considered the contractual fee rates payable by the Fund to Funds Management under the Management Agreement, as well as the contractual fee rates payable by the Fund to Funds Management for class-level administrative services under a Class-Level Administration Agreement, which include, among other things, class-level transfer agency and sub-transfer agency costs (collectively, the “Management Rates”). The Board also reviewed and considered the contractual investment sub-advisory fee rates that are payable by Funds Management to the Sub-Adviser for investment sub-advisory services.
Among other information reviewed by the Board was a comparison of the Fund’s Management Rates with the average contractual investment management fee rates of funds in the expense Groups at a common asset level as well as transfer agency costs of the funds in the expense Groups. The Board noted that the Management Rates of the Fund were lower than, equal to or in range of the sum of these average rates for the Fund’s expense Groups for all share classes.
The Board also received and considered information about the portion of the total management fee that was retained by Funds Management after payment of the fee to the Sub-Adviser for sub-advisory services. In assessing the reasonableness of this amount, the Board received and evaluated information about the nature and extent of responsibilities retained and risks assumed by Funds Management and not delegated to or assumed by the Sub-Adviser, and about Funds Management’s on-going oversight services. Given the affiliation between Funds Management and the Sub-Adviser, the Board ascribed limited relevance to the allocation of fees between them.
The Board also received and considered information about the nature and extent of services offered and fee rates charged by Funds Management and the Sub-Adviser to other types of clients with investment strategies similar to those of the Fund. In this regard, the Board received information about the significantly greater scope of services, and compliance, reporting and other legal burdens and risks of managing proprietary mutual funds compared with those associated with managing assets of other types of clients, including third-party sub-advised fund clients and non-mutual fund clients such as institutional separate accounts.
Based on its consideration of the factors and information it deemed relevant, including those described here, the Board determined that the compensation payable to Funds Management under the Management Agreement and to the Sub-Adviser under the Sub-Advisory Agreement was reasonable.
Profitability
The Board received and considered information concerning the profitability of Funds Management, as well as the profitability of both WFAM and Wells Fargo & Co. (“Wells Fargo”) from providing services to the fund family as a whole. The Board noted that the Sub-Adviser’s profitability information with respect to providing services to the Fund and other funds in the family was subsumed in the WFAM and Wells Fargo profitability analysis.
36 | Government Money Market Funds
Table of Contents
Other information (unaudited)
Funds Management reported on the methodologies and estimates used in calculating profitability, including a description of the methodology used to allocate certain expenses. Among other things, the Board noted that the levels of profitability reported on a fund-by-fund basis varied widely, depending on factors such as the size, type and age of fund. Based on its review, the Board did not deem the profits reported by Funds Management, WFAM or Wells Fargo from services provided to the Fund to be at a level that would prevent it from approving the continuation of the Advisory Agreements.
Economies of scale
The Board received and considered information about the potential for Funds Management to experience economies of scale in the provision of management services to the Fund, the difficulties of calculating economies of scale at an individual fund level, and the extent to which potential scale benefits are shared with shareholders. The Board noted the existence of breakpoints in the Fund’s management fee structure, which operate generally to reduce the Fund’s expense ratios as the Fund grows in size. The Board considered that in addition to management fee breakpoints, Funds Management shares potential economies of scale from its management business in a variety of ways, including through fee waiver and expense reimbursement arrangements, services that benefit shareholders, competitive management fee rates set at the outset without regard to breakpoints, and investments in the business intended to enhance services available to shareholders.
The Board concluded that Funds Management’s arrangements with respect to the Fund, including contractual breakpoints, constituted a reasonable approach to sharing potential economies of scale with the Fund and its shareholders.
Other benefits to Funds Management and the Sub-Adviser
The Board received and considered information regarding potential “fall-out” or ancillary benefits received by Funds Management and its affiliates, including the Sub-Adviser, as a result of their relationships with the Fund. Ancillary benefits could include, among others, benefits directly attributable to other relationships with the Fund and benefits potentially derived from an increase in Funds Management’s and the Sub-Adviser’s business as a result of their relationships with the Fund. The Board noted that various affiliates of Funds Management may receive distribution-related fees, shareholder servicing payments and sub-transfer agency fees in respect of shares sold or held through them and services provided.
The Board also reviewed information about soft dollar credits earned and utilized by the Sub-Adviser, fees earned by Funds Management and the Sub-Adviser from managing a private investment vehicle for the fund family’s securities lending collateral, and commissions earned by an affiliated broker from portfolio transactions.
Based on its consideration of the factors and information it deemed relevant, including those described here, the Board did not find that any ancillary benefits received by Funds Management and its affiliates, including the Sub-Adviser, were unreasonable.
Conclusion
At the Meeting, after considering the above-described factors and based on its deliberations and its evaluation of the information described above, the Board unanimously approved the continuation of the Advisory Agreements for a one-year term and determined that the compensation payable to Funds Management and the Sub-Adviser under each of the Advisory Agreements was reasonable.
Government Money Market Funds | 37
Table of Contents
This page is intentionally left blank.
Table of Contents
This page is intentionally left blank.
Table of Contents
This page is intentionally left blank.
Table of Contents
For more information
More information about Wells Fargo Funds is available free upon request. To obtain literature, please write, visit the Fund’s website, or call:
Wells Fargo Funds
P.O. Box 219967
Kansas City, MO 64121-9967
Website:wfam.com
Individual investors:1-800-222-8222
Retail investment professionals:1-888-877-9275
Institutional investment professionals:1-866-765-0778

This report and the financial statements contained herein are submitted for the general information of the shareholders of the Fund. If this report is used for promotional purposes, distribution of the report must be accompanied or preceded by a current prospectus. Before investing, please consider the investment objectives, risks, charges, and expenses of the investment. For a current prospectus and, if available, a summary prospectus, containing this information, call1-800-260-5969 or visit the Fund’s website atwfam.com. Read the prospectus carefully before you invest or send money.
Wells Fargo Asset Management (WFAM) is the trade name for certain investment advisory/management firms owned by Wells Fargo & Company. These firms include but are not limited to Wells Capital Management Incorporated and Wells Fargo Funds Management, LLC. Certain products managed by WFAM entities are distributed by Wells Fargo Funds Distributor, LLC (a broker-dealer and Member FINRA).
This material is for general informational and educational purposes only and is NOT intended to provide investment advice or a recommendation of any kind—including a recommendation for any specific investment, strategy, or plan.
INVESTMENT PRODUCTS: NOT FDIC INSURED ◾ NO BANK GUARANTEE ◾ MAY LOSE VALUE
© 2019 Wells Fargo Funds Management, LLC. All rights reserved.
405491 09-19
SA303/SAR303 07-19
Table of Contents

Semi-Annual Report
July 31, 2019
Government Money Market Funds
| ∎ | Wells Fargo 100% Treasury Money Market Fund |
Beginning on January 1, 2021, as permitted by new regulations adopted by the Securities and Exchange Commission, paper copies of the Wells Fargo Funds’ annual and semi-annual shareholder reports issued after this date will no longer be sent by mail, unless you specifically request paper copies of the reports. Instead, the reports will be made available on the Funds’ website, and you will be notified by mail each time a report is posted and provided with a website address to access the report.
If you already elected to receive shareholder reports electronically, you will not be affected by this change and you need not take any action. You may elect to receive shareholder reports and other communications from the Fund electronically at any time by contacting your financial intermediary (such as a broker-dealer or bank) or, if you are a direct investor, by calling1-800-222-8222 or by enrolling at wellsfargo.com/advantagedelivery.
You may elect to receive all future reports in paper free of charge. If you invest through a financial intermediary, you can contact your financial intermediary to request that you continue to receive paper copies of your shareholder reports; if you invest directly with the Fund, you can call 1-800-222-8222. Your election to receive reports in paper will apply to all Wells Fargo Funds held in your account with your financial intermediary or, if you are a direct investor, to all Wells Fargo Funds that you hold.
Table of Contents
|
Reduce clutter. Save trees. |
Sign up for electronic delivery of prospectuses and shareholder reports atwellsfargo.com/advantagedelivery |
The views expressed and any forward-looking statements are as of July 31, 2019, unless otherwise noted, and are those of the Fund managers and/or Wells Fargo Asset Management. Discussions of individual securities, or the markets generally, or any Wells Fargo Fund are not intended as individual recommendations. Future events or results may vary significantly from those expressed in any forward-looking statements. The views expressed are subject to change at any time in response to changing circumstances in the market. Wells Fargo Asset Management and the Fund disclaim any obligation to publicly update or revise any views expressed or forward-looking statements.
INVESTMENT PRODUCTS: NOT FDIC INSURED ◾ NO BANK GUARANTEE ◾ MAY LOSE VALUE
Government Money Market Funds | 1
Table of Contents
Letter to shareholders (unaudited)

Andrew Owen
President
Wells Fargo Funds
Dear Shareholder:
We are pleased to offer you this semi-annual report for the Wells Fargo 100% Treasury Money Market Fund for the six-month period that ended July 31, 2019. Global stock and bond investors enjoyed gains that came amid continued concerns about global economic growth, international trade, geopolitical tensions, and bouts of market volatility. These concerns grew more intense as the period closed.
For the period, U.S. stocks, based on the S&P 500 Index,1 gained 11.32% and international stocks, as measured by the MSCI ACWI ex USA Index (Net),2 added 4.34%. The MSCI EM Index (Net)3 inched higher by 0.44%. For bond investors, the Bloomberg Barclays U.S. Aggregate Bond Index4 added 5.23%, the Bloomberg Barclays Global Aggregate ex-USD Index5 added 2.33%, the Bloomberg Barclays Municipal Bond Index6 gained 5.15%, and the ICE BofAML U.S. High Yield Index7 added 5.86%.
Concerns for slowing global growth reemerge during the first quarter of 2019.
After the S&P 500 Index’s best monthly performance in 30 years during January and positive returns for other major indices across major asset classes, signs of slowing global growth grew more ominous in February. The Bureau of Economic Analysis announced fourth-quarter 2018 gross domestic product (GDP) grew at an annualized 2.2% rate, down from the levels of the prior two quarters. In a February report, the Bank of England forecast the slowest growth since the financial crisis for 2019. China and the U.S. continued to wrangle over trade issues.
By the end of March 2019, a combination of dovish U.S. Federal Reserve (Fed) sentiment and steady, if not spectacular, U.S. economic and business metrics reinforced investors’ confidence. Monthly job creation data and corporate profits, while less consistent than during 2018, were solid. China announced a roughly $300 billion stimulus package through tax and fee cuts intended to reinvigorate economic growth. During April 2019, favorable sentiment found additional support in reports of sustained low inflation, solid employment data, and first-quarter U.S. GDP of an annualized rate of 3.2%.
| 1 | The S&P 500 Index consists of 500 stocks chosen for market size, liquidity, and industry group representation. It is a market-value-weighted index with each stock’s weight in the index proportionate to its market value. You cannot invest directly in an index. |
| 2 | The Morgan Stanley Capital International (MSCI) All Country World Index (ACWI) ex USA Index (Net) is a free-float-adjusted market-capitalization weighted index that is designed to measure the equity market performance of developed and emerging markets, excluding the U.S. Source: MSCI. MSCI makes no express or implied warranties or representations and shall have no liability whatsoever with respect to any MSCI data contained herein. The MSCI data may not be further redistributed or used as a basis for other indices or any securities or financial products. This report is not approved, reviewed, or produced by MSCI. You cannot invest directly in an index. |
| 3 | The MSCI Emerging Markets (EM) Index (Net) is a free-float-adjusted market-capitalization-weighted index that is designed to measure the equity market performance of emerging markets. You cannot invest directly in an index. |
| 4 | The Bloomberg Barclays U.S. Aggregate Bond Index is a broad-based benchmark that measures the investment-grade, U.S. dollar-denominated, fixed-rate taxable bond market, including Treasuries, government-related and corporate securities, mortgage-backed securities (agency fixed-rate and hybrid adjustable-rate mortgage pass-throughs), asset-backed securities, and commercial mortgage-backed securities. You cannot invest directly in an index. |
| 5 | The Bloomberg Barclays Global Aggregate ex-USD Index is an unmanaged index that provides a broad-based measure of the global investment-grade fixed-income markets excluding the U.S. dollar-denominated debt market. You cannot invest directly in an index. |
| 6 | The Bloomberg Barclays Municipal Bond Index is an unmanaged index composed of long-term tax-exempt bonds with a minimum credit rating of Baa. You cannot invest directly in an index. |
| 7 | The ICE BofAML U.S. High Yield Index is a market-capitalization-weighted index of domestic and Yankee high-yield bonds. The index tracks the performance of high-yield securities traded in the U.S. bond market. You cannot invest directly in an index. Copyright 2019. ICE Data Indices, LLC. All rights reserved. |
2 | Government Money Market Funds
Table of Contents
Letter to shareholders (unaudited)
During May 2019, markets tumbled on mixed investment signals. In the U.S., partisan wrangling ramped up as Democrats and Republicans set their sights on 2020 presidential politics. The U.K.’s Brexit caused Prime Minister Theresa May to resign. The European Commission downgraded the 2019 growth forecast to 1.2%. The U.S. increased tariffs on products from China, China responded, and then talks broke down. President Donald Trump threatened to turn his foreign policy tariff tool to Mexico over immigration issues.
As had been the case during most of 2019 to date, just as the investment horizon appeared to darken, sentiment turned and U.S. equity markets gained during June and July. The gains, primarily driven by geopolitical and monetary policy events, pushed equity markets to new highs.
President Mario Draghi of the European Central Bank said that if the outlook doesn’t improve, the bank will cut rates or buy more assets to prop up inflation. President Trump backed off of tariff threats against Mexico and China. In the U.S., the Fed implemented a 0.25% federal funds rate cut in July 2019.
Later in July 2019, the U.S. reversed course and threatened to impose higher tariffs on China’s exports after talks failed. China responded with tariff threats of its own and devalued the renminbi, a move that roiled global markets. Despite the accommodative approach of central banks, investors continued to have misgivings about the durability of economic growth globally and a pervasively cautious tone influenced the world’s equity and fixed-income markets.
Don’t let short-term uncertainty derail long-term investment goals.
Periods of investment uncertainty can present challenges, but experience has taught us that maintaining long-term investment goals can be an effective way to plan for the future. To help you create a sound strategy based on your personal goals and risk tolerance, Wells Fargo Funds offers more than 100 mutual funds spanning a wide range of asset classes and investment styles. Although diversification cannot guarantee an investment profit or prevent losses, we believe it can be an effective way to manage investment risk and potentially smooth out overall portfolio performance. We encourage investors to know their investments and to understand that appropriate levels of risk-taking may unlock opportunities.
Thank you for choosing to invest with Wells Fargo Funds. We appreciate your confidence in us and remain committed to helping you meet your financial needs.
Sincerely,

Andrew Owen
President
Wells Fargo Funds
“During May 2019, markets tumbled on mixed investment signals.”
“In the U.S., the Fed implemented a 0.25% federal funds rate cut in July 2019.”
|
For further information about your Fund, contact your investment professional, visit our website at wfam.com,or call us directly at1-800-222-8222. |
Government Money Market Funds | 3
Table of Contents
Performance highlights (unaudited)
Investment objective
The Fund seeks current income exempt from most state and local individual income taxes, while preserving capital and liquidity.
Manager
Wells Fargo Funds Management, LLC
Subadviser
Wells Capital Management Incorporated
Portfolio managers
Michael C. Bird, CFA®‡
Jeffrey L. Weaver, CFA®‡
Laurie White
Average annual total returns (%) as of July 31, 2019
| Expense ratios1 (%) | ||||||||||||||||||||||
| Inception date | 1 year | 5 year | 10 year | Gross | Net2 | |||||||||||||||||
| Class A (WFTXX) | 11-8-1999 | 1.72 | 0.51 | 0.26 | 0.62 | 0.60 | ||||||||||||||||
| Administrator Class (WTRXX)3 | 6-30-2010 | 2.03 | 0.69 | 0.35 | 0.35 | 0.30 | ||||||||||||||||
| Institutional Class (WOTXX)4 | 10-31-2014 | 2.13 | 0.76 | 0.39 | 0.23 | 0.20 | ||||||||||||||||
| Service Class (NWTXX) | 12-3-1990 | 1.82 | 0.58 | 0.29 | 0.52 | 0.50 | ||||||||||||||||
| Sweep Class5 | 6-30-2010 | 1.50 | 0.42 | 0.22 | 0.78 | 0.78 | ||||||||||||||||
Yield summary (%) as of July 31, 20192
| Class A | Administrator Class | Institutional Class | Service Class | Sweep Class | ||||||||||||||||
| 7-day current yield | 1.63 | 1.93 | 2.03 | 1.73 | 1.46 | |||||||||||||||
| 7-day compound yield | 1.65 | 1.95 | 2.05 | 1.75 | 1.47 | |||||||||||||||
| 30-day simple yield | 1.67 | 1.97 | 2.07 | 1.77 | 1.49 | |||||||||||||||
| 30-day compound yield | 1.68 | 1.99 | 2.09 | 1.78 | 1.50 | |||||||||||||||
Figures quoted represent past performance, which is no guarantee of future results,and do not reflect taxes that a shareholder may pay on fund distributions or the redemption of fund shares. Investment returns will fluctuate. The Fund’s yield figures more closely reflect the current earnings of the Fund than the total return figures. Current performance may be lower or higher than the performance data quoted, which assumes the reinvestment of dividends and capital gains. Currentmonth-end performance is available on the Fund’s website,wfam.com.
Each class is sold without afront-end sales charge or contingent deferred sales charge.
For government money market funds: You could lose money by investing in the Fund. Although the Fund seeks to preserve the value of your investment at $1.00 per share, it cannot guarantee it will do so. An investment in the Fund is not insured or guaranteed by the Federal Deposit Insurance Corporation or any other government agency. The Fund’s sponsor has no legal obligation to provide financial support to the Fund, and you should not expect that the sponsor will provide financial support to the Fund at any time.
Please see footnotes on page 5.
4 | Government Money Market Funds
Table of Contents
Performance highlights (unaudited)
| Portfolio composition as of July 31, 20196 |
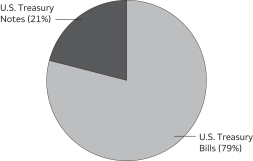 |
| Effective maturity distribution as of July 31, 20196 |
|

| Weighted average maturity as of July 31, 20197 |
33 days |
| Weighted average life as of July 31, 20198 |
106 days |
| ‡ | CFA® and Chartered Financial Analyst® are trademarks owned by CFA Institute. |
| 1 | Reflects the expense ratios as stated in the most recent prospectuses. The expense ratios shown are subject to change and may differ from the annualized expense ratios shown in the financial highlights of this report. |
| 2 | The manager has contractually committed through May 31, 2020, to waive fees and/or reimburse expenses to the extent necessary to cap the expenses of each class after fee waivers at the amounts shown. Brokerage commissions, stamp duty fees, interest, taxes, acquired fund fees and expenses (if any), and extraordinary expenses are excluded from the expense cap. Prior to or after the commitment expiration date, the cap may be increased or the commitment to maintain the cap may be terminated only with the approval of the Board of Trustees. Without this cap, the Fund’s returns would have been lower. Without waived fees and/or reimbursed expenses, the Fund’s7-day current yield would have been 1.62%, 1.89%, 2.01%, 1.72%, and 1.46% for Class A, Administrator Class, Institutional Class, Service Class, and Sweep Class, respectively. The expense ratio paid by an investor is the net expense ratio (the total annual fund operating expenses after fee waivers) as stated in the prospectuses. |
| 3 | Historical performance shown for Administrator Class shares prior to their inception reflects the performance of Service Class shares, and includes the higher expenses applicable to Service Class shares. If these expenses had not been included, returns for Administrator Class shares would be higher. |
| 4 | Historical performance shown for Institutional Class shares prior to their inception reflects the performance of Administrator Class shares, and includes the higher expenses applicable to Administrator Class shares. If these expenses had not been included, returns for Institutional Class shares would be higher. |
| 5 | Historical performance shown for Sweep Class shares prior to their inception reflects the performance of Service Class shares, and has not been adjusted to reflect the higher expenses applicable to Sweep Class shares. If these expenses had been adjusted, returns for Sweep Class shares would be lower. |
| 6 | Amounts are calculated based on the total investments of the Fund. These amounts are subject to change and may have changed since the date specified. |
| 7 | Weighted Average Maturity (WAM): WAM is an average of the effective maturities of all securities held in the portfolio, weighted by each security’s percentage of total investments. The maturity of a portfolio security is the period remaining until the date on which the principal amount is unconditionally required to be paid, or in the case of a security called for redemption, the date on which the redemption payment is unconditionally required to be made. WAM calculations allow for the maturities of certain securities with demand features or periodic interest rate resets to be shortened. WAM is a way to measure a fund’s sensitivity to potential interest rate changes. WAM is subject to change and may have changed since the date specified. |
| 8 | Weighted Average Life (WAL): WAL is an average of the final maturities of all securities held in the portfolio, weighted by their percentage of total investments. The maturity of a portfolio security is the period remaining until the date on which the principal amount is unconditionally required to be paid, or in the case of a security called for redemption, the date on which the redemption payment is unconditionally required to be made. In contrast to WAM, the calculation of WAL allows for the maturities of certain securities with demand features to be shortened, but not the periodic interest rate resets. WAL is a way to measure a fund’s potential sensitivity to credit spread changes. WAL is subject to change and may have changed since the date specified. |
Government Money Market Funds | 5
Table of Contents
As a shareholder of the Fund, you incur ongoing costs, including management fees, distribution(12b-1) and/or shareholder servicing fees, and other Fund expenses. This example is intended to help you understand your ongoing costs (in dollars) of investing in the Fund and to compare these costs with the ongoing costs of investing in other mutual funds.
The example is based on an investment of $1,000 invested at the beginning of thesix-month period and held for the entire period from February 1, 2019 to July 31, 2019.
Actual expenses
The “Actual” line of the table below provides information about actual account values and actual expenses. You may use the information in this line, together with the amount you invested, to estimate the expenses that you paid over the period. Simply divide your account value by $1,000 (for example, an $8,600 account value divided by $1,000 = 8.6), then multiply the result by the number in the “Actual” line under the heading entitled “Expenses paid during period” for your applicable class of shares to estimate the expenses you paid on your account during this period.
Hypothetical example for comparison purposes
The “Hypothetical” line of the table below provides information about hypothetical account values and hypothetical expenses based on the Fund’s actual expense ratio and an assumed rate of return of 5% per year before expenses, which is not the Fund’s actual return. The hypothetical account values and expenses may not be used to estimate the actual ending account balance or expenses you paid for the period. You may use this information to compare the ongoing costs of investing in the Fund and other funds. To do so, compare this 5% hypothetical example with the 5% hypothetical examples that appear in the shareholder reports of the other funds.
Please note that the expenses shown in the table are meant to highlight your ongoing costs only. Therefore, the “Hypothetical” line of the table is useful in comparing ongoing costs only and will not help you determine the relative total costs of owning different funds.
| Beginning account value 2-1-2019 | Ending account value 7-31-2019 | Expenses paid during the period¹ | Annualized net expense ratio | |||||||||||||
Class A | ||||||||||||||||
Actual | $ | 1,000.00 | $ | 1,008.99 | $ | 2.99 | 0.60 | % | ||||||||
Hypothetical (5% return before expenses) | $ | 1,000.00 | $ | 1,021.82 | $ | 3.01 | 0.60 | % | ||||||||
Administrator Class | ||||||||||||||||
Actual | $ | 1,000.00 | $ | 1,010.49 | $ | 1.50 | 0.30 | % | ||||||||
Hypothetical (5% return before expenses) | $ | 1,000.00 | $ | 1,023.31 | $ | 1.51 | 0.30 | % | ||||||||
Institutional Class | ||||||||||||||||
Actual | $ | 1,000.00 | $ | 1,010.99 | $ | 1.00 | 0.20 | % | ||||||||
Hypothetical (5% return before expenses) | $ | 1,000.00 | $ | 1,023.80 | $ | 1.00 | 0.20 | % | ||||||||
Service Class | ||||||||||||||||
Actual | $ | 1,000.00 | $ | 1,009.49 | $ | 2.49 | 0.50 | % | ||||||||
Hypothetical (5% return before expenses) | $ | 1,000.00 | $ | 1,022.32 | $ | 2.51 | 0.50 | % | ||||||||
Sweep Class | ||||||||||||||||
Actual | $ | 1,000.00 | $ | 1,007.94 | $ | 4.03 | 0.81 | % | ||||||||
Hypothetical (5% return before expenses) | $ | 1,000.00 | $ | 1,020.78 | $ | 4.06 | 0.81 | % | ||||||||
| 1 | Expenses paid is equal to the annualized net expense ratio of each class multiplied by the average account value over the period, multiplied by the number of days in the most recent fiscal half-year divided by the number of days in the fiscal year (to reflect theone-half-year period). |
6 | Government Money Market Funds
Table of Contents
Portfolio of investments—July 31, 2019 (unaudited)
| Interest rate | Maturity date | Principal | Value | |||||||||||||
| Treasury Debt: 97.75% | ||||||||||||||||
U.S. Treasury Bill (z) | 2.02 | % | 1-23-2020 | $ | 40,000,000 | $ | 39,611,840 | |||||||||
U.S. Treasury Bill (z) | 2.04 | 12-26-2019 | 60,000,000 | 59,504,855 | ||||||||||||
U.S. Treasury Bill (z) | 2.04 | 1-16-2020 | 20,000,000 | 19,811,233 | ||||||||||||
U.S. Treasury Bill (z) | 2.05 | 10-24-2019 | 190,000,000 | 189,094,492 | ||||||||||||
U.S. Treasury Bill (z) | 2.06 | 1-30-2020 | 30,000,000 | 29,690,221 | ||||||||||||
U.S. Treasury Bill (z) | 2.08 | 1-2-2020 | 50,000,000 | 49,559,817 | ||||||||||||
U.S. Treasury Bill (z) | 2.09 | 10-31-2019 | 190,000,000 | 188,999,581 | ||||||||||||
U.S. Treasury Bill (z) | 2.10 | 2-27-2020 | 20,000,000 | 19,759,083 | ||||||||||||
U.S. Treasury Bill (z) | 2.10 | 9-26-2019 | 90,000,000 | 89,707,680 | ||||||||||||
U.S. Treasury Bill (z) | 2.11 | 9-17-2019 | 190,000,000 | 189,477,595 | ||||||||||||
U.S. Treasury Bill (z) | 2.12 | 8-20-2019 | 1,097,760,000 | 1,096,534,734 | ||||||||||||
U.S. Treasury Bill (z) | 2.12 | 8-27-2019 | 1,250,000,000 | 1,248,087,736 | ||||||||||||
U.S. Treasury Bill (z) | 2.12 | 10-17-2019 | 190,000,000 | 189,142,519 | ||||||||||||
U.S. Treasury Bill (z) | 2.14 | 9-24-2019 | 240,000,000 | 239,233,200 | ||||||||||||
U.S. Treasury Bill (z) | 2.15 | 9-10-2019 | 140,000,000 | 139,667,111 | ||||||||||||
U.S. Treasury Bill (z) | 2.15 | 12-19-2019 | 40,000,000 | 39,668,667 | ||||||||||||
U.S. Treasury Bill (z) | 2.16 | 8-13-2019 | 810,110,000 | 809,527,253 | ||||||||||||
U.S. Treasury Bill (z) | 2.17 | 9-3-2019 | 390,000,000 | 389,226,709 | ||||||||||||
U.S. Treasury Bill (z) | 2.18 | 9-19-2019 | 190,000,000 | 189,439,331 | ||||||||||||
U.S. Treasury Bill (z) | 2.18 | 12-12-2019 | 30,000,000 | 29,761,431 | ||||||||||||
U.S. Treasury Bill (z) | 2.20 | 8-6-2019 | 1,412,380,000 | 1,411,948,570 | ||||||||||||
U.S. Treasury Bill (z) | 2.21 | 10-10-2019 | 190,000,000 | 189,187,222 | ||||||||||||
U.S. Treasury Bill (z) | 2.26 | 9-12-2019 | 240,000,000 | 239,370,560 | ||||||||||||
U.S. Treasury Bill (z) | 2.27 | 10-3-2019 | 633,765,000 | 631,264,810 | ||||||||||||
U.S. Treasury Bill (z) | 2.29 | 8-1-2019 | 294,670,000 | 294,670,000 | ||||||||||||
U.S. Treasury Bill (z) | 2.30 | 9-5-2019 | 190,000,000 | 189,576,986 | ||||||||||||
U.S. Treasury Bill (z) | 2.36 | 8-22-2019 | 260,000,000 | 259,644,867 | ||||||||||||
U.S. Treasury Bill (z) | 2.36 | 8-29-2019 | 220,000,000 | 219,599,639 | ||||||||||||
U.S. Treasury Bill (z) | 2.40 | 8-15-2019 | 280,000,000 | 279,740,525 | ||||||||||||
U.S. Treasury Bill (z) | 2.41 | 8-8-2019 | 270,000,000 | 269,874,467 | ||||||||||||
U.S. Treasury Bill (z) | 3.90 | 1-9-2020 | 40,000,000 | 39,628,179 | ||||||||||||
U.S. Treasury Note | 0.75 | 8-15-2019 | 30,000,000 | 29,978,603 | ||||||||||||
U.S. Treasury Note | 1.00 | 10-15-2019 | 30,000,000 | 29,894,079 | ||||||||||||
U.S. Treasury Note | 1.25 | 2-29-2020 | 70,000,000 | 69,663,558 | ||||||||||||
U.S. Treasury Note | 1.38 | 1-31-2020 | 20,000,000 | 19,926,185 | ||||||||||||
U.S. Treasury Note | 1.38 | 2-29-2020 | 20,000,000 | 19,922,118 | ||||||||||||
U.S. Treasury Note | 1.38 | 4-30-2020 | 20,000,000 | 19,892,344 | ||||||||||||
U.S. Treasury Note | 1.50 | 10-31-2019 | 50,000,000 | 49,872,611 | ||||||||||||
U.S. Treasury Note (U.S. Treasury 3 Month Bill Money Market Yield +0.00%)± | 2.05 | 1-31-2020 | 270,000,000 | 269,969,265 | ||||||||||||
U.S. Treasury Note (U.S. Treasury 3 Month Bill Money Market Yield +0.03%)± | 2.08 | 4-30-2020 | 360,000,000 | 359,998,234 | ||||||||||||
U.S. Treasury Note (U.S. Treasury 3 Month Bill Money Market Yield +0.04%)± | 2.09 | 7-31-2020 | 265,000,000 | 264,968,843 | ||||||||||||
U.S. Treasury Note (U.S. Treasury 3 Month Bill Money Market Yield +0.05%)± | 2.10 | 10-31-2019 | 195,000,000 | 195,007,515 | ||||||||||||
U.S. Treasury Note (U.S. Treasury 3 Month Bill Money Market Yield +0.05%)± | 2.10 | 10-31-2020 | 355,000,000 | 354,791,387 | ||||||||||||
U.S. Treasury Note (U.S. Treasury 3 Month Bill Money Market Yield +0.12%)± | 2.17 | 1-31-2021 | 350,000,000 | 349,831,043 | ||||||||||||
U.S. Treasury Note (U.S. Treasury 3 Month Bill Money Market Yield +0.14%)± | 2.19 | 4-30-2021 | 300,000,000 | 299,849,620 | ||||||||||||
U.S. Treasury Note | 2.25 | 2-29-2020 | 20,000,000 | 20,021,917 | ||||||||||||
The accompanying notes are an integral part of these financial statements.
Government Money Market Funds | 7
Table of Contents
Portfolio of investments—July 31, 2019 (unaudited)
| Interest rate | Maturity date | Principal | Value | |||||||||||||
| Treasury Debt (continued) | ||||||||||||||||
U.S. Treasury Note | 2.25 | % | 3-31-2020 | $ | 20,000,000 | $ | 20,026,052 | |||||||||
U.S. Treasury Note (U.S. Treasury 3 Month Bill Money Market Yield +0.22%) ± | 2.27 | 7-31-2021 | 70,000,000 | 70,000,000 | ||||||||||||
U.S. Treasury Note | 2.50 | 5-31-2020 | 40,000,000 | 40,143,107 | ||||||||||||
U.S. Treasury Note | 3.63 | 8-15-2019 | 10,000,000 | 10,003,876 | ||||||||||||
U.S. Treasury Note | 3.63 | 2-15-2020 | 30,000,000 | 30,245,319 | ||||||||||||
Total Treasury Debt (Cost $11,794,016,589) |
| 11,794,016,589 | ||||||||||||||
|
| |||||||||||||||
| Total investments in securities (Cost $11,794,016,589) | 97.75 | % | 11,794,016,589 | |||||
Other assets and liabilities, net | 2.25 | 272,073,727 | ||||||
|
|
|
| |||||
| Total net assets | 100.00 | % | $ | 12,066,090,316 | ||||
|
|
|
| |||||
| (z) | Zero coupon security. The rate represents the current yield to maturity. |
| ± | Variable rate investment. The rate shown is the rate in effect at period end. |
The accompanying notes are an integral part of these financial statements.
8 | Government Money Market Funds
Table of Contents
Statement of assets and liabilities—July 31, 2019 (unaudited)
Assets | ||||
Investments in unaffiliated securities, at amortized cost | $ | 11,794,016,589 | ||
Cash | 2,616 | |||
Receivable for investments sold | 493,599,893 | |||
Receivable for Fund shares sold | 8,468,712 | |||
Receivable for interest | 2,238,596 | |||
Prepaid expenses and other assets | 131,660 | |||
|
| |||
Total assets | 12,298,458,066 | |||
|
| |||
Liabilities | ||||
Payable for investments purchased | 218,689,802 | |||
Dividends payable | 8,213,914 | |||
Payable for Fund shares redeemed | 1,684,197 | |||
Management fee payable | 1,245,565 | |||
Administration fees payable | 990,469 | |||
Distribution fee payable | 126,523 | |||
Trustees’ fees and expenses payable | 2,487 | |||
Accrued expenses and other liabilities | 1,414,793 | |||
|
| |||
Total liabilities | 232,367,750 | |||
|
| |||
Total net assets | $ | 12,066,090,316 | ||
|
| |||
Net assets consist of | ||||
Paid-in capital | $ | 12,065,786,192 | ||
Total distributable earnings | 304,124 | |||
|
| |||
Total net assets | $ | 12,066,090,316 | ||
|
| |||
Computation of net asset value per share | ||||
Net assets – Class A | $ | 343,760,942 | ||
Shares outstanding – Class A1 | 343,736,725 | |||
Net asset value per share – Class A | $1.00 | |||
Net assets – Administrator Class | $ | 628,673,291 | ||
Shares outstanding – Administrator Class1 | 628,628,649 | |||
Net asset value per share – Administrator Class | $1.00 | |||
Net assets – Institutional Class | $ | 7,247,011,255 | ||
Shares outstanding – Institutional Class1 | 7,246,518,778 | |||
Net asset value per share – Institutional Class | $1.00 | |||
Net assets – Service Class | $ | 3,406,191,134 | ||
Shares outstanding – Service Class1 | 3,405,966,546 | |||
Net asset value per share – Service Class | $1.00 | |||
Net assets – Sweep Class | $ | 440,453,694 | ||
Shares outstanding – Sweep Class1 | 440,425,042 | |||
Net asset value per share – Sweep Class | $1.00 | |||
| 1 | The Fund has an unlimited number of authorized shares. |
The accompanying notes are an integral part of these financial statements.
Government Money Market Funds | 9
Table of Contents
Statement of operations—six months ended July 31, 2019 (unaudited)
Investment income | ||||
Interest | $ | 141,128,912 | ||
|
| |||
Expenses | ||||
Management fee | 10,285,807 | |||
Administration fees |
| |||
Class A | 376,335 | |||
Administrator Class | 312,776 | |||
Institutional Class | 2,875,134 | |||
Service Class | 1,911,296 | |||
Sweep Class | 63,345 | |||
Shareholder servicing fees |
| |||
Class A | 427,653 | |||
Administrator Class | 312,425 | |||
Service Class | 3,974,646 | |||
Sweep Class | 527,874 | |||
Distribution fee |
| |||
Sweep Class | 739,024 | |||
Custody and accounting fees | 123,659 | |||
Professional fees | 26,071 | |||
Registration fees | 61,178 | |||
Trustees’ fees and expenses | 6,959 | |||
Other fees and expenses | 63,669 | |||
|
| |||
Total expenses | 22,087,851 | |||
Less: Fee waivers and/or expense reimbursements | (3,259,592 | ) | ||
|
| |||
Net expenses | 18,828,259 | |||
|
| |||
Net investment income | 122,300,653 | |||
Net realized gains on investments | 500,410 | |||
|
| |||
Net increase in net assets resulting from operations | $ | 122,801,063 | ||
|
| |||
The accompanying notes are an integral part of these financial statements.
10 | Government Money Market Funds
Table of Contents
Statement of changes in net assets
| Six months ended July 31, 2019 (unaudited) | Year ended January 31, 2019 | |||||||||||||||
Operations |
| |||||||||||||||
Net investment income | $ | 122,300,653 | $ | 174,142,362 | ||||||||||||
Net realized gains (losses) on investments | 500,410 | (440,382 | ) | |||||||||||||
|
| |||||||||||||||
Net increase in net assets resulting from operations | 122,801,063 | 173,701,980 | ||||||||||||||
|
| |||||||||||||||
Distributions to shareholders from net investment income and net realized gains | ||||||||||||||||
Class A | (3,088,582 | ) | (3,585,269 | ) | ||||||||||||
Administrator Class | (6,584,998 | ) | (12,151,739 | ) | ||||||||||||
Institutional Class | (79,210,404 | ) | (112,222,067 | ) | ||||||||||||
Service Class | (30,343,364 | ) | (40,839,299 | ) | ||||||||||||
Sweep Class | (3,369,863 | ) | (4,851,067 | ) | ||||||||||||
|
| |||||||||||||||
Total distributions to shareholders | (122,597,211 | ) | (173,649,441 | ) | ||||||||||||
|
| |||||||||||||||
Capital share transactions | Shares | Shares | ||||||||||||||
Proceeds from shares sold |
| |||||||||||||||
Class A | 538,837,903 | 538,837,903 | 1,137,578,905 | 1,137,578,905 | ||||||||||||
Administrator Class | 1,454,337,211 | 1,454,337,211 | 2,946,536,440 | 2,946,536,440 | ||||||||||||
Institutional Class | 13,674,598,939 | 13,674,598,939 | 20,906,716,859 | 20,906,716,859 | ||||||||||||
Service Class | 8,194,475,266 | 8,194,475,266 | 16,011,789,165 | 16,011,789,165 | ||||||||||||
Sweep Class | 2,185,977,743 | 2,185,977,743 | 4,479,924,845 | 4,479,924,845 | ||||||||||||
|
| |||||||||||||||
| 26,048,227,062 | 45,482,546,214 | |||||||||||||||
|
| |||||||||||||||
Reinvestment of distributions |
| |||||||||||||||
Class A | 3,085,621 | 3,085,621 | 3,581,445 | 3,581,445 | ||||||||||||
Administrator Class | 3,618,545 | 3,618,545 | 6,604,565 | 6,604,565 | ||||||||||||
Institutional Class | 52,839,724 | 52,839,724 | 78,887,331 | 78,887,331 | ||||||||||||
Service Class | 9,285,223 | 9,285,223 | 9,489,778 | 9,489,778 | ||||||||||||
Sweep Class | 3,369,863 | 3,369,863 | 4,851,067 | 4,851,067 | ||||||||||||
|
| |||||||||||||||
| 72,198,976 | 103,414,186 | |||||||||||||||
|
| |||||||||||||||
Payment for shares redeemed |
| |||||||||||||||
Class A | (582,179,305 | ) | (582,179,305 | ) | (1,048,396,260 | ) | (1,048,396,260 | ) | ||||||||
Administrator Class | (1,521,533,205 | ) | (1,521,533,205 | ) | (3,175,348,441 | ) | (3,175,348,441 | ) | ||||||||
Institutional Class | (13,777,227,123 | ) | (13,777,227,123 | ) | (18,389,742,128 | ) | (18,389,742,128 | ) | ||||||||
Service Class | (7,594,046,967 | ) | (7,594,046,967 | ) | (16,170,354,767 | ) | (16,170,354,767 | ) | ||||||||
Sweep Class | (2,167,946,107 | ) | (2,167,946,107 | ) | (4,547,426,565 | ) | (4,547,426,565 | ) | ||||||||
|
| |||||||||||||||
| (25,642,932,707 | ) | (43,331,268,161 | ) | |||||||||||||
|
| |||||||||||||||
Net increase in net assets resulting from capital share transactions | 477,493,331 | 2,254,692,239 | ||||||||||||||
|
| |||||||||||||||
Total increase in net assets | 477,697,183 | 2,254,744,778 | ||||||||||||||
|
| |||||||||||||||
Net assets | ||||||||||||||||
Beginning of period | 11,588,393,133 | 9,333,648,355 | ||||||||||||||
|
| |||||||||||||||
End of period | $ | 12,066,090,316 | $ | 11,588,393,133 | ||||||||||||
|
| |||||||||||||||
The accompanying notes are an integral part of these financial statements.
Government Money Market Funds | 11
Table of Contents
(For a share outstanding throughout each period)
| Six months ended July 31, 2019 (unaudited) | Year ended January 31 | |||||||||||||||||||||||
| CLASS A | 2019 | 2018 | 2017 | 2016 | 2015 | |||||||||||||||||||
Net asset value, beginning of period | $1.00 | $1.00 | $1.00 | $1.00 | $1.00 | $1.00 | ||||||||||||||||||
Net investment income (loss) | 0.01 | 0.01 | 0.00 | 1 | 0.00 | 1 | 0.00 | 1,2 | (0.00 | )2,3 | ||||||||||||||
Net realized gains (losses) on investments | 0.00 | 1 | (0.00 | )3 | (0.00 | )3 | 0.00 | 1 | (0.00 | )3 | 0.00 | 1 | ||||||||||||
|
|
|
|
|
|
|
|
|
|
|
| |||||||||||||
Total from investment operations | 0.01 | 0.01 | 0.00 | 1 | 0.00 | 1 | (0.00 | )3 | 0.00 | 1 | ||||||||||||||
Distributions to shareholders from | ||||||||||||||||||||||||
Net investment income | (0.01 | ) | (0.01 | ) | (0.00 | )1 | (0.00 | )1 | (0.00 | )1 | (0.00 | )1 | ||||||||||||
Net realized gains | 0.00 | (0.00 | )1 | (0.00 | )1 | (0.00 | )1 | (0.00 | )1 | (0.00 | )1 | |||||||||||||
|
|
|
|
|
|
|
|
|
|
|
| |||||||||||||
Total distributions to shareholders | (0.01 | ) | (0.01 | ) | (0.00 | )1 | (0.00 | )1 | (0.00 | )1 | (0.00 | )1 | ||||||||||||
Net asset value, end of period | $1.00 | $1.00 | $1.00 | $1.00 | $1.00 | $1.00 | ||||||||||||||||||
Total return4 | 0.90 | % | 1.35 | % | 0.32 | % | 0.01 | % | 0.00 | % | 0.00 | % | ||||||||||||
Ratios to average net assets (annualized) | ||||||||||||||||||||||||
Gross expenses | 0.65 | % | 0.71 | % | 0.79 | % | 0.79 | % | 0.79 | % | 0.79 | % | ||||||||||||
Net expenses | 0.60 | % | 0.62 | % | 0.64 | % | 0.36 | % | 0.08 | % | 0.04 | % | ||||||||||||
Net investment income (loss) | 1.80 | % | 1.35 | % | 0.31 | % | 0.00 | % | 0.00 | % | (0.00 | )% | ||||||||||||
Supplemental data | ||||||||||||||||||||||||
Net assets, end of period (000s omitted) | $343,761 | $384,013 | $291,246 | $363,639 | $464,176 | $1,009,623 | ||||||||||||||||||
| 1 | Amount is less than $0.005. |
| 2 | Calculated based upon average shares outstanding |
| 3 | Amount is more than $(0.005). |
| 4 | Returns for periods of less than one year are not annualized. |
The accompanying notes are an integral part of these financial statements.
12 | Government Money Market Funds
Table of Contents
Financial highlights
(For a share outstanding throughout each period)
| Six months ended July 31, 2019 (unaudited) | Year ended January 31 | |||||||||||||||||||||||
| ADMINISTRATOR CLASS | 2019 | 2018 | 2017 | 2016 | 2015 | |||||||||||||||||||
Net asset value, beginning of period | $1.00 | $1.00 | $1.00 | $1.00 | $1.00 | $1.00 | ||||||||||||||||||
Net investment income (loss) | 0.01 | 0.02 | 0.01 | 0.00 | 1 | 0.00 | 1 | (0.00 | )2,3 | |||||||||||||||
Net realized gains (losses) on investments | 0.00 | 1 | (0.00 | )2 | (0.00 | )2 | 0.00 | 1 | (0.00 | )2 | 0.00 | 1 | ||||||||||||
|
|
|
|
|
|
|
|
|
|
|
| |||||||||||||
Total from investment operations | 0.01 | 0.02 | 0.01 | 0.00 | 1 | (0.00 | )2 | 0.00 | 1 | |||||||||||||||
Distributions to shareholders from | ||||||||||||||||||||||||
Net investment income | (0.01 | ) | (0.02 | ) | (0.01 | ) | (0.00 | )1 | (0.00 | )1 | (0.00 | )1 | ||||||||||||
Net realized gains | 0.00 | (0.00 | )1 | (0.00 | )1 | (0.00 | )1 | (0.00 | )1 | (0.00 | )1 | |||||||||||||
|
|
|
|
|
|
|
|
|
|
|
| |||||||||||||
Total distributions to shareholders | (0.01 | ) | (0.02 | ) | (0.01 | ) | (0.00 | )1 | (0.00 | )1 | (0.00 | )1 | ||||||||||||
Net asset value, end of period | $1.00 | $1.00 | $1.00 | $1.00 | $1.00 | $1.00 | ||||||||||||||||||
Total return4 | 1.05 | % | 1.67 | % | 0.67 | % | 0.07 | % | 0.00 | % | 0.00 | % | ||||||||||||
Ratios to average net assets (annualized) | ||||||||||||||||||||||||
Gross expenses | 0.38 | % | 0.44 | % | 0.52 | % | 0.52 | % | 0.51 | % | 0.51 | % | ||||||||||||
Net expenses | 0.30 | % | 0.30 | % | 0.30 | % | 0.30 | % | 0.08 | % | 0.04 | % | ||||||||||||
Net investment income (loss) | 2.10 | % | 1.63 | % | 0.65 | % | 0.06 | % | 0.00 | % | (0.00 | )% | ||||||||||||
Supplemental data | ||||||||||||||||||||||||
Net assets, end of period (000s omitted) | $628,673 | $692,247 | $914,471 | $1,226,947 | $1,945,991 | $2,656,805 | ||||||||||||||||||
| 1 | Amount is less than $0.005. |
| 2 | Amount is more than $(0.005). |
| 3 | Calculated based upon average shares outstanding |
| 4 | Returns for periods of less than one year are not annualized. |
The accompanying notes are an integral part of these financial statements.
Government Money Market Funds | 13
Table of Contents
Financial highlights
(For a share outstanding throughout each period)
| Six months ended July 31, 2019 (unaudited) | Year ended January 31 | |||||||||||||||||||||||
| INSTITUTIONAL CLASS | 2019 | 2018 | 2017 | 2016 | 20151 | |||||||||||||||||||
Net asset value, beginning of period | $1.00 | $1.00 | $1.00 | $1.00 | $1.00 | $1.00 | ||||||||||||||||||
Net investment income (loss) | 0.01 | 0.02 | 0.01 | 0.00 | 2 | 0.00 | 2 | (0.00 | )3,4 | |||||||||||||||
Net realized gains (losses) on investments | 0.00 | 2 | (0.00 | )3 | (0.00 | )3 | 0.00 | 2 | (0.00 | )3 | 0.00 | 2 | ||||||||||||
|
|
|
|
|
|
|
|
|
|
|
| |||||||||||||
Total from investment operations | 0.01 | 0.02 | 0.01 | 0.00 | 2 | 0.00 | 2 | 0.00 | 2 | |||||||||||||||
Distributions to shareholders from | ||||||||||||||||||||||||
Net investment income | (0.01 | ) | (0.02 | ) | (0.01 | ) | (0.00 | )2 | (0.00 | )2 | (0.00 | )2 | ||||||||||||
Net realized gains | 0.00 | (0.00 | )2 | (0.00 | )2 | (0.00 | )2 | (0.00 | )2 | (0.00 | )2 | |||||||||||||
|
|
|
|
|
|
|
|
|
|
|
| |||||||||||||
Total distributions to shareholders | (0.01 | ) | (0.02 | ) | (0.01 | ) | (0.00 | )2 | (0.00 | )2 | (0.00 | )2 | ||||||||||||
Net asset value, end of period | $1.00 | $1.00 | $1.00 | $1.00 | $1.00 | $1.00 | ||||||||||||||||||
Total return5 | 1.10 | % | 1.77 | % | 0.77 | % | 0.17 | % | 0.01 | % | 0.00 | % | ||||||||||||
Ratios to average net assets (annualized) | ||||||||||||||||||||||||
Gross expenses | 0.26 | % | 0.31 | % | 0.40 | % | 0.40 | % | 0.40 | % | 0.39 | % | ||||||||||||
Net expenses | 0.20 | % | 0.20 | % | 0.20 | % | 0.20 | % | 0.11 | % | 0.04 | % | ||||||||||||
Net investment income (loss) | 2.20 | % | 1.79 | % | 0.78 | % | 0.18 | % | 0.01 | % | (0.00 | )% | ||||||||||||
Supplemental data | ||||||||||||||||||||||||
Net assets, end of period (000s omitted) | $7,247,011 | $7,296,690 | $4,700,731 | $3,566,678 | $632,263 | $100 | ||||||||||||||||||
| 1 | For the period from October 31, 2014 (commencement of class operations) to January 31, 2015 |
| 2 | Amount is less than $0.005. |
| 3 | Amount is more than $(0.005). |
| 4 | Calculated based upon average shares outstanding |
| 5 | Returns for periods of less than one year are not annualized. |
The accompanying notes are an integral part of these financial statements.
14 | Government Money Market Funds
Table of Contents
Financial highlights
(For a share outstanding throughout each period)
| Six months ended July 31, 2019 (unaudited) | Year ended January 31 | |||||||||||||||||||||||
| SERVICE CLASS | 2019 | 2018 | 2017 | 2016 | 2015 | |||||||||||||||||||
Net asset value, beginning of period | $1.00 | $1.00 | $1.00 | $1.00 | $1.00 | $1.00 | ||||||||||||||||||
Net investment income (loss) | 0.01 | 0.01 | 0.00 | 1 | 0.00 | 1 | 0.00 | 1 | (0.00 | )2,3 | ||||||||||||||
Net realized gains (losses) on investments | 0.00 | 1 | (0.00 | )2 | (0.00 | )2 | 0.00 | 1 | (0.00 | )2 | 0.00 | 1 | ||||||||||||
|
|
|
|
|
|
|
|
|
|
|
| |||||||||||||
Total from investment operations | 0.01 | 0.01 | 0.00 | 1 | 0.00 | 1 | (0.00 | )2 | 0.00 | 1 | ||||||||||||||
Distributions to shareholders from | ||||||||||||||||||||||||
Net investment income | (0.01 | ) | (0.01 | ) | (0.00 | )1 | (0.00 | )1 | (0.00 | )1 | (0.00 | )1 | ||||||||||||
Net realized gains | 0.00 | (0.00 | )1 | (0.00 | )1 | (0.00 | )1 | (0.00 | )1 | (0.00 | )1 | |||||||||||||
|
|
|
|
|
|
|
|
|
|
|
| |||||||||||||
Total distributions to shareholders | (0.01 | ) | (0.01 | ) | (0.00 | )1 | (0.00 | )1 | (0.00 | )1 | (0.00 | )1 | ||||||||||||
Net asset value, end of period | $1.00 | $1.00 | $1.00 | $1.00 | $1.00 | $1.00 | ||||||||||||||||||
Total return4 | 0.95 | % | 1.46 | % | 0.46 | % | 0.01 | % | 0.00 | % | 0.00 | % | ||||||||||||
Ratios to average net assets (annualized) | ||||||||||||||||||||||||
Gross expenses | 0.55 | % | 0.61 | % | 0.69 | % | 0.69 | % | 0.69 | % | 0.68 | % | ||||||||||||
Net expenses | 0.50 | % | 0.50 | % | 0.50 | % | 0.36 | % | 0.09 | % | 0.05 | % | ||||||||||||
Net investment income (loss) | 1.90 | % | 1.45 | % | 0.45 | % | 0.00 | % | 0.00 | % | (0.00 | )% | ||||||||||||
Supplemental data | ||||||||||||||||||||||||
Net assets, end of period (000s omitted) | $3,406,191 | $2,796,397 | $2,945,498 | $3,337,172 | $5,614,425 | $6,962,725 | ||||||||||||||||||
| 1 | Amount is less than $0.005. |
| 2 | Amount is more than $(0.005). |
| 3 | Calculated based upon average shares outstanding |
| 4 | Returns for periods of less than one year are not annualized. |
The accompanying notes are an integral part of these financial statements.
Government Money Market Funds | 15
Table of Contents
Financial highlights
(For a share outstanding throughout each period)
| Six months ended July 31, 2019 (unaudited) | Year ended January 31 | |||||||||||||||||||||||
| SWEEP CLASS | 2019 | 2018 | 2017 | 2016 | 2015 | |||||||||||||||||||
Net asset value, beginning of period | $1.00 | $1.00 | $1.00 | $1.00 | $1.00 | $1.00 | ||||||||||||||||||
Net investment income (loss) | 0.01 | 0.01 | 0.00 | 1 | 0.00 | 1 | 0.00 | 1 | (0.00 | )2,3 | ||||||||||||||
Net realized gains (losses) on investments | 0.00 | 1 | (0.00 | )2 | (0.00 | )2 | 0.00 | 1 | (0.00 | )2 | 0.00 | 1 | ||||||||||||
|
|
|
|
|
|
|
|
|
|
|
| |||||||||||||
Total from investment operations | 0.01 | 0.01 | 0.00 | 1 | 0.00 | 1 | (0.00 | )2 | 0.00 | 1 | ||||||||||||||
Distributions to shareholders from | ||||||||||||||||||||||||
Net investment income | (0.01 | ) | (0.01 | ) | (0.00 | )1 | (0.00 | )1 | (0.00 | )1 | (0.00 | )1 | ||||||||||||
Net realized gains | 0.00 | (0.00 | )1 | (0.00 | )1 | (0.00 | )1 | (0.00 | )1 | (0.00 | )1 | |||||||||||||
|
|
|
|
|
|
|
|
|
|
|
| |||||||||||||
Total distributions to shareholders | (0.01 | ) | (0.01 | ) | (0.00 | )1 | (0.00 | )1 | (0.00 | )1 | (0.00 | )1 | ||||||||||||
Net asset value, end of period | $1.00 | $1.00 | $1.00 | $1.00 | $1.00 | $1.00 | ||||||||||||||||||
Total return4 | 0.79 | % | 1.13 | % | 0.18 | % | 0.01 | % | 0.00 | % | 0.00 | % | ||||||||||||
Ratios to average net assets (annualized) | ||||||||||||||||||||||||
Gross expenses | 0.81 | % | 0.87 | % | 0.95 | % | 1.11 | % | 1.14 | % | 1.14 | % | ||||||||||||
Net expenses | 0.81 | % | 0.83 | % | 0.77 | % | 0.36 | % | 0.09 | % | 0.04 | % | ||||||||||||
Net investment income (loss) | 1.59 | % | 1.14 | % | 0.16 | % | 0.00 | % | 0.00 | % | (0.00 | )% | ||||||||||||
Supplemental data | ||||||||||||||||||||||||
Net assets, end of period (000s omitted) | $440,454 | $419,046 | $481,702 | $672,256 | $473,246 | $427,778 | ||||||||||||||||||
| 1 | Amount is less than $0.005. |
| 2 | Amount is more than $(0.005). |
| 3 | Calculated based upon average shares outstanding |
| 4 | Returns for periods of less than one year are not annualized. |
The accompanying notes are an integral part of these financial statements.
16 | Government Money Market Funds
Table of Contents
Notes to financial statements (unaudited)
1. ORGANIZATION
Wells Fargo Funds Trust (the “Trust”), a Delaware statutory trust organized on March 10, 1999, is anopen-end management investment company registered under the Investment Company Act of 1940, as amended (the “1940 Act”). As an investment company, the Trust follows the accounting and reporting guidance in Financial Accounting Standards Board (“FASB”)Accounting Standards Codification Topic 946, Financial Services – Investment Companies. These financial statements report on the Wells Fargo 100% Treasury Money Market Fund (the “Fund”) which is a diversified series of the Trust.
2. SIGNIFICANT ACCOUNTING POLICIES
The following significant accounting policies, which are consistently followed in the preparation of the financial statements of the Fund, are in conformity with U.S. generally accepted accounting principles which require management to make estimates and assumptions that affect the reported amounts of assets and liabilities, disclosure of contingent assets and liabilities at the date of the financial statements, and the reported amounts of revenues and expenses during the reporting period. Actual results could differ from those estimates.
Securities valuation
As permitted under Rule2a-7 of the 1940 Act, portfolio securities are valued at amortized cost, which approximates fair value. The amortized cost method involves valuing a security at its cost, plus accretion of discount or minus amortization of premium over the period until maturity.
Investments which are not valued using the method discussed above are valued at their fair value, as determined in good faith by the Board of Trustees of the Fund. The Board of Trustees has established a Valuation Committee comprised of the Trustees and has delegated to it the authority to take any actions regarding the valuation of portfolio securities that the Valuation Committee deems necessary or appropriate, including determining the fair value of portfolio securities, unless the determination has been delegated to the Wells Fargo Asset Management Pricing Committee at Wells Fargo Funds Management, LLC (“Funds Management”). The Board of Trustees retains the authority to make or ratify any valuation decisions or approve any changes to the Valuation Procedures as it deems appropriate. On a quarterly basis, the Board of Trustees receives reports on any valuation actions taken by the Valuation Committee or the Wells Fargo Asset Management Pricing Committee which may include items for ratification.
When-issued transactions
The Fund may purchase securities on a forward commitment or when-issued basis. The Fund records a when-issued transaction on the trade date and will segregate assets in an amount at least equal in value to the Fund’s commitment to purchase when-issued securities. Securities purchased on a when-issued basis aremarked-to-market daily and the Fund begins earning interest on the settlement date. Losses may arise due to changes in the market value of the underlying securities or if the counterparty does not perform under the contract.
Security transactions and income recognition
Securities transactions are recorded on a trade date basis. Realized gains or losses are recorded on the basis of identified cost.
Interest income is accrued daily and bond discounts are accreted and premiums are amortized daily. To the extent debt obligations are placed onnon-accrual status, any related interest income may be reduced by writing off interest receivables when the collection of all or a portion of interest has been determined to be doubtful based on consistently applied procedures and the fair value has decreased. If the issuer subsequently resumes interest payments or when the collectability of interest is reasonably assured, the debt obligation is removed fromnon-accrual status.
Distributions to shareholders
Distributions to shareholders from net investment income are declared daily and paid monthly. Distributions from net realized gains, if any, are recorded on theex-dividend date and paid at least annually. Such distributions are determined in accordance with income tax regulations and may differ from U.S. generally accepted accounting principles. Dividend sources are estimated at the time of declaration. The tax character of distributions is determined as of the Fund’s fiscal year end. Therefore, a portion of the Fund’s distributions made prior to the Fund’s fiscal year end may be categorized as a tax return of capital at year end.
Federal and other taxes
The Fund intends to continue to qualify as a regulated investment company by distributing substantially all of its investment company taxable and any net realized capital gains (after reduction for capital loss carryforwards) sufficient to relieve it from all, or substantially all, federal income taxes. Accordingly, no provision for federal income taxes was required.
The Fund’s income and federal excise tax returns and all financial records supporting those returns for the prior three fiscal years are subject to examination by the federal and Delaware revenue authorities. Management has analyzed the Fund’s tax positions taken on federal, state, and foreign tax returns for all open tax years and does not believe that there are any uncertain tax positions that require recognition of a tax liability.
Government Money Market Funds | 17
Table of Contents
Notes to financial statements (unaudited)
As of July 31, 2019, the cost of investments for federal income tax purposes is substantially the same as for financial reporting purposes.
Class allocations
The separate classes of shares offered by the Fund differ principally in applicable distribution, shareholder servicing, and administration fees. Class specific expenses are charged directly to that share class. Investment income, common fund-level expenses, and realized gains (losses) on investments are allocated daily to each class of shares based on the relative proportion of net assets of each class.
3. FAIR VALUATION MEASUREMENTS
Fair value measurements of investments are determined within a framework that has established a fair value hierarchy based upon the various data inputs utilized in determining the value of the Fund’s investments. The three-level hierarchy gives the highest priority to unadjusted quoted prices in active markets for identical assets or liabilities (Level 1) and the lowest priority to unobservable inputs (Level 3). The Fund’s investments are classified within the fair value hierarchy based on the lowest level of input that is significant to the fair value measurement. The inputs are summarized into three broad levels as follows:
| ∎ | Level 1 – quoted prices in active markets for identical securities |
| ∎ | Level 2 – other significant observable inputs (including quoted prices for similar securities, interest rates, prepayment speeds, credit risk, etc.) |
| ∎ | Level 3 – significant unobservable inputs (including the Fund’s own assumptions in determining the fair value of investments) |
The inputs or methodologies used for valuing investments in securities are not necessarily an indication of the risk associated with investing in those securities.
The following is a summary of the inputs used in valuing the Fund’s assets and liabilities as of July 31, 2019:
| Quoted prices (Level 1) | Other significant observable inputs (Level 2) | Significant (Level 3) | Total | |||||||||||||
Assets | ||||||||||||||||
Investments in: | ||||||||||||||||
Treasury debt | $ | 0 | $ | 11,794,016,589 | $ | 0 | $ | 11,794,016,589 | ||||||||
Additional sector, industry or geographic detail is included in the Portfolio of Investments.
For the six months ended July 31, 2019, the Fund did not have any transfers into/out of Level 3.
4. TRANSACTIONS WITH AFFILIATES
Management fee
Funds Management, an indirect wholly owned subsidiary of Wells Fargo & Company (“Wells Fargo”), is the manager of the Fund and provides advisory and fund-level administrative services under an investment management agreement. Under the investment management agreement, Funds Management is responsible for, among other services, implementing the investment objectives and strategies of the Fund, supervising the subadviser and providing fund-level administrative services in connection with the Fund’s operations. As compensation for its services under the investment management agreement, Funds Management is entitled to receive a management fee at the following annual rate based on the Fund’s average daily net assets:
| Management fee | ||||||||
| Average daily net assets | Current rate | Rate prior to June 1, 2019 | ||||||
First $5 billion | 0.15 | % | 0.20 | % | ||||
Next $5 billion | 0.14 | 0.19 | ||||||
Over $10 billion | 0.13 | 0.18 | ||||||
For the six months ended July 31, 2019, the management fee was equivalent to an annual rate of 0.17% of the Fund’s average daily net assets.
18 | Government Money Market Funds
Table of Contents
Notes to financial statements (unaudited)
Funds Management has retained the services of a subadviser to provide daily portfolio management to the Fund. The fee for subadvisory services is borne by Funds Management. Wells Capital Management Incorporated, an affiliate of Funds Management and an indirect wholly owned subsidiary of Wells Fargo, is the subadviser to the Fund and is entitled to receive a fee from Funds Management at an annual rate starting at 0.05% and declining to 0.01% as the average daily net assets of the Fund increase.
Administration fees
Under a class-level administration agreement, Funds Management provides class-level administrative services to the Fund, which includes paying fees and expenses for services provided by the transfer agent,sub-transfer agents, omnibus account servicers and record-keepers. As compensation for its services under the class-level administration agreement, Funds Management receives an annual fee which is calculated based on the average daily net assets of each class as follows:
| Class-level administration fee | ||||
Class A | 0.22 | % | ||
Administrator Class | 0.10 | |||
Institutional Class | 0.08 | |||
Service Class | 0.12 | |||
Sweep Class | 0.03 | |||
Waivers and/or expense reimbursements
Funds Management has contractually waived and/or reimbursed management and administration fees to the extent necessary to maintain certain net operating expense ratios for the Fund. When each class of the Fund has exceeded its expense cap, Funds Management has waived fees and/or reimbursed expenses from fund-level expenses on a proportionate basis and then from class specific expenses. When only certain classes exceed their expense caps, waivers and/or reimbursements are applied against class specific expenses before fund-level expenses. Funds Management has committed through May 31, 2020 to waive fees and/or reimburse expenses to the extent necessary to cap the Fund’s expenses at 0.60% for Class A shares, 0.30% for Administrator Class shares, 0.20% for Institutional Class shares, 0.50% for Service Class shares, and 0.78% for Sweep Class shares. Prior to or after the commitment expiration date, the cap may be increased or the commitment to maintain the cap may be terminated only with the approval of the Board of Trustees. Prior to June 1, 2019, the Fund’s expenses were capped at 0.83% for Sweep Class shares.
Distribution fee
The Trust has adopted a distribution plan for Sweep Class shares of the Fund pursuant to Rule12b-1 under the 1940 Act. A distribution fee is charged to Sweep Class shares and paid to Wells Fargo Funds Distributor, LLC, the principal underwriter, at an annual rate of 0.35% of the average daily net assets of Sweep Class shares.
Shareholder servicing fees
The Trust has entered into contracts with one or more shareholder servicing agents, whereby Class A, Service Class, and Sweep Class of the Fund are charged a fee at an annual rate of 0.25% of the respective average daily net assets of each class. Administrator Class is charged a fee at an annual rate of 0.10% of its average daily net assets. A portion of these total shareholder servicing fees were paid to affiliates of Wells Fargo.
Interfund transactions
The Fund may purchase or sell portfolio investment securities to certain other Wells Fargo affiliates pursuant to Rule17a-7 under the 1940 Act and under procedures adopted by the Board of Trustees. The procedures have been designed to ensure that these interfund transactions, which do not incur broker commissions, are effected at current market prices.
5. INDEMNIFICATION
Under the Trust’s organizational documents, the officers and Trustees have been granted certain indemnification rights against certain liabilities that may arise out of performance of their duties to the Trust. Additionally, in the normal course of business, the Trust may enter into contracts with service providers that contain a variety of indemnification clauses. The Trust’s maximum exposure under these arrangements is dependent on future claims that may be made against the Fund and, therefore, cannot be estimated.
Government Money Market Funds | 19
Table of Contents
Notes to financial statements (unaudited)
6. NEW ACCOUNTING PRONOUNCEMENTS
In August 2018, FASB issued Accounting Standards Update (“ASU”)No. 2018-13, Fair Value Measurement (Topic 820)Disclosure Framework—Changes to the Disclosure Requirements for Fair Value Measurement. ASU2018-13 updates the disclosure requirements for fair value measurements by modifying or removing certain disclosures and adding certain new disclosures. The amendments are effective for fiscal years, and interim periods within those fiscal years, beginning after December 15, 2019. Early adoption is permitted. Management has adopted the removal and modification of disclosures early, as permitted, and will adopt the additional new disclosures at the effective date.
In March 2017, FASB issued ASU No. 2017-08,Premium Amortization on Purchased Callable Debt Securities. ASU 2017-08 shortens the amortization period for certain callable debt securities held at a premium and requires the premium to be amortized to the earliest call date. The amendments do not require an accounting change for securities held at a discount and discounts will continue to be accreted to the maturity date of the security. ASU 2017-08 is effective for fiscal years beginning after December 15, 2018 and for interim periods within those fiscal years. During the current reporting period, management of the Fund adopted the change in accounting policy which did not have a material impact to the Fund’s financial statements.
20 | Government Money Market Funds
Table of Contents
PROXY VOTING INFORMATION
A description of the policies and procedures used to determine how to vote proxies relating to portfolio securities is available, upon request, by calling1-800-222-8222, visiting our website atwfam.com, or visiting the SEC website at sec.gov. Information regarding how the proxies related to portfolio securities were voted during the most recent12-month period ended June 30 is available on the website atwfam.comor by visiting the SEC website at sec.gov.
Government Money Market Funds | 21
Table of Contents
Other information (unaudited)
BOARD OF TRUSTEES AND OFFICERS
Each of the Trustees and Officers1 listed in the table below acts in identical capacities for each fund in the Wells Fargo family of funds, which consists of 152 mutual funds comprising the Wells Fargo Funds Trust, Wells Fargo Variable Trust, Wells Fargo Master Trust and fourclosed-end funds (collectively the “Fund Complex”). This table should be read in conjunction with the Prospectus and the Statement of Additional Information2. The mailing address of each Trustee and Officer is 525 Market Street, 12th Floor, San Francisco, CA 94105. Each Trustee and Officer serves an indefinite term, however, each Trustee serves such term until reaching the mandatory retirement age established by the Trustees.
Independent Trustees
Name and year of birth | Position held and length of service* | Principal occupations during past five years or longer | Current other public company or investment company directorships | |||
| William R. Ebsworth (Born 1957) | Trustee, since 2015 | Retired. From 1984 to 2013, equities analyst, portfolio manager, research director and chief investment officer at Fidelity Management and Research Company in Boston, Tokyo, and Hong Kong, and retired in 2013 as Chief Investment Officer of Fidelity Strategic Advisers, Inc. where he led a team of investment professionals managing client assets. Prior thereto, Board member of Hong Kong Securities Clearing Co., Hong Kong Options Clearing Corp., the Thailand International Fund, Ltd., Fidelity Investments Life Insurance Company, and Empire Fidelity Investments Life Insurance Company. Audit Committee Chair and Investment Committee Chair of the Vincent Memorial Hospital Endowment(non-profit organization). Mr. Ebsworth is a CFA® charterholder. | N/A | |||
| Jane A. Freeman (Born 1953) | Trustee, since 2015; Chair Liaison, since 2018 | Retired. From 2012 to 2014 and 1999 to 2008, Chief Financial Officer of Scientific Learning Corporation. From 2008 to 2012, Ms. Freeman provided consulting services related to strategic business projects. Prior to 1999, Portfolio Manager at Rockefeller & Co. and Scudder, Stevens & Clark. Board member of the Harding Loevner Funds from 1996 to 2014, serving as both Lead Independent Director and chair of the Audit Committee. Board member of the Russell Exchange Traded Funds Trust from 2011 to 2012 and the chair of the Audit Committee. Ms. Freeman is a Board Member of The Ruth Bancroft Garden(non-profit organization). She is also an inactive Chartered Financial Analyst. | N/A | |||
| Isaiah Harris, Jr. (Born 1952) | Trustee, since 2009; Audit Committee Chairman, since 2019 | Retired. Chairman of the Board of CIGNA Corporation since 2009, and Director since 2005. From 2003 to 2011, Director of Deluxe Corporation. Prior thereto, President and CEO of BellSouth Advertising and Publishing Corp. from 2005 to 2007, President and CEO of BellSouth Enterprises from 2004 to 2005 and President of BellSouth Consumer Services from 2000 to 2003. Emeritus member of the Iowa State University Foundation Board of Governors. Emeritus Member of the Advisory Board of Iowa State University School of Business. Advisory Board Member, Palm Harbor Academy (private school). Advisory Board Member, Child Evangelism Fellowship(non-profit). Mr. Harris is a certified public accountant (inactive status). | CIGNA Corporation | |||
| Judith M. Johnson (Born 1949) | Trustee, since 2008; Audit Committee Chairman, from 2009 to 2018 | Retired. Prior thereto, Chief Executive Officer and Chief Investment Officer of Minneapolis Employees Retirement Fund from 1996 to 2008. Ms. Johnson is an attorney, certified public accountant and a certified managerial accountant. | N/A | |||
22 | Government Money Market Funds
Table of Contents
Other information (unaudited)
Name and year of birth | Position held and length of service* | Principal occupations during past five years or longer | Current other public company or investment company directorships | |||
| David F. Larcker (Born 1950) | Trustee, since 2009 | James Irvin Miller Professor of Accounting at the Graduate School of Business, Stanford University, Director of the Corporate Governance Research Initiative and Senior Faculty of The Rock Center for Corporate Governance since 2006. From 2005 to 2008, Professor of Accounting at the Graduate School of Business, Stanford University. Prior thereto, Ernst & Young Professor of Accounting at The Wharton School, University of Pennsylvania from 1985 to 2005. | N/A | |||
| Olivia S. Mitchell (Born 1953) | Trustee, since 2006; Nominating and Governance Committee Chairman, since 2018 | International Foundation of Employee Benefit Plans Professor, Wharton School of the University of Pennsylvania since 1993. Director of Wharton’s Pension Research Council and Boettner Center on Pensions & Retirement Research, and Research Associate at the National Bureau of Economic Research. Previously, Cornell University Professor from 1978 to 1993. | N/A | |||
| Timothy J. Penny (Born 1951) | Trustee, since 1996; Chairman, since 2018 | President and Chief Executive Officer of Southern Minnesota Initiative Foundation, anon-profit organization, since 2007. Member of the Board of Trustees of NorthStar Education Finance, Inc., anon-profit organization, since 2007. | N/A | |||
| James G. Polisson (Born 1959) | Trustee, since 2018 | Retired. Chief Marketing Officer, Source (ETF) UK Services, Ltd, from 2015 to 2017. From 2012 to 2015, Principal of The Polisson Group, LLC, a management consulting, corporate advisory and principal investing company. Chief Executive Officer and Managing Director at Russell Investments, Global Exchange Traded Funds from 2010 to 2012. Managing Director of Barclays Global Investors from 1998 to 2010 and Global Chief Marketing Officer for iShares and Barclays Global Investors from 2000 to 2010. Trustee of the San Francisco Mechanics’ Institute, anon-profit organization, from 2013 to 2015. Board member of the Russell Exchange Traded Fund Trust from 2011 to 2012. Director of Barclays Global Investors Holdings Deutschland GmbH from 2006 to 2009. Mr. Polisson is an attorney and has a retired status with the Massachusetts and District of Columbia Bar Associations. | N/A | |||
| * | Length of service dates reflect the Trustee’s commencement of service with the Trust’s predecessor entities, where applicable. |
Government Money Market Funds | 23
Table of Contents
Other information (unaudited)
Officers
Name and year of birth | Position held and length of service | Principal occupations during past five years or longer | ||
Andrew Owen (Born 1960) | President, since 2017 | Executive Vice President of Wells Fargo & Company and Head of Affiliated Managers, Wells Fargo Asset Management, since 2014. In addition, Mr. Owen is currently President, Chief Executive Officer and Director of Wells Fargo Funds Management, LLC since 2017. Prior thereto, Executive Vice President responsible for marketing, investments and product development for Wells Fargo Funds Management, LLC, from 2009 to 2014. | ||
Nancy Wiser1 (Born 1967) | Treasurer, since 2012 | Executive Vice President of Wells Fargo Funds Management, LLC since 2011. Chief Operating Officer and Chief Compliance Officer at LightBox Capital Management LLC, from 2008 to 2011. | ||
| Alexander Kymn (Born 1973) | Secretary and Chief Legal Officer, since 2018 | Senior Company Counsel of Wells Fargo Bank, N.A. since 2018 (previously Senior Counsel from 2007 to 2018). Vice President of Wells Fargo Funds Management, LLC from 2008 to 2014. | ||
| Michael H. Whitaker(Born 1967) | Chief Compliance Officer, since 2016 | Senior Vice President and Chief Compliance Officer since 2016. Senior Vice President and Chief Compliance Officer for Fidelity Investments from 2007 to 2016. | ||
David Berardi (Born 1975) | Assistant Treasurer, since 2009 | Vice President of Wells Fargo Funds Management, LLC since 2009. Vice President of Evergreen Investment Management Company, LLC from 2008 to 2010. Manager of Fund Reporting and Control for Evergreen Investment Management Company, LLC from 2004 to 2010. | ||
| Jeremy DePalma1 (Born 1974) | Assistant Treasurer, since 2009 | Senior Vice President of Wells Fargo Funds Management, LLC since 2009. Senior Vice President of Evergreen Investment Management Company, LLC from 2008 to 2010 and head of the Fund Reporting and Control Team within Fund Administration from 2005 to 2010. | ||
| 1 | Nancy Wiser acts as Treasurer of 65 funds in the Fund Complex. Jeremy DePalma acts as Treasurer of 87 funds and Assistant Treasurer of 65 funds in the Fund Complex. |
| 2 | The Statement of Additional Information includes additional information about the Trustees and is available, without charge, upon request, by calling1-800-222-8222 or by visiting the website atwfam.com. |
24 | Government Money Market Funds
Table of Contents
Other information (unaudited)
BOARD CONSIDERATION OF INVESTMENT MANAGEMENT ANDSUB-ADVISORY AGREEMENTS:
Wells Fargo 100% Treasury Money Market Fund
Under the Investment Company Act of 1940 (the “1940 Act”), the Board of Trustees (the “Board”) of Wells Fargo Funds Trust (the “Trust”) must determine annually whether to approve the continuation of the Trust’s investment management andsub-advisory agreements. In this regard, at anin-person meeting held on May21-22, 2019 (the “Meeting”), the Board, all the members of which have no direct or indirect interest in the investment management andsub-advisory agreements and are not “interested persons” of the Trust, as defined in the 1940 Act (the “Independent Trustees”), reviewed and approved for Wells Fargo 100% Treasury Money Market Fund(the “Fund”): (i) an investment management agreement (the “Management Agreement”) with Wells Fargo Funds Management, LLC (“Funds Management”); and (ii) an investmentsub-advisory agreement (the“Sub-Advisory Agreement”) with Wells Capital Management Incorporated (the“Sub-Adviser”), an affiliate of Funds Management. The Management Agreement and theSub-Advisory Agreement are collectively referred to as the “Advisory Agreements.”
At the Meeting, the Board considered the factors and reached the conclusions described below relating to the selection of Funds Management and theSub-Adviser and the approval of the Advisory Agreements. Prior to the Meeting, including at anin-person meeting in April 2019, the Trustees conferred extensively among themselves and with representatives of Funds Management about these matters. Also, the Board has adopted a team-based approach, with each team consisting of asub-set of Trustees, to assist the full Board in the discharge of its duties in reviewing investment performance and other matters throughout the year. The Independent Trustees were assisted in their evaluation of the Advisory Agreements by independent legal counsel, from whom they received separate legal advice and with whom they met separately.
In providing information to the Board, Funds Management and theSub-Adviser were guided by a detailed set of requests for information submitted to them by independent legal counsel on behalf of the Independent Trustees at the start of the Board’s annual contract renewal process earlier in 2019. In considering and approving the Advisory Agreements, the Trustees considered the information they believed relevant, including but not limited to the information discussed below. The Board considered not only the specific information presented in connection with the Meeting, but also the knowledge gained over time through interaction with Funds Management and theSub-Adviser about various topics. In this regard, the Board reviewed reports of Funds Management at each of its quarterly meetings, which included, among other things, portfolio reviews and investment performance reports. In addition, the Board and the teams mentioned above confer with portfolio managers at various times throughout the year. The Board did not identify any particular information or consideration that wasall-important or controlling, and each individual Trustee may have attributed different weights to various factors.
After its deliberations, the Board unanimously approved the continuation of the Advisory Agreements for aone-year term and determined that the compensation payable to Funds Management and theSub-Adviser under each of the Advisory Agreements was reasonable. The Board considered the approval of the Advisory Agreements for the Fund as part of its consideration of agreements for funds across the complex, but its approvals were made on afund-by-fund basis. The following summarizes a number of important, but not necessarily all, factors considered by the Board in support of its approvals.
Nature, extent and quality of services
The Board received and considered various information regarding the nature, extent and quality of services provided to the Fund by Funds Management and theSub-Adviser under the Advisory Agreements. This information included a description of the investment advisory services and Fund-level administrative services covered by the Management Agreement, as well as, among other things, a summary of the background and experience of senior management of Wells Fargo Asset Management (“WFAM”), of which Funds Management and theSub-Adviser are a part, a summary of investments made in the business of WFAM, a summary of certain organizational and personnel changes involving Funds Management and theSub-Adviser, and a description of Funds Management’s and theSub-Adviser’s business continuity planning programs and of their approaches to data privacy and cybersecurity. The Board received and reviewed information about Funds Management’s role as administrator of the Fund’s liquidity risk management program. The Board also considered the qualifications, background, tenure and responsibilities of each of the portfolio managers primarily responsible for theday-to-day portfolio management of the Fund.
The Board evaluated the ability of Funds Management and theSub-Adviser to attract and retain qualified investment professionals, including research, advisory and supervisory personnel. The Board further considered the compliance programs and compliance records of Funds Management and theSub-Adviser. In addition, the Board took into account the full range of services provided to the Fund by Funds Management and its affiliates.
Government Money Market Funds | 25
Table of Contents
Other information (unaudited)
Fund investment performance and expenses
The Board considered the investment performance results for the Fund over various time periods ended December 31, 2018. The Board considered these results in comparison to the investment performance of funds in a universe that was determined by Broadridge Inc. (“Broadridge”) to be similar to the Fund (the “Universe”), and in comparison to the Fund’s benchmark index and to other comparative data. Broadridge is an independent provider of investment company data. The Board received a description of the methodology used by Broadridge to select the mutual funds in the performance Universe. The Board noted that the investment performance of the Fund (Service Class) was higher than or equal to the average investment performance of the Universe for all periods under review. The Board also noted that the investment performance of the Fund was higher than or equal to its benchmark index, the Lipper U.S. Treasury Money Market Funds, for all periods under review.
The Board also received and considered information regarding the Fund’s net operating expense ratios and their various components, including actual management fees, custodian and othernon-management fees, and Rule12b-1 andnon-Rule12b-1 shareholder service fees. The Board considered these ratios in comparison to the median ratios of funds in class-specific expense groups that were determined by Broadridge to be similar to the Fund (the “Groups”). The Board received a description of the methodology used by Broadridge to select the mutual funds in the expense Groups and an explanation of how funds comprising expense groups and their expense ratios may vary fromyear-to-year. Based on the Broadridge reports, the Board noted that the net operating expense ratios of the Fund were lower than or in range of the median net operating expense ratios of the expense Groups for each share class.
The Board took into account the Fund’s investment performance and expense information provided to it among the factors considered in deciding tore-approve the Advisory Agreements.
Investment management andsub-advisory fee rates
The Board reviewed and considered the contractual fee rates payable by the Fund to Funds Management under the Management Agreement, as well as the contractual fee rates payable by the Fund to Funds Management for class-level administrative services under a Class-Level Administration Agreement, which include, among other things, class-level transfer agency andsub-transfer agency costs (collectively, the “Management Rates”). The Board also discussed and accepted Funds Management’s proposal to revise the Management Agreement to reduce the management fees paid by the Fund to Funds Management. The Board also reviewed and considered the contractual investmentsub-advisory fee rates that are payable by Funds Management to theSub-Adviser for investmentsub-advisory services.
Among other information reviewed by the Board was a comparison of the Fund’s Management Rates with the average contractual investment management fee rates of funds in the expense Groups at a common asset level as well as transfer agency costs of the funds in the expense Groups. The Board noted that the Management Rates of the Fund were lower than or in range of the sum of these average rates for the Fund’s expense Groups for all share classes.
The Board also received and considered information about the portion of the total management fee that was retained by Funds Management after payment of the fee to theSub-Adviser forsub-advisory services. In assessing the reasonableness of this amount, the Board received and evaluated information about the nature and extent of responsibilities retained and risks assumed by Funds Management and not delegated to or assumed by theSub-Adviser, and about Funds Management’son-going oversight services. Given the affiliation between Funds Management and theSub-Adviser, the Board ascribed limited relevance to the allocation of fees between them.
The Board also received and considered information about the nature and extent of services offered and fee rates charged by Funds Management and theSub-Adviser to other types of clients with investment strategies similar to those of the Fund. In this regard, the Board received information about the significantly greater scope of services, and compliance, reporting and other legal burdens and risks of managing proprietary mutual funds compared with those associated with managing assets of other types of clients, including third-partysub-advised fund clients andnon-mutual fund clients such as institutional separate accounts.
Based on its consideration of the factors and information it deemed relevant, including those described here, the Board determined that the compensation payable to Funds Management under the Management Agreement and to theSub-Adviser under theSub-Advisory Agreement was reasonable.
Profitability
The Board received and considered information concerning the profitability of Funds Management, as well as the profitability of both WFAM and Wells Fargo & Co. (“Wells Fargo”) from providing services to the fund family as a whole. The Board noted that theSub-Adviser’s profitability information with respect to providing services to the Fund and other funds in the family was subsumed in the WFAM and Wells Fargo profitability analysis.
26 | Government Money Market Funds
Table of Contents
Other information (unaudited)
Funds Management reported on the methodologies and estimates used in calculating profitability, including a description of the methodology used to allocate certain expenses. Among other things, the Board noted that the levels of profitability reported on afund-by-fund basis varied widely, depending on factors such as the size, type and age of fund. Based on its review, the Board did not deem the profits reported by Funds Management, WFAM or Wells Fargo from services provided to the Fund to be at a level that would prevent it from approving the continuation of the Advisory Agreements.
Economies of scale
The Board received and considered information about the potential for Funds Management to experience economies of scale in the provision of management services to the Fund, the difficulties of calculating economies of scale at an individual fund level, and the extent to which potential scale benefits are shared with shareholders. The Board noted the existence of breakpoints in the Fund’s management fee structure, which operate generally to reduce the Fund’s expense ratios as the Fund grows in size. The Board considered that in addition to management fee breakpoints, Funds Management shares potential economies of scale from its management business in a variety of ways, including through fee waiver and expense reimbursement arrangements, services that benefit shareholders, competitive management fee rates set at the outset without regard to breakpoints, and investments in the business intended to enhance services available to shareholders. The Board also discussed and accepted Funds Management’s proposal to revise the Management Agreement to reduce the management fees paid by the Fund to Funds Management.
The Board concluded that Funds Management’s arrangements with respect to the Fund, including contractual breakpoints, constituted a reasonable approach to sharing potential economies of scale with the Fund and its shareholders.
Other benefits to Funds Management and theSub-Adviser
The Board received and considered information regarding potential“fall-out” or ancillary benefits received by Funds Management and its affiliates, including theSub-Adviser, as a result of their relationships with the Fund. Ancillary benefits could include, among others, benefits directly attributable to other relationships with the Fund and benefits potentially derived from an increase in Funds Management’s and theSub-Adviser’s business as a result of their relationships with the Fund. The Board noted that various affiliates of Funds Management may receive distribution-related fees, shareholder servicing payments andsub-transfer agency fees in respect of shares sold or held through them and services provided.
The Board also reviewed information about soft dollar credits earned and utilized by theSub-Adviser, fees earned by Funds Management and theSub-Adviser from managing a private investment vehicle for the fund family’s securities lending collateral, and commissions earned by an affiliated broker from portfolio transactions.
Based on its consideration of the factors and information it deemed relevant, including those described here, the Board did not find that any ancillary benefits received by Funds Management and its affiliates, including theSub-Adviser, were unreasonable.
Conclusion
At the Meeting, after considering the above-described factors and based on its deliberations and its evaluation of the information described above, the Board unanimously approved the continuation of the Advisory Agreements for aone-year term and determined that the compensation payable to Funds Management and theSub-Adviser under each of the Advisory Agreements was reasonable.
Government Money Market Funds | 27
Table of Contents
This page is intentionally left blank.
Table of Contents
For more information
More information about Wells Fargo Funds is available free upon request. To obtain literature, please write, visit the Fund’s website, or call:
Wells Fargo Funds
P.O. Box 219967
Kansas City, MO 64121-9967
Website:wfam.com
Individual investors:1-800-222-8222
Retail investment professionals:1-888-877-9275
Institutional investment professionals:1-866-765-0778

This report and the financial statements contained herein are submitted for the general information of the shareholders of the Fund. If this report is used for promotional purposes, distribution of the report must be accompanied or preceded by a current prospectus. Before investing, please consider the investment objectives, risks, charges, and expenses of the investment. For a current prospectus and, if available, a summary prospectus, containing this information, call1-800-260-5969 or visit the Fund’s website atwfam.com. Read the prospectus carefully before you invest or send money.
Wells Fargo Asset Management (WFAM) is the trade name for certain investment advisory/management firms owned by Wells Fargo & Company. These firms include but are not limited to Wells Capital Management Incorporated and Wells Fargo Funds Management, LLC. Certain products managed by WFAM entities are distributed by Wells Fargo Funds Distributor, LLC (a broker-dealer and Member FINRA).
This material is for general informational and educational purposes only and is NOT intended to provide investment advice or a recommendation of any kind—including a recommendation for any specific investment, strategy, or plan.
INVESTMENT PRODUCTS: NOT FDIC INSURED ◾ NO BANK GUARANTEE ◾ MAY LOSE VALUE
© 2019 Wells Fargo Funds Management, LLC. All rights reserved.
405492 09-19
SA300/SAR300 07-19
Table of Contents

Semi-Annual Report
July 31, 2019
Government Money Market Funds
| ∎ | Wells Fargo Treasury Plus Money Market Fund |
Beginning on January 1, 2021, as permitted by new regulations adopted by the Securities and Exchange Commission, paper copies of the Wells Fargo Funds’ annual and semi-annual shareholder reports issued after this date will no longer be sent by mail, unless you specifically request paper copies of the reports. Instead, the reports will be made available on the Funds’ website, and you will be notified by mail each time a report is posted and provided with a website address to access the report.
If you already elected to receive shareholder reports electronically, you will not be affected by this change and you need not take any action. You may elect to receive shareholder reports and other communications from the Fund electronically at any time by contacting your financial intermediary (such as a broker-dealer or bank) or, if you are a direct investor, by calling1-800-222-8222 or by enrolling at wellsfargo.com/advantagedelivery.
You may elect to receive all future reports in paper free of charge. If you invest through a financial intermediary, you can contact your financial intermediary to request that you continue to receive paper copies of your shareholder reports; if you invest directly with the Fund, you can call 1-800-222-8222. Your election to receive reports in paper will apply to all Wells Fargo Funds held in your account with your financial intermediary or, if you are a direct investor, to all Wells Fargo Funds that you hold.
Table of Contents
|
Reduce clutter. Save trees. |
Sign up for electronic delivery of prospectuses and shareholder reports atwellsfargo.com/advantagedelivery |
The views expressed and any forward-looking statements are as of July 31, 2019, unless otherwise noted, and are those of the Fund managers and/or Wells Fargo Asset Management. Discussions of individual securities, or the markets generally, or any Wells Fargo Fund are not intended as individual recommendations. Future events or results may vary significantly from those expressed in any forward-looking statements. The views expressed are subject to change at any time in response to changing circumstances in the market. Wells Fargo Asset Management and the Fund disclaim any obligation to publicly update or revise any views expressed or forward-looking statements.
INVESTMENT PRODUCTS: NOT FDIC INSURED ◾ NO BANK GUARANTEE ◾ MAY LOSE VALUE
Government Money Market Funds | 1
Table of Contents
Letter to shareholders (unaudited)

Andrew Owen
President
Wells Fargo Funds
Dear Shareholder:
We are pleased to offer you this semi-annual report for the Wells Fargo Treasury Plus Money Market Fund for the six-month period that ended July 31, 2019. Global stock and bond investors enjoyed gains that came amid continued concerns about global economic growth, international trade, geopolitical tensions, and bouts of market volatility. These concerns grew more intense as the period closed.
For the period, U.S. stocks, based on the S&P 500 Index,1 gained 11.32% and international stocks, as measured by the MSCI ACWI ex USA Index (Net),2 added 4.34%. The MSCI EM Index (Net)3 inched higher by 0.44%. For bond investors, the Bloomberg Barclays U.S. Aggregate Bond Index4 added 5.23%, the Bloomberg Barclays Global Aggregate ex-USD Index5 added 2.33%, the Bloomberg Barclays Municipal Bond Index6 gained 5.15%, and the ICE BofAML U.S. High Yield Index7 added 5.86%.
Concerns for slowing global growth reemerge during the first quarter of 2019.
After the S&P 500 Index’s best monthly performance in 30 years during January and positive returns for other major indices across major asset classes, signs of slowing global growth grew more ominous in February. The Bureau of Economic Analysis announced fourth-quarter 2018 gross domestic product (GDP) grew at an annualized 2.2% rate, down from the levels of the prior two quarters. In a February report, the Bank of England forecast the slowest growth since the financial crisis for 2019. China and the U.S. continued to wrangle over trade issues.
By the end of March 2019, a combination of dovish U.S. Federal Reserve (Fed) sentiment and steady, if not spectacular, U.S. economic and business metrics reinforced investors’ confidence. Monthly job creation data and corporate profits, while less consistent than during 2018, were solid. China announced a roughly $300 billion stimulus package through tax and fee cuts intended to reinvigorate economic growth. During April 2019, favorable sentiment found additional support in reports of sustained low inflation, solid employment data, and first-quarter U.S. GDP of an annualized rate of 3.2%.
| 1 | The S&P 500 Index consists of 500 stocks chosen for market size, liquidity, and industry group representation. It is a market-value-weighted index with each stock’s weight in the index proportionate to its market value. You cannot invest directly in an index. |
| 2 | The Morgan Stanley Capital International (MSCI) All Country World Index (ACWI) ex USA Index (Net) is a free-float-adjusted market-capitalization weighted index that is designed to measure the equity market performance of developed and emerging markets, excluding the U.S. Source: MSCI. MSCI makes no express or implied warranties or representations and shall have no liability whatsoever with respect to any MSCI data contained herein. The MSCI data may not be further redistributed or used as a basis for other indices or any securities or financial products. This report is not approved, reviewed, or produced by MSCI. You cannot invest directly in an index. |
| 3 | The MSCI Emerging Markets (EM) Index (Net) is a free-float-adjusted market-capitalization-weighted index that is designed to measure the equity market performance of emerging markets. You cannot invest directly in an index. |
| 4 | The Bloomberg Barclays U.S. Aggregate Bond Index is a broad-based benchmark that measures the investment-grade, U.S. dollar-denominated, fixed-rate taxable bond market, including Treasuries, government-related and corporate securities, mortgage-backed securities (agency fixed-rate and hybrid adjustable-rate mortgage pass-throughs), asset-backed securities, and commercial mortgage-backed securities. You cannot invest directly in an index. |
| 5 | The Bloomberg Barclays Global Aggregate ex-USD Index is an unmanaged index that provides a broad-based measure of the global investment-grade fixed-income markets excluding the U.S. dollar-denominated debt market. You cannot invest directly in an index. |
| 6 | The Bloomberg Barclays Municipal Bond Index is an unmanaged index composed of long-term tax-exempt bonds with a minimum credit rating of Baa. You cannot invest directly in an index. |
| 7 | The ICE BofAML U.S. High Yield Index is a market-capitalization-weighted index of domestic and Yankee high-yield bonds. The index tracks the performance of high-yield securities traded in the U.S. bond market. You cannot invest directly in an index. Copyright 2019. ICE Data Indices, LLC. All rights reserved. |
2 | Government Money Market Funds
Table of Contents
Letter to shareholders (unaudited)
During May 2019, markets tumbled on mixed investment signals. In the U.S., partisan wrangling ramped up as Democrats and Republicans set their sights on 2020 presidential politics. The U.K.’s Brexit caused Prime Minister Theresa May to resign. The European Commission downgraded the 2019 growth forecast to 1.2%. The U.S. increased tariffs on products from China, China responded, and then talks broke down. President Donald Trump threatened to turn his foreign policy tariff tool to Mexico over immigration issues.
As had been the case during most of 2019 to date, just as the investment horizon appeared to darken, sentiment turned and U.S. equity markets gained during June and July. The gains, primarily driven by geopolitical and monetary policy events, pushed equity markets to new highs.
President Mario Draghi of the European Central Bank said that if the outlook doesn’t improve, the bank will cut rates or buy more assets to prop up inflation. President Trump backed off of tariff threats against Mexico and China. In the U.S., the Fed implemented a 0.25% federal funds rate cut in July 2019.
Later in July 2019, the U.S. reversed course and threatened to impose higher tariffs on China’s exports after talks failed. China responded with tariff threats of its own and devalued the renminbi, a move that roiled global markets. Despite the accommodative approach of central banks, investors continued to have misgivings about the durability of economic growth globally and a pervasively cautious tone influenced the world’s equity and fixed-income markets.
Don’t let short-term uncertainty derail long-term investment goals.
Periods of investment uncertainty can present challenges, but experience has taught us that maintaining long-term investment goals can be an effective way to plan for the future. To help you create a sound strategy based on your personal goals and risk tolerance, Wells Fargo Funds offers more than 100 mutual funds spanning a wide range of asset classes and investment styles. Although diversification cannot guarantee an investment profit or prevent losses, we believe it can be an effective way to manage investment risk and potentially smooth out overall portfolio performance. We encourage investors to know their investments and to understand that appropriate levels of risk-taking may unlock opportunities.
Thank you for choosing to invest with Wells Fargo Funds. We appreciate your confidence in us and remain committed to helping you meet your financial needs.
Sincerely,

Andrew Owen
President
Wells Fargo Funds
“During May 2019, markets tumbled on mixed investment signals.”
“In the U.S., the Fed implemented a 0.25% federal funds rate cut in July 2019.”
|
For further information about your Fund, contact your investment professional, visit our website at wfam.com,or call us directly at1-800-222-8222. |
Government Money Market Funds | 3
Table of Contents
Performance highlights (unaudited)
Investment objective
The Fund seeks current income, while preserving capital and liquidity.
Manager
Wells Fargo Funds Management, LLC
Subadviser
Wells Capital Management Incorporated
Portfolio managers
Michael C. Bird, CFA®‡
Jeffrey L. Weaver, CFA®‡
Laurie White
Average annual total returns (%) as of July 31, 2019
| Expense ratios1 (%) | ||||||||||||||||||||||
| Inception date | 1 year | 5 year | 10 year | Gross | Net2 | |||||||||||||||||
| Class A (PIVXX) | 7-28-2003 | 1.75 | 0.54 | 0.27 | 0.61 | 0.60 | ||||||||||||||||
| Administrator Class (WTPXX) | 3-31-2008 | 2.01 | 0.68 | 0.34 | 0.34 | 0.34 | ||||||||||||||||
| Institutional Class (PISXX) | 8-11-1995 | 2.16 | 0.78 | 0.40 | 0.22 | 0.20 | ||||||||||||||||
| Select Class3 | 3-15-2019 | 2.17 | 0.78 | 0.40 | 0.18 | 0.14 | ||||||||||||||||
| Service Class (PRVXX) | 10-1-1985 | 1.90 | 0.62 | 0.31 | 0.51 | 0.45 | ||||||||||||||||
| Sweep Class4 | 6-30-2010 | 1.58 | 0.46 | 0.23 | 0.77 | 0.77 | ||||||||||||||||
Yield summary (%) as of July 31, 20192
| Class A | Administrator Class | Institutional Class | Select Class | Service Class | Sweep Class | |||||||||||||||||
| 7-day current yield | 1.76 | 2.02 | 2.16 | 2.22 | 1.91 | 1.59 | ||||||||||||||||
| 7-day compound yield | 1.77 | 2.04 | 2.18 | 2.24 | 1.93 | 1.60 | ||||||||||||||||
| 30-day simple yield | 1.80 | 2.06 | 2.20 | 2.26 | 1.95 | 1.63 | ||||||||||||||||
| 30-day compound yield | 1.82 | 2.08 | 2.22 | 2.29 | 1.97 | 1.64 | ||||||||||||||||
Figures quoted represent past performance, which is no guarantee of future results, and do not reflect taxes that a shareholder may pay on fund distributions or the redemption of fund shares. Investment returns will fluctuate. The Fund’s yield figures more closely reflect the current earnings of the Fund than the total return figures. Current performance may be lower or higher than the performance data quoted, which assumes the reinvestment of dividends and capital gains. Current month-end performance is available on the Fund’s website,wfam.com.
Each class is sold without a front-end sales charge or contingent deferred sales charge.
For government money market funds: You could lose money by investing in the Fund. Although the Fund seeks to preserve the value of your investment at $1.00 per share, it cannot guarantee it will do so. An investment in the Fund is not insured or guaranteed by the Federal Deposit Insurance Corporation or any other government agency. The Fund’s sponsor has no legal obligation to provide financial support to the Fund, and you should not expect that the sponsor will provide financial support to the Fund at any time.
Please see footnotes on page 5.
4 | Government Money Market Funds
Table of Contents
Performance highlights (unaudited)
| Portfolio composition as of July 31, 20195 |
|
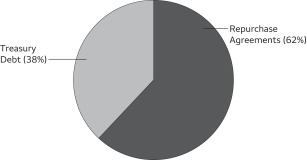
| Effective maturity distribution as of July 31, 20195 |
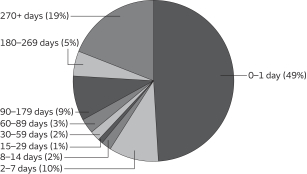 |
| Weighted average maturity as of July 31, 20196 |
25 days |
| Weighted average life as of July 31, 20197 |
111 days |
| ‡ | CFA® and Chartered Financial Analyst® are trademarks owned by CFA Institute. |
| 1 | Reflects the expense ratios as stated in the most recent prospectuses. The expense ratios shown are subject to change and may differ from the annualized expense ratios shown in the financial highlights of this report. |
| 2 | The manager has contractually committed through May 31, 2020, to waive fees and/or reimburse expenses to cap the expenses of each class after fee waivers at the amounts shown. Brokerage commissions, stamp duty fees, interest, taxes, acquired fund fees and expenses (if any), and extraordinary expenses are excluded from the cap. Prior to or after the commitment expiration date, the cap may be increased or the commitment to maintain the cap may be terminated only with the approval of the Board of Trustees. Without this cap, the Fund’s returns would have been lower. Without waived fees and/or reimbursed expenses, the Fund’s 7-day current yield would have been 1.74%, 2.01%, 2.13%, 2.17%, 1.84%, and 1.59% for Class A, Administrator Class, Institutional Class, Select Class, Service Class, and Sweep Class, respectively. The expense ratio paid by an investor is the net expense ratio (the total annual fund operating expenses after fee waivers) as stated in the prospectuses. |
| 3 | Historical performance shown for the Select Class shares prior to their inception reflects the performance of the Institutional Class shares, and includes the higher expenses applicable to Institutional Class shares. If these expenses had not been included, returns for Select Class shares would be higher. |
| 4 | Historical performance shown for Sweep Class shares prior to their inception reflects the performance of Class A shares, and has not been adjusted to include the higher expenses applicable to Sweep Class shares. If these expenses had been adjusted, returns for Sweep Class shares would be lower. |
| 5 | Amounts are calculated based on the total investments of the Fund. These amounts are subject to change and may have changed since the date specified. |
| 6 | Weighted Average Maturity (WAM): WAM is an average of the effective maturities of all securities held in the portfolio, weighted by each security’s percentage of total investments. The maturity of a portfolio security is the period remaining until the date on which the principal amount is unconditionally required to be paid, or in the case of a security called for redemption, the date on which the redemption payment is unconditionally required to be made. WAM calculations allow for the maturities of certain securities with demand features or periodic interest rate resets to be shortened. WAM is a way to measure a fund’s sensitivity to potential interest rate changes. WAM is subject to change and may have changed since the date specified. |
| 7 | Weighted Average Life (WAL): WAL is an average of the final maturities of all securities held in the portfolio, weighted by their percentage of total investments. The maturity of a portfolio security is the period remaining until the date on which the principal amount is unconditionally required to be paid, or in the case of a security called for redemption, the date on which the redemption payment is unconditionally required to be made. In contrast to WAM, the calculation of WAL allows for the maturities of certain securities with demand features to be shortened, but not the periodic interest rate resets. WAL is a way to measure a fund’s potential sensitivity to credit spread changes. WAL is subject to change and may have changed since the date specified. |
Government Money Market Funds | 5
Table of Contents
As a shareholder of the Fund, you incur ongoing costs, including management fees, distribution (12b-1) and/or shareholder servicing fees, and other Fund expenses. This example is intended to help you understand your ongoing costs (in dollars) of investing in the Fund and to compare these costs with the ongoing costs of investing in other mutual funds.
The example is based on an investment of $1,000 invested at the beginning of the six-month period and held for the entire period from February 1, 2019 to July 31, 2019.
Actual expenses
The “Actual” line of the table below provides information about actual account values and actual expenses. You may use the information in this line, together with the amount you invested, to estimate the expenses that you paid over the period. Simply divide your account value by $1,000 (for example, an $8,600 account value divided by $1,000 = 8.6), then multiply the result by the number in the “Actual” line under the heading entitled “Expenses paid during period” for your applicable class of shares to estimate the expenses you paid on your account during this period.
Hypothetical example for comparison purposes
The “Hypothetical” line of the table below provides information about hypothetical account values and hypothetical expenses based on the Fund’s actual expense ratio and an assumed rate of return of 5% per year before expenses, which is not the Fund’s actual return. The hypothetical account values and expenses may not be used to estimate the actual ending account balance or expenses you paid for the period. You may use this information to compare the ongoing costs of investing in the Fund and other funds. To do so, compare this 5% hypothetical example with the 5% hypothetical examples that appear in the shareholder reports of the other funds.
Please note that the expenses shown in the table are meant to highlight your ongoing costs only. Therefore, the “Hypothetical” line of the table is useful in comparing ongoing costs only and will not help you determine the relative total costs of owning different funds.
| Beginning account value 2-1-2019 | Ending account value 7-31-2019 | Expenses paid during the period¹ | Annualized net expense ratio | |||||||||||||
Class A | ||||||||||||||||
Actual | $ | 1,000.00 | $ | 1,009.18 | $ | 2.99 | 0.60 | % | ||||||||
Hypothetical (5% return before expenses) | $ | 1,000.00 | $ | 1,021.82 | $ | 3.01 | 0.60 | % | ||||||||
Administrator Class | ||||||||||||||||
Actual | $ | 1,000.00 | $ | 1,010.48 | $ | 1.69 | 0.34 | % | ||||||||
Hypothetical (5% return before expenses) | $ | 1,000.00 | $ | 1,023.11 | $ | 1.71 | 0.34 | % | ||||||||
Institutional Class | ||||||||||||||||
Actual | $ | 1,000.00 | $ | 1,011.18 | $ | 1.00 | 0.20 | % | ||||||||
Hypothetical (5% return before expenses) | $ | 1,000.00 | $ | 1,023.80 | $ | 1.00 | 0.20 | % | ||||||||
Select Class | ||||||||||||||||
Actual | $ | 1,000.00 | $ | 1,011.28 | $ | 0.70 | 0.14 | % | ||||||||
Hypothetical (5% return before expenses) | $ | 1,000.00 | $ | 1,024.10 | $ | 0.70 | 0.14 | % | ||||||||
Service Class | ||||||||||||||||
Actual | $ | 1,000.00 | $ | 1,009.92 | $ | 2.24 | 0.45 | % | ||||||||
Hypothetical (5% return before expenses) | $ | 1,000.00 | $ | 1,022.56 | $ | 2.26 | 0.45 | % | ||||||||
Sweep Class | ||||||||||||||||
Actual | $ | 1,000.00 | $ | 1,008.33 | $ | 3.83 | 0.77 | % | ||||||||
Hypothetical (5% return before expenses) | $ | 1,000.00 | $ | 1,020.98 | $ | 3.86 | 0.77 | % | ||||||||
| 1 | Expenses paid is equal to the annualized net expense ratio of each class multiplied by the average account value over the period, multiplied by the number of days in the most recent fiscal half-year divided by the number of days in the fiscal year (to reflect the one-half-year period). |
6 | Government Money Market Funds
Table of Contents
Portfolio of investments—July 31, 2019 (unaudited)
Interest rate | Maturity date | Principal | Value | |||||||||||||
| Repurchase Agreements ^^: 62.26% | ||||||||||||||||
Bank of America, dated7-31-2019, maturity value $200,014,111 (1) | 2.54 | % | 8-1-2019 | $ | 200,000,000 | $ | 200,000,000 | |||||||||
Bank of Montreal, dated7-31-2019, maturity value $650,045,681 (2) | 2.53 | 8-1-2019 | 650,000,000 | 650,000,000 | ||||||||||||
Bank of Nova Scotia NY, dated7-31-2019, maturity value $160,011,200 (3) | 2.52 | 8-1-2019 | 160,000,000 | 160,000,000 | ||||||||||||
BNP Paribas, dated7-18-2019, maturity value $200,746,667 (4) | 2.24 | 9-16-2019 | 200,000,000 | 200,000,000 | ||||||||||||
BNP Paribas, dated7-24-2019, maturity value $75,269,458 (5) | 2.23 | 9-20-2019 | 75,000,000 | 75,000,000 | ||||||||||||
BNP Paribas, dated7-31-2019, maturity value $200,087,500 (6) | 2.25 | 8-7-2019 | 200,000,000 | 200,000,000 | ||||||||||||
Citigroup Global Markets, dated7-25-2019, maturity value $250,117,639 (7) | 2.42 | 8-1-2019 | 250,000,000 | 250,000,000 | ||||||||||||
Credit Agricole SA, dated7-18-2019, maturity value $100,205,333 (8)¢øø§ | 2.28 | 8-19-2019 | 100,000,000 | 100,000,000 | ||||||||||||
Credit Agricole SA, dated7-31-2019, maturity value $200,087,500 (9) | 2.25 | 8-7-2019 | 200,000,000 | 200,000,000 | ||||||||||||
Fixed Income Clearing Corporation, dated7-31-2019, maturity value $1,500,107,592 (10) | 2.57 | 8-1-2019 | 1,500,000,509 | 1,500,000,509 | ||||||||||||
Fixed Income Clearing Corporation, dated7-31-2019, maturity value $250,015,625 (11) | 2.25 | 8-1-2019 | 250,000,000 | 250,000,000 | ||||||||||||
Fixed Income Clearing Corporation, dated7-31-2019, maturity value $250,019,693 (12) | 2.73 | 8-1-2019 | 250,000,735 | 250,000,735 | ||||||||||||
Fixed Income Clearing Corporation, dated7-31-2019, maturity value $500,034,028 (13) | 2.45 | 8-1-2019 | 500,000,000 | 500,000,000 | ||||||||||||
Fixed Income Clearing Corporation, dated7-31-2019, maturity value $750,047,083 (14) | 2.26 | 8-1-2019 | 750,000,000 | 750,000,000 | ||||||||||||
ING Financial Markets LLC, dated7-31-2019, maturity value $100,007,807 (15) | 2.53 | 8-1-2019 | 100,000,779 | 100,000,779 | ||||||||||||
JPMorgan Securities, dated7-1-2019, maturity value | 2.43 | 8-1-2019 | 100,000,000 | 100,000,000 | ||||||||||||
JPMorgan Securities, dated7-31-2019, maturity value $570,040,217 (17) | 2.54 | 8-1-2019 | 570,000,000 | 570,000,000 | ||||||||||||
MetLife Incorporated, dated7-31-2019, maturity value $250,022,334 (18) | 2.55 | 8-1-2019 | 250,004,625 | 250,004,625 | ||||||||||||
MUFG Securities Canada Limited, dated7-30-2019, maturity value $250,112,778 (19) | 2.32 | 8-6-2019 | 250,000,000 | 250,000,000 | ||||||||||||
MUFG Securities Canada Limited, dated7-31-2019, maturity value $500,219,722 (20) | 2.26 | 8-7-2019 | 500,000,000 | 500,000,000 | ||||||||||||
Prudential, dated7-31-2019, maturity value $123,128,505 (21) | 2.56 | 8-1-2019 | 123,119,750 | 123,119,750 | ||||||||||||
RBC Dominion, dated7-17-2019, maturity value $250,543,125 (22)¢øø§ | 2.37 | 8-19-2019 | 250,000,000 | 250,000,000 | ||||||||||||
RBC Dominion, dated7-31-2019, maturity value $370,025,900 (23) | 2.52 | 8-1-2019 | 370,000,000 | 370,000,000 | ||||||||||||
Royal Bank of Scotland, dated7-31-2019, maturity value $600,042,333 (24) | 2.54 | 8-1-2019 | 600,000,000 | 600,000,000 | ||||||||||||
Societe Generale NY, dated7-31-2019, maturity value $450,031,875 (25) | 2.55 | 8-1-2019 | 450,000,000 | 450,000,000 | ||||||||||||
Societe Generale NY, dated7-8-2019, maturity value $100,296,250 (26) | 2.37 | 8-22-2019 | 100,000,000 | 100,000,000 | ||||||||||||
Standard Chartered Bank, dated7-31-2019, maturity value $375,026,354 (27) | 2.53 | 8-1-2019 | 375,000,000 | 375,000,000 | ||||||||||||
Total Repurchase Agreements (Cost $9,323,126,398) | 9,323,126,398 | |||||||||||||||
|
| |||||||||||||||
| Treasury Debt: 38.01% | ||||||||||||||||
U.S. Treasury Bill (z) | 2.02 | 1-23-2020 | 65,000,000 | 64,368,238 | ||||||||||||
U.S. Treasury Bill (z) | 2.04 | 12-26-2019 | 145,000,000 | 143,803,032 | ||||||||||||
U.S. Treasury Bill (z) | 2.04 | 1-16-2020 | 25,000,000 | 24,764,042 | ||||||||||||
U.S. Treasury Bill (z) | 2.05 | 1-30-2020 | 35,000,000 | 34,638,591 | ||||||||||||
U.S. Treasury Bill (z) | 2.08 | 1-2-2020 | 115,000,000 | 113,987,236 | ||||||||||||
U.S. Treasury Bill (z) | 2.10 | 2-27-2020 | 50,000,000 | 49,397,708 | ||||||||||||
U.S. Treasury Bill (z) | 2.10 | 1-9-2020 | 75,000,000 | 74,302,893 | ||||||||||||
U.S. Treasury Bill (z) | 2.15 | 12-19-2019 | 160,000,000 | 158,674,666 | ||||||||||||
The accompanying notes are an integral part of these financial statements.
Government Money Market Funds | 7
Table of Contents
Portfolio of investments—July 31, 2019 (unaudited)
Interest rate | Maturity date | Principal | Value | |||||||||||||
| Treasury Debt (continued) | ||||||||||||||||
U.S. Treasury Bill (z) | 2.18 | % | 12-12-2019 | $ | 70,000,000 | $ | 69,443,340 | |||||||||
U.S. Treasury Bill (z) | 2.47 | 8-8-2019 | 40,000,000 | 39,981,022 | ||||||||||||
U.S. Treasury Bill (z) | 2.47 | 8-15-2019 | 60,000,000 | 59,942,988 | ||||||||||||
U.S. Treasury Bill (z) | 2.48 | 8-22-2019 | 30,000,000 | 29,957,125 | ||||||||||||
U.S. Treasury Bill (z) | 2.49 | 8-1-2019 | 30,000,000 | 30,000,000 | ||||||||||||
U.S. Treasury Bill (z) | 2.50 | 8-29-2019 | 40,000,000 | 39,923,311 | ||||||||||||
U.S. Treasury Note | 0.75 | 8-15-2019 | 50,000,000 | 49,964,338 | ||||||||||||
U.S. Treasury Note | 1.00 | 10-15-2019 | 70,000,000 | 69,752,852 | ||||||||||||
U.S. Treasury Note | 1.13 | 3-31-2020 | 25,000,000 | 24,848,174 | ||||||||||||
U.S. Treasury Note | 1.25 | 2-29-2020 | 110,000,000 | 109,468,959 | ||||||||||||
U.S. Treasury Note | 1.38 | 9-30-2019 | 300,000,000 | 299,459,102 | ||||||||||||
U.S. Treasury Note | 1.38 | 1-31-2020 | 30,000,000 | 29,889,277 | ||||||||||||
U.S. Treasury Note | 1.38 | 2-29-2020 | 30,000,000 | 29,883,177 | ||||||||||||
U.S. Treasury Note | 1.38 | 4-30-2020 | 80,000,000 | 79,569,375 | ||||||||||||
U.S. Treasury Note | 1.50 | 10-31-2019 | 180,000,000 | 179,541,451 | ||||||||||||
U.S. Treasury Note | 1.50 | 4-15-2020 | 20,000,000 | 19,921,814 | ||||||||||||
U.S. Treasury Note | 1.50 | 5-15-2020 | 20,000,000 | 19,916,696 | ||||||||||||
U.S. Treasury Note | 1.63 | 12-31-2019 | 70,000,000 | 69,759,938 | ||||||||||||
U.S. Treasury Note | 1.75 | 9-30-2019 | 25,000,000 | 24,962,419 | ||||||||||||
U.S. Treasury Note (U.S. Treasury 3 Month Bill Money Market Yield +0.00%) ± | 2.05 | 1-31-2020 | 430,000,000 | 429,947,761 | ||||||||||||
U.S. Treasury Note (U.S. Treasury 3 Month Bill Money Market Yield +0.03%) ± | 2.08 | 4-30-2020 | 650,000,000 | 650,000,625 | ||||||||||||
U.S. Treasury Note (U.S. Treasury 3 Month Bill Money Market Yield +0.04%) ± | 2.09 | 7-31-2020 | 460,000,000 | 459,996,593 | ||||||||||||
U.S. Treasury Note (U.S. Treasury 3 Month Bill Money Market Yield +0.05%) ± | 2.10 | 10-31-2020 | 548,000,000 | 547,660,923 | ||||||||||||
U.S. Treasury Note (U.S. Treasury 3 Month Bill Money Market Yield +0.05%) ± | 2.10 | 10-31-2019 | 307,000,000 | 307,011,737 | ||||||||||||
U.S. Treasury Note (U.S. Treasury 3 Month Bill Money Market Yield +0.12%) ± | 2.17 | 1-31-2021 | 460,000,000 | 459,789,519 | ||||||||||||
U.S. Treasury Note (U.S. Treasury 3 Month Bill Money Market Yield +0.14%) ± | 2.19 | 4-30-2021 | 430,000,000 | 429,751,138 | ||||||||||||
U.S. Treasury Note | 2.25 | 2-29-2020 | 30,000,000 | 30,032,875 | ||||||||||||
U.S. Treasury Note | 2.25 | 3-31-2020 | 30,000,000 | 30,039,078 | ||||||||||||
U.S. Treasury Note (U.S. Treasury 3 Month Bill Money Market Yield +0.22%) ± | 2.27 | 7-31-2021 | 90,000,000 | 90,000,000 | ||||||||||||
U.S. Treasury Note | 2.38 | 4-30-2020 | 60,000,000 | 60,153,517 | ||||||||||||
U.S. Treasury Note | 2.50 | 5-31-2020 | 75,000,000 | 75,268,325 | ||||||||||||
U.S. Treasury Note | 3.38 | 11-15-2019 | 100,000,000 | 100,265,185 | ||||||||||||
U.S. Treasury Note | 3.63 | 8-15-2019 | 10,000,000 | 10,003,876 | ||||||||||||
U.S. Treasury Note | 3.63 | 2-15-2020 | 70,000,000 | 70,572,412 | ||||||||||||
Total Treasury Debt (Cost $5,690,615,328) | 5,690,615,328 | |||||||||||||||
|
| |||||||||||||||
| Total investments in securities (Cost $15,013,741,726) | 100.27 | % | 15,013,741,726 | |||||
Other assets and liabilities, net | (0.27 | ) | (40,393,061 | ) | ||||
|
|
|
| |||||
| Total net assets | 100.00 | % | $ | 14,973,348,665 | ||||
|
|
|
| |||||
| ^^ | Collateralized by: |
| (1) | U.S. government securities, 0.38%,7-15-2027, fair value including accrued interest is $204,000,008. |
| (2) | U.S. government securities, 0.00% to 4.25%,8-15-2019 to8-15-2048, fair value including accrued interest is $663,000,037. |
The accompanying notes are an integral part of these financial statements.
8 | Government Money Market Funds
Table of Contents
Portfolio of investments—July 31, 2019 (unaudited)
| (3) | U.S. government securities, 0.00% to 4.63%,9-12-2019 to2-15-2040, fair value including accrued interest is $163,200,038. |
| (4) | U.S. government securities, 0.00% to 3.88%,5-15-2020 to2-15-2047, fair value including accrued interest is $204,000,000. |
| (5) | U.S. government securities, 0.00% to 4.50%,8-20-2019 to2-15-2048, fair value including accrued interest is $76,500,058. |
| (6) | U.S. government securities, 0.13% to 3.00%,4-30-2020 to11-15-2024, fair value including accrued interest is $204,000,028. |
| (7) | U.S. government securities, 0.13% to 2.13%,8-15-2019 to1-15-2027, fair value including accrued interest is $255,000,016. |
| (8) | U.S. government securities, 0.50% to 1.63%,11-30-2020 to1-15-2028, fair value including accrued interest is $102,000,003. |
| (9) | U.S. government securities, 2.00%,12-31-2021, fair value including accrued interest is $204,000,026. |
| (10) | U.S. government securities, 2.88%,5-31-2025 to8-15-2028, fair value including accrued interest is $1,530,000,519. |
| (11) | U.S. government securities, 1.88%,3-31-2022 to6-30-2026, fair value including accrued interest is $255,000,798. |
| (12) | U.S. government securities, 2.88%,4-30-2025 to5-15-2028, fair value including accrued interest is $255,000,750. |
| (13) | U.S. government securities, 2.88%,11-15-2021, fair value including accrued interest is $510,003,340. |
| (14) | U.S. government securities, 2.00% to 2.63%,12-15-2021 to12-31-2021, fair value including accrued interest is $765,000,776. |
| (15) | U.S. government securities, 1.50% to 3.13%,5-15-2020 to2-15-2042, fair value including accrued interest is $102,041,612. |
| (16) | U.S. government securities, 3.88% to 4.50%,8-15-2039 to8-15-2040, fair value including accrued interest is $102,000,032. |
| (17) | U.S. government securities, 3.88%,8-15-2040, fair value including accrued interest is $581,400,039. |
| (18) | U.S. government securities, 1.50%,7-15-2020, fair value including accrued interest is $255,150,634. |
| (19) | U.S. government securities, 1.25% to 4.50%,1-31-2021 to2-15-2036, fair value including accrued interest is $255,000,003. |
| (20) | U.S. government securities, 1.25% to 3.00%,11-15-2020 to11-15-2045, fair value including accrued interest is $510,000,022. |
| (21) | U.S. government securities, 0.00% to 3.00%,11-15-2021 to2-15-2026, fair value including accrued interest is $123,128,505. |
| (22) | U.S. government securities, 0.00% to 6.50%,11-30-2019 to8-15-2048, fair value including accrued interest is $255,000,001. |
| (23) | U.S. government securities, 0.00% to 3.63%,11-30-2019 to8-15-2048, fair value including accrued interest is $377,400,022. |
| (24) | U.S. government securities, 0.00% to 6.63%,8-15-2019 to11-15-2048, fair value including accrued interest is $612,000,007. |
| (25) | U.S. government securities, 0.00% to 3.50%,8-15-2019 to2-15-2043, fair value including accrued interest is $459,000,022. |
| (26) | U.S. government securities, 0.00% to 2.88%,8-1-2019 to8-15-2028, fair value including accrued interest is $102,000,010. |
| (27) | U.S. government securities, 1.38% to 6.00%,11-30-2019 to2-15-2049, fair value including accrued interest is $382,500,022. |
| ¢ | The security represents a long-dated and extendible repurchase agreement which automatically renews on previously set terms. The maturity date represents the next put date. |
| øø | The interest rate is determined and reset by the issuer periodically depending upon the terms of the security. The rate shown is the rate in effect at period end. |
| § | The security is subject to a demand feature which reduces the effective maturity. |
| (z) | Zero coupon security. The rate represents the current yield to maturity. |
| ± | Variable rate investment. The rate shown is the rate in effect at period end. |
The accompanying notes are an integral part of these financial statements.
Government Money Market Funds | 9
Table of Contents
Statement of assets and liabilities—July 31, 2019 (unaudited)
Assets | ||||
Investments in repurchase agreements, at amortized cost | $ | 9,323,126,398 | ||
Investments in unaffiliated securities, at amortized cost | 5,690,615,328 | |||
Cash | 8,765,083 | |||
Receivable for Fund shares sold | 4,500,672 | |||
Receivable for interest | 1,834,823 | |||
Prepaid expenses and other assets | 925,535 | |||
|
| |||
Total assets | 15,029,767,839 | |||
|
| |||
Liabilities | ||||
Payable for investments purchased | 34,638,591 | |||
Dividends payable | 16,653,273 | |||
Management fee payable | 1,515,463 | |||
Payable for Fund shares redeemed | 1,453,217 | |||
Administration fees payable | 1,248,461 | |||
Trustees’ fees and expenses payable | 2,611 | |||
Distribution fee payable | 30 | |||
Accrued expenses and other liabilities | 907,528 | |||
|
| |||
Total liabilities | 56,419,174 | |||
|
| |||
Total net assets | $ | 14,973,348,665 | ||
|
| |||
Net assets consist of | ||||
Paid-in capital | $ | 14,973,543,138 | ||
Total distributable loss | (194,473 | ) | ||
|
| |||
Total net assets | $ | 14,973,348,665 | ||
|
| |||
Computation of net asset value per share | ||||
Net assets – Class A | $ | 1,273,169,152 | ||
Shares outstanding – Class A1 | 1,273,008,719 | |||
Net asset value per share – Class A | $1.00 | |||
Net assets – Administrator Class | $ | 89,403,241 | ||
Shares outstanding – Administrator Class1 | 89,392,072 | |||
Net asset value per share – Administrator Class | $1.00 | |||
Net assets – Institutional Class | $ | 11,188,372,880 | ||
Shares outstanding – Institutional Class1 | 11,186,934,518 | |||
Net asset value per share – Institutional Class | $1.00 | |||
Net assets – Select Class | $ | 1,014,973,106 | ||
Shares outstanding – Select Class1 | 1,014,844,407 | |||
Net asset value per share – Select Class | $1.00 | |||
Net assets – Service Class | $ | 1,407,330,200 | ||
Shares outstanding – Service Class1 | 1,407,144,751 | |||
Net asset value per share – Service Class | $1.00 | |||
Net assets – Sweep Class | $ | 100,086 | ||
Shares outstanding – Sweep Class1 | 100,073 | |||
Net asset value per share – Sweep Class | $1.00 | |||
| 1 | The Fund has an unlimited number of authorized shares. |
The accompanying notes are an integral part of these financial statements.
10 | Government Money Market Funds
Table of Contents
Statement of operations—six months ended July 31, 2019 (unaudited)
Investment income | ||||
Interest | $ | 179,897,375 | ||
|
| |||
Expenses | ||||
Management fee | 10,321,631 | |||
Administration fees | ||||
Class A | 1,351,068 | |||
Administrator Class | 56,207 | |||
Institutional Class | 4,679,346 | |||
Select Class | 57,890 | 1 | ||
Service Class | 843,897 | |||
Sweep Class | 14 | |||
Shareholder servicing fees | ||||
Class A | 1,535,305 | |||
Administrator Class | 56,207 | |||
Service Class | 1,754,866 | |||
Sweep Class | 125 | |||
Distribution fee | ||||
Sweep Class | 174 | |||
Custody and accounting fees | 106,593 | |||
Professional fees | 24,578 | |||
Registration fees | 45,152 | |||
Shareholder report expenses | 19,410 | |||
Trustees’ fees and expenses | 14,697 | |||
Other fees and expenses | 47,862 | |||
|
| |||
Total expenses | 20,915,022 | |||
Less: Fee waivers and/or expense reimbursements | (1,973,228 | ) | ||
|
| |||
Net expenses | 18,941,794 | |||
|
| |||
Net investment income | 160,955,581 | |||
Net realized gains on investments | 46,712 | |||
|
| |||
Net increase in net assets resulting from operations | $ | 161,002,293 | ||
|
| |||
| 1 | For the period from March 15, 2019 (commencement of class operations) to July 31, 2019 |
The accompanying notes are an integral part of these financial statements.
Government Money Market Funds | 11
Table of Contents
Statement of changes in net assets
Six months ended (unaudited) | Year ended January 31, 2019 | |||||||||||||||
Operations | ||||||||||||||||
Net investment income | $ | 160,955,581 | $ | 252,918,099 | ||||||||||||
Net realized gains on investments | 46,712 | 48,547 | ||||||||||||||
|
| |||||||||||||||
Net increase in net assets resulting from operations | 161,002,293 | 252,966,646 | ||||||||||||||
|
| |||||||||||||||
Distributions to shareholders from net investment income and net realized gains | ||||||||||||||||
Class A | (11,305,993 | ) | (19,056,287 | ) | ||||||||||||
Administrator Class | (1,183,792 | ) | (1,412,617 | ) | ||||||||||||
Institutional Class | (131,157,018 | ) | (211,798,222 | ) | ||||||||||||
Select Class | (3,285,106 | )1 | N/A | |||||||||||||
Service Class | (14,022,840 | ) | (20,731,069 | ) | ||||||||||||
Sweep Class | (831 | ) | (1,194 | ) | ||||||||||||
|
| |||||||||||||||
Total distributions to shareholders | (160,955,580 | ) | (252,999,389 | ) | ||||||||||||
|
| |||||||||||||||
Capital share transactions | Shares | Shares | ||||||||||||||
Proceeds from shares sold | ||||||||||||||||
Class A | 4,628,117,482 | 4,628,117,482 | 11,127,666,658 | 11,127,666,658 | ||||||||||||
Administrator Class | 300,642,025 | 300,642,025 | 897,131,428 | 897,131,428 | ||||||||||||
Institutional Class | 46,365,849,248 | 46,365,849,248 | 96,585,943,995 | 96,585,943,995 | ||||||||||||
Select Class | 1,264,750,029 | 1 | 1,264,750,029 | 1 | N/A | N/A | ||||||||||
Service Class | 4,593,336,136 | 4,593,336,136 | 5,871,089,621 | 5,871,089,621 | ||||||||||||
|
| |||||||||||||||
| 57,152,694,920 | 114,481,831,702 | |||||||||||||||
|
| |||||||||||||||
Reinvestment of distributions | ||||||||||||||||
Class A | 5,768,663 | 5,768,663 | 9,016,382 | 9,016,382 | ||||||||||||
Administrator Class | 1,182,185 | 1,182,185 | 1,299,659 | 1,299,659 | ||||||||||||
Institutional Class | 49,373,990 | 49,373,990 | 73,636,342 | 73,636,342 | ||||||||||||
Select Class | 3,163,893 | 1 | 3,163,893 | 1 | N/A | N/A | ||||||||||
Service Class | 3,264,376 | 3,264,376 | 5,760,060 | 5,760,060 | ||||||||||||
|
| |||||||||||||||
| 62,753,107 | 89,712,443 | |||||||||||||||
|
| |||||||||||||||
Payment for shares redeemed | ||||||||||||||||
Class A | (4,563,481,223 | ) | (4,563,481,223 | ) | (11,225,626,967 | ) | (11,225,626,967 | ) | ||||||||
Administrator Class | (313,756,738 | ) | (313,756,738 | ) | (939,295,687 | ) | (939,295,687 | ) | ||||||||
Institutional Class | (47,693,596,484 | ) | (47,693,596,484 | ) | (97,277,939,890 | ) | (97,277,939,890 | ) | ||||||||
Select Class | (253,069,515 | )1 | (253,069,515 | )1 | N/A | N/A | ||||||||||
Service Class | (4,620,714,822 | ) | (4,620,714,822 | ) | (5,904,735,073 | ) | (5,904,735,073 | ) | ||||||||
|
| |||||||||||||||
| (57,444,618,782 | ) | (115,347,597,617 | ) | |||||||||||||
|
| |||||||||||||||
Net decrease in net assets resulting from capital share transactions | (229,170,755 | ) | (776,053,472 | ) | ||||||||||||
|
| |||||||||||||||
Total decrease in net assets | (229,124,042 | ) | (776,086,215 | ) | ||||||||||||
|
| |||||||||||||||
Net assets | ||||||||||||||||
Beginning of period | 15,202,472,707 | 15,978,558,922 | ||||||||||||||
|
| |||||||||||||||
End of period | $ | 14,973,348,665 | $ | 15,202,472,707 | ||||||||||||
|
| |||||||||||||||
| 1 | For the period from March 15, 2019 (commencement of class operations) to July 31, 2019 |
The accompanying notes are an integral part of these financial statements.
12 | Government Money Market Funds
Table of Contents
(For a share outstanding throughout each period)
| Six months ended July 31, 2019 (unaudited) | Year ended January 31 | |||||||||||||||||||||||
| CLASS A | 2019 | 2018 | 2017 | 2016 | 2015 | |||||||||||||||||||
Net asset value, beginning of period | $1.00 | $1.00 | $1.00 | $1.00 | $1.00 | $1.00 | ||||||||||||||||||
Net investment income | 0.01 | 0.01 | 0.00 | 1 | 0.00 | 1 | 0.00 | 1 | 0.00 | 1 | ||||||||||||||
Net realized gains (losses) on investments | 0.00 | 1 | 0.00 | 1 | 0.00 | 1 | 0.00 | 1 | 0.00 | 1 | (0.00 | )2 | ||||||||||||
|
|
|
|
|
|
|
|
|
|
|
| |||||||||||||
Total from investment operations | 0.01 | 0.01 | 0.00 | 1 | 0.00 | 1 | 0.00 | 1 | 0.00 | 1 | ||||||||||||||
Distributions to shareholders from | ||||||||||||||||||||||||
Net investment income | (0.01 | ) | (0.01 | ) | (0.00 | )1 | (0.00 | )1 | (0.00 | )1 | (0.00 | )1 | ||||||||||||
Net realized gains | 0.00 | (0.00 | )1 | (0.00 | )1 | 0.00 | 0.00 | (0.00 | )1 | |||||||||||||||
|
|
|
|
|
|
|
|
|
|
|
| |||||||||||||
Total distributions to shareholders | (0.01 | ) | (0.01 | ) | (0.00 | )1 | (0.00 | )1 | (0.00 | )1 | (0.00 | )1 | ||||||||||||
Net asset value, end of period | $1.00 | $1.00 | $1.00 | $1.00 | $1.00 | $1.00 | ||||||||||||||||||
Total return3 | 0.92 | % | 1.37 | % | 0.38 | % | 0.01 | % | 0.01 | % | 0.01 | % | ||||||||||||
Ratios to average net assets (annualized) | ||||||||||||||||||||||||
Gross expenses | 0.61 | % | 0.61 | % | 0.62 | % | 0.62 | % | 0.62 | % | 0.62 | % | ||||||||||||
Net expenses | 0.60 | % | 0.60 | % | 0.61 | % | 0.39 | % | 0.11 | % | 0.06 | % | ||||||||||||
Net investment income | 1.84 | % | 1.36 | % | 0.38 | % | 0.01 | % | 0.01 | % | 0.01 | % | ||||||||||||
Supplemental data | ||||||||||||||||||||||||
Net assets, end of period (000s omitted) | $1,273,169 | $1,202,749 | $1,291,723 | $1,745,419 | $1,956,626 | $1,733,107 | ||||||||||||||||||
| 1 | Amount is less than $0.005. |
| 2 | Amount is more than $(0.005). |
| 3 | Returns for periods of less than one year are not annualized. |
The accompanying notes are an integral part of these financial statements.
Government Money Market Funds | 13
Table of Contents
Financial highlights
(For a share outstanding throughout each period)
| Six months ended July 31, 2019 (unaudited) | Year ended January 31 | |||||||||||||||||||||||
| ADMINISTRATOR CLASS | 2019 | 2018 | 2017 | 2016 | 2015 | |||||||||||||||||||
Net asset value, beginning of period | $1.00 | $1.00 | $1.00 | $1.00 | $1.00 | $1.00 | ||||||||||||||||||
Net investment income | 0.01 | 0.02 | 0.01 | 0.00 | 1 | 0.00 | 1 | 0.00 | 1 | |||||||||||||||
Net realized gains (losses) on investments | 0.00 | 1 | 0.00 | 1 | 0.00 | 1 | 0.00 | 1 | 0.00 | 1 | (0.00 | )2 | ||||||||||||
|
|
|
|
|
|
|
|
|
|
|
| |||||||||||||
Total from investment operations | 0.01 | 0.02 | 0.01 | 0.00 | 1 | 0.00 | 1 | 0.00 | 1 | |||||||||||||||
Distributions to shareholders from | ||||||||||||||||||||||||
Net investment income | (0.01 | ) | (0.02 | ) | (0.01 | ) | (0.00 | )1 | (0.00 | )1 | (0.00 | )1 | ||||||||||||
Net realized gains | 0.00 | (0.00 | )1 | (0.00 | )1 | 0.00 | 0.00 | (0.00 | )1 | |||||||||||||||
|
|
|
|
|
|
|
|
|
|
|
| |||||||||||||
Total distributions to shareholders | (0.01 | ) | (0.02 | ) | (0.01 | ) | (0.00 | )1 | (0.00 | )1 | (0.00 | )1 | ||||||||||||
Net asset value, end of period | $1.00 | $1.00 | $1.00 | $1.00 | $1.00 | $1.00 | ||||||||||||||||||
Total return3 | 1.05 | % | 1.63 | % | 0.65 | % | 0.06 | % | 0.01 | % | 0.01 | % | ||||||||||||
Ratios to average net assets (annualized) | ||||||||||||||||||||||||
Gross expenses | 0.34 | % | 0.35 | % | 0.35 | % | 0.34 | % | 0.34 | % | 0.34 | % | ||||||||||||
Net expenses | 0.34 | % | 0.35 | % | 0.35 | % | 0.34 | % | 0.10 | % | 0.06 | % | ||||||||||||
Net investment income | 2.11 | % | 1.48 | % | 0.61 | % | 0.05 | % | 0.01 | % | 0.01 | % | ||||||||||||
Supplemental data | ||||||||||||||||||||||||
Net assets, end of period (000s omitted) | $89,403 | $101,340 | $142,198 | $106,246 | $101,432 | $106,179 | ||||||||||||||||||
| 1 | Amount is less than $0.005. |
| 2 | Amount is more than $(0.005). |
| 3 | Returns for periods of less than one year are not annualized. |
The accompanying notes are an integral part of these financial statements.
14 | Government Money Market Funds
Table of Contents
Financial highlights
(For a share outstanding throughout each period)
| Six months ended July 31, 2019 (unaudited) | Year ended January 31 | |||||||||||||||||||||||
| INSTITUTIONAL CLASS | 2019 | 2018 | 2017 | 2016 | 2015 | |||||||||||||||||||
Net asset value, beginning of period | $1.00 | $1.00 | $1.00 | $1.00 | $1.00 | $1.00 | ||||||||||||||||||
Net investment income | 0.01 | 0.02 | 0.01 | 0.00 | 1 | 0.00 | 1 | 0.00 | 1 | |||||||||||||||
Net realized gains (losses) on investments | 0.00 | 1 | 0.00 | 1 | 0.00 | 1 | 0.00 | 1 | 0.00 | 1 | (0.00 | )2 | ||||||||||||
|
|
|
|
|
|
|
|
|
|
|
| |||||||||||||
Total from investment operations | 0.01 | 0.02 | 0.01 | 0.00 | 1 | 0.00 | 1 | 0.00 | 1 | |||||||||||||||
Distributions to shareholders from | ||||||||||||||||||||||||
Net investment income | (0.01 | ) | (0.02 | ) | (0.01 | ) | (0.00 | )1 | (0.00 | )1 | (0.00 | )1 | ||||||||||||
Net realized gains | 0.00 | (0.00 | )1 | (0.00 | )1 | 0.00 | 0.00 | (0.00 | )1 | |||||||||||||||
|
|
|
|
|
|
|
|
|
|
|
| |||||||||||||
Total distributions to shareholders | (0.01 | ) | (0.02 | ) | (0.01 | ) | (0.00 | )1 | (0.00 | )1 | (0.00 | )1 | ||||||||||||
Net asset value, end of period | $1.00 | $1.00 | $1.00 | $1.00 | $1.00 | $1.00 | ||||||||||||||||||
Total return3 | 1.12 | % | 1.78 | % | 0.79 | % | 0.20 | % | 0.02 | % | 0.01 | % | ||||||||||||
Ratios to average net assets (annualized) | ||||||||||||||||||||||||
Gross expenses | 0.22 | % | 0.22 | % | 0.23 | % | 0.23 | % | 0.23 | % | 0.23 | % | ||||||||||||
Net expenses | 0.20 | % | 0.20 | % | 0.20 | % | 0.20 | % | 0.10 | % | 0.06 | % | ||||||||||||
Net investment income | 2.24 | % | 1.77 | % | 0.81 | % | 0.20 | % | 0.02 | % | 0.01 | % | ||||||||||||
Supplemental data | ||||||||||||||||||||||||
Net assets, end of period (000s omitted) | $11,188,373 | $12,466,864 | $13,085,244 | $11,489,674 | $12,617,153 | $11,190,887 | ||||||||||||||||||
| 1 | Amount is less than $0.005. |
| 2 | Amount is more than $(0.005). |
| 3 | Returns for periods of less than one year are not annualized. |
The accompanying notes are an integral part of these financial statements.
Government Money Market Funds | 15
Table of Contents
Financial highlights
(For a share outstanding throughout the period)
| SELECT CLASS | Period ended (unaudited) | |||
Net asset value, beginning of period | $1.00 | |||
Net investment income | 0.01 | |||
Net realized gains on investments | 0.00 | 2 | ||
|
| |||
Total from investment operations | 0.01 | |||
Distributions to shareholders from | ||||
Net investment income | (0.01 | ) | ||
Net asset value, end of period | $1.00 | |||
Total return3 | 0.86 | % | ||
Ratios to average net assets (annualized) | ||||
Gross expenses | 0.18 | % | ||
Net expenses | 0.14 | % | ||
Net investment income | 2.27 | % | ||
Supplemental data | ||||
Net assets, end of period (000s omitted) | $1,014,973 | |||
| 1 | For the period from March 15, 2019 (commencement of class operations) to July 31, 2019 |
| 2 | Amount is less than $0.005. |
| 3 | Returns for periods of less than one year are not annualized. |
The accompanying notes are an integral part of these financial statements.
16 | Government Money Market Funds
Table of Contents
Financial highlights
(For a share outstanding throughout each period)
| Six months ended July 31, 2019 (unaudited) | Year ended January 31 | |||||||||||||||||||||||
| SERVICE CLASS | 2019 | 2018 | 2017 | 2016 | 2015 | |||||||||||||||||||
Net asset value, beginning of period | $1.00 | $1.00 | $1.00 | $1.00 | $1.00 | $1.00 | ||||||||||||||||||
Net investment income | 0.01 | 0.02 | 0.01 | 0.00 | 1 | 0.00 | 1 | 0.00 | 1 | |||||||||||||||
Net realized gains (losses) on investments | 0.00 | 1 | 0.00 | 1 | 0.00 | 1 | 0.00 | 1 | 0.00 | 1 | (0.00 | )2 | ||||||||||||
|
|
|
|
|
|
|
|
|
|
|
| |||||||||||||
Total from investment operations | 0.01 | 0.02 | 0.01 | 0.00 | 1 | 0.00 | 1 | 0.00 | 1 | |||||||||||||||
Distributions to shareholders from | ||||||||||||||||||||||||
Net investment income | (0.01 | ) | (0.02 | ) | (0.01 | ) | (0.00 | )1 | (0.00 | )1 | (0.00 | )1 | ||||||||||||
Net realized gains | 0.00 | (0.00 | )1 | (0.00 | )1 | 0.00 | 0.00 | (0.00 | )1 | |||||||||||||||
|
|
|
|
|
|
|
|
|
|
|
| |||||||||||||
Total distributions to shareholders | (0.01 | ) | (0.02 | ) | (0.01 | ) | (0.00 | )1 | (0.00 | )1 | (0.00 | )1 | ||||||||||||
Net asset value, end of period | $1.00 | $1.00 | $1.00 | $1.00 | $1.00 | $1.00 | ||||||||||||||||||
Total return3 | 0.99 | % | 1.53 | % | 0.54 | % | 0.02 | % | 0.01 | % | 0.01 | % | ||||||||||||
Ratios to average net assets (annualized) | ||||||||||||||||||||||||
Gross expenses | 0.51 | % | 0.51 | % | 0.52 | % | 0.52 | % | 0.52 | % | 0.52 | % | ||||||||||||
Net expenses | 0.45 | % | 0.45 | % | 0.45 | % | 0.38 | % | 0.11 | % | 0.06 | % | ||||||||||||
Net investment income | 1.99 | % | 1.51 | % | 0.54 | % | 0.03 | % | 0.01 | % | 0.01 | % | ||||||||||||
Supplemental data | ||||||||||||||||||||||||
Net assets, end of period (000s omitted) | $1,407,330 | $1,431,420 | $1,459,295 | $1,500,467 | $1,339,895 | $1,845,375 | ||||||||||||||||||
| 1 | Amount is less than $0.005. |
| 2 | Amount is more than $(0.005). |
| 3 | Returns for periods of less than one year are not annualized. |
The accompanying notes are an integral part of these financial statements.
Government Money Market Funds | 17
Table of Contents
Financial highlights
(For a share outstanding throughout each period)
| Six months ended July 31, 2019 (unaudited) | Year ended January 31 | |||||||||||||||||||||||
| SWEEP CLASS | 2019 | 2018 | 2017 | 2016 | 2015 | |||||||||||||||||||
Net asset value, beginning of period | $1.00 | $1.00 | $1.00 | $1.00 | $1.00 | $1.00 | ||||||||||||||||||
Net investment income | 0.01 | 0.01 | 0.00 | 1 | 0.00 | 1,2 | 0.00 | 1 | 0.00 | 1 | ||||||||||||||
Net realized gains (losses) on investments | 0.00 | 1 | 0.00 | 1 | 0.00 | 1 | 0.00 | 1 | 0.00 | 1 | (0.00 | )3 | ||||||||||||
|
|
|
|
|
|
|
|
|
|
|
| |||||||||||||
Total from investment operations | 0.01 | 0.01 | 0.00 | 1 | 0.00 | 1 | 0.00 | 1 | 0.00 | 1 | ||||||||||||||
Distributions to shareholders from | ||||||||||||||||||||||||
Net investment income | (0.01 | ) | (0.01 | ) | (0.00 | )1 | (0.00 | )1 | (0.00 | )1 | (0.00 | )1 | ||||||||||||
Net realized gains | 0.00 | (0.00 | )1 | (0.00 | )1 | 0.00 | 0.00 | (0.00 | )1 | |||||||||||||||
|
|
|
|
|
|
|
|
|
|
|
| |||||||||||||
Total distributions to shareholders | (0.01 | ) | (0.01 | ) | (0.00 | )1 | (0.00 | )1 | (0.00 | )1 | (0.00 | )1 | ||||||||||||
Net asset value, end of period | $1.00 | $1.00 | $1.00 | $1.00 | $1.00 | $1.00 | ||||||||||||||||||
Total return4 | 0.83 | % | 1.20 | % | 0.24 | % | 0.01 | % | 0.01 | % | 0.01 | % | ||||||||||||
Ratios to average net assets (annualized) | ||||||||||||||||||||||||
Gross expenses | 0.77 | % | 0.77 | % | 0.77 | % | 0.96 | % | 0.97 | % | 0.97 | % | ||||||||||||
Net expenses | 0.77 | % | 0.77 | % | 0.75 | % | 0.34 | % | 0.11 | % | 0.06 | % | ||||||||||||
Net investment income | 1.67 | % | 1.19 | % | 0.24 | % | 0.01 | % | 0.01 | % | 0.01 | % | ||||||||||||
Supplemental data | ||||||||||||||||||||||||
Net assets, end of period (000s omitted) | $100 | $100 | $100 | $100 | $3,145 | $3,054 | ||||||||||||||||||
| 1 | Amount is less than $0.005. |
| 2 | Calculated based upon average shares outstanding |
| 3 | Amount is more than $(0.005). |
| 4 | Returns for periods of less than one year are not annualized. |
The accompanying notes are an integral part of these financial statements.
18 | Government Money Market Funds
Table of Contents
Notes to financial statements (unaudited)
1. ORGANIZATION
Wells Fargo Funds Trust (the “Trust”), a Delaware statutory trust organized on March 10, 1999, is an open-end management investment company registered under the Investment Company Act of 1940, as amended (the “1940 Act”). As an investment company, the Trust follows the accounting and reporting guidance in Financial Accounting Standards Board (“FASB”) Accounting Standards Codification Topic 946, Financial Services – Investment Companies. These financial statements report on the Wells Fargo Treasury Plus Money Market Fund (the “Fund”) which is a diversified series of the Trust.
2. SIGNIFICANT ACCOUNTING POLICIES
The following significant accounting policies, which are consistently followed in the preparation of the financial statements of the Fund, are in conformity with U.S. generally accepted accounting principles which require management to make estimates and assumptions that affect the reported amounts of assets and liabilities, disclosure of contingent assets and liabilities at the date of the financial statements, and the reported amounts of revenues and expenses during the reporting period. Actual results could differ from those estimates.
Securities valuation
As permitted under Rule 2a-7 of the 1940 Act, portfolio securities are valued at amortized cost, which approximates fair value. The amortized cost method involves valuing a security at its cost, plus accretion of discount or minus amortization of premium over the period until maturity.
Investments which are not valued using the method discussed above are valued at their fair value, as determined in good faith by the Board of Trustees of the Fund. The Board of Trustees has established a Valuation Committee comprised of the Trustees and has delegated to it the authority to take any actions regarding the valuation of portfolio securities that the Valuation Committee deems necessary or appropriate, including determining the fair value of portfolio securities, unless the determination has been delegated to the Wells Fargo Asset Management Pricing Committee at Wells Fargo Funds Management, LLC (“Funds Management”). The Board of Trustees retains the authority to make or ratify any valuation decisions or approve any changes to the Valuation Procedures as it deems appropriate. On a quarterly basis, the Board of Trustees receives reports on any valuation actions taken by the Valuation Committee or the Wells Fargo Asset Management Pricing Committee which may include items for ratification.
Repurchase agreements
The Fund may invest in repurchase agreements and may participate in pooled repurchase agreement transactions with other funds advised by Funds Management. Repurchase agreements are agreements where the seller of a security to the Fund agrees to repurchase that security from the Fund at a mutually agreed upon time and price. The repurchase agreements must be fully collateralized based on values that are marked-to-market daily. The collateral may be held by an agent bank under a tri-party agreement. It is the custodian’s responsibility to value collateral daily and to take action to obtain additional collateral as necessary to maintain a market value equal to or greater than the resale price. The repurchase agreements are collateralized by securities issued or guaranteed by the U.S. Government, its agencies or instrumentalities. There could be potential loss to the Fund in the event that the Fund is delayed or prevented from exercising its rights to dispose of the collateral, including the risk of a possible decline in the value of the underlying obligations during the period in which the Fund seeks to assert its rights.
When-issued transactions
The Fund may purchase securities on a forward commitment or when-issued basis. The Fund records a when-issued transaction on the trade date and will segregate assets in an amount at least equal in value to the Fund’s commitment to purchase when-issued securities. Securities purchased on a when-issued basis are marked-to-market daily and the Fund begins earning interest on the settlement date. Losses may arise due to changes in the market value of the underlying securities or if the counterparty does not perform under the contract.
Security transactions and income recognition
Securities transactions are recorded on a trade date basis. Realized gains or losses are recorded on the basis of identified cost.
Interest income is accrued daily and bond discounts are accreted and premiums are amortized daily. To the extent debt obligations are placed on non-accrual status, any related interest income may be reduced by writing off interest receivables when the collection of all or a portion of interest has been determined to be doubtful based on consistently applied procedures and the fair value has decreased. If the issuer subsequently resumes interest payments or when the collectability of interest is reasonably assured, the debt obligation is removed from non-accrual status.
Distributions to shareholders
Distributions to shareholders from net investment income are declared daily and paid monthly. Distributions from net realized gains, if any, are recorded on the ex-dividend date and paid at least annually. Such distributions are determined in accordance
Government Money Market Funds | 19
Table of Contents
Notes to financial statements (unaudited)
with income tax regulations and may differ from U.S. generally accepted accounting principles. Dividend sources are estimated at the time of declaration. The tax character of distributions is determined as of the Fund’s fiscal year end. Therefore, a portion of the Fund’s distributions made prior to the Fund’s fiscal year end may be categorized as a tax return of capital at year end.
Federal and other taxes
The Fund intends to continue to qualify as a regulated investment company by distributing substantially all of its investment company taxable income and any net realized capital gains (after reduction for capital loss carryforwards) sufficient to relieve it from all, or substantially all, federal income taxes. Accordingly, no provision for federal income taxes was required.
The Fund’s income and federal excise tax returns and all financial records supporting those returns for the prior three fiscal years are subject to examination by the federal and Delaware revenue authorities. Management has analyzed the Fund’s tax positions taken on federal, state, and foreign tax returns for all open tax years and does not believe that there are any uncertain tax positions that require recognition of a tax liability.
As of July 31, 2019, the cost of investments for federal income tax purposes is substantially the same as for financial reporting purposes.
Class allocations
The separate classes of shares offered by the Fund differ principally in distribution, shareholder servicing, and administration fees. Class specific expenses are charged directly to that share class. Investment income, common fund-level expenses, and realized gains (losses) on investments are allocated daily to each class of shares based on the relative proportion of net assets of each class.
3. FAIR VALUATION MEASUREMENTS
Fair value measurements of investments are determined within a framework that has established a fair value hierarchy based upon the various data inputs utilized in determining the value of the Fund’s investments. The three-level hierarchy gives the highest priority to unadjusted quoted prices in active markets for identical assets or liabilities (Level 1) and the lowest priority to unobservable inputs (Level 3). The Fund’s investments are classified within the fair value hierarchy based on the lowest level of input that is significant to the fair value measurement. The inputs are summarized into three broad levels as follows:
| ∎ | Level 1 – quoted prices in active markets for identical securities |
| ∎ | Level 2 – other significant observable inputs (including quoted prices for similar securities, interest rates, prepayment speeds, credit risk, etc.) |
| ∎ | Level 3 – significant unobservable inputs (including the Fund’s own assumptions in determining the fair value of investments) |
The inputs or methodologies used for valuing investments in securities are not necessarily an indication of the risk associated with investing in those securities.
The following is a summary of the inputs used in valuing the Fund’s assets and liabilities as of July 31, 2019:
| Quoted prices (Level 1) | Other significant observable inputs (Level 2) | Significant (Level 3) | Total | |||||||||||||
Assets | ||||||||||||||||
Investments in: | ||||||||||||||||
Repurchase agreements | $ | 0 | $ | 9,323,126,398 | $ | 0 | $ | 9,323,126,398 | ||||||||
Treasury debt | 0 | 5,690,615,328 | 0 | 5,690,615,328 | ||||||||||||
Total assets | $ | 0 | $ | 15,013,741,726 | $ | 0 | $ | 15,013,741,726 | ||||||||
Additional sector, industry or geographic detail is included in the Portfolio of Investments.
For the six months ended July 31, 2019, the Fund did not have any transfers into/out of Level 3.
4. TRANSACTIONS WITH AFFILIATES
Management fee
Funds Management, an indirect wholly owned subsidiary of Wells Fargo & Company (“Wells Fargo”), is the manager of the Fund and provides advisory and fund-level administrative services under an investment management agreement. Under the investment management agreement, Funds Management is responsible for, among other services, implementing the investment objectives and
20 | Government Money Market Funds
Table of Contents
Notes to financial statements (unaudited)
strategies of the Fund, supervising the subadviser and providing fund-level administrative services in connection with the Fund’s operations. As compensation for its services under the investment management agreement, Funds Management is entitled to receive a management fee at the following annual rate based on the Fund’s average daily net assets:
| Average daily net assets | Management fee | |
First $5 billion | 0.15% | |
Next $5 billion | 0.14 | |
Over $10 billion | 0.13 | |
For the six months ended July 31, 2019, the management fee was equivalent to an annual rate of 0.14% of the Fund’s average daily net assets.
Funds Management has retained the services of a subadviser to provide daily portfolio management to the Fund. The fee for subadvisory services is borne by Funds Management. Wells Capital Management Incorporated, an affiliate of Funds Management and an indirect wholly owned subsidiary of Wells Fargo, is the subadviser to the Fund and is entitled to receive a fee from Funds Management at an annual rate starting at 0.05% and declining to 0.01% as the average daily net assets of the Fund increase.
Administration fees
Under a class-level administration agreement, Funds Management provides class-level administrative services to the Fund, which includes paying fees and expenses for services provided by the transfer agent, sub-transfer agents, omnibus account servicers and record-keepers. As compensation for its services under the class-level administration agreement, Funds Management receives an annual fee which is calculated based on the average daily net assets of each class as follows:
| Class-level administration fee | ||||
Class A | 0.22 | % | ||
Administrator Class | 0.10 | |||
Institutional Class | 0.08 | |||
Select Class | 0.04 | |||
Service Class | 0.12 | |||
Sweep Class | 0.03 | |||
Waivers and/or expense reimbursements
Funds Management has contractually waived and/or reimbursed management and administration fees to the extent necessary to maintain certain net operating expense ratios for the Fund. When each class of the Fund has exceeded its expense cap, Funds Management has waived fees and/or reimbursed expenses from fund-level expenses on a proportionate basis and then from class specific expenses. When only certain classes exceed their expense caps, waivers and/or reimbursements are applied against class specific expenses before fund-level expenses. Funds Management has committed through May 31, 2020 to waive fees and/or reimburse expenses to the extent necessary to cap the Fund’s expenses at 0.60% for Class A shares, 0.34% for Administrator Class shares, 0.20% for Institutional Class shares, 0.14% for Select Class shares, 0.45% for Service Class shares, and 0.77% for Sweep Class shares. Prior to or after the commitment expiration date, the cap may be increased or the commitment to maintain the cap may be terminated only with the approval of the Board of Trustees.
Distribution fee
The Trust has adopted a distribution plan for Sweep Class shares of the Fund pursuant to Rule 12b-1 under the 1940 Act. A distribution fee is charged to Sweep Class shares and paid to Wells Fargo Funds Distributor, LLC, the principal underwriter, at an annual rate of 0.35% of the average daily net assets of Sweep Class shares.
Shareholder servicing fees
The Trust has entered into contracts with one or more shareholder servicing agents, whereby Class A, Service Class, and Sweep Class of the Fund are charged a fee at an annual rate of 0.25% of the respective average daily net assets of each class. Administrator Class is charged a fee at an annual rate of 0.10% of its average daily net assets. A portion of these total shareholder servicing fees were paid to affiliates of Wells Fargo.
Government Money Market Funds | 21
Table of Contents
Notes to financial statements (unaudited)
Interfund transactions
The Fund may purchase or sell portfolio investment securities to certain other Wells Fargo affiliates pursuant to Rule 17a-7 under the 1940 Act and under procedures adopted by the Board of Trustees. The procedures have been designed to ensure that these interfund transactions, which do not incur broker commissions, are effected at current market prices.
5. INDEMNIFICATION
Under the Trust’s organizational documents, the officers and Trustees have been granted certain indemnification rights against certain liabilities that may arise out of performance of their duties to the Trust. Additionally, in the normal course of business, the Trust may enter into contracts with service providers that contain a variety of indemnification clauses. The Trust’s maximum exposure under these arrangements is dependent on future claims that may be made against the Fund and, therefore, cannot be estimated.
6. NEW ACCOUNTING PRONOUNCEMENTS
In August 2018, FASB issued Accounting Standards Update (“ASU”) No. 2018-13, Fair Value Measurement (Topic 820)Disclosure Framework—Changes to the Disclosure Requirements for Fair Value Measurement. ASU 2018-13 updates the disclosure requirements for fair value measurements by modifying or removing certain disclosures and adding certain new disclosures. The amendments are effective for fiscal years, and interim periods within those fiscal years, beginning after December 15, 2019. Early adoption is permitted. Management has adopted the removal and modification of disclosures early, as permitted, and will adopt the additional new disclosures at the effective date.
In March 2017, FASB issued ASU No. 2017-08,Premium Amortization on Purchased Callable Debt Securities. ASU 2017-08 shortens the amortization period for certain callable debt securities held at a premium and requires the premium to be amortized to the earliest call date. The amendments do not require an accounting change for securities held at a discount and discounts will continue to be accreted to the maturity date of the security. ASU 2017-08 is effective for fiscal years beginning after December 15, 2018 and for interim periods within those fiscal years. During the current reporting period, management of the Fund adopted the change in accounting policy which did not have a material impact to the Fund’s financial statements.
22 | Government Money Market Funds
Table of Contents
PROXY VOTING INFORMATION
A description of the policies and procedures used to determine how to vote proxies relating to portfolio securities is available, upon request, by calling1-800-222-8222, visiting our website atwfam.com, or visiting the SEC website at sec.gov. Information regarding how the proxies related to portfolio securities were voted during the most recent 12-month period ended June 30 is available on the website atwfam.comor by visiting the SEC website at sec.gov.
Government Money Market Funds | 23
Table of Contents
Other information (unaudited)
BOARD OF TRUSTEES AND OFFICERS
Each of the Trustees and Officers1 listed in the table below acts in identical capacities for each fund in the Wells Fargo family of funds, which consists of 152 mutual funds comprising the Wells Fargo Funds Trust, Wells Fargo Variable Trust, Wells Fargo Master Trust and four closed-end funds (collectively the “Fund Complex”). This table should be read in conjunction with the Prospectus and the Statement of Additional Information2. The mailing address of each Trustee and Officer is 525 Market Street, 12th Floor, San Francisco, CA 94105. Each Trustee and Officer serves an indefinite term, however, each Trustee serves such term until reaching the mandatory retirement age established by the Trustees.
Independent Trustees
| Name and year of birth | Position held and length of service* | Principal occupations during past five years or longer | Current other public company or investment company directorships | |||
| William R. Ebsworth (Born 1957) | Trustee, since 2015 | Retired. From 1984 to 2013, equities analyst, portfolio manager, research director and chief investment officer at Fidelity Management and Research Company in Boston, Tokyo, and Hong Kong, and retired in 2013 as Chief Investment Officer of Fidelity Strategic Advisers, Inc. where he led a team of investment professionals managing client assets. Prior thereto, Board member of Hong Kong Securities Clearing Co., Hong Kong Options Clearing Corp., the Thailand International Fund, Ltd., Fidelity Investments Life Insurance Company, and Empire Fidelity Investments Life Insurance Company. Audit Committee Chair and Investment Committee Chair of the Vincent Memorial Hospital Endowment (non-profit organization). Mr. Ebsworth is a CFA® charterholder. | N/A | |||
| Jane A. Freeman (Born 1953) | Trustee, since 2015; Chair Liaison, since 2018 | Retired. From 2012 to 2014 and 1999 to 2008, Chief Financial Officer of Scientific Learning Corporation. From 2008 to 2012, Ms. Freeman provided consulting services related to strategic business projects. Prior to 1999, Portfolio Manager at Rockefeller & Co. and Scudder, Stevens & Clark. Board member of the Harding Loevner Funds from 1996 to 2014, serving as both Lead Independent Director and chair of the Audit Committee. Board member of the Russell Exchange Traded Funds Trust from 2011 to 2012 and the chair of the Audit Committee. Ms. Freeman is a Board Member of The Ruth Bancroft Garden (non-profit organization). She is also an inactive Chartered Financial Analyst. | N/A | |||
| Isaiah Harris, Jr. (Born 1952) | Trustee, since 2009; Audit Committee Chairman, since 2019 | Retired. Chairman of the Board of CIGNA Corporation since 2009, and Director since 2005. From 2003 to 2011, Director of Deluxe Corporation. Prior thereto, President and CEO of BellSouth Advertising and Publishing Corp. from 2005 to 2007, President and CEO of BellSouth Enterprises from 2004 to 2005 and President of BellSouth Consumer Services from 2000 to 2003. Emeritus member of the Iowa State University Foundation Board of Governors. Emeritus Member of the Advisory Board of Iowa State University School of Business. Advisory Board Member, Palm Harbor Academy (private school). Advisory Board Member, Child Evangelism Fellowship (non-profit). Mr. Harris is a certified public accountant (inactive status). | CIGNA Corporation | |||
| Judith M. Johnson (Born 1949) | Trustee, since 2008; Audit Committee Chairman, from 2009 to 2018 | Retired. Prior thereto, Chief Executive Officer and Chief Investment Officer of Minneapolis Employees Retirement Fund from 1996 to 2008. Ms. Johnson is an attorney, certified public accountant and a certified managerial accountant. | N/A | |||
24 | Government Money Market Funds
Table of Contents
Other information (unaudited)
| Name and year of birth | Position held and length of service* | Principal occupations during past five years or longer | Current other public company or investment company directorships | |||
| David F. Larcker (Born 1950) | Trustee, since 2009 | James Irvin Miller Professor of Accounting at the Graduate School of Business, Stanford University, Director of the Corporate Governance Research Initiative and Senior Faculty of The Rock Center for Corporate Governance since 2006. From 2005 to 2008, Professor of Accounting at the Graduate School of Business, Stanford University. Prior thereto, Ernst & Young Professor of Accounting at The Wharton School, University of Pennsylvania from 1985 to 2005. | N/A | |||
| Olivia S. Mitchell (Born 1953) | Trustee, since 2006; Nominating and Governance Committee Chairman, since 2018 | International Foundation of Employee Benefit Plans Professor, Wharton School of the University of Pennsylvania since 1993. Director of Wharton’s Pension Research Council and Boettner Center on Pensions & Retirement Research, and Research Associate at the National Bureau of Economic Research. Previously, Cornell University Professor from 1978 to 1993. | N/A | |||
| Timothy J. Penny (Born 1951) | Trustee, since 1996; Chairman, since 2018 | President and Chief Executive Officer of Southern Minnesota Initiative Foundation, a non-profit organization, since 2007. Member of the Board of Trustees of NorthStar Education Finance, Inc., a non-profit organization, since 2007. | N/A | |||
| James G. Polisson (Born 1959) | Trustee, since 2018 | Retired. Chief Marketing Officer, Source (ETF) UK Services, Ltd, from 2015 to 2017. From 2012 to 2015, Principal of The Polisson Group, LLC, a management consulting, corporate advisory and principal investing company. Chief Executive Officer and Managing Director at Russell Investments, Global Exchange Traded Funds from 2010 to 2012. Managing Director of Barclays Global Investors from 1998 to 2010 and Global Chief Marketing Officer for iShares and Barclays Global Investors from 2000 to 2010. Trustee of the San Francisco Mechanics’ Institute, a non-profit organization, from 2013 to 2015. Board member of the Russell Exchange Traded Fund Trust from 2011 to 2012. Director of Barclays Global Investors Holdings Deutschland GmbH from 2006 to 2009. Mr. Polisson is an attorney and has a retired status with the Massachusetts and District of Columbia Bar Associations. | N/A | |||
| * | Length of service dates reflect the Trustee’s commencement of service with the Trust’s predecessor entities, where applicable. |
Government Money Market Funds | 25
Table of Contents
Other information (unaudited)
Officers
Name and year of birth | Position held and length of service | Principal occupations during past five years or longer | ||
| Andrew Owen (Born 1960) | President, since 2017 | Executive Vice President of Wells Fargo & Company and Head of Affiliated Managers, Wells Fargo Asset Management, since 2014. In addition, Mr. Owen is currently President, Chief Executive Officer and Director of Wells Fargo Funds Management, LLC since 2017. Prior thereto, Executive Vice President responsible for marketing, investments and product development for Wells Fargo Funds Management, LLC, from 2009 to 2014. | ||
| Nancy Wiser1 (Born 1967) | Treasurer, since 2012 | Executive Vice President of Wells Fargo Funds Management, LLC since 2011. Chief Operating Officer and Chief Compliance Officer at LightBox Capital Management LLC, from 2008 to 2011. | ||
| Alexander Kymn (Born 1973) | Secretary and Chief Legal Officer, since 2018 | Senior Company Counsel of Wells Fargo Bank, N.A. since 2018 (previously Senior Counsel from 2007 to 2018). Vice President of Wells Fargo Funds Management, LLC from 2008 to 2014. | ||
| Michael H. Whitaker (Born 1967) | Chief Compliance Officer, since 2016 | Senior Vice President and Chief Compliance Officer since 2016. Senior Vice President and Chief Compliance Officer for Fidelity Investments from 2007 to 2016. | ||
| David Berardi (Born 1975) | Assistant Treasurer, since 2009 | Vice President of Wells Fargo Funds Management, LLC since 2009. Vice President of Evergreen Investment Management Company, LLC from 2008 to 2010. Manager of Fund Reporting and Control for Evergreen Investment Management Company, LLC from 2004 to 2010. | ||
| Jeremy DePalma1 (Born 1974) | Assistant Treasurer, since 2009 | Senior Vice President of Wells Fargo Funds Management, LLC since 2009. Senior Vice President of Evergreen Investment Management Company, LLC from 2008 to 2010 and head of the Fund Reporting and Control Team within Fund Administration from 2005 to 2010. | ||
| 1 | Nancy Wiser acts as Treasurer of 65 funds in the Fund Complex. Jeremy DePalma acts as Treasurer of 87 funds and Assistant Treasurer of 65 funds in the Fund Complex. |
| 2 | The Statement of Additional Information includes additional information about the Trustees and is available, without charge, upon request, by calling1-800-222-8222 or by visiting the website atwfam.com. |
26 | Government Money Market Funds
Table of Contents
Other information (unaudited)
BOARD CONSIDERATION OF INVESTMENT MANAGEMENT AND SUB-ADVISORY AGREEMENTS:
Wells Fargo Treasury Plus Money Market Fund
Under the Investment Company Act of 1940 (the “1940 Act”), the Board of Trustees (the “Board”) of Wells Fargo Funds Trust (the “Trust”) must determine annually whether to approve the continuation of the Trust’s investment management and sub-advisory agreements. In this regard, at an in-person meeting held on May 21-22, 2019 (the “Meeting”), the Board, all the members of which have no direct or indirect interest in the investment management and sub-advisory agreements and are not “interested persons” of the Trust, as defined in the 1940 Act (the “Independent Trustees”), reviewed and approved for Wells Fargo Treasury Plus Money Market Fund (the “Fund”): (i) an investment management agreement (the “Management Agreement”) with Wells Fargo Funds Management, LLC (“Funds Management”); and (ii) an investment sub-advisory agreement (the “Sub-Advisory Agreement”) with Wells Capital Management Incorporated (the “Sub-Adviser”), an affiliate of Funds Management. The Management Agreement and the Sub-Advisory Agreement are collectively referred to as the “Advisory Agreements.”
At the Meeting, the Board considered the factors and reached the conclusions described below relating to the selection of Funds Management and the Sub-Adviser and the approval of the Advisory Agreements. Prior to the Meeting, including at an in-person meeting in April 2019, the Trustees conferred extensively among themselves and with representatives of Funds Management about these matters. Also, the Board has adopted a team-based approach, with each team consisting of a sub-set of Trustees, to assist the full Board in the discharge of its duties in reviewing investment performance and other matters throughout the year. The Independent Trustees were assisted in their evaluation of the Advisory Agreements by independent legal counsel, from whom they received separate legal advice and with whom they met separately.
In providing information to the Board, Funds Management and the Sub-Adviser were guided by a detailed set of requests for information submitted to them by independent legal counsel on behalf of the Independent Trustees at the start of the Board’s annual contract renewal process earlier in 2019. In considering and approving the Advisory Agreements, the Trustees considered the information they believed relevant, including but not limited to the information discussed below. The Board considered not only the specific information presented in connection with the Meeting, but also the knowledge gained over time through interaction with Funds Management and the Sub-Adviser about various topics. In this regard, the Board reviewed reports of Funds Management at each of its quarterly meetings, which included, among other things, portfolio reviews and investment performance reports. In addition, the Board and the teams mentioned above confer with portfolio managers at various times throughout the year. The Board did not identify any particular information or consideration that was all-important or controlling, and each individual Trustee may have attributed different weights to various factors.
After its deliberations, the Board unanimously approved the continuation of the Advisory Agreements for a one-year term and determined that the compensation payable to Funds Management and the Sub-Adviser under each of the Advisory Agreements was reasonable. The Board considered the approval of the Advisory Agreements for the Fund as part of its consideration of agreements for funds across the complex, but its approvals were made on a fund-by-fund basis. The following summarizes a number of important, but not necessarily all, factors considered by the Board in support of its approvals.
Nature, extent and quality of services
The Board received and considered various information regarding the nature, extent and quality of services provided to the Fund by Funds Management and the Sub-Adviser under the Advisory Agreements. This information included a description of the investment advisory services and Fund-level administrative services covered by the Management Agreement, as well as, among other things, a summary of the background and experience of senior management of Wells Fargo Asset Management (“WFAM”), of which Funds Management and the Sub-Adviser are a part, a summary of investments made in the business of WFAM, a summary of certain organizational and personnel changes involving Funds Management and the Sub-Adviser, and a description of Funds Management’s and the Sub-Adviser’s business continuity planning programs and of their approaches to data privacy and cybersecurity. The Board received and reviewed information about Funds Management’s role as administrator of the Fund’s liquidity risk management program. The Board also considered the qualifications, background, tenure and responsibilities of each of the portfolio managers primarily responsible for the day-to-day portfolio management of the Fund.
The Board evaluated the ability of Funds Management and the Sub-Adviser to attract and retain qualified investment professionals, including research, advisory and supervisory personnel. The Board further considered the compliance programs and compliance records of Funds Management and the Sub-Adviser. In addition, the Board took into account the full range of services provided to the Fund by Funds Management and its affiliates.
Government Money Market Funds | 27
Table of Contents
Other information (unaudited)
Fund investment performance and expenses
The Board considered the investment performance results for the Fund over various time periods ended December 31, 2018. The Board considered these results in comparison to the investment performance of funds in a universe that was determined by Broadridge Inc. (“Broadridge”) to be similar to the Fund (the “Universe”), and in comparison to the Fund’s benchmark index and to other comparative data. Broadridge is an independent provider of investment company data. The Board received a description of the methodology used by Broadridge to select the mutual funds in the performance Universe. The Board noted that the investment performance of the Fund (Institutional Class) was higher than the average investment performance of the Universe for all periods under review. The Board also noted that the investment performance of the Fund was higher than its benchmark index, the Lipper U.S. Treasury Money Market Funds, for all periods under review.
The Board also received and considered information regarding the Fund’s net operating expense ratios and their various components, including actual management fees, custodian and other non-management fees, and Rule 12b-1 and non-Rule 12b-1 shareholder service fees. The Board considered these ratios in comparison to the median ratios of funds in class-specific expense groups that were determined by Broadridge to be similar to the Fund (the “Groups”). The Board received a description of the methodology used by Broadridge to select the mutual funds in the expense Groups and an explanation of how funds comprising expense groups and their expense ratios may vary from year-to-year. Based on the Broadridge reports, the Board noted that the net operating expense ratios of the Fund were lower than, equal to or in range of the median net operating expense ratios of the expense Groups for each share class.
The Board took into account the Fund’s investment performance and expense information provided to it among the factors considered in deciding to re-approve the Advisory Agreements.
Investment management and sub-advisory fee rates
The Board reviewed and considered the contractual fee rates payable by the Fund to Funds Management under the Management Agreement, as well as the contractual fee rates payable by the Fund to Funds Management for class-level administrative services under a Class-Level Administration Agreement, which include, among other things, class-level transfer agency and sub-transfer agency costs (collectively, the “Management Rates”). The Board also reviewed and considered the contractual investment sub-advisory fee rates that are payable by Funds Management to the Sub-Adviser for investment sub-advisory services.
Among other information reviewed by the Board was a comparison of the Fund’s Management Rates with the average contractual investment management fee rates of funds in the expense Groups at a common asset level as well as transfer agency costs of the funds in the expense Groups. The Board noted that the Management Rates of the Fund were lower than, equal to or in range of the sum of these average rates for the Fund’s expense Groups for all share classes.
The Board also received and considered information about the portion of the total management fee that was retained by Funds Management after payment of the fee to the Sub-Adviser for sub-advisory services. In assessing the reasonableness of this amount, the Board received and evaluated information about the nature and extent of responsibilities retained and risks assumed by Funds Management and not delegated to or assumed by the Sub-Adviser, and about Funds Management’s on-going oversight services. Given the affiliation between Funds Management and the Sub-Adviser, the Board ascribed limited relevance to the allocation of fees between them.
The Board also received and considered information about the nature and extent of services offered and fee rates charged by Funds Management and the Sub-Adviser to other types of clients with investment strategies similar to those of the Fund. In this regard, the Board received information about the significantly greater scope of services, and compliance, reporting and other legal burdens and risks of managing proprietary mutual funds compared with those associated with managing assets of other types of clients, including third-party sub-advised fund clients and non-mutual fund clients such as institutional separate accounts.
Based on its consideration of the factors and information it deemed relevant, including those described here, the Board determined that the compensation payable to Funds Management under the Management Agreement and to the Sub-Adviser under the Sub-Advisory Agreement was reasonable.
Profitability
The Board received and considered information concerning the profitability of Funds Management, as well as the profitability of both WFAM and Wells Fargo & Co. (“Wells Fargo”) from providing services to the fund family as a whole. The Board noted that the Sub-Adviser’s profitability information with respect to providing services to the Fund and other funds in the family was subsumed in the WFAM and Wells Fargo profitability analysis.
Funds Management reported on the methodologies and estimates used in calculating profitability, including a description of the methodology used to allocate certain expenses. Among other things, the Board noted that the levels of profitability
28 | Government Money Market Funds
Table of Contents
Other information (unaudited)
reported on a fund-by-fund basis varied widely, depending on factors such as the size, type and age of fund. Based on its review, the Board did not deem the profits reported by Funds Management, WFAM or Wells Fargo from services provided to the Fund to be at a level that would prevent it from approving the continuation of the Advisory Agreements.
Economies of scale
The Board received and considered information about the potential for Funds Management to experience economies of scale in the provision of management services to the Fund, the difficulties of calculating economies of scale at an individual fund level, and the extent to which potential scale benefits are shared with shareholders. The Board noted the existence of breakpoints in the Fund’s management fee structure, which operate generally to reduce the Fund’s expense ratios as the Fund grows in size. The Board considered that in addition to management fee breakpoints, Funds Management shares potential economies of scale from its management business in a variety of ways, including through fee waiver and expense reimbursement arrangements, services that benefit shareholders, competitive management fee rates set at the outset without regard to breakpoints, and investments in the business intended to enhance services available to shareholders.
The Board concluded that Funds Management’s arrangements with respect to the Fund, including contractual breakpoints, constituted a reasonable approach to sharing potential economies of scale with the Fund and its shareholders.
Other benefits to Funds Management and the Sub-Adviser
The Board received and considered information regarding potential “fall-out” or ancillary benefits received by Funds Management and its affiliates, including the Sub-Adviser, as a result of their relationships with the Fund. Ancillary benefits could include, among others, benefits directly attributable to other relationships with the Fund and benefits potentially derived from an increase in Funds Management’s and the Sub-Adviser’s business as a result of their relationships with the Fund. The Board noted that various affiliates of Funds Management may receive distribution-related fees, shareholder servicing payments and sub-transfer agency fees in respect of shares sold or held through them and services provided.
The Board also reviewed information about soft dollar credits earned and utilized by the Sub-Adviser, fees earned by Funds Management and the Sub-Adviser from managing a private investment vehicle for the fund family’s securities lending collateral, and commissions earned by an affiliated broker from portfolio transactions.
Based on its consideration of the factors and information it deemed relevant, including those described here, the Board did not find that any ancillary benefits received by Funds Management and its affiliates, including the Sub-Adviser, were unreasonable.
Conclusion
At the Meeting, after considering the above-described factors and based on its deliberations and its evaluation of the information described above, the Board unanimously approved the continuation of the Advisory Agreements for a one-year term and determined that the compensation payable to Funds Management and the Sub-Adviser under each of the Advisory Agreements was reasonable.
Government Money Market Funds | 29
Table of Contents
This page is intentionally left blank.
Table of Contents
This page is intentionally left blank.
Table of Contents
This page is intentionally left blank.
Table of Contents
For more information
More information about Wells Fargo Funds is available free upon request. To obtain literature, please write, visit the Fund’s website, or call:
Wells Fargo Funds
P.O. Box 219967
Kansas City, MO 64121-9967
Website:wfam.com
Individual investors:1-800-222-8222
Retail investment professionals:1-888-877-9275
Institutional investment professionals:1-866-765-0778

This report and the financial statements contained herein are submitted for the general information of the shareholders of the Fund. If this report is used for promotional purposes, distribution of the report must be accompanied or preceded by a current prospectus. Before investing, please consider the investment objectives, risks, charges, and expenses of the investment. For a current prospectus and, if available, a summary prospectus, containing this information, call1-800-260-5969 or visit the Fund’s website atwfam.com. Read the prospectus carefully before you invest or send money.
Wells Fargo Asset Management (WFAM) is the trade name for certain investment advisory/management firms owned by Wells Fargo & Company. These firms include but are not limited to Wells Capital Management Incorporated and Wells Fargo Funds Management, LLC. Certain products managed by WFAM entities are distributed by Wells Fargo Funds Distributor, LLC (a broker-dealer and Member FINRA).
This material is for general informational and educational purposes only and is NOT intended to provide investment advice or a recommendation of any kind—including a recommendation for any specific investment, strategy, or plan.
INVESTMENT PRODUCTS: NOT FDIC INSURED ◾ NO BANK GUARANTEE ◾ MAY LOSE VALUE
© 2019 Wells Fargo Funds Management, LLC. All rights reserved.
405493 029-19
SA314/SAR314 07-19
Table of Contents
| ITEM 2. | CODE OF ETHICS |
Not applicable.
| ITEM 3. | AUDIT COMMITTEE FINANCIAL EXPERT |
Not applicable.
| ITEM 4. | PRINCIPAL ACCOUNTANT FEES AND SERVICES |
Not applicable.
| ITEM 5. | AUDIT COMMITTEE OF LISTED REGISTRANTS |
Not applicable.
| ITEM 6. | INVESTMENTS |
A Portfolio of Investments for each series of Wells Fargo Funds Trust is included as part of the report to shareholders filed under Item 1 of this Form.
| ITEM 7. | DISCLOSURE OF PROXY VOTING POLICIES AND PROCEDURES FORCLOSED-END MANAGEMENT INVESTMENT COMPANIES |
Not applicable.
| ITEM 8. | PORTFOLIO MANAGERS OFCLOSED-END MANAGEMENT INVESTMENT COMPANIES |
Not applicable.
Table of Contents
| ITEM 9. | PURCHASES OF EQUITY SECURITIES BYCLOSED-END MANAGEMENT INVESTMENT COMPANY AND AFFILIATED PURCHASERS |
Not applicable.
| ITEM 10. | SUBMISSION OF MATTERS TO A VOTE OF SECURITY HOLDERS |
There have been no material changes to the procedures by which shareholders may recommend nominees to the registrant’s Board of Trustees that have been implemented since the registrant’s last provided disclosure in response to the requirements of this Item.
| ITEM 11. | CONTROLS AND PROCEDURES |
(a) The President and Treasurer have concluded that the Wells Fargo Funds Trust disclosure controls and procedures (as defined inRule 30a-3(c) under the Investment Company Act of 1940) provide reasonable assurances that material information relating to the registrant is made known to them by the appropriate persons, based on their evaluation of these controls and procedures as of a date within 90 days of the filing of this report.
(b) There were no significant changes in the registrant’s internal controls over financial reporting (as defined in Rule30a-3(d) under the Investment Company Act of 1940) that occurred during the most recent fiscal half-year of the period covered by this report that materially affected, or is reasonably likely to materially affect, the registrant’s internal control over financial reporting.
| ITEM 12. | DISCLOSURES OF SECURITIES LENDING ACTIVITES FORCLOSED-END MANAGEMENT INVESTMENT COMPANIES |
Not applicable.
Table of Contents
| ITEM 13. | EXHIBITS |
(a)(1) Not applicable.
(a)(2) Certification pursuant to Rule30a-2(a) under the Investment Company Act of 1940 (17 CFR270.30a-2(a)) is filed and attached hereto as Exhibit 99.CERT.
(b) Certification pursuant to Rule30a-2(b) under the Investment Company Act of 1940 (17 CFR270.30a-2(b)) is filed and attached hereto as Exhibit 99.906CERT.
Table of Contents
SIGNATURES
Pursuant to the requirements of the Securities Exchange Act of 1934 and the Investment Company Act of 1940, the registrant has duly caused this report to be signed on its behalf by the undersigned, thereunto duly authorized.
| Wells Fargo Funds Trust | ||
| By: | ||
| /s/ Andrew Owen | ||
| Andrew Owen | ||
| President | ||
| Date: | September 25, 2019 | |
Pursuant to the requirements of the Securities Exchange Act of 1934 and the Investment Company Act of 1940, this report has been signed below by the following persons on behalf of the registrant and in the capacities and on the date indicated.
| Wells Fargo Funds Trust | ||
| By: | ||
| /s/ Andrew Owen | ||
| Andrew Owen | ||
| President | ||
| Date: | September 25, 2019 | |
| By: | ||
| /s/ Nancy Wiser | ||
| Nancy Wiser | ||
| Treasurer | ||
| Date: | September 25, 2019 | |