
UNITED STATES
SECURITIES AND EXCHANGE COMMISSION
Washington, D.C. 20549
FORMN-CSRS
CERTIFIED SHAREHOLDER REPORT OF REGISTERED
MANAGEMENT INVESTMENT COMPANIES
Investment Company Act file number:811-09253
Wells Fargo Funds Trust
(Exact name of registrant as specified in charter)
525 Market St., San Francisco, CA 94105
(Address of principal executive offices) (Zip code)
Catherine Kennedy
Wells Fargo Funds Management, LLC
525 Market St., San Francisco, CA 94105
(Name and address of agent for service)
Registrant’s telephone number, including area code:800-222-8222
Date of fiscal year end: March 31
Registrant is making a filing for 7 of its series:
Wells Fargo Intrinsic Small Cap Value Fund, Wells Fargo Disciplined Small Cap Fund, Wells Fargo Special Small Cap Value Fund, Wells Fargo Fundamental Small Cap Growth Fund, Wells Fargo Precious Metals Fund, Wells Fargo Specialized Technology Fund, and Wells Fargo Utility and Telecommunications Fund.
Date of reporting period: September 30, 2019
ITEM 1. REPORT TO STOCKHOLDERS
Semi-Annual Report
September 30, 2019
Wells Fargo
Intrinsic Small Cap Value Fund
Beginning on January 1, 2021, as permitted by new regulations adopted by the Securities and Exchange Commission, paper copies of the Wells Fargo Funds’ annual and semi-annual shareholder reports issued after this date will no longer be sent by mail, unless you specifically request paper copies of the reports. Instead, the reports will be made available on the Funds’ website, and you will be notified by mail each time a report is posted and provided with a website address to access the report.
If you already elected to receive shareholder reports electronically, you will not be affected by this change and you need not take any action. You may elect to receive shareholder reports and other communications from the Fund electronically at any time by contacting your financial intermediary (such as a broker-dealer or bank) or, if you are a direct investor, by calling1-800-222-8222 or by enrolling at wellsfargo.com/advantagedelivery.
You may elect to receive all future reports in paper free of charge. If you invest through a financial intermediary, you can contact your financial intermediary to request that you continue to receive paper copies of your shareholder reports; if you invest directly with the Fund, you can call 1-800-222-8222. Your election to receive reports in paper will apply to all Wells Fargo Funds held in your account with your financial intermediary or, if you are a direct investor, to all Wells Fargo Funds that you hold.
|
|
|
Reduce clutter. Save trees. |
Sign up for electronic delivery of prospectuses and shareholder reports atwellsfargo.com/advantagedelivery |
The views expressed and any forward-looking statements are as of September 30, 2019, unless otherwise noted, and are those of the Fund managers and/or Wells Fargo Asset Management. Discussions of individual securities, or the markets generally, or any Wells Fargo Fund are not intended as individual recommendations. Future events or results may vary significantly from those expressed in any forward-looking statements. The views expressed are subject to change at any time in response to changing circumstances in the market. Wells Fargo Asset Management and the Fund disclaim any obligation to publicly update or revise any views expressed or forward-looking statements.
INVESTMENT PRODUCTS: NOT FDIC INSURED ◾ NO BANK GUARANTEE ◾ MAY LOSE VALUE
Wells Fargo Intrinsic Small Cap Value Fund | 1
Letter to shareholders (unaudited)

Andrew Owen
President
Wells Fargo Funds
“During the third quarter of 2019, investors regrouped.”
Dear Shareholder:
We are pleased to offer you this semi-annual report for the Wells Fargo Intrinsic Small Cap Value Fund for the six-month period that ended September 30, 2019. U.S. stock and global bond investors generally saw markets recover during the second half amid intensifying market volatility, global economic growth concerns, international trade stare downs, and simmering geopolitical tensions.
Overall, fixed income kept pace with domestic stocks and outperformed foreign equities. For the period, U.S. stocks, based on the S&P 500 Index,1 gained 6.08% and international stocks, as measured by the MSCI ACWI ex USA Index (Net),2 added 1.13%. The MSCI EM Index (Net)3 fell by 3.66%. Among fixed income investors, the Bloomberg Barclays U.S. Aggregate Bond Index4 added 5.42%, the Bloomberg Barclays Global Aggregate ex-USD Index5 gained 2.82%, the Bloomberg Barclays Municipal Bond Index6 increased 3.74%, and the ICE BofAML U.S. High Yield Index7 was up 3.82%.
Early second-quarter 2019 investor enthusiasm faded as the quarter wore on.
During April 2019, favorable sentiment found additional support in reports of sustained low inflation, solid employment data, and first-quarter U.S. gross domestic product growth at an annualized rate of 3.2%. During May, markets tumbled on mixed investment signals. In the U.S., partisan wrangling ramped up as Democrats and Republicans set their sights on 2020 presidential politics. The U.K.’s Brexit disagreements caused Prime Minister Theresa May to resign. Boris Johnson succeeded her only to exacerbate uncertainty about Brexit’s resolution ahead of an October 2019 deadline. The European Commission downgraded the 2019 growth forecast to 1.2%. The U.S. increased tariffs on products from China, China responded, and then talks broke down. President Donald Trump threatened to turn his foreign policy tariff tool to Mexico over immigration issues.
During the third quarter of 2019, investors regrouped. Just as the investment horizon appeared to darken, sentiment turned and U.S. equity markets gained during June and July. The gains, primarily driven by geopolitical and monetary policy events, pushed equity markets to new highs. European Central Bank President Mario Draghi said that if the outlook doesn’t improve, the bank would cut rates or buy more assets to prop up inflation. President Trump backed off of tariff threats against Mexico and China. In the U.S., the Federal Reserve (Fed) implemented a 0.25% federal funds rate cut in July.
| 1 | The S&P 500 Index consists of 500 stocks chosen for market size, liquidity, and industry group representation. It is a market-value-weighted index with each stock’s weight in the index proportionate to its market value. You cannot invest directly in an index. |
| 2 | The Morgan Stanley Capital International (MSCI) All Country World Index (ACWI) ex USA Index (Net) is a free-float-adjusted market-capitalization weighted index that is designed to measure the equity market performance of developed and emerging markets, excluding the U.S. Source: MSCI. MSCI makes no express or implied warranties or representations and shall have no liability whatsoever with respect to any MSCI data contained herein. The MSCI data may not be further redistributed or used as a basis for other indices or any securities or financial products. This report is not approved, reviewed, or produced by MSCI. You cannot invest directly in an index. |
| 3 | The MSCI Emerging Markets (EM) Index (Net) is a free-float-adjusted market-capitalization-weighted index that is designed to measure the equity market performance of emerging markets. You cannot invest directly in an index. |
| 4 | The Bloomberg Barclays U.S. Aggregate Bond Index is a broad-based benchmark that measures the investment-grade, U.S. dollar-denominated, fixed-rate taxable bond market, including Treasuries, government-related and corporate securities, mortgage-backed securities (agency fixed-rate and hybrid adjustable-rate mortgage pass-throughs), asset-backed securities, and commercial mortgage-backed securities. You cannot invest directly in an index. |
| 5 | The Bloomberg Barclays Global Aggregate ex-USD Index is an unmanaged index that provides a broad-based measure of the global investment-grade fixed-income markets excluding the U.S. dollar-denominated debt market. You cannot invest directly in an index. |
| 6 | The Bloomberg Barclays Municipal Bond Index is an unmanaged index composed of long-term tax-exempt bonds with a minimum credit rating of Baa. You cannot invest directly in an index. |
| 7 | The ICE BofAML U.S. High Yield Index is a market-capitalization-weighted index of domestic and Yankee high-yield bonds. The index tracks the performance of high-yield securities traded in the U.S. bond market. You cannot invest directly in an index. Copyright 2019. ICE Data Indices, LLC. All rights reserved. |
2 | Wells Fargo Intrinsic Small Cap Value Fund
Letter to shareholders (unaudited)
Later in July 2019, the U.S. reversed course and threatened to impose higher tariffs on China’s exports after talks failed. China responded with tariff threats of its own and devalued the renminbi, a move that roiled global markets. Major U.S. stock market indices closed July with the worst weekly results of the year. Bond prices gained as Treasury yields fell to levels not seen since November 2016 and the yield curve inverted at multiple points along the 30-year arc.
In a microcosm, August encapsulated many of the unnerving events that plagued investors during the prior 11 months. The U.S.-China trade relationship swung from antagonistic to hopeful and back again with no evident compromise on the horizon. Evidence of a continued global economic slowdown mounted. Central banks in China, New Zealand, and Thailand cut interest rates. Industrial and manufacturing data declined in China, Canada, Japan, and Germany. Adding to the uncertain environment, Italy’s prime minister resigned, many feared a crackdown in Hong Kong as protesters sustained their calls for reform throughout the month, and Boris Johnson planned to suspend Parliament as Brexit’s deadline neared.
In the U.S., September saw the Fed join other central banks in cutting interest rates. Manufacturing data in the U.S., as reported by the Institute for Supply Management, disappointed investors. The U.S. Congress announced it would pursue an impeachment investigation of President Trump. Meanwhile, the Brexit impasse showed no signs of resolution. Officials in China said that hitting the country’s economic growth goals for the year would be difficult considering the weight of tariffs and trade restrictions. So while the S&P 500 Index finished the third quarter with year-to-date returns that were the best in more than 20 years, amid signs of equity investors taking money out of the stock market, concerns about future returns remained.
Don’t let short-term uncertainty derail long-term investment goals.
Periods of investment uncertainty can present challenges, but experience has taught us that maintaining long-term investment goals can be an effective way to plan for the future. To help you create a sound strategy based on your personal goals and risk tolerance, Wells Fargo Funds offers more than 100 mutual funds spanning a wide range of asset classes and investment styles. Although diversification cannot guarantee an investment profit or prevent losses, we believe it can be an effective way to manage investment risk and potentially smooth out overall portfolio performance. We encourage investors to know their investments and to understand that appropriate levels of risk-taking may unlock opportunities.
Thank you for choosing to invest with Wells Fargo Funds. We appreciate your confidence in us and remain committed to helping you meet your financial needs.
Sincerely,

Andrew Owen
President
Wells Fargo Funds
“In the U.S., September saw the Fed join other central banks in cutting interest rates.”
|
|
|
For further information about your Fund, contact your investment professional, visit our website at wfam.com, or call us directly at1-800-222-8222. |
Wells Fargo Intrinsic Small Cap Value Fund | 3
Performance highlights (unaudited)
Investment objective
The Fund seeks long-term capital appreciation.
Manager
Wells Fargo Funds Management, LLC
Subadviser
Wells Capital Management Incorporated
Portfolio managers
Ann Miletti
Christopher G. Miller, CFA®‡
Average annual total returns (%) as of September 30, 2019
| | | | | | | | | | | | | | | | | | | | | | | | | | | | | | | | | | |
| | | | |
| | | | | Including sales charge | | | Excluding sales charge | | | Expense ratios1 (%) | |
| | | | | | | | | |
| | | Inception date | | 1 year | | | 5 year | | | 10 year | | | 1 year | | | 5 year | | | 10 year | | | Gross | | | Net2 | |
| | | | | | | | | | |
| Class A (WFSMX) | | 3-31-2008 | | | -12.29 | | | | 4.85 | | | | 9.20 | | | | -6.94 | | | | 6.10 | | | | 9.85 | | | | 1.54 | | | | 1.35 | |
| | | | | | | | | | |
| Class C (WSCDX) | | 3-31-2008 | | | -8.65 | | | | 5.30 | | | | 9.02 | | | | -7.65 | | | | 5.30 | | | | 9.02 | | | | 2.29 | | | | 2.10 | |
| | | | | | | | | | |
| Administrator Class (WFSDX) | | 4-8-2005 | | | – | | | | – | | | | – | | | | -6.81 | | | | 6.27 | | | | 10.07 | | | | 1.46 | | | | 1.20 | |
| | | | | | | | | | |
| Institutional Class (WFSSX) | | 4-8-2005 | | | – | | | | – | | | | – | | | | -6.63 | | | | 6.47 | | | | 10.29 | | | | 1.21 | | | | 1.00 | |
| | | | | | | | | | |
| Russell 2000® Value Index3 | | – | | | – | | | | – | | | | – | | | | -8.24 | | | | 7.17 | | | | 10.06 | | | | – | | | | – | |
Figures quoted represent past performance, which is no guarantee of future results, and do not reflect taxes that a shareholder may pay on fund distributions or the redemption of fund shares. Investment return and principal value of an investment will fluctuate so that an investor’s shares, when redeemed, may be worth more or less than their original cost. Performance shown without sales charges would be lower if sales charges were reflected. Current performance may be lower or higher than the performance data quoted, which assumes the reinvestment of dividends and capital gains. Current month-end performance is available on the Fund’s website,wfam.com.
Index returns do not include transaction costs associated with buying and selling securities, any mutual fund fees or expenses, or any taxes. It is not possible to invest directly in an index.
For Class A shares, the maximum front-end sales charge is 5.75%. For Class C shares, the maximum contingent deferred sales charge is 1.00%. Performance including a contingent deferred sales charge assumes the sales charge for the corresponding time period. Administrator Class and Institutional Class shares are sold without a front-end sales charge or contingent deferred sales charge.
Stock values fluctuate in response to the activities of individual companies and general market and economic conditions. Smaller-company stocks tend to be more volatile and less liquid than those of larger companies. Certain investment strategies tend to increase the total risk of an investment (relative to the broader market). Consult the Fund’s prospectus for additional information on these and other risks.
Please see footnotes on page 5.
4 | Wells Fargo Intrinsic Small Cap Value Fund
Performance highlights (unaudited)
| | | | |
| |
| Ten largest holdings (%) as of September 30, 20194 | | | |
| | |
Bio-Rad Laboratories Incorporated Class A | | | 2.53 | |
| | |
Sterling Bancorp | | | 2.23 | |
| | |
Essent Group Limited | | | 2.16 | |
| | |
SPX Corporation | | | 2.15 | |
| | |
Webster Financial Corporation | | | 2.08 | |
| | |
Four Corners Property Trust Incorporated | | | 2.07 | |
| | |
AngioDynamics Incorporated | | | 1.98 | |
| | |
National General Holdings Corporation | | | 1.97 | |
| | |
Masonite International Corporation | | | 1.97 | |
| | |
Ameris Bancorp | | | 1.93 | |
|
|
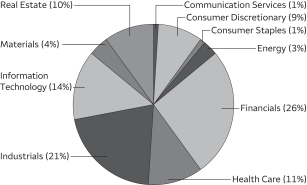
| Sector distribution as of September 30, 20195 |
|
 |
| ‡ | CFA® and Chartered Financial Analyst® are trademarks owned by CFA Institute. |
| 1 | Reflect the expense ratios as stated in the most recent prospectuses. The expense ratios shown are subject to change and may differ from the annualized expense ratios shown in the financial highlights of this report. |
| 2 | The manager has contractually committed through July 31, 2020, to waive fees and/or reimburse expenses to the extent necessary to cap the expenses of each class after fee waivers at the amounts shown. Brokerage commissions, stamp duty fees, interest, taxes, acquired fund fees and expenses (if any), and extraordinary expenses are excluded from the expense cap. Prior to or after the commitment expiration date, the cap may be increased or the commitment to maintain the cap may be terminated only with the approval of the Board of Trustees. Without this cap, the Fund’s returns would have been lower. The expense ratio paid by an investor is the net expense ratio (the total annual fund operating expenses after fee waivers) as stated in the prospectuses. |
| 3 | The Russell 2000® Value Index measures the performance of those Russell 2000 companies with lower price/book ratios and lower forecasted growth values. You cannot invest directly in an index. |
| 4 | The ten largest holdings, excluding cash, cash equivalents and any money market funds, are calculated based on the value of the investments divided by total net assets of the Fund. Holdings are subject to change and may have changed since the date specified. |
| 5 | Amounts are calculated based on the total long-term investments of the Fund. These amounts are subject to change and may have changed since the date specified. |
Wells Fargo Intrinsic Small Cap Value Fund | 5
Fund expenses (unaudited)
As a shareholder of the Fund, you incur two types of costs: (1) transaction costs, including sales charges (loads) on purchase payments and contingent deferred sales charges (if any) on redemptions and (2) ongoing costs, including management fees, distribution (12b-1) and/or shareholder servicing fees, and other Fund expenses. This example is intended to help you understand your ongoing costs (in dollars) of investing in the Fund and to compare these costs with the ongoing costs of investing in other mutual funds.
The example is based on an investment of $1,000 invested at the beginning of the six-month period and held for the entire period from April 1, 2019 to September 30, 2019.
Actual expenses
The “Actual” line of the table below provides information about actual account values and actual expenses. You may use the information in this line, together with the amount you invested, to estimate the expenses that you paid over the period. Simply divide your account value by $1,000 (for example, an $8,600 account value divided by $1,000 = 8.6), then multiply the result by the number in the “Actual” line under the heading entitled “Expenses paid during period” for your applicable class of shares to estimate the expenses you paid on your account during this period.
Hypothetical example for comparison purposes
The “Hypothetical” line of the table below provides information about hypothetical account values and hypothetical expenses based on the Fund’s actual expense ratio and an assumed rate of return of 5% per year before expenses, which is not the Fund’s actual return. The hypothetical account values and expenses may not be used to estimate the actual ending account balance or expenses you paid for the period. You may use this information to compare the ongoing costs of investing in the Fund and other funds. To do so, compare this 5% hypothetical example with the 5% hypothetical examples that appear in the shareholder reports of the other funds.
Please note that the expenses shown in the table are meant to highlight your ongoing costs only and do not reflect any transactional costs, such as sales charges (loads) and contingent deferred sales charges. Therefore, the “Hypothetical” line of the table is useful in comparing ongoing costs only and will not help you determine the relative total costs of owning different funds. In addition, if these transactional costs were included, your costs would have been higher.
| | | | | | | | | | | | | | | | |
| | | Beginning
account value
4-1-2019 | | | Ending
account value
9-30-2019 | | | Expenses
paid during
the period¹ | | | Annualized net
expense ratio | |
| | | | | |
Class A | | | | | | | | | | | | | | | | |
| | | | |
Actual | | $ | 1,000.00 | | | $ | 1,013.88 | | | $ | 6.82 | | | | 1.35 | % |
| | | | |
Hypothetical (5% return before expenses) | | $ | 1,000.00 | | | $ | 1,018.30 | | | $ | 6.83 | | | | 1.35 | % |
| | | | | |
Class C | | | | | | | | | | | | | | | | |
| | | | |
Actual | | $ | 1,000.00 | | | $ | 1,010.01 | | | $ | 10.58 | | | | 2.10 | % |
| | | | |
Hypothetical (5% return before expenses) | | $ | 1,000.00 | | | $ | 1,014.54 | | | $ | 10.61 | | | | 2.10 | % |
| | | | | |
Administrator Class | | | | | | | | | | | | | | | | |
| | | | |
Actual | | $ | 1,000.00 | | | $ | 1,014.89 | | | $ | 6.06 | | | | 1.20 | % |
| | | | |
Hypothetical (5% return before expenses) | | $ | 1,000.00 | | | $ | 1,019.05 | | | $ | 6.07 | | | | 1.20 | % |
| | | | | |
Institutional Class | | | | | | | | | | | | | | | | |
| | | | |
Actual | | $ | 1,000.00 | | | $ | 1,015.64 | | | $ | 5.05 | | | | 1.00 | % |
| | | | |
Hypothetical (5% return before expenses) | | $ | 1,000.00 | | | $ | 1,020.05 | | | $ | 5.06 | | | | 1.00 | % |
| 1 | Expenses paid is equal to the annualized net expense ratio of each class multiplied by the average account value over the period, multiplied by the number of days in the most recent fiscal half-year divided by the number of days in the fiscal year (to reflect the one-half-year period). |
6 | Wells Fargo Intrinsic Small Cap Value Fund
Portfolio of investments—September 30, 2019 (unaudited)
| | | | | | | | | | | | | | | | |
| | | | | | | | | Shares | | | Value | |
| Common Stocks: 97.40% | | | | | | | | | | | | | | | | |
| | | | |
Communication Services: 1.17% | | | | | | | | | | | | | | | | |
| | | | |
| Entertainment: 0.63% | | | | | | | | | | | | |
Lions Gate Entertainment Class B | | | | | | | | | | | 45,995 | | | $ | 401,995 | |
| | | | | | | | | | | | | | | | |
| | | | |
| Interactive Media & Services: 0.54% | | | | | | | | | | | | |
Eventbrite Incorporated Class A Ǡ | | | | | | | | | | | 19,577 | | | | 346,709 | |
| | | | | | | | | | | | | | | | |
| | | | |
Consumer Discretionary: 9.06% | | | | | | | | | | | | | | | | |
| | | | |
| Auto Components: 3.30% | | | | | | | | | | | | |
American Axle & Manufacturing Holdings Incorporated † | | | | | | | | | | | 68,006 | | | | 559,009 | |
Dana Incorporated | | | | | | | | | | | 50,213 | | | | 725,076 | |
Gentherm Incorporated † | | | | | | | | | | | 20,166 | | | | 828,520 | |
| |
| | | | 2,112,605 | |
| | | | | | | | | | | | | | | | |
| | | | |
| Diversified Consumer Services: 0.61% | | | | | | | | | | | | |
Houghton Mifflin Harcourt Company † | | | | | | | | | | | 72,632 | | | | 387,129 | |
| | | | | | | | | | | | | | | | |
| | | | |
| Hotels, Restaurants & Leisure: 1.98% | | | | | | | | | | | | |
Jack in the Box Incorporated | | | | | | | | | | | 10,212 | | | | 930,517 | |
Playa Hotels & Resorts NV † | | | | | | | | | | | 42,668 | | | | 334,090 | |
| |
| | | | 1,264,607 | |
| | | | | | | | | | | | | | | | |
| | | | |
| Internet & Direct Marketing Retail: 0.96% | | | | | | | | | | | | |
Groupon Incorporated † | | | | | | | | | | | 231,629 | | | | 616,133 | |
| | | | | | | | | | | | | | | | |
| | | | |
| Specialty Retail: 1.06% | | | | | | | | | | | | |
National Vision Holdings Incorporated † | | | | | | | | | | | 28,299 | | | | 681,157 | |
| | | | | | | | | | | | | | | | |
| | | | |
| Textiles, Apparel & Luxury Goods: 1.15% | | | | | | | | | | | | |
Carter’s Incorporated | | | | | | | | | | | 8,049 | | | | 734,149 | |
| | | | | | | | | | | | | | | | |
| | | | |
| Consumer Staples: 1.25% | | | | | | | | | | | | |
| | | | |
| Food Products: 1.25% | | | | | | | | | | | | |
TreeHouse Foods Incorporated † | | | | | | | | | | | 14,463 | | | | 801,973 | |
| | | | | | | | | | | | | | | | |
| | | | |
Energy: 3.35% | | | | | | | | | | | | | | | | |
| | | | |
| Oil, Gas & Consumable Fuels: 3.35% | | | | | | | | | | | | |
Cimarex Energy Company | | | | | | | | | | | 20,818 | | | | 998,015 | |
Targa Resources Corporation | | | | | | | | | | | 28,516 | | | | 1,145,488 | |
| |
| | | | 2,143,503 | |
| | | | | | | | | | | | | | | | |
| | | | |
| Financials: 25.06% | | | | | | | | | | | | |
| | | | |
| Banks: 15.54% | | | | | | | | | | | | |
Ameris Bancorp | | | | | | | | | | | 30,720 | | | | 1,236,173 | |
Independent Bank Group Incorporated | | | | | | | | | | | 12,511 | | | | 658,204 | |
Pinnacle Financial Partners Incorporated | | | | | | | | | | | 19,927 | | | | 1,130,857 | |
Renasant Corporation | | | | | | | | | | | 28,439 | | | | 995,649 | |
Sterling Bancorp | | | | | | | | | | | 71,245 | | | | 1,429,175 | |
United Community Bank | | | | | | | | | | | 33,258 | | | | 942,864 | |
Webster Financial Corporation | | | | | | | | | | | 28,326 | | | | 1,327,640 | |
Wintrust Financial Corporation | | | | | | | | | | | 16,152 | | | | 1,043,904 | |
Zions Bancorporation | | | | | | | | | | | 26,409 | | | | 1,175,729 | |
| |
| | | | 9,940,195 | |
| | | | | | | | | | | | | | | | |
Wells Fargo Intrinsic Small Cap Value Fund | 7
Portfolio of investments—September 30, 2019 (unaudited)
| | | | | | | | | | | | | | | | |
| | | | | | | | | Shares | | | Value | |
| Capital Markets: 1.19% | | | | | | | | | | | | |
Stifel Financial Corporation | | | | | | | | | | | 13,283 | | | $ | 762,179 | |
| | | | | | | | | | | | | | | | |
| | | | |
| Insurance: 6.17% | | | | | | | | | | | | |
Axis Capital Holdings Limited | | | | | | | | | | | 10,742 | | | | 716,706 | |
CNO Financial Group Incorporated | | | | | | | | | | | 66,241 | | | | 1,048,595 | |
First American Financial Corporation | | | | | | | | | | | 15,619 | | | | 921,677 | |
National General Holdings Corporation | | | | | | | | | | | 54,874 | | | | 1,263,199 | |
| |
| | | | 3,950,177 | |
| | | | | | | | | | | | | | | | |
| | | | |
| Thrifts & Mortgage Finance: 2.16% | | | | | | | | | | | | |
Essent Group Limited | | | | | | | | | | | 28,923 | | | | 1,378,759 | |
| | | | | | | | | | | | | | | | |
| | | | |
| Health Care: 10.76% | | | | | | | | | | | | |
| | | | |
| Health Care Equipment & Supplies: 6.72% | | | | | | | | | | | | |
AngioDynamics Incorporated † | | | | | | | | | | | 68,815 | | | | 1,267,572 | |
Haemonetics Corporation † | | | | | | | | | | | 7,592 | | | | 957,655 | |
Integer Holdings Corporation † | | | | | | | | | | | 13,737 | | | | 1,037,968 | |
Steris plc | | | | | | | | | | | 7,187 | | | | 1,038,450 | |
| |
| | | | 4,301,645 | |
| | | | | | | | | | | | | | | | |
| | | | |
| Life Sciences Tools & Services: 4.04% | | | | | | | | | | | | |
Bio-Rad Laboratories Incorporated Class A † | | | | | | | | | | | 4,863 | | | | 1,618,115 | |
Bruker Corporation | | | | | | | | | | | 21,970 | | | | 965,142 | |
| |
| | | | 2,583,257 | |
| | | | | | | | | | | | | | | | |
| | | | |
Industrials: 20.72% | | | | | | | | | | | | | | | | |
| | | | |
| Airlines: 0.74% | | | | | | | | | | | | |
Spirit Airlines Incorporated † | | | | | | | | | | | 13,029 | | | | 472,953 | |
| | | | | | | | | | | | | | | | |
| | | | |
| Building Products: 1.97% | | | | | | | | | | | | |
Masonite International Corporation † | | | | | | | | | | | 21,761 | | | | 1,262,138 | |
| | | | | | | | | | | | | | | | |
| | | | |
| Commercial Services & Supplies: 5.84% | | | | | | | | | | | | |
Advanced Disposal Services Incorporated † | | | | | | | | | | | 14,940 | | | | 486,596 | |
IAA Incorporated † | | | | | | | | | | | 15,131 | | | | 631,417 | |
Interface Incorporated | | | | | | | | | | | 57,675 | | | | 832,827 | |
Knoll Incorporated | | | | | | | | | | | 31,146 | | | | 789,551 | |
Stericycle Incorporated † | | | | | | | | | | | 19,527 | | | | 994,510 | |
| |
| | | | 3,734,901 | |
| | | | | | | | | | | | | | | | |
| | | | |
| Machinery: 6.62% | | | | | | | | | | | | |
Altra Industrial Motion Corporation | | | | | | | | | | | 33,557 | | | | 929,361 | |
ITT Incorporated | | | | | | | | | | | 15,785 | | | | 965,884 | |
Rexnord Corporation † | | | | | | | | | | | 35,424 | | | | 958,219 | |
SPX Corporation † | | | | | | | | | | | 34,453 | | | | 1,378,465 | |
| |
| | | | 4,231,929 | |
| | | | | | | | | | | | | | | | |
| | | | |
| Professional Services: 1.42% | | | | | | | | | | | | |
ASGN Incorporated † | | | | | | | | | | | 14,435 | | | | 907,384 | |
| | | | | | | | | | | | | | | | |
| | | | |
| Road & Rail: 2.24% | | | | | | | | | | | | |
Genesee & Wyoming Incorporated Class A † | | | | | | | | | | | 5,484 | | | | 606,037 | |
Saia Incorporated † | | | | | | | | | | | 8,851 | | | | 829,339 | |
| |
| | | | 1,435,376 | |
| | | | | | | | | | | | | | | | |
8 | Wells Fargo Intrinsic Small Cap Value Fund
Portfolio of investments—September 30, 2019 (unaudited)
| | | | | | | | | | | | | | | | |
| | | | | | | | | Shares | | | Value | |
| Trading Companies & Distributors: 1.89% | | | | | | | | | | | | |
Air Lease Corporation | | | | | | | | | | | 24,272 | | | $ | 1,015,055 | |
MRC Global Incorporated † | | | | | | | | | | | 16,093 | | | | 195,208 | |
| |
| | | | 1,210,263 | |
| | | | | | | | | | | | | | | | |
| | | | |
Information Technology: 13.19% | | | | | | | | | | | | | | | | |
| | | | |
| Communications Equipment: 1.10% | | | | | | | | | | | | |
Infinera Corporation Ǡ | | | | | | | | | | | 129,382 | | | | 705,132 | |
| | | | | | | | | | | | | | | | |
| | | | |
| Electronic Equipment, Instruments & Components: 6.50% | | | | | | | | | | | | |
Anixter International Incorporated † | | | | | | | | | | | 15,802 | | | | 1,092,234 | |
Avnet Incorporated | | | | | | | | | | | 24,028 | | | | 1,068,886 | |
SYNNEX Corporation | | | | | | | | | | | 8,960 | | | | 1,011,584 | |
Zebra Technologies Corporation Class A † | | | | | | | | | | | 4,773 | | | | 985,004 | |
| |
| | | | 4,157,708 | |
| | | | | | | | | | | | | | | | |
| | | | |
| IT Services: 2.71% | | | | | | | | | | | | |
Conduent Incorporated † | | | | | | | | | | | 56,372 | | | | 350,634 | |
InterXion Holding NV † | | | | | | | | | | | 7,942 | | | | 646,955 | |
WEX Incorporated † | | | | | | | | | | | 3,649 | | | | 737,353 | |
| |
| | | | 1,734,942 | |
| | | | | | | | | | | | | | | | |
| | | | |
| Semiconductors & Semiconductor Equipment: 1.71% | | | | | | | | | | | | |
Brooks Automation Incorporated | | | | | | | | | | | 29,600 | | | | 1,096,088 | |
| | | | | | | | | | | | | | | | |
| | | | |
| Software: 1.17% | | | | | | | | | | | | |
Mimecast Limited † | | | | | | | | | | | 20,874 | | | | 744,576 | |
| | | | | | | | | | | | | | | | |
| | | | |
Materials: 3.55% | | | | | | | | | | | | | | | | |
| | | | |
| Chemicals: 0.72% | | | | | | | | | | | | |
Olin Corporation | | | | | | | | | | | 24,708 | | | | 462,534 | |
| | | | | | | | | | | | | | | | |
| | | | |
| Metals & Mining: 2.83% | | | | | | | | | | | | |
Reliance Steel & Aluminum Company | | | | | | | | | | | 8,970 | | | | 893,950 | |
Royal Gold Incorporated | | | | | | | | | | | 7,428 | | | | 915,204 | |
| |
| | | | 1,809,154 | |
| | | | | | | | | | | | | | | | |
| | | | |
Real Estate: 9.29% | | | | | | | | | | | | | | | | |
| | | | |
| Equity REITs: 9.29% | | | | | | | | | | | | |
Cousins Properties Incorporated | | | | | | | | | | | 28,768 | | | | 1,081,389 | |
Four Corners Property Trust Incorporated | | | | | | | | | | | 46,772 | | | | 1,322,712 | |
Healthcare Realty Trust Incorporated | | | | | | | | | | | 33,654 | | | | 1,127,409 | |
Hudson Pacific Properties Incorporated | | | | | | | | | | | 19,071 | | | | 638,116 | |
Retail Opportunity Investment Corporation | | | | | | | | | | | 61,521 | | | | 1,121,528 | |
Taubman Centers Incorporated | | | | | | | | | | | 15,924 | | | | 650,177 | |
| |
| | | | 5,941,331 | |
| | | | | | | | | | | | | | | | |
| |
Total Common Stocks (Cost $55,246,205) | | | | 62,312,581 | |
| | | | | | | | | | | | | | | | |
| | | | |
| | | | | | | | | | | | | | | | |
Wells Fargo Intrinsic Small Cap Value Fund | 9
Portfolio of investments—September 30, 2019 (unaudited)
| | | | | | | | | | | | | | | | |
| | | Yield | | | | | | Shares | | | Value | |
Short-Term Investments: 3.84% | | | | | | | | | | | | | | | | |
| | | | |
| Investment Companies: 3.84% | | | | | | | | | | | | |
Securities Lending Cash Investments LLC (l)(r)(u) | | | 2.11 | % | | | | | | | 686,302 | | | $ | 686,370 | |
Wells Fargo Government Money Market Fund Select Class (l)(u) | | | 1.88 | | | | | | | | 1,773,416 | | | | 1,773,416 | |
| |
Total Short-Term Investments (Cost $2,459,786) | | | | 2,459,786 | |
| | | | | | | | | | | | | | | | |
| | | | | | | | |
| Total investments in securities (Cost $57,705,991) | | | 101.24 | % | | | 64,772,367 | |
| | |
Other assets and liabilities, net | | | (1.24 | ) | | | (793,225 | ) |
| | | | | | | | |
| Total net assets | | | 100.00 | % | | $ | 63,979,142 | |
| | | | | | | | |
| « | All or a portion of this security is on loan. |
| † | Non-income-earning security |
| (l) | The issuer of the security is an affiliated person of the Fund as defined in the Investment Company Act of 1940. |
| (r) | The investment is a non-registered investment company purchased with cash collateral received from securities on loan. |
| (u) | The rate represents the 7-day annualized yield at period end. |
Abbreviations:
| REIT | Real estate investment trust |
Investments in Affiliates
An affiliated investment is an investment in which the Fund owns at least 5% of the outstanding voting shares of the issuer or as a result of other relationships, such as the Fund and the issuer having the same investment manager. Transactions with issuers that were either affiliated persons of the Portfolio at the beginning of the period or the end of the period were as follows:
| | | | | | | | | | | | | | | | | | | | | | | | | | | | | | | | | | | | |
| | | Shares,
beginning of
period | | | Shares
purchased | | | Shares
sold | | | Shares,
end of
period | | | Net
realized
gains
(losses) | | | Net
change in
unrealized
gains
(losses) | | | Income
from
affiliated
securities | | | Value,
end of
period | | | % of
net
assets | |
| Short-Term Investments | | | | | | | | | | | | | | | | | | | | | | | | | | | | | | | | | | | | |
Investment Companies | | | | | | | | | | | | | | | | | | | | | | | | | | | | | | | | | | | | |
Securities Lending Cash Investments LLC | | | 0 | | | | 8,862,899 | | | | 8,176,597 | | | | 686,302 | | | $ | (49 | ) | | $ | 0 | | | $ | 3,789 | # | | $ | 686,370 | | | | | |
Wells Fargo Government Money Market Fund Select Class | | | 2,859,333 | | | | 6,924,089 | | | | 8,010,006 | | | | 1,773,416 | | | | 0 | | | | 0 | | | | 20,773 | | | | 1,773,416 | | | | | |
| | | | | | | | | | | | | | | | | | | | | | | | | | | | | | | | | | | | |
| | | | | | | | | |
| | | | | | | | | | | | | | | | | | $ | (49 | ) | | $ | 0 | | | $ | 24,562 | | | $ | 2,459,786 | | | | 3.84 | % |
| | | | | | | | | | | | | | | | | | | | | | | | | | | | | | | | | | | | |
| # | Amount shown represents income before fees and rebates. |
The accompanying notes are an integral part of these financial statements.
10 | Wells Fargo Intrinsic Small Cap Value Fund
Statement of assets and liabilities—September 30, 2019 (unaudited)
| | | | |
| | | | |
| |
Assets | | | | |
Investments in unaffiliated securities (including $667,758 of securities loaned), at value (cost $55,246,205) | | $ | 62,312,581 | |
Investments in affiliated securities, at value (cost $2,459,786) | | | 2,459,786 | |
Receivable for investments sold | | | 92,879 | |
Receivable for Fund shares sold | | | 66,154 | |
Receivable for dividends | | | 37,093 | |
Receivable for securities lending income, net | | | 246 | |
Prepaid expenses and other assets | | | 33,147 | |
| | | | |
Total assets | | | 65,001,886 | |
| | | | |
| |
Liabilities | | | | |
Payable upon receipt of securities loaned | | | 685,926 | |
Payable for investments purchased | | | 208,817 | |
Payable for Fund shares redeemed | | | 41,743 | |
Management fee payable | | | 30,985 | |
Administration fees payable | | | 9,517 | |
Trustees’ fees and expenses payable | | | 2,477 | |
Distribution fee payable | | | 219 | |
Accrued expenses and other liabilities | | | 43,060 | |
| | | | |
Total liabilities | | | 1,022,744 | |
| | | | |
Total net assets | | $ | 63,979,142 | |
| | | | |
| |
Net assets consist of | | | | |
Paid-in capital | | $ | 51,633,306 | |
Total distributable earnings | | | 12,345,836 | |
| | | | |
Total net assets | | $ | 63,979,142 | |
| | | | |
| |
Computation of net asset value and offering price per share | | | | |
Net assets – Class A | | $ | 42,016,678 | |
Shares outstanding – Class A1 | | | 1,369,127 | |
Net asset value per share – Class A | | | $30.69 | |
Maximum offering price per share – Class A2 | | | $32.56 | |
Net assets – Class C | | $ | 357,728 | |
Shares outstanding – Class C1 | | | 12,657 | |
Net asset value per share – Class C | | | $28.26 | |
Net assets – Administrator Class | | $ | 1,697,652 | |
Shares outstanding – Administrator Class1 | | | 54,160 | |
Net asset value per share – Administrator Class | | | $31.35 | |
Net assets – Institutional Class | | $ | 19,907,084 | |
Shares outstanding – Institutional Class1 | | | 625,553 | |
Net asset value per share – Institutional Class | | | $31.82 | |
| 1 | The Fund has an unlimited number of authorized shares. |
| 2 | Maximum offering price is computed as 100/94.25 of net asset value. On investments of $50,000 or more, the offering price is reduced. |
The accompanying notes are an integral part of these financial statements.
Wells Fargo Intrinsic Small Cap Value Fund | 11
Statement of operations—six months ended September 30, 2019 (unaudited)
| | | | |
| | | | |
| |
Investment income | | | | |
Dividends | | $ | 429,446 | |
Income from affiliated securities | | | 21,403 | |
| | | | |
Total investment income | | | 450,849 | |
| | | | |
| |
Expenses | | | | |
Management fee | | | 277,391 | |
Administration fees | | | | |
Class A | | | 45,073 | |
Class C | | | 463 | |
Administrator Class | | | 789 | |
Institutional Class | | | 13,447 | |
Shareholder servicing fees | | | | |
Class A | | | 53,658 | |
Class C | | | 551 | |
Administrator Class | | | 1,517 | |
Distribution fee | | | | |
Class C | | | 1,653 | |
Custody and accounting fees | | | 5,788 | |
Professional fees | | | 19,469 | |
Registration fees | | | 33,612 | |
Shareholder report expenses | | | 15,964 | |
Trustees’ fees and expenses | | | 10,227 | |
Other fees and expenses | | | 4,674 | |
| | | | |
Total expenses | | | 484,276 | |
Less: Fee waivers and/or expense reimbursements | | | | |
Fund-level | | | (79,522 | ) |
| | | | |
Net expenses | | | 404,754 | |
| | | | |
Net investment income | | | 46,095 | |
| | | | |
| |
Realized and unrealized gains (losses) on investments | | | | |
Net realized gains (losses) on | | | | |
Unaffiliated securities | | | 1,663,954 | |
Affiliated securities | | | (49 | ) |
| | | | |
Net realized gains on investments | | | 1,663,905 | |
Net change in unrealized gains (losses) on investments | | | (795,692 | ) |
| | | | |
Net realized and unrealized gains (losses) on investments | | | 868,213 | |
| | | | |
Net increase in net assets resulting from operations | | $ | 914,308 | |
| | | | |
The accompanying notes are an integral part of these financial statements.
12 | Wells Fargo Intrinsic Small Cap Value Fund
Statement of changes in net assets
| | | | | | | | | | | | | | | | |
| | | Six months ended
September 30, 2019
(unaudited) | | | Year ended
March 31, 2019 | |
| | | | |
Operations | | | | | | | | | | | | | | | | |
Net investment income | | | | | | $ | 46,095 | | | | | | | $ | 2,078 | |
Net realized gains on investments | | | | | | | 1,663,905 | | | | | | | | 4,077,462 | |
Net change in unrealized gains (losses) on investments | | | | | | | (795,692 | ) | | | | | | | (6,626,742 | ) |
| | | | |
Net increase (decrease) in net assets resulting from operations | | | | | | | 914,308 | | | | | | | | (2,547,202 | ) |
| | | | |
| | | | |
Capital share transactions | | | Shares | | | | | | | | Shares | | | | | |
Proceeds from shares sold | | | | | | | | | | | | | | | | |
Class A | | | 13,801 | | | | 424,555 | | | | 32,828 | | | | 1,010,693 | |
Class C | | | 412 | | | | 11,807 | | | | 1,268 | | | | 37,710 | |
Administrator Class | | | 17,633 | | | | 559,628 | | | | 13,111 | | | | 411,209 | |
Institutional Class | | | 10,573 | | | | 333,221 | | | | 40,538 | | | | 1,300,358 | |
| | | | |
| | | | | | | 1,329,211 | | | | | | | | 2,759,970 | |
| | | | |
Payment for shares redeemed | | | | | | | | | | | | | | | | |
Class A | | | (99,187 | ) | | | (3,025,209 | ) | | | (199,126 | ) | | | (6,242,566 | ) |
Class C | | | (6,557 | ) | | | (181,966 | ) | | | (11,127 | ) | | | (325,796 | ) |
Administrator Class | | | (1,180 | ) | | | (37,148 | ) | | | (17,407 | ) | | | (542,222 | ) |
Institutional Class | | | (67,921 | ) | | | (2,137,275 | ) | | | (221,373 | ) | | | (7,195,900 | ) |
| | | | |
| | | | | | | (5,381,598 | ) | | | | | | | (14,306,484 | ) |
| | | | |
Net decrease in net assets resulting from capital share transactions | | | | | | | (4,052,387 | ) | | | | | | | (11,546,514 | ) |
| | | | |
Total decrease in net assets | | | | | | | (3,138,079 | ) | | | | | | | (14,093,716 | ) |
| | | | |
| | | | |
Net assets | | | | | | | | | | | | | | | | |
Beginning of period | | | | | | | 67,117,221 | | | | | | | | 81,210,937 | |
| | | | |
End of period | | | | | | $ | 63,979,142 | | | | | | | $ | 67,117,221 | |
| | | | |
The accompanying notes are an integral part of these financial statements.
Wells Fargo Intrinsic Small Cap Value Fund | 13
Financial highlights
(For a share outstanding throughout each period)
| | | | | | | | | | | | | | | | | | | | | | | | |
| | | Six months ended
September 30, 2019
(unaudited) | | | Year ended March 31 | |
| CLASS A | | 2019 | | | 2018 | | | 2017 | | | 2016 | | | 2015 | |
Net asset value, beginning of period | | | $30.27 | | | | $31.46 | | | | $28.92 | | | | $23.49 | | | | $25.50 | | | | $23.53 | |
Net investment income (loss) | | | 0.01 | 1 | | | (0.04 | )1 | | | (0.08 | )1 | | | (0.15 | )1 | | | 0.22 | 1 | | | 0.04 | |
Net realized and unrealized gains (losses) on investments | | | 0.41 | | | | (1.15 | ) | | | 2.62 | | | | 5.71 | | | | (2.09 | ) | | | 1.93 | |
| | | | | | | | | | | | | | | | | | | | | | | | |
Total from investment operations | | | 0.42 | | | | (1.19 | ) | | | 2.54 | | | | 5.56 | | | | (1.87 | ) | | | 1.97 | |
Distributions to shareholders from | | | | | | | | | | | | | | | | | | | | | | | | |
Net investment income | | | 0.00 | | | | 0.00 | | | | 0.00 | | | | (0.13 | ) | | | (0.14 | ) | | | 0.00 | |
Net asset value, end of period | | | $30.69 | | | | $30.27 | | | | $31.46 | | | | $28.92 | | | | $23.49 | | | | $25.50 | |
Total return2 | | | 1.39 | % | | | (3.78 | )% | | | 8.78 | % | | | 23.68 | % | | | (7.36 | )% | | | 8.37 | % |
Ratios to average net assets (annualized) | | | | | | | | | | | | | | | | | | | | | | | | |
Gross expenses | | | 1.59 | % | | | 1.54 | % | | | 1.54 | % | | | 1.48 | % | | | 1.47 | % | | | 1.46 | % |
Net expenses | | | 1.35 | % | | | 1.35 | % | | | 1.35 | % | | | 1.35 | % | | | 1.35 | % | | | 1.40 | % |
Net investment income (loss) | | | 0.03 | % | | | (0.11 | )% | | | (0.26 | )% | | | (0.57 | )% | | | 0.95 | % | | | 0.15 | % |
Supplemental data | | | | | | | | | | | | | | | | | | | | | | | | |
Portfolio turnover rate | | | 16 | % | | | 34 | % | | | 27 | % | | | 142 | % | | | 66 | % | | | 60 | % |
Net assets, end of period (000s omitted) | | | $42,017 | | | | $44,028 | | | | $50,993 | | | | $52,817 | | | | $49,898 | | | | $817 | |
| 1 | Calculated based upon average shares outstanding |
| 2 | Total return calculations do not include any sales charges. Returns for periods of less than one year are not annualized. |
The accompanying notes are an integral part of these financial statements.
14 | Wells Fargo Intrinsic Small Cap Value Fund
Financial highlights
(For a share outstanding throughout each period)
| | | | | | | | | | | | | | | | | | | | | | | | |
| | | Six months ended
September 30, 2019
(unaudited) | | | Year ended March 31 | |
| CLASS C | | 2019 | | | 2018 | | | 2017 | | | 2016 | | | 2015 | |
Net asset value, beginning of period | | | $27.98 | | | | $29.30 | | | | $27.14 | | | | $22.11 | | | | $24.04 | | | | $22.35 | |
Net investment loss | | | (0.11 | )1 | | | (0.25 | )1 | | | (0.28 | )1 | | | (0.39 | )1 | | | (0.00 | )1,2 | | | (0.14 | )1 |
Net realized and unrealized gains (losses) on investments | | | 0.39 | | | | (1.07 | ) | | | 2.44 | | | | 5.42 | | | | (1.93 | ) | | | 1.83 | |
| | | | | | | | | | | | | | | | | | | | | | | | |
Total from investment operations | | | 0.28 | | | | (1.32 | ) | | | 2.16 | | | | 5.03 | | | | (1.93 | ) | | | 1.69 | |
Net asset value, end of period | | | $28.26 | | | | $27.98 | | | | $29.30 | | | | $27.14 | | | | $22.11 | | | | $24.04 | |
Total return3 | | | 1.00 | % | | | (4.51 | )% | | | 7.96 | % | | | 22.75 | % | | | (8.03 | )% | | | 7.56 | % |
Ratios to average net assets (annualized) | | | | | | | | | | | | | | | | | | | | | | | | |
Gross expenses | | | 2.33 | % | | | 2.29 | % | | | 2.29 | % | | | 2.22 | % | | | 2.22 | % | | | 2.21 | % |
Net expenses | | | 2.10 | % | | | 2.10 | % | | | 2.10 | % | | | 2.10 | % | | | 2.12 | % | | | 2.15 | % |
Net investment loss | | | (0.75 | )% | | | (0.85 | )% | | | (1.02 | )% | | | (1.52 | )% | | | (0.00 | )% | | | (0.62 | )% |
Supplemental data | | | | | | | | | | | | | | | | | | | | | | | | |
Portfolio turnover rate | | | 16 | % | | | 34 | % | | | 27 | % | | | 142 | % | | | 66 | % | | | 60 | % |
Net assets, end of period (000s omitted) | | | $358 | | | | $526 | | | | $840 | | | | $989 | | | | $285 | | | | $304 | |
| 1 | Calculated based upon average shares outstanding |
| 2 | Amount is more than $(0.005). |
| 3 | Total return calculations do not include any sales charges. Returns for periods of less than one year are not annualized. |
The accompanying notes are an integral part of these financial statements.
Wells Fargo Intrinsic Small Cap Value Fund | 15
Financial highlights
(For a share outstanding throughout each period)
| | | | | | | | | | | | | | | | | | | | | | | | |
| | | Six months ended
September 30, 2019
(unaudited) | | | Year ended March 31 | |
| ADMINISTRATOR CLASS | | 2019 | | | 2018 | | | 2017 | | | 2016 | | | 2015 | |
Net asset value, beginning of period | | | $30.89 | | | | $32.06 | | | | $29.43 | | | | $23.89 | | | | $25.95 | | | | $23.90 | |
Net investment income (loss) | | | 0.03 | 1 | | | 0.01 | 1 | | | (0.03 | )1 | | | (0.10 | )1 | | | 0.22 | 1 | | | 0.07 | 1 |
Net realized and unrealized gains (losses) on investments | | | 0.43 | | | | (1.18 | ) | | | 2.66 | | | | 5.80 | | | | (2.08 | ) | | | 1.98 | |
| | | | | | | | | | | | | | | | | | | | | | | | |
Total from investment operations | | | 0.46 | | | | (1.17 | ) | | | 2.63 | | | | 5.70 | | | | (1.86 | ) | | | 2.05 | |
Distributions to shareholders from | | | | | | | | | | | | | | | | | | | | | | | | |
Net investment income | | | 0.00 | | | | 0.00 | | | | 0.00 | | | | (0.16 | ) | | | (0.20 | ) | | | 0.00 | |
Net asset value, end of period | | | $31.35 | | | | $30.89 | | | | $32.06 | | | | $29.43 | | | | $23.89 | | | | $25.95 | |
Total return2 | | | 1.49 | % | | | (3.65 | )% | | | 8.94 | % | | | 23.86 | % | | | (7.17 | )% | | | 8.58 | % |
Ratios to average net assets (annualized) | | | | | | | | | | | | | | | | | | | | | | | | |
Gross expenses | | | 1.51 | % | | | 1.46 | % | | | 1.46 | % | | | 1.40 | % | | | 1.37 | % | | | 1.30 | % |
Net expenses | | | 1.20 | % | | | 1.20 | % | | | 1.20 | % | | | 1.20 | % | | | 1.20 | % | | | 1.20 | % |
Net investment income (loss) | | | 0.18 | % | | | 0.05 | % | | | (0.10 | )% | | | (0.38 | )% | | | 0.91 | % | | | 0.27 | % |
Supplemental data | | | | | | | | | | | | | | | | | | | | | | | | |
Portfolio turnover rate | | | 16 | % | | | 34 | % | | | 27 | % | | | 142 | % | | | 66 | % | | | 60 | % |
Net assets, end of period (000s omitted) | | | $1,698 | | | | $1,165 | | | | $1,347 | | | | $4,355 | | | | $4,893 | | | | $5,110 | |
| 1 | Calculated based upon average shares outstanding |
| 2 | Returns for periods of less than one year are not annualized. |
The accompanying notes are an integral part of these financial statements.
16 | Wells Fargo Intrinsic Small Cap Value Fund
Financial highlights
(For a share outstanding throughout each period)
| | | | | | | | | | | | | | | | | | | | | | | | |
| | | Six months ended
September 30, 2019
(unaudited) | | | Year ended March 31 | |
| INSTITUTIONAL CLASS | | 2019 | | | 2018 | | | 2017 | | | 2016 | | | 2015 | |
Net asset value, beginning of period | | | $31.33 | | | | $32.45 | | | | $29.73 | | | | $24.13 | | | | $26.22 | | | | $24.19 | |
Net investment income (loss) | | | 0.06 | 1 | | | 0.08 | 1 | | | 0.03 | 1 | | | (0.07 | )1 | | | 0.33 | | | | 0.14 | 1 |
Net realized and unrealized gains (losses) on investments | | | 0.43 | | | | (1.20 | ) | | | 2.69 | | | | 5.89 | | | | (2.17 | ) | | | 1.99 | |
| | | | | | | | | | | | | | | | | | | | | | | | |
Total from investment operations | | | 0.49 | | | | (1.12 | ) | | | 2.72 | | | | 5.82 | | | | (1.84 | ) | | | 2.13 | |
Distributions to shareholders from | | | | | | | | | | | | | | | | | | | | | | | | |
Net investment income | | | 0.00 | | | | 0.00 | | | | 0.00 | | | | (0.22 | ) | | | (0.25 | ) | | | (0.10 | ) |
Net asset value, end of period | | | $31.82 | | | | $31.33 | | | | $32.45 | | | | $29.73 | | | | $24.13 | | | | $26.22 | |
Total return2 | | | 1.56 | % | | | (3.45 | )% | | | 9.15 | % | | | 24.14 | % | | | (7.02 | )% | | | 8.83 | % |
Ratios to average net assets (annualized) | | | | | | | | | | | | | | | | | | | | | | | | |
Gross expenses | | | 1.25 | % | | | 1.21 | % | | | 1.21 | % | | | 1.15 | % | | | 1.12 | % | | | 1.03 | % |
Net expenses | | | 1.00 | % | | | 1.00 | % | | | 1.00 | % | | | 1.00 | % | | | 1.00 | % | | | 1.00 | % |
Net investment income (loss) | | | 0.38 | % | | | 0.24 | % | | | 0.08 | % | | | (0.26 | )% | | | 1.10 | % | | | 0.57 | % |
Supplemental data | | | | | | | | | | | | | | | | | | | | | | | | |
Portfolio turnover rate | | | 16 | % | | | 34 | % | | | 27 | % | | | 142 | % | | | 66 | % | | | 60 | % |
Net assets, end of period (000s omitted) | | | $19,907 | | | | $21,398 | | | | $28,032 | | | | $59,991 | | | | $71,072 | | | | $84,563 | |
| 1 | Calculated based upon average shares outstanding |
| 2 | Returns for periods of less than one year are not annualized. |
The accompanying notes are an integral part of these financial statements.
Wells Fargo Intrinsic Small Cap Value Fund | 17
Notes to financial statements (unaudited)
1. ORGANIZATION
Wells Fargo Funds Trust (the “Trust”), a Delaware statutory trust organized on March 10, 1999, is an open-end management investment company registered under the Investment Company Act of 1940, as amended (the “1940 Act”). As an investment company, the Trust follows the accounting and reporting guidance in Financial Accounting Standards Board (“FASB”) Accounting Standards Codification Topic 946, Financial Services – Investment Companies. These financial statements report on the Wells Fargo Intrinsic Small Cap Value Fund (the “Fund”) which is a diversified series of the Trust.
2. SIGNIFICANT ACCOUNTING POLICIES
The following significant accounting policies, which are consistently followed in the preparation of the financial statements of the Fund, are in conformity with U.S. generally accepted accounting principles which require management to make estimates and assumptions that affect the reported amounts of assets and liabilities, disclosure of contingent assets and liabilities at the date of the financial statements, and the reported amounts of revenues and expenses during the reporting period. Actual results could differ from those estimates.
Securities valuation
All investments are valued each business day as of the close of regular trading on the New York Stock Exchange (generally 4 p.m. Eastern Time), although the Fund may deviate from this calculation time under unusual or unexpected circumstances.
Equity securities that are listed on a foreign or domestic exchange or market are valued at the official closing price or, if none, the last sales price. If no sale occurs on the principal exchange or market that day, a fair value price will be determined in accordance with the Fund’s Valuation Procedures.
Investments in registered open-end investment companies are valued at net asset value. Interests in non-registered investment companies that are redeemable at net asset value are fair valued normally at net asset value.
Investments which are not valued using any of the methods discussed above are valued at their fair value, as determined in good faith by the Board of Trustees of the Fund. The Board of Trustees has established a Valuation Committee comprised of the Trustees and has delegated to it the authority to take any actions regarding the valuation of portfolio securities that the Valuation Committee deems necessary or appropriate, including determining the fair value of portfolio securities, unless the determination has been delegated to the Wells Fargo Asset Management Pricing Committee at Wells Fargo Funds Management, LLC (“Funds Management”). The Board of Trustees retains the authority to make or ratify any valuation decisions or approve any changes to the Valuation Procedures as it deems appropriate. On a quarterly basis, the Board of Trustees receives reports on any valuation actions taken by the Valuation Committee or the Wells Fargo Asset Management Pricing Committee which may include items for ratification.
Securities lending
The Fund may lend its securities from time to time in order to earn additional income in the form of fees or interest on securities received as collateral or the investment of any cash received as collateral. When securities are on loan, the Fund receives interest or dividends on those securities. Cash collateral received in connection with its securities lending transactions is invested in Securities Lending Cash Investments, LLC (the “Securities Lending Fund”). Investments in Securities Lending Fund are valued at the evaluated bid price provided by an independent pricing service. Income earned from investment in the Securities Lending Fund (net of fees and rebates), if any, is included in income from affiliated securities on the Statement of Operations.
In a securities lending transaction, the net asset value of the Fund is affected by an increase or decrease in the value of the securities loaned and by an increase or decrease in the value of the instrument in which collateral is invested. The amount of securities lending activity undertaken by the Fund fluctuates from time to time. The Fund has the right under the lending agreement to recover the securities from the borrower on demand. In the event of default or bankruptcy by the borrower, the Fund may be prevented from recovering the loaned securities or gaining access to the collateral or may experience delays or costs in doing so. In such an event, the terms of the agreement allows the unaffiliated securities lending agent to use the collateral to purchase replacement securities on behalf of the Fund or pay the Fund the market value of the loaned securities. The Fund bears the risk of loss with respect to depreciation of its investment of the cash collateral.
Security transactions and income recognition
Securities transactions are recorded on a trade date basis. Realized gains or losses are recorded on the basis of identified cost.
Dividend income is recognized on the ex-dividend date.
18 | Wells Fargo Intrinsic Small Cap Value Fund
Notes to financial statements (unaudited)
Distributions to shareholders
Distributions to shareholders from net investment income and any net realized gains are recorded on the ex-dividend date and paid at least annually. Such distributions are determined in accordance with income tax regulations and may differ from U.S. generally accepted accounting principles. Dividend sources are estimated at the time of declaration. The tax character of distributions is determined as of the Fund’s fiscal year end. Therefore, a portion of the Fund’s distributions made prior to the Fund’s fiscal year end may be categorized as a tax return of capital at year end.
Federal and other taxes
The Fund intends to continue to qualify as a regulated investment company by distributing substantially all of its investment company taxable income and any net realized capital gains (after reduction for capital loss carryforwards) sufficient to relieve it from all, or substantially all, federal income taxes. Accordingly, no provision for federal income taxes was required.
The Fund’s income and federal excise tax returns and all financial records supporting those returns for the prior three fiscal years are subject to examination by the federal and Delaware revenue authorities. Management has analyzed the Fund’s tax positions taken on federal, state, and foreign tax returns for all open tax years and does not believe that there are any uncertain tax positions that require recognition of a tax liability.
As of September 30, 2019, the aggregate cost of all investments for federal income tax purposes was $56,845,077 and the unrealized gains (losses) consisted of:
| | | | |
| |
Gross unrealized gains | | $ | 13,173,581 | |
| |
Gross unrealized losses | | | (5,246,291 | ) |
| |
Net unrealized gains | | $ | 7,927,290 | |
Class allocations
The separate classes of shares offered by the Fund differ principally in applicable sales charges, distribution, shareholder servicing, and administration fees. Class specific expenses are charged directly to that share class. Investment income, common fund-level expenses, and realized and unrealized gains (losses) on investments are allocated daily to each class of shares based on the relative proportion of net assets of each class.
3. FAIR VALUATION MEASUREMENTS
Fair value measurements of investments are determined within a framework that has established a fair value hierarchy based upon the various data inputs utilized in determining the value of the Fund’s investments. The three-level hierarchy gives the highest priority to unadjusted quoted prices in active markets for identical assets or liabilities (Level 1) and the lowest priority to unobservable inputs (Level 3). The Fund’s investments are classified within the fair value hierarchy based on the lowest level of input that is significant to the fair value measurement. The inputs are summarized into three broad levels as follows:
| ∎ | | Level 1 – quoted prices in active markets for identical securities |
| ∎ | | Level 2 – other significant observable inputs (including quoted prices for similar securities, interest rates, prepayment speeds, credit risk, etc.) |
| ∎ | | Level 3 – significant unobservable inputs (including the Fund’s own assumptions in determining the fair value of investments) |
The inputs or methodologies used for valuing investments in securities are not necessarily an indication of the risk associated with investing in those securities.
Wells Fargo Intrinsic Small Cap Value Fund | 19
Notes to financial statements (unaudited)
The following is a summary of the inputs used in valuing the Fund’s assets and liabilities as of September 30, 2019:
| | | | | | | | | | | | | | | | |
| | | | |
| | | Quoted prices
(Level 1) | | | Other significant
observable inputs
(Level 2) | | | Significant
unobservable inputs
(Level 3) | | | Total | |
| | | | |
Assets | | | | | | | | | | | | | | | | |
Investments in: | | | | | | | | | | | | | | | | |
| | | | |
Common stocks | | | | | | | | | | | | | | | | |
| | | | |
Communication services | | $ | 748,704 | | | $ | 0 | | | $ | 0 | | | $ | 748,704 | |
| | | | |
Consumer discretionary | | | 5,795,780 | | | | 0 | | | | 0 | | | | 5,795,780 | |
| | | | |
Consumer staples | | | 801,973 | | | | 0 | | | | 0 | | | | 801,973 | |
| | | | |
Energy | | | 2,143,503 | | | | 0 | | | | 0 | | | | 2,143,503 | |
| | | | |
Financials | | | 16,031,310 | | | | 0 | | | | 0 | | | | 16,031,310 | |
| | | | |
Health care | | | 6,884,902 | | | | 0 | | | | 0 | | | | 6,884,902 | |
| | | | |
Industrials | | | 13,254,944 | | | | 0 | | | | 0 | | | | 13,254,944 | |
| | | | |
Information technology | | | 8,438,446 | | | | 0 | | | | 0 | | | | 8,438,446 | |
| | | | |
Materials | | | 2,271,688 | | | | 0 | | | | 0 | | | | 2,271,688 | |
| | | | |
Real estate | | | 5,941,331 | | | | 0 | | | | 0 | | | | 5,941,331 | |
| | | | |
Short-term investments | | | | | | | | | | | | | | | | |
| | | | |
Investment companies | | | 2,459,786 | | | | 0 | | | | 0 | | | | 2,459,786 | |
| | | | |
Total assets | | $ | 64,772,367 | | | $ | 0 | | | $ | 0 | | | $ | 64,772,367 | |
Additional sector, industry or geographic detail is included in the Portfolio of Investments.
For the six months ended September 30, 2019, the Fund did not have any transfers into/out of Level 3.
4. TRANSACTIONS WITH AFFILIATES
Management fee
Funds Management, an indirect wholly owned subsidiary of Wells Fargo & Company (“Wells Fargo”), is the manager of the Fund and provides advisory and fund-level administrative services under an investment management agreement. Under the investment management agreement, Funds Management is responsible for, among other services, implementing the investment objectives and strategies of the Fund, supervising the subadviser and providing fund-level administrative services in connection with the Fund’s operations. As compensation for its services under the investment management agreement, Funds Management is entitled to receive a management fee at the following annual rate based on the Fund’s average daily net assets:
| | | | |
| |
| Average daily net assets | | Management fee | |
| |
First $500 million | | | 0.850 | % |
| |
Next $500 million | | | 0.825 | |
| |
Next $1 billion | | | 0.800 | |
| |
Next $1 billion | | | 0.775 | |
| |
Next $1 billion | | | 0.750 | |
| |
Next $1 billion | | | 0.730 | |
| |
Next $5 billion | | | 0.720 | |
| |
Over $10 billion | | | 0.710 | |
For the six months ended September 30, 2019, the management fee was equivalent to an annual rate of 0.85% of the Fund’s average daily net assets.
Funds Management has retained the services of a subadviser to provide daily portfolio management to the Fund. The fee for subadvisory services is borne by Funds Management. Wells Capital Management Incorporated (“WellsCap”), an affiliate of Funds Management and an indirect wholly owned subsidiary of Wells Fargo, is the subadviser to the Fund and is entitled to receive a fee from Funds Management at an annual rate starting at 0.55% and declining to 0.40% as the average daily net assets of the Fund increase.
20 | Wells Fargo Intrinsic Small Cap Value Fund
Notes to financial statements (unaudited)
Administration fees
Under a class-level administration agreement, Funds Management provides class-level administrative services to the Fund, which includes paying fees and expenses for services provided by the transfer agent, sub-transfer agents, omnibus account servicers and record-keepers. As compensation for its services under the class-level administration agreement, Funds Management receives an annual fee which is calculated based on the average daily net assets of each class as follows:
| | | | |
| |
| | | Class-level
administration fee | |
| |
Class A, Class C | | | 0.21 | % |
| |
Administrator Class, Institutional Class | | | 0.13 | |
Waivers and/or expense reimbursements
Funds Management has contractually waived and/or reimbursed management and administration fees to the extent necessary to maintain certain net operating expense ratios for the Fund. When each class of the Fund has exceeded its expense cap, Funds Management has waived fees and/or reimbursed expenses from fund-level expenses on a proportionate basis and then from class specific expenses. When only certain classes exceed their expense caps, waivers and/or reimbursements are applied against class specific expenses before fund-level expenses. Funds Management has committed through July 31, 2020 to waive fees and/or reimburse expenses to the extent necessary to cap the Fund’s expenses at 1.35% for Class A shares, 2.10% for Class C shares, 1.20% for Administrator Class shares, and 1.00% for Institutional Class shares. Prior to or after the commitment expiration date, the cap may be increased or the commitment to maintain the cap may be terminated only with the approval of the Board of Trustees.
Distribution fee
The Trust has adopted a distribution plan for Class C shares of the Fund pursuant to Rule 12b-1 under the 1940 Act. A distribution fee is charged to Class C shares and paid to Wells Fargo Funds Distributor, LLC (“Funds Distributor”), the principal underwriter, at an annual rate of 0.75% of the average daily net assets of Class C shares.
In addition, Funds Distributor is entitled to receive the front-end sales charge from the purchase of Class A shares and a contingent deferred sales charge on the redemption of certain Class A shares. Funds Distributor is also entitled to receive the contingent deferred sales charges from redemptions of Class C shares. For the six months ended September 30, 2019, Funds Distributor received $100 from the sale of Class A shares. No contingent deferred sales charges were incurred by Class A and Class C shares for the six months ended September 30, 2019.
Shareholder servicing fees
The Trust has entered into contracts with one or more shareholder servicing agents, whereby Class A, Class C, and Administrator Class of the Fund are charged a fee at an annual rate of 0.25% of the average daily net assets of each respective class. A portion of these total shareholder servicing fees were paid to affiliates of Wells Fargo.
Interfund transactions
The Fund may purchase or sell portfolio investment securities to certain other Wells Fargo affiliates pursuant to Rule 17a-7 under the 1940 Act and under procedures adopted by the Board of Trustees. The procedures have been designed to ensure that these interfund transactions, which do not incur broker commissions, are effected at current market prices.
5. INVESTMENT PORTFOLIO TRANSACTIONS
Purchases and sales of investments, excluding U.S. government obligations (if any) and short-term securities, for the six months ended September 30, 2019 were $9,885,594 and $12,855,678, respectively.
6. SECURITIES LENDING TRANSACTIONS
The Fund lends its securities through an unaffiliated securities lending agent and receives collateral in the form of cash or securities with a value at least equal to the value of the securities on loan. The value of the loaned securities is determined at the close of each business day and any increases or decreases in the required collateral are exchanged between the Fund and the counterparty on the next business day. Cash collateral received is invested in the Securities Lending Fund which seeks to provide a positive return compared to the daily Fed Funds Open Rate by investing in high-quality, U.S. dollar-denominated short-term money market instruments and is exempt from registration under Section 3(c)(7) of the 1940 Act. Securities Lending Fund is managed by Funds Management and is subadvised by WellsCap. Funds Management receives an advisory fee starting at 0.05% and declining to 0.01% as the average daily net assets of the Securities Lending Fund increase. All of the fees received by Funds Management are paid to WellsCap for its services as subadviser.
Wells Fargo Intrinsic Small Cap Value Fund | 21
Notes to financial statements (unaudited)
In the event of counterparty default or the failure of a borrower to return a loaned security, the Fund has the right to use the collateral to offset any losses incurred. As of September 30, 2019, the Fund had securities lending transactions with the following counterparties which are subject to offset:
| | | | | | | | | | | | |
| | | |
| Counterparty | | Value of
securities
on loan | | | Collateral
received1 | | | Net amount | |
| | | |
Deutsche Bank Securities Inc. | | $ | 318,318 | | | $ | (318,318 | ) | | $ | 0 | |
| | | |
SG Americas Securities LLC | | | 349,440 | | | | (349,440 | ) | | | 0 | |
| 1 | Collateral received within this table is limited to the collateral for the net transaction with the counterparty. |
7. BANK BORROWINGS
The Trust (excluding the money market funds), Wells Fargo Master Trust and Wells Fargo Variable Trust are parties to a $280,000,000 revolving credit agreement whereby the Fund is permitted to use bank borrowings for temporary or emergency purposes, such as to fund shareholder redemption requests. Interest under the credit agreement is charged to the Fund based on a borrowing rate equal to the higher of the Federal Funds rate in effect on that day plus 1.25% or the overnight LIBOR rate in effect on that day plus 1.25%. In addition, an annual commitment fee equal to 0.25% of the unused balance is allocated to each participating fund.
For the six months ended September 30, 2019, there were no borrowings by the Fund under the agreement.
8. CONCENTRATION RISK
Concentration risks result from exposure to a limited number of sectors. As of the end of the period, the Fund invests a concentration of its portfolio in the financials sector. A fund that invests a substantial portion of its assets in any sector may be more affected by changes in that sector than would be a fund whose investments are not heavily weighted in any sector.
9. INDEMNIFICATION
Under the Trust’s organizational documents, the officers and Trustees have been granted certain indemnification rights against certain liabilities that may arise out of performance of their duties to the Trust. Additionally, in the normal course of business, the Trust may enter into contracts with service providers that contain a variety of indemnification clauses. The Trust’s maximum exposure under these arrangements is dependent on future claims that may be made against the Fund and, therefore, cannot be estimated.
10. NEW ACCOUNTING PRONOUNCEMENT
In August 2018, FASB issued Accounting Standards Update (“ASU”) No. 2018-13, Fair Value Measurement (Topic 820)Disclosure Framework—Changes to the Disclosure Requirements for Fair Value Measurement. ASU 2018-13 updates the disclosure requirements for fair value measurements by modifying or removing certain disclosures and adding certain new disclosures. The amendments are effective for fiscal years, and interim periods within those fiscal years, beginning after December 15, 2019. Early adoption is permitted. Management has adopted the removal and modification of disclosures early, as permitted, and will adopt the additional new disclosures at the effective date.
22 | Wells Fargo Intrinsic Small Cap Value Fund
Other information (unaudited)
PROXY VOTING INFORMATION
A description of the policies and procedures used to determine how to vote proxies relating to portfolio securities is available, upon request, by calling1-800-222-8222, visiting our website atwfam.com, or visiting the SEC website at sec.gov. Information regarding how the proxies related to portfolio securities were voted during the most recent 12-month period ended June 30 is available on the website atwfam.comor by visiting the SEC website at sec.gov.
QUARTERLY PORTFOLIO HOLDINGS INFORMATION
The Fund files its complete schedule of portfolio holdings with the SEC for the first and third quarters of each fiscal year on Form N-Q or Form N-PORT, which is available by visiting the SEC website at sec.gov. Those forms may be reviewed and copied at the SEC’s Public Reference Room in Washington, DC. Information on the operation of the Public Reference Room may be obtained by calling 1-800-SEC-0330.
Wells Fargo Intrinsic Small Cap Value Fund | 23
Other information (unaudited)
BOARD OF TRUSTEES AND OFFICERS
Each of the Trustees and Officers1 listed in the table below acts in identical capacities for each fund in the Wells Fargo family of funds, which consists of 150 mutual funds comprising the Wells Fargo Funds Trust, Wells Fargo Variable Trust, Wells Fargo Master Trust and four closed-end funds (collectively the “Fund Complex”). This table should be read in conjunction with the Prospectus and the Statement of Additional Information2. The mailing address of each Trustee and Officer is 525 Market Street, 12th Floor, San Francisco, CA 94105. Each Trustee and Officer serves an indefinite term, however, each Trustee serves such term until reaching the mandatory retirement age established by the Trustees.
Independent Trustees
| | | | | | |
Name and year of birth | | Position held and
length of service* | | Principal occupations during past five years or longer | | Current other
public company or
investment
company
directorships |
| | | |
William R. Ebsworth (Born 1957) | | Trustee, since 2015 | | Retired. From 1984 to 2013, equities analyst, portfolio manager, research director and chief investment officer at Fidelity Management and Research Company in Boston, Tokyo, and Hong Kong, and retired in 2013 as Chief Investment Officer of Fidelity Strategic Advisers, Inc. where he led a team of investment professionals managing client assets. Prior thereto, Board member of Hong Kong Securities Clearing Co., Hong Kong Options Clearing Corp., the Thailand International Fund, Ltd., Fidelity Investments Life Insurance Company, and Empire Fidelity Investments Life Insurance Company. Audit Committee Chair and Investment Committee Chair of the Vincent Memorial Hospital Endowment (non-profit organization). Mr. Ebsworth is a CFA® charterholder. | | N/A |
| | | |
Jane A. Freeman (Born 1953) | | Trustee, since 2015; Chair Liaison, since 2018 | | Retired. From 2012 to 2014 and 1999 to 2008, Chief Financial Officer of Scientific Learning Corporation. From 2008 to 2012, Ms. Freeman provided consulting services related to strategic business projects. Prior to 1999, Portfolio Manager at Rockefeller & Co. and Scudder, Stevens & Clark. Board member of the Harding Loevner Funds from 1996 to 2014, serving as both Lead Independent Director and chair of the Audit Committee. Board member of the Russell Exchange Traded Funds Trust from 2011 to 2012 and the chair of the Audit Committee. Ms. Freeman is a Board Member of The Ruth Bancroft Garden (non-profit organization). She is also an inactive Chartered Financial Analyst. | | N/A |
| | | |
Isaiah Harris, Jr. (Born 1952) | | Trustee, since 2009; Audit Committee Chairman, since 2019 | | Retired. Chairman of the Board of CIGNA Corporation since 2009, and Director since 2005. From 2003 to 2011, Director of Deluxe Corporation. Prior thereto, President and CEO of BellSouth Advertising and Publishing Corp. from 2005 to 2007, President and CEO of BellSouth Enterprises from 2004 to 2005 and President of BellSouth Consumer Services from 2000 to 2003. Emeritus member of the Iowa State University Foundation Board of Governors. Emeritus Member of the Advisory Board of Iowa State University School of Business. Advisory Board Member, Palm Harbor Academy (private school). Advisory Board Member, Child Evangelism Fellowship (non-profit). Mr. Harris is a certified public accountant (inactive status). | | CIGNA Corporation |
| | | |
Judith M. Johnson (Born 1949) | | Trustee, since 2008; Audit Committee Chairman, from 2009 to 2018 | | Retired. Prior thereto, Chief Executive Officer and Chief Investment Officer of Minneapolis Employees Retirement Fund from 1996 to 2008. Ms. Johnson is an attorney, certified public accountant and a certified managerial accountant. | | N/A |
24 | Wells Fargo Intrinsic Small Cap Value Fund
Other information (unaudited)
| | | | | | |
Name and year of birth | | Position held and
length of service* | | Principal occupations during past five years or longer | | Current other
public company or
investment
company
directorships |
| | | |
David F. Larcker (Born 1950) | | Trustee, since 2009 | | James Irvin Miller Professor of Accounting at the Graduate School of Business, Stanford University, Director of the Corporate Governance Research Initiative and Senior Faculty of The Rock Center for Corporate Governance since 2006. From 2005 to 2008, Professor of Accounting at the Graduate School of Business, Stanford University. Prior thereto, Ernst & Young Professor of Accounting at The Wharton School, University of Pennsylvania from 1985 to 2005. | | N/A |
| | | |
Olivia S. Mitchell (Born 1953) | | Trustee, since 2006; Nominating and Governance Committee Chairman, since 2018 | | International Foundation of Employee Benefit Plans Professor, Wharton School of the University of Pennsylvania since 1993. Director of Wharton’s Pension Research Council and Boettner Center on Pensions & Retirement Research, and Research Associate at the National Bureau of Economic Research. Previously, Cornell University Professor from 1978 to 1993. | | N/A |
| | | |
Timothy J. Penny (Born 1951) | | Trustee, since 1996; Chairman, since 2018 | | President and Chief Executive Officer of Southern Minnesota Initiative Foundation, a non-profit organization, since 2007. Member of the Board of Trustees of NorthStar Education Finance, Inc., a non-profit organization, since 2007. | | N/A |
| | | |
James G. Polisson (Born 1959) | | Trustee, since 2018 | | Retired. Chief Marketing Officer, Source (ETF) UK Services, Ltd, from 2015 to 2017. From 2012 to 2015, Principal of The Polisson Group, LLC, a management consulting, corporate advisory and principal investing company. Chief Executive Officer and Managing Director at Russell Investments, Global Exchange Traded Funds from 2010 to 2012. Managing Director of Barclays Global Investors from 1998 to 2010 and Global Chief Marketing Officer for iShares and Barclays Global Investors from 2000 to 2010. Trustee of the San Francisco Mechanics’ Institute, a non-profit organization, from 2013 to 2015. Board member of the Russell Exchange Traded Fund Trust from 2011 to 2012. Director of Barclays Global Investors Holdings Deutschland GmbH from 2006 to 2009. Mr. Polisson is an attorney and has a retired status with the Massachusetts and District of Columbia Bar Associations. | | N/A |
| * | Length of service dates reflect the Trustee’s commencement of service with the Trust’s predecessor entities, where applicable. |
Wells Fargo Intrinsic Small Cap Value Fund | 25
Other information (unaudited)
Officers
| | | | |
Name and year of birth | | Position held and
length of service | | Principal occupations during past five years or longer |
| | |
Andrew Owen (Born 1960) | | President, since 2017 | | Executive Vice President of Wells Fargo & Company and Head of Affiliated Managers, Wells Fargo Asset Management, since 2014. In addition, Mr. Owen is currently President, Chief Executive Officer and Director of Wells Fargo Funds Management, LLC since 2017. Prior thereto, Executive Vice President responsible for marketing, investments and product development for Wells Fargo Funds Management, LLC, from 2009 to 2014. |
| | |
Nancy Wiser1 (Born 1967) | | Treasurer, since 2012 | | Executive Vice President of Wells Fargo Funds Management, LLC since 2011. Chief Operating Officer and Chief Compliance Officer at LightBox Capital Management LLC, from 2008 to 2011. |
| | |
Michelle Rhee3 (Born 1966) | | Chief Legal Officer, since 2019 | | Secretary of Wells Fargo Funds Management, LLC, Chief Legal Counsel of Wells Fargo Asset Management and Assistant General Counsel of Wells Fargo Bank, N.A. since 2018. Associate General Counsel and Managing Director of Bank of America Corporation from 2004 to 2018. |
| | |
Catherine Kennedy4 (Born 1969) | | Secretary, since 2019 | | Vice President of Wells Fargo Funds Management, LLC and Senior Counsel of the Wells Fargo Legal Department since 2010. Vice President and Senior Counsel of Evergreen Investment Management Company, LLC from 1998 to 2010. |
| | |
Michael H. Whitaker (Born 1967) | | Chief Compliance Officer, since 2016 | | Chief Compliance Officer of Wells Fargo Asset Management since 2016. Senior Vice President and Chief Compliance Officer for Fidelity Investments from 2007 to 2016. |
| | |
David Berardi (Born 1975) | | Assistant Treasurer, since 2009 | | Vice President of Wells Fargo Funds Management, LLC since 2009. Vice President of Evergreen Investment Management Company, LLC from 2008 to 2010. Manager of Fund Reporting and Control for Evergreen Investment Management Company, LLC from 2004 to 2010. |
| | |
Jeremy DePalma1 (Born 1974) | | Assistant Treasurer, since 2009 | | Senior Vice President of Wells Fargo Funds Management, LLC since 2009. Senior Vice President of Evergreen Investment Management Company, LLC from 2008 to 2010 and head of the Fund Reporting and Control Team within Fund Administration from 2005 to 2010. |
| 1 | Nancy Wiser acts as Treasurer of 64 funds in the Fund Complex. Jeremy DePalma acts as Treasurer of 86 funds and Assistant Treasurer of 64 funds in the Fund Complex. |
| 2 | The Statement of Additional Information includes additional information about the Trustees and is available, without charge, upon request, by calling1-800-222-8222 or by visiting the website atwfam.com. |
| 3 | Michelle Rhee became Chief Legal Officer effective October 22, 2019. |
| 4 | Catherine Kennedy became Secretary effective October 22, 2019. |
26 | Wells Fargo Intrinsic Small Cap Value Fund
Other information (unaudited)
BOARD CONSIDERATION OF INVESTMENT MANAGEMENT AND SUB-ADVISORY AGREEMENTS:
Wells Fargo Intrinsic Small Cap Value Fund
Under the Investment Company Act of 1940 (the “1940 Act”), the Board of Trustees (the “Board”) of Wells Fargo Funds Trust (the “Trust”) must determine annually whether to approve the continuation of the Trust’s investment management and sub-advisory agreements. In this regard, at an in-person meeting held on May 21-22, 2019 (the “Meeting”), the Board, all the members of which have no direct or indirect interest in the investment management and sub-advisory agreements and are not “interested persons” of the Trust, as defined in the 1940 Act (the “Independent Trustees”), reviewed and approved for Wells Fargo Intrinsic Small Cap Value Fund (the “Fund”): (i) an investment management agreement (the “Management Agreement”) with Wells Fargo Funds Management, LLC (“Funds Management”); and (ii) an investment sub-advisory agreement (the “Sub-Advisory Agreement”) with Wells Capital Management Incorporated (the “Sub-Adviser”), an affiliate of Funds Management. The Management Agreement and the Sub-Advisory Agreement are collectively referred to as the “Advisory Agreements.”
At the Meeting, the Board considered the factors and reached the conclusions described below relating to the selection of Funds Management and the Sub-Adviser and the approval of the Advisory Agreements. Prior to the Meeting, including at an in-person meeting in April 2019, the Trustees conferred extensively among themselves and with representatives of Funds Management about these matters. Also, the Board has adopted a team-based approach, with each team consisting of a sub-set of Trustees, to assist the full Board in the discharge of its duties in reviewing investment performance and other matters throughout the year. The Independent Trustees were assisted in their evaluation of the Advisory Agreements by independent legal counsel, from whom they received separate legal advice and with whom they met separately.
In providing information to the Board, Funds Management and the Sub-Adviser were guided by a detailed set of requests for information submitted to them by independent legal counsel on behalf of the Independent Trustees at the start of the Board’s annual contract renewal process earlier in 2019. In considering and approving the Advisory Agreements, the Trustees considered the information they believed relevant, including but not limited to the information discussed below. The Board considered not only the specific information presented in connection with the Meeting, but also the knowledge gained over time through interaction with Funds Management and the Sub-Adviser about various topics. In this regard, the Board reviewed reports of Funds Management at each of its quarterly meetings, which included, among other things, portfolio reviews and investment performance reports. In addition, the Board and the teams mentioned above confer with portfolio managers at various times throughout the year. The Board did not identify any particular information or consideration that was all-important or controlling, and each individual Trustee may have attributed different weights to various factors.
After its deliberations, the Board unanimously approved the continuation of the Advisory Agreements for a one-year term and determined that the compensation payable to Funds Management and the Sub-Adviser under each of the Advisory Agreements was reasonable. The Board considered the approval of the Advisory Agreements for the Fund as part of its consideration of agreements for funds across the complex, but its approvals were made on a fund-by-fund basis. The following summarizes a number of important, but not necessarily all, factors considered by the Board in support of its approvals.
Nature, extent and quality of services
The Board received and considered various information regarding the nature, extent and quality of services provided to the Fund by Funds Management and the Sub-Adviser under the Advisory Agreements. This information included a description of the investment advisory services and Fund-level administrative services covered by the Management Agreement, as well as, among other things, a summary of the background and experience of senior management of Wells Fargo Asset Management (“WFAM”), of which Funds Management and the Sub-Adviser are a part, a summary of investments made in the business of WFAM, a summary of certain organizational and personnel changes involving Funds Management and the Sub-Adviser, and a description of Funds Management’s and the Sub-Adviser’s business continuity planning programs and of their approaches to data privacy and cybersecurity. The Board received and reviewed information about Funds Management’s role as administrator of the Fund’s liquidity risk management program. The Board also considered the qualifications, background, tenure and responsibilities of each of the portfolio managers primarily responsible for the day-to-day portfolio management of the Fund.
The Board evaluated the ability of Funds Management and the Sub-Adviser to attract and retain qualified investment professionals, including research, advisory and supervisory personnel. The Board further considered the compliance programs and compliance records of Funds Management and the Sub-Adviser. In addition, the Board took into account the full range of services provided to the Fund by Funds Management and its affiliates.
Wells Fargo Intrinsic Small Cap Value Fund | 27
Other information (unaudited)
Fund investment performance and expenses
The Board considered the investment performance results for the Fund over various time periods ended December 31, 2018. The Board considered these results in comparison to the investment performance of funds in a universe that was determined by Broadridge Inc. (“Broadridge”) to be similar to the Fund (the “Universe”), and in comparison to the Fund’s benchmark index and to other comparative data. Broadridge is an independent provider of investment company data. The Board received a description of the methodology used by Broadridge to select the mutual funds in the performance Universe. The Board noted that the investment performance of the Fund (Administrator Class) was lower than the average investment performance of the Universe for all periods under review. The Board also noted that the investment performance of the Fund was lower than its benchmark index, the Russell 2000® Value Index, for the one-, three- and five-year periods under review, but in range of its benchmark for the ten-year period under review.
The Board received information concerning, and discussed factors contributing to, the underperformance of the Fund relative to the Universe and benchmark for the periods identified above. The Board took note of the explanations for the relative underperformance during these periods, including with respect to investment decisions and market factors that affected the Fund’s investment performance. The Board also noted that the Fund had changed sub-advisers in September 2016.
The Board also received and considered information regarding the Fund’s net operating expense ratios and their various components, including actual management fees, custodian and other non-management fees, and Rule 12b-1 and non-Rule 12b-1 shareholder service fees. The Board considered these ratios in comparison to the median ratios of funds in class-specific expense groups that were determined by Broadridge to be similar to the Fund (the “Groups”). The Board received a description of the methodology used by Broadridge to select the mutual funds in the expense Groups and an explanation of how funds comprising expense groups and their expense ratios may vary from year-to-year. Based on the Broadridge reports, the Board noted that the net operating expense ratios of the Fund were in range of, lower than, or equal to the median net operating expense ratios of the expense Groups for each share class.
The Board took into account the Fund’s investment performance and expense information provided to it among the factors considered in deciding to re-approve the Advisory Agreements.
Investment management and sub-advisory fee rates
The Board reviewed and considered the contractual fee rates payable by the Fund to Funds Management under the Management Agreement, as well as the contractual fee rates payable by the Fund to Funds Management for class-level administrative services under a Class-Level Administration Agreement, which include, among other things, class-level transfer agency and sub-transfer agency costs (collectively, the “Management Rates”). The Board also reviewed and considered the contractual investment sub-advisory fee rates that are payable by Funds Management to the Sub-Adviser for investment sub-advisory services.
Among other information reviewed by the Board was a comparison of the Fund’s Management Rates with the average contractual investment management fee rates of funds in the expense Groups at a common asset level as well as transfer agency costs of the funds in the expense Groups. The Board noted that the Management Rates of the Fund were in range of or lower than the sum of these average rates for the Fund’s expense Groups for all share classes.
The Board also received and considered information about the portion of the total management fee that was retained by Funds Management after payment of the fee to the Sub-Adviser for sub-advisory services. In assessing the reasonableness of this amount, the Board received and evaluated information about the nature and extent of responsibilities retained and risks assumed by Funds Management and not delegated to or assumed by the Sub-Adviser, and about Funds Management’s on-going oversight services. Given the affiliation between Funds Management and the Sub-Adviser, the Board ascribed limited relevance to the allocation of fees between them.
The Board also received and considered information about the nature and extent of services offered and fee rates charged by Funds Management and the Sub-Adviser to other types of clients with investment strategies similar to those of the Fund. In this regard, the Board received information about the significantly greater scope of services, and compliance, reporting and other legal burdens and risks of managing proprietary mutual funds compared with those associated with managing assets of other types of clients, including third-party sub-advised fund clients and non-mutual fund clients such as institutional separate accounts.
Based on its consideration of the factors and information it deemed relevant, including those described here, the Board determined that the compensation payable to Funds Management under the Management Agreement and to the Sub-Adviser under the Sub-Advisory Agreement was reasonable.
28 | Wells Fargo Intrinsic Small Cap Value Fund
Other information (unaudited)
Profitability
The Board received and considered information concerning the profitability of Funds Management, as well as the profitability of both WFAM and Wells Fargo & Co. (“Wells Fargo”) from providing services to the fund family as a whole. The Board noted that the Sub-Adviser’s profitability information with respect to providing services to the Fund and other funds in the family was subsumed in the WFAM and Wells Fargo profitability analysis.
Funds Management reported on the methodologies and estimates used in calculating profitability, including a description of the methodology used to allocate certain expenses. Among other things, the Board noted that the levels of profitability reported on a fund-by-fund basis varied widely, depending on factors such as the size, type and age of fund. Based on its review, the Board did not deem the profits reported by Funds Management, WFAM or Wells Fargo from services provided to the Fund to be at a level that would prevent it from approving the continuation of the Advisory Agreements.
Economies of scale
The Board received and considered information about the potential for Funds Management to experience economies of scale in the provision of management services to the Fund, the difficulties of calculating economies of scale at an individual fund level, and the extent to which potential scale benefits are shared with shareholders. The Board noted the existence of breakpoints in the Fund’s management fee structure, which operate generally to reduce the Fund’s expense ratios as the Fund grows in size. The Board considered that in addition to management fee breakpoints, Funds Management shares potential economies of scale from its management business in a variety of ways, including through fee waiver and expense reimbursement arrangements, services that benefit shareholders, competitive management fee rates set at the outset without regard to breakpoints, and investments in the business intended to enhance services available to shareholders.
The Board concluded that Funds Management’s arrangements with respect to the Fund, including contractual breakpoints, constituted a reasonable approach to sharing potential economies of scale with the Fund and its shareholders.
Other benefits to Funds Management and the Sub-Adviser
The Board received and considered information regarding potential “fall-out” or ancillary benefits received by Funds Management and its affiliates, including the Sub-Adviser, as a result of their relationships with the Fund. Ancillary benefits could include, among others, benefits directly attributable to other relationships with the Fund and benefits potentially derived from an increase in Funds Management’s and the Sub-Adviser’s business as a result of their relationships with the Fund. The Board noted that various affiliates of Funds Management may receive distribution-related fees, shareholder servicing payments and sub-transfer agency fees in respect of shares sold or held through them and services provided.
The Board also reviewed information about soft dollar credits earned and utilized by the Sub-Adviser, fees earned by Funds Management and the Sub-Adviser from managing a private investment vehicle for the fund family’s securities lending collateral, and commissions earned by an affiliated broker from portfolio transactions.
Based on its consideration of the factors and information it deemed relevant, including those described here, the Board did not find that any ancillary benefits received by Funds Management and its affiliates, including the Sub-Adviser, were unreasonable.
Conclusion
At the Meeting, after considering the above-described factors and based on its deliberations and its evaluation of the information described above, the Board unanimously approved the continuation of the Advisory Agreements for a one-year term and determined that the compensation payable to Funds Management and the Sub-Adviser under each of the Advisory Agreements was reasonable.
Wells Fargo Intrinsic Small Cap Value Fund | 29
This page is intentionally left blank.
This page is intentionally left blank.
This page is intentionally left blank.

For more information
More information about Wells Fargo Funds is available free upon request. To obtain literature, please write, visit the Fund’s website, or call:
Wells Fargo Funds
P.O. Box 219967
Kansas City, MO 64121-9967
Website:wfam.com
Individual investors:1-800-222-8222
Retail investment professionals:1-888-877-9275
Institutional investment professionals:1-866-765-0778

This report and the financial statements contained herein are submitted for the general information of the shareholders of the Fund. If this report is used for promotional purposes, distribution of the report must be accompanied or preceded by a current prospectus. Before investing, please consider the investment objectives, risks, charges, and expenses of the investment. For a current prospectus and, if available, a summary prospectus, containing this information, call1-800-222-8222 or visit the Fund’s website atwfam.com. Read the prospectus carefully before you invest or send money.
Wells Fargo Asset Management (WFAM) is the trade name for certain investment advisory/management firms owned by Wells Fargo & Company. These firms include but are not limited to Wells Capital Management Incorporated and Wells Fargo Funds Management, LLC. Certain products managed by WFAM entities are distributed by Wells Fargo Funds Distributor, LLC (a broker-dealer and Member FINRA).
This material is for general informational and educational purposes only and is NOT intended to provide investment advice or a recommendation of any kind—including a recommendation for any specific investment, strategy, or plan.
INVESTMENT PRODUCTS: NOT FDIC INSURED ◾ NO BANK GUARANTEE ◾ MAY LOSE VALUE
© 2019 Wells Fargo & Company. All rights reserved.
406818 11-19
SA242/SAR242 09-19
Semi-Annual Report
September 30, 2019
Wells Fargo Disciplined Small Cap Fund
Beginning on January 1, 2021, as permitted by new regulations adopted by the Securities and Exchange Commission, paper copies of the Wells Fargo Funds’ annual and semi-annual shareholder reports issued after this date will no longer be sent by mail, unless you specifically request paper copies of the reports. Instead, the reports will be made available on the Funds’ website, and you will be notified by mail each time a report is posted and provided with a website address to access the report.
If you already elected to receive shareholder reports electronically, you will not be affected by this change and you need not take any action. You may elect to receive shareholder reports and other communications from the Fund electronically at any time by contacting your financial intermediary (such as a broker-dealer or bank) or, if you are a direct investor, by calling1-800-222-8222 or by enrolling at wellsfargo.com/advantagedelivery.
You may elect to receive all future reports in paper free of charge. If you invest through a financial intermediary, you can contact your financial intermediary to request that you continue to receive paper copies of your shareholder reports; if you invest directly with the Fund, you can call 1-800-222-8222. Your election to receive reports in paper will apply to all Wells Fargo Funds held in your account with your financial intermediary or, if you are a direct investor, to all Wells Fargo Funds that you hold.
|
|
|
Reduce clutter. Save trees. |
Sign up for electronic delivery of prospectuses and shareholder reports atwellsfargo.com/advantagedelivery |
The views expressed and any forward-looking statements are as of September 30, 2019, unless otherwise noted, and are those of the Fund managers and/or Wells Fargo Asset Management. Discussions of individual securities, or the markets generally, or any Wells Fargo Fund are not intended as individual recommendations. Future events or results may vary significantly from those expressed in any forward-looking statements. The views expressed are subject to change at any time in response to changing circumstances in the market. Wells Fargo Asset Management and the Fund disclaim any obligation to publicly update or revise any views expressed or forward-looking statements.
INVESTMENT PRODUCTS: NOT FDIC INSURED ◾ NO BANK GUARANTEE ◾ MAY LOSE VALUE
Wells Fargo Disciplined Small Cap Fund | 1
Letter to shareholders (unaudited)

Andrew Owen
President
Wells Fargo Funds
“During the third quarter of 2019, investors regrouped.”
Dear Shareholder:
We are pleased to offer you this semi-annual report for the Wells Fargo Disciplined Small Cap Fund for the six-month period that ended September 30, 2019. U.S. stock and global bond investors generally saw markets recover during the second half amid intensifying market volatility, global economic growth concerns, international trade stare downs, and simmering geopolitical tensions.
Overall, fixed income kept pace with domestic stocks and outperformed foreign equities. For the period, U.S. stocks, based on the S&P 500 Index,1 gained 6.08% and international stocks, as measured by the MSCI ACWI ex USA Index (Net),2 added 1.13%. The MSCI EM Index (Net)3 fell by 3.66%. Among fixed income investors, the Bloomberg Barclays U.S. Aggregate Bond Index4 added 5.42%, the Bloomberg Barclays Global Aggregate ex-USD Index5 gained 2.82%, the Bloomberg Barclays Municipal Bond Index6 increased 3.74%, and the ICE BofAML U.S. High Yield Index7 was up 3.82%.
Early second-quarter 2019 investor enthusiasm faded as the quarter wore on.
During April 2019, favorable sentiment found additional support in reports of sustained low inflation, solid employment data, and first-quarter U.S. gross domestic product growth at an annualized rate of 3.2%. During May, markets tumbled on mixed investment signals. In the U.S., partisan wrangling ramped up as Democrats and Republicans set their sights on 2020 presidential politics. The U.K.’s Brexit disagreements caused Prime Minister Theresa May to resign. Boris Johnson succeeded her only to exacerbate uncertainty about Brexit’s resolution ahead of an October 2019 deadline. The European Commission downgraded the 2019 growth forecast to 1.2%. The U.S. increased tariffs on products from China, China responded, and then talks broke down. President Donald Trump threatened to turn his foreign policy tariff tool to Mexico over immigration issues.
During the third quarter of 2019, investors regrouped. Just as the investment horizon appeared to darken, sentiment turned and U.S. equity markets gained during June and July. The gains, primarily driven by geopolitical and monetary policy events, pushed equity markets to new highs. European Central Bank President Mario Draghi said that if the outlook doesn’t improve, the bank would cut rates or buy more assets to prop up inflation. President Trump backed off of tariff threats against Mexico and China. In the U.S., the Federal Reserve (Fed) implemented a 0.25% federal funds rate cut in July.
| 1 | The S&P 500 Index consists of 500 stocks chosen for market size, liquidity, and industry group representation. It is a market-value-weighted index with each stock’s weight in the index proportionate to its market value. You cannot invest directly in an index. |
| 2 | The Morgan Stanley Capital International (MSCI) All Country World Index (ACWI) ex USA Index (Net) is a free-float-adjusted market-capitalization weighted index that is designed to measure the equity market performance of developed and emerging markets, excluding the U.S. Source: MSCI. MSCI makes no express or implied warranties or representations and shall have no liability whatsoever with respect to any MSCI data contained herein. The MSCI data may not be further redistributed or used as a basis for other indices or any securities or financial products. This report is not approved, reviewed, or produced by MSCI. You cannot invest directly in an index. |
| 3 | The MSCI Emerging Markets (EM) Index (Net) is a free-float-adjusted market-capitalization-weighted index that is designed to measure the equity market performance of emerging markets. You cannot invest directly in an index. |
| 4 | The Bloomberg Barclays U.S. Aggregate Bond Index is a broad-based benchmark that measures the investment-grade, U.S. dollar-denominated, fixed-rate taxable bond market, including Treasuries, government-related and corporate securities, mortgage-backed securities (agency fixed-rate and hybrid adjustable-rate mortgage pass-throughs), asset-backed securities, and commercial mortgage-backed securities. You cannot invest directly in an index. |
| 5 | The Bloomberg Barclays Global Aggregate ex-USD Index is an unmanaged index that provides a broad-based measure of the global investment-grade fixed-income markets excluding the U.S. dollar-denominated debt market. You cannot invest directly in an index. |
| 6 | The Bloomberg Barclays Municipal Bond Index is an unmanaged index composed of long-term tax-exempt bonds with a minimum credit rating of Baa. You cannot invest directly in an index. |
| 7 | The ICE BofAML U.S. High Yield Index is a market-capitalization-weighted index of domestic and Yankee high-yield bonds. The index tracks the performance of high-yield securities traded in the U.S. bond market. You cannot invest directly in an index. Copyright 2019. ICE Data Indices, LLC. All rights reserved. |
2 | Wells Fargo Disciplined Small Cap Fund
Letter to shareholders (unaudited)
Later in July 2019, the U.S. reversed course and threatened to impose higher tariffs on China’s exports after talks failed. China responded with tariff threats of its own and devalued the renminbi, a move that roiled global markets. Major U.S. stock market indices closed July with the worst weekly results of the year. Bond prices gained as Treasury yields fell to levels not seen since November 2016 and the yield curve inverted at multiple points along the 30-year arc.
In a microcosm, August encapsulated many of the unnerving events that plagued investors during the prior 11 months. The U.S.-China trade relationship swung from antagonistic to hopeful and back again with no evident compromise on the horizon. Evidence of a continued global economic slowdown mounted. Central banks in China, New Zealand, and Thailand cut interest rates. Industrial and manufacturing data declined in China, Canada, Japan, and Germany. Adding to the uncertain environment, Italy’s prime minister resigned, many feared a crackdown in Hong Kong as protesters sustained their calls for reform throughout the month, and Boris Johnson planned to suspend Parliament as Brexit’s deadline neared.
In the U.S., September saw the Fed join other central banks in cutting interest rates. Manufacturing data in the U.S., as reported by the Institute for Supply Management, disappointed investors. The U.S. Congress announced it would pursue an impeachment investigation of President Trump. Meanwhile, the Brexit impasse showed no signs of resolution. Officials in China said that hitting the country’s economic growth goals for the year would be difficult considering the weight of tariffs and trade restrictions. So while the S&P 500 Index finished the third quarter with year-to-date returns that were the best in more than 20 years, amid signs of equity investors taking money out of the stock market, concerns about future returns remained.
Don’t let short-term uncertainty derail long-term investment goals.
Periods of investment uncertainty can present challenges, but experience has taught us that maintaining long-term investment goals can be an effective way to plan for the future. To help you create a sound strategy based on your personal goals and risk tolerance, Wells Fargo Funds offers more than 100 mutual funds spanning a wide range of asset classes and investment styles. Although diversification cannot guarantee an investment profit or prevent losses, we believe it can be an effective way to manage investment risk and potentially smooth out overall portfolio performance. We encourage investors to know their investments and to understand that appropriate levels of risk-taking may unlock opportunities.
Thank you for choosing to invest with Wells Fargo Funds. We appreciate your confidence in us and remain committed to helping you meet your financial needs.
Sincerely,

Andrew Owen
President
Wells Fargo Funds
“In the U.S., September saw the Fed join other central banks in cutting interest rates.”
|
|
|
For further information about your Fund, contact your investment professional, visit our website at wfam.com, or call us directly at1-800-222-8222. |
Wells Fargo Disciplined Small Cap Fund | 3
Performance highlights (unaudited)
Investment objective
The Fund seeks long-term capital appreciation.
Manager
Wells Fargo Funds Management, LLC
Subadviser
Wells Capital Management Incorporated
Portfolio managers
Justin P. Carr, CFA®‡
Robert M. Wicentowski, CFA®‡
Average annual total returns (%) as of September 30, 2019
| | | | | | | | | | | | | | | | | | | | | | | | | | | | | | | | | | |
| | | | |
| | | | | Including sales charge | | | Excluding sales charge | | | Expense ratios1 (%) | |
| | | | | | | | | |
| | | Inception date | | 1 year | | | 5 year | | | 10 year | | | 1 year | | | 5 year | | | 10 year | | | Gross | | | Net2 | |
| | | | | | | | | | |
| Class A (WDSAX)3 | | 7-31-2018 | | | -16.97 | | | | 4.97 | | | | 8.93 | | | | -11.90 | | | | 6.22 | | | | 9.58 | | | | 1.14 | | | | 0.96 | |
| | | | | | | | | | |
| Class R6 (WSCJX)4 | | 10-31-2016 | | | – | | | | – | | | | – | | | | -12.21 | | | | 6.40 | | | | 9.67 | | | | 0.71 | | | | 0.53 | |
| | | | | | | | | | |
| Administrator Class (NVSOX) | | 8-1-1993 | | | – | | | | – | | | | – | | | | -12.44 | | | | 6.10 | | | | 9.52 | | | | 1.06 | | | | 0.88 | |
| | | | | | | | | | |
| Institutional Class (WSCOX)5 | | 10-31-2014 | | | – | | | | – | | | | – | | | | -12.22 | | | | 6.36 | | | | 9.65 | | | | 0.81 | | | | 0.63 | |
| | | | | | | | | | |
| Russell 2000® Index6 | | – | | | – | | | | – | | | | – | | | | -8.89 | | | | 8.19 | | | | 11.19 | | | | – | | | | – | |
Figures quoted represent past performance, which is no guarantee of future results, and do not reflect taxes that a shareholder may pay on fund distributions or the redemption of fund shares. Investment return and principal value of an investment will fluctuate so that an investor’s shares, when redeemed, may be worth more or less than their original cost. Performance shown without sales charges would be lower if sales charges were reflected. Current performance may be lower or higher than the performance data quoted, which assumes the reinvestment of dividends and capital gains. Current month-end performance is available on the Fund’s website,wfam.com.
Index returns do not include transaction costs associated with buying and selling securities, any mutual fund fees or expenses, or any taxes. It is not possible to invest directly in an index.
For Class A shares, the maximum front-end sales charge is 5.75%. Performance including a contingent deferred sales charge assumes the sales charge for the corresponding time period. Class R6, Administrator Class, and Institutional Class shares are sold without a front-end sales charge or contingent deferred sales charge.
Stock values fluctuate in response to the activities of individual companies and general market and economic conditions. Smaller-company stocks tend to be more volatile and less liquid than those of larger companies. The use of derivatives may reduce returns and/or increase volatility. Consult the Fund’s prospectus for additional information on these and other risks.
Please see footnotes on page 5.
4 | Wells Fargo Disciplined Small Cap Fund
Performance highlights (unaudited)
| | | | |
| |
| Ten largest holdings (%) as of September 30, 20197 | | | |
| | |
Performance Food Group Company | | | 0.87 | |
| | |
EMCOR Group Incorporated | | | 0.86 | |
| | |
Helen of Troy Limited | | | 0.85 | |
| | |
MasTec Incorporated | | | 0.85 | |
| | |
Ryman Hospitality Properties Incorporated | | | 0.83 | |
| | |
Radian Group Incorporated | | | 0.78 | |
| | |
Portland General Electric Company | | | 0.77 | |
| | |
J2 Global Incorporated | | | 0.77 | |
| | |
CyrusOne Incorporated | | | 0.74 | |
| | |
Atkore International Incorporated | | | 0.74 | |
|
|
| Sector distribution as of September 30, 20198 |
|
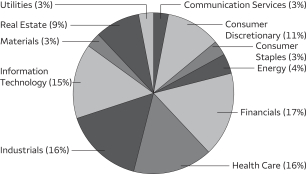 |
| ‡ | CFA® and Chartered Financial Analyst® are trademarks owned by CFA Institute. |
| 1 | Reflects the expense ratios as stated in the most recent prospectuses, which include the impact of 0.03% in acquired fund fees and expenses. The expense ratios shown are subject to change and may differ from the annualized expense ratios shown in the financial highlights of this report, which do not include acquired fund fees and expenses. |
| 2 | The manager has contractually committed through July 31, 2020, to waive fees and/or reimburse expenses to the extent necessary to cap the expenses of each class after fee waivers at 0.93% for Class A, 0.50% for Class R6, 0.85% for Administrator Class, and 0.60% for Institutional Class. Brokerage commissions, stamp duty fees, interest, taxes, acquired fund fees and expenses (if any), and extraordinary expenses are excluded from the expense cap. Prior to or after the commitment expiration date, the cap may be increased or the commitment to maintain the cap may be terminated only with the approval of the Board of Trustees. Without this cap, the Fund’s returns would have been lower. The expense ratio paid by an investor is the net expense ratio (the total annual fund operating expenses after fee waivers) as stated in the prospectuses. |
| 3 | Historical performance shown for Class A shares prior to their inception reflects the performance of the Administrator Class shares, and is adjusted to reflect the higher expenses and sales charges of the Class A shares. |
| 4 | Historical performance shown for Class R6 shares prior to their inception reflects the performance of the Institutional Class shares, and includes the higher expenses applicable to Institutional Class shares. If these expenses had been included, returns for Class R6 would be higher. |
| 5 | Historical performance shown for Institutional Class shares prior to their inception reflects the performance of the Administrator Class shares, and includes the higher expenses applicable to Administrator Class shares. If these expenses had been included, returns for the Institutional Class shares would be higher. |
| 6 | The Russell 2000® Index measures the performance of the 2,000 smallest companies in the Russell 3000® Index, which represents approximately 8% of the total market capitalization of the Russell 3000® Index. You cannot invest directly in an index. |
| 7 | The ten largest holdings, excluding cash, cash equivalents and any money market funds, are calculated based on the value of the investments divided by total net assets of the Fund. Holdings are subject to change and may have changed since the date specified. |
| 8 | Amounts are calculated based on the total long-term investments of the Fund. These amounts are subject to change and may have changed since the date specified. |
Wells Fargo Disciplined Small Cap Fund | 5
Fund expenses (unaudited)
As a shareholder of the Fund, you incur two types of costs: (1) transaction costs, including sales charges (loads) on purchase payments and contingent deferred sales charges (if any) on redemptions and (2) ongoing costs, including management fees, distribution (12b-1) and/or shareholder servicing fees, and other Fund expenses. This example is intended to help you understand your ongoing costs (in dollars) of investing in the Fund and to compare these costs with the ongoing costs of investing in other mutual funds.
The example is based on an investment of $1,000 invested at the beginning of the six-month period and held for the entire period from April 1, 2019 to September 30, 2019.
Actual expenses
The “Actual” line of the table below provides information about actual account values and actual expenses. You may use the information in this line, together with the amount you invested, to estimate the expenses that you paid over the period. Simply divide your account value by $1,000 (for example, an $8,600 account value divided by $1,000 = 8.6), then multiply the result by the number in the “Actual” line under the heading entitled “Expenses paid during period” for your applicable class of shares to estimate the expenses you paid on your account during this period.
Hypothetical example for comparison purposes
The “Hypothetical” line of the table below provides information about hypothetical account values and hypothetical expenses based on the Fund’s actual expense ratio and an assumed rate of return of 5% per year before expenses, which is not the Fund’s actual return. The hypothetical account values and expenses may not be used to estimate the actual ending account balance or expenses you paid for the period. You may use this information to compare the ongoing costs of investing in the Fund and other funds. To do so, compare this 5% hypothetical example with the 5% hypothetical examples that appear in the shareholder reports of the other funds.
Please note that the expenses shown in the table are meant to highlight your ongoing costs only and do not reflect any transactional costs, such as sales charges (loads) and contingent deferred sales charges. Therefore, the “Hypothetical” line of the table is useful in comparing ongoing costs only and will not help you determine the relative total costs of owning different funds. In addition, if these transactional costs were included, your costs would have been higher.
| | | | | | | | | | | | | | | | |
| | | Beginning
account value
4-1-2019 | | | Ending
account value
9-30-2019 | | | Expenses
paid during
the period¹ | | | Annualized net
expense ratio | |
| | | | | |
Class A | | | | | | | | | | | | | | | | |
| | | | |
Actual | | $ | 1,000.00 | | | $ | 1,002.38 | | | $ | 4.67 | | | | 0.93 | % |
| | | | |
Hypothetical (5% return before expenses) | | $ | 1,000.00 | | | $ | 1,020.41 | | | $ | 4.71 | | | | 0.93 | % |
| | | | | |
Class R6 | | | | | | | | | | | | | | | | |
| | | | |
Actual | | $ | 1,000.00 | | | $ | 998.82 | | | $ | 2.51 | | | | 0.50 | % |
| | | | |
Hypothetical (5% return before expenses) | | $ | 1,000.00 | | | $ | 1,022.56 | | | $ | 2.54 | | | | 0.50 | % |
| | | | | |
Administrator Class | | | | | | | | | | | | | | | | |
| | | | |
Actual | | $ | 1,000.00 | | | $ | 997.62 | | | $ | 4.26 | | | | 0.85 | % |
| | | | |
Hypothetical (5% return before expenses) | | $ | 1,000.00 | | | $ | 1,020.81 | | | $ | 4.31 | | | | 0.85 | % |
| | | | | |
Institutional Class | | | | | | | | | | | | | | | | |
| | | | |
Actual | | $ | 1,000.00 | | | $ | 998.82 | | | $ | 2.51 | | | | 0.60 | % |
| | | | |
Hypothetical (5% return before expenses) | | $ | 1,000.00 | | | $ | 1,022.06 | | | $ | 2.54 | | | | 0.60 | % |
| 1 | Expenses paid is equal to the annualized net expense ratio of each class multiplied by the average account value over the period, multiplied by the number of days in the most recent fiscal half-year divided by the number of days in the fiscal year (to reflect the one-half-year period). |
6 | Wells Fargo Disciplined Small Cap Fund
Portfolio of investments—September 30, 2019 (unaudited)
| | | | | | | | | | | | | | | | |
| | | | | | | | | Shares | | | Value | |
| Common Stocks: 98.70% | |
| | | | |
Communication Services: 2.46% | | | | | | | | | | | | | | | | |
| | | | |
| Diversified Telecommunication Services: 0.37% | | | | | | | | | | | | |
Vonage Holdings Corporation † | | | | | | | | | | | 18,934 | | | $ | 213,954 | |
| | | | | | | | | | | | | | | | |
| | | | |
| Entertainment: 0.44% | | | | | | | | | | | | |
Marcus Corporation | | | | | | | | | | | 6,768 | | | | 250,484 | |
| | | | | | | | | | | | | | | | |
| | | | |
| Interactive Media & Services: 0.74% | | | | | | | | | | | | |
QuinStreet Incorporated † | | | | | | | | | | | 18,962 | | | | 238,732 | |
The Meet Group Incorporated † | | | | | | | | | | | 39,203 | | | | 128,390 | |
Yelp Incorporated † | | | | | | | | | | | 1,680 | | | | 58,380 | |
| |
| | | | 425,502 | |
| | | | | | | | | | | | | | | | |
| | | | |
| Media: 0.87% | | | | | | | | | | | | |
Gray Television Incorporated † | | | | | | | | | | | 9,505 | | | | 155,122 | |
MSG Networks Incorporated Class A † | | | | | | | | | | | 1,739 | | | | 28,207 | |
Nexstar Media Group Incorporated Class A | | | | | | | | | | | 3,088 | | | | 315,933 | |
| |
| | | | 499,262 | |
| | | | | | | | | | | | | | | | |
| | | | |
| Wireless Telecommunication Services: 0.04% | | | | | | | | | | | | |
Boingo Wireless Incorporated † | | | | | | | | | | | 1,856 | | | | 20,602 | |
| | | | | | | | | | | | | | | | |
| | | | |
Consumer Discretionary: 11.09% | | | | | | | | | | | | | | | | |
| | | | |
| Auto Components: 0.46% | | | | | | | | | | | | |
Dana Incorporated | | | | | | | | | | | 10,555 | | | | 152,414 | |
Modine Manufacturing Company † | | | | | | | | | | | 9,777 | | | | 111,164 | |
| |
| | | | 263,578 | |
| | | | | | | | | | | | | | | | |
| | | | |
| Distributors: 0.30% | | | | | | | | | | | | |
Funko Incorporated Class A † | | | | | | | | | | | 8,378 | | | | 172,377 | |
| | | | | | | | | | | | | | | | |
| | | | |
| Diversified Consumer Services: 0.93% | | | | | | | | | | | | |
Career Education Corporation † | | | | | | | | | | | 12,382 | | | | 196,750 | |
Grand Canyon Education Incorporated † | | | | | | | | | | | 1,757 | | | | 172,537 | |
K12 Incorporated † | | | | | | | | | | | 6,097 | | | | 160,961 | |
| |
| | | | 530,248 | |
| | | | | | | | | | | | | | | | |
| | | | |
| Hotels, Restaurants & Leisure: 3.39% | | | | | | | | | | | | |
Bloomin’ Brands Incorporated | | | | | | | | | | | 8,831 | | | | 167,171 | |
Brinker International Incorporated « | | | | | | | | | | | 8,366 | | | | 356,977 | |
Churchill Downs Incorporated | | | | | | | | | | | 1,013 | | | | 125,060 | |
Dave & Buster’s Entertainment Incorporated | | | | | | | | | | | 4,907 | | | | 191,128 | |
Lindblad Expeditions Holding † | | | | | | | | | | | 5,524 | | | | 92,582 | |
Marriott Vacations Worldwide Corporation | | | | | | | | | | | 1,977 | | | | 204,837 | |
Noodles & Company Ǡ | | | | | | | | | | | 26,896 | | | | 152,231 | |
Penn National Gaming Incorporated † | | | | | | | | | | | 11,934 | | | | 222,271 | |
Planet Fitness Incorporated Class A † | | | | | | | | | | | 1,584 | | | | 91,666 | |
Playags Incorporated † | | | | | | | | | | | 6,896 | | | | 70,891 | |
Ruth’s Chris Steak House Incorporated | | | | | | | | | | | 9,293 | | | | 189,717 | |
Shake Shack Incorporated Class A † | | | | | | | | | | | 821 | | | | 80,491 | |
| |
| | | | 1,945,022 | |
| | | | | | | | | | | | | | | | |
Wells Fargo Disciplined Small Cap Fund | 7
Portfolio of investments—September 30, 2019 (unaudited)
| | | | | | | | | | | | | | | | |
| | | | | | | | | Shares | | | Value | |
| Household Durables: 2.37% | | | | | | | | | | | | |
Helen of Troy Limited † | | | | | | | | | | | 3,082 | | | $ | 485,908 | |
La-Z-Boy Incorporated | | | | | | | | | | | 5,198 | | | | 174,601 | |
Taylor Morrison Home Corporation Class A † | | | | | | | | | | | 9,891 | | | | 256,573 | |
TopBuild Corporation † | | | | | | | | | | | 1,084 | | | | 104,530 | |
Universal Electronics Incorporated † | | | | | | | | | | | 6,626 | | | | 337,263 | |
| |
| | | | 1,358,875 | |
| | | | | | | | | | | | | | | | |
| | | | |
| Internet & Direct Marketing Retail: 0.22% | | | | | | | | | | | | |
Stamps.com Incorporated † | | | | | | | | | | | 1,680 | | | | 125,076 | |
| | | | | | | | | | | | | | | | |
| | | | |
| Specialty Retail: 1.68% | | | | | | | | | | | | |
American Eagle Outfitters Incorporated | | | | | | | | | | | 10,435 | | | | 169,256 | |
Asbury Automotive Group Incorporated † | | | | | | | | | | | 1,911 | | | | 195,553 | |
Caleres Incorporated | | | | | | | | | | | 3,071 | | | | 71,892 | |
Children’s Place Retail Stores Incorporated « | | | | | | | | | | | 1,662 | | | | 127,957 | |
Designer Brands Incorporated | | | | | | | | | | | 8,872 | | | | 151,889 | |
Tailored Brands Incorporated « | | | | | | | | | | | 11,181 | | | | 49,196 | |
Tilly’s Incorporated Class A | | | | | | | | | | | 10,833 | | | | 102,264 | |
Zumiez Incorporated † | | | | | | | | | | | 2,996 | | | | 94,898 | |
| |
| | | | 962,905 | |
| | | | | | | | | | | | | | | | |
| | | | |
| Textiles, Apparel & Luxury Goods: 1.74% | | | | | | | | | | | | |
G-III Apparel Group Limited † | | | | | | | | | | | 6,484 | | | | 167,093 | |
Movado Group Incorporated | | | | | | | | | | | 8,531 | | | | 212,081 | |
Skechers U.S.A. Incorporated Class A † | | | | | | | | | | | 5,823 | | | | 217,489 | |
Steven Madden Limited | | | | | | | | | | | 11,273 | | | | 403,461 | |
| |
| | | | 1,000,124 | |
| | | | | | | | | | | | | | | | |
| | | | |
Consumer Staples: 2.52% | | | | | | | | | | | | | | | | |
| | | | |
| Food & Staples Retailing: 0.87% | | | | | | | | | | | | |
Performance Food Group Company † | | | | | | | | | | | 10,847 | | | | 499,070 | |
| | | | | | | | | | | | | | | | |
| | | | |
| Food Products: 0.77% | | | | | | | | | | | | |
Fresh Del Monte Produce Incorporated | | | | | | | | | | | 2,995 | | | | 102,159 | |
Simply Good Foods Company † | | | | | | | | | | | 11,587 | | | | 335,907 | |
| |
| | | | 438,066 | |
| | | | | | | | | | | | | | | | |
| | | | |
| Personal Products: 0.78% | | | | | | | | | | | | |
Medifast Incorporated | | | | | | | | | | | 3,020 | | | | 312,963 | |
USANA Health Sciences Incorporated † | | | | | | | | | | | 1,958 | | | | 133,908 | |
| |
| | | | 446,871 | |
| | | | | | | | | | | | | | | | |
| | | | |
| Tobacco: 0.10% | | | | | | | | | | | | |
Turning Point Brands Incorporated « | | | | | | | | | | | 2,569 | | | | 59,241 | |
| | | | | | | | | | | | | | | | |
| | | | |
Energy: 4.07% | | | | | | | | | | | | | | | | |
| | | | |
| Energy Equipment & Services: 1.65% | | | | | | | | | | | | |
Archrock Incorporated | | | | | | | | | | | 30,121 | | | | 300,306 | |
Cactus Incorporated Class A † | | | | | | | | | | | 7,629 | | | | 220,783 | |
Helix Energy Solutions Group Incorporated † | | | | | | | | | | | 38,398 | | | | 309,488 | |
ProPetro Holding Corporation † | | | | | | | | | | | 12,491 | | | | 113,543 | |
| |
| | | | 944,120 | |
| | | | | | | | | | | | | | | | |
8 | Wells Fargo Disciplined Small Cap Fund
Portfolio of investments—September 30, 2019 (unaudited)
| | | | | | | | | | | | | | | | |
| | | | | | | | | Shares | | | Value | |
| Oil, Gas & Consumable Fuels: 2.42% | | | | | | | | | | | | |
Ardmore Shipping Corporation † | | | | | | | | | | | 19,719 | | | $ | 131,920 | |
Bonanza Creek Energy Incorporated † | | | | | | | | | | | 9,209 | | | | 206,190 | |
Delek US Holdings Incorporated | | | | | | | | | | | 7,188 | | | | 260,924 | |
Northern Oil & Gas Incorporated † | | | | | | | | | | | 36,804 | | | | 72,136 | |
Par Pacific Holdings Incorporated † | | | | | | | | | | | 5,355 | | | | 122,415 | |
Renewable Energy Group Incorporated † | | | | | | | | | | | 5,010 | | | | 75,175 | |
Scorpio Tankers Incorporated | | | | | | | | | | | 5,596 | | | | 166,537 | |
SRC Energy Incorporated † | | | | | | | | | | | 27,306 | | | | 127,246 | |
World Fuel Services Corporation | | | | | | | | | | | 5,722 | | | | 228,537 | |
| |
| | | | 1,391,080 | |
| | | | | | | | | | | | | | | | |
| | | | |
Financials: 17.05% | | | | | | | | | | | | | | | | |
| | | | |
| Banks: 8.24% | | | | | | | | | | | | |
BancFirst Corporation | | | | | | | | | | | 4,022 | | | | 222,899 | |
Bank of N.T. Butterfield & Son Limited | | | | | | | | | | | 6,520 | | | | 193,253 | |
Brookline Bancorp Incorporated | | | | | | | | | | | 17,291 | | | | 254,696 | |
CenterState Banks Incorporated | | | | | | | | | | | 7,272 | | | | 174,419 | |
Central Pacific Financial Company | | | | | | | | | | | 3,960 | | | | 112,464 | |
CNB Financial Corporation | | | | | | | | | | | 5,239 | | | | 150,359 | |
Enterprise Financial Service | | | | | | | | | | | 6,677 | | | | 272,088 | |
First Bancorp of North Carolina | | | | | | | | | | | 5,402 | | | | 193,932 | |
First Financial Corporation | | | | | | | | | | | 6,170 | | | | 268,210 | |
First Interstate BancSystem Class A | | | | | | | | | | | 6,402 | | | | 257,616 | |
First Merchants Corporation | | | | | | | | | | | 3,854 | | | | 145,045 | |
Great Southern Bancorp Incorporated | | | | | | | | | | | 5,271 | | | | 300,183 | |
Hancock Holding Company | | | | | | | | | | | 8,355 | | | | 319,955 | |
Heritage Commerce Corporation | | | | | | | | | | | 8,256 | | | | 97,049 | |
IBERIABANK Corporation | | | | | | | | | | | 715 | | | | 54,011 | |
Independent Bank Corporation | | | | | | | | | | | 7,342 | | | | 156,495 | |
Mercantile Bank Corporation | | | | | | | | | | | 6,142 | | | | 201,458 | |
NBT Bancorp Incorporated | | | | | | | | | | | 4,269 | | | | 156,203 | |
OFG Bancorp | | | | | | | | | | | 6,482 | | | | 141,956 | |
Peoples Bancorp Incorporated | | | | | | | | | | | 8,274 | | | | 263,196 | |
Preferred Bank (Los Angeles) | | | | | | | | | | | 5,042 | | | | 264,100 | |
Simmons First National Corporation Class A | | | | | | | | | | | 1,366 | | | | 34,013 | |
Sterling Bancorp | | | | | | | | | | | 4,387 | | | | 88,003 | |
TriCo Bancshares | | | | | | | | | | | 5,236 | | | | 190,067 | |
Umpqua Holdings Corporation | | | | | | | | | | | 7,093 | | | | 116,751 | |
WesBanco Incorporated | | | | | | | | | | | 2,530 | | | | 94,546 | |
| |
| | | | 4,722,967 | |
| | | | | | | | | | | | | | | | |
| | | | |
| Capital Markets: 2.17% | | | | | | | | | | | | |
BGC Partners Incorporated Class A | | | | | | | | | | | 20,139 | | | | 110,765 | |
Blucora Incorporated † | | | | | | | | | | | 10,569 | | | | 228,713 | |
BrightSphere Investment Group Incorporated | | | | | | | | | | | 7,297 | | | | 72,313 | |
Evercore Partners Incorporated Class A | | | | | | | | | | | 3,312 | | | | 265,291 | |
Houlihan Lokey Incorporated | | | | | | | | | | | 5,807 | | | | 261,896 | |
Stifel Financial Corporation | | | | | | | | | | | 5,328 | | | | 305,721 | |
| |
| | | | 1,244,699 | |
| | | | | | | | | | | | | | | | |
| | | | |
| Consumer Finance: 0.72% | | | | | | | | | | | | |
Enova International Incorporated † | | | | | | | | | | | 11,273 | | | | 233,915 | |
Regional Management Corporation † | | | | | | | | | | | 6,468 | | | | 182,139 | |
| |
| | | | 416,054 | |
| | | | | | | | | | | | | | | | |
Wells Fargo Disciplined Small Cap Fund | 9
Portfolio of investments—September 30, 2019 (unaudited)
| | | | | | | | | | | | | | | | |
| | | | | | | | | Shares | | | Value | |
| Insurance: 2.68% | | | | | | | | | | | | |
Argo Group International Holdings Limited | | | | | | | | | | | 3,595 | | | $ | 252,513 | |
Health Insurance Innovations Incorporated Class A Ǡ | | | | | | | | | | | 11,717 | | | | 292,105 | |
Kemper Corporation | | | | | | | | | | | 4,269 | | | | 332,769 | |
National General Holdings Corporation | | | | | | | | | | | 15,330 | | | | 352,897 | |
Selective Insurance Group Incorporated | | | | | | | | | | | 4,059 | | | | 305,196 | |
| |
| | | | 1,535,480 | |
| | | | | | | | | | | | | | | | |
| | | | |
| Thrifts & Mortgage Finance: 3.24% | | | | | | | | | | | | |
Essent Group Limited | | | | | | | | | | | 8,745 | | | | 416,874 | |
First Defiance Financial Corporation | | | | | | | | | | | 8,856 | | | | 256,514 | |
MGIC Investment Corporation | | | | | | | | | | | 19,095 | | | | 240,215 | |
NMI Holdings Incorporated Class A † | | | | | | | | | | | 9,833 | | | | 258,215 | |
Radian Group Incorporated | | | | | | | | | | | 19,682 | | | | 449,537 | |
Walker & Dunlop Incorporated | | | | | | | | | | | 4,265 | | | | 238,541 | |
| |
| | | | 1,859,896 | |
| | | | | | | | | | | | | | | | |
| | | | |
Health Care: 15.86% | | | | | | | | | | | | | | | | |
| | | | |
| Biotechnology: 6.17% | | | | | | | | | | | | |
Arena Pharmaceuticals Incorporated † | | | | | | | | | | | 3,748 | | | | 171,546 | |
Blueprint Medicines Corporation † | | | | | | | | | | | 2,227 | | | | 163,618 | |
CareDx Incorporated † | | | | | | | | | | | 8,549 | | | | 193,293 | |
Concert Pharmaceuticals Incorporated † | | | | | | | | | | | 12,224 | | | | 71,877 | |
Eagle Pharmaceuticals Incorporated † | | | | | | | | | | | 2,575 | | | | 145,668 | |
Emergent BioSolutions Incorporated † | | | | | | | | | | | 2,975 | | | | 155,533 | |
Exelixis Incorporated † | | | | | | | | | | | 8,237 | | | | 145,671 | |
Fibrogen Incorporated † | | | | | | | | | | | 5,443 | | | | 201,282 | |
Genomic Health Incorporated † | | | | | | | | | | | 3,056 | | | | 207,258 | |
Halozyme Therapeutics Incorporated † | | | | | | | | | | | 9,430 | | | | 146,259 | |
Heron Therapeutics Incorporated † | | | | | | | | | | | 8,088 | | | | 149,628 | |
Intercept Pharmaceuticals Incorporated † | | | | | | | | | | | 1,484 | | | | 98,478 | |
Invitae Corporation † | | | | | | | | | | | 2,541 | | | | 48,965 | |
Ligand Pharmaceuticals Incorporated † | | | | | | | | | | | 1,163 | | | | 115,765 | |
Molecular Templates Incorporated † | | | | | | | | | | | 21,111 | | | | 139,121 | |
Pfenex Incorporated † | | | | | | | | | | | 22,920 | | | | 193,445 | |
REGENXBIO Incorporated † | | | | | | | | | | | 3,147 | | | | 112,033 | |
Repligen Corporation † | | | | | | | | | | | 2,316 | | | | 177,614 | |
Rigel Pharmaceuticals Incorporated † | | | | | | | | | | | 95,422 | | | | 178,439 | |
Sangamo Therapeutics Incorporated † | | | | | | | | | | | 8,888 | | | | 80,436 | |
The Medicines Company Ǡ | | | | | | | | | | | 6,106 | | | | 305,300 | |
Ultragenyx Pharmaceutical Incorporated † | | | | | | | | | | | 2,361 | | | | 101,004 | |
Vanda Pharmaceuticals Incorporated † | | | | | | | | | | | 4,864 | | | | 64,594 | |
Vericel Corporation † | | | | | | | | | | | 11,408 | | | | 172,717 | |
| |
| | | | 3,539,544 | |
| | | | | | | | | | | | | | | | |
| | | | |
| Health Care Equipment & Supplies: 3.97% | | | | | | | | | | | | |
Apyx Medical Corporation † | | | | | | | | | | | 16,207 | | | | 109,721 | |
CONMED Corporation | | | | | | | | | | | 2,745 | | | | 263,932 | |
Globus Medical Incorporated Class A † | | | | | | | | | | | 5,112 | | | | 261,325 | |
Haemonetics Corporation † | | | | | | | | | | | 1,860 | | | | 234,620 | |
iRhythm Technologies Incorporated Ǡ | | | | | | | | | | | 2,117 | | | | 156,891 | |
Merit Medical Systems Incorporated † | | | | | | | | | | | 4,114 | | | | 125,312 | |
Novocure Limited † | | | | | | | | | | | 4,286 | | | | 320,507 | |
Orthofix Medical Incorporated † | | | | | | | | | | | 2,347 | | | | 124,438 | |
Seaspine Holdings Corporation † | | | | | | | | | | | 18,000 | | | | 219,780 | |
STAAR Surgical Company † | | | | | | | | | | | 6,758 | | | | 174,221 | |
10 | Wells Fargo Disciplined Small Cap Fund
Portfolio of investments—September 30, 2019 (unaudited)
| | | | | | | | | | | | | | | | |
| | | | | | | | | Shares | | | Value | |
| Health Care Equipment & Supplies (continued) | | | | | | | | | | | | |
Tactile Systems Technology Class I † | | | | | | | | | | | 4,837 | | | $ | 204,702 | |
Wright Medical Group NV † | | | | | | | | | | | 3,876 | | | | 79,962 | |
| |
| | | | 2,275,411 | |
| | | | | | | | | | | | | | | | |
| | | | |
| Health Care Providers & Services: 1.86% | | | | | | | | | | | | |
Amedisys Incorporated † | | | | | | | | | | | 1,875 | | | | 245,644 | |
BioTelemetry Incorporated † | | | | | | | | | | | 3,873 | | | | 157,747 | |
Centene Corporation † | | | | | | | | | | | 4,276 | | | | 184,980 | |
Ensign Group Incorporated | | | | | | | | | | | 5,052 | | | | 239,616 | |
R1 RCM Incorporated † | | | | | | | | | | | 26,899 | | | | 240,208 | |
| |
| | | | 1,068,195 | |
| | | | | | | | | | | | | | | | |
| | | | |
| Health Care Technology: 0.56% | | | | | | | | | | | | |
HMS Holdings Corporation † | | | | | | | | | | | 4,512 | | | | 155,506 | |
Omnicell Incorporated † | | | | | | | | | | | 2,251 | | | | 162,680 | |
| |
| | | | 318,186 | |
| | | | | | | | | | | | | | | | |
| | | | |
| Life Sciences Tools & Services: 1.01% | | | | | | | | | | | | |
Medpace Holdings Incorporated † | | | | | | | | | | | 4,724 | | | | 397,005 | |
PRA Health Sciences Incorporated † | | | | | | | | | | | 1,823 | | | | 180,896 | |
| |
| | | | 577,901 | |
| | | | | | | | | | | | | | | | |
| | | | |
| Pharmaceuticals: 2.29% | | | | | | | | | | | | |
ANI Pharmaceuticals Incorporated † | | | | | | | | | | | 3,647 | | | | 265,793 | |
Catalent Incorporated † | | | | | | | | | | | 4,741 | | | | 225,956 | |
Cormedix Incorporated † | | | | | | | | | | | 9,083 | | | | 57,950 | |
Horizon Therapeutics plc † | | | | | | | | | | | 13,204 | | | | 359,545 | |
Pacira Pharmaceuticals Incorporated † | | | | | | | | | | | 4,573 | | | | 174,094 | |
Supernus Pharmaceuticals Incorporated † | | | | | | | | | | | 8,384 | | | | 230,392 | |
| |
| | | | 1,313,730 | |
| | | | | | | | | | | | | | | | |
| | | | |
Industrials: 16.00% | | | | | | | | | | | | | | | | |
| | | | |
| Aerospace & Defense: 0.66% | | | | | | | | | | | | |
Ducommun Incorporated † | | | | | | | | | | | 2,692 | | | | 114,141 | |
Moog Incorporated Class A | | | | | | | | | | | 3,237 | | | | 262,585 | |
| |
| | | | 376,726 | |
| | | | | | | | | | | | | | | | |
| | | | |
| Airlines: 0.65% | | | | | | | | | | | | |
SkyWest Incorporated | | | | | | | | | | | 6,516 | | | | 374,018 | |
| | | | | | | | | | | | | | | | |
| | | | |
| Building Products: 0.89% | | | | | | | | | | | | |
Builders FirstSource Incorporated † | | | | | | | | | | | 10,636 | | | | 218,836 | |
Cornerstone Building Brands Incorporated † | | | | | | | | | | | 6,295 | | | | 38,085 | |
CSW Industrials Incorporated | | | | | | | | | | | 3,631 | | | | 250,648 | |
| |
| | | | 507,569 | |
| | | | | | | | | | | | | | | | |
| | | | |
| Commercial Services & Supplies: 3.08% | | | | | | | | | | | | |
Ennis Incorporated | | | | | | | | | | | 12,669 | | | | 256,040 | |
Knoll Incorporated | | | | | | | | | | | 9,876 | | | | 250,357 | |
McGrath RentCorp | | | | | | | | | | | 5,266 | | | | 366,461 | |
Tetra Tech Incorporated | | | | | | | | | | | 4,600 | | | | 399,096 | |
UniFirst Corporation | | | | | | | | | | | 649 | | | | 126,633 | |
Viad Corporation | | | | | | | | | | | 5,491 | | | | 368,721 | |
| |
| | | | 1,767,308 | |
| | | | | | | | | | | | | | | | |
Wells Fargo Disciplined Small Cap Fund | 11
Portfolio of investments—September 30, 2019 (unaudited)
| | | | | | | | | | | | | | | | |
| | | | | | | | | Shares | | | Value | |
| Construction & Engineering: 3.47% | | | | | | | | | | | | |
Ameresco Incorporated Class A † | | | | | | | | | | | 7,667 | | | $ | 123,209 | |
Comfort Systems Incorporated | | | | | | | | | | | 3,286 | | | | 145,340 | |
EMCOR Group Incorporated | | | | | | | | | | | 5,718 | | | | 492,434 | |
Great Lakes Dredge & Dock Company † | | | | | | | | | | | 24,240 | | | | 253,308 | |
MasTec Incorporated † | | | | | | | | | | | 7,475 | | | | 485,352 | |
MYR Group Incorporated † | | | | | | | | | | | 9,279 | | | | 290,340 | |
Primoris Services Corporation | | | | | | | | | | | 6,780 | | | | 132,956 | |
Sterling Construction Company Incorporated † | | | | | | | | | | | 5,132 | | | | 67,486 | |
| |
| | | | 1,990,425 | |
| | | | | | | | | | | | | | | | |
| | | | |
| Electrical Equipment: 1.45% | | | | | | | | | | | | |
Atkore International Incorporated † | | | | | | | | | | | 13,959 | | | | 423,656 | |
Encore Wire Corporation | | | | | | | | | | | 5,457 | | | | 307,120 | |
EnerSys | | | | | | | | | | | 1,499 | | | | 98,844 | |
| |
| | | | 829,620 | |
| | | | | | | | | | | | | | | | |
| | | | |
| Machinery: 2.50% | | | | | | | | | | | | |
EnPro Industries Incorporated | | | | | | | | | | | 3,187 | | | | 218,788 | |
Federal Signal Corporation | | | | | | | | | | | 9,632 | | | | 315,352 | |
Hillenbrand Incorporated | | | | | | | | | | | 11,667 | | | | 360,277 | |
Kennametal Incorporated | | | | | | | | | | | 3,989 | | | | 122,622 | |
Meritor Incorporated † | | | | | | | | | | | 11,073 | | | | 204,851 | |
Park Ohio Holdings Corporation | | | | | | | | | | | 7,144 | | | | 213,320 | |
| |
| | | | 1,435,210 | |
| | | | | | | | | | | | | | | | |
| | | | |
| Professional Services: 1.76% | | | | | | | | | | | | |
Barrett Business Services Incorporated | | | | | | | | | | | 2,347 | | | | 208,461 | |
CBIZ Incorporated † | | | | | | | | | | | 5,651 | | | | 132,799 | |
CRA International Incorporated | | | | | | | | | | | 1,615 | | | | 67,782 | |
Insperity Incorporated | | | | | | | | | | | 3,005 | | | | 296,353 | |
TriNet Group Incorporated † | | | | | | | | | | | 4,895 | | | | 304,420 | |
| |
| | | | 1,009,815 | |
| | | | | | | | | | | | | | | | |
| | | | |
| Road & Rail: 0.16% | | | | | | | | | | | | |
Universal Truckload Services | | | | | | | | | | | 3,990 | | | | 92,887 | |
| | | | | | | | | | | | | | | | |
| | | | |
| Trading Companies & Distributors: 1.38% | | | | | | | | | | | | |
Applied Industrial Technologies Incorporated | | | | | | | | | | | 2,834 | | | | 160,971 | |
DXP Enterprises Incorporated † | | | | | | | | | | | 7,969 | | | | 276,684 | |
H&E Equipment Services Incorporated | | | | | | | | | | | 8,727 | | | | 251,861 | |
Rush Enterprises Incorporated | | | | | | | | | | | 2,591 | | | | 99,961 | |
| |
| | | | 789,477 | |
| | | | | | | | | | | | | | | | |
| | | | |
Information Technology: 14.46% | | | | | | | | | | | | | | | | |
| | | | |
| Communications Equipment: 0.78% | | | | | | | | | | | | |
Ciena Corporation † | | | | | | | | | | | 8,590 | | | | 336,986 | |
Extreme Networks Incorporated † | | | | | | | | | | | 15,246 | | | | 110,915 | |
| |
| | | | 447,901 | |
| | | | | | | | | | | | | | | | |
| | | | |
| Electronic Equipment, Instruments & Components: 4.15% | | | | | | | | | | | | |
Anixter International Incorporated † | | | | | | | | | | | 3,804 | | | | 262,932 | |
Fabrinet † | | | | | | | | | | | 4,297 | | | | 224,733 | |
Insight Enterprises Incorporated † | | | | | | | | | | | 4,090 | | | | 227,772 | |
Kemet Corporation | | | | | | | | | | | 7,021 | | | | 127,642 | |
12 | Wells Fargo Disciplined Small Cap Fund
Portfolio of investments—September 30, 2019 (unaudited)
| | | | | | | | | | | | | | | | |
| | | | | | | | | Shares | | | Value | |
| Electronic Equipment, Instruments & Components (continued) | | | | | | | | | | | | |
Napco Security Technologies Incorporated † | | | | | | | | | | | 6,231 | | | $ | 159,015 | |
OSI Systems Incorporated † | | | | | | | | | | | 2,874 | | | | 291,883 | |
Sanmina Corporation † | | | | | | | | | | | 9,858 | | | | 316,540 | |
ScanSource Incorporated † | | | | | | | | | | | 4,186 | | | | 127,882 | |
SYNNEX Corporation | | | | | | | | | | | 3,238 | | | | 365,570 | |
Vishay Precision Group † | | | | | | | | | | | 8,431 | | | | 276,031 | |
| |
| | | | 2,380,000 | |
| | | | | | | | | | | | | | | | |
| | | | |
| IT Services: 4.80% | | | | | | | | | | | | |
CACI International Incorporated Class A † | | | | | | | | | | | 1,048 | | | | 242,360 | |
Cardtronics Incorporated Class A † | | | | | | | | | | | 7,607 | | | | 230,036 | |
CSG Systems International Incorporated | | | | | | | | | | | 4,324 | | | | 223,464 | |
EPAM Systems Incorporated † | | | | | | | | | | | 1,454 | | | | 265,093 | |
Evertec Incorporated | | | | | | | | | | | 7,844 | | | | 244,890 | |
KBR Incorporated | | | | | | | | | | | 12,829 | | | | 314,824 | |
ManTech International Corporation Class A | | | | | | | | | | | 2,097 | | | | 149,747 | |
MAXIMUS Incorporated | | | | | | | | | | | 3,831 | | | | 295,983 | |
Perficient Incorporated † | | | | | | | | | | | 10,356 | | | | 399,534 | |
Science Applications International Corporation | | | | | | | | | | | 1,752 | | | | 153,037 | |
Unisys Corporation † | | | | | | | | | | | 31,298 | | | | 232,544 | |
| |
| | | | 2,751,512 | |
| | | | | | | | | | | | | | | | |
| | | | |
| Semiconductors & Semiconductor Equipment: 1.70% | | | | | | | | | | | | |
Diodes Incorporated † | | | | | | | | | | | 4,633 | | | | 186,015 | |
Entegris Incorporated | | | | | | | | | | | 5,350 | | | | 251,771 | |
MKS Instruments Incorporated | | | | | | | | | | | 1,113 | | | | 102,708 | |
Ultra Clean Holdings Incorporated † | | | | | | | | | | | 10,674 | | | | 156,214 | |
Xperi Corporation | | | | | | | | | | | 13,317 | | | | 275,396 | |
| |
| | | | 972,104 | |
| | | | | | | | | | | | | | | | |
| | | | |
| Software: 3.03% | | | | | | | | | | | | |
ACI Worldwide Incorporated † | | | | | | | | | | | 12,099 | | | | 379,001 | |
J2 Global Incorporated | | | | | | | | | | | 4,848 | | | | 440,295 | |
LivePerson Incorporated † | | | | | | | | | | | 1,387 | | | | 49,516 | |
Qualys Incorporated † | | | | | | | | | | | 940 | | | | 71,036 | |
Rapid7 Incorporated † | | | | | | | | | | | 1,442 | | | | 65,452 | |
SPS Commerce Incorporated † | | | | | | | | | | | 6,565 | | | | 309,015 | |
Upland Software Incorporated † | | | | | | | | | | | 794 | | | | 27,679 | |
Verint Systems Incorporated † | | | | | | | | | | | 6,362 | | | | 272,166 | |
Workiva Incorporated † | | | | | | | | | | | 2,816 | | | | 123,425 | |
| |
| | | | 1,737,585 | |
| | | | | | | | | | | | | | | | |
| | | | |
Materials: 2.99% | | | | | | | | | | | | | | | | |
| | | | |
| Chemicals: 1.58% | | | | | | | | | | | | |
Innospec Incorporated | | | | | | | | | | | 4,184 | | | | 372,962 | |
Kraton Performance Polymers Incorporated † | | | | | | | | | | | 2,917 | | | | 94,190 | |
PolyOne Corporation | | | | | | | | | | | 10,397 | | | | 339,462 | |
Trinseo SA | | | | | | | | | | | 2,368 | | | | 101,706 | |
| |
| | | | 908,320 | |
| | | | | | | | | | | | | | | | |
| | | | |
| Containers & Packaging: 0.66% | | | | | | | | | | | | |
Berry Global Group Incorporated † | | | | | | | | | | | 3,082 | | | | 121,030 | |
Greif Incorporated Class A | | | | | | | | | | | 6,711 | | | | 254,280 | |
| |
| | | | 375,310 | |
| | | | | | | | | | | | | | | | |
Wells Fargo Disciplined Small Cap Fund | 13
Portfolio of investments—September 30, 2019 (unaudited)
| | | | | | | | | | | | | | | | |
| | | | | | | | | Shares | | | Value | |
| Metals & Mining: 0.62% | | | | | | | | | | | | |
Materion Corporation | | | | | | | | | | | 4,385 | | | $ | 269,064 | |
Suncoke Energy Incorporated † | | | | | | | | | | | 14,985 | | | | 84,515 | |
| |
| | | | 353,579 | |
| | | | | | | | | | | | | | | | |
| | | | |
| Paper & Forest Products: 0.13% | | | | | | | | | | | | |
Louisiana-Pacific Corporation | | | | | | | | | | | 3,107 | | | | 76,370 | |
| | | | | | | | | | | | | | | | |
| | | | |
Real Estate: 8.87% | | | | | | | | | | | | | | | | |
| | | | |
| Equity REITs: 7.82% | | | | | | | | | | | | |
Americold Realty Trust | | | | | | | | | | | 3,668 | | | | 135,973 | |
Armada Hoffler Properties Incorporated | | | | | | | | | | | 15,051 | | | | 272,273 | |
Ashford Hospitality Trust Incorporated | | | | | | | | | | | 47,666 | | | | 157,774 | |
CareTrust REIT Incorporated | | | | | | | | | | | 6,635 | | | | 155,956 | |
Catchmark Timber Trust Incorporated Class A | | | | | | | | | | | 34,532 | | | | 368,456 | |
CoreCivic Incorporated | | | | | | | | | | | 6,343 | | | | 109,607 | |
CyrusOne Incorporated | | | | | | | | | | | 5,394 | | | | 426,665 | |
Digital Realty Trust Incorporated | | | | | | | | | | | 1,450 | | | | 188,225 | |
Easterly Government Properties Incorporated | | | | | | | | | | | 8,196 | | | | 174,575 | |
First Industrial Realty Trust Incorporated | | | | | | | | | | | 7,266 | | | | 287,443 | |
Global Medical REIT Incorporated | | | | | | | | | | | 20,437 | | | | 232,982 | |
NexPoint Residential | | | | | | | | | | | 7,096 | | | | 331,809 | |
Piedmont Office Realty Trust Incorporated Class A | | | | | | | | | | | 15,811 | | | | 330,134 | |
Preferred Apartment Communities Incorporated Class A | | | | | | | | | | | 11,745 | | | | 169,715 | |
Ryman Hospitality Properties Incorporated | | | | | | | | | | | 5,786 | | | | 473,353 | |
STAG Industrial Incorporated | | | | | | | | | | | 10,814 | | | | 318,797 | |
UMH Properties Incorporated | | | | | | | | | | | 10,593 | | | | 149,149 | |
Xenia Hotels & Resorts Incorporated | | | | | | | | | | | 9,360 | | | | 197,683 | |
| |
| | | | 4,480,569 | |
| | | | | | | | | | | | | | | | |
| | | | |
| Real Estate Management & Development: 1.05% | | | | | | | | | | | | |
Kennedy Wilson Holdings Incorporated | | | | | | | | | | | 11,036 | | | | 241,909 | |
Newmark Group Incorporated Class A | | | | | | | | | | | 39,865 | | | | 361,177 | |
| |
| | | | 603,086 | |
| | | | | | | | | | | | | | | | |
| | | | |
Utilities: 3.33% | | | | | | | | | | | | | | | | |
| | | | |
| Electric Utilities: 1.53% | | | | | | | | | | | | |
IDACORP Incorporated | | | | | | | | | | | 2,179 | | | | 245,508 | |
Portland General Electric Company | | | | | | | | | | | 7,835 | | | | 441,659 | |
Spark Energy Incorporated Class A « | | | | | | | | | | | 18,143 | | | | 191,409 | |
| |
| | | | 878,576 | |
| | | | | | | | | | | | | | | | |
| | | | |
| Gas Utilities: 0.55% | | | | | | | | | | | | |
Southwest Gas Holdings Incorporated | | | | | | | | | | | 3,467 | | | | 315,636 | |
| | | | | | | | | | | | | | | | |
| | | | |
| Independent Power & Renewable Electricity Producers: 0.39% | | | | | | | | | | | | |
Clearway Energy Incorporated Class A | | | | | | | | | | | 12,868 | | | | 223,131 | |
| | | | | | | | | | | | | | | | |
| | | | |
| Multi-Utilities: 0.61% | | | | | | | | | | | | |
Northwestern Corporation | | | | | | | | | | | 4,686 | | | | 351,684 | |
| | | | | | | | | | | | | | | | |
| | | | |
| Water Utilities: 0.25% | | | | | | | | | | | | |
Consolidated Water Company | | | | | | | | | | | 8,699 | | | | 143,443 | |
| | | | | | | | | | | | | | | | |
| |
Total Common Stocks (Cost $57,313,018) | | | | 56,590,381 | |
| | | | | | | | | | | | | | | | |
14 | Wells Fargo Disciplined Small Cap Fund
Portfolio of investments—September 30, 2019 (unaudited)
| | | | | | | | | | | | | | | | |
| | | Yield | | | | | | Shares | | | Value | |
| Short-Term Investments: 3.50% | | | | | | | | | | | | | | | | |
| | | | |
| Investment Companies: 3.27% | | | | | | | | | | | | |
Securities Lending Cash Investments LLC (l)(r)(u) | | | 2.11 | % | | | | | | | 1,442,968 | | | $ | 1,443,112 | |
Wells Fargo Government Money Market Fund Select Class (l)(u) | | | 1.88 | | | | | | | | 433,017 | | | | 433,017 | |
| |
| | | | 1,876,129 | |
| | | | | | | | | | | | | | | | |
| | | | |
| | | | | | | | | | | | | | | | |
| | | | | | Maturity
date | | | Principal | | | | |
| U.S. Treasury Securities: 0.23% | | | | | | | | | | | | |
U.S. Treasury Bill (z)# | | | 2.05 | | | | 1-2-2020 | | | $ | 130,000 | | | | 129,393 | |
| | | | | | | | | | | | | | | | |
| |
Total Short-Term Investments (Cost $2,005,436) | | | | 2,005,522 | |
| | | | | | | | | | | | | | | | |
| | | | | | | | |
| Total investments in securities (Cost $59,318,454) | | | 102.20 | % | | | 58,595,903 | |
| | |
Other assets and liabilities, net | | | (2.20 | ) | | | (1,258,819 | ) |
| | | | | | | | |
| Total net assets | | | 100.00 | % | | $ | 57,337,084 | |
| | | | | | | | |
| † | Non-income-earning security |
| « | All or a portion of this security is on loan. |
| (l) | The issuer of the security is an affiliated person of the Fund as defined in the Investment Company Act of 1940. |
| (r) | The investment is a non-registered investment company purchased with cash collateral received from securities on loan. |
| (u) | The rate represents the 7-day annualized yield at period end. |
| (z) | Zero coupon security. The rate represents the current yield to maturity. |
| # | All or a portion of this security is segregated as collateral for investments in derivative instruments. |
Abbreviations:
| REIT | Real estate investment trust |
Futures Contracts
| | | | | | | | | | | | | | | | | | | | | | | | |
| Description | | Number of
contracts | | | Expiration
date | | | Notional
cost | | | Notional
value | | | Unrealized
gains | | | Unrealized
losses | |
| | | | | | |
Long | | | | | | | | | | | | | | | | | | | | | | | | |
| | | | | | |
Russell 2000 E-Mini Index | | | 5 | | | | 12-20-2019 | | | $ | 396,510 | | | $ | 381,250 | | | $ | 0 | | | $ | (15,260 | ) |
Investments in Affiliates
An affiliated investment is an investment in which the Fund owns at least 5% of the outstanding voting shares of the issuer or as a result of other relationships, such as the Fund and the issuer having the same investment manager. Transactions with issuers that were either affiliated persons of the Fund at the beginning of the period or the end of the period were as follows:
| | | | | | | | | | | | | | | | | | | | | | | | | | | | | | | | | | | | |
| | | Shares,
beginning of
period | | | Shares
purchased | | | Shares
sold | | | Shares,
end of
period | | | Net
realized
gains
(losses) | | | Net
change in
unrealized
gains
(losses) | | | Income
from
affiliated
securities | | | Value,
end of
period | | | % of
net
assets | |
| Short-Term Investments | | | | | | | | | | | | | | | | | | | | | | | | | | | | | | | | | | | | |
Investment Companies | | | | | | | | | | | | | | | | | | | | | | | | | | | | | | | | | | | | |
Securities Lending Cash Investments LLC | | | 533,068 | | | | 7,964,249 | | | | 7,054,349 | | | | 1,442,968 | | | $ | 43 | | | $ | 0 | | | $ | 10,227 | # | | $ | 1,443,112 | | | | | |
Wells Fargo Government Money Market Fund Select Class | | | 849,992 | | | | 17,138,013 | | | | 17,554,988 | | | | 433,017 | | | | 0 | | | | 0 | | | | 11,531 | | | | 433,017 | | | | | |
| | | | | | | | | | | | | | | | | | | | | | | | | | | | | | | | | | | | |
| | | | | | | | | |
| | | | | | | | | | | | | | | | | | $ | 43 | | | $ | 0 | | | $ | 21,758 | | | $ | 1,876,129 | | | | 3.27 | % |
| | | | | | | | | | | | | | | | | | | | | | | | | | | | | | | | | | | | |
| # | Amount shown represents income before fees and rebates. |
The accompanying notes are an integral part of these financial statements.
Wells Fargo Disciplined Small Cap Fund | 15
Statement of assets and liabilities—September 30, 2019 (unaudited)
| | | | |
| | | | |
| |
Assets | | | | |
Investments in unaffiliated securities (including $1,406,011 of securities loaned), at value (cost $57,442,325) | | $ | 56,719,774 | |
Investments in affiliated securities, at value (cost $1,876,129) | | | 1,876,129 | |
Cash | | | 1,356 | |
Receivable for investments sold | | | 102,362 | |
Receivable for Fund shares sold | | | 27,319 | |
Receivable for dividends | | | 62,298 | |
Receivable for securities lending income, net | | | 9,042 | |
Receivable for daily variation margin on open futures contracts | | | 376 | |
Prepaid expenses and other assets | | | 45,261 | |
| | | | |
Total assets | | | 58,843,917 | |
| | | | |
| |
Liabilities | | | | |
Payable upon receipt of securities loaned | | | 1,441,778 | |
Payable for Fund shares redeemed | | | 12,073 | |
Management fee payable | | | 6,577 | |
Administration fees payable | | | 5,384 | |
Trustees’ fees and expenses payable | | | 2,465 | |
Accrued expenses and other liabilities | | | 38,556 | |
| | | | |
Total liabilities | | | 1,506,833 | |
| | | | |
Total net assets | | $ | 57,337,084 | |
| | | | |
| |
Net assets consist of | | | | |
Paid-in capital | | $ | 62,722,551 | |
Total distributable loss | | | (5,385,467 | ) |
| | | | |
Total net assets | | $ | 57,337,084 | |
| | | | |
| |
Computation of net asset value and offering price per share | | | | |
Net assets – Class A | | $ | 92,896 | |
Shares outstanding – Class A1 | | | 11,040 | |
Net asset value per share – Class A | | | $8.41 | |
Maximum offering price per share – Class A2 | | | $8.92 | |
Net assets – Class R6 | | $ | 10,012,234 | |
Shares outstanding – Class R61 | | | 1,178,638 | |
Net asset value per share – Class R6 | | | $8.49 | |
Net assets – Administrator Class | | $ | 36,954,668 | |
Shares outstanding – Administrator Class1 | | | 4,411,285 | |
Net asset value per share – Administrator Class | | | $8.38 | |
Net assets – Institutional Class | | $ | 10,277,286 | |
Shares outstanding – Institutional Class1 | | | 1,213,321 | |
Net asset value per share – Institutional Class | | | $8.47 | |
| 1 | The Fund has an unlimited number of authorized shares. |
| 2 | Maximum offering price is computed as 100/94.25 of net asset value. On investments of $50,000 or more, the offering price is reduced. |
The accompanying notes are an integral part of these financial statements.
16 | Wells Fargo Disciplined Small Cap Fund
Statement of operations—six months ended September 30, 2019 (unaudited)
| | | | |
| | | | |
| |
Investment income | | | | |
Dividends (net of foreign withholding taxes of $45) | | $ | 446,076 | |
Income from affiliates securities | | | 52,253 | |
| | | | |
Total investment income | | | 498,329 | |
| | | | |
| |
Expenses | | | | |
Management fee | | | 170,913 | |
Administration fees | | | | |
Class A | | | 89 | |
Class R6 | | | 1,063 | |
Administrator Class | | | 28,712 | |
Institutional Class | | | 11,066 | |
Shareholder servicing fees | | | | |
Class A | | | 106 | |
Administrator Class | | | 55,216 | |
Custody and accounting fees | | | 10,393 | |
Professional fees | | | 20,952 | |
Registration fees | | | 33,574 | |
Shareholder report expenses | | | 16,403 | |
Trustees’ fees and expenses | | | 10,232 | |
Interest expense | | | 561 | |
Other fees and expenses | | | 5,644 | |
| | | | |
Total expenses | | | 364,924 | |
Less: Fee waivers and/or expense reimbursements | | | | |
Fund-level | | | (107,800 | ) |
| | | | |
Net expenses | | | 257,124 | |
| | | | |
Net investment income | | | 241,205 | |
| | | | |
| |
Realized and unrealized gains (losses) on investments | | | | |
Net realized gains (losses) on | | | | |
Unaffiliated securities | | | (2,369,313 | ) |
Affiliated securities | | | 43 | |
Futures contracts | | | (29,325 | ) |
| | | | |
Net realized gains on investments | | | (2,398,595 | ) |
| | | | |
| |
Net change in unrealized gains (losses) on: | | | | |
Unaffiliated securities | | | 2,166,164 | |
Futures contracts | | | (11,336 | ) |
| | | | |
Net change in unrealized gains (losses) on investments | | | 2,154,828 | |
| | | | |
Net realized and unrealized gains (losses) on investments | | | (243,767 | ) |
| | | | |
Net decrease in net assets resulting from operations | | $ | (2,562 | ) |
| | | | |
The accompanying notes are an integral part of these financial statements.
Wells Fargo Disciplined Small Cap Fund | 17
Statement of changes in net assets
| | | | | | | | | | | | | | | | |
| | | Six months ended
September 30, 2019
(unaudited) | | | Year ended
March 31, 2019 | |
| | | |
Operations | | | | | | | | | | | | |
Net investment income | | | | | | $ | 241,205 | | | | | | | $ | 401,383 | |
Net realized gains (losses) on investments | | | | | | | (2,398,595 | ) | | | | | | | 28,609,817 | |
Net change in unrealized gains (losses) on investments | | | | | | | 2,154,828 | | | | | | | | (38,978,818 | ) |
| | | | |
Net decrease in net assets resulting from operations | | | | | | | (2,562 | ) | | | | | | | (9,967,618 | ) |
| | | | |
| | | | |
Distributions to shareholders from net investment income and net realized gains | | | | | | | | | | | | | | | | |
Class A | | | | | | | 0 | | | | | | | | (23,529 | )1 |
Class R6 | | | | | | | 0 | | | | | | | | (4,570,209 | ) |
Administrator Class | | | | | | | 0 | | | | | | | | (37,650,733 | ) |
Institutional Class | | | | | | | 0 | | | | | | | | (22,694,010 | ) |
| | | | |
Total distributions to shareholders | | | | | | | 0 | | | | | | | | (64,938,481 | ) |
| | | | |
| | | | |
Capital share transactions | | | Shares | | | | | | | | Shares | | | | | |
Proceeds from shares sold | | | | | | | | | | | | | | | | |
Class A | | | 17,006 | | | | 146,570 | | | | 2.960 | 1 | | | 51,409 | 1 |
Class R6 | | | 819,116 | | | | 7,119,373 | | | | 220,833 | | | | 4,395,129 | |
Administrator Class | | | 152,063 | | | | 1,282,436 | | | | 348,961 | | | | 5,660,352 | |
Institutional Class | | | 93,346 | | | | 795,850 | | | | 657,651 | | | | 12,223,841 | |
| | | | |
| | | | | | | 9,344,229 | | | | | | | | 22,330,731 | |
| | | | |
Reinvestment of distributions | | | | | | | | | | | | | | | | |
Class A | | | 0 | | | | 0 | | | | 1,361 | 1 | | | 10,912 | 1 |
Class R6 | | | 0 | | | | 0 | | | | 523,136 | | | | 4,271,599 | |
Administrator Class | | | 0 | | | | 0 | | | | 4,686,419 | | | | 37,625,033 | |
Institutional Class | | | 0 | | | | 0 | | | | 2,679,230 | | | | 21,773,661 | |
| | | | |
| | | | | | | 0 | | | | | | | | 63,681,205 | |
| | | | |
Payment for shares redeemed | | | | | | | | | | | | | | | | |
Class A | | | (10,080 | ) | | | (87,519 | ) | | | (207 | )1 | | | (1,692 | )1 |
Class R6 | | | (112,508 | ) | | | (963,301 | ) | | | (1,326,785 | ) | | | (24,323,015 | ) |
Administrator Class | | | (1,681,808 | ) | | | (14,296,072 | ) | | | (3,156,760 | ) | | | (42,530,327 | ) |
Institutional Class | | | (1,904,762 | ) | | | (16,274,651 | ) | | | (3,311,260 | ) | | | (47,808,217 | ) |
| | | | |
| | | | | | | (31,621,543 | ) | | | | | | | (114,663,251 | ) |
| | | | |
Net decrease in net assets resulting from capital share transactions | | | | | | | (22,277,314 | ) | | | | | | | (28,651,315 | ) |
| | | | |
Total decrease in net assets | | | | | | | (22,279,876 | ) | | | | | | | (103,557,414 | ) |
| | | | |
| | |
Net assets | | | | | | | | |
Beginning of period | | | | | | | 79,616,960 | | | | | | | | 183,174,374 | |
| | | | |
End of period | | | | | | $ | 57,337,084 | | | | | | | $ | 79,616,960 | |
| | | | |
| 1 | For the period from July 31, 2018 (commencement of class operations) to March 31, 2019 |
The accompanying notes are an integral part of these financial statements.
18 | Wells Fargo Disciplined Small Cap Fund
Financial highlights
(For a share outstanding throughout each period)
| | | | | | | | |
| CLASS A | | Six months ended
September 30, 2019
(unaudited) | | | Year ended
March 31, 20191 | |
Net asset value, beginning of period | | | $8.39 | | | | $23.70 | |
Net investment income | | | 0.02 | | | | 0.02 | |
Net realized and unrealized gains (losses) on investments | | | (0.00 | )2 | | | (3.37 | ) |
| | | | | | | | |
Total from investment operations | | | 0.02 | | | | (3.35 | ) |
Distributions to shareholders from | | | | | | | | |
Net investment income | | | 0.00 | | | | (0.04 | ) |
Net realized gains | | | 0.00 | | | | (11.92 | ) |
| | | | | | | | |
Total distributions to shareholders | | | 0.00 | | | | (11.96 | ) |
Net asset value, end of period | | | $8.41 | | | | $8.39 | |
Total return3 | | | 0.24 | % | | | (11.52 | )% |
Ratios to average net assets (annualized) | | | | | | | | |
Gross expenses | | | 1.26 | % | | | 1.14 | % |
Net expenses | | | 0.93 | % | | | 0.92 | % |
Net investment income | | | 0.63 | % | | | 0.16 | % |
Supplemental data | | | | | | | | |
Portfolio turnover rate | | | 37 | % | | | 176 | % |
Net assets, end of period (000s omitted) | | | $93 | | | | $34 | |
| 1 | For the period from July 31, 2018 (commencement of class operations) to March 31, 2019 |
| 2 | Amount is more than $(0.005). |
| 3 | Total return calculations do not include any sales charges. Returns for periods of less than one year are not annualized. |
The accompanying notes are an integral part of these financial statements.
Wells Fargo Disciplined Small Cap Fund | 19
Financial highlights
(For a share outstanding throughout each period)
| | | | | | | | | | | | | | | | |
| | | Six months ended
September 30, 2019
(unaudited) | | | Year ended March 31 | |
| CLASS R6 | | 2019 | | | 2018 | | | 20171 | |
Net asset value, beginning of period | | | $8.50 | | | | $22.63 | | | | $23.82 | | | | $22.43 | |
Net investment income | | | 0.04 | 2 | | | 0.06 | | | | 0.07 | | | | 0.14 | |
Net realized and unrealized gains (losses) on investments | | | (0.05 | ) | | | (2.19 | ) | | | 2.08 | | | | 3.32 | |
| | | | | | | | | | | | | | | | |
Total from investment operations | | | (0.01 | ) | | | (2.13 | ) | | | 2.15 | | | | 3.46 | |
Distributions to shareholders from | | | | | | | | | | | | | | | | |
Net investment income | | | 0.00 | | | | (0.08 | ) | | | (0.06 | ) | | | (0.14 | ) |
Net realized gains | | | 0.00 | | | | (11.92 | ) | | | (3.28 | ) | | | (1.93 | ) |
| | | | | | | | | | | | | | | | |
Total distributions to shareholders | | | 0.00 | | | | (12.00 | ) | | | (3.34 | ) | | | (2.07 | ) |
Net asset value, end of period | | | $8.49 | | | | $8.50 | | | | $22.63 | | | | $23.82 | |
Total return3 | | | (0.12 | )% | | | (6.75 | )% | | | 8.95 | % | | | 15.63 | % |
Ratios to average net assets (annualized) | | | | | | | | | | | | | | | | |
Gross expenses | | | 0.84 | % | | | 0.82 | % | | | 1.06 | % | | | 0.92 | % |
Net expenses | | | 0.50 | % | | | 0.64 | % | | | 0.85 | % | | | 0.85 | % |
Net investment income | | | 1.01 | % | | | 0.48 | % | | | 0.14 | % | | | 0.67 | % |
Supplemental data | | | | | | | | | | | | | | | | |
Portfolio turnover rate | | | 37 | % | | | 176 | % | | | 48 | % | | | 73 | % |
Net assets, end of period (000s omitted) | | | $10,012 | | | | $4,014 | | | | $23,871 | | | | $1,626 | |
| 1 | For the period from October 31, 2016 (commencement of class operations) to March 31, 2017 |
| 2 | Calculated based upon average shares outstanding |
| 3 | Returns for periods of less than one year are not annualized. |
The accompanying notes are an integral part of these financial statements.
20 | Wells Fargo Disciplined Small Cap Fund
Financial highlights
(For a share outstanding throughout each period)
| | | | | | | | | | | | | | | | | | | | | | | | |
| | | Six months ended
September 30, 2018
(unaudited) | | | Year ended March 31 | |
| ADMINISTRATOR CLASS | | 2019 | | | 2018 | | | 2017 | | | 2016 | | | 2015 | |
Net asset value, beginning of period | | | $8.40 | | | | $22.53 | | | | $23.79 | | | | $21.15 | | | | $25.19 | | | | $37.93 | |
Net investment income | | | 0.03 | 1 | | | 0.03 | 1 | | | 0.06 | | | | 0.08 | 1 | | | 0.06 | | | | 0.02 | |
Net realized and unrealized gains (losses) on investments | | | (0.05 | ) | | | (2.21 | ) | | | 2.00 | | | | 4.56 | | | | (1.24 | ) | | | 3.13 | |
| | | | | | | | | | | | | | | | | | | | | | | | |
Total from investment operations | | | (0.02 | ) | | | (2.18 | ) | | | 2.06 | | | | 4.64 | | | | (1.18 | ) | | | 3.15 | |
Distributions to shareholders from | | | | | | | | | | | | | | | | | | | | | | | | |
Net investment income | | | 0.00 | | | | (0.03 | ) | | | (0.04 | ) | | | (0.07 | ) | | | (0.02 | ) | | | 0.00 | |
Net realized gains | | | 0.00 | | | | (11.92 | ) | | | (3.28 | ) | | | (1.93 | ) | | | (2.84 | ) | | | (15.89 | ) |
| | | | | | | | | | | | | | | | | | | | | | | | |
Total distributions to shareholders | | | 0.00 | | | | (11.95 | ) | | | (3.32 | ) | | | (2.00 | ) | | | (2.86 | ) | | | (15.89 | ) |
Net asset value, end of period | | | $8.38 | | | | $8.40 | | | | $22.53 | | | | $23.79 | | | | $21.15 | | | | $25.19 | |
Total return2 | | | (0.24 | )% | | | (7.01 | )% | | | 8.52 | % | | | 22.13 | % | | | (4.39 | )% | | | 11.75 | % |
Ratios to average net assets (annualized) | | | | | | | | | | | | | | | | | | | | | | | | |
Gross expenses | | | 1.17 | % | | | 1.13 | % | | | 1.30 | % | | | 1.28 | % | | | 1.29 | % | | | 1.24 | % |
Net expenses | | | 0.85 | % | | | 0.95 | % | | | 1.20 | % | | | 1.20 | % | | | 1.20 | % | | | 1.20 | % |
Net investment income | | | 0.61 | % | | | 0.16 | % | | | 0.12 | % | | | 0.36 | % | | | 0.25 | % | | | 0.06 | % |
Supplemental data | | | | | | | | | | | | | | | | | | | | | | | | |
Portfolio turnover rate | | | 37 | % | | | 176 | % | | | 48 | % | | | 73 | % | | | 59 | % | | | 60 | % |
Net assets, end of period (000s omitted) | | | $36,955 | | | | $49,911 | | | | $91,506 | | | | $231,039 | | | | $264,560 | | | | $306,628 | |
| 1 | Calculated based upon average shares outstanding |
| 2 | Returns for periods of less than one year are not annualized. |
The accompanying notes are an integral part of these financial statements.
Wells Fargo Disciplined Small Cap Fund | 21
Financial highlights
(For a share outstanding throughout each period)
| | | | | | | | | | | | | | | | | | | | | | | | |
| | | Six months ended
September 30, 2019
(unaudited) | | | Year ended March 31 | |
| INSTITUTIONAL CLASS | | 2019 | | | 2018 | | | 2017 | | | 2016 | | | 20151 | |
Net asset value, beginning of period | | | $8.48 | | | | $22.61 | | | | $23.82 | | | | $21.18 | | | | $25.22 | | | | $39.04 | |
Net investment income | | | 0.04 | 2 | | | 0.07 | 2 | | | 0.09 | | | | 0.09 | | | | 0.16 | 2 | | | 0.06 | |
Net realized and unrealized gains (losses) on investments | | | (0.05 | ) | | | (2.22 | ) | | | 2.03 | | | | 4.61 | | | | (1.28 | ) | | | 2.01 | |
| | | | | | | | | | | | | | | | | | | | | | | | |
Total from investment operations | | | (0.01 | ) | | | (2.15 | ) | | | 2.12 | | | | 4.70 | | | | (1.12 | ) | | | 2.07 | |
Distributions to shareholders from | | | | | | | | | | | | | | | | | | | | | | | | |
Net investment income | | | 0.00 | | | | (0.06 | ) | | | (0.05 | ) | | | (0.13 | ) | | | (0.08 | ) | | | 0.00 | |
Net realized gains | | | 0.00 | | | | (11.92 | ) | | | (3.28 | ) | | | (1.93 | ) | | | (2.84 | ) | | | (15.89 | ) |
| | | | | | | | | | | | | | | | | | | | | | | | |
Total distributions to shareholders | | | 0.00 | | | | (11.98 | ) | | | (3.33 | ) | | | (2.06 | ) | | | (2.92 | ) | | | (15.89 | ) |
Net asset value, end of period | | | $8.47 | | | | $8.48 | | | | $22.61 | | | | $23.82 | | | | $21.18 | | | | $25.22 | |
Total return3 | | | (0.12 | )% | | | (6.79 | )% | | | 8.81 | % | | | 22.43 | % | | | (4.12 | )% | | | 8.68 | % |
Ratios to average net assets (annualized) | | | | | | | | | | | | | | | | | | | | | | | | |
Gross expenses | | | 0.91 | % | | | 0.89 | % | | | 1.07 | % | | | 1.03 | % | | | 1.05 | % | | | 0.92 | % |
Net expenses | | | 0.60 | % | | | 0.71 | % | | | 0.95 | % | | | 0.95 | % | | | 0.95 | % | | | 0.92 | % |
Net investment income | | | 0.82 | % | | | 0.41 | % | | | 0.37 | % | | | 0.56 | % | | | 0.71 | % | | | 0.59 | % |
Supplemental data | | | | | | | | | | | | | | | | | | | | | | | | |
Portfolio turnover rate | | | 37 | % | | | 176 | % | | | 48 | % | | | 73 | % | | | 59 | % | | | 60 | % |
Net assets, end of period (000s omitted) | | | $10,277 | | | | $25,658 | | | | $67,798 | | | | $54,375 | | | | $263 | | | | $11 | |
| 1 | For the period from October 31, 2014 (commencement of class operations) to March 31, 2015 |
| 2 | Calculated based upon average shares outstanding |
| 3 | Returns for periods of less than one year are not annualized. |
The accompanying notes are an integral part of these financial statements.
22 | Wells Fargo Disciplined Small Cap Fund
Notes to financial statements (unaudited)
1. ORGANIZATION
Wells Fargo Funds Trust (the “Trust”), a Delaware statutory trust organized on March 10, 1999, is an open-end management investment company registered under the Investment Company Act of 1940, as amended (the “1940 Act”). As an investment company, the Trust follows the accounting and reporting guidance in Financial Accounting Standards Board (“FASB”) Accounting Standards Codification Topic 946, Financial Services – Investment Companies. These financial statements report on the Wells Fargo Disciplined Small Cap Fund (the “Fund”) which is a diversified series of the Trust.
2. SIGNIFICANT ACCOUNTING POLICIES
The following significant accounting policies, which are consistently followed in the preparation of the financial statements of the Fund, are in conformity with U.S. generally accepted accounting principles which require management to make estimates and assumptions that affect the reported amounts of assets and liabilities, disclosure of contingent assets and liabilities at the date of the financial statements, and the reported amounts of revenues and expenses during the reporting period. Actual results could differ from those estimates.
Securities valuation
All investments are valued each business day as of the close of regular trading on the New York Stock Exchange (generally 4 p.m. Eastern Time), although the Fund may deviate from this calculation time under unusual or unexpected circumstances.
Equity securities and futures contracts that are listed on a foreign or domestic exchange or market are valued at the official closing price or, if none, the last sales price. If no sale occurs on the principal exchange or market that day, a fair value price will be determined in accordance with the Fund’s Valuation Procedures.
The values of securities denominated in foreign currencies are translated into U.S. dollars at rates provided by an independent foreign currency pricing source at a time each business day specified by the Wells Fargo Asset Management Pricing Committee at Wells Fargo Funds Management, LLC (“Funds Management”).
Many securities markets and exchanges outside the U.S. close prior to the close of the New York Stock Exchange and therefore may not fully reflect trading or events that occur after the close of the principal exchange in which the foreign securities are traded, but before the close of the New York Stock Exchange. If such trading or events are expected to materially affect the value of such securities, then fair value pricing procedures approved by the Board of Trustees of the Fund are applied. These procedures take into account multiple factors including movements in U.S. securities markets after foreign exchanges close. Foreign securities that are fair valued under these procedures are categorized as Level 2 and the application of these procedures may result in transfers between Level 1 and Level 2. Depending on market activity, such fair valuations may be frequent. Such fair value pricing may result in net asset values that are higher or lower than net asset values based on the last reported sales price or latest quoted bid price. On September 30, 2019, such fair value pricing was not used in pricing foreign securities.
Investments in registered open-end investment companies are valued at net asset value. Interests in non-registered investment companies that are redeemable at net asset value are fair valued normally at net asset value.
Investments which are not valued using any of the methods discussed above are valued at their fair value, as determined in good faith by the Board of Trustees of the Fund. The Board of Trustees has established a Valuation Committee comprised of the Trustees and has delegated to it the authority to take any actions regarding the valuation of portfolio securities that the Valuation Committee deems necessary or appropriate, including determining the fair value of portfolio securities, unless the determination has been delegated to the Wells Fargo Asset Management Pricing Committee. The Board of Trustees retains the authority to make or ratify any valuation decisions or approve any changes to the Valuation Procedures as it deems appropriate. On a quarterly basis, the Board of Trustees receives reports on any valuation actions taken by the Valuation Committee or the Wells Fargo Asset Management Pricing Committee which may include items for ratification.
Foreign currency translation
The accounting records of the Fund are maintained in U.S. dollars. The values of other assets and liabilities denominated in foreign currencies are translated into U.S. dollars at rates provided by an independent foreign currency pricing source at a time each business day specified by the Wells Fargo Asset Management Pricing Committee. Purchases and sales of securities, and income and expenses are converted at the rate of exchange on the respective dates of such transactions. Net realized foreign exchange gains or losses arise from sales of foreign currencies, currency gains or losses realized between the trade and settlement dates on securities transactions, and the difference between the amounts of dividends, interest and foreign withholding taxes recorded and the U.S. dollar equivalent of the amounts actually paid or received. Net unrealized foreign exchange gains and losses arise from changes in the fair value of assets and liabilities other than investments in securities resulting from changes in exchange rates. The changes in net assets arising from changes in exchange rates of securities and the changes in net assets resulting from changes in market prices of securities are not separately presented. Such changes are included in net realized and unrealized gains or losses from investments.
Wells Fargo Disciplined Small Cap Fund | 23
Notes to financial statements (unaudited)
Securities lending
The Fund may lend its securities from time to time in order to earn additional income in the form of fees or interest on securities received as collateral or the investment of any cash received as collateral. When securities are on loan, the Fund receives interest or dividends on those securities. Cash collateral received in connection with its securities lending transactions is invested in Securities Lending Cash Investments, LLC (the “Securities Lending Fund”). Investments in Securities Lending Fund are valued at the evaluated bid price provided by an independent pricing service. Income earned from investment in the Securities Lending Fund (net of fees and rebates), if any, is included in securities lending income from affiliates on the Statement of Operations.
In a securities lending transaction, the net asset value of the Fund is affected by an increase or decrease in the value of the securities loaned and by an increase or decrease in the value of the instrument in which collateral is invested. The amount of securities lending activity undertaken by the Fund fluctuates from time to time. The Fund has the right under the lending agreement to recover the securities from the borrower on demand. In the event of default or bankruptcy by the borrower, the Fund may be prevented from recovering the loaned securities or gaining access to the collateral or may experience delays or costs in doing so. In such an event, the terms of the agreement allows the unaffiliated securities lending agent to use the collateral to purchase replacement securities on behalf of the Fund or pay the Fund the market value of the loaned securities. The Fund bears the risk of loss with respect to depreciation of its investment of the cash collateral.
Futures contracts
Futures contracts are agreements between the Fund and a counterparty to buy or sell a specific amount of a commodity, financial instrument or currency at a specified price and on a specified date. The Fund may buy and sell futures contracts in order to gain exposure to, or protect against, changes in security values and is subject to equity price risk. The primary risks associated with the use of futures contracts are the imperfect correlation between changes in market values of securities held by the Fund and the prices of futures contracts, and the possibility of an illiquid market. Futures contracts are generally entered into on a regulated futures exchange and cleared through a clearinghouse associated with the exchange. With futures contracts, there is minimal counterparty risk to the Fund since futures contracts are exchange traded and the exchange’s clearinghouse, as the counterparty to all exchange traded futures, guarantees the futures contracts against default.
Upon entering into a futures contracts, the Fund is required to deposit either cash or securities (initial margin) with the broker in an amount equal to a certain percentage of the contract value. Subsequent payments (variation margin) are paid to or from the broker each day equal to the daily changes in the contract value. Such payments are recorded as unrealized gains or losses and, if any, shown as variation margin receivable (payable) in the Statement of Assets and Liabilities. Should the Fund fail to make requested variation margin payments, the broker can gain access to the initial margin to satisfy the Fund’s payment obligations. When the contracts are closed, a realized gain or loss is recorded in the Statement of Operations.
Security transactions and income recognition
Securities transactions are recorded on a trade date basis. Realized gains or losses are recorded on the basis of identified cost.
Dividend income is recognized on the ex-dividend date, except for certain dividends from foreign securities, which are recorded as soon as the custodian verifies the ex-dividend date. Dividend income from foreign securities is recorded net of foreign taxes withheld where recovery of such taxes is not assured.
Distributions to shareholders
Distributions to shareholders from net investment income and any net realized gains are recorded on the ex-dividend date and paid at least annually. Such distributions are determined in accordance with income tax regulations and may differ from U.S. generally accepted accounting principles. Dividend sources are estimated at the time of declaration. The tax character of distributions is determined as of the Fund’s fiscal year end. Therefore, a portion of the Fund’s distributions made prior to the Fund’s fiscal year end may be categorized as a tax return of capital at year end.
Federal and other taxes
The Fund intends to continue to qualify as a regulated investment company by distributing substantially all of its investment company taxable income and any net realized capital gains (after reduction for capital loss carryforwards) sufficient to relieve it from all, or substantially all, federal income taxes. Accordingly, no provision for federal income taxes was required.
The Fund’s income and federal excise tax returns and all financial records supporting those returns for the prior three fiscal years are subject to examination by the federal and Delaware revenue authorities. Management has analyzed the Fund’s tax positions taken on federal, state, and foreign tax returns for all open tax years and does not believe that there are any uncertain tax positions that require recognition of a tax liability.
24 | Wells Fargo Disciplined Small Cap Fund
Notes to financial statements (unaudited)
As of September 30, 2019, the aggregate cost of all investments for federal income tax purposes was $59,775,816 and the unrealized gains (losses) consisted of:
| | | | |
| |
Gross unrealized gains | | $ | 4,821,517 | |
| |
Gross unrealized losses | | | (6,016,690 | ) |
| |
Net unrealized losses | | $ | (1,195,173 | ) |
As of March 31, 2019, the Fund had current year net deferred post-October capital losses consisting of $1,969,221 in short-term losses which were recognized on the first day of the current fiscal year.
Class allocations
The separate classes of shares offered by the Fund differ principally in applicable sales charges, shareholder servicing, and administration fees. Class specific expenses are charged directly to that share class. Investment income, common fund-level expenses, and realized and unrealized gains (losses) on investments are allocated daily to each class of shares based on the relative proportion of net assets of each class.
3. FAIR VALUATION MEASUREMENTS
Fair value measurements of investments are determined within a framework that has established a fair value hierarchy based upon the various data inputs utilized in determining the value of the Fund’s investments. The three-level hierarchy gives the highest priority to unadjusted quoted prices in active markets for identical assets or liabilities (Level 1) and the lowest priority to unobservable inputs (Level 3). The Fund’s investments are classified within the fair value hierarchy based on the lowest level of input that is significant to the fair value measurement. The inputs are summarized into three broad levels as follows:
| ∎ | | Level 1 – quoted prices in active markets for identical securities |
| ∎ | | Level 2 – other significant observable inputs (including quoted prices for similar securities, interest rates, prepayment speeds, credit risk, etc.) |
| ∎ | | Level 3 – significant unobservable inputs (including the Fund’s own assumptions in determining the fair value of investments) |
The inputs or methodologies used for valuing investments in securities are not necessarily an indication of the risk associated with investing in those securities.
The following is a summary of the inputs used in valuing the Fund’s assets and liabilities as of September 30, 2019:
| | | | | | | | | | | | | | | | |
| | | | |
| | | Quoted prices (Level 1) | | | Other significant
observable inputs
(Level 2) | | | Significant
unobservable inputs (Level 3) | | | Total | |
| | | | |
Assets | | | | | | | | | | | | | | | | |
Investments in: | | | | | | | | | | | | | | | | |
| | | | |
Common stocks | | | | | | | | | | | | | | | | |
| | | | |
Communication services | | $ | 1,409,804 | | | $ | 0 | | | $ | 0 | | | $ | 1,409,804 | |
| | | | |
Consumer discrepancy | | | 6,358,205 | | | | 0 | | | | 0 | | | | 6,358,205 | |
| | | | |
Consumer staples | | | 1,443,248 | | | | 0 | | | | 0 | | | | 1,443,248 | |
| | | | |
Energy | | | 2,335,200 | | | | 0 | | | | 0 | | | | 2,335,200 | |
| | | | |
Financials | | | 9,779,096 | | | | 0 | | | | 0 | | | | 9,779,096 | |
| | | | |
Health care | | | 9,092,967 | | | | 0 | | | | 0 | | | | 9,092,967 | |
| | | | |
Industrials | | | 9,173,055 | | | | 0 | | | | 0 | | | | 9,173,055 | |
| | | | |
Information technology | | | 8,289,102 | | | | 0 | | | | 0 | | | | 8,289,102 | |
| | | | |
Materials | | | 1,713,579 | | | | 0 | | | | 0 | | | | 1,713,579 | |
| | | | |
Real estate | | | 5,083,655 | | | | 0 | | | | 0 | | | | 5,083,655 | |
| | | | |
Utilities | | | 1,912,470 | | | | 0 | | | | 0 | | | | 1,912,470 | |
| | | | |
Short-term investments | | | | | | | | | | | | | | | | |
| | | | |
Investment companies | | | 1,876,129 | | | | 0 | | | | 0 | | | | 1,876,129 | |
| | | | |
U.S. Treasury securities | | | 129,393 | | | | 0 | | | | 0 | | | | 129,393 | |
| | | | |
Total assets | | $ | 58,595,903 | | | $ | 0 | | | $ | 0 | | | $ | 58,595,903 | |
| | | | |
Liabilities | | | | | | | | | | | | | | | | |
| | | | |
Futures contracts | | | 15,260 | | | | 0 | | | | 0 | | | | 15,260 | |
| | | | |
Total liabilities | | $ | 15,260 | | | $ | 0 | | | $ | 0 | | | $ | 15,260 | |
Wells Fargo Disciplined Small Cap Fund | 25
Notes to financial statements (unaudited)
Futures contracts are reported at their cumulative unrealized gains (losses) at measurement date as reported in the table following the Portfolio of Investments. For futures contracts, the current day’s variation margin is reported on the Statement of Assets and Liabilities. All other assets and liabilities are reported at their market value at measurement date.
Additional sector, industry or geographic detail is included in the Portfolio of Investments.
For the six months ended September 30, 2019, the Fund did not have any transfers into/out of Level 3.
4. TRANSACTIONS WITH AFFILIATES
Management fee
Funds Management an indirect wholly owned subsidiary of Wells Fargo & Company (“Wells Fargo”), is the manager of the Fund and provides advisory and fund-level administrative services under an investment management agreement. Under the investment management agreement, Funds Management is responsible for, among other services, implementing the investment objectives and strategies of the Fund, supervising the subadviser and providing fund-level administrative services in connection with the Fund’s operations. As compensation for its services under the investment management agreement, Funds Management is entitled to receive a management fee at the following annual rate based on the Fund’s average daily net assets:
| | | | |
| |
| Average daily net assets | | Management fee | |
| |
First $1 billion | | | 0.500 | % |
| |
Next $4 billion | | | 0.475 | |
| |
Next $5 billion | | | 0.440 | |
| |
Over $10 billion | | | 0.430 | |
For the six months ended September 30, 2019, the management fee was equivalent to an annual rate of 0.50% of the Fund’s average daily net assets.
Funds Management has retained the services of a subadviser to provide daily portfolio management to the Fund. The fee for subadvisory services is borne by Funds Management. Wells Capital Management Incorporated (“WellsCap”), an affiliate of Funds Management and an indirect wholly owned subsidiary of Wells Fargo, is the subadviser to the Fund and is entitled to receive a fee from Funds Management at an annual rate starting at 0.35% and declining to 0.25% as the average daily net assets of the Fund increase.
Administration fees
Under a class-level administration agreement, Funds Management provides class-level administrative services to the Fund, which includes paying fees and expenses for services provided by the transfer agent, sub-transfer agents, omnibus account servicers and record-keepers. As compensation for its services under the class-level administration agreement, Funds Management receives an annual fee which is calculated based on the average daily net assets of each class as follows:
| | | | |
| |
| | | Class-level
administration fee | |
| |
Class A | | | 0.21 | % |
| |
Class R6 | | | 0.03 | |
| |
Administrator Class, Institutional Class | | | 0.13 | |
Waivers and/or expense reimbursements
Funds Management has contractually waived and/or reimbursed management and administration fees to the extent necessary to maintain certain net operating expense ratios for the Fund. When each class of the Fund has exceeded its expense cap, Funds Management has waived fees and/or reimbursed expenses from fund-level expenses on a proportionate basis and then from class specific expenses. When only certain classes exceed their expense caps, waivers and/or reimbursements are applied against class specific expenses before fund-level expenses. Funds Management has committed through July 31, 2020 to waive fees and/or reimburse expenses to the extent necessary to cap the Fund’s expenses at 0.93% for Class A shares, 0.50% for Class R6 shares, 0.85% for Administrator Class shares, and 0.60% for Institutional Class shares. Prior to or after the commitment expiration date, the cap may be increased or the commitment to maintain the cap may be terminated only with the approval of the Board of Trustees.
26 | Wells Fargo Disciplined Small Cap Fund
Notes to financial statements (unaudited)
Sales charges
Wells Fargo Funds Distributor, LLC (“Funds Distributor’), the principal underwriter, is entitled to receive the front-end sales charge from the purchase of Class A shares and a contingent deferred sales charge on the redemption of certain Class A shares. Funds Distributor did not receive any front-end or contingent deferred sales charges from Class A shares for the six months ended September 30, 2019.
Shareholder servicing fees
The Trust has entered into contracts with one or more shareholder servicing agents, whereby Class A and Administrator Class of the Fund are charged a fee at an annual rate of 0.25% of the average daily net assets of each respective class. A portion of these total shareholder servicing fees were paid to affiliates of Wells Fargo.
Interfund transactions
The Fund may purchase or sell portfolio investment securities to certain other Wells Fargo affiliates pursuant to Rule 17a-7 under the 1940 Act and under procedures adopted by the Board of Trustees. The procedures have been designed to ensure that these interfund transactions, which do not incur broker commissions, are effected at current market prices.
5. INVESTMENT PORTFOLIO TRANSACTIONS
Purchases and sales of investments, excluding U.S. government obligations (if any) and short-term securities, for the six months ended September 30, 2019 were $24,991,384 and $46,632,170, respectively.
6. SECURITIES LENDING TRANSACTIONS
The Fund lends its securities through an unaffiliated securities lending agent and receives collateral in the form of cash or securities with a value at least equal to the value of the securities on loan. The value of the loaned securities is determined at the close of each business day and any increases or decreases in the required collateral are exchanged between the Fund and the counterparty on the next business day. Cash collateral received is invested in the Securities Lending Fund which seeks to provide a positive return compared to the daily Fed Funds Open Rate by investing in high-quality, U.S. dollar-denominated short-term money market instruments and is exempt from registration under Section 3(c)(7) of the 1940 Act. Securities Lending Fund is managed by Funds Management and is subadvised by WellsCap. Funds Management receives an advisory fee starting at 0.05% and declining to 0.01% as the average daily net assets of the Securities Lending Fund increase. All of the fees received by Funds Management are paid to WellsCap for its services as subadviser.
In the event of counterparty default or the failure of a borrower to return a loaned security, the Fund has the right to use the collateral to offset any losses incurred. As of September 30, 2019, the Fund had securities lending transactions with the following counterparties which are subject to offset:
| | | | | | | | | | | | |
| | | |
| Counterparty | | Value of
securities on
loan | | | Collateral received1 | | | Net amount | |
| | | |
Bank of America Securities Inc. | | $ | 338,400 | | | $ | (338,400 | ) | | $ | 0 | |
| | | |
Citigroup Global Markets Inc. | | | 55,777 | | | | (55,777 | ) | | | 0 | |
| | | |
JPMorgan Securities LLC | | | 411,472 | | | | (411,472 | ) | | | 0 | |
| | | |
Morgan Stanley & Co. LLC | | | 580,877 | | | | (580,877 | ) | | | 0 | |
| | | |
SG Americas Securities LLC | | | 19,485 | | | | (19,485 | ) | | | 0 | |
| 1 | Collateral received within this table is limited to the collateral for the net transaction with the counterparty. |
7. DERIVATIVE TRANSACTIONS
During the six months ended September 30, 2019, the Fund entered into futures contracts for economic hedging purposes. The Fund had an average notional amount of $929,590 in long futures contracts during the six months ended September 30, 2019.
The fair value, realized gains or losses and change in unrealized gains or losses, if any, on derivative instruments are reflected in the corresponding financial statement captions.
8. BANK BORROWINGS
The Trust (excluding the money market funds), Wells Fargo Master Trust and Wells Fargo Variable Trust are parties to a $280,000,000 revolving credit agreement whereby the Fund is permitted to use bank borrowings for temporary or emergency
Wells Fargo Disciplined Small Cap Fund | 27
Notes to financial statements (unaudited)
purposes, such as to fund shareholder redemption requests. Interest under the credit agreement is charged to the Fund based on a borrowing rate equal to the higher of the Federal Funds rate in effect on that day plus 1.25% or the overnight LIBOR rate in effect on that day plus 1.25%. In addition, an annual commitment fee equal to 0.25% of the unused balance is allocated to each participating fund.
During the six months ended September 30, 2019, the Fund had average borrowings outstanding of $15,203 (on an annualized basis) at an average interest rate of 3.69% and paid interest in the amount of $561.
9. INDEMNIFICATION
Under the Trust’s organizational documents, the officers and Trustees have been granted certain indemnification rights against certain liabilities that may arise out of performance of their duties to the Trust. Additionally, in the normal course of business, the Trust may enter into contracts with service providers that contain a variety of indemnification clauses. The Trust’s maximum exposure under these arrangements is dependent on future claims that may be made against the Fund and, therefore, cannot be estimated.
10. NEW ACCOUNTING PRONOUNCEMENT
In August 2018, FASB issued Accounting Standards Update (“ASU”) No. 2018-13, Fair Value Measurement (Topic 820)Disclosure Framework—Changes to the Disclosure Requirements for Fair Value Measurement. ASU 2018-13 updates the disclosure requirements for fair value measurements by modifying or removing certain disclosures and adding certain new disclosures. The amendments are effective for fiscal years, and interim periods within those fiscal years, beginning after December 15, 2019. Early adoption is permitted. Management has adopted the removal and modification of disclosures early, as permitted, and will adopt the additional new disclosures at the effective date.
28 | Wells Fargo Disciplined Small Cap Fund
Other information (unaudited)
PROXY VOTING INFORMATION
A description of the policies and procedures used to determine how to vote proxies relating to portfolio securities is available, upon request, by calling1-800-222-8222, visiting our website atwfam.com, or visiting the SEC website at sec.gov. Information regarding how the proxies related to portfolio securities were voted during the most recent 12-month period ended June 30 is available on the website atwfam.comor by visiting the SEC website at sec.gov.
QUARTERLY PORTFOLIO HOLDINGS INFORMATION
The Fund files its complete schedule of portfolio holdings with the SEC for the first and third quarters of each fiscal year on Form N-Q or Form N-PORT, which is available by visiting the SEC website at sec.gov. Those forms may be reviewed and copied at the SEC’s Public Reference Room in Washington, DC. Information on the operation of the Public Reference Room may be obtained by calling 1-800-SEC-0330.
Wells Fargo Disciplined Small Cap Fund | 29
Other information (unaudited)
BOARD OF TRUSTEES AND OFFICERS
Each of the Trustees and Officers1 listed in the table below acts in identical capacities for each fund in the Wells Fargo family of funds, which consists of 150 mutual funds comprising the Wells Fargo Funds Trust, Wells Fargo Variable Trust, Wells Fargo Master Trust and four closed-end funds (collectively the “Fund Complex”). This table should be read in conjunction with the Prospectus and the Statement of Additional Information2. The mailing address of each Trustee and Officer is 525 Market Street, 12th Floor, San Francisco, CA 94105. Each Trustee and Officer serves an indefinite term, however, each Trustee serves such term until reaching the mandatory retirement age established by the Trustees.
Independent Trustees
| | | | | | |
Name and year of birth | | Position held and length of service* | | Principal occupations during past five years or longer | | Current other
public company or
investment
company
directorships |
| | | |
William R. Ebsworth (Born 1957) | | Trustee, since 2015 | | Retired. From 1984 to 2013, equities analyst, portfolio manager, research director and chief investment officer at Fidelity Management and Research Company in Boston, Tokyo, and Hong Kong, and retired in 2013 as Chief Investment Officer of Fidelity Strategic Advisers, Inc. where he led a team of investment professionals managing client assets. Prior thereto, Board member of Hong Kong Securities Clearing Co., Hong Kong Options Clearing Corp., the Thailand International Fund, Ltd., Fidelity Investments Life Insurance Company, and Empire Fidelity Investments Life Insurance Company. Audit Committee Chair and Investment Committee Chair of the Vincent Memorial Hospital Endowment (non-profit organization). Mr. Ebsworth is a CFA® charterholder. | | N/A |
| | | |
Jane A. Freeman (Born 1953) | | Trustee, since 2015; Chair Liaison, since 2018 | | Retired. From 2012 to 2014 and 1999 to 2008, Chief Financial Officer of Scientific Learning Corporation. From 2008 to 2012, Ms. Freeman provided consulting services related to strategic business projects. Prior to 1999, Portfolio Manager at Rockefeller & Co. and Scudder, Stevens & Clark. Board member of the Harding Loevner Funds from 1996 to 2014, serving as both Lead Independent Director and chair of the Audit Committee. Board member of the Russell Exchange Traded Funds Trust from 2011 to 2012 and the chair of the Audit Committee. Ms. Freeman is a Board Member of The Ruth Bancroft Garden (non-profit organization). She is also an inactive Chartered Financial Analyst. | | N/A |
| | | |
Isaiah Harris, Jr. (Born 1952) | | Trustee, since 2009; Audit Committee Chairman, since 2019 | | Retired. Chairman of the Board of CIGNA Corporation since 2009, and Director since 2005. From 2003 to 2011, Director of Deluxe Corporation. Prior thereto, President and CEO of BellSouth Advertising and Publishing Corp. from 2005 to 2007, President and CEO of BellSouth Enterprises from 2004 to 2005 and President of BellSouth Consumer Services from 2000 to 2003. Emeritus member of the Iowa State University Foundation Board of Governors. Emeritus Member of the Advisory Board of Iowa State University School of Business. Advisory Board Member, Palm Harbor Academy (private school). Advisory Board Member, Child Evangelism Fellowship (non-profit). Mr. Harris is a certified public accountant (inactive status). | | CIGNA Corporation |
| | | |
Judith M. Johnson (Born 1949) | | Trustee, since 2008; Audit Committee Chairman, from 2009 to 2018 | | Retired. Prior thereto, Chief Executive Officer and Chief Investment Officer of Minneapolis Employees Retirement Fund from 1996 to 2008. Ms. Johnson is an attorney, certified public accountant and a certified managerial accountant. | | N/A |
30 | Wells Fargo Disciplined Small Cap Fund
Other information (unaudited)
| | | | | | |
Name and year of birth | | Position held and length of service* | | Principal occupations during past five years or longer | | Current other
public company or
investment
company
directorships |
| | | |
David F. Larcker
(Born 1950) | | Trustee, since 2009 | | James Irvin Miller Professor of Accounting at the Graduate School of Business, Stanford University, Director of the Corporate Governance Research Initiative and Senior Faculty of The Rock Center for Corporate Governance since 2006. From 2005 to 2008, Professor of Accounting at the Graduate School of Business, Stanford University. Prior thereto, Ernst & Young Professor of Accounting at The Wharton School, University of Pennsylvania from 1985 to 2005. | | N/A |
| | | |
Olivia S. Mitchell (Born 1953) | | Trustee, since 2006; Nominating and Governance Committee Chairman, since 2018 | | International Foundation of Employee Benefit Plans Professor, Wharton School of the University of Pennsylvania since 1993. Director of Wharton’s Pension Research Council and Boettner Center on Pensions & Retirement Research, and Research Associate at the National Bureau of Economic Research. Previously, Cornell University Professor from 1978 to 1993. | | N/A |
| | | |
Timothy J. Penny
(Born 1951) | | Trustee, since 1996; Chairman, since 2018 | | President and Chief Executive Officer of Southern Minnesota Initiative Foundation, a non-profit organization, since 2007. Member of the Board of Trustees of NorthStar Education Finance, Inc., a non-profit organization, since 2007. | | N/A |
| | | |
James G. Polisson
(Born 1959) | | Trustee, since 2018 | | Retired. Chief Marketing Officer, Source (ETF) UK Services, Ltd, from 2015 to 2017. From 2012 to 2015, Principal of The Polisson Group, LLC, a management consulting, corporate advisory and principal investing company. Chief Executive Officer and Managing Director at Russell Investments, Global Exchange Traded Funds from 2010 to 2012. Managing Director of Barclays Global Investors from 1998 to 2010 and Global Chief Marketing Officer for iShares and Barclays Global Investors from 2000 to 2010. Trustee of the San Francisco Mechanics’ Institute, a non-profit organization, from 2013 to 2015. Board member of the Russell Exchange Traded Fund Trust from 2011 to 2012. Director of Barclays Global Investors Holdings Deutschland GmbH from 2006 to 2009. Mr. Polisson is an attorney and has a retired status with the Massachusetts and District of Columbia Bar Associations. | | N/A |
| * | Length of service dates reflect the Trustee’s commencement of service with the Trust’s predecessor entities, where applicable. |
Wells Fargo Disciplined Small Cap Fund | 31
Other information (unaudited)
Officers
| | | | |
Name and year of birth | | Position held and
length of service | | Principal occupations during past five years or longer |
| | |
Andrew Owen (Born 1960) | | President, since 2017 | | Executive Vice President of Wells Fargo & Company and Head of Affiliated Managers, Wells Fargo Asset Management, since 2014. In addition, Mr. Owen is currently President, Chief Executive Officer and Director of Wells Fargo Funds Management, LLC since 2017. Prior thereto, Executive Vice President responsible for marketing, investments and product development for Wells Fargo Funds Management, LLC, from 2009 to 2014. |
| | |
Nancy Wiser1 (Born 1967) | | Treasurer, since 2012 | | Executive Vice President of Wells Fargo Funds Management, LLC since 2011. Chief Operating Officer and Chief Compliance Officer at LightBox Capital Management LLC, from 2008 to 2011. |
| | |
Michelle Rhee3 (Born 1966) | | Chief Legal Officer, since 2019 | | Secretary of Wells Fargo Funds Management, LLC, Chief Legal Counsel of Wells Fargo Asset Management and Assistant General Counsel of Wells Fargo Bank, N.A. since 2018. Associate General Counsel and Managing Director of Bank of America Corporation from 2004 to 2018. |
| | |
Catherine Kennedy4 (Born 1969) | | Secretary, since 2019 | | Vice President of Wells Fargo Funds Management, LLC and Senior Counsel of the Wells Fargo Legal Department since 2010. Vice President and Senior Counsel of Evergreen Investment Management Company, LLC from 1998 to 2010. |
| | |
Michael H. Whitaker (Born 1967) | | Chief Compliance Officer, since 2016 | | Chief Compliance Officer of Wells Fargo Asset Management since 2016. Senior Vice President and Chief Compliance Officer for Fidelity Investments from 2007 to 2016. |
| | |
| David Berardi (Born 1975) | | Assistant Treasurer, since 2009 | | Vice President of Wells Fargo Funds Management, LLC since 2009. Vice President of Evergreen Investment Management Company, LLC from 2008 to 2010. Manager of Fund Reporting and Control for Evergreen Investment Management Company, LLC from 2004 to 2010. |
| | |
| Jeremy DePalma1 (Born 1974) | | Assistant Treasurer, since 2009 | | Senior Vice President of Wells Fargo Funds Management, LLC since 2009. Senior Vice President of Evergreen Investment Management Company, LLC from 2008 to 2010 and head of the Fund Reporting and Control Team within Fund Administration from 2005 to 2010. |
| 1 | Nancy Wiser acts as Treasurer of 64 funds in the Fund Complex. Jeremy DePalma acts as Treasurer of 86 funds and Assistant Treasurer of 64 funds in the Fund Complex. |
| 2 | The Statement of Additional Information includes additional information about the Trustees and is available, without charge, upon request, by calling1-800-222-8222 or by visiting the website atwfam.com. |
| 3 | Michelle Rhee became Chief Legal Officer effective October 22, 2019. |
| 4 | Catherine Kennedy became Secretary effective October 22, 2019. |
32 | Wells Fargo Disciplined Small Cap Fund
Other information (unaudited)
BOARD CONSIDERATION OF INVESTMENT MANAGEMENT AND SUB-ADVISORY AGREEMENTS:
Wells Fargo Disciplined Small Cap Fund
Under the Investment Company Act of 1940 (the “1940 Act”), the Board of Trustees (the “Board”) of Wells Fargo Funds Trust (the “Trust”) must determine annually whether to approve the continuation of the Trust’s investment management and sub-advisory agreements. In this regard, at an in-person meeting held on May 21-22, 2019 (the “Meeting”), the Board, all the members of which have no direct or indirect interest in the investment management and sub-advisory agreements and are not “interested persons” of the Trust, as defined in the 1940 Act (the “Independent Trustees”), reviewed and approved for Wells Fargo Disciplined Small Cap Fund (the “Fund”): (i) an investment management agreement (the “Management Agreement”) with Wells Fargo Funds Management, LLC (“Funds Management”); and (ii) an investment sub-advisory agreement (the “Sub-Advisory Agreement”) with Wells Capital Management Incorporated (the “Sub-Adviser”), an affiliate of Funds Management. The Management Agreement and theSub-Advisory Agreement are collectively referred to as the “Advisory Agreements.”
At the Meeting, the Board considered the factors and reached the conclusions described below relating to the selection of Funds Management and the Sub-Adviser and the approval of the Advisory Agreements. Prior to the Meeting, including at an in-person meeting in April 2019, the Trustees conferred extensively among themselves and with representatives of Funds Management about these matters. Also, the Board has adopted a team-based approach, with each team consisting of a sub-set of Trustees, to assist the full Board in the discharge of its duties in reviewing investment performance and other matters throughout the year. The Independent Trustees were assisted in their evaluation of the Advisory Agreements by independent legal counsel, from whom they received separate legal advice and with whom they met separately.
In providing information to the Board, Funds Management and the Sub-Adviser were guided by a detailed set of requests for information submitted to them by independent legal counsel on behalf of the Independent Trustees at the start of the Board’s annual contract renewal process earlier in 2019. In considering and approving the Advisory Agreements, the Trustees considered the information they believed relevant, including but not limited to the information discussed below. The Board considered not only the specific information presented in connection with the Meeting, but also the knowledge gained over time through interaction with Funds Management and the Sub-Adviser about various topics. In this regard, the Board reviewed reports of Funds Management at each of its quarterly meetings, which included, among other things, portfolio reviews and investment performance reports. In addition, the Board and the teams mentioned above confer with portfolio managers at various times throughout the year. The Board did not identify any particular information or consideration that was all-important or controlling, and each individual Trustee may have attributed different weights to various factors.
After its deliberations, the Board unanimously approved the continuation of the Advisory Agreements for a one-year term and determined that the compensation payable to Funds Management and the Sub-Adviser under each of the Advisory Agreements was reasonable. The Board considered the approval of the Advisory Agreements for the Fund as part of its consideration of agreements for funds across the complex, but its approvals were made on a fund-by-fund basis. The following summarizes a number of important, but not necessarily all, factors considered by the Board in support of its approvals.
Nature, extent and quality of services
The Board received and considered various information regarding the nature, extent and quality of services provided to the Fund by Funds Management and the Sub-Adviser under the Advisory Agreements. This information included a description of the investment advisory services and Fund-level administrative services covered by the Management Agreement, as well as, among other things, a summary of the background and experience of senior management of Wells Fargo Asset Management (“WFAM”), of which Funds Management and the Sub-Adviser are a part, a summary of investments made in the business of WFAM, a summary of certain organizational and personnel changes involving Funds Management and the Sub-Adviser, and a description of Funds Management’s and the Sub-Adviser’s business continuity planning programs and of their approaches to data privacy and cybersecurity. The Board received and reviewed information about Funds Management’s role as administrator of the Fund’s liquidity risk management program. The Board also considered the qualifications, background, tenure and responsibilities of each of the portfolio managers primarily responsible for the day-to-day portfolio management of the Fund.
The Board evaluated the ability of Funds Management and the Sub-Adviser to attract and retain qualified investment professionals, including research, advisory and supervisory personnel. The Board further considered the compliance programs and compliance records of Funds Management and the Sub-Adviser. In addition, the Board took into account the full range of services provided to the Fund by Funds Management and its affiliates.
Fund investment performance and expenses
The Board considered the investment performance results for the Fund over various time periods ended December 31, 2018. The Board considered these results in comparison to the investment performance of funds in a universe that was determined by
Wells Fargo Disciplined Small Cap Fund | 33
Other information (unaudited)
Broadridge Inc. (“Broadridge”) to be similar to the Fund (the “Universe”), and in comparison to the Fund’s benchmark index and to other comparative data. Broadridge is an independent provider of investment company data. The Board received a description of the methodology used by Broadridge to select the mutual funds in the performance Universe. The Board noted that the investment performance of the Fund (Administrator Class) was lower than the average investment performance of the Universe for the one-, three- and ten-year periods under review, but higher than the average investment performance of the Universe for the five-year period under review. The Board also noted that the investment performance of the Fund was lower than its benchmark index, the Russell 2000® Index, for all periods under review.
The Board received information concerning, and discussed factors contributing to, the underperformance of the Fund relative to the Universe and benchmark for the periods identified above. The Board took note of the explanations for the relative underperformance during these periods, including with respect to investment decisions and market factors that affected the Fund’s investment performance. The Board also noted that the Fund had changed sub-advisers and investment strategies in June 2018.
The Board also received and considered information regarding the Fund’s net operating expense ratios and their various components, including actual management fees, custodian and other non-management fees, and Rule 12b-1 and non-Rule 12b-1 shareholder service fees. The Board considered these ratios in comparison to the median ratios of funds in class-specific expense groups that were determined by Broadridge to be similar to the Fund (the “Groups”). The Board received a description of the methodology used by Broadridge to select the mutual funds in the expense Groups and an explanation of how funds comprising expense groups and their expense ratios may vary from year-to-year. Based on the Broadridge reports, the Board noted that the net operating expense ratios of the Fund were lower than the median net operating expense ratios of the expense Groups for each share class.
The Board took into account the Fund’s investment performance and expense information provided to it among the factors considered in deciding to re-approve the Advisory Agreements.
Investment management and sub-advisory fee rates
The Board reviewed and considered the contractual fee rates payable by the Fund to Funds Management under the Management Agreement, as well as the contractual fee rates payable by the Fund to Funds Management for class-level administrative services under a Class-Level Administration Agreement, which include, among other things, class-level transfer agency and sub-transfer agency costs (collectively, the “Management Rates”). The Board also reviewed and considered the contractual investmentsub-advisory fee rates that are payable by Funds Management to the Sub-Adviser for investment sub-advisory services.
Among other information reviewed by the Board was a comparison of the Fund’s Management Rates with the average contractual investment management fee rates of funds in the expense Groups at a common asset level as well as transfer agency costs of the funds in the expense Groups. The Board noted that the Management Rates of the Fund were lower than the sum of these average rates for the Fund’s expense Groups for all share classes.
The Board also received and considered information about the portion of the total management fee that was retained by Funds Management after payment of the fee to the Sub-Adviser for sub-advisory services. In assessing the reasonableness of this amount, the Board received and evaluated information about the nature and extent of responsibilities retained and risks assumed by Funds Management and not delegated to or assumed by the Sub-Adviser, and about Funds Management’s on-going oversight services. Given the affiliation between Funds Management and the Sub-Adviser, the Board ascribed limited relevance to the allocation of fees between them.
The Board also received and considered information about the nature and extent of services offered and fee rates charged by Funds Management and the Sub-Adviser to other types of clients with investment strategies similar to those of the Fund. In this regard, the Board received information about the significantly greater scope of services, and compliance, reporting and other legal burdens and risks of managing proprietary mutual funds compared with those associated with managing assets of other types of clients, including third-party sub-advised fund clients and non-mutual fund clients such as institutional separate accounts.
Based on its consideration of the factors and information it deemed relevant, including those described here, the Board determined that the compensation payable to Funds Management under the Management Agreement and to the Sub-Adviser under the Sub-Advisory Agreement was reasonable.
Profitability
The Board received and considered information concerning the profitability of Funds Management, as well as the profitability of both WFAM and Wells Fargo & Co. (“Wells Fargo”) from providing services to the fund family as a whole. The Board noted that the Sub-Adviser’s profitability information with respect to providing services to the Fund and other funds in the family was subsumed in the WFAM and Wells Fargo profitability analysis.
34 | Wells Fargo Disciplined Small Cap Fund
Other information (unaudited)
Funds Management reported on the methodologies and estimates used in calculating profitability, including a description of the methodology used to allocate certain expenses. Among other things, the Board noted that the levels of profitability reported on a fund-by-fund basis varied widely, depending on factors such as the size, type and age of fund. Based on its review, the Board did not deem the profits reported by Funds Management, WFAM or Wells Fargo from services provided to the Fund to be at a level that would prevent it from approving the continuation of the Advisory Agreements.
Economies of scale
The Board received and considered information about the potential for Funds Management to experience economies of scale in the provision of management services to the Fund, the difficulties of calculating economies of scale at an individual fund level, and the extent to which potential scale benefits are shared with shareholders. The Board noted the existence of breakpoints in the Fund’s management fee structure, which operate generally to reduce the Fund’s expense ratios as the Fund grows in size. The Board considered that in addition to management fee breakpoints, Funds Management shares potential economies of scale from its management business in a variety of ways, including through fee waiver and expense reimbursement arrangements, services that benefit shareholders, competitive management fee rates set at the outset without regard to breakpoints, and investments in the business intended to enhance services available to shareholders.
The Board concluded that Funds Management’s arrangements with respect to the Fund, including contractual breakpoints, constituted a reasonable approach to sharing potential economies of scale with the Fund and its shareholders.
Other benefits to Funds Management and the Sub-Adviser
The Board received and considered information regarding potential “fall-out” or ancillary benefits received by Funds Management and its affiliates, including the Sub-Adviser, as a result of their relationships with the Fund. Ancillary benefits could include, among others, benefits directly attributable to other relationships with the Fund and benefits potentially derived from an increase in Funds Management’s and the Sub-Adviser’s business as a result of their relationships with the Fund. The Board noted that various affiliates of Funds Management may receive distribution-related fees, shareholder servicing payments and sub-transfer agency fees in respect of shares sold or held through them and services provided.
The Board also reviewed information about soft dollar credits earned and utilized by the Sub-Adviser, fees earned by Funds Management and the Sub-Adviser from managing a private investment vehicle for the fund family’s securities lending collateral, and commissions earned by an affiliated broker from portfolio transactions.
Based on its consideration of the factors and information it deemed relevant, including those described here, the Board did not find that any ancillary benefits received by Funds Management and its affiliates, including the Sub-Adviser, were unreasonable.
Conclusion
At the Meeting, after considering the above-described factors and based on its deliberations and its evaluation of the information described above, the Board unanimously approved the continuation of the Advisory Agreements for a one-year term and determined that the compensation payable to Funds Management and the Sub-Adviser under each of the Advisory Agreements was reasonable.
Wells Fargo Disciplined Small Cap Fund | 35
This page is intentionally left blank.

For more information
More information about Wells Fargo Funds is available free upon request. To obtain literature, please write, visit the Fund’s website, or call:
Wells Fargo Funds
P.O. Box 219967
Kansas City, MO 64121-9967
Website:wfam.com
Individual investors:1-800-222-8222
Retail investment professionals:1-888-877-9275
Institutional investment professionals:1-866-765-0778

This report and the financial statements contained herein are submitted for the general information of the shareholders of the Fund. If this report is used for promotional purposes, distribution of the report must be accompanied or preceded by a current prospectus. Before investing, please consider the investment objectives, risks, charges, and expenses of the investment. For a current prospectus and, if available, a summary prospectus, containing this information, call1-800-222-8222 or visit the Fund’s website atwfam.com. Read the prospectus carefully before you invest or send money.
Wells Fargo Asset Management (WFAM) is the trade name for certain investment advisory/management firms owned by Wells Fargo & Company. These firms include but are not limited to Wells Capital Management Incorporated and Wells Fargo Funds Management, LLC. Certain products managed by WFAM entities are distributed by Wells Fargo Funds Distributor, LLC (a broker-dealer and Member FINRA).
This material is for general informational and educational purposes only and is NOT intended to provide investment advice or a recommendation of any kind—including a recommendation for any specific investment, strategy, or plan.
INVESTMENT PRODUCTS: NOT FDIC INSURED ◾ NO BANK GUARANTEE ◾ MAY LOSE VALUE
© 2019 Wells Fargo & Company. All rights reserved.
406819 11-19
SA243/SAR243 09-19
Semi-Annual Report
September 30, 2019
Wells Fargo
Special Small Cap Value Fund
Beginning on January 1, 2021, as permitted by new regulations adopted by the Securities and Exchange Commission, paper copies of the Wells Fargo Funds’ annual and semi-annual shareholder reports issued after this date will no longer be sent by mail, unless you specifically request paper copies of the reports. Instead, the reports will be made available on the Funds’ website, and you will be notified by mail each time a report is posted and provided with a website address to access the report.
If you already elected to receive shareholder reports electronically, you will not be affected by this change and you need not take any action. You may elect to receive shareholder reports and other communications from the Fund electronically at any time by contacting your financial intermediary (such as a broker-dealer or bank) or, if you are a direct investor, by calling1-800-222-8222 or by enrolling at wellsfargo.com/advantagedelivery.
You may elect to receive all future reports in paper free of charge. If you invest through a financial intermediary, you can contact your financial intermediary to request that you continue to receive paper copies of your shareholder reports; if you invest directly with the Fund, you can call 1-800-222-8222. Your election to receive reports in paper will apply to all Wells Fargo Funds held in your account with your financial intermediary or, if you are a direct investor, to all Wells Fargo Funds that you hold.
|
|
|
Reduce clutter. Save trees. |
Sign up for electronic delivery of prospectuses and shareholder reports at wellsfargo.com/ advantagedelivery |
The views expressed and any forward-looking statements are as of September 30, 2019, unless otherwise noted, and are those of the Fund managers and/or Wells Fargo Asset Management. Discussions of individual securities, or the markets generally, or any Wells Fargo Fund are not intended as individual recommendations. Future events or results may vary significantly from those expressed in any forward-looking statements. The views expressed are subject to change at any time in response to changing circumstances in the market. Wells Fargo Asset Management and the Fund disclaim any obligation to publicly update or revise any views expressed or forward-looking statements.
INVESTMENT PRODUCTS: NOT FDIC INSURED ◾ NO BANK GUARANTEE ◾ MAY LOSE VALUE
Wells Fargo Special Small Cap Value Fund | 1
Letter to shareholders (unaudited)

Andrew Owen
President
Wells Fargo Funds
“During the third quarter of 2019, investors regrouped.”
Dear Shareholder:
We are pleased to offer you this semi-annual report for the Wells Fargo Special Small Cap Value Fund for thesix-month period that ended September 30, 2019. U.S. stock and global bond investors generally saw markets recover during the second half amid intensifying market volatility, global economic growth concerns, international trade stare downs, and simmering geopolitical tensions.
Overall, fixed income kept pace with domestic stocks and outperformed foreign equities. For the period, U.S. stocks, based on the S&P 500 Index,1 gained 6.08% and international stocks, as measured by the MSCI ACWI ex USA Index (Net),2 added 1.13%. The MSCI EM Index (Net)3 fell by 3.66%. Among fixed income investors, the Bloomberg Barclays U.S. Aggregate Bond Index4 added 5.42%, the Bloomberg Barclays Global Aggregateex-USD Index5 gained 2.82%, the Bloomberg Barclays Municipal Bond Index6 increased 3.74%, and the ICE BofAML U.S. High Yield Index7 was up 3.82%.
Early second-quarter 2019 investor enthusiasm faded as the quarter wore on.
During April 2019, favorable sentiment found additional support in reports of sustained low inflation, solid employment data, and first-quarter U.S. gross domestic product growth at an annualized rate of 3.2%. During May, markets tumbled on mixed investment signals. In the U.S., partisan wrangling ramped up as Democrats and Republicans set their sights on 2020 presidential politics. The U.K.’s Brexit disagreements caused Prime Minister Theresa May to resign. Boris Johnson succeeded her only to exacerbate uncertainty about Brexit’s resolution ahead of an October 2019 deadline. The European Commission downgraded the 2019 growth forecast to 1.2%. The U.S. increased tariffs on products from China, China responded, and then talks broke down. President Donald Trump threatened to turn his foreign policy tariff tool to Mexico over immigration issues.
During the third quarter of 2019, investors regrouped. Just as the investment horizon appeared to darken, sentiment turned and U.S. equity markets gained during June and July. The gains, primarily driven by geopolitical and monetary policy events, pushed equity markets to new highs. European Central Bank President Mario Draghi said that if the outlook doesn’t improve, the bank would cut rates or buy more assets to prop up inflation. President Trump backed off of tariff threats against Mexico and China. In the U.S., the Federal Reserve (Fed) implemented a 0.25% federal funds rate cut in July.
| 1 | The S&P 500 Index consists of 500 stocks chosen for market size, liquidity, and industry group representation. It is a market-value-weighted index with each stock’s weight in the index proportionate to its market value. You cannot invest directly in an index. |
| 2 | The Morgan Stanley Capital International (MSCI) All Country World Index (ACWI) ex USA Index (Net) is a free-float-adjustedmarket-capitalization weighted index that is designed to measure the equity market performance of developed and emerging markets, excluding the U.S. Source: MSCI. MSCI makes no express or implied warranties or representations and shall have no liability whatsoever with respect to any MSCI data contained herein. The MSCI data may not be further redistributed or used as a basis for other indices or any securities or financial products. This report is not approved, reviewed, or produced by MSCI. You cannot invest directly in an index. |
| 3 | The MSCI Emerging Markets (EM) Index (Net) is a free-float-adjusted market-capitalization-weighted index that is designed to measure the equity market performance of emerging markets. You cannot invest directly in an index. |
| 4 | The Bloomberg Barclays U.S. Aggregate Bond Index is a broad-based benchmark that measures the investment-grade, U.S.dollar-denominated, fixed-rate taxable bond market, including Treasuries, government-related and corporate securities, mortgage-backed securities (agency fixed-rate and hybrid adjustable-rate mortgage pass-throughs), asset-backed securities, and commercialmortgage-backed securities. You cannot invest directly in an index. |
| 5 | The Bloomberg Barclays Global Aggregateex-USD Index is an unmanaged index that provides a broad-based measure of the global investment-grade fixed-income markets excluding the U.S. dollar-denominated debt market. You cannot invest directly in an index. |
| 6 | The Bloomberg Barclays Municipal Bond Index is an unmanaged index composed of long-termtax-exempt bonds with a minimum credit rating of Baa. You cannot invest directly in an index. |
| 7 | The ICE BofAML U.S. High Yield Index is a market-capitalization-weighted index of domestic and Yankee high-yield bonds. The index tracks the performance of high-yield securities traded in the U.S. bond market. You cannot invest directly in an index. Copyright 2019. ICE Data Indices, LLC. All rights reserved. |
2 | Wells Fargo Special Small Cap Value Fund
Letter to shareholders (unaudited)
Later in July 2019, the U.S. reversed course and threatened to impose higher tariffs on China’s exports after talks failed. China responded with tariff threats of its own and devalued the renminbi, a move that roiled global markets. Major U.S. stock market indices closed July with the worst weekly results of the year. Bond prices gained as Treasury yields fell to levels not seen since November 2016 and the yield curve inverted at multiple points along the30-year arc.
In a microcosm, August encapsulated many of the unnerving events that plagued investors during the prior 11 months. The U.S.-China trade relationship swung from antagonistic to hopeful and back again with no evident compromise on the horizon. Evidence of a continued global economic slowdown mounted. Central banks in China, New Zealand, and Thailand cut interest rates. Industrial and manufacturing data declined in China, Canada, Japan, and Germany. Adding to the uncertain environment, Italy’s prime minister resigned, many feared a crackdown in Hong Kong as protesters sustained their calls for reform throughout the month, and Boris Johnson planned to suspend Parliament as Brexit’s deadline neared.
In the U.S., September saw the Fed join other central banks in cutting interest rates. Manufacturing data in the U.S., as reported by the Institute for Supply Management, disappointed investors. The U.S. Congress announced it would pursue an impeachment investigation of President Trump. Meanwhile, the Brexit impasse showed no signs of resolution. Officials in China said that hitting the country’s economic growth goals for the year would be difficult considering the weight of tariffs and trade restrictions. So while the S&P 500 Index finished the third quarter withyear-to-date returns that were the best in more than 20 years, amid signs of equity investors taking money out of the stock market, concerns about future returns remained.
Don’t let short-term uncertainty derail long-term investment goals.
Periods of investment uncertainty can present challenges, but experience has taught us that maintaining long-term investment goals can be an effective way to plan for the future. To help you create a sound strategy based on your personal goals and risk tolerance, Wells Fargo Funds offers more than 100 mutual funds spanning a wide range of asset classes and investment styles. Although diversification cannot guarantee an investment profit or prevent losses, we believe it can be an effective way to manage investment risk and potentially smooth out overall portfolio performance. We encourage investors to know their investments and to understand that appropriate levels of risk-taking may unlock opportunities.
Thank you for choosing to invest with Wells Fargo Funds. We appreciate your confidence in us and remain committed to helping you meet your financial needs.
Sincerely,

Andrew Owen
President
Wells Fargo Funds
“In the U.S., September saw the Fed join other central banks in cutting interest rates.”
|
|
|
For further information about your Fund, contact your investment professional, visit our website at wfam.com, or call us directly at1-800-222-8222. |
Wells Fargo Special Small Cap Value Fund | 3
Performance highlights (unaudited)
The Fund is currently closed to most new investors.1
Investment objective
The Fund seeks long-term capital appreciation.
Manager
Wells Fargo Funds Management, LLC
Subadviser
Wells Capital Management Incorporated
Portfolio managers
Robert Rifkin, CFA®‡
James M. Tringas, CFA®‡
Bryant VanCronkhite, CFA®‡, CPA
Average annual total returns (%) as of September 30, 20192
| | | | | | | | | | | | | | | | | | | | | | | | | | | | | | | | | | |
| | | | |
| | | | | Including sales charge | | | Excluding sales charge | | | Expense ratios3 (%) | |
| | | | | | | | | |
| | | Inception date | | 1 year | | | 5 year | | | 10 year | | | 1 year | | | 5 year | | | 10 year | | | Gross | | | Net4 | |
| | | | | | | | | | |
| Class A (ESPAX) | | 5-7-1993 | | | -9.19 | | | | 7.32 | | | | 10.66 | | | | -3.65 | | | | 8.60 | | | | 11.32 | | | | 1.30 | | | | 1.30 | |
| | | | | | | | | | |
| Class C (ESPCX) | | 12-12-2000 | | | -5.39 | | | | 7.78 | | | | 10.49 | | | | -4.39 | | | | 7.78 | | | | 10.49 | | | | 2.05 | | | | 2.05 | |
| | | | | | | | | | |
| Class R (ESPHX)5 | | 9-30-2015 | | | – | | | | – | | | | – | | | | -3.88 | | | | 8.34 | | | | 11.03 | | | | 1.55 | | | | 1.55 | |
| | | | | | | | | | |
| Class R6 (ESPRX)6 | | 10-31-2014 | | | – | | | | – | | | | – | | | | -3.25 | | | | 9.06 | | | | 11.77 | | | | 0.87 | | | | 0.87 | |
| | | | | | | | | | |
| Administrator Class (ESPIX) | | 7-23-1996 | | | – | | | | – | | | | – | | | | -3.57 | | | | 8.74 | | | | 11.53 | | | | 1.22 | | | | 1.21 | |
| | | | | | | | | | |
| Institutional Class (ESPNX)7 | | 7-30-2010 | | | – | | | | – | | | | – | | | | -3.34 | | | | 9.00 | | | | 11.74 | | | | 0.97 | | | | 0.95 | |
| | | | | | | | | | |
| Russell 2000®Value Index8 | | – | | | – | | | | – | | | | – | | | | -8.24 | | | | 7.17 | | | | 10.06 | | | | – | | | | – | |
Figures quoted represent past performance, which is no guarantee of future results, and do not reflect taxes that a shareholder may pay on fund distributions or the redemption of fund shares. Investment return and principal value of an investment will fluctuate so that an investor’s shares, when redeemed, may be worth more or less than their original cost. Performance shown without sales charges would be lower if sales charges were reflected. Current performance may be lower or higher than the performance data quoted, which assumes the reinvestment of dividends and capital gains. Currentmonth-end performance is available on the Fund’s website,wfam.com.
Index returns do not include transaction costs associated with buying and selling securities, any mutual fund fees or expenses, or any taxes. It is not possible to invest directly in an index.
For Class A shares, the maximumfront-end sales charge is 5.75%. For Class C shares, the maximum contingent deferred sales charge is 1.00%. Performance including a contingent deferred sales charge assumes the sales charge for the corresponding time period. Class R, Class R6, Administrator Class, and Institutional Class shares are sold without afront-end sales charge or contingent deferred sales charge.
Stock values fluctuate in response to the activities of individual companies and general market and economic conditions. Smaller-company stocks tend to be more volatile and less liquid than those of larger companies. Consult the Fund’s prospectus for additional information on these and other risks.
Please see footnotes on page 5.
4 | Wells Fargo Special Small Cap Value Fund
Performance highlights (unaudited)
| | | | |
|
| Ten largest holdings (%) as of September 30, 20199 | |
| | |
Eagle Materials Incorporated | | | 2.82 | |
| | |
Innospec Incorporated | | | 2.28 | |
| | |
Neenah Paper Incorporated | | | 2.10 | |
| | |
Mueller Industries Incorporated | | | 2.09 | |
| | |
Denny’s Corporation | | | 2.06 | |
| | |
UMB Financial Corporation | | | 2.05 | |
| | |
Dine Brands Global Incorporated | | | 2.02 | |
| | |
Simpson Manufacturing Company Incorporated | | | 1.85 | |
| | |
Nomad Foods Limited | | | 1.81 | |
| | |
Franklin Electric Company Incorporated | | | 1.79 | |
|
|
| Sector distribution as of September 30, 201910 |
|
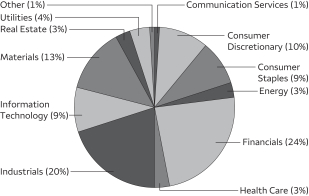 |
| ‡ | CFA® and Chartered Financial Analyst® are trademarks owned by CFA Institute. |
| 1 | Please see the Fund’s current Statement of Additional Information for further details. |
| 2 | Historical performance prior to July 19, 2010, is based on the performance of the Fund’s predecessor, Evergreen Special Values Fund. |
| 3 | Reflects the expense ratios as stated in the most recent prospectuses, which include the impact of 0.01% in acquired fund fees and expenses. The expense ratios shown are subject to change and may differ from the annualized expense ratios shown in the financial highlights of this report, which do not include acquired fund fees and expenses. |
| 4 | The manager has contractually committed through July 31, 2020, to waive fees and/or reimburse expenses to the extent necessary to cap the expenses of each class after fee waivers at 1.31% for Class A, 2.06% for Class C, 1.56% for Class R, 0.89% for Class R6, 1.20% for Administrator Class, and 0.94% for Institutional Class. Brokerage commissions, stamp duty fees, interest, taxes, acquired fund fees and expenses (if any), and extraordinary expenses are excluded from the expense cap. Prior to or after the commitment expiration date, the cap may be increased or the commitment to maintain the cap may be terminated only with the approval of the Board of Trustees. Without this cap, the Fund’s returns would have been lower. The expense ratio paid by an investor is the net expense ratio (the total annual fund operating expenses after fee waivers) as stated in the prospectuses. |
| 5 | Historical performance shown for Class R shares prior to their inception reflects the performance of the Institutional Class shares adjusted to reflect the higher expenses applicable to Class R shares. |
| 6 | Historical performance shown for Class R6 shares prior to their inception reflects the performance of the Institutional Class shares, and includes the higher expenses applicable to Institutional Class shares. If these expenses had not been included, returns for Class R6 shares would be higher. |
| 7 | Historical performance shown for Institutional Class shares prior to their inception reflects the performance of Administrator Class shares, and includes the higher expenses applicable to Administrator Class shares. If these expenses had not been included, returns for Institutional Class shares would be higher. |
| 8 | The Russell 2000® Value Index measures the performance of those Russell 2000 companies with lower price/book ratios and lower forecasted growth values. You cannot invest directly in an index. |
| 9 | The ten largest holdings, excluding cash, cash equivalents and any money market funds, are calculated based on the value of the investments divided by total net assets of the Fund. Holdings are subject to change and may have changed since the date specified. |
| 10 | Amounts are calculated based on the total long-term investments of the Fund. These amounts are subject to change and may have changed since the date specified. |
Wells Fargo Special Small Cap Value Fund | 5
Fund expenses (unaudited)
As a shareholder of the Fund, you incur two types of costs: (1) transaction costs, including sales charges (loads) on purchase payments and contingent deferred sales charges (if any) on redemptions and (2) ongoing costs, including management fees, distribution(12b-1) and/or shareholder servicing fees, and other Fund expenses. This example is intended to help you understand your ongoing costs (in dollars) of investing in the Fund and to compare these costs with the ongoing costs of investing in other mutual funds.
The example is based on an investment of $1,000 invested at the beginning of thesix-month period and held for the entire period from April 1, 2019 to September 30, 2019.
Actual expenses
The “Actual” line of the table below provides information about actual account values and actual expenses. You may use the information in this line, together with the amount you invested, to estimate the expenses that you paid over the period. Simply divide your account value by $1,000 (for example, an $8,600 account value divided by $1,000 = 8.6), then multiply the result by the number in the “Actual” line under the heading entitled “Expenses paid during period” for your applicable class of shares to estimate the expenses you paid on your account during this period.
Hypothetical example for comparison purposes
The “Hypothetical” line of the table below provides information about hypothetical account values and hypothetical expenses based on the Fund’s actual expense ratio and an assumed rate of return of 5% per year before expenses, which is not the Fund’s actual return. The hypothetical account values and expenses may not be used to estimate the actual ending account balance or expenses you paid for the period. You may use this information to compare the ongoing costs of investing in the Fund and other funds. To do so, compare this 5% hypothetical example with the 5% hypothetical examples that appear in the shareholder reports of the other funds.
Please note that the expenses shown in the table are meant to highlight your ongoing costs only and do not reflect any transactional costs, such as sales charges (loads) and contingent deferred sales charges. Therefore, the “Hypothetical” line of the table is useful in comparing ongoing costs only and will not help you determine the relative total costs of owning different funds. In addition, if these transactional costs were included, your costs would have been higher.
| | | | | | | | | | | | | | | | |
| | | Beginning
account value
4-1-2019 | | | Ending
account value
9-30-2019 | | | Expenses
paid during
the period¹ | | | Annualized net
expense ratio | |
| | | | | |
Class A | | | | | | | | | | | | | | | | |
| | | | |
Actual | | $ | 1,000.00 | | | $ | 1,042.53 | | | $ | 6.55 | | | | 1.28 | % |
| | | | |
Hypothetical (5% return before expenses) | | $ | 1,000.00 | | | $ | 1,018.65 | | | $ | 6.48 | | | | 1.28 | % |
| | | | | |
Class C | | | | | | | | | | | | | | | | |
| | | | |
Actual | | $ | 1,000.00 | | | $ | 1,038.25 | | | $ | 10.37 | | | | 2.03 | % |
| | | | |
Hypothetical (5% return before expenses) | | $ | 1,000.00 | | | $ | 1,014.89 | | | $ | 10.25 | | | | 2.03 | % |
| | | | | |
Class R | | | | | | | | | | | | | | | | |
| | | | |
Actual | | $ | 1,000.00 | | | $ | 1,040.98 | | | $ | 7.83 | | | | 1.53 | % |
| | | | |
Hypothetical (5% return before expenses) | | $ | 1,000.00 | | | $ | 1,017.40 | | | $ | 7.74 | | | | 1.53 | % |
| | | | | |
Class R6 | | | | | | | | | | | | | | | | |
| | | | |
Actual | | $ | 1,000.00 | | | $ | 1,044.55 | | | $ | 4.36 | | | | 0.85 | % |
| | | | |
Hypothetical (5% return before expenses) | | $ | 1,000.00 | | | $ | 1,020.81 | | | $ | 4.31 | | | | 0.85 | % |
| | | | | |
Administrator Class | | | | | | | | | | | | | | | | |
| | | | |
Actual | | $ | 1,000.00 | | | $ | 1,043.01 | | | $ | 6.15 | | | | 1.20 | % |
| | | | |
Hypothetical (5% return before expenses) | | $ | 1,000.00 | | | $ | 1,019.05 | | | $ | 6.07 | | | | 1.20 | % |
| | | | | |
Institutional Class | | | | | | | | | | | | | | | | |
| | | | |
Actual | | $ | 1,000.00 | | | $ | 1,043.91 | | | $ | 4.82 | | | | 0.94 | % |
| | | | |
Hypothetical (5% return before expenses) | | $ | 1,000.00 | | | $ | 1,020.36 | | | $ | 4.76 | | | | 0.94 | % |
| 1 | Expenses paid is equal to the annualized net expense ratio of each class multiplied by the average account value over the period, multiplied by the number of days in the most recent fiscal half-year divided by the number of days in the fiscal year (to reflect theone-half-year period). |
6 | Wells Fargo Special Small Cap Value Fund
Portfolio of investments—September 30, 2019 (unaudited)
| | | | | | | | | | | | | | | | |
| | | | | | | | | Shares | | | Value | |
| Common Stocks: 93.96% | | | | | | | | | | | | | | | | |
| | | | |
Communication Services: 1.03% | | | | | | | | | | | | | | | | |
| | | | |
| Diversified Telecommunication Services: 0.48% | | | | | | | | | | | | |
CenturyLink Incorporated | | | | | | | | | | | 1,289,600 | | | $ | 16,094,208 | |
| | | | | | | | | | | | | | | | |
| | | | |
| Media: 0.55% | | | | | | | | | | | | |
A.H. Belo Corporation Class A (l) | | | | | | | | | | | 1,767,189 | | | | 6,626,959 | |
New Media Investment Group Incorporated « | | | | | | | | | | | 1,305,239 | | | | 11,499,156 | |
| | | | |
| | | | | | | | | | | | | | | 18,126,115 | |
| | | | | | | | | | | | | | | | |
|
Consumer Discretionary: 9.46% | |
|
| Diversified Consumer Services: 0.11% | |
Franchise Group Incorporated Ǡ | | | | | | | | | | | 297,943 | | | | 3,548,501 | |
| | | | | | | | | | | | | | | | |
|
| Hotels, Restaurants & Leisure: 5.32% | |
Denny’s Corporation (l)† | | | | | | | | | | | 3,017,471 | | | | 68,692,727 | |
Dine Brands Global Incorporated (l) | | | | | | | | | | | 888,132 | | | | 67,373,694 | |
Jack in the Box Incorporated | | | | | | | | | | | 106,300 | | | | 9,686,056 | |
The Wendy’s Company | | | | | | | | | | | 1,569,800 | | | | 31,364,604 | |
| | | | |
| | | | | | | | | | | | | | | 177,117,081 | |
| | | | | | | | | | | | | | | | |
|
| Household Durables: 2.24% | |
Helen of Troy Limited † | | | | | | | | | | | 313,600 | | | | 49,442,176 | |
Newell Rubbermaid Incorporated | | | | | | | | | | | 1,335,547 | | | | 25,001,440 | |
| | | | |
| | | | | | | | | | | | | | | 74,443,616 | |
| | | | | | | | | | | | | | | | |
|
| Specialty Retail: 0.45% | |
American Eagle Outfitters Incorporated | | | | | | | | | | | 327,900 | | | | 5,318,538 | |
Urban Outfitters Incorporated † | | | | | | | | | | | 350,700 | | | | 9,851,163 | |
| | | | |
| | | | | | | | | | | | | | | 15,169,701 | |
| | | | | | | | | | | | | | | | |
|
| Textiles, Apparel & Luxury Goods: 1.34% | |
Delta Apparel Incorporated (l)† | | | | | | | | | | | 568,092 | | | | 13,492,185 | |
Steven Madden Limited | | | | | | | | | | | 873,600 | | | | 31,266,144 | |
| | | | |
| | | | | | | | | | | | | | | 44,758,329 | |
| | | | | | | | | | | | | | | | |
|
Consumer Staples: 9.02% | |
|
| Beverages: 0.81% | |
Cott Corporation | | | | | | | | | | | 2,170,500 | | | | 27,066,135 | |
| | | | | | | | | | | | | | | | |
|
| Food & Staples Retailing: 0.68% | |
BJ’s Wholesale Club Holdings Incorporated † | | | | | | | | | | | 878,081 | | | | 22,715,955 | |
| | | | | | | | | | | | | | | | |
|
| Food Products: 5.06% | |
Hostess Brands Incorporated † | | | | | | | | | | | 2,101,623 | | | | 29,391,198 | |
J & J Snack Foods Corporation | | | | | | | | | | | 256,257 | | | | 49,201,344 | |
Nomad Foods Limited † | | | | | | | | | | | 2,933,647 | | | | 60,139,764 | |
TreeHouse Foods Incorporated † | | | | | | | | | | | 535,285 | | | | 29,681,553 | |
| | | | |
| | | | | | | | | | | | | | | 168,413,859 | |
| | | | | | | | | | | | | | | | |
|
| Household Products: 2.47% | |
Central Garden & Pet Company (l)† | | | | | | | | | | | 799,422 | | | | 23,367,105 | |
Central Garden & Pet Company Class A † | | | | | | | | | | | 844,933 | | | | 23,425,767 | |
Spectrum Brands Holdings Incorporated | | | | | | | | | | | 671,126 | | | | 35,381,763 | |
| | | | |
| | | | | | | | | | | | | | | 82,174,635 | |
| | | | | | | | | | | | | | | | |
Wells Fargo Special Small Cap Value Fund | 7
Portfolio of investments—September 30, 2019 (unaudited)
| | | | | | | | | | | | | | | | |
| | | | | | | | | Shares | | | Value | |
Energy: 3.13% | |
|
| Energy Equipment & Services: 1.34% | |
C&J Energy Services Incorporated † | | | | | | | | | | | 708,674 | | | $ | 7,604,072 | |
Forum Energy Technologies Incorporated † | | | | | | | | | | | 2,650,491 | | | | 4,108,261 | |
Oil States International Incorporated † | | | | | | | | | | | 713,999 | | | | 9,496,187 | |
Patterson-UTI Energy Incorporated | | | | | | | | | | | 2,186,810 | | | | 18,697,226 | |
Tetra Technologies Incorporated † | | | | | | | | | | | 2,275,522 | | | | 4,573,799 | |
| | | | |
| | | | | | | | | | | | | | | 44,479,545 | |
| | | | | | | | | | | | | | | | |
|
| Oil, Gas & Consumable Fuels: 1.79% | |
Berry Petroleum Corporation | | | | | | | | | | | 1,049,385 | | | | 9,822,244 | |
Callon Petroleum Company Ǡ | | | | | | | | | | | 1,820,500 | | | | 7,900,970 | |
Magnolia Oil & Gas Corporation Ǡ | | | | | | | | | | | 1,037,800 | | | | 11,519,580 | |
QEP Resources Incorporated | | | | | | | | | | | 3,316,700 | | | | 12,271,790 | |
WPX Energy Incorporated † | | | | | | | | | | | 1,715,802 | | | | 18,170,343 | |
| | | | |
| | | | | | | | | | | | | | | 59,684,927 | |
| | | | | | | | | | | | | | | | |
|
Financials: 22.89% | |
|
| Banks: 11.76% | |
Associated Banc Corporation | | | | | | | | | | | 1,905,252 | | | | 38,581,353 | |
CVB Financial Corporation | | | | | | | | | | | 818,290 | | | | 17,077,712 | |
First Citizens BancShares Corporation Class A | | | | | | | | | | | 120,050 | | | | 56,609,578 | |
First Hawaiian Incorporated | | | | | | | | | | | 1,584,590 | | | | 42,308,553 | |
Hancock Holding Company | | | | | | | | | | | 1,066,345 | | | | 40,835,682 | |
IBERIABANK Corporation | | | | | | | | | | | 452,800 | | | | 34,204,512 | |
LegacyTexas Financial Group | | | | | | | | | | | 395,500 | | | | 17,216,115 | |
Renasant Corporation | | | | | | | | | | | 1,168,635 | | | | 40,913,911 | |
South State Corporation | | | | | | | | | | | 474,561 | | | | 35,734,443 | |
UMB Financial Corporation | | | | | | | | | | | 1,055,726 | | | | 68,178,785 | |
| | | | |
| | | | | | | | | | | | | | | 391,660,644 | |
| | | | | | | | | | | | | | | | |
|
| Capital Markets: 2.58% | |
Apollo Investment Corporation | | | | | | | | | | | 1,462,270 | | | | 23,527,924 | |
Artisan Partners Asset Management Incorporated Class A | | | | | | | | | | | 808,795 | | | | 22,840,371 | |
Glassbridge Enterprises Incorporated (l)†(a) | | | | | | | | | | | 1,527 | | | | 61,080 | |
New Mountain Finance Corporation | | | | | | | | | | | 1,994,943 | | | | 27,191,073 | |
Westwood Holdings Group Incorporated | | | | | | | | | | | 436,883 | | | | 12,088,553 | |
| | | | |
| | | | | | | | | | | | | | | 85,709,001 | |
| | | | | | | | | | | | | | | | |
|
| Diversified Financial Services: 0.47% | |
Jefferies Financial Group Incorporated | | | | | | | | | | | 845,000 | | | | 15,548,000 | |
| | | | | | | | | | | | | | | | |
|
| Insurance: 5.21% | |
CNO Financial Group Incorporated | | | | | | | | | | | 637,900 | | | | 10,097,957 | |
Enstar Group Limited † | | | | | | | | | | | 159,748 | | | | 30,339,340 | |
ProAssurance Corporation | | | | | | | | | | | 1,027,415 | | | | 41,374,002 | |
Stewart Information Services Corporation | | | | | | | | | | | 835,775 | | | | 32,419,712 | |
The Hanover Insurance Group Incorporated | | | | | | | | | | | 229,291 | | | | 31,078,102 | |
White Mountains Insurance Group Limited | | | | | | | | | | | 26,022 | | | | 28,103,760 | |
| | | | |
| | | | | | | | | | | | | | | 173,412,873 | |
| | | | | | | | | | | | | | | | |
|
| Mortgage REITs: 2.32% | |
Apollo Commercial Real Estate Finance Incorporated | | | | | | | | | | | 1,463,815 | | | | 28,061,334 | |
Invesco Mortgage Capital Incorporated | | | | | | | | | | | 840,680 | | | | 12,870,811 | |
8 | Wells Fargo Special Small Cap Value Fund
Portfolio of investments—September 30, 2019 (unaudited)
| | | | | | | | | | | | | | | | |
| | | | | | | | | Shares | | | Value | |
| Mortgage REITs(continued) | |
New York Mortgage Trust Incorporated | | | | | | | | | | | 1,919,200 | | | $ | 11,687,928 | |
Two Harbors Investment Corporation | | | | | | | | | | | 1,885,957 | | | | 24,762,615 | |
| | | | |
| | | | | | | | | | | | | | | 77,382,688 | |
| | | | | | | | | | | | | | | | |
|
| Thrifts & Mortgage Finance: 0.55% | |
United Financial Bancorp Incorporated | | | | | | | | | | | 1,353,192 | | | | 18,444,007 | |
| | | | | | | | | | | | | | | | |
|
Health Care: 2.24% | |
|
| Health Care Equipment & Supplies: 0.61% | |
Avanos Medical Incorporated † | | | | | | | | | | | 478,000 | | | | 17,905,880 | |
Merit Medical Systems Incorporated † | | | | | | | | | | | 81,900 | | | | 2,494,674 | |
| | | | |
| | | | | | | | | | | | | | | 20,400,554 | |
| | | | | | | | | | | | | | | | |
|
| Health Care Providers & Services: 0.78% | |
Hanger Incorporated † | | | | | | | | | | | 515,839 | | | | 10,512,799 | |
Premier Incorporated Class A † | | | | | | | | | | | 540,100 | | | | 15,619,692 | |
| | | | |
| | | | | | | | | | | | | | | 26,132,491 | |
| | | | | | | | | | | | | | | | |
|
| Pharmaceuticals: 0.85% | |
Prestige Consumer Healthcare Incorporated † | | | | | | | | | | | 811,300 | | | | 28,143,997 | |
| | | | | | | | | | | | | | | | |
|
Industrials: 18.93% | |
|
| Aerospace & Defense: 0.69% | |
Parsons Corporation † | | | | | | | | | | | 700,598 | | | | 23,105,722 | |
| | | | | | | | | | | | | | | | |
|
| Building Products: 4.73% | |
CSW Industrials Incorporated (l) | | | | | | | | | | | 839,169 | | | | 57,927,836 | |
Griffon Corporation | | | | | | | | | | | 780,385 | | | | 16,364,673 | |
Quanex Building Products Corporation | | | | | | | | | | | 1,195,227 | | | | 21,609,704 | |
Simpson Manufacturing Company Incorporated | | | | | | | | | | | 885,789 | | | | 61,447,183 | |
| | | | |
| | | | | | | | | | | | | | | 157,349,396 | |
| | | | | | | | | | | | | | | | |
|
| Commercial Services & Supplies: 3.46% | |
ACCO Brands Corporation | | | | | | | | | | | 1,498,061 | | | | 14,785,862 | |
Deluxe Corporation | | | | | | | | | | | 555,331 | | | | 27,300,072 | |
Ennis Incorporated | | | | | | | | | | | 1,238,793 | | | | 25,036,007 | |
Healthcare Services Group Incorporated | | | | | | | | | | | 481,800 | | | | 11,702,922 | |
Viad Corporation | | | | | | | | | | | 542,850 | | | | 36,452,378 | |
| | | | |
| | | | | | | | | | | | | | | 115,277,241 | |
| | | | | | | | | | | | | | | | |
|
| Electrical Equipment: 1.69% | |
Atkore International Incorporated † | | | | | | | | | | | 1,472,654 | | | | 44,695,049 | |
EnerSys | | | | | | | | | | | 173,035 | | | | 11,409,928 | |
| | | | |
| | | | | | | | | | | | | | | 56,104,977 | |
| | | | | | | | | | | | | | | | |
|
| Machinery: 7.25% | |
Alamo Group Incorporated | | | | | | | | | | | 54,500 | | | | 6,415,740 | |
Douglas Dynamics Incorporated | | | | | | | | | | | 804,367 | | | | 35,850,637 | |
Franklin Electric Company Incorporated | | | | | | | | | | | 1,246,882 | | | | 59,613,428 | |
Hillenbrand Incorporated | | | | | | | | | | | 850,367 | | | | 26,259,333 | |
Kadant Incorporated | | | | | | | | | | | 299,184 | | | | 26,265,363 | |
Mueller Industries Incorporated | | | | | | | | | | | 2,421,836 | | | | 69,458,256 | |
NN Incorporated | | | | | | | | | | | 873,565 | | | | 6,228,518 | |
Trimas Corporation † | | | | | | | | | | | 366,500 | | | | 11,233,225 | |
| | | | |
| | | | | | | | | | | | | | | 241,324,500 | |
| | | | | | | | | | | | | | | | |
Wells Fargo Special Small Cap Value Fund | 9
Portfolio of investments—September 30, 2019 (unaudited)
| | | | | | | | | | | | | | | | |
| | | | | | | | | Shares | | | Value | |
| Professional Services: 0.74% | |
Korn/Ferry International | | | | | | | | | | | 634,032 | | | $ | 24,498,996 | |
| | | | | | | | | | | | | | | | |
|
| Trading Companies & Distributors: 0.37% | |
Aircastle Limited | | | | | | | | | | | 556,402 | | | | 12,480,097 | |
| | | | | | | | | | | | | | | | |
|
Information Technology: 8.41% | |
|
| Communications Equipment: 0.59% | |
NETGEAR Incorporated | | | | | | | | | | | 611,963 | | | | 19,717,448 | |
| | | | | | | | | | | | | | | | |
|
| Electronic Equipment, Instruments & Components: 2.99% | |
AVX Corporation | | | | | | | | | | | 1,385,241 | | | | 21,055,663 | |
Badger Meter Incorporated | | | | | | | | | | | 299,815 | | | | 16,100,066 | |
Belden Incorporated | | | | | | | | | | | 406,468 | | | | 21,681,003 | |
Littelfuse Incorporated | | | | | | | | | | | 42,500 | | | | 7,535,675 | |
Novanta Incorporated † | | | | | | | | | | | 408,126 | | | | 33,352,057 | |
| | | | |
| | | | | | | | | | | | | | | 99,724,464 | |
| | | | | | | | | | | | | | | | |
|
| IT Services: 1.22% | |
MAXIMUS Incorporated | | | | | | | | | | | 219,600 | | | | 16,966,296 | |
Sykes Enterprises Incorporated † | | | | | | | | | | | 770,200 | | | | 23,598,928 | |
| | | | |
| | | | | | | | | | | | | | | 40,565,224 | |
| | | | | | | | | | | | | | | | |
|
| Semiconductors & Semiconductor Equipment: 2.15% | |
Brooks Automation Incorporated | | | | | | | | | | | 590,000 | | | | 21,847,700 | |
Cabot Microelectronics Corporation | | | | | | | | | | | 288,013 | | | | 40,670,316 | |
DSP Group Incorporated † | | | | | | | | | | | 644,948 | | | | 9,084,093 | |
| | | | |
| | | | | | | | | | | | | | | 71,602,109 | |
| | | | | | | | | | | | | | | | |
|
| Software: 1.05% | |
ACI Worldwide Incorporated † | | | | | | | | | | | 443,902 | | | | 13,905,230 | |
BlackBerry Limited † | | | | | | | | | | | 361,700 | | | | 1,898,925 | |
Cision Limited † | | | | | | | | | | | 875,468 | | | | 6,732,349 | |
Verint Systems Incorporated † | | | | | | | | | | | 287,100 | | | | 12,282,138 | |
| | | | |
| | | | | | | | | | | | | | | 34,818,642 | |
| | | | | | | | | | | | | | | | |
|
| Technology Hardware, Storage & Peripherals: 0.41% | |
NCR Corporation † | | | | | | | | | | | 432,200 | | | | 13,640,232 | |
| | | | | | | | | | | | | | | | |
|
Materials: 12.75% | |
|
| Chemicals: 4.61% | |
Element Solutions Incorporated † | | | | | | | | | | | 1,104,900 | | | | 11,247,882 | |
Innospec Incorporated | | | | | | | | | | | 853,072 | | | | 76,042,838 | |
PolyOne Corporation | | | | | | | | | | | 1,015,715 | | | | 33,163,095 | |
PQ Group Holdings Incorporated † | | | | | | | | | | | 626,227 | | | | 9,982,058 | |
Sensient Technologies Corporation | | | | | | | | | | | 335,753 | | | | 23,049,443 | |
| | | | |
| | | | | | | | | | | | | | | 153,485,316 | |
| | | | | | | | | | | | | | | | |
|
| Construction Materials: 2.82% | |
Eagle Materials Incorporated | | | | | | | | | | | 1,042,053 | | | | 93,795,191 | |
| | | | | | | | | | | | | | | | |
|
| Containers & Packaging: 1.51% | |
Silgan Holdings Incorporated | | | | 1,678,121 | | | | 50,402,364 | |
| | | | | | | | | |
|
| Metals & Mining: 0.70% | |
Compass Minerals International Incorporated | | | | 356,300 | | | | 20,127,387 | |
Mayville Engineering Company Incorporated † | | | | 230,800 | | | | 3,044,252 | |
| | | | |
| | | | | | | | | | | | | | | 23,171,639 | |
| | | | | | | | | | | | | | | | |
10 | Wells Fargo Special Small Cap Value Fund
Portfolio of investments—September 30, 2019 (unaudited)
| | | | | | | | | | | | | | | | |
| | | | | | | | | Shares | | | Value | |
| Paper & Forest Products: 3.11% | |
Neenah Incorporated (l) | | | | 1,072,924 | | | $ | 69,868,811 | |
Schweitzer-Mauduit International Incorporated | | | | 902,492 | | | | 33,789,300 | |
| | | | |
| | | | | | | | | | | | | | | 103,658,111 | |
| | | | | | | | | | | | | | | | |
|
Real Estate: 2.75% | |
|
| Equity REITs: 2.75% | |
Acadia Realty Trust | | | | 930,167 | | | | 26,584,173 | |
Pebblebrook Hotel Trust | | | | 1,200,624 | | | | 33,401,360 | |
Washington REIT | | | | 1,158,262 | | | | 31,690,048 | |
| | | | |
| | | | | | | | | | | | | | | 91,675,581 | |
| | | | | | | | | | | | | | | | |
|
Utilities: 3.35% | |
|
| Electric Utilities: 3.35% | |
Hawaiian Electric Industries Incorporated | | | | 1,294,083 | | | | 59,023,126 | |
IDACORP Incorporated | | | | 465,600 | | | | 52,459,152 | |
| | | | |
| | | | | | | | | | | | | | | 111,482,278 | |
| | | | | | | | | | | | | | | | |
| |
Total Common Stocks (Cost $2,877,709,659) | | | | 3,128,506,390 | |
| | | | | |
|
| Exchange-Traded Funds: 1.09% | |
iShares Russell 2000 Value Index ETF | | | | 305,200 | | | | 36,443,932 | |
| | | | | | | | | |
| |
Total Exchange-Traded Funds (Cost $35,906,483) | | | | 36,443,932 | |
| | | | | |
| | | | |
| | | | | | | | | | | | | | | | |
| | | Dividend
yield | | | | | | | | | | |
| Preferred Stocks: 0.26% | |
|
Industrials: 0.26% | |
|
| Industrial Conglomerates: 0.26% | |
Steel Partners Holdings LP | | | 7.09 | % | | | | | | | 406,259 | | | | 8,600,503 | |
| | | | | | | | | | | | | | | | |
| |
Total Preferred Stocks (Cost $8,797,449) | | | | 8,600,503 | |
| | | | | |
| | | | |
| | | | | | | | | | | | | | | | |
| | | | Expiration
date | | | | | | | |
| Rights: 0.01% | |
|
Financials: 0.01% | |
|
| Diversified Financial Services: 0.01% | |
Schulman Incorporated Class A †(a)‡ | | | | | | | 12-31-2099 | | | | 593,658 | | | | 257,054 | |
| | | | | | | | | | | | | | | | |
| |
Total Rights (Cost $257,054) | | | | 257,054 | |
| | | | | |
| | | | |
| | | | | | | | | | | | | | | | |
| | | Yield | | | | | | | | | | |
| Short-Term Investments: 4.73% | |
|
| Investment Companies: 4.73% | |
Securities Lending Cash Investments LLC (l)(r)(u) | | | 2.11 | | | | | | | | 21,785,717 | | | | 21,787,895 | |
Wells Fargo Government Money Market Fund Select Class (l)(u) | | | 1.88 | | | | | | | | 135,698,184 | | | | 135,698,184 | |
| |
Total Short-Term Investments (Cost $157,486,079) | | | | 157,486,079 | |
| | | | | |
| | | | | | | | |
| Total investments in securities (Cost $3,080,156,724) | | | 100.05 | % | | | 3,331,293,958 | |
| | |
Other assets and liabilities, net | | | (0.05 | ) | | | (1,795,132 | ) |
| | | | | | | | |
| Total net assets | | | 100.00 | % | | $ | 3,329,498,826 | |
| | | | | | | | |
Wells Fargo Special Small Cap Value Fund | 11
Portfolio of investments—September 30, 2019 (unaudited)
| (l) | The issuer of the security is an affiliated person of the Fund as defined in the Investment Company Act of 1940. |
| « | All or a portion of this security is on loan. |
| † | Non-income-earning security |
| (a) | The security is fair valued in accordance with procedures approved by the Board of Trustees. |
| ‡ | Security is valued using significant unobservable inputs. |
| (r) | The investment is anon-registered investment company purchased with cash collateral received from securities on loan. |
| (u) | The rate represents the7-day annualized yield at period end. |
Abbreviations:
| REIT | Real estate investment trust |
Investments in Affiliates
An affiliated investment is an investment in which the Fund owns at least 5% of the outstanding voting shares of the issuer or as a result of other relationships, such as the Fund and the issuer having the same investment manager. Transactions with issuers that were either affiliated persons of the Fund at the beginning of the period or the end of the period were as follows:
| | | | | | | | | | | | | | | | | | | | | | | | | | | | | | | | | | | | |
| | | Shares, beginning of period | | | Shares purchased | | | Shares sold | | | Shares, end of period | | | Net realized gains (losses) | | | Net change in unrealized gains (losses) | | | Income from affiliated securities | | | Value, end of period | | | % of net assets | |
Common Stocks | | | | | | | | | | | | | | | | | | | | | | | | | | | | | | | | | | | | |
Communication Services | | | | | | | | | | | | | | | | | | | | | | | | | | | | | | | | | | | | |
Media | | | | | | | | | | | | | | | | | | | | | | | | | | | | | | | | | | | | |
A.H. Belo Corporation Class A | | | 1,658,289 | | | | 108,900 | | | | 0 | | | | 1,767,189 | | | $ | 0 | | | $ | 28,093 | | | $ | 276,750 | | | $ | 6,626,959 | | | | | |
Consumer Discretionary | | | | | | | | | | | | | | | | | | | | | | | | | | | | | | | | | | | | |
Hotels, Restaurants & Leisure | | | | | | | | | | | | | | | | | | | | | | | | | | | | | | | | | | | | |
Denny’s Corporation † | | | 3,316,971 | | | | 76,500 | | | | 376,000 | | | | 3,017,471 | | | | 1,969,878 | | | | 12,764,504 | | | | 0 | | | | 68,692,727 | | | | | |
Dine Brands Global Incorporated | | | 713,300 | | | | 194,505 | | | | 19,673 | | | | 888,132 | | | | 26,820 | | | | 7,211,955 | | | | 1,111,451 | | | | 67,373,694 | | | | | |
Textiles, Apparel & Luxury Goods | | | | | | | | | | | | | | | | | | | | | | | | | | | | | | | | | | | | |
Delta Apparel Incorporated † | | | 519,692 | | | | 48,400 | | | | 0 | | | | 568,092 | | | | 0 | | | | 864,484 | | | | 0 | | | | 13,492,185 | | | | | |
Consumer Staples | | | | | | | | | | | | | | | | | | | | | | | | | | | | | | | | | | | | |
Household Products | | | | | | | | | | | | | | | | | | | | | | | | | | | | | | | | | | | | |
Central Garden & Pet Company † | | | 743,522 | | | | 90,300 | | | | 34,400 | | | | 799,422 | | | | (579,357 | ) | | | 3,428,814 | | | | 0 | | | | 23,367,105 | | | | | |
Financials | | | | | | | | | | | | | | | | | | | | | | | | | | | | | | | | | | | | |
Capital Markets | | | | | | | | | | | | | | | | | | | | | | | | | | | | | | | | | | | | |
Glassbridge Enterprises Incorporated † | | | 305,421 | | | | 1,528 | | | | 305,422 | | | | 1,527 | | | | (2,967 | ) | | | 2,969 | | | | 0 | | | | 61,080 | | | | | |
Industrials | | | | | | | | | | | | | | | | | | | | | | | | | | | | | | | | | | | | |
Building Products | | | | | | | | | | | | | | | | | | | | | | | | | | | | | | | | | | | | |
CSW Industrials Incorporated | | | 759,969 | | | | 79,200 | | | | 0 | | | | 839,169 | | | | 0 | | | | 9,328,250 | | | | 212,225 | | | | 57,927,836 | | | | | |
Materials | | | | | | | | | | | | | | | | | | | | | | | | | | | | | | | | | | | | |
Paper and Forest Products | | | | | | | | | | | | | | | | | | | | | | | | | | | | | | | | | | | | |
Neenah Incorporated | | | 877,121 | | | | 195,803 | | | | 0 | | | | 1,072,924 | | | | 0 | | | | 848,363 | | | | 880,220 | | | | 69,868,811 | | | | | |
| | | | | | | | | |
| | | | | | | | | | | | | | | | | | | | | | | | | | | | | | | 307,410,397 | | | | 9.23 | % |
| | | | | | | | | | | | | | | | | | | | | | | | | | | | | | | | | | | | |
12 | Wells Fargo Special Small Cap Value Fund
Portfolio of investments—September 30, 2019 (unaudited)
Investments in Affiliates (continued)
| | | | | | | | | | | | | | | | | | | | | | | | | | | | | | | | | | | | |
| | | Shares, beginning of period | | | Shares purchased | | | Shares sold | | | Shares, end of period | | | Net realized gains (losses) | | | Net change in unrealized gains (losses) | | | Income from affiliated securities | | | Value, end of period | | | % of net assets | |
Short-Term Investments | | | | | | | | | | | | | | | | | | | | | | | | | | | | | | | | | | | | |
Investment Companies | | | | | | | | | | | | | | | | | | | | | | | | | | | | | | | | | | | | |
Securities Lending Cash Investments LLC | | | 57,964,218 | | | | 263,936,451 | | | | 300,114,952 | | | | 21,785,717 | | | $ | 1,487 | | | $ | 0 | | | $ | 523,587 | # | | $ | 21,787,895 | | | | | |
Wells Fargo Government Money Market Fund Select Class | | | 128,767,336 | | | | 603,151,016 | | | | 596,220,168 | | | | 135,698,184 | | | | 0 | | | | 0 | | | | 2,153,557 | | | | 135,698,184 | | | | | |
| | | | | | | | | |
| | | | | | | | | | | | | | | | | | | | | | | | | | | | | | | 157,486,079 | | | | 4.73 | % |
| | | | | | | | | | | | | | | | | | | | | | | | | | | | | | | | | | | | |
| | | | | | | | | | | | | | | | | | $ | 1,415,861 | | | $ | 34,477,432 | | | $ | 5,157,790 | | | $ | 464,896,476 | | | | 13.96 | % |
| | | | | | | | | | | | | | | | | | | | | | | | | | | | | | | | | | | | |
| † | Non-income-earning security |
| # | Amount shown represents income before fees and rebates. |
The accompanying notes are an integral part of these financial statements.
Wells Fargo Special Small Cap Value Fund | 13
Statement of assets and liabilities—September 30, 2019 (unaudited)
| | | | |
| | | | |
| |
Assets | | | | |
Investments in unaffiliated securities (including $20,809,630 of securities loaned), at value (cost $2,657,343,469) | | $ | 2,866,397,482 | |
Investments in affiliated securities, at value (cost $422,813,255) | | | 464,896,476 | |
Receivable for investments sold | | | 6,850,136 | |
Receivable for Fund shares sold | | | 10,675,220 | |
Receivable for dividends | | | 7,180,864 | |
Receivable for securities lending income, net | | | 18,528 | |
Prepaid expenses and other assets | | | 7,563,787 | |
| | | | |
Total assets | | | 3,363,582,493 | |
| | | | |
| |
Liabilities | | | | |
Payable upon receipt of securities loaned | | | 21,781,363 | |
Payable for investments purchased | | | 6,322,486 | |
Payable for Fund shares redeemed | | | 3,307,732 | |
Management fee payable | | | 2,146,099 | |
Administration fees payable | | | 335,502 | |
Distribution fees payable | | | 13,842 | |
Trustees’ fees and expenses payable | | | 2,554 | |
Accrued expenses and other liabilities | | | 174,089 | |
| | | | |
Total liabilities | | | 34,083,667 | |
| | | | |
Total net assets | | $ | 3,329,498,826 | |
| | | | |
| |
Net assets consist of | | | | |
Paid-in capital | | $ | 3,048,850,949 | |
Total distributable earnings | | | 280,647,877 | |
| | | | |
Total net assets | | $ | 3,329,498,826 | |
| | | | |
| |
Computation of net asset value and offering price per share | | | | |
Net assets – Class A | | $ | 514,738,068 | |
Shares outstanding – Class A1 | | | 15,557,609 | |
Net asset value per share – Class A | | | $33.09 | |
Maximum offering price per share – Class A2 | | | $35.11 | |
Net assets – Class C | | $ | 19,904,820 | |
Shares outstanding – Class C1 | | | 672,640 | |
Net asset value per share – Class C | | | $29.59 | |
Net assets – Class R | | $ | 7,502,672 | |
Shares outstanding – Class R1 | | | 223,776 | |
Net asset value per share – Class R | | | $33.53 | |
Net assets – Class R6 | | $ | 634,113,657 | |
Shares outstanding – Class R61 | | | 18,649,863 | |
Net asset value per share – Class R6 | | | $34.00 | |
Net assets – Administrator Class | | $ | 153,817,936 | |
Shares outstanding – Administrator Class1 | | | 4,531,072 | |
Net asset value per share – Administrator Class | | | $33.95 | |
Net assets – Institutional Class | | $ | 1,999,421,673 | |
Shares outstanding – Institutional Class1 | | | 58,801,904 | |
Net asset value per share – Institutional Class | | | $34.00 | |
| 1 | The Fund has an unlimited number of authorized shares. |
| 2 | Maximum offering price is computed as 100/94.25 of net asset value. On investments of $50,000 or more, the offering price is reduced. |
The accompanying notes are an integral part of these financial statements.
14 | Wells Fargo Special Small Cap Value Fund
Statement of operations—six months ended September 30, 2019 (unaudited)
| | | | |
| | | | |
| |
Investment income | | | | |
Dividends (net of foreign withholding taxes of $36,014) | | $ | 29,137,179 | |
Income from affiliated securities | | | 4,725,766 | |
Interest | | | 31,288 | |
| | | | |
Total investment income | | | 33,894,233 | |
| | | | |
| |
Expenses | | | | |
Management fee | | | 12,209,267 | |
Administration fees | |
Class A | | | 559,962 | |
Class C | | | 23,635 | |
Class R | | | 7,387 | |
Class R6 | | | 86,311 | |
Administrator Class | | | 100,725 | |
Institutional Class | | | 1,136,815 | |
Shareholder servicing fees | |
Class A | | | 666,621 | |
Class C | | | 28,138 | |
Class R | | | 8,794 | |
Administrator Class | | | 193,701 | |
Distribution fees | |
Class C | | | 84,396 | |
Class R | | | 8,774 | |
Custody and accounting fees | | | 44,603 | |
Professional fees | | | 24,689 | |
Registration fees | | | 74,581 | |
Shareholder report expenses | | | 46,647 | |
Trustees’ fees and expenses | | | 10,325 | |
Other fees and expenses | | | 26,576 | |
| | | | |
Total expenses | | | 15,341,947 | |
Less: Fee waivers and/or expense reimbursements | |
Class R | | | (2 | ) |
Administrator Class | | | (1,120 | ) |
Institutional Class | | | (69,140 | ) |
| | | | |
Net expenses | | | 15,271,685 | |
| | | | |
Net investment income | | | 18,622,548 | |
| | | | |
| |
Realized and unrealized gains (losses) on investments | | | | |
Net realized gains (losses) on | | | | |
Unaffiliated securities | | | 1,679,089 | |
Affiliated securities | | | 1,415,861 | |
Futures contracts | | | (101,433 | ) |
| | | | |
Net realized gains on investments | | | 2,993,517 | |
| | | | |
| |
Net change in unrealized gains (losses) on | | | | |
Unaffiliated securities | | | 75,526,303 | |
Affiliated securities | | | 34,477,432 | |
| | | | |
Net change in unrealized gains (losses) on investments | | | 110,003,735 | |
| | | | |
Net realized and unrealized gains (losses) on investments | | | 112,997,252 | |
| | | | |
Net increase in net assets resulting from operations | | $ | 131,619,800 | |
| | | | |
The accompanying notes are an integral part of these financial statements.
Wells Fargo Special Small Cap Value Fund | 15
Statement of changes in net assets
| | | | | | | | | | | | | | | | |
| | | Six months ended
September 30, 2019 (unaudited) | | | Year ended
March 31, 2019 | |
| | | |
Operations | | | | | | | | | | | | |
Net investment income | | | | | | $ | 18,622,548 | | | | | | | $ | 23,686,389 | |
Net realized gains on investments | | | | | | | 2,993,517 | | | | | | | | 70,868,512 | |
Net change in unrealized gains (losses) on investments | | | | | | | 110,003,735 | | | | | | | | (132,481,283 | ) |
| | | | |
Net increase (decrease) in net assets resulting from operations | | | | | | | 131,619,800 | | | | | | | | (37,926,382 | ) |
| | | | |
| | | |
Distributions to shareholders from net investment income and net
realized gains | | | | | | | | | | | | | |
Class A | | | | | | | 0 | | | | | | | | (34,950,655 | ) |
Class C | | | | | | | 0 | | | | | | | | (3,190,299 | ) |
Class R | | | | | | | 0 | | | | | | | | (404,926 | ) |
Class R6 | | | | | | | 0 | | | | | | | | (29,776,704 | ) |
Administrator Class | | | | | | | 0 | | | | | | | | (10,505,173 | ) |
Institutional Class | | | | | | | 0 | | | | | | | | (92,413,835 | ) |
| | | | |
Total distributions to shareholders | | | | | | | 0 | | | | | | | | (171,241,592 | ) |
| | | | |
| | | | |
Capital share transactions | | | Shares | | | | | | | | Shares | | | | | |
Proceeds from shares sold | | | | | | | | | | | | | | | | |
Class A | | | 1,389,658 | | | | 44,845,738 | | | | 4,399,455 | | | | 147,434,144 | |
Class C | | | 8,027 | | | | 233,621 | | | | 176,335 | | | | 5,606,048 | |
Class R | | | 43,619 | | | | 1,421,556 | | | | 108,771 | | | | 3,732,400 | |
Class R6 | | | 4,112,904 | | | | 136,957,351 | | | | 10,731,533 | | | | 369,575,214 | |
Administrator Class | | | 393,587 | | | | 13,073,496 | | | | 1,731,106 | | | | 60,553,466 | |
Institutional Class | | | 23,829,470 | | | | 787,995,007 | | | | 25,518,350 | | | | 892,397,775 | |
| | | | |
| | | | | | | 984,526,769 | | | | | | | | 1,479,299,047 | |
| | | | |
Reinvestment of distributions | |
Class A | | | 0 | | | | 0 | | | | 1,076,242 | | | | 31,879,046 | |
Class C | | | 0 | | | | 0 | | | | 114,907 | | | | 3,053,065 | |
Class R | | | 0 | | | | 0 | | | | 13,400 | | | | 402,776 | |
Class R6 | | | 0 | | | | 0 | | | | 757,094 | | | | 23,032,048 | |
Administrator Class | | | 0 | | | | 0 | | | | 339,786 | | | | 10,323,048 | |
Institutional Class | | | 0 | | | | 0 | | | | 2,401,764 | | | | 73,095,306 | |
| | | | |
| | | | | | | 0 | | | | | | | | 141,785,289 | |
| | | | |
Payment for shares redeemed | |
Class A | | | (2,425,173 | ) | | | (78,906,944 | ) | | | (4,558,516 | ) | | | (151,304,840 | ) |
Class C | | | (189,374 | ) | | | (5,463,518 | ) | | | (1,140,298 | ) | | | (33,300,231 | ) |
Class R | | | (26,531 | ) | | | (868,519 | ) | | | (48,026 | ) | | | (1,606,676 | ) |
Class R6 | | | (1,389,960 | ) | | | (46,172,435 | ) | | | (2,789,106 | ) | | | (93,680,041 | ) |
Administrator Class | | | (788,992 | ) | | | (26,166,145 | ) | | | (3,674,115 | ) | | | (131,798,914 | ) |
Institutional Class | | | (6,763,056 | ) | | | (224,499,386 | ) | | | (20,110,486 | ) | | | (683,366,611 | ) |
| | | | |
| | | | | | | (382,076,947 | ) | | | | | | | (1,095,057,313 | ) |
| | | | |
Net increase in net assets resulting from capital share transactions | | | | | | | 602,449,822 | | | | | | | | 526,027,023 | |
| | | | |
Total increase in net assets | | | | | | | 734,069,622 | | | | | | | | 316,859,049 | |
| | | | |
| | |
Net assets | | | | | | | | |
Beginning of period | | | | | | | 2,595,429,204 | | | | | | | | 2,278,570,155 | |
| | | | |
End of period | | | | | | $ | 3,329,498,826 | | | | | | | $ | 2,595,429,204 | |
| | | | |
The accompanying notes are an integral part of these financial statements.
16 | Wells Fargo Special Small Cap Value Fund
Financial highlights
(For a share outstanding throughout each period)
| | | | | | | | | | | | | | | | | | | | | | | | |
| | | Six months ended
September 30, 2019
(unaudited) | | | Year ended March 31 | |
| CLASS A | | 2019 | | | 2018 | | | 2017 | | | 2016 | | | 2015 | |
Net asset value, beginning of period | | | $31.74 | | | | $34.42 | | | | $33.15 | | | | $27.40 | | | | $29.27 | | | | $32.59 | |
Net investment income | | | 0.14 | 1 | | | 0.22 | | | | 0.24 | | | | 0.35 | 1 | | | 0.20 | | | | 0.26 | |
Net realized and unrealized gains (losses) on investments | | | 1.21 | | | | (0.69 | ) | | | 2.89 | | | | 6.15 | | | | (1.46 | ) | | | 1.81 | |
| | | | | | | | | | | | | | | | | | | | | | | | |
Total from investment operations | | | 1.35 | | | | (0.47 | ) | | | 3.13 | | | | 6.50 | | | | (1.26 | ) | | | 2.07 | |
Distributions to shareholders from | | | | | | | | | | | | | | | | | | | | | | | | |
Net investment income | | | 0.00 | | | | (0.15 | ) | | | (0.32 | ) | | | (0.18 | ) | | | (0.19 | ) | | | (0.21 | ) |
Net realized gains | | | 0.00 | | | | (2.06 | ) | | | (1.54 | ) | | | (0.57 | ) | | | (0.42 | ) | | | (5.18 | ) |
| | | | | | | | | | | | | | | | | | | | | | | | |
Total distributions to shareholders | | | 0.00 | | | | (2.21 | ) | | | (1.86 | ) | | | (0.75 | ) | | | (0.61 | ) | | | (5.39 | ) |
Net asset value, end of period | | | $33.09 | | | | $31.74 | | | | $34.42 | | | | $33.15 | | | | $27.40 | | | | $29.27 | |
Total return2 | | | 4.25 | % | | | (0.87 | )% | | | 9.42 | % | | | 23.69 | % | | | (4.21 | )% | | | 7.56 | % |
Ratios to average net assets (annualized) | | | | | | | | | | | | | | | | | | | | | | | | |
Gross expenses | | | 1.28 | % | | | 1.29 | % | | | 1.31 | % | | | 1.32 | % | | | 1.36 | % | | | 1.39 | % |
Net expenses | | | 1.28 | % | | | 1.29 | % | | | 1.31 | % | | | 1.32 | % | | | 1.34 | % | | | 1.34 | % |
Net investment income | | | 0.88 | % | | | 0.67 | % | | | 0.66 | % | | | 1.14 | % | | | 0.73 | % | | | 0.90 | % |
Supplemental data | | | | | | | | | | | | | | | | | | | | | | | | |
Portfolio turnover rate | | | 16 | % | | | 32 | % | | | 41 | % | | | 51 | % | | | 46 | % | | | 79 | % |
Net assets, end of period (000s omitted) | | | $514,738 | | | | $526,656 | | | | $539,499 | | | | $575,269 | | | | $417,161 | | | | $448,980 | |
| 1 | Calculated based upon average shares outstanding |
| 2 | Total return calculations do not include any sales charges. Returns for periods of less than one year are not annualized. |
The accompanying notes are an integral part of these financial statements.
Wells Fargo Special Small Cap Value Fund | 17
Financial highlights
(For a share outstanding throughout each period)
| | | | | | | | | | | | | | | | | | | | | | | | |
| | | Six months ended
September 30, 2019
(unaudited) | | | Year ended March 31 | |
| CLASS C | | 2019 | | | 2018 | | | 2017 | | | 2016 | | | 2015 | |
Net asset value, beginning of period | | | $28.49 | | | | $31.21 | | | | $30.19 | | | | $25.05 | | | | $26.81 | | | | $30.31 | |
Net investment income (loss) | | | 0.01 | 1 | | | (0.05 | )1 | | | (0.03 | )1 | | | 0.12 | 1 | | | (0.03 | ) | | | 0.04 | 1 |
Net realized and unrealized gains (losses) on investments | | | 1.09 | | | | (0.61 | ) | | | 2.64 | | | | 5.59 | | | | (1.31 | ) | | | 1.65 | |
| | | | | | | | | | | | | | | | | | | | | | | | |
Total from investment operations | | | 1.10 | | | | (0.66 | ) | | | 2.61 | | | | 5.71 | | | | (1.34 | ) | | | 1.69 | |
Distributions to shareholders from | | | | | | | | | | | | | | | | | | | | | | | | |
Net investment income | | | 0.00 | | | | 0.00 | | | | (0.05 | ) | | | 0.00 | | | | 0.00 | | | | (0.01 | ) |
Net realized gains | | | 0.00 | | | | (2.06 | ) | | | (1.54 | ) | | | (0.57 | ) | | | (0.42 | ) | | | (5.18 | ) |
| | | | | | | | | | | | | | | | | | | | | | | | |
Total distributions to shareholders | | | 0.00 | | | | (2.06 | ) | | | (1.59 | ) | | | (0.57 | ) | | | (0.42 | ) | | | (5.19 | ) |
Net asset value, end of period | | | $29.59 | | | | $28.49 | | | | $31.21 | | | | $30.19 | | | | $25.05 | | | | $26.81 | |
Total return2 | | | 3.82 | % | | | (1.63 | )% | | | 8.60 | % | | | 22.75 | % | | | (4.93 | )% | | | 6.75 | % |
Ratios to average net assets (annualized) | | | | | | | | | | | | | | | | | | | | | | | | |
Gross expenses | | | 2.03 | % | | | 2.04 | % | | | 2.06 | % | | | 2.07 | % | | | 2.11 | % | | | 2.14 | % |
Net expenses | | | 2.03 | % | | | 2.04 | % | | | 2.06 | % | | | 2.07 | % | | | 2.09 | % | | | 2.09 | % |
Net investment income (loss) | | | 0.09 | % | | | (0.13 | )% | | | (0.10 | )% | | | 0.42 | % | | | (0.02 | )% | | | 0.15 | % |
Supplemental data | | | | | | | | | | | | | | | | | | | | | | | | |
Portfolio turnover rate | | | 16 | % | | | 32 | % | | | 41 | % | | | 51 | % | | | 46 | % | | | 79 | % |
Net assets, end of period (000s omitted) | | | $19,905 | | | | $24,334 | | | | $53,145 | | | | $60,309 | | | | $40,512 | | | | $44,327 | |
| 1 | Calculated based upon average shares outstanding |
| 2 | Total return calculations do not include any sales charges. Returns for periods of less than one year are not annualized. |
The accompanying notes are an integral part of these financial statements.
18 | Wells Fargo Special Small Cap Value Fund
Financial highlights
(For a share outstanding throughout each period)
| | | | | | | | | | | | | | | | | | | | |
| | | Six months ended
September 30, 2019
(unaudited) | | | Year ended March 31 | |
| CLASS R | | 2019 | | | 2018 | | | 2017 | | | 20161 | |
Net asset value, beginning of period | | | $32.20 | | | | $34.94 | | | | $33.73 | | | | $27.97 | | | | $26.72 | |
Net investment income | | | 0.11 | | | | 0.18 | | | | 0.17 | | | | 0.63 | 2 | | | 0.08 | 2 |
Net realized and unrealized gains (losses) on investments | | | 1.22 | | | | (0.74 | ) | | | 2.92 | | | | 5.94 | | | | 1.87 | |
| | | | | | | | | | | | | | | | | | | | |
Total from investment operations | | | 1.33 | | | | (0.56 | ) | | | 3.09 | | | | 6.57 | | | | 1.95 | |
Distributions to shareholders from | | | | | | | | | | | | | | | | | | | | |
Net investment income | | | 0.00 | | | | (0.12 | ) | | | (0.34 | ) | | | (0.24 | ) | | | (0.28 | ) |
Net realized gains | | | 0.00 | | | | (2.06 | ) | | | (1.54 | ) | | | (0.57 | ) | | | (0.42 | ) |
| | | | | | | | | | | | | | | | | | | | |
Total distributions to shareholders | | | 0.00 | | | | (2.18 | ) | | | (1.88 | ) | | | (0.81 | ) | | | (0.70 | ) |
Net asset value, end of period | | | $33.53 | | | | $32.20 | | | | $34.94 | | | | $33.73 | | | | $27.97 | |
Total return3 | | | 4.10 | % | | | (1.11 | )% | | | 9.13 | % | | | 23.47 | % | | | 7.40 | % |
Ratios to average net assets (annualized) | | | | | | | | | | | | | | | | | | | | |
Gross expenses | | | 1.53 | % | | | 1.55 | % | | | 1.57 | % | | | 1.56 | % | | | 1.59 | % |
Net expenses | | | 1.53 | % | | | 1.55 | % | | | 1.56 | % | | | 1.56 | % | | | 1.58 | % |
Net investment income | | | 0.66 | % | | | 0.47 | % | | | 0.43 | % | | | 1.86 | % | | | 0.56 | % |
Supplemental data | | | | | | | | | | | | | | | | | | | | |
Portfolio turnover rate | | | 16 | % | | | 32 | % | | | 41 | % | | | 51 | % | | | 46 | % |
Net assets, end of period (000s omitted) | | | $7,503 | | | | $6,656 | | | | $4,631 | | | | $785 | | | | $27 | |
| 1 | For the period from September 30, 2015 (commencement of class operations) to March 31, 2016. |
| 2 | Calculated based upon average shares outstanding |
| 3 | Returns for periods of less than one year are not annualized. |
The accompanying notes are an integral part of these financial statements.
Wells Fargo Special Small Cap Value Fund | 19
Financial highlights
(For a share outstanding throughout each period)
| | | | | | | | | | | | | | | | | | | | | | | | |
| | | Six months ended
September 30, 2019
(unaudited) | | | Year ended March 31 | |
| CLASS R6 | | 2019 | | | 2018 | | | 2017 | | | 2016 | | | 20151 | |
Net asset value, beginning of period | | | $32.55 | | | | $35.25 | | | | $33.93 | | | | $28.01 | | | | $29.91 | | | | $33.38 | |
Net investment income | | | 0.23 | 2 | | | 0.38 | | | | 0.38 | 2 | | | 0.61 | 2 | | | 0.39 | | | | 0.26 | 2 |
Net realized and unrealized gains (losses) on investments | | | 1.22 | | | | (0.72 | ) | | | 2.97 | | | | 6.18 | | | | (1.54 | ) | | | 1.80 | |
| | | | | | | | | | | | | | | | | | | | | | | | |
Total from investment operations | | | 1.45 | | | | (0.34 | ) | | | 3.35 | | | | 6.79 | | | | (1.15 | ) | | | 2.06 | |
Distributions to shareholders from | | | | | | | | | | | | | | | | | | | | | | | | |
Net investment income | | | 0.00 | | | | (0.30 | ) | | | (0.49 | ) | | | (0.30 | ) | | | (0.33 | ) | | | (0.35 | ) |
Net realized gains | | | 0.00 | | | | (2.06 | ) | | | (1.54 | ) | | | (0.57 | ) | | | (0.42 | ) | | | (5.18 | ) |
| | | | | | | | | | | | | | | | | | | | | | | | |
Total distributions to shareholders | | | 0.00 | | | | (2.36 | ) | | | (2.03 | ) | | | (0.87 | ) | | | (0.75 | ) | | | (5.53 | ) |
Net asset value, end of period | | | $34.00 | | | | $32.55 | | | | $35.25 | | | | $33.93 | | | | $28.01 | | | | $29.91 | |
Total return3 | | | 4.45 | % | | | (0.42 | )% | | | 9.85 | % | | | 24.22 | % | | | (3.74 | )% | | | 7.42 | % |
Ratios to average net assets (annualized) | | | | | | | | | | | | | | | | | | | | | | | | |
Gross expenses | | | 0.85 | % | | | 0.86 | % | | | 0.88 | % | | | 0.89 | % | | | 0.93 | % | | | 0.89 | % |
Net expenses | | | 0.85 | % | | | 0.86 | % | | | 0.88 | % | | | 0.89 | % | | | 0.89 | % | | | 0.89 | % |
Net investment income | | | 1.36 | % | | | 1.16 | % | | | 1.10 | % | | | 1.87 | % | | | 1.56 | % | | | 2.19 | % |
Supplemental data | | | | | | | | | | | | | | | | | | | | | | | | |
Portfolio turnover rate | | | 16 | % | | | 32 | % | | | 41 | % | | | 51 | % | | | 46 | % | | | 79 | % |
Net assets, end of period (000s omitted) | | | $634,114 | | | | $518,377 | | | | $254,801 | | | | $176,362 | | | | $36,344 | | | | $27 | |
| 1 | For the period from October 31, 2014 (commencement of class operations) to March 31, 2015 |
| 2 | Calculated based upon average shares outstanding |
| 3 | Returns for periods of less than one year are not annualized. |
The accompanying notes are an integral part of these financial statements.
20 | Wells Fargo Special Small Cap Value Fund
Financial highlights
(For a share outstanding throughout each period)
| | | | | | | | | | | | | | | | | | | | | | | | |
| | | Six months ended
September 30, 2019
(unaudited) | | | Year ended March 31 | |
| ADMINISTRATOR CLASS | | 2019 | | | 2018 | | | 2017 | | | 2016 | | | 2015 | |
Net asset value, beginning of period | | | $32.55 | | | | $35.22 | | | | $33.90 | | | | $28.02 | | | | $29.94 | | | | $33.21 | |
Net investment income | | | 0.16 | 1 | | | 0.27 | 1 | | | 0.27 | 1 | | | 0.44 | 1 | | | 0.26 | 1 | | | 0.35 | 1 |
Net realized and unrealized gains (losses) on investments | | | 1.24 | | | | (0.71 | ) | | | 2.97 | | | | 6.24 | | | | (1.49 | ) | | | 1.83 | |
| | | | | | | | | | | | | | | | | | | | | | | | |
Total from investment operations | | | 1.40 | | | | (0.44 | ) | | | 3.24 | | | | 6.68 | | | | (1.23 | ) | | | 2.18 | |
Distributions to shareholders from | | | | | | | | | | | | | | | | | | | | | | | | |
Net investment income | | | 0.00 | | | | (0.17 | ) | | | (0.38 | ) | | | (0.23 | ) | | | (0.27 | ) | | | (0.27 | ) |
Net realized gains | | | 0.00 | | | | (2.06 | ) | | | (1.54 | ) | | | (0.57 | ) | | | (0.42 | ) | | | (5.18 | ) |
| | | | | | | | | | | | | | | | | | | | | | | | |
Total distributions to shareholders | | | 0.00 | | | | (2.23 | ) | | | (1.92 | ) | | | (0.80 | ) | | | (0.69 | ) | | | (5.45 | ) |
Net asset value, end of period | | | $33.95 | | | | $32.55 | | | | $35.22 | | | | $33.90 | | | | $28.02 | | | | $29.94 | |
Total return2 | | | 4.30 | % | | | (0.77 | )% | | | 9.52 | % | | | 23.82 | % | | | (4.01 | )% | | | 7.78 | % |
Ratios to average net assets (annualized) | | | | | | | | | | | | | | | | | | | | | | | | |
Gross expenses | | | 1.20 | % | | | 1.21 | % | | | 1.23 | % | | | 1.24 | % | | | 1.26 | % | | | 1.23 | % |
Net expenses | | | 1.20 | % | | | 1.20 | % | | | 1.20 | % | | | 1.20 | % | | | 1.17 | % | | | 1.09 | % |
Net investment income | | | 0.96 | % | | | 0.74 | % | | | 0.76 | % | | | 1.36 | % | | | 0.95 | % | | | 1.10 | % |
Supplemental data | | | | | | | | | | | | | | | | | | | | | | | | |
Portfolio turnover rate | | | 16 | % | | | 32 | % | | | 41 | % | | | 51 | % | | | 46 | % | | | 79 | % |
Net assets, end of period (000s omitted) | | | $153,818 | | | | $160,369 | | | | $229,992 | | | | $199,262 | | | | $95,030 | | | | $70,100 | |
| 1 | Calculated based upon average shares outstanding |
| 2 | Returns for periods of less than one year are not annualized. |
The accompanying notes are an integral part of these financial statements.
Wells Fargo Special Small Cap Value Fund | 21
Financial highlights
(For a share outstanding throughout each period)
| | | | | | | | | | | | | | | | | | | | | | | | |
| | | Six months ended
September 30, 2019
(unaudited) | | | Year ended March 31 | |
| INSTITUTIONAL CLASS | | 2019 | | | 2018 | | | 2017 | | | 2016 | | | 2015 | |
Net asset value, beginning of period | | | $32.56 | | | | $35.27 | | | | $33.94 | | | | $28.03 | | | | $29.93 | | | | $33.21 | |
Net investment income | | | 0.17 | | | | 0.33 | | | | 0.33 | | | | 0.60 | 1 | | | 0.30 | | | | 0.43 | 1 |
Net realized and unrealized gains (losses) on investments | | | 1.27 | | | | (0.70 | ) | | | 3.01 | | | | 6.17 | | | | (1.46 | ) | | | 1.80 | |
| | | | | | | | | | | | | | | | | | | | | | | | |
Total from investment operations | | | 1.44 | | | | (0.37 | ) | | | 3.34 | | | | 6.77 | | | | (1.16 | ) | | | 2.23 | |
Distributions to shareholders from | | | | | | | | | | | | | | | | | | | | | | | | |
Net investment income | | | 0.00 | | | | (0.28 | ) | | | (0.47 | ) | | | (0.29 | ) | | | (0.32 | ) | | | (0.33 | ) |
Net realized gains | | | 0.00 | | | | (2.06 | ) | | | (1.54 | ) | | | (0.57 | ) | | | (0.42 | ) | | | (5.18 | ) |
| | | | | | | | | | | | | | | | | | | | | | | | |
Total distributions to shareholders | | | 0.00 | | | | (2.34 | ) | | | (2.01 | ) | | | (0.86 | ) | | | (0.74 | ) | | | (5.51 | ) |
Net asset value, end of period | | | $34.00 | | | | $32.56 | | | | $35.27 | | | | $33.94 | | | | $28.03 | | | | $29.93 | |
Total return2 | | | 4.39 | % | | | (0.53 | )% | | | 9.82 | % | | | 24.13 | % | | | (3.79 | )% | | | 7.96 | % |
Ratios to average net assets (annualized) | | | | | | | | | | | | | | | | | | | | | | | | |
Gross expenses | | | 0.95 | % | | | 0.96 | % | | | 0.98 | % | | | 0.99 | % | | | 1.01 | % | | | 0.96 | % |
Net expenses | | | 0.94 | % | | | 0.94 | % | | | 0.94 | % | | | 0.94 | % | | | 0.94 | % | | | 0.94 | % |
Net investment income | | | 1.32 | % | | | 1.04 | % | | | 1.02 | % | | | 1.86 | % | | | 1.17 | % | | | 1.36 | % |
Supplemental data | | | | | | | | | | | | | | | | | | | | | | | | |
Portfolio turnover rate | | | 16 | % | | | 32 | % | | | 41 | % | | | 51 | % | | | 46 | % | | | 79 | % |
Net assets, end of period (000s omitted) | | | $1,999,422 | | | | $1,359,038 | | | | $1,196,501 | | | | $921,732 | | | | $256,190 | | | | $189,965 | |
| 1 | Calculated based upon average shares outstanding |
| 2 | Returns for periods of less than one year are not annualized. |
The accompanying notes are an integral part of these financial statements.
22 | Wells Fargo Special Small Cap Value Fund
Notes to financial statements (unaudited)
1. ORGANIZATION
Wells Fargo Funds Trust (the “Trust”), a Delaware statutory trust organized on March 10, 1999, is anopen-end management investment company registered under the Investment Company Act of 1940, as amended (the “1940 Act”). As an investment company, the Trust follows the accounting and reporting guidance in Financial Accounting Standards Board (“FASB”)Accounting Standards Codification Topic 946, Financial Services – Investment Companies. These financial statements report on the Wells Fargo Special Small Cap Value Fund (the “Fund”) which is a diversified series of the Trust.
2. SIGNIFICANT ACCOUNTING POLICIES
The following significant accounting policies, which are consistently followed in the preparation of the financial statements of the Fund, are in conformity with U.S. generally accepted accounting principles which require management to make estimates and assumptions that affect the reported amounts of assets and liabilities, disclosure of contingent assets and liabilities at the date of the financial statements, and the reported amounts of revenues and expenses during the reporting period. Actual results could differ from those estimates.
Securities valuation
All investments are valued each business day as of the close of regular trading on the New York Stock Exchange (generally 4 p.m. Eastern Time), although the Fund may deviate from this calculation time under unusual or unexpected circumstances.
Equity securities and futures contracts that are listed on a foreign or domestic exchange or market are valued at the official closing price or, if none, the last sales price. If no sale occurs on the principal exchange or market that day, a fair value price will be determined in accordance with the Fund’s Valuation Procedures.
Investments in registeredopen-end investment companies are valued at net asset value. Interests innon-registered investment companies that are redeemable at net asset value are fair valued normally at net asset value.
Investments which are not valued using any of the methods discussed above are valued at their fair value, as determined in good faith by the Board of Trustees of the Fund. The Board of Trustees has established a Valuation Committee comprised of the Trustees and has delegated to it the authority to take any actions regarding the valuation of portfolio securities that the Valuation Committee deems necessary or appropriate, including determining the fair value of portfolio securities, unless the determination has been delegated to the Wells Fargo Asset Management Pricing Committee at Wells Fargo Funds Management, LLC (“Funds Management”). The Board of Trustees retains the authority to make or ratify any valuation decisions or approve any changes to the Valuation Procedures as it deems appropriate. On a quarterly basis, the Board of Trustees receives reports on any valuation actions taken by the Valuation Committee or the Wells Fargo Asset Management Pricing Committee which may include items for ratification.
Securities lending
The Fund may lend its securities from time to time in order to earn additional income in the form of fees or interest on securities received as collateral or the investment of any cash received as collateral. When securities are on loan, the Fund receives interest or dividends on those securities. Cash collateral received in connection with its securities lending transactions is invested in Securities Lending Cash Investments, LLC (the “Securities Lending Fund”). Investments in Securities Lending Fund are valued at the evaluated bid price provided by an independent pricing service. Income earned from investment in the Securities Lending Fund (net of fees and rebates), if any, is included in income from affiliated securities on the Statement of Operations.
In a securities lending transaction, the net asset value of the Fund is affected by an increase or decrease in the value of the securities loaned and by an increase or decrease in the value of the instrument in which collateral is invested. The amount of securities lending activity undertaken by the Fund fluctuates from time to time. The Fund has the right under the lending agreement to recover the securities from the borrower on demand. In the event of default or bankruptcy by the borrower, the Fund may be prevented from recovering the loaned securities or gaining access to the collateral or may experience delays or costs in doing so. In such an event, the terms of the agreement allows the unaffiliated securities lending agent to use the collateral to purchase replacement securities on behalf of the Fund or pay the Fund the market value of the loaned securities. The Fund bears the risk of loss with respect to depreciation of its investment of the cash collateral.
Futures contracts
Futures contracts are agreements between the Fund and a counterparty to buy or sell a specific amount of a commodity, financial instrument or currency at a specified price and on a specified date. The Fund may buy and sell futures contracts in order to gain exposure to, or protect against, changes in security values and is subject to equity price risk. The primary risks associated with the use of futures contracts are the imperfect correlation between changes in market values of securities held by the Fund and the prices of futures contracts, and the possibility of an illiquid market. Futures contracts are generally entered into on a regulated futures exchange and cleared through a clearinghouse associated with the exchange. With futures contracts,
Wells Fargo Special Small Cap Value Fund | 23
Notes to financial statements (unaudited)
there is minimal counterparty risk to the Fund since futures contracts are exchange traded and the exchange’s clearinghouse, as the counterparty to all exchange traded futures, guarantees the futures contracts against default.
Upon entering into a futures contracts, the Fund is required to deposit either cash or securities (initial margin) with the broker in an amount equal to a certain percentage of the contract value. Subsequent payments (variation margin) are paid to or from the broker each day equal to the daily changes in the contract value. Such payments are recorded as unrealized gains or losses and, if any, shown as variation margin receivable (payable) in the Statement of Assets and Liabilities. Should the Fund fail to make requested variation margin payments, the broker can gain access to the initial margin to satisfy the Fund’s payment obligations. When the contracts are closed, a realized gain or loss is recorded in the Statement of Operations.
Security transactions and income recognition
Securities transactions are recorded on a trade date basis. Realized gains or losses are recorded on the basis of identified cost.
Dividend income is recognized on theex-dividend date. Dividend income is recorded net of foreign taxes withheld where recovery of such taxes is not assured.
Income dividends and capital gain distributions from investment companies are recorded on theex-dividend date. Capital gain distributions from investment companies are treated as realized gains.
Distributions to shareholders
Distributions to shareholders from net investment income and any net realized gains are recorded on theex-dividend date and paid at least annually. Such distributions are determined in accordance with income tax regulations and may differ from U.S. generally accepted accounting principles. Dividend sources are estimated at the time of declaration. The tax character of distributions is determined as of the Fund’s fiscal year end. Therefore, a portion of the Fund’s distributions made prior to the Fund’s fiscal year end may be categorized as a tax return of capital at year end.
Federal and other taxes
The Fund intends to continue to qualify as a regulated investment company by distributing substantially all of its investment company taxable income and any net realized capital gains (after reduction for capital loss carryforwards) sufficient to relieve it from all, or substantially all, federal income taxes. Accordingly, no provision for federal income taxes was required.
The Fund’s income and federal excise tax returns and all financial records supporting those returns for the prior three fiscal years are subject to examination by the federal and Delaware revenue authorities. Management has analyzed the Fund’s tax positions taken on federal, state, and foreign tax returns for all open tax years and does not believe that there are any uncertain tax positions that require recognition of a tax liability.
As of September 30, 2019, the aggregate cost of all investments for federal income tax purposes was $3,101,523,457 and the unrealized gains (losses) consisted of:
| | | | |
| |
Gross unrealized gains | | $ | 472,417,868 | |
| |
Gross unrealized losses | | | (242,647,367 | ) |
| |
Net unrealized gains | | | 229,770,501 | |
Class allocations
The separate classes of shares offered by the Fund differ principally in applicable sales charges, distribution, shareholder servicing, and administration fees. Class specific expenses are charged directly to that share class. Investment income, common fund-level expenses, and realized and unrealized gains (losses) on investments are allocated daily to each class of shares based on the relative proportion of net assets of each class.
3. FAIR VALUATION MEASUREMENTS
Fair value measurements of investments are determined within a framework that has established a fair value hierarchy based upon the various data inputs utilized in determining the value of the Fund’s investments. The three-level hierarchy gives the highest priority to unadjusted quoted prices in active markets for identical assets or liabilities (Level 1) and the lowest priority to unobservable inputs (Level 3). The Fund’s investments are classified within the fair value hierarchy based on the lowest level of input that is significant to the fair value measurement. The inputs are summarized into three broad levels as follows:
| ∎ | | Level 1 – quoted prices in active markets for identical securities |
| ∎ | | Level 2 – other significant observable inputs (including quoted prices for similar securities, interest rates, prepayment speeds, credit risk, etc.) |
| ∎ | | Level 3 – significant unobservable inputs (including the Fund’s own assumptions in determining the fair value of investments) |
24 | Wells Fargo Special Small Cap Value Fund
Notes to financial statements (unaudited)
The inputs or methodologies used for valuing investments in securities are not necessarily an indication of the risk associated with investing in those securities.
The following is a summary of the inputs used in valuing the Fund’s assets and liabilities as of September 30, 2019:
| | | | | | | | | | | | | | | | |
| | | | |
| | | Quoted prices
(Level 1) | | | Other significant
observable inputs
(Level 2) | | | Significant
unobservable inputs (Level 3) | | | Total | |
| | | | |
Assets | | | | | | | | | | | | | | | | |
Investments in: | | | | | | | | | | | | | | | | |
| | | | |
Common stocks | | | | | | | | | | | | | | | | |
| | | | |
Communication services | | $ | 34,220,323 | | | $ | 0 | | | $ | 0 | | | $ | 34,220,323 | |
| | | | |
Consumer discretionary | | | 315,037,228 | | | | 0 | | | | 0 | | | | 315,037,228 | |
| | | | |
Consumer staples | | | 300,370,584 | | | | 0 | | | | 0 | | | | 300,370,584 | |
| | | | |
Energy | | | 104,164,472 | | | | 0 | | | | 0 | | | | 104,164,472 | |
| | | | |
Financials | | | 762,096,133 | | | | 61,080 | | | | 0 | | | | 762,157,213 | |
| | | | |
Health care | | | 74,677,042 | | | | 0 | | | | 0 | | | | 74,677,042 | |
| | | | |
Industrials | | | 630,140,929 | | | | 0 | | | | 0 | | | | 630,140,929 | |
| | | | |
Information technology | | | 280,068,119 | | | | 0 | | | | 0 | | | | 280,068,119 | |
| | | | |
Materials | | | 424,512,621 | | | | 0 | | | | 0 | | | | 424,512,621 | |
| | | | |
Real estate | | | 91,675,581 | | | | 0 | | | | 0 | | | | 91,675,581 | |
| | | | |
Utilities | | | 111,482,278 | | | | 0 | | | | 0 | | | | 111,482,278 | |
| | | | |
Exchange-traded funds | | | 36,443,932 | | | | 0 | | | | 0 | | | | 36,443,932 | |
| | | | |
Preferred stocks | | | | | | | | | | | | | | | | |
| | | | |
Industrials | | | 8,600,503 | | | | 0 | | | | 0 | | | | 8,600,503 | |
| | | | |
Rights | | | | | | | | | | | | | | | | |
| | | | |
Financials | | | 0 | | | | 0 | | | | 257,054 | | | | 257,054 | |
| | | | |
Short-term investments | | | | | | | | | | | | | | | | |
| | | | |
Investment companies | | | 157,486,079 | | | | 0 | | | | 0 | | | | 157,486,079 | |
| | | | |
Total assets | | $ | 3,330,975,824 | | | $ | 61,080 | | | $ | 257,054 | | | $ | 3,331,293,958 | |
Additional sector, industry or geographic detail is included in the Portfolio of Investments.
For the six months ended September 30, 2019, the Fund did not have any transfers into/out of Level 3.
4. TRANSACTIONS WITH AFFILIATES
Management fee
Funds Management, an indirect wholly owned subsidiary of Wells Fargo & Company (“Wells Fargo”), is the manager of the Fund and provides advisory and fund-level administrative services under an investment management agreement. Under the investment management agreement, Funds Management is responsible for, among other services, implementing the investment objectives and strategies of the Fund, supervising the subadviser and providing fund-level administrative services in connection with the Fund’s operations. As compensation for its services under the investment management agreement, Funds Management is entitled to receive a management fee at the following annual rate based on the Fund’s average daily net assets:
| | |
| |
| Average daily net assets | | Management fee |
| |
First $500 million | | 0.850% |
| |
Next $500 million | | 0.825 |
| |
Next $1 billion | | 0.800 |
| |
Next $1 billion | | 0.775 |
| |
Next $1 billion | | 0.750 |
| |
Next $1 billion | | 0.730 |
| |
Next $5 billion | | 0.720 |
| |
Over $10 billion | | 0.710 |
Wells Fargo Special Small Cap Value Fund | 25
Notes to financial statements (unaudited)
For the six months ended September 30, 2019, the management fee was equivalent to an annual rate of 0.80% of the Fund’s average daily net assets.
Funds Management has retained the services of a subadviser to provide daily portfolio management to the Fund. The fee for subadvisory services is borne by Funds Management. Wells Capital Management Incorporated (“WellsCap”), an affiliate of Funds Management and an indirect wholly owned subsidiary of Wells Fargo, is the subadviser to the Fund and is entitled to receive a fee from Funds Management at an annual rate starting at 0.55% and declining to 0.40% as the average daily net assets of the Fund increase.
Administration fees
Under a class-level administration agreement, Funds Management provides class-level administrative services to the Fund, which includes paying fees and expenses for services provided by the transfer agent,sub-transfer agents, omnibus account servicers and record-keepers. As compensation for its services under the class-level administration agreement, Funds Management receives an annual fee which is calculated based on the average daily net assets of each class as follows:
| | |
| |
| | | Class-level
administration fee |
| |
Class A, Class C, Class R | | 0.21% |
| |
Class R6 | | 0.03 |
| |
Administrator Class, Institutional Class | | 0.13 |
Waivers and/or expense reimbursements
Funds Management has contractually waived and/or reimbursed management and administration fees to the extent necessary to maintain certain net operating expense ratios for the Fund. When each class of the Fund has exceeded its expense cap, Funds Management has waived fees and/or reimbursed expenses from fund-level expenses on a proportionate basis and then from class specific expenses. When only certain classes exceed their expense caps, waivers and/or reimbursements are applied against class specific expenses before fund-level expenses. Funds Management has committed through July 31, 2020 to waive fees and/or reimburse expenses to the extent necessary to cap the Fund’s expenses at 1.31% for Class A shares, 2.06% for Class C shares, 1.56% for Class R shares, 0.89% for Class R6 shares, 1.20% for Administrator Class shares, and 0.94% for Institutional Class shares. Prior to or after the commitment expiration date, the cap may be increased or the commitment to maintain the cap may be terminated only with the approval of the Board of Trustees. Prior to August 1, 2019, the Fund’s expenses were capped at 1.34% for Class A shares, 2.09% for Class C shares, and 1.59% for Class R shares.
Distribution fees
The Trust has adopted a distribution plan for Class C and Class R shares of the Fund pursuant to Rule12b-1 under the 1940 Act. Distribution fees are charged to Class C and Class R shares and paid to Wells Fargo Funds Distributor, LLC (“Funds Distributor”), the principal underwriter, at an annual rate of 0.75% of the average daily net assets of Class C shares and 0.25% of the average daily net assets of Class R shares.
In addition, Funds Distributor is entitled to receive thefront-end sales charge from the purchase of Class A shares and a contingent deferred sales charge on the redemption of certain Class A shares. Funds Distributor is also entitled to receive the contingent deferred sales charges from redemptions of Class C shares. For the six months ended September 30, 2019, Funds Distributor received $2,754 from the sale of Class A shares and $115 in contingent deferred sales charges from redemptions of Class C shares. No contingent deferred sales charges were incurred by Class A shares for the six months ended September 30, 2019.
Shareholder servicing fees
The Trust has entered into contracts with one or more shareholder servicing agents, whereby Class A, Class C, Class R, and Administrator Class of the Fund are charged a fee at an annual rate of 0.25% of the average daily net assets of each respective class. A portion of these total shareholder servicing fees were paid to affiliates of Wells Fargo.
Interfund transactions
The Fund may purchase or sell portfolio investment securities to certain other Wells Fargo affiliates pursuant to Rule17a-7 under the 1940 Act and under procedures adopted by the Board of Trustees. The procedures have been designed to ensure that these interfund transactions, which do not incur broker commissions, are effected at current market prices.
26 | Wells Fargo Special Small Cap Value Fund
Notes to financial statements (unaudited)
5. INVESTMENT PORTFOLIO TRANSACTIONS
Purchases and sales of investments, excluding U.S. government obligations (if any) and short-term securities, for the six months ended September 30, 2019 were $1,061,383,182 and $460,015,584, respectively.
6. SECURITIES LENDING TRANSACTIONS
The Fund lends its securities through an unaffiliated securities lending agent and receives collateral in the form of cash or securities with a value at least equal to the value of the securities on loan. The value of the loaned securities is determined at the close of each business day and any increases or decreases in the required collateral are exchanged between the Fund and the counterparty on the next business day. Cash collateral received is invested in the Securities Lending Fund which seeks to provide a positive return compared to the daily Fed Funds Open Rate by investing in high-quality, U.S. dollar-denominated short-term money market instruments and is exempt from registration under Section 3(c)(7) of the 1940 Act. Securities Lending Fund is managed by Funds Management and is subadvised by WellsCap. Funds Management receives an advisory fee starting at 0.05% and declining to 0.01% as the average daily net assets of the Securities Lending Fund increase. All of the fees received by Funds Management are paid to WellsCap for its services as subadviser.
In the event of counterparty default or the failure of a borrower to return a loaned security, the Fund has the right to use the collateral to offset any losses incurred. As of September 30, 2019, the Fund had securities lending transactions with the following counterparties which are subject to offset:
| | | | | | | | | | | | |
| | | |
| Counterparty | | Value of
securities on loan | | | Collateral
received1 | | | Net amount | |
| | | |
Bank of America Securities Inc. | | $ | 4,371,490 | | | $ | (4,371,490 | ) | | $ | 0 | |
| | | |
Barclays Capital Inc. | | | 3,133,373 | | | | (3,133,373 | ) | | | 0 | |
| | | |
Citigroup Global Markets Inc. | | | 536,693 | | | | (536,693 | ) | | | 0 | |
| | | |
Deutsche Bank Securities Inc. | | | 4,558,281 | | | | (4,558,281 | ) | | | 0 | |
| | | |
JPMorgan Securities LLC | | | 7,042,198 | | | | (7,042,198 | ) | | | 0 | |
| | | |
Morgan Stanley & Co. LLC | | | 644,746 | | | | (644,746 | ) | | | 0 | |
| | | |
UBS Securities LLC | | | 522,849 | | | | (522,849 | ) | | | 0 | |
| 1 | Collateral received within this table is limited to the collateral for the net transaction with the counterparty. |
7. BANK BORROWINGS
The Trust (excluding the money market funds), Wells Fargo Master Trust and Wells Fargo Variable Trust are parties to a $280,000,000 revolving credit agreement whereby the Fund is permitted to use bank borrowings for temporary or emergency purposes, such as to fund shareholder redemption requests. Interest under the credit agreement is charged to the Fund based on a borrowing rate equal to the higher of the Federal Funds rate in effect on that day plus 1.25% or the overnight LIBOR rate in effect on that day plus 1.25%. In addition, an annual commitment fee equal to 0.25% of the unused balance is allocated to each participating fund.
For the six months ended September 30, 2019, there were no borrowings by the Fund under the agreement.
8. INDEMNIFICATION
Under the Trust’s organizational documents, the officers and Trustees have been granted certain indemnification rights against certain liabilities that may arise out of performance of their duties to the Trust. Additionally, in the normal course of business, the Trust may enter into contracts with service providers that contain a variety of indemnification clauses. The Trust’s maximum exposure under these arrangements is dependent on future claims that may be made against the Fund and, therefore, cannot be estimated.
9. NEW ACCOUNTING PRONOUNCEMENT
In August 2018, FASB issued Accounting Standards Update (“ASU”)No. 2018-13, Fair Value Measurement (Topic 820)Disclosure Framework—Changes to the Disclosure Requirements for Fair Value Measurement. ASU2018-13 updates the disclosure requirements for fair value measurements by modifying or removing certain disclosures and adding certain new disclosures. The amendments are effective for fiscal years, and interim periods within those fiscal years, beginning after December 15, 2019. Early adoption is permitted. Management has adopted the removal and modification of disclosures early, as permitted, and will adopt the additional new disclosures at the effective date.
Wells Fargo Special Small Cap Value Fund | 27
Other information (unaudited)
PROXY VOTING INFORMATION
A description of the policies and procedures used to determine how to vote proxies relating to portfolio securities is available, upon request, by calling1-800-222-8222, visiting our website atwfam.com, or visiting the SEC website at sec.gov. Information regarding how the proxies related to portfolio securities were voted during the most recent12-month period ended June 30 is available on the website atwfam.comor by visiting the SEC website at sec.gov.
QUARTERLY PORTFOLIO HOLDINGS INFORMATION
The Fund files its complete schedule of portfolio holdings with the SEC for the first and third quarters of each fiscal year on FormN-Q or FormN-PORT, which is available by visiting the SEC website at sec.gov. Those forms may be reviewed and copied at the SEC’s Public Reference Room in Washington, DC. Information on the operation of the Public Reference Room may be obtained by calling1-800-SEC-0330.
28 | Wells Fargo Special Small Cap Value Fund
Other information (unaudited)
BOARD OF TRUSTEES AND OFFICERS
Each of the Trustees and Officers1 listed in the table below acts in identical capacities for each fund in the Wells Fargo family of funds, which consists of 150 mutual funds comprising the Wells Fargo Funds Trust, Wells Fargo Variable Trust, Wells Fargo Master Trust and fourclosed-end funds (collectively the “Fund Complex”). This table should be read in conjunction with the Prospectus and the Statement of Additional Information2. The mailing address of each Trustee and Officer is 525 Market Street, 12th Floor, San Francisco, CA 94105. Each Trustee and Officer serves an indefinite term, however, each Trustee serves such term until reaching the mandatory retirement age established by the Trustees.
Independent Trustees
| | | | | | |
Name and
year of birth | | Position held and
length of service* | | Principal occupations during past five years or longer | | Current other
public company or
investment
company
directorships |
| | | |
| William R. Ebsworth (Born 1957) | | Trustee, since 2015 | | Retired. From 1984 to 2013, equities analyst, portfolio manager, research director and chief investment officer at Fidelity Management and Research Company in Boston, Tokyo, and Hong Kong, and retired in 2013 as Chief Investment Officer of Fidelity Strategic Advisers, Inc. where he led a team of investment professionals managing client assets. Prior thereto, Board member of Hong Kong Securities Clearing Co., Hong Kong Options Clearing Corp., the Thailand International Fund, Ltd., Fidelity Investments Life Insurance Company, and Empire Fidelity Investments Life Insurance Company. Audit Committee Chair and Investment Committee Chair of the Vincent Memorial Hospital Endowment(non-profit organization). Mr. Ebsworth is a CFA® charterholder. | | N/A |
| | | |
| Jane A. Freeman (Born 1953) | | Trustee, since 2015; Chair Liaison, since 2018 | | Retired. From 2012 to 2014 and 1999 to 2008, Chief Financial Officer of Scientific Learning Corporation. From 2008 to 2012, Ms. Freeman provided consulting services related to strategic business projects. Prior to 1999, Portfolio Manager at Rockefeller & Co. and Scudder, Stevens & Clark. Board member of the Harding Loevner Funds from 1996 to 2014, serving as both Lead Independent Director and chair of the Audit Committee. Board member of the Russell Exchange Traded Funds Trust from 2011 to 2012 and the chair of the Audit Committee. Ms. Freeman is a Board Member of The Ruth Bancroft Garden(non-profit organization). She is also an inactive Chartered Financial Analyst. | | N/A |
| | | |
Isaiah Harris, Jr.
(Born 1952) | | Trustee, since 2009; Audit Committee Chairman, since 2019 | | Retired. Chairman of the Board of CIGNA Corporation since 2009, and Director since 2005. From 2003 to 2011, Director of Deluxe Corporation. Prior thereto, President and CEO of BellSouth Advertising and Publishing Corp. from 2005 to 2007, President and CEO of BellSouth Enterprises from 2004 to 2005 and President of BellSouth Consumer Services from 2000 to 2003. Emeritus member of the Iowa State University Foundation Board of Governors. Emeritus Member of the Advisory Board of Iowa State University School of Business. Advisory Board Member, Palm Harbor Academy (private school). Advisory Board Member, Child Evangelism Fellowship(non-profit). Mr. Harris is a certified public accountant (inactive status). | | CIGNA Corporation |
| | | |
| Judith M. Johnson (Born 1949) | | Trustee, since 2008; Audit Committee Chairman, from 2009 to 2018 | | Retired. Prior thereto, Chief Executive Officer and Chief Investment Officer of Minneapolis Employees Retirement Fund from 1996 to 2008. Ms. Johnson is an attorney, certified public accountant and a certified managerial accountant. | | N/A |
Wells Fargo Special Small Cap Value Fund | 29
Other information (unaudited)
| | | | | | |
Name and
year of birth | | Position held and
length of service* | | Principal occupations during past five years or longer | | Current other
public company or
investment
company
directorships |
| | | |
David F. Larcker
(Born 1950) | | Trustee, since 2009 | | James Irvin Miller Professor of Accounting at the Graduate School of Business, Stanford University, Director of the Corporate Governance Research Initiative and Senior Faculty of The Rock Center for Corporate Governance since 2006. From 2005 to 2008, Professor of Accounting at the Graduate School of Business, Stanford University. Prior thereto, Ernst & Young Professor of Accounting at The Wharton School, University of Pennsylvania from 1985 to 2005. | | N/A |
| | | |
Olivia S. Mitchell
(Born 1953) | | Trustee, since 2006; Nominating and Governance Committee Chairman, since 2018 | | International Foundation of Employee Benefit Plans Professor, Wharton School of the University of Pennsylvania since 1993. Director of Wharton’s Pension Research Council and Boettner Center on Pensions & Retirement Research, and Research Associate at the National Bureau of Economic Research. Previously, Cornell University Professor from 1978 to 1993. | | N/A |
| | | |
| Timothy J. Penny (Born 1951) | | Trustee, since 1996; Chairman, since 2018 | | President and Chief Executive Officer of Southern Minnesota Initiative Foundation, anon-profit organization, since 2007. Member of the Board of Trustees of NorthStar Education Finance, Inc., anon-profit organization, since 2007. | | N/A |
| | | |
| James G. Polisson (Born 1959) | | Trustee, since 2018 | | Retired. Chief Marketing Officer, Source (ETF) UK Services, Ltd, from 2015 to 2017. From 2012 to 2015, Principal of The Polisson Group, LLC, a management consulting, corporate advisory and principal investing company. Chief Executive Officer and Managing Director at Russell Investments, Global Exchange Traded Funds from 2010 to 2012. Managing Director of Barclays Global Investors from 1998 to 2010 and Global Chief Marketing Officer for iShares and Barclays Global Investors from 2000 to 2010. Trustee of the San Francisco Mechanics’ Institute, anon-profit organization, from 2013 to 2015. Board member of the Russell Exchange Traded Fund Trust from 2011 to 2012. Director of Barclays Global Investors Holdings Deutschland GmbH from 2006 to 2009. Mr. Polisson is an attorney and has a retired status with the Massachusetts and District of Columbia Bar Associations. | | N/A |
| * | Length of service dates reflect the Trustee’s commencement of service with the Trust’s predecessor entities, where applicable. |
30 | Wells Fargo Special Small Cap Value Fund
Other information (unaudited)
Officers
| | | | |
Name and
year of birth | | Position held and
length of service | | Principal occupations during past five years or longer |
| | |
| Andrew Owen (Born 1960) | | President, since 2017 | | Executive Vice President of Wells Fargo & Company and Head of Affiliated Managers, Wells Fargo Asset Management, since 2014. In addition, Mr. Owen is currently President, Chief Executive Officer and Director of Wells Fargo Funds Management, LLC since 2017. Prior thereto, Executive Vice President responsible for marketing, investments and product development for Wells Fargo Funds Management, LLC, from 2009 to 2014. |
| | |
| Nancy Wiser1(Born 1967) | | Treasurer, since 2012 | | Executive Vice President of Wells Fargo Funds Management, LLC since 2011. Chief Operating Officer and Chief Compliance Officer at LightBox Capital Management LLC, from 2008 to 2011. |
| | |
| Michelle Rhee3(Born 1966) | | Chief Legal Officer, since 2019 | | Secretary of Wells Fargo Funds Management, LLC, Chief Legal Counsel of Wells Fargo Asset Management and Assistant General Counsel of Wells Fargo Bank, N.A. since 2018. Associate General Counsel and Managing Director of Bank of America Corporation from 2004 to 2018. |
| | |
| Catherine Kennedy4(Born 1969) | | Secretary, since 2019 | | Vice President of Wells Fargo Funds Management, LLC and Senior Counsel of the Wells Fargo Legal Department since 2010. Vice President and Senior Counsel of Evergreen Investment Management Company, LLC from 1998 to 2010. |
| | |
| Michael H. Whitaker(Born 1967) | | Chief Compliance Officer, since 2016 | | Chief Compliance Officer of Wells Fargo Asset Management since 2016. Senior Vice President and Chief Compliance Officer for Fidelity Investments from 2007 to 2016. |
| | |
| David Berardi (Born 1975) | | Assistant Treasurer, since 2009 | | Vice President of Wells Fargo Funds Management, LLC since 2009. Vice President of Evergreen Investment Management Company, LLC from 2008 to 2010. Manager of Fund Reporting and Control for Evergreen Investment Management Company, LLC from 2004 to 2010. |
| | |
| Jeremy DePalma1(Born 1974) | | Assistant Treasurer, since 2009 | | Senior Vice President of Wells Fargo Funds Management, LLC since 2009. Senior Vice President of Evergreen Investment Management Company, LLC from 2008 to 2010 and head of the Fund Reporting and Control Team within Fund Administration from 2005 to 2010. |
| 1 | Nancy Wiser acts as Treasurer of 64 funds in the Fund Complex. Jeremy DePalma acts as Treasurer of 86 funds and Assistant Treasurer of 64 funds in the Fund Complex. |
| 2 | The Statement of Additional Information includes additional information about the Trustees and is available, without charge, upon request, by calling1-800-222-8222 or by visiting the website atwfam.com. |
| 3 | Michelle Rhee became Chief Legal Officer effective October 22, 2019. |
| 4 | Catherine Kennedy became Secretary effective October 22, 2019. |
Wells Fargo Special Small Cap Value Fund | 31
Other information (unaudited)
BOARD CONSIDERATION OF INVESTMENT MANAGEMENT ANDSUB-ADVISORY AGREEMENTS:
Wells Fargo Special Small Cap Value Fund
Under the Investment Company Act of 1940 (the “1940 Act”), the Board of Trustees (the “Board”) of Wells Fargo Funds Trust (the “Trust”) must determine annually whether to approve the continuation of the Trust’s investment management andsub-advisory agreements. In this regard, at anin-person meeting held on May21-22, 2019 (the “Meeting”), the Board, all the members of which have no direct or indirect interest in the investment management andsub-advisory agreements and are not “interested persons” of the Trust, as defined in the 1940 Act (the “Independent Trustees”), reviewed and approved for Wells Fargo Special Small Cap Value Fund(the “Fund”): (i) an investment management agreement (the “Management Agreement”) with Wells Fargo Funds Management, LLC (“Funds Management”); and (ii) an investmentsub-advisory agreement (the“Sub-Advisory Agreement”) with Wells Capital Management Incorporated (the“Sub-Adviser”), an affiliate of Funds Management. The Management Agreement and theSub-Advisory Agreement are collectively referred to as the “Advisory Agreements.”
At the Meeting, the Board considered the factors and reached the conclusions described below relating to the selection of Funds Management and theSub-Adviser and the approval of the Advisory Agreements. Prior to the Meeting, including at anin-person meeting in April 2019, the Trustees conferred extensively among themselves and with representatives of Funds Management about these matters. Also, the Board has adopted a team-based approach, with each team consisting of asub-set of Trustees, to assist the full Board in the discharge of its duties in reviewing investment performance and other matters throughout the year. The Independent Trustees were assisted in their evaluation of the Advisory Agreements by independent legal counsel, from whom they received separate legal advice and with whom they met separately.
In providing information to the Board, Funds Management and theSub-Adviser were guided by a detailed set of requests for information submitted to them by independent legal counsel on behalf of the Independent Trustees at the start of the Board’s annual contract renewal process earlier in 2019. In considering and approving the Advisory Agreements, the Trustees considered the information they believed relevant, including but not limited to the information discussed below. The Board considered not only the specific information presented in connection with the Meeting, but also the knowledge gained over time through interaction with Funds Management and theSub-Adviser about various topics. In this regard, the Board reviewed reports of Funds Management at each of its quarterly meetings, which included, among other things, portfolio reviews and investment performance reports. In addition, the Board and the teams mentioned above confer with portfolio managers at various times throughout the year. The Board did not identify any particular information or consideration that wasall-important or controlling, and each individual Trustee may have attributed different weights to various factors.
After its deliberations, the Board unanimously approved the continuation of the Advisory Agreements for aone-year term and determined that the compensation payable to Funds Management and theSub-Adviser under each of the Advisory Agreements was reasonable. The Board considered the approval of the Advisory Agreements for the Fund as part of its consideration of agreements for funds across the complex, but its approvals were made on afund-by-fund basis. The following summarizes a number of important, but not necessarily all, factors considered by the Board in support of its approvals.
Nature, extent and quality of services
The Board received and considered various information regarding the nature, extent and quality of services provided to the Fund by Funds Management and theSub-Adviser under the Advisory Agreements. This information included a description of the investment advisory services and Fund-level administrative services covered by the Management Agreement, as well as, among other things, a summary of the background and experience of senior management of Wells Fargo Asset Management (“WFAM”), of which Funds Management and theSub-Adviser are a part, a summary of investments made in the business of WFAM, a summary of certain organizational and personnel changes involving Funds Management and theSub-Adviser, and a description of Funds Management’s and theSub-Adviser’s business continuity planning programs and of their approaches to data privacy and cybersecurity. The Board received and reviewed information about Funds Management’s role as administrator of the Fund’s liquidity risk management program. The Board also considered the qualifications, background, tenure and responsibilities of each of the portfolio managers primarily responsible for theday-to-day portfolio management of the Fund.
The Board evaluated the ability of Funds Management and theSub-Adviser to attract and retain qualified investment professionals, including research, advisory and supervisory personnel. The Board further considered the compliance programs and compliance records of Funds Management and theSub-Adviser. In addition, the Board took into account the full range of services provided to the Fund by Funds Management and its affiliates.
32 | Wells Fargo Special Small Cap Value Fund
Other information (unaudited)
Fund investment performance and expenses
The Board considered the investment performance results for the Fund over various time periods ended December 31, 2018. The Board considered these results in comparison to the investment performance of funds in a universe that was determined by Broadridge Inc. (“Broadridge”) to be similar to the Fund (the “Universe”), and in comparison to the Fund’s benchmark index and to other comparative data. Broadridge is an independent provider of investment company data. The Board received a description of the methodology used by Broadridge to select the mutual funds in the performance Universe. The Board noted that the investment performance of the Fund (Administrator Class) was higher than the average investment performance of the Universe for all periods under review. The Board also noted that the investment performance of the Fund was higher than its benchmark index, the Russell 2000® Value Index, for the three-, five- andten-year periods under review, but lower than its benchmark for theone-year period under review.
The Board received information concerning, and discussed factors contributing to, the short-term underperformance of the Fund relative to its benchmark. The Board took note of the explanations for the relative underperformance during these periods, including with respect to investment decisions and market factors that affected the Fund’s investment performance. The Board also took note of the Fund’s outperformance relative to the Universe and benchmark over the longer time periods under review.
The Board also received and considered information regarding the Fund’s net operating expense ratios and their various components, including actual management fees, custodian and othernon-management fees, and Rule12b-1 andnon-Rule12b-1 shareholder service fees. The Board considered these ratios in comparison to the median ratios of funds in class-specific expense groups that were determined by Broadridge to be similar to the Fund (the “Groups”). The Board received a description of the methodology used by Broadridge to select the mutual funds in the expense Groups and an explanation of how funds comprising expense groups and their expense ratios may vary fromyear-to-year. Based on the Broadridge reports, the Board noted that the net operating expense ratios of the Fund were in range of or lower than the median net operating expense ratios of the expense Groups for each share class. The Board also noted that the net operating expense ratio cap for Class A and Class R would be reduced.
The Board took into account the Fund’s investment performance and expense information provided to it among the factors considered in deciding tore-approve the Advisory Agreements.
Investment management andsub-advisory fee rates
The Board reviewed and considered the contractual fee rates payable by the Fund to Funds Management under the Management Agreement, as well as the contractual fee rates payable by the Fund to Funds Management for class-level administrative services under a Class-Level Administration Agreement, which include, among other things, class-level transfer agency andsub-transfer agency costs (collectively, the “Management Rates”). The Board also reviewed and considered the contractual investmentsub-advisory fee rates that are payable by Funds Management to theSub-Adviser for investmentsub-advisory services.
Among other information reviewed by the Board was a comparison of the Fund’s Management Rates with the average contractual investment management fee rates of funds in the expense Groups at a common asset level as well as transfer agency costs of the funds in the expense Groups. The Board noted that the Management Rates of the Fund were in range of or lower than the sum of these average rates for the Fund’s expense Groups for all share classes.
The Board also received and considered information about the portion of the total management fee that was retained by Funds Management after payment of the fee to theSub-Adviser forsub-advisory services. In assessing the reasonableness of this amount, the Board received and evaluated information about the nature and extent of responsibilities retained and risks assumed by Funds Management and not delegated to or assumed by theSub-Adviser, and about Funds Management’son-going oversight services. Given the affiliation between Funds Management and theSub-Adviser, the Board ascribed limited relevance to the allocation of fees between them.
The Board also received and considered information about the nature and extent of services offered and fee rates charged by Funds Management and theSub-Adviser to other types of clients with investment strategies similar to those of the Fund. In this regard, the Board received information about the significantly greater scope of services, and compliance, reporting and other legal burdens and risks of managing proprietary mutual funds compared with those associated with managing assets of other types of clients, including third-partysub-advised fund clients andnon-mutual fund clients such as institutional separate accounts.
Based on its consideration of the factors and information it deemed relevant, including those described here, the Board determined that the compensation payable to Funds Management under the Management Agreement and to theSub-Adviser under theSub-Advisory Agreement was reasonable.
Wells Fargo Special Small Cap Value Fund | 33
Other information (unaudited)
Profitability
The Board received and considered information concerning the profitability of Funds Management, as well as the profitability of both WFAM and Wells Fargo & Co. (“Wells Fargo”) from providing services to the fund family as a whole. The Board noted that theSub-Adviser’s profitability information with respect to providing services to the Fund and other funds in the family was subsumed in the WFAM and Wells Fargo profitability analysis.
Funds Management reported on the methodologies and estimates used in calculating profitability, including a description of the methodology used to allocate certain expenses. Among other things, the Board noted that the levels of profitability reported on afund-by-fund basis varied widely, depending on factors such as the size, type and age of fund. Based on its review, the Board did not deem the profits reported by Funds Management, WFAM or Wells Fargo from services provided to the Fund to be at a level that would prevent it from approving the continuation of the Advisory Agreements.
Economies of scale
The Board received and considered information about the potential for Funds Management to experience economies of scale in the provision of management services to the Fund, the difficulties of calculating economies of scale at an individual fund level, and the extent to which potential scale benefits are shared with shareholders. The Board noted the existence of breakpoints in the Fund’s management fee structure, which operate generally to reduce the Fund’s expense ratios as the Fund grows in size. The Board considered that in addition to management fee breakpoints, Funds Management shares potential economies of scale from its management business in a variety of ways, including through fee waiver and expense reimbursement arrangements, services that benefit shareholders, competitive management fee rates set at the outset without regard to breakpoints, and investments in the business intended to enhance services available to shareholders.
The Board concluded that Funds Management’s arrangements with respect to the Fund, including contractual breakpoints, constituted a reasonable approach to sharing potential economies of scale with the Fund and its shareholders.
Other benefits to Funds Management and theSub-Adviser
The Board received and considered information regarding potential“fall-out” or ancillary benefits received by Funds Management and its affiliates, including theSub-Adviser, as a result of their relationships with the Fund. Ancillary benefits could include, among others, benefits directly attributable to other relationships with the Fund and benefits potentially derived from an increase in Funds Management’s and theSub-Adviser’s business as a result of their relationships with the Fund. The Board noted that various affiliates of Funds Management may receive distribution-related fees, shareholder servicing payments andsub-transfer agency fees in respect of shares sold or held through them and services provided.
The Board also reviewed information about soft dollar credits earned and utilized by theSub-Adviser, fees earned by Funds Management and theSub-Adviser from managing a private investment vehicle for the fund family’s securities lending collateral, and commissions earned by an affiliated broker from portfolio transactions.
Based on its consideration of the factors and information it deemed relevant, including those described here, the Board did not find that any ancillary benefits received by Funds Management and its affiliates, including theSub-Adviser, were unreasonable.
Conclusion
At the Meeting, after considering the above-described factors and based on its deliberations and its evaluation of the information described above, the Board unanimously approved the continuation of the Advisory Agreements for aone-year term and determined that the compensation payable to Funds Management and theSub-Adviser under each of the Advisory Agreements was reasonable.
34 | Wells Fargo Special Small Cap Value Fund
This page is intentionally left blank.
This page is intentionally left blank.

For more information
More information about Wells Fargo Funds is available free upon request. To obtain literature, please write, visit the Fund’s website, or call:
Wells Fargo Funds
P.O. Box 219967
Kansas City, MO 64121-9967
Website:wfam.com
Individual investors:1-800-222-8222
Retail investment professionals:1-888-877-9275
Institutional investment professionals:1-866-765-0778

This report and the financial statements contained herein are submitted for the general information of the shareholders of the Fund. If this report is used for promotional purposes, distribution of the report must be accompanied or preceded by a current prospectus. Before investing, please consider the investment objectives, risks, charges, and expenses of the investment. For a current prospectus and, if available, a summary prospectus, containing this information, call1-800-222-8222 or visit the Fund’s website atwfam.com. Read the prospectus carefully before you invest or send money.
Wells Fargo Asset Management (WFAM) is the trade name for certain investment advisory/management firms owned by Wells Fargo & Company. These firms include but are not limited to Wells Capital Management Incorporated and Wells Fargo Funds Management, LLC. Certain products managed by WFAM entities are distributed by Wells Fargo Funds Distributor, LLC (a broker-dealer and Member FINRA).
This material is for general informational and educational purposes only and is NOT intended to provide investment advice or a recommendation of any kind—including a recommendation for any specific investment, strategy, or plan.
INVESTMENT PRODUCTS: NOT FDIC INSURED ◾ NO BANK GUARANTEE ◾ MAY LOSE VALUE
© 2019 Wells Fargo & Company. All rights reserved.
406821 11-19
SA246/SAR246 09-19
Semi-Annual Report
September 30, 2019
Wells Fargo
Fundamental Small Cap Growth Fund
(formerly Wells Fargo Traditional Small Cap Growth Fund)
Beginning on January 1, 2021, as permitted by new regulations adopted by the Securities and Exchange Commission, paper copies of the Wells Fargo Funds’ annual and semi-annual shareholder reports issued after this date will no longer be sent by mail, unless you specifically request paper copies of the reports. Instead, the reports will be made available on the Funds’ website, and you will be notified by mail each time a report is posted and provided with a website address to access the report.
If you already elected to receive shareholder reports electronically, you will not be affected by this change and you need not take any action. You may elect to receive shareholder reports and other communications from the Fund electronically at any time by contacting your financial intermediary (such as a broker-dealer or bank) or, if you are a direct investor, by calling1-800-222-8222 or by enrolling at wellsfargo.com/advantagedelivery.
You may elect to receive all future reports in paper free of charge. If you invest through a financial intermediary, you can contact your financial intermediary to request that you continue to receive paper copies of your shareholder reports; if you invest directly with the Fund, you can call 1-800-222-8222. Your election to receive reports in paper will apply to all Wells Fargo Funds held in your account with your financial intermediary or, if you are a direct investor, to all Wells Fargo Funds that you hold.
|
|
|
Reduce clutter. Save trees. |
Sign up for electronic delivery of prospectuses and shareholder reports atwellsfargo.com/advantagedelivery |
The views expressed and any forward-looking statements are as of September 30, 2019, unless otherwise noted, and are those of the Fund managers and/or Wells Fargo Asset Management. Discussions of individual securities, or the markets generally, or any Wells Fargo Fund are not intended as individual recommendations. Future events or results may vary significantly from those expressed in any forward-looking statements. The views expressed are subject to change at any time in response to changing circumstances in the market. Wells Fargo Asset Management and the Fund disclaim any obligation to publicly update or revise any views expressed or forward-looking statements.
INVESTMENT PRODUCTS: NOT FDIC INSURED ◾ NO BANK GUARANTEE ◾ MAY LOSE VALUE
Wells Fargo Fundamental Small Cap Growth Fund | 1
Letter to shareholders (unaudited)

Andrew Owen
President
Wells Fargo Funds
“During the third quarter of 2019, investors regrouped.”
Dear Shareholder:
We are pleased to offer you this semi-annual report for the Wells Fargo Fundamental Small Cap Growth Fund for the six-month period that ended September 30, 2019. Effective July 22, 2019, the Fund changed its name from Wells Fargo Traditional Small Cap Growth Fund to Wells Fargo Fundamental Small Cap Growth Fund. U.S. stock and global bond investors generally saw markets recover during the second half amid by intensifying market volatility, global economic growth concerns, international trade stare downs, and simmering geopolitical tensions.
Overall, fixed income kept pace with domestic stocks and outperformed foreign equities. For the period, U.S. stocks, based on the S&P 500 Index,1 gained 6.08% and international stocks, as measured by the MSCI ACWI ex USA Index (Net),2 added 1.13%. The MSCI EM Index (Net)3 fell by 3.66%. Among fixed income investors, the Bloomberg Barclays U.S. Aggregate Bond Index4 added 5.42%, the Bloomberg Barclays Global Aggregate ex-USD Index5 gained 2.82%, the Bloomberg Barclays Municipal Bond Index6 increased 3.74%, and the ICE BofAML U.S. High Yield Index7 was up 3.82%.
Early second-quarter 2019 investor enthusiasm faded as the quarter wore on.
During April 2019, favorable sentiment found additional support in reports of sustained low inflation, solid employment data, and first-quarter U.S. gross domestic product growth at an annualized rate of 3.2%. During May, markets tumbled on mixed investment signals. In the U.S., partisan wrangling ramped up as Democrats and Republicans set their sights on 2020 presidential politics. The U.K.’s Brexit disagreements caused Prime Minister Theresa May to resign. Boris Johnson succeeded her only to exacerbate uncertainty about Brexit’s resolution ahead of an October 2019 deadline. The European Commission downgraded the 2019 growth forecast to 1.2%. The U.S. increased tariffs on products from China, China responded, and then talks broke down. President Donald Trump threatened to turn his foreign policy tariff tool to Mexico over immigration issues.
During the third quarter of 2019, investors regrouped. Just as the investment horizon appeared to darken, sentiment turned and U.S. equity markets gained during June and July. The gains, primarily driven by geopolitical and monetary policy events, pushed equity markets to new highs. European Central Bank President Mario Draghi said that if the outlook doesn’t improve, the bank would cut rates or buy more assets to prop up inflation. President Trump backed off of tariff threats against Mexico and China. In the U.S., the Federal Reserve (Fed) implemented a 0.25% federal funds rate cut in July.
| 1 | The S&P 500 Index consists of 500 stocks chosen for market size, liquidity, and industry group representation. It is a market-value-weighted index with each stock’s weight in the index proportionate to its market value. You cannot invest directly in an index. |
| 2 | The Morgan Stanley Capital International (MSCI) All Country World Index (ACWI) ex USA Index (Net) is a free-float-adjusted market-capitalization weighted index that is designed to measure the equity market performance of developed and emerging markets, excluding the U.S. Source: MSCI. MSCI makes no express or implied warranties or representations and shall have no liability whatsoever with respect to any MSCI data contained herein. The MSCI data may not be further redistributed or used as a basis for other indices or any securities or financial products. This report is not approved, reviewed, or produced by MSCI. You cannot invest directly in an index. |
| 3 | The MSCI Emerging Markets (EM) Index (Net) is a free-float-adjusted market-capitalization-weighted index that is designed to measure the equity market performance of emerging markets. You cannot invest directly in an index. |
| 4 | The Bloomberg Barclays U.S. Aggregate Bond Index is a broad-based benchmark that measures the investment-grade, U.S. dollar-denominated, fixed-rate taxable bond market, including Treasuries, government-related and corporate securities, mortgage-backed securities (agency fixed-rate and hybrid adjustable-rate mortgage pass-throughs), asset-backed securities, and commercial mortgage-backed securities. You cannot invest directly in an index. |
| 5 | The Bloomberg Barclays Global Aggregate ex-USD Index is an unmanaged index that provides a broad-based measure of the global investment-grade fixed-income markets excluding the U.S. dollar-denominated debt market. You cannot invest directly in an index. |
| 6 | The Bloomberg Barclays Municipal Bond Index is an unmanaged index composed of long-term tax-exempt bonds with a minimum credit rating of Baa. You cannot invest directly in an index. |
| 7 | The ICE BofAML U.S. High Yield Index is a market-capitalization-weighted index of domestic and Yankee high-yield bonds. The index tracks the performance of high-yield securities traded in the U.S. bond market. You cannot invest directly in an index. Copyright 2019. ICE Data Indices, LLC. All rights reserved. |
2 | Wells Fargo Fundamental Small Cap Growth Fund
Letter to shareholders (unaudited)
Later in July 2019, the U.S. reversed course and threatened to impose higher tariffs on China’s exports after talks failed. China responded with tariff threats of its own and devalued the renminbi, a move that roiled global markets. Major U.S. stock market indices closed July with the worst weekly results of the year. Bond prices gained as Treasury yields fell to levels not seen since November 2016 and the yield curve inverted at multiple points along the 30-year arc.
In a microcosm, August encapsulated many of the unnerving events that plagued investors during the prior 11 months. The U.S.-China trade relationship swung from antagonistic to hopeful and back again with no evident compromise on the horizon. Evidence of a continued global economic slowdown mounted. Central banks in China, New Zealand, and Thailand cut interest rates. Industrial and manufacturing data declined in China, Canada, Japan, and Germany. Adding to the uncertain environment, Italy’s prime minister resigned, many feared a crackdown in Hong Kong as protesters sustained their calls for reform throughout the month, and Boris Johnson planned to suspend Parliament as Brexit’s deadline neared.
In the U.S., September saw the Fed join other central banks in cutting interest rates. Manufacturing data in the U.S., as reported by the Institute for Supply Management, disappointed investors. The U.S. Congress announced it would pursue an impeachment investigation of President Trump. Meanwhile, the Brexit impasse showed no signs of resolution. Officials in China said that hitting the country’s economic growth goals for the year would be difficult considering the weight of tariffs and trade restrictions. So while the S&P 500 Index finished the third quarter with year-to-date returns that were the best in more than 20 years, amid signs of equity investors taking money out of the stock market, concerns about future returns remained.
Don’t let short-term uncertainty derail long-term investment goals.
Periods of investment uncertainty can present challenges, but experience has taught us that maintaining long-term investment goals can be an effective way to plan for the future. To help you create a sound strategy based on your personal goals and risk tolerance, Wells Fargo Funds offers more than 100 mutual funds spanning a wide range of asset classes and investment styles. Although diversification cannot guarantee an investment profit or prevent losses, we believe it can be an effective way to manage investment risk and potentially smooth out overall portfolio performance. We encourage investors to know their investments and to understand that appropriate levels of risk-taking may unlock opportunities.
Thank you for choosing to invest with Wells Fargo Funds. We appreciate your confidence in us and remain committed to helping you meet your financial needs.
Sincerely,

Andrew Owen
President
Wells Fargo Funds
“In the U.S., September saw the Fed join other central banks in cutting interest rates.”
|
|
|
For further information about your Fund, contact your investment professional, visit our website at wfam.com, or call us directly at1-800-222-8222. |
Wells Fargo Fundamental Small Cap Growth Fund | 3
Performance highlights (unaudited)
Investment objective
The Fund seeks long-term capital appreciation.
Manager
Wells Fargo Funds Management, LLC
Subadviser
Wells Capital Management Incorporated
Portfolio managers
Michael T. Smith, CFA®‡
Christopher J. Warner, CFA®‡
Average annual total returns (%) as of September 30, 20191
| | | | | | | | | | | | | | | | | | | | | | | | | | | | | | | | | | |
| | | | |
| | | | | Including sales charge | | | Excluding sales charge | | | Expense ratios2 (%) | |
| | | | | | | | | |
| | | Inception date | | 1 year | | | 5 year | | | 10 year | | | 1 year | | | 5 year | | | 10 year | | | Gross | | | Net3 | |
| | | | | | | | | | |
| Class A (EGWAX) | | 6-5-1995 | | | -6.32 | | | | 8.96 | | | | 11.20 | | | | -0.59 | | | | 10.26 | | | | 11.87 | | | | 1.52 | | | | 1.24 | |
| | | | | | | | | | |
| Class C (EGWCX)4 | | 7-30-2010 | | | -2.31 | | | | 9.45 | | | | 11.04 | | | | -1.31 | | | | 9.45 | | | | 11.04 | | | | 2.27 | | | | 1.99 | |
| | | | | | | | | | |
| Administrator Class (EGWDX)5 | | 7-30-2010 | | | – | | | | – | | | | – | | | | -0.59 | | | | 10.42 | | | | 12.02 | | | | 1.44 | | | | 1.16 | |
| | | | | | | | | | |
| Institutional Class (EGRYX) | | 11-19-1997 | | | – | | | | – | | | | – | | | | -0.26 | | | | 10.64 | | | | 12.25 | | | | 1.19 | | | | 0.91 | |
| | | | | | | | | | |
| Russell 2000® Growth Index6 | | – | | | – | | | | – | | | | – | | | | -9.63 | | | | 9.08 | | | | 12.25 | | | | – | | | | – | |
Figures quoted represent past performance, which is no guarantee of future results, and do not reflect taxes that a shareholder may pay on fund distributions or the redemption of fund shares. Investment return and principal value of an investment will fluctuate so that an investor’s shares, when redeemed, may be worth more or less than their original cost. Performance shown without sales charges would be lower if sales charges were reflected. Current performance may be lower or higher than the performance data quoted, which assumes the reinvestment of dividends and capital gains. Current month-end performance is available on the Fund’s website,wfam.com.
Index returns do not include transaction costs associated with buying and selling securities, any mutual fund fees or expenses, or any taxes. It is not possible to invest directly in an index.
For Class A shares, the maximum front-end sales charge is 5.75%. For Class C shares, the maximum contingent deferred sales charge is 1.00%. Performance including a contingent deferred sales charge assumes the sales charge for the corresponding time period. Administrator Class and Institutional Class shares are sold without a front-end sales charge or contingent deferred sales charge.
Stock values fluctuate in response to the activities of individual companies and general market and economic conditions. Smaller-company stocks tend to be more volatile and less liquid than those of larger companies. Consult the Fund’s prospectus for additional information on these and other risks.
Please see footnotes on page 5.
4 | Wells Fargo Fundamental Small Cap Growth Fund
Performance highlights (unaudited)
| | | | |
|
| Ten largest holdings (%) as of September 30, 20197 | |
| | |
WNS Holdings Limited ADR | | | 2.64 | |
| | |
Casella Waste Systems Incorporated Class A | | | 2.63 | |
| | |
Tetra Tech Incorporated | | | 2.27 | |
| | |
Haemonetics Corporation | | | 2.17 | |
| | |
MSA Safety Incorporated | | | 2.08 | |
| | |
The Brink’s Company | | | 2.06 | |
| | |
Novanta Incorporated | | | 1.84 | |
| | |
Envestnet Incorporated | | | 1.83 | |
| | |
Saia Incorporated | | | 1.82 | |
| | |
InterXion Holding NV | | | 1.81 | |
|
|
| Sector distribution as of September 30, 20198 |
|
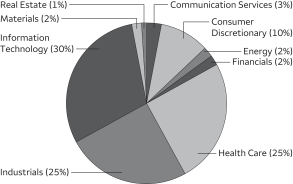 |
| ‡ | CFA® and Chartered Financial Analyst® are trademarks owned by CFA Institute. |
| 1 | Historical performance prior to July 19, 2010, is based on the performance of the Fund’s predecessor, Evergreen Growth Fund. |
| 2 | Reflects the expense ratios as stated in the most recent prospectuses, which include the impact of 0.01% in acquired fund fees and expenses. The expense ratios shown are subject to change and may differ from the annualized expense ratios shown in the financial highlights of this report, which do not include acquired fund fees and expenses. |
| 3 | The manager has contractually committed through July 31, 2020, to waive fees and/or reimburse expenses to the extent necessary to cap the expenses of each class after fee waivers at 1.23% for Class A, 1.98% for Class C, 1.15% for Administrator Class, and 0.90% for Institutional Class. Brokerage commissions, stamp duty fees, interest, taxes, acquired fund fees and expenses (if any), and extraordinary expenses are excluded from the expense cap. Prior to or after the commitment expiration date, the cap may be increased or the commitment to maintain the cap may be terminated only with the approval of the Board of Trustees. Without this cap, the Fund’s returns would have been lower. The expense ratio paid by an investor is the net expense ratio (the total annual fund operating expenses after fee waivers) as stated in the prospectuses. |
| 4 | Historical performance shown for Class C shares prior to their inception reflects the performance of Class A shares and has been adjusted to reflect the higher expenses applicable to Class C shares. |
| 5 | Historical performance shown for Administrator Class shares prior to their inception reflects the performance of Institutional Class shares and has been adjusted to reflect the higher expenses applicable to Administrator Class shares. |
| 6 | The Russell 2000® Growth Index measures the performance of those Russell 2000 companies with higher price/book ratios and higher forecasted growth values. You cannot invest directly in an index. |
| 7 | The ten largest holdings, excluding cash, cash equivalents and any money market funds, are calculated based on the value of the investments divided by total net assets of the Fund. Holdings are subject to change and may have changed since the date specified. |
| 8 | Amounts are calculated based on the total long-term investments of the Fund. These amounts are subject to change and may have changed since the date specified. |
Wells Fargo Fundamental Small Cap Growth Fund | 5
Fund expenses (unaudited)
As a shareholder of the Fund, you incur two types of costs: (1) transaction costs, including sales charges (loads) on purchase payments and contingent deferred sales charges (if any) on redemptions and (2) ongoing costs, including management fees, distribution (12b-1) and/or shareholder servicing fees, and other Fund expenses. This example is intended to help you understand your ongoing costs (in dollars) of investing in the Fund and to compare these costs with the ongoing costs of investing in other mutual funds.
The example is based on an investment of $1,000 invested at the beginning of the six-month period and held for the entire period from April 1, 2019 to September 30, 2019.
Actual expenses
The “Actual” line of the table below provides information about actual account values and actual expenses. You may use the information in this line, together with the amount you invested, to estimate the expenses that you paid over the period. Simply divide your account value by $1,000 (for example, an $8,600 account value divided by $1,000 = 8.6), then multiply the result by the number in the “Actual” line under the heading entitled “Expenses paid during period” for your applicable class of shares to estimate the expenses you paid on your account during this period.
Hypothetical example for comparison purposes
The “Hypothetical” line of the table below provides information about hypothetical account values and hypothetical expenses based on the Fund’s actual expense ratio and an assumed rate of return of 5% per year before expenses, which is not the Fund’s actual return. The hypothetical account values and expenses may not be used to estimate the actual ending account balance or expenses you paid for the period. You may use this information to compare the ongoing costs of investing in the Fund and other funds. To do so, compare this 5% hypothetical example with the 5% hypothetical examples that appear in the shareholder reports of the other funds.
Please note that the expenses shown in the table are meant to highlight your ongoing costs only and do not reflect any transactional costs, such as sales charges (loads) and contingent deferred sales charges. Therefore, the “Hypothetical” line of the table is useful in comparing ongoing costs only and will not help you determine the relative total costs of owning different funds. In addition, if these transactional costs were included, your costs would have been higher.
| | | | | | | | | | | | | | | | |
| | | Beginning
account value
4-1-2019 | | | Ending
account value
9-30-2019 | | | Expenses
paid during
the period¹ | | | Annualized net
expense ratio | |
| | | | | |
Class A | | | | | | | | | | | | | | | | |
| | | | |
Actual | | $ | 1,000.00 | | | $ | 1,012.05 | | | $ | 6.20 | | | | 1.23 | % |
| | | | |
Hypothetical (5% return before expenses) | | $ | 1,000.00 | | | $ | 1,018.90 | | | $ | 6.23 | | | | 1.23 | % |
| | | | | |
Class C | | | | | | | | | | | | | | | | |
| | | | |
Actual | | $ | 1,000.00 | | | $ | 1,007.79 | | | $ | 9.97 | | | | 1.98 | % |
| | | | |
Hypothetical (5% return before expenses) | | $ | 1,000.00 | | | $ | 1,015.14 | | | $ | 10.00 | | | | 1.98 | % |
| | | | | |
Administrator Class | | | | | | | | | | | | | | | | |
| | | | |
Actual | | $ | 1,000.00 | | | $ | 1,011.66 | | | $ | 5.80 | | | | 1.15 | % |
| | | | |
Hypothetical (5% return before expenses) | | $ | 1,000.00 | | | $ | 1,019.30 | | | $ | 5.82 | | | | 1.15 | % |
| | | | | |
Institutional Class | | | | | | | | | | | | | | | | |
| | | | |
Actual | | $ | 1,000.00 | | | $ | 1,013.80 | | | $ | 4.54 | | | | 0.90 | % |
| | | | |
Hypothetical (5% return before expenses) | | $ | 1,000.00 | | | $ | 1,020.56 | | | $ | 4.56 | | | | 0.90 | % |
| 1 | Expenses paid is equal to the annualized net expense ratio of each class multiplied by the average account value over the period, multiplied by the number of days in the most recent fiscal half-year divided by the number of days in the fiscal year (to reflect the one-half-year period). |
6 | Wells Fargo Fundamental Small Cap Growth Fund
Portfolio of investments—September 30, 2019 (unaudited)
| | | | | | | | | | | | | | | | |
| | | | | | | | | Shares | | | Value | |
| Common Stocks: 95.77% | |
|
Communication Services: 2.68% | |
|
| Entertainment: 2.68% | |
CD Projekt SA | | | | | | | | | | | 16,762 | | | $ | 1,039,183 | |
World Wrestling Entertainment Incorporated Class A « | | | | | | | | | | | 20,110 | | | | 1,430,827 | |
| | | | |
| | | | | | | | | | | | | | | 2,470,010 | |
| | | | | | | | | | | | | | | | |
|
Consumer Discretionary: 10.11% | |
|
| Auto Components: 1.66% | |
Stoneridge Incorporated † | | | | | | | | | | | 49,185 | | | | 1,523,259 | |
| | | | | | | | | | | | | | | | |
|
| Diversified Consumer Services: 4.47% | |
Bright Horizons Family Solutions Incorporated † | | | | | | | | | | | 8,654 | | | | 1,319,735 | |
Chegg Incorporated † | | | | | | | | | | | 42,904 | | | | 1,284,975 | |
OneSpaWorld Holdings Limited Ǡ | | | | | | | | | | | 96,976 | | | | 1,506,037 | |
| | | | |
| | | | | | | | | | | | | | | 4,110,747 | |
| | | | | | | | | | | | | | | | |
|
| Internet & Direct Marketing Retail: 1.37% | |
Etsy Incorporated † | | | | | | | | | | | 22,324 | | | | 1,261,306 | |
| | | | | | | | | | | | | | | | |
|
| Leisure Products: 1.33% | |
Games Workshop Group plc | | | | | | | | | | | 21,072 | | | | 1,222,908 | |
| | | | | | | | | | | | | | | | |
|
| Specialty Retail: 1.28% | |
Five Below Incorporated † | | | | | | | | | | | 9,374 | | | | 1,182,061 | |
| | | | | | | | | | | | | | | | |
|
Energy: 1.71% | |
|
| Oil, Gas & Consumable Fuels: 1.71% | |
Texas Pacific Land Trust « | | | | | | | | | | | 766 | | | | 497,571 | |
Viper Energy Partners LP | | | | | | | | | | | 39,054 | | | | 1,080,624 | |
| | | | |
| | | | | | | | | | | | | | | 1,578,195 | |
| | | | | | | | | | | | | | | | |
|
Financials: 1.68% | |
|
| Consumer Finance: 1.68% | |
Green Dot Corporation Class A † | | | | | | | | | | | 24,680 | | | | 623,170 | |
SLM Corporation | | | | | | | | | | | 105,095 | | | | 927,463 | |
| | | | |
| | | | | | | | | | | | | | | 1,550,633 | |
| | | | | | | | | | | | | | | | |
|
Health Care: 24.02% | |
|
| Biotechnology: 9.18% | |
CareDx Incorporated † | | | | | | | | | | | 29,062 | | | | 657,092 | |
Coherus Biosciences Incorporated † | | | | | | | | | | | 37,512 | | | | 759,993 | |
CRISPR Therapeutics AG Ǡ | | | | | | | | | | | 9,429 | | | | 386,495 | |
Deciphera Pharmaceuticals Incorporated † | | | | | | | | | | | 16,636 | | | | 564,626 | |
Immunomedics Incorporated † | | | | | | | | | | | 40,996 | | | | 543,607 | |
Invitae Corporation Ǡ | | | | | | | | | | | 35,371 | | | | 681,599 | |
KalVista Pharmaceuticals Incorporated † | | | | | | | | | | | 24,940 | | | | 289,304 | |
Mirati Therapeutics Incorporated † | | | | | | | | | | | 6,963 | | | | 542,487 | |
Precision BioSciences Incorporated Ǡ | | | | | | | | | | | 9,706 | | | | 81,433 | |
Stemline Therapeutics Incorporated † | | | | | | | | | | | 41,937 | | | | 436,564 | |
Turning Point Therapeutics Incorporated † | | | | | | | | | | | 12,899 | | | | 485,002 | |
Twist Bioscience Corporation † | | | | | | | | | | | 20,091 | | | | 479,773 | |
Veracyte Incorporated † | | | | | | | | | | | 46,932 | | | | 1,126,368 | |
Wells Fargo Fundamental Small Cap Growth Fund | 7
Portfolio of investments—September 30, 2019 (unaudited)
| | | | | | | | | | | | | | | | |
| | | | | | | | | Shares | | | Value | |
|
| Biotechnology (continued) | |
Vericel Corporation † | | | | | | | | | | | 58,762 | | | $ | 889,657 | |
Zai Lab Limited ADR † | | | | | | | | | | | 16,022 | | | | 518,312 | |
| | | | |
| | | | | | | | | | | | | | | 8,442,312 | |
| | | | | | | | | | | | | | | | |
|
| Health Care Equipment & Supplies: 9.69% | |
Axonics Modulation Technologies Incorporated Ǡ | | | | | | | | | | | 25,231 | | | | 679,219 | |
BioLife Solutions Incorporated Ǡ | | | | | | | | | | | 35,846 | | | | 595,940 | |
Haemonetics Corporation † | | | | | | | | | | | 15,805 | | | | 1,993,643 | |
ICU Medical Incorporated † | | | | | | | | | | | 4,953 | | | | 790,499 | |
Insulet Corporation † | | | | | | | | | | | 6,824 | | | | 1,125,482 | |
iRhythm Technologies Incorporated Ǡ | | | | | | | | | | | 15,770 | | | | 1,168,715 | |
Orthopediatrics Corporation Ǡ | | | | | | | | | | | 32,820 | | | | 1,157,233 | |
Shockwave Medical Incorporated Ǡ | | | | | | | | | | | 18,958 | | | | 567,413 | |
Silk Road Medical Incorporated Ǡ | | | | | | | | | | | 25,850 | | | | 840,901 | |
| | | | |
| | | | | | | | | | | | | | | 8,919,045 | |
| | | | | | | | | | | | | | | | |
|
| Health Care Providers & Services: 2.27% | |
HealthEquity Incorporated † | | | | | | | | | | | 23,979 | | | | 1,370,280 | |
The Joint Corporation Ǡ | | | | | | | | | | | 38,813 | | | | 722,310 | |
| | | | |
| | | | | | | | | | | | | | | 2,092,590 | |
| | | | | | | | | | | | | | | | |
|
| Health Care Technology: 1.31% | |
Inspire Medical Systems Incorporated † | | | | | | | | | | | 13,092 | | | | 798,874 | |
Phreesia Incorporated Ǡ | | | | | | | | | | | 16,601 | | | | 402,408 | |
| | | | |
| | | | | | | | | | | | | | | 1,201,282 | |
| | | | | | | | | | | | | | | | |
|
| Life Sciences Tools & Services: 1.57% | |
Adaptive Biotechnologies Corporation Ǡ | | | | | | | | | | | 11,393 | | | | 352,044 | |
Fluidigm Corporation † | | | | | | | | | | | 128,783 | | | | 596,265 | |
Quanterix Corporation † | | | | | | | | | | | 22,649 | | | | 497,372 | |
| | | | |
| | | | | | | | | | | | | | | 1,445,681 | |
| | | | | | | | | | | | | | | | |
|
Industrials: 24.20% | |
|
| Aerospace & Defense: 4.84% | |
Axon Enterprise Incorporated † | | | | | | | | | | | 26,636 | | | | 1,512,392 | |
Ducommun Incorporated † | | | | | | | | | | | 17,655 | | | | 748,572 | |
Kratos Defense & Security Solutions Incorporated † | | | | | | | | | | | 33,994 | | | | 632,118 | |
Mercury Computer Systems Incorporated † | | | | | | | | | | | 19,176 | | | | 1,556,516 | |
| | | | |
| | | | | | | | | | | | | | | 4,449,598 | |
| | | | | | | | | | | | | | | | |
|
| Building Products: 1.32% | |
Trex Company Incorporated † | | | | | | | | | | | 13,323 | | | | 1,211,460 | |
| | | | | | | | | | | | | | | | |
|
| Commercial Services & Supplies: 10.78% | |
Casella Waste Systems Incorporated Class A † | | | | | | | | | | | 56,277 | | | | 2,416,534 | |
IAA Incorporated † | | | | | | | | | | | 38,598 | | | | 1,610,695 | |
MSA Safety Incorporated | | | | | | | | | | | 17,528 | | | | 1,912,480 | |
Tetra Tech Incorporated | | | | | | | | | | | 24,055 | | | | 2,087,012 | |
The Brink’s Company | | | | | | | | | | | 22,823 | | | | 1,893,168 | |
| | | | |
| | | | | | | | | | | | | | | 9,919,889 | |
| | | | | | | | | | | | | | | | |
|
| Construction & Engineering: 2.87% | |
Construction Partners Incorporated Class A † | | | | | | | | | | | 76,947 | | | | 1,198,834 | |
WillScot Corporation † | | | | | | | | | | | 92,449 | | | | 1,440,355 | |
| | | | |
| | | | | | | | | | | | | | | 2,639,189 | |
| | | | | | | | | | | | | | | | |
8 | Wells Fargo Fundamental Small Cap Growth Fund
Portfolio of investments—September 30, 2019 (unaudited)
| | | | | | | | | | | | | | | | |
| | | | | | | | | Shares | | | Value | |
| Road & Rail: 1.82% | |
Saia Incorporated † | | | | | | | | | | | 17,901 | | | $ | 1,677,324 | |
| | | | | | | | | | | | | | | | |
|
| Trading Companies & Distributors: 2.57% | |
SiteOne Landscape Supply Incorporated † | | | | | | | | | | | 17,305 | | | | 1,280,916 | |
Univar Incorporated † | | | | | | | | | | | 52,311 | | | | 1,085,976 | |
| | | | |
| | | | | | | | | | | | | | | 2,366,892 | |
| | | | | | | | | | | | | | | | |
|
Information Technology: 28.50% | |
|
| Electronic Equipment, Instruments & Components: 5.77% | |
Littelfuse Incorporated | | | | | | | | | | | 5,956 | | | | 1,056,058 | |
Novanta Incorporated † | | | | | | | | | | | 20,663 | | | | 1,688,580 | |
Par Technology Corporation Ǡ | | | | | | | | | | | 53,920 | | | | 1,281,678 | |
Rogers Corporation † | | | | | | | | | | | 9,352 | | | | 1,278,512 | |
| | | | |
| | | | | | | | | | | | | | | 5,304,828 | |
| | | | | | | | | | | | | | | | |
|
| IT Services: 10.45% | |
EPAM Systems Incorporated † | | | | | | | | | | | 6,611 | | | | 1,205,318 | |
Euronet Worldwide Incorporated † | | | | | | | | | | | 9,826 | | | | 1,437,546 | |
InterXion Holding NV † | | | | | | | | | | | 20,466 | | | | 1,667,160 | |
Keywords Studios plc | | | | | | | | | | | 56,615 | | | | 798,438 | |
Okta Incorporated † | | | | | | | | | | | 5,683 | | | | 559,548 | |
WEX Incorporated † | | | | | | | | | | | 7,517 | | | | 1,518,960 | |
WNS Holdings Limited ADR † | | | | | | | | | | | 41,342 | | | | 2,428,843 | |
| | | | |
| | | | | | | | | | | | | | | 9,615,813 | |
| | | | | | | | | | | | | | | | |
|
| Semiconductors & Semiconductor Equipment: 1.36% | |
Lattice Semiconductor Corporation † | | | | | | | | | | | 68,290 | | | | 1,248,683 | |
| | | | | | | | | | | | | | | | |
|
| Software: 9.29% | |
Avalara Incorporated † | | | | | | | | | | | 15,665 | | | | 1,054,098 | |
Blue Prism Group plc † | | | | | | | | | | | 41,506 | | | | 484,820 | |
Envestnet Incorporated † | | | | | | | | | | | 29,723 | | | | 1,685,294 | |
Globant SA † | | | | | | | | | | | 16,428 | | | | 1,504,476 | |
LivePerson Incorporated † | | | | | | | | | | | 41,883 | | | | 1,495,223 | |
Model N Incorporated † | | | | | | | | | | | 53,591 | | | | 1,487,686 | |
Pagerduty Incorporated Ǡ | | | | | | | | | | | 14,004 | | | | 395,613 | |
Telaria Incorporated † | | | | | | | | | | | 63,689 | | | | 440,091 | |
| | | | |
| | | | | | | | | | | | | | | 8,547,301 | |
| | | | | | | | | | | | | | | | |
|
| Technology Hardware, Storage & Peripherals: 1.63% | |
NCR Corporation † | | | | | | | | | | | 47,670 | | | | 1,504,465 | |
| | | | | | | | | | | | | | | | |
|
Materials: 1.95% | |
|
| Chemicals: 1.43% | |
Ingevity Corporation † | | | | | | | | | | | 15,510 | | | | 1,315,868 | |
| | | | | | | | | | | | | | | | |
|
| Metals & Mining: 0.52% | |
Sandstorm Gold Limited Ǡ | | | | | | | | | | | 84,947 | | | | 479,101 | |
| | | | | | | | | | | | | | | | |
|
Real Estate: 0.92% | |
|
| Equity REITs: 0.92% | |
Innovative Industrial Properties Incorporated « | | | | | | | | 9,133 | | | | 843,615 | |
| | | | | | | | | | | | | |
| |
Total Common Stocks (Cost $76,013,291) | | | | 88,124,055 | |
| | | | | |
Wells Fargo Fundamental Small Cap Growth Fund | 9
Portfolio of investments—September 30, 2019 (unaudited)
| | | | | | | | | | | | | | | | |
| | | Yield | | | | | | Shares | | | Value | |
| Short-Term Investments: 17.11% | |
|
| Investment Companies: 17.11% | |
Securities Lending Cash Investments LLC (l)(r)(u) | | | 2.11 | % | | | | | | | 11,996,887 | | | $ | 11,998,087 | |
Wells Fargo Government Money Market Fund Select Class (l)(u) | | | 1.88 | | | | | | | | 3,748,042 | | | | 3,748,042 | |
| |
Total Short-Term Investments (Cost $15,746,129) | | | | 15,746,129 | |
| | | | | |
| | | | | | | | |
| Total investments in securities (Cost $91,759,420) | | | 112.88 | % | | | 103,870,184 | |
| | |
Other assets and liabilities, net | | | (12.88 | ) | | | (11,855,030 | ) |
| | | | | | | | |
| Total net assets | | | 100.00 | % | | $ | 92,015,154 | |
| | | | | | | | |
| « | All or a portion of this security is on loan. |
| † | Non-income-earning security |
| (l) | The issuer of the security is an affiliated person of the Fund as defined in the Investment Company Act of 1940. |
| (r) | The investment is anon-registered investment company purchased with cash collateral received from securities on loan. |
| (u) | The rate represents the7-day annualized yield at period end. |
Abbreviations:
| ADR | American depositary receipt |
| REIT | Real estate investment trust |
Investments in Affiliates
An affiliated investment is an investment in which the Fund owns at least 5% of the outstanding voting shares of the issuer or as a result of other relationships, such as the Fund and the issuer having the same investment manager. Transactions with issuers that were either affiliated persons of the Fund at the beginning of the period or the end of the period were as follows:
| | | | | | | | | | | | | | | | | | | | | | | | | | | | | | | | | | | | |
| | | Shares,
beginning of
period | | | Shares
purchased | | | Shares
sold | | | Shares,
end of
period | | | Net
realized
gains
(losses) | | | Net
change in
unrealized
gains
(losses) | | | Income
from
affiliated
securities | | | Value,
end of
period | | | % of
net
assets | |
| | | | | | | | | |
| Short-Term Investments | | | | | | | | | | | | | | | | | | | | | | | | | | | |
Investment Companies | | | | | | | | | | | | | | | | | | | | | | | | | | | | | | | | | | | | |
Securities Lending Cash Investments LLC | | | 6,840,260 | | | | 36,064,824 | | | | 30,908,197 | | | | 11,996,887 | | | $ | 75 | | | $ | 0 | | | $ | 98,804 | # | | $ | 11,998,087 | | | | | |
Wells Fargo Government Money Market Fund Select Class | | | 2,404,400 | | | | 21,801,718 | | | | 20,458,076 | | | | 3,748,042 | | | | 0 | | | | 0 | | | | 33,232 | | | | 3,748,042 | | | | | |
| | | | | | | | | | | | | | | | | | | | | | | | | | | | | | | | | | | | |
| | | | | | | | | | | | | | | | | | $ | 75 | | | $ | 0 | | | $ | 132,036 | | | $ | 15,746,129 | | | | 17.11 | % |
| | | | | | | | | | | | | | | | | | | | | | | | | | | | | | | | | | | | |
| # | Amount shown represents income before fees and rebates. |
The accompanying notes are an integral part of these financial statements.
10 | Wells Fargo Fundamental Small Cap Growth Fund
Statement of assets and liabilities—September 30, 2019 (unaudited)
| | | | |
| | | | |
| |
Assets | | | | |
Investments in unaffiliated securities (including $11,713,588 of securities loaned), at value (cost $76,013,291) | | $ | 88,124,055 | |
Investments in affiliated securities, at value (cost $15,746,129) | | | 15,746,129 | |
Foreign currency, at value (cost $321) | | | 314 | |
Receivable for investments sold | | | 271,268 | |
Receivable for Fund shares sold | | | 2,826 | |
Receivable for dividends | | | 23,728 | |
Receivable for securities lending income, net | | | 12,251 | |
Prepaid expenses and other assets | | | 51,542 | |
| | | | |
Total assets | | | 104,232,113 | |
| | | | |
| |
Liabilities | | | | |
Payable upon receipt of securities loaned | | | 11,996,335 | |
Payable for investments purchased | | | 97,225 | |
Payable for Fund shares redeemed | | | 10,566 | |
Management fee payable | | | 43,575 | |
Administration fees payable | | | 15,740 | |
Trustees’ fees and expenses payable | | | 2,605 | |
Distribution fee payable | | | 222 | |
Accrued expenses and other liabilities | | | 50,691 | |
| | | | |
Total liabilities | | | 12,216,959 | |
| | | | |
Total net assets | | $ | 92,015,154 | |
| | | | |
| |
Net assets consist of | | | | |
Paid-in capital | | $ | 73,217,478 | |
Total distributable earnings | | | 18,797,676 | |
| | | | |
Total net assets | | $ | 92,015,154 | |
| | | | |
| |
Computation of net asset value and offering price per share | | | | |
Net assets – Class A | | $ | 81,671,271 | |
Shares outstanding – Class A1 | | | 6,077,743 | |
Net asset value per share – Class A | | | $13.44 | |
Maximum offering price per share – Class A2 | | | $14.26 | |
Net assets – Class C | | $ | 351,911 | |
Shares outstanding – Class C1 | | | 30,216 | |
Net asset value per share – Class C | | | $11.65 | |
Net assets – Administrator Class | | $ | 123,656 | |
Shares outstanding – Administrator Class1 | | | 7,916 | |
Net asset value per share – Administrator Class | | | $15.62 | |
Net assets – Institutional Class | | $ | 9,868,316 | |
Shares outstanding – Institutional Class1 | | | 610,765 | |
Net asset value per share – Institutional Class | | | $16.16 | |
| 1 | The Fund has an unlimited number of authorized shares. |
| 2 | Maximum offering price is computed as 100/94.25 of net asset value. On investments of $50,000 or more, the offering price is reduced. |
The accompanying notes are an integral part of these financial statements.
Wells Fargo Fundamental Small Cap Growth Fund | 11
Statement of operations—six months ended September 30, 2019 (unaudited)
| | | | |
| | | | |
| |
Investment income | | | | |
Dividends (net of foreign withholding taxes of $984) | | $ | 124,992 | |
Securities lending income from affiliates, net | | | 84,679 | |
Income from affiliated securities | | | 33,232 | |
| | | | |
Total investment income | | | 242,903 | |
| | | | |
| |
Expenses | | | | |
Management fee | | | 416,199 | |
Administration fees | | | | |
Class A | | | 91,814 | |
Class C | | | 403 | |
Administrator Class | | | 82 | |
Institutional Class | | | 6,485 | |
Shareholder servicing fees | | | | |
Class A | | | 109,303 | |
Class C | | | 480 | |
Administrator Class | | | 158 | |
Distribution fee | | | | |
Class C | | | 1,402 | |
Custody and accounting fees | | | 7,108 | |
Professional fees | | | 23,205 | |
Registration fees | | | 33,447 | |
Shareholder report expenses | | | 20,723 | |
Trustees’ fees and expenses | | | 10,325 | |
Other fees and expenses | | | 5,563 | |
| | | | |
Total expenses | | | 726,697 | |
Less: Fee waivers and/or expense reimbursements | | | | |
Fund-level | | | (139,851 | ) |
| | | | |
Net expenses | | | 586,846 | |
| | | | |
Net investment loss | | | (343,943 | ) |
| | | | |
| |
Realized and unrealized gains (losses) on investments | | | | |
Net realized gains on | |
Unaffiliated securities | | | 5,153,904 | |
Affiliated securities | | | 75 | |
| | | | |
Net realized gains on investments | | | 5,153,979 | |
Net change in unrealized gains (losses) on investments | | | (3,464,848 | ) |
| | | | |
Net realized and unrealized gains (losses) on investments | | | 1,689,131 | |
| | | | |
Net increase in net assets resulting from operations | | $ | 1,345,188 | |
| | | | |
The accompanying notes are an integral part of these financial statements.
12 | Wells Fargo Fundamental Small Cap Growth Fund
Statement of changes in net assets
| | | | | | | | | | | | | | | | |
| | | Six months ended
September 30, 2019 (unaudited) | | | Year ended
March 31, 2019 | |
| |
Operations | | | | | |
Net investment loss | | | | | | $ | (343,943 | ) | | | | | | $ | (686,522 | ) |
Net realized gains on investments | | | | | | | 5,153,979 | | | | | | | | 22,170,499 | |
Net change in unrealized gains (losses) on investments | | | | | | | (3,464,848 | ) | | | | | | | (6,083,970 | ) |
| | | | |
Net increase in net assets resulting from operations | | | | | | | 1,345,188 | | | | | | | | 15,400,007 | |
| | | | |
| | | |
Distributions to shareholders from net investment income and net realized gains | | | | | | | | | | | | |
Class A | | | | | | | 0 | | | | | | | | (20,884,975 | ) |
Class C | | | | | | | 0 | | | | | | | | (93,417 | ) |
Administrator Class | | | | | | | 0 | | | | | | | | (53,408 | ) |
Institutional Class | | | | | | | 0 | | | | | | | | (2,160,122 | ) |
| | | | |
Total distributions to shareholders | | | | | | | 0 | | | | | | | | (23,191,922 | ) |
| | | | |
| | | | |
Capital share transactions | | | Shares | | | | | | | | Shares | | | | | |
Proceeds from shares sold | |
Class A | | | 89,633 | | | | 1,270,658 | | | | 264,201 | | | | 3,988,191 | |
Class C | | | 4,494 | | | | 55,741 | | | | 11,256 | | | | 157,108 | |
Administrator Class | | | 2,272 | | | | 35,000 | | | | 8,969 | | | | 158,898 | |
Institutional Class | | | 112,638 | | | | 1,926,704 | | | | 202,779 | | | | 3,570,799 | |
| | | | |
| | | | | | | 3,288,103 | | | | | | | | 7,874,996 | |
| | | | |
Reinvestment of distributions | |
Class A | | | 0 | | | | 0 | | | | 1,770,518 | | | | 20,467,178 | |
Class C | | | 0 | | | | 0 | | | | 8,060 | | | | 81,241 | |
Administrator Class | | | 0 | | | | 0 | | | | 3,408 | | | | 45,808 | |
Institutional Class | | | 0 | | | | 0 | | | | 129,330 | | | | 1,792,511 | |
| | | | |
| | | | | | | 0 | | | | | | | | 22,386,738 | |
| | | | |
Payment for shares redeemed | |
Class A | | | (487,503 | ) | | | (6,845,238 | ) | | | (1,090,350 | ) | | | (16,060,877 | ) |
Class C | | | (4,457 | ) | | | (54,659 | ) | | | (8,765 | ) | | | (106,912 | ) |
Administrator Class | | | (1,094 | ) | | | (17,706 | ) | | | (13,374 | ) | | | (189,489 | ) |
Institutional Class | | | (109,960 | ) | | | (1,853,551 | ) | | | (230,424 | ) | | | (3,981,806 | ) |
| | | | |
| | | | | | | (8,771,154 | ) | | | | | | | (20,339,084 | ) |
| | | | |
Net increase (decrease) in net assets resulting from capital share transactions | | | | | | | (5,483,051 | ) | | | | | | | 9,922,650 | |
| | | | |
Total increase (decrease) in net assets | | | | | | | (4,137,863 | ) | | | | | | | 2,130,735 | |
| | | | |
| | |
Net assets | | | | | | | | |
Beginning of period | | | | | | | 96,153,017 | | | | | | | | 94,022,282 | |
| | | | |
End of period | | | | | | $ | 92,015,154 | | | | | | | $ | 96,153,017 | |
| | | | |
The accompanying notes are an integral part of these financial statements.
Wells Fargo Fundamental Small Cap Growth Fund | 13
Financial highlights
(For a share outstanding throughout each period)
| | | | | | | | | | | | | | | | | | | | | | | | |
| | | Six months ended
September 30, 2019
(unaudited) | | | Year ended March 31 | |
| CLASS A | | 2019 | | | 2018 | | | 2017 | | | 2016 | | | 2015 | |
Net asset value, beginning of period | | | $13.28 | | | | $15.32 | | | | $14.08 | | | | $12.05 | | | | $18.04 | | | | $20.37 | |
Net investment loss | | | (0.05 | )1 | | | (0.11 | )1 | | | (0.12 | )1 | | | (0.10 | )1 | | | (0.12 | )1 | | | (0.18 | ) |
Net realized and unrealized gains (losses) on investments | | | 0.21 | | | | 2.17 | | | | 2.35 | | | | 2.51 | | | | (2.13 | ) | | | 1.33 | |
| | | | | | | | | | | | | | | | | | | | | | | | |
Total from investment operations | | | 0.16 | | | | 2.06 | | | | 2.23 | | | | 2.41 | | | | (2.25 | ) | | | 1.15 | |
Distributions to shareholders from | | | | | | | | | | | | | | | | | | | | | | | | |
Net realized gains | | | 0.00 | | | | (4.10 | ) | | | (0.99 | ) | | | (0.38 | ) | | | (3.74 | ) | | | (3.48 | ) |
Net asset value, end of period | | | $13.44 | | | | $13.28 | | | | $15.32 | | | | $14.08 | | | | $12.05 | | | | $18.04 | |
Total return2 | | | 1.20 | % | | | 17.46 | % | | | 16.08 | % | | | 20.10 | % | | | (12.86 | )% | | | 6.77 | % |
Ratios to average net assets (annualized) | | | | | | | | | | | | | | | | | | | | | | | | |
Gross expenses | | | 1.51 | % | | | 1.51 | % | | | 1.52 | % | | | 1.51 | % | | | 1.50 | % | | | 1.47 | % |
Net expenses | | | 1.23 | % | | | 1.23 | % | | | 1.33 | % | | | 1.33 | % | | | 1.33 | % | | | 1.33 | % |
Net investment loss | | | (0.73 | )% | | | (0.74 | )% | | | (0.79 | )% | | | (0.77 | )% | | | (0.74 | )% | | | (0.87 | )% |
Supplemental data | | | | | | | | | | | | | | | | | | | | | | | | |
Portfolio turnover rate | | | 29 | % | | | 155 | % | | | 44 | % | | | 113 | % | | | 123 | % | | | 73 | % |
Net assets, end of period (000s omitted) | | | $81,671 | | | | $86,006 | | | | $84,738 | | | | $82,734 | | | | $84,139 | | | | $123,712 | |
| 1 | Calculated based upon average shares outstanding |
| 2 | Total return calculations do not include any sales charges. Returns for periods of less than one year are not annualized. |
The accompanying notes are an integral part of these financial statements.
14 | Wells Fargo Fundamental Small Cap Growth Fund
Financial highlights
(For a share outstanding throughout each period)
| | | | | | | | | | | | | | | | | | | | | | | | |
| | | Six months ended
September 30, 2019
(unaudited) | | | Year ended March 31 | |
| CLASS C | | 2019 | | | 2018 | | | 2017 | | | 2016 | | | 2015 | |
Net asset value, beginning of period | | | $11.55 | | | | $13.94 | | | | $12.99 | | | | $11.22 | | | | $17.21 | | | | $19.73 | |
Net investment loss | | | (0.09 | ) | | | (0.20 | )1 | | | (0.21 | )1 | | | (0.18 | )1 | | | (0.18 | )1 | | | (0.29 | )1 |
Net realized and unrealized gains (losses) on investments | | | 0.19 | | | | 1.91 | | | | 2.15 | | | | 2.33 | | | | (2.07 | ) | | | 1.25 | |
| | | | | | | | | | | | | | | | | | | | | | | | |
Total from investment operations | | | 0.10 | | | | 1.71 | | | | 1.94 | | | | 2.15 | | | | (2.25 | ) | | | 0.96 | |
Distributions to shareholders from | | | | | | | | | | | | | | | | | | | | | | | | |
Net realized gains | | | 0.00 | | | | (4.10 | ) | | | (0.99 | ) | | | (0.38 | ) | | | (3.74 | ) | | | (3.48 | ) |
Net asset value, end of period | | | $11.65 | | | | $11.55 | | | | $13.94 | | | | $12.99 | | | | $11.22 | | | | $17.21 | |
Total return2 | | | 0.78 | % | | | 16.69 | % | | | 15.17 | % | | | 19.26 | % | | | (13.55 | )% | | | 5.98 | % |
Ratios to average net assets (annualized) | | | | | | | | | | | | | | | | | | | | | | | | |
Gross expenses | | | 2.25 | % | | | 2.26 | % | | | 2.27 | % | | | 2.26 | % | | | 2.25 | % | | | 2.22 | % |
Net expenses | | | 1.98 | % | | | 1.98 | % | | | 2.08 | % | | | 2.08 | % | | | 2.08 | % | | | 2.08 | % |
Net investment loss | | | (1.48 | )% | | | (1.48 | )% | | | (1.54 | )% | | | (1.52 | )% | | | (1.49 | )% | | | (1.61 | )% |
Supplemental data | | | | | | | | | | | | | | | | | | | | | | | | |
Portfolio turnover rate | | | 29 | % | | | 155 | % | | | 44 | % | | | 113 | % | | | 123 | % | | | 73 | % |
Net assets, end of period (000s omitted) | | | $352 | | | | $349 | | | | $274 | | | | $225 | | | | $162 | | | | $232 | |
| 1 | Calculated based upon average shares outstanding |
| 2 | Total return calculations do not include any sales charges. Returns for periods of less than one year are not annualized. |
The accompanying notes are an integral part of these financial statements.
Wells Fargo Fundamental Small Cap Growth Fund | 15
Financial highlights
(For a share outstanding throughout each period)
| | | | | | | | | | | | | | | | | | | | | | | | |
| | | Six months ended
September 30, 2019
(unaudited) | | | Year ended March 31 | |
| ADMINISTRATOR CLASS | | 2019 | | | 2018 | | | 2017 | | | 2016 | | | 2015 | |
Net asset value, beginning of period | | | $15.43 | | | | $17.14 | | | | $15.63 | | | | $13.29 | | | | $19.44 | | | | $21.65 | |
Net investment loss | | | (0.05 | )1 | | | (0.11 | )1 | | | (0.11 | )1 | | | (0.09 | )1 | | | (0.10 | )1 | | | (0.15 | )1 |
Net realized and unrealized gains (losses) on investments | | | 0.24 | | | | 2.50 | | | | 2.61 | | | | 2.81 | | | | (2.31 | ) | | | 1.42 | |
| | | | | | | | | | | | | | | | | | | | | | | | |
Total from investment operations | | | 0.19 | | | | 2.39 | | | | 2.50 | | | | 2.72 | | | | (2.41 | ) | | | 1.27 | |
Distributions to shareholders from | | | | | | | | | | | | | | | | | | | | | | | | |
Net realized gains | | | 0.00 | | | | (4.10 | ) | | | (0.99 | ) | | | (0.38 | ) | | | (3.74 | ) | | | (3.48 | ) |
Net asset value, end of period | | | $15.62 | | | | $15.43 | | | | $17.14 | | | | $15.63 | | | | $13.29 | | | | $19.44 | |
Total return2 | | | 1.17 | % | | | 17.59 | % | | | 16.21 | % | | | 20.56 | % | | | (12.76 | )% | | | 6.93 | % |
Ratios to average net assets (annualized) | | | | | | | | | | | | | | | | | | | | | | | | |
Gross expenses | | | 1.44 | % | | | 1.43 | % | | | 1.44 | % | | | 1.43 | % | | | 1.39 | % | | | 1.29 | % |
Net expenses | | | 1.15 | % | | | 1.15 | % | | | 1.20 | % | | | 1.20 | % | | | 1.20 | % | | | 1.19 | % |
Net investment loss | | | (0.66 | )% | | | (0.63 | )% | | | (0.66 | )% | | | (0.64 | )% | | | (0.61 | )% | | | (0.73 | )% |
Supplemental data | | | | | | | | | | | | | | | | | | | | | | | | |
Portfolio turnover rate | | | 29 | % | | | 155 | % | | | 44 | % | | | 113 | % | | | 123 | % | | | 73 | % |
Net assets, end of period (000s omitted) | | | $124 | | | | $104 | | | | $133 | | | | $174 | | | | $2,413 | | | | $3,128 | |
| 1 | Calculated based upon average shares outstanding |
| 2 | Returns for periods of less than one year are not annualized. |
The accompanying notes are an integral part of these financial statements.
16 | Wells Fargo Fundamental Small Cap Growth Fund
Financial highlights
(For a share outstanding throughout each period)
| | | | | | | | | | | | | | | | | | | | | | | | |
| | | Six months ended
September 30, 2019
(unaudited) | | | Year ended March 31 | |
| INSTITUTIONAL CLASS | | 2019 | | | 2018 | | | 2017 | | | 2016 | | | 2015 | |
Net asset value, beginning of period | | | $15.94 | | | | $17.53 | | | | $15.94 | | | | $13.54 | | | | $19.69 | | | | $21.84 | |
Net investment loss | | | (0.03 | )1 | | | (0.07 | )1 | | | (0.08 | )1 | | | (0.06 | )1 | | | (0.07 | )1 | | | (0.11 | )1 |
Net realized and unrealized gains (losses) on investments | | | 0.25 | | | | 2.58 | | | | 2.66 | | | | 2.84 | | | | (2.34 | ) | | | 1.44 | |
| | | | | | | | | | | | | | | | | | | | | | | | |
Total from investment operations | | | 0.22 | | | | 2.51 | | | | 2.58 | | | | 2.78 | | | | (2.41 | ) | | | 1.33 | |
Distributions to shareholders from | | | | | | | | | | | | | | | | | | | | | | | | |
Net realized gains | | | 0.00 | | | | (4.10 | ) | | | (0.99 | ) | | | (0.38 | ) | | | (3.74 | ) | | | (3.48 | ) |
Net asset value, end of period | | | $16.16 | | | | $15.94 | | | | $17.53 | | | | $15.94 | | | | $13.54 | | | | $19.69 | |
Total return2 | | | 1.38 | % | | | 17.85 | % | | | 16.40 | % | | | 20.62 | % | | | (12.58 | )% | | | 7.16 | % |
Ratios to average net assets (annualized) | | | | | | | | | | | | | | | | | | | | | | | | |
Gross expenses | | | 1.19 | % | | | 1.18 | % | | | 1.19 | % | | | 1.18 | % | | | 1.14 | % | | | 1.04 | % |
Net expenses | | | 0.90 | % | | | 0.90 | % | | | 0.98 | % | | | 0.98 | % | | | 0.98 | % | | | 0.98 | % |
Net investment loss | | | (0.40 | )% | | | (0.41 | )% | | | (0.44 | )% | | | (0.43 | )% | | | (0.39 | )% | | | (0.52 | )% |
Supplemental data | | | | | | | | | | | | | | | | | | | | | | | | |
Portfolio turnover rate | | | 29 | % | | | 155 | % | | | 44 | % | | | 113 | % | | | 123 | % | | | 73 | % |
Net assets, end of period (000s omitted) | | | $9,868 | | | | $9,695 | | | | $8,878 | | | | $8,001 | | | | $8,980 | | | | $11,812 | |
| 1 | Calculated based upon average shares outstanding |
| 2 | Returns for periods of less than one year are not annualized. |
The accompanying notes are an integral part of these financial statements.
Wells Fargo Fundamental Small Cap Growth Fund | 17
Notes to financial statements (unaudited)
1. ORGANIZATION
Wells Fargo Funds Trust (the “Trust”), a Delaware statutory trust organized on March 10, 1999, is an open-end management investment company registered under the Investment Company Act of 1940, as amended (the “1940 Act”). As an investment company, the Trust follows the accounting and reporting guidance in Financial Accounting Standards Board (“FASB”) Accounting Standards Codification Topic 946, Financial Services – Investment Companies. These financial statements report on the Wells Fargo Fundamental Small Cap Growth Fund (formerly, Wells Fargo Traditional Small Cap Growth Fund) (the “Fund”) which is a diversified series of the Trust.
2. SIGNIFICANT ACCOUNTING POLICIES
The following significant accounting policies, which are consistently followed in the preparation of the financial statements of the Fund, are in conformity with U.S. generally accepted accounting principles which require management to make estimates and assumptions that affect the reported amounts of assets and liabilities, disclosure of contingent assets and liabilities at the date of the financial statements, and the reported amounts of revenues and expenses during the reporting period. Actual results could differ from those estimates.
Securities valuation
All investments are valued each business day as of the close of regular trading on the New York Stock Exchange (generally 4 p.m. Eastern Time), although the Fund may deviate from this calculation time under unusual or unexpected circumstances.
Equity securities that are listed on a foreign or domestic exchange or market are valued at the official closing price or, if none, the last sales price. If no sale occurs on the principal exchange or market that day, a fair value price will be determined in accordance with the Fund’s Valuation Procedures.
The values of securities denominated in foreign currencies are translated into U.S. dollars at rates provided by an independent foreign currency pricing source at a time each business day specified by the Wells Fargo Asset Management Pricing Committee at Wells Fargo Funds Management, LLC (“Funds Management”).
Many securities markets and exchanges outside the U.S. close prior to the close of the New York Stock Exchange and therefore may not fully reflect trading or events that occur after the close of the principal exchange in which the foreign securities are traded, but before the close of the New York Stock Exchange. If such trading or events are expected to materially affect the value of such securities, then fair value pricing procedures approved by the Board of Trustees of the Fund are applied. These procedures take into account multiple factors including movements in U.S. securities markets after foreign exchanges close. Foreign securities that are fair valued under these procedures are categorized as Level 2 and the application of these procedures may result in transfers between Level 1 and Level 2. Depending on market activity, such fair valuations may be frequent. Such fair value pricing may result in net asset values that are higher or lower than net asset values based on the last reported sales price or latest quoted bid price. On September 30, 2019, such fair value pricing was not used in pricing foreign securities.
Investments in registered open-end investment companies are valued at net asset value. Interests in non-registered investment companies that are redeemable at net asset value are fair valued normally at net asset value.
Investments which are not valued using any of the methods discussed above are valued at their fair value, as determined in good faith by the Board of Trustees. The Board of Trustees has established a Valuation Committee comprised of the Trustees and has delegated to it the authority to take any actions regarding the valuation of portfolio securities that the Valuation Committee deems necessary or appropriate, including determining the fair value of portfolio securities, unless the determination has been delegated to the Wells Fargo Asset Management Pricing Committee. The Board of Trustees retains the authority to make or ratify any valuation decisions or approve any changes to the Valuation Procedures as it deems appropriate. On a quarterly basis, the Board of Trustees receives reports on any valuation actions taken by the Valuation Committee or the Wells Fargo Asset Management Pricing Committee which may include items for ratification.
Foreign currency translation
The accounting records of the Fund are maintained in U.S. dollars. The values of other assets and liabilities denominated in foreign currencies are translated into U.S. dollars at rates provided by an independent foreign currency pricing source at a time each business day specified by the Wells Fargo Asset Management Pricing Committee. Purchases and sales of securities, and income and expenses are converted at the rate of exchange on the respective dates of such transactions. Net realized foreign exchange gains or losses arise from sales of foreign currencies, currency gains or losses realized between the trade and settlement dates on securities transactions, and the difference between the amounts of dividends, interest and foreign withholding taxes recorded and the U.S. dollar equivalent of the amounts actually paid or received. Net unrealized foreign exchange gains and losses arise from changes in the fair value of assets and liabilities other than investments in securities resulting from changes in exchange rates. The changes in net
18 | Wells Fargo Fundamental Small Cap Growth Fund
Notes to financial statements (unaudited)
assets arising from changes in exchange rates of securities and the changes in net assets resulting from changes in market prices of securities are not separately presented. Such changes are included in net realized and unrealized gains or losses from investments.
Securities lending
The Fund may lend its securities from time to time in order to earn additional income in the form of fees or interest on securities received as collateral or the investment of any cash received as collateral. When securities are on loan, the Fund receives interest or dividends on those securities. Cash collateral received in connection with its securities lending transactions is invested in Securities Lending Cash Investments, LLC (the “Securities Lending Fund”). Investments in Securities Lending Fund are valued at the evaluated bid price provided by an independent pricing service. Income earned from investment in the Securities Lending Fund, if any, is included in securities lending income from affiliates (net of fees and rebates) on the Statement of Operations.
In a securities lending transaction, the net asset value of the Fund is affected by an increase or decrease in the value of the securities loaned and by an increase or decrease in the value of the instrument in which collateral is invested. The amount of securities lending activity undertaken by the Fund fluctuates from time to time. The Fund has the right under the lending agreement to recover the securities from the borrower on demand. In the event of default or bankruptcy by the borrower, the Fund may be prevented from recovering the loaned securities or gaining access to the collateral or may experience delays or costs in doing so. In such an event, the terms of the agreement allows the unaffiliated securities lending agent to use the collateral to purchase replacement securities on behalf of the Fund or pay the Fund the market value of the loaned securities. The Fund bears the risk of loss with respect to depreciation of its investment of the cash collateral.
Security transactions and income recognition
Securities transactions are recorded on a trade date basis. Realized gains or losses are recorded on the basis of identified cost.
Dividend income is recognized on the ex-dividend date, except for certain dividends from foreign securities, which are recorded as soon as the custodian verifies the ex-dividend date. Dividend income from foreign securities is recorded net of foreign taxes withheld where recovery of such taxes is not assured.
Distributions to shareholders
Distributions to shareholders from net investment income and any net realized gains are recorded on the ex-dividend date and paid at least annually. Such distributions are determined in accordance with income tax regulations and may differ from U.S. generally accepted accounting principles. Dividend sources are estimated at the time of declaration. The tax character of distributions is determined as of the Fund’s fiscal year end. Therefore, a portion of the Fund’s distributions made prior to the Fund’s fiscal year end may be categorized as a tax return of capital at year end.
Federal and other taxes
The Fund intends to continue to qualify as a regulated investment company by distributing substantially all of its investment company taxable income and any net realized capital gains (after reduction for capital loss carryforwards) sufficient to relieve it from all, or substantially all, federal income taxes. Accordingly, no provision for federal income taxes was required.
The Fund’s income and federal excise tax returns and all financial records supporting those returns for the prior three fiscal years are subject to examination by the federal and Delaware revenue authorities. Management has analyzed the Fund’s tax positions taken on federal, state, and foreign tax returns for all open tax years and does not believe that there are any uncertain tax positions that require recognition of a tax liability.
As of September 30, 2019, the aggregate cost of all investments for federal income tax purposes was $91,878,899 and the unrealized gains (losses) consisted of:
| | | | |
| |
Gross unrealized gains | | $ | 17,255,073 | |
| |
Gross unrealized losses | | | (5,263,788 | ) |
| |
Net unrealized gains | | $ | 11,991,285 | |
Class allocations
The separate classes of shares offered by the Fund differ principally in applicable sales charges, distribution, shareholder servicing, and administration fees. Class specific expenses are charged directly to that share class. Investment income, common fund-level expenses, and realized and unrealized gains (losses) on investments are allocated daily to each class of shares based on the relative proportion of net assets of each class.
3. FAIR VALUATION MEASUREMENTS
Fair value measurements of investments are determined within a framework that has established a fair value hierarchy based upon the various data inputs utilized in determining the value of the Fund’s investments. The three-level hierarchy gives the highest priority to unadjusted quoted prices in active markets for identical assets or liabilities (Level 1) and the lowest priority to
Wells Fargo Fundamental Small Cap Growth Fund | 19
Notes to financial statements (unaudited)
unobservable inputs (Level 3). The Fund’s investments are classified within the fair value hierarchy based on the lowest level of input that is significant to the fair value measurement. The inputs are summarized into three broad levels as follows:
| ∎ | | Level 1 – quoted prices in active markets for identical securities |
| ∎ | | Level 2 – other significant observable inputs (including quoted prices for similar securities, interest rates, prepayment speeds, credit risk, etc.) |
| ∎ | | Level 3 – significant unobservable inputs (including the Fund’s own assumptions in determining the fair value of investments) |
The inputs or methodologies used for valuing investments in securities are not necessarily an indication of the risk associated with investing in those securities.
The following is a summary of the inputs used in valuing the Fund’s assets and liabilities as of September 30, 2019:
| | | | | | | | | | | | | | | | |
| | | | |
| | | Quoted prices
(Level 1) | | | Other significant
observable inputs
(Level 2) | | | Significant
unobservable inputs (Level 3) | | | Total | |
| | | | |
Assets | | | | | | | | | | | | | | | | |
Investments in: | | | | | | | | | | | | | | | | |
| | | | |
Common stocks | | | | | | | | | | | | | | | | |
| | | | |
Communication services | | $ | 2,470,010 | | | $ | 0 | | | $ | 0 | | | $ | 2,470,010 | |
| | | | |
Consumer discretionary | | | 9,300,281 | | | | 0 | | | | 0 | | | | 9,300,281 | |
| | | | |
Energy | | | 1,578,195 | | | | 0 | | | | 0 | | | | 1,578,195 | |
| | | | |
Financials | | | 1,550,633 | | | | 0 | | | | 0 | | | | 1,550,633 | |
| | | | |
Health care | | | 22,100,910 | | | | 0 | | | | 0 | | | | 22,100,910 | |
| | | | |
Industrials | | | 22,264,352 | | | | 0 | | | | 0 | | | | 22,264,352 | |
| | | | |
Information technology | | | 26,221,090 | | | | 0 | | | | 0 | | | | 26,221,090 | |
| | | | |
Materials | | | 1,794,969 | | | | 0 | | | | 0 | | | | 1,794,969 | |
| | | | |
Real estate | | | 843,615 | | | | 0 | | | | 0 | | | | 843,615 | |
| | | | |
Short-term investments | | | | | | | | | | | | | | | | |
| | | | |
Investment companies | | | 15,746,129 | | | | 0 | | | | 0 | | | | 15,746,129 | |
| | | | |
Total assets | | $ | 103,870,184 | | | $ | 0 | | | $ | 0 | | | $ | 103,870,184 | |
Additional sector, industry or geographic detail is included in the Portfolio of Investments.
For the six months ended September 30, 2019, the Fund did not have any transfers into/out of Level 3.
4. TRANSACTIONS WITH AFFILIATES
Management fee
Funds Management, an indirect wholly owned subsidiary of Wells Fargo & Company (“Wells Fargo”), is the manager of the Fund and provides advisory and fund-level administrative services under an investment management agreement. Under the investment management agreement, Funds Management is responsible for, among other services, implementing the investment objectives and strategies of the Fund, supervising the subadviser and providing fund-level administrative services in connection with the Fund’s operations. As compensation for its services under the investment management agreement, Funds Management is entitled to receive a management fee at the following annual rate based on the Fund’s average daily net assets:
| | | | |
| |
| Average daily net assets | | Management fee | |
| |
First $500 million | | | 0.850 | % |
| |
Next $500 million | | | 0.825 | |
| |
Next $1 billion | | | 0.800 | |
| |
Next $1 billion | | | 0.775 | |
| |
Next $1 billion | | | 0.750 | |
| |
Next $1 billion | | | 0.730 | |
| |
Next $5 billion | | | 0.720 | |
| |
Over $10 billion | | | 0.710 | |
20 | Wells Fargo Fundamental Small Cap Growth Fund
Notes to financial statements (unaudited)
For the six months ended September 30, 2019, the management fee was equivalent to an annual rate of 0.85% of the Fund’s average daily net assets.
Funds Management has retained the services of a subadviser to provide daily portfolio management to the Fund. The fee for subadvisory services is borne by Funds Management. Wells Capital Management Incorporated (“WellsCap”), an affiliate of Funds Management and an indirect wholly owned subsidiary of Wells Fargo, is the subadviser to the Fund and is entitled to receive a fee from Funds Management at an annual rate starting at 0.55% and declining to 0.40% as the average daily net assets of the Fund increase.
Administration fees
Under a class-level administration agreement, Funds Management provides class-level administrative services to the Fund, which includes paying fees and expenses for services provided by the transfer agent, sub-transfer agents, omnibus account servicers and record-keepers. As compensation for its services under the class-level administration agreement, Funds Management receives an annual fee which is calculated based on the average daily net assets of each class as follows:
| | | | |
| |
| | | Class-level
administration fee | |
| |
Class A, Class C | | | 0.21 | % |
| |
Administrator Class, Institutional Class | | | 0.13 | |
Waivers and/or expense reimbursements
Funds Management has contractually waived and/or reimbursed management and administration fees to the extent necessary to maintain certain net operating expense ratios for the Fund. When each class of the Fund has exceeded its expense cap, Funds Management has waived fees and/or reimbursed expenses from fund-level expenses on a proportionate basis and then from class specific expenses. When only certain classes exceed their expense caps, waivers and/or reimbursements are applied against class specific expenses before fund-level expenses. Funds Management has committed through July 31, 2020 to waive fees and/or reimburse expenses to the extent necessary to cap the Fund’s expenses at 1.23% for Class A shares, 1.98% for Class C shares, 1.15% for Administrator Class shares, and 0.90% for Institutional Class shares. Prior to or after the commitment expiration date, the cap may be increased or the commitment to maintain the cap may be terminated only with the approval of the Board of Trustees.
Distribution fee
The Trust has adopted a distribution plan for Class C shares of the Fund pursuant to Rule 12b-1 under the 1940 Act. A distribution fee is charged to Class C shares and paid to Wells Fargo Funds Distributor, LLC (“Funds Distributor”), the principal underwriter, at an annual rate of 0.75% of the average daily net assets of Class C shares.
In addition, Funds Distributor is entitled to receive the front-end sales charge from the purchase of Class A shares and a contingent deferred sales charge on the redemption of certain Class A shares. Funds Distributor is also entitled to receive the contingent deferred sales charges from redemptions of Class C shares. For the six months ended September 30, 2019, Funds Distributor received $573 from the sale of Class A shares. No contingent deferred sales charges from Class A and Class C shares for the six months ended September 30, 2019.
Shareholder servicing fees
The Trust has entered into contracts with one or more shareholder servicing agents, whereby Class A, Class C, and Administrator Class of the Fund are charged a fee at an annual rate of 0.25% of the average daily net assets of each respective class. A portion of these total shareholder servicing fees were paid to affiliates of Wells Fargo.
Interfund transactions
The Fund may purchase or sell portfolio investment securities to certain other Wells Fargo affiliates pursuant to Rule 17a-7 under the 1940 Act and under procedures adopted by the Board of Trustees. The procedures have been designed to ensure that these interfund transactions, which do not incur broker commissions, are effected at current market prices.
5. INVESTMENT PORTFOLIO TRANSACTIONS
Purchases and sales of investments, excluding U.S. government obligations (if any) and short-term securities, for the six months ended September 30, 2019 were $26,760,006 and $32,921,588, respectively.
Wells Fargo Fundamental Small Cap Growth Fund | 21
Notes to financial statements (unaudited)
6. SECURITIES LENDING TRANSACTIONS
The Fund lends its securities through an unaffiliated securities lending agent and receives collateral in the form of cash or securities with a value at least equal to the value of the securities on loan. The value of the loaned securities is determined at the close of each business day and any increases or decreases in the required collateral are exchanged between the Fund and the counterparty on the next business day. Cash collateral received is invested in the Securities Lending Fund which seeks to provide a positive return compared to the daily Fed Funds Open Rate by investing in high-quality, U.S. dollar-denominated short-term money market instruments and is exempt from registration under Section 3(c)(7) of the 1940 Act. Securities Lending Fund is managed by Funds Management and is subadvised by WellsCap. Funds Management receives an advisory fee starting at 0.05% and declining to 0.01% as the average daily net assets of the Securities Lending Fund increase. All of the fees received by Funds Management are paid to WellsCap for its services as subadviser.
In the event of counterparty default or the failure of a borrower to return a loaned security, the Fund has the right to use the collateral to offset any losses incurred. As of September 30, 2019, the Fund had securities lending transactions with the following counterparties which are subject to offset:
| | | | | | | | | | | | |
| | | |
| Counterparty | | Value of
securities on
loan | | | Collateral
received1 | | | Net amount | |
| | | |
Bank of America Securities Inc. | | $ | 1,326,971 | | | $ | (1,326,971 | ) | | $ | 0 | |
| | | |
Barclays Capital Inc. | | | 1,868,694 | | | | (1,868,694 | ) | | | 0 | |
| | | |
BMO Capital Markets Corp. | | | 587,748 | | | | (587,748 | ) | | | 0 | |
| | | |
Citigroup Global Markets Inc. | | | 1,938,892 | | | | (1,938,892 | ) | | | 0 | |
| | | |
Deutsche Bank Securities Inc. | | | 464,920 | | | | (464,920 | ) | | | 0 | |
| | | |
JPMorgan Securities LLC | | | 2,112,806 | | | | (2,112,806 | ) | | | 0 | |
| | | |
Jefferies LLC | | | 327,348 | | | | (327,348 | ) | | | 0 | |
| | | |
Morgan Stanley & Co. LLC | | | 2,360,733 | | | | (2,360,733 | ) | | | 0 | |
| | | |
UBS Securities LLC | | | 725,476 | | | | (725,476 | ) | | | 0 | |
| 1 | Collateral received within this table is limited to the collateral for the net transaction with the counterparty. |
7. BANK BORROWINGS
The Trust (excluding the money market funds), Wells Fargo Master Trust and Wells Fargo Variable Trust are parties to a $280,000,000 revolving credit agreement whereby the Fund is permitted to use bank borrowings for temporary or emergency purposes, such as to fund shareholder redemption requests. Interest under the credit agreement is charged to the Fund based on a borrowing rate equal to the higher of the Federal Funds rate in effect on that day plus 1.25% or the overnight LIBOR rate in effect on that day plus 1.25%. In addition, an annual commitment fee equal to 0.25% of the unused balance is allocated to each participating fund.
For the six months ended September 30, 2019, there were no borrowings by the Fund under the agreement.
8. CONCENTRATION RISK
Concentration risks result from exposure to a limited number of sectors. As of the end of the period, the Fund invests a concentration of its portfolio in the health care, industrials, and information technology sectors. A fund that invests a substantial portion of its assets in any sector may be more affected by changes in that sector than would be a fund whose investments are not heavily weighted in any sector.
9. INDEMNIFICATION
Under the Trust’s organizational documents, the officers and Trustees have been granted certain indemnification rights against certain liabilities that may arise out of performance of their duties to the Trust. Additionally, in the normal course of business, the Trust may enter into contracts with service providers that contain a variety of indemnification clauses. The Trust’s maximum exposure under these arrangements is dependent on future claims that may be made against the Fund and, therefore, cannot be estimated.
22 | Wells Fargo Fundamental Small Cap Growth Fund
Notes to financial statements (unaudited)
10. NEW ACCOUNTING PRONOUNCEMENT
In August 2018, FASB issued Accounting Standards Update (“ASU”) No. 2018-13, Fair Value Measurement (Topic 820)Disclosure Framework—Changes to the Disclosure Requirements for Fair Value MeasurementASU 2018-13 updates the disclosure requirements for fair value measurements by modifying or removing certain disclosures and adding certain new disclosures. The amendments are effective for fiscal years, and interim periods within those fiscal years, beginning after December 15, 2019. Early adoption is permitted. Management has adopted the removal and modification of disclosures early, as permitted, and will adopt the additional new disclosures at the effective date.
Wells Fargo Fundamental Small Cap Growth Fund | 23
Other information (unaudited)
PROXY VOTING INFORMATION
A description of the policies and procedures used to determine how to vote proxies relating to portfolio securities is available, upon request, by calling1-800-222-8222, visiting our website at wfam.com, or visiting the SEC website at sec.gov. Information regarding how the proxies related to portfolio securities were voted during the most recent 12-month period ended June 30 is available on the website atwfam.comor by visiting the SEC website at sec.gov.
QUARTERLY PORTFOLIO HOLDINGS INFORMATION
The Fund files its complete schedule of portfolio holdings with the SEC for the first and third quarters of each fiscal year on Form N-Q or Form N-PORT, which is available by visiting the SEC website at sec.gov. Those forms may be reviewed and copied at the SEC’s Public Reference Room in Washington, DC. Information on the operation of the Public Reference Room may be obtained by calling1-800-SEC-0330.
24 | Wells Fargo Fundamental Small Cap Growth Fund
Other information (unaudited)
BOARD OF TRUSTEES AND OFFICERS
Each of the Trustees and Officers1 listed in the table below acts in identical capacities for each fund in the Wells Fargo family of funds, which consists of 150 mutual funds comprising the Wells Fargo Funds Trust, Wells Fargo Variable Trust, Wells Fargo Master Trust and four closed-end funds (collectively the “Fund Complex”). This table should be read in conjunction with the Prospectus and the Statement of Additional Information2. The mailing address of each Trustee and Officer is 525 Market Street, 12th Floor, San Francisco, CA 94105. Each Trustee and Officer serves an indefinite term, however, each Trustee serves such term until reaching the mandatory retirement age established by the Trustees.
Independent Trustees
| | | | | | |
Name and year of birth | | Position held and
length of service* | | Principal occupations during past five years or longer | | Current other
public company or
investment
company
directorships |
| | | |
William R. Ebsworth (Born 1957) | | Trustee, since 2015 | | Retired. From 1984 to 2013, equities analyst, portfolio manager, research director and chief investment officer at Fidelity Management and Research Company in Boston, Tokyo, and Hong Kong, and retired in 2013 as Chief Investment Officer of Fidelity Strategic Advisers, Inc. where he led a team of investment professionals managing client assets. Prior thereto, Board member of Hong Kong Securities Clearing Co., Hong Kong Options Clearing Corp., the Thailand International Fund, Ltd., Fidelity Investments Life Insurance Company, and Empire Fidelity Investments Life Insurance Company. Audit Committee Chair and Investment Committee Chair of the Vincent Memorial Hospital Endowment (non-profit organization). Mr. Ebsworth is a CFA® charterholder. | | N/A |
| | | |
Jane A. Freeman (Born 1953) | | Trustee, since 2015; Chair Liaison, since 2018 | | Retired. From 2012 to 2014 and 1999 to 2008, Chief Financial Officer of Scientific Learning Corporation. From 2008 to 2012, Ms. Freeman provided consulting services related to strategic business projects. Prior to 1999, Portfolio Manager at Rockefeller & Co. and Scudder, Stevens & Clark. Board member of the Harding Loevner Funds from 1996 to 2014, serving as both Lead Independent Director and chair of the Audit Committee. Board member of the Russell Exchange Traded Funds Trust from 2011 to 2012 and the chair of the Audit Committee. Ms. Freeman is a Board Member of The Ruth Bancroft Garden (non-profit organization). She is also an inactive Chartered Financial Analyst. | | N/A |
| | | |
Isaiah Harris, Jr. (Born 1952) | | Trustee, since 2009; Audit Committee Chairman, since 2019 | | Retired. Chairman of the Board of CIGNA Corporation since 2009, and Director since 2005. From 2003 to 2011, Director of Deluxe Corporation. Prior thereto, President and CEO of BellSouth Advertising and Publishing Corp. from 2005 to 2007, President and CEO of BellSouth Enterprises from 2004 to 2005 and President of BellSouth Consumer Services from 2000 to 2003. Emeritus member of the Iowa State University Foundation Board of Governors. Emeritus Member of the Advisory Board of Iowa State University School of Business. Advisory Board Member, Palm Harbor Academy (private school). Advisory Board Member, Child Evangelism Fellowship (non-profit). Mr. Harris is a certified public accountant (inactive status). | | CIGNA Corporation |
| | | |
Judith M. Johnson (Born 1949) | | Trustee, since 2008; Audit Committee Chairman, from 2009 to 2018 | | Retired. Prior thereto, Chief Executive Officer and Chief Investment Officer of Minneapolis Employees Retirement Fund from 1996 to 2008. Ms. Johnson is an attorney, certified public accountant and a certified managerial accountant. | | N/A |
Wells Fargo Fundamental Small Cap Growth Fund | 25
Other information (unaudited)
| | | | | | |
Name and year of birth | | Position held and
length of service* | | Principal occupations during past five years or longer | | Current other
public company or
investment
company
directorships |
| | | |
David F. Larcker (Born 1950) | | Trustee, since 2009 | | James Irvin Miller Professor of Accounting at the Graduate School of Business, Stanford University, Director of the Corporate Governance Research Initiative and Senior Faculty of The Rock Center for Corporate Governance since 2006. From 2005 to 2008, Professor of Accounting at the Graduate School of Business, Stanford University. Prior thereto, Ernst & Young Professor of Accounting at The Wharton School, University of Pennsylvania from 1985 to 2005. | | N/A |
| | | |
Olivia S. Mitchell (Born 1953) | | Trustee, since 2006; Nominating and Governance Committee Chairman, since 2018 | | International Foundation of Employee Benefit Plans Professor, Wharton School of the University of Pennsylvania since 1993. Director of Wharton’s Pension Research Council and Boettner Center on Pensions & Retirement Research, and Research Associate at the National Bureau of Economic Research. Previously, Cornell University Professor from 1978 to 1993. | | N/A |
| | | |
Timothy J. Penny (Born 1951) | | Trustee, since 1996; Chairman, since 2018 | | President and Chief Executive Officer of Southern Minnesota Initiative Foundation, a non-profit organization, since 2007. Member of the Board of Trustees of NorthStar Education Finance, Inc., a non-profit organization, since 2007. | | N/A |
| | | |
James G. Polisson (Born 1959) | | Trustee, since 2018 | | Retired. Chief Marketing Officer, Source (ETF) UK Services, Ltd, from 2015 to 2017. From 2012 to 2015, Principal of The Polisson Group, LLC, a management consulting, corporate advisory and principal investing company. Chief Executive Officer and Managing Director at Russell Investments, Global Exchange Traded Funds from 2010 to 2012. Managing Director of Barclays Global Investors from 1998 to 2010 and Global Chief Marketing Officer for iShares and Barclays Global Investors from 2000 to 2010. Trustee of the San Francisco Mechanics’ Institute, a non-profit organization, from 2013 to 2015. Board member of the Russell Exchange Traded Fund Trust from 2011 to 2012. Director of Barclays Global Investors Holdings Deutschland GmbH from 2006 to 2009. Mr. Polisson is an attorney and has a retired status with the Massachusetts and District of Columbia Bar Associations. | | N/A |
| * | Length of service dates reflect the Trustee’s commencement of service with the Trust’s predecessor entities, where applicable. |
26 | Wells Fargo Fundamental Small Cap Growth Fund
Other information (unaudited)
Officers
| | | | |
Name and year of birth | | Position held and
length of service | | Principal occupations during past five years or longer |
| | |
Andrew Owen (Born 1960) | | President, since 2017 | | Executive Vice President of Wells Fargo & Company and Head of Affiliated Managers, Wells Fargo Asset Management, since 2014. In addition, Mr. Owen is currently President, Chief Executive Officer and Director of Wells Fargo Funds Management, LLC since 2017. Prior thereto, Executive Vice President responsible for marketing, investments and product development for Wells Fargo Funds Management, LLC, from 2009 to 2014. |
| | |
Nancy Wiser1 (Born 1967) | | Treasurer, since 2012 | | Executive Vice President of Wells Fargo Funds Management, LLC since 2011. Chief Operating Officer and Chief Compliance Officer at LightBox Capital Management LLC, from 2008 to 2011. |
| | |
Michelle Rhee3 (Born 1966) | | Chief Legal Officer, since 2019 | | Secretary of Wells Fargo Funds Management, LLC, Chief Legal Counsel of Wells Fargo Asset Management and Assistant General Counsel of Wells Fargo Bank, N.A. since 2018. Associate General Counsel and Managing Director of Bank of America Corporation from 2004 to 2018. |
| | |
Catherine Kennedy4 (Born 1969) | | Secretary, since 2019 | | Vice President of Wells Fargo Funds Management, LLC and Senior Counsel of the Wells Fargo Legal Department since 2010. Vice President and Senior Counsel of Evergreen Investment Management Company, LLC from 1998 to 2010. |
| | |
Michael H. Whitaker (Born 1967) | | Chief Compliance Officer, since 2016 | | Chief Compliance Officer of Wells Fargo Asset Management since 2016. Senior Vice President and Chief Compliance Officer for Fidelity Investments from 2007 to 2016. |
| | |
David Berardi (Born 1975) | | Assistant Treasurer, since 2009 | | Vice President of Wells Fargo Funds Management, LLC since 2009. Vice President of Evergreen Investment Management Company, LLC from 2008 to 2010. Manager of Fund Reporting and Control for Evergreen Investment Management Company, LLC from 2004 to 2010. |
| | |
Jeremy DePalma1 (Born 1974) | | Assistant Treasurer, since 2009 | | Senior Vice President of Wells Fargo Funds Management, LLC since 2009. Senior Vice President of Evergreen Investment Management Company, LLC from 2008 to 2010 and head of the Fund Reporting and Control Team within Fund Administration from 2005 to 2010. |
| 1 | Nancy Wiser acts as Treasurer of 64 funds in the Fund Complex. Jeremy DePalma acts as Treasurer of 86 funds and Assistant Treasurer of 64 funds in the Fund Complex. |
| 2 | The Statement of Additional Information includes additional information about the Trustees and is available, without charge, upon request, by calling 1-800-222-8222 or by visiting the website atwfam.com. |
| 3 | Michelle Rhee became Chief Legal Officer effective October 22, 2019. |
| 4 | Catherine Kennedy became Secretary effective October 22, 2019. |
Wells Fargo Fundamental Small Cap Growth Fund | 27
Other information (unaudited)
BOARD CONSIDERATION OF INVESTMENT MANAGEMENT AND SUB-ADVISORY AGREEMENTS:
Wells Fargo Fundamental Small Cap Growth Fund
Under the Investment Company Act of 1940 (the “1940 Act”), the Board of Trustees (the “Board”) of Wells Fargo Funds Trust (the “Trust”) must determine annually whether to approve the continuation of the Trust’s investment management andsub-advisory agreements. In this regard, at an in-person meeting held on May 21-22, 2019 (the “Meeting”), the Board, all the members of which have no direct or indirect interest in the investment management and sub-advisory agreements and are not “interested persons” of the Trust, as defined in the 1940 Act (the “Independent Trustees”), reviewed and approved for Wells Fargo Fundamental Small Cap Growth Fund, formerly known as Wells Fargo Traditional Small Cap Growth Fund (the “Fund”): (i) an investment management agreement (the “Management Agreement”) with Wells Fargo Funds Management, LLC (“Funds Management”); and (ii) an investment sub-advisory agreement (the “Sub-Advisory Agreement”) with Wells Capital Management Incorporated (the “Sub-Adviser”), an affiliate of Funds Management. The Management Agreement and theSub-Advisory Agreement are collectively referred to as the “Advisory Agreements.”
At the Meeting, the Board considered the factors and reached the conclusions described below relating to the selection of Funds Management and the Sub-Adviser and the approval of the Advisory Agreements. Prior to the Meeting, including at an in-person meeting in April 2019, the Trustees conferred extensively among themselves and with representatives of Funds Management about these matters. Also, the Board has adopted a team-based approach, with each team consisting of a sub-set of Trustees, to assist the full Board in the discharge of its duties in reviewing investment performance and other matters throughout the year. The Independent Trustees were assisted in their evaluation of the Advisory Agreements by independent legal counsel, from whom they received separate legal advice and with whom they met separately.
In providing information to the Board, Funds Management and the Sub-Adviser were guided by a detailed set of requests for information submitted to them by independent legal counsel on behalf of the Independent Trustees at the start of the Board’s annual contract renewal process earlier in 2019. In considering and approving the Advisory Agreements, the Trustees considered the information they believed relevant, including but not limited to the information discussed below. The Board considered not only the specific information presented in connection with the Meeting, but also the knowledge gained over time through interaction with Funds Management and the Sub-Adviser about various topics. In this regard, the Board reviewed reports of Funds Management at each of its quarterly meetings, which included, among other things, portfolio reviews and investment performance reports. In addition, the Board and the teams mentioned above confer with portfolio managers at various times throughout the year. The Board did not identify any particular information or consideration that was all-important or controlling, and each individual Trustee may have attributed different weights to various factors.
After its deliberations, the Board unanimously approved the continuation of the Advisory Agreements for a one-year term and determined that the compensation payable to Funds Management and the Sub-Adviser under each of the Advisory Agreements was reasonable. The Board considered the approval of the Advisory Agreements for the Fund as part of its consideration of agreements for funds across the complex, but its approvals were made on a fund-by-fund basis. The following summarizes a number of important, but not necessarily all, factors considered by the Board in support of its approvals.
Nature, extent and quality of services
The Board received and considered various information regarding the nature, extent and quality of services provided to the Fund by Funds Management and the Sub-Adviser under the Advisory Agreements. This information included a description of the investment advisory services and Fund-level administrative services covered by the Management Agreement, as well as, among other things, a summary of the background and experience of senior management of Wells Fargo Asset Management (“WFAM”), of which Funds Management and the Sub-Adviser are a part, a summary of investments made in the business of WFAM, a summary of certain organizational and personnel changes involving Funds Management and the Sub-Adviser, and a description of Funds Management’s and the Sub-Adviser’s business continuity planning programs and of their approaches to data privacy and cybersecurity. The Board received and reviewed information about Funds Management’s role as administrator of the Fund’s liquidity risk management program. The Board also considered the qualifications, background, tenure and responsibilities of each of the portfolio managers primarily responsible for the day-to-day portfolio management of the Fund.
The Board evaluated the ability of Funds Management and the Sub-Adviser to attract and retain qualified investment professionals, including research, advisory and supervisory personnel. The Board further considered the compliance programs and compliance records of Funds Management and the Sub-Adviser. In addition, the Board took into account the full range of services provided to the Fund by Funds Management and its affiliates.
28 | Wells Fargo Fundamental Small Cap Growth Fund
Other information (unaudited)
Fund investment performance and expenses
The Board considered the investment performance results for the Fund over various time periods ended December 31, 2018. The Board considered these results in comparison to the investment performance of funds in a universe that was determined by Broadridge Inc. (“Broadridge”) to be similar to the Fund (the “Universe”), and in comparison to the Fund’s benchmark index and to other comparative data. Broadridge is an independent provider of investment company data. The Board received a description of the methodology used by Broadridge to select the mutual funds in the performance Universe. The Board noted that the investment performance of the Fund (Class A) was higher than or in range of the average investment performance of the Universe for the one- and three-year periods under review, but lower than the average investment performance of the Universe for the five- and ten-year periods under review. The Board also noted that the investment performance of the Fund was higher than its benchmark index, the Russell 2000® Growth Index, for the one- and three-year periods under review, but lower than its benchmark for the five- and ten-year periods under review.
The Board also received and considered information regarding the Fund’s net operating expense ratios and their various components, including actual management fees, custodian and other non-management fees, and Rule 12b-1 and non-Rule 12b-1 shareholder service fees. The Board considered these ratios in comparison to the median ratios of funds in class-specific expense groups that were determined by Broadridge to be similar to the Fund (the “Groups”). The Board received a description of the methodology used by Broadridge to select the mutual funds in the expense Groups and an explanation of how funds comprising expense groups and their expense ratios may vary from year-to-year. Based on the Broadridge reports, the Board noted that the net operating expense ratios of the Fund were lower than or in range of the median net operating expense ratios of the expense Groups for each share class. The Board noted that the Fund’s expense caps, including expense caps for Class A and the Administrator Class, were lowered in 2018.
The Board took into account the Fund’s investment performance and expense information provided to it among the factors considered in deciding to re-approve the Advisory Agreements.
Investment management and sub-advisory fee rates
The Board reviewed and considered the contractual fee rates payable by the Fund to Funds Management under the Management Agreement, as well as the contractual fee rates payable by the Fund to Funds Management for class-level administrative services under a Class-Level Administration Agreement, which include, among other things, class-level transfer agency and sub-transfer agency costs (collectively, the “Management Rates”). The Board also reviewed and considered the contractual investment sub-advisory fee rates that are payable by Funds Management to the Sub-Adviser for investment sub-advisory services.
Among other information reviewed by the Board was a comparison of the Fund’s Management Rates with the average contractual investment management fee rates of funds in the expense Groups at a common asset level as well as transfer agency costs of the funds in the expense Groups. The Board noted that the Management Rates of the Fund were in range of the sum of the average rates of the Fund’s expense Group for the Institutional Class, but that the Management Rates of the Fund’s Class A and Administrator Class shares were higher than the sum of the average rates of their respective expense Groups.
The Board also received and considered information about the portion of the total management fee that was retained by Funds Management after payment of the fee to the Sub-Adviser for sub-advisory services. In assessing the reasonableness of this amount, the Board received and evaluated information about the nature and extent of responsibilities retained and risks assumed by Funds Management and not delegated to or assumed by the Sub-Adviser, and about Funds Management’s on-going oversight services. Given the affiliation between Funds Management and the Sub-Adviser, the Board ascribed limited relevance to the allocation of fees between them.
The Board also received and considered information about the nature and extent of services offered and fee rates charged by Funds Management and the Sub-Adviser to other types of clients with investment strategies similar to those of the Fund. In this regard, the Board received information about the significantly greater scope of services, and compliance, reporting and other legal burdens and risks of managing proprietary mutual funds compared with those associated with managing assets of other types of clients, including third-party sub-advised fund clients and non-mutual fund clients such as institutional separate accounts.
Based on its consideration of the factors and information it deemed relevant, including those described here, the Board determined that the compensation payable to Funds Management under the Management Agreement and to the Sub-Adviser under the Sub-Advisory Agreement was reasonable.
Wells Fargo Fundamental Small Cap Growth Fund | 29
Other information (unaudited)
Profitability
The Board received and considered information concerning the profitability of Funds Management, as well as the profitability of both WFAM and Wells Fargo & Co. (“Wells Fargo”) from providing services to the fund family as a whole. The Board noted that the Sub-Adviser’s profitability information with respect to providing services to the Fund and other funds in the family was subsumed in the WFAM and Wells Fargo profitability analysis.
Funds Management reported on the methodologies and estimates used in calculating profitability, including a description of the methodology used to allocate certain expenses. Among other things, the Board noted that the levels of profitability reported on a fund-by-fund basis varied widely, depending on factors such as the size, type and age of fund. Based on its review, the Board did not deem the profits reported by Funds Management, WFAM or Wells Fargo from services provided to the Fund to be at a level that would prevent it from approving the continuation of the Advisory Agreements.
Economies of scale
The Board received and considered information about the potential for Funds Management to experience economies of scale in the provision of management services to the Fund, the difficulties of calculating economies of scale at an individual fund level, and the extent to which potential scale benefits are shared with shareholders. The Board noted the existence of breakpoints in the Fund’s management fee structure, which operate generally to reduce the Fund’s expense ratios as the Fund grows in size. The Board considered that in addition to management fee breakpoints, Funds Management shares potential economies of scale from its management business in a variety of ways, including through fee waiver and expense reimbursement arrangements, services that benefit shareholders, competitive management fee rates set at the outset without regard to breakpoints, and investments in the business intended to enhance services available to shareholders.
The Board concluded that Funds Management’s arrangements with respect to the Fund, including contractual breakpoints, constituted a reasonable approach to sharing potential economies of scale with the Fund and its shareholders.
Other benefits to Funds Management and the Sub-Adviser
The Board received and considered information regarding potential “fall-out” or ancillary benefits received by Funds Management and its affiliates, including the Sub-Adviser, as a result of their relationships with the Fund. Ancillary benefits could include, among others, benefits directly attributable to other relationships with the Fund and benefits potentially derived from an increase in Funds Management’s and the Sub-Adviser’s business as a result of their relationships with the Fund. The Board noted that various affiliates of Funds Management may receive distribution-related fees, shareholder servicing payments and sub-transfer agency fees in respect of shares sold or held through them and services provided.
The Board also reviewed information about soft dollar credits earned and utilized by the Sub-Adviser, fees earned by Funds Management and the Sub-Adviser from managing a private investment vehicle for the fund family’s securities lending collateral, and commissions earned by an affiliated broker from portfolio transactions.
Based on its consideration of the factors and information it deemed relevant, including those described here, the Board did not find that any ancillary benefits received by Funds Management and its affiliates, including the Sub-Adviser, were unreasonable.
Conclusion
At the Meeting, after considering the above-described factors and based on its deliberations and its evaluation of the information described above, the Board unanimously approved the continuation of the Advisory Agreements for a one-year term and determined that the compensation payable to Funds Management and the Sub-Adviser under each of the Advisory Agreements was reasonable.
30 | Wells Fargo Fundamental Small Cap Growth Fund
This page is intentionally left blank.
This page is intentionally left blank.

For more information
More information about Wells Fargo Funds is available free upon request. To obtain literature, please write, visit the Fund’s website, or call:
Wells Fargo Funds
P.O. Box 219967
Kansas City, MO 64121-9967
Website:wfam.com
Individual investors:1-800-222-8222
Retail investment professionals:1-888-877-9275
Institutional investment professionals:1-866-765-0778

This report and the financial statements contained herein are submitted for the general information of the shareholders of the Fund. If this report is used for promotional purposes, distribution of the report must be accompanied or preceded by a current prospectus. Before investing, please consider the investment objectives, risks, charges, and expenses of the investment. For a current prospectus and, if available, a summary prospectus, containing this information, call1-800-222-8222 or visit the Fund’s website atwfam.com. Read the prospectus carefully before you invest or send money.
Wells Fargo Asset Management (WFAM) is the trade name for certain investment advisory/management firms owned by Wells Fargo & Company. These firms include but are not limited to Wells Capital Management Incorporated and Wells Fargo Funds Management, LLC. Certain products managed by WFAM entities are distributed by Wells Fargo Funds Distributor, LLC (a broker-dealer and Member FINRA).
This material is for general informational and educational purposes only and is NOT intended to provide investment advice or a recommendation of any kind—including a recommendation for any specific investment, strategy, or plan.
INVESTMENT PRODUCTS: NOT FDIC INSURED ◾ NO BANK GUARANTEE ◾ MAY LOSE VALUE
© 2019 Wells Fargo & Company. All rights reserved.
406822 11-19
SA247/SAR247 09-19
Semi-Annual Report
September 30, 2019
Wells Fargo Precious Metals Fund
Beginning on January 1, 2021, as permitted by new regulations adopted by the Securities and Exchange Commission, paper copies of the Wells Fargo Funds’ annual and semi-annual shareholder reports issued after this date will no longer be sent by mail, unless you specifically request paper copies of the reports. Instead, the reports will be made available on the Funds’ website, and you will be notified by mail each time a report is posted and provided with a website address to access the report.
If you already elected to receive shareholder reports electronically, you will not be affected by this change and you need not take any action. You may elect to receive shareholder reports and other communications from the Fund electronically at any time by contacting your financial intermediary (such as a broker-dealer or bank) or, if you are a direct investor, by calling1-800-222-8222 or by enrolling at wellsfargo.com/advantagedelivery.
You may elect to receive all future reports in paper free of charge. If you invest through a financial intermediary, you can contact your financial intermediary to request that you continue to receive paper copies of your shareholder reports; if you invest directly with the Fund, you can call 1-800-222-8222. Your election to receive reports in paper will apply to all Wells Fargo Funds held in your account with your financial intermediary or, if you are a direct investor, to all Wells Fargo Funds that you hold.
|
|
|
Reduce clutter. Save trees. |
Sign up for electronic delivery of prospectuses and shareholder reports atwellsfargo.com/advantagedelivery |
The views expressed and any forward-looking statements are as of September 30, 2019, unless otherwise noted, and are those of the Fund managers and/or Wells Fargo Asset Management. Discussions of individual securities, or the markets generally, or any Wells Fargo Fund are not intended as individual recommendations. Future events or results may vary significantly from those expressed in any forward-looking statements. The views expressed are subject to change at any time in response to changing circumstances in the market. Wells Fargo Asset Management and the Fund disclaim any obligation to publicly update or revise any views expressed or forward-looking statements.
INVESTMENT PRODUCTS: NOT FDIC INSURED ◾ NO BANK GUARANTEE ◾ MAY LOSE VALUE
Wells Fargo Precious Metals Fund | 1
Letter to shareholders (unaudited)

Andrew Owen
President
Wells Fargo Funds
“During the third quarter of 2019, investors regrouped.”
Dear Shareholder:
We are pleased to offer you this semi-annual report for the Wells Fargo Precious Metals Fund for the six-month period that ended September 30, 2019. U.S. stock and global bond investors generally saw markets recover during the second half amid intensifying market volatility, global economic growth concerns, international trade stare downs, and simmering geopolitical tensions.
Overall, fixed income kept pace with domestic stocks and outperformed foreign equities. For the period, U.S. stocks, based on the S&P 500 Index,1 gained 6.08% and international stocks, as measured by the MSCI ACWI ex USA Index (Net),2 added 1.13%. The MSCI EM Index (Net)3 fell by 3.66%. Among fixed income investors, the Bloomberg Barclays U.S. Aggregate Bond Index4 added 5.42%, the Bloomberg Barclays Global Aggregate ex-USD Index5 gained 2.82%, the Bloomberg Barclays Municipal Bond Index6 increased 3.74%, and the ICE BofAML U.S. High Yield Index7 was up 3.82%.
Early second-quarter 2019 investor enthusiasm faded as the quarter wore on.
During April 2019, favorable sentiment found additional support in reports of sustained low inflation, solid employment data, and first-quarter U.S. gross domestic product (GDP) growth at an annualized rate of 3.2%. During May, markets tumbled on mixed investment signals. In the U.S., partisan wrangling ramped up as Democrats and Republicans set their sights on 2020 presidential politics. The U.K.’s Brexit disagreements caused Prime Minister Theresa May to resign. Boris Johnson succeeded her only to exacerbate uncertainty about Brexit’s resolution ahead of an October 2019 deadline. The European Commission downgraded the 2019 growth forecast to 1.2%. The U.S. increased tariffs on products from China, China responded, and then talks broke down. President Donald Trump threatened to turn his foreign policy tariff tool to Mexico over immigration issues.
During the third quarter of 2019, investors regrouped. Just as the investment horizon appeared to darken, sentiment turned and U.S. equity markets gained during June and July. The gains, primarily driven by geopolitical and monetary policy events, pushed equity markets to new highs. European Central Bank President Mario Draghi said that if the outlook doesn’t improve, the bank would cut rates or buy more assets to prop up inflation. President Trump backed off of tariff threats against Mexico and China. In the U.S., the Federal Reserve (Fed) implemented a 0.25% federal funds rate cut in July.
| 1 | The S&P 500 Index consists of 500 stocks chosen for market size, liquidity, and industry group representation. It is a market-value-weighted index with each stock’s weight in the index proportionate to its market value. You cannot invest directly in an index. |
| 2 | The Morgan Stanley Capital International (MSCI) All Country World Index (ACWI) ex USA Index (Net) is a free-float-adjusted market-capitalization weighted index that is designed to measure the equity market performance of developed and emerging markets, excluding the U.S. Source: MSCI. MSCI makes no express or implied warranties or representations and shall have no liability whatsoever with respect to any MSCI data contained herein. The MSCI data may not be further redistributed or used as a basis for other indices or any securities or financial products. This report is not approved, reviewed, or produced by MSCI. You cannot invest directly in an index. |
| 3 | The MSCI Emerging Markets (EM) Index (Net) is a free-float-adjusted market-capitalization-weighted index that is designed to measure the equity market performance of emerging markets. You cannot invest directly in an index. |
| 4 | The Bloomberg Barclays U.S. Aggregate Bond Index is a broad-based benchmark that measures the investment-grade, U.S. dollar-denominated, fixed-rate taxable bond market, including Treasuries, government-related and corporate securities, mortgage-backed securities (agency fixed-rate and hybrid adjustable-rate mortgage pass-throughs), asset-backed securities, and commercial mortgage-backed securities. You cannot invest directly in an index. |
| 5 | The Bloomberg Barclays Global Aggregate ex-USD Index is an unmanaged index that provides a broad-based measure of the global investment-grade fixed-income markets excluding the U.S. dollar-denominated debt market. You cannot invest directly in an index. |
| 6 | The Bloomberg Barclays Municipal Bond Index is an unmanaged index composed of long-term tax-exempt bonds with a minimum credit rating of Baa. You cannot invest directly in an index. |
| 7 | The ICE BofAML U.S. High Yield Index is a market-capitalization-weighted index of domestic and Yankee high-yield bonds. The index tracks the performance of high-yield securities traded in the U.S. bond market. You cannot invest directly in an index. Copyright 2019. ICE Data Indices, LLC. All rights reserved. |
2 | Wells Fargo Precious Metals Fund
Letter to shareholders (unaudited)
Later in July 2019, the U.S. reversed course and threatened to impose higher tariffs on China’s exports after talks failed. China responded with tariff threats of its own and devalued the renminbi, a move that roiled global markets. Major U.S. stock market indices closed July with the worst weekly results of the year. Bond prices gained as Treasury yields fell to levels not seen since November 2016 and the yield curve inverted at multiple points along the 30-year arc.
In a microcosm, August encapsulated many of the unnerving events that plagued investors during the prior 11 months. The U.S.-China trade relationship swung from antagonistic to hopeful and back again with no evident compromise on the horizon. Evidence of a continued global economic slowdown mounted. Central banks in China, New Zealand, and Thailand cut interest rates. Industrial and manufacturing data declined in China, Canada, Japan, and Germany. Adding to the uncertain environment, Italy’s prime minister resigned, many feared a crackdown in Hong Kong as protesters sustained their calls for reform throughout the month, and Boris Johnson planned to suspend Parliament as Brexit’s deadline neared.
In the U.S., September saw the Fed join other central banks in cutting interest rates. Manufacturing data in the U.S., as reported by the Institute for Supply Management, disappointed investors. The U.S. Congress announced it would pursue an impeachment investigation of President Trump. Meanwhile, the Brexit impasse showed no signs of resolution. Officials in China said that hitting the country’s economic growth goals for the year would be difficult considering the weight of tariffs and trade restrictions. So while the S&P 500 Index finished the third quarter with year-to-date returns that were the best in more than 20 years, amid signs of equity investors taking money out of the stock market, concerns about future returns remained.
Don’t let short-term uncertainty derail long-term investment goals.
Periods of investment uncertainty can present challenges, but experience has taught us that maintaining long-term investment goals can be an effective way to plan for the future. To help you create a sound strategy based on your personal goals and risk tolerance, Wells Fargo Funds offers more than 100 mutual funds spanning a wide range of asset classes and investment styles. Although diversification cannot guarantee an investment profit or prevent losses, we believe it can be an effective way to manage investment risk and potentially smooth out overall portfolio performance. We encourage investors to know their investments and to understand that appropriate levels of risk-taking may unlock opportunities.
Thank you for choosing to invest with Wells Fargo Funds. We appreciate your confidence in us and remain committed to helping you meet your financial needs.
Sincerely,

Andrew Owen
President
Wells Fargo Funds
“In the U.S., September saw the Fed join other central banks in cutting interest rates.”
|
|
|
For further information about your Fund, contact your investment professional, visit our website at wfam.com, or call us directly at1-800-222-8222. |
Wells Fargo Precious Metals Fund | 3
Performance highlights (unaudited)
Investment objective
The Fund seeks long-term capital appreciation.
Manager
Wells Fargo Funds Management, LLC
Subadviser
Wells Capital Management Incorporated
Portfolio managers
Michael Bradshaw, CFA®‡
Oleg Makhorine
Average annual total returns (%) as of September 30, 20191
| | | | | | | | | | | | | | | | | | | | | | | | | | | | | | | | | | |
| | | | |
| | | | | Including sales charge | | | Excluding sales charge | | | Expense ratios2 (%) | |
| | | | | | | | | |
| | | Inception date | | 1 year | | | 5 year | | | 10 year | | | 1 year | | | 5 year | | | 10 year | | | Gross | | | Net3 | |
| | | | | | | | | | |
| Class A (EKWAX) | | 1-20-1998 | | | 36.00 | | | | 2.62 | | | | -3.56 | | | | 44.31 | | | | 3.84 | | | | -2.99 | | | | 1.22 | | | | 1.09 | |
| | | | | | | | | | |
| Class C (EKWCX) | | 1-29-1998 | | | 42.24 | | | | 3.07 | | | | -3.71 | | | | 43.24 | | | | 3.07 | | | | -3.71 | | | | 1.97 | | | | 1.84 | |
| | | | | | | | | | |
| Administrator Class (EKWDX)4 | | 7-30-2010 | | | – | | | | – | | | | – | | | | 44.51 | | | | 3.99 | | | | -2.86 | | | | 1.14 | | | | 0.95 | |
| | | | | | | | | | |
| Institutional Class (EKWYX) | | 2-29-2000 | | | – | | | | – | | | | – | | | | 44.74 | | | | 4.14 | | | | -2.69 | | | | 0.89 | | | | 0.79 | |
| | | | | | | | | | |
| FTSE Gold Mines Index5 | | – | | | – | | | | – | | | | – | | | | 52.26 | | | | 7.23 | | | | -4.01 | | | | – | | | | – | |
| | | | | | | | | | |
| S&P 500 Index6 | | – | | | – | | | | – | | | | – | | | | 4.25 | | | | 10.84 | | | | 13.24 | | | | – | | | | – | |
Figures quoted represent past performance, which is no guarantee of future results, and do not reflect taxes that a shareholder may pay on fund distributions or the redemption of fund shares. Investment return and principal value of an investment will fluctuate so that an investor’s shares, when redeemed, may be worth more or less than their original cost. Performance shown without sales charges would be lower if sales charges were reflected. Current performance may be lower or higher than the performance data quoted, which assumes the reinvestment of dividends and capital gains. Currentmonth-end performance is available on the Fund’s website,wfam.com.
Please keep in mind that high double-digit returns were primarily achieved during favorable market conditions. You should not expect that such favorable returns can be consistently achieved. A fund’s performance, especially for short time periods, should not be the sole factor in making your investment decision.
While the S&P 500 Index is comprised of U.S. equity securities of companies diversified across ten sectors, the Fund’s holdings are concentrated primarily in precious metals related stocks. Therefore, the performance of the S&P 500 Index is displayed only to show how the concentrated Fund performed compared with a diversified selection of U.S. equity securities.
Index returns do not include transaction costs associated with buying and selling securities, any mutual fund fees or expenses, or any taxes. It is not possible to invest directly in an index.
For Class A shares, the maximumfront-end sales charge is 5.75%. For Class C shares, the maximum contingent deferred sales charge is 1.00%. Performance including a contingent deferred sales charge assumes the sales charge for the corresponding time period. Administrator Class and Institutional Class shares are sold without afront-end sales charge or contingent deferred sales charge.
Stock values fluctuate in response to the activities of individual companies and general market and economic conditions. Bond values fluctuate in response to the financial condition of individual issuers, general market and economic conditions, and changes in interest rates. Changes in market conditions and government policies may lead to periods of heightened volatility in the bond market and reduced liquidity for certain bonds held by the Fund. In general, when interest rates rise, bond values fall and investors may lose principal value. Interest rate changes and their impact on the Fund and its share price can be sudden and unpredictable. Funds that concentrate their investments in limited sectors, such as gold-related investments, are more vulnerable to adverse market, economic, regulatory, political, or other developments affecting those sectors. Certain investment strategies tend to increase the total risk of an investment (relative to the broader market). The Fund is exposed to foreign investment risk, geographic,non-diversification risk, smaller-company securities risk, and subsidiary risk. Consult the Fund’s prospectus for additional information on these and other risks.
Please see footnotes on page 5.
4 | Wells Fargo Precious Metals Fund
Performance highlights (unaudited)
| | | | |
|
| Ten largest holdings (%) as of September 30, 20197 | |
| | |
Barrick Gold Corporation | | | 8.29 | |
| | |
Newmont Goldcorp Corporation | | | 7.27 | |
| | |
Kirkland Lake Gold Limited | | | 6.17 | |
| | |
Royal Gold Incorporated | | | 5.90 | |
| | |
Newcrest Mining Limited | | | 5.80 | |
| | |
Kinross Gold Corporation | | | 4.54 | |
| | |
Agnico-Eagle Mines Limited | | | 4.35 | |
| | |
Wheaton Precious MetalsCorporation-U.S. Exchange Traded Shares | | | 4.13 | |
| | |
Franco-Nevada Corporation-Legend Shares | | | 3.73 | |
| | |
Agnico-Eagle MinesLimited-U.S. Exchange Traded Shares | | | 3.72 | |
|
|
| Country allocation as of September 30, 20198 |
|
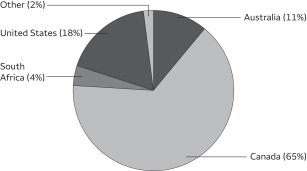 |
| ‡ | CFA® and Chartered Financial Analyst® are trademarks owned by CFA Institute. |
| 1 | Historical performance prior to July 19, 2010, is based on the performance of the Fund’s predecessor, Evergreen Precious Metals Fund. |
| 2 | Reflects the expense ratios as stated in the most recent prospectuses. The expense ratios shown are subject to change and may differ from the annualized expense ratios shown in the financial highlights of this report. |
| 3 | The manager has contractually committed through July 31, 2020, to waive fees and/or reimburse expenses to the extent necessary to cap the expenses of each class after fee waivers at the amounts shown. Brokerage commissions, stamp duty fees, interest, taxes, acquired fund fees and expenses (if any), and extraordinary expenses are excluded from the expense cap. Prior to or after the commitment expiration date, the cap may be increased or the commitment to maintain the cap may be terminated only with the approval of the Board of Trustees. Without this cap, the Fund’s returns would have been lower. The expense ratio paid by an investor is the net expense ratio (the total annual fund operating expenses after fee waivers) as stated in the prospectuses. |
| 4 | Historical performance shown for Administrator Class shares prior to their inception reflects the performance of Institutional Class shares and has been adjusted to reflect the higher expenses applicable to Administrator Class shares. |
| 5 | FTSE Gold Mines Index is an unmanaged, open-ended index designed to reflect the performance of the worldwide market in the shares of companies whose principal activity is the mining of gold. You cannot invest directly in an index. |
| 6 | The S&P 500 Index consists of 500 stocks chosen for market size, liquidity, and industry group representation. It is a market-value weighted index with each stock’s weight in the index proportionate to its market value. You cannot invest directly in an index. |
| 7 | The ten largest holdings, excluding cash, cash equivalents and any money market funds, are calculated based on the value of the investments divided by total net assets of the Fund. Holdings are subject to change and may have changed since the date specified. |
| 8 | Amounts are calculated based on the total long-term investments of the Fund. These amounts are subject to change and may have changed since the date specified. |
Wells Fargo Precious Metals Fund | 5
Fund expenses (unaudited)
As a shareholder of the Fund, you incur two types of costs: (1) transaction costs, including sales charges (loads) on purchase payments and contingent deferred sales charges (if any) on redemptions and (2) ongoing costs, including management fees, distribution(12b-1) and/or shareholder servicing fees, and other Fund expenses. This example is intended to help you understand your ongoing costs (in dollars) of investing in the Fund and to compare these costs with the ongoing costs of investing in other mutual funds.
The example is based on an investment of $1,000 invested at the beginning of thesix-month period and held for the entire period from April 1, 2019 to September 30, 2019.
Actual expenses
The “Actual” line of the table below provides information about actual account values and actual expenses. You may use the information in this line, together with the amount you invested, to estimate the expenses that you paid over the period. Simply divide your account value by $1,000 (for example, an $8,600 account value divided by $1,000 = 8.6), then multiply the result by the number in the “Actual” line under the heading entitled “Expenses paid during period” for your applicable class of shares to estimate the expenses you paid on your account during this period.
Hypothetical example for comparison purposes
The “Hypothetical” line of the table below provides information about hypothetical account values and hypothetical expenses based on the Fund’s actual expense ratio and an assumed rate of return of 5% per year before expenses, which is not the Fund’s actual return. The hypothetical account values and expenses may not be used to estimate the actual ending account balance or expenses you paid for the period. You may use this information to compare the ongoing costs of investing in the Fund and other funds. To do so, compare this 5% hypothetical example with the 5% hypothetical examples that appear in the shareholder reports of the other funds.
Please note that the expenses shown in the table are meant to highlight your ongoing costs only and do not reflect any transactional costs, such as sales charges (loads) and contingent deferred sales charges. Therefore, the “Hypothetical” line of the table is useful in comparing ongoing costs only and will not help you determine the relative total costs of owning different funds. In addition, if these transactional costs were included, your costs would have been higher.
| | | | | | | | | | | | | | | | |
| | | Beginning
account value
4-1-2019 | | | Ending
account value
9-30-2019 | | | Expenses
paid during
the period¹ | | | Annualized net expense ratio | |
| | | | | |
Class A | | | | | | | | | | | | | | | | |
| | | | |
Actual | | $ | 1,000.00 | | | $ | 1,188.86 | | | $ | 5.98 | | | | 1.09 | % |
| | | | |
Hypothetical (5% return before expenses) | | $ | 1,000.00 | | | $ | 1,019.60 | | | $ | 5.52 | | | | 1.09 | % |
| | | | | |
Class C | | | | | | | | | | | | | | | | |
| | | | |
Actual | | $ | 1,000.00 | | | $ | 1,184.07 | | | $ | 10.07 | | | | 1.84 | % |
| | | | |
Hypothetical (5% return before expenses) | | $ | 1,000.00 | | | $ | 1,015.84 | | | $ | 9.30 | | | | 1.84 | % |
| | | | | |
Administrator Class | | | | | | | | | | | | | | | | |
| | | | |
Actual | | $ | 1,000.00 | | | $ | 1,189.27 | | | $ | 5.21 | | | | 0.95 | % |
| | | | |
Hypothetical (5% return before expenses) | | $ | 1,000.00 | | | $ | 1,020.31 | | | $ | 4.81 | | | | 0.95 | % |
| | | | | |
Institutional Class | | | | | | | | | | | | | | | | |
| | | | |
Actual | | $ | 1,000.00 | | | $ | 1,190.34 | | | $ | 4.34 | | | | 0.79 | % |
| | | | |
Hypothetical (5% return before expenses) | | $ | 1,000.00 | | | $ | 1,021.11 | | | $ | 4.00 | | | | 0.79 | % |
| 1 | Expenses paid is equal to the annualized net expense ratio of each class multiplied by the average account value over the period, multiplied by the number of days in the most recent fiscal half-year divided by the number of days in the fiscal year (to reflect theone-half-year period). |
6 | Wells Fargo Precious Metals Fund
Consolidated portfolio of investments—September 30, 2019 (unaudited)
| | | | | | | | | | | | | | | | |
| | | | | | | | | Shares | | | Value | |
| Common Stocks: 95.32% | | | | | | | | | | | | | | | | |
| | | | |
Australia: 11.09% | | | | | | | | | | | | | | | | |
Evolution Mining Limited (Materials, Metals & Mining) | | | | | | | | | | | 2,500,000 | | | $ | 7,643,810 | |
Newcrest Mining Limited (Materials, Metals & Mining) | | | | | | | | | | | 802,294 | | | | 18,817,418 | |
Northern Star Resources Limited (Materials, Metals & Mining) | | | | | | | | | | | 1,275,000 | | | | 9,500,598 | |
| | | | |
| | | | | | | | | | | | | | | 35,961,826 | |
| | | | | | | | | | | | | | | | |
| | | | |
| Canada: 64.39% | | | | | | | | | | | | |
Agnico-Eagle Mines Limited (Materials, Metals & Mining) | | | | | | | | | | | 263,164 | | | | 14,108,219 | |
Agnico-Eagle Mines Limited-Legend Shares (Materials, Metals & Mining) | | | | | | | | | | | 35,000 | | | | 1,876,350 | |
Agnico-Eagle MinesLimited-U.S. Exchange Traded Shares (Materials, Metals & Mining) | | | | | | | | | | | 225,370 | | | | 12,077,797 | |
Alamos Gold Incorporated Class A (Materials, Metals & Mining) | | | | | | | | | | | 863,980 | | | | 5,021,433 | |
B2Gold Corporation (Materials, Metals & Mining) † | | | | | | | | | | | 2,850,000 | | | | 9,271,616 | |
Barrick Gold Corporation (Materials, Metals & Mining) | | | | | | | | | | | 1,551,723 | | | | 26,891,360 | |
Centerra Gold Incorporated-Legend Shares (Materials, Metals & Mining) 144A | | | | | | | | | | | 250,000 | | | | 2,124,769 | |
Continental Gold Incorporated (Materials, Metals & Mining) † | | | | | | | | | | | 1,300,000 | | | | 3,610,975 | |
Detour Gold Corporation (Materials, Metals & Mining) † | | | | | | | | | | | 271,057 | | | | 3,979,363 | |
Detour Gold Corporation-Legend Shares (Materials, Metals & Mining) 144A | | | | | | | | | | | 525,000 | | | | 7,707,476 | |
Detour Gold Corporation-Legend Shares (Materials, Metals & Mining) | | | | | | | | | | | 90,000 | | | | 1,321,282 | |
Endeavour Mining Corporation (Materials, Metals & Mining) † | | | | | | | | | | | 450,000 | | | | 8,600,219 | |
Franco-Nevada Corporation-Legend Shares (Materials, Metals & Mining) 144A | | | | | | | | | | | 132,948 | | | | 12,114,188 | |
IAMGOLD Corporation (Materials, Metals & Mining) † | | | | | | | | | | | 1,455,000 | | | | 4,964,034 | |
Kinross Gold Corporation (Materials, Metals & Mining) † | | | | | | | | | | | 3,200,553 | | | | 14,736,290 | |
Kirkland Lake Gold Limited (Materials, Metals & Mining) | | | | | | | | | | | 447,000 | | | | 20,024,493 | |
Lundin Gold Inc Common Stock (Materials, Metals & Mining) † | | | | | | | | | | | 150,000 | | | | 866,136 | |
MAG Silver Corporation (Materials, Metals & Mining) † | | | | | | | | | | | 590,000 | | | | 6,270,295 | |
MAG Silver Corporation-Legend Shares (Materials, Metals & Mining) | | | | | | | | | | | 100,000 | | | | 1,062,762 | |
OceanaGold Corporation (Materials, Metals & Mining) | | | | | | | | | | | 1,800,000 | | | | 4,700,910 | |
Osisko Gold Royalties Limited (Materials, Metals & Mining) | | | | | | | | | | | 246,700 | | | | 2,292,242 | |
Pan American Silver Corporation (Materials, Metals & Mining) | | | | | | | | | | | 250,000 | | | | 3,920,000 | |
Pretium Resources Incorporated (Materials, Metals & Mining) † | | | | | | | | | | | 375,000 | | | | 4,322,187 | |
SEMAFO Incorporated (Materials, Metals & Mining) † | | | | | | | | | | | 2,060,400 | | | | 6,609,578 | |
SSR Mining Incorporated (Materials, Metals & Mining) † | | | | | | | | | | | 525,000 | | | | 7,623,000 | |
Torex Gold Resources Incorporated (Materials, Metals & Mining) † | | | | | | | | | | | 280,000 | | | | 3,470,280 | |
Torex Gold Resources Incorporated-Legend Shares (Materials, Metals & Mining) 144A | | | | | | | | | | | 185,000 | | | | 2,292,863 | |
Torex Gold Resources Incorporated-Legend Shares (Materials, Metals & Mining) | | | | | | | | | | | 266,250 | | | | 3,299,864 | |
Wheaton Precious Metals Corporation (Materials, Metals & Mining) | | | | | | | | | | | 12,950 | | | | 339,573 | |
Wheaton Precious MetalsCorporation-U.S. Exchange Traded Shares (Materials, Metals & Mining) | | | | | | | | | | | 510,000 | | | | 13,382,400 | |
| | | | |
| | | | | | | | | | | | | | | 208,881,954 | |
| | | | | | | | | | | | | | | | |
| | | | |
| Peru: 0.59% | | | | | | | | | | | | |
Compania de Minas Buenaventura SA ADR (Materials, Metals & Mining) | | | | | | | | | | | 125,000 | | | | 1,897,500 | |
| | | | | | | | | | | | | | | | |
| | | | |
| South Africa: 3.51% | | | | | | | | | | | | |
AngloGold Ashanti Limited ADR (Materials, Metals & Mining) | | | | | | | | | | | 300,591 | | | | 5,491,798 | |
Gold Fields Limited ADR (Materials, Metals & Mining) | | | | | | | | | | | 1,200,000 | | | | 5,904,000 | |
| | | | |
| | | | | | | | | | | | | | | 11,395,798 | |
| | | | | | | | | | | | | | | | |
| | | | |
| United Kingdom: 1.04% | | | | | | | | | | | | |
Fresnillo plc (Materials, Metals & Mining) | | | | | | | | | | | 400,000 | | | | 3,362,080 | |
| | | | | | | | | | | | | | | | |
Wells Fargo Precious Metals Fund | 7
Consolidated portfolio of investments—September 30, 2019 (unaudited)
| | | | | | | | | | | | | | | | |
| | | | | | | | | Shares | | | Value | |
| United States: 14.70% | | | | | | | | | | | | |
Newmont Goldcorp Corporation (Materials, Metals & Mining) | | | | | | | | | | | 621,802 | | | $ | 23,578,732 | |
Newmont Goldcorp Corporation - Toronto Exchange Traded Shares (Materials, Metals & Mining) | | | | | | | | | | | 131,348 | | | | 4,967,004 | |
Royal Gold Incorporated (Materials, Metals & Mining) | | | | | | | | | | | 155,436 | | | | 19,151,270 | |
| | | | |
| | | | | | | | | | | | | | | 47,697,006 | |
| | | | | | | | | | | | | | | | |
| | | | |
Total Common Stocks (Cost $185,558,387) | | | | | | | | | | | | | | | 309,196,164 | |
| | | | | | | | | | | | | | | | |
| | | | |
| | | | | | | | | | | | | | | | |
| | | | | | | | | Troy ounces | | | | |
| Commodities: 3.49% | | | | | | | | | | | | |
Gold Bullion †** | | | | | | | | | | | 4,248 | | | | 11,331,644 | |
| | | | | | | | | | | | | | | | |
| | | | |
Total Commodities (Cost $5,013,415) | | | | | | | | | | | | | | | 11,331,644 | |
| | | | | | | | | | | | | | | | |
| | | | |
| | | | | | | | | | | | | | | | |
| | | Yield | | | | | | Shares | | | | |
| Short-Term Investments: 1.09% | | | | | | | | | | | | |
| | | | |
| Investment Companies: 1.09% | | | | | | | | | | | | |
Wells Fargo Government Money Market Fund Select Class (l)(u) | | | 1.88 | % | | | | | | | 3,517,474 | | | | 3,517,474 | |
| | | | | | | | | | | | | | | | |
| | | | |
Total Short-Term Investments (Cost $3,517,474) | | | | | | | | | | | | | | | 3,517,474 | |
| | | | | | | | | | | | | | | | |
| | | | | | | | |
| Total investments (Cost $194,089,276) | | | 99.90 | % | | | 324,045,282 | |
| | |
Other assets and liabilities, net | | | 0.10 | | | | 333,033 | |
| | | | | | | | |
| Total net assets | | | 100.00 | % | | $ | 324,378,315 | |
| | | | | | | | |
| † | Non-income-earning security |
| 144A | The security may be resold in transactions exempt from registration, normally to qualified institutional buyers, pursuant to Rule 144A under the Securities Act of 1933. |
| ** | Represents an investment held in Special Investments (Cayman) SPC, the consolidated entity. |
| (l) | The issuer of the security is an affiliated person of the Fund as defined in the Investment Company Act of 1940. |
| (u) | The rate represents the7-day annualized yield at period end. |
Investments in Affiliates
An affiliated investment is an investment in which the Fund owns at least 5% of the outstanding voting shares of the issuer or as a result of other relationships, such as the Fund and the issuer having the same investment manager. Transactions with issuers that were either affiliated persons of the Fund at the beginning of the period or the end of the period were as follows:
| | | | | | | | | | | | | | | | | | | | | | | | | | | | | | | | | | | | |
| | | Shares,
beginning of
period | | | Shares
purchased | | | Shares
sold | | | Shares,
end of
period | | | Net
realized
gains
(losses) | | | Net
change in
unrealized
gains
(losses) | | | Income
from
affiliated
securities | | | Value,
end of
period | | | % of
net
assets | |
| Short-Term Investments | | | | | | | | | | | | | | | | | | | | | | | | | | | |
Investment Companies | | | | | | | | | | | | | | | | | | | | | | | | | | | | | | | | | | | | |
Wells Fargo Government Money Market Fund Select Class | | | 3,331,397 | | | | 45,138,970 | | | | 44,952,893 | | | | 3,517,474 | | | $ | 0 | | | $ | 0 | | | $ | 44,188 | | | $ | 3,517,474 | | | | 1.09 | % |
The accompanying notes are an integral part of these financial statements.
8 | Wells Fargo Precious Metals Fund
Consolidated statement of assets and liabilities—September 30, 2019 (unaudited)
| | | | |
| | | | |
| |
Assets | | | | |
Investments in unaffiliated securities, at value (cost $185,558,387) | | $ | 309,196,164 | |
Investments in commodities, at value (cost $5,013,415) | | | 11,331,644 | |
Investments in affiliated securities, at value (cost $3,517,474) | | | 3,517,474 | |
Cash | | | 146,562 | |
Foreign currency, at value (cost $578,658) | | | 578,798 | |
Receivable for investments sold | | | 928,127 | |
Receivable for Fund shares sold | | | 581,020 | |
Receivable for dividends | | | 32,572 | |
Prepaid expenses and other assets | | | 62,197 | |
| | | | |
Total assets | | | 326,374,558 | |
| | | | |
| |
Liabilities | | | | |
Payable for Fund shares redeemed | | | 1,203,066 | |
Payable for investments purchased | | | 307,464 | |
Management fee payable | | | 158,437 | |
Administration fees payable | | | 50,945 | |
Distribution fee payable | | | 10,514 | |
Trustees’ fees and expenses payable | | | 2,588 | |
Accrued expenses and other liabilities | | | 263,229 | |
| | | | |
Total liabilities | | | 1,996,243 | |
| | | | |
Total net assets | | $ | 324,378,315 | |
| | | | |
| |
Net assets consist of | | | | |
Paid-in capital | | $ | 386,025,455 | |
Total distributable loss | | | (61,647,140 | ) |
| | | | |
Total net assets | | $ | 324,378,315 | |
| | | | |
| |
Computation of net asset value and offering price per share | | | | |
Net assets – Class A | | $ | 178,831,983 | |
Shares outstanding – Class A1 | | | 4,432,449 | |
Net asset value per share – Class A | | | $40.35 | |
Maximum offering price per share – Class A2 | | | $42.81 | |
Net assets – Class C | | $ | 15,891,677 | |
Shares outstanding – Class C1 | | | 449,185 | |
Net asset value per share – Class C | | | $35.38 | |
Net assets – Administrator Class | | $ | 9,640,672 | |
Shares outstanding – Administrator Class1 | | | 236,399 | |
Net asset value per share – Administrator Class | | | $40.78 | |
Net assets – Institutional Class | | $ | 120,013,983 | |
Shares outstanding – Institutional Class1 | | | 2,916,607 | |
Net asset value per share – Institutional Class | | | $41.15 | |
| 1 | The Fund has an unlimited number of authorized shares. |
| 2 | Maximum offering price is computed as 100/94.25 of net asset value. On investments of $50,000 or more, the offering price is reduced. |
The accompanying notes are an integral part of these financial statements.
Wells Fargo Precious Metals Fund | 9
Consolidated statement of operations—six months ended September 30, 2019 (unaudited)
| | | | |
| | | | |
| |
Investment income | | | | |
Dividends (net of foreign withholding taxes of $93,875) | | $ | 1,695,992 | |
Income from affiliated securities | | | 44,188 | |
| | | | |
Total investment income | | | 1,740,180 | |
| | | | |
| |
Expenses | | | | |
Management fee | | | 988,637 | |
Administration fees | | | | |
Class A | | | 183,126 | |
Class C | | | 16,276 | |
Administrator Class | | | 5,744 | |
Institutional Class | | | 68,544 | |
Shareholder servicing fees | | | | |
Class A | | | 218,007 | |
Class C | | | 19,376 | |
Administrator Class | | | 11,046 | |
Distribution fee | | | | |
Class C | | | 58,091 | |
Custody and accounting fees | | | 21,601 | |
Professional fees | | | 29,403 | |
Registration fees | | | 37,831 | |
Shareholder report expenses | | | 33,168 | |
Trustees’ fees and expenses | | | 10,325 | |
Transfer agent fees | | | 4,983 | |
Other fees and expenses | | | 10,073 | |
| | | | |
Total expenses | | | 1,716,231 | |
Less: Fee waivers and/or expense reimbursements | | | | |
Fund-level | | | (164,797 | ) |
Administrator Class | | | (150 | ) |
| | | | |
Net expenses | | | 1,551,284 | |
| | | | |
Net investment income | | | 188,896 | |
| | | | |
| |
Realized and unrealized gains (losses) on investments | | | | |
Net realized gains on | | | | |
Unaffiliated securities | | | 4,823,327 | |
Commodities | | | 1,815,729 | |
| | | | |
Net realized gains on investments | | | 6,639,056 | |
| | | | |
| |
Net change in unrealized gains (losses) on | | | | |
Unaffiliated securities | | | 43,078,216 | |
Commodities | | | (432,296 | ) |
| | | | |
Net change in unrealized gains (losses) on investments | | | 42,645,920 | |
| | | | |
Net realized and unrealized gains (losses) on investments | | | 49,284,976 | |
| | | | |
Net increase in net assets resulting from operations | | $ | 49,473,872 | |
| | | | |
The accompanying notes are an integral part of these financial statements.
10 | Wells Fargo Precious Metals Fund
Consolidated statement of changes in net assets
| | | | | | | | | | | | | | | | |
| | | Six months ended
September 30, 2019
(unaudited) | | | Year ended
March 31, 2019 | |
| | | |
Operations | | | | | | | | | | | | |
Net investment income (loss) | | | | | | $ | 188,896 | | | | | | | $ | (214,605 | ) |
Net realized gains (losses) on investments | | | | | | | 6,639,056 | | | | | | | | (7,313,853 | ) |
Net change in unrealized gains (losses) on investments | | | | | | | 42,645,920 | | | | | | | | 14,726,301 | |
| | | | |
Net increase in net assets resulting from operations | | | | | | | 49,473,872 | | | | | | | | 7,197,843 | |
| | | | |
| | | | |
Capital share transactions | | | Shares | | | | | | | | Shares | | | | | |
Proceeds from shares sold | |
Class A | | | 631,700 | | | | 25,249,203 | | | | 1,198,292 | | | | 37,973,472 | |
Class C | | | 32,689 | | | | 1,163,882 | | | | 42,566 | | | | 1,175,460 | |
Administrator Class | | | 15,741 | | | | 639,442 | | | | 22,524 | | | | 739,042 | |
Institutional Class | | | 833,705 | | | | 33,800,075 | | | | 1,646,466 | | | | 53,786,635 | |
| | | | |
| | | | | | | 60,852,602 | | | | | | | | 93,674,609 | |
| | | | |
Payment for shares redeemed | |
Class A | | | (997,142 | ) | | | (38,405,638 | ) | | | (1,822,759 | ) | | | (56,867,045 | ) |
Class C | | | (82,485 | ) | | | (2,725,538 | ) | | | (678,903 | ) | | | (19,431,951 | ) |
Administrator Class | | | (15,174 | ) | | | (572,126 | ) | | | (63,191 | ) | | | (2,054,168 | ) |
Institutional Class | | | (677,844 | ) | | | (25,529,286 | ) | | | (1,367,558 | ) | | | (43,913,813 | ) |
| | | | |
| | | | | | | (67,232,588 | ) | | | | | | | (122,266,977 | ) |
| | | | |
Net decrease in net assets resulting from capital share transactions | | | | | | | (6,379,986 | ) | | | | | | | (28,592,368 | ) |
| | | | |
Total increase (decrease) in net assets | | | | | | | 43,093,886 | | | | | | | | (21,394,525 | ) |
| | | | |
| | |
Net assets | | | | | | | | |
Beginning of period | | | | | | | 281,284,429 | | | | | | | | 302,678,954 | |
| | | | |
End of period | | | | | | $ | 324,378,315 | | | | | | | $ | 281,284,429 | |
| | | | |
The accompanying notes are an integral part of these financial statements.
Wells Fargo Precious Metals Fund | 11
Consolidated financial highlights
(For a share outstanding throughout each period)
| | | | | | | | | | | | | | | | | | | | | | | | |
| | | Six months ended
September 30, 2019
(unaudited) | | | Year ended March 31 | |
| CLASS A | | 2019 | | | 2018 | | | 2017 | | | 2016 | | | 2015 | |
Net asset value, beginning of period | | | $33.94 | | | | $32.80 | | | | $35.99 | | | | $32.73 | | | | $28.99 | | | | $36.65 | |
Net investment income (loss) | | | 0.01 | 1 | | | (0.03 | )1 | | | (0.11 | )1 | | | (0.22 | )1 | | | (0.05 | ) | | | (0.11 | )1 |
Net realized and unrealized gains (losses) on investments | | | 6.40 | | | | 1.17 | | | | (2.60 | ) | | | 3.85 | | | | 3.79 | | | | (7.55 | ) |
| | | | | | | | | | | | | | | | | | | | | | | | |
Total from investment operations | | | 6.41 | | | | 1.14 | | | | (2.71 | ) | | | 3.63 | | | | 3.74 | | | | (7.66 | ) |
Distributions to shareholders from net investment income | | | 0.00 | | | | 0.00 | | | | (0.48 | ) | | | (0.37 | ) | | | 0.00 | | | | 0.00 | |
Net asset value, end of period | | | $40.35 | | | | $33.94 | | | | $32.80 | | | | $35.99 | | | | $32.73 | | | | $28.99 | |
Total return2 | | | 18.89 | % | | | 3.48 | % | | | (7.56 | )% | | | 11.24 | % | | | 12.90 | % | | | (20.90 | )% |
Ratios to average net assets (annualized) | | | | | | | | | | | | | | | | | | | | | | | | |
Gross expenses | | | 1.21 | % | | | 1.22 | % | | | 1.21 | % | | | 1.20 | % | | | 1.23 | % | | | 1.23 | % |
Net expenses | | | 1.09 | % | | | 1.09 | % | | | 1.04 | % | | | 1.09 | % | | | 1.10 | % | | | 1.10 | % |
Net investment income (loss) | | | 0.05 | % | | | (0.11 | )% | | | (0.32 | )% | | | (0.57 | )% | | | (0.24 | )% | | | (0.30 | )% |
Supplemental data | | | | | | | | | | | | | | | | | | | | | | | | |
Portfolio turnover rate3 | | | 9 | % | | | 19 | % | | | 27 | % | | | 21 | % | | | 18 | % | | | 9 | % |
Net assets, end of period (000s omitted) | | | $178,832 | | | | $162,860 | | | | $177,859 | | | | $242,423 | | | | $236,310 | | | | $211,477 | |
| 1 | Calculated based upon average shares outstanding |
| 2 | Total return calculations do not include any sales charges. Returns for periods of less than one year are not annualized. |
| 3 | Portfolio turnover rate includes the purchases and sales transactions of its wholly-owned subsidiary. |
The accompanying notes are an integral part of these financial statements.
12 | Wells Fargo Precious Metals Fund
Consolidated financial highlights
(For a share outstanding throughout each period)
| | | | | | | | | | | | | | | | | | | | | | | | |
| | | Six months ended
September 30, 2019
(unaudited) | | | Year ended March 31 | |
| CLASS C | | 2019 | | | 2018 | | | 2017 | | | 2016 | | | 2015 | |
Net asset value, beginning of period | | | $29.88 | | | | $29.09 | | | | $32.07 | | | | $29.10 | | | | $25.97 | | | | $33.08 | |
Net investment loss | | | (0.11 | )1 | | | (0.24 | )1 | | | (0.33 | )1 | | | (0.46 | )1 | | | (0.24 | )1 | | | (0.35 | )1 |
Net realized and unrealized gains (losses) on investments | | | 5.61 | | | | 1.03 | | | | (2.30 | ) | | | 3.49 | | | | 3.37 | | | | (6.76 | ) |
| | | | | | | | | | | | | | | | | | | | | | | | |
Total from investment operations | | | 5.50 | | | | 0.79 | | | | (2.63 | ) | | | 3.03 | | | | 3.13 | | | | (7.11 | ) |
Distributions to shareholders from net investment income | | | 0.00 | | | | 0.00 | | | | (0.35 | ) | | | (0.06 | ) | | | 0.00 | | | | 0.00 | |
Net asset value, end of period | | | $35.38 | | | | $29.88 | | | | $29.09 | | | | $32.07 | | | | $29.10 | | | | $25.97 | |
Total return2 | | | 18.41 | % | | | 2.72 | % | | | (8.24 | )% | | | 10.42 | % | | | 12.05 | % | | | (21.49 | )% |
Ratios to average net assets (annualized) | | | | | | | | | | | | | | | | | | | | | | | | |
Gross expenses | | | 1.96 | % | | | 1.97 | % | | | 1.96 | % | | | 1.95 | % | | | 1.99 | % | | | 1.98 | % |
Net expenses | | | 1.84 | % | | | 1.84 | % | | | 1.79 | % | | | 1.84 | % | | | 1.85 | % | | | 1.85 | % |
Net investment loss | | | (0.69 | )% | | | (0.88 | )% | | | (1.07 | )% | | | (1.32 | )% | | | (0.99 | )% | | | (1.06 | )% |
Supplemental data | | | | | | | | | | | | | | | | | | | | | | | | |
Portfolio turnover rate3 | | | 9 | % | | | 19 | % | | | 27 | % | | | 21 | % | | | 18 | % | | | 9 | % |
Net assets, end of period (000s omitted) | | | $15,892 | | | | $14,908 | | | | $33,022 | | | | $48,710 | | | | $52,648 | | | | $59,074 | |
| 1 | Calculated based upon average shares outstanding |
| 2 | Total return calculations do not include any sales charges. Returns for periods of less than one year are not annualized. |
| 3 | Portfolio turnover rate includes the purchases and sales transactions of its wholly-owned subsidiary. |
The accompanying notes are an integral part of these financial statements.
Wells Fargo Precious Metals Fund | 13
Consolidated financial highlights
(For a share outstanding throughout each period)
| | | | | | | | | | | | | | | | | | | | | | | | |
| | | Six months ended
September 30, 2019
(unaudited) | | | Year ended March 31 | |
| ADMINISTRATOR CLASS | | 2019 | | | 2018 | | | 2017 | | | 2016 | | | 2015 | |
Net asset value, beginning of period | | | $34.29 | | | | $33.09 | | | | $36.27 | | | | $32.98 | | | | $29.17 | | | | $36.82 | |
Net investment income (loss) | | | 0.04 | 1 | | | 0.01 | 1 | | | (0.09 | )1 | | | (0.17 | )1 | | | (0.03 | )1 | | | (0.06 | )1 |
Net realized and unrealized gains (losses) on investments | | | 6.45 | | | | 1.19 | | | | (2.59 | ) | | | 3.87 | | | | 3.84 | | | | (7.59 | ) |
| | | | | | | | | | | | | | | | | | | | | | | | |
Total from investment operations | | | 6.49 | | | | 1.20 | | | | (2.68 | ) | | | 3.70 | | | | 3.81 | | | | (7.65 | ) |
Distributions to shareholders from net investment income | | | 0.00 | | | | 0.00 | | | | (0.50 | ) | | | (0.41 | ) | | | 0.00 | | | | 0.00 | |
Net asset value, end of period | | | $40.78 | | | | $34.29 | | | | $33.09 | | | | $36.27 | | | | $32.98 | | | | $29.17 | |
Total return2 | | | 18.93 | % | | | 3.63 | % | | | (7.40 | )% | | | 11.37 | % | | | 13.06 | % | | | (20.78 | )% |
Ratios to average net assets (annualized) | | | | | | | | | | | | | | | | | | | | | | | | |
Gross expenses | | | 1.13 | % | | | 1.14 | % | | | 1.15 | % | | | 1.12 | % | | | 1.13 | % | | | 1.07 | % |
Net expenses | | | 0.95 | % | | | 0.95 | % | | | 0.91 | % | | | 0.95 | % | | | 0.96 | % | | | 0.96 | % |
Net investment income (loss) | | | 0.19 | % | | | 0.04 | % | | | (0.25 | )% | | | (0.43 | )% | | | (0.10 | )% | | | (0.17 | )% |
Supplemental data | | | | | | | | | | | | | | | | | | | | | | | | |
Portfolio turnover rate3 | | | 9 | % | | | 19 | % | | | 27 | % | | | 21 | % | | | 18 | % | | | 9 | % |
Net assets, end of period (000s omitted) | | | $9,641 | | | | $8,086 | | | | $9,148 | | | | $15,325 | | | | $16,114 | | | | $21,917 | |
| 1 | Calculated based upon average shares outstanding |
| 2 | Returns for periods of less than one year are not annualized. |
| 3 | Portfolio turnover rate includes the purchases and sales transactions of its wholly-owned subsidiary. |
The accompanying notes are an integral part of these financial statements.
14 | Wells Fargo Precious Metals Fund
Consolidated financial highlights
(For a share outstanding throughout each period)
| | | | | | | | | | | | | | | | | | | | | | | | |
| | | Six months ended
September 30, 2019
(unaudited) | | | Year ended March 31 | |
| INSTITUTIONAL CLASS | | 2019 | | | 2018 | | | 2017 | | | 2016 | | | 2015 | |
Net asset value, beginning of period | | | $34.57 | | | | $33.30 | | | | $36.47 | | | | $33.21 | | | | $29.33 | | | | $36.96 | |
Net investment income (loss) | | | 0.07 | 1 | | | 0.04 | | | | 0.02 | | | | (0.09 | )1 | | | 0.02 | 1 | | | 0.01 | 1 |
Net realized and unrealized gains (losses) on investments | | | 6.51 | | | | 1.23 | | | | (2.67 | ) | | | 3.85 | | | | 3.86 | | | | (7.64 | ) |
| | | | | | | | | | | | | | | | | | | | | | | | |
Total from investment operations | | | 6.58 | | | | 1.27 | | | | (2.65 | ) | | | 3.76 | | | | 3.88 | | | | (7.63 | ) |
Distributions to shareholder from net investment income | | | 0.00 | | | | 0.00 | | | | (0.52 | ) | | | (0.50 | ) | | | 0.00 | | | | 0.00 | |
Net asset value, end of period | | | $41.15 | | | | $34.57 | | | | $33.30 | | | | $36.47 | | | | $33.21 | | | | $29.33 | |
Total return2 | | | 19.03 | % | | | 3.81 | % | | | (7.27 | )% | | | 11.49 | % | | | 14.05 | % | | | (20.64 | )% |
Ratios to average net assets (annualized) | | | | | | | | | | | | | | | | | | | | | | | | |
Gross expenses | | | 0.88 | % | | | 0.89 | % | | | 0.88 | % | | | 0.88 | % | | | 0.88 | % | | | 0.80 | % |
Net expenses | | | 0.79 | % | | | 0.79 | % | | | 0.73 | % | | | 0.79 | % | | | 0.80 | % | | | 0.79 | % |
Net investment income (loss) | | | 0.35 | % | | | 0.21 | % | | | 0.01 | % | | | (0.24 | )% | | | 0.06 | % | | | 0.03 | % |
Supplemental data | | | | | | | | | | | | | | | | | | | | | | | | |
Portfolio turnover rate3 | | | 9 | % | | | 19 | % | | | 27 | % | | | 21 | % | | | 18 | % | | | 9 | % |
Net assets, end of period (000s omitted) | | | $120,014 | | | | $95,431 | | | | $82,650 | | | | $89,680 | | | | $60,601 | | | | $43,014 | |
| 1 | Calculated based upon average shares outstanding |
| 2 | Returns for periods of less than one year are not annualized. |
| 3 | Portfolio turnover rate includes the purchases and sales transactions of its wholly-owned subsidiary. |
The accompanying notes are an integral part of these financial statements.
Wells Fargo Precious Metals Fund | 15
Notes to consolidated financial statements (unaudited)
1. ORGANIZATION
Wells Fargo Funds Trust (the “Trust”), a Delaware statutory trust organized on March 10, 1999, is anopen-end management investment company registered under the Investment Company Act of 1940, as amended (the “1940 Act”). As an investment company, the Trust follows the accounting and reporting guidance in Financial Accounting Standards Board(“FASB”)Accounting Standards Codification Topic 946, Financial Services – Investment Companies. These financial statements report on the Wells Fargo Precious Metals Fund (the “Fund”) which is anon-diversified series of the Trust.
2. INVESTMENT IN SUBSIDIARY
The Fund invests in precious metals and minerals through Special Investments (Cayman) SPC (the “Subsidiary”), a wholly-owned subsidiary incorporated on May 3, 2005 under the laws of the Cayman Islands as an exempted segregated portfolio company with limited liability. As of September 30, 2019, the Subsidiary held $11,331,644 in gold bullion representing 100.37% of its net assets. The Fund is the sole shareholder of the Subsidiary. As of September 30, 2019, the Fund held $11,289,700 in the Subsidiary, representing 3.48% of the Fund’s net assets prior to consolidation.
The consolidated financial statements of the Fund include the financial results of the Subsidiary. The Consolidated Portfolio of Investments includes positions of the Fund and the Subsidiary and the consolidated financial statements include the accounts of the Fund and the Subsidiary. Accordingly, all interfund balances and transactions between the Fund and the Subsidiary have been eliminated in consolidation.
3. SIGNIFICANT ACCOUNTING POLICIES
The following significant accounting policies, which are consistently followed in the preparation of the financial statements of the Fund, are in conformity with U.S. generally accepted accounting principles which require management to make estimates and assumptions that affect the reported amounts of assets and liabilities, disclosure of contingent assets and liabilities at the date of the financial statements, and the reported amounts of revenues and expenses during the reporting period. Actual results could differ from those estimates.
Securities valuation
All investments are valued each business day as of the close of regular trading on the New York Stock Exchange (generally 4 p.m. Eastern Time), although the Fund may deviate from this calculation time under unusual or unexpected circumstances.
Equity securities that are listed on a foreign or domestic exchange or market are valued at the official closing price or, if none, the last sales price. If no sale occurs on the principal exchange or market that day, a fair value price will be determined in accordance with the Fund’s Valuation Procedures.
Investments in commodities are valued at their last traded price.
The values of securities denominated in foreign currencies are translated into U.S. dollars at rates provided by an independent foreign currency pricing source at a time each business day specified by the Wells Fargo Asset Management Pricing Committee at Wells Fargo Funds Management, LLC (“Funds Management”)
Many securities markets and exchanges outside the U.S. close prior to the close of the New York Stock Exchange and therefore may not fully reflect trading or events that occur after the close of the principal exchange in which the foreign securities are traded, but before the close of the New York Stock Exchange. If such trading or events are expected to materially affect the value of such securities, then fair value pricing procedures approved by the Board of Trustees of the Fund are applied. These procedures take into account multiple factors including movements in U.S. securities markets after foreign exchanges close. Foreign securities that are fair valued under these procedures are categorized as Level 2 and the application of these procedures may result in transfers between Level 1 and Level 2. Depending on market activity, such fair valuations may be frequent. Such fair value pricing may result in net asset values that are higher or lower than net asset values based on the last reported sales price or latest quoted bid price. On September 30, 2019, such fair value pricing was not used in pricing foreign securities.
Investments in registeredopen-end investment companies are valued at net asset value.
Investments which are not valued using any of the methods discussed above are valued at their fair value, as determined in good faith by the Board of Trustees. The Board of Trustees has established a Valuation Committee comprised of the Trustees and has delegated to it the authority to take any actions regarding the valuation of portfolio securities that the Valuation Committee deems necessary or appropriate, including determining the fair value of portfolio securities, unless the determination has been delegated to the Wells Fargo Asset Management Pricing Committee.The Board of Trustees retains the authority to make or ratify any valuation decisions or approve any changes to the Valuation Procedures as it deems appropriate. On a quarterly basis, the Board of Trustees receives reports on any valuation actions taken by the Valuation Committee or the Wells Fargo Asset Management Pricing Committee which may include items for ratification.
16 | Wells Fargo Precious Metals Fund
Notes to consolidated financial statements (unaudited)
Foreign currency translation
The accounting records of the Fund are maintained in U.S. dollars. The values of other assets and liabilities denominated in foreign currencies are translated into U.S. dollars at rates provided by an independent foreign currency pricing source at a time each business day specified by the Wells Fargo Asset Management Pricing Committee. Purchases and sales of securities, and income and expenses are converted at the rate of exchange on the respective dates of such transactions. Net realized foreign exchange gains or losses arise from sales of foreign currencies, currency gains or losses realized between the trade and settlement dates on securities transactions, and the difference between the amounts of dividends, interest and foreign withholding taxes recorded and the U.S. dollar equivalent of the amounts actually paid or received. Net unrealized foreign exchange gains and losses arise from changes in the fair value of assets and liabilities other than investments in securities resulting from changes in exchange rates. The changes in net assets arising from changes in exchange rates of securities and the changes in net assets resulting from changes in market prices of securities are not separately presented. Such changes are included in net realized and unrealized gains or losses from investments.
Security transactions and income recognition
Securities transactions and commodities are recorded on a trade date basis. Realized gains or losses are recorded on the basis of identified cost.
Dividend income is recognized on theex-dividend date, except for certain dividends from foreign securities, which are recorded as soon as the custodian verifies theex-dividend date. Dividend income from foreign securities is recorded net of foreign taxes withheld where recovery of such taxes is not assured.
Distributions to shareholders
Distributions to shareholders from net investment income and any net realized gains are recorded on theex-dividend date and paid at least annually. Such distributions are determined in accordance with income tax regulations and may differ from U.S. generally accepted accounting principles. Dividend sources are estimated at the time of declaration. The tax character of distributions is determined as of the Fund’s fiscal year end. Therefore, a portion of the Fund’s distributions made prior to the Fund’s fiscal year end may be categorized as a tax return of capital at year end.
Federal and other taxes
The Fund intends to continue to qualify as a regulated investment company by distributing substantially all of its investment company taxable income and any net realized capital gains (after reduction for capital loss carryforwards) sufficient to relieve it from all, or substantially all, federal income taxes. Accordingly, no provision for federal income taxes was required.
The Subsidiary is classified as a controlled foreign corporation under Subchapter N of the Internal Revenue Code. Therefore, the Fund is required to increase its taxable income by its share of the Subsidiary’s income. Net investment losses of the Subsidiary cannot be deducted by the Fund in the current period nor carried forward to offset taxable income in future periods.
The Fund’s income and federal excise tax returns and all financial records supporting those returns for the prior three fiscal years are subject to examination by the federal and Delaware revenue authorities. Management has analyzed the Fund’s tax positions taken on federal, state, and foreign tax returns for all open tax years and does not believe that there are any uncertain tax positions that require recognition of a tax liability.
As of September 30, 2019, the aggregate cost of all investments for federal income tax purposes was $195,707,799 and the unrealized gains (losses) consisted of:
| | | | |
| |
Gross unrealized gains | | $ | 141,435,441 | |
| |
Gross unrealized losses | | | (13,097,958 | ) |
| |
Net unrealized gains | | $ | 128,337,483 | |
As of March 31, 2019, the Fund had capital loss carryforwards which consisted of $29,456,427 in short-term capital losses and $158,488,084 in long-term capital losses.
Class allocations
The separate classes of shares offered by the Fund differ principally in applicable sales charges, distribution, shareholder servicing, and administration fees. Class specific expenses are charged directly to that share class. Investment income, common fund-level expenses, and realized and unrealized gains (losses) on investments are allocated daily to each class of shares based on the relative proportion of net assets of each class.
4. FAIR VALUATION MEASUREMENTS
Fair value measurements of investments are determined within a framework that has established a fair value hierarchy based upon the various data inputs utilized in determining the value of the Fund’s investments. The three-level hierarchy gives the highest priority to unadjusted quoted prices in active markets for identical assets or liabilities (Level 1) and the lowest priority to
Wells Fargo Precious Metals Fund | 17
Notes to consolidated financial statements (unaudited)
unobservable inputs (Level 3). The Fund’s investments are classified within the fair value hierarchy based on the lowest level of input that is significant to the fair value measurement. The inputs are summarized into three broad levels as follows:
| ∎ | | Level 1 – quoted prices in active markets for identical securities |
| ∎ | | Level 2 – other significant observable inputs (including quoted prices for similar securities, interest rates, prepayment speeds, credit risk, etc.) |
| ∎ | | Level 3 – significant unobservable inputs (including the Fund’s own assumptions in determining the fair value of investments) |
The inputs or methodologies used for valuing investments in securities are not necessarily an indication of the risk associated with investing in those securities.
The following is a summary of the inputs used in valuing the Fund’s assets and liabilities as of September 30, 2019:
| | | | | | | | | | | | | | | | |
| | | | |
| | | Quoted prices
(Level 1) | | | Other significant
observable inputs
(Level 2) | | | Significant
unobservable inputs
(Level 3) | | | Total | |
| | | | |
Assets | | | | | | | | | | | | | | | | |
Investments in: | | | | | | | | | | | | | | | | |
| | | | |
Common stocks | | | | | | | | | | | | | | | | |
| | | | |
Australia | | $ | 35,961,826 | | | $ | 0 | | | $ | 0 | | | $ | 35,961,826 | |
| | | | |
Canada | | | 177,082,400 | | | | 31,799,554 | | | | 0 | | | | 208,881,954 | |
| | | | |
Peru | | | 1,897,500 | | | | 0 | | | | 0 | | | | 1,897,500 | |
| | | | |
South Africa | | | 11,395,798 | | | | 0 | | | | 0 | | | | 11,395,798 | |
| | | | |
United Kingdom | | | 3,362,080 | | | | 0 | | | | 0 | | | | 3,362,080 | |
| | | | |
United States | | | 47,697,006 | | | | 0 | | | | 0 | | | | 47,697,006 | |
| | | | |
Commodities | | | 11,331,644 | | | | 0 | | | | 0 | | | | 11,331,644 | |
| | | | |
Short-term investments | | | | | | | | | | | | | | | | |
| | | | |
Investment companies | | | 3,517,474 | | | | 0 | | | | 0 | | | | 3,517,474 | |
| | | | |
Total assets | | $ | 292,245,728 | | | $ | 31,799,554 | | | $ | 0 | | | $ | 324,045,282 | |
Additional sector, industry or geographic detail is included in the Portfolio of Investments.
For the six months ended September 30, 2019, the Fund did not have any transfers into/out of Level 3.
5. TRANSACTIONS WITH AFFILIATES
Management fee
Funds Management, an indirect wholly owned subsidiary of Wells Fargo & Company (“Wells Fargo”), is the manager of the Fund and provides advisory and fund-level administrative services under an investment management agreement. Under the investment management agreement, Funds Management is responsible for, among other services, implementing the investment objectives and strategies of the Fund, supervising the subadviser and providing fund-level administrative services in connection with the Fund’s operations. As compensation for its services under the investment management agreement, Funds Management is entitled to receive a management fee at the following annual rate based on the Fund’s average daily net assets:
| | | | |
| |
| Average daily net assets | | Management fee | |
| |
First $500 million | | | 0.650 | % |
| |
Next $500 million | | | 0.600 | |
| |
Next $1 billion | | | 0.550 | |
| |
Next $2 billion | | | 0.525 | |
| |
Next $1 billion | | | 0.500 | |
| |
Next $5 billion | | | 0.490 | |
| |
Over $10 billion | | | 0.480 | |
18 | Wells Fargo Precious Metals Fund
Notes to consolidated financial statements (unaudited)
For the six months ended September 30, 2019, the management fee was equivalent to an annual rate of 0.65% of the Fund’s average daily net assets.
The Subsidiary has entered into a separate advisory contract with Funds Management to manage the investment and reinvestment of its assets in conformity with its investment objectives and restrictions. Under this agreement, the Subsidiary does not pay Funds Management a fee for its services.
Funds Management has retained the services of a subadviser to provide daily portfolio management to the Fund. The fee for subadvisory services is borne by Funds Management. Wells Capital Management Incorporated, an affiliate of Funds Management and an indirect wholly owned subsidiary of Wells Fargo, is the subadviser to the Fund and is entitled to receive a fee from Funds Management at an annual rate starting at 0.40% and declining to 0.30% as the average daily net assets of the Fund increase.
Administration fees
Under a class-level administration agreement, Funds Management provides class-level administrative services to the Fund, which includes paying fees and expenses for services provided by the transfer agent,sub-transfer agents, omnibus account servicers and record-keepers. As compensation for its services under the class-level administration agreement, Funds Management receives an annual fee which is calculated based on the average daily net assets of each class as follows:
| | | | |
| |
| | | Class-level
administration fee | |
| |
Class A, Class C | | | 0.21 | % |
| |
Administrator Class, Institutional Class | | | 0.13 | |
Waivers and/or expense reimbursements
Funds Management has contractually waived and/or reimbursed management and administration fees to the extent necessary to maintain certain net operating expense ratios for the Fund. When each class of the Fund has exceeded its expense cap, Funds Management has waived fees and/or reimbursed expenses from fund-level expenses on a proportionate basis and then from class specific expenses. When only certain classes exceed their expense caps, waivers and/or reimbursements are applied against class specific expenses before fund-level expenses. Funds Management has committed through July 31, 2020 to waive fees and/or reimburse expenses to the extent necessary to cap the Fund’s expenses at 1.09% for Class A shares, 1.84% for Class C shares, 0.95% for Administrator Class shares, and 0.79% for Institutional Class shares. Prior to or after the commitment expiration date, the cap may be increased or the commitment to maintain the cap may be terminated only with the approval of the Board of Trustees.
Distribution fee
The Trust has adopted a distribution plan for Class C shares of the Fund pursuant to Rule12b-1 under the 1940 Act. A distribution fee is charged to Class C shares and paid to Wells Fargo Funds Distributor, LLC (“Funds Distributor”), the principal underwriter, at an annual rate of 0.75% of the average daily net assets of Class C shares.
In addition, Funds Distributor is entitled to receive thefront-end sales charge from the purchase of Class A shares and a contingent deferred sales charge on the redemption of certain Class A shares. Funds Distributor is also entitled to receive the contingent deferred sales charges from redemptions of Class C shares. For the six months ended September 30, 2019, Funds Distributor received $4,438 from the sale of Class A shares. No contingent deferred sales charges were incurred by Class A and Class C shares for the six months ended September 30, 2019.
Shareholder servicing fees
The Trust has entered into contracts with one or more shareholder servicing agents, whereby Class A, Class C, and Administrator Class of the Fund are charged a fee at an annual rate of 0.25% of the average daily net assets of each respective class. A portion of these total shareholder servicing fees were paid to affiliates of Wells Fargo.
Interfund transactions
The Fund may purchase or sell portfolio investment securities to certain other Wells Fargo affiliates pursuant to Rule17a-7 under the 1940 Act and under procedures adopted by the Board of Trustees. The procedures have been designed to ensure that these interfund transactions, which do not incur broker commissions, are effected at current market prices.
6. INVESTMENT PORTFOLIO TRANSACTIONS
Purchases and sales of investments, excluding U.S. government obligations (if any) and short-term securities, for the six months ended September 30, 2019 were $26,387,949 and $35,956,044, respectively. These amounts include purchases and sales transactions of the Subsidiary.
Wells Fargo Precious Metals Fund | 19
Notes to consolidated financial statements (unaudited)
7. BANK BORROWINGS
The Trust (excluding the money market funds), Wells Fargo Master Trust and Wells Fargo Variable Trust are parties to a $280,000,000 revolving credit agreement whereby the Fund is permitted to use bank borrowings for temporary or emergency purposes, such as to fund shareholder redemption requests. Interest under the credit agreement is charged to the Fund based on a borrowing rate equal to the higher of the Federal Funds rate in effect on that day plus 1.25% or the overnight LIBOR rate in effect on that day plus 1.25%. In addition, an annual commitment fee equal to 0.25% of the unused balance is allocated to each participating fund.
For the six months ended September 30, 2019, there were no borrowings by the Fund under the agreement.
8. CONCENTRATION RISK
The Fund invests a substantial portion of its assets in precious metals companies and, therefore, may be more affected by changes in the precious metals sector than a fund whose investments are not heavily weighted in any sector.
9. INDEMNIFICATION
Under the Trust’s organizational documents, the officers and Trustees have been granted certain indemnification rights against certain liabilities that may arise out of performance of their duties to the Trust. Additionally, in the normal course of business, the Trust may enter into contracts with service providers that contain a variety of indemnification clauses. The Trust’s maximum exposure under these arrangements is dependent on future claims that may be made against the Fund and, therefore, cannot be estimated.
10. NEW ACCOUNTING PRONOUNCEMENT
In August 2018, FASB issued Accounting Standards Update (“ASU”)No. 2018-13, Fair Value Measurement (Topic 820)Disclosure Framework—Changes to the Disclosure Requirements for Fair Value Measurement. ASU2018-13 updates the disclosure requirements for fair value measurements by modifying or removing certain disclosures and adding certain new disclosures. The amendments are effective for fiscal years, and interim periods within those fiscal years, beginning after December 15, 2019. Early adoption is permitted. Management has adopted the removal and modification of disclosures early, as permitted, and will adopt the additional new disclosures at the effective date.
20 | Wells Fargo Precious Metals Fund
Other information (unaudited)
TAX INFORMATION
Pursuant to Section 853 of the Internal Revenue Code, the following amounts have been designated as foreign taxes paid for the fiscal year ended March 31, 2019. These amounts may be less than the actual foreign taxes paid for financial statement purposes. Foreign taxes paid or withheld should be included in taxable income with an offsetting deduction from gross income or as a credit for taxes paid to foreign governments. None of the income was derived from ineligible foreign sources as defined under Section 901(j) of the Internal Revenue Code.
| | | | |
Creditable
foreign taxes
paid | | Per share
amount | | Foreign
income as % of
ordinary income
distributions |
| | |
$141,269 | | $0.0170 | | 100% |
PROXY VOTING INFORMATION
A description of the policies and procedures used to determine how to vote proxies relating to portfolio securities is available, upon request, by calling1-800-222-8222, visiting our website atwfam.com, or visiting the SEC website at sec.gov. Information regarding how the proxies related to portfolio securities were voted during the most recent12-month period ended June 30 is available on the website atwfam.comor by visiting the SEC website at sec.gov.
QUARTERLY PORTFOLIO HOLDINGS INFORMATION
The Fund files its complete schedule of portfolio holdings with the SEC for the first and third quarters of each fiscal year on Form N-Q or FormN-PORT, which is available by visiting the SEC website at sec.gov. Those forms may be reviewed and copied at the SEC’s Public Reference Room in Washington, DC. Information on the operation of the Public Reference Room may be obtained by calling1-800-SEC-0330.
Wells Fargo Precious Metals Fund | 21
Other information (unaudited)
BOARD OF TRUSTEES AND OFFICERS
Each of the Trustees and Officers1 listed in the table below acts in identical capacities for each fund in the Wells Fargo family of funds, which consists of 150 mutual funds comprising the Wells Fargo Funds Trust, Wells Fargo Variable Trust, Wells Fargo Master Trust and fourclosed-end funds (collectively the “Fund Complex”). This table should be read in conjunction with the Prospectus and the Statement of Additional Information2. The mailing address of each Trustee and Officer is 525 Market Street, 12th Floor, San Francisco, CA 94105. Each Trustee and Officer serves an indefinite term, however, each Trustee serves such term until reaching the mandatory retirement age established by the Trustees.
Independent Trustees
| | | | | | |
Name and
year of birth | | Position held and
length of service* | | Principal occupations during past five years or longer | | Current other
public company or
investment
company
directorships |
| | | |
William R. Ebsworth (Born 1957) | | Trustee, since 2015 | | Retired. From 1984 to 2013, equities analyst, portfolio manager, research director and chief investment officer at Fidelity Management and Research Company in Boston, Tokyo, and Hong Kong, and retired in 2013 as Chief Investment Officer of Fidelity Strategic Advisers, Inc. where he led a team of investment professionals managing client assets. Prior thereto, Board member of Hong Kong Securities Clearing Co., Hong Kong Options Clearing Corp., the Thailand International Fund, Ltd., Fidelity Investments Life Insurance Company, and Empire Fidelity Investments Life Insurance Company. Audit Committee Chair and Investment Committee Chair of the Vincent Memorial Hospital Endowment(non-profit organization). Mr. Ebsworth is a CFA® charterholder. | | N/A |
| | | |
Jane A. Freeman (Born 1953) | | Trustee, since 2015; Chair Liaison, since 2018 | | Retired. From 2012 to 2014 and 1999 to 2008, Chief Financial Officer of Scientific Learning Corporation. From 2008 to 2012, Ms. Freeman provided consulting services related to strategic business projects. Prior to 1999, Portfolio Manager at Rockefeller & Co. and Scudder, Stevens & Clark. Board member of the Harding Loevner Funds from 1996 to 2014, serving as both Lead Independent Director and chair of the Audit Committee. Board member of the Russell Exchange Traded Funds Trust from 2011 to 2012 and the chair of the Audit Committee. Ms. Freeman is a Board Member of The Ruth Bancroft Garden(non-profit organization). She is also an inactive Chartered Financial Analyst. | | N/A |
| | | |
Isaiah Harris, Jr. (Born 1952) | | Trustee, since 2009; Audit Committee Chairman, since 2019 | | Retired. Chairman of the Board of CIGNA Corporation since 2009, and Director since 2005. From 2003 to 2011, Director of Deluxe Corporation. Prior thereto, President and CEO of BellSouth Advertising and Publishing Corp. from 2005 to 2007, President and CEO of BellSouth Enterprises from 2004 to 2005 and President of BellSouth Consumer Services from 2000 to 2003. Emeritus member of the Iowa State University Foundation Board of Governors. Emeritus Member of the Advisory Board of Iowa State University School of Business. Advisory Board Member, Palm Harbor Academy (private school). Advisory Board Member, Child Evangelism Fellowship(non-profit). Mr. Harris is a certified public accountant (inactive status). | | CIGNA Corporation |
| | | |
Judith M. Johnson (Born 1949) | | Trustee, since 2008; Audit Committee Chairman, from 2009 to 2018 | | Retired. Prior thereto, Chief Executive Officer and Chief Investment Officer of Minneapolis Employees Retirement Fund from 1996 to 2008. Ms. Johnson is an attorney, certified public accountant and a certified managerial accountant. | | N/A |
22 | Wells Fargo Precious Metals Fund
Other information (unaudited)
| | | | | | |
Name and
year of birth | | Position held and
length of service* | | Principal occupations during past five years or longer | | Current other
public company or
investment
company
directorships |
| | | |
David F. Larcker (Born 1950) | | Trustee, since 2009 | | James Irvin Miller Professor of Accounting at the Graduate School of Business, Stanford University, Director of the Corporate Governance Research Initiative and Senior Faculty of The Rock Center for Corporate Governance since 2006. From 2005 to 2008, Professor of Accounting at the Graduate School of Business, Stanford University. Prior thereto, Ernst & Young Professor of Accounting at The Wharton School, University of Pennsylvania from 1985 to 2005. | | N/A |
| | | |
Olivia S. Mitchell (Born 1953) | | Trustee, since 2006; Nominating and Governance Committee Chairman, since 2018 | | International Foundation of Employee Benefit Plans Professor, Wharton School of the University of Pennsylvania since 1993. Director of Wharton’s Pension Research Council and Boettner Center on Pensions & Retirement Research, and Research Associate at the National Bureau of Economic Research. Previously, Cornell University Professor from 1978 to 1993. | | N/A |
| | | |
Timothy J. Penny (Born 1951) | | Trustee, since 1996; Chairman, since 2018 | | President and Chief Executive Officer of Southern Minnesota Initiative Foundation, anon-profit organization, since 2007. Member of the Board of Trustees of NorthStar Education Finance, Inc., anon-profit organization, since 2007. | | N/A |
| | | |
James G. Polisson (Born 1959) | | Trustee, since 2018 | | Retired. Chief Marketing Officer, Source (ETF) UK Services, Ltd, from 2015 to 2017. From 2012 to 2015, Principal of The Polisson Group, LLC, a management consulting, corporate advisory and principal investing company. Chief Executive Officer and Managing Director at Russell Investments, Global Exchange Traded Funds from 2010 to 2012. Managing Director of Barclays Global Investors from 1998 to 2010 and Global Chief Marketing Officer for iShares and Barclays Global Investors from 2000 to 2010. Trustee of the San Francisco Mechanics’ Institute, anon-profit organization, from 2013 to 2015. Board member of the Russell Exchange Traded Fund Trust from 2011 to 2012. Director of Barclays Global Investors Holdings Deutschland GmbH from 2006 to 2009. Mr. Polisson is an attorney and has a retired status with the Massachusetts and District of Columbia Bar Associations. | | N/A |
| * | Length of service dates reflect the Trustee’s commencement of service with the Trust’s predecessor entities, where applicable. |
Wells Fargo Precious Metals Fund | 23
Other information (unaudited)
Officers
| | | | |
Name and
year of birth | | Position held and
length of service | | Principal occupations during past five years or longer |
| | |
Andrew Owen (Born 1960) | | President, since 2017 | | Executive Vice President of Wells Fargo & Company and Head of Affiliated Managers, Wells Fargo Asset Management, since 2014. In addition, Mr. Owen is currently President, Chief Executive Officer and Director of Wells Fargo Funds Management, LLC since 2017. Prior thereto, Executive Vice President responsible for marketing, investments and product development for Wells Fargo Funds Management, LLC, from 2009 to 2014. |
| | |
Nancy Wiser1 (Born 1967) | | Treasurer, since 2012 | | Executive Vice President of Wells Fargo Funds Management, LLC since 2011. Chief Operating Officer and Chief Compliance Officer at LightBox Capital Management LLC, from 2008 to 2011. |
| | |
Michelle Rhee3 (Born 1966) | | Chief Legal Officer, since 2019 | | Secretary of Wells Fargo Funds Management, LLC, Chief Legal Counsel of Wells Fargo Asset Management and Assistant General Counsel of Wells Fargo Bank, N.A. since 2018. Associate General Counsel and Managing Director of Bank of America Corporation from 2004 to 2018. |
| | |
Catherine Kennedy4 (Born 1969) | | Secretary, since 2019 | | Vice President of Wells Fargo Funds Management, LLC and Senior Counsel of the Wells Fargo Legal Department since 2010. Vice President and Senior Counsel of Evergreen Investment Management Company, LLC from 1998 to 2010. |
| | |
Michael H. Whitaker (Born 1967) | | Chief Compliance Officer, since 2016 | | Chief Compliance Officer of Wells Fargo Asset Management since 2016. Senior Vice President and Chief Compliance Officer for Fidelity Investments from 2007 to 2016. |
| | |
David Berardi (Born 1975) | | Assistant Treasurer, since 2009 | | Vice President of Wells Fargo Funds Management, LLC since 2009. Vice President of Evergreen Investment Management Company, LLC from 2008 to 2010. Manager of Fund Reporting and Control for Evergreen Investment Management Company, LLC from 2004 to 2010. |
| | |
Jeremy DePalma1 (Born 1974) | | Assistant Treasurer, since 2009 | | Senior Vice President of Wells Fargo Funds Management, LLC since 2009. Senior Vice President of Evergreen Investment Management Company, LLC from 2008 to 2010 and head of the Fund Reporting and Control Team within Fund Administration from 2005 to 2010. |
| 1 | Nancy Wiser acts as Treasurer of 64 funds in the Fund Complex. Jeremy DePalma acts as Treasurer of 86 funds and Assistant Treasurer of 64 funds in the Fund Complex. |
| 2 | The Statement of Additional Information includes additional information about the Trustees and is available, without charge, upon request, by calling1-800-222-8222 or by visiting the website atwfam.com. |
| 3 | Michelle Rhee became Chief Legal Officer effective October 22, 2019. |
| 4 | Catherine Kennedy became Secretary effective October 22, 2019. |
24 | Wells Fargo Precious Metals Fund
Other information (unaudited)
BOARD CONSIDERATION OF INVESTMENT MANAGEMENT ANDSUB-ADVISORY AGREEMENTS:
Wells Fargo Precious Metals Fund
Under the Investment Company Act of 1940 (the “1940 Act”), the Board of Trustees (the “Board”) of Wells Fargo Funds Trust (the “Trust”) must determine annually whether to approve the continuation of the Trust’s investment management andsub-advisory agreements. In this regard, at anin-person meeting held on May21-22, 2019 (the “Meeting”), the Board, all the members of which have no direct or indirect interest in the investment management andsub-advisory agreements and are not “interested persons” of the Trust, as defined in the 1940 Act (the “Independent Trustees”), reviewed and approved for Wells Fargo Precious Metals Fund(the “Fund”): (i) an investment management agreement (the “Management Agreement”) with Wells Fargo Funds Management, LLC (“Funds Management”); and (ii) an investmentsub-advisory agreement (the“Sub-Advisory Agreement”) with Wells Capital Management Incorporated (the“Sub-Adviser”), an affiliate of Funds Management. The Management Agreement and theSub-Advisory Agreement are collectively referred to as the “Advisory Agreements.”
At the Meeting, the Board considered the factors and reached the conclusions described below relating to the selection of Funds Management and theSub-Adviser and the approval of the Advisory Agreements. Prior to the Meeting, including at anin-person meeting in April 2019, the Trustees conferred extensively among themselves and with representatives of Funds Management about these matters. Also, the Board has adopted a team-based approach, with each team consisting of asub-set of Trustees, to assist the full Board in the discharge of its duties in reviewing investment performance and other matters throughout the year. The Independent Trustees were assisted in their evaluation of the Advisory Agreements by independent legal counsel, from whom they received separate legal advice and with whom they met separately.
In providing information to the Board, Funds Management and theSub-Adviser were guided by a detailed set of requests for information submitted to them by independent legal counsel on behalf of the Independent Trustees at the start of the Board’s annual contract renewal process earlier in 2019. In considering and approving the Advisory Agreements, the Trustees considered the information they believed relevant, including but not limited to the information discussed below. The Board considered not only the specific information presented in connection with the Meeting, but also the knowledge gained over time through interaction with Funds Management and theSub-Adviser about various topics. In this regard, the Board reviewed reports of Funds Management at each of its quarterly meetings, which included, among other things, portfolio reviews and investment performance reports. In addition, the Board and the teams mentioned above confer with portfolio managers at various times throughout the year. The Board did not identify any particular information or consideration that wasall-important or controlling, and each individual Trustee may have attributed different weights to various factors.
After its deliberations, the Board unanimously approved the continuation of the Advisory Agreements for aone-year term and determined that the compensation payable to Funds Management and theSub-Adviser under each of the Advisory Agreements was reasonable. The Board considered the approval of the Advisory Agreements for the Fund as part of its consideration of agreements for funds across the complex, but its approvals were made on afund-by-fund basis. The following summarizes a number of important, but not necessarily all, factors considered by the Board in support of its approvals.
Nature, extent and quality of services
The Board received and considered various information regarding the nature, extent and quality of services provided to the Fund by Funds Management and theSub-Adviser under the Advisory Agreements. This information included a description of the investment advisory services and Fund-level administrative services covered by the Management Agreement, as well as, among other things, a summary of the background and experience of senior management of Wells Fargo Asset Management (“WFAM”), of which Funds Management and theSub-Adviser are a part, a summary of investments made in the business of WFAM, a summary of certain organizational and personnel changes involving Funds Management and theSub-Adviser, and a description of Funds Management’s and theSub-Adviser’s business continuity planning programs and of their approaches to data privacy and cybersecurity. The Board received and reviewed information about Funds Management’s role as administrator of the Fund’s liquidity risk management program. The Board also considered the qualifications, background, tenure and responsibilities of each of the portfolio managers primarily responsible for theday-to-day portfolio management of the Fund.
The Board evaluated the ability of Funds Management and theSub-Adviser to attract and retain qualified investment professionals, including research, advisory and supervisory personnel. The Board further considered the compliance programs and compliance records of Funds Management and theSub-Adviser. In addition, the Board took into account the full range of services provided to the Fund by Funds Management and its affiliates.
Wells Fargo Precious Metals Fund | 25
Other information (unaudited)
Fund investment performance and expenses
The Board considered the investment performance results for the Fund over various time periods ended December 31, 2018. The Board considered these results in comparison to the investment performance of funds in a universe that was determined by Broadridge Inc. (“Broadridge”) to be similar to the Fund (the “Universe”), and in comparison to the Fund’s benchmark index and to other comparative data. Broadridge is an independent provider of investment company data. The Board received a description of the methodology used by Broadridge to select the mutual funds in the performance Universe. The Board noted that the investment performance of the Fund (Class A) was higher than the average investment performance of the Universe for theone-, five- andten-year periods under review, but lower than the average investment performance of the Universe for the three-year period under review. The Board also noted that the investment performance of the Fund was lower than its benchmark index, the FTSE Gold Mines Index, for theone-, three- and five-year periods under review, but higher than its benchmark for theten-year period under review.
The Board also received and considered information regarding the Fund’s net operating expense ratios and their various components, including actual management fees, custodian and othernon-management fees, and Rule12b-1 andnon-Rule12b-1 shareholder service fees. The Board considered these ratios in comparison to the median ratios of funds in class-specific expense groups that were determined by Broadridge to be similar to the Fund (the “Groups”). The Board received a description of the methodology used by Broadridge to select the mutual funds in the expense Groups and an explanation of how funds comprising expense groups and their expense ratios may vary fromyear-to-year. Based on the Broadridge reports, the Board noted that the net operating expense ratios of the Fund were lower than the median net operating expense ratios of the expense Groups for each share class.
The Board took into account the Fund’s investment performance and expense information provided to it among the factors considered in deciding tore-approve the Advisory Agreements.
Investment management andsub-advisory fee rates
The Board reviewed and considered the contractual fee rates payable by the Fund to Funds Management under the Management Agreement, as well as the contractual fee rates payable by the Fund to Funds Management for class-level administrative services under a Class-Level Administration Agreement, which include, among other things, class-level transfer agency andsub-transfer agency costs (collectively, the “Management Rates”). The Board also reviewed and considered the contractual investmentsub-advisory fee rates that are payable by Funds Management to theSub-Adviser for investmentsub-advisory services.
Among other information reviewed by the Board was a comparison of the Fund’s Management Rates with the average contractual investment management fee rates of funds in the expense Groups at a common asset level as well as transfer agency costs of the funds in the expense Groups. The Board noted that the Management Rates of the Fund were lower than the sum of these average rates for the Fund’s expense Groups for all share classes.
The Board also received and considered information about the portion of the total management fee that was retained by Funds Management after payment of the fee to theSub-Adviser forsub-advisory services. In assessing the reasonableness of this amount, the Board received and evaluated information about the nature and extent of responsibilities retained and risks assumed by Funds Management and not delegated to or assumed by theSub-Adviser, and about Funds Management’son-going oversight services. Given the affiliation between Funds Management and theSub-Adviser, the Board ascribed limited relevance to the allocation of fees between them.
The Board also received and considered information about the nature and extent of services offered and fee rates charged by Funds Management and theSub-Adviser to other types of clients with investment strategies similar to those of the Fund. In this regard, the Board received information about the significantly greater scope of services, and compliance, reporting and other legal burdens and risks of managing proprietary mutual funds compared with those associated with managing assets of other types of clients, including third-partysub-advised fund clients andnon-mutual fund clients such as institutional separate accounts.
Based on its consideration of the factors and information it deemed relevant, including those described here, the Board determined that the compensation payable to Funds Management under the Management Agreement and to theSub-Adviser under theSub-Advisory Agreement was reasonable.
Profitability
The Board received and considered information concerning the profitability of Funds Management, as well as the profitability of both WFAM and Wells Fargo & Co. (“Wells Fargo”) from providing services to the fund family as a whole. The Board noted that theSub-Adviser’s profitability information with respect to providing services to the Fund and other funds in the family was subsumed in the WFAM and Wells Fargo profitability analysis.
26 | Wells Fargo Precious Metals Fund
Other information (unaudited)
Funds Management reported on the methodologies and estimates used in calculating profitability, including a description of the methodology used to allocate certain expenses. Among other things, the Board noted that the levels of profitability reported on afund-by-fund basis varied widely, depending on factors such as the size, type and age of fund. Based on its review, the Board did not deem the profits reported by Funds Management, WFAM or Wells Fargo from services provided to the Fund to be at a level that would prevent it from approving the continuation of the Advisory Agreements.
Economies of scale
The Board received and considered information about the potential for Funds Management to experience economies of scale in the provision of management services to the Fund, the difficulties of calculating economies of scale at an individual fund level, and the extent to which potential scale benefits are shared with shareholders. The Board noted the existence of breakpoints in the Fund’s management fee structure, which operate generally to reduce the Fund’s expense ratios as the Fund grows in size. The Board considered that in addition to management fee breakpoints, Funds Management shares potential economies of scale from its management business in a variety of ways, including through fee waiver and expense reimbursement arrangements, services that benefit shareholders, competitive management fee rates set at the outset without regard to breakpoints, and investments in the business intended to enhance services available to shareholders.
The Board concluded that Funds Management’s arrangements with respect to the Fund, including contractual breakpoints, constituted a reasonable approach to sharing potential economies of scale with the Fund and its shareholders.
Other benefits to Funds Management and theSub-Adviser
The Board received and considered information regarding potential“fall-out” or ancillary benefits received by Funds Management and its affiliates, including theSub-Adviser, as a result of their relationships with the Fund. Ancillary benefits could include, among others, benefits directly attributable to other relationships with the Fund and benefits potentially derived from an increase in Funds Management’s and theSub-Adviser’s business as a result of their relationships with the Fund. The Board noted that various affiliates of Funds Management may receive distribution-related fees, shareholder servicing payments andsub-transfer agency fees in respect of shares sold or held through them and services provided.
The Board also reviewed information about soft dollar credits earned and utilized by theSub-Adviser, fees earned by Funds Management and theSub-Adviser from managing a private investment vehicle for the fund family’s securities lending collateral, and commissions earned by an affiliated broker from portfolio transactions.
Based on its consideration of the factors and information it deemed relevant, including those described here, the Board did not find that any ancillary benefits received by Funds Management and its affiliates, including theSub-Adviser, were unreasonable.
Conclusion
At the Meeting, after considering the above-described factors and based on its deliberations and its evaluation of the information described above, the Board unanimously approved the continuation of the Advisory Agreements for aone-year term and determined that the compensation payable to Funds Management and theSub-Adviser under each of the Advisory Agreements was reasonable.
Wells Fargo Precious Metals Fund | 27
This page is intentionally left blank.

For more information
More information about Wells Fargo Funds is available free upon request. To obtain literature, please write, visit the Fund’s website, or call:
Wells Fargo Funds
P.O. Box 219967
Kansas City, MO 64121-9967
Website:wfam.com
Individual investors:1-800-222-8222
Retail investment professionals:1-888-877-9275
Institutional investment professionals:1-866-765-0778

This report and the financial statements contained herein are submitted for the general information of the shareholders of the Fund. If this report is used for promotional purposes, distribution of the report must be accompanied or preceded by a current prospectus. Before investing, please consider the investment objectives, risks, charges, and expenses of the investment. For a current prospectus and, if available, a summary prospectus, containing this information, call1-800-222-8222 or visit the Fund’s website atwfam.com. Read the prospectus carefully before you invest or send money.
Wells Fargo Asset Management (WFAM) is the trade name for certain investment advisory/management firms owned by Wells Fargo & Company. These firms include but are not limited to Wells Capital Management Incorporated and Wells Fargo Funds Management, LLC. Certain products managed by WFAM entities are distributed by Wells Fargo Funds Distributor, LLC (a broker-dealer and Member FINRA).
This material is for general informational and educational purposes only and is NOT intended to provide investment advice or a recommendation of any kind—including a recommendation for any specific investment, strategy, or plan.
INVESTMENT PRODUCTS: NOT FDIC INSURED ◾ NO BANK GUARANTEE ◾ MAY LOSE VALUE
© 2019 Wells Fargo & Company. All rights reserved.
406823 11-19
SA316/SAR316 09-19
Semi-Annual Report
September 30, 2019
Wells Fargo
Specialized Technology Fund
Beginning on January 1, 2021, as permitted by new regulations adopted by the Securities and Exchange Commission, paper copies of the Wells Fargo Funds’ annual and semi-annual shareholder reports issued after this date will no longer be sent by mail, unless you specifically request paper copies of the reports. Instead, the reports will be made available on the Funds’ website, and you will be notified by mail each time a report is posted and provided with a website address to access the report.
If you already elected to receive shareholder reports electronically, you will not be affected by this change and you need not take any action. You may elect to receive shareholder reports and other communications from the Fund electronically at any time by contacting your financial intermediary (such as a broker-dealer or bank) or, if you are a direct investor, by calling1-800-222-8222 or by enrolling at wellsfargo.com/advantagedelivery.
You may elect to receive all future reports in paper free of charge. If you invest through a financial intermediary, you can contact your financial intermediary to request that you continue to receive paper copies of your shareholder reports; if you invest directly with the Fund, you can call 1-800-222-8222. Your election to receive reports in paper will apply to all Wells Fargo Funds held in your account with your financial intermediary or, if you are a direct investor, to all Wells Fargo Funds that you hold.
|
|
|
Reduce clutter. Save trees. |
Sign up for electronic delivery of prospectuses and shareholder reports atwellsfargo.com/advantagedelivery |
The views expressed and any forward-looking statements are as of September 30, 2019, unless otherwise noted, and are those of the Fund managers and/or Wells Fargo Asset Management. Discussions of individual securities, or the markets generally, or any Wells Fargo Fund are not intended as individual recommendations. Future events or results may vary significantly from those expressed in any forward-looking statements. The views expressed are subject to change at any time in response to changing circumstances in the market. Wells Fargo Asset Management and the Fund disclaim any obligation to publicly update or revise any views expressed or forward-looking statements.
INVESTMENT PRODUCTS: NOT FDIC INSURED ◾ NO BANK GUARANTEE ◾ MAY LOSE VALUE
Wells Fargo Specialized Technology Fund | 1
Letter to shareholders (unaudited)

Andrew Owen
President
Wells Fargo Funds
“During the third quarter of 2019, investors regrouped.”
Dear Shareholder:
We are pleased to offer you this semi-annual report for the Wells Fargo Specialized Technology Fund for the six-month period that ended September 30, 2019. U.S. stock and global bond investors generally saw markets recover during the second half amid intensifying market volatility, global economic growth concerns, international trade stare downs, and simmering geopolitical tensions.
Overall, fixed income kept pace with domestic stocks and outperformed foreign equities. For the period, U.S. stocks, based on the S&P 500 Index,1 gained 6.08% and international stocks, as measured by the MSCI ACWI ex USA Index (Net),2 added 1.13%. The MSCI EM Index (Net)3 fell by 3.66%. Among fixed income investors, the Bloomberg Barclays U.S. Aggregate Bond Index4 added 5.42%, the Bloomberg Barclays Global Aggregate ex-USD Index5 gained 2.82%, the Bloomberg Barclays Municipal Bond Index6 increased 3.74%, and the ICE BofAML U.S. High Yield Index7 was up 3.82%.
Early second-quarter 2019 investor enthusiasm faded as the quarter wore on.
During April 2019, favorable sentiment found additional support in reports of sustained low inflation, solid employment data, and first-quarter U.S. gross domestic product growth at an annualized rate of 3.2%. During May, markets tumbled on mixed investment signals. In the U.S., partisan wrangling ramped up as Democrats and Republicans set their sights on 2020 presidential politics. The U.K.’s Brexit disagreements caused Prime Minister Theresa May to resign. Boris Johnson succeeded her only to exacerbate uncertainty about Brexit’s resolution ahead of an October 2019 deadline. The European Commission downgraded the 2019 growth forecast to 1.2%. The U.S. increased tariffs on products from China, China responded, and then talks broke down. President Donald Trump threatened to turn his foreign policy tariff tool to Mexico over immigration issues.
During the third quarter of 2019, investors regrouped. Just as the investment horizon appeared to darken, sentiment turned and U.S. equity markets gained during June and July. The gains, primarily driven by geopolitical and monetary policy events, pushed equity markets to new highs. European Central Bank President Mario Draghi said that if the outlook doesn’t improve, the bank would cut rates or buy more assets to prop up inflation. President Trump backed off of tariff threats against Mexico and China. In the U.S., the Federal Reserve (Fed) implemented a 0.25% federal funds rate cut in July.
| 1 | The S&P 500 Index consists of 500 stocks chosen for market size, liquidity, and industry group representation. It is a market-value-weighted index with each stock’s weight in the index proportionate to its market value. You cannot invest directly in an index. |
| 2 | The Morgan Stanley Capital International (MSCI) All Country World Index (ACWI) ex USA Index (Net) is a free-float-adjusted market-capitalization weighted index that is designed to measure the equity market performance of developed and emerging markets, excluding the U.S. Source: MSCI. MSCI makes no express or implied warranties or representations and shall have no liability whatsoever with respect to any MSCI data contained herein. The MSCI data may not be further redistributed or used as a basis for other indices or any securities or financial products. This report is not approved, reviewed, or produced by MSCI. You cannot invest directly in an index. |
| 3 | The MSCI Emerging Markets (EM) Index (Net) is a free-float-adjusted market-capitalization-weighted index that is designed to measure the equity market performance of emerging markets. You cannot invest directly in an index. |
| 4 | The Bloomberg Barclays U.S. Aggregate Bond Index is a broad-based benchmark that measures the investment-grade, U.S. dollar-denominated, fixed-rate taxable bond market, including Treasuries, government-related and corporate securities, mortgage-backed securities (agency fixed-rate and hybrid adjustable-rate mortgage pass-throughs), asset-backed securities, and commercial mortgage-backed securities. You cannot invest directly in an index. |
| 5 | The Bloomberg Barclays Global Aggregate ex-USD Index is an unmanaged index that provides a broad-based measure of the global investment-grade fixed-income markets excluding the U.S. dollar-denominated debt market. You cannot invest directly in an index. |
| 6 | The Bloomberg Barclays Municipal Bond Index is an unmanaged index composed of long-term tax-exempt bonds with a minimum credit rating of Baa. You cannot invest directly in an index. |
| 7 | The ICE BofAML U.S. High Yield Index is a market-capitalization-weighted index of domestic and Yankee high-yield bonds. The index tracks the performance of high-yield securities traded in the U.S. bond market. You cannot invest directly in an index. Copyright 2019. ICE Data Indices, LLC. All rights reserved. |
2 | Wells Fargo Specialized Technology Fund
Letter to shareholders (unaudited)
Later in July 2019, the U.S. reversed course and threatened to impose higher tariffs on China’s exports after talks failed. China responded with tariff threats of its own and devalued the renminbi, a move that roiled global markets. Major U.S. stock market indices closed July with the worst weekly results of the year. Bond prices gained as Treasury yields fell to levels not seen since November 2016 and the yield curve inverted at multiple points along the30-year arc.
In a microcosm, August encapsulated many of the unnerving events that plagued investors during the prior 11 months. The U.S.-China trade relationship swung from antagonistic to hopeful and back again with no evident compromise on the horizon. Evidence of a continued global economic slowdown mounted. Central banks in China, New Zealand, and Thailand cut interest rates. Industrial and manufacturing data declined in China, Canada, Japan, and Germany. Adding to the uncertain environment, Italy’s prime minister resigned, many feared a crackdown in Hong Kong as protesters sustained their calls for reform throughout the month, and Boris Johnson planned to suspend Parliament as Brexit’s deadline neared.
In the U.S., September saw the Fed join other central banks in cutting interest rates. Manufacturing data in the U.S., as reported by the Institute for Supply Management, disappointed investors. The U.S. Congress announced it would pursue an impeachment investigation of President Trump. Meanwhile, the Brexit impasse showed no signs of resolution. Officials in China said that hitting the country’s economic growth goals for the year would be difficult considering the weight of tariffs and trade restrictions. So while the S&P 500 Index finished the third quarter with year-to-date returns that were the best in more than 20 years, amid signs of equity investors taking money out of the stock market, concerns about future returns remained.
Don’t let short-term uncertainty derail long-term investment goals.
Periods of investment uncertainty can present challenges, but experience has taught us that maintaining long-term investment goals can be an effective way to plan for the future. To help you create a sound strategy based on your personal goals and risk tolerance, Wells Fargo Funds offers more than 100 mutual funds spanning a wide range of asset classes and investment styles. Although diversification cannot guarantee an investment profit or prevent losses, we believe it can be an effective way to manage investment risk and potentially smooth out overall portfolio performance. We encourage investors to know their investments and to understand that appropriate levels of risk-taking may unlock opportunities.
Thank you for choosing to invest with Wells Fargo Funds. We appreciate your confidence in us and remain committed to helping you meet your financial needs.
Sincerely,

Andrew Owen
President
Wells Fargo Funds
“In the U.S., September saw the Fed join other central banks in cutting interest rates.”
|
|
|
For further information about your Fund, contact your investment professional, visit our website at wfam.com, or call us directly at1-800-222-8222. |
Wells Fargo Specialized Technology Fund | 3
Performance highlights (unaudited)
Investment objective
The Fund seeks long-term capital appreciation.
Manager
Wells Fargo Funds Management, LLC
Subadviser
Allianz Global Investors U.S. LLC
Portfolio managers
Huachen Chen, CFA®‡
Walter C. Price, Jr., CFA®‡
Michael A. Seidenberg
Average annual total returns (%) as of September 30, 2019
| | | | | | | | | | | | | | | | | | | | | | | | | | | | | | | | | | |
| | | | |
| | | | | Including sales charge | | | Excluding sales charge | | | Expense ratios1 (%) | |
| | | | | | | | | |
| | | Inception date | | 1 year | | | 5 year | | | 10 year | | | 1 year | | | 5 year | | | 10 year | | | Gross | | | Net2 | |
| | | | | | | | | | |
| Class A (WFSTX) | | 9-18-2000 | | | -10.04 | | | | 13.99 | | | | 15.43 | | | | -4.56 | | | | 15.34 | | | | 16.12 | | | | 1.41 | | | | 1.39 | |
| | | | | | | | | | |
| Class C (WFTCX) | | 9-18-2000 | | | -6.27 | | | | 14.48 | | | | 15.25 | | | | -5.27 | | | | 14.48 | | | | 15.25 | | | | 2.16 | | | | 2.14 | |
| | | | | | | | | | |
| Administrator Class (WFTDX)3 | | 7-30-2010 | | | – | | | | – | | | | – | | | | -4.51 | | | | 15.47 | | | | 16.28 | | | | 1.33 | | | | 1.29 | |
| | | | | | | | | | |
| Institutional Class (WFTIX)4 | | 10-31-2016 | | | – | | | | – | | | | – | | | | -4.23 | | | | 15.62 | | | | 16.35 | | | | 1.08 | | | | 1.04 | |
| | | | | | | | | | |
| S&P North American Technology Index5 | | – | | | – | | | | – | | | | – | | | | 4.90 | | | | 18.77 | | | | 17.43 | | | | – | | | | – | |
| | | | | | | | | | |
| S&P 500 Index6 | | – | | | – | | | | – | | | | – | | | | 4.25 | | | | 10.84 | | | | 13.24 | | | | – | | | | – | |
Figures quoted represent past performance, which is no guarantee of future results, and do not reflect taxes that a shareholder may pay on fund distributions or the redemption of fund shares. Investment return and principal value of an investment will fluctuate so that an investor’s shares, when redeemed, may be worth more or less than their original cost. Performance shown without sales charges would be lower if sales charges were reflected. Current performance may be lower or higher than the performance data quoted, which assumes the reinvestment of dividends and capital gains. Current month-end performance is available on the Fund’s website,wfam.com.
While the S&P 500 Index is comprised of U.S. equity securities of companies diversified across ten sectors, the Fund’s holdings are concentrated primarily in technology related stocks. Therefore, the performance of the S&P 500 Index is displayed only to show how the concentrated Fund performed compared with a diversified selection of U.S. equity securities.
Index returns do not include transaction costs associated with buying and selling securities, any mutual fund fees or expenses, or any taxes. It is not possible to invest directly in an index.
For Class A shares, the maximum front-end sales charge is 5.75%. For Class C shares, the maximum contingent deferred sales charge is 1.00%. Performance including a contingent deferred sales charge assumes the sales charge for the corresponding time period. Administrator Class and Institutional Class shares are sold without a front-end sales charge or contingent deferred sales charge.
Stock values fluctuate in response to the activities of individual companies and general market and economic conditions. Funds that concentrate their investments in limited sectors, such as information technology, are more vulnerable to adverse market, economic, regulatory, political, or other developments affecting those sectors. Certain investment strategies tend to increase the total risk of an investment (relative to the broader market). The Fund is exposed to convertible securities risk, foreign investment risk, non-diversification risk, and smaller-company securities risk. Consult the Fund’s prospectus for additional information on these and other risks.
Please see footnotes on page 5.
4 | Wells Fargo Specialized Technology Fund
Performance highlights (unaudited)
| | | | |
|
| Ten largest holdings (%) as of September 30, 20197 | |
| | |
Microsoft Corporation | | | 9.05 | |
| | |
Paycom Software Incorporated | | | 5.04 | |
| | |
Facebook Incorporated Class A | | | 4.62 | |
| | |
Amazon.com Incorporated | | | 4.07 | |
| | |
MasterCard Incorporated Class A | | | 3.77 | |
| | |
Twilio Incorporated Class A | | | 3.42 | |
| | |
Alphabet Incorporated Class C | | | 3.10 | |
| | |
Okta Incorporated | | | 2.99 | |
| | |
Alteryx Incorporated Class A | | | 2.92 | |
| | |
RingCentral Incorporated Class A | | | 2.88 | |
|
|
| Industry distribution as of September 30, 20198 |
|
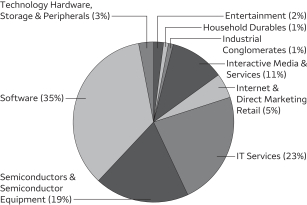 |
| ‡ | CFA® and Chartered Financial Analyst® are trademarks owned by CFA Institute. |
| 1 | Reflects the expense ratios as stated in the most recent prospectuses, which include the impact of 0.01% in acquired fund fees and expenses. The expense ratios shown are subject to change and may differ from the annualized expense ratios shown in the financial highlights of this report, which do not include acquired fund fees and expenses. |
| 2 | The manager has contractually committed through July 31, 2020, to waive fees and/or reimburse expenses to the extent necessary to cap the expenses of each class after fee waivers at 1.38% for Class A, 2.13% for Class C, 1.28% for Administrator Class, and 1.03% for Institutional Class. Brokerage commissions, stamp duty fees, interest, taxes, acquired fund fees and expenses (if any), and extraordinary expenses are excluded from the expense cap. Prior to or after the commitment expiration date, the cap may be increased or the commitment to maintain the cap may be terminated only with the approval of the Board of Trustees. Without this cap, the Fund’s returns would have been lower. The expense ratio paid by an investor is the net expense ratio (the total annual fund operating expenses after fee waivers) as stated in the prospectuses. |
| 3 | Historical performance shown for Administrator Class shares prior to their inception reflects the performance of Class A shares, and includes the higher expenses applicable to Class A shares. If these expenses had not been included, returns for Administrator Class shares would be higher. |
| 4 | Historical performance shown for Institutional Class shares prior to their inception reflects the performance of the Administrator Class shares, and is not adjusted to reflect Institutional Class expenses. If these expenses had been included, returns for Institutional Class shares would be higher. |
| 5 | The S&P North American Technology Index is a modified market-capitalization-weighted index of select technology stocks. You cannot invest directly in an index. |
| 6 | The S&P 500 Index consists of 500 stocks chosen for market size, liquidity, and industry group representation. It is a market-value weighted index with each stock’s weight in the index proportionate to its market value. You cannot invest directly in an index. |
| 7 | The ten largest holdings, excluding cash, cash equivalents and any money market funds, are calculated based on the value of the investments divided by total net assets of the Fund. Holdings are subject to change and may have changed since the date specified. |
| 8 | Amounts are calculated based on the total long-term investments of the Fund. These amounts are subject to change and may have changed since the date specified. |
Wells Fargo Specialized Technology Fund | 5
Fund expenses (unaudited)
As a shareholder of the Fund, you incur two types of costs: (1) transaction costs, including sales charges (loads) on purchase payments and contingent deferred sales charges (if any) on redemptions and (2) ongoing costs, including management fees, distribution (12b-1) and/or shareholder servicing fees, and other Fund expenses. This example is intended to help you understand your ongoing costs (in dollars) of investing in the Fund and to compare these costs with the ongoing costs of investing in other mutual funds.
The example is based on an investment of $1,000 invested at the beginning of the six-month period and held for the entire period from April 1, 2019 to September 30, 2019.
Actual expenses
The “Actual” line of the table below provides information about actual account values and actual expenses. You may use the information in this line, together with the amount you invested, to estimate the expenses that you paid over the period. Simply divide your account value by $1,000 (for example, an $8,600 account value divided by $1,000 = 8.6), then multiply the result by the number in the “Actual” line under the heading entitled “Expenses paid during period” for your applicable class of shares to estimate the expenses you paid on your account during this period.
Hypothetical example for comparison purposes
The “Hypothetical” line of the table below provides information about hypothetical account values and hypothetical expenses based on the Fund’s actual expense ratio and an assumed rate of return of 5% per year before expenses, which is not the Fund’s actual return. The hypothetical account values and expenses may not be used to estimate the actual ending account balance or expenses you paid for the period. You may use this information to compare the ongoing costs of investing in the Fund and other funds. To do so, compare this 5% hypothetical example with the 5% hypothetical examples that appear in the shareholder reports of the other funds.
Please note that the expenses shown in the table are meant to highlight your ongoing costs only and do not reflect any transactional costs, such as sales charges (loads) and contingent deferred sales charges. Therefore, the “Hypothetical” line of the table is useful in comparing ongoing costs only and will not help you determine the relative total costs of owning different funds. In addition, if these transactional costs were included, your costs would have been higher.
| | | | | | | | | | | | | | | | |
| | | Beginning account value 4-1-2019 | | | Ending account value 9-30-2019 | | | Expenses paid during the period¹ | | | Annualized net expense ratio | |
| | | | | |
Class A | | | | | | | | | | | | | | | | |
| | | | |
Actual | | $ | 1,000.00 | | | $ | 971.49 | | | $ | 6.82 | | | | 1.38 | % |
| | | | |
Hypothetical (5% return before expenses) | | $ | 1,000.00 | | | $ | 1,018.15 | | | $ | 6.98 | | | | 1.38 | % |
| | | | | |
Class C | | | | | | | | | | | | | | | | |
| | | | |
Actual | | $ | 1,000.00 | | | $ | 967.29 | | | $ | 10.50 | | | | 2.13 | % |
| | | | |
Hypothetical (5% return before expenses) | | $ | 1,000.00 | | | $ | 1,014.39 | | | $ | 10.76 | | | | 2.13 | % |
| | | | | |
Administrator Class | | | | | | | | | | | | | | | | |
| | | | |
Actual | | $ | 1,000.00 | | | $ | 971.43 | | | $ | 6.33 | | | | 1.28 | % |
| | | | |
Hypothetical (5% return before expenses) | | $ | 1,000.00 | | | $ | 1,018.65 | | | $ | 6.48 | | | | 1.28 | % |
| | | | | |
Institutional Class | | | | | | | | | | | | | | | | |
| | | | |
Actual | | $ | 1,000.00 | | | $ | 973.05 | | | $ | 5.09 | | | | 1.03 | % |
| | | | |
Hypothetical (5% return before expenses) | | $ | 1,000.00 | | | $ | 1,019.90 | | | $ | 5.22 | | | | 1.03 | % |
| 1 | Expenses paid is equal to the annualized net expense ratio of each class multiplied by the average account value over the period, multiplied by the number of days in the most recent fiscal half-year divided by the number of days in the fiscal year (to reflect the one-half-year period). |
6 | Wells Fargo Specialized Technology Fund
Portfolio of investments—September 30, 2019 (unaudited)
| | | | | | | | | | | | | | | | |
| | | | | | | | | Shares | | | Value | |
| Common Stocks: 94.98% | | | | | | | | | | | | | | | | |
| | | | |
Communication Services: 12.47% | | | | | | | | | | | | | | | | |
| | | | |
Entertainment: 2.23% | | | | | | | | | | | | | | | | |
Activision Blizzard Incorporated | | | | | | | | | | | 41,740 | | | $ | 2,208,881 | |
Electronic Arts Incorporated † | | | | | | | | | | | 9,275 | | | | 907,281 | |
Take-Two Interactive Software Incorporated † | | | | | | | | | | | 47,525 | | | | 5,956,784 | |
Zynga Incorporated Class A † | | | | | | | | | | | 158,255 | | | | 921,044 | |
| | | | |
| | | | | | | | | | | | | | | 9,993,990 | |
| | | | | | | | | | | | | | | | |
| | | | |
| Interactive Media & Services: 10.24% | | | | | | | | | | | | |
Alphabet Incorporated Class C † | | | | | | | | | | | 11,405 | | | | 13,902,695 | |
Facebook Incorporated Class A † | | | | | | | | | | | 116,420 | | | | 20,732,064 | |
Snap Incorporated Class A Ǡ | | | | | | | | | | | 645,360 | | | | 10,196,688 | |
Yandex NV Class A † | | | | | | | | | | | 30,620 | | | | 1,072,006 | |
| | | | |
| | | | | | | | | | | | | | | 45,903,453 | |
| | | | | | | | | | | | | | | | |
| | | | |
Consumer Discretionary: 4.93% | | | | | | | | | | | | | | | | |
| | | | |
| Automobiles: 0.10% | | | | | | | | | | | | |
Tesla Motors Incorporated Ǡ | | | | | | | | | | | 1,950 | | | | 469,697 | |
| | | | | | | | | | | | | | | | |
| | | | |
| Household Durables: 0.47% | | | | | | | | | | | | |
Roku Incorporated † | | | | | | | | | | | 20,480 | | | | 2,084,045 | |
| | | | | | | | | | | | | | | | |
| | | | |
| Internet & Direct Marketing Retail: 4.36% | | | | | | | | | | | | |
Alibaba Group Holding Limited ADR † | | | | | | | | | | | 6,090 | | | | 1,018,431 | |
Amazon.com Incorporated † | | | | | | | | | | | 10,505 | | | | 18,235,735 | |
GrubHub Incorporated † | | | | | | | | | | | 5,355 | | | | 301,005 | |
| | | | |
| | | | | | | | | | | | | | | 19,555,171 | |
| | | | | | | | | | | | | | | | |
| | | | |
Health Care: 0.38% | | | | | | | | | | | | | | | | |
| | | | |
| Health Care Technology: 0.38% | | | | | | | | | | | | |
Veeva Systems Incorporated Class A † | | | | | | | | | | | 11,210 | | | | 1,711,655 | |
| | | | | | | | | | | | | | | | |
| | | | |
Industrials: 0.70% | | | | | | | | | | | | | | | | |
| | | | |
| Electrical Equipment: 0.11% | | | | | | | | | | | | |
Bloom Energy Corporation Class A Ǡ | | | | | | | | | | | 148,375 | | | | 482,219 | |
| | | | | | | | | | | | | | | | |
| | | | |
| Industrial Conglomerates: 0.44% | | | | | | | | | | | | |
Roper Technologies Incorporated | | | | | | | | | | | 5,540 | | | | 1,975,564 | |
| | | | | | | | | | | | | | | | |
| | | | |
| Road & Rail: 0.15% | | | | | | | | | | | | |
Lyft Incorporated Class A Ǡ | | | | | | | | | | | 7,775 | | | | 317,531 | |
Uber Technologies Incorporated Ǡ | | | | | | | | | | | 11,335 | | | | 345,377 | |
| | | | |
| | | | | | | | | | | | | | | 662,908 | |
| | | | | | | | | | | | | | | | |
| | | | |
Information Technology: 76.50% | | | | | | | | | | | | | | | | |
| | | | |
| Communications Equipment: 1.21% | | | | | | | | | | | | |
Arista Networks Incorporated † | | | | | | | | | | | 3,635 | | | | 868,474 | |
Palo Alto Networks Incorporated † | | | | | | | | | | | 20,035 | | | | 4,083,734 | |
Viavi Solutions Incorporated † | | | | | | | | | | | 34,600 | | | | 484,573 | |
| | | | |
| | | | | | | | | | | | | | | 5,436,781 | |
| | | | | | | | | | | | | | | | |
Wells Fargo Specialized Technology Fund | 7
Portfolio of investments—September 30, 2019 (unaudited)
| | | | | | | | | | | | | | | | |
| | | | | | | | | Shares | | | Value | |
| Electronic Equipment, Instruments & Components: 0.22% | | | | | | | | | | | | |
Cognex Corporation | | | | | | | | | | | 1,410 | | | $ | 69,273 | |
Flex Limited † | | | | | | | | | | | 87,320 | | | | 913,804 | |
| | | | |
| | | | | | | | | | | | | | | 983,077 | |
| | | | | | | | | | | | | | | | |
| | | | |
| IT Services: 21.62% | | | | | | | | | | | | |
Akamai Technologies Incorporated † | | | | | | | | | | | 95,275 | | | | 8,706,230 | |
Capgemini SA | | | | | | | | | | | 7,860 | | | | 926,094 | |
Coupa Software Incorporated † | | | | | | | | | | | 7,480 | | | | 969,184 | |
DXC Technology Company | | | | | | | | | | | 24,075 | | | | 710,213 | |
Fidelity National Information Services Incorporated | | | | | | | | | | | 49,636 | | | | 6,589,675 | |
Fiserv Incorporated † | | | | | | | | | | | 50,565 | | | | 5,238,028 | |
Global Payments Incorporated | | | | | | | | | | | 36,999 | | | | 5,882,841 | |
MasterCard Incorporated Class A | | | | | | | | | | | 62,235 | | | | 16,901,159 | |
MongoDB Incorporated Ǡ | | | | | | | | | | | 65,505 | | | | 7,892,042 | |
Okta Incorporated † | | | | | | | | | | | 136,065 | | | | 13,396,960 | |
PayPal Holdings Incorporated † | | | | | | | | | | | 39,910 | | | | 4,134,277 | |
Shopify Incorporated Class A † | | | | | | | | | | | 1,375 | | | | 428,533 | |
Square Incorporated Class A † | | | | | | | | | | | 7,405 | | | | 458,740 | |
Twilio Incorporated Class A Ǡ | | | | | | | | | | | 139,315 | | | | 15,319,077 | |
Visa Incorporated Class A | | | | | | | | | | | 54,695 | | | | 9,408,087 | |
| | | | |
| | | | | | | | | | | | | | | 96,961,140 | |
| | | | | | | | | | | | | | | | |
| | | | |
| Semiconductors & Semiconductor Equipment: 17.91% | | | | | | | | | | | | |
Advanced Micro Devices Incorporated † | | | | | | | | | | | 364,770 | | | | 10,574,682 | |
Analog Devices Incorporated | | | | | | | | | | | 46,895 | | | | 5,239,578 | |
ASML Holding NV | | | | | | | | | | | 5,350 | | | | 1,329,047 | |
Broadcom Incorporated | | | | | | | | | | | 16,265 | | | | 4,490,279 | |
Cree Incorporated † | | | | | | | | | | | 113,240 | | | | 5,548,760 | |
Infineon Technologies AG | | | | | | | | | | | 27,262 | | | | 490,641 | |
KLA-Tencor Corporation | | | | | | | | | | | 44,215 | | | | 7,050,082 | |
Lam Research Corporation | | | | | | | | | | | 18,130 | | | | 4,190,024 | |
Marvell Technology Group Limited | | | | | | | | | | | 18,705 | | | | 467,064 | |
Microchip Technology Incorporated | | | | | | | | | | | 69,765 | | | | 6,481,866 | |
Micron Technology Incorporated † | | | | | | | | | | | 204,880 | | | | 8,779,108 | |
NVIDIA Corporation | | | | | | | | | | | 13,765 | | | | 2,396,074 | |
ON Semiconductor Corporation † | | | | | | | | | | | 223,215 | | | | 4,287,960 | |
QUALCOMM Incorporated | | | | | | | | | | | 78,925 | | | | 6,020,399 | |
Taiwan Semiconductor Manufacturing Company Limited ADR | | | | | | | | | | | 33,510 | | | | 1,557,545 | |
Teradyne Incorporated | | | | | | | | | | | 109,225 | | | | 6,325,220 | |
Texas Instruments Incorporated | | | | | | | | | | | 23,865 | | | | 3,084,313 | |
Xilinx Incorporated | | | | | | | | | | | 20,565 | | | | 1,972,184 | |
| | | | |
| | | | | | | | | | | | | | | 80,284,826 | |
| | | | | | | | | | | | | | | | |
| | | | |
| Software: 32.52% | | | | | | | | | | | | |
Alteryx Incorporated Class A Ǡ | | | | | | | | | | | 121,755 | | | | 13,080,140 | |
Aspen Technology Incorporated † | | | | | | | | | | | 4,470 | | | | 550,168 | |
Atlassian Corporation plc Class A † | | | | | | | | | | | 69,130 | | | | 8,671,667 | |
Autodesk Incorporated † | | | | | | | | | | | 9,030 | | | | 1,333,731 | |
AVEVA Group plc | | | | | | | | | | | 34,415 | | | | 1,565,653 | |
Crowdstrike Holdings Incorporated Class A Ǡ | | | | | | | | | | | 13,890 | | | | 809,926 | |
Datadog Incorporated Class A † | | | | | | | | | | | 1,135 | | | | 38,488 | |
Dynatrace Incorporated † | | | | | | | | | | | 9,130 | | | | 170,457 | |
Elastic NV Ǡ | | | | | | | | | | | 74,918 | | | | 6,168,748 | |
ForeScout Technologies Incorporated † | | | | | | | | | | | 27,155 | | | | 1,029,718 | |
Fortinet Incorporated † | | | | | | | | | | | 60,850 | | | | 4,670,846 | |
8 | Wells Fargo Specialized Technology Fund
Portfolio of investments—September 30, 2019 (unaudited)
| | | | | | | | | | | | | | | | |
| | | | | | | | | Shares | | | Value | |
| | | | |
| Software (continued) | | | | | | | | | | | | |
Guidewire Software Incorporated † | | | | | | | | | | | 4,300 | | | $ | 453,134 | |
HubSpot Incorporated † | | | | | | | | | | | 6,450 | | | | 977,885 | |
Microsoft Corporation | | | | | | | | | | | 291,760 | | | | 40,563,393 | |
Paycom Software Incorporated † | | | | | | | | | | | 107,945 | | | | 22,613,398 | |
Proofpoint Incorporated † | | | | | | | | | | | 57,885 | | | | 7,470,059 | |
Rapid7 Incorporated † | | | | | | | | | | | 53,090 | | | | 2,409,755 | |
RealPage Incorporated † | | | | | | | | | | | 13,370 | | | | 840,438 | |
RingCentral Incorporated Class A † | | | | | | | | | | | 102,910 | | | | 12,931,671 | |
Salesforce.com Incorporated † | | | | | | | | | | | 17,639 | | | | 2,618,333 | |
ServiceNow Incorporated † | | | | | | | | | | | 22,595 | | | | 5,735,741 | |
Smartsheet Incorporated Class A † | | | | | | | | | | | 21,670 | | | | 780,770 | |
Splunk Incorporated † | | | | | | | | | | | 4,675 | | | | 550,996 | |
Temenos Group AG | | | | | | | | | | | 10,365 | | | | 1,734,337 | |
Workday Incorporated Class A † | | | | | | | | | | | 9,755 | | | | 1,657,960 | |
Zendesk Incorporated † | | | | | | | | | | | 21,185 | | | | 1,543,963 | |
Zscaler Incorporated Ǡ | | | | | | | | | | | 102,195 | | | | 4,829,736 | |
| | | | |
| | | | | | | | | | | | | | | 145,801,111 | |
| | | | | | | | | | | | | | | | |
| | | | |
| Technology Hardware, Storage & Peripherals: 3.02% | | | | | | | | | | | | |
Apple Incorporated | | | | | | | | | | | 26,350 | | | | 5,901,610 | |
NetApp Incorporated | | | | | | | | | | | 52,250 | | | | 2,743,648 | |
Pure Storage Incorporated Class A † | | | | | | | | | | | 289,385 | | | | 4,902,182 | |
| | | | |
| | | | | | | | | | | | | | | 13,547,440 | |
| | | | | | | | | | | | | | | | |
| | | | |
Total Common Stocks (Cost $305,759,448) | | | | | | | | | | | | | | | 425,853,077 | |
| | | | | | | | | | | | | | | | |
| | | | |
| | | | | | | | | | | | | | | | |
| | | Yield | | | | | | | | | | |
| Short-Term Investments: 11.12% | | | | | | | | | | | | |
| | | | |
| Investment Companies: 11.12% | | | | | | | | | | | | |
Securities Lending Cash Investments LLC (l)(r)(u) | | | 2.11 | % | | | | | | | 25,275,586 | | | | 25,278,113 | |
Wells Fargo Government Money Market Fund Select Class (l)(u) | | | 1.88 | | | | | | | | 24,573,165 | | | | 24,573,165 | |
| | | | |
Total Short-Term Investments (Cost $49,851,278) | | | | | | | | | | | | | | | 49,851,278 | |
| | | | | | | | | | | | | | | | |
| | | | | | | | |
| Total investments in securities (Cost $355,610,726) | | | 106.10 | % | | | 475,704,355 | |
| | |
Other assets and liabilities, net | | | (6.10 | ) | | | (27,334,548 | ) |
| | | | | | | | |
| Total net assets | | | 100.00 | % | | $ | 448,369,807 | |
| | | | | | | | |
| † | Non-income-earning security |
| « | All or a portion of this security is on loan. |
| (l) | The issuer of the security is an affiliated person of the Fund as defined in the Investment Company Act of 1940. |
| (r) | The investment is a non-registered investment company purchased with cash collateral received from securities on loan. |
| (u) | The rate represents the 7-day annualized yield at period end. |
Abbreviations:
| ADR | American depositary receipt |
Wells Fargo Specialized Technology Fund | 9
Portfolio of investments—September 30, 2019 (unaudited)
Investments in Affiliates
An affiliated investment is an investment in which the Fund owns at least 5% of the outstanding voting shares of the issuer or as a result of other relationships, such as the Fund and the issuer having the same investment manager. Transactions with issuers that were either affiliated persons of the Fund at the beginning of the period or the end of the period were as follows:
| | | | | | | | | | | | | | | | | | | | | | | | | | | | | | | | | | | | |
| | | Shares,
beginning of
period | | | Shares
purchased | | | Shares
sold | | | Shares,
end of
period | | | Net
realized
gains
(losses) | | | Net
change in
unrealized
gains
(losses) | | | Income
from
affiliated
securities | | | Value,
end of
period | | | % of
net
assets | |
| Short-Term Investments | | | | | | | | | | | | | | | | | | | | | | | | | | | |
Investment Companies | | | | | | | | | | | | | | | | | | | | | | | | | | | | | | | | | | | | |
Securities Lending Cash Investments LLC | | | 20,473,818 | | | | 150,439,938 | | | | 145,638,170 | | | | 25,275,586 | | | $ | (533 | ) | | $ | 0 | | | $ | 212,424 | # | | $ | 25,278,113 | | | | | |
Wells Fargo Government Money Market Fund Select Class | | | 18,717,955 | | | | 118,765,060 | | | | 112,909,850 | | | | 24,573,165 | | | | 0 | | | | 0 | | | | 300,511 | | | | 24,573,165 | | | | | |
| | | | | | | | | | | | | | | | | | | | | | | | | | | | | | | | | | | | |
| | | | | | | | | |
| | | | | | | | | | | | | | | | | | $ | (533 | ) | | $ | 0 | | | $ | 512,935 | | | $ | 49,851,278 | | | | 11.12 | % |
| | | | | | | | | | | | | | | | | | | | | | | | | | | | | | | | | | | | |
| # | Amount shown represents income before fees and rebates. |
The accompanying notes are an integral part of these financial statements.
10 | Wells Fargo Specialized Technology Fund
Statement of assets and liabilities—September 30, 2019 (unaudited)
| | | | |
| | | | |
| |
Assets | | | | |
Investments in unaffiliated securities (including $24,682,070 of securities loaned), at value (cost $305,759,448) | | $ | 425,853,077 | |
Investments in affiliated securities, at value (cost $49,851,278) | | | 49,851,278 | |
Foreign currency, at value (cost $29) | | | 29 | |
Receivable for Fund shares sold | | | 175,117 | |
Receivable for dividends | | | 126,050 | |
Receivable for securities lending income, net | | | 9,993 | |
Prepaid expenses and other assets | | | 41,374 | |
| | | | |
Total assets | | | 476,056,918 | |
| | | | |
| |
Liabilities | | | | |
Payable upon receipt of securities loaned | | | 25,278,589 | |
Payable for Fund shares redeemed | | | 1,796,088 | |
Management fee payable | | | 332,593 | |
Administration fees payable | | | 75,842 | |
Distribution fee payable | | | 6,361 | |
Trustees’ fees and expenses payable | | | 2,524 | |
Accrued expenses and other liabilities | | | 195,114 | |
| | | | |
Total liabilities | | | 27,687,111 | |
| | | | |
Total net assets | | $ | 448,369,807 | |
| | | | |
| |
Net assets consist of | | | | |
Paid-in capital | | $ | 249,361,131 | |
Total distributable earnings | | | 199,008,676 | |
| | | | |
Total net assets | | $ | 448,369,807 | |
| | | | |
| |
Computation of net asset value and offering price per share | | | | |
Net assets – Class A | | $ | 363,660,527 | |
Shares outstanding – Class A1 | | | 28,080,428 | |
Net asset value per share – Class A | | | $12.95 | |
Maximum offering price per share – Class A2 | | | $13.74 | |
Net assets – Class C | | $ | 9,905,779 | |
Shares outstanding – Class C1 | | | 1,014,974 | |
Net asset value per share – Class C | | | $9.76 | |
Net assets – Administrator Class | | $ | 20,444,132 | |
Shares outstanding – Administrator Class1 | | | 1,541,520 | |
Net asset value per share – Administrator Class | | | $13.26 | |
Net assets – Institutional Class | | $ | 54,359,369 | |
Shares outstanding – Institutional Class1 | | | 4,069,197 | |
Net asset value per share – Institutional Class | | | $13.36 | |
| 1 | The Fund has an unlimited number of authorized shares. |
| 2 | Maximum offering price is computed as 100/94.25 of net asset value. On investments of $50,000 or more, the offering price is reduced. |
The accompanying notes are an integral part of these financial statements.
Wells Fargo Specialized Technology Fund | 11
Statement of operations—six months ended September 30, 2019 (unaudited)
| | | | |
| | | | |
| |
Investment income | | | | |
Dividends (net of foreign withholding taxes of $7,196) | | $ | 1,123,350 | |
Income from affiliated securities | | | 360,854 | |
| | | | |
Total investment income | | | 1,484,204 | |
| | | | |
| |
Expenses | | | | |
Management fee | | | 2,166,085 | |
Administration fees | | | | |
Class A | | | 420,475 | |
Class C | | | 11,600 | |
Administrator Class | | | 14,381 | |
Institutional Class | | | 38,146 | |
Shareholder servicing fees | | | | |
Class A | | | 500,565 | |
Class C | | | 13,809 | |
Administrator Class | | | 27,656 | |
Distribution fee | | | | |
Class C | | | 41,428 | |
Custody and accounting fees | | | 22,869 | |
Professional fees | | | 20,729 | |
Registration fees | | | 38,260 | |
Shareholder report expenses | | | 30,090 | |
Trustees’ fees and expenses | | | 10,220 | |
Other fees and expenses | | | 9,261 | |
| | | | |
Total expenses | | | 3,365,574 | |
Less: Fee waivers and/or expense reimbursements | | | | |
Fund-level | | | (38,335 | ) |
Administrator Class | | | (794 | ) |
Institutional Class | | | (2,186 | ) |
| | | | |
Net expenses | | | 3,324,259 | |
| | | | |
Net investment loss | | | (1,840,055 | ) |
| | | | |
| |
Realized and unrealized gains (losses) on investments | | | | |
Net realized gains (losses) on | | | | |
Unaffiliated securities | | | 47,785,290 | |
Affiliated securities | | | (533 | ) |
| | | | |
Net realized gains on investments | | | 47,784,757 | |
Net change in unrealized gains (losses) on investments | | | (58,678,915 | ) |
| | | | |
Net realized and unrealized gains (losses) on investments | | | (10,894,158 | ) |
| | | | |
Net decrease in net assets resulting from operations | | $ | (12,734,213 | ) |
| | | | |
The accompanying notes are an integral part of these financial statements.
12 | Wells Fargo Specialized Technology Fund
Statement of changes in net assets
| | | | | | | | | | | | | | | | |
| | | Six months ended
September 30, 2019
(unaudited) | | | Year ended
March 31, 2019 | |
| | | | |
Operations | | | | | | | | | | | | | | | | |
Net investment loss | | | | | | $ | (1,840,055 | ) | | | | | | $ | (3,499,634 | ) |
Net realized gains on investments | | | | | | | 47,784,757 | | | | | | | | 35,766,720 | |
Net change in unrealized gains (losses) on investments | | | | | | | (58,678,915 | ) | | | | | | | 32,208,814 | |
| | | | |
Net increase (decrease) in net assets resulting from operations | | | | | | | (12,734,213 | ) | | | | | | | 64,475,900 | |
| | | | |
| | | |
Distributions to shareholders from net investment income and net realized gains | | | | | | | | | | | | | |
Class A | | | | | | | 0 | | | | | | | | (67,273,231 | ) |
Class C | | | | | | | 0 | | | | | | | | (3,624,112 | ) |
Administrator Class | | | | | | | 0 | | | | | | | | (4,975,885 | ) |
Institutional Class | | | | | | | 0 | | | | | | | | (7,475,902 | ) |
| | | | |
Total distributions to shareholders | | | | | | | 0 | | | | | | | | (83,349,130 | ) |
| | | | |
| | | | |
Capital share transactions | | | Shares | | | | | | | | Shares | | | | | |
Proceeds from shares sold | | | | | | | | | | | | | | | | |
Class A | | | 580,552 | | | | 8,004,022 | | | | 4,113,717 | | | | 60,597,284 | |
Class C | | | 79,987 | | | | 836,546 | | | | 268,796 | | | | 3,062,171 | |
Administrator Class | | | 171,673 | | | | 2,426,568 | | | | 1,538,764 | | | | 23,150,690 | |
Institutional Class | | | 1,133,130 | | | | 16,029,313 | | | | 2,894,403 | | | | 42,700,368 | |
| | | | |
| | | | | | | 27,296,449 | | | | | | | | 129,510,513 | |
| | | | |
Reinvestment of distributions | | | | | | | | | | | | | | | | |
Class A | | | 0 | | | | 0 | | | | 5,657,801 | | | | 65,404,176 | |
Class C | | | 0 | | | | 0 | | | | 398,400 | | | | 3,489,984 | |
Administrator Class | | | 0 | | | | 0 | | | | 419,248 | | | | 4,955,513 | |
Institutional Class | | | 0 | | | | 0 | | | | 620,076 | | | | 7,372,701 | |
| | | | |
| | | | | | | 0 | | | | | | | | 81,222,374 | |
| | | | |
Payment for shares redeemed | | | | | | | | | | | | | | | | |
Class A | | | (2,648,931 | ) | | | (36,247,333 | ) | | | (4,727,403 | ) | | | (66,144,891 | ) |
Class C | | | (216,636 | ) | | | (2,234,973 | ) | | | (914,962 | ) | | | (9,401,210 | ) |
Administrator Class | | | (277,370 | ) | | | (3,890,283 | ) | | | (1,645,125 | ) | | | (21,244,618 | ) |
Institutional Class | | | (794,733 | ) | | | (11,127,966 | ) | | | (1,697,391 | ) | | | (23,893,325 | ) |
| | | | |
| | | | | | | (53,500,555 | ) | | | | | | | (120,684,044 | ) |
| | | | |
Net increase (decrease) in net assets resulting from capital share transactions | | | | | | | (26,204,106 | ) | | | | | | | 90,048,843 | |
| | | | |
Total increase (decrease) in net assets | | | | | | | (38,938,319 | ) | | | | | | | 71,175,613 | |
| | | | |
| | | | |
Net assets | | | | | | | | | | | | | | | | |
Beginning of period | | | | | | | 487,308,126 | | | | | | | | 416,132,513 | |
| | | | |
End of period | | | | | | $ | 448,369,807 | | | | | | | $ | 487,308,126 | |
| | | | |
The accompanying notes are an integral part of these financial statements.
Wells Fargo Specialized Technology Fund | 13
Financial highlights
(For a share outstanding throughout each period)
| | | | | | | | | | | | | | | | | | | | | | | | |
| | | Six months ended
September 30, 2019
(unaudited) | | | Year ended March 31 | |
| CLASS A | | 2019 | | | 2018 | | | 2017 | | | 2016 | | | 2015 | |
Net asset value, beginning of period | | | $13.33 | | | | $14.08 | | | | $10.95 | | | | $9.39 | | | | $10.74 | | | | $10.65 | |
Net investment loss | | | (0.05 | ) | | | (0.11 | ) | | | (0.10 | )1 | | | (0.03 | )1 | | | (0.06 | ) | | | (0.06 | ) |
Net realized and unrealized gains (losses) on investments | | | (0.33 | ) | | | 2.06 | | | | 4.20 | | | | 2.17 | | | | 0.02 | | | | 1.43 | |
| | | | | | | | | | | | | | | | | | | | | | | | |
Total from investment operations | | | (0.38 | ) | | | 1.95 | | | | 4.10 | | | | 2.14 | | | | (0.04 | ) | | | 1.37 | |
Distributions to shareholders from | | | | | | | | | | | | | | | | | | | | | | | | |
Net realized gains | | | 0.00 | | | | (2.70 | ) | | | (0.97 | ) | | | (0.58 | ) | | | (1.31 | ) | | | (1.28 | ) |
Net asset value, end of period | | | $12.95 | | | | $13.33 | | | | $14.08 | | | | $10.95 | | | | $9.39 | | | | $10.74 | |
Total return2 | | | (2.85 | )% | | | 16.80 | % | | | 38.41 | % | | | 23.55 | % | | | (0.66 | )% | | | 13.24 | % |
Ratios to average net assets (annualized) | | | | | | | | | | | | | | | | | | | | | | | | |
Gross expenses | | | 1.39 | % | | | 1.40 | % | | | 1.41 | % | | | 1.44 | % | | | 1.45 | % | | | 1.52 | % |
Net expenses | | | 1.38 | % | | | 1.39 | % | | | 1.41 | % | | | 1.44 | % | | | 1.45 | % | | | 1.51 | % |
Net investment loss | | | (0.77 | )% | | | (0.77 | )% | | | (0.75 | )% | | | (0.28 | )% | | | (0.53 | )% | | | (0.58 | )% |
Supplemental data | | | | | | | | | | | | | | | | | | | | | | | | |
Portfolio turnover rate | | | 63 | % | | | 107 | % | | | 109 | % | | | 131 | % | | | 153 | % | | | 119 | % |
Net assets, end of period (000s omitted) | | | $363,661 | | | | $401,990 | | | | $353,552 | | | | $266,329 | | | | $267,811 | | | | $168,108 | |
| 1 | Calculated based upon average shares outstanding |
| 2 | Total return calculations do not include any sales charges. Returns for periods of less than one year are not annualized. |
The accompanying notes are an integral part of these financial statements.
14 | Wells Fargo Specialized Technology Fund
Financial highlights
(For a share outstanding throughout each period)
| | | | | | | | | | | | | | | | | | | | | | | | |
| | | Six months ended
September 30, 2019
(unaudited) | | | Year ended March 31 | |
| CLASS C | | 2019 | | | 2018 | | | 2017 | | | 2016 | | | 2015 | |
Net asset value, beginning of period | | | $10.09 | | | | $11.38 | | | | $9.06 | | | | $7.92 | | | | $9.33 | | | | $9.47 | |
Net investment loss | | | (0.08 | )1 | | | (0.17 | )1 | | | (0.16 | ) | | | (0.09 | )1 | | | (0.12 | )1 | | | (0.13 | )1 |
Net realized and unrealized gains (losses) on investments | | | (0.25 | ) | | | 1.58 | | | | 3.45 | | | | 1.81 | | | | 0.02 | | | | 1.27 | |
| | | | | | | | | | | | | | | | | | | | | | | | |
Total from investment operations | | | (0.33 | ) | | | 1.41 | | | | 3.29 | | | | 1.72 | | | | (0.10 | ) | | | 1.14 | |
Distributions to shareholders from | | | | | | | | | | | | | | | | | | | | | | | | |
Net realized gains | | | 0.00 | | | | (2.70 | ) | | | (0.97 | ) | | | (0.58 | ) | | | (1.31 | ) | | | (1.28 | ) |
Net asset value, end of period | | | $9.76 | | | | $10.09 | | | | $11.38 | | | | $9.06 | | | | $7.92 | | | | $9.33 | |
Total return2 | | | (3.27 | )% | | | 16.01 | % | | | 37.45 | % | | | 22.59 | % | | | (1.45 | )% | | | 12.44 | % |
Ratios to average net assets (annualized) | | | | | | | | | | | | | | | | | | | | | | | | |
Gross expenses | | | 2.14 | % | | | 2.15 | % | | | 2.16 | % | | | 2.19 | % | | | 2.20 | % | | | 2.27 | % |
Net expenses | | | 2.13 | % | | | 2.14 | % | | | 2.16 | % | | | 2.19 | % | | | 2.20 | % | | | 2.26 | % |
Net investment loss | | | (1.52 | )% | | | (1.52 | )% | | | (1.49 | )% | | | (1.03 | )% | | | (1.34 | )% | | | (1.33 | )% |
Supplemental data | | | | | | | | | | | | | | | | | | | | | | | | |
Portfolio turnover rate | | | 63 | % | | | 107 | % | | | 109 | % | | | 131 | % | | | 153 | % | | | 119 | % |
Net assets, end of period (000s omitted) | | | $9,906 | | | | $11,615 | | | | $15,932 | | | | $12,827 | | | | $13,797 | | | | $14,143 | |
| 1 | Calculated based upon average shares outstanding |
| 2 | Total return calculations do not include any sales charges. Returns for periods of less than one year are not annualized. |
The accompanying notes are an integral part of these financial statements.
Wells Fargo Specialized Technology Fund | 15
Financial highlights
(For a share outstanding throughout each period)
| | | | | | | | | | | | | | | | | | | | | | | | |
| | | Six months ended
September 30, 2019
(unaudited) | | | Year ended March 31 | |
| ADMINISTRATOR CLASS | | 2019 | | | 2018 | | | 2017 | | | 2016 | | | 2015 | |
Net asset value, beginning of period | | | $13.65 | | | | $14.34 | | | | $11.12 | | | | $9.52 | | | | $10.86 | | | | $10.74 | |
Net investment loss | | | (0.05 | )1 | | | (0.09 | )1 | | | (0.09 | )1 | | | (0.02 | ) | | | (0.05 | ) | | | (0.05 | ) |
Net realized and unrealized gains (losses) on investments | | | (0.34 | ) | | | 2.10 | | | | 4.28 | | | | 2.20 | | | | 0.02 | | | | 1.45 | |
| | | | | | | | | | | | | | | | | | | | | | | | |
Total from investment operations | | | (0.39 | ) | | | 2.01 | | | | 4.19 | | | | 2.18 | | | | (0.03 | ) | | | 1.40 | |
Distributions to shareholders from | | | | | | | | | | | | | | | | | | | | | | | | |
Net realized gains | | | 0.00 | | | | (2.70 | ) | | | (0.97 | ) | | | (0.58 | ) | | | (1.31 | ) | | | (1.28 | ) |
Net asset value, end of period | | | $13.26 | | | | $13.65 | | | | $14.34 | | | | $11.12 | | | | $9.52 | | | | $10.86 | |
Total return2 | | | (2.86 | )% | | | 17.02 | % | | | 38.55 | % | | | 23.65 | % | | | (0.56 | )% | | | 13.42 | % |
Ratios to average net assets (annualized) | | | | | | | | | | | | | | | | | | | | | | | | |
Gross expenses | | | 1.31 | % | | | 1.32 | % | | | 1.33 | % | | | 1.36 | % | | | 1.35 | % | | | 1.36 | % |
Net expenses | | | 1.28 | % | | | 1.29 | % | | | 1.32 | % | | | 1.33 | % | | | 1.33 | % | | | 1.35 | % |
Net investment loss | | | (0.67 | )% | | | (0.65 | )% | | | (0.66 | )% | | | (0.17 | )% | | | (0.48 | )% | | | (0.42 | )% |
Supplemental data | | | | | | | | | | | | | | | | | | | | | | | | |
Portfolio turnover rate | | | 63 | % | | | 107 | % | | | 109 | % | | | 131 | % | | | 153 | % | | | 119 | % |
Net assets, end of period (000s omitted) | | | $20,444 | | | | $22,480 | | | | $19,140 | | | | $39,833 | | | | $32,373 | | | | $31,842 | |
| 1 | Calculated based upon average shares outstanding |
| 2 | Returns for periods of less than one year are not annualized. |
The accompanying notes are an integral part of these financial statements.
16 | Wells Fargo Specialized Technology Fund
Financial highlights
(For a share outstanding throughout each period)
| | | | | | | | | | | | | | | | |
| | | Six months ended
September 30, 2019
(unaudited) | | | Year ended March 31 | |
| INSTITUTIONAL CLASS | | 2019 | | | 2018 | | | 20171 | |
Net asset value, beginning of period | | | $13.73 | | | | $14.37 | | | | $11.12 | | | | $10.42 | |
Net investment income (loss) | | | (0.03 | ) | | | (0.07 | ) | | | (0.05 | ) | | | 0.01 | 2 |
Net realized and unrealized gains (losses) on investments | | | (0.34 | ) | | | 2.13 | | | | 4.27 | | | | 1.27 | |
| | | | | | | | | | | | | | | | |
Total from investment operations | | | (0.37 | ) | | | 2.06 | | | | 4.22 | | | | 1.28 | |
Distributions to shareholders from | | | | | | | | | | | | | | | | |
Net realized gains | | | 0.00 | | | | (2.70 | ) | | | (0.97 | ) | | | (0.58 | ) |
Net asset value, end of period | | | $13.36 | | | | $13.73 | | | | $14.37 | | | | $11.12 | |
Total return3 | | | (2.69 | )% | | | 17.25 | % | | | 38.91 | % | | | 12.97 | % |
Ratios to average net assets (annualized) | | | | | | | | | | | | | | | | |
Gross expenses | | | 1.06 | % | | | 1.07 | % | | | 1.08 | % | | | 1.11 | % |
Net expenses | | | 1.03 | % | | | 1.04 | % | | | 1.07 | % | | | 1.08 | % |
Net investment income (loss) | | | (0.43 | )% | | | (0.42 | )% | | | (0.40 | )% | | | 0.17 | % |
Supplemental data | | | | | | | | | | | | | | | | |
Portfolio turnover rate | | | 63 | % | | | 107 | % | | | 109 | % | | | 131 | % |
Net assets, end of period (000s omitted) | | | $54,359 | | | | $51,223 | | | | $27,509 | | | | $19,869 | |
| 1 | For the period from October 31, 2016 (commencement of class operations) to March 31, 2017 |
| 2 | Calculated based upon average shares outstanding |
| 3 | Returns for periods of less than one year are not annualized. |
The accompanying notes are an integral part of these financial statements.
Wells Fargo Specialized Technology Fund | 17
Notes to financial statements (unaudited)
1. ORGANIZATION
Wells Fargo Funds Trust (the “Trust”), a Delaware statutory trust organized on March 10, 1999, is an open-end management investment company registered under the Investment Company Act of 1940, as amended (the “1940 Act”). As an investment company, the Trust follows the accounting and reporting guidance in Financial Accounting Standards Board (“FASB”) Accounting Standards Codification Topic 946, Financial Services – Investment Companies. These financial statements report on the Wells Fargo Specialized Technology Fund (the “Fund”) which is a non-diversified series of the Trust.
2. SIGNIFICANT ACCOUNTING POLICIES
The following significant accounting policies, which are consistently followed in the preparation of the financial statements of the Fund, are in conformity with U.S. generally accepted accounting principles which require management to make estimates and assumptions that affect the reported amounts of assets and liabilities, disclosure of contingent assets and liabilities at the date of the financial statements, and the reported amounts of revenues and expenses during the reporting period. Actual results could differ from those estimates.
Securities valuation
All investments are valued each business day as of the close of regular trading on the New York Stock Exchange (generally 4 p.m. Eastern Time), although the Fund may deviate from this calculation time under unusual or unexpected circumstances.
Equity securities that are listed on a foreign or domestic exchange or market are valued at the official closing price or, if none, the last sales price. If no sale occurs on the principal exchange or market that day, a fair value price will be determined in accordance with the Fund’s Valuation Procedures.
The values of securities denominated in foreign currencies are translated into U.S. dollars at rates provided by an independent foreign currency pricing source at a time each business day specified by the Wells Fargo Asset Management Pricing Committee at Wells Fargo Funds Management, LLC (“Funds Management”)
Many securities markets and exchanges outside the U.S. close prior to the close of the New York Stock Exchange and therefore may not fully reflect trading or events that occur after the close of the principal exchange in which the foreign securities are traded, but before the close of the New York Stock Exchange. If such trading or events are expected to materially affect the value of such securities, then fair value pricing procedures approved by the Board of Trustees of the Fund are applied. These procedures take into account multiple factors including movements in U.S. securities markets after foreign exchanges close. Foreign securities that are fair valued under these procedures are categorized as Level 2 and the application of these procedures may result in transfers between Level 1 and Level 2. Depending on market activity, such fair valuations may be frequent. Such fair value pricing may result in net asset values that are higher or lower than net asset values based on the last reported sales price or latest quoted bid price. On September 30, 2019, such fair value pricing was not used in pricing foreign securities.
Investments in registered open-end investment companies are valued at net asset value. Interests in non-registered investment companies that are redeemable at net asset value are fair valued normally at net asset value.
Investments which are not valued using any of the methods discussed above are valued at their fair value, as determined in good faith by the Board of Trustees. The Board of Trustees has established a Valuation Committee comprised of the Trustees and has delegated to it the authority to take any actions regarding the valuation of portfolio securities that the Valuation Committee deems necessary or appropriate, including determining the fair value of portfolio securities, unless the determination has been delegated to the Wells Fargo Asset Management Pricing Committee. The Board of Trustees retains the authority to make or ratify any valuation decisions or approve any changes to the Valuation Procedures as it deems appropriate. On a quarterly basis, the Board of Trustees receives reports on any valuation actions taken by the Valuation Committee or the Wells Fargo Asset Management Pricing Committee which may include items for ratification.
Foreign currency translation
The accounting records of the Fund are maintained in U.S. dollars. The values of other assets and liabilities denominated in foreign currencies are translated into U.S. dollars at rates provided by an independent foreign currency pricing source at a time each business day specified by the Wells Fargo Asset Management Pricing Committee. Purchases and sales of securities, and income and expenses are converted at the rate of exchange on the respective dates of such transactions. Net realized foreign exchange gains or losses arise from sales of foreign currencies, currency gains or losses realized between the trade and settlement dates on securities transactions, and the difference between the amounts of dividends, interest and foreign withholding taxes recorded and the U.S. dollar equivalent of the amounts actually paid or received. Net unrealized foreign exchange gains and losses arise from changes in the fair value of assets and liabilities other than investments in securities resulting from changes in exchange rates. The changes in net assets arising from changes in exchange rates of securities and the changes in net assets resulting from changes in market prices of securities are not separately presented. Such changes are included in net realized and unrealized gains or losses from investments.
18 | Wells Fargo Specialized Technology Fund
Notes to financial statements (unaudited)
Forward foreign currency contracts
A forward foreign currency contract is an agreement between two parties to purchase or sell a specific currency for anagreed-upon price at a future date. The Fund enters into forward foreign currency contracts to facilitate transactions inforeign-denominated securities and to attempt to minimize the risk to the Fund from adverse changes in the relationship between currencies. Forward foreign currency contracts are recorded at the forward rate and marked-to-market daily. When the contracts are closed, realized gains and losses arising from such transactions are recorded as realized gains or losses on forward foreign currency contracts. The Fund is subject to foreign currency risk and may be exposed to risks if the counterparties to the contracts are unable to meet the terms of their contracts or if the value of the foreign currency changes unfavorably. The Fund’s maximum risk of loss from counterparty credit risk is the unrealized gains on the contracts. This risk may be mitigated if there is a master netting arrangement between the Fund and the counterparty.
Securities lending
The Fund may lend its securities from time to time in order to earn additional income in the form of fees or interest on securities received as collateral or the investment of any cash received as collateral. When securities are on loan, the Fund receives interest or dividends on those securities. Cash collateral received in connection with its securities lending transactions is invested in Securities Lending Cash Investments, LLC (the “Securities Lending Fund”). Investments in Securities Lending Fund are valued at the evaluated bid price provided by an independent pricing service. Income earned from investment in the Securities Lending Fund (net of fees and rebates), if any, is included in income from affiliated securities on the Statement of Operations.
In a securities lending transaction, the net asset value of the Fund is affected by an increase or decrease in the value of the securities loaned and by an increase or decrease in the value of the instrument in which collateral is invested. The amount of securities lending activity undertaken by the Fund fluctuates from time to time. The Fund has the right under the lending agreement to recover the securities from the borrower on demand. In the event of default or bankruptcy by the borrower, the Fund may be prevented from recovering the loaned securities or gaining access to the collateral or may experience delays or costs in doing so. In such an event, the terms of the agreement allows the unaffiliated securities lending agent to use the collateral to purchase replacement securities on behalf of the Fund or pay the Fund the market value of the loaned securities. The Fund bears the risk of loss with respect to depreciation of its investment of the cash collateral.
Security transactions and income recognition
Securities transactions are recorded on a trade date basis. Realized gains or losses are recorded on the basis of identified cost.
Dividend income is recognized on the ex-dividend date, except for certain dividends from foreign securities, which are recorded as soon as the custodian verifies the ex-dividend date. Dividend income from foreign securities is recorded net of foreign taxes withheld where recovery of such taxes is not assured.
Distributions to shareholders
Distributions to shareholders from net investment income and any net realized gains are recorded on the ex-dividend date and paid at least annually. Such distributions are determined in accordance with income tax regulations and may differ from U.S. generally accepted accounting principles. Dividend sources are estimated at the time of declaration. The tax character of distributions is determined as of the Fund’s fiscal year end. Therefore, a portion of the Fund’s distributions made prior to the Fund’s fiscal year end may be categorized as a tax return of capital at year end.
Federal and other taxes
The Fund intends to continue to qualify as a regulated investment company by distributing substantially all of its investment company taxable income and any net realized capital gains (after reduction for capital loss carryforwards) sufficient to relieve it from all, or substantially all, federal income taxes. Accordingly, no provision for federal income taxes was required.
The Fund’s income and federal excise tax returns and all financial records supporting those returns for the prior three fiscal years are subject to examination by the federal and Delaware revenue authorities. Management has analyzed the Fund’s tax positions taken on federal, state, and foreign tax returns for all open tax years and does not believe that there are any uncertain tax positions that require recognition of a tax liability.
As of September 30, 2019, the aggregate cost of all investments for federal income tax purposes was $361,141,083 and the unrealized gains (losses) consisted of:
| | | | |
| |
Gross unrealized gains | | $ | 125,663,844 | |
| |
Gross unrealized losses | | | (11,100,572 | ) |
| |
Net unrealized gains | | $ | 114,563,272 | |
Wells Fargo Specialized Technology Fund | 19
Notes to financial statements (unaudited)
As of March 31, 2019, the Fund had a qualified late-year ordinary loss of $783,694 which was recognized on the first day of the current fiscal year.
Class allocations
The separate classes of shares offered by the Fund differ principally in applicable sales charges, distribution, shareholder servicing, and administration fees. Class specific expenses are charged directly to that share class. Investment income, common fund-level expenses, and realized and unrealized gains (losses) on investments are allocated daily to each class of shares based on the relative proportion of net assets of each class.
3. FAIR VALUATION MEASUREMENTS
Fair value measurements of investments are determined within a framework that has established a fair value hierarchy based upon the various data inputs utilized in determining the value of the Fund’s investments. The three-level hierarchy gives the highest priority to unadjusted quoted prices in active markets for identical assets or liabilities (Level 1) and the lowest priority to unobservable inputs (Level 3). The Fund’s investments are classified within the fair value hierarchy based on the lowest level of input that is significant to the fair value measurement. The inputs are summarized into three broad levels as follows:
| ∎ | | Level 1 – quoted prices in active markets for identical securities |
| ∎ | | Level 2 – other significant observable inputs (including quoted prices for similar securities, interest rates, prepayment speeds, credit risk, etc.) |
| ∎ | | Level 3 – significant unobservable inputs (including the Fund’s own assumptions in determining the fair value of investments) |
The inputs or methodologies used for valuing investments in securities are not necessarily an indication of the risk associated with investing in those securities.
The following is a summary of the inputs used in valuing the Fund’s assets and liabilities as of September 30, 2019:
| | | | | | | | | | | | | | | | |
| | | | |
| | | Quoted prices (Level 1) | | | Other significant observable inputs (Level 2) | | | Significant unobservable inputs (Level 3) | | | Total | |
| | | | |
Assets | | | | | | | | | | | | | | | | |
Investments in: | | | | | | | | | | | | | | | | |
| | | | |
Common stocks | | | | | | | | | | | | | | | | |
| | | | |
Communication services | | $ | 55,897,443 | | | $ | 0 | | | $ | 0 | | | $ | 55,897,443 | |
| | | | |
Consumer discretionary | | | 22,108,913 | | | | 0 | | | | 0 | | | | 22,108,913 | |
| | | | |
Health care | | | 1,711,655 | | | | 0 | | | | 0 | | | | 1,711,655 | |
| | | | |
Industrials | | | 3,120,691 | | | | 0 | | | | 0 | | | | 3,120,691 | |
| | | | |
Information technology | | | 343,014,375 | | | | 0 | | | | 0 | | | | 343,014,375 | |
| | | | |
Short-term investments | | | | | | | | | | | | | | | | |
| | | | |
Investment companies | | | 49,851,278 | | | | 0 | | | | 0 | | | | 49,851,278 | |
| | | | |
Total assets | | $ | 475,704,355 | | | $ | 0 | | | $ | 0 | | | $ | 475,704,355 | |
Additional sector, industry or geographic detail is included in the Portfolio of Investments.
For the six months ended September 30, 2019, the Fund did not have any transfers into/out of Level 3.
4. TRANSACTIONS WITH AFFILIATES AND OTHER EXPENSES
Management fee
Funds Management, an indirect wholly owned subsidiary of Wells Fargo & Company (“Wells Fargo”), is the manager of the Fund and provides advisory and fund-level administrative services under an investment management agreement. Under the investment management agreement, Funds Management is responsible for, among other services, implementing the investment objectives and strategies of the Fund, supervising the subadviser and providing fund-level administrative services in
20 | Wells Fargo Specialized Technology Fund
Notes to financial statements (unaudited)
connection with the Fund’s operations. As compensation for its services under the investment management agreement, Funds Management is entitled to receive a management fee at the following annual rate based on the Fund’s average daily net assets:
| | | | |
| |
| Average daily net assets | | Management fee | |
| |
First $500 million | | | 0.880 | % |
| |
Next $500 million | | | 0.875 | |
| |
Next $1 billion | | | 0.850 | |
| |
Next $2 billion | | | 0.825 | |
| |
Next $1 billion | | | 0.800 | |
| |
Next $5 billion | | | 0.790 | |
| |
Over $10 billion | | | 0.780 | |
For the six months ended September 30, 2019, the management fee was equivalent to an annual rate of 0.88% of the Fund’s average daily net assets.
Funds Management has retained the services of a subadviser to provide daily portfolio management to the Fund. The fee for subadvisory services is borne by Funds Management. Allianz Global Investors U.S. LLC, which is not an affiliate of Funds Management, is the subadviser to the Fund and is entitled to receive a fee from Funds Management at an annual rate starting at 0.80% and declining to 0.55% as the average daily net assets of the Fund increase.
Administration fees
Under a class-level administration agreement, Funds Management provides class-level administrative services to the Fund, which includes paying fees and expenses for services provided by the transfer agent, sub-transfer agents, omnibus account servicers and record-keepers. As compensation for its services under the class-level administration agreement, Funds Management receives an annual fee which is calculated based on the average daily net assets of each class as follows:
| | | | |
| |
| | | Class-level administration fee | |
| |
Class A, Class C | | | 0.21 | % |
| |
Administrator Class, Institutional Class | | | 0.13 | |
Waivers and/or expense reimbursements
Funds Management has contractually waived and/or reimbursed management and administration fees to the extent necessary to maintain certain net operating expense ratios for the Fund. When each class of the Fund has exceeded its expense cap, Funds Management has waived fees and/or reimbursed expenses from fund-level expenses on a proportionate basis and then from class specific expenses. When only certain classes exceed their expense caps, waivers and/or reimbursements are applied against class specific expenses before fund-level expenses. Funds Management has committed through July 31, 2020 to waive fees and/or reimburse expenses to the extent necessary to cap the Fund’s expenses at 1.38% for Class A shares, 2.13% for Class C shares, 1.28% for Administrator Class shares, and 1.03% for Institutional Class shares. Prior to or after the commitment expiration date, the cap may be increased or the commitment to maintain the cap may be terminated only with the approval of the Board of Trustees.
Distribution fee
The Trust has adopted a distribution plan for Class C shares of the Fund pursuant to Rule 12b-1 under the 1940 Act. A distribution fee is charged to Class C shares and paid to Wells Fargo Funds Distributor, LLC (“Funds Distributor”), the principal underwriter, at an annual rate of 0.75% of the average daily net assets of Class C shares.
In addition, Funds Distributor is entitled to receive the front-end sales charge from the purchase of Class A shares and a contingent deferred sales charge on the redemption of certain Class A shares. Funds Distributor is also entitled to receive the contingent deferred sales charges from redemptions of Class C shares. For the six months ended September 30, 2019, Funds Distributor received $5,437 from the sale of Class A shares and $24 in contingent deferred sales charges from redemptions of Class C shares. No contingent deferred sales charges were incurred by Class A shares for the six months ended September 30, 2019.
Shareholder servicing fees
The Trust has entered into contracts with one or more shareholder servicing agents, whereby Class A, Class C, and Administrator Class of the Fund are charged a fee at an annual rate of 0.25% of the average daily net assets of each respective class. A portion of these total shareholder servicing fees were paid to affiliates of Wells Fargo.
Wells Fargo Specialized Technology Fund | 21
Notes to financial statements (unaudited)
Interfund transactions
The Fund may purchase or sell portfolio investment securities to certain other Wells Fargo affiliates pursuant to Rule 17a-7 under the 1940 Act and under procedures adopted by the Board of Trustees. The procedures have been designed to ensure that these interfund transactions, which do not incur broker commissions, are effected at current market prices.
5. INVESTMENT PORTFOLIO TRANSACTIONS
Purchases and sales of investments, excluding U.S. government obligations (if any) and short-term securities, for the six months ended September 30, 2019 were $290,863,471 and $324,934,214, respectively.
6. SECURITIES LENDING TRANSACTIONS
The Fund lends its securities through an unaffiliated securities lending agent and receives collateral in the form of cash or securities with a value at least equal to the value of the securities on loan. The value of the loaned securities is determined at the close of each business day and any increases or decreases in the required collateral are exchanged between the Fund and the counterparty on the next business day. Cash collateral received is invested in the Securities Lending Fund which seeks to provide a positive return compared to the daily Fed Funds Open Rate by investing in high-quality, U.S. dollar-denominated short-term money market instruments and is exempt from registration under Section 3(c)(7) of the 1940 Act. Securities Lending Fund is managed by Funds Management and is subadvised by Wells Capital Management Incorporated (“WellsCap”), an affiliate of Funds Management and an indirect wholly owned subsidiary of Wells Fargo. Funds Management receives an advisory fee starting at 0.05% and declining to 0.01% as the average daily net assets of the Securities Lending Fund increase. All of the fees received by Funds Management are paid to WellsCap for its services as subadviser.
In the event of counterparty default or the failure of a borrower to return a loaned security, the Fund has the right to use the collateral to offset any losses incurred. As of September 30, 2019, the Fund had securities lending transactions with the following counterparties which are subject to offset:
| | | | | | | | | | | | |
| | | |
| Counterparty | | Value of securities on loan | | | Collateral received1 | | | Net amount | |
| | | |
Bank of America Securities Inc. | | $ | 6,286,038 | | | $ | (6,286,038 | ) | | $ | 0 | |
| | | |
Barclays Capital Inc. | | | 3,109,245 | | | | (3,109,245 | ) | | | 0 | |
| | | |
BNP Paribas Securities Corp. | | | 3,572,990 | | | | (3,572,990 | ) | | | 0 | |
| | | |
Citigroup Global Markets Inc. | | | 1,928,329 | | | | (1,928,329 | ) | | | 0 | |
| | | |
JPMorgan Securities LLC | | | 7,115,012 | | | | (7,115,012 | ) | | | 0 | |
| | | |
Morgan Stanley & Co. LLC | | | 1,559,285 | | | | (1,559,285 | ) | | | 0 | |
| | | |
Scotia Capital (USA) Inc. | | | 817,586 | | | | (817,586 | ) | | | 0 | |
| | | |
UBS Securities LLC | | | 293,585 | | | | (293,585 | ) | | | 0 | |
| 1 | Collateral received within this table is limited to the collateral for the net transaction with the counterparty. |
7. BANK BORROWINGS
The Trust (excluding the money market funds), Wells Fargo Master Trust and Wells Fargo Variable Trust are parties to a $280,000,000 revolving credit agreement whereby the Fund is permitted to use bank borrowings for temporary or emergency purposes, such as to fund shareholder redemption requests. Interest under the credit agreement is charged to the Fund based on a borrowing rate equal to the higher of the Federal Funds rate in effect on that day plus 1.25% or the overnight LIBOR rate in effect on that day plus 1.25%. In addition, an annual commitment fee equal to 0.25% of the unused balance is allocated to each participating fund.
For the six months ended September 30, 2019, there were no borrowings by the Fund under the agreement.
8. CONCENTRATION RISK
The Fund invests a substantial portion of its assets in information technology companies and, therefore, would be more affected by changes in the information technology sector than would be a fund whose investments are not heavily weighted in the sector.
22 | Wells Fargo Specialized Technology Fund
Notes to financial statements (unaudited)
9. INDEMNIFICATION
Under the Trust’s organizational documents, the officers and Trustees have been granted certain indemnification rights against certain liabilities that may arise out of performance of their duties to the Trust. Additionally, in the normal course of business, the Trust may enter into contracts with service providers that contain a variety of indemnification clauses. The Trust’s maximum exposure under these arrangements is dependent on future claims that may be made against the Fund and, therefore, cannot be estimated.
10. NEW ACCOUNTING PRONOUNCEMENT
In August 2018, FASB issued Accounting Standards Update (“ASU”) No. 2018-13, Fair Value Measurement (Topic 820)Disclosure Framework—Changes to the Disclosure Requirements for Fair Value Measurement. ASU 2018-13 updates the disclosure requirements for fair value measurements by modifying or removing certain disclosures and adding certain new disclosures. The amendments are effective for fiscal years, and interim periods within those fiscal years, beginning after December 15, 2019. Early adoption is permitted. Management has adopted the removal and modification of disclosures early, as permitted, and will adopt the additional new disclosures at the effective date.
Wells Fargo Specialized Technology Fund | 23
Other information (unaudited)
PROXY VOTING INFORMATION
A description of the policies and procedures used to determine how to vote proxies relating to portfolio securities is available, upon request, by calling1-800-222-8222, visiting our website atwfam.com, or visiting the SEC website at sec.gov. Information regarding how the proxies related to portfolio securities were voted during the most recent 12-month period ended June 30 is available on the website atwfam.comor by visiting the SEC website at sec.gov.
QUARTERLY PORTFOLIO HOLDINGS INFORMATION
The Fund files its complete schedule of portfolio holdings with the SEC for the first and third quarters of each fiscal year on Form N-Q or Form N-PORT, which is available by visiting the SEC website at sec.gov. Those forms may be reviewed and copied at the SEC’s Public Reference Room in Washington, DC. Information on the operation of the Public Reference Room may be obtained bycalling 1-800-SEC-0330.
24 | Wells Fargo Specialized Technology Fund
Other information (unaudited)
BOARD OF TRUSTEES AND OFFICERS
Each of the Trustees and Officers1 listed in the table below acts in identical capacities for each fund in the Wells Fargo family of funds, which consists of 150 mutual funds comprising the Wells Fargo Funds Trust, Wells Fargo Variable Trust, Wells Fargo Master Trust and four closed-end funds (collectively the “Fund Complex”). This table should be read in conjunction with the Prospectus and the Statement of Additional Information2. The mailing address of each Trustee and Officer is 525 Market Street, 12th Floor, San Francisco, CA 94105. Each Trustee and Officer serves an indefinite term, however, each Trustee serves such term until reaching the mandatory retirement age established by the Trustees.
Independent Trustees
| | | | | | |
Name and year of birth | | Position held and length of service* | | Principal occupations during past five years or longer | | Current other public company or investment company directorships |
| | | |
William R. Ebsworth (Born 1957) | | Trustee, since 2015 | | Retired. From 1984 to 2013, equities analyst, portfolio manager, research director and chief investment officer at Fidelity Management and Research Company in Boston, Tokyo, and Hong Kong, and retired in 2013 as Chief Investment Officer of Fidelity Strategic Advisers, Inc. where he led a team of investment professionals managing client assets. Prior thereto, Board member of Hong Kong Securities Clearing Co., Hong Kong Options Clearing Corp., the Thailand International Fund, Ltd., Fidelity Investments Life Insurance Company, and Empire Fidelity Investments Life Insurance Company. Audit Committee Chair and Investment Committee Chair of the Vincent Memorial Hospital Endowment (non-profit organization). Mr. Ebsworth is a CFA® charterholder. | | N/A |
| | | |
Jane A. Freeman (Born 1953) | | Trustee, since 2015; Chair Liaison, since 2018 | | Retired. From 2012 to 2014 and 1999 to 2008, Chief Financial Officer of Scientific Learning Corporation. From 2008 to 2012, Ms. Freeman provided consulting services related to strategic business projects. Prior to 1999, Portfolio Manager at Rockefeller & Co. and Scudder, Stevens & Clark. Board member of the Harding Loevner Funds from 1996 to 2014, serving as both Lead Independent Director and chair of the Audit Committee. Board member of the Russell Exchange Traded Funds Trust from 2011 to 2012 and the chair of the Audit Committee. Ms. Freeman is a Board Member of The Ruth Bancroft Garden (non-profit organization). She is also an inactive Chartered Financial Analyst. | | N/A |
| | | |
Isaiah Harris, Jr. (Born 1952) | | Trustee, since 2009; Audit Committee Chairman, since 2019 | | Retired. Chairman of the Board of CIGNA Corporation since 2009, and Director since 2005. From 2003 to 2011, Director of Deluxe Corporation. Prior thereto, President and CEO of BellSouth Advertising and Publishing Corp. from 2005 to 2007, President and CEO of BellSouth Enterprises from 2004 to 2005 and President of BellSouth Consumer Services from 2000 to 2003. Emeritus member of the Iowa State University Foundation Board of Governors. Emeritus Member of the Advisory Board of Iowa State University School of Business. Advisory Board Member, Palm Harbor Academy (private school). Advisory Board Member, Child Evangelism Fellowship (non-profit). Mr. Harris is a certified public accountant (inactive status). | | CIGNA Corporation |
| | | |
Judith M. Johnson (Born 1949) | | Trustee, since 2008; Audit Committee Chairman, from 2009 to 2018 | | Retired. Prior thereto, Chief Executive Officer and Chief Investment Officer of Minneapolis Employees Retirement Fund from 1996 to 2008. Ms. Johnson is an attorney, certified public accountant and a certified managerial accountant. | | N/A |
Wells Fargo Specialized Technology Fund | 25
Other information (unaudited)
| | | | | | |
Name and year of birth | | Position held and length of service* | | Principal occupations during past five years or longer | | Current other public company or investment company directorships |
| | | |
David F. Larcker (Born 1950) | | Trustee, since 2009 | | James Irvin Miller Professor of Accounting at the Graduate School of Business, Stanford University, Director of the Corporate Governance Research Initiative and Senior Faculty of The Rock Center for Corporate Governance since 2006. From 2005 to 2008, Professor of Accounting at the Graduate School of Business, Stanford University. Prior thereto, Ernst & Young Professor of Accounting at The Wharton School, University of Pennsylvania from 1985 to 2005. | | N/A |
| | | |
Olivia S. Mitchell (Born 1953) | | Trustee, since 2006; Nominating and Governance Committee Chairman, since 2018 | | International Foundation of Employee Benefit Plans Professor, Wharton School of the University of Pennsylvania since 1993. Director of Wharton’s Pension Research Council and Boettner Center on Pensions & Retirement Research, and Research Associate at the National Bureau of Economic Research. Previously, Cornell University Professor from 1978 to 1993. | | N/A |
| | | |
Timothy J. Penny (Born 1951) | | Trustee, since 1996; Chairman, since 2018 | | President and Chief Executive Officer of Southern Minnesota Initiative Foundation, a non-profit organization, since 2007. Member of the Board of Trustees of NorthStar Education Finance, Inc., a non-profit organization, since 2007. | | N/A |
| | | |
James G. Polisson (Born 1959) | | Trustee, since 2018 | | Retired. Chief Marketing Officer, Source (ETF) UK Services, Ltd, from 2015 to 2017. From 2012 to 2015, Principal of The Polisson Group, LLC, a management consulting, corporate advisory and principal investing company. Chief Executive Officer and Managing Director at Russell Investments, Global Exchange Traded Funds from 2010 to 2012. Managing Director of Barclays Global Investors from 1998 to 2010 and Global Chief Marketing Officer for iShares and Barclays Global Investors from 2000 to 2010. Trustee of the San Francisco Mechanics’ Institute, a non-profit organization, from 2013 to 2015. Board member of the Russell Exchange Traded Fund Trust from 2011 to 2012. Director of Barclays Global Investors Holdings Deutschland GmbH from 2006 to 2009. Mr. Polisson is an attorney and has a retired status with the Massachusetts and District of Columbia Bar Associations. | | N/A |
| * | Length of service dates reflect the Trustee’s commencement of service with the Trust’s predecessor entities, where applicable. |
26 | Wells Fargo Specialized Technology Fund
Other information (unaudited)
Officers
| | | | |
Name and year of birth | | Position held and length of service | | Principal occupations during past five years or longer |
| | |
Andrew Owen (Born 1960) | | President, since 2017 | | Executive Vice President of Wells Fargo & Company and Head of Affiliated Managers, Wells Fargo Asset Management, since 2014. In addition, Mr. Owen is currently President, Chief Executive Officer and Director of Wells Fargo Funds Management, LLC since 2017. Prior thereto, Executive Vice President responsible for marketing, investments and product development for Wells Fargo Funds Management, LLC, from 2009 to 2014. |
| | |
Nancy Wiser1 (Born 1967) | | Treasurer, since 2012 | | Executive Vice President of Wells Fargo Funds Management, LLC since 2011. Chief Operating Officer and Chief Compliance Officer at LightBox Capital Management LLC, from 2008 to 2011. |
| | |
Michelle Rhee3 (Born 1966) | | Chief Legal Officer, since 2019 | | Secretary of Wells Fargo Funds Management, LLC, Chief Legal Counsel of Wells Fargo Asset Management and Assistant General Counsel of Wells Fargo Bank, N.A. since 2018. Associate General Counsel and Managing Director of Bank of America Corporation from 2004 to 2018. |
| | |
Catherine Kennedy4 (Born 1969) | | Secretary, since 2019 | | Vice President of Wells Fargo Funds Management, LLC and Senior Counsel of the Wells Fargo Legal Department since 2010. Vice President and Senior Counsel of Evergreen Investment Management Company, LLC from 1998 to 2010. |
| | |
Michael H. Whitaker (Born 1967) | | Chief Compliance Officer, since 2016 | | Chief Compliance Officer of Wells Fargo Asset Management since 2016. Senior Vice President and Chief Compliance Officer for Fidelity Investments from 2007 to 2016. |
| | |
David Berardi (Born 1975) | | Assistant Treasurer, since 2009 | | Vice President of Wells Fargo Funds Management, LLC since 2009. Vice President of Evergreen Investment Management Company, LLC from 2008 to 2010. Manager of Fund Reporting and Control for Evergreen Investment Management Company, LLC from 2004 to 2010. |
| | |
Jeremy DePalma1 (Born 1974) | | Assistant Treasurer, since 2009 | | Senior Vice President of Wells Fargo Funds Management, LLC since 2009. Senior Vice President of Evergreen Investment Management Company, LLC from 2008 to 2010 and head of the Fund Reporting and Control Team within Fund Administration from 2005 to 2010. |
| 1 | Nancy Wiser acts as Treasurer of 64 funds in the Fund Complex. Jeremy DePalma acts as Treasurer of 86 funds and Assistant Treasurer of 64 funds in the Fund Complex. |
| 2 | The Statement of Additional Information includes additional information about the Trustees and is available, without charge, upon request, by calling1-800-222-8222 or by visiting the website atwfam.com. |
| 3 | Michelle Rhee became Chief Legal Officer effective October 22, 2019. |
| 4 | Catherine Kennedy became Secretary effective October 22, 2019. |
Wells Fargo Specialized Technology Fund | 27
Other information (unaudited)
BOARD CONSIDERATION OF INVESTMENT MANAGEMENT AND SUB-ADVISORY AGREEMENTS:
Wells Fargo Specialized Technology Fund
Under the Investment Company Act of 1940 (the “1940 Act”), the Board of Trustees (the “Board”) of Wells Fargo Funds Trust (the “Trust”) must determine annually whether to approve the continuation of the Trust’s investment management andsub-advisory agreements. In this regard, at an in-person meeting held on May 21-22, 2019 (the “Meeting”), the Board, all the members of which have no direct or indirect interest in the investment management and sub-advisory agreements and are not “interested persons” of the Trust, as defined in the 1940 Act (the “Independent Trustees”), reviewed and approved for Wells Fargo Specialized Technology Fund (the “Fund”): (i) an investment management agreement (the “Management Agreement”) with Wells Fargo Funds Management, LLC (“Funds Management”); and (ii) an investment sub-advisory agreement (the “Sub-Advisory Agreement”) with Allianz Global Investors U.S. LLC (the “Sub-Adviser”). The Management Agreement and the Sub-Advisory Agreement are collectively referred to as the “Advisory Agreements.”
At the Meeting, the Board considered the factors and reached the conclusions described below relating to the selection of Funds Management and the Sub-Adviser and the approval of the Advisory Agreements. Prior to the Meeting, including at anin-person meeting in April 2019, the Trustees conferred extensively among themselves and with representatives of Funds Management about these matters. Also, the Board has adopted a team-based approach, with each team consisting of a sub-set of Trustees, to assist the full Board in the discharge of its duties in reviewing investment performance and other matters throughout the year. The Independent Trustees were assisted in their evaluation of the Advisory Agreements by independent legal counsel, from whom they received separate legal advice and with whom they met separately.
In providing information to the Board, Funds Management and the Sub-Adviser were guided by a detailed set of requests for information submitted to them by independent legal counsel on behalf of the Independent Trustees at the start of the Board’s annual contract renewal process earlier in 2019. In considering and approving the Advisory Agreements, the Trustees considered the information they believed relevant, including but not limited to the information discussed below. The Board considered not only the specific information presented in connection with the Meeting, but also the knowledge gained over time through interaction with Funds Management and the Sub-Adviser about various topics. In this regard, the Board reviewed reports of Funds Management at each of its quarterly meetings, which included, among other things, portfolio reviews and investment performance reports. In addition, the Board and the teams mentioned above confer with portfolio managers at various times throughout the year. The Board did not identify any particular information or consideration that was all-important or controlling, and each individual Trustee may have attributed different weights to various factors.
After its deliberations, the Board unanimously approved the continuation of the Advisory Agreements for a one-year term and determined that the compensation payable to Funds Management and the Sub-Adviser under each of the Advisory Agreements was reasonable. The Board considered the approval of the Advisory Agreements for the Fund as part of its consideration of agreements for funds across the complex, but its approvals were made on a fund-by-fund basis. The following summarizes a number of important, but not necessarily all, factors considered by the Board in support of its approvals.
Nature, extent and quality of services
The Board received and considered various information regarding the nature, extent and quality of services provided to the Fund by Funds Management and the Sub-Adviser under the Advisory Agreements. This information included a description of the investment advisory services and Fund-level administrative services covered by the Management Agreement, as well as, among other things, a summary of the background and experience of senior management of Wells Fargo Asset Management (“WFAM”), of which Funds Management is a part, a summary of investments made in the business of WFAM, a summary of certain organizational and personnel changes involving Funds Management, and a description of Funds Management’s and the Sub-Adviser’s business continuity planning programs and of their approaches to data privacy and cybersecurity. The Board received and reviewed information about Funds Management’s role as administrator of the Fund’s liquidity risk management program. The Board also considered the qualifications, background, tenure and responsibilities of each of the portfolio managers primarily responsible for the day-to-day portfolio management of the Fund.
The Board evaluated the ability of Funds Management and the Sub-Adviser to attract and retain qualified investment professionals, including research, advisory and supervisory personnel. The Board further considered the compliance programs and compliance records of Funds Management and the Sub-Adviser. In addition, the Board took into account the full range of services provided to the Fund by Funds Management and its affiliates.
28 | Wells Fargo Specialized Technology Fund
Other information (unaudited)
Fund investment performance and expenses
The Board considered the investment performance results for the Fund over various time periods ended December 31, 2018. The Board considered these results in comparison to the investment performance of funds in a universe that was determined by Broadridge Inc. (“Broadridge”) to be similar to the Fund (the “Universe”), and in comparison to the Fund’s benchmark index and to other comparative data. Broadridge is an independent provider of investment company data. The Board received a description of the methodology used by Broadridge to select the mutual funds in the performance Universe. The Board noted that the investment performance of the Fund (Class A) was higher than the average performance of the Universe for all periods under review. The Board also noted that the investment performance of the Fund was higher than or in range of its benchmark index, the S&P North American Technology Index, for the one- and three-year periods under review, but lower than its benchmark index for the five- and ten-year periods under review.
The Board received information concerning, and discussed factors contributing to, the underperformance of the Fund relative to the benchmark for the periods identified above. The Board took note of the explanations for the relative underperformance during these periods, including with respect to investment decisions and market factors that affected the Fund’s investment performance. The Board also took note of the Fund’s outperformance relative to the Universe, and the Fund’s recent outperformance relative to its benchmark index.
The Board also received and considered information regarding the Fund’s net operating expense ratios and their various components, including actual management fees, custodian and other non-management fees, and Rule 12b-1 and non-Rule 12b-1 shareholder service fees. The Board considered these ratios in comparison to the median ratios of funds in class-specific expense groups that were determined by Broadridge to be similar to the Fund (the “Groups”). The Board received a description of the methodology used by Broadridge to select the mutual funds in the expense Groups and an explanation of how funds comprising expense groups and their expense ratios may vary from year-to-year. Based on the Broadridge reports, the Board noted that the net operating expense ratios of the Fund were in range of the median net operating expense ratios of the expense Groups for each share class except Class A. The Board noted that the Fund’s expense caps, including the expense caps for Class A, were lowered in 2018.
The Board took into account the Fund’s investment performance and expense information provided to it among the factors considered in deciding to re-approve the Advisory Agreements.
Investment management and sub-advisory fee rates
The Board reviewed and considered the contractual fee rates payable by the Fund to Funds Management under the Management Agreement, as well as the contractual fee rates payable by the Fund to Funds Management for class-level administrative services under a Class-Level Administration Agreement, which include, among other things, class-level transfer agency and sub-transfer agency costs (collectively, the “Management Rates”). The Board also reviewed and considered the contractual investmentsub-advisory fee rates that are payable by Funds Management to the Sub-Adviser for investment sub-advisory services.
Among other information reviewed by the Board was a comparison of the Fund’s Management Rates with the average contractual investment management fee rates of funds in the expense Groups at a common asset level as well as transfer agency costs of the other funds in the expense Groups. The Board noted that the Management Rates of the Fund were in range of the sum of these average rates for the Fund’s expense Groups for all share classes except for Class A. The Board noted that the Fund’s expense caps, including the expense caps for Class A, were lowered in 2018.
The Board also received and considered information about the portion of the total management fee that was retained by Funds Management after payment of the fee to the Sub-Adviser for sub-advisory services. The Board considered this amount in comparison to the median amount retained by advisers to funds in a sub-advised expense universe that was determined by Broadridge to be similar to the Fund. In assessing the reasonableness of this amount, the Board received and evaluated information about the nature and extent of responsibilities retained and risks assumed by Funds Management and not delegated to or assumed by the Sub-Adviser, and about Funds Management’s on-going oversight services. The Board also considered that the sub-advisory fees paid to the Sub-Adviser had been negotiated by Funds Management on an arm’s length basis.
The Board also received and considered information about the nature and extent of services offered and fee rates charged by Funds Management and the Sub-Adviser to other types of clients with investment strategies similar to those of the Fund. In this regard, the Board received information about the significantly greater scope of services, and compliance, reporting and other legal burdens and risks of managing proprietary mutual funds compared with those associated with managing assets of other types of clients, including third-party sub-advised fund clients and non-mutual fund clients such as institutional separate accounts.
Wells Fargo Specialized Technology Fund | 29
Other information (unaudited)
Based on its consideration of the factors and information it deemed relevant, including those described here, the Board determined that the compensation payable to Funds Management under the Management Agreement and to the Sub-Adviser under the Sub-Advisory Agreement was reasonable.
Profitability
The Board received and considered information concerning the profitability of Funds Management, as well as the profitability of both WFAM and Wells Fargo & Co. (“Wells Fargo”) from providing services to the fund family as a whole. Funds Management reported on the methodologies and estimates used in calculating profitability, including a description of the methodology used to allocate certain expenses. Among other things, the Board noted that the levels of profitability reported on a fund-by-fund basis varied widely, depending on factors such as the size, type and age of fund. The Board did not consider profitability with respect to the Sub-Adviser, as the sub-advisory fees paid to the Sub-Adviser had been negotiated by Funds Management on an arm’s-length basis.
Based on its review, the Board did not deem the profits reported by Funds Management, WFAM or Wells Fargo from services provided to the Fund to be at a level that would prevent it from approving the continuation of the Advisory Agreements.
Economies of scale
The Board received and considered information about the potential for Funds Management to experience economies of scale in the provision of management services to the Fund, the difficulties of calculating economies of scale at an individual fund level, and the extent to which potential scale benefits are shared with shareholders. The Board noted the existence of breakpoints in the Fund’s management fee structure, which operate generally to reduce the Fund’s expense ratios as the Fund grows in size. The Board considered that in addition to management fee breakpoints, Funds Management shares potential economies of scale from its management business in a variety of ways, including through fee waiver and expense reimbursement arrangements, services that benefit shareholders, competitive management fee rates set at the outset without regard to breakpoints, and investments in the business intended to enhance services available to shareholders.
The Board concluded that Funds Management’s arrangements with respect to the Fund, including contractual breakpoints, constituted a reasonable approach to sharing potential economies of scale with the Fund and its shareholders.
Other benefits to Funds Management and the Sub-Adviser
The Board received and considered information regarding potential “fall-out” or ancillary benefits received by Funds Management, the Sub-Adviser, and their affiliates as a result of their relationships with the Fund. Ancillary benefits could include, among others, benefits directly attributable to other relationships with the Fund and benefits potentially derived from an increase in Funds Management’s and the Sub-Adviser’s business as a result of their relationships with the Fund. The Board noted that various affiliates of Funds Management may receive distribution-related fees, shareholder servicing payments and sub-transfer agency fees in respect of shares sold or held through them and services provided.
The Board also reviewed information about soft dollar credits earned and utilized by the Sub-Adviser, fees earned by Funds Management and its affiliate from managing a private investment vehicle for the fund family’s securities lending collateral, and commissions earned by an affiliated broker from portfolio transactions.
Based on its consideration of the factors and information it deemed relevant, including those described here, the Board did not find that any ancillary benefits received by Funds Management, the Sub-Adviser, and their affiliates were unreasonable.
Conclusion
At the Meeting, after considering the above-described factors and based on its deliberations and its evaluation of the information described above, the Board unanimously approved the continuation of the Advisory Agreements for a one-year term and determined that the compensation payable to Funds Management and the Sub-Adviser under each of the Advisory Agreements was reasonable.
30 | Wells Fargo Specialized Technology Fund
This page is intentionally left blank.
This page is intentionally left blank.

For more information
More information about Wells Fargo Funds is available free upon request. To obtain literature, please write, visit the Fund’s website, or call:
Wells Fargo Funds
P.O. Box 219967
Kansas City, MO 64121-9967
Website:wfam.com
Individual investors:1-800-222-8222
Retail investment professionals:1-888-877-9275
Institutional investment professionals:1-866-765-0778

This report and the financial statements contained herein are submitted for the general information of the shareholders of the Fund. If this report is used for promotional purposes, distribution of the report must be accompanied or preceded by a current prospectus. Before investing, please consider the investment objectives, risks, charges, and expenses of the investment. For a current prospectus and, if available, a summary prospectus, containing this information, call1-800-222-8222 or visit the Fund’s website atwfam.com. Read the prospectus carefully before you invest or send money.
Wells Fargo Asset Management (WFAM) is the trade name for certain investment advisory/management firms owned by Wells Fargo & Company. These firms include but are not limited to Wells Capital Management Incorporated and Wells Fargo Funds Management, LLC. Certain products managed by WFAM entities are distributed by Wells Fargo Funds Distributor, LLC (a broker-dealer and Member FINRA).
This material is for general informational and educational purposes only and is NOT intended to provide investment advice or a recommendation of any kind—including a recommendation for any specific investment, strategy, or plan.
INVESTMENT PRODUCTS: NOT FDIC INSURED ◾ NO BANK GUARANTEE ◾ MAY LOSE VALUE
© 2019 Wells Fargo & Company. All rights reserved.
406824 11-19
SA317/SAR317 09-19
Semi-Annual Report
September 30, 2019
Wells Fargo
Utility and Telecommunications Fund
Beginning on January 1, 2021, as permitted by new regulations adopted by the Securities and Exchange Commission, paper copies of the Wells Fargo Funds’ annual and semi-annual shareholder reports issued after this date will no longer be sent by mail, unless you specifically request paper copies of the reports. Instead, the reports will be made available on the Funds’ website, and you will be notified by mail each time a report is posted and provided with a website address to access the report.
If you already elected to receive shareholder reports electronically, you will not be affected by this change and you need not take any action. You may elect to receive shareholder reports and other communications from the Fund electronically at any time by contacting your financial intermediary (such as a broker-dealer or bank) or, if you are a direct investor, by calling1-800-222-8222 or by enrolling at wellsfargo.com/advantagedelivery.
You may elect to receive all future reports in paper free of charge. If you invest through a financial intermediary, you can contact your financial intermediary to request that you continue to receive paper copies of your shareholder reports; if you invest directly with the Fund, you can call 1-800-222-8222. Your election to receive reports in paper will apply to all Wells Fargo Funds held in your account with your financial intermediary or, if you are a direct investor, to all Wells Fargo Funds that you hold.
|
|
|
Reduce clutter. Save trees. |
Sign up for electronic delivery of prospectuses and shareholder reports atwellsfargo.com/advantagedelivery |
The views expressed and any forward-looking statements are as of September 30, 2019, unless otherwise noted, and are those of the Fund managers and/or Wells Fargo Asset Management. Discussions of individual securities, or the markets generally, or any Wells Fargo Fund are not intended as individual recommendations. Future events or results may vary significantly from those expressed in any forward-looking statements. The views expressed are subject to change at any time in response to changing circumstances in the market. Wells Fargo Asset Management and the Fund disclaim any obligation to publicly update or revise any views expressed or forward-looking statements.
INVESTMENT PRODUCTS: NOT FDIC INSURED ◾ NO BANK GUARANTEE ◾ MAY LOSE VALUE
Wells Fargo Utility and Telecommunications Fund | 1
Letter to shareholders (unaudited)

Andrew Owen
President
Wells Fargo Funds
“During the third quarter of 2019, investors regrouped.”
Dear Shareholder:
We are pleased to offer you this semi-annual report for the Wells Fargo Utility and Telecommunications Fund for the six-month period that ended September 30, 2019. U.S. stock and global bond investors generally saw markets recover during the second half amid intensifying market volatility, global economic growth concerns, international trade stare downs, and simmering geopolitical tensions.
Overall, fixed income kept pace with domestic stocks and outperformed foreign equities. For the period, U.S. stocks, based on the S&P 500 Index,1 gained 6.08% and international stocks, as measured by the MSCI ACWI ex USA Index (Net),2 added 1.13%. The MSCI EM Index (Net)3 fell by 3.66%. Among fixed income investors, the Bloomberg Barclays U.S. Aggregate Bond Index4 added 5.42%, the Bloomberg Barclays Global Aggregate ex-USD Index5 gained 2.82%, the Bloomberg Barclays Municipal Bond Index6 increased 3.74%, and the ICE BofAML U.S. High Yield Index7 was up 3.82%.
Early second-quarter 2019 investor enthusiasm faded as the quarter wore on.
During April 2019, favorable sentiment found additional support in reports of sustained low inflation, solid employment data, and first-quarter U.S. gross domestic product growth at an annualized rate of 3.2%. During May, markets tumbled on mixed investment signals. In the U.S., partisan wrangling ramped up as Democrats and Republicans set their sights on 2020 presidential politics. The U.K.’s Brexit disagreements caused Prime Minister Theresa May to resign. Boris Johnson succeeded her only to exacerbate uncertainty about Brexit’s resolution ahead of an October 2019 deadline. The European Commission downgraded the 2019 growth forecast to 1.2%. The U.S. increased tariffs on products from China, China responded, and then talks broke down. President Donald Trump threatened to turn his foreign policy tariff tool to Mexico over immigration issues.
During the third quarter of 2019, investors regrouped. Just as the investment horizon appeared to darken, sentiment turned and U.S. equity markets gained during June and July. The gains, primarily driven by geopolitical and monetary policy events, pushed equity markets to new highs. European Central Bank President Mario Draghi said that if the outlook doesn’t improve, the bank would cut rates or buy more assets to prop up inflation. President Trump backed off of tariff threats against Mexico and China. In the U.S., the Federal Reserve (Fed) implemented a 0.25% federal funds rate cut in July.
| 1 | The S&P 500 Index consists of 500 stocks chosen for market size, liquidity, and industry group representation. It is a market-value-weighted index with each stock’s weight in the index proportionate to its market value. You cannot invest directly in an index. |
| 2 | The Morgan Stanley Capital International (MSCI) All Country World Index (ACWI) ex USA Index (Net) is a free-float-adjusted market-capitalization weighted index that is designed to measure the equity market performance of developed and emerging markets, excluding the U.S. Source: MSCI. MSCI makes no express or implied warranties or representations and shall have no liability whatsoever with respect to any MSCI data contained herein. The MSCI data may not be further redistributed or used as a basis for other indices or any securities or financial products. This report is not approved, reviewed, or produced by MSCI. You cannot invest directly in an index. |
| 3 | The MSCI Emerging Markets (EM) Index (Net) is a free-float-adjusted market-capitalization-weighted index that is designed to measure the equity market performance of emerging markets. You cannot invest directly in an index. |
| 4 | The Bloomberg Barclays U.S. Aggregate Bond Index is a broad-based benchmark that measures the investment-grade, U.S. dollar-denominated, fixed-rate taxable bond market, including Treasuries, government-related and corporate securities, mortgage-backed securities (agency fixed-rate and hybrid adjustable-rate mortgage pass-throughs), asset-backed securities, and commercial mortgage-backed securities. You cannot invest directly in an index. |
| 5 | The Bloomberg Barclays Global Aggregate ex-USD Index is an unmanaged index that provides a broad-based measure of the global investment-grade fixed-income markets excluding the U.S. dollar-denominated debt market. You cannot invest directly in an index. |
| 6 | The Bloomberg Barclays Municipal Bond Index is an unmanaged index composed of long-term tax-exempt bonds with a minimum credit rating of Baa. You cannot invest directly in an index. |
| 7 | The ICE BofAML U.S. High Yield Index is a market-capitalization-weighted index of domestic and Yankee high-yield bonds. The index tracks the performance of high-yield securities traded in the U.S. bond market. You cannot invest directly in an index. Copyright 2019. ICE Data Indices, LLC. All rights reserved. |
2 | Wells Fargo Utility and Telecommunications Fund
Letter to shareholders (unaudited)
Later in July 2019, the U.S. reversed course and threatened to impose higher tariffs on China’s exports after talks failed. China responded with tariff threats of its own and devalued the renminbi, a move that roiled global markets. Major U.S. stock market indices closed July with the worst weekly results of the year. Bond prices gained as Treasury yields fell to levels not seen since November 2016 and the yield curve inverted at multiple points along the 30-year arc.
In a microcosm, August encapsulated many of the unnerving events that plagued investors during the prior 11 months. The U.S.-China trade relationship swung from antagonistic to hopeful and back again with no evident compromise on the horizon. Evidence of a continued global economic slowdown mounted. Central banks in China, New Zealand, and Thailand cut interest rates. Industrial and manufacturing data declined in China, Canada, Japan, and Germany. Adding to the uncertain environment, Italy’s prime minister resigned, many feared a crackdown in Hong Kong as protesters sustained their calls for reform throughout the month, and Boris Johnson planned to suspend Parliament as Brexit’s deadline neared.
In the U.S., September saw the Fed join other central banks in cutting interest rates. Manufacturing data in the U.S., as reported by the Institute for Supply Management, disappointed investors. The U.S. Congress announced it would pursue an impeachment investigation of President Trump. Meanwhile, the Brexit impasse showed no signs of resolution. Officials in China said that hitting the country’s economic growth goals for the year would be difficult considering the weight of tariffs and trade restrictions. So while the S&P 500 Index finished the third quarter with year-to-date returns that were the best in more than 20 years, amid signs of equity investors taking money out of the stock market, concerns about future returns remained.
Don’t let short-term uncertainty derail long-term investment goals.
Periods of investment uncertainty can present challenges, but experience has taught us that maintaining long-term investment goals can be an effective way to plan for the future. To help you create a sound strategy based on your personal goals and risk tolerance, Wells Fargo Funds offers more than 100 mutual funds spanning a wide range of asset classes and investment styles. Although diversification cannot guarantee an investment profit or prevent losses, we believe it can be an effective way to manage investment risk and potentially smooth out overall portfolio performance. We encourage investors to know their investments and to understand that appropriate levels of risk-taking may unlock opportunities.
Thank you for choosing to invest with Wells Fargo Funds. We appreciate your confidence in us and remain committed to helping you meet your financial needs.
Sincerely,

Andrew Owen
President
Wells Fargo Funds
“In the U.S., September saw the Fed join other central banks in cutting interest rates.”
|
|
|
For further information about your Fund, contact your investment professional, visit our website at wfam.com, or call us directly at1-800-222-8222. |
Wells Fargo Utility and Telecommunications Fund | 3
Performance highlights (unaudited)
Investment objective
The Fund seeks total return, consisting of current income and capital appreciation.
Manager
Wells Fargo Funds Management, LLC
Subadviser†
Wells Capital Management Incorporated
Portfolio managers*
Kent Newcomb, CFA®‡
Jack Spudich, CFA®‡
Average annual total returns (%) as of September 30, 20191
| | | | | | | | | | | | | | | | | | | | | | | | | | | | | | | | | | |
| | | | |
| | | | | Including sales charge | | | Excluding sales charge | | | Expense ratios2 (%) | |
| | | | | | | | | |
| | | Inception date | | 1 year | | | 5 year | | | 10 year | | | 1 year | | | 5 year | | | 10 year | | | Gross | | | Net3 | |
| | | | | | | | | | |
| Class A (EVUAX) | | 1-4-1994 | | | 16.17 | | | | 9.34 | | | | 10.67 | | | | 23.26 | | | | 10.64 | | | | 11.33 | | | | 1.19 | | | | 1.14 | |
| | | | | | | | | | |
| Class C (EVUCX) | | 9-2-1994 | | | 21.34 | | | | 9.81 | | | | 10.50 | | | | 22.34 | | | | 9.81 | | | | 10.50 | | | | 1.94 | | | | 1.89 | |
| | | | | | | | | | |
| Administrator Class (EVUDX)4 | | 7-30-2010 | | | – | | | | – | | | | – | | | | 23.51 | | | | 10.85 | | | | 11.54 | | | | 1.11 | | | | 0.95 | |
| | | | | | | | | | |
| Institutional Class (EVUYX) | | 2-28-1994 | | | – | | | | – | | | | – | | | | 23.70 | | | | 11.04 | | | | 11.70 | | | | 0.86 | | | | 0.78 | |
| | | | | | | | | | |
| S&P 500 Utilities Index5 | | – | | | – | | | | – | | | | – | | | | 27.10 | | | | 12.89 | | | | 12.51 | | | | – | | | | – | |
| | | | | | | | | | |
| S&P 500 Index6 | | – | | | – | | | | – | | | | – | | | | 4.25 | | | | 10.84 | | | | 13.24 | | | | – | | | | – | |
Figures quoted represent past performance, which is no guarantee of future results, and do not reflect taxes that a shareholder may pay on fund distributions or the redemption of fund shares. Investment return and principal value of an investment will fluctuate so that an investor’s shares, when redeemed, may be worth more or less than their original cost. Performance shown without sales charges would be lower if sales charges were reflected. Current performance may be lower or higher than the performance data quoted, which assumes the reinvestment of dividends and capital gains. Currentmonth-end performance is available on the Fund’s website,wfam.com.
While the S&P 500 Index is comprised of U.S. equity securities of companies diversified across ten sectors, the Fund’s holdings are concentrated primarily in utilities and telecommunication services stocks. Therefore, the performance of the S&P 500 Index is displayed only to show how the concentrated Fund performed compared with a diversified selection of U.S. equity securities.
Index returns do not include transaction costs associated with buying and selling securities, any mutual fund fees or expenses, or any taxes. It is not possible to invest directly in an index.
For Class A shares, the maximumfront-end sales charge is 5.75%. For Class C shares, the maximum contingent deferred sales charge is 1.00%. Performance including a contingent deferred sales charge assumes the sales charge for the corresponding time period. Administrator Class and Institutional Class shares are sold without afront-end sales charge or contingent deferred sales charge.
Stock values fluctuate in response to the activities of individual companies and general market and economic conditions. Bond values fluctuate in response to the financial condition of individual issuers, general market and economic conditions, and changes in interest rates. Changes in market conditions and government policies may lead to periods of heightened volatility in the bondmarket and reduced liquidity for certain bonds held by the Fund. In general, when interest rates rise, bond values fall and investors may lose principal value. Interest rate changes and their impact on the Fund and its share price can be sudden and unpredictable. The use of derivatives may reduce returns and/or increase volatility. Funds that concentrate their investments in limited sectors, such as utilities and telecommunication services, are more vulnerable to adverse market, economic, regulatory, political, or other developments affecting those sectors. Certain investment strategies tend to increase the total risk of an investment (relative to the broader market). The Fund is exposed to convertible securities risk, foreign investment risk, high-yield securities risk, smaller-company securities risk, andnon-diversification risk. Consult the Fund’s prospectus for additional information on these and other risks.
Please see footnotes on page 5.
4 | Wells Fargo Utility and Telecommunications Fund
Performance highlights (unaudited)
| | | | |
|
| Ten largest holdings (%) as of September 30, 20197 | |
| | |
Eversource Energy | | | 8.23 | |
| | |
PNM Resources Incorporated | | | 7.08 | |
| | |
Sempra Energy | | | 6.69 | |
| | |
American Water Works Company Incorporated | | | 5.63 | |
| | |
NextEra Energy Incorporated | | | 5.44 | |
| | |
CMS Energy Corporation | | | 5.30 | |
| | |
Alliant Energy Corporation | | | 5.23 | |
| | |
Visa Incorporated Class A | | | 4.87 | |
| | |
Dominion Energy Incorporated | | | 4.86 | |
| | |
Entergy Corporation | | | 4.79 | |
|
|
| Industry distribution as of September 30, 20198 |
|
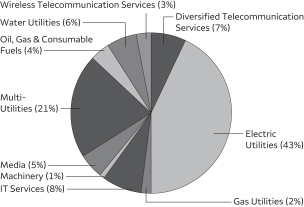 |
| † | Wells Capital Management Incorporated became the subadviser of the Fund on October 15, 2019. |
| * | Mr. Newcomb and Mr. Spudich became portfolio managers of the Fund on October 15, 2019. |
| ‡ | CFA® and Chartered Financial Analyst® are trademarks owned by CFA Institute. |
| 1 | Historical performance prior to July 19, 2010, is based on the performance of the Fund’s predecessor, Evergreen Utility and Telecommunications Fund. |
| 2 | Reflects the expense ratios as stated in the most recent prospectuses. The expense ratios shown are subject to change and may differ from the annualized expense ratios shown in the financial highlights of this report. |
| 3 | The manager has contractually committed through July 31, 2020, to waive fees and/or reimburse expenses to the extent necessary to cap the expenses of each class after fee waivers at the amounts shown. Brokerage commissions, stamp duty fees, interest, taxes, acquired fund fees and expenses (if any), and extraordinary expenses are excluded from the expense cap. Prior to or after the commitment expiration date, the cap may be increased or the commitment to maintain the cap may be terminated only with the approval of the Board of Trustees. Without this cap, the Fund’s returns would have been lower. The expense ratio paid by an investor is the net expense ratio (the total annual fund operating expenses after fee waivers) as stated in the prospectuses. |
| 4 | Historical performance shown for Administrator Class shares prior to their inception reflects the performance of Institutional Class shares and has been adjusted to reflect the higher expenses applicable to Administrator Class shares. |
| 5 | The S&P 500 Utilities Index is a market-value-weighted index that measures the performance of all stocks within the utilities sector of the S&P 500 Index. You cannot invest directly in an index. |
| 6 | The S&P 500 Index consists of 500 stocks chosen for market size, liquidity, and industry group representation. It is a market-value-weighted index with each stock’s weight in the index proportionate to its market value. You cannot invest directly in an index. |
| 7 | The ten largest holdings, excluding cash, cash equivalents and any money market funds, are calculated based on the value of the investments divided by total net assets of the Fund. Holdings are subject to change and may have changed since the date specified. |
| 8 | Amounts are calculated based on the total long-term investments of the Fund. These amounts are subject to change and may have changed since the date specified. |
Wells Fargo Utility and Telecommunications Fund | 5
Fund expenses (unaudited)
As a shareholder of the Fund, you incur two types of costs: (1) transaction costs, including sales charges (loads) on purchase payments and contingent deferred sales charges (if any) on redemptions and (2) ongoing costs, including management fees, distribution (12b-1) and/or shareholder servicing fees, and other Fund expenses. This example is intended to help you understand your ongoing costs (in dollars) of investing in the Fund and to compare these costs with the ongoing costs of investing in other mutual funds.
The example is based on an investment of $1,000 invested at the beginning of thesix-month period and held for the entire period from April 1, 2019 to September 30, 2019.
Actual expenses
The “Actual” line of the table below provides information about actual account values and actual expenses. You may use the information in this line, together with the amount you invested, to estimate the expenses that you paid over the period. Simply divide your account value by $1,000 (for example, an $8,600 account value divided by $1,000 = 8.6), then multiply the result by the number in the “Actual” line under the heading entitled “Expenses paid during period” for your applicable class of shares to estimate the expenses you paid on your account during this period.
Hypothetical example for comparison purposes
The “Hypothetical” line of the table below provides information about hypothetical account values and hypothetical expenses based on the Fund’s actual expense ratio and an assumed rate of return of 5% per year before expenses, which is not the Fund’s actual return. The hypothetical account values and expenses may not be used to estimate the actual ending account balance or expenses you paid for the period. You may use this information to compare the ongoing costs of investing in the Fund and other funds. To do so, compare this 5% hypothetical example with the 5% hypothetical examples that appear in the shareholder reports of the other funds.
Please note that the expenses shown in the table are meant to highlight your ongoing costs only and do not reflect any transactional costs, such as sales charges (loads) and contingent deferred sales charges. Therefore, the “Hypothetical” line of the table is useful in comparing ongoing costs only and will not help you determine the relative total costs of owning different funds. In addition, if these transactional costs were included, your costs would have been higher.
| | | | | | | | | | | | | | | | |
| | | Beginning
account value
4-1-2019 | | | Ending
account value
9-30-2019 | | | Expenses
paid during
the period¹ | | | Annualized net
expense ratio | |
| | | | | |
Class A | | | | | | | | | | | | | | | | |
| | | | |
Actual | | $ | 1,000.00 | | | $ | 1,111.64 | | | $ | 6.03 | | | | 1.14 | % |
| | | | |
Hypothetical (5% return before expenses) | | $ | 1,000.00 | | | $ | 1,019.35 | | | $ | 5.77 | | | | 1.14 | % |
| | | | | |
Class C | | | | | | | | | | | | | | | | |
| | | | |
Actual | | $ | 1,000.00 | | | $ | 1,107.65 | | | $ | 9.99 | | | | 1.89 | % |
| | | | |
Hypothetical (5% return before expenses) | | $ | 1,000.00 | | | $ | 1,015.59 | | | $ | 9.55 | | | | 1.89 | % |
| | | | | |
Administrator Class | | | | | | | | | | | | | | | | |
| | | | |
Actual | | $ | 1,000.00 | | | $ | 1,112.95 | | | $ | 5.03 | | | | 0.95 | % |
| | | | |
Hypothetical (5% return before expenses) | | $ | 1,000.00 | | | $ | 1,020.31 | | | $ | 4.81 | | | | 0.95 | % |
| | | | | |
Institutional Class | | | | | | | | | | | | | | | | |
| | | | |
Actual | | $ | 1,000.00 | | | $ | 1,113.60 | | | $ | 4.13 | | | | 0.78 | % |
| | | | |
Hypothetical (5% return before expenses) | | $ | 1,000.00 | | | $ | 1,021.16 | | | $ | 3.95 | | | | 0.78 | % |
| 1 | Expenses paid is equal to the annualized net expense ratio of each class multiplied by the average account value over the period, multiplied by the number of days in the most recent fiscal half-year divided by the number of days in the fiscal year (to reflect theone-half-year period). |
6 | Wells Fargo Utility and Telecommunications Fund
Portfolio of investments—September 30, 2019 (unaudited)
| | | | | | | | | | | | | | | | |
| | | | | | | | | Shares | | | Value | |
| Common Stocks: 97.29% | |
|
Communication Services: 14.49% | |
|
| Diversified Telecommunication Services: 6.59% | |
AT&T Incorporated | | | | | | | | | | | 210,000 | | | $ | 7,946,400 | |
Telia Company AB | | | | | | | | | | | 100 | | | | 448 | |
Verizon Communications Incorporated | | | | | | | | | | | 350,000 | | | | 21,126,000 | |
| |
| | | | 29,072,848 | |
| | | | | |
|
| Media: 4.60% | |
Comcast Corporation Class A | | | | | | | | | | | 450,200 | | | | 20,295,016 | |
| | | | | | | | | | | | | | | | |
|
| Wireless Telecommunication Services: 3.30% | |
Shenandoah Telecommunications Company | | | | | | | | | | | 457,657 | | | | 14,539,763 | |
| | | | | | | | | | | | | | | | |
|
Energy: 4.12% | |
|
| Oil, Gas & Consumable Fuels: 4.12% | |
ONEOK Incorporated | | | | | | | | | | | 76,900 | | | | 5,666,761 | |
The Williams Companies Incorporated | | | | | | | | | | | 520,000 | | | | 12,511,200 | |
| |
| | | | 18,177,961 | |
| | | | | |
|
Financials: 0.30% | |
|
| Diversified Financial Services: 0.30% | |
A-Mark Precious Metals Incorporated † | | | | | | | | | | | 109,999 | | | | 1,325,488 | |
| | | | | | | | | | | | | | | | |
|
Industrials: 0.58% | |
|
| Machinery: 0.58% | |
Perma-Pipe International Holdings Incorporated † | | | | | | | | | | | 266,500 | | | | 2,569,060 | |
| | | | | | | | | | | | | | | | |
|
Information Technology: 7.64% | |
|
| IT Services: 7.64% | |
MasterCard Incorporated Class A | | | | | | | | | | | 45,000 | | | | 12,220,650 | |
Visa Incorporated Class A | | | | | | | | | | | 125,000 | | | | 21,501,250 | |
| |
| | | | 33,721,900 | |
| | | | | |
|
Utilities: 70.16% | |
|
| Electric Utilities: 41.82% | |
Alliant Energy Corporation | | | | | | | | | | | 428,315 | | | | 23,099,028 | |
American Electric Power Company Incorporated | | | | | | | | | | | 175,000 | | | | 16,395,750 | |
Edison International | | | | | | | | | | | 102,000 | | | | 7,692,840 | |
Entergy Corporation | | | | | | | | | | | 180,000 | | | | 21,124,800 | |
Eversource Energy | | | | | | | | | | | 425,000 | | | | 36,324,750 | |
Exelon Corporation | | | | | | | | | | | 141,001 | | | | 6,811,758 | |
FirstEnergy Corporation | | | | | | | | | | | 370,000 | | | | 17,845,100 | |
NextEra Energy Incorporated | | | | | | | | | | | 103,015 | | | | 24,001,465 | |
PNM Resources Incorporated | | | | | | | | | | | 600,000 | | | | 31,248,000 | |
| |
| | | | 184,543,491 | |
| | | | | |
|
| Gas Utilities: 2.11% | |
South Jersey Industries Incorporated | | | | | | | | | | | 280,000 | | | | 9,214,800 | |
Spire Incorporated | | | | | | | | | | | 1,000 | | | | 87,240 | |
| |
| | | | 9,302,040 | |
| | | | | |
Wells Fargo Utility and Telecommunications Fund | 7
Portfolio of investments—September 30, 2019 (unaudited)
| | | | | | | | | | | | | | | | |
| | | | | | | | | Shares | | | Value | |
| Multi-Utilities: 20.60% | |
CMS Energy Corporation | | | | | | | | | | | 365,532 | | | $ | 23,375,771 | |
Dominion Energy Incorporated | | | | | | | | | | | 264,827 | | | | 21,461,580 | |
Hera SpA | | | | | | | | | | | 1,000,000 | | | | 4,104,753 | |
Public Service Enterprise Group Incorporated | | | | | | | | | | | 200,000 | | | | 12,416,000 | |
Sempra Energy | | | | | | | | | | | 200,000 | | | | 29,522,000 | |
| |
| | | | 90,880,104 | |
| | | | | |
|
| Water Utilities: 5.63% | |
American Water Works Company Incorporated | | | | | | | | | | | 200,000 | | | | 24,846,000 | |
| | | | | | | | | | | | | | | | |
| |
Total Common Stocks (Cost $200,223,458) | | | | 429,273,671 | |
| | | | | |
| | | | |
| | | | | | | | | | | | | | | | |
| | | Dividend yield | | | | | | | | | | |
| Preferred Stocks: 0.50% | |
|
Utilities: 0.50% | |
|
| Electric Utilities: 0.50% | |
Spark Energy Incorporated | | | 8.79 | % | | | | | | | 88,596 | | | | 2,206,040 | |
| | | | | | | | | | | | | | | | |
| |
Total Preferred Stocks (Cost $2,237,049) | | | | 2,206,040 | |
| | | | | |
| | | | |
| | | | | | | | | | | | | | | | |
| | | Yield | | | | | | | | | | |
| Short-Term Investments: 2.16% | |
|
| Investment Companies: 2.16% | |
Wells Fargo Government Money Market Fund Select Class (I)(u) | | | 1.88 | | | | | | | | 9,523,721 | | | | 9,523,721 | |
| | | | | | | | | | | | | | | | |
| |
Total Short-Term Investments (Cost $9,523,721) | | | | 9,523,721 | |
| | | | | |
| | | | | | | | |
| Total investments in securities (Cost $211,984,228) | | | 99.95 | % | | | 441,003,432 | |
| | |
Other assets and liabilities, net | | | 0.05 | | | | 241,734 | |
| | | | | | | | |
| Total net assets | | | 100.00 | % | | $ | 441,245,166 | |
| | | | | | | | |
| † | Non-income-earning security |
| (l) | The issuer of the security is an affiliated person of the Fund as defined in the Investment Company Act of 1940. |
| (u) | The rate represents the7-day annualized yield at period end. |
Investments in Affiliates
An affiliated investment is an investment in which the Fund owns at least 5% of the outstanding voting shares of the issuer or as a result of other relationships, such as the Fund and the issuer having the same investment manager. Transactions with issuers that were either affiliated persons of the Portfolio at the beginning of the period or the end of the period were as follows:
| | | | | | | | | | | | | | | | | | | | | | | | | | | | | | | | | | | | |
| | | Shares,
beginning of
period | | | Shares
purchased | | | Shares
sold | | | Shares,
end of
period | | | Net
realized
gains
(losses) | | | Net
change in
unrealized
gains
(losses) | | | Income
from
affiliated
securities | | | Value,
end of
period | | | % of
net
assets | |
| | | | | | | | | |
| Short-Term Investments | | | | | | | | | | | | | | | | | | | | | | | | | | | |
Investment Companies | | | | | | | | | | | | | | | | | | | | | | | | | | | | | | | | | | | | |
Securities Lending Cash Investments LLC* | | | 137,186 | | | | 45,446 | | | | 182,632 | | | | 0 | | | $ | 0 | | | $ | 0 | | | $ | 23 | # | | $ | 0 | | | | | |
Wells Fargo Government Money Market Fund Select Class | | | 10,518,041 | | | | 28,669,458 | | | | 29,663,778 | | | | 9,523,721 | | | | 0 | | | | 0 | | | | 79,997 | | | | 9,523,721 | | | | | |
| | | | | | | | | | | | | | | | | | | | | | | | | | | | | | | | | | | | |
| | | | | | | | | | | | | | | | | | $ | 0 | | | $ | 0 | | | $ | 80,020 | | | $ | 9,523,721 | | | | 2.16 | % |
| | | | | | | | | | | | | | | | | | | | | | | | | | | | | | | | | | | | |
| * | No longer held at the end of the period. |
| # | Amount shown represents income before fees and rebates. |
The accompanying notes are an integral part of these financial statements.
8 | Wells Fargo Utility and Telecommunications Fund
Statement of assets and liabilities—September 30, 2019 (unaudited)
| | | | |
| | | | |
| |
Assets | | | | |
Investments in unaffiliated securities, at value (cost $202,460,507) | | $ | 431,479,711 | |
Investment in affiliated securities, at value (cost $9,523,721) | | | 9,523,721 | |
Foreign currency, at value (cost $371,835) | | | 342,108 | |
Receivable for Fund shares sold | | | 337,607 | |
Receivable for dividends | | | 399,492 | |
Receivable for securities lending income, net | | | 16 | |
Prepaid expenses and other assets | | | 14,437 | |
| | | | |
Total assets | | | 442,097,092 | |
| | | | |
| |
Liabilities | | | | |
Payable for Fund shares redeemed | | | 358,869 | |
Management fee payable | | | 219,737 | |
Shareholder servicing fees payable | | | 79,407 | |
Administration fees payable | | | 71,710 | |
Distribution fee payable | | | 10,732 | |
Trustees’ fees and expenses payable | | | 2,547 | |
Accrued expenses and other liabilities | | | 108,924 | |
| | | | |
Total liabilities | | | 851,926 | |
| | | | |
Total net assets | | $ | 441,245,166 | |
| | | | |
| |
Net assets consist of | | | | |
Paid-in capital | | $ | 148,363,336 | |
Total distributable earnings | | | 292,881,830 | |
| | | | |
Total net assets | | $ | 441,245,166 | |
| | | | |
| |
Computation of net asset value and offering price per share | | | | |
Net assets – Class A | | $ | 371,850,571 | |
Shares outstanding – Class A1 | | | 14,007,432 | |
Net asset value per share – Class A | | | $26.55 | |
Maximum offering price per share – Class A2 | | | $28.17 | |
Net assets – Class C | | $ | 17,380,032 | |
Shares outstanding – Class C1 | | | 653,166 | |
Net asset value per share – Class C | | | $26.61 | |
Net assets – Administrator Class | | $ | 2,405,178 | |
Shares outstanding – Administrator Class1 | | | 90,464 | |
Net asset value per share – Administrator Class | | | $26.59 | |
Net assets – Institutional Class | | $ | 49,609,385 | |
Shares outstanding – Institutional Class1 | | | 1,869,514 | |
Net asset value per share – Institutional Class | | | $26.54 | |
| 1 | The Fund has an unlimited number of authorized shares. |
| 2 | Maximum offering price is computed as 100/94.25 of net asset value. On investments of $50,000 or more, the offering price is reduced. |
The accompanying notes are an integral part of these financial statements.
Wells Fargo Utility and Telecommunications Fund | 9
Statement of operations—six months ended September 30, 2019 (unaudited)
| | | | |
| | | | |
| |
Investment income | | | | |
Dividends (net of foreign withholding taxes of $17,086) | | $ | 5,106,320 | |
Income from affiliated securities | | | 80,079 | |
| | | | |
Total investment income | | | 5,186,399 | |
| | | | |
| |
Expenses | | | | |
Management fee | | | 1,368,841 | |
Administration fees | | | | |
Class A | | | 370,061 | |
Class C | | | 19,340 | |
Administrator Class | | | 3,002 | |
Institutional Class | | | 29,709 | |
Shareholder servicing fees | | | | |
Class A | | | 440,548 | |
Class C | | | 23,023 | |
Administrator Class | | | 5,773 | |
Distribution fee | | | | |
Class C | | | 68,980 | |
Custody and accounting fees | | | 13,369 | |
Professional fees | | | 32,623 | |
Registration fees | | | 37,339 | |
Shareholder report expenses | | | 31,709 | |
Trustees’ fees and expenses | | | 10,325 | |
Other fees and expenses | | | 9,249 | |
| | | | |
Total expenses | | | 2,463,891 | |
Less: Fee waivers and/or expense reimbursements | | | | |
Fund-level | | | (79,213 | ) |
Administrator Class | | | (1,870 | ) |
Institutional Class | | | (21 | ) |
| | | | |
Net expenses | | | 2,382,787 | |
| | | | |
Net investment income | | | 2,803,612 | |
| | | | |
| |
Realized and unrealized gains (losses) on investments | | | | |
Net realized gains on investments | | | 60,457,317 | |
Net change in unrealized gains (losses) on investments | | | (18,523,824 | ) |
| | | | |
Net realized and unrealized gains (losses) on investments | | | 41,933,493 | |
| | | | |
Net increase in net assets resulting from operations | | $ | 44,737,105 | |
| | | | |
The accompanying notes are an integral part of these financial statements.
10 | Wells Fargo Utility and Telecommunications Fund
Statement of changes in net assets
| | | | | | | | | | | | | | | | |
| | | Six months ended
September 30, 2019
(unaudited) | | | Year ended
March 31, 2019 | |
| | | |
Operations | | | | | | | | | | | | |
Net investment income | | | | | | $ | 2,803,612 | | | | | | | $ | 5,337,642 | |
Net realized gains on investments | | | | | | | 60,457,317 | | | | | | | | 14,071,102 | |
Net change in unrealized gains (losses) on investments | | | | | | | (18,523,824 | ) | | | | | | | 48,138,280 | |
| | | | |
Net increase in net assets resulting from operations | | | | | | | 44,737,105 | | | | | | | | 67,547,024 | |
| | | | |
| | | | |
Distributions to shareholders from net investment income and net realized gains | | | | | | | | | | | | | | | | |
Class A | | | | | | | (2,231,714 | ) | | | | | | | (5,340,753 | ) |
Class C | | | | | | | (27,644 | ) | | | | | | | (367,071 | ) |
Administrator Class | | | | | | | (29,359 | ) | | | | | | | (93,347 | ) |
Institutional Class | | | | | | | (379,432 | ) | | | | | | | (753,499 | ) |
| | | | |
Total distributions to shareholders | | | | | | | (2,668,149 | ) | | | | | | | (6,554,670 | ) |
| | | | |
| | | | |
Capital share transactions | | | Shares | | | | | | | | Shares | | | | | |
Proceeds from shares sold | |
Class A | | | 531,788 | | | | 13,460,074 | | | | 1,320,405 | | | | 29,507,498 | |
Class C | | | 26,859 | | | | 673,581 | | | | 54,882 | | | | 1,186,781 | |
Administrator Class | | | 35,863 | | | | 895,817 | | | | 45,614 | | | | 1,005,325 | |
Institutional Class | | | 397,400 | | | | 9,999,262 | | | | 635,353 | | | | 13,820,300 | |
| | | | |
| | | | | | | 25,028,734 | | | | | | | | 45,519,904 | |
| | | | |
Reinvestment of distributions | |
Class A | | | 80,552 | | | | 2,099,526 | | | | 229,766 | | | | 5,021,772 | |
Class C | | | 1,000 | | | | 26,036 | | | | 16,325 | | | | 353,472 | |
Administrator Class | | | 1,125 | | | | 29,101 | | | | 4,234 | | | | 92,538 | |
Institutional Class | | | 14,355 | | | | 374,005 | | | | 33,858 | | | | 740,651 | |
| | | | |
| | | | | | | 2,528,668 | | | | | | | | 6,208,433 | |
| | | | |
Payment for shares redeemed | |
Class A | | | (666,484 | ) | | | (16,772,133 | ) | | | (1,517,053 | ) | | | (32,912,173 | ) |
Class C | | | (190,000 | ) | | | (4,782,003 | ) | | | (1,294,523 | ) | | | (28,777,618 | ) |
Administrator Class | | | (166,711 | ) | | | (4,250,116 | ) | | | (59,230 | ) | | | (1,267,063 | ) |
Institutional Class | | | (308,961 | ) | | | (7,766,283 | ) | | | (445,017 | ) | | | (9,601,338 | ) |
| | | | |
| | | | | | | (33,570,535 | ) | | | | | | | (72,558,192 | ) |
| | | | |
Net decrease in net assets resulting from capital share transactions | | | | | | | (6,013,133 | ) | | | | | | | (20,829,855 | ) |
| | | | |
Total increase in net assets | | | | | | | 36,055,823 | | | | | | | | 40,162,499 | |
| | | | |
| | | | |
Net assets | | | | | | | | | | | | | | | | |
Beginning of period | | | | | | | 405,189,343 | | | | | | | | 365,026,844 | |
| | | | |
End of period | | | | | | $ | 441,245,166 | | | | | | | $ | 405,189,343 | |
| | | | |
The accompanying notes are an integral part of these financial statements.
Wells Fargo Utility and Telecommunications Fund | 11
Financial highlights
(For a share outstanding throughout each period)
| | | | | | | | | | | | | | | | | | | | | | | | |
| | | Six months ended
September 30, 2019
(unaudited) | | | Year ended March 31 | |
| CLASS A | | 2019 | | | 2018 | | | 2017 | | | 2016 | | | 2015 | |
Net asset value, beginning of period | | | $24.03 | | | | $20.46 | | | | $20.01 | | | | $18.70 | | | | $18.23 | | | | $17.71 | |
Net investment income | | | 0.17 | | | | 0.32 | | | | 0.34 | | | | 0.35 | | | | 0.31 | | | | 0.29 | |
Net realized and unrealized gains (losses) on investments | | | 2.51 | | | | 3.65 | | | | 0.47 | | | | 1.30 | | | | 0.45 | | | | 0.57 | |
| | | | | | | | | | | | | | | | | | | | | | | | |
Total from investment operations | | | 2.68 | | | | 3.97 | | | | 0.81 | | | | 1.65 | | | | 0.76 | | | | 0.86 | |
Distributions to shareholders from | | | | | | | | | | | | | | | | | | | | | | | | |
Net investment income | | | (0.16 | ) | | | (0.34 | ) | | | (0.36 | ) | | | (0.34 | ) | | | (0.29 | ) | | | (0.34 | ) |
Net realized gains | | | 0.00 | | | | (0.06 | ) | | | 0.00 | | | | 0.00 | | | | 0.00 | | | | 0.00 | |
| | | | | | | | | | | | | | | | | | | | | | | | |
Total distributions to shareholders | | | (0.16 | ) | | | (0.40 | ) | | | (0.36 | ) | | | (0.34 | ) | | | (0.29 | ) | | | (0.34 | ) |
Net asset value, end of period | | | $26.55 | | | | $24.03 | | | | $20.46 | | | | $20.01 | | | | $18.70 | | | | $18.23 | |
Total return1 | | | 11.16 | % | | | 19.59 | % | | | 4.00 | % | | | 8.87 | % | | | 4.30 | % | | | 4.82 | % |
Ratios to average net assets (annualized) | | | | | | | | | | | | | | | | | | | | | | | | |
Gross expenses | | | 1.17 | % | | | 1.19 | % | | | 1.17 | % | | | 1.18 | % | | | 1.20 | % | | | 1.22 | % |
Net expenses | | | 1.14 | % | | | 1.14 | % | | | 1.14 | % | | | 1.14 | % | | | 1.14 | % | | | 1.14 | % |
Net investment income | | | 1.32 | % | | | 1.47 | % | | | 1.60 | % | | | 1.79 | % | | | 1.73 | % | | | 1.57 | % |
Supplemental data | | | | | | | | | | | | | | | | | | | | | | | | |
Portfolio turnover rate | | | 18 | % | | | 10 | % | | | 7 | % | | | 22 | % | | | 15 | % | | | 29 | % |
Net assets, end of period (000s omitted) | | | $371,851 | | | | $337,848 | | | | $287,047 | | | | $308,152 | | | | $315,238 | | | | $341,342 | |
| 1 | Total return calculations do not include any sales charges. Returns for periods of less than one year are not annualized. |
The accompanying notes are an integral part of these financial statements.
12 | Wells Fargo Utility and Telecommunications Fund
Financial highlights
(For a share outstanding throughout each period)
| | | | | | | | | | | | | | | | | | | | | | | | |
| | | Six months ended
September 30, 2019
(unaudited) | | | Year ended March 31 | |
| CLASS C | | 2019 | | | 2018 | | | 2017 | | | 2016 | | | 2015 | |
Net asset value, beginning of period | | | $24.06 | | | | $20.47 | | | | $20.01 | | | | $18.70 | | | | $18.25 | | | | $17.73 | |
Net investment income | | | 0.07 | 1 | | | 0.16 | 1 | | | 0.13 | | | | 0.16 | | | | 0.17 | 1 | | | 0.15 | |
Net realized and unrealized gains (losses) on investments | | | 2.52 | | | | 3.63 | | | | 0.52 | | | | 1.34 | | | | 0.45 | | | | 0.57 | |
| | | | | | | | | | | | | | | | | | | | | | | | |
Total from investment operations | | | 2.59 | | | | 3.79 | | | | 0.65 | | | | 1.50 | | | | 0.62 | | | | 0.72 | |
Distributions to shareholders from | | | | | | | | | | | | | | | | | | | | | | | | |
Net investment income | | | (0.04 | ) | | | (0.14 | ) | | | (0.19 | ) | | | (0.19 | ) | | | (0.17 | ) | | | (0.20 | ) |
Net realized gains | | | 0.00 | | | | (0.06 | ) | | | 0.00 | | | | 0.00 | | | | 0.00 | | | | 0.00 | |
| | | | | | | | | | | | | | | | | | | | | | | | |
Total distributions to shareholders | | | (0.04 | ) | | | (0.20 | ) | | | (0.19 | ) | | | (0.19 | ) | | | (0.17 | ) | | | (0.20 | ) |
Net asset value, end of period | | | $26.61 | | | | $24.06 | | | | $20.47 | | | | $20.01 | | | | $18.70 | | | | $18.25 | |
Total return2 | | | 10.77 | % | | | 18.65 | % | | | 3.24 | % | | | 8.04 | % | | | 3.49 | % | | | 4.04 | % |
Ratios to average net assets (annualized) | | | | | | | | | | | | | | | | | | | | | | | | |
Gross expenses | | | 1.92 | % | | | 1.94 | % | | | 1.92 | % | | | 1.93 | % | | | 1.95 | % | | | 1.97 | % |
Net expenses | | | 1.89 | % | | | 1.89 | % | | | 1.89 | % | | | 1.89 | % | | | 1.89 | % | | | 1.89 | % |
Net investment income | | | 0.56 | % | | | 0.74 | % | | | 0.85 | % | | | 1.02 | % | | | 0.99 | % | | | 0.82 | % |
Supplemental data | | | | | | | | | | | | | | | | | | | | | | | | |
Portfolio turnover rate | | | 18 | % | | | 10 | % | | | 7 | % | | | 22 | % | | | 15 | % | | | 29 | % |
Net assets, end of period (000s omitted) | | | $17,380 | | | | $19,618 | | | | $41,729 | | | | $51,123 | | | | $57,431 | | | | $63,632 | |
| 1 | Calculated based upon average shares outstanding |
| 2 | Total return calculations do not include any sales charges. Returns for periods of less than one year are not annualized. |
The accompanying notes are an integral part of these financial statements.
Wells Fargo Utility and Telecommunications Fund | 13
Financial highlights
(For a share outstanding throughout each period)
| | | | | | | | | | | | | | | | | | | | | | | | |
| | | Six months ended
September 30, 2019
(unaudited) | | | Year ended March 31 | |
| ADMINISTRATOR CLASS | | 2019 | | | 2018 | | | 2017 | | | 2016 | | | 2015 | |
Net asset value, beginning of period | | | $24.05 | | | | $20.48 | | | | $20.03 | | | | $18.72 | | | | $18.25 | | | | $17.73 | |
Net investment income | | | 0.18 | 1 | | | 0.36 | | | | 0.37 | | | | 0.38 | | | | 0.34 | | | | 0.33 | |
Net realized and unrealized gains (losses) on investments | | | 2.53 | | | | 3.65 | | | | 0.48 | | | | 1.30 | | | | 0.45 | | | | 0.56 | |
| | | | | | | | | | | | | | | | | | | | | | | | |
Total from investment operations | | | 2.71 | | | | 4.01 | | | | 0.85 | | | | 1.68 | | | | 0.79 | | | | 0.89 | |
Distributions to shareholders from | | | | | | | | | | | | | | | | | | | | | | | | |
Net investment income | | | (0.17 | ) | | | (0.38 | ) | | | (0.40 | ) | | | (0.37 | ) | | | (0.32 | ) | | | (0.37 | ) |
Net realized gains | | | 0.00 | | | | (0.06 | ) | | | 0.00 | | | | 0.00 | | | | 0.00 | | | | 0.00 | |
| | | | | | | | | | | | | | | | | | | | | | | | |
Total distributions to shareholders | | | (0.17 | ) | | | (0.44 | ) | | | (0.40 | ) | | | (0.37 | ) | | | (0.32 | ) | | | (0.37 | ) |
Net asset value, end of period | | | $26.59 | | | | $24.05 | | | | $20.48 | | | | $20.03 | | | | $18.72 | | | | $18.25 | |
Total return2 | | | 11.29 | % | | | 19.80 | % | | | 4.21 | % | | | 9.04 | % | | | 4.49 | % | | | 5.01 | % |
Ratios to average net assets (annualized) | | | | | | | | | | | | | | | | | | | | | | | | |
Gross expenses | | | 1.10 | % | | | 1.11 | % | | | 1.09 | % | | | 1.10 | % | | | 1.09 | % | | | 1.06 | % |
Net expenses | | | 0.95 | % | | | 0.95 | % | | | 0.95 | % | | | 0.95 | % | | | 0.95 | % | | | 0.95 | % |
Net investment income | | | 1.41 | % | | | 1.66 | % | | | 1.80 | % | | | 1.93 | % | | | 1.93 | % | | | 1.79 | % |
Supplemental data | | | | | | | | | | | | | | | | | | | | | | | | |
Portfolio turnover rate | | | 18 | % | | | 10 | % | | | 7 | % | | | 22 | % | | | 15 | % | | | 29 | % |
Net assets, end of period (000s omitted) | | | $2,405 | | | | $5,296 | | | | $4,702 | | | | $5,168 | | | | $6,740 | | | | $8,365 | |
| 1 | Calculated based upon average shares outstanding |
| 2 | Returns for periods of less than one year are not annualized. |
The accompanying notes are an integral part of these financial statements.
14 | Wells Fargo Utility and Telecommunications Fund
Financial highlights
(For a share outstanding throughout each period)
| | | | | | | | | | | | | | | | | | | | | | | | |
| | | Six months ended
September 30, 2019
(unaudited) | | | Year ended March 31 | |
| INSTITUTIONAL CLASS | | 2019 | | | 2018 | | | 2017 | | | 2016 | | | 2015 | |
Net asset value, beginning of period | | | $24.01 | | | | $20.45 | | | | $20.00 | | | | $18.69 | | | | $18.23 | | | | $17.74 | |
Net investment income | | | 0.21 | | | | 0.41 | | | | 0.41 | | | | 0.42 | | | | 0.36 | 1 | | | 0.35 | 1 |
Net realized and unrealized gains (losses) on investments | | | 2.52 | | | | 3.62 | | | | 0.47 | | | | 1.30 | | | | 0.45 | | | | 0.54 | |
| | | | | | | | | | | | | | | | | | | | | | | | |
Total from investment operations | | | 2.73 | | | | 4.03 | | | | 0.88 | | | | 1.72 | | | | 0.81 | | | | 0.89 | |
Distributions to shareholders from | | | | | | | | | | | | | | | | | | | | | | | | |
Net investment income | | | (0.20 | ) | | | (0.41 | ) | | | (0.43 | ) | | | (0.41 | ) | | | (0.35 | ) | | | (0.40 | ) |
Net realized gains | | | 0.00 | | | | (0.06 | ) | | | 0.00 | | | | 0.00 | | | | 0.00 | | | | 0.00 | |
| | | | | | | | | | | | | | | | | | | | | | | | |
Total distributions to shareholders | | | (0.20 | ) | | | (0.47 | ) | | | (0.43 | ) | | | (0.41 | ) | | | (0.35 | ) | | | (0.40 | ) |
Net asset value, end of period | | | $26.54 | | | | $24.01 | | | | $20.45 | | | | $20.00 | | | | $18.69 | | | | $18.23 | |
Total return2 | | | 11.36 | % | | | 20.03 | % | | | 4.38 | % | | | 9.26 | % | | | 4.63 | % | | | 5.02 | % |
Ratios to average net assets (annualized) | | | | | | | | | | | | | | | | | | | | | | | | |
Gross expenses | | | 0.84 | % | | | 0.86 | % | | | 0.84 | % | | | 0.85 | % | | | 0.84 | % | | | 0.79 | % |
Net expenses | | | 0.78 | % | | | 0.78 | % | | | 0.78 | % | | | 0.78 | % | | | 0.78 | % | | | 0.78 | % |
Net investment income | | | 1.69 | % | | | 1.83 | % | | | 1.95 | % | | | 2.18 | % | | | 2.03 | % | | | 1.89 | % |
Supplemental data | | | | | | | | | | | | | | | | | | | | | | | | |
Portfolio turnover rate | | | 18 | % | | | 10 | % | | | 7 | % | | | 22 | % | | | 15 | % | | | 29 | % |
Net assets, end of period (000s omitted) | | | $49,609 | | | | $42,427 | | | | $31,548 | | | | $24,575 | | | | $15,295 | | | | $14,156 | |
| 1 | Calculated based upon average shares outstanding |
| 2 | Returns for periods of less than one year are not annualized. |
The accompanying notes are an integral part of these financial statements.
Wells Fargo Utility and Telecommunications Fund | 15
Notes to financial statements (unaudited)
1. ORGANIZATION
Wells Fargo Funds Trust (the “Trust”), a Delaware statutory trust organized on March 10, 1999, is anopen-end management investment company registered under the Investment Company Act of 1940, as amended (the “1940 Act”). As an investment company, the Trust follows the accounting and reporting guidance in Financial Accounting Standards Board(“FASB”)Accounting Standards Codification Topic 946, Financial Services – Investment Companies. These financial statements report on the Wells Fargo Utility and Telecommunications Fund (the “Fund”) which is anon-diversified series of the Trust.
2. SIGNIFICANT ACCOUNTING POLICIES
The following significant accounting policies, which are consistently followed in the preparation of the financial statements of the Fund, are in conformity with U.S. generally accepted accounting principles which require management to make estimates and assumptions that affect the reported amounts of assets and liabilities, disclosure of contingent assets and liabilities at the date of the financial statements, and the reported amounts of revenues and expenses during the reporting period. Actual results could differ from those estimates.
Securities valuation
All investments are valued each business day as of the close of regular trading on the New York Stock Exchange (generally 4 p.m. Eastern Time), although the Fund may deviate from this calculation time under unusual or unexpected circumstances.
Equity securities that are listed on a foreign or domestic exchange or market are valued at the official closing price or, if none, the last sales price. If no sale occurs on the principal exchange or market that day, a fair value price will be determined in accordance with the Fund’s Valuation Procedures.
The values of securities denominated in foreign currencies are translated into U.S. dollars at rates provided by an independent foreign currency pricing source at a time each business day specified by the Wells Fargo Asset Management Pricing Committee at Wells Fargo Funds Management, LLC (“Funds Management”).
Many securities markets and exchanges outside the U.S. close prior to the close of the New York Stock Exchange and therefore may not fully reflect trading or events that occur after the close of the principal exchange in which the foreign securities are traded, but before the close of the New York Stock Exchange. If such trading or events are expected to materially affect the value of such securities, then fair value pricing procedures approved by the Board of Trustees of the Fund are applied. These procedures take into account multiple factors including movements in U.S. securities markets after foreign exchanges close. Foreign securities that are fair valued under these procedures are categorized as Level 2 and the application of these procedures may result in transfers between Level 1 and Level 2. Depending on market activity, such fair valuations may be frequent. Such fair value pricing may result in net asset values that are higher or lower than net asset values based on the last reported sales price or latest quoted bid price. On September 30, 2019, such fair value pricing was not used in pricing certain foreign securities.
Investments in registeredopen-end investment companies are valued at net asset value. Interests innon-registered investment companies that are redeemable at net asset value are fair valued normally at net asset value.
Investments which are not valued using any of the methods discussed above are valued at their fair value, as determined in good faith by the Board of Trustees. The Board of Trustees has established a Valuation Committee comprised of the Trustees and has delegated to it the authority to take any actions regarding the valuation of portfolio securities that the Valuation Committee deems necessary or appropriate, including determining the fair value of portfolio securities, unless the determination has been delegated to the Wells Fargo Asset Management Pricing Committee. The Board of Trustees retains the authority to make or ratify any valuation decisions or approve any changes to the Valuation Procedures as it deems appropriate. On a quarterly basis, the Board of Trustees receives reports on any valuation actions taken by the Valuation Committee or the Wells Fargo Asset Management Pricing Committee which may include items for ratification.
Foreign currency translation
The accounting records of the Fund are maintained in U.S. dollars. The values of other assets and liabilities denominated in foreign currencies are translated into U.S. dollars at rates provided by an independent foreign currency pricing source at a time each business day specified by the Wells Fargo Asset Management Pricing Committee. Purchases and sales of securities, and income and expenses are converted at the rate of exchange on the respective dates of such transactions. Net realized foreign exchange gains or losses arise from sales of foreign currencies, currency gains or losses realized between the trade and settlement dates on securities transactions, and the difference between the amounts of dividends, interest and foreign withholding taxes recorded and the U.S. dollar equivalent of the amounts actually paid or received. Net unrealized foreign exchange gains and losses arise from changes in the fair value of assets and liabilities other than investments in securities resulting from changes in exchange rates. The changes in net assets arising from changes in exchange rates of securities and the changes in net assets resulting from changes in market prices of securities are not separately presented. Such changes are included in net realized and unrealized gains or losses from investments.
16 | Wells Fargo Utility and Telecommunications Fund
Notes to financial statements (unaudited)
Securities lending
The Fund may lend its securities from time to time in order to earn additional income in the form of fees or interest on securities received as collateral or the investment of any cash received as collateral. When securities are on loan, the Fund receives interest or dividends on those securities. Cash collateral received in connection with its securities lending transactions is invested in Securities Lending Cash Investments, LLC (the “Securities Lending Fund”). Investments in Securities Lending Fund are valued at the evaluated bid price provided by an independent pricing service. Income earned from investment in the Securities Lending Fund (net of fees and rebates), if any, is included in income from affiliated securities on the Statement of Operations.
In a securities lending transaction, the net asset value of the Fund is affected by an increase or decrease in the value of the securities loaned and by an increase or decrease in the value of the instrument in which collateral is invested. The amount of securities lending activity undertaken by the Fund fluctuates from time to time. The Fund has the right under the lending agreement to recover the securities from the borrower on demand. In the event of default or bankruptcy by the borrower, the Fund may be prevented from recovering the loaned securities or gaining access to the collateral or may experience delays or costs in doing so. In such an event, the terms of the agreement allows the unaffiliated securities lending agent to use the collateral to purchase replacement securities on behalf of the Fund or pay the Fund the market value of the loaned securities. The Fund bears the risk of loss with respect to depreciation of its investment of the cash collateral.
Security transactions and income recognition
Securities transactions are recorded on a trade date basis. Realized gains or losses are recorded on the basis of identified cost.
Dividend income is recognized on theex-dividend date, except for certain dividends from foreign securities, which are recorded as soon as the custodian verifies theex-dividend date. Dividend income from foreign securities is recorded net of foreign taxes withheld where recovery of such taxes is not assured.
Distributions to shareholders
Distributions to shareholders are recorded on theex-dividend date and paid from net investment income quarterly and any net realized gains are paid at least annually. Such distributions are determined in accordance with income tax regulations and may differ from U.S. generally accepted accounting principles. Dividend sources are estimated at the time of declaration. The tax character of distributions is determined as of the Fund’s fiscal year end. Therefore, a portion of the Fund’s distributions made prior to the Fund’s fiscal year end may be categorized as a tax return of capital at year end.
Federal and other taxes
The Fund intends to continue to qualify as a regulated investment company by distributing substantially all of its investment company taxable income and any net realized capital gains (after reduction for capital loss carryforwards) sufficient to relieve it from all, or substantially all, federal income taxes. Accordingly, no provision for federal income taxes was required.
The Fund’s income and federal excise tax returns and all financial records supporting those returns for the prior three fiscal years are subject to examination by the federal and Delaware revenue authorities. Management has analyzed the Fund’s tax positions taken on federal, state, and foreign tax returns for all open tax years and does not believe that there are any uncertain tax positions that require recognition of a tax liability.
As of September 30, 2019, the aggregate cost of all investments for federal income tax purposes was $211,984,228 and the unrealized gains (losses) consisted of:
| | | | |
| |
Gross unrealized gains | | $ | 231,169,532 | |
| |
Gross unrealized losses | | | (2,150,328 | ) |
| |
Net unrealized gains | | $ | 229,019,204 | |
Class allocations
The separate classes of shares offered by the Fund differ principally in applicable sales charges, distribution, shareholder servicing, and administration fees. Class specific expenses are charged directly to that share class. Investment income, common fund-level expenses, and realized and unrealized gains (losses) on investments are allocated daily to each class of shares based on the relative proportion of net assets of each class.
3. FAIR VALUATION MEASUREMENTS
Fair value measurements of investments are determined within a framework that has established a fair value hierarchy based upon the various data inputs utilized in determining the value of the Fund’s investments. The three-level hierarchy gives the highest priority to unadjusted quoted prices in active markets for identical assets or liabilities (Level 1) and the lowest priority to
Wells Fargo Utility and Telecommunications Fund | 17
Notes to financial statements (unaudited)
unobservable inputs (Level 3). The Fund’s investments are classified within the fair value hierarchy based on the lowest level of input that is significant to the fair value measurement. The inputs are summarized into three broad levels as follows:
| ∎ | | Level 1 – quoted prices in active markets for identical securities |
| ∎ | | Level 2 – other significant observable inputs (including quoted prices for similar securities, interest rates, prepayment speeds, credit risk, etc.) |
| ∎ | | Level 3 – significant unobservable inputs (including the Fund’s own assumptions in determining the fair value of investments) |
The inputs or methodologies used for valuing investments in securities are not necessarily an indication of the risk associated with investing in those securities.
The following is a summary of the inputs used in valuing the Fund’s assets and liabilities as of September 30, 2019:
| | | | | | | | | | | | | | | | |
| | | | |
| | | Quoted prices
(Level 1) | | | Other significant
observable inputs
(Level 2) | | | Significant
unobservable inputs (Level 3) | | | Total | |
| | | | |
Assets | | | | | | | | | | | | | | | | |
Investments in: | | | | | | | | | | | | | | | | |
| | | | |
Common stocks | | | | | | | | | | | | | | | | |
| | | | |
Communication services | | $ | 63,907,627 | | | $ | 0 | | | $ | 0 | | | $ | 63,907,627 | |
| | | | |
Energy | | | 18,177,961 | | | | 0 | | | | 0 | | | | 18,177,961 | |
| | | | |
Financials | | | 1,325,488 | | | | 0 | | | | 0 | | | | 1,325,488 | |
| | | | |
Industrials | | | 2,569,060 | | | | 0 | | | | 0 | | | | 2,569,060 | |
| | | | |
Information technology | | | 33,721,900 | | | | 0 | | | | 0 | | | | 33,721,900 | |
| | | | |
Utilities | | | 309,571,635 | | | | 0 | | | | 0 | | | | 309,571,635 | |
| | | | |
Preferred stocks | | | | | | | | | | | | | | | | |
| | | | |
Utilities | | | 2,206,040 | | | | 0 | | | | 0 | | | | 2,206,040 | |
| | | | |
Short-term investments | | | | | | | | | | | | | | | | |
| | | | |
Investment companies | | | 9,523,721 | | | | 0 | | | | 0 | | | | 9,523,721 | |
| | | | |
Total assets | | $ | 441,003,432 | | | $ | 0 | | | $ | 0 | | | $ | 441,003,432 | |
Additional sector, industry or geographic detail is included in the Portfolio of Investments.
For the six months ended September 30, 2019, the Fund did not have any transfers into/out of Level 3.
4. TRANSACTIONS WITH AFFILIATES AND OTHER EXPENSES
Management fee
Funds Management, an indirect wholly owned subsidiary of Wells Fargo & Company (“Wells Fargo”), is the manager of the Fund and provides advisory and fund-level administrative services under an investment management agreement. Under the investment management agreement, Funds Management is responsible for, among other services, implementing the investment objectives and strategies of the Fund, supervising the subadviser and providing fund-level administrative services in connection with the Fund’s operations. As compensation for its services under the investment management agreement, Funds Management is entitled to receive a management fee at the following annual rate based on the Fund’s average daily net assets:
| | | | |
| |
| Average daily net assets | | Management fee | |
| |
First $500 million | | | 0.650 | % |
| |
Next $500 million | | | 0.600 | |
| |
Next $1 billion | | | 0.550 | |
| |
Next $2 billion | | | 0.525 | |
| |
Next $1 billion | | | 0.500 | |
| |
Next $5 billion | | | 0.490 | |
| |
Over $10 billion | | | 0.480 | |
18 | Wells Fargo Utility and Telecommunications Fund
Notes to financial statements (unaudited)
For the six months ended September 30, 2019, the management fee was equivalent to an annual rate of 0.65% of the Fund’s average daily net assets.
Funds Management has retained the services of a subadviser to provide daily portfolio management to the Fund. The fee for subadvisory services is borne by Funds Management. Crow Point Partners, LLC, which is not an affiliate of Funds Management, is the subadviser to the Fund and is entitled to receive a fee from Funds Management at an annual rate starting at 0.20% and declining to 0.10% as the average daily net assets of the Fund increase.
Administration fees
Under a class-level administration agreement, Funds Management provides class-level administrative services to the Fund, which includes paying fees and expenses for services provided by the transfer agent,sub-transfer agents, omnibus account servicers and record-keepers. As compensation for its services under the class-level administration agreement, Funds Management receives an annual fee which is calculated based on the average daily net assets of each class as follows:
| | | | |
| |
| | | Class-level
administration fee | |
| |
Class A, Class C | | | 0.21 | % |
| |
Administrator Class, Institutional Class | | | 0.13 | |
Waivers and/or expense reimbursements
Funds Management has contractually waived and/or reimbursed management and administration fees to the extent necessary to maintain certain net operating expense ratios for the Fund. When each class of the Fund has exceeded its expense cap, Funds Management has waived fees and/or reimbursed expenses from fund-level expenses on a proportionate basis and then from class specific expenses. When only certain classes exceed their expense caps, waivers and/or reimbursements are applied against class specific expenses before fund-level expenses. Funds Management has committed through July 31, 2020 to waive fees and/or reimburse expenses to the extent necessary to cap the Fund’s expenses at 1.14% for Class A shares, 1.89% for Class C shares, 0.95% for Administrator Class shares, and 0.78% for Institutional Class. Prior to or after the commitment expiration date, the cap may be increased or the commitment to maintain the cap may be terminated only with the approval of the Board of Trustees.
Distribution fee
The Trust has adopted a distribution plan for Class C shares of the Fund pursuant to Rule12b-1 under the 1940 Act. A distribution fee is charged to Class C shares and paid to Wells Fargo Funds Distributor, LLC (“Funds Distributor”), the principal underwriter, at an annual rate of 0.75% of the average daily net assets of Class C shares.
In addition, Funds Distributor is entitled to receive thefront-end sales charge from the purchase of Class A shares and a contingent deferred sales charge on the redemption of certain Class A shares. Funds Distributor is also entitled to receive the contingent deferred sales charges from redemptions of Class C shares. For the six months ended September 30, 2019, Funds Distributor received $19,586 from the sale of Class A shares. No contingent deferred sales charges were incurred by Class A and Class C shares for the six months ended September 30, 2019.
Shareholder servicing fees
The Trust has entered into contracts with one or more shareholder servicing agents, whereby Class A, Class C, and Administrator Class of the Fund are charged a fee at an annual rate of 0.25% of the average daily net assets of each respective class. A portion of these total shareholder servicing fees were paid to affiliates of Wells Fargo.
Interfund transactions
The Fund may purchase or sell portfolio investment securities to certain other Wells Fargo affiliates pursuant to Rule17a-7 under the 1940 Act and under procedures adopted by the Board of Trustees. The procedures have been designed to ensure that these interfund transactions, which do not incur broker commissions, are effected at current market prices. Pursuant to these procedures, the Fund had $16,120,298 and $16,124,327 in interfund purchases and sales, respectively, during the six months ended September 30, 2019.
5. INVESTMENT PORTFOLIO TRANSACTIONS
Purchases and sales of investments, excluding U.S. government obligations (if any) and short-term securities, for the six months ended September 30, 2019 were $73,217,747 and $77,134,412, respectively.
Wells Fargo Utility and Telecommunications Fund | 19
Notes to financial statements (unaudited)
6. SECURITIES LENDING TRANSACTIONS
The Fund lends its securities through an unaffiliated securities lending agent and receives collateral in the form of cash or securities with a value at least equal to the value of the securities on loan. The value of the loaned securities is determined at the close of each business day and any increases or decreases in the required collateral are exchanged between the Fund and the counterparty on the next business day. Cash collateral received is invested in the Securities Lending Fund which seeks to provide a positive return compared to the daily Fed Funds Open Rate by investing in high-quality, U.S. dollar-denominated short-term money market instruments and is exempt from registration under Section 3(c)(7) of the 1940 Act. Securities Lending Fund is managed by Funds Management and is subadvised by Wells Capital Management Incorporated (“WellsCap”), an affiliate of Funds Management and an indirect wholly owned subsidiary of Wells Fargo. Funds Management receives an advisory fee starting at 0.05% and declining to 0.01% as the average daily net assets of the Securities Lending Fund increase. All of the fees received by Funds Management are paid to WellsCap for its services as subadviser.
In the event of counterparty default or the failure of a borrower to return a loaned security, the Fund has the right to use the collateral to offset any losses incurred. As of September 30, 2019, the Fund did not have any securities on loan.
7. BANK BORROWINGS
The Trust (excluding the money market funds), Wells Fargo Master Trust and Wells Fargo Variable Trust are parties to a $280,000,000 revolving credit agreement whereby the Fund is permitted to use bank borrowings for temporary or emergency purposes, such as to fund shareholder redemption requests. Interest under the credit agreement is charged to the Fund based on a borrowing rate equal to the higher of the Federal Funds rate in effect on that day plus 1.25% or the overnight LIBOR rate in effect on that day plus 1.25%. In addition, an annual commitment fee equal to 0.25% of the unused balance is allocated to each participating fund.
For the six months ended September 30, 2019, there were no borrowings by the Fund under the agreement.
8. CONCENTRATION RISK
The Fund invests a substantial portion of its assets in utility and telecommunications companies and, therefore, may be more affected by changes in the utility sector than would be a fund whose investments are not heavily weighted in any sector.
9. INDEMNIFICATION
Under the Trust’s organizational documents, the officers and Trustees have been granted certain indemnification rights against certain liabilities that may arise out of performance of their duties to the Trust. Additionally, in the normal course of business, the Trust may enter into contracts with service providers that contain a variety of indemnification clauses. The Trust’s maximum exposure under these arrangements is dependent on future claims that may be made against the Fund and, therefore, cannot be estimated.
10. NEW ACCOUNTING PRONOUNCEMENT
In August 2018, FASB issued Accounting Standards Update (“ASU”)No. 2018-13, Fair Value Measurement (Topic 820)Disclosure Framework—Changes to the Disclosure Requirements for Fair Value Measurement. ASU2018-13 updates the disclosure requirements for fair value measurements by modifying or removing certain disclosures and adding certain new disclosures. The amendments are effective for fiscal years, and interim periods within those fiscal years, beginning after December 15, 2019. Early adoption is permitted. Management has adopted the removal and modification of disclosures early, as permitted, and will adopt the additional new disclosures at the effective date.
20 | Wells Fargo Utility and Telecommunications Fund
Other information (unaudited)
PROXY VOTING INFORMATION
A description of the policies and procedures used to determine how to vote proxies relating to portfolio securities is available, upon request, by calling1-800-222-8222, visiting our website atwfam.com, or visiting the SEC website at sec.gov. Information regarding how the proxies related to portfolio securities were voted during the most recent12-month period ended June 30 is available on the website atwfam.comor by visiting the SEC website at sec.gov.
QUARTERLY PORTFOLIO HOLDINGS INFORMATION
The Fund files its complete schedule of portfolio holdings with the SEC for the first and third quarters of each fiscal year on FormN-Q or FormN-PORT, which is available by visiting the SEC website at sec.gov. Those forms may be reviewed and copied at the SEC’s Public Reference Room in Washington, DC. Information on the operation of the Public Reference Room may be obtained by calling1-800-SEC-0330.
Wells Fargo Utility and Telecommunications Fund | 21
Other information (unaudited)
BOARD OF TRUSTEES AND OFFICERS
Each of the Trustees and Officers1 listed in the table below acts in identical capacities for each fund in the Wells Fargo family of funds, which consists of 150 mutual funds comprising the Wells Fargo Funds Trust, Wells Fargo Variable Trust, Wells Fargo Master Trust and fourclosed-end funds (collectively the “Fund Complex”). This table should be read in conjunction with the Prospectus and the Statement of Additional Information2. The mailing address of each Trustee and Officer is 525 Market Street, 12th Floor, San Francisco, CA 94105. Each Trustee and Officer serves an indefinite term, however, each Trustee serves such term until reaching the mandatory retirement age established by the Trustees.
Independent Trustees
| | | | | | |
Name and year of birth | | Position held and
length of service* | | Principal occupations during past five years or longer | | Current other
public company or
investment
company
directorships |
| | | |
William R. Ebsworth (Born 1957) | | Trustee, since 2015 | | Retired. From 1984 to 2013, equities analyst, portfolio manager, research director and chief investment officer at Fidelity Management and Research Company in Boston, Tokyo, and Hong Kong, and retired in 2013 as Chief Investment Officer of Fidelity Strategic Advisers, Inc. where he led a team of investment professionals managing client assets. Prior thereto, Board member of Hong Kong Securities Clearing Co., Hong Kong Options Clearing Corp., the Thailand International Fund, Ltd., Fidelity Investments Life Insurance Company, and Empire Fidelity Investments Life Insurance Company. Audit Committee Chair and Investment Committee Chair of the Vincent Memorial Hospital Endowment(non-profit organization). Mr. Ebsworth is a CFA® charterholder. | | N/A |
| | | |
Jane A. Freeman (Born 1953) | | Trustee, since 2015; Chair Liaison, since 2018 | | Retired. From 2012 to 2014 and 1999 to 2008, Chief Financial Officer of Scientific Learning Corporation. From 2008 to 2012, Ms. Freeman provided consulting services related to strategic business projects. Prior to 1999, Portfolio Manager at Rockefeller & Co. and Scudder, Stevens & Clark. Board member of the Harding Loevner Funds from 1996 to 2014, serving as both Lead Independent Director and chair of the Audit Committee. Board member of the Russell Exchange Traded Funds Trust from 2011 to 2012 and the chair of the Audit Committee. Ms. Freeman is a Board Member of The Ruth Bancroft Garden(non-profit organization). She is also an inactive Chartered Financial Analyst. | | N/A |
| | | |
Isaiah Harris, Jr. (Born 1952) | | Trustee, since 2009; Audit Committee Chairman, since 2019 | | Retired. Chairman of the Board of CIGNA Corporation since 2009, and Director since 2005. From 2003 to 2011, Director of Deluxe Corporation. Prior thereto, President and CEO of BellSouth Advertising and Publishing Corp. from 2005 to 2007, President and CEO of BellSouth Enterprises from 2004 to 2005 and President of BellSouth Consumer Services from 2000 to 2003. Emeritus member of the Iowa State University Foundation Board of Governors. Emeritus Member of the Advisory Board of Iowa State University School of Business. Advisory Board Member, Palm Harbor Academy (private school). Advisory Board Member, Child Evangelism Fellowship(non-profit). Mr. Harris is a certified public accountant (inactive status). | | CIGNA Corporation |
| | | |
Judith M. Johnson (Born 1949) | | Trustee, since 2008; Audit Committee Chairman, from 2009 to 2018 | | Retired. Prior thereto, Chief Executive Officer and Chief Investment Officer of Minneapolis Employees Retirement Fund from 1996 to 2008. Ms. Johnson is an attorney, certified public accountant and a certified managerial accountant. | | N/A |
22 | Wells Fargo Utility and Telecommunications Fund
Other information (unaudited)
| | | | | | |
Name and year of birth | | Position held and
length of service* | | Principal occupations during past five years or longer | | Current other
public company or
investment
company
directorships |
| | | |
David F. Larcker (Born 1950) | | Trustee, since 2009 | | James Irvin Miller Professor of Accounting at the Graduate School of Business, Stanford University, Director of the Corporate Governance Research Initiative and Senior Faculty of The Rock Center for Corporate Governance since 2006. From 2005 to 2008, Professor of Accounting at the Graduate School of Business, Stanford University. Prior thereto, Ernst & Young Professor of Accounting at The Wharton School, University of Pennsylvania from 1985 to 2005. | | N/A |
| | | |
Olivia S. Mitchell (Born 1953) | | Trustee, since 2006; Nominating and Governance Committee Chairman, since 2018 | | International Foundation of Employee Benefit Plans Professor, Wharton School of the University of Pennsylvania since 1993. Director of Wharton’s Pension Research Council and Boettner Center on Pensions & Retirement Research, and Research Associate at the National Bureau of Economic Research. Previously, Cornell University Professor from 1978 to 1993. | | N/A |
| | | |
Timothy J. Penny (Born 1951) | | Trustee, since 1996; Chairman, since 2018 | | President and Chief Executive Officer of Southern Minnesota Initiative Foundation, anon-profit organization, since 2007. Member of the Board of Trustees of NorthStar Education Finance, Inc., anon-profit organization, since 2007. | | N/A |
| | | |
James G. Polisson (Born 1959) | | Trustee, since 2018 | | Retired. Chief Marketing Officer, Source (ETF) UK Services, Ltd, from 2015 to 2017. From 2012 to 2015, Principal of The Polisson Group, LLC, a management consulting, corporate advisory and principal investing company. Chief Executive Officer and Managing Director at Russell Investments, Global Exchange Traded Funds from 2010 to 2012. Managing Director of Barclays Global Investors from 1998 to 2010 and Global Chief Marketing Officer for iShares and Barclays Global Investors from 2000 to 2010. Trustee of the San Francisco Mechanics’ Institute, anon-profit organization, from 2013 to 2015. Board member of the Russell Exchange Traded Fund Trust from 2011 to 2012. Director of Barclays Global Investors Holdings Deutschland GmbH from 2006 to 2009. Mr. Polisson is an attorney and has a retired status with the Massachusetts and District of Columbia Bar Associations. | | N/A |
| * | Length of service dates reflect the Trustee’s commencement of service with the Trust’s predecessor entities, where applicable. |
Wells Fargo Utility and Telecommunications Fund | 23
Other information (unaudited)
Officers
| | | | |
Name and year of birth | | Position held and
length of service | | Principal occupations during past five years or longer |
| | |
Andrew Owen (Born 1960) | | President, since 2017 | | Executive Vice President of Wells Fargo & Company and Head of Affiliated Managers, Wells Fargo Asset Management, since 2014. In addition, Mr. Owen is currently President, Chief Executive Officer and Director of Wells Fargo Funds Management, LLC since 2017. Prior thereto, Executive Vice President responsible for marketing, investments and product development for Wells Fargo Funds Management, LLC, from 2009 to 2014. |
| | |
Nancy Wiser1 (Born 1967) | | Treasurer, since 2012 | | Executive Vice President of Wells Fargo Funds Management, LLC since 2011. Chief Operating Officer and Chief Compliance Officer at LightBox Capital Management LLC, from 2008 to 2011. |
| | |
Michelle Rhee3 (Born 1966) | | Chief Legal Officer, since 2019 | | Secretary of Wells Fargo Funds Management, LLC, Chief Legal Counsel of Wells Fargo Asset Management and Assistant General Counsel of Wells Fargo Bank, N.A. since 2018. Associate General Counsel and Managing Director of Bank of America Corporation from 2004 to 2018. |
| | |
Catherine Kennedy4 (Born 1969) | | Secretary, since 2019 | | Vice President of Wells Fargo Funds Management, LLC and Senior Counsel of the Wells Fargo Legal Department since 2010. Vice President and Senior Counsel of Evergreen Investment Management Company, LLC from 1998 to 2010. |
| | |
Michael H. Whitaker (Born 1967) | | Chief Compliance Officer, since 2016 | | Chief Compliance Officer of Wells Fargo Asset Management since 2016. Senior Vice President and Chief Compliance Officer for Fidelity Investments from 2007 to 2016. |
| | |
David Berardi (Born 1975) | | Assistant Treasurer, since 2009 | | Vice President of Wells Fargo Funds Management, LLC since 2009. Vice President of Evergreen Investment Management Company, LLC from 2008 to 2010. Manager of Fund Reporting and Control for Evergreen Investment Management Company, LLC from 2004 to 2010. |
| | |
Jeremy DePalma1 (Born 1974) | | Assistant Treasurer, since 2009 | | Senior Vice President of Wells Fargo Funds Management, LLC since 2009. Senior Vice President of Evergreen Investment Management Company, LLC from 2008 to 2010 and head of the Fund Reporting and Control Team within Fund Administration from 2005 to 2010. |
| 1 | Nancy Wiser acts as Treasurer of 64 funds in the Fund Complex. Jeremy DePalma acts as Treasurer of 86 funds and Assistant Treasurer of 64 funds in the Fund Complex. |
| 2 | The Statement of Additional Information includes additional information about the Trustees and is available, without charge, upon request, by calling1-800-222-8222 or by visiting the website atwfam.com. |
| 3 | Michelle Rhee became Chief Legal Officer effective October 22, 2019. |
| 4 | Catherine Kennedy became Secretary effective October 22, 2019. |
24 | Wells Fargo Utility and Telecommunications Fund
Other information (unaudited)
BOARD CONSIDERATION OF INVESTMENT MANAGEMENT ANDSUB-ADVISORY AGREEMENTS:
Wells Fargo Utility and Telecommunications Fund
Under the Investment Company Act of 1940 (the “1940 Act”), the Board of Trustees (the “Board”) of Wells Fargo Funds Trust (the “Trust”) must determine annually whether to approve the continuation of the Trust’s investment management andsub-advisory agreements. In this regard, at anin-person meeting held on May21-22, 2019 (the “Meeting”), the Board, all the members of which have no direct or indirect interest in the investment management andsub-advisory agreements and are not “interested persons” of the Trust, as defined in the 1940 Act (the “Independent Trustees”), reviewed and approved for Wells Fargo Utility and Telecommunications Fund(the “Fund”): (i) an investment management agreement (the “Management Agreement”) with Wells Fargo Funds Management, LLC (“Funds Management”); and (ii) an investmentsub-advisory agreement (the“Sub-Advisory Agreement”) with Crow Point Partners, LLC (the“Sub-Adviser”). The Management Agreement and theSub-Advisory Agreement are collectively referred to as the “Advisory Agreements.”
At the Meeting, the Board considered the factors and reached the conclusions described below relating to the selection of Funds Management and theSub-Adviser and the approval of the Advisory Agreements. Prior to the Meeting, including at anin-person meeting in April 2019, the Trustees conferred extensively among themselves and with representatives of Funds Management about these matters. Also, the Board has adopted a team-based approach, with each team consisting of asub-set of Trustees, to assist the full Board in the discharge of its duties in reviewing investment performance and other matters throughout the year. The Independent Trustees were assisted in their evaluation of the Advisory Agreements by independent legal counsel, from whom they received separate legal advice and with whom they met separately.
In providing information to the Board, Funds Management and theSub-Adviser were guided by a detailed set of requests for information submitted to them by independent legal counsel on behalf of the Independent Trustees at the start of the Board’s annual contract renewal process earlier in 2019. In considering and approving the Advisory Agreements, the Trustees considered the information they believed relevant, including but not limited to the information discussed below. The Board considered not only the specific information presented in connection with the Meeting, but also the knowledge gained over time through interaction with Funds Management and theSub-Adviser about various topics. In this regard, the Board reviewed reports of Funds Management at each of its quarterly meetings, which included, among other things, portfolio reviews and investment performance reports. In addition, the Board and the teams mentioned above confer with portfolio managers at various times throughout the year. The Board did not identify any particular information or consideration that wasall-important or controlling, and each individual Trustee may have attributed different weights to various factors.
After its deliberations, the Board unanimously approved the continuation of the Advisory Agreements for aone-year term and determined that the compensation payable to Funds Management and theSub-Adviser under each of the Advisory Agreements was reasonable. The Board considered the approval of the Advisory Agreements for the Fund as part of its consideration of agreements for funds across the complex, but its approvals were made on afund-by-fund basis. The following summarizes a number of important, but not necessarily all, factors considered by the Board in support of its approvals.
Nature, extent and quality of services
The Board received and considered various information regarding the nature, extent and quality of services provided to the Fund by Funds Management and theSub-Adviser under the Advisory Agreements. This information included a description of the investment advisory services and Fund-level administrative services covered by the Management Agreement, as well as, among other things, a summary of the background and experience of senior management of Wells Fargo Asset Management (“WFAM”), of which Funds Management is a part, a summary of investments made in the business of WFAM, a summary of certain organizational and personnel changes involving Funds Management, and a description of Funds Management’s and theSub-Adviser’s business continuity planning programs and of their approaches to data privacy and cybersecurity. The Board received and reviewed information about Funds Management’s role as administrator of the Fund’s liquidity risk management program. The Board also considered the qualifications, background, tenure and responsibilities of each of the portfolio managers primarily responsible for theday-to-day portfolio management of the Fund.
The Board evaluated the ability of Funds Management and theSub-Adviser to attract and retain qualified investment professionals, including research, advisory and supervisory personnel. The Board further considered the compliance programs and compliance records of Funds Management and theSub-Adviser. In addition, the Board took into account the full range of services provided to the Fund by Funds Management and its affiliates.
Wells Fargo Utility and Telecommunications Fund | 25
Other information (unaudited)
Fund investment performance and expenses
The Board considered the investment performance results for the Fund over various time periods ended December 31, 2018. The Board considered these results in comparison to the investment performance of funds in a universe that was determined by Broadridge Inc. (“Broadridge”) to be similar to the Fund (the “Universe”), and in comparison to the Fund’s benchmark index and to other comparative data. Broadridge is an independent provider of investment company data. The Board received a description of the methodology used by Broadridge to select the mutual funds in the performance Universe. The Board noted that the investment performance of the Fund (Class A) was higher than the average performance of the Universe for theone-, three- andten-year periods under review, and in range of the average performance of the Universe for the five-year period under review. The Board also noted that the investment performance of the Fund was in range of its benchmark index, the S&P 500 Utilities Index, for theten-year period under review, but lower than its benchmark index for theone-, three- and five-year periods under review.
The Board received information concerning, and discussed factors contributing to, the underperformance of the Fund relative to the benchmark for the periods identified above. The Board took note of the explanations for the relative underperformance during these periods, including with respect to investment decisions and market factors that affected the Fund’s investment performance. The Board also took note of the Fund’s outperformance relative to the Universe.
The Board also received and considered information regarding the Fund’s net operating expense ratios and their various components, including actual management fees, custodian and othernon-management fees, and Rule12b-1 andnon-Rule12b-1 shareholder service fees. The Board considered these ratios in comparison to the median ratios of funds in class-specific expense groups that were determined by Broadridge to be similar to the Fund (the “Groups”). The Board received a description of the methodology used by Broadridge to select the mutual funds in the expense Groups and an explanation of how funds comprising expense groups and their expense ratios may vary fromyear-to-year. Based on the Broadridge reports, the Board noted that the net operating expense ratios of the Fund were lower than or equal to the median net operating expense ratios of the expense Groups for each share class.
The Board took into account the Fund’s investment performance and expense information provided to it among the factors considered in deciding tore-approve the Advisory Agreements.
Investment management andsub-advisory fee rates
The Board reviewed and considered the contractual fee rates payable by the Fund to Funds Management under the Management Agreement, as well as the contractual fee rates payable by the Fund to Funds Management for class-level administrative services under a Class-Level Administration Agreement, which include, among other things, class-level transfer agency andsub-transfer agency costs (collectively, the “Management Rates”). The Board also reviewed and considered the contractual investmentsub-advisory fee rates that are payable by Funds Management to theSub-Adviser for investmentsub-advisory services.
Among other information reviewed by the Board was a comparison of the Fund’s Management Rates with the average contractual investment management fee rates of funds in the expense Groups at a common asset level as well as transfer agency costs of the other funds in the expense Groups. The Board noted that the Management Rates of the Fund were lower than, in range of or equal to the sum of these average rates for the Fund’s expense Groups for all share classes.
The Board also received and considered information about the portion of the total management fee that was retained by Funds Management after payment of the fee to theSub-Adviser forsub-advisory services. The Board considered this amount in comparison to the median amount retained by advisers to funds in asub-advised expense universe that was determined by Broadridge to be similar to the Fund. In assessing the reasonableness of this amount, the Board received and evaluated information about the nature and extent of responsibilities retained and risks assumed by Funds Management and not delegated to or assumed by theSub-Adviser, and about Funds Management’son-going oversight services. The Board also considered that thesub-advisory fees paid to theSub-Adviser had been negotiated by Funds Management on an arm’s length basis.
Based on its consideration of the factors and information it deemed relevant, including those described here, the Board determined that the compensation payable to Funds Management under the Management Agreement and to theSub-Adviser under theSub-Advisory Agreement was reasonable.
Profitability
The Board received and considered information concerning the profitability of Funds Management, as well as the profitability of both WFAM and Wells Fargo & Co. (“Wells Fargo”) from providing services to the fund family as a whole. Funds Management reported on the methodologies and estimates used in calculating profitability, including a description of the methodology used to allocate certain expenses. Among other things, the Board noted that the levels of profitability reported on afund-by-fund basis varied widely, depending on factors such as the size, type and age of fund. The Board did not consider profitability with respect to theSub-Adviser, as thesub-advisory fees paid to theSub-Adviser had been negotiated by Funds Management on anarm’s-length basis.
26 | Wells Fargo Utility and Telecommunications Fund
Other information (unaudited)
Based on its review, the Board did not deem the profits reported by Funds Management, WFAM or Wells Fargo from services provided to the Fund to be at a level that would prevent it from approving the continuation of the Advisory Agreements.
Economies of scale
The Board received and considered information about the potential for Funds Management to experience economies of scale in the provision of management services to the Fund, the difficulties of calculating economies of scale at an individual fund level, and the extent to which potential scale benefits are shared with shareholders. The Board noted the existence of breakpoints in the Fund’s management fee structure, which operate generally to reduce the Fund’s expense ratios as the Fund grows in size. The Board considered that in addition to management fee breakpoints, Funds Management shares potential economies of scale from its management business in a variety of ways, including through fee waiver and expense reimbursement arrangements, services that benefit shareholders, competitive management fee rates set at the outset without regard to breakpoints, and investments in the business intended to enhance services available to shareholders.
The Board concluded that Funds Management’s arrangements with respect to the Fund, including contractual breakpoints, constituted a reasonable approach to sharing potential economies of scale with the Fund and its shareholders.
Other benefits to Funds Management and theSub-Adviser
The Board received and considered information regarding potential“fall-out” or ancillary benefits received by Funds Management, theSub-Adviser, and their affiliates as a result of their relationships with the Fund. Ancillary benefits could include, among others, benefits directly attributable to other relationships with the Fund and benefits potentially derived from an increase in Funds Management’s and theSub-Adviser’s business as a result of their relationships with the Fund. The Board noted that various affiliates of Funds Management may receive distribution-related fees, shareholder servicing payments andsub-transfer agency fees in respect of shares sold or held through them and services provided.
The Board also reviewed information about soft dollar credits earned and utilized by theSub-Adviser, fees earned by Funds Management and its affiliate from managing a private investment vehicle for the fund family’s securities lending collateral, and commissions earned by an affiliated broker from portfolio transactions.
Based on its consideration of the factors and information it deemed relevant, including those described here, the Board did not find that any ancillary benefits received by Funds Management, theSub-Adviser, and their affiliates were unreasonable.
Conclusion
At the Meeting, after considering the above-described factors and based on its deliberations and its evaluation of the information described above, the Board unanimously approved the continuation of the Advisory Agreements for aone-year term and determined that the compensation payable to Funds Management and theSub-Adviser under each of the Advisory Agreements was reasonable.
Wells Fargo Utility and Telecommunications Fund | 27
This page is intentionally left blank.

For more information
More information about Wells Fargo Funds is available free upon request. To obtain literature, please write, visit the Fund’s website, or call:
Wells Fargo Funds
P.O. Box 219967
Kansas City, MO 64121-9967
Website:wfam.com
Individual investors:1-800-222-8222
Retail investment professionals:1-888-877-9275
Institutional investment professionals:1-866-765-0778

This report and the financial statements contained herein are submitted for the general information of the shareholders of the Fund. If this report is used for promotional purposes, distribution of the report must be accompanied or preceded by a current prospectus. Before investing, please consider the investment objectives, risks, charges, and expenses of the investment. For a current prospectus and, if available, a summary prospectus, containing this information, call1-800-222-8222 or visit the Fund’s website atwfam.com. Read the prospectus carefully before you invest or send money.
Wells Fargo Asset Management (WFAM) is the trade name for certain investment advisory/management firms owned by Wells Fargo & Company. These firms include but are not limited to Wells Capital Management Incorporated and Wells Fargo Funds Management, LLC. Certain products managed by WFAM entities are distributed by Wells Fargo Funds Distributor, LLC (a broker-dealer and Member FINRA).
This material is for general informational and educational purposes only and is NOT intended to provide investment advice or a recommendation of any kind—including a recommendation for any specific investment, strategy, or plan.
INVESTMENT PRODUCTS: NOT FDIC INSURED ◾ NO BANK GUARANTEE ◾ MAY LOSE VALUE
© 2019 Wells Fargo & Company. All rights reserved.
406825 11-19
SA318/SAR318 09-19
ITEM 2. CODE OF ETHICS
Not applicable.
ITEM 3. AUDIT COMMITTEE FINANCIAL EXPERT
Not applicable.
ITEM 4. PRINCIPAL ACCOUNTANT FEES AND SERVICES
Not applicable.
ITEM 5. AUDIT COMMITTEE OF LISTED REGISTRANTS
Not applicable.
ITEM 6. INVESTMENTS
A Portfolio of Investments for each series of Wells Fargo Funds Trust is included as part of the report to shareholders filed under Item 1 of this Form.
ITEM 7. DISCLOSURE OF PROXY VOTING POLICIES AND PROCEDURES FORCLOSED-END MANAGEMENT INVESTMENT COMPANIES
Not applicable.
ITEM 8. PORTFOLIO MANAGERS OFCLOSED-END MANAGEMENT INVESTMENT COMPANIES
Not applicable.
ITEM 9. PURCHASES OF EQUITY SECURITIES BYCLOSED-END MANAGEMENT INVESTMENT COMPANY AND AFFILIATED PURCHASERS
Not applicable.
ITEM 10. SUBMISSION OF MATTERS TO A VOTE OF SECURITY HOLDERS
There have been no material changes to the procedures by which shareholders may recommend nominees to the registrant’s Board of Trustees that have been implemented since the registrant’s last provided disclosure in response to the requirements of this Item.
ITEM 11. CONTROLS AND PROCEDURES
(a) The President and Treasurer have concluded that the Wells Fargo Funds Trust disclosure controls and procedures (as defined in Rule30a-3(c) under the Investment Company Act of 1940) provide reasonable assurances that material information relating to the registrant is made known to them by the appropriate persons, based on their evaluation of these controls and procedures as of a date within 90 days of the filing of this report.
(b) There were no significant changes in the registrant’s internal controls over financial reporting (as defined in Rule30a-3(d) under the Investment Company Act of 1940) that occurred during the most recent fiscal half-year of the period covered by this report that materially affected, or is reasonably likely to materially affect, the registrant’s internal control over financial reporting.
ITEM 12. DISCLOSURES OF SECURITIES LENDING ACTIVITIES FORCLOSED-END MANAGEMENT INVESTMENT COMPANIES
Not applicable.
ITEM 13. EXHIBITS
(a)(1) Not applicable.
(a)(2) Certification pursuant to Rule30a-2(a) under the Investment Company Act of 1940 (17 CFR270.30a-2(a)) is filed and attached hereto as Exhibit 99.CERT.
(b) Certification pursuant to Rule30a-2(b) under the Investment Company Act of 1940 (17 CFR270.30a-2(b)) is filed and attached hereto as Exhibit 99.906CERT.
SIGNATURES
Pursuant to the requirements of the Securities Exchange Act of 1934 and the Investment Company Act of 1940, the registrant has duly caused this report to be signed on its behalf by the undersigned, thereunto duly authorized.
| | |
| Wells Fargo Funds Trust |
| |
| By: | | |
| | /s/ Andrew Owen |
| |
| | Andrew Owen |
| | President |
|
| Date: November 25, 2019 |
Pursuant to the requirements of the Securities Exchange Act of 1934 and the Investment Company Act of 1940, this report has been signed below by the following persons on behalf of the registrant and in the capacities and on the date indicated.
| | |
| Wells Fargo Funds Trust |
| |
| By: | | |
| | /s/ Andrew Owen |
| |
| | Andrew Owen |
| | President |
|
| Date: November 25, 2019 |
| |
| By: | | |
| | /s/ Nancy Wiser |
| |
| | Nancy Wiser |
| | Treasurer |
|
| Date: November 25, 2019 |