Table of Contents

UNITED STATES
SECURITIES AND EXCHANGE COMMISSION
Washington, D.C. 20549
FORMN-CSRS
CERTIFIED SHAREHOLDER REPORT OF REGISTERED
MANAGEMENT INVESTMENT COMPANIES
Investment Company Act file number:811-09253
Wells Fargo Funds Trust
(Exact name of registrant as specified in charter)
525 Market St., San Francisco, CA 94105
(Address of principal executive offices) (Zip code)
Catherine Kennedy
Wells Fargo Funds Management, LLC
525 Market St., San Francisco, CA 94105
(Name and address of agent for service)
Registrant’s telephone number, including area code:800-222-8222
Date of fiscal year end: July 31
Registrant is making a filing for 10 of its series:
Wells Fargo Disciplined U.S. Core Fund, Wells Fargo Endeavor Select Fund, Wells Fargo Growth Fund, Wells Fargo Classic Value Fund, Wells Fargo Large Cap Core Fund, Wells Fargo Large Cap Growth Fund, Wells Fargo Large Company Value Fund, Wells Fargo Low Volatility U.S. Equity Fund, Wells Fargo Omega Growth Fund, and Wells Fargo Premier Large Company Growth Fund.
Date of reporting period: January 31, 2020
Table of Contents
ITEM 1. REPORT TO STOCKHOLDERS
Table of Contents

Semi-Annual Report
January 31, 2020
Wells Fargo
Disciplined U.S. Core Fund
Beginning on January 1, 2021, as permitted by new regulations adopted by the Securities and Exchange Commission, paper copies of the Wells Fargo Funds’ annual and semi-annual shareholder reports issued after this date will no longer be sent by mail, unless you specifically request paper copies of the reports. Instead, the reports will be made available on the Funds’ website, and you will be notified by mail each time a report is posted and provided with a website address to access the report.
If you already elected to receive shareholder reports electronically, you will not be affected by this change and you need not take any action. You may elect to receive shareholder reports and other communications from the Fund electronically at any time by contacting your financial intermediary (such as a broker-dealer or bank) or, if you are a direct investor, by calling1-800-222-8222 or by enrolling at wellsfargo.com/advantagedelivery.
You may elect to receive all future reports in paper free of charge. If you invest through a financial intermediary, you can contact your financial intermediary to request that you continue to receive paper copies of your shareholder reports; if you invest directly with the Fund, you can call 1-800-222-8222. Your election to receive reports in paper will apply to all Wells Fargo Funds held in your account with your financial intermediary or, if you are a direct investor, to all Wells Fargo Funds that you hold.
Table of Contents
|
Reduce clutter. Save trees. |
Sign up for electronic delivery of prospectuses and shareholder reports atwellsfargo.com/advantagedelivery |
The views expressed and any forward-looking statements are as of January 31, 2020, unless otherwise noted, and are those of the Fund managers and/or Wells Fargo Asset Management. Discussions of individual securities, or the markets generally, or any Wells Fargo Fund are not intended as individual recommendations. Future events or results may vary significantly from those expressed in any forward-looking statements. The views expressed are subject to change at any time in response to changing circumstances in the market. Wells Fargo Asset Management and the Fund disclaim any obligation to publicly update or revise any views expressed or forward-looking statements.
INVESTMENT PRODUCTS: NOT FDIC INSURED ◾ NO BANK GUARANTEE ◾ MAY LOSE VALUE
Wells Fargo Disciplined U.S. Core Fund | 1
Table of Contents
Letter to shareholders (unaudited)

Andrew Owen
President
Wells Fargo Funds
“As the period began, U.S.-China trade tensions continued with no signs of compromise.”
Dear Shareholder:
We are pleased to offer you this semi-annual report for the Wells Fargo Disciplined U.S. Core Fund for thesix-month period that ended January 31, 2020. Despite some market volatility, the period was strongly positive for financial markets as supportive central banks more than offset concerns over slowing global economic growth and international trade tensions.
Overall, both fixed-income and equity investors enjoyed healthy annual returns, with U.S. markets leading the way. For the period, U.S. stocks, based on the S&P 500 Index,1 gained 9.31% and international stocks, as measured by the MSCI ACWI ex USA Index (Net),2 returned 5.37%. The MSCI EM Index (Net)3 gained a more modest 3.36%. For bond investors, the Bloomberg Barclays U.S. Aggregate Bond Index4 added 4.20%, the Bloomberg Barclays Global Aggregateex-USD Index5 returned 1.58%, the Bloomberg Barclays Municipal Bond Index6 gained 3.33%, and the ICE BofA U.S. High Yield Index7 added 3.34%.
The period began with uncertainty, leading to central bank support.
In August as the period began, U.S.-China trade tensions continued with no signs of compromise. Evidence of a continued global economic slowdown mounted, and central banks in China, New Zealand, and Thailand cut interest rates. Industrial and manufacturing data declined in China, Canada, Japan, and Germany. Adding to global uncertainty, Italy’s prime minister resigned, many feared a crackdown in Hong Kong as protestors sustained their calls for reform, and Boris Johnson planned to suspend Parliament as Brexit’s deadline neared.
In the U.S., the Federal Reserve (Fed) cut interest rates a second time in the third quarter in September. U.S. manufacturing data disappointed investors. The U.S. Congress announced it would pursue an impeachment investigation of President Trump. Meanwhile, the Brexit impasse showed no signs of resolution. Officials in China said that hitting the country’s economic growth goals for the year would be difficult considering the weight of tariffs and trade restrictions. Although the S&P 500 Index finished the third quarter with the bestyear-to-date returns in more than 20 years, concerns about future returns remained.
The fourth quarter started on a strong note, with U.S.-China trade tensions relaxing in October along with renewed optimism for a U.K. Brexit deal and positive macroeconomic data. The initial estimate of U.S. third-quarter gross domestic product growth was a resilient 1.9% annualized rate, while the U.S. unemployment rate fell to a50-year low of 3.5% in September. However, despite resilience among U.S. consumers, business
| 1 | The S&P 500 Index consists of 500 stocks chosen for market size, liquidity, and industry group representation. It is a market-value-weighted index with each stock’s weight in the index proportionate to its market value. You cannot invest directly in an index. |
| 2 | The Morgan Stanley Capital International (MSCI) All Country World Index (ACWI) ex USA Index (Net) is a free-float-adjusted market-capitalization-weighted index that is designed to measure the equity market performance of developed markets, excluding the United States. Source: MSCI. MSCI makes no express or implied warranties or representations and shall have no liability whatsoever with respect to any MSCI data contained herein. The MSCI data may not be further redistributed or used as a basis for other indices or any securities or financial products. This report is not approved, reviewed, or produced by MSCI. You cannot invest directly in an index. |
| 3 | The MSCI Emerging Markets (EM) Index (Net) is a free-float-adjusted market-capitalization-weighted index that is designed to measure equity market performance of emerging markets. You cannot invest directly in an index. |
| 4 | The Bloomberg Barclays U.S. Aggregate Bond Index is a broad-based benchmark that measures the investment-grade, U.S. dollar-denominated, fixed-rate taxable bond market, including Treasuries, government-related and corporate securities, mortgage-backed securities (agency fixed-rate and hybrid adjustable-rate mortgage pass-throughs), asset-backed securities, and commercial mortgage-backed securities. You cannot invest directly in an index. |
| 5 | The Bloomberg Barclays Global Aggregateex-USD Index is an unmanaged index that provides a broad-based measure of the global investment-grade fixed-income markets excluding the U.S. dollar-denominated debt market. You cannot invest directly in an index. |
| 6 | The Bloomberg Barclays Municipal Bond Index is an unmanaged index composed of long-termtax-exempt bonds with a minimum credit rating of Baa. You cannot invest directly in an index. |
| 7 | The ICE BofA U.S. High Yield Index is a market-capitalization-weighted index of domestic and Yankee high-yield bonds. The index tracks the performance of high-yield securities traded in the U.S. bond market. You cannot invest directly in an index. Copyright 2020. ICE Data Indices, LLC. All rights reserved. |
2 | Wells Fargo Disciplined U.S. Core Fund
Table of Contents
Letter to shareholders (unaudited)
confidence declined while manufacturing activity contracted. Concerned with a potential economic slowdown, the Fed lowered interest rates another quarter point in late October, its third rate cut in four months. This helped push the S&P 500 Index to a newall-time high, while emerging market equities rallied and global bonds declined overall, reflecting a broad pickup in risk appetite.
Equity markets continued to rally in November despite ongoing geopolitical risks. Hopes for a U.S.-China trade deal buoyed investor confidence. U.S. business sentiment improved slightly, and manufacturing and services activity picked up. Throughout the month, central bank actions were on hold. With that positive backdrop, developed market equities outpaced those in emerging markets, and U.S. stocks, as reflected by the S&P 500 Index, outperformednon-U.S. stocks overall. While consumer confidence and purchasing manager activity rose in the eurozone, China reported weakening manufacturing and consumer data. Bond yields rose marginally, leading to slightly negative returns for global government and investment-grade corporate bonds.
Financial markets ended 2019 on a broadly positive note, with the U.S. and China reaching an accord on a Phase One trade deal, with some details to be worked out. That, along with the landslide win by thepro-Brexit U.K. Conservative Party in a national election and ongoing central bank support, gave investors greater certainty and confidence. U.S. economic indicators were generally positive, with the exception of manufacturing activity and business confidence. However, consumer confidence was resilient, fed by a robust labor market, tame inflation, and lower interest rates, which boosted housing affordability and stimulated homebuyer activity. The impeachment of U.S. President Donald Trump, while historically noteworthy, had little impact on markets. Meanwhile, slowing Chinese economic activity, partly attributable to the trade war, led to further government stimulus atyear-end through lower reserve ratios, allowing banks to lend more money.
Theyear-end rally continued in early January 2020. However, capital market volatility picked up in late January on concerns over the unknown impact of the coronavirus on the global economy and stock markets. With sentiment somewhat souring, perceived safe havens did well in January. The U.S. dollar and Japanese yen both rose and government bonds outperformed equities. While the S&P 500 Index held its ground, emerging market equities tumbled, including those in Asia that are most exposed to viruses—physical or economic—originating in China.
Following the end of the reporting period, the coronavirus continued its global spread, resulting in disruptions to global markets, including through border closings, restrictions on travel and large gatherings, expedited and enhanced health screenings, quarantines, cancellations, business and school closings, disruptions to employment and supply chains, reduced productivity, and reduced customer and client activity in multiple markets and sectors. The risk of further spreading of the coronavirus has led to significant uncertainty and volatility in the financial markets. The full extent of the coronavirus’s impact on the global economy cannot necessarily be foreseen and the impacts may be short term or may last for an extended period of time.
Don’t let short-term uncertainty derail long-term investment goals.
Periods of investment uncertainty can present challenges, but experience has taught us that maintaining long-term investment goals can be an effective way to plan for the future. To help you create a sound strategy based on your personal goals and risk tolerance, Wells Fargo Funds offers more than 100 mutual funds spanning a wide range of asset classes and investment styles. Although diversification cannot guarantee an investment profit or prevent losses, we believe it can be an effective way to manage investment risk and potentially smooth out overall portfolio performance. We
“Financial markets ended 2019 on a broadly positive note, with the U.S. and China reaching an accord on a Phase One trade deal.”
|
For further information about your Fund, contact your investment professional, visit our website at wfam.com, or call us directly at1-800-222-8222. |
Wells Fargo Disciplined U.S. Core Fund | 3
Table of Contents
Letter to shareholders (unaudited)
encourage investors to know their investments and to understand that appropriate levels of risk-taking may unlock opportunities.
Thank you for choosing to invest with Wells Fargo Funds. We appreciate your confidence in us and remain committed to helping you meet your financial needs.
Sincerely,

Andrew Owen
President
Wells Fargo Funds
4 | Wells Fargo Disciplined U.S. Core Fund
Table of Contents
Performance highlights (unaudited)
Investment objective
The Fund seeks long-term capital appreciation.
Manager
Wells Fargo Funds Management, LLC
Subadviser
Wells Capital Management Incorporated
Portfolio managers
Justin Carr, CFA®‡
Robert M. Wicentowski, CFA®‡
Average annual total returns (%) as of January 31, 20201
| Including sales charge | Excluding sales charge | Expense ratios2 (%) | ||||||||||||||||||||||||||||||||
| Inception date | 1 year | 5 year | 10 year | 1 year | 5 year | 10 year | Gross | Net3 | ||||||||||||||||||||||||||
| Class A (EVSAX) | 2-28-1990 | 11.21 | 9.10 | 12.33 | 17.97 | 10.41 | 13.00 | 0.84 | 0.84 | |||||||||||||||||||||||||
| Class C (EVSTX) | 6-30-1999 | 16.15 | 9.59 | 12.16 | 17.15 | 9.59 | 12.16 | 1.59 | 1.59 | |||||||||||||||||||||||||
| Class R (EVSHX)4 | 9-30-2015 | – | – | – | 17.71 | 10.14 | 12.69 | 1.09 | 1.09 | |||||||||||||||||||||||||
| Class R6 (EVSRX)5 | 9-30-2015 | – | – | – | 18.52 | 10.90 | 13.48 | 0.41 | 0.41 | |||||||||||||||||||||||||
| Administrator Class (EVSYX) | 2-21-1995 | – | – | – | 18.07 | 10.54 | 13.16 | 0.76 | 0.74 | |||||||||||||||||||||||||
| Institutional Class (EVSIX)6 | 7-30-2010 | – | – | – | 18.47 | 10.83 | 13.44 | 0.51 | 0.48 | |||||||||||||||||||||||||
| S&P 500 Index7 | – | – | – | – | 21.68 | 12.37 | 13.97 | – | – | |||||||||||||||||||||||||
Figures quoted represent past performance, which is no guarantee of future results, and do not reflect taxes that shareholder may pay on an investment in a fund. Investment return and principal value of an investment will fluctuate so that an investor’s shares, when redeemed, may be worth more or less than their original cost. Performance shown without sales charges would be lower if sales charges were reflected. Current performance may be lower or higher than the performance data quoted, which assumes the reinvestment of dividends and capital gains. Currentmonth-end performance is available on the Fund’s website,wfam.com.
Index returns do not include transaction costs associated with buying and selling securities, any mutual fund fees or expenses, or any taxes. It is not possible to invest directly in an index.
For Class A shares, the maximumfront-end sales charge is 5.75%. For Class C shares, the maximum contingent deferred sales charge is 1.00%. Performance including a contingent deferred sales charge assumes the sales charge for the corresponding time period. Class R, Class R6, Administrator Class, and Institutional Class shares are sold without afront-end sales charge or contingent deferred sales charge.
Stock values fluctuate in response to the activities of individual companies and general market and economic conditions. The use of derivatives may reduce returns and/or increase volatility. Consult the Fund’s prospectus for additional information on these and other risks.
Please see footnotes on page 6.
Wells Fargo Disciplined U.S. Core Fund | 5
Table of Contents
Performance highlights (unaudited)
| Ten largest holdings (%) as of January 31, 20208 | ||||
Microsoft Corporation | 5.11 | |||
Apple Incorporated | 4.94 | |||
Amazon.com Incorporated | 2.94 | |||
Johnson & Johnson | 2.01 | |||
Alphabet Incorporated Class C | 1.90 | |||
JPMorgan Chase & Company | 1.85 | |||
Berkshire Hathaway Incorporated Class B | 1.84 | |||
Alphabet Incorporated Class A | 1.83 | |||
Visa Incorporated Class A | 1.81 | |||
Facebook Incorporated Class A | 1.62 | |||
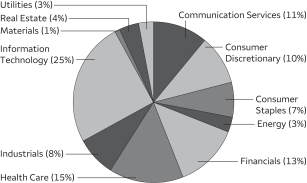
| Sector distribution as of January 31, 20209 |
|
| ‡ | CFA® and Chartered Financial Analyst®are trademarks owned by CFA Institute. |
| 1 | Historical performance prior to July 19, 2010, is based on the performance of the Fund’s predecessor, Evergreen Enhanced S&P 500 Fund. |
| 2 | Reflects the expense ratios as stated in the most recent prospectuses. The expense ratios shown are subject to change and may differ from the annualized expense ratios shown in the financial highlights of this report. |
| 3 | The manager has contractually committed through November 30, 2020, to waive fees and/or reimburse expenses to the extent necessary to cap total annual fund operating expenses after fee waivers at 0.87% for Class A, 1.62% for Class C, 1.12% for Class R, 0.43% for Class R6, 0.74% for Administrator Class, and 0.48% for Institutional Class. Brokerage commissions, stamp duty fees, interest, taxes, acquired fund fees and expenses (if any), and extraordinary expenses are excluded from the expense cap. Prior to or after the commitment expiration date, the cap may be increased or the commitment to maintain the cap may be terminated only with the approval of the Board of Trustees. Without this cap, the Fund’s returns would have been lower. The expense ratio paid by an investor is the net expense ratio (the total annual fund operating expenses after fee waivers) as stated in the prospectuses. |
| 4 | Historical performance shown for the Class R shares prior to their inception reflects the performance of the Administrator Class shares, adjusted to reflect higher expenses applicable to the Class R shares. |
| 5 | Historical performance shown for the Class R6 shares prior to their inception reflects the performance of the Institutional Class shares, and includes the higher expenses applicable to the Institutional Class shares. If these expenses had not been included, returns for the Class R6 shares would be higher. |
| 6 | Historical performance shown for the Institutional Class shares prior to their inception reflects the performance of the Administrator Class shares, and includes the higher expenses applicable to the Administrator Class shares. If these expenses had not been included, returns for the Institutional Class shares would be higher. |
| 7 | The S&P 500 Index consists of 500 stocks chosen for market size, liquidity, and industry group representation. It is a market-value-weighted index with each stock’s weight in the index proportionate to its market value. You cannot invest directly in an index. |
| 8 | The ten largest holdings, excluding cash, cash equivalents and any money market funds, are calculated based on the value of the investments divided by total net assets of the Fund. Holdings are subject to change and may have changed since the date specified. |
| 9 | Amounts are calculated based on the total long-term investments of the Fund. These amounts are subject to change and may have changed since the date specified. |
6 | Wells Fargo Disciplined U.S. Core Fund
Table of Contents
As a shareholder of the Fund, you incur two types of costs: (1) transaction costs, including sales charges (loads) on purchase payments and contingent deferred sales charges (if any) on redemptions and (2) ongoing costs, including management fees, distribution(12b-1) and/or shareholder servicing fees, and other Fund expenses. This example is intended to help you understand your ongoing costs (in dollars) of investing in the Fund and to compare these costs with the ongoing costs of investing in other mutual funds.
The example is based on an investment of $1,000 invested at the beginning of thesix-month period and held for the entire period from August 1, 2019 to January 31, 2020.
Actual expenses
The “Actual” line of the table below provides information about actual account values and actual expenses. You may use the information in this line, together with the amount you invested, to estimate the expenses that you paid over the period. Simply divide your account value by $1,000 (for example, an $8,600 account value divided by $1,000 = 8.6), then multiply the result by the number in the “Actual” line under the heading entitled “Expenses paid during period” for your applicable class of shares to estimate the expenses you paid on your account during this period.
Hypothetical example for comparison purposes
The “Hypothetical” line of the table below provides information about hypothetical account values and hypothetical expenses based on the Fund’s actual expense ratio and an assumed rate of return of 5% per year before expenses, which is not the Fund’s actual return. The hypothetical account values and expenses may not be used to estimate the actual ending account balance or expenses you paid for the period. You may use this information to compare the ongoing costs of investing in the Fund and other funds. To do so, compare this 5% hypothetical example with the 5% hypothetical examples that appear in the shareholder reports of the other funds.
Please note that the expenses shown in the table are meant to highlight your ongoing costs only and do not reflect any transactional costs, such as sales charges (loads) and contingent deferred sales charges. Therefore, the “Hypothetical” line of the table is useful in comparing ongoing costs only and will not help you determine the relative total costs of owning different funds. In addition, if these transactional costs were included, your costs would have been higher.
| Beginning account value 8-1-2019 | Ending account value 1-31-2020 | Expenses paid during the period1 | Annualized net expense ratio | |||||||||||||
Class A | ||||||||||||||||
Actual | $ | 1,000.00 | $ | 1,077.33 | $ | 4.39 | 0.84 | % | ||||||||
Hypothetical (5% return before expenses) | $ | 1,000.00 | $ | 1,020.91 | $ | 4.27 | 0.84 | % | ||||||||
Class C | ||||||||||||||||
Actual | $ | 1,000.00 | $ | 1,073.24 | $ | 8.34 | 1.60 | % | ||||||||
Hypothetical (5% return before expenses) | $ | 1,000.00 | $ | 1,017.09 | $ | 8.11 | 1.60 | % | ||||||||
Class R | ||||||||||||||||
Actual | $ | 1,000.00 | $ | 1,075.88 | $ | 5.74 | 1.10 | % | ||||||||
Hypothetical (5% return before expenses) | $ | 1,000.00 | $ | 1,019.61 | $ | 5.58 | 1.10 | % | ||||||||
Class R6 | ||||||||||||||||
Actual | $ | 1,000.00 | $ | 1,079.72 | $ | 2.20 | 0.42 | % | ||||||||
Hypothetical (5% return before expenses) | $ | 1,000.00 | $ | 1,023.03 | $ | 2.14 | 0.42 | % | ||||||||
Administrator Class | ||||||||||||||||
Actual | $ | 1,000.00 | $ | 1,077.90 | $ | 3.87 | 0.74 | % | ||||||||
Hypothetical (5% return before expenses) | $ | 1,000.00 | $ | 1,021.42 | $ | 3.76 | 0.74 | % | ||||||||
Institutional Class | ||||||||||||||||
Actual | $ | 1,000.00 | $ | 1,079.48 | $ | 2.51 | 0.48 | % | ||||||||
Hypothetical (5% return before expenses) | $ | 1,000.00 | $ | 1,022.72 | $ | 2.44 | 0.48 | % | ||||||||
| 1 | Expenses paid is equal to the annualized net expense ratio of each class multiplied by the average account value over the period, multiplied by the number of days in the most recent fiscal half-year divided by the number of days in the fiscal year (to reflect theone-half-year period). |
Wells Fargo Disciplined U.S. Core Fund | 7
Table of Contents
Portfolio of investments—January 31, 2020 (unaudited)
| Shares | Value | |||||||||||||||
| Common Stocks: 97.17% |
| |||||||||||||||
Communication Services: 10.53% |
| |||||||||||||||
| Diversified Telecommunication Services: 2.94% | ||||||||||||||||
AT&T Incorporated | 428,762 | $ | 16,130,022 | |||||||||||||
Verizon Communications Incorporated | 249,932 | 14,855,958 | ||||||||||||||
| 30,985,980 | ||||||||||||||||
|
| |||||||||||||||
| Entertainment: 0.70% | ||||||||||||||||
Netflix Incorporated † | 7,568 | 2,611,641 | ||||||||||||||
The Walt Disney Company | 34,433 | 4,762,428 | ||||||||||||||
| 7,374,069 | ||||||||||||||||
|
| |||||||||||||||
| Interactive Media & Services: 5.35% | ||||||||||||||||
Alphabet Incorporated Class A † | 13,456 | 19,279,488 | ||||||||||||||
Alphabet Incorporated Class C † | 13,991 | 20,066,312 | ||||||||||||||
Facebook Incorporated Class A † | 84,759 | 17,113,690 | ||||||||||||||
| 56,459,490 | ||||||||||||||||
|
| |||||||||||||||
| Media: 1.36% | ||||||||||||||||
Comcast Corporation Class A | 108,516 | 4,686,806 | ||||||||||||||
Discovery Communications Incorporated Class A †« | 192,474 | 5,631,789 | ||||||||||||||
News Corporation Class A | 296,349 | 4,036,273 | ||||||||||||||
| 14,354,868 | ||||||||||||||||
|
| |||||||||||||||
| Wireless Telecommunication Services: 0.18% | ||||||||||||||||
T-Mobile US Incorporated † | 24,242 | 1,919,724 | ||||||||||||||
|
| |||||||||||||||
Consumer Discretionary: 9.28% |
| |||||||||||||||
| Automobiles: 0.70% | ||||||||||||||||
Ford Motor Company | 385,302 | 3,398,364 | ||||||||||||||
General Motors Company | 118,058 | 3,941,957 | ||||||||||||||
| 7,340,321 | ||||||||||||||||
|
| |||||||||||||||
| Hotels, Restaurants & Leisure: 0.84% | ||||||||||||||||
Chipotle Mexican Grill Incorporated † | 2,160 | 1,872,202 | ||||||||||||||
Starbucks Corporation | 81,888 | 6,946,559 | ||||||||||||||
| 8,818,761 | ||||||||||||||||
|
| |||||||||||||||
| Household Durables: 1.06% | ||||||||||||||||
D.R. Horton Incorporated | 95,674 | 5,663,901 | ||||||||||||||
Pulte Group Incorporated | 124,184 | 5,544,816 | ||||||||||||||
| 11,208,717 | ||||||||||||||||
|
| |||||||||||||||
| Internet & Direct Marketing Retail: 2.94% | ||||||||||||||||
Amazon.com Incorporated † | 15,441 | 31,016,646 | ||||||||||||||
|
| |||||||||||||||
| Multiline Retail: 0.72% | ||||||||||||||||
Target Corporation | 68,206 | 7,553,132 | ||||||||||||||
|
| |||||||||||||||
| Specialty Retail: 2.09% | ||||||||||||||||
AutoZone Incorporated † | 1,674 | 1,771,025 | ||||||||||||||
Best Buy Company Incorporated | 75,661 | 6,407,730 | ||||||||||||||
The Home Depot Incorporated | 60,817 | 13,872,358 | ||||||||||||||
| 22,051,113 | ||||||||||||||||
|
| |||||||||||||||
The accompanying notes are an integral part of these financial statements.
8 | Wells Fargo Disciplined U.S. Core Fund
Table of Contents
Portfolio of investments—January 31, 2020 (unaudited)
| Shares | Value | |||||||||||||||
| Textiles, Apparel & Luxury Goods: 0.93% | ||||||||||||||||
Nike Incorporated Class B | 102,195 | $ | 9,841,379 | |||||||||||||
|
| |||||||||||||||
Consumer Staples: 7.11% |
| |||||||||||||||
| Beverages: 0.69% | ||||||||||||||||
The Coca-Cola Company | 124,600 | 7,276,640 | ||||||||||||||
|
| |||||||||||||||
| Food & Staples Retailing: 2.64% | ||||||||||||||||
Costco Wholesale Corporation | 11,740 | 3,586,805 | ||||||||||||||
The Kroger Company | 245,482 | 6,593,647 | ||||||||||||||
Walgreens Boots Alliance Incorporated | 116,791 | 5,938,822 | ||||||||||||||
Walmart Incorporated | 102,132 | 11,693,093 | ||||||||||||||
| 27,812,367 | ||||||||||||||||
|
| |||||||||||||||
| Food Products: 1.49% | ||||||||||||||||
General Mills Incorporated | 44,451 | 2,321,231 | ||||||||||||||
Lamb Weston Holdings Incorporated | 33,286 | 3,039,345 | ||||||||||||||
Pilgrim’s Pride Corporation † | 155,416 | 4,048,587 | ||||||||||||||
Tyson Foods Incorporated Class A | 76,337 | 6,307,726 | ||||||||||||||
| 15,716,889 | ||||||||||||||||
|
| |||||||||||||||
| Household Products: 1.53% | ||||||||||||||||
The Procter & Gamble Company | 129,289 | 16,111,995 | ||||||||||||||
|
| |||||||||||||||
| Personal Products: 0.39% | ||||||||||||||||
The Estee Lauder Companies Incorporated Class A | 21,077 | 4,113,387 | ||||||||||||||
|
| |||||||||||||||
| Tobacco: 0.37% | ||||||||||||||||
Philip Morris International Incorporated | 47,970 | 3,967,119 | ||||||||||||||
|
| |||||||||||||||
Energy: 3.29% |
| |||||||||||||||
| Energy Equipment & Services: 0.21% | ||||||||||||||||
Schlumberger Limited | 64,187 | 2,150,906 | ||||||||||||||
|
| |||||||||||||||
| Oil, Gas & Consumable Fuels: 3.08% | ||||||||||||||||
Chevron Corporation | 92,764 | 9,938,735 | ||||||||||||||
Exxon Mobil Corporation | 214,762 | 13,341,015 | ||||||||||||||
Kinder Morgan Incorporated | 165,765 | 3,459,516 | ||||||||||||||
Valero Energy Corporation | 68,510 | 5,776,078 | ||||||||||||||
| 32,515,344 | ||||||||||||||||
|
| |||||||||||||||
Financials: 12.23% |
| |||||||||||||||
| Banks: 4.53% | ||||||||||||||||
Bank of America Corporation | 199,052 | 6,534,877 | ||||||||||||||
Citigroup Incorporated | 158,316 | 11,780,294 | ||||||||||||||
Citizens Financial Group Incorporated | 78,864 | 2,940,050 | ||||||||||||||
JPMorgan Chase & Company | 147,420 | 19,512,511 | ||||||||||||||
Popular Incorporated | 39,297 | 2,199,060 | ||||||||||||||
Regions Financial Corporation | 188,114 | 2,928,935 | ||||||||||||||
US Bancorp | 34,896 | 1,857,165 | ||||||||||||||
| 47,752,892 | ||||||||||||||||
|
| |||||||||||||||
The accompanying notes are an integral part of these financial statements.
Wells Fargo Disciplined U.S. Core Fund | 9
Table of Contents
Portfolio of investments—January 31, 2020 (unaudited)
| Shares | Value | |||||||||||||||
| Capital Markets: 1.54% | ||||||||||||||||
Ameriprise Financial Incorporated | 33,795 | $ | 5,590,031 | |||||||||||||
Morgan Stanley | 80,130 | 4,187,594 | ||||||||||||||
Northern Trust Corporation | 66,416 | 6,496,149 | ||||||||||||||
| 16,273,774 | ||||||||||||||||
|
| |||||||||||||||
| Consumer Finance: 1.27% | ||||||||||||||||
Capital One Financial Corporation | 75,961 | 7,580,908 | ||||||||||||||
Synchrony Financial | 180,519 | 5,850,621 | ||||||||||||||
| 13,431,529 | ||||||||||||||||
|
| |||||||||||||||
| Diversified Financial Services: 1.84% | ||||||||||||||||
Berkshire Hathaway Incorporated Class B † | 86,324 | 19,373,695 | ||||||||||||||
|
| |||||||||||||||
| Insurance: 3.05% | ||||||||||||||||
MetLife Incorporated | 151,273 | 7,519,781 | ||||||||||||||
Prudential Financial Incorporated | 67,783 | 6,172,320 | ||||||||||||||
Reinsurance Group of America Incorporated | 36,854 | 5,308,819 | ||||||||||||||
The Hartford Financial Services Group Incorporated | 105,424 | 6,249,535 | ||||||||||||||
The Progressive Corporation | 85,046 | 6,862,362 | ||||||||||||||
| 32,112,817 | ||||||||||||||||
|
| |||||||||||||||
Health Care: 14.53% |
| |||||||||||||||
| Biotechnology: 2.55% | ||||||||||||||||
AbbVie Incorporated | 119,653 | 9,694,286 | ||||||||||||||
Amgen Incorporated | 44,603 | 9,636,478 | ||||||||||||||
Gilead Sciences Incorporated | 120,489 | 7,614,905 | ||||||||||||||
| 26,945,669 | ||||||||||||||||
|
| |||||||||||||||
| Health Care Equipment & Supplies: 3.16% | ||||||||||||||||
Abbott Laboratories | 113,499 | 9,890,303 | ||||||||||||||
Baxter International Incorporated | 36,855 | 3,288,203 | ||||||||||||||
Danaher Corporation | 13,703 | 2,204,402 | ||||||||||||||
Edwards Lifesciences Corporation † | 20,403 | 4,485,804 | ||||||||||||||
Medtronic plc | 84,894 | 9,800,163 | ||||||||||||||
Zimmer Biomet Holdings Incorporated | 24,540 | 3,629,466 | ||||||||||||||
| 33,298,341 | ||||||||||||||||
|
| |||||||||||||||
| Health Care Providers & Services: 3.32% | ||||||||||||||||
AmerisourceBergen Corporation | 46,254 | 3,957,492 | ||||||||||||||
Anthem Incorporated | 28,401 | 7,534,217 | ||||||||||||||
Cardinal Health Incorporated | 36,946 | 1,892,005 | ||||||||||||||
Humana Incorporated | 9,228 | 3,102,823 | ||||||||||||||
McKesson Corporation | 36,011 | 5,135,529 | ||||||||||||||
UnitedHealth Group Incorporated | 49,125 | 13,384,106 | ||||||||||||||
| 35,006,172 | ||||||||||||||||
|
| |||||||||||||||
| Health Care Technology: 0.47% | ||||||||||||||||
Veeva Systems Incorporated Class A † | 33,677 | 4,937,385 | ||||||||||||||
|
| |||||||||||||||
| Pharmaceuticals: 5.03% | ||||||||||||||||
Allergan plc | 20,433 | 3,813,615 | ||||||||||||||
Bristol-Myers Squibb Company | 154,801 | 9,744,723 | ||||||||||||||
Johnson & Johnson | 142,119 | 21,157,256 | ||||||||||||||
The accompanying notes are an integral part of these financial statements.
10 | Wells Fargo Disciplined U.S. Core Fund
Table of Contents
Portfolio of investments—January 31, 2020 (unaudited)
| Shares | Value | |||||||||||||||
| Pharmaceuticals (continued) | ||||||||||||||||
Merck & Company Incorporated | 160,553 | $ | 13,717,648 | |||||||||||||
Pfizer Incorporated | 124,208 | 4,625,506 | ||||||||||||||
| 53,058,748 | ||||||||||||||||
|
| |||||||||||||||
Industrials: 7.75% |
| |||||||||||||||
| Aerospace & Defense: 2.47% | ||||||||||||||||
Arconic Incorporated | 98,147 | 2,939,503 | ||||||||||||||
Lockheed Martin Corporation | 10,263 | 4,393,796 | ||||||||||||||
Northrop Grumman Corporation | 8,228 | 3,081,962 | ||||||||||||||
Raytheon Company | 35,512 | 7,846,021 | ||||||||||||||
United Technologies Corporation | 52,185 | 7,838,187 | ||||||||||||||
| 26,099,469 | ||||||||||||||||
|
| |||||||||||||||
| Air Freight & Logistics: 0.64% | ||||||||||||||||
Expeditors International of Washington Incorporated | 36,104 | 2,637,036 | ||||||||||||||
United Parcel Service Incorporated Class B | 39,742 | 4,114,092 | ||||||||||||||
| 6,751,128 | ||||||||||||||||
|
| |||||||||||||||
| Airlines: 1.03% | ||||||||||||||||
Delta Air Lines Incorporated | 120,547 | 6,719,290 | ||||||||||||||
United Airlines Holdings Incorporated † | 54,820 | 4,100,536 | ||||||||||||||
| 10,819,826 | ||||||||||||||||
|
| |||||||||||||||
| Commercial Services & Supplies: 0.58% | ||||||||||||||||
Waste Management Incorporated | 50,209 | 6,110,435 | ||||||||||||||
|
| |||||||||||||||
| Construction & Engineering: 0.55% | ||||||||||||||||
Quanta Services Incorporated | 147,008 | 5,755,363 | ||||||||||||||
|
| |||||||||||||||
| Electrical Equipment: 0.68% | ||||||||||||||||
AMETEK Incorporated | 40,339 | 3,918,934 | ||||||||||||||
Eaton Corporation plc | 34,829 | 3,290,296 | ||||||||||||||
| 7,209,230 | ||||||||||||||||
|
| |||||||||||||||
| Industrial Conglomerates: 0.10% | ||||||||||||||||
Honeywell International Incorporated | 5,981 | 1,036,029 | ||||||||||||||
|
| |||||||||||||||
| Machinery: 1.02% | ||||||||||||||||
Caterpillar Incorporated | 25,149 | 3,303,321 | ||||||||||||||
Cummins Incorporated | 27,855 | 4,455,964 | ||||||||||||||
PACCAR Incorporated | 39,807 | 2,954,077 | ||||||||||||||
| 10,713,362 | ||||||||||||||||
|
| |||||||||||||||
| Professional Services: 0.15% | ||||||||||||||||
Robert Half International Incorporated | 27,145 | 1,579,025 | ||||||||||||||
|
| |||||||||||||||
| Trading Companies & Distributors: 0.53% | ||||||||||||||||
W.W. Grainger Incorporated | 18,544 | 5,612,712 | ||||||||||||||
|
| |||||||||||||||
Information Technology: 24.44% |
| |||||||||||||||
| Communications Equipment: 1.17% | ||||||||||||||||
Cisco Systems Incorporated | 268,814 | 12,357,380 | ||||||||||||||
|
| |||||||||||||||
The accompanying notes are an integral part of these financial statements.
Wells Fargo Disciplined U.S. Core Fund | 11
Table of Contents
Portfolio of investments—January 31, 2020 (unaudited)
| Shares | Value | |||||||||||||||
| Electronic Equipment, Instruments & Components: 0.65% | ||||||||||||||||
CDW Corporation of Delaware | 8,769 | $ | 1,143,916 | |||||||||||||
Keysight Technologies Incorporated † | 46,705 | 4,343,098 | ||||||||||||||
Zebra Technologies Corporation Class A † | 5,635 | 1,346,878 | ||||||||||||||
| 6,833,892 | ||||||||||||||||
|
| |||||||||||||||
| IT Services: 5.67% | ||||||||||||||||
Accenture plc Class A | 48,243 | 9,899,946 | ||||||||||||||
Amdocs Limited | 58,355 | 4,198,642 | ||||||||||||||
Cognizant Technology Solutions Corporation Class A | 30,247 | 1,856,561 | ||||||||||||||
International Business Machines Corporation | 41,291 | 5,934,755 | ||||||||||||||
KBR Incorporated | 135,832 | 3,694,630 | ||||||||||||||
MasterCard Incorporated Class A | 25,804 | 8,152,516 | ||||||||||||||
PayPal Holdings Incorporated † | 44,797 | 5,101,930 | ||||||||||||||
VeriSign Incorporated † | 9,189 | 1,912,598 | ||||||||||||||
Visa Incorporated Class A | 95,723 | 19,046,005 | ||||||||||||||
| 59,797,583 | ||||||||||||||||
|
| |||||||||||||||
| Semiconductors & Semiconductor Equipment: 4.26% | ||||||||||||||||
Applied Materials Incorporated | 49,362 | 2,862,502 | ||||||||||||||
Broadcom Incorporated | 31,573 | 9,634,817 | ||||||||||||||
Intel Corporation | 235,503 | 15,055,707 | ||||||||||||||
KLA-Tencor Corporation | 5,865 | 972,065 | ||||||||||||||
Micron Technology Incorporated † | 146,116 | 7,757,298 | ||||||||||||||
QUALCOMM Incorporated | 101,631 | 8,670,141 | ||||||||||||||
| 44,952,530 | ||||||||||||||||
|
| |||||||||||||||
| Software: 7.30% | ||||||||||||||||
Cadence Design Systems Incorporated † | 48,494 | 3,496,902 | ||||||||||||||
Fortinet Incorporated † | 18,143 | 2,092,976 | ||||||||||||||
Intuit Incorporated | 28,115 | 7,882,884 | ||||||||||||||
Microsoft Corporation | 316,614 | 53,897,201 | ||||||||||||||
Oracle Corporation | 116,229 | 6,096,211 | ||||||||||||||
Salesforce.com Incorporated † | 19,095 | 3,481,209 | ||||||||||||||
| 76,947,383 | ||||||||||||||||
|
| |||||||||||||||
| Technology Hardware, Storage & Peripherals: 5.39% | ||||||||||||||||
Apple Incorporated | 168,321 | 52,097,033 | ||||||||||||||
HP Incorporated | 221,256 | 4,717,178 | ||||||||||||||
| 56,814,211 | ||||||||||||||||
|
| |||||||||||||||
Materials: 1.32% |
| |||||||||||||||
| Chemicals: 0.56% | ||||||||||||||||
Linde plc | 5,066 | 1,029,057 | ||||||||||||||
LyondellBasell Industries NV Class A | 63,207 | 4,921,297 | ||||||||||||||
| 5,950,354 | ||||||||||||||||
|
| |||||||||||||||
| Metals & Mining: 0.76% | ||||||||||||||||
Nucor Corporation | 99,101 | 4,706,306 | ||||||||||||||
Reliance Steel & Aluminum Company | 28,888 | 3,316,342 | ||||||||||||||
| 8,022,648 | ||||||||||||||||
|
| |||||||||||||||
Real Estate: 3.72% |
| |||||||||||||||
| Equity REITs: 3.72% | ||||||||||||||||
American Tower Corporation | 42,912 | 9,944,427 | ||||||||||||||
AvalonBay Communities Incorporated | 23,714 | 5,138,587 | ||||||||||||||
The accompanying notes are an integral part of these financial statements.
12 | Wells Fargo Disciplined U.S. Core Fund
Table of Contents
Portfolio of investments—January 31, 2020 (unaudited)
| Shares | Value | |||||||||||||||
| Equity REITs (continued) | ||||||||||||||||
Crown Castle International Corporation | 31,459 | $ | 4,713,817 | |||||||||||||
Equinix Incorporated | 13,087 | 7,717,797 | ||||||||||||||
Prologis Incorporated | 85,695 | 7,959,352 | ||||||||||||||
SBA Communications Corporation | 14,976 | 3,737,411 | ||||||||||||||
| 39,211,391 | ||||||||||||||||
|
| |||||||||||||||
Utilities: 2.97% | ||||||||||||||||
| Electric Utilities: 1.24% | ||||||||||||||||
Eversource Energy | 23,856 | 2,205,249 | ||||||||||||||
Exelon Corporation | 158,569 | 7,546,299 | ||||||||||||||
The Southern Company | 47,628 | 3,353,011 | ||||||||||||||
| 13,104,559 | ||||||||||||||||
|
| |||||||||||||||
| Independent Power & Renewable Electricity Producers: 0.99% | ||||||||||||||||
NRG Energy Incorporated | 146,592 | 5,407,779 | ||||||||||||||
Vistra Energy Corporation | 225,336 | 5,074,567 | ||||||||||||||
| 10,482,346 | ||||||||||||||||
|
| |||||||||||||||
| Multi-Utilities: 0.74% | ||||||||||||||||
Dominion Energy Incorporated | 44,848 | 3,845,716 | ||||||||||||||
DTE Energy Company | 29,411 | 3,900,193 | ||||||||||||||
| 7,745,909 | ||||||||||||||||
|
| |||||||||||||||
Total Common Stocks (Cost $676,068,504) | 1,024,686,634 | |||||||||||||||
|
| |||||||||||||||
| Yield | ||||||||||||||||
| Short-Term Investments: 0.80% | ||||||||||||||||
| Investment Companies: 0.68% | ||||||||||||||||
Securities Lending Cash Investments LLC (l)(r)(u) | 1.70 | % | 1,512,474 | 1,512,625 | ||||||||||||
Wells Fargo Government Money Market Fund Select Class (l)(u) | 1.51 | 5,701,170 | 5,701,170 | |||||||||||||
| 7,213,795 | ||||||||||||||||
|
| |||||||||||||||
| Maturity date | Principal | |||||||||||||||
| U.S. Treasury Securities: 0.12% | ||||||||||||||||
U.S. Treasury Bill #(z) | 1.48 | 7-30-2020 | $ | 1,217,000 | 1,207,981 | |||||||||||
|
| |||||||||||||||
Total Short-Term Investments (Cost $8,421,811) | 8,421,776 | |||||||||||||||
|
| |||||||||||||||
| Total investments in securities (Cost $684,490,315) | 97.97 | % | 1,033,108,410 | |||||
Other assets and liabilities, net | 2.03 | 21,383,247 | ||||||
|
|
|
| |||||
| Total net assets | 100.00 | % | $ | 1,054,491,657 | ||||
|
|
|
| |||||
| † | Non-income-earning security |
| « | All or a portion of this security is on loan. |
| (l) | The issuer of the security is an affiliated person of the Fund as defined in the Investment Company Act of 1940. |
| (r) | The investment is anon-registered investment company purchased with cash collateral received from securities on loan. |
| (u) | The rate represents the7-day annualized yield at period end. |
| # | All or a portion of this security is segregated as collateral for investments in derivative instruments. |
| (z) | Zero coupon security. The rate represents the current yield to maturity. |
Abbreviations:
| REIT | Real estate investment trust |
The accompanying notes are an integral part of these financial statements.
Wells Fargo Disciplined U.S. Core Fund | 13
Table of Contents
Portfolio of investments—January 31, 2020 (unaudited)
Futures Contracts
| Description | Number of contracts | Expiration date | Notional cost | Notional value | Unrealized gains | Unrealized losses | ||||||||||||||||||
Long | ||||||||||||||||||||||||
S&P 500E-Mini Index | 157 | 3-20-2020 | $ | 25,769,588 | $ | 25,308,400 | $ | 0 | $ | (461,188 | ) | |||||||||||||
Investments in Affiliates
An affiliated investment is an investment in which the Fund owns at least 5% of the outstanding voting shares of the issuer or as a result of other relationships, such as the Fund and the issuer having the same investment manager. Transactions with issuers that were either affiliated persons of the Fund at the beginning of the period or the end of the period were as follows:
| Shares, beginning of period | Shares purchased | Shares sold | Shares, end of period | Net realized gains (losses) | Net change in unrealized gains (losses) | Income from affiliated securities | Value, end of period | % of net assets | ||||||||||||||||||||||||||||
| Short-Term Investments | ||||||||||||||||||||||||||||||||||||
Investment Companies | ||||||||||||||||||||||||||||||||||||
Securities Lending Cash Investments LLC | 4,463,040 | 56,545,733 | (59,496,299 | ) | 1,512,474 | ($ | 130 | ) | $ | 0 | $ | 52,003 | # | $ | 1,512,625 | |||||||||||||||||||||
Wells Fargo Government Money Market Fund Select Class | 7,316,959 | 131,276,494 | (132,892,283 | ) | 5,701,170 | 0 | 0 | 54,460 | 5,701,170 | |||||||||||||||||||||||||||
|
|
|
|
|
|
|
|
|
| |||||||||||||||||||||||||||
| ($ | 130 | ) | $ | 0 | $ | 106,463 | $ | 7,213,795 | 0.68 | % | ||||||||||||||||||||||||||
|
|
|
|
|
|
|
|
|
| |||||||||||||||||||||||||||
| # | Amount shown represents income before fees and rebates. |
The accompanying notes are an integral part of these financial statements.
14 | Wells Fargo Disciplined U.S. Core Fund
Table of Contents
Statement of assets and liabilities—January 31, 2020 (unaudited)
Assets | ||||
Investments in unaffiliated securities (including $1,472,064 of securities loaned), at value (cost $677,276,520) | $ | 1,025,894,615 | ||
Investments in affiliated securities, at value (cost $7,213,795) | 7,213,795 | |||
Receivable for investments sold | 22,707,108 | |||
Receivable for Fund shares sold | 636,051 | |||
Receivable for dividends | 1,279,578 | |||
Receivable for securities lending income, net | 991 | |||
Prepaid expenses and other assets | 246,430 | |||
|
| |||
Total assets | 1,057,978,568 | |||
|
| |||
Liabilities | ||||
Payable upon receipt of securities loaned | 1,512,549 | |||
Payable for Fund shares redeemed | 906,421 | |||
Payable for daily variation margin on open futures contracts | 461,972 | |||
Management fee payable | 331,195 | |||
Administration fees payable | 132,866 | |||
Distribution fees payable | 24,068 | |||
Trustees’ fees and expenses payable | 5,630 | |||
Accrued expenses and other liabilities | 112,210 | |||
|
| |||
Total liabilities | 3,486,911 | |||
|
| |||
Total net assets | $ | 1,054,491,657 | ||
|
| |||
Net assets consist of | ||||
Paid-in capital | $ | 659,911,046 | ||
Total distributable earnings | 394,580,611 | |||
|
| |||
Total net assets | $ | 1,054,491,657 | ||
|
| |||
Computation of net asset value and offering price per share | ||||
Net assets – Class A | $ | 439,643,239 | ||
Shares outstanding – Class A1 | 24,626,191 | |||
Net asset value per share – Class A | $17.85 | |||
Maximum offering price per share – Class A2 | $18.94 | |||
Net assets – Class C | $ | 35,850,508 | ||
Shares outstanding – Class C1 | 2,182,238 | |||
Net asset value per share – Class C | $16.43 | |||
Net assets – Class R | $ | 3,147,946 | ||
Shares outstanding – Class R1 | 174,588 | |||
Net asset value per share – Class R | $18.03 | |||
Net assets – Class R6 | $ | 326,427,255 | ||
Shares outstanding – Class R61 | 17,828,914 | |||
Net asset value per share – Class R6 | $18.31 | |||
Net assets – Administrator Class | $ | 59,186,011 | ||
Shares outstanding – Administrator Class1 | 3,217,681 | |||
Net asset value per share – Administrator Class | $18.39 | |||
Net assets – Institutional Class | $ | 190,236,698 | ||
Shares outstanding – Institutional Class1 | 10,493,386 | |||
Net asset value per share – Institutional Class | $18.13 | |||
| 1 | The Fund has an unlimited number of authorized shares. |
| 2 | Maximum offering price is computed as 100/94.25 of net asset value. On investments of $50,000 or more, the offering price is reduced. |
The accompanying notes are an integral part of these financial statements.
Wells Fargo Disciplined U.S. Core Fund | 15
Table of Contents
Statement of operations—six months ended January 31, 2020 (unaudited)
Investment income | ||||
Dividends (net of foreign withholding taxes of $3,724) | $ | 11,857,941 | ||
Income from affiliated securities | 64,760 | |||
|
| |||
Total investment income | 11,922,701 | |||
|
| |||
Expenses | ||||
Management fee | 1,898,427 | |||
Administration fees |
| |||
Class A | 464,165 | |||
Class C | 39,350 | |||
Class R | 3,351 | |||
Class R6 | 47,780 | |||
Administrator Class | 39,123 | |||
Institutional Class | 148,608 | |||
Shareholder servicing fees |
| |||
Class A | 552,578 | |||
Class C | 46,846 | |||
Class R | 3,990 | |||
Administrator Class | 75,236 | |||
Distribution fees |
| |||
Class C | 140,455 | |||
Class R | 3,979 | |||
Custody and accounting fees | 30,575 | |||
Professional fees | 27,214 | |||
Registration fees | 55,800 | |||
Shareholder report expenses | 60,364 | |||
Trustees’ fees and expenses | 10,864 | |||
Interest expense | 2,640 | |||
Other fees and expenses | 40,816 | |||
|
| |||
Total expenses | 3,692,161 | |||
Less: Fee waivers and/or expense reimbursements |
| |||
Class A | (12,920 | ) | ||
Class C | (9 | ) | ||
Administrator Class | (10,528 | ) | ||
Institutional Class | (44,705 | ) | ||
|
| |||
Net expenses | 3,623,999 | |||
|
| |||
Net investment income | 8,298,702 | |||
|
| |||
Realized and unrealized gains (losses) on investments | ||||
Net realized gains (losses) on |
| |||
Unaffiliated securities | 46,959,422 | |||
Affiliated securities | (130 | ) | ||
|
| |||
Net realized gains on investments | 46,959,292 | |||
|
| |||
Net change in unrealized gains (losses) on |
| |||
Unaffiliated securities | 23,196,022 | |||
Futures contracts | (461,188 | ) | ||
|
| |||
Net change in unrealized gains (losses) on investments | 22,734,834 | |||
|
| |||
Net realized and unrealized gains (losses) on investments | 69,694,126 | |||
|
| |||
Net increase in net assets resulting from operations | $ | 77,992,828 | ||
|
| |||
The accompanying notes are an integral part of these financial statements.
16 | Wells Fargo Disciplined U.S. Core Fund
Table of Contents
Statement of changes in net assets
| Six months ended January 31, 2020 (unaudited) | Year ended July 31, 2019 | |||||||||||||||
Operations | ||||||||||||||||
Net investment income | $ | 8,298,702 | $ | 20,796,365 | ||||||||||||
Net realized gains on investments | 46,959,292 | 27,061,264 | ||||||||||||||
Net change in unrealized gains (losses) on investments | 22,734,834 | (3,387,087 | ) | |||||||||||||
|
| |||||||||||||||
Net increase in net assets resulting from operations | 77,992,828 | 44,470,542 | ||||||||||||||
|
| |||||||||||||||
Distributions to shareholders from net investment income and net realized gains | ||||||||||||||||
Class A | (18,684,889 | ) | (27,282,105 | ) | ||||||||||||
Class C | (1,266,022 | ) | (2,771,228 | ) | ||||||||||||
Class R | (125,676 | ) | (201,547 | ) | ||||||||||||
Class R6 | (13,828,583 | ) | (25,476,362 | ) | ||||||||||||
Administrator Class | (2,526,202 | ) | (3,946,556 | ) | ||||||||||||
Institutional Class | (9,162,742 | ) | (24,186,334 | ) | ||||||||||||
|
| |||||||||||||||
Total distributions to shareholders | (45,594,114 | ) | (83,864,132 | ) | ||||||||||||
|
| |||||||||||||||
Capital share transactions | Shares | Shares | ||||||||||||||
Proceeds from shares sold | ||||||||||||||||
Class A | 544,217 | 9,619,200 | 1,886,725 | 30,921,236 | ||||||||||||
Class C | 63,471 | 1,033,073 | 472,068 | 6,869,156 | ||||||||||||
Class R | 10,310 | 183,174 | 37,989 | 635,336 | ||||||||||||
Class R6 | 1,870,963 | 34,914,156 | 3,079,018 | 48,714,888 | ||||||||||||
Administrator Class | 84,827 | 1,532,305 | 426,111 | 7,266,082 | ||||||||||||
Institutional Class | 632,858 | 11,325,042 | 4,282,122 | 73,227,240 | ||||||||||||
|
| |||||||||||||||
| 58,606,950 | 167,633,938 | |||||||||||||||
|
| |||||||||||||||
Reinvestment of distributions | ||||||||||||||||
Class A | 983,735 | 17,558,389 | 1,648,190 | 25,532,516 | ||||||||||||
Class C | 71,599 | 1,167,986 | 177,775 | 2,524,825 | ||||||||||||
Class R | 6,899 | 124,243 | 12,745 | 199,335 | ||||||||||||
Class R6 | 704,180 | 12,911,375 | 1,506,629 | 23,955,923 | ||||||||||||
Administrator Class | 122,595 | 2,255,074 | 235,868 | 3,758,071 | ||||||||||||
Institutional Class | 466,053 | 8,456,868 | 1,264,383 | 19,892,703 | ||||||||||||
|
| |||||||||||||||
| 42,473,935 | 75,863,373 | |||||||||||||||
|
| |||||||||||||||
Payment for shares redeemed | ||||||||||||||||
Class A | (2,022,678 | ) | (35,729,893 | ) | (5,568,268 | ) | (92,539,888 | ) | ||||||||
Class C | (395,372 | ) | (6,353,643 | ) | (1,440,204 | ) | (21,524,938 | ) | ||||||||
Class R | (21,860 | ) | (389,351 | ) | (55,966 | ) | (904,117 | ) | ||||||||
Class R6 | (3,925,366 | ) | (70,925,354 | ) | (9,937,174 | ) | (168,483,143 | ) | ||||||||
Administrator Class | (293,245 | ) | (5,394,843 | ) | (2,534,639 | ) | (43,971,874 | ) | ||||||||
Institutional Class | (6,861,437 | ) | (121,425,461 | ) | (12,205,371 | ) | (203,720,141 | ) | ||||||||
|
| |||||||||||||||
| (240,218,545 | ) | (531,144,101 | ) | |||||||||||||
|
| |||||||||||||||
Net decrease in net assets resulting from capital share transactions | (139,137,660 | ) | (287,646,790 | ) | ||||||||||||
|
| |||||||||||||||
Total decrease in net assets | (106,738,946 | ) | (327,040,380 | ) | ||||||||||||
|
| |||||||||||||||
Net assets | ||||||||||||||||
Beginning of period | 1,161,230,603 | 1,488,270,983 | ||||||||||||||
|
| |||||||||||||||
End of period | $ | 1,054,491,657 | $ | 1,161,230,603 | ||||||||||||
|
| |||||||||||||||
The accompanying notes are an integral part of these financial statements.
Wells Fargo Disciplined U.S. Core Fund | 17
Table of Contents
(For a share outstanding throughout each period)
| Six months ended January 31, 2020 (unaudited) | Year ended July 31 | |||||||||||||||||||||||
| CLASS A | 2019 | 2018 | 2017 | 2016 | 2015 | |||||||||||||||||||
Net asset value, beginning of period | $17.29 | $17.70 | $16.30 | $14.50 | $15.45 | $16.29 | ||||||||||||||||||
Net investment income | 0.12 | 1 | 0.25 | 0.24 | 0.22 | 0.21 | 0.21 | |||||||||||||||||
Net realized and unrealized gains (losses) on investments | 1.21 | 0.38 | 1.90 | 1.94 | 0.47 | 1.60 | ||||||||||||||||||
|
|
|
|
|
|
|
|
|
|
|
| |||||||||||||
Total from investment operations | 1.33 | 0.63 | 2.14 | 2.16 | 0.68 | 1.81 | ||||||||||||||||||
Distributions to shareholders from | ||||||||||||||||||||||||
Net investment income | (0.33 | ) | (0.19 | ) | (0.15 | ) | (0.15 | ) | (0.19 | ) | (0.16 | ) | ||||||||||||
Net realized gains | (0.44 | ) | (0.85 | ) | (0.59 | ) | (0.21 | ) | (1.44 | ) | (2.49 | ) | ||||||||||||
|
|
|
|
|
|
|
|
|
|
|
| |||||||||||||
Total distributions to shareholders | (0.77 | ) | (1.04 | ) | (0.74 | ) | (0.36 | ) | (1.63 | ) | (2.65 | ) | ||||||||||||
Net asset value, end of period | $17.85 | $17.29 | $17.70 | $16.30 | $14.50 | $15.45 | ||||||||||||||||||
Total return2 | 7.73 | % | 4.31 | % | 13.28 | % | 15.12 | % | 5.22 | % | 12.01 | % | ||||||||||||
Ratios to average net assets (annualized) | ||||||||||||||||||||||||
Gross expenses | 0.85 | % | 0.84 | % | 0.83 | % | 0.85 | % | 0.87 | % | 0.89 | % | ||||||||||||
Net expenses | 0.84 | % | 0.84 | % | 0.83 | % | 0.85 | % | 0.87 | % | 0.89 | % | ||||||||||||
Net investment income | 1.33 | % | 1.40 | % | 1.33 | % | 1.45 | % | 1.60 | % | 1.43 | % | ||||||||||||
Supplemental data | ||||||||||||||||||||||||
Portfolio turnover rate | 32 | % | 63 | % | 73 | % | 60 | % | 52 | % | 53 | % | ||||||||||||
Net assets, end of period (000s omitted) | $439,643 | $434,367 | $480,602 | $467,491 | $412,629 | $331,123 | ||||||||||||||||||
| 1 | Calculated based upon average shares outstanding |
| 2 | Total return calculations do not include any sales charges. Returns for periods of less than one year are not annualized. |
The accompanying notes are an integral part of these financial statements.
18 | Wells Fargo Disciplined U.S. Core Fund
Table of Contents
Financial highlights
(For a share outstanding throughout each period)
| Six months ended January 31, 2020 (unaudited) | Year ended July 31 | |||||||||||||||||||||||
| CLASS C | 2019 | 2018 | 2017 | 2016 | 2015 | |||||||||||||||||||
Net asset value, beginning of period | $15.85 | $16.28 | $15.04 | $13.45 | $14.50 | $15.47 | ||||||||||||||||||
Net investment income | 0.06 | 0.12 | 0.09 | 0.10 | 0.14 | 0.13 | ||||||||||||||||||
Net realized and unrealized gains (losses) on investments | 1.10 | 0.35 | 1.76 | 1.79 | 0.38 | 1.48 | ||||||||||||||||||
|
|
|
|
|
|
|
|
|
|
|
| |||||||||||||
Total from investment operations | 1.16 | 0.47 | 1.85 | 1.89 | 0.52 | 1.61 | ||||||||||||||||||
Distributions to shareholders from | ||||||||||||||||||||||||
Net investment income | (0.14 | ) | (0.05 | ) | (0.02 | ) | (0.09 | ) | (0.13 | ) | (0.09 | ) | ||||||||||||
Net realized gains | (0.44 | ) | (0.85 | ) | (0.59 | ) | (0.21 | ) | (1.44 | ) | (2.49 | ) | ||||||||||||
|
|
|
|
|
|
|
|
|
|
|
| |||||||||||||
Total distributions to shareholders | (0.58 | ) | (0.90 | ) | (0.61 | ) | (0.30 | ) | (1.57 | ) | (2.58 | ) | ||||||||||||
Net asset value, end of period | $16.43 | $15.85 | $16.28 | $15.04 | $13.45 | $14.50 | ||||||||||||||||||
Total return1 | 7.32 | % | 3.59 | % | 12.41 | % | 14.27 | % | 4.43 | % | 11.18 | % | ||||||||||||
Ratios to average net assets (annualized) | ||||||||||||||||||||||||
Gross expenses | 1.60 | % | 1.59 | % | 1.58 | % | 1.60 | % | 1.62 | % | 1.64 | % | ||||||||||||
Net expenses | 1.60 | % | 1.59 | % | 1.58 | % | 1.60 | % | 1.62 | % | 1.64 | % | ||||||||||||
Net investment income | 0.58 | % | 0.66 | % | 0.58 | % | 0.69 | % | 0.82 | % | 0.66 | % | ||||||||||||
Supplemental data | ||||||||||||||||||||||||
Portfolio turnover rate | 32 | % | 63 | % | 73 | % | 60 | % | 52 | % | 53 | % | ||||||||||||
Net assets, end of period (000s omitted) | $35,851 | $38,708 | $52,647 | $54,054 | $46,801 | $20,680 | ||||||||||||||||||
| 1 | Total return calculations do not include any sales charges. Returns for periods of less than one year are not annualized. |
The accompanying notes are an integral part of these financial statements.
Wells Fargo Disciplined U.S. Core Fund | 19
Table of Contents
Financial highlights
(For a share outstanding throughout each period)
| Six months ended January 31, 2020 (unaudited) | Year ended July 31 | |||||||||||||||||||
| CLASS R | 2019 | 2018 | 2017 | 20161 | ||||||||||||||||
Net asset value, beginning of period | $17.44 | $17.88 | $16.51 | $14.77 | $14.62 | |||||||||||||||
Net investment income | 0.10 | 0.19 | 2 | 0.18 | 2 | 0.17 | 2 | 0.13 | 2 | |||||||||||
Net realized and unrealized gains (losses) on investments | 1.22 | 0.41 | 1.94 | 1.99 | 1.72 | |||||||||||||||
|
|
|
|
|
|
|
|
|
| |||||||||||
Total from investment operations | 1.32 | 0.60 | 2.12 | 2.16 | 1.85 | |||||||||||||||
Distributions to shareholders from | ||||||||||||||||||||
Net investment income | (0.29 | ) | (0.19 | ) | (0.16 | ) | (0.21 | ) | (0.26 | ) | ||||||||||
Net realized gains | (0.44 | ) | (0.85 | ) | (0.59 | ) | (0.21 | ) | (1.44 | ) | ||||||||||
|
|
|
|
|
|
|
|
|
| |||||||||||
Total distributions to shareholders | (0.73 | ) | (1.04 | ) | (0.75 | ) | (0.42 | ) | (1.70 | ) | ||||||||||
Net asset value, end of period | $18.03 | $17.44 | $17.88 | $16.51 | $14.77 | |||||||||||||||
Total return3 | 7.59 | % | 4.07 | % | 12.97 | % | 14.86 | % | 13.56 | % | ||||||||||
Ratios to average net assets (annualized) | ||||||||||||||||||||
Gross expenses | 1.10 | % | 1.09 | % | 1.08 | % | 1.10 | % | 1.12 | % | ||||||||||
Net expenses | 1.10 | % | 1.09 | % | 1.08 | % | 1.10 | % | 1.12 | % | ||||||||||
Net investment income | 1.08 | % | 1.15 | % | 1.04 | % | 1.10 | % | 1.12 | % | ||||||||||
Supplemental data | ||||||||||||||||||||
Portfolio turnover rate | 32 | % | 63 | % | 73 | % | 60 | % | 52 | % | ||||||||||
Net assets, end of period (000s omitted) | $3,148 | $3,126 | $3,298 | $2,001 | $201 | |||||||||||||||
| 1 | For the period from September 30, 2015 (commencement of class operations) to July 31, 2016. |
| 2 | Calculated based upon average shares outstanding |
| 3 | Returns for periods of less than one year are not annualized. |
The accompanying notes are an integral part of these financial statements.
20 | Wells Fargo Disciplined U.S. Core Fund
Table of Contents
Financial highlights
(For a share outstanding throughout each period)
| Six months ended January 31, 2020 (unaudited) | Year ended July 31 | |||||||||||||||||||
| CLASS R6 | 2019 | 2018 | 2017 | 20161 | ||||||||||||||||
Net asset value, beginning of period | $17.76 | $18.17 | $16.71 | $14.86 | $14.62 | |||||||||||||||
Net investment income | 0.20 | 0.32 | 0.30 | 2 | 0.28 | 2 | 0.22 | 2 | ||||||||||||
Net realized and unrealized gains (losses) on investments | 1.21 | 0.40 | 1.97 | 1.99 | 1.72 | |||||||||||||||
|
|
|
|
|
|
|
|
|
| |||||||||||
Total from investment operations | 1.41 | 0.72 | 2.27 | 2.27 | 1.94 | |||||||||||||||
Distributions to shareholders from | ||||||||||||||||||||
Net investment income | (0.42 | ) | (0.28 | ) | (0.22 | ) | (0.21 | ) | (0.26 | ) | ||||||||||
Net realized gains | (0.44 | ) | (0.85 | ) | (0.59 | ) | (0.21 | ) | (1.44 | ) | ||||||||||
|
|
|
|
|
|
|
|
|
| |||||||||||
Total distributions to shareholders | (0.86 | ) | (1.13 | ) | (0.81 | ) | (0.42 | ) | (1.70 | ) | ||||||||||
Net asset value, end of period | $18.31 | $17.76 | $18.17 | $16.71 | $14.86 | |||||||||||||||
Total return3 | 7.97 | % | 4.77 | % | 13.78 | % | 15.56 | % | 14.24 | % | ||||||||||
Ratios to average net assets (annualized) | ||||||||||||||||||||
Gross expenses | 0.42 | % | 0.41 | % | 0.40 | % | 0.42 | % | 0.44 | % | ||||||||||
Net expenses | 0.42 | % | 0.41 | % | 0.40 | % | 0.42 | % | 0.43 | % | ||||||||||
Net investment income | 1.76 | % | 1.84 | % | 1.71 | % | 1.77 | % | 1.88 | % | ||||||||||
Supplemental data | ||||||||||||||||||||
Portfolio turnover rate | 32 | % | 63 | % | 73 | % | 60 | % | 52 | % | ||||||||||
Net assets, end of period (000s omitted) | $326,427 | $340,606 | $445,678 | $41,770 | $4,024 | |||||||||||||||
| 1 | For the period from September 30, 2015 (commencement of class operations) to July 31, 2016. |
| 2 | Calculated based upon average shares outstanding |
| 3 | Returns for periods of less than one year are not annualized. |
The accompanying notes are an integral part of these financial statements.
Wells Fargo Disciplined U.S. Core Fund | 21
Table of Contents
Financial highlights
(For a share outstanding throughout each period)
| Six months ended January 31, 2020 (unaudited) | Year ended July 31 | |||||||||||||||||||||||
| ADMINISTRATOR CLASS | 2019 | 2018 | 2017 | 2016 | 2015 | |||||||||||||||||||
Net asset value, beginning of period | $17.80 | $18.17 | $16.71 | $14.85 | $15.80 | $16.60 | ||||||||||||||||||
Net investment income | 0.13 | 1 | 0.26 | 1 | 0.25 | 1 | 0.25 | 1 | 0.24 | 1 | 0.25 | 1 | ||||||||||||
Net realized and unrealized gains (losses) on investments | 1.25 | (0.41 | ) | 1.97 | 1.98 | 0.48 | 1.63 | |||||||||||||||||
|
|
|
|
|
|
|
|
|
|
|
| |||||||||||||
Total from investment operations | 1.38 | 0.67 | 2.22 | 2.23 | 0.72 | 1.88 | ||||||||||||||||||
Distributions to shareholders from | ||||||||||||||||||||||||
Net investment income | (0.35 | ) | (0.19 | ) | (0.17 | ) | (0.16 | ) | (0.23 | ) | (0.19 | ) | ||||||||||||
Net realized gains | (0.44 | ) | (0.85 | ) | (0.59 | ) | (0.21 | ) | (1.44 | ) | (2.49 | ) | ||||||||||||
|
|
|
|
|
|
|
|
|
|
|
| |||||||||||||
Total distributions to shareholders | (0.79 | ) | (1.04 | ) | (0.76 | ) | (0.37 | ) | (1.67 | ) | (2.68 | ) | ||||||||||||
Net asset value, end of period | $18.39 | $17.80 | $18.17 | $16.71 | $14.85 | $15.80 | ||||||||||||||||||
Total return2 | 7.79 | % | 4.43 | % | 13.40 | % | 15.24 | % | 5.36 | % | 12.20 | % | ||||||||||||
Ratios to average net assets (annualized) | ||||||||||||||||||||||||
Gross expenses | 0.77 | % | 0.76 | % | 0.75 | % | 0.77 | % | 0.78 | % | 0.74 | % | ||||||||||||
Net expenses | 0.74 | % | 0.74 | % | 0.74 | % | 0.74 | % | 0.74 | % | 0.73 | % | ||||||||||||
Net investment income | 1.44 | % | 1.50 | % | 1.42 | % | 1.60 | % | 1.71 | % | 1.58 | % | ||||||||||||
Supplemental data | ||||||||||||||||||||||||
Portfolio turnover rate | 32 | % | 63 | % | 73 | % | 60 | % | 52 | % | 53 | % | ||||||||||||
Net assets, end of period (000s omitted) | $59,186 | $58,808 | $94,058 | $94,294 | $116,807 | $63,544 | ||||||||||||||||||
| 1 | Calculated based upon average shares outstanding |
| 2 | Returns for periods of less than one year are not annualized. |
The accompanying notes are an integral part of these financial statements.
22 | Wells Fargo Disciplined U.S. Core Fund
Table of Contents
Financial highlights
(For a share outstanding throughout each period)
| Six months ended January 31, 2020 (unaudited) | Year ended July 31 | |||||||||||||||||||||||
| INSTITUTIONAL CLASS | 2019 | 2018 | 2017 | 2016 | 2015 | |||||||||||||||||||
Net asset value, beginning of period | $17.57 | $17.98 | $16.55 | $14.72 | $15.66 | $16.47 | ||||||||||||||||||
Net investment income | 0.16 | 1 | 0.30 | 1 | 0.28 | 0.27 | 1 | 0.28 | 1 | 0.30 | ||||||||||||||
Net realized and unrealized gains (losses) on investments | 1.23 | 0.40 | 1.95 | 1.98 | 0.47 | 1.61 | ||||||||||||||||||
|
|
|
|
|
|
|
|
|
|
|
| |||||||||||||
Total from investment operations | 1.39 | 0.70 | 2.23 | 2.25 | 0.75 | 1.91 | ||||||||||||||||||
Distributions to shareholders from | ||||||||||||||||||||||||
Net investment income | (0.39 | ) | (0.26 | ) | (0.21 | ) | (0.21 | ) | (0.25 | ) | (0.23 | ) | ||||||||||||
Net realized gains | (0.44 | ) | (0.85 | ) | (0.59 | ) | (0.21 | ) | (1.44 | ) | (2.49 | ) | ||||||||||||
|
|
|
|
|
|
|
|
|
|
|
| |||||||||||||
Total distributions to shareholders | (0.83 | ) | (1.11 | ) | (0.80 | ) | (0.42 | ) | (1.69 | ) | (2.72 | ) | ||||||||||||
Net asset value, end of period | $18.13 | $17.57 | $17.98 | $16.55 | $14.72 | $15.66 | ||||||||||||||||||
Total return2 | 7.95 | % | 4.69 | % | 13.65 | % | 15.51 | % | 5.64 | % | 12.55 | % | ||||||||||||
Ratios to average net assets (annualized) | ||||||||||||||||||||||||
Gross expenses | 0.52 | % | 0.51 | % | 0.50 | % | 0.52 | % | 0.54 | % | 0.47 | % | ||||||||||||
Net expenses | 0.48 | % | 0.48 | % | 0.48 | % | 0.48 | % | 0.48 | % | 0.47 | % | ||||||||||||
Net investment income | 1.74 | % | 1.77 | % | 1.67 | % | 1.76 | % | 1.96 | % | 1.86 | % | ||||||||||||
Supplemental data | ||||||||||||||||||||||||
Portfolio turnover rate | 32 | % | 63 | % | 73 | % | 60 | % | 52 | % | 53 | % | ||||||||||||
Net assets, end of period (000s omitted) | $190,237 | $285,616 | $411,988 | $353,573 | $163,674 | $109,901 | ||||||||||||||||||
| 1 | Calculated based upon average shares outstanding |
| 2 | Returns for periods of less than one year are not annualized. |
The accompanying notes are an integral part of these financial statements.
Wells Fargo Disciplined U.S. Core Fund | 23
Table of Contents
Notes to financial statements (unaudited)
1. ORGANIZATION
Wells Fargo Funds Trust (the “Trust”), a Delaware statutory trust organized on March 10, 1999, is anopen-end management investment company registered under the Investment Company Act of 1940, as amended (the “1940 Act”). As an investment company, the Trust follows the accounting and reporting guidance in Financial Accounting Standards Board (“FASB”)Accounting Standards Codification Topic 946, Financial Services – Investment Companies. These financial statements report on the Wells Fargo Disciplined U.S. Core Fund (the “Fund”) which is a diversified series of the Trust.
2. SIGNIFICANT ACCOUNTING POLICIES
The following significant accounting policies, which are consistently followed in the preparation of the financial statements of the Fund, are in conformity with U.S. generally accepted accounting principles which require management to make estimates and assumptions that affect the reported amounts of assets and liabilities, disclosure of contingent assets and liabilities at the date of the financial statements, and the reported amounts of revenues and expenses during the reporting period. Actual results could differ from those estimates.
Securities valuation
All investments are valued each business day as of the close of regular trading on the New York Stock Exchange (generally 4 p.m. Eastern Time), although the Fund may deviate from this calculation time under unusual or unexpected circumstances.
Equity securities and futures contracts that are listed on a foreign or domestic exchange or market are valued at the official closing price or, if none, the last sales price. If no sale occurs on the principal exchange or market that day, a fair value price will be determined in accordance with the Fund’s Valuation Procedures.
Debt securities are valued at the evaluated bid price provided by an independent pricing service (e.g. taking into account various factors, including yields, maturities, or credit ratings) or, if a reliable price is not available, the quoted bid price from an independent broker-dealer.
Investments in registeredopen-end investment companies are valued at net asset value. Interests innon-registered investment companies that are redeemable at net asset value are fair valued normally at net asset value.
Investments which are not valued using any of the methods discussed above are valued at their fair value, as determined in good faith by the Board of Trustees of the Fund. The Board of Trustees has established a Valuation Committee comprised of the Trustees and has delegated to it the authority to take any actions regarding the valuation of portfolio securities that the Valuation Committee deems necessary or appropriate, including determining the fair value of portfolio securities, unless the determination has been delegated to the Wells Fargo Asset Management Pricing Committee at Wells Fargo Funds Management, LLC (“Funds Management”).The Board of Trustees retains the authority to make or ratify any valuation decisions or approve any changes to the Valuation Procedures as it deems appropriate. On a quarterly basis, the Board of Trustees receives reports on any valuation actions taken by the Valuation Committee or the Wells Fargo Asset Management Pricing Committee which may include items for ratification.
Securities lending
The Fund may lend its securities from time to time in order to earn additional income in the form of fees or interest on securities received as collateral or the investment of any cash received as collateral. When securities are on loan, the Fund receives interest or dividends on those securities. Cash collateral received in connection with its securities lending transactions is invested in Securities Lending Cash Investments, LLC (the “Securities Lending Fund”). Investments in Securities Lending Fund are valued at the evaluated bid price provided by an independent pricing service. Income earned from investment in the Securities Lending Fund (net of fees and rebates), if any, is included in income from affiliated securities on the Statement of Operations.
In a securities lending transaction, the net asset value of the Fund is affected by an increase or decrease in the value of the securities loaned and by an increase or decrease in the value of the instrument in which collateral is invested. The amount of securities lending activity undertaken by the Fund fluctuates from time to time. The Fund has the right under the lending agreement to recover the securities from the borrower on demand. In the event of default or bankruptcy by the borrower, the Fund may be prevented from recovering the loaned securities or gaining access to the collateral or may experience delays or costs in doing so. In such an event, the terms of the agreement allows the unaffiliated securities lending agent to use the collateral to purchase replacement securities on behalf of the Fund or pay the Fund the market value of the loaned securities. The Fund bears the risk of loss with respect to depreciation of its investment of the cash collateral.
Futures contracts
Futures contracts are agreements between the Fund and a counterparty to buy or sell a specific amount of a commodity, financial instrument or currency at a specified price and on a specified date. The Fund may buy and sell futures contracts in order to gain exposure to, or protect against, changes in security values and is subject to equity price risk. The primary risks associated with the use of futures contracts are the imperfect correlation between changes in market values of securities held by the Fund and the
24 | Wells Fargo Disciplined U.S. Core Fund
Table of Contents
Notes to financial statements (unaudited)
prices of futures contracts, and the possibility of an illiquid market. Futures contracts are generally entered into on a regulated futures exchange and cleared through a clearinghouse associated with the exchange. With futures contracts, there is minimal counterparty risk to the Fund since futures contracts are exchange traded and the exchange’s clearinghouse, as the counterparty to all exchange traded futures, guarantees the futures contracts against default.
Upon entering into a futures contracts, the Fund is required to deposit either cash or securities (initial margin) with the broker in an amount equal to a certain percentage of the contract value. Subsequent payments (variation margin) are paid to or from the broker each day equal to the daily changes in the contract value. Such payments are recorded as unrealized gains or losses and, if any, shown as variation margin receivable (payable) in the Statement of Assets and Liabilities. Should the Fund fail to make requested variation margin payments, the broker can gain access to the initial margin to satisfy the Fund’s payment obligations. When the contracts are closed, a realized gain or loss is recorded in the Statement of Operations.
Security transactions and income recognition
Securities transactions are recorded on a trade date basis. Realized gains or losses are recorded on the basis of identified cost.
Dividend income is recognized on theex-dividend date. Dividend income is recorded net of foreign taxes withheld where recovery of such taxes is not assured.
Distributions to shareholders
Distributions to shareholders from net investment income and any net realized gains are recorded on theex-dividend date and paid at least annually. Such distributions are determined in accordance with income tax regulations and may differ from U.S. generally accepted accounting principles. Dividend sources are estimated at the time of declaration. The tax character of distributions is determined as of the Fund’s fiscal year end. Therefore, a portion of the Fund’s distributions made prior to the Fund’s fiscal year end may be categorized as a tax return of capital at year end.
Federal and other taxes
The Fund intends to continue to qualify as a regulated investment company by distributing substantially all of its investment company taxable income and any net realized capital gains (after reduction for capital loss carryforwards) sufficient to relieve it from all, or substantially all, federal income taxes. Accordingly, no provision for federal income taxes was required.
The Fund’s income and federal excise tax returns and all financial records supporting those returns for the prior three fiscal years are subject to examination by the federal and Delaware revenue authorities. Management has analyzed the Fund’s tax positions taken on federal, state, and foreign tax returns for all open tax years and does not believe that there are any uncertain tax positions that require recognition of a tax liability.
As of January 31, 2020, the aggregate cost of all investments for federal income tax purposes was $686,706,810 and the unrealized gains (losses) consisted of:
Gross unrealized gains | $ | 359,375,345 | ||
Gross unrealized losses | (13,434,933 | ) | ||
Net unrealized gains | $ | 345,940,412 | ||
Class allocations
The separate classes of shares offered by the Fund differ principally in applicable sales charges, distribution, shareholder servicing, and administration fees. Class specific expenses are charged directly to that share class. Investment income, common fund-level expenses, and realized and unrealized gains (losses) on investments are allocated daily to each class of shares based on the relative proportion of net assets of each class.
3. FAIR VALUATION MEASUREMENTS
Fair value measurements of investments are determined within a framework that has established a fair value hierarchy based upon the various data inputs utilized in determining the value of the Fund’s investments. The three-level hierarchy gives the highest priority to unadjusted quoted prices in active markets for identical assets or liabilities (Level 1) and the lowest priority to unobservable inputs (Level 3). The Fund’s investments are classified within the fair value hierarchy based on the lowest level of input that is significant to the fair value measurement. The inputs are summarized into three broad levels as follows:
| ∎ | Level 1 – quoted prices in active markets for identical securities |
| ∎ | Level 2 – other significant observable inputs (including quoted prices for similar securities, interest rates, prepayment speeds, credit risk, etc.) |
| ∎ | Level 3 – significant unobservable inputs (including the Fund’s own assumptions in determining the fair value of investments) |
Wells Fargo Disciplined U.S. Core Fund | 25
Table of Contents
Notes to financial statements (unaudited)
The inputs or methodologies used for valuing investments in securities are not necessarily an indication of the risk associated with investing in those securities.
The following is a summary of the inputs used in valuing the Fund’s assets and liabilities as of January 31, 2020:
| Quoted prices (Level 1) | Other significant observable inputs (Level 2) | Significant (Level 3) | Total | |||||||||||||
Assets | ||||||||||||||||
Investments in: | ||||||||||||||||
Common stocks | ||||||||||||||||
Communication services | $ | 111,094,131 | $ | 0 | $ | 0 | $ | 111,094,131 | ||||||||
Consumer discretionary | 97,830,069 | 0 | 0 | 97,830,069 | ||||||||||||
Consumer staples | 74,998,397 | 0 | 0 | 74,998,397 | ||||||||||||
Energy | 34,666,250 | 0 | 0 | 34,666,250 | ||||||||||||
Financials | 128,944,707 | 0 | 0 | 128,944,707 | ||||||||||||
Health care | 153,246,315 | 0 | 0 | 153,246,315 | ||||||||||||
Industrials | 81,686,579 | 0 | 0 | 81,686,579 | ||||||||||||
Information technology | 257,702,979 | 0 | 0 | 257,702,979 | ||||||||||||
Materials | 13,973,002 | 0 | 0 | 13,973,002 | ||||||||||||
Real estate | 39,211,391 | 0 | 0 | 39,211,391 | ||||||||||||
Utilities | 31,332,814 | 0 | 0 | 31,332,814 | ||||||||||||
Short-term investments | ||||||||||||||||
Investment companies | 7,213,795 | 0 | 0 | 7,213,795 | ||||||||||||
U.S. Treasury securities | 1,207,981 | 0 | 0 | 1,207,981 | ||||||||||||
Total assets | $ | 1,033,108,410 | $ | 0 | $ | 0 | $ | 1,033,108,410 | ||||||||
Liabilities | ||||||||||||||||
Futures contracts | $ | 461,188 | $ | 0 | $ | 0 | $ | 461,188 | ||||||||
Total liabilities | $ | 461,188 | $ | 0 | $ | 0 | $ | 461,188 | ||||||||
Additional sector, industry or geographic detail is included in the Portfolio of Investments.
Futures contracts are reported at their cumulative unrealized gains (losses) at measurement date as reported in the table following the Portfolio of Investments. For futures contracts, the current day’s variation margin is reported on the Statement of Assets and Liabilities. All other assets and liabilities are reported at their market value at measurement date.
For the six months ended January 31, 2020, the Fund did not have any transfers into/out of Level 3.
4. TRANSACTIONS WITH AFFILIATES
Management fee
Funds Management, an indirect wholly owned subsidiary of Wells Fargo & Company (“Wells Fargo”), is the manager of the Fund and provides advisory and fund-level administrative services under an investment management agreement. Under the investment management agreement, Funds Management is responsible for, among other services, implementing the investment objectives and strategies of the Fund, supervising the subadviser and providing fund-level administrative services in connection with the Fund’s operations. As compensation for its services under the investment management agreement, Funds Management is entitled to receive a management fee at the following annual rate based on the Fund’s average daily net assets:
| Average daily net assets | Management fee | |||
First $1 billion | 0.350 | % | ||
Next $4 billion | 0.325 | |||
Next $5 billion | 0.290 | |||
Over $10 billion | 0.280 | |||
26 |�� Wells Fargo Disciplined U.S. Core Fund
Table of Contents
Notes to financial statements (unaudited)
For the six months ended January 31, 2020, the management fee was equivalent to an annual rate of 0.35% of the Fund’s average daily net assets.
Funds Management has retained the services of a subadviser to provide daily portfolio management to the Fund. The fee for subadvisory services is borne by Funds Management. Wells Capital Management Incorporated (“WellsCap”), an affiliate of Funds Management and an indirect wholly owned subsidiary of Wells Fargo, is the subadviser to the Fund and is entitled to receive a fee from Funds Management at an annual rate starting at 0.25% and declining to 0.15% as the average daily net assets of the Fund increase.
Administration fees
Under a class-level administration agreement, Funds Management provides class-level administrative services to the Fund, which includes paying fees and expenses for services provided by the transfer agent,sub-transfer agents, omnibus account servicers and record-keepers. As compensation for its services under the class-level administration agreement, Funds Management receives an annual fee which is calculated based on the average daily net assets of each class as follows:
| Class-level administration fee | ||||
Class A, Class C, Class R | 0.21 | % | ||
Class R6 | 0.03 | |||
Administrator Class, Institutional Class | 0.13 | |||
Waivers and/or expense reimbursements
Funds Management has contractually waived and/or reimbursed management and administration fees to the extent necessary to maintain certain net operating expense ratios for the Fund. When each class of the Fund has exceeded its expense cap, Funds Management has waived fees and/or reimbursed expenses from fund-level expenses on a proportionate basis and then from class specific expenses. When only certain classes exceed their expense caps, waivers and/or reimbursements are applied against class specific expenses before fund-level expenses. Funds Management has committed through November 30, 2020 to waive fees and/or reimburse expenses to the extent necessary to cap the Fund’s expenses at 0.87% for Class A shares, 1.62% for Class C shares, 1.12% for Class R shares, 0.43% for Class R6 shares, 0.74% for Administrator Class shares, and 0.48% for Institutional Class shares. Prior to or after the commitment expiration date, the cap may be increased or the commitment to maintain the cap may be terminated only with the approval of the Board of Trustees.
Distribution fees
The Trust has adopted a distribution plan for Class C and Class R shares of the Fund pursuant to Rule12b-1 under the 1940 Act. Distribution fees are charged to Class C and Class R shares and paid to Wells Fargo Funds Distributor, LLC (“Funds Distributor”), the principal underwriter, at an annual rate of 0.75% of the average daily net assets of Class C shares and 0.25% of the average daily net assets of Class R shares.
In addition, Funds Distributor is entitled to receive thefront-end sales charge from the purchase of Class A shares and a contingent deferred sales charge on the redemption of certain Class A shares. Funds Distributor is also entitled to receive the contingent deferred sales charges from redemptions of Class C shares. For the six months ended January 31, 2020, Funds Distributor received $2,509 from the sale of Class A shares and $40 in contingent deferred sales charges from redemptions of Class C shares. No contingent deferred sales charges were incurred by Class A for the six months ended January 31, 2020.
Shareholder servicing fees
The Trust has entered into contracts with one or more shareholder servicing agents, whereby Class A, Class C, Class R, and Administrator Class of the Fund are charged a fee at an annual rate of 0.25% of the average daily net assets of each respective class. A portion of these total shareholder servicing fees were paid to affiliates of Wells Fargo.
Interfund transactions
The Fund may purchase or sell portfolio investment securities to certain other Wells Fargo affiliates pursuant to Rule17a-7 under the 1940 Act and under procedures adopted by the Board of Trustees. The procedures have been designed to ensure that these interfund transactions, which do not incur broker commissions, are effected at current market prices.
5. INVESTMENT PORTFOLIO TRANSACTIONS
Purchases and sales of investments, excluding U.S. government obligations (if any) and short-term securities, for the six months ended January 31, 2020 were $345,068,929 and $545,762,945, respectively.
Wells Fargo Disciplined U.S. Core Fund | 27
Table of Contents
Notes to financial statements (unaudited)
6. SECURITIES LENDING TRANSACTIONS
The Fund lends its securities through an unaffiliated securities lending agent and receives collateral in the form of cash or securities with a value at least equal to the value of the securities on loan. The value of the loaned securities is determined at the close of each business day and any increases or decreases in the required collateral are exchanged between the Fund and the counterparty on the next business day. Cash collateral received is invested in the Securities Lending Fund which seeks to provide a positive return compared to the daily Fed Funds Open Rate by investing in high-quality, U.S. dollar-denominated short-term money market instruments and is exempt from registration under Section 3(c)(7) of the 1940 Act. Securities Lending Fund is managed by Funds Management and is subadvised by WellsCap. Funds Management receives an advisory fee starting at 0.05% and declining to 0.01% as the average daily net assets of the Securities Lending Fund increase. All of the fees received by Funds Management are paid to WellsCap for its services as subadviser.
In the event of counterparty default or the failure of a borrower to return a loaned security, the Fund has the right to use the collateral to offset any losses incurred. As of January 31, 2020, the Fund had securities lending transactions with the following counterparties which are subject to offset:
| Counterparty | Value of securities on loan | Collateral received1 | Net amount | |||||
BNP Paribas Securities Corp. | $1,472,064 | $(1,472,064) | $ | 0 | ||||
| 1 | Collateral received within this table is limited to the collateral for the net transaction with the counterparty. |
7. DERIVATIVE TRANSACTIONS
During the six months ended January 31, 2020, the Fund entered into futures contracts for to gain market exposure. The Fund had an average notional amount of $280,104 in long futures contracts during the six months ended January 31, 2020.
The fair value, realized gains or losses and change in unrealized gains or losses, if any, on derivative instruments are reflected in the corresponding financial statement captions.
8. BANK BORROWINGS
The Trust (excluding the money market funds), Wells Fargo Master Trust and Wells Fargo Variable Trust are parties to a $280,000,000 revolving credit agreement whereby the Fund is permitted to use bank borrowings for temporary or emergency purposes, such as to fund shareholder redemption requests. Interest under the credit agreement is charged to the Fund based on a borrowing rate equal to the higher of the Federal Funds rate in effect on that day plus 1.25% or the overnight LIBOR rate in effect on that day plus 1.25%. In addition, an annual commitment fee equal to 0.25% of the unused balance is allocated to each participating fund.
During the six months ended January 31, 2020, the Fund had average borrowings outstanding of $76,968 (on an annual basis) at an average rate of 3.43% and paid interest in the amount of $2,640.
9. CONCENTRATION RISK
Concentration risks result from exposure to a limited number of sectors. As of the end of the period, the Fund invests a concentration of its portfolio in the information technology sector. A fund that invests a substantial portion of its assets in any sector may be more affected by changes in that sector than would be a fund whose investments are not heavily weighted in any sector.
10. INDEMNIFICATION
Under the Trust’s organizational documents, the officers and Trustees have been granted certain indemnification rights against certain liabilities that may arise out of performance of their duties to the Trust. Additionally, in the normal course of business, the Trust may enter into contracts with service providers that contain a variety of indemnification clauses. The Trust’s maximum exposure under these arrangements is dependent on future claims that may be made against the Fund and, therefore, cannot be estimated.
11. NEW ACCOUNTING PRONOUNCEMENT
In August 2018, FASB issued Accounting Standards Update (“ASU”)No. 2018-13, Fair Value Measurement (Topic 820)Disclosure Framework—Changes to the Disclosure Requirements for Fair Value Measurement. ASU2018-13 updates the disclosure requirements for fair value measurements by modifying or removing certain disclosures and adding certain new disclosures. The amendments are effective for fiscal years, and interim periods within those fiscal years, beginning after December 15, 2019. Early adoption is
28 | Wells Fargo Disciplined U.S. Core Fund
Table of Contents
Notes to financial statements (unaudited)
permitted. Management has adopted the removal and modification of disclosures early, as permitted, and will adopt the additional new disclosures at the effective date.
12. SUBSEQUENT EVENT
On March 11, 2020, the World Health Organization announced that it had made the assessment that coronavirus disease 2019 (“COVID-19”) is a pandemic. The impacts of COVID-19 is adversely affecting the entire global economy, individual companies and investment products, and the market in general. There is significant uncertainty around the extent and duration of business disruptions related to COVID-19 and the impact may be short term or may last for an extended period of time. The risk of further spreading of COVID-19 has led to significant uncertainty and volatility in the financial markets and the value of the Fund and the securities in which the Fund invests may be adversely affected by impacts caused by COVID-19.
Wells Fargo Disciplined U.S. Core Fund | 29
Table of Contents
PROXY VOTING INFORMATION
A description of the policies and procedures used to determine how to vote proxies relating to portfolio securities is available, upon request, by calling1-800-222-8222, visiting our website atwfam.com, or visiting the SEC website at sec.gov. Information regarding how the proxies related to portfolio securities were voted during the most recent12-month period ended June 30 is available on the website atwfam.comor by visiting the SEC website at sec.gov.
QUARTERLY PORTFOLIO HOLDINGS INFORMATION
The Fund files its complete schedule of portfolio holdings with the SEC for the first and third quarters of each fiscal year as an exhibit to its reports on FormN-PORT. Shareholders may view the filed FormN-PORT by visiting the SEC website at sec.gov.
30 | Wells Fargo Disciplined U.S. Core Fund
Table of Contents
Other information (unaudited)
BOARD OF TRUSTEES AND OFFICERS
Each of the Trustees and Officers1 listed in the table below acts in identical capacities for each fund in the Wells Fargo family of funds, which consists of 149 mutual funds comprising the Wells Fargo Funds Trust, Wells Fargo Variable Trust, Wells Fargo Master Trust and fourclosed-end funds (collectively the “Fund Complex”). This table should be read in conjunction with the Prospectus and the Statement of Additional Information2. The mailing address of each Trustee and Officer is 525 Market Street, 12th Floor, San Francisco, CA 94105. Each Trustee and Officer serves an indefinite term, however, each Trustee serves such term until reaching the mandatory retirement age established by the Trustees.
Independent Trustees
Name and year of birth | Position held and length of service* | Principal occupations during past five years or longer | Current other public company or investment company directorships | |||
| William R. Ebsworth (Born 1957) | Trustee, since 2015 | Retired. From 1984 to 2013, equities analyst, portfolio manager, research director and chief investment officer at Fidelity Management and Research Company in Boston, Tokyo, and Hong Kong, and retired in 2013 as Chief Investment Officer of Fidelity Strategic Advisers, Inc. where he led a team of investment professionals managing client assets. Prior thereto, Board member of Hong Kong Securities Clearing Co., Hong Kong Options Clearing Corp., the Thailand International Fund, Ltd., Fidelity Investments Life Insurance Company, and Empire Fidelity Investments Life Insurance Company. Audit Committee Chair and Investment Committee Chair of the Vincent Memorial Hospital Endowment(non-profit organization). Mr. Ebsworth is a CFA® charterholder. | N/A | |||
| Jane A. Freeman (Born 1953) | Trustee, since 2015; Chair Liaison, since 2018 | Retired. From 2012 to 2014 and 1999 to 2008, Chief Financial Officer of Scientific Learning Corporation. From 2008 to 2012, Ms. Freeman provided consulting services related to strategic business projects. Prior to 1999, Portfolio Manager at Rockefeller & Co. and Scudder, Stevens & Clark. Board member of the Harding Loevner Funds from 1996 to 2014, serving as both Lead Independent Director and chair of the Audit Committee. Board member of the Russell Exchange Traded Funds Trust from 2011 to 2012 and the chair of the Audit Committee. Ms. Freeman is a Board Member of The Ruth Bancroft Garden(non-profit organization). She is also an inactive Chartered Financial Analyst. | N/A | |||
| Isaiah Harris, Jr. (Born 1952) | Trustee, since 2009; Audit Committee Chairman, since 2019 | Retired. Chairman of the Board of CIGNA Corporation since 2009, and Director since 2005. From 2003 to 2011, Director of Deluxe Corporation. Prior thereto, President and CEO of BellSouth Advertising and Publishing Corp. from 2005 to 2007, President and CEO of BellSouth Enterprises from 2004 to 2005 and President of BellSouth Consumer Services from 2000 to 2003. Emeritus member of the Iowa State University Foundation Board of Governors. Emeritus Member of the Advisory Board of Iowa State University School of Business. Advisory Board Member, Palm Harbor Academy (private school). Advisory Board Member, Child Evangelism Fellowship(non-profit). Mr. Harris is a certified public accountant (inactive status). | CIGNA Corporation | |||
| Judith M. Johnson (Born 1949) | Trustee, since 2008; Audit Committee Chairman, from 2009 to 2018 | Retired. Prior thereto, Chief Executive Officer and Chief Investment Officer of Minneapolis Employees Retirement Fund from 1996 to 2008. Ms. Johnson is an attorney, certified public accountant and a certified managerial accountant. | N/A | |||
Wells Fargo Disciplined U.S. Core Fund | 31
Table of Contents
Other information (unaudited)
Name and year of birth | Position held and length of service* | Principal occupations during past five years or longer | Current other public company or investment company directorships | |||
| David F. Larcker (Born 1950) | Trustee, since 2009 | James Irvin Miller Professor of Accounting at the Graduate School of Business, Stanford University, Director of the Corporate Governance Research Initiative and Senior Faculty of The Rock Center for Corporate Governance since 2006. From 2005 to 2008, Professor of Accounting at the Graduate School of Business, Stanford University. Prior thereto, Ernst & Young Professor of Accounting at The Wharton School, University of Pennsylvania from 1985 to 2005. | N/A | |||
| Olivia S. Mitchell (Born 1953) | Trustee, since 2006; Nominating and Governance Committee Chair, since 2018 | International Foundation of Employee Benefit Plans Professor, Wharton School of the University of Pennsylvania since 1993. Director of Wharton’s Pension Research Council and Boettner Center on Pensions & Retirement Research, and Research Associate at the National Bureau of Economic Research. Previously, Cornell University Professor from 1978 to 1993. | N/A | |||
| Timothy J. Penny (Born 1951) | Trustee, since 1996; Chairman, since 2018 | President and Chief Executive Officer of Southern Minnesota Initiative Foundation, anon-profit organization, since 2007. Member of the Board of Trustees of NorthStar Education Finance, Inc., anon-profit organization, since 2007. | N/A | |||
| James G. Polisson (Born 1959) | Trustee, since 2018 | Retired. Chief Marketing Officer, Source (ETF) UK Services, Ltd, from 2015 to 2017. From 2012 to 2015, Principal of The Polisson Group, LLC, a management consulting, corporate advisory and principal investing company. Chief Executive Officer and Managing Director at Russell Investments, Global Exchange Traded Funds from 2010 to 2012. Managing Director of Barclays Global Investors from 1998 to 2010 and Global Chief Marketing Officer for iShares and Barclays Global Investors from 2000 to 2010. Trustee of the San Francisco Mechanics’ Institute, anon-profit organization, from 2013 to 2015. Board member of the Russell Exchange Traded Fund Trust from 2011 to 2012. Director of Barclays Global Investors Holdings Deutschland GmbH from 2006 to 2009. Mr. Polisson is an attorney and has a retired status with the Massachusetts and District of Columbia Bar Associations. | N/A | |||
| Pamela Wheelock3 (Born 1959) | Trustee, since January 2020; previously Trustee from January 2018 to July 2019 | Board member of the Destination Medical Center Economic Development Agency, Rochester, Minnesota since 2019. Acting Commissioner, Minnesota Department of Human Services, July 2019 through September 2019. Human Services Manager (part-time), Minnesota Department of Human Services, October 2019 through December 2019. Chief Operating Officer, Twin Cities Habitat for Humanity from 2017 to 2019. Vice President of University Services, University of Minnesota from 2012 to 2016. Prior thereto, on the Board of Directors, Governance Committee and Finance Committee for the Minnesota Philanthropy Partners (Saint Paul Foundation) from 2012 to 2018, Interim Chief Executive Officer of Blue Cross Blue Shield of Minnesota from 2011 to 2012, Chairman of the Board from 2009 to 2012 and Board Director from 2003 to 2015. Vice President, Leadership and Community Engagement, Bush Foundation, Saint Paul, Minnesota (a private foundation) from 2009 to 2011. Executive Vice President and Chief Financial Officer, Minnesota Sports and Entertainment from 2004 to 2009 and Senior Vice President from 2002 to 2004. Executive Vice President of the Minnesota Wild Foundation from 2004 to 2008. Commissioner of Finance, State of Minnesota, from 1999 to 2002. Currently Board Chair of the Minnesota Wild Foundation since 2010. | N/A | |||
| * | Length of service dates reflect the Trustee’s commencement of service with the Trust’s predecessor entities, where applicable. |
32 | Wells Fargo Disciplined U.S. Core Fund
Table of Contents
Other information (unaudited)
Officers
Name and year of birth | Position held and length of service | Principal occupations during past five years or longer | ||
| Andrew Owen (Born 1960) | President, since 2017 | Executive Vice President of Wells Fargo & Company and Head of Affiliated Managers, Wells Fargo Asset Management, since 2014. In addition, Mr. Owen is currently President, Chief Executive Officer and Director of Wells Fargo Funds Management, LLC since 2017. Prior thereto, Executive Vice President responsible for marketing, investments and product development for Wells Fargo Funds Management, LLC, from 2009 to 2014. | ||
| Jeremy DePalma1 (Born 1974) | Treasurer, since 2012 | Senior Vice President of Wells Fargo Funds Management, LLC since 2009. Senior Vice President of Evergreen Investment Management Company, LLC from 2008 to 2010 and head of the Fund Reporting and Control Team within Fund Administration from 2005 to 2010. | ||
| Michelle Rhee (Born 1966) | Chief Legal Officer, since 2019 | Secretary of Wells Fargo Funds Management, LLC, Chief Legal Counsel of Wells Fargo Asset Management and Assistant General Counsel of Wells Fargo Bank, N.A. since 2018. Associate General Counsel and Managing Director of Bank of America Corporation from 2004 to 2018. | ||
| Catherine Kennedy (Born 1969) | Secretary, since 2019 | Vice President of Wells Fargo Funds Management, LLC and Senior Counsel of the Wells Fargo Legal Department since 2010. Vice President and Senior Counsel of Evergreen Investment Management Company, LLC from 1998 to 2010. | ||
| Michael H. Whitaker (Born 1967) | Chief Compliance Officer, since 2016 | Chief Compliance Officer of Wells Fargo Asset Management since 2016. Senior Vice President and Chief Compliance Officer for Fidelity Investments from 2007 to 2016. | ||
| David Berardi (Born 1975) | Assistant Treasurer, since 2009 | Vice President of Wells Fargo Funds Management, LLC since 2009. Vice President of Evergreen Investment Management Company, LLC from 2008 to 2010. Manager of Fund Reporting and Control for Evergreen Investment Management Company, LLC from 2004 to 2010. | ||
| 1 | Jeremy DePalma acts as Treasurer of 85 funds and Assistant Treasurer of 64 funds in the Fund Complex. |
| 2 | The Statement of Additional Information includes additional information about the Trustees and is available, without charge, upon request, by calling1-800-222-8222 or by visiting the website atwfam.com. |
| 3 | Pamela Wheelock wasre-appointed to the Board effective January 1, 2020. |
Wells Fargo Disciplined U.S. Core Fund | 33
Table of Contents
Effective on or about May 1, 2020, if you purchase Fund shares through a Janney Montgomery Scott LLC (“Janney”) brokerage account, you will be eligible for the following load waivers(front-end sales charge waivers and contingent deferred sales charge (“CDSC”), orback-end sales charge, waivers) and discounts, which may differ from those disclosed elsewhere in the Fund’s Prospectus or SAI.
| Front-end sales charge* waivers on Class A shares available at Janney |
| Shares purchased through reinvestment of capital gains distributions and dividend reinvestment when purchasing shares of the same fund (but not any other fund within the fund family). |
| Shares purchased by employees and registered representatives of Janney or its affiliates and their family members as designated by Janney. |
| Shares purchased from the proceeds of redemptions within the same fund family, provided (1) the repurchase occurs within ninety (90) days following the redemption, (2) the redemption and purchase occur in the same account, and (3) redeemed shares were subject to afront-end or deferred sales load (i.e., right of reinstatement). |
| Employer-sponsored retirement plans (e.g., 401(k) plans, 457 plans, employer-sponsored 403(b) plans, profit sharing and money purchase pension plans and defined benefit plans). For purposes of this provision, employer-sponsored retirement plans do not include SEP IRAs, Simple IRAs,SAR-SEPs or Keogh plans. |
| Shares acquired through a right of reinstatement. |
| Class C shares that are no longer subject to a contingent deferred sales charge and are converted to Class A shares of the same fund pursuant to Janney’s policies and procedures. |
| CDSC waivers on Class A and Class C shares available at Janney |
| Shares sold upon the death or disability of the shareholder. |
| Shares sold as part of a systematic withdrawal plan as described in the Fund’s Prospectus. |
| Shares purchased in connection with a return of excess contributions from an IRA account. |
| Shares sold as part of a required minimum distribution for IRA and retirement accounts if the redemption is taken in or after the year the shareholder reaches qualified age based on applicable IRS regulations. |
| Shares sold to pay Janney fees but only if the transaction is initiated by Janney. |
| Shares acquired through a right of reinstatement. |
| Shares exchanged into the same share class of a different fund. |
| Front-end sales charge* discounts available at Janney; breakpoints, rights of accumulation and/or letters of intent |
| Breakpoints as described in the Fund’s Prospectus. |
| Rights of accumulation (“ROA”), which entitle shareholders to breakpoint discounts, will be automatically calculated based on the aggregated holding of fund family assets held by accounts within the purchaser’s household at Janney. Eligible fund family assets not held at Janney may be included in the ROA calculation only if the shareholder notifies his or her financial advisor about such assets. |
| Letters of intent which allow for breakpoint discounts based on anticipated purchases within a fund family, over a13-month time period. Eligible fund family assets not held at Janney Montgomery Scott may be included in the calculation of letters of intent only if the shareholder notifies his or her financial advisor about such assets. |
| * | Also referred to as an “initial sales charge.” |
34 | Wells Fargo Disciplined U.S. Core Fund
Table of Contents
For more information
More information about Wells Fargo Funds is available free upon request. To obtain literature, please write, visit the Fund’s website, or call:
Wells Fargo Funds
P.O. Box 219967
Kansas City, MO 64121-9967
Website:wfam.com
Individual investors:1-800-222-8222
Retail investment professionals:1-888-877-9275
Institutional investment professionals:1-866-765-0778

This report and the financial statements contained herein are submitted for the general information of the shareholders of the Fund. If this report is used for promotional purposes, distribution of the report must be accompanied or preceded by a current prospectus. Before investing, please consider the investment objectives, risks, charges, and expenses of the investment. For a current prospectus and, if available, a summary prospectus, containing this information, call1-800-222-8222 or visit the Fund’s website atwfam.com. Read the prospectus carefully before you invest or send money.
Wells Fargo Asset Management (WFAM) is the trade name for certain investment advisory/management firms owned by Wells Fargo & Company. These firms include but are not limited to Wells Capital Management Incorporated and Wells Fargo Funds Management, LLC. Certain products managed by WFAM entities are distributed by Wells Fargo Funds Distributor, LLC (a broker-dealer and Member FINRA).
This material is for general informational and educational purposes only and is NOT intended to provide investment advice or a recommendation of any kind—including a recommendation for any specific investment, strategy, or plan.
INVESTMENT PRODUCTS: NOT FDIC INSURED ◾ NO BANK GUARANTEE ◾ MAY LOSE VALUE
© 2020 Wells Fargo & Company. All rights reserved
PAR-0220-03812 03-20
SA203/SAR203 01-20
Table of Contents

Semi-Annual Report
January 31, 2020
Wells Fargo Endeavor Select Fund
Beginning on January 1, 2021, as permitted by new regulations adopted by the Securities and Exchange Commission, paper copies of the Wells Fargo Funds’ annual and semi-annual shareholder reports issued after this date will no longer be sent by mail, unless you specifically request paper copies of the reports. Instead, the reports will be made available on the Funds’ website, and you will be notified by mail each time a report is posted and provided with a website address to access the report.
If you already elected to receive shareholder reports electronically, you will not be affected by this change and you need not take any action. You may elect to receive shareholder reports and other communications from the Fund electronically at any time by contacting your financial intermediary (such as a broker-dealer or bank) or, if you are a direct investor, by calling1-800-222-8222 or by enrolling at wellsfargo.com/advantagedelivery.
You may elect to receive all future reports in paper free of charge. If you invest through a financial intermediary, you can contact your financial intermediary to request that you continue to receive paper copies of your shareholder reports; if you invest directly with the Fund, you can call 1-800-222-8222. Your election to receive reports in paper will apply to all Wells Fargo Funds held in your account with your financial intermediary or, if you are a direct investor, to all Wells Fargo Funds that you hold.
Table of Contents
|
Reduce clutter. Save trees. |
Sign up for electronic delivery of prospectuses and shareholder reports atwellsfargo.com/advantagedelivery |
The views expressed and any forward-looking statements are as of January 31, 2020, unless otherwise noted, and are those of the Fund managers and/or Wells Fargo Asset Management. Discussions of individual securities, or the markets generally, or any Wells Fargo Fund are not intended as individual recommendations. Future events or results may vary significantly from those expressed in any forward-looking statements. The views expressed are subject to change at any time in response to changing circumstances in the market. Wells Fargo Asset Management and the Fund disclaim any obligation to publicly update or revise any views expressed or forward-looking statements.
INVESTMENT PRODUCTS: NOT FDIC INSURED ◾ NO BANK GUARANTEE ◾ MAY LOSE VALUE
Wells Fargo Endeavor Select Fund | 1
Table of Contents
Letter to shareholders (unaudited)

Andrew Owen
President
Wells Fargo Funds
“As the period began, U.S.-China trade tensions continued with no signs of compromise.”
Dear Shareholder:
We are pleased to offer you this semi-annual report for the Wells Fargo Endeavor Select Fund for thesix-month period that ended January 31, 2020. Despite some market volatility, the period was strongly positive for financial markets as supportive central banks more than offset concerns over slowing global economic growth and international trade tensions.
Overall, both fixed-income and equity investors enjoyed healthy annual returns, with U.S. markets leading the way. For the period, U.S. stocks, based on the S&P 500 Index,1 gained 9.31% and international stocks, as measured by the MSCI ACWI ex USA Index (Net),2 returned 5.37%. The MSCI EM Index (Net)3 gained a more modest 3.36%. For bond investors, the Bloomberg Barclays U.S. Aggregate Bond Index4 added 4.20%, the Bloomberg Barclays Global Aggregateex-USD Index5 returned 1.58%, the Bloomberg Barclays Municipal Bond Index6 gained 3.33%, and the ICE BofA U.S. High Yield Index7 added 3.34%.
The period began with uncertainty, leading to central bank support.
In August as the period began, U.S.-China trade tensions continued with no signs of compromise. Evidence of a continued global economic slowdown mounted, and central banks in China, New Zealand, and Thailand cut interest rates. Industrial and manufacturing data declined in China, Canada, Japan, and Germany. Adding to global uncertainty, Italy’s prime minister resigned, many feared a crackdown in Hong Kong as protestors sustained their calls for reform, and Boris Johnson planned to suspend Parliament as Brexit’s deadline neared.
In the U.S., the Federal Reserve (Fed) cut interest rates a second time in the third quarter in September. U.S. manufacturing data disappointed investors. The U.S. Congress announced it would pursue an impeachment investigation of President Trump. Meanwhile, the Brexit impasse showed no signs of resolution. Officials in China said that hitting the country’s economic growth goals for the year would be difficult considering the weight of tariffs and trade restrictions. Although the S&P 500 Index finished the third quarter with the bestyear-to-date returns in more than 20 years, concerns about future returns remained.
The fourth quarter started on a strong note, with U.S.-China trade tensions relaxing in October along with renewed optimism for a U.K. Brexit deal and positive macroeconomic data. The initial estimate of U.S. third-quarter gross domestic product growth was a resilient 1.9% annualized rate, while the U.S. unemployment rate fell to a50-year low of 3.5% in September. However, despite resilience among U.S. consumers, business
| 1 | The S&P 500 Index consists of 500 stocks chosen for market size, liquidity, and industry group representation. It is a market-value-weighted index with each stock’s weight in the index proportionate to its market value. You cannot invest directly in an index. |
| 2 | The Morgan Stanley Capital International (MSCI) All Country World Index (ACWI) ex USA Index (Net) is a free-float-adjusted market-capitalization-weighted index that is designed to measure the equity market performance of developed markets, excluding the United States. Source: MSCI. MSCI makes no express or implied warranties or representations and shall have no liability whatsoever with respect to any MSCI data contained herein. The MSCI data may not be further redistributed or used as a basis for other indices or any securities or financial products. This report is not approved, reviewed, or produced by MSCI. You cannot invest directly in an index. |
| 3 | The MSCI Emerging Markets (EM) Index (Net) is a free-float-adjusted market-capitalization-weighted index that is designed to measure equity market performance of emerging markets. You cannot invest directly in an index. |
| 4 | The Bloomberg Barclays U.S. Aggregate Bond Index is a broad-based benchmark that measures the investment-grade, U.S. dollar-denominated, fixed-rate taxable bond market, including Treasuries, government-related and corporate securities, mortgage-backed securities (agency fixed-rate and hybrid adjustable-rate mortgage pass-throughs), asset-backed securities, and commercial mortgage-backed securities. You cannot invest directly in an index. |
| 5 | The Bloomberg Barclays Global Aggregateex-USD Index is an unmanaged index that provides a broad-based measure of the global investment-grade fixed-income markets excluding the U.S. dollar-denominated debt market. You cannot invest directly in an index. |
| 6 | The Bloomberg Barclays Municipal Bond Index is an unmanaged index composed of long-termtax-exempt bonds with a minimum credit rating of Baa. You cannot invest directly in an index. |
| 7 | The ICE BofA U.S. High Yield Index is a market-capitalization-weighted index of domestic and Yankee high-yield bonds. The index tracks the performance of high-yield securities traded in the U.S. bond market. You cannot invest directly in an index. Copyright 2020. ICE Data Indices, LLC. All rights reserved. |
2 | Wells Fargo Endeavor Select Fund
Table of Contents
Letter to shareholders (unaudited)
confidence declined while manufacturing activity contracted. Concerned with a potential economic slowdown, the Fed lowered interest rates another quarter point in late October, its third rate cut in four months. This helped push the S&P 500 Index to a newall-time high, while emerging market equities rallied and global bonds declined overall, reflecting a broad pickup in risk appetite.
Equity markets continued to rally in November despite ongoing geopolitical risks. Hopes for a U.S.-China trade deal buoyed investor confidence. U.S. business sentiment improved slightly, and manufacturing and services activity picked up. Throughout the month, central bank actions were on hold. With that positive backdrop, developed market equities outpaced those in emerging markets, and U.S. stocks, as reflected by the S&P 500 Index, outperformednon-U.S. stocks overall. While consumer confidence and purchasing manager activity rose in the eurozone, China reported weakening manufacturing and consumer data. Bond yields rose marginally, leading to slightly negative returns for global government and investment-grade corporate bonds.
Financial markets ended 2019 on a broadly positive note, with the U.S. and China reaching an accord on a Phase One trade deal, with some details to be worked out. That, along with the landslide win by thepro-Brexit U.K. Conservative Party in a national election and ongoing central bank support, gave investors greater certainty and confidence. U.S. economic indicators were generally positive, with the exception of manufacturing activity and business confidence. However, consumer confidence was resilient, fed by a robust labor market, tame inflation, and lower interest rates, which boosted housing affordability and stimulated homebuyer activity. The impeachment of U.S. President Donald Trump, while historically noteworthy, had little impact on markets. Meanwhile, slowing Chinese economic activity, partly attributable to the trade war, led to further government stimulus atyear-end through lower reserve ratios, allowing banks to lend more money.
Theyear-end rally continued in early January 2020. However, capital market volatility picked up in late January on concerns over the unknown impact of the coronavirus on the global economy and stock markets. With sentiment somewhat souring, perceived safe havens did well in January. The U.S. dollar and Japanese yen both rose and government bonds outperformed equities. While the S&P 500 Index held its ground, emerging market equities tumbled, including those in Asia that are most exposed to viruses—physical or economic—originating in China.
Following the end of the reporting period, the coronavirus continued its global spread, resulting in disruptions to global markets, including through border closings, restrictions on travel and large gatherings, expedited and enhanced health screenings, quarantines, cancellations, business and school closings, disruptions to employment and supply chains, reduced productivity, and reduced customer and client activity in multiple markets and sectors. The risk of further spreading of the coronavirus has led to significant uncertainty and volatility in the financial markets. The full extent of the coronavirus’s impact on the global economy cannot necessarily be foreseen and the impacts may be short term or may last for an extended period of time.
Don’t let short-term uncertainty derail long-term investment goals.
Periods of investment uncertainty can present challenges, but experience has taught us that maintaining long-term investment goals can be an effective way to plan for the future. To help you create a sound strategy based on your personal goals and risk tolerance, Wells Fargo Funds offers more than 100 mutual funds spanning a wide range of asset classes and investment styles. Although diversification cannot guarantee an investment profit or prevent losses, we believe it can be an effective way to manage investment risk and potentially smooth out overall portfolio performance. We encourage investors to know
“Financial markets ended 2019 on a broadly positive note, with the U.S. and China reaching an accord on a Phase One trade deal.”
|
For further information about your Fund, contact your investment professional, visit our website at wfam.com, or call us directly at1-800-222-8222. |
Wells Fargo Endeavor Select Fund | 3
Table of Contents
Letter to shareholders (unaudited)
their investments and to understand that appropriate levels of risk-taking may unlock opportunities.
Thank you for choosing to invest with Wells Fargo Funds. We appreciate your confidence in us and remain committed to helping you meet your financial needs.
Sincerely,

Andrew Owen
President
Wells Fargo Funds
4 | Wells Fargo Endeavor Select Fund
Table of Contents
Performance highlights (unaudited)
Investment objective
The Fund seeks long-term capital appreciation.
Manager
Wells Fargo Funds Management, LLC
Subadviser
Wells Capital Management Incorporated
Portfolio managers
Michael T. Smith, CFA®‡
Christopher J. Warner, CFA®‡
Average annual total returns (%) as of January 31, 2020
| Including sales charge | Excluding sales charge | Expense ratios1 (%) | ||||||||||||||||||||||||||||||||
| Inception date | 1 year | 5 year | 10 year | 1 year | 5 year | 10 year | Gross | Net2 | ||||||||||||||||||||||||||
| Class A (STAEX) | 12-29-2000 | 23.22 | 14.50 | 14.67 | 30.74 | 15.87 | 15.35 | 1.30 | 1.03 | |||||||||||||||||||||||||
| Class C (WECCX) | 12-29-2000 | 28.41 | 14.96 | 14.46 | 29.41 | 14.96 | 14.46 | 2.05 | 1.78 | |||||||||||||||||||||||||
| Class R6 (WECRX)3 | 9-20-2019 | – | – | – | 31.14 | 16.33 | 15.83 | 0.87 | 0.60 | |||||||||||||||||||||||||
| Administrator Class (WECDX) | 4-8-2005 | – | – | – | 30.70 | 16.09 | 15.60 | 1.22 | 0.94 | |||||||||||||||||||||||||
| Institutional Class (WFCIX) | 4-8-2005 | – | – | – | 31.01 | 16.31 | 15.82 | 0.97 | 0.70 | |||||||||||||||||||||||||
| Russell 1000® Growth Index4 | – | – | – | – | 27.94 | 15.49 | 15.99 | – | – | |||||||||||||||||||||||||
Figures quoted represent past performance, which is no guarantee of future results, and do not reflect taxes that shareholder may pay on an investment in a fund. Investment return and principal value of an investment will fluctuate so that an investor’s shares, when redeemed, may be worth more or less than their original cost. Performance shown without sales charges would be lower if sales charges were reflected. Current performance may be lower or higher than the performance data quoted, which assumes the reinvestment of dividends and capital gains. Currentmonth-end performance is available on the Fund’s website,wfam.com.
Please keep in mind that high double-digit returns were primarily achieved during favorable market conditions. You should not expect that such favorable returns can be consistently achieved. A fund’s performance, especially for short time periods, should not be the sole factor in making your investment decision.
Index returns do not include transaction costs associated with buying and selling securities, any mutual fund fees or expenses, or any taxes. It is not possible to invest directly in an index.
For Class A shares, the maximumfront-end sales charge is 5.75%. For Class C shares, the maximum contingent deferred sales charge is 1.00%. Performance including a contingent deferred sales charge assumes the sales charge for the corresponding time period. Class R6, Administrator Class, and Institutional Class shares are sold without afront-end sales charge or contingent deferred sales charge.
Stock values fluctuate in response to the activities of individual companies and general market and economic conditions. Certain investment strategies tend to increase the total risk of an investment (relative to the broader market). The Fund is exposed to foreign investment risk, focused portfolio risk, and smaller-company securities risk. Consult the Fund’s prospectus for additional information on these and other risks.
Please see footnotes on page 6.
Wells Fargo Endeavor Select Fund | 5
Table of Contents
Performance highlights (unaudited)
| Ten largest holdings (%) as of January 31, 20205 | ||||
Microsoft Corporation | 10.25 | |||
Amazon.com Incorporated | 6.21 | |||
Alphabet Incorporated Class A | 6.01 | |||
Visa Incorporated Class A | 4.89 | |||
UnitedHealth Group Incorporated | 3.86 | |||
ServiceNow Incorporated | 3.03 | |||
The Home Depot Incorporated | 2.98 | |||
Global Payments Incorporated | 2.95 | |||
Waste Connections Incorporated | 2.91 | |||
Union Pacific Corporation | 2.83 | |||
| Sector distribution as of January 31, 20206 |
|
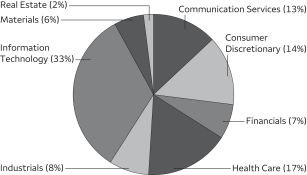
| ‡ | CFA® and Chartered Financial Analyst®are trademarks owned by CFA Institute. |
| 1 | Reflects the expense ratios as stated in the most recent prospectuses. The expense ratios shown are subject to change and may differ from the annualized expense ratios shown in the financial highlights of this report. |
| 2 | The manager has contractually committed through November 30, 2021, to waive fees and/or reimburse expenses to the extent necessary to cap total annual fund operating expenses after fee waivers at 1.03% for Class A, 1.78% for Class C, 0.60% for Class R6, 0.94% for Administrator Class, and 0.70% for Institutional Class. Brokerage commissions, stamp duty fees, interest, taxes, acquired fund fees and expenses (if any), and extraordinary expenses are excluded from the expense cap. Prior to or after the commitment expiration date, the cap may be increased or the commitment to maintain the cap may be terminated only with the approval of the Board of Trustees. Without this cap, the Fund’s returns would have been lower. The expense ratio paid by an investor is the net expense ratio (the total annual fund operating expenses after fee waivers) as stated in the prospectuses. |
| 3 | Historical performance shown for the Class R6 shares prior to their inception reflects the performance of the Institutional Class shares, and includes the higher expenses applicable to the Institutional Class shares. If these expenses had not been included, returns for the Class R6 shares would be higher. |
| 4 | The Russell 1000® Growth Index measures the performance of those Russell 1000 companies with higher price/book ratios and higher forecasted growth values. You cannot invest directly in an index. |
| 5 | The ten largest holdings, excluding cash, cash equivalents and any money market funds, are calculated based on the value of the investments divided by total net assets of the Fund. Holdings are subject to change and may have changed since the date specified. |
| 6 | Amounts are calculated based on the total long-term investments of the Fund. These amounts are subject to change and may have changed since the date specified. |
6 | Wells Fargo Endeavor Select Fund
Table of Contents
As a shareholder of the Fund, you incur two types of costs: (1) transaction costs, including sales charges (loads) on purchase payments and contingent deferred sales charges (if any) on redemptions and (2) ongoing costs, including management fees, distribution(12b-1) and/or shareholder servicing fees, and other Fund expenses. This example is intended to help you understand your ongoing costs (in dollars) of investing in the Fund and to compare these costs with the ongoing costs of investing in other mutual funds.
The example is based on an investment of $1,000 invested at the beginning of thesix-month period and held for the entire period from August 1, 2019 to January 31, 2020.
Actual expenses
The “Actual” line of the table below provides information about actual account values and actual expenses. You may use the information in this line, together with the amount you invested, to estimate the expenses that you paid over the period. Simply divide your account value by $1,000 (for example, an $8,600 account value divided by $1,000 = 8.6), then multiply the result by the number in the “Actual” line under the heading entitled “Expenses paid during period” for your applicable class of shares to estimate the expenses you paid on your account during this period.
Hypothetical example for comparison purposes
The “Hypothetical” line of the table below provides information about hypothetical account values and hypothetical expenses based on the Fund’s actual expense ratio and an assumed rate of return of 5% per year before expenses, which is not the Fund’s actual return. The hypothetical account values and expenses may not be used to estimate the actual ending account balance or expenses you paid for the period. You may use this information to compare the ongoing costs of investing in the Fund and other funds. To do so, compare this 5% hypothetical example with the 5% hypothetical examples that appear in the shareholder reports of the other funds.
Please note that the expenses shown in the table are meant to highlight your ongoing costs only and do not reflect any transactional costs, such as sales charges (loads) and contingent deferred sales charges. Therefore, the “Hypothetical” line of the table is useful in comparing ongoing costs only and will not help you determine the relative total costs of owning different funds. In addition, if these transactional costs were included, your costs would have been higher.
| Beginning account value 8-1-2019 | Ending account value 1-31-2020 | Expenses paid during | Annualized net expense ratio | |||||||||||||
Class A | ||||||||||||||||
Actual | $ | 1,000.00 | $ | 1,106.46 | $ | 5.35 | 1.01 | % | ||||||||
Hypothetical (5% return before expenses) | $ | 1,000.00 | $ | 1,020.06 | $ | 5.13 | 1.01 | % | ||||||||
Class C | ||||||||||||||||
Actual | $ | 1,000.00 | $ | 1,099.76 | $ | 9.55 | 1.81 | % | ||||||||
Hypothetical (5% return before expenses) | $ | 1,000.00 | $ | 1,016.04 | $ | 9.17 | 1.81 | % | ||||||||
Class R6 | ||||||||||||||||
Actual | $ | 1,000.00 | $ | 1,108.20 | $ | 3.18 | 0.60 | % | ||||||||
Hypothetical (5% return before expenses) | $ | 1,000.00 | $ | 1,022.12 | $ | 3.05 | 0.60 | % | ||||||||
Administrator Class | ||||||||||||||||
Actual | $ | 1,000.00 | $ | 1,105.61 | $ | 5.03 | 0.95 | % | ||||||||
Hypothetical (5% return before expenses) | $ | 1,000.00 | $ | 1,020.36 | $ | 4.82 | 0.95 | % | ||||||||
Institutional Class | ||||||||||||||||
Actual | $ | 1,000.00 | $ | 1,107.09 | $ | 3.92 | 0.74 | % | ||||||||
Hypothetical (5% return before expenses) | $ | 1,000.00 | $ | 1,021.42 | $ | 3.76 | 0.74 | % | ||||||||
| 1 | Expenses paid is equal to the annualized net expense ratio of each class multiplied by the average account value over the period, multiplied by the number of days in the most recent fiscal half-year divided by the number of days in the fiscal year (to reflect theone-half-year period). |
Wells Fargo Endeavor Select Fund | 7
Table of Contents
Portfolio of investments—January 31, 2020 (unaudited)
| Shares | Value | |||||||||||||||
| Common Stocks: 97.20% | ||||||||||||||||
Communication Services: 12.35% | ||||||||||||||||
| Entertainment: 2.75% | ||||||||||||||||
Netflix Incorporated † | 10,800 | $ | 3,726,972 | |||||||||||||
Nintendo Company Limited ADR | 65,250 | 2,994,975 | ||||||||||||||
| 6,721,947 | ||||||||||||||||
|
| |||||||||||||||
| Interactive Media & Services: 9.60% | ||||||||||||||||
Alphabet Incorporated Class A † | 10,257 | 14,696,024 | ||||||||||||||
Alphabet Incorporated Class C † | 1,250 | 1,792,788 | ||||||||||||||
IAC Corporation † | 16,100 | 3,921,799 | ||||||||||||||
Tencent Holdings Limited ADR | 63,950 | 3,063,845 | ||||||||||||||
| 23,474,456 | ||||||||||||||||
|
| |||||||||||||||
Consumer Discretionary: 13.68% | ||||||||||||||||
| Auto Components: 1.33% | ||||||||||||||||
Aptiv plc | 38,350 | 3,251,697 | ||||||||||||||
|
| |||||||||||||||
| Automobiles: 1.52% | ||||||||||||||||
Ferrari NV | 22,000 | 3,714,040 | ||||||||||||||
|
| |||||||||||||||
| Internet & Direct Marketing Retail: 7.85% | ||||||||||||||||
Amazon.com Incorporated † | 7,558 | 15,181,906 | ||||||||||||||
MercadoLibre Incorporated † | 6,050 | 4,011,150 | ||||||||||||||
| 19,193,056 | ||||||||||||||||
|
| |||||||||||||||
| Specialty Retail: 2.98% | ||||||||||||||||
The Home Depot Incorporated | 31,916 | 7,280,040 | ||||||||||||||
|
| |||||||||||||||
Financials: 6.74% | ||||||||||||||||
| Capital Markets: 6.74% | ||||||||||||||||
Intercontinental Exchange Incorporated | 66,490 | 6,631,713 | ||||||||||||||
Raymond James Financial Incorporated | 41,800 | 3,821,774 | ||||||||||||||
S&P Global Incorporated | 20,541 | 6,033,508 | ||||||||||||||
| 16,486,995 | ||||||||||||||||
|
| |||||||||||||||
Health Care: 16.14% | ||||||||||||||||
| Health Care Equipment & Supplies: 9.61% | ||||||||||||||||
Alcon Incorporated † | 72,450 | 4,270,203 | ||||||||||||||
Boston Scientific Corporation † | 139,000 | 5,819,930 | ||||||||||||||
DexCom Incorporated † | 19,550 | 4,706,663 | ||||||||||||||
Edwards Lifesciences Corporation † | 17,250 | 3,792,584 | ||||||||||||||
Intuitive Surgical Incorporated † | 8,750 | 4,898,074 | ||||||||||||||
| 23,487,454 | ||||||||||||||||
|
| |||||||||||||||
| Health Care Providers & Services: 3.86% | ||||||||||||||||
UnitedHealth Group Incorporated | 34,647 | 9,439,575 | ||||||||||||||
|
| |||||||||||||||
| Pharmaceuticals: 2.67% | ||||||||||||||||
Merck & Company Incorporated | 76,450 | 6,531,888 | ||||||||||||||
|
| |||||||||||||||
The accompanying notes are an integral part of these financial statements.
8 | Wells Fargo Endeavor Select Fund
Table of Contents
Portfolio of investments—January 31, 2020 (unaudited)
| Shares | Value | |||||||||||||||
Industrials: 8.03% | ||||||||||||||||
| Commercial Services & Supplies: 5.20% | ||||||||||||||||
Cintas Corporation | 20,100 | $ | 5,607,297 | |||||||||||||
Waste Connections Incorporated | 73,840 | 7,111,530 | ||||||||||||||
| 12,718,827 | ||||||||||||||||
|
| |||||||||||||||
| Road & Rail: 2.83% | ||||||||||||||||
Union Pacific Corporation | 38,500 | 6,907,670 | ||||||||||||||
|
| |||||||||||||||
Information Technology: 32.34% | ||||||||||||||||
| Communications Equipment: 2.50% | ||||||||||||||||
Motorola Solutions Incorporated | 34,600 | 6,124,200 | ||||||||||||||
|
| |||||||||||||||
| IT Services: 14.53% | ||||||||||||||||
Fiserv Incorporated † | 50,694 | 6,012,815 | ||||||||||||||
FleetCor Technologies Incorporated † | 12,600 | 3,971,898 | ||||||||||||||
Global Payments Incorporated | 36,943 | 7,220,509 | ||||||||||||||
PayPal Holdings Incorporated † | 55,700 | 6,343,673 | ||||||||||||||
Visa Incorporated Class A | 60,128 | 11,963,668 | ||||||||||||||
| 35,512,563 | ||||||||||||||||
|
| |||||||||||||||
| Software: 15.31% | ||||||||||||||||
Autodesk Incorporated † | 25,300 | 4,980,305 | ||||||||||||||
Microsoft Corporation | 147,181 | 25,054,622 | ||||||||||||||
ServiceNow Incorporated † | 21,880 | 7,400,472 | ||||||||||||||
| 37,435,399 | ||||||||||||||||
|
| |||||||||||||||
Materials: 6.26% | ||||||||||||||||
| Chemicals: 4.70% | ||||||||||||||||
Air Products & Chemicals Incorporated | 22,100 | 5,275,491 | ||||||||||||||
The Sherwin-Williams Company | 11,150 | 6,210,439 | ||||||||||||||
| 11,485,930 | ||||||||||||||||
|
| |||||||||||||||
| Construction Materials: 1.56% | ||||||||||||||||
Vulcan Materials Company | 26,900 | 3,809,847 | ||||||||||||||
|
| |||||||||||||||
Real Estate: 1.66% | ||||||||||||||||
| Equity REITs: 1.66% | ||||||||||||||||
SBA Communications Corporation | 16,300 | 4,067,828 | ||||||||||||||
|
| |||||||||||||||
Total Common Stocks (Cost $117,908,448) | 237,643,412 | |||||||||||||||
|
| |||||||||||||||
| Yield | ||||||||||||||||
| Short-Term Investments: 2.96% | ||||||||||||||||
| Investment Companies: 2.96% | ||||||||||||||||
Wells Fargo Government Money Market Fund Select Class (l)(u) | 1.51 | % | 7,239,663 | 7,239,663 | ||||||||||||
|
| |||||||||||||||
Total Short-Term Investments (Cost $7,239,663) | 7,239,663 | |||||||||||||||
|
| |||||||||||||||
| Total investments in securities (Cost $125,148,111) | 100.16 | % | 244,883,075 | |||||
Other assets and liabilities, net | (0.16 | ) | (388,189 | ) | ||||
|
|
|
| |||||
| Total net assets | 100.00 | % | $ | 244,494,886 | ||||
|
|
|
| |||||
The accompanying notes are an integral part of these financial statements.
Wells Fargo Endeavor Select Fund | 9
Table of Contents
Portfolio of investments—January 31, 2020 (unaudited)
| † | Non-income-earning security |
| (l) | The issuer of the security is an affiliated person of the Fund as defined in the Investment Company Act of 1940. |
| (u) | The rate represents the7-day annualized yield at period end. |
Abbreviations:
| ADR | American depositary receipt |
| REIT | Real estate investment trust |
Investments in Affiliates
An affiliated investment is an investment in which the Fund owns at least 5% of the outstanding voting shares of the issuer or as a result of other relationships, such as the Fund and the issuer having the same investment manager. Transactions with issuers that were either affiliated persons of the Fund at the beginning of the period or the end of the period were as follows:
| Shares, beginning of period | Shares purchased | Shares sold | Shares, end of period | Net realized gains (losses) | Net change in unrealized gains (losses) | Income from affiliated securities | Value, end of period | % of net assets | ||||||||||||||||||||||||||||
| Short-Term Investments | ||||||||||||||||||||||||||||||||||||
Investment Companies | ||||||||||||||||||||||||||||||||||||
Securities Lending Cash Investments LLC * | 0 | 23,449,037 | (23,449,037 | ) | 0 | $ | 251 | $ | 0 | $ | 11,766 | # | $ | 0 | ||||||||||||||||||||||
Wells Fargo Government Money Market Fund Select Class | 4,314,739 | 31,806,357 | (28,881,433 | ) | 7,239,663 | 0 | 0 | 39,283 | 7,239,663 | |||||||||||||||||||||||||||
|
|
|
|
|
|
|
|
|
| |||||||||||||||||||||||||||
| $ | 251 | $ | 0 | $ | 51,049 | $ | 7,239,663 | 2.96 | % | |||||||||||||||||||||||||||
|
|
|
|
|
|
|
|
|
| |||||||||||||||||||||||||||
| * | No longer held at the end of the period. |
| # | Amount shown represents income before fees and rebates. |
The accompanying notes are an integral part of these financial statements.
10 | Wells Fargo Endeavor Select Fund
Table of Contents
Statement of assets and liabilities—January 31, 2020 (unaudited)
Assets | ||||
Investments in unaffiliated securities, at value (cost $117,908,448) | $ | 237,643,412 | ||
Investments in affiliated securities, at value (cost $7,239,663) | 7,239,663 | |||
Receivable for Fund shares sold | 432,408 | |||
Receivable for dividends | 40,401 | |||
Prepaid expenses and other assets | 168,349 | |||
|
| |||
Total assets | 245,524,233 | |||
|
| |||
Liabilities | ||||
Payable for investments purchased | 559,332 | |||
Payable for Fund shares redeemed | 263,052 | |||
Overdraft due to custodian bank | 506 | |||
Management fee payable | 108,315 | |||
Administration fees payable | 32,017 | |||
Distribution fee payable | 2,584 | |||
Trustees’ fees and expenses payable | 11,112 | |||
Accrued expenses and other liabilities | 52,429 | |||
|
| |||
Total liabilities | 1,029,347 | |||
|
| |||
Total net assets | $ | 244,494,886 | ||
|
| |||
Net assets consist of | ||||
Paid-in capital | $ | 120,425,612 | ||
Total distributable earnings | 124,069,274 | |||
|
| |||
Total net assets | $ | 244,494,886 | ||
|
| |||
Computation of net asset value and offering price per share | ||||
Net assets – Class A | $ | 107,422,632 | ||
Shares outstanding – Class A1 | 12,780,241 | |||
Net asset value per share – Class A | $8.41 | |||
Maximum offering price per share – Class A2 | $8.92 | |||
Net assets – Class C | $ | 3,945,605 | ||
Shares outstanding – Class C1 | 868,431 | |||
Net asset value per share – Class C | $4.54 | |||
Net assets – Class R6 | $ | 49,780,945 | ||
Shares outstanding – Class R61 | 5,019,019 | |||
Net asset value per share – Class R6 | $9.92 | |||
Net assets – Administrator Class | $ | 8,127,085 | ||
Shares outstanding – Administrator Class1 | 872,586 | |||
Net asset value per share – Administrator Class | $9.31 | |||
Net assets – Institutional Class | $ | 75,218,619 | ||
Shares outstanding – Institutional Class1 | 7,589,233 | |||
Net asset value per share – Institutional Class | $9.91 | |||
| 1 | The Fund has an unlimited number of authorized shares. |
| 2 | Maximum offering price is computed as 100/94.25 of net asset value. On investments of $50,000 or more, the offering price is reduced. |
The accompanying notes are an integral part of these financial statements.
Wells Fargo Endeavor Select Fund | 11
Table of Contents
Statement of operations—six months ended January 31, 2020 (unaudited)
Investment income | ||||
Dividends (net of foreign withholding taxes of $11,074) | $ | 727,209 | ||
Income from affiliated securities | 41,482 | |||
|
| |||
Total investment income | 768,691 | |||
|
| |||
Expenses | ||||
Management fee | 726,380 | |||
Administration fees | ||||
Class A | 84,174 | |||
Class C | 3,715 | |||
Class R6 | 5,213 | ¹ | ||
Administrator Class | 4,019 | |||
Institutional Class | 52,768 | |||
Shareholder servicing fees | ||||
Class A | 100,207 | |||
Class C | 4,423 | |||
Administrator Class | 7,728 | |||
Distribution fee | ||||
Class C | 13,187 | |||
Custody and accounting fees | 7,085 | |||
Professional fees | 23,142 | |||
Registration fees | 30,575 | |||
Shareholder report expenses | 17,836 | |||
Trustees’ fees and expenses | 11,522 | |||
Other fees and expenses | 6,317 | |||
|
| |||
Total expenses | 1,098,291 | |||
Less: Fee waivers and/or expense reimbursements | ||||
Fund-level | (225,438 | ) | ||
|
| |||
Net expenses | 872,853 | |||
|
| |||
Net investment loss | (104,162 | ) | ||
|
| |||
Realized and unrealized gains (losses) on investments | ||||
Net realized gains on | ||||
Unaffiliated securities | 8,466,153 | |||
Affiliated securities | 251 | |||
|
| |||
Net realized gains on investments | 8,466,404 | |||
Net change in unrealized gains (losses) on investments | 16,081,391 | |||
|
| |||
Net realized and unrealized gains (losses) on investments | 24,547,795 | |||
|
| |||
Net increase in net assets resulting from operations | $ | 24,443,633 | ||
|
| |||
| ¹ | For the period from September 20, 2019 (commencement of class operations) to January 31, 2020 |
The accompanying notes are an integral part of these financial statements.
12 | Wells Fargo Endeavor Select Fund
Table of Contents
Statement of changes in net assets
Six months ended (unaudited) | Year ended July 31, 2019 | |||||||||||||||
Operations | ||||||||||||||||
Net investment loss | $ | (104,162 | ) | $ | (39,219 | ) | ||||||||||
Net realized gains on investments | 8,466,404 | 21,279,816 | ||||||||||||||
Net change in unrealized gains (losses) on investments | 16,081,391 | (3,421,390 | ) | |||||||||||||
|
| |||||||||||||||
Net increase in net assets resulting from operations | 24,443,633 | 17,819,207 | ||||||||||||||
|
| |||||||||||||||
Distributions to shareholders from net investment income and net realized gains | ||||||||||||||||
Class A | (9,193,804 | ) | (3,430,850 | ) | ||||||||||||
Class C | (639,884 | ) | (1,168,306 | ) | ||||||||||||
Class R6 | (3,817,296 | )¹ | N/A | |||||||||||||
Administrator Class | (594,711 | ) | (567,258 | ) | ||||||||||||
Institutional Class | (5,072,891 | ) | (23,115,770 | ) | ||||||||||||
|
| |||||||||||||||
Total distributions to shareholders | (19,318,586 | ) | (28,282,184 | ) | ||||||||||||
|
| |||||||||||||||
Capital share transactions | Shares | Shares | ||||||||||||||
Proceeds from shares sold | ||||||||||||||||
Class A | 942,408 | 7,867,167 | 695,352 | 5,403,334 | ||||||||||||
Class C | 145,959 | 675,963 | 135,403 | 567,944 | ||||||||||||
Class R6 | 5,124,083 | ¹ | 49,146,447 | ¹ | N/A | N/A | ||||||||||
Administrator Class | 78,959 | 732,219 | 17,483 | 134,106 | ||||||||||||
Institutional Class | 2,259,074 | 21,803,460 | 927,530 | 8,358,983 | ||||||||||||
|
| |||||||||||||||
| 80,225,256 | 14,464,367 | |||||||||||||||
|
| |||||||||||||||
Reinvestment of distributions | ||||||||||||||||
Class A | 1,136,944 | 8,970,487 | 460,780 | 3,073,403 | ||||||||||||
Class C | 145,449 | 621,069 | 298,729 | 1,168,031 | ||||||||||||
Class R6 | 410,012 | ¹ | 3,813,107 | ¹ | N/A | N/A | ||||||||||
Administrator Class | 67,574 | 590,592 | 77,420 | 566,717 | ||||||||||||
Institutional Class | 543,524 | 5,054,778 | 2,976,014 | 23,004,592 | ||||||||||||
|
| |||||||||||||||
| 19,050,033 | 27,812,743 | |||||||||||||||
|
| |||||||||||||||
Payment for shares redeemed | ||||||||||||||||
Class A | (1,377,045 | ) | (11,351,918 | ) | (731,194 | ) | (5,639,781 | ) | ||||||||
Class C | (265,559 | ) | (1,188,926 | ) | (585,440 | ) | (2,522,025 | ) | ||||||||
Class R6 | (770,459 | )¹ | (7,583,017 | )¹ | N/A | N/A | ||||||||||
Administrator Class | (96,942 | ) | (891,161 | ) | (114,882 | ) | (964,193 | ) | ||||||||
Institutional Class | (7,534,310 | ) | (72,317,278 | ) | (5,242,746 | ) | (47,188,366 | ) | ||||||||
|
| |||||||||||||||
| (93,332,300 | ) | (56,314,365 | ) | |||||||||||||
|
| |||||||||||||||
Net asset value of shares issued in acquisition | ||||||||||||||||
Class A | 9,924,795 | 82,227,900 | 0 | 0 | ||||||||||||
Class C | 406,964 | 1,963,250 | 0 | 0 | ||||||||||||
Class R6 | 255,383¹ | 2,459,686¹ | N/A | N/A | ||||||||||||
Administrator Class | 539,878 | 4,913,234 | 0 | 0 | ||||||||||||
Institutional Class | 1,198,969 | 11,547,626 | 0 | 0 | ||||||||||||
|
| |||||||||||||||
| 103,111,696 | 0 | |||||||||||||||
|
| |||||||||||||||
Net increase (decrease) in net assets resulting from capital share transactions | 109,054,685 | (14,037,255 | ) | |||||||||||||
|
| |||||||||||||||
Total increase (decrease) in net assets | 114,179,732 | (24,500,232 | ) | |||||||||||||
|
| |||||||||||||||
Net assets | ||||||||||||||||
Beginning of period | 130,315,154 | 154,815,386 | ||||||||||||||
|
| |||||||||||||||
End of period | $ | 244,494,886 | $ | 130,315,154 | ||||||||||||
|
| |||||||||||||||
| ¹ | For the period from September 20, 2019 (commencement of class operations) to January 31, 2020 |
The accompanying notes are an integral part of these financial statements.
Wells Fargo Endeavor Select Fund | 13
Table of Contents
(For a share outstanding throughout each period)
| Six months ended January 31, 2020 (unaudited) | Year ended July 31 | |||||||||||||||||||||||
| CLASS A | 2019 | 2018 | 2017 | 2016 | 2015 | |||||||||||||||||||
Net asset value, beginning of period | $8.33 | $9.43 | $9.09 | $8.96 | $13.74 | $14.13 | ||||||||||||||||||
Net investment loss | (0.01 | )1 | (0.03 | )1 | (0.04 | )1 | (0.03 | )1 | (0.04 | )1 | (0.08 | )1 | ||||||||||||
Net realized and unrealized gains (losses) on investments | 0.85 | 0.97 | 2.23 | 1.49 | (0.14 | ) | 1.65 | |||||||||||||||||
|
|
|
|
|
|
|
|
|
|
|
| |||||||||||||
Total from investment operations | 0.84 | 0.94 | 2.19 | 1.46 | (0.18 | ) | 1.57 | |||||||||||||||||
Distributions to shareholders from | ||||||||||||||||||||||||
Net realized gains | (0.76 | ) | (2.04 | ) | (1.85 | ) | (1.33 | ) | (4.60 | ) | (1.96 | ) | ||||||||||||
Net asset value, end of period | $8.41 | $8.33 | $9.43 | $9.09 | $8.96 | $13.74 | ||||||||||||||||||
Total return2 | 10.65 | % | 15.37 | % | 27.35 | % | 19.39 | % | (0.07 | )% | 12.14 | % | ||||||||||||
Ratios to average net assets (annualized) | ||||||||||||||||||||||||
Gross expenses | 1.25 | % | 1.30 | % | 1.25 | % | 1.22 | % | 1.28 | % | 1.24 | % | ||||||||||||
Net expenses | 1.01 | % | 1.20 | % | 1.20 | % | 1.20 | % | 1.20 | % | 1.23 | % | ||||||||||||
Net investment loss | (0.32 | )% | (0.35 | )% | (0.49 | )% | (0.33 | )% | (0.36 | )% | (0.55 | )% | ||||||||||||
Supplemental data | ||||||||||||||||||||||||
Portfolio turnover rate | 6 | % | 20 | % | 36 | % | 59 | % | 79 | % | 126 | % | ||||||||||||
Net assets, end of period (000s omitted) | $107,423 | $17,940 | $16,301 | $12,953 | $18,498 | $26,197 | ||||||||||||||||||
| 1 | Calculated based upon average shares outstanding |
| 2 | Total return calculations do not include any sales charges. Returns for periods of less than one year are not annualized. |
The accompanying notes are an integral part of these financial statements.
14 | Wells Fargo Endeavor Select Fund
Table of Contents
Financial highlights
(For a share outstanding throughout each period)
| Six months ended January 31, 2020 (unaudited) | Year ended July 31 | |||||||||||||||||||||||
| CLASS C | 2019 | 2018 | 2017 | 2016 | 2015 | |||||||||||||||||||
Net asset value, beginning of period | $4.86 | $6.46 | $6.80 | $7.09 | $11.93 | $12.61 | ||||||||||||||||||
Net investment loss | (0.03 | )1 | (0.06 | )1 | (0.08 | )1 | (0.07 | )1 | (0.09 | )1 | (0.16 | )1 | ||||||||||||
Net realized and unrealized gains (losses) on investments | 0.47 | 0.50 | 1.59 | 1.11 | (0.15 | ) | 1.44 | |||||||||||||||||
|
|
|
|
|
|
|
|
|
|
|
| |||||||||||||
Total from investment operations | 0.44 | 0.44 | 1.51 | 1.04 | (0.24 | ) | 1.28 | |||||||||||||||||
Distributions to shareholders from | ||||||||||||||||||||||||
Net realized gains | (0.76 | ) | (2.04 | ) | (1.85 | ) | (1.33 | ) | (4.60 | ) | (1.96 | ) | ||||||||||||
Net asset value, end of period | $4.54 | $4.86 | $6.46 | $6.80 | $7.09 | $11.93 | ||||||||||||||||||
Total return2 | 9.98 | % | 14.51 | % | 26.43 | % | 18.46 | % | (0.76 | )% | 11.21 | % | ||||||||||||
Ratios to average net assets (annualized) | ||||||||||||||||||||||||
Gross expenses | 2.00 | % | 2.05 | % | 2.00 | % | 1.97 | % | 2.03 | % | 1.99 | % | ||||||||||||
Net expenses | 1.81 | % | 1.95 | % | 1.95 | % | 1.95 | % | 1.95 | % | 1.99 | % | ||||||||||||
Net investment loss | (1.05 | )% | (1.12 | )% | (1.22 | )% | (1.08 | )% | (1.11 | )% | (1.32 | )% | ||||||||||||
Supplemental data | ||||||||||||||||||||||||
Portfolio turnover rate | 6 | % | 20 | % | 36 | % | 59 | % | 79 | % | 126 | % | ||||||||||||
Net assets, end of period (000s omitted) | $3,946 | $2,116 | $3,792 | $3,676 | $4,845 | $6,914 | ||||||||||||||||||
| 1 | Calculated based upon average shares outstanding |
| 2 | Total return calculations do not include any sales charges. Returns for periods of less than one year are not annualized. |
The accompanying notes are an integral part of these financial statements.
Wells Fargo Endeavor Select Fund | 15
Table of Contents
Financial highlights
(For a share outstanding throughout the period)
| Six months ended January 31, 20201 (unaudited) | ||||
| CLASS R6 | ||||
Net asset value, beginning of period | $9.63 | |||
Net investment income | 0.00 | 2,3 | ||
Net realized and unrealized gains (losses) on investments | 1.05 | |||
|
| |||
Total from investment operations | 1.05 | |||
Distributions to shareholders from | ||||
Net realized gains | (0.76 | ) | ||
Net asset value, end of period | $9.92 | |||
Total return4 | 11.40 | % | ||
Ratios to average net assets (annualized) | ||||
Gross expenses | 0.81 | % | ||
Net expenses | 0.60 | % | ||
Net investment income | 0.07 | % | ||
Supplemental data | ||||
Portfolio turnover rate | 6 | % | ||
Net assets, end of period (000s omitted) | $49,781 | |||
| 1 | For the period from September 20, 2019 (commencement of class operations) to January 31, 2020 |
| 2 | Calculated based upon average shares outstanding |
| 3 | Amount is less than $0.005. |
| 4 | Returns for periods of less than one year are not annualized. |
The accompanying notes are an integral part of these financial statements.
16 | Wells Fargo Endeavor Select Fund
Table of Contents
Financial highlights
(For a share outstanding throughout each period)
| Six months ended January 31, 2020 (unaudited) | Year ended July 31 | |||||||||||||||||||||||
| ADMINISTRATOR CLASS | 2019 | 2018 | 2017 | 2016 | 2015 | |||||||||||||||||||
Net asset value, beginning of period | $9.15 | $10.12 | $9.62 | $9.38 | $14.13 | $14.45 | ||||||||||||||||||
Net investment income (loss) | (0.01 | )1 | (0.01 | )1 | (0.03 | )1 | (0.01 | )1 | 0.01 | 1 | (0.05 | )1 | ||||||||||||
Net realized and unrealized gains (losses) on investments | 0.93 | 1.08 | 2.38 | 1.58 | (0.16 | ) | 1.69 | |||||||||||||||||
|
|
|
|
|
|
|
|
|
|
|
| |||||||||||||
Total from investment operations | 0.92 | 1.07 | 2.35 | 1.57 | (0.15 | ) | 1.64 | |||||||||||||||||
Distributions to shareholders from | ||||||||||||||||||||||||
Net realized gains | (0.76 | ) | (2.04 | ) | (1.85 | ) | (1.33 | ) | (4.60 | ) | (1.96 | ) | ||||||||||||
Net asset value, end of period | $9.31 | $9.15 | $10.12 | $9.62 | $9.38 | $14.13 | ||||||||||||||||||
Total return2 | 10.56 | % | 15.63 | % | 27.55 | % | 19.71 | % | 0.16 | % | 12.38 | % | ||||||||||||
Ratios to average net assets (annualized) | ||||||||||||||||||||||||
Gross expenses | 1.17 | % | 1.21 | % | 1.16 | % | 1.14 | % | 1.14 | % | 1.05 | % | ||||||||||||
Net expenses | 0.95 | % | 1.00 | % | 1.00 | % | 1.00 | % | 1.00 | % | 0.99 | % | ||||||||||||
Net investment income (loss) | (0.23 | )% | (0.16 | )% | (0.28 | )% | (0.12 | )% | 0.06 | % | (0.32 | )% | ||||||||||||
Supplemental data | ||||||||||||||||||||||||
Portfolio turnover rate | 6 | % | 20 | % | 36 | % | 59 | % | 79 | % | 126 | % | ||||||||||||
Net assets, end of period (000s omitted) | $8,127 | $2,590 | $3,068 | $3,695 | $5,254 | $42,776 | ||||||||||||||||||
| 1 | Calculated based upon average shares outstanding |
| 2 | Returns for periods of less than one year are not annualized. |
The accompanying notes are an integral part of these financial statements.
Wells Fargo Endeavor Select Fund | 17
Table of Contents
Financial highlights
(For a share outstanding throughout each period)
| Six months ended January 31, 2020 (unaudited) | Year ended July 31 | |||||||||||||||||||||||
| INSTITUTIONAL CLASS | 2019 | 2018 | 2017 | 2016 | 2015 | |||||||||||||||||||
Net asset value, beginning of period | $9.68 | $10.57 | $9.95 | $9.65 | $14.39 | $14.65 | ||||||||||||||||||
Net investment income (loss) | 0.00 | 1,2 | 0.00 | 1,2 | (0.01 | )1 | 0.00 | 1,2 | 0.00 | 1,2 | (0.01 | )1 | ||||||||||||
Net realized and unrealized gains (losses) on investments | 0.99 | 1.15 | 2.49 | 1.64 | (0.14 | ) | 1.71 | |||||||||||||||||
|
|
|
|
|
|
|
|
|
|
|
| |||||||||||||
Total from investment operations | 0.99 | 1.15 | 2.48 | 1.64 | (0.14 | ) | 1.70 | |||||||||||||||||
Distributions to shareholders from | ||||||||||||||||||||||||
Net investment income | 0.00 | 0.00 | (0.01 | ) | (0.01 | ) | 0.00 | 0.00 | ||||||||||||||||
Net realized gains | (0.76 | ) | (2.04 | ) | (1.85 | ) | (1.33 | ) | (4.60 | ) | (1.96 | ) | ||||||||||||
|
|
|
|
|
|
|
|
|
|
|
| |||||||||||||
Total distributions to shareholders | (0.76 | ) | (2.04 | ) | (1.86 | ) | (1.34 | ) | (4.60 | ) | (1.96 | ) | ||||||||||||
Net asset value, end of period | $9.91 | $9.68 | $10.57 | $9.95 | $9.65 | $14.39 | ||||||||||||||||||
Total return3 | 10.71 | % | 15.76 | % | 28.01 | % | 19.87 | % | 0.27 | % | 12.63 | % | ||||||||||||
Ratios to average net assets (annualized) | ||||||||||||||||||||||||
Gross expenses | 0.93 | % | 0.97 | % | 0.92 | % | 0.89 | % | 0.95 | % | 0.81 | % | ||||||||||||
Net expenses | 0.74 | % | 0.80 | % | 0.80 | % | 0.80 | % | 0.80 | % | 0.80 | % | ||||||||||||
Net investment income (loss) | 0.09 | % | 0.05 | % | (0.08 | )% | 0.05 | % | 0.04 | % | (0.09 | )% | ||||||||||||
Supplemental data | ||||||||||||||||||||||||
Portfolio turnover rate | 6 | % | 20 | % | 36 | % | 59 | % | 79 | % | 126 | % | ||||||||||||
Net assets, end of period (000s omitted) | $75,219 | $107,670 | $131,655 | $144,199 | $162,935 | $221,801 | ||||||||||||||||||
| 1 | Calculated based upon average shares outstanding |
| 2 | Amount is less than $0.005. |
| 3 | Returns for periods of less than one year are not annualized. |
The accompanying notes are an integral part of these financial statements.
18 | Wells Fargo Endeavor Select Fund
Table of Contents
Notes to financial statements (unaudited)
1. ORGANIZATION
Wells Fargo Funds Trust (the “Trust”), a Delaware statutory trust organized on March 10, 1999, is anopen-end management investment company registered under the Investment Company Act of 1940, as amended (the “1940 Act”). As an investment company, the Trust follows the accounting and reporting guidance in Financial Accounting Standards Board (“FASB”)Accounting Standards Codification Topic 946, Financial Services – Investment Companies. These financial statements report on the Wells Fargo Endeavor Select Fund (the “Fund”) which is a diversified series of the Trust.
2. SIGNIFICANT ACCOUNTING POLICIES
The following significant accounting policies, which are consistently followed in the preparation of the financial statements of the Fund, are in conformity with U.S. generally accepted accounting principles which require management to make estimates and assumptions that affect the reported amounts of assets and liabilities, disclosure of contingent assets and liabilities at the date of the financial statements, and the reported amounts of revenues and expenses during the reporting period. Actual results could differ from those estimates.
Securities valuation
All investments are valued each business day as of the close of regular trading on the New York Stock Exchange (generally 4 p.m. Eastern Time), although the Fund may deviate from this calculation time under unusual or unexpected circumstances.
Equity securities that are listed on a foreign or domestic exchange or market are valued at the official closing price or, if none, the last sales price. If no sale occurs on the principal exchange or market that day, a fair value price will be determined in accordance with the Fund’s Valuation Procedures.
Investments in registeredopen-end investment companies are valued at net asset value. Interests innon-registered investment companies that are redeemable at net asset value are fair valued normally at net asset value.
Investments which are not valued using any of the methods discussed above are valued at their fair value, as determined in good faith by the Board of Trustees of the Fund. The Board of Trustees has established a Valuation Committee comprised of the Trustees and has delegated to it the authority to take any actions regarding the valuation of portfolio securities that the Valuation Committee deems necessary or appropriate, including determining the fair value of portfolio securities, unless the determination has been delegated to the Wells Fargo Asset Management Pricing Committee at Wells Fargo Funds Management, LLC (“Funds Management”). The Board of Trustees retains the authority to make or ratify any valuation decisions or approve any changes to the Valuation Procedures as it deems appropriate. On a quarterly basis, the Board of Trustees receives reports on any valuation actions taken by the Valuation Committee or the Wells Fargo Asset Management Pricing Committee which may include items for ratification.
Foreign currency translation
The accounting records of the Fund are maintained in U.S. dollars. The values of other assets and liabilities denominated in foreign currencies are translated into U.S. dollars at rates provided by an independent foreign currency pricing source at a time each business day specified by the Wells Fargo Asset Management Pricing Committee. Purchases and sales of securities, and income and expenses are converted at the rate of exchange on the respective dates of such transactions. Net realized foreign exchange gains or losses arise from sales of foreign currencies, currency gains or losses realized between the trade and settlement dates on securities transactions, and the difference between the amounts of dividends, interest and foreign withholding taxes recorded and the U.S. dollar equivalent of the amounts actually paid or received. Net unrealized foreign exchange gains and losses arise from changes in the fair value of assets and liabilities other than investments in securities resulting from changes in exchange rates. The changes in net assets arising from changes in exchange rates of securities and the changes in net assets resulting from changes in market prices of securities are not separately presented. Such changes are included in net realized and unrealized gains or losses from investments.
Securities lending
The Fund may lend its securities from time to time in order to earn additional income in the form of fees or interest on securities received as collateral or the investment of any cash received as collateral. When securities are on loan, the Fund receives interest or dividends on those securities. Cash collateral received in connection with its securities lending transactions is invested in Securities Lending Cash Investments, LLC (the “Securities Lending Fund”). Investments in Securities Lending Fund are valued at the evaluated bid price provided by an independent pricing service. Income earned from investment in the Securities Lending Fund (net of fees and rebates), if any, is included in income from affiliated securities on the Statement of Operations.
In a securities lending transaction, the net asset value of the Fund is affected by an increase or decrease in the value of the securities loaned and by an increase or decrease in the value of the instrument in which collateral is invested. The amount of securities lending activity undertaken by the Fund fluctuates from time to time. The Fund has the right under the lending agreement to recover the
Wells Fargo Endeavor Select Fund | 19
Table of Contents
Notes to financial statements (unaudited)
securities from the borrower on demand. In the event of default or bankruptcy by the borrower, the Fund may be prevented from recovering the loaned securities or gaining access to the collateral or may experience delays or costs in doing so. In such an event, the terms of the agreement allows the unaffiliated securities lending agent to use the collateral to purchase replacement securities on behalf of the Fund or pay the Fund the market value of the loaned securities. The Fund bears the risk of loss with respect to depreciation of its investment of the cash collateral.
Security transactions and income recognition
Securities transactions are recorded on a trade date basis. Realized gains or losses are recorded on the basis of identified cost.
Dividend income is recognized on theex-dividend date. Dividend income is recorded net of foreign taxes withheld where recovery of such taxes is not assured.
Distributions to shareholders
Distributions to shareholders from net investment income and any net realized gains are recorded on theex-dividend date and paid at least annually. Such distributions are determined in accordance with income tax regulations and may differ from U.S. generally accepted accounting principles. Dividend sources are estimated at the time of declaration. The tax character of distributions is determined as of the Fund’s fiscal year end. Therefore, a portion of the Fund’s distributions made prior to the Fund’s fiscal year end may be categorized as a tax return of capital at year end.
Federal and other taxes
The Fund intends to continue to qualify as a regulated investment company by distributing substantially all of its investment company taxable income and any net realized capital gains (after reduction for capital loss carryforwards) sufficient to relieve it from all, or substantially all, federal income taxes. Accordingly, no provision for federal income taxes was required.
The Fund’s income and federal excise tax returns and all financial records supporting those returns for the prior three fiscal years are subject to examination by the federal and Delaware revenue authorities. Management has analyzed the Fund’s tax positions taken on federal, state, and foreign tax returns for all open tax years and does not believe that there are any uncertain tax positions that require recognition of a tax liability.
As of January 31, 2020, the aggregate cost of all investments for federal income tax purposes was $126,067,391 and the unrealized gains (losses) consisted of:
Gross unrealized gains | $ | 119,396,209 | ||
Gross unrealized losses | (580,525 | ) | ||
Net unrealized gains | $ | 118,815,684 | ||
Class allocations
The separate classes of shares offered by the Fund differ principally in applicable sales charges, distribution, shareholder servicing, and administration fees. Class specific expenses are charged directly to that share class. Investment income, common fund-level expenses, and realized and unrealized gains (losses) on investments are allocated daily to each class of shares based on the relative proportion of net assets of each class.
3. FAIR VALUATION MEASUREMENTS
Fair value measurements of investments are determined within a framework that has established a fair value hierarchy based upon the various data inputs utilized in determining the value of the Fund’s investments. The three-level hierarchy gives the highest priority to unadjusted quoted prices in active markets for identical assets or liabilities (Level 1) and the lowest priority to unobservable inputs (Level 3). The Fund’s investments are classified within the fair value hierarchy based on the lowest level of input that is significant to the fair value measurement. The inputs are summarized into three broad levels as follows:
| ∎ | Level 1 – quoted prices in active markets for identical securities |
| ∎ | Level 2 – other significant observable inputs (including quoted prices for similar securities, interest rates, prepayment speeds, credit risk, etc.) |
| ∎ | Level 3 – significant unobservable inputs (including the Fund’s own assumptions in determining the fair value of investments) |
The inputs or methodologies used for valuing investments in securities are not necessarily an indication of the risk associated with investing in those securities.
20 | Wells Fargo Endeavor Select Fund
Table of Contents
Notes to financial statements (unaudited)
The following is a summary of the inputs used in valuing the Fund’s assets and liabilities as of January 31, 2020:
| Quoted prices (Level 1) | Other significant observable inputs (Level 2) | Significant (Level 3) | Total | |||||||||||||
Assets | ||||||||||||||||
Investments in: | ||||||||||||||||
Common stocks | ||||||||||||||||
Communication services | $ | 30,196,403 | $ | 0 | $ | 0 | $ | 30,196,403 | ||||||||
Consumer discretionary | 33,438,833 | 0 | 0 | 33,438,833 | ||||||||||||
Financials | 16,486,995 | 0 | 0 | 16,486,995 | ||||||||||||
Health care | 39,458,917 | 0 | 0 | 39,458,917 | ||||||||||||
Industrials | 19,626,497 | 0 | 0 | 19,626,497 | ||||||||||||
Information technology | 79,072,162 | 0 | 0 | 79,072,162 | ||||||||||||
Materials | 15,295,777 | 0 | 0 | 15,295,777 | ||||||||||||
Real estate | 4,067,828 | 0 | 0 | 4,067,828 | ||||||||||||
Short-term investments | ||||||||||||||||
Investment companies | 7,239,663 | 0 | 0 | 7,239,663 | ||||||||||||
Total assets | $ | 244,883,075 | $ | 0 | $ | 0 | $ | 244,883,075 | ||||||||
Additional sector, industry or geographic detail is included in the Portfolio of Investments.
For the six months ended January 31, 2020, the Fund did not have any transfers into/out of Level 3.
4. TRANSACTIONS WITH AFFILIATES
Management fee
Funds Management, an indirect wholly owned subsidiary of Wells Fargo & Company (“Wells Fargo”), is the manager of the Fund and provides advisory and fund-level administrative services under an investment management agreement. Under the investment management agreement, Funds Management is responsible for, among other services, implementing the investment objectives and strategies of the Fund, supervising the subadviser and providing fund-level administrative services in connection with the Fund’s operations. As compensation for its services under the investment management agreement, Funds Management is entitled to receive a management fee at the following annual rate based on the Fund’s average daily net assets:
| Average daily net assets | Management fee | |||
First $500 million | 0.700 | % | ||
Next $500 million | 0.675 | |||
Next $1 billion | 0.650 | |||
Next $2 billion | 0.625 | |||
Next $1 billion | 0.600 | |||
Next $3 billion | 0.590 | |||
Next $2 billion | 0.565 | |||
Next $2 billion | 0.555 | |||
Next $4 billion | 0.530 | |||
Over $16 billion | 0.505 | |||
For the six months ended January 31, 2020, the management fee was equivalent to an annual rate of 0.70% of the Fund’s average daily net assets.
Funds Management has retained the services of a subadviser to provide daily portfolio management to the Fund. The fee for subadvisory services is borne by Funds Management. Wells Capital Management Incorporated (“WellsCap”), an affiliate of Funds Management and an indirect wholly owned subsidiary of Wells Fargo, is the subadviser to the Fund and is entitled to receive a fee from Funds Management at an annual rate starting at 0.30% and declining to 0.20% as the average daily net assets of the Fund increase.
Wells Fargo Endeavor Select Fund | 21
Table of Contents
Notes to financial statements (unaudited)
Administration fees
Under a class-level administration agreement, Funds Management provides class-level administrative services to the Fund, which includes paying fees and expenses for services provided by the transfer agent,sub-transfer agents, omnibus account servicers and record-keepers. As compensation for its services under the class-level administration agreement, Funds Management receives an annual fee which is calculated based on the average daily net assets of each class as follows:
| Class-level administration fee | ||||
Class A, Class C | 0.21 | % | ||
Class R6 | 0.03 | |||
Administrator Class, Institutional Class | 0.13 | |||
Waivers and/or expense reimbursements
Funds Management has contractually waived and/or reimbursed management and administration fees to the extent necessary to maintain certain net operating expense ratios for the Fund. When each class of the Fund has exceeded its expense cap, Funds Management has waived fees and/or reimbursed expenses from fund-level expenses on a proportionate basis and then from class specific expenses. When only certain classes exceed their expense caps, waivers and/or reimbursements are applied against class specific expenses before fund-level expenses. Funds Management has committed through November 30, 2021 to waive fees and/or reimburse expenses to the extent necessary to cap the Fund’s expenses at 1.03% for Class A shares, 1.78% for Class C shares, 0.60% for Class R6 shares, 0.94% for Administrator Class shares, and 0.70% for Institutional Class shares. Prior to or after the commitment expiration date, the cap may be increased or the commitment to maintain the cap may be terminated only with the approval of the Board of Trustees.Prior to December 1, 2019, the Fund’s expenses were capped at 1.20% for Class A shares, 1.95% for Class C shares, 1.00% for Administrator Class shares, and 0.80% for Institutional Class shares.
Distribution fee
The Trust has adopted a distribution plan for Class C shares of the Fund pursuant to Rule12b-1 under the 1940 Act. A distribution fee is charged to Class C shares and paid to Wells Fargo Funds Distributor, LLC (“Funds Distributor”), the principal underwriter, at an annual rate of 0.75% of the average daily net assets of Class C shares.
In addition, Funds Distributor is entitled to receive thefront-end sales charge from the purchase of Class A shares and a contingent deferred sales charge on the redemption of certain Class A shares. Funds Distributor is also entitled to receive the contingent deferred sales charges from redemptions of Class C shares. For the six months ended January 31, 2020, Funds Distributor received $2,040 from the sale of Class A shares and $70 in contingent deferred sales charges from redemptions of Class C. No contingent deferred sales charges were incurred by Class A for the six months ended January 31, 2020.
Shareholder servicing fees
The Trust has entered into contracts with one or more shareholder servicing agents, whereby Class A, Class C, and Administrator Class of the Fund are charged a fee at an annual rate of 0.25% of the average daily net assets of each respective class. A portion of these total shareholder servicing fees were paid to affiliates of Wells Fargo.
Interfund transactions
The Fund may purchase or sell portfolio investment securities to certain other Wells Fargo affiliates pursuant to Rule17a-7 under the 1940 Act and under procedures adopted by the Board of Trustees. The procedures have been designed to ensure that these interfund transactions, which do not incur broker commissions, are effected at current market prices.
5. INVESTMENT PORTFOLIO TRANSACTIONS
Purchases and sales of investments, excluding U.S. government obligations (if any) and short-term securities, for the six months ended January 31, 2020 were $11,549,001 and $25,775,280, respectively.
6. SECURITIES LENDING TRANSACTIONS
The Fund lends its securities through an unaffiliated securities lending agent and receives collateral in the form of cash or securities with a value at least equal to the value of the securities on loan. The value of the loaned securities is determined at the close of each business day and any increases or decreases in the required collateral are exchanged between the Fund and the counterparty on the next business day. Cash collateral received is invested in the Securities Lending Fund which seeks to provide a positive return compared to the daily Fed Funds Open Rate by investing in high-quality, U.S. dollar-denominated short-term money market instruments and is exempt from registration under Section 3(c)(7) of the 1940 Act. Securities Lending Fund is
22 | Wells Fargo Endeavor Select Fund
Table of Contents
Notes to financial statements (unaudited)
managed by Funds Management and is subadvised by WellsCap. Funds Management receives an advisory fee starting at 0.05% and declining to 0.01% as the average daily net assets of the Securities Lending Fund increase. All of the fees received by Funds Management are paid to WellsCap for its services as subadviser.
In the event of counterparty default or the failure of a borrower to return a loaned security, the Fund has the right to use the collateral to offset any losses incurred. As of January 31, 2020, the Fund did not have any securities on loan.
7. ACQUISITION
After the close of business on September 20, 2019, the Fund acquired the net assets of Wells Fargo Capital Growth Fund. The purpose of the transaction was to combine two funds with similar investment objectives and strategies. Shareholders holding Class A, Class C, Class R6, Administrator Class and Institutional Class shares of Wells Fargo Capital Growth Fund received Class A, Class C, Class R6, Administrator Class, and Institutional Class shares, respectively, of the Fund in the reorganization. The acquisition was accomplished by atax-free exchange of all of the shares of Wells Fargo Capital Growth Fund for 12,325,989 shares of the Fund valued at $103,111,696 at an exchange ratio of 0.97, 1.03, 1.14, 1.09, and 1.13 for Class A, Class C, Class R6, Administrator Class and Institutional Class shares, respectively. The investment portfolio of Capital Growth Fund with a fair value of $101,506,563, identified cost of $55,944,059 and unrealized gains of $45,562,504 at September 20, 2019 were the principal assets acquired by the Fund. The aggregate net assets of Wells Fargo Capital Growth Fund and the Fund immediately prior to the acquisition were $103,112,202 and $124,063,059, respectively. The aggregate net assets of the Fund immediately after the acquisition were $227,175,261. For financial reporting purposes, assets received and shares issued by the Fund were recorded at fair value; however, the cost basis of the investments received from Capital Growth Fund was carried forward to align with ongoing reporting of the Fund’s realized and unrealized gains and losses with amounts distributable to shareholders for tax purposes.
Assuming the acquisition had been completed August 1, 2019, the beginning of the annual reporting period for the Fund, the pro forma results of operations for the six months ended January 31, 2020 would have been as follows (unaudited):
Net investment income loss | $ | (29,229 | ) | |
Net realized and unrealized gains on investments | 28,158,331 | |||
Net increase in net assets resulting from operations | $ | 28,129,102 | ||
Because the combined investment portfolios have been managed as a single integrated portfolio since the acquisition was completed, it is not practicable to separate the amounts of revenue and earnings of Wells Fargo Capital Growth Fund that have been included in the Fund’s Statement of Operations since September 20, 2019.
8. BANK BORROWINGS
The Trust (excluding the money market funds), Wells Fargo Master Trust and Wells Fargo Variable Trust are parties to a $280,000,000 revolving credit agreement whereby the Fund is permitted to use bank borrowings for temporary or emergency purposes, such as to fund shareholder redemption requests. Interest under the credit agreement is charged to the Fund based on a borrowing rate equal to the higher of the Federal Funds rate in effect on that day plus 1.25% or the overnight LIBOR rate in effect on that day plus 1.25%. In addition, an annual commitment fee equal to 0.25% of the unused balance is allocated to each participating fund.
For the six months ended January 31, 2020, there were no borrowings by the Fund under the agreement.
9. CONCENTRATION RISK
Concentration risks result from exposure to a limited number of sectors. As of the end of the period, the Fund invests a concentration of its portfolio in the information technology sector. A fund that invests a substantial portion of its assets in any sector may be more affected by changes in that sector than would be a fund whose investments are not heavily weighted in any sector.
10. INDEMNIFICATION
Under the Trust’s organizational documents, the officers and Trustees have been granted certain indemnification rights against certain liabilities that may arise out of performance of their duties to the Trust. Additionally, in the normal course of business, the Trust may enter into contracts with service providers that contain a variety of indemnification clauses. The Trust’s maximum exposure under these arrangements is dependent on future claims that may be made against the Fund and, therefore, cannot be estimated.
Wells Fargo Endeavor Select Fund | 23
Table of Contents
Notes to financial statements (unaudited)
11. NEW ACCOUNTING PRONOUNCEMENT
In August 2018, FASB issued Accounting Standards Update (“ASU”)No. 2018-13, Fair Value Measurement (Topic 820)Disclosure Framework—Changes to the Disclosure Requirements for Fair Value Measurement.ASU2018-13 updates the disclosure requirements for fair value measurements by modifying or removing certain disclosures and adding certain new disclosures. The amendments are effective for fiscal years, and interim periods within those fiscal years, beginning after December 15, 2019. Early adoption is permitted. Management has adopted the removal and modification of disclosures early, as permitted, and will adopt the additional new disclosures at the effective date.
12. SUBSEQUENT EVENT
On March 11, 2020, the World Health Organization announced that it had made the assessment that coronavirus disease 2019 (“COVID-19”) is a pandemic. The impacts of COVID-19 is adversely affecting the entire global economy, individual companies and investment products, and the market in general. There is significant uncertainty around the extent and duration of business disruptions related to COVID-19 and the impact may be short term or may last for an extended period of time. The risk of further spreading of COVID-19 has led to significant uncertainty and volatility in the financial markets and the value of the Fund and the securities in which the Fund invests may be adversely affected by impacts caused by COVID-19.
24 | Wells Fargo Endeavor Select Fund
Table of Contents
PROXY VOTING INFORMATION
A description of the policies and procedures used to determine how to vote proxies relating to portfolio securities is available, upon request, by calling1-800-222-8222, visiting our website atwfam.com, or visiting the SEC website at sec.gov. Information regarding how the proxies related to portfolio securities were voted during the most recent12-month period ended June 30 is available on the website atwfam.comor by visiting the SEC website at sec.gov.
QUARTERLY PORTFOLIO HOLDINGS INFORMATION
The Fund files its complete schedule of portfolio holdings with the SEC for the first and third quarters of each fiscal year as an exhibit to its reports on FormN-PORT. Shareholders may view the filed FormN-PORT by visiting the SEC website at sec.gov.
Wells Fargo Endeavor Select Fund | 25
Table of Contents
Other information (unaudited)
BOARD OF TRUSTEES AND OFFICERS
Each of the Trustees and Officers1 listed in the table below acts in identical capacities for each fund in the Wells Fargo family of funds, which consists of 149 mutual funds comprising the Wells Fargo Funds Trust, Wells Fargo Variable Trust, Wells Fargo Master Trust and fourclosed-end funds (collectively the “Fund Complex”). This table should be read in conjunction with the Prospectus and the Statement of Additional Information2. The mailing address of each Trustee and Officer is 525 Market Street, 12th Floor, San Francisco, CA 94105. Each Trustee and Officer serves an indefinite term, however, each Trustee serves such term until reaching the mandatory retirement age established by the Trustees.
Independent Trustees
Name and year of birth | Position held and length of service* | Principal occupations during past five years or longer | Current other public company or investment company directorships | |||
| William R. Ebsworth (Born 1957) | Trustee, since 2015 | Retired. From 1984 to 2013, equities analyst, portfolio manager, research director and chief investment officer at Fidelity Management and Research Company in Boston, Tokyo, and Hong Kong, and retired in 2013 as Chief Investment Officer of Fidelity Strategic Advisers, Inc. where he led a team of investment professionals managing client assets. Prior thereto, Board member of Hong Kong Securities Clearing Co., Hong Kong Options Clearing Corp., the Thailand International Fund, Ltd., Fidelity Investments Life Insurance Company, and Empire Fidelity Investments Life Insurance Company. Audit Committee Chair and Investment Committee Chair of the Vincent Memorial Hospital Endowment(non-profit organization). Mr. Ebsworth is a CFA® charterholder. | N/A | |||
| Jane A. Freeman (Born 1953) | Trustee, since 2015; Chair Liaison, since 2018 | Retired. From 2012 to 2014 and 1999 to 2008, Chief Financial Officer of Scientific Learning Corporation. From 2008 to 2012, Ms. Freeman provided consulting services related to strategic business projects. Prior to 1999, Portfolio Manager at Rockefeller & Co. and Scudder, Stevens & Clark. Board member of the Harding Loevner Funds from 1996 to 2014, serving as both Lead Independent Director and chair of the Audit Committee. Board member of the Russell Exchange Traded Funds Trust from 2011 to 2012 and the chair of the Audit Committee. Ms. Freeman is a Board Member of The Ruth Bancroft Garden(non-profit organization). She is also an inactive Chartered Financial Analyst. | N/A | |||
| Isaiah Harris, Jr. (Born 1952) | Trustee, since 2009; Audit Committee Chairman, since 2019 | Retired. Chairman of the Board of CIGNA Corporation since 2009, and Director since 2005. From 2003 to 2011, Director of Deluxe Corporation. Prior thereto, President and CEO of BellSouth Advertising and Publishing Corp. from 2005 to 2007, President and CEO of BellSouth Enterprises from 2004 to 2005 and President of BellSouth Consumer Services from 2000 to 2003. Emeritus member of the Iowa State University Foundation Board of Governors. Emeritus Member of the Advisory Board of Iowa State University School of Business. Advisory Board Member, Palm Harbor Academy (private school). Advisory Board Member, Child Evangelism Fellowship(non-profit). Mr. Harris is a certified public accountant (inactive status). | CIGNA Corporation | |||
| Judith M. Johnson (Born 1949) | Trustee, since 2008; | Retired. Prior thereto, Chief Executive Officer and Chief Investment Officer of Minneapolis Employees Retirement Fund from 1996 to 2008. Ms. Johnson is an attorney, certified public accountant and a certified managerial accountant. | N/A | |||
26 | Wells Fargo Endeavor Select Fund
Table of Contents
Other information (unaudited)
Name and year of birth | Position held and length of service* | Principal occupations during past five years or longer | Current other public company or investment company directorships | |||
| David F. Larcker (Born 1950) | Trustee, since 2009 | James Irvin Miller Professor of Accounting at the Graduate School of Business, Stanford University, Director of the Corporate Governance Research Initiative and Senior Faculty of The Rock Center for Corporate Governance since 2006. From 2005 to 2008, Professor of Accounting at the Graduate School of Business, Stanford University. Prior thereto, Ernst & Young Professor of Accounting at The Wharton School, University of Pennsylvania from 1985 to 2005. | N/A | |||
| Olivia S. Mitchell (Born 1953) | Trustee, since 2006; Nominating and Governance Committee Chair, since 2018 | International Foundation of Employee Benefit Plans Professor, Wharton School of the University of Pennsylvania since 1993. Director of Wharton’s Pension Research Council and Boettner Center on Pensions & Retirement Research, and Research Associate at the National Bureau of Economic Research. Previously, Cornell University Professor from 1978 to 1993. | N/A | |||
| Timothy J. Penny (Born 1951) | Trustee, since 1996; Chairman, since 2018 | President and Chief Executive Officer of Southern Minnesota Initiative Foundation, anon-profit organization, since 2007. Member of the Board of Trustees of NorthStar Education Finance, Inc., anon-profit organization, since 2007. | N/A | |||
| James G. Polisson (Born 1959) | Trustee, since 2018 | Retired. Chief Marketing Officer, Source (ETF) UK Services, Ltd, from 2015 to 2017. From 2012 to 2015, Principal of The Polisson Group, LLC, a management consulting, corporate advisory and principal investing company. Chief Executive Officer and Managing Director at Russell Investments, Global Exchange Traded Funds from 2010 to 2012. Managing Director of Barclays Global Investors from 1998 to 2010 and Global Chief Marketing Officer for iShares and Barclays Global Investors from 2000 to 2010. Trustee of the San Francisco Mechanics’ Institute, anon-profit organization, from 2013 to 2015. Board member of the Russell Exchange Traded Fund Trust from 2011 to 2012. Director of Barclays Global Investors Holdings Deutschland GmbH from 2006 to 2009. Mr. Polisson is an attorney and has a retired status with the Massachusetts and District of Columbia Bar Associations. | N/A | |||
| Pamela Wheelock3 (Born 1959) | Trustee, since January 2020; previously Trustee from January 2018 to July 2019 | Board member of the Destination Medical Center Economic Development Agency, Rochester, Minnesota since 2019. Acting Commissioner, Minnesota Department of Human Services, July 2019 through September 2019. Human Services Manager (part-time), Minnesota Department of Human Services, October 2019 through December 2019. Chief Operating Officer, Twin Cities Habitat for Humanity from 2017 to 2019. Vice President of University Services, University of Minnesota from 2012 to 2016. Prior thereto, on the Board of Directors, Governance Committee and Finance Committee for the Minnesota Philanthropy Partners (Saint Paul Foundation) from 2012 to 2018, Interim Chief Executive Officer of Blue Cross Blue Shield of Minnesota from 2011 to 2012, Chairman of the Board from 2009 to 2012 and Board Director from 2003 to 2015. Vice President, Leadership and Community Engagement, Bush Foundation, Saint Paul, Minnesota (a private foundation) from 2009 to 2011. Executive Vice President and Chief Financial Officer, Minnesota Sports and Entertainment from 2004 to 2009 and Senior Vice President from 2002 to 2004. Executive Vice President of the Minnesota Wild Foundation from 2004 to 2008. Commissioner of Finance, State of Minnesota, from 1999 to 2002. Currently Board Chair of the Minnesota Wild Foundation since 2010. | N/A | |||
| * | Length of service dates reflect the Trustee’s commencement of service with the Trust’s predecessor entities, where applicable. |
Wells Fargo Endeavor Select Fund | 27
Table of Contents
Other information (unaudited)
Officers
| Name and year of birth | Position held and length of service | Principal occupations during past five years or longer | ||
| Andrew Owen (Born 1960) | President, since 2017 | Executive Vice President of Wells Fargo & Company and Head of Affiliated Managers, Wells Fargo Asset Management, since 2014. In addition, Mr. Owen is currently President, Chief Executive Officer and Director of Wells Fargo Funds Management, LLC since 2017. Prior thereto, Executive Vice President responsible for marketing, investments and product development for Wells Fargo Funds Management, LLC, from 2009 to 2014. | ||
| Jeremy DePalma1 (Born 1974) | Treasurer, since 2012 | Senior Vice President of Wells Fargo Funds Management, LLC since 2009. Senior Vice President of Evergreen Investment Management Company, LLC from 2008 to 2010 and head of the Fund Reporting and Control Team within Fund Administration from 2005 to 2010. | ||
| Michelle Rhee (Born 1966) | Chief Legal Officer, since 2019 | Secretary of Wells Fargo Funds Management, LLC, Chief Legal Counsel of Wells Fargo Asset Management and Assistant General Counsel of Wells Fargo Bank, N.A. since 2018. Associate General Counsel and Managing Director of Bank of America Corporation from 2004 to 2018. | ||
| Catherine Kennedy (Born 1969) | Secretary, since 2019 | Vice President of Wells Fargo Funds Management, LLC and Senior Counsel of the Wells Fargo Legal Department since 2010. Vice President and Senior Counsel of Evergreen Investment Management Company, LLC from 1998 to 2010. | ||
| Michael H. Whitaker(Born 1967) | Chief Compliance Officer, since 2016 | Chief Compliance Officer of Wells Fargo Asset Management since 2016. Senior Vice President and Chief Compliance Officer for Fidelity Investments from 2007 to 2016. | ||
| David Berardi (Born 1975) | Assistant Treasurer, since 2009 | Vice President of Wells Fargo Funds Management, LLC since 2009. Vice President of Evergreen Investment Management Company, LLC from 2008 to 2010. Manager of Fund Reporting and Control for Evergreen Investment Management Company, LLC from 2004 to 2010. | ||
| 1 | Jeremy DePalma acts as Treasurer of 85 funds and Assistant Treasurer of 64 funds in the Fund Complex. |
| 2 | The Statement of Additional Information includes additional information about the Trustees and is available, without charge, upon request, by calling1-800-222-8222 or by visiting the website atwfam.com. |
| 3 | Pamela Wheelock wasre-appointed to the Board effective January 1, 2020. |
28 | Wells Fargo Endeavor Select Fund
Table of Contents
Effective on or about May 1, 2020, if you purchase Fund shares through a Janney Montgomery Scott LLC (“Janney”) brokerage account, you will be eligible for the following load waivers(front-end sales charge waivers and contingent deferred sales charge (“CDSC”), orback-end sales charge, waivers) and discounts, which may differ from those disclosed elsewhere in the Fund’s Prospectus or SAI.
| Front-end sales charge* waivers on Class A shares available at Janney |
| Shares purchased through reinvestment of capital gains distributions and dividend reinvestment when purchasing shares of the same fund (but not any other fund within the fund family). |
| Shares purchased by employees and registered representatives of Janney or its affiliates and their family members as designated by Janney. |
| Shares purchased from the proceeds of redemptions within the same fund family, provided (1) the repurchase occurs within ninety (90) days following the redemption, (2) the redemption and purchase occur in the same account, and (3) redeemed shares were subject to afront-end or deferred sales load (i.e., right of reinstatement). |
| Employer-sponsored retirement plans (e.g., 401(k) plans, 457 plans, employer-sponsored 403(b) plans, profit sharing and money purchase pension plans and defined benefit plans). For purposes of this provision, employer-sponsored retirement plans do not include SEP IRAs, Simple IRAs,SAR-SEPs or Keogh plans. |
| Shares acquired through a right of reinstatement. |
| Class C shares that are no longer subject to a contingent deferred sales charge and are converted to Class A shares of the same fund pursuant to Janney’s policies and procedures. |
| CDSC waivers on Class A and Class C shares available at Janney |
| Shares sold upon the death or disability of the shareholder. |
| Shares sold as part of a systematic withdrawal plan as described in the Fund’s Prospectus. |
| Shares purchased in connection with a return of excess contributions from an IRA account. |
| Shares sold as part of a required minimum distribution for IRA and retirement accounts if the redemption is taken in or after the year the shareholder reaches qualified age based on applicable IRS regulations. |
| Shares sold to pay Janney fees but only if the transaction is initiated by Janney. |
| Shares acquired through a right of reinstatement. |
| Shares exchanged into the same share class of a different fund. |
| Front-end sales charge* discounts available at Janney; breakpoints, rights of accumulation and/or letters of intent |
| Breakpoints as described in the Fund’s Prospectus. |
| Rights of accumulation (“ROA”), which entitle shareholders to breakpoint discounts, will be automatically calculated based on the aggregated holding of fund family assets held by accounts within the purchaser’s household at Janney. Eligible fund family assets not held at Janney may be included in the ROA calculation only if the shareholder notifies his or her financial advisor about such assets. |
| Letters of intent which allow for breakpoint discounts based on anticipated purchases within a fund family, over a13-month time period. Eligible fund family assets not held at Janney Montgomery Scott may be included in the calculation of letters of intent only if the shareholder notifies his or her financial advisor about such assets. |
| * | Also referred to as an “initial sales charge.” |
Wells Fargo Endeavor Select Fund | 29
Table of Contents
For more information
More information about Wells Fargo Funds is available free upon request. To obtain literature, please write, visit the Fund’s website, or call:
Wells Fargo Funds
P.O. Box 219967
Kansas City, MO 64121-9967
Website:wfam.com
Individual investors:1-800-222-8222
Retail investment professionals:1-888-877-9275
Institutional investment professionals:1-866-765-0778

This report and the financial statements contained herein are submitted for the general information of the shareholders of the Fund. If this report is used for promotional purposes, distribution of the report must be accompanied or preceded by a current prospectus. Before investing, please consider the investment objectives, risks, charges, and expenses of the investment. For a current prospectus and, if available, a summary prospectus, containing this information, call1-800-222-8222 or visit the Fund’s website atwfam.com. Read the prospectus carefully before you invest or send money.
Wells Fargo Asset Management (WFAM) is the trade name for certain investment advisory/management firms owned by Wells Fargo & Company. These firms include but are not limited to Wells Capital Management Incorporated and Wells Fargo Funds Management, LLC. Certain products managed by WFAM entities are distributed by Wells Fargo Funds Distributor, LLC (a broker-dealer and Member FINRA).
This material is for general informational and educational purposes only and is NOT intended to provide investment advice or a recommendation of any kind—including a recommendation for any specific investment, strategy, or plan.
INVESTMENT PRODUCTS: NOT FDIC INSURED ◾ NO BANK GUARANTEE ◾ MAY LOSE VALUE
© 2020 Wells Fargo & Company. All rights reserved
PAR-0220-03818 03-20
SA205/SAR205 01-20
Table of Contents

Semi-Annual Report
January 31, 2020
Wells Fargo Growth Fund
Beginning on January 1, 2021, as permitted by new regulations adopted by the Securities and Exchange Commission, paper copies of the Wells Fargo Funds’ annual and semi-annual shareholder reports issued after this date will no longer be sent by mail, unless you specifically request paper copies of the reports. Instead, the reports will be made available on the Funds’ website, and you will be notified by mail each time a report is posted and provided with a website address to access the report.
If you already elected to receive shareholder reports electronically, you will not be affected by this change and you need not take any action. You may elect to receive shareholder reports and other communications from the Fund electronically at any time by contacting your financial intermediary (such as a broker-dealer or bank) or, if you are a direct investor, by calling1-800-222-8222 or by enrolling at wellsfargo.com/advantagedelivery.
You may elect to receive all future reports in paper free of charge. If you invest through a financial intermediary, you can contact your financial intermediary to request that you continue to receive paper copies of your shareholder reports; if you invest directly with the Fund, you can call 1-800-222-8222. Your election to receive reports in paper will apply to all Wells Fargo Funds held in your account with your financial intermediary or, if you are a direct investor, to all Wells Fargo Funds that you hold.
Table of Contents
|
Reduce clutter. Save trees. |
Sign up for electronic delivery of prospectuses and shareholder reports atwellsfargo.com/advantagedelivery |
The views expressed and any forward-looking statements are as of January 31, 2020, unless otherwise noted, and are those of the Fund managers and/or Wells Fargo Asset Management. Discussions of individual securities, or the markets generally, or any Wells Fargo Fund are not intended as individual recommendations. Future events or results may vary significantly from those expressed in any forward-looking statements. The views expressed are subject to change at any time in response to changing circumstances in the market. Wells Fargo Asset Management and the Fund disclaim any obligation to publicly update or revise any views expressed or forward-looking statements.
INVESTMENT PRODUCTS: NOT FDIC INSURED ◾ NO BANK GUARANTEE ◾ MAY LOSE VALUE
Wells Fargo Growth Fund | 1
Table of Contents
Letter to shareholders (unaudited)

Andrew Owen
President
Wells Fargo Funds
“As the period began, U.S.-China trade tensions continued with no signs of compromise.”
Dear Shareholder:
We are pleased to offer you this semi-annual report for the Wells Fargo Wells Fargo Growth Fund for thesix-month period that ended January 31, 2020. Despite some market volatility, the period was strongly positive for financial markets as supportive central banks more than offset concerns over slowing global economic growth and international trade tensions.
Overall, both fixed-income and equity investors enjoyed healthy annual returns, with U.S. markets leading the way. For the period, U.S. stocks, based on the S&P 500 Index,1 gained 9.31% and international stocks, as measured by the MSCI ACWI ex USA Index (Net),2 returned 5.37%. The MSCI EM Index (Net)3 gained a more modest 3.36%. For bond investors, the Bloomberg Barclays U.S. Aggregate Bond Index4 added 4.20%, the Bloomberg Barclays Global Aggregateex-USD Index5 returned 1.58%, the Bloomberg Barclays Municipal Bond Index6 gained 3.33%, and the ICE BofA U.S. High Yield Index7 added 3.34%.
The period began with uncertainty, leading to central bank support.
In August as the period began, U.S.-China trade tensions continued with no signs of compromise. Evidence of a continued global economic slowdown mounted, and central banks in China, New Zealand, and Thailand cut interest rates. Industrial and manufacturing data declined in China, Canada, Japan, and Germany. Adding to global uncertainty, Italy’s prime minister resigned, many feared a crackdown in Hong Kong as protestors sustained their calls for reform, and Boris Johnson planned to suspend Parliament as Brexit’s deadline neared.
In the U.S., the Federal Reserve (Fed) cut interest rates a second time in the third quarter in September. U.S. manufacturing data disappointed investors. The U.S. Congress announced it would pursue an impeachment investigation of President Trump. Meanwhile, the Brexit impasse showed no signs of resolution. Officials in China said that hitting the country’s economic growth goals for the year would be difficult considering the weight of tariffs and trade restrictions. Although the S&P 500 Index finished the third quarter with the bestyear-to-date returns in more than 20 years, concerns about future returns remained.
The fourth quarter started on a strong note, with U.S.-China trade tensions relaxing in October along with renewed optimism for a U.K. Brexit deal and positive macroeconomic data. The initial estimate of U.S. third-quarter gross domestic product growth was a resilient 1.9% annualized rate, while the U.S. unemployment rate fell to a50-year low of 3.5% in September. However, despite resilience among U.S. consumers, business confidence declined while manufacturing activity contracted. Concerned with a potential economic slowdown, the Fed lowered interest rates another quarter point in late October, its third rate cut in four months. This helped push the S&P 500 Index to a new
| 1 | The S&P 500 Index consists of 500 stocks chosen for market size, liquidity, and industry group representation. It is a market-value-weighted index with each stock’s weight in the index proportionate to its market value. You cannot invest directly in an index. |
| 2 | The Morgan Stanley Capital International (MSCI) All Country World Index (ACWI) ex USA Index (Net) is a free-float-adjusted market-capitalization-weighted index that is designed to measure the equity market performance of developed markets, excluding the United States. Source: MSCI. MSCI makes no express or implied warranties or representations and shall have no liability whatsoever with respect to any MSCI data contained herein. The MSCI data may not be further redistributed or used as a basis for other indices or any securities or financial products. This report is not approved, reviewed, or produced by MSCI. You cannot invest directly in an index. |
| 3 | The MSCI Emerging Markets (EM) Index (Net) is a free-float-adjusted market-capitalization-weighted index that is designed to measure equity market performance of emerging markets. You cannot invest directly in an index. |
| 4 | The Bloomberg Barclays U.S. Aggregate Bond Index is a broad-based benchmark that measures the investment-grade, U.S. dollar-denominated, fixed-rate taxable bond market, including Treasuries, government-related and corporate securities, mortgage-backed securities (agency fixed-rate and hybrid adjustable-rate mortgage pass-throughs), asset-backed securities, and commercial mortgage-backed securities. You cannot invest directly in an index. |
| 5 | The Bloomberg Barclays Global Aggregateex-USD Index is an unmanaged index that provides a broad-based measure of the global investment-grade fixed-income markets excluding the U.S. dollar-denominated debt market. You cannot invest directly in an index. |
| 6 | The Bloomberg Barclays Municipal Bond Index is an unmanaged index composed of long-termtax-exempt bonds with a minimum credit rating of Baa. You cannot invest directly in an index. |
| 7 | The ICE BofA U.S. High Yield Index is a market-capitalization-weighted index of domestic and Yankee high-yield bonds. The index tracks the performance of high-yield securities traded in the U.S. bond market. You cannot invest directly in an index. Copyright 2020. ICE Data Indices, LLC. All rights reserved. |
2 | Wells Fargo Growth Fund
Table of Contents
Letter to shareholders (unaudited)
all-time high, while emerging market equities rallied and global bonds declined overall, reflecting a broad pickup in risk appetite.
Equity markets continued to rally in November despite ongoing geopolitical risks. Hopes for a U.S.-China trade deal buoyed investor confidence. U.S. business sentiment improved slightly, and manufacturing and services activity picked up. Throughout the month, central bank actions were on hold. With that positive backdrop, developed market equities outpaced those in emerging markets, and U.S. stocks, as reflected by the S&P 500 Index, outperformednon-U.S. stocks overall. While consumer confidence and purchasing manager activity rose in the eurozone, China reported weakening manufacturing and consumer data. Bond yields rose marginally, leading to slightly negative returns for global government and investment-grade corporate bonds.
Financial markets ended 2019 on a broadly positive note, with the U.S. and China reaching an accord on a Phase One trade deal, with some details to be worked out. That, along with the landslide win by thepro-Brexit U.K. Conservative Party in a national election and ongoing central bank support, gave investors greater certainty and confidence. U.S. economic indicators were generally positive, with the exception of manufacturing activity and business confidence. However, consumer confidence was resilient, fed by a robust labor market, tame inflation, and lower interest rates, which boosted housing affordability and stimulated homebuyer activity. The impeachment of U.S. President Donald Trump, while historically noteworthy, had little impact on markets. Meanwhile, slowing Chinese economic activity, partly attributable to the trade war, led to further government stimulus atyear-end through lower reserve ratios, allowing banks to lend more money.
Theyear-end rally continued in early January 2020. However, capital market volatility picked up in late January on concerns over the unknown impact of the coronavirus on the global economy and stock markets. With sentiment somewhat souring, perceived safe havens did well in January. The U.S. dollar and Japanese yen both rose and government bonds outperformed equities. While the S&P 500 Index held its ground, emerging market equities tumbled, including those in Asia that are most exposed to viruses—physical or economic—originating in China.
Following the end of the reporting period, the coronavirus continued its global spread, resulting in disruptions to global markets, including through border closings, restrictions on travel and large gatherings, expedited and enhanced health screenings, quarantines, cancellations, business and school closings, disruptions to employment and supply chains, reduced productivity, and reduced customer and client activity in multiple markets and sectors. The risk of further spreading of the coronavirus has led to significant uncertainty and volatility in the financial markets. The full extent of the coronavirus’s impact on the global economy cannot necessarily be foreseen and the impacts may be short term or may last for an extended period of time.
Don’t let short-term uncertainty derail long-term investment goals.
Periods of investment uncertainty can present challenges, but experience has taught us that maintaining long-term investment goals can be an effective way to plan for the future. To help you create a sound strategy based on your personal goals and risk tolerance, Wells Fargo Funds offers more than 100 mutual funds spanning a wide range of asset classes and investment styles. Although diversification cannot guarantee an investment profit or prevent losses, we believe it can be an effective way to manage investment risk and potentially smooth out overall portfolio performance. We encourage investors to know their investments and to understand that appropriate levels of risk-taking may unlock opportunities.
Thank you for choosing to invest with Wells Fargo Funds. We appreciate your confidence in us and remain committed to helping you meet your financial needs.
Sincerely,

Andrew Owen
President
Wells Fargo Funds
“Financial markets ended 2019 on a broadly positive note, with the U.S. and China reaching an accord on a Phase One trade deal.”
|
For further information about your Fund, contact your investment professional, visit our website at wfam.com, or call us directly at1-800-222-8222. |
Wells Fargo Growth Fund | 3
Table of Contents
Performance highlights (unaudited)
Investment objective
The Fund seeks long-term capital appreciation.
Manager
Wells Fargo Funds Management, LLC
Subadviser
Wells Capital Management Incorporated
Portfolio managers
Joseph M. Eberhardy, CFA®‡, CPA
Thomas C. Ognar, CFA®‡
Average annual total returns (%) as of January 31, 2020
| Including sales charge | Excluding sales charge | Expense ratios1 (%) | ||||||||||||||||||||||||||||||||
| Inception date | 1 year | 5 year | 10 year | 1 year | 5 year | 10 year | Gross | Net2 | ||||||||||||||||||||||||||
| Class A (SGRAX) | 2-24-2000 | 20.65 | 13.18 | 15.62 | 28.02 | 14.53 | 16.31 | 1.18 | 1.16 | |||||||||||||||||||||||||
| Class C (WGFCX) | 12-26-2002 | 25.98 | 13.66 | 15.44 | 26.98 | 13.66 | 15.44 | 1.93 | 1.91 | |||||||||||||||||||||||||
| Class R6 (SGRHX)3 | 9-30-2015 | – | – | – | 28.60 | 15.05 | 16.83 | 0.75 | 0.70 | |||||||||||||||||||||||||
| Administrator Class (SGRKX) | 8-30-2002 | – | – | – | 28.23 | 14.75 | 16.57 | 1.10 | 0.96 | |||||||||||||||||||||||||
| Institutional Class (SGRNX) | 2-24-2000 | – | – | – | 28.50 | 14.99 | 16.80 | 0.85 | 0.75 | |||||||||||||||||||||||||
| Russell 3000® Growth Index4 | – | – | – | – | 26.94 | 15.05 | 15.80 | – | – | |||||||||||||||||||||||||
Figures quoted represent past performance, which is no guarantee of future results, and do not reflect taxes that shareholder may pay on an investment in a fund. Investment return and principal value of an investment will fluctuate so that an investor’s shares, when redeemed, may be worth more or less than their original cost. Performance shown without sales charges would be lower if sales charges were reflected. Current performance may be lower or higher than the performance data quoted, which assumes the reinvestment of dividends and capital gains. Currentmonth-end performance is available on the Fund’s website,wfam.com.
Please keep in mind that high double-digit returns were primarily achieved during favorable market conditions. You should not expect that such favorable returns can be consistently achieved. A fund’s performance, especially for short time periods, should not be the sole factor in making your investment decision.
Index returns do not include transaction costs associated with buying and selling securities, any mutual fund fees or expenses, or any taxes. It is not possible to invest directly in an index.
For Class A shares, the maximumfront-end sales charge is 5.75%. For Class C shares, the maximum contingent deferred sales charge is 1.00%. Performance including a contingent deferred sales charge assumes the sales charge for the corresponding time period. Class R6, Administrator Class, and Institutional Class shares are sold without afront-end sales charge or contingent deferred sales charge.
Stock values fluctuate in response to the activities of individual companies and general market and economic conditions. Certain investment strategies tend to increase the total risk of an investment (relative to the broader market). The Fund is exposed to foreign investment risk and smaller-company securities risk. Consult the Fund’s prospectus for additional information on these and other risks.
Please see footnotes on page 5.
4 | Wells Fargo Growth Fund
Table of Contents
Performance highlights (unaudited)
| Ten largest holdings (%) as of January 31, 20205 | ||||
Amazon.com Incorporated | 7.00 | |||
Microsoft Corporation | 5.88 | |||
Alphabet Incorporated Class A | 5.47 | |||
MasterCard Incorporated Class A | 3.44 | |||
Microchip Technology Incorporated | 3.18 | |||
Visa Incorporated Class A | 2.97 | |||
Apple Incorporated | 2.94 | |||
Envestnet Incorporated | 2.61 | |||
Facebook Incorporated Class A | 2.35 | |||
Monolithic Power Systems Incorporated | 2.08 | |||
| Sector distribution as of January 31, 20206 |
|
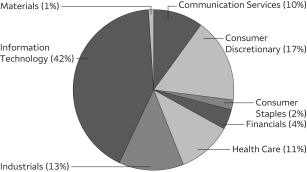
| ‡ | CFA® and Chartered Financial Analyst® are trademarks owned by CFA Institute. |
| 1 | Reflects the expense ratios as stated in the most recent prospectuses. The expense ratios shown are subject to change and may differ from the annualized expense ratios shown in the financial highlights of this report. |
| 2 | The manager has contractually committed through November 30, 2020, to waive fees and/or reimburse expenses to the extent necessary to cap total annual fund operating expenses after fee waivers at 1.16% for Class A, 1.91% for Class C, 0.70% for Class R6, 0.96% for Administrator Class, and 0.75% for Institutional Class. Brokerage commissions, stamp duty fees, interest, taxes, acquired fund fees and expenses (if any), and extraordinary expenses are excluded from the expense cap. Prior to or after the commitment expiration date, the cap may be increased or the commitment to maintain the cap may be terminated only with the approval of the Board of Trustees. Without this cap, the Fund’s returns would have been lower. The expense ratio paid by an investor is the net expense ratio (the total annual fund operating expenses after fee waivers) as stated in the prospectuses. |
| 3 | Historical performance shown for the Class R6 shares prior to their inception reflects the performance of the Institutional Class shares, and includes the higher expenses applicable to the Institutional Class shares. If these expenses had not been included, returns for the Class R6 shares would be higher. |
| 4 | The Russell 3000® Growth Index measures the performance of those Russell 3000® Index companies with higher price/book ratios and higher forecasted growth values. You cannot invest directly in an index. |
| 5 | The ten largest holdings, excluding cash, cash equivalents and any money market funds, are calculated based on the value of the investments divided by total net assets of the Fund. Holdings are subject to change and may have changed since the date specified. |
| 6 | Amounts are calculated based on the total long-term investments of the Fund. These amounts are subject to change and may have changed since the date specified. |
Wells Fargo Growth Fund | 5
Table of Contents
As a shareholder of the Fund, you incur two types of costs: (1) transaction costs, including sales charges (loads) on purchase payments and contingent deferred sales charges (if any) on redemptions and (2) ongoing costs, including management fees, distribution(12b-1) and/or shareholder servicing fees, and other Fund expenses. This example is intended to help you understand your ongoing costs (in dollars) of investing in the Fund and to compare these costs with the ongoing costs of investing in other mutual funds.
The example is based on an investment of $1,000 invested at the beginning of thesix-month period and held for the entire period from August 1, 2019 to January 31, 2020.
Actual expenses
The “Actual” line of the table below provides information about actual account values and actual expenses. You may use the information in this line, together with the amount you invested, to estimate the expenses that you paid over the period. Simply divide your account value by $1,000 (for example, an $8,600 account value divided by $1,000 = 8.6), then multiply the result by the number in the “Actual” line under the heading entitled “Expenses paid during period” for your applicable class of shares to estimate the expenses you paid on your account during this period.
Hypothetical example for comparison purposes
The “Hypothetical” line of the table below provides information about hypothetical account values and hypothetical expenses based on the Fund’s actual expense ratio and an assumed rate of return of 5% per year before expenses, which is not the Fund’s actual return. The hypothetical account values and expenses may not be used to estimate the actual ending account balance or expenses you paid for the period. You may use this information to compare the ongoing costs of investing in the Fund and other funds. To do so, compare this 5% hypothetical example with the 5% hypothetical examples that appear in the shareholder reports of the other funds.
Please note that the expenses shown in the table are meant to highlight your ongoing costs only and do not reflect any transactional costs, such as sales charges (loads) and contingent deferred sales charges. Therefore, the “Hypothetical” line of the table is useful in comparing ongoing costs only and will not help you determine the relative total costs of owning different funds. In addition, if these transactional costs were included, your costs would have been higher.
| Beginning account value 8-1-2019 | Ending account value 1-31-2020 | Expenses paid during the period1 | Annualized net expense ratio | |||||||||||||
Class A | ||||||||||||||||
Actual | $ | 1,000.00 | $ | 1,089.41 | $ | 5.93 | 1.13 | % | ||||||||
Hypothetical (5% return before expenses) | $ | 1,000.00 | $ | 1,019.46 | $ | 5.74 | 1.13 | % | ||||||||
Class C | ||||||||||||||||
Actual | $ | 1,000.00 | $ | 1,084.78 | $ | 10.01 | 1.91 | % | ||||||||
Hypothetical (5% return before expenses) | $ | 1,000.00 | $ | 1,015.53 | $ | 9.68 | 1.91 | % | ||||||||
Class R6 | ||||||||||||||||
Actual | $ | 1,000.00 | $ | 1,091.89 | $ | 3.68 | 0.70 | % | ||||||||
Hypothetical (5% return before expenses) | $ | 1,000.00 | $ | 1,021.62 | $ | 3.56 | 0.70 | % | ||||||||
Administrator Class | ||||||||||||||||
Actual | $ | 1,000.00 | $ | 1,090.20 | $ | 5.04 | 0.96 | % | ||||||||
Hypothetical (5% return before expenses) | $ | 1,000.00 | $ | 1,020.31 | $ | 4.88 | 0.96 | % | ||||||||
Institutional Class | ||||||||||||||||
Actual | $ | 1,000.00 | $ | 1,091.28 | $ | 3.94 | 0.75 | % | ||||||||
Hypothetical (5% return before expenses) | $ | 1,000.00 | $ | 1,021.37 | $ | 3.81 | 0.75 | % | ||||||||
| 1 | Expenses paid is equal to the annualized net expense ratio of each class multiplied by the average account value over the period, multiplied by the number of days in the most recent fiscal half-year divided by the number of days in the fiscal year (to reflect theone-half-year period). |
6 | Wells Fargo Growth Fund
Table of Contents
Portfolio of investments—January 31, 2020 (unaudited)
| Shares | Value | |||||||||||||||
| Common Stocks: 99.82% | ||||||||||||||||
Communication Services: 9.60% | ||||||||||||||||
| Interactive Media & Services: 9.60% | ||||||||||||||||
Alphabet Incorporated Class A † | 181,735 | $ | 260,386,273 | |||||||||||||
Alphabet Incorporated Class C † | 18,990 | 27,236,028 | ||||||||||||||
Facebook Incorporated Class A † | 553,000 | 111,656,230 | ||||||||||||||
Pinterest Incorporated Class A † | 2,602,585 | 57,334,948 | ||||||||||||||
| 456,613,479 | ||||||||||||||||
|
| |||||||||||||||
Consumer Discretionary: 16.97% | ||||||||||||||||
| Diversified Consumer Services: 0.95% | ||||||||||||||||
Bright Horizons Family Solutions Incorporated † | 117,030 | 19,161,322 | ||||||||||||||
Grand Canyon Education Incorporated † | 330,650 | 25,883,282 | ||||||||||||||
| 45,044,604 | ||||||||||||||||
|
| |||||||||||||||
| Hotels, Restaurants & Leisure: 1.27% | ||||||||||||||||
Norwegian Cruise Line Holdings Limited † | 413,100 | 22,245,435 | ||||||||||||||
Planet Fitness Incorporated Class A † | 218,600 | 17,660,694 | ||||||||||||||
Royal Caribbean Cruises Limited | 176,100 | 20,617,788 | ||||||||||||||
| 60,523,917 | ||||||||||||||||
|
| |||||||||||||||
| Household Durables: 0.34% | ||||||||||||||||
Roku Incorporated † | 133,100 | 16,098,445 | ||||||||||||||
|
| |||||||||||||||
| Internet & Direct Marketing Retail: 7.17% | ||||||||||||||||
Amazon.com Incorporated † | 165,870 | 333,186,386 | ||||||||||||||
Etsy Incorporated † | 159,500 | 7,785,195 | ||||||||||||||
| 340,971,581 | ||||||||||||||||
|
| |||||||||||||||
| Multiline Retail: 0.53% | ||||||||||||||||
Ollie’s Bargain Outlet Holdings Incorporated † | 478,000 | 25,353,120 | ||||||||||||||
|
| |||||||||||||||
| Specialty Retail: 5.60% | ||||||||||||||||
Burlington Stores Incorporated † | 425,550 | 92,544,359 | ||||||||||||||
CarMax Incorporated † | 506,400 | 49,141,056 | ||||||||||||||
Carvana Company † | 43,100 | 3,415,675 | ||||||||||||||
Five Below Incorporated † | 336,359 | 38,082,566 | ||||||||||||||
The Home Depot Incorporated | 141,510 | 32,278,431 | ||||||||||||||
ULTA Beauty Incorporated † | 190,900 | 51,144,019 | ||||||||||||||
| 266,606,106 | ||||||||||||||||
|
| |||||||||||||||
| Textiles, Apparel & Luxury Goods: 1.11% | ||||||||||||||||
Levi Strauss & Company Class A « | 2,693,669 | 52,903,659 | ||||||||||||||
|
| |||||||||||||||
Consumer Staples: 2.02% | ||||||||||||||||
| Beverages: 1.19% | ||||||||||||||||
The Coca-Cola Company | 970,200 | 56,659,680 | ||||||||||||||
|
| |||||||||||||||
| Food & Staples Retailing: 0.12% | ||||||||||||||||
Grocery Outlet Holding Corporation † | 175,300 | 5,739,322 | ||||||||||||||
|
| |||||||||||||||
| Personal Products: 0.71% | ||||||||||||||||
The Estee Lauder Companies Incorporated Class A | 172,060 | 33,579,230 | ||||||||||||||
|
| |||||||||||||||
The accompanying notes are an integral part of these financial statements.
Wells Fargo Growth Fund | 7
Table of Contents
Portfolio of investments—January 31, 2020 (unaudited)
| Shares | Value | |||||||||||||||
| Financials: 4.31% | ||||||||||||||||
| Capital Markets: 3.54% | ||||||||||||||||
Assetmark Financial Holdings † | 459,787 | $ | 13,485,553 | |||||||||||||
CME Group Incorporated | 100,910 | 21,908,570 | ||||||||||||||
MarketAxess Holdings Incorporated | 199,121 | 70,524,676 | ||||||||||||||
The Charles Schwab Corporation | 602,050 | 27,423,378 | ||||||||||||||
Tradeweb Markets Incorporated Class A | 766,037 | 35,375,589 | ||||||||||||||
| 168,717,766 | ||||||||||||||||
|
| |||||||||||||||
| Thrifts & Mortgage Finance: 0.77% | ||||||||||||||||
LendingTree Incorporated † | 117,160 | 36,460,192 | ||||||||||||||
|
| |||||||||||||||
Health Care: 10.54% | ||||||||||||||||
| Biotechnology: 2.81% | ||||||||||||||||
Alexion Pharmaceuticals Incorporated † | 225,100 | 22,372,689 | ||||||||||||||
Biohaven Pharmaceutical Holding Company † | 136,700 | 6,628,583 | ||||||||||||||
Exact Sciences Corporation † | 341,300 | 31,836,464 | ||||||||||||||
Natera Incorporated † | 922,895 | 32,310,554 | ||||||||||||||
Vertex Pharmaceuticals Incorporated † | 177,700 | 40,346,785 | ||||||||||||||
| 133,495,075 | ||||||||||||||||
|
| |||||||||||||||
| Health Care Equipment & Supplies: 4.98% | ||||||||||||||||
Boston Scientific Corporation † | 1,472,520 | 61,654,412 | ||||||||||||||
DexCom Incorporated † | 190,100 | 45,766,575 | ||||||||||||||
Edwards Lifesciences Corporation † | 118,900 | 26,141,354 | ||||||||||||||
Insulet Corporation † | 259,900 | 50,430,996 | ||||||||||||||
Novocure Limited † | 522,900 | 42,595,434 | ||||||||||||||
Stryker Corporation | 49,200 | 10,366,440 | ||||||||||||||
| 236,955,211 | ||||||||||||||||
|
| |||||||||||||||
| Health Care Technology: 1.32% | ||||||||||||||||
Veeva Systems Incorporated Class A † | 428,950 | 62,888,360 | ||||||||||||||
|
| |||||||||||||||
| Life Sciences Tools & Services: 0.52% | ||||||||||||||||
Adaptive Biotechnologies Corporation † | 338,937 | 10,135,911 | ||||||||||||||
Repligen Corporation † | 145,900 | 14,646,901 | ||||||||||||||
| 24,782,812 | ||||||||||||||||
|
| |||||||||||||||
| Pharmaceuticals: 0.91% | ||||||||||||||||
Zoetis Incorporated | 323,470 | 43,412,909 | ||||||||||||||
|
| |||||||||||||||
Industrials: 12.87% | ||||||||||||||||
| Aerospace & Defense: 0.80% | ||||||||||||||||
The Boeing Company | 119,580 | 38,058,727 | ||||||||||||||
|
| |||||||||||||||
| Commercial Services & Supplies: 3.85% | ||||||||||||||||
Casella Waste Systems Incorporated Class A † | 666,024 | 34,093,769 | ||||||||||||||
Copart Incorporated † | 690,370 | 70,044,940 | ||||||||||||||
Waste Connections Incorporated | 820,805 | 79,051,730 | ||||||||||||||
| 183,190,439 | ||||||||||||||||
|
| |||||||||||||||
| Industrial Conglomerates: 0.71% | ||||||||||||||||
Roper Technologies Incorporated | 88,590 | 33,811,259 | ||||||||||||||
|
| |||||||||||||||
The accompanying notes are an integral part of these financial statements.
8 | Wells Fargo Growth Fund
Table of Contents
Portfolio of investments—January 31, 2020 (unaudited)
| Shares | Value | |||||||||||||||
| Machinery: 0.21% | ||||||||||||||||
Fortive Corporation | 103,560 | $ | 7,759,751 | |||||||||||||
Wabtec Corporation | 30,300 | 2,237,958 | ||||||||||||||
| 9,997,709 | ||||||||||||||||
|
| |||||||||||||||
| Professional Services: 2.10% | ||||||||||||||||
ASGN Incorporated † | 697,887 | 47,239,971 | ||||||||||||||
CoStar Group Incorporated † | 60,000 | 39,179,400 | ||||||||||||||
TransUnion | 146,600 | 13,443,220 | ||||||||||||||
| 99,862,591 | ||||||||||||||||
|
| |||||||||||||||
| Road & Rail: 5.20% | ||||||||||||||||
CSX Corporation | 977,346 | 74,610,594 | ||||||||||||||
Lyft Incorporated Class A † | 129,700 | 6,158,156 | ||||||||||||||
Norfolk Southern Corporation | 438,090 | 91,214,719 | ||||||||||||||
Union Pacific Corporation | 421,560 | 75,636,295 | ||||||||||||||
| 247,619,764 | ||||||||||||||||
|
| |||||||||||||||
Information Technology: 42.08% | ||||||||||||||||
| IT Services: 13.60% | ||||||||||||||||
Euronet Worldwide Incorporated † | 401,000 | 63,213,640 | ||||||||||||||
Global Payments Incorporated | 472,070 | 92,266,082 | ||||||||||||||
InterXion Holding NV † | 80,231 | 6,982,504 | ||||||||||||||
MasterCard Incorporated Class A | 517,370 | 163,457,878 | ||||||||||||||
MongoDB Incorporated † | 112,420 | 18,426,762 | ||||||||||||||
PayPal Holdings Incorporated † | 629,790 | 71,726,783 | ||||||||||||||
Square Incorporated Class A † | 120,100 | 8,970,269 | ||||||||||||||
Switch Incorporated Class A | 537,725 | 8,603,600 | ||||||||||||||
Twilio Incorporated Class A † | 270,139 | 33,589,083 | ||||||||||||||
Visa Incorporated Class A | 710,910 | 141,449,763 | ||||||||||||||
WEX Incorporated † | 178,389 | 38,696,142 | ||||||||||||||
| 647,382,506 | ||||||||||||||||
|
| |||||||||||||||
| Semiconductors & Semiconductor Equipment: 6.72% | ||||||||||||||||
Microchip Technology Incorporated | 1,549,990 | 151,093,025 | ||||||||||||||
Monolithic Power Systems Incorporated | 577,770 | 98,896,891 | ||||||||||||||
NXP Semiconductors NV | 53,800 | 6,825,068 | ||||||||||||||
Texas Instruments Incorporated | 520,380 | 62,783,847 | ||||||||||||||
| 319,598,831 | ||||||||||||||||
|
| |||||||||||||||
| Software: 18.82% | ||||||||||||||||
Adobe Incorporated † | 65,320 | 22,936,465 | ||||||||||||||
Anaplan Incorporated † | 369,339 | 21,270,233 | ||||||||||||||
BlackLine Incorporated † | 209,730 | 12,829,184 | ||||||||||||||
Cloudflare Incorporated Class A † | 593,192 | 10,594,409 | ||||||||||||||
Dropbox Incorporated Class A † | 394,400 | 6,712,688 | ||||||||||||||
Dynatrace Incorporated † | 1,606,632 | 50,303,648 | ||||||||||||||
Envestnet Incorporated † | 1,572,270 | 124,004,935 | ||||||||||||||
Everbridge Incorporated † | 165,200 | 14,973,728 | ||||||||||||||
HubSpot Incorporated † | 118,540 | 21,448,628 | ||||||||||||||
Microsoft Corporation | 1,644,250 | 279,900,678 | ||||||||||||||
Mimecast Limited † | 1,185,400 | 60,490,962 | ||||||||||||||
Proofpoint Incorporated † | 368,990 | 45,315,662 | ||||||||||||||
Rapid7 Incorporated † | 588,000 | 34,915,440 | ||||||||||||||
RealPage Incorporated † | 489,300 | 28,550,655 | ||||||||||||||
The accompanying notes are an integral part of these financial statements.
Wells Fargo Growth Fund | 9
Table of Contents
Portfolio of investments—January 31, 2020 (unaudited)
| Shares | Value | |||||||||||||||
| Software (continued) | ||||||||||||||||
RingCentral Incorporated Class A † | 23,400 | $ | 4,810,572 | |||||||||||||
Salesforce.com Incorporated † | 240,115 | 43,775,366 | ||||||||||||||
ServiceNow Incorporated † | 85,590 | 28,949,106 | ||||||||||||||
Splunk Incorporated † | 358,500 | 55,660,710 | ||||||||||||||
Talend SA ADR † | 758,700 | 27,996,030 | ||||||||||||||
| 895,439,099 | ||||||||||||||||
|
| |||||||||||||||
| Technology Hardware, Storage & Peripherals: 2.94% | ||||||||||||||||
Apple Incorporated | 451,940 | 139,879,949 | ||||||||||||||
|
| |||||||||||||||
Materials: 1.43% | ||||||||||||||||
| Chemicals: 1.43% | ||||||||||||||||
Linde plc | 239,760 | 48,702,449 | ||||||||||||||
PolyOne Corporation | 581,163 | 19,282,982 | ||||||||||||||
| 67,985,431 | ||||||||||||||||
|
| |||||||||||||||
Total Common Stocks (Cost $2,156,599,419) | 4,749,631,773 | |||||||||||||||
|
| |||||||||||||||
| Yield | ||||||||||||||||
| Short-Term Investments: 0.24% | ||||||||||||||||
Investment Companies: 0.24% | ||||||||||||||||
Securities Lending Cash Investments LLC (l)(r)(u) | 1.70 | % | 809,919 | 810,000 | ||||||||||||
Wells Fargo Government Money Market Fund Select Class (l)(u) | 1.51 | 10,749,554 | 10,749,554 | |||||||||||||
Total Short-Term Investments (Cost $11,559,554) | 11,559,554 | |||||||||||||||
|
| |||||||||||||||
| Total investments in securities (Cost $2,168,158,973) | 100.06 | % | 4,761,191,327 | |||||
Other assets and liabilities, net | (0.06 | ) | (2,671,982 | ) | ||||
|
|
|
| |||||
| Total net assets | 100.00 | % | $ | 4,758,519,345 | ||||
|
|
|
| |||||
| † | Non-income-earning security |
| « | All or a portion of this security is on loan. |
| (l) | The issuer of the security is an affiliated person of the Fund as defined in the Investment Company Act of 1940. |
| (r) | The investment is anon-registered investment company purchased with cash collateral received from securities on loan. |
| (u) | The rate represents the7-day annualized yield at period end. |
Abbreviations:
| ADR | American depositary receipt |
The accompanying notes are an integral part of these financial statements.
10 | Wells Fargo Growth Fund
Table of Contents
Portfolio of investments—January 31, 2020 (unaudited)
Investments in Affiliates
An affiliated investment is an investment in which the Fund owns at least 5% of the outstanding voting shares of the issuer or as a result of other relationships, such as the Fund and the issuer having the same investment manager. Transactions with issuers that were either affiliated persons of the Fund at the beginning of the period or the end of the period were as follows:
| Shares, beginning of period | Shares purchased | Shares sold | Shares, end of period | Net realized gains (losses) | Net change in unrealized gains (losses) | Income from affiliated securities | Value, end of period | % of net assets | ||||||||||||||||||||||||||||
| Short-Term Investments | ||||||||||||||||||||||||||||||||||||
Investment Companies | ||||||||||||||||||||||||||||||||||||
Securities Lending Cash Investments LLC | 18,742,078 | 389,446,853 | (407,379,012 | ) | 809,919 | $ | 6,487 | $ | (1,552 | ) | $ | 451,013 | # | $ | 810,000 | |||||||||||||||||||||
Wells Fargo Government Money Market Fund Select Class | 62,114,127 | 267,506,123 | (318,870,696 | ) | 10,749,554 | 0 | 0 | 231,232 | 10,749,554 | |||||||||||||||||||||||||||
|
|
|
|
|
|
|
|
|
| |||||||||||||||||||||||||||
| $ | 6,487 | $ | (1,552 | ) | $ | 682,245 | $ | 11,559,554 | 0.24 | % | ||||||||||||||||||||||||||
|
|
|
|
|
|
|
|
|
| |||||||||||||||||||||||||||
| # | Amount shown represents gross income before fees and rebates |
The accompanying notes are an integral part of these financial statements.
Wells Fargo Growth Fund | 11
Table of Contents
Statement of assets and liabilities—January 31, 2020 (unaudited)
Assets | ||||
Investments in unaffiliated securities (including $790,000 of securities loaned), at value (cost $2,156,599,419) | $ | 4,749,631,773 | ||
Investments in affiliated securities, at value (cost $11,559,554) | 11,559,554 | |||
Receivable for investments sold | 30,480,008 | |||
Receivable for Fund shares sold | 5,295,989 | |||
Receivable for dividends | 767,739 | |||
Receivable for securities lending income, net | 9,815 | |||
Prepaid expenses and other assets | 42,035 | |||
|
| |||
Total assets | 4,797,786,913 | |||
|
| |||
Liabilities | ||||
Payable upon receipt of securities loaned | 785,738 | |||
Payable for investments purchased | 25,534,206 | |||
Payable for Fund shares redeemed | 7,952,382 | |||
Management fee payable | 2,774,523 | |||
Administration fees payable | 696,676 | |||
Distribution fee payable | 89,425 | |||
Trustees’ fees and expenses payable | 7,087 | |||
Accrued expenses and other liabilities | 1,427,531 | |||
|
| |||
Total liabilities | 39,267,568 | |||
|
| |||
Total net assets | $ | 4,758,519,345 | ||
|
| |||
Net assets consist of | ||||
Paid-in capital | $ | 2,026,214,905 | ||
Total distributable earnings | 2,732,304,440 | |||
|
| |||
Total net assets | $ | 4,758,519,345 | ||
|
| |||
Computation of net asset value and offering price per share | ||||
Net assets – Class A | $ | 2,201,136,192 | ||
Shares outstanding – Class A1 | 64,421,729 | |||
Net asset value per share – Class A | $34.17 | |||
Maximum offering price per share – Class A2 | $36.25 | |||
Net assets – Class C | $ | 131,542,830 | ||
Shares outstanding – Class C1 | 5,596,592 | |||
Net asset value per share – Class C | $23.50 | |||
Net assets – Class R6 | $ | 360,151,001 | ||
Shares outstanding – Class R61 | 7,919,363 | |||
Net asset value per share – Class R6 | $45.48 | |||
Net assets – Administrator Class | $ | 525,410,895 | ||
Shares outstanding – Administrator Class1 | 12,889,336 | |||
Net asset value per share – Administrator Class | $40.76 | |||
Net assets – Institutional Class | $ | 1,540,278,427 | ||
Shares outstanding – Institutional Class1 | 33,998,386 | |||
Net asset value per share – Institutional Class | $45.30 | |||
| 1 | The Fund has an unlimited number of authorized shares. |
| 2 | Maximum offering price is computed as 100/94.25 of net asset value. On investments of $50,000 or more, the offering price is reduced. |
The accompanying notes are an integral part of these financial statements.
12 | Wells Fargo Growth Fund
Table of Contents
Statement of operations—six months ended January 31, 2020 (unaudited)
Investment income | ||||
Dividends (net of foreign withholding taxes of $44,069) | $ | 13,084,407 | ||
Income from affiliated securities | 399,325 | |||
|
| |||
Total investment income | 13,483,732 | |||
|
| |||
Expenses | ||||
Management fee | 16,320,684 | |||
Administration fees |
| |||
Class A | 2,240,248 | |||
Class C | 146,610 | |||
Class R6 | 51,483 | |||
Administrator Class | 356,353 | |||
Institutional Class | 978,422 | |||
Shareholder servicing fees |
| |||
Class A | 2,666,962 | |||
Class C | 174,535 | |||
Administrator Class | 685,295 | |||
Distribution fee |
| |||
Class C | 523,130 | |||
Custody and accounting fees | 80,155 | |||
Professional fees | 25,966 | |||
Registration fees | 61,151 | |||
Shareholder report expenses | 127,397 | |||
Trustees’ fees and expenses | 12,400 | |||
Other fees and expenses | 43,576 | |||
|
| |||
Total expenses | 24,494,367 | |||
Less: Fee waivers and/or expense reimbursements |
| |||
Fund-level | (461,974 | ) | ||
Class A | (322,658 | ) | ||
Class C | (4 | ) | ||
Class R6 | (32,815 | ) | ||
Administrator Class | (296,819 | ) | ||
Institutional Class | (517,958 | ) | ||
|
| |||
Net expenses | 22,862,139 | |||
|
| |||
Net investment loss | (9,378,407 | ) | ||
|
| |||
Realized and unrealized gains (losses) on investments | ||||
Net realized gains on |
| |||
Unaffiliated securities | 242,940,925 | |||
Affiliated securities | 6,487 | |||
|
| |||
Net realized gains on investments | 242,947,412 | |||
|
| |||
Net change in unrealized gains (losses) on |
| |||
Unaffiliated securities | 166,207,661 | |||
Affiliated securities | (1,552 | ) | ||
|
| |||
Net change in unrealized gains (losses) on investments | 166,206,109 | |||
|
| |||
Net realized and unrealized gains (losses) on investments | 409,153,521 | |||
|
| |||
Net increase in net assets resulting from operations | $ | 399,775,114 | ||
|
| |||
The accompanying notes are an integral part of these financial statements.
Wells Fargo Growth Fund | 13
Table of Contents
Statement of changes in net assets
| Six months ended January 31, 2020 (unaudited) | Year ended July 31, 2019 | |||||||||||||||
Operations |
| |||||||||||||||
Net investment loss | $ | (9,378,407 | ) | $ | (12,812,172 | ) | ||||||||||
Net realized gains on investments | 242,947,412 | 632,722,898 | ||||||||||||||
Net change in unrealized gains (losses) on investments | 166,206,109 | (63,288,246 | ) | |||||||||||||
|
| |||||||||||||||
Net increase in net assets resulting from operations | 399,775,114 | 556,622,480 | ||||||||||||||
|
| |||||||||||||||
Distributions to shareholders from net investment income and net realized gains | ||||||||||||||||
Class A | (247,668,290 | ) | (355,696,811 | ) | ||||||||||||
Class C | (20,979,782 | ) | (37,666,442 | ) | ||||||||||||
Class R6 | (31,160,181 | ) | (36,585,868 | ) | ||||||||||||
Administrator Class | (55,248,543 | ) | (78,768,918 | ) | ||||||||||||
Institutional Class | (133,918,973 | ) | (211,847,451 | ) | ||||||||||||
|
| |||||||||||||||
Total distributions to shareholders | (488,975,769 | ) | (720,565,490 | ) | ||||||||||||
|
| |||||||||||||||
Capital share transactions | Shares | Shares | ||||||||||||||
Proceeds from shares sold |
| |||||||||||||||
Class A | 1,611,509 | 55,033,322 | 2,458,750 | 81,981,928 | ||||||||||||
Class C | 338,294 | 7,869,434 | 746,761 | 17,066,886 | ||||||||||||
Class R6 | 696,761 | 31,367,430 | 2,698,823 | 114,509,957 | ||||||||||||
Administrator Class | 1,137,671 | 45,903,388 | 2,744,478 | 107,374,673 | ||||||||||||
Institutional Class | 2,926,085 | 130,248,708 | 5,400,449 | 232,172,883 | ||||||||||||
|
| |||||||||||||||
| 270,422,282 | 553,106,327 | |||||||||||||||
|
| |||||||||||||||
Reinvestment of distributions |
| |||||||||||||||
Class A | 7,496,102 | 239,800,299 | 12,007,593 | 343,056,930 | ||||||||||||
Class C | 799,568 | 17,614,481 | 1,566,352 | 32,721,099 | ||||||||||||
Class R6 | 688,571 | 29,298,699 | 995,813 | 36,576,208 | ||||||||||||
Administrator Class | 1,435,463 | 54,762,934 | 2,333,920 | 77,882,902 | ||||||||||||
Institutional Class | 3,048,613 | 129,230,698 | 5,586,200 | 204,566,633 | ||||||||||||
|
| |||||||||||||||
| 470,707,111 | 694,803,772 | |||||||||||||||
|
| |||||||||||||||
Payment for shares redeemed |
| |||||||||||||||
Class A | (4,208,993 | ) | (145,281,681 | ) | (10,353,405 | ) | (346,975,927 | ) | ||||||||
Class C | (1,574,063 | ) | (38,849,839 | ) | (2,391,955 | ) | (58,387,097 | ) | ||||||||
Class R6 | (822,893 | ) | (36,815,297 | ) | (1,446,729 | ) | (63,083,744 | ) | ||||||||
Administrator Class | (3,198,093 | ) | (128,188,593 | ) | (4,421,943 | ) | (173,395,539 | ) | ||||||||
Institutional Class | (4,884,294 | ) | (219,786,061 | ) | (12,123,280 | ) | (516,616,632 | ) | ||||||||
|
| |||||||||||||||
| (568,921,471 | ) | (1,158,458,939 | ) | |||||||||||||
|
| |||||||||||||||
Net increase in net assets resulting from capital share transactions | 172,207,922 | 89,451,160 | ||||||||||||||
|
| |||||||||||||||
Total increase (decrease) in net assets | 83,007,267 | (74,491,850 | ) | |||||||||||||
|
| |||||||||||||||
Net assets | ||||||||||||||||
Beginning of period | 4,675,512,078 | 4,750,003,928 | ||||||||||||||
|
| |||||||||||||||
End of period | $ | 4,758,519,345 | $ | 4,675,512,078 | ||||||||||||
|
| |||||||||||||||
The accompanying notes are an integral part of these financial statements.
14 | Wells Fargo Growth Fund
Table of Contents
(For a share outstanding throughout each period)
| Six months ended January 31, 2020 (unaudited) | Year ended July 31 | |||||||||||||||||||||||
| CLASS A | 2019 | 2018 | 2017 | 2016 | 2015 | |||||||||||||||||||
Net asset value, beginning of period | $35.56 | $38.67 | $40.38 | $42.28 | $49.50 | $49.99 | ||||||||||||||||||
Net investment loss | (0.10 | )1 | (0.13 | ) | (0.12 | ) | (0.19 | )1 | (0.20 | )1 | (0.29 | )1 | ||||||||||||
Net realized and unrealized gains (losses) on investments | 2.99 | 3.73 | 9.49 | 5.61 | (0.99 | ) | 7.03 | |||||||||||||||||
|
|
|
|
|
|
|
|
|
|
|
| |||||||||||||
Total from investment operations | 2.89 | 3.60 | 9.37 | 5.42 | (1.19 | ) | 6.74 | |||||||||||||||||
Distributions to shareholders from | ||||||||||||||||||||||||
Net realized gains | (4.28 | ) | (6.71 | ) | (11.08 | ) | (7.32 | ) | (6.03 | ) | (7.23 | ) | ||||||||||||
Net asset value, end of period | $34.17 | $35.56 | $38.67 | $40.38 | $42.28 | $49.50 | ||||||||||||||||||
Total return2 | 8.94 | % | 13.55 | % | 27.66 | % | 15.95 | % | (1.69 | )% | 15.01 | % | ||||||||||||
Ratios to average net assets (annualized) | ||||||||||||||||||||||||
Gross expenses | 1.17 | % | 1.18 | % | 1.18 | % | 1.17 | % | 1.15 | % | 1.18 | % | ||||||||||||
Net expenses | 1.13 | % | 1.16 | % | 1.16 | % | 1.16 | % | 1.14 | % | 1.18 | % | ||||||||||||
Net investment loss | (0.55 | )% | (0.45 | )% | (0.45 | )% | (0.49 | )% | (0.49 | )% | (0.59 | )% | ||||||||||||
Supplemental data | ||||||||||||||||||||||||
Portfolio turnover rate | 17 | % | 39 | % | 37 | % | 42 | % | 38 | % | 35 | % | ||||||||||||
Net assets, end of period (000s omitted) | $2,201,136 | $2,116,542 | $2,142,855 | $1,950,551 | $2,582,955 | $1,465,643 | ||||||||||||||||||
| 1 | Calculated based upon average shares outstanding |
| 2 | Total return calculations do not include any sales charges. Returns for periods of less than one year are not annualized. |
The accompanying notes are an integral part of these financial statements.
Wells Fargo Growth Fund | 15
Table of Contents
Financial highlights
(For a share outstanding throughout each period)
| Six months ended January 31, 2020 (unaudited) | Year ended July 31 | |||||||||||||||||||||||
| CLASS C | 2019 | 2018 | 2017 | 2016 | 2015 | |||||||||||||||||||
Net asset value, beginning of period | $25.87 | $30.33 | $34.05 | $37.07 | $44.51 | $45.95 | ||||||||||||||||||
Net investment loss | (0.17 | )1 | (0.31 | )1 | (0.33 | ) | (0.41 | )1 | (0.46 | )1 | (0.60 | )1 | ||||||||||||
Net realized and unrealized gains (losses) on investments | 2.08 | 2.56 | 7.69 | 4.71 | (0.95 | ) | 6.39 | |||||||||||||||||
|
|
|
|
|
|
|
|
|
|
|
| |||||||||||||
Total from investment operations | 1.91 | 2.25 | 7.36 | 4.30 | (1.41 | ) | 5.79 | |||||||||||||||||
Distributions to shareholders from | ||||||||||||||||||||||||
Net realized gains | (4.28 | ) | (6.71 | ) | (11.08 | ) | (7.32 | ) | (6.03 | ) | (7.23 | ) | ||||||||||||
Net asset value, end of period | $23.50 | $25.87 | $30.33 | $34.05 | $37.07 | $44.51 | ||||||||||||||||||
Total return2 | 8.48 | % | 12.68 | % | 26.73 | % | 15.05 | % | (2.44 | )% | 14.16 | % | ||||||||||||
Ratios to average net assets (annualized) | ||||||||||||||||||||||||
Gross expenses | 1.92 | % | 1.93 | % | 1.93 | % | 1.92 | % | 1.90 | % | 1.93 | % | ||||||||||||
Net expenses | 1.91 | % | 1.91 | % | 1.91 | % | 1.91 | % | 1.89 | % | 1.93 | % | ||||||||||||
Net investment loss | (1.32 | )% | (1.19 | )% | (1.19 | )% | (1.23 | )% | (1.24 | )% | (1.34 | )% | ||||||||||||
Supplemental data | ||||||||||||||||||||||||
Portfolio turnover rate | 17 | % | 39 | % | 37 | % | 42 | % | 38 | % | 35 | % | ||||||||||||
Net assets, end of period (000s omitted) | $131,543 | $156,056 | $185,346 | $205,607 | $321,032 | $465,833 | ||||||||||||||||||
| 1 | Calculated based upon average shares outstanding |
| 2 | Total return calculations do not include any sales charges. Returns for periods of less than one year are not annualized. |
The accompanying notes are an integral part of these financial statements.
16 | Wells Fargo Growth Fund
Table of Contents
Financial highlights
(For a share outstanding throughout each period)
| Six months ended January 31, 2020 (unaudited) | Year ended July 31 | |||||||||||||||||||
| CLASS R6 | 2019 | 2018 | 2017 | 20161 | ||||||||||||||||
Net asset value, beginning of period | $45.84 | $47.53 | $47.13 | $47.90 | $48.97 | |||||||||||||||
Net investment income (loss) | (0.03 | ) | 0.00 | 2,3 | (0.01 | )2 | (0.02 | )2 | (0.02 | ) | ||||||||||
Net realized and unrealized gains (losses) on investments | 3.95 | 5.02 | 11.49 | 6.57 | 4.98 | |||||||||||||||
|
|
|
|
|
|
|
|
|
| |||||||||||
Total from investment operations | 3.92 | 5.02 | 11.48 | 6.55 | 4.96 | |||||||||||||||
Distributions to shareholders from | ||||||||||||||||||||
Net realized gains | (4.28 | ) | (6.71 | ) | (11.08 | ) | (7.32 | ) | (6.03 | ) | ||||||||||
Net asset value, end of period | $45.48 | $45.84 | $47.53 | $47.13 | $47.90 | |||||||||||||||
Total return4 | 9.19 | % | 14.06 | % | 28.26 | % | 16.49 | % | 10.89 | % | ||||||||||
Ratios to average net assets (annualized) | ||||||||||||||||||||
Gross expenses | 0.74 | % | 0.75 | % | 0.75 | % | 0.74 | % | 0.74 | % | ||||||||||
Net expenses | 0.70 | % | 0.70 | % | 0.70 | % | 0.70 | % | 0.70 | % | ||||||||||
Net investment income (loss) | (0.12 | )% | 0.00 | % | (0.02 | )% | (0.05 | )% | (0.23 | )% | ||||||||||
Supplemental data | ||||||||||||||||||||
Portfolio turnover rate | 17 | % | 39 | % | 37 | % | 42 | % | 38 | % | ||||||||||
Net assets, end of period (000s omitted) | $360,151 | $337,260 | $242,838 | $49,454 | $30,906 | |||||||||||||||
| 1 | For the period from September 30, 2015 (commencement of class operations) to July 31, 2016 |
| 2 | Calculated based upon average shares outstanding |
| 3 | Amount is less than $0.005. |
| 4 | Returns for periods of less than one year are not annualized. |
The accompanying notes are an integral part of these financial statements.
Wells Fargo Growth Fund | 17
Table of Contents
Financial highlights
(For a share outstanding throughout each period)
| Six months ended January 31, 2020 (unaudited) | Year ended July 31 | |||||||||||||||||||||||
| ADMINISTRATOR CLASS | 2019 | 2018 | 2017 | 2016 | 2015 | |||||||||||||||||||
Net asset value, beginning of period | $41.58 | $43.89 | $44.40 | $45.66 | $52.86 | $52.80 | ||||||||||||||||||
Net investment loss | (0.08 | )1 | (0.10 | )1 | (0.11 | )1 | (0.11 | )1 | (0.14 | )1 | (0.20 | )1 | ||||||||||||
Net realized and unrealized gains (losses) on investments | 3.54 | 4.50 | 10.68 | 6.17 | (1.03 | ) | 7.49 | |||||||||||||||||
|
|
|
|
|
|
|
|
|
|
|
| |||||||||||||
Total from investment operations | 3.46 | 4.40 | 10.57 | 6.06 | (1.17 | ) | 7.29 | |||||||||||||||||
Distributions to shareholders from | ||||||||||||||||||||||||
Net realized gains | (4.28 | ) | (6.71 | ) | (11.08 | ) | (7.32 | ) | (6.03 | ) | (7.23 | ) | ||||||||||||
Net asset value, end of period | $40.76 | $41.58 | $43.89 | $44.40 | $45.66 | $52.86 | ||||||||||||||||||
Total return2 | 9.02 | % | 13.78 | % | 27.90 | % | 16.20 | % | (1.53 | )% | 15.28 | % | ||||||||||||
Ratios to average net assets (annualized) | ||||||||||||||||||||||||
Gross expenses | 1.09 | % | 1.10 | % | 1.10 | % | 1.09 | % | 1.07 | % | 1.02 | % | ||||||||||||
Net expenses | 0.96 | % | 0.96 | % | 0.96 | % | 0.96 | % | 0.96 | % | 0.96 | % | ||||||||||||
Net investment loss | (0.38 | )% | (0.25 | )% | (0.24 | )% | (0.27 | )% | (0.31 | )% | (0.37 | )% | ||||||||||||
Supplemental data | ||||||||||||||||||||||||
Portfolio turnover rate | 17 | % | 39 | % | 37 | % | 42 | % | 38 | % | 35 | % | ||||||||||||
Net assets, end of period (000s omitted) | $525,411 | $561,900 | $564,391 | $637,987 | $1,528,288 | $2,349,359 | ||||||||||||||||||
| 1 | Calculated based upon average shares outstanding |
| 2 | Returns for periods of less than one year are not annualized. |
The accompanying notes are an integral part of these financial statements.
18 | Wells Fargo Growth Fund
Table of Contents
Financial highlights
(For a share outstanding throughout each period)
| Six months ended January 31, 2020 (unaudited) | Year ended July 31 | |||||||||||||||||||||||
| INSTITUTIONAL CLASS | 2019 | 2018 | 2017 | 2016 | 2015 | |||||||||||||||||||
Net asset value, beginning of period | $45.70 | $47.43 | $47.07 | $47.87 | $54.99 | $54.54 | ||||||||||||||||||
Net investment loss | (0.04 | )1 | (0.01 | )1 | (0.02 | )1 | (0.04 | )1 | (0.05 | )1 | (0.09 | )1 | ||||||||||||
Net realized and unrealized gains (losses) on investments | 3.92 | 4.99 | 11.46 | 6.56 | (1.04 | ) | 7.77 | |||||||||||||||||
|
|
|
|
|
|
|
|
|
|
|
| |||||||||||||
Total from investment operations | 3.88 | 4.98 | 11.44 | 6.52 | (1.09 | ) | 7.68 | |||||||||||||||||
Distributions to shareholders from | ||||||||||||||||||||||||
Net realized gains | (4.28 | ) | (6.71 | ) | (11.08 | ) | (7.32 | ) | (6.03 | ) | (7.23 | ) | ||||||||||||
Net asset value, end of period | $45.30 | $45.70 | $47.43 | $47.07 | $47.87 | $54.99 | ||||||||||||||||||
Total return2 | 9.13 | % | 14.00 | % | 28.21 | % | 16.44 | % | (1.31 | )% | 15.53 | % | ||||||||||||
Ratios to average net assets (annualized) | ||||||||||||||||||||||||
Gross expenses | 0.84 | % | 0.85 | % | 0.85 | % | 0.84 | % | 0.82 | % | 0.76 | % | ||||||||||||
Net expenses | 0.75 | % | 0.75 | % | 0.75 | % | 0.75 | % | 0.75 | % | 0.75 | % | ||||||||||||
Net investment loss | (0.17 | )% | (0.03 | )% | (0.03 | )% | (0.08 | )% | (0.10 | )% | (0.17 | )% | ||||||||||||
Supplemental data | ||||||||||||||||||||||||
Portfolio turnover rate | 17 | % | 39 | % | 37 | % | 42 | % | 38 | % | 35 | % | ||||||||||||
Net assets, end of period (000s omitted) | $1,540,278 | $1,503,753 | $1,614,575 | $1,655,724 | $2,398,134 | $3,863,196 | ||||||||||||||||||
| 1 | Calculated based upon average shares outstanding |
| 2 | Returns for periods of less than one year are not annualized. |
The accompanying notes are an integral part of these financial statements.
Wells Fargo Growth Fund | 19
Table of Contents
Notes to financial statements (unaudited)
1. ORGANIZATION
Wells Fargo Funds Trust (the “Trust”), a Delaware statutory trust organized on March 10, 1999, is anopen-end management investment company registered under the Investment Company Act of 1940, as amended (the “1940 Act”). As an investment company, the Trust follows the accounting and reporting guidance in Financial Accounting Standards Board (“FASB”)Accounting Standards Codification Topic 946, Financial Services – Investment Companies. These financial statements report on the Wells Fargo Growth Fund (the “Fund”) which is a diversified series of the Trust.
2. SIGNIFICANT ACCOUNTING POLICIES
The following significant accounting policies, which are consistently followed in the preparation of the financial statements of the Fund, are in conformity with U.S. generally accepted accounting principles which require management to make estimates and assumptions that affect the reported amounts of assets and liabilities, disclosure of contingent assets and liabilities at the date of the financial statements, and the reported amounts of revenues and expenses during the reporting period. Actual results could differ from those estimates.
Securities valuation
All investments are valued each business day as of the close of regular trading on the New York Stock Exchange (generally 4 p.m. Eastern Time), although the Fund may deviate from this calculation time under unusual or unexpected circumstances.
Equity securities that are listed on a foreign or domestic exchange or market are valued at the official closing price or, if none, the last sales price. If no sale occurs on the principal exchange or market that day, a fair value price will be determined in accordance with the Fund’s Valuation Procedures.
Investments in registeredopen-end investment companies are valued at net asset value. Interests innon-registered investment companies that are redeemable at net asset value are fair valued normally at net asset value.
Investments which are not valued using any of the methods discussed above are valued at their fair value, as determined in good faith by the Board of Trustees of the Fund. The Board of Trustees has established a Valuation Committee comprised of the Trustees and has delegated to it the authority to take any actions regarding the valuation of portfolio securities that the Valuation Committee deems necessary or appropriate, including determining the fair value of portfolio securities, unless the determination has been delegated to the Wells Fargo Asset Management Pricing Committee at Wells Fargo Funds Management, LLC (“Funds Management”).The Board of Trustees retains the authority to make or ratify any valuation decisions or approve any changes to the Valuation Procedures as it deems appropriate. On a quarterly basis, the Board of Trustees receives reports on any valuation actions taken by the Valuation Committee or the Wells Fargo Asset Management Pricing Committee which may include items for ratification.
Foreign currency translation
The accounting records of the Fund are maintained in U.S. dollars. The values of other assets and liabilities denominated in foreign currencies are translated into U.S. dollars at rates provided by an independent foreign currency pricing source at a time each business day specified by the Wells Fargo Asset Management Pricing Committee. Purchases and sales of securities, and income and expenses are converted at the rate of exchange on the respective dates of such transactions. Net realized foreign exchange gains or losses arise from sales of foreign currencies, currency gains or losses realized between the trade and settlement dates on securities transactions, and the difference between the amounts of dividends, interest and foreign withholding taxes recorded and the U.S. dollar equivalent of the amounts actually paid or received. Net unrealized foreign exchange gains and losses arise from changes in the fair value of assets and liabilities other than investments in securities resulting from changes in exchange rates. The changes in net assets arising from changes in exchange rates of securities and the changes in net assets resulting from changes in market prices of securities are not separately presented. Such changes are included in net realized and unrealized gains or losses from investments.
Securities lending
The Fund may lend its securities from time to time in order to earn additional income in the form of fees or interest on securities received as collateral or the investment of any cash received as collateral. When securities are on loan, the Fund receives interest or dividends on those securities. Cash collateral received in connection with its securities lending transactions is invested in Securities Lending Cash Investments, LLC (the “Securities Lending Fund”). Investments in Securities Lending Fund are valued at the evaluated bid price provided by an independent pricing service. Income earned from investment in the Securities Lending Fund (net of fees and rebates), if any, is included in income from affiliated securities on the Statement of Operations.
In a securities lending transaction, the net asset value of the Fund is affected by an increase or decrease in the value of the securities loaned and by an increase or decrease in the value of the instrument in which collateral is invested. The amount of securities lending
20 | Wells Fargo Growth Fund
Table of Contents
Notes to financial statements (unaudited)
activity undertaken by the Fund fluctuates from time to time. The Fund has the right under the lending agreement to recover the securities from the borrower on demand. In the event of default or bankruptcy by the borrower, the Fund may be prevented from recovering the loaned securities or gaining access to the collateral or may experience delays or costs in doing so. In such an event, the terms of the agreement allows the unaffiliated securities lending agent to use the collateral to purchase replacement securities on behalf of the Fund or pay the Fund the market value of the loaned securities. The Fund bears the risk of loss with respect to depreciation of its investment of the cash collateral.
Security transactions and income recognition
Securities transactions are recorded on a trade date basis. Realized gains or losses are recorded on the basis of identified cost.
Dividend income is recognized on theex-dividend date. Dividend income is recorded net of foreign taxes withheld where recovery of such taxes is not assured.
Distributions to shareholders
Distributions to shareholders from net investment income and any net realized gains are recorded on theex-dividend date and paid at least annually. Such distributions are determined in accordance with income tax regulations and may differ from U.S. generally accepted accounting principles. Dividend sources are estimated at the time of declaration. The tax character of distributions is determined as of the Fund’s fiscal year end. Therefore, a portion of the Fund’s distributions made prior to the Fund’s fiscal year end may be categorized as a tax return of capital at year end.
Federal and other taxes
The Fund intends to continue to qualify as a regulated investment company by distributing substantially all of its investment company taxable income and any net realized capital gains (after reduction for capital loss carryforwards) sufficient to relieve it from all, or substantially all, federal income taxes. Accordingly, no provision for federal income taxes was required.
The Fund’s income and federal excise tax returns and all financial records supporting those returns for the prior three fiscal years are subject to examination by the federal and Delaware revenue authorities. Management has analyzed the Fund’s tax positions taken on federal, state, and foreign tax returns for all open tax years and does not believe that there are any uncertain tax positions that require recognition of a tax liability.
As of January 31, 2020, the aggregate cost of all investments for federal income tax purposes was $2,164,263,061 and the unrealized gains (losses) consisted of:
Gross unrealized gains | $ | 2,602,071,497 | ||
Gross unrealized losses | (5,143,231 | ) | ||
Net unrealized gains | $ | 2,596,928,266 | ||
As of July 31, 2019, the Fund had a qualified late-year ordinary loss of $9,108,551 which was recognized on the first day of the current fiscal year.
Class allocations
The separate classes of shares offered by the Fund differ principally in applicable sales charges, distribution, shareholder servicing, and administration fees. Class specific expenses are charged directly to that share class. Investment income, common fund-level expenses, and realized and unrealized gains (losses) on investments are allocated daily to each class of shares based on the relative proportion of net assets of each class.
3. FAIR VALUATION MEASUREMENTS
Fair value measurements of investments are determined within a framework that has established a fair value hierarchy based upon the various data inputs utilized in determining the value of the Fund’s investments. The three-level hierarchy gives the highest priority to unadjusted quoted prices in active markets for identical assets or liabilities (Level 1) and the lowest priority to unobservable inputs (Level 3). The Fund’s investments are classified within the fair value hierarchy based on the lowest level of input that is significant to the fair value measurement. The inputs are summarized into three broad levels as follows:
| ∎ | Level 1 – quoted prices in active markets for identical securities |
| ∎ | Level 2 – other significant observable inputs (including quoted prices for similar securities, interest rates, prepayment speeds, credit risk, etc.) |
| ∎ | Level 3 – significant unobservable inputs (including the Fund’s own assumptions in determining the fair value of investments) |
Wells Fargo Growth Fund | 21
Table of Contents
Notes to financial statements (unaudited)
The inputs or methodologies used for valuing investments in securities are not necessarily an indication of the risk associated with investing in those securities.
The following is a summary of the inputs used in valuing the Fund’s assets and liabilities as of January 31, 2020:
| Quoted prices (Level 1) | Other significant observable inputs (Level 2) | Significant (Level 3) | Total | |||||||||||||
Assets | ||||||||||||||||
Investments in: | ||||||||||||||||
Common stocks | ||||||||||||||||
Communication services | $ | 456,613,479 | $ | 0 | $ | 0 | $ | 456,613,479 | ||||||||
Consumer discretionary | 807,501,432 | 0 | 0 | 807,501,432 | ||||||||||||
Consumer staples | 95,978,232 | 0 | 0 | 95,978,232 | ||||||||||||
Financials | 205,177,958 | 0 | 0 | 205,177,958 | ||||||||||||
Health care | 501,534,367 | 0 | 0 | 501,534,367 | ||||||||||||
Industrials | 612,540,489 | 0 | 0 | 612,540,489 | ||||||||||||
Information technology | 2,002,300,385 | 0 | 0 | 2,002,300,385 | ||||||||||||
Materials | 67,985,431 | 0 | 0 | 67,985,431 | ||||||||||||
Short-term investments | ||||||||||||||||
Investment companies | 11,559,554 | 0 | 0 | 11,559,554 | ||||||||||||
Total assets | $ | 4,761,191,327 | $ | 0 | $ | 0 | $ | 4,761,191,327 | ||||||||
Additional sector, industry or geographic detail is included in the Portfolio of Investments.
For the six months ended January 31, 2020, the Fund did not have any transfers into/out of Level 3.
4. TRANSACTIONS WITH AFFILIATES
Management fee
Funds Management, an indirect wholly owned subsidiary of Wells Fargo & Company (“Wells Fargo”), is the manager of the Fund and provides advisory and fund-level administrative services under an investment management agreement. Under the investment management agreement, Funds Management is responsible for, among other services, implementing the investment objectives and strategies of the Fund, supervising the subadviser and providing fund-level administrative services in connection with the Fund’s operations. As compensation for its services under the investment management agreement, Funds Management is entitled to receive a management fee at the following annual rate based on the Fund’s average daily net assets:
| Average daily net assets | Management fee | |||
First $500 million | 0.800 | % | ||
Next $500 million | 0.750 | |||
Next $1 billion | 0.700 | |||
Next $2 billion | 0.675 | |||
Next $1 billion | 0.650 | |||
Next $3 billion | 0.640 | |||
Next $2 billion | 0.615 | |||
Next $2 billion | 0.605 | |||
Next $4 billion | 0.580 | |||
Over $16 billion | 0.555 | |||
For the six months ended January 31, 2020, the management fee was equivalent to an annual rate of 0.70% of the Fund’s average daily net assets.
Funds Management has retained the services of a subadviser to provide daily portfolio management to the Fund. The fee for subadvisory services is borne by Funds Management. Wells Capital Management Incorporated (“WellsCap”), an affiliate of
22 | Wells Fargo Growth Fund
Table of Contents
Notes to financial statements (unaudited)
Funds Management and an indirect wholly owned subsidiary of Wells Fargo, is the subadviser to the Fund and is entitled to receive a fee from Funds Management at an annual rate starting at 0.45% and declining to 0.30% as the average daily net assets of the Fund increase.
Administration fees
Under a class-level administration agreement, Funds Management provides class-level administrative services to the Fund, which includes paying fees and expenses for services provided by the transfer agent,sub-transfer agents, omnibus account servicers and record-keepers. As compensation for its services under the class-level administration agreement, Funds Management receives an annual fee which is calculated based on the average daily net assets of each class as follows:
| Class-level administration fee | ||||
Class A, Class C | 0.21 | % | ||
Class R6 | 0.03 | |||
Administrator Class, Institutional Class | 0.13 | |||
Waivers and/or expense reimbursements
Funds Management has contractually waived and/or reimbursed management and administration fees to the extent necessary to maintain certain net operating expense ratios for the Fund. When each class of the Fund has exceeded its expense cap, Funds Management has waived fees and/or reimbursed expenses from fund-level expenses on a proportionate basis and then from class specific expenses. When only certain classes exceed their expense caps, waivers and/or reimbursements are applied against class specific expenses before fund-level expenses. Funds Management has committed through November 30, 2020 to waive fees and/or reimburse expenses to the extent necessary to cap the Fund’s expenses at 1.16% for Class A shares, 1.91% for Class C shares, 0.70% for Class R6 shares, 0.96% for Administrator Class shares, and 0.75% for Institutional Class shares. Prior to or after the commitment expiration date, the cap may be increased or the commitment to maintain the cap may be terminated only with the approval of the Board of Trustees.
Distribution fee
The Trust has adopted a distribution plan for Class C shares of the Fund pursuant to Rule12b-1 under the 1940 Act. A distribution fee is charged to Class C shares and paid to Wells Fargo Funds Distributor, LLC (“Funds Distributor”), the principal underwriter, at an annual rate of 0.75% of the average daily net assets of Class C shares.
In addition, Funds Distributor is entitled to receive thefront-end sales charge from the purchase of Class A shares and a contingent deferred sales charge on the redemption of certain Class A shares. Funds Distributor is also entitled to receive the contingent deferred sales charges from redemptions of Class C shares. For the six months ended January 31, 2020, Funds Distributor received $14,607 from the sale of Class A shares and $10 in contingent deferred sales charges from redemptions of Class C shares. No contingent deferred sales charges were incurred by Class A shares for the six months ended January 31, 2020.
Shareholder servicing fees
The Trust has entered into contracts with one or more shareholder servicing agents, whereby Class A, Class C, Class, and Administrator Class of the Fund are charged a fee at an annual rate of 0.25% of the average daily net assets of each respective class. A portion of these total shareholder servicing fees were paid to affiliates of Wells Fargo.
Interfund transactions
The Fund may purchase or sell portfolio investment securities to certain other Wells Fargo affiliates pursuant to Rule17a-7 under the 1940 Act and under procedures adopted by the Board of Trustees. The procedures have been designed to ensure that these interfund transactions, which do not incur broker commissions, are effected at current market prices.
5. INVESTMENT PORTFOLIO TRANSACTIONS
Purchases and sales of investments, excluding U.S. government obligations (if any) and short-term securities, for the six months ended January 31, 2020 were $759,352,613 and $1,026,556,428, respectively.
6. SECURITIES LENDING TRANSACTIONS
The Fund lends its securities through an unaffiliated securities lending agent and receives collateral in the form of cash or securities with a value at least equal to the value of the securities on loan. The value of the loaned securities is determined at the close of each business day and any increases or decreases in the required collateral are exchanged between the Fund and the counterparty on the
Wells Fargo Growth Fund | 23
Table of Contents
Notes to financial statements (unaudited)
next business day. Cash collateral received is invested in the Securities Lending Fund which seeks to provide a positive return compared to the daily Fed Funds Open Rate by investing in high-quality, U.S. dollar-denominated short-term money market instruments and is exempt from registration under Section 3(c)(7) of the 1940 Act. Securities Lending Fund is managed by Funds Management and is subadvised by WellsCap. Funds Management receives an advisory fee starting at 0.05% and declining to 0.01% as the average daily net assets of the Securities Lending Fund increase. All of the fees received by Funds Management are paid to WellsCap for its services as subadviser.
In the event of counterparty default or the failure of a borrower to return a loaned security, the Fund has the right to use the collateral to offset any losses incurred. As of January 31, 2020, the Fund had securities lending transactions with the following counterparties which are subject to offset:
| Counterparty | Value of securities on loan | Collateral received1 | Net amount | |||||||||
JPMorgan Securities LLC | $ | 790,000 | $ | (790,000 | ) | $ | 0 | |||||
| 1 | Collateral received within this table is limited to the collateral for the net transaction with the counterparty. |
7. BANK BORROWINGS
The Trust (excluding the money market funds), Wells Fargo Master Trust and Wells Fargo Variable Trust are parties to a $280,000,000 revolving credit agreement whereby the Fund is permitted to use bank borrowings for temporary or emergency purposes, such as to fund shareholder redemption requests. Interest under the credit agreement is charged to the Fund based on a borrowing rate equal to the higher of the Federal Funds rate in effect on that day plus 1.25% or the overnight LIBOR rate in effect on that day plus 1.25%. In addition, an annual commitment fee equal to 0.25% of the unused balance is allocated to each participating fund.
For the six months ended January 31, 2020, there were no borrowings by the Fund under the agreement.
8. CONCENTRATION RISK
Concentration risks result from exposure to a limited number of sectors. As of the end of the period, the Fund invests a concentration of its portfolio in the information technology sector. A fund that invests a substantial portion of its assets in any sector may be more affected by changes in that sector than would be a fund whose investments are not heavily weighted in any sector.
9. INDEMNIFICATION
Under the Trust’s organizational documents, the officers and Trustees have been granted certain indemnification rights against certain liabilities that may arise out of performance of their duties to the Trust. Additionally, in the normal course of business, the Trust may enter into contracts with service providers that contain a variety of indemnification clauses. The Trust’s maximum exposure under these arrangements is dependent on future claims that may be made against the Fund and, therefore, cannot be estimated.
10. NEW ACCOUNTING PRONOUNCEMENT
In August 2018, FASB issued Accounting Standards Update (“ASU”)No. 2018-13, Fair Value Measurement (Topic 820)Disclosure Framework—Changes to the Disclosure Requirements for Fair Value Measurement. ASU2018-13 updates the disclosure requirements for fair value measurements by modifying or removing certain disclosures and adding certain new disclosures. The amendments are effective for fiscal years, and interim periods within those fiscal years, beginning after December 15, 2019. Early adoption is permitted. Management has adopted the removal and modification of disclosures early, as permitted, and will adopt the additional new disclosures at the effective date.
11. SUBSEQUENT EVENT
On March 11, 2020, the World Health Organization announced that it had made the assessment that coronavirus disease 2019 (“COVID-19”) is a pandemic. The impacts of COVID-19 is adversely affecting the entire global economy, individual companies and investment products, and the market in general. There is significant uncertainty around the extent and duration of business disruptions related to COVID-19 and the impact may be short term or may last for an extended period of time. The risk of further spreading of COVID-19 has led to significant uncertainty and volatility in the financial markets and the value of the Fund and the securities in which the Fund invests may be adversely affected by impacts caused by COVID-19.
24 | Wells Fargo Growth Fund
Table of Contents
PROXY VOTING INFORMATION
A description of the policies and procedures used to determine how to vote proxies relating to portfolio securities is available, upon request, by calling1-800-222-8222, visiting our website atwfam.com, or visiting the SEC website at sec.gov. Information regarding how the proxies related to portfolio securities were voted during the most recent12-month period ended June 30 is available on the website atwfam.comor by visiting the SEC website at sec.gov.
QUARTERLY PORTFOLIO HOLDINGS INFORMATION
The Fund files its complete schedule of portfolio holdings with the SEC for the first and third quarters of each fiscal year as an exhibit to its reports on FormN-PORT. Shareholders may view the filed FormN-PORT by visiting the SEC website at sec.gov.
Wells Fargo Growth Fund | 25
Table of Contents
Other information (unaudited)
BOARD OF TRUSTEES AND OFFICERS
Each of the Trustees and Officers1 listed in the table below acts in identical capacities for each fund in the Wells Fargo family of funds, which consists of 149 mutual funds comprising the Wells Fargo Funds Trust, Wells Fargo Variable Trust, Wells Fargo Master Trust and fourclosed-end funds (collectively the “Fund Complex”). This table should be read in conjunction with the Prospectus and the Statement of Additional Information2. The mailing address of each Trustee and Officer is 525 Market Street, 12th Floor, San Francisco, CA 94105. Each Trustee and Officer serves an indefinite term, however, each Trustee serves such term until reaching the mandatory retirement age established by the Trustees.
Independent Trustees
Name and year of birth | Position held and length of service* | Principal occupations during past five years or longer | Current other public company or investment company directorships | |||
William R. Ebsworth (Born 1957) | Trustee, since 2015 | Retired. From 1984 to 2013, equities analyst, portfolio manager, research director and chief investment officer at Fidelity Management and Research Company in Boston, Tokyo, and Hong Kong, and retired in 2013 as Chief Investment Officer of Fidelity Strategic Advisers, Inc. where he led a team of investment professionals managing client assets. Prior thereto, Board member of Hong Kong Securities Clearing Co., Hong Kong Options Clearing Corp., the Thailand International Fund, Ltd., Fidelity Investments Life Insurance Company, and Empire Fidelity Investments Life Insurance Company. Audit Committee Chair and Investment Committee Chair of the Vincent Memorial Hospital Endowment(non-profit organization). Mr. Ebsworth is a CFA® charterholder. | N/A | |||
Jane A. Freeman (Born 1953) | Trustee, since 2015; Chair Liaison, since 2018 | Retired. From 2012 to 2014 and 1999 to 2008, Chief Financial Officer of Scientific Learning Corporation. From 2008 to 2012, Ms. Freeman provided consulting services related to strategic business projects. Prior to 1999, Portfolio Manager at Rockefeller & Co. and Scudder, Stevens & Clark. Board member of the Harding Loevner Funds from 1996 to 2014, serving as both Lead Independent Director and chair of the Audit Committee. Board member of the Russell Exchange Traded Funds Trust from 2011 to 2012 and the chair of the Audit Committee. Ms. Freeman is a Board Member of The Ruth Bancroft Garden(non-profit organization). She is also an inactive Chartered Financial Analyst. | N/A | |||
Isaiah Harris, Jr. (Born 1952) | Trustee, since 2009; Audit Committee Chairman, since 2019 | Retired. Chairman of the Board of CIGNA Corporation since 2009, and Director since 2005. From 2003 to 2011, Director of Deluxe Corporation. Prior thereto, President and CEO of BellSouth Advertising and Publishing Corp. from 2005 to 2007, President and CEO of BellSouth Enterprises from 2004 to 2005 and President of BellSouth Consumer Services from 2000 to 2003. Emeritus member of the Iowa State University Foundation Board of Governors. Emeritus Member of the Advisory Board of Iowa State University School of Business. Advisory Board Member, Palm Harbor Academy (private school). Advisory Board Member, Child Evangelism Fellowship(non-profit). Mr. Harris is a certified public accountant (inactive status). | CIGNA Corporation | |||
Judith M. Johnson (Born 1949) | Trustee, since 2008; Audit Committee Chairman, from 2009 to 2018 | Retired. Prior thereto, Chief Executive Officer and Chief Investment Officer of Minneapolis Employees Retirement Fund from 1996 to 2008. Ms. Johnson is an attorney, certified public accountant and a certified managerial accountant. | N/A | |||
26 | Wells Fargo Growth Fund
Table of Contents
Other information (unaudited)
Name and year of birth | Position held and length of service* | Principal occupations during past five years or longer | Current other public company or investment company directorships | |||
David F. Larcker (Born 1950) | Trustee, since 2009 | James Irvin Miller Professor of Accounting at the Graduate School of Business, Stanford University, Director of the Corporate Governance Research Initiative and Senior Faculty of The Rock Center for Corporate Governance since 2006. From 2005 to 2008, Professor of Accounting at the Graduate School of Business, Stanford University. Prior thereto, Ernst & Young Professor of Accounting at The Wharton School, University of Pennsylvania from 1985 to 2005. | N/A | |||
Olivia S. Mitchell (Born 1953) | Trustee, since 2006; Nominating and Governance Committee Chair, since 2018 | International Foundation of Employee Benefit Plans Professor, Wharton School of the University of Pennsylvania since 1993. Director of Wharton’s Pension Research Council and Boettner Center on Pensions & Retirement Research, and Research Associate at the National Bureau of Economic Research. Previously, Cornell University Professor from 1978 to 1993. | N/A | |||
Timothy J. Penny (Born 1951) | Trustee, since 1996; Chairman, since 2018 | President and Chief Executive Officer of Southern Minnesota Initiative Foundation, anon-profit organization, since 2007. Member of the Board of Trustees of NorthStar Education Finance, Inc., anon-profit organization, since 2007. | N/A | |||
James G. Polisson (Born 1959) | Trustee, since 2018 | Retired. Chief Marketing Officer, Source (ETF) UK Services, Ltd, from 2015 to 2017. From 2012 to 2015, Principal of The Polisson Group, LLC, a management consulting, corporate advisory and principal investing company. Chief Executive Officer and Managing Director at Russell Investments, Global Exchange Traded Funds from 2010 to 2012. Managing Director of Barclays Global Investors from 1998 to 2010 and Global Chief Marketing Officer for iShares and Barclays Global Investors from 2000 to 2010. Trustee of the San Francisco Mechanics’ Institute, anon-profit organization, from 2013 to 2015. Board member of the Russell Exchange Traded Fund Trust from 2011 to 2012. Director of Barclays Global Investors Holdings Deutschland GmbH from 2006 to 2009. Mr. Polisson is an attorney and has a retired status with the Massachusetts and District of Columbia Bar Associations. | N/A | |||
Pamela Wheelock3 (Born 1959) | Trustee, since January 2020; previously Trustee from January 2018 to July 2019 | Board member of the Destination Medical Center Economic Development Agency, Rochester, Minnesota since 2019. Acting Commissioner, Minnesota Department of Human Services, July 2019 through September 2019. Human Services Manager (part-time), Minnesota Department of Human Services, October 2019 through December 2019. Chief Operating Officer, Twin Cities Habitat for Humanity from 2017 to 2019. Vice President of University Services, University of Minnesota from 2012 to 2016. Prior thereto, on the Board of Directors, Governance Committee and Finance Committee for the Minnesota Philanthropy Partners (Saint Paul Foundation) from 2012 to 2018, Interim Chief Executive Officer of Blue Cross Blue Shield of Minnesota from 2011 to 2012, Chairman of the Board from 2009 to 2012 and Board Director from 2003 to 2015. Vice President, Leadership and Community Engagement, Bush Foundation, Saint Paul, Minnesota (a private foundation) from 2009 to 2011. Executive Vice President and Chief Financial Officer, Minnesota Sports and Entertainment from 2004 to 2009 and Senior Vice President from 2002 to 2004. Executive Vice President of the Minnesota Wild Foundation from 2004 to 2008. Commissioner of Finance, State of Minnesota, from 1999 to 2002. Currently Board Chair of the Minnesota Wild Foundation since 2010. | N/A | |||
| * | Length of service dates reflect the Trustee’s commencement of service with the Trust’s predecessor entities, where applicable. |
Wells Fargo Growth Fund | 27
Table of Contents
Other information (unaudited)
Officers
Name and year of birth | Position held and length of service | Principal occupations during past five years or longer | ||
Andrew Owen (Born 1960) | President, since 2017 | Executive Vice President of Wells Fargo & Company and Head of Affiliated Managers, Wells Fargo Asset Management, since 2014. In addition, Mr. Owen is currently President, Chief Executive Officer and Director of Wells Fargo Funds Management, LLC since 2017. Prior thereto, Executive Vice President responsible for marketing, investments and product development for Wells Fargo Funds Management, LLC, from 2009 to 2014. | ||
Jeremy DePalma1 (Born 1974) | Treasurer, since 2012 | Senior Vice President of Wells Fargo Funds Management, LLC since 2009. Senior Vice President of Evergreen Investment Management Company, LLC from 2008 to 2010 and head of the Fund Reporting and Control Team within Fund Administration from 2005 to 2010. | ||
Michelle Rhee (Born 1966) | Chief Legal Officer, since 2019 | Secretary of Wells Fargo Funds Management, LLC, Chief Legal Counsel of Wells Fargo Asset Management and Assistant General Counsel of Wells Fargo Bank, N.A. since 2018. Associate General Counsel and Managing Director of Bank of America Corporation from 2004 to 2018. | ||
Catherine Kennedy (Born 1969) | Secretary, since 2019 | Vice President of Wells Fargo Funds Management, LLC and Senior Counsel of the Wells Fargo Legal Department since 2010. Vice President and Senior Counsel of Evergreen Investment Management Company, LLC from 1998 to 2010. | ||
Michael H. Whitaker (Born 1967) | Chief Compliance Officer, since 2016 | Chief Compliance Officer of Wells Fargo Asset Management since 2016. Senior Vice President and Chief Compliance Officer for Fidelity Investments from 2007 to 2016. | ||
David Berardi (Born 1975) | Assistant Treasurer, since 2009 | Vice President of Wells Fargo Funds Management, LLC since 2009. Vice President of Evergreen Investment Management Company, LLC from 2008 to 2010. Manager of Fund Reporting and Control for Evergreen Investment Management Company, LLC from 2004 to 2010. | ||
| 1 | Jeremy DePalma acts as Treasurer of 85 funds and Assistant Treasurer of 64 funds in the Fund Complex. |
| 2 | The Statement of Additional Information includes additional information about the Trustees and is available, without charge, upon request, by calling1-800-222-8222 or by visiting the website atwfam.com. |
| 3 | Pamela Wheelock wasre-appointed to the Board effective January 1, 2020. |
28 | Wells Fargo Growth Fund
Table of Contents
Effective on or about May 1, 2020, if you purchase Fund shares through a Janney Montgomery Scott LLC (“Janney”) brokerage account, you will be eligible for the following load waivers(front-end sales charge waivers and contingent deferred sales charge (“CDSC”), orback-end sales charge, waivers) and discounts, which may differ from those disclosed elsewhere in the Fund’s Prospectus or SAI.
| Front-end sales charge* waivers on Class A shares available at Janney |
| Shares purchased through reinvestment of capital gains distributions and dividend reinvestment when purchasing shares of the same fund (but not any other fund within the fund family). |
| Shares purchased by employees and registered representatives of Janney or its affiliates and their family members as designated by Janney. |
| Shares purchased from the proceeds of redemptions within the same fund family, provided (1) the repurchase occurs within ninety (90) days following the redemption, (2) the redemption and purchase occur in the same account, and (3) redeemed shares were subject to afront-end or deferred sales load (i.e., right of reinstatement). |
| Employer-sponsored retirement plans (e.g., 401(k) plans, 457 plans, employer-sponsored 403(b) plans, profit sharing and money purchase pension plans and defined benefit plans). For purposes of this provision, employer-sponsored retirement plans do not include SEP IRAs, Simple IRAs,SAR-SEPs or Keogh plans. |
| Shares acquired through a right of reinstatement. |
| Class C shares that are no longer subject to a contingent deferred sales charge and are converted to Class A shares of the same fund pursuant to Janney’s policies and procedures. |
| CDSC waivers on Class A and Class C shares available at Janney |
| Shares sold upon the death or disability of the shareholder. |
| Shares sold as part of a systematic withdrawal plan as described in the Fund’s Prospectus. |
| Shares purchased in connection with a return of excess contributions from an IRA account. |
| Shares sold as part of a required minimum distribution for IRA and retirement accounts if the redemption is taken in or after the year the shareholder reaches qualified age based on applicable IRS regulations. |
| Shares sold to pay Janney fees but only if the transaction is initiated by Janney. |
| Shares acquired through a right of reinstatement. |
| Shares exchanged into the same share class of a different fund. |
| Front-end sales charge* discounts available at Janney; breakpoints, rights of accumulation and/or letters of intent |
| Breakpoints as described in the Fund’s Prospectus. |
| Rights of accumulation (“ROA”), which entitle shareholders to breakpoint discounts, will be automatically calculated based on the aggregated holding of fund family assets held by accounts within the purchaser’s household at Janney. Eligible fund family assets not held at Janney may be included in the ROA calculation only if the shareholder notifies his or her financial advisor about such assets. |
| Letters of intent which allow for breakpoint discounts based on anticipated purchases within a fund family, over a13-month time period. Eligible fund family assets not held at Janney Montgomery Scott may be included in the calculation of letters of intent only if the shareholder notifies his or her financial advisor about such assets. |
| * | Also referred to as an “initial sales charge.” |
Wells Fargo Growth Fund | 29
Table of Contents
This page is intentionally left blank.
Table of Contents
This page is intentionally left blank.
Table of Contents
This page is intentionally left blank.
Table of Contents
For more information
More information about Wells Fargo Funds is available free upon request. To obtain literature, please write, visit the Fund’s website, or call:
Wells Fargo Funds
P.O. Box 219967
Kansas City, MO 64121-9967
Website:wfam.com
Individual investors:1-800-222-8222
Retail investment professionals:1-888-877-9275
Institutional investment professionals:1-866-765-0778

This report and the financial statements contained herein are submitted for the general information of the shareholders of the Fund. If this report is used for promotional purposes, distribution of the report must be accompanied or preceded by a current prospectus. Before investing, please consider the investment objectives, risks, charges, and expenses of the investment. For a current prospectus and, if available, a summary prospectus, containing this information, call1-800-222-8222 or visit the Fund’s website atwfam.com. Read the prospectus carefully before you invest or send money.
Wells Fargo Asset Management (WFAM) is the trade name for certain investment advisory/management firms owned by Wells Fargo & Company. These firms include but are not limited to Wells Capital Management Incorporated and Wells Fargo Funds Management, LLC. Certain products managed by WFAM entities are distributed by Wells Fargo Funds Distributor, LLC (a broker-dealer and Member FINRA).
This material is for general informational and educational purposes only and is NOT intended to provide investment advice or a recommendation of any kind—including a recommendation for any specific investment, strategy, or plan.
INVESTMENT PRODUCTS: NOT FDIC INSURED ◾ NO BANK GUARANTEE ◾ MAY LOSE VALUE
© 2020 Wells Fargo & Company. All rights reserved
PAR-0220-03823 03-20
SA206/SAR206 01-20
Table of Contents

Semi-Annual Report
January 31, 2020
Wells Fargo Classic Value Fund
Beginning on January 1, 2021, as permitted by new regulations adopted by the Securities and Exchange Commission, paper copies of the Wells Fargo Funds’ annual and semi-annual shareholder reports issued after this date will no longer be sent by mail, unless you specifically request paper copies of the reports. Instead, the reports will be made available on the Funds’ website, and you will be notified by mail each time a report is posted and provided with a website address to access the report.
If you already elected to receive shareholder reports electronically, you will not be affected by this change and you need not take any action. You may elect to receive shareholder reports and other communications from the Fund electronically at any time by contacting your financial intermediary (such as a broker-dealer or bank) or, if you are a direct investor, by calling1-800-222-8222 or by enrolling at wellsfargo.com/advantagedelivery.
You may elect to receive all future reports in paper free of charge. If you invest through a financial intermediary, you can contact your financial intermediary to request that you continue to receive paper copies of your shareholder reports; if you invest directly with the Fund, you can call 1-800-222-8222. Your election to receive reports in paper will apply to all Wells Fargo Funds held in your account with your financial intermediary or, if you are a direct investor, to all Wells Fargo Funds that you hold.
Table of Contents
|
Reduce clutter. Save trees. |
Sign up for electronic delivery of prospectuses and shareholder reports atwellsfargo.com/advantagedelivery |
The views expressed and any forward-looking statements are as of January 31, 2020, unless otherwise noted, and are those of the Fund managers and/or Wells Fargo Asset Management. Discussions of individual securities, or the markets generally, or any Wells Fargo Fund are not intended as individual recommendations. Future events or results may vary significantly from those expressed in any forward-looking statements. The views expressed are subject to change at any time in response to changing circumstances in the market. Wells Fargo Asset Management and the Fund disclaim any obligation to publicly update or revise any views expressed or forward-looking statements.
INVESTMENT PRODUCTS: NOT FDIC INSURED ◾ NO BANK GUARANTEE ◾ MAY LOSE VALUE
Wells Fargo Classic Value Fund | 1
Table of Contents
Letter to shareholders (unaudited)

Andrew Owen
President
Wells Fargo Funds
“As the period began, U.S.-China trade tensions continued with no signs of compromise.”
Dear Shareholder:
We are pleased to offer you this semi-annual report for the Wells Fargo Classic Value Fund for thesix-month period that ended January 31, 2020. Despite some market volatility, the period was strongly positive for financial markets as supportive central banks more than offset concerns over slowing global economic growth and international trade tensions.
Overall, both fixed-income and equity investors enjoyed healthy annual returns, with U.S. markets leading the way. For the period, U.S. stocks, based on the S&P 500 Index,1 gained 9.31% and international stocks, as measured by the MSCI ACWI ex USA Index (Net),2 returned 5.37%. The MSCI EM Index (Net)3 gained a more modest 3.36%. For bond investors, the Bloomberg Barclays U.S. Aggregate Bond Index4 added 4.20%, the Bloomberg Barclays Global Aggregateex-USD Index5 returned 1.58%, the Bloomberg Barclays Municipal Bond Index6 gained 3.33%, and the ICE BofA U.S. High Yield Index7 added 3.34%.
The period began with uncertainty, leading to central bank support.
In August as the period began, U.S.-China trade tensions continued with no signs of compromise. Evidence of a continued global economic slowdown mounted, and central banks in China, New Zealand, and Thailand cut interest rates. Industrial and manufacturing data declined in China, Canada, Japan, and Germany. Adding to global uncertainty, Italy’s prime minister resigned, many feared a crackdown in Hong Kong as protestors sustained their calls for reform, and Boris Johnson planned to suspend Parliament as Brexit’s deadline neared.
In the U.S., the Federal Reserve (Fed) cut interest rates a second time in the third quarter in September. U.S. manufacturing data disappointed investors. The U.S. Congress announced it would pursue an impeachment investigation of President Trump. Meanwhile, the Brexit impasse showed no signs of resolution. Officials in China said that hitting the country’s economic growth goals for the year would be difficult considering the weight of tariffs and trade restrictions. Although the S&P 500 Index finished the third quarter with the bestyear-to-date returns in more than 20 years, concerns about future returns remained.
The fourth quarter started on a strong note, with U.S.-China trade tensions relaxing in October along with renewed optimism for a U.K. Brexit deal and positive macroeconomic data. The initial estimate of U.S. third-quarter gross domestic product growth was a resilient 1.9% annualized rate, while the U.S. unemployment rate fell to a50-year low of 3.5% in September. However, despite resilience among U.S. consumers, business confidence declined while manufacturing activity contracted. Concerned with a potential economic slowdown, the Fed lowered interest rates another quarter point in late
| 1 | The S&P 500 Index consists of 500 stocks chosen for market size, liquidity, and industry group representation. It is a market-value-weighted index with each stock’s weight in the index proportionate to its market value. You cannot invest directly in an index. |
| 2 | The Morgan Stanley Capital International (MSCI) All Country World Index (ACWI) ex USA Index (Net) is a free-float-adjusted market-capitalization-weighted index that is designed to measure the equity market performance of developed markets, excluding the United States. Source: MSCI. MSCI makes no express or implied warranties or representations and shall have no liability whatsoever with respect to any MSCI data contained herein. The MSCI data may not be further redistributed or used as a basis for other indices or any securities or financial products. This report is not approved, reviewed, or produced by MSCI. You cannot invest directly in an index. |
| 3 | The MSCI Emerging Markets (EM) Index (Net) is a free-float-adjusted market-capitalization-weighted index that is designed to measure equity market performance of emerging markets. You cannot invest directly in an index. |
| 4 | The Bloomberg Barclays U.S. Aggregate Bond Index is a broad-based benchmark that measures the investment-grade, U.S. dollar-denominated, fixed-rate taxable bond market, including Treasuries, government-related and corporate securities, mortgage-backed securities (agency fixed-rate and hybrid adjustable-rate mortgage pass-throughs), asset-backed securities, and commercial mortgage-backed securities. You cannot invest directly in an index. |
| 5 | The Bloomberg Barclays Global Aggregateex-USD Index is an unmanaged index that provides a broad-based measure of the global investment-grade fixed-income markets excluding the U.S. dollar-denominated debt market. You cannot invest directly in an index. |
| 6 | The Bloomberg Barclays Municipal Bond Index is an unmanaged index composed of long-termtax-exempt bonds with a minimum credit rating of Baa. You cannot invest directly in an index. |
| 7 | The ICE BofA U.S. High Yield Index is a market-capitalization-weighted index of domestic and Yankee high-yield bonds. The index tracks the performance of high-yield securities traded in the U.S. bond market. You cannot invest directly in an index. Copyright 2020. ICE Data Indices, LLC. All rights reserved. |
2 | Wells Fargo Classic Value Fund
Table of Contents
Letter to shareholders (unaudited)
October, its third rate cut in four months. This helped push the S&P 500 Index to a newall-time high, while emerging market equities rallied and global bonds declined overall, reflecting a broad pickup in risk appetite.
Equity markets continued to rally in November despite ongoing geopolitical risks. Hopes for a U.S.-China trade deal buoyed investor confidence. U.S. business sentiment improved slightly, and manufacturing and services activity picked up. Throughout the month, central bank actions were on hold. With that positive backdrop, developed market equities outpaced those in emerging markets, and U.S. stocks, as reflected by the S&P 500 Index, outperformednon-U.S. stocks overall. While consumer confidence and purchasing manager activity rose in the eurozone, China reported weakening manufacturing and consumer data. Bond yields rose marginally, leading to slightly negative returns for global government and investment-grade corporate bonds.
Financial markets ended 2019 on a broadly positive note, with the U.S. and China reaching an accord on a Phase One trade deal, with some details to be worked out. That, along with the landslide win by thepro-Brexit U.K. Conservative Party in a national election and ongoing central bank support, gave investors greater certainty and confidence. U.S. economic indicators were generally positive, with the exception of manufacturing activity and business confidence. However, consumer confidence was resilient, fed by a robust labor market, tame inflation, and lower interest rates, which boosted housing affordability and stimulated homebuyer activity. The impeachment of U.S. President Donald Trump, while historically noteworthy, had little impact on markets. Meanwhile, slowing Chinese economic activity, partly attributable to the trade war, led to further government stimulus atyear-end through lower reserve ratios, allowing banks to lend more money.
Theyear-end rally continued in early January 2020. However, capital market volatility picked up in late January on concerns over the unknown impact of the coronavirus on the global economy and stock markets. With sentiment somewhat souring, perceived safe havens did well in January. The U.S. dollar and Japanese yen both rose and government bonds outperformed equities. While the S&P 500 Index held its ground, emerging market equities tumbled, including those in Asia that are most exposed to viruses—physical or economic—originating in China.
Following the end of the reporting period, the coronavirus continued its global spread, resulting in disruptions to global markets, including through border closings, restrictions on travel and large gatherings, expedited and enhanced health screenings, quarantines, cancellations, business and school closings, disruptions to employment and supply chains, reduced productivity, and reduced customer and client activity in multiple markets and sectors. The risk of further spreading of the coronavirus has led to significant uncertainty and volatility in the financial markets. The full extent of the coronavirus’s impact on the global economy cannot necessarily be foreseen and the impacts may be short term or may last for an extended period of time.
Don’t let short-term uncertainty derail long-term investment goals.
Periods of investment uncertainty can present challenges, but experience has taught us that maintaining long-term investment goals can be an effective way to plan for the future. To help you create a sound strategy based on your personal goals and risk tolerance, Wells Fargo Funds offers more than 100 mutual funds spanning a wide range of asset classes and investment styles. Although diversification cannot guarantee an investment profit or prevent losses, we believe it can be an effective way to manage investment risk and potentially smooth out overall portfolio performance. We encourage investors to know their investments and to understand that appropriate levels of risk-taking may unlock opportunities.
Thank you for choosing to invest with Wells Fargo Funds. We appreciate your confidence in us and remain committed to helping you meet your financial needs.
Sincerely,

Andrew Owen
President
Wells Fargo Funds
“Financial markets ended 2019 on a broadly positive note, with the U.S. and China reaching an accord on a Phase One trade deal.”
|
For further information about your Fund, contact your investment professional, visit our website at wfam.com, or call us directly at1-800-222-8222. |
Wells Fargo Classic Value Fund | 3
Table of Contents
Performance highlights (unaudited)
Investment objective
The Fund seeks long-term capital appreciation.
Manager
Wells Fargo Funds Management, LLC
Subadviser
Wells Capital Management Incorporated
Portfolio managers
Miguel E. Giaconi, CFA®‡
Jean-Baptiste Nadal, CFA®‡
Average annual total returns (%) as of January 31, 20201
| Including sales charge | Excluding sales charge | Expense ratios2 (%) | ||||||||||||||||||||||||||||||||
| Inception date | 1 year | 5 year | 10 year | 1 year | 5 year | 10 year | Gross | Net3 | ||||||||||||||||||||||||||
| Class A (EIVAX) | 8-1-2006 | 11.66 | 7.77 | 10.94 | 18.48 | 9.06 | 11.60 | 1.19 | 1.11 | |||||||||||||||||||||||||
| Class C (EIVCX) | 8-1-2006 | 16.51 | 8.22 | 10.76 | 17.51 | 8.22 | 10.76 | 1.94 | 1.86 | |||||||||||||||||||||||||
| Class R (EIVTX)4 | 3-1-2013 | – | – | – | 18.10 | 8.78 | 11.33 | 1.44 | 1.36 | |||||||||||||||||||||||||
| Class R6 (EIVFX)5 | 11-30-2012 | – | – | – | 18.97 | 9.71 | 12.10 | 0.76 | 0.65 | |||||||||||||||||||||||||
| Administrator Class (EIVDX)6 | 7-30-2010 | – | – | – | 18.61 | 9.22 | 11.81 | 1.11 | 0.95 | |||||||||||||||||||||||||
| Institutional Class (EIVIX) | 8-1-2006 | – | – | – | 18.88 | 9.50 | 12.04 | 0.86 | 0.70 | |||||||||||||||||||||||||
| Russell 1000® Value Index7 | – | – | – | – | 14.88 | 8.70 | 11.87 | – | – | |||||||||||||||||||||||||
Figures quoted represent past performance,which is no guarantee of future results, and do not reflect taxes that shareholder may pay on an investment in a fund. Investment return and principal value of an investment will fluctuate so that an investor’s shares, when redeemed, may be worth more or less than their original cost. Performance shown without sales charges would be lower if sales charges were reflected. Current performance may be lower or higher than the performance data quoted, which assumes the reinvestment of dividends and capital gains. Currentmonth-end performance is available on the Fund’s website, wfam.com.
Index returns do not include transaction costs associated with buying and selling securities, any mutual fund fees or expenses, or any taxes. It is not possible to invest directly in an index.
For Class A shares, the maximumfront-end sales charge is 5.75%. For Class C shares, the maximum contingent deferred sales charge is 1.00%. Performance including a contingent deferred sales charge assumes the sales charge for the corresponding time period. Class R, Class R6, Administrator Class, and Institutional Class shares are sold without afront-end sales charge or contingent deferred sales charge.
Stock values fluctuate in response to the activities of individual companies and general market and economic conditions. Certain investment strategies tend to increase the total risk of an investment (relative to the broader market). The Fund is exposed to foreign investment risk and focused portfolio risk. Consult the Fund’s prospectus for additional information on these and other risks.
Please see footnotes on page 5.
4 | Wells Fargo Classic Value Fund
Table of Contents
Performance highlights (unaudited)
| Ten largest holdings (%) as of January 31, 20208 | ||||
Mondelez International Incorporated Class A | 3.55 | |||
Comcast Corporation Class A | 3.39 | |||
Cigna Corporation | 3.30 | |||
Kellogg Company | 3.15 | |||
Merck & Company Incorporated | 3.15 | |||
Eli Lilly & Company | 3.10 | |||
NextEra Energy Incorporated | 2.96 | |||
Honeywell International Incorporated | 2.88 | |||
Henry Schein Incorporated | 2.78 | |||
PNC Financial Services Group Incorporated | 2.77 | |||
| Sector distribution as of January 31, 20209 |
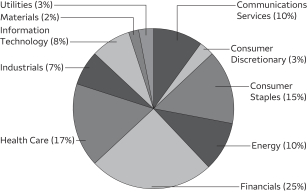 |
| ‡ | CFA® and Chartered Financial Analyst® are trademarks owned by CFA Institute. |
| 1 | Historical performance prior to July 19, 2010, is based on the performance of the Fund’s predecessor, Evergreen Intrinsic Value Fund. |
| 2 | Reflects the expense ratios as stated in the most recent prospectuses. The expense ratios shown are subject to change and may differ from the annualized expense ratios shown in the financial highlights of this report. |
| 3 | The manager has contractually committed through November 30, 2020, to waive fees and/or reimburse expenses to the extent necessary to cap total annual fund operating expenses after fee waivers at 1.11% for Class A, 1.86% for Class C, 1.36% for Class R, 0.65% for Class R6, 0.95% for Administrator Class, and 0.70% for Institutional Class. Brokerage commissions, stamp duty fees, interest, taxes, acquired fund fees and expenses (if any), and extraordinary expenses are excluded from the expense cap. Prior to or after the commitment expiration date, the cap may be increased or the commitment to maintain the cap may be terminated only with the approval of the Board of Trustees. Without this cap, the Fund’s returns would have been lower. The expense ratio paid by an investor is the net expense ratio (the total annual fund operating expenses after fee waivers) as stated in the prospectuses. |
| 4 | Historical performance shown for the Class R shares prior to their inception reflects the performance of the Institutional Class shares, adjusted to reflect the higher expenses applicable to the Class R shares. |
| 5 | Historical performance shown for the Class R6 shares prior to their inception reflects the performance of the Institutional Class shares, and includes the higher expenses applicable to the Institutional Class shares. If these expenses had not been included, returns for the Class R6 shares would be higher. |
| 6 | Historical performance shown for the Administrator Class shares prior to their inception reflects the performance of the Institutional Class shares, adjusted to reflect the higher expenses applicable to the Administrator Class shares. |
| 7 | The Russell 1000® Value Index measures the performance of those Russell 1000 companies with lower price/book ratios and lower forecasted growth values. You cannot invest directly in an index. |
| 8 | The ten largest holdings, excluding cash, cash equivalents and any money market funds, are calculated based on the value of the investments divided by total net assets of the Fund. Holdings are subject to change and may have changed since the date specified. |
| 9 | Amounts are calculated based on the total long-term investments of the Fund. These amounts are subject to change and may have changed since the date specified. |
Wells Fargo Classic Value Fund | 5
Table of Contents
As a shareholder of the Fund, you incur two types of costs: (1) transaction costs, including sales charges (loads) on purchase payments and contingent deferred sales charges (if any) on redemptions and (2) ongoing costs, including management fees, distribution(12b-1) and/or shareholder servicing fees, and other Fund expenses. This example is intended to help you understand your ongoing costs (in dollars) of investing in the Fund and to compare these costs with the ongoing costs of investing in other mutual funds.
The example is based on an investment of $1,000 invested at the beginning of thesix-month period and held for the entire period from August 1, 2019 to January 31, 2020.
Actual expenses
The “Actual” line of the table below provides information about actual account values and actual expenses. You may use the information in this line, together with the amount you invested, to estimate the expenses that you paid over the period. Simply divide your account value by $1,000 (for example, an $8,600 account value divided by $1,000 = 8.6), then multiply the result by the number in the “Actual” line under the heading entitled “Expenses paid during period” for your applicable class of shares to estimate the expenses you paid on your account during this period.
Hypothetical example for comparison purposes
The “Hypothetical” line of the table below provides information about hypothetical account values and hypothetical expenses based on the Fund’s actual expense ratio and an assumed rate of return of 5% per year before expenses, which is not the Fund’s actual return. The hypothetical account values and expenses may not be used to estimate the actual ending account balance or expenses you paid for the period. You may use this information to compare the ongoing costs of investing in the Fund and other funds. To do so, compare this 5% hypothetical example with the 5% hypothetical examples that appear in the shareholder reports of the other funds.
Please note that the expenses shown in the table are meant to highlight your ongoing costs only and do not reflect any transactional costs, such as sales charges (loads) and contingent deferred sales charges. Therefore, the “Hypothetical” line of the table is useful in comparing ongoing costs only and will not help you determine the relative total costs of owning different funds. In addition, if these transactional costs were included, your costs would have been higher.
| Beginning account value 8-1-2019 | Ending account value 1-31-2020 | Expenses paid during the period1 | Annualized net expense ratio | |||||||||||||
Class A | ||||||||||||||||
Actual | $ | 1,000.00 | $ | 1,050.32 | $ | 5.62 | 1.09 | % | ||||||||
Hypothetical (5% return before expenses) | $ | 1,000.00 | $ | 1,019.66 | $ | 5.53 | 1.09 | % | ||||||||
Class C | ||||||||||||||||
Actual | $ | 1,000.00 | $ | 1,046.06 | $ | 9.57 | 1.86 | % | ||||||||
Hypothetical (5% return before expenses) | $ | 1,000.00 | $ | 1,015.79 | $ | 9.42 | 1.86 | % | ||||||||
Class R | ||||||||||||||||
Actual | $ | 1,000.00 | $ | 1,048.81 | $ | 7.00 | 1.36 | % | ||||||||
Hypothetical (5% return before expenses) | $ | 1,000.00 | $ | 1,018.30 | $ | 6.90 | 1.36 | % | ||||||||
Class R6 | ||||||||||||||||
Actual | $ | 1,000.00 | $ | 1,051.72 | $ | 3.35 | 0.65 | % | ||||||||
Hypothetical (5% return before expenses) | $ | 1,000.00 | $ | 1,021.87 | $ | 3.30 | 0.65 | % | ||||||||
Administrator Class | ||||||||||||||||
Actual | $ | 1,000.00 | $ | 1,051.27 | $ | 4.69 | 0.91 | % | ||||||||
Hypothetical (5% return before expenses) | $ | 1,000.00 | $ | 1,020.56 | $ | 4.62 | 0.91 | % | ||||||||
Institutional Class | ||||||||||||||||
Actual | $ | 1,000.00 | $ | 1,052.15 | $ | 3.61 | 0.70 | % | ||||||||
Hypothetical (5% return before expenses) | $ | 1,000.00 | $ | 1,021.62 | $ | 3.56 | 0.70 | % | ||||||||
| 1 | Expenses paid is equal to the annualized net expense ratio of each class multiplied by the average account value over the period, multiplied by the number of days in the most recent fiscal half-year divided by the number of days in the fiscal year (to reflect theone-half-year period). |
6 | Wells Fargo Classic Value Fund
Table of Contents
Portfolio of investments—January 31, 2020 (unaudited)
| Shares | Value | |||||||||||||||
| Common Stocks: 97.41% | ||||||||||||||||
Communication Services: 9.92% | ||||||||||||||||
| Diversified Telecommunication Services: 2.50% | ||||||||||||||||
Verizon Communications Incorporated | 362,400 | $ | 21,541,056 | |||||||||||||
|
| |||||||||||||||
| Entertainment: 2.34% | ||||||||||||||||
The Walt Disney Company | 145,800 | 20,165,598 | ||||||||||||||
|
| |||||||||||||||
| Interactive Media & Services: 1.69% | ||||||||||||||||
Alphabet Incorporated Class C † | 10,150 | 14,557,435 | ||||||||||||||
|
| |||||||||||||||
| Media: 3.39% | ||||||||||||||||
Comcast Corporation Class A | 676,800 | 29,230,992 | ||||||||||||||
|
| |||||||||||||||
Consumer Discretionary: 2.83% | ||||||||||||||||
| Multiline Retail: 0.76% | ||||||||||||||||
Dollar Tree Incorporated † | 75,300 | 6,556,371 | ||||||||||||||
|
| |||||||||||||||
| Specialty Retail: 2.07% | ||||||||||||||||
Advance Auto Parts Incorporated | 135,500 | 17,852,125 | ||||||||||||||
|
| |||||||||||||||
Consumer Staples: 15.00% | ||||||||||||||||
| Beverages: 1.93% | ||||||||||||||||
Anheuser-Busch InBev NV ADR « | 221,000 | 16,641,300 | ||||||||||||||
|
| |||||||||||||||
| Food & Staples Retailing: 2.51% | ||||||||||||||||
The Kroger Company | 806,000 | 21,649,160 | ||||||||||||||
|
| |||||||||||||||
Food Products: 10.56% | ||||||||||||||||
Archer Daniels Midland Company | 503,700 | 22,545,612 | ||||||||||||||
ConAgra Foods Incorporated | 324,200 | 10,672,664 | ||||||||||||||
Kellogg Company | 398,600 | 27,188,506 | ||||||||||||||
Mondelez International Incorporated Class A | 532,700 | 30,566,326 | ||||||||||||||
| 90,973,108 | ||||||||||||||||
|
| |||||||||||||||
Energy: 9.20% | ||||||||||||||||
| Energy Equipment & Services: 3.50% | ||||||||||||||||
Schlumberger Limited | 465,000 | 15,582,150 | ||||||||||||||
TechnipFMC plc | 886,424 | 14,634,860 | ||||||||||||||
| 30,217,010 | ||||||||||||||||
|
| |||||||||||||||
| Oil, Gas & Consumable Fuels: 5.70% | ||||||||||||||||
Chevron Corporation | 170,800 | 18,299,512 | ||||||||||||||
ConocoPhillips | 289,703 | 17,217,049 | ||||||||||||||
EOG Resources Incorporated | 186,200 | 13,575,842 | ||||||||||||||
| 49,092,403 | ||||||||||||||||
|
| |||||||||||||||
Financials: 24.23% | ||||||||||||||||
| Banks: 15.76% | ||||||||||||||||
Bank of America Corporation | 724,100 | 23,772,204 | ||||||||||||||
CIT Group Incorporated | 435,200 | 19,892,992 | ||||||||||||||
JPMorgan Chase & Company | 173,600 | 22,977,696 | ||||||||||||||
PNC Financial Services Group Incorporated | 160,500 | 23,842,275 | ||||||||||||||
The accompanying notes are an integral part of these financial statements.
Wells Fargo Classic Value Fund | 7
Table of Contents
Portfolio of investments—January 31, 2020 (unaudited)
| Shares | Value | |||||||||||||||
| Banks (continued) | ||||||||||||||||
Truist Financial Corporation | 435,800 | $ | 22,474,206 | |||||||||||||
US Bancorp | 430,200 | 22,895,244 | ||||||||||||||
| 135,854,617 | ||||||||||||||||
|
| |||||||||||||||
| Capital Markets: 3.53% | ||||||||||||||||
Intercontinental Exchange Incorporated | 204,800 | 20,426,752 | ||||||||||||||
The Goldman Sachs Group Incorporated | 42,000 | 9,985,500 | ||||||||||||||
| 30,412,252 | ||||||||||||||||
|
| |||||||||||||||
| Insurance: 4.94% | ||||||||||||||||
American International Group Incorporated | 383,300 | 19,264,658 | ||||||||||||||
The Allstate Corporation | 196,300 | 23,269,402 | ||||||||||||||
| 42,534,060 | ||||||||||||||||
|
| |||||||||||||||
Health Care: 16.37% | ||||||||||||||||
| Biotechnology: 1.99% | ||||||||||||||||
Gilead Sciences Incorporated | 271,000 | 17,127,200 | ||||||||||||||
|
| |||||||||||||||
| Health Care Equipment & Supplies: 2.04% | ||||||||||||||||
Medtronic plc | 152,000 | 17,546,880 | ||||||||||||||
|
| |||||||||||||||
| Health Care Providers & Services: 6.09% | ||||||||||||||||
Cigna Corporation | 148,000 | 28,472,240 | ||||||||||||||
Henry Schein Incorporated † | 348,000 | 23,991,120 | ||||||||||||||
| 52,463,360 | ||||||||||||||||
|
| |||||||||||||||
| Pharmaceuticals: 6.25% | ||||||||||||||||
Eli Lilly & Company | 191,400 | 26,727,096 | ||||||||||||||
Merck & Company Incorporated | 318,000 | 27,169,920 | ||||||||||||||
| 53,897,016 | ||||||||||||||||
|
| |||||||||||||||
Industrials: 6.91% | ||||||||||||||||
| Aerospace & Defense: 2.45% | ||||||||||||||||
General Dynamics Corporation | 120,300 | 21,105,431 | ||||||||||||||
|
| |||||||||||||||
| Air Freight & Logistics: 1.58% | ||||||||||||||||
United Parcel Service Incorporated Class B | 131,600 | 13,623,232 | ||||||||||||||
|
| |||||||||||||||
| Industrial Conglomerates: 2.88% | ||||||||||||||||
Honeywell International Incorporated | 143,200 | 24,805,104 | ||||||||||||||
|
| |||||||||||||||
Information Technology: 8.07% | ||||||||||||||||
| Communications Equipment: 3.60% | ||||||||||||||||
Cisco Systems Incorporated | 302,100 | 13,887,537 | ||||||||||||||
Motorola Solutions Incorporated | 97,000 | 17,169,000 | ||||||||||||||
| 31,056,537 | ||||||||||||||||
|
| |||||||||||||||
| Semiconductors & Semiconductor Equipment: 1.54% | ||||||||||||||||
NXP Semiconductors NV | 104,600 | 13,269,556 | ||||||||||||||
|
| |||||||||||||||
| Software: 1.70% | ||||||||||||||||
Microsoft Corporation | 86,100 | 14,656,803 | ||||||||||||||
|
| |||||||||||||||
| Technology Hardware, Storage & Peripherals: 1.23% | ||||||||||||||||
Apple Incorporated | 34,266 | 10,605,670 | ||||||||||||||
|
| |||||||||||||||
The accompanying notes are an integral part of these financial statements.
8 | Wells Fargo Classic Value Fund
Table of Contents
Portfolio of investments—January 31, 2020 (unaudited)
| Shares | Value | |||||||||||||||
Materials: 1.92% | ||||||||||||||||
| Construction Materials: 1.92% | ||||||||||||||||
Vulcan Materials Company | 116,800 | $ | 16,542,384 | |||||||||||||
|
| |||||||||||||||
Utilities: 2.96% | ||||||||||||||||
| Electric Utilities: 2.96% | ||||||||||||||||
NextEra Energy Incorporated | 95,200 | 25,532,640 | ||||||||||||||
|
| |||||||||||||||
Total Common Stocks (Cost $642,221,487) | 839,509,300 | |||||||||||||||
|
| |||||||||||||||
| Yield | ||||||||||||||||
| Short-Term Investments: 4.56% | ||||||||||||||||
| Investment Companies: 4.56% | ||||||||||||||||
Securities Lending Cash Investments LLC (l)(r)(u) | 1.70 | % | 16,318,093 | 16,319,725 | ||||||||||||
Wells Fargo Government Money Market Fund Select Class (l)(u) | 1.51 | 22,932,042 | 22,932,042 | |||||||||||||
| 39,251,767 | ||||||||||||||||
|
| |||||||||||||||
Total Short-Term Investments (Cost $39,251,767) | 39,251,767 | |||||||||||||||
|
| |||||||||||||||
| Total investments in securities (Cost $681,473,254) | 101.97 | % | 878,761,067 | |||||
Other assets and liabilities, net | (1.97 | ) | (16,955,477 | ) | ||||
|
|
|
| |||||
| Total net assets | 100.00 | % | $ | 861,805,590 | ||||
|
|
|
| |||||
| † | Non-income-earning security |
| « | All or a portion of this security is on loan. |
| (l) | The issuer of the security is an affiliated person of the Fund as defined in the Investment Company Act of 1940. |
| (r) | The investment is anon-registered investment company purchased with cash collateral received from securities on loan. |
| (u) | The rate represents the7-day annualized yield at period end. |
Abbreviations:
| ADR | American Depositary Receipt |
Investments in Affiliates
An affiliated investment is an investment in which the Fund owns at least 5% of the outstanding voting shares of the issuer or as a result of other relationships, such as the Fund and the issuer having the same investment manager. Transactions with issuers that were either affiliated persons of the Fund at the beginning of the period or the end of the period were as follows:
| Shares, beginning of period | Shares purchased | Shares sold | Shares, end of period | Net realized gains (losses) | Net change in unrealized gains (losses) | Income from affiliated securities | Value, end of period | % of net assets | ||||||||||||||||||||||||||||
| Short-Term Investments | ||||||||||||||||||||||||||||||||||||
Investment Companies | ||||||||||||||||||||||||||||||||||||
Securities Lending Cash Investments LLC | 0 | 101,240,973 | (84,922,880 | ) | 16,318,093 | $ | (77 | ) | $ | 0 | $ | 29,943 | # | $ | 16,319,725 | |||||||||||||||||||||
Wells Fargo Government Money Market Fund Select Class | 21,251,512 | 82,489,857 | (80,809,327 | ) | 22,932,042 | 0 | 0 | 156,007 | 22,932,042 | |||||||||||||||||||||||||||
|
|
|
|
|
|
|
|
|
| |||||||||||||||||||||||||||
| $ | (77 | ) | $ | 0 | $ | 185,950 | $ | 39,251,767 | 4.56 | % | ||||||||||||||||||||||||||
|
|
|
|
|
|
|
|
|
| |||||||||||||||||||||||||||
| # | Amount shown represents income before fees and rebates |
The accompanying notes are an integral part of these financial statements.
Wells Fargo Classic Value Fund | 9
Table of Contents
Statement of assets and liabilities—January 31, 2020 (unaudited)
Assets | ||||
Investments in unaffiliated securities (including $15,988,083 of securities loaned), at value (cost $642,221,487) | $ | 839,509,300 | ||
Investments in affiliated securities, at value (cost $39,251,767) | 39,251,767 | |||
Receivable for Fund shares sold | 45,872 | |||
Receivable for dividends | 768,413 | |||
Receivable for securities lending income, net | 2,585 | |||
Prepaid expenses and other assets | 8,980 | |||
|
| |||
Total assets | 879,586,917 | |||
|
| |||
Liabilities | ||||
Payable upon receipt of securities loaned | 16,317,022 | |||
Payable for Fund shares redeemed | 560,695 | |||
Management fee payable | 451,840 | |||
Administration fees payable | 126,092 | |||
Distribution fees payable | 4,530 | |||
Trustees’ fees and expenses payable | 5,777 | |||
Accrued expenses and other liabilities | 315,371 | |||
|
| |||
Total liabilities | 17,781,327 | |||
|
| |||
Total net assets | $ | 861,805,590 | ||
|
| |||
Net assets consist of | ||||
Paid-in capital | $ | 634,480,269 | ||
Total distributable earnings | 227,325,321 | |||
|
| |||
Total net assets | $ | 861,805,590 | ||
|
| |||
Computation of net asset value and offering price per share | ||||
Net assets – Class A | $ | 284,837,721 | ||
Shares outstanding – Class A1 | 22,881,053 | |||
Net asset value per share – Class A | $12.45 | |||
Maximum offering price per share – Class A2 | $13.21 | |||
Net assets – Class C | $ | 6,428,009 | ||
Shares outstanding – Class C1 | 531,102 | |||
Net asset value per share – Class C | $12.10 | |||
Net assets – Class R | $ | 94,494 | ||
Shares outstanding – Class R1 | 7,530 | |||
Net asset value per share – Class R | $12.55 | |||
Net assets – Class R6 | $ | 7,177,773 | ||
Shares outstanding – Class R61 | 587,673 | |||
Net asset value per share – Class R6 | $12.21 | |||
Net assets – Administrator Class | $ | 462,191,147 | ||
Shares outstanding – Administrator Class1 | 35,153,950 | |||
Net asset value per share – Administrator Class | $13.15 | |||
Net assets – Institutional Class | $ | 101,076,446 | ||
Shares outstanding – Institutional Class1 | 8,072,574 | |||
Net asset value per share – Institutional Class | $12.52 | |||
| 1 | The Fund has an unlimited number of authorized shares. |
| 2 | Maximum offering price is computed as 100/94.25 of net asset value. On investments of $50,000 or more, the offering price is reduced. |
The accompanying notes are an integral part of these financial statements.
10 | Wells Fargo Classic Value Fund
Table of Contents
Statement of operations—six months ended January 31, 2020 (unaudited)
Investment income | ||||
Dividends (net of foreign withholding taxes of $18,908) | $ | 9,089,555 | ||
Income from affiliated securities | 162,022 | |||
|
| |||
Total investment income | 9,251,577 | |||
|
| |||
Expenses | ||||
Management fee | 3,049,397 | |||
Administration fees | ||||
Class A | 308,192 | |||
Class C | 7,211 | |||
Class R | 98 | |||
Class R6 | 683 | |||
Administrator Class | 307,764 | |||
Institutional Class | 69,022 | |||
Shareholder servicing fees | ||||
Class A | 353,646 | |||
Class C | 8,585 | |||
Class R | 116 | |||
Administrator Class | 591,853 | |||
Distribution fees | ||||
Class C | 25,730 | |||
Class R | 110 | |||
Custody and accounting fees | 17,914 | |||
Professional fees | 22,818 | |||
Registration fees | 50,973 | |||
Shareholder report expenses | 45,862 | |||
Trustees’ fees and expenses | 10,864 | |||
Other fees and expenses | 14,882 | |||
|
| |||
Total expenses | 4,885,720 | |||
Less: Fee waivers and/or expense reimbursements | ||||
Fund-level | (482,144 | ) | ||
Class A | (9,901 | ) | ||
Class C | (49 | ) | ||
Administrator Class | (172,146 | ) | ||
Institutional Class | (16,404 | ) | ||
|
| |||
Net expenses | 4,205,076 | |||
|
| |||
Net investment income | 5,046,501 | |||
|
| |||
Realized and unrealized gains (losses) on investments | ||||
Net realized gains (losses) on | ||||
Unaffiliated securities | 36,690,875 | |||
Affiliated securities | (77 | ) | ||
|
| |||
Net realized gains on investments | 36,690,798 | |||
Net change in unrealized gains (losses) on investments | 1,415,229 | |||
|
| |||
Net realized and unrealized gains (losses) on investments | 38,106,027 | |||
|
| |||
Net increase in net assets resulting from operations | $ | 43,152,528 | ||
|
| |||
The accompanying notes are an integral part of these financial statements.
Wells Fargo Classic Value Fund | 11
Table of Contents
Statement of changes in net assets
Six months ended | Year ended July 31, 2019 | |||||||||||||||
Operations | ||||||||||||||||
Net investment income | $ | 5,046,501 | $ | 8,013,702 | ||||||||||||
Net realized gains on investments | 36,690,798 | 76,996,742 | ||||||||||||||
Net change in unrealized gains (losses) on investments | 1,415,229 | (13,962,337 | ) | |||||||||||||
|
| |||||||||||||||
Net increase in net assets resulting from operations | 43,152,528 | 71,048,107 | ||||||||||||||
|
| |||||||||||||||
Distributions to shareholders from net investment income and net realized gains | ||||||||||||||||
Class A | (28,687,356 | ) | (20,592,244 | ) | ||||||||||||
Class C | (597,397 | ) | (1,289,606 | ) | ||||||||||||
Class R | (9,076 | ) | (5,465 | ) | ||||||||||||
Class R6 | (458,181 | ) | (8,549 | ) | ||||||||||||
Administrator Class | (45,185,976 | ) | (32,970,858 | ) | ||||||||||||
Institutional Class | (10,686,553 | ) | (9,914,802 | ) | ||||||||||||
|
| |||||||||||||||
Total distributions to shareholders | (85,624,539 | ) | (64,781,524 | ) | ||||||||||||
|
| |||||||||||||||
Capital share transactions | Shares | Shares | ||||||||||||||
Proceeds from shares sold | ||||||||||||||||
Class A | 217,899 | 2,839,040 | 1,095,957 | 13,103,460 | ||||||||||||
Class C | 38,977 | 481,095 | 39,212 | 474,330 | ||||||||||||
Class R | 323 | 4,257 | 620 | 7,723 | ||||||||||||
Class R6 | 274,289 | 3,446,837 | 338,872 | 4,112,428 | ||||||||||||
Administrator Class | 281,332 | 3,896,482 | 156,229 | 2,025,198 | ||||||||||||
Institutional Class | 431,144 | 5,636,619 | 340,168 | 4,276,101 | ||||||||||||
|
| |||||||||||||||
| 16,304,330 | 23,999,240 | |||||||||||||||
|
| |||||||||||||||
Reinvestment of distributions | ||||||||||||||||
Class A | 2,187,382 | 27,522,364 | 1,707,185 | 19,644,349 | ||||||||||||
Class C | 46,079 | 559,402 | 110,427 | 1,234,002 | ||||||||||||
Class R | 588 | 7,444 | 372 | 4,309 | ||||||||||||
Class R6 | 36,211 | 448,674 | 65 | 713 | ||||||||||||
Administrator Class | 3,206,695 | 42,691,455 | 2,569,095 | 31,093,029 | ||||||||||||
Institutional Class | 812,822 | 10,324,119 | 740,566 | 8,584,300 | ||||||||||||
|
| |||||||||||||||
| 81,553,458 | 60,560,702 | |||||||||||||||
|
| |||||||||||||||
Payment for shares redeemed | ||||||||||||||||
Class A | (1,695,147 | ) | (22,079,433 | ) | (2,824,686 | ) | (34,934,918 | ) | ||||||||
Class C | (131,833 | ) | (1,666,449 | ) | (1,137,730 | ) | (13,185,582 | ) | ||||||||
Class R | (14 | ) | (186 | ) | (1 | ) | (14 | ) | ||||||||
Class R6 | (50,177 | ) | (656,398 | ) | (211,115 | ) | (2,800,996 | ) | ||||||||
Administrator Class | (1,937,828 | ) | (26,622,726 | ) | (3,428,830 | ) | (44,447,112 | ) | ||||||||
Institutional Class | (1,255,341 | ) | (16,264,628 | ) | (3,443,010 | ) | (40,683,763 | ) | ||||||||
|
| |||||||||||||||
| (67,289,820 | ) | (136,052,385 | ) | |||||||||||||
|
| |||||||||||||||
Net increase (decrease) in net assets resulting from capital share transactions | 30,567,968 | (51,492,443 | ) | |||||||||||||
|
| |||||||||||||||
Total decrease in net assets | (11,904,043 | ) | (45,225,860 | ) | ||||||||||||
|
| |||||||||||||||
Net assets | ||||||||||||||||
Beginning of period | 873,709,633 | 918,935,493 | ||||||||||||||
|
| |||||||||||||||
End of period | $ | 861,805,590 | $ | 873,709,633 | ||||||||||||
|
| |||||||||||||||
The accompanying notes are an integral part of these financial statements.
12 | Wells Fargo Classic Value Fund
Table of Contents
(For a share outstanding throughout each period)
| Six months ended January 31, 2020 (unaudited) | Year ended July 31 | |||||||||||||||||||||||
| CLASS A | 2019 | 2018 | 2017 | 2016 | 2015 | |||||||||||||||||||
Net asset value, beginning of period | $13.13 | $13.05 | $12.61 | $12.01 | $13.73 | $13.60 | ||||||||||||||||||
Net investment income | 0.06 | 0.10 | 0.11 | 0.12 | 1 | 0.13 | 0.10 | |||||||||||||||||
Net realized and unrealized gains (losses) on investments | 0.60 | 0.94 | 1.39 | 1.43 | (0.42 | ) | 1.09 | |||||||||||||||||
|
|
|
|
|
|
|
|
|
|
|
| |||||||||||||
Total from investment operations | 0.66 | 1.04 | 1.50 | 1.55 | (0.29 | ) | 1.19 | |||||||||||||||||
Distributions to shareholders from | ||||||||||||||||||||||||
Net investment income | (0.10 | ) | (0.12 | ) | (0.06 | ) | (0.14 | ) | (0.11 | ) | (0.07 | ) | ||||||||||||
Net realized gains | (1.24 | ) | (0.84 | ) | (1.00 | ) | (0.81 | ) | (1.32 | ) | (0.99 | ) | ||||||||||||
|
|
|
|
|
|
|
|
|
|
|
| |||||||||||||
Total distributions to shareholders | (1.34 | ) | (0.96 | ) | (1.06 | ) | (0.95 | ) | (1.43 | ) | (1.06 | ) | ||||||||||||
Net asset value, end of period | $12.45 | $13.13 | $13.05 | $12.61 | $12.01 | $13.73 | ||||||||||||||||||
Total return2 | 5.03 | % | 9.03 | % | 12.43 | % | 13.50 | % | (1.73 | )% | 9.19 | % | ||||||||||||
Ratios to average net assets (annualized) | ||||||||||||||||||||||||
Gross expenses | 1.18 | % | 1.18 | % | 1.18 | % | 1.17 | % | 1.17 | % | 1.20 | % | ||||||||||||
Net expenses | 1.09 | % | 1.10 | % | 1.10 | % | 1.10 | %�� | 1.10 | % | 1.16 | % | ||||||||||||
Net investment income | 1.00 | % | 0.81 | % | 0.83 | % | 0.95 | % | 1.12 | % | 0.75 | % | ||||||||||||
Supplemental data | ||||||||||||||||||||||||
Portfolio turnover rate | 15 | % | 27 | % | 21 | % | 27 | % | 34 | % | 29 | % | ||||||||||||
Net assets, end of period (000s omitted) | $284,838 | $291,111 | $289,683 | $293,599 | $318,543 | $372,443 | ||||||||||||||||||
| 1 | Calculated based upon average shares outstanding |
| 2 | Total return calculations do not include any sales charges. Returns for periods of less than one year are not annualized. |
The accompanying notes are an integral part of these financial statements.
Wells Fargo Classic Value Fund | 13
Table of Contents
Financial highlights
(For a share outstanding throughout each period)
| Six months ended January 31, 2020 (unaudited) | Year ended July 31 | |||||||||||||||||||||||
| CLASS C | 2019 | 2018 | 2017 | 2016 | 2015 | |||||||||||||||||||
Net asset value, beginning of period | $12.75 | $12.69 | $12.31 | $11.74 | $13.45 | $13.36 | ||||||||||||||||||
Net investment income | 0.02 | 1 | 0.00 | 1,2 | 0.01 | 1 | 0.02 | 1 | 0.03 | 0.00 | 2 | |||||||||||||
Net realized and unrealized gains (losses) on investments | 0.57 | 0.92 | 1.37 | 1.40 | (0.41 | ) | 1.08 | |||||||||||||||||
|
|
|
|
|
|
|
|
|
|
|
| |||||||||||||
Total from investment operations | 0.59 | 0.92 | 1.38 | 1.42 | (0.38 | ) | 1.08 | |||||||||||||||||
Distributions to shareholders from | ||||||||||||||||||||||||
Net investment income | 0.00 | (0.02 | ) | 0.00 | (0.04 | ) | (0.01 | ) | 0.00 | |||||||||||||||
Net realized gains | (1.24 | ) | (0.84 | ) | (1.00 | ) | (0.81 | ) | (1.32 | ) | (0.99 | ) | ||||||||||||
|
|
|
|
|
|
|
|
|
|
|
| |||||||||||||
Total distributions to shareholders | (1.24 | ) | (0.86 | ) | (1.00 | ) | (0.85 | ) | (1.33 | ) | (0.99 | ) | ||||||||||||
Net asset value, end of period | $12.10 | $12.75 | $12.69 | $12.31 | $11.74 | $13.45 | ||||||||||||||||||
Total return3 | 4.61 | % | 8.16 | % | 11.65 | % | 12.58 | % | (2.47 | )% | 8.42 | % | ||||||||||||
Ratios to average net assets (annualized) | ||||||||||||||||||||||||
Gross expenses | 1.93 | % | 1.94 | % | 1.93 | % | 1.93 | % | 1.93 | % | 1.96 | % | ||||||||||||
Net expenses | 1.86 | % | 1.86 | % | 1.86 | % | 1.86 | % | 1.86 | % | 1.91 | % | ||||||||||||
Net investment income | 0.24 | % | 0.03 | % | 0.08 | % | 0.20 | % | 0.37 | % | 0.00 | % | ||||||||||||
Supplemental data | ||||||||||||||||||||||||
Portfolio turnover rate | 15 | % | 27 | % | 21 | % | 27 | % | 34 | % | 29 | % | ||||||||||||
Net assets, end of period (000s omitted) | $6,428 | $7,370 | $19,874 | $21,727 | $28,756 | $36,098 | ||||||||||||||||||
| 1 | Calculated based upon average shares outstanding |
| 2 | Amount is less than $0.005. |
| 3 | Total return calculations do not include any sales charges. Returns for periods of less than one year are not annualized. |
The accompanying notes are an integral part of these financial statements.
14 | Wells Fargo Classic Value Fund
Table of Contents
Financial highlights
(For a share outstanding throughout each period)
| Six months ended January 31, 2020 (unaudited) | Year ended July 31 | |||||||||||||||||||||||
| CLASS R | 2019 | 2018 | 2017 | 2016 | 2015 | |||||||||||||||||||
Net asset value, beginning of period | $13.22 | $13.15 | $12.70 | $12.09 | $13.81 | $13.66 | ||||||||||||||||||
Net investment income | 0.04 | 0.06 | 0.05 | 0.08 | 1 | 0.10 | 0.05 | |||||||||||||||||
Net realized and unrealized gains (losses) on investments | 0.61 | 0.95 | 1.44 | 1.45 | (0.43 | ) | 1.12 | |||||||||||||||||
|
|
|
|
|
|
|
|
|
|
|
| |||||||||||||
Total from investment operations | 0.65 | 1.01 | 1.49 | 1.53 | (0.33 | ) | 1.17 | |||||||||||||||||
Distributions to shareholders from | ||||||||||||||||||||||||
Net investment income | (0.08 | ) | (0.10 | ) | (0.04 | ) | (0.11 | ) | (0.07 | ) | (0.03 | ) | ||||||||||||
Net realized gains | (1.24 | ) | (0.84 | ) | (1.00 | ) | (0.81 | ) | (1.32 | ) | (0.99 | ) | ||||||||||||
|
|
|
|
|
|
|
|
|
|
|
| |||||||||||||
Total distributions to shareholders | (1.32 | ) | (0.94 | ) | (1.04 | ) | (0.92 | ) | (1.39 | ) | (1.02 | ) | ||||||||||||
Net asset value, end of period | $12.55 | $13.22 | $13.15 | $12.70 | $12.09 | $13.81 | ||||||||||||||||||
Total return2 | 4.88 | % | 8.70 | % | 12.21 | % | 13.22 | % | (1.99 | )% | 8.96 | % | ||||||||||||
Ratios to average net assets (annualized) | ||||||||||||||||||||||||
Gross expenses | 1.42 | % | 1.43 | % | 1.44 | % | 1.44 | % | 1.44 | % | 1.47 | % | ||||||||||||
Net expenses | 1.36 | % | 1.36 | % | 1.36 | % | 1.36 | % | 1.36 | % | 1.40 | % | ||||||||||||
Net investment income | 0.73 | % | 0.55 | % | 0.56 | % | 0.69 | % | 0.86 | % | 0.50 | % | ||||||||||||
Supplemental data | ||||||||||||||||||||||||
Portfolio turnover rate | 15 | % | 27 | % | 21 | % | 27 | % | 34 | % | 29 | % | ||||||||||||
Net assets, end of period (000s omitted) | $94 | $88 | $74 | $48 | $43 | $41 | ||||||||||||||||||
| 1 | Calculated based upon average shares outstanding. |
| 2 | Returns for periods of less than one year are not annualized. |
The accompanying notes are an integral part of these financial statements.
Wells Fargo Classic Value Fund | 15
Table of Contents
Financial highlights
(For a share outstanding throughout each period)
| Six months ended January 31, 2020 (unaudited) | Year ended July 31 | |||||||||||||||||||||||
| CLASS R6 | 2019 | 2018 | 2017 | 2016 | 2015 | |||||||||||||||||||
Net asset value, beginning of period | $12.93 | $12.92 | $12.49 | $11.90 | $13.62 | $13.60 | ||||||||||||||||||
Net investment income | 0.09 | 0.16 | 1 | 0.16 | 0.17 | 1 | 0.17 | 0.17 | 1 | |||||||||||||||
Net realized and unrealized gains (losses) on investments | 0.58 | 1.00 | 1.39 | 1.42 | (0.40 | ) | 1.08 | |||||||||||||||||
|
|
|
|
|
|
|
|
|
|
|
| |||||||||||||
Total from investment operations | 0.67 | 1.16 | 1.55 | 1.59 | (0.23 | ) | 1.25 | |||||||||||||||||
Distributions to shareholders from | ||||||||||||||||||||||||
Net investment income | (0.15 | ) | (0.31 | ) | (0.12 | ) | (0.19 | ) | (0.17 | ) | (0.24 | ) | ||||||||||||
Net realized gains | (1.24 | ) | (0.84 | ) | (1.00 | ) | (0.81 | ) | (1.32 | ) | (0.99 | ) | ||||||||||||
|
|
|
|
|
|
|
|
|
|
|
| |||||||||||||
Total distributions to shareholders | (1.39 | ) | (1.15 | ) | (1.12 | ) | (1.00 | ) | (1.49 | ) | (1.23 | ) | ||||||||||||
Net asset value, end of period | $12.21 | $12.93 | $12.92 | $12.49 | $11.90 | $13.62 | ||||||||||||||||||
Total return2 | 5.17 | % | 10.38 | % | 12.96 | % | 14.03 | % | (1.30 | )% | 9.74 | % | ||||||||||||
Ratios to average net assets (annualized) | ||||||||||||||||||||||||
Gross expenses | 0.76 | % | 0.76 | % | 0.75 | % | 0.75 | % | 0.75 | % | 0.74 | % | ||||||||||||
Net expenses | 0.65 | % | 0.65 | % | 0.65 | % | 0.65 | % | 0.65 | % | 0.65 | % | ||||||||||||
Net investment income | 1.39 | % | 1.27 | % | 1.29 | % | 1.40 | % | 1.47 | % | 1.25 | % | ||||||||||||
Supplemental data | ||||||||||||||||||||||||
Portfolio turnover rate | 15 | % | 27 | % | 21 | % | 27 | % | 34 | % | 29 | % | ||||||||||||
Net assets, end of period (000s omitted) | $7,178 | $4,231 | $2,578 | $2,397 | $2,842 | $169 | ||||||||||||||||||
| 1 | Calculated based upon average shares outstanding |
| 2 | Returns for periods of less than one year are not annualized. |
The accompanying notes are an integral part of these financial statements.
16 | Wells Fargo Classic Value Fund
Table of Contents
Financial highlights
(For a share outstanding throughout each period)
| Six months ended January 31, 2020 (unaudited) | Year ended July 31 | |||||||||||||||||||||||
| ADMINISTRATOR CLASS | 2019 | 2018 | 2017 | 2016 | 2015 | |||||||||||||||||||
Net asset value, beginning of period | $13.81 | $13.68 | $13.17 | $12.51 | $14.25 | $14.08 | ||||||||||||||||||
Net investment income | 0.08 | 0.12 | 0.13 | 0.14 | 1 | 0.15 | 0.13 | |||||||||||||||||
Net realized and unrealized gains (losses) on investments | 0.63 | 1.00 | 1.47 | 1.49 | (0.43 | ) | 1.14 | |||||||||||||||||
|
|
|
|
|
|
|
|
|
|
|
| |||||||||||||
Total from investment operations | 0.71 | 1.12 | 1.60 | 1.63 | (0.28 | ) | 1.27 | |||||||||||||||||
Distributions to shareholders from | ||||||||||||||||||||||||
Net investment income | (0.13 | ) | (0.15 | ) | (0.09 | ) | (0.16 | ) | (0.14 | ) | (0.11 | ) | ||||||||||||
Net realized gains | (1.24 | ) | (0.84 | ) | (1.00 | ) | (0.81 | ) | (1.32 | ) | (0.99 | ) | ||||||||||||
|
|
|
|
|
|
|
|
|
|
|
| |||||||||||||
Total distributions to shareholders | (1.37 | ) | (0.99 | ) | (1.09 | ) | (0.97 | ) | (1.46 | ) | (1.10 | ) | ||||||||||||
Net asset value, end of period | $13.15 | $13.81 | $13.68 | $13.17 | $12.51 | $14.25 | ||||||||||||||||||
Total return2 | 5.13 | % | 9.21 | % | 12.63 | % | 13.66 | % | (1.58 | )% | 9.42 | % | ||||||||||||
Ratios to average net assets (annualized) | ||||||||||||||||||||||||
Gross expenses | 1.11 | % | 1.11 | % | 1.10 | % | 1.10 | % | 1.10 | % | 1.06 | % | ||||||||||||
Net expenses | 0.91 | % | 0.95 | % | 0.95 | % | 0.95 | % | 0.95 | % | 0.95 | % | ||||||||||||
Net investment income | 1.18 | % | 0.96 | % | 0.98 | % | 1.10 | % | 1.27 | % | 0.95 | % | ||||||||||||
Supplemental data | ||||||||||||||||||||||||
Portfolio turnover rate | 15 | % | 27 | % | 21 | % | 27 | % | 34 | % | 29 | % | ||||||||||||
Net assets, end of period (000s omitted) | $462,191 | $464,041 | $469,464 | $459,650 | $470,152 | $529,293 | ||||||||||||||||||
| 1 | Calculated based upon average shares outstanding |
| 2 | Returns for periods of less than one year are not annualized. |
The accompanying notes are an integral part of these financial statements.
Wells Fargo Classic Value Fund | 17
Table of Contents
Financial highlights
(For a share outstanding throughout each period)
| Six months ended January 31, 2020 (unaudited) | Year ended July 31 | |||||||||||||||||||||||
| INSTITUTIONAL CLASS | 2019 | 2018 | 2017 | 2016 | 2015 | |||||||||||||||||||
Net asset value, beginning of period | $13.22 | $13.14 | $12.68 | $12.08 | $13.80 | $13.67 | ||||||||||||||||||
Net investment income | 0.09 | 0.15 | 1 | 0.22 | 0.17 | 1 | 0.18 | 0.15 | ||||||||||||||||
Net realized and unrealized gains (losses) on investments | 0.60 | 0.94 | 1.35 | 1.43 | (0.41 | ) | 1.11 | |||||||||||||||||
|
|
|
|
|
|
|
|
|
|
|
| |||||||||||||
Total from investment operations | 0.69 | 1.09 | 1.57 | 1.60 | (0.23 | ) | 1.26 | |||||||||||||||||
Distributions to shareholders from | ||||||||||||||||||||||||
Net investment income | (0.15 | ) | (0.17 | ) | (0.11 | ) | (0.19 | ) | (0.17 | ) | (0.14 | ) | ||||||||||||
Net realized gains | (1.24 | ) | (0.84 | ) | (1.00 | ) | (0.81 | ) | (1.32 | ) | (0.99 | ) | ||||||||||||
|
|
|
|
|
|
|
|
|
|
|
| |||||||||||||
Total distributions to shareholders | (1.39 | ) | (1.01 | ) | (1.11 | ) | (1.00 | ) | (1.49 | ) | (1.13 | ) | ||||||||||||
Net asset value, end of period | $12.52 | $13.22 | $13.14 | $12.68 | $12.08 | $13.80 | ||||||||||||||||||
Total return2 | 5.21 | % | 9.44 | % | 12.96 | % | 13.88 | % | (1.27 | )% | 9.66 | % | ||||||||||||
Ratios to average net assets (annualized) | ||||||||||||||||||||||||
Gross expenses | 0.86 | % | 0.86 | % | 0.85 | % | 0.85 | % | 0.85 | % | 0.79 | % | ||||||||||||
Net expenses | 0.70 | % | 0.70 | % | 0.70 | % | 0.70 | % | 0.70 | % | 0.70 | % | ||||||||||||
Net investment income | 1.39 | % | 1.22 | % | 1.24 | % | 1.36 | % | 1.52 | % | 1.20 | % | ||||||||||||
Supplemental data | ||||||||||||||||||||||||
Portfolio turnover rate | 15 | % | 27 | % | 21 | % | 27 | % | 34 | % | 29 | % | ||||||||||||
Net assets, end of period (000s omitted) | $101,076 | $106,869 | $137,263 | $162,480 | $215,175 | $255,565 | ||||||||||||||||||
| 1 | Calculated based upon average shares outstanding. |
| 2 | Returns for periods of less than one year are not annualized. |
The accompanying notes are an integral part of these financial statements.
18 | Wells Fargo Classic Value Fund
Table of Contents
Notes to financial statements (unaudited)
1. ORGANIZATION
Wells Fargo Funds Trust (the “Trust”), a Delaware statutory trust organized on March 10, 1999, is anopen-end management investment company registered under the Investment Company Act of 1940, as amended (the “1940 Act”). As an investment company, the Trust follows the accounting and reporting guidance in Financial Accounting Standards Board (“FASB”)Accounting Standards Codification Topic 946, Financial Services – Investment Companies. These financial statements report on the Wells Fargo Classic Value Fund (the “Fund”) which is a diversified series of the Trust.
2. SIGNIFICANT ACCOUNTING POLICIES
The following significant accounting policies, which are consistently followed in the preparation of the financial statements of the Fund, are in conformity with U.S. generally accepted accounting principles which require management to make estimates and assumptions that affect the reported amounts of assets and liabilities, disclosure of contingent assets and liabilities at the date of the financial statements, and the reported amounts of revenues and expenses during the reporting period. Actual results could differ from those estimates.
Securities valuation
All investments are valued each business day as of the close of regular trading on the New York Stock Exchange (generally 4 p.m. Eastern Time), although the Fund may deviate from this calculation time under unusual or unexpected circumstances.
Equity securities that are listed on a foreign or domestic exchange or market are valued at the official closing price or, if none, the last sales price. If no sale occurs on the principal exchange or market that day, a fair value price will be determined in accordance with the Fund’s Valuation Procedures.
Investments in registeredopen-end investment companies are valued at net asset value. Interests innon-registered investment companies that are redeemable at net asset value are fair valued normally at net asset value.
Investments which are not valued using any of the methods discussed above are valued at their fair value, as determined in good faith by the Board of Trustees of the Fund. The Board of Trustees has established a Valuation Committee comprised of the Trustees and has delegated to it the authority to take any actions regarding the valuation of portfolio securities that the Valuation Committee deems necessary or appropriate, including determining the fair value of portfolio securities, unless the determination has been delegated to the Wells Fargo Asset Management Pricing Committee at Wells Fargo Funds Management, LLC (“Funds Management”). The Board of Trustees retains the authority to make or ratify any valuation decisions or approve any changes to the Valuation Procedures as it deems appropriate. On a quarterly basis, the Board of Trustees receives reports on any valuation actions taken by the Valuation Committee or the Wells Fargo Asset Management Pricing Committee which may include items for ratification.
Securities lending
The Fund may lend its securities from time to time in order to earn additional income in the form of fees or interest on securities received as collateral or the investment of any cash received as collateral. When securities are on loan, the Fund receives interest or dividends on those securities. Cash collateral received in connection with its securities lending transactions is invested in Securities Lending Cash Investments, LLC (the “Securities Lending Fund”). Investments in Securities Lending Fund are valued at the evaluated bid price provided by an independent pricing service. Income earned from investment in the Securities Lending Fund (net of fees and rebates), if any, is included in income from affiliated securities on the Statement of Operations.
In a securities lending transaction, the net asset value of the Fund is affected by an increase or decrease in the value of the securities loaned and by an increase or decrease in the value of the instrument in which collateral is invested. The amount of securities lending activity undertaken by the Fund fluctuates from time to time. The Fund has the right under the lending agreement to recover the securities from the borrower on demand. In the event of default or bankruptcy by the borrower, the Fund may be prevented from recovering the loaned securities or gaining access to the collateral or may experience delays or costs in doing so. In such an event, the terms of the agreement allows the unaffiliated securities lending agent to use the collateral to purchase replacement securities on behalf of the Fund or pay the Fund the market value of the loaned securities. The Fund bears the risk of loss with respect to depreciation of its investment of the cash collateral.
Security transactions and income recognition
Securities transactions are recorded on a trade date basis. Realized gains or losses are recorded on the basis of identified cost.
Dividend income is recognized on theex-dividend date. Dividend income is recorded net of foreign taxes withheld where recovery of such taxes is not assured.
Wells Fargo Classic Value Fund | 19
Table of Contents
Notes to financial statements (unaudited)
Distributions to shareholders
Distributions to shareholders from net investment income and any net realized gains are recorded on theex-dividend date and paid at least annually. Such distributions are determined in accordance with income tax regulations and may differ from U.S. generally accepted accounting principles. Dividend sources are estimated at the time of declaration. The tax character of distributions is determined as of the Fund’s fiscal year end. Therefore, a portion of the Fund’s distributions made prior to the Fund’s fiscal year end may be categorized as a tax return of capital at year end.
Federal and other taxes
The Fund intends to continue to qualify as a regulated investment company by distributing substantially all of its investment company taxable income and any net realized capital gains (after reduction for capital loss carryforwards) sufficient to relieve it from all, or substantially all, federal income taxes. Accordingly, no provision for federal income taxes was required.
The Fund’s income and federal excise tax returns and all financial records supporting those returns for the prior three fiscal years are subject to examination by the federal and Delaware revenue authorities. Management has analyzed the Fund’s tax positions taken on federal, state, and foreign tax returns for all open tax years and does not believe that there are any uncertain tax positions that require recognition of a tax liability.
As of January 31, 2020, the aggregate cost of all investments for federal income tax purposes was $681,571,556 and the unrealized gains (losses) consisted of:
Gross unrealized gains | $ | 218,299,732 | ||
Gross unrealized losses | (21,110,221 | ) | ||
Net unrealized gains | $ | 197,189,511 | ||
Class allocations
The separate classes of shares offered by the Fund differ principally in applicable sales charges, distribution, shareholder servicing, and administration fees. Class specific expenses are charged directly to that share class. Investment income, common fund-level expenses, and realized and unrealized gains (losses) on investments are allocated daily to each class of shares based on the relative proportion of net assets of each class.
3. FAIR VALUATION MEASUREMENTS
Fair value measurements of investments are determined within a framework that has established a fair value hierarchy based upon the various data inputs utilized in determining the value of the Fund’s investments. The three-level hierarchy gives the highest priority to unadjusted quoted prices in active markets for identical assets or liabilities (Level 1) and the lowest priority to unobservable inputs (Level 3). The Fund’s investments are classified within the fair value hierarchy based on the lowest level of input that is significant to the fair value measurement. The inputs are summarized into three broad levels as follows:
| ∎ | Level 1 – quoted prices in active markets for identical securities |
| ∎ | Level 2 – other significant observable inputs (including quoted prices for similar securities, interest rates, prepayment speeds, credit risk, etc.) |
| ∎ | Level 3 – significant unobservable inputs (including the Fund’s own assumptions in determining the fair value of investments) |
The inputs or methodologies used for valuing investments in securities are not necessarily an indication of the risk associated with investing in those securities.
20 | Wells Fargo Classic Value Fund
Table of Contents
Notes to financial statements (unaudited)
The following is a summary of the inputs used in valuing the Fund’s assets and liabilities as of January 31, 2020:
| Quoted prices (Level 1) | Other significant observable inputs (Level 2) | Significant (Level 3) | Total | |||||||||||||
Assets | ||||||||||||||||
Investments in: | ||||||||||||||||
Common stocks | ||||||||||||||||
Communications services | $ | 85,495,081 | $ | 0 | $ | 0 | $ | 85,495,081 | ||||||||
Consumer discretionary | 24,408,496 | 0 | 0 | 24,408,496 | ||||||||||||
Consumer staples | 129,263,568 | 0 | 0 | 129,263,568 | ||||||||||||
Energy | 79,309,413 | 0 | 0 | 79,309,413 | ||||||||||||
Financials | 208,800,929 | 0 | 0 | 208,800,929 | ||||||||||||
Health care | 141,034,456 | 0 | 0 | 141,034,456 | ||||||||||||
Industrials | 59,533,767 | 0 | 0 | 59,533,767 | ||||||||||||
Information technology | 69,588,566 | 0 | 0 | 69,588,566 | ||||||||||||
Materials | 16,542,384 | 0 | 0 | 16,542,384 | ||||||||||||
Utilities | 25,532,640 | 0 | 0 | 25,532,640 | ||||||||||||
Short-term investments | ||||||||||||||||
Investment companies | 39,251,767 | 0 | 0 | 39,251,767 | ||||||||||||
Total assets | $ | 878,761,067 | $ | 0 | $ | 0 | $ | 878,761,067 | ||||||||
Additional sector, industry or geographic detail is included in the Portfolio of Investments.
For the six months ended January 31, 2020, the Fund did not have any transfers into/out of Level 3.
4. TRANSACTIONS WITH AFFILIATES
Management fee
Funds Management, an indirect wholly owned subsidiary of Wells Fargo & Company (“Wells Fargo”), is the manager of the Fund and provides advisory and fund-level administrative services under an investment management agreement. Under the investment management agreement, Funds Management is responsible for, among other services, implementing the investment objectives and strategies of the Fund, supervising the subadviser and providing fund-level administrative services in connection with the Fund’s operations. As compensation for its services under the investment management agreement, Funds Management is entitled to receive a management fee at the following annual rate based on the Fund’s average daily net assets:
| Average daily net assets | Management fee | |
First $500 million | 0.700% | |
Next $500 million | 0.675 | |
Next $1 billion | 0.650 | |
Next $2 billion | 0.625 | |
Next $1 billion | 0.600 | |
Next $3 billion | 0.590 | |
Next $2 billion | 0.565 | |
Next $2 billion | 0.555 | |
Next $4 billion | 0.530 | |
Over $16 billion | 0.505 | |
For the six months ended January 31, 2020, the management fee was equivalent to an annual rate of 0.69% of the Fund’s average daily net assets.
Funds Management has retained the services of a subadviser to provide daily portfolio management to the Fund. The fee for subadvisory services is borne by Funds Management. Wells Capital Management Incorporated (“WellsCap”), an affiliate of
Wells Fargo Classic Value Fund | 21
Table of Contents
Notes to financial statements (unaudited)
Funds Management and an indirect wholly owned subsidiary of Wells Fargo, is the subadviser to the Fund and is entitled to receive a fee from Funds Management at an annual rate starting at 0.35% and declining to 0.25% as the average daily net assets of the Fund increase.
Administration fees
Under a class-level administration agreement, Funds Management provides class-level administrative services to the Fund, which includes paying fees and expenses for services provided by the transfer agent,sub-transfer agents, omnibus account servicers and record-keepers. As compensation for its services under the class-level administration agreement, Funds Management receives an annual fee which is calculated based on the average daily net assets of each class as follows:
| Class-level administration fee | ||||
Class A, Class C, Class R | 0.21 | % | ||
Class R6 | 0.03 | |||
Administrator Class, Institutional Class | 0.13 | |||
Waivers and/or expense reimbursements
Funds Management has contractually waived and/or reimbursed management and administration fees to the extent necessary to maintain certain net operating expense ratios for the Fund. When each class of the Fund has exceeded its expense cap, Funds Management has waived fees and/or reimbursed expenses from fund-level expenses on a proportionate basis and then from class specific expenses. When only certain classes exceed their expense caps, waivers and/or reimbursements are applied against class specific expenses before fund-level expenses. Funds Management has committed through November 30, 2020 to waive fees and/or reimburse expenses to the extent necessary to cap the Fund’s expenses at 1.11% for Class A shares, 1.86% for Class C shares, 1.36% for Class R shares, 0.65% for Class R6 shares, 0.95% for Administrator Class shares, and 0.70% for Institutional Class shares. Prior to or after the commitment expiration date, the cap may be increased or the commitment to maintain the cap may be terminated only with the approval of the Board of Trustees.
Distribution fees
The Trust has adopted a distribution plan for Class C and Class R shares of the Fund pursuant to Rule12b-1 under the 1940 Act. Distribution fees are charged to Class C and Class R shares and paid to Wells Fargo Funds Distributor, LLC (“Funds Distributor”), the principal underwriter, at an annual rate of 0.75% of the average daily net assets of Class C shares and 0.25% of the average daily net assets of Class R shares.
In addition, Funds Distributor is entitled to receive thefront-end sales charge from the purchase of Class A shares and a contingent deferred sales charge on the redemption of certain Class A shares. Funds Distributor is also entitled to receive the contingent deferred sales charges from redemptions of Class C shares. For the six months ended January 31, 2020, Funds Distributor received $3,324 from the sale of Class A shares. No contingent deferred sales charges were incurred by Class A and Class C shares for the six months ended January 31, 2020.
Shareholder servicing fees
The Trust has entered into contracts with one or more shareholder servicing agents, whereby Class A, Class C, Class R, and Administrator Class of the Fund are charged a fee at an annual rate of 0.25% of the average daily net assets of each respective class. A portion of these total shareholder servicing fees were paid to affiliates of Wells Fargo.
Interfund transactions
The Fund may purchase or sell portfolio investment securities to certain other Wells Fargo affiliates pursuant to Rule17a-7 under the 1940 Act and under procedures adopted by the Board of Trustees. The procedures have been designed to ensure that these interfund transactions, which do not incur broker commissions, are effected at current market prices.
5. INVESTMENT PORTFOLIO TRANSACTIONS
Purchases and sales of investments, excluding U.S. government obligations (if any) and short-term securities, for the six months ended January 31, 2020 were $126,386,550 and $177,992,589, respectively.
6. SECURITIES LENDING TRANSACTIONS
The Fund lends its securities through an unaffiliated securities lending agent and receives collateral in the form of cash or securities with a value at least equal to the value of the securities on loan. The value of the loaned securities is determined at the close of each business day and any increases or decreases in the required collateral are exchanged between the Fund and the
22 | Wells Fargo Classic Value Fund
Table of Contents
Notes to financial statements (unaudited)
counterparty on the next business day. Cash collateral received is invested in the Securities Lending Fund which seeks to provide a positive return compared to the daily Fed Funds Open Rate by investing in high-quality, U.S. dollar-denominated short-term money market instruments and is exempt from registration under Section 3(c)(7) of the 1940 Act. Securities Lending Fund is managed by Funds Management and is subadvised by WellsCap. Funds Management receives an advisory fee starting at 0.05% and declining to 0.01% as the average daily net assets of the Securities Lending Fund increase. All of the fees received by Funds Management are paid to WellsCap for its services as subadviser.
In the event of counterparty default or the failure of a borrower to return a loaned security, the Fund has the right to use the collateral to offset any losses incurred. As of January 31, 2020, the Fund had securities lending transactions with the following counterparties which are subject to offset:
| Counterparty | Value of securities on loan | Collateral received1 | Net amount | |||||||||
Barclays Capital Inc. | $ | 6,474,450 | $ | (6,474,450 | ) | $ | 0 | |||||
Morgan Stanley & Co. LLC | 9,513,633 | (9,513,633 | ) | 0 | ||||||||
| 1 | Collateral received within this table is limited to the collateral for the net transaction with the counterparty. |
7. BANK BORROWINGS
The Trust (excluding the money market funds), Wells Fargo Master Trust and Wells Fargo Variable Trust are parties to a $280,000,000 revolving credit agreement whereby the Fund is permitted to use bank borrowings for temporary or emergency purposes, such as to fund shareholder redemption requests. Interest under the credit agreement is charged to the Fund based on a borrowing rate equal to the higher of the Federal Funds rate in effect on that day plus 1.25% or the overnight LIBOR rate in effect on that day plus 1.25%. In addition, an annual commitment fee equal to 0.25% of the unused balance is allocated to each participating fund.
For the six months ended January 31, 2020, there were no borrowings by the Fund under the agreement.
8. CONCENTRATION RISK
Concentration risks result from exposure to a limited number of sectors. As of the end of the period, the Fund invests a concentration of its portfolio in the financials sector. A fund that invests a substantial portion of its assets in any sector may be more affected by changes in that sector than would be a fund whose investments are not heavily weighted in any sector.
9. INDEMNIFICATION
Under the Trust’s organizational documents, the officers and Trustees have been granted certain indemnification rights against certain liabilities that may arise out of performance of their duties to the Trust. Additionally, in the normal course of business, the Trust may enter into contracts with service providers that contain a variety of indemnification clauses. The Trust’s maximum exposure under these arrangements is dependent on future claims that may be made against the Fund and, therefore, cannot be estimated.
10. NEW ACCOUNTING PRONOUNCEMENT
In August 2018, FASB issued Accounting Standards Update (“ASU”)No. 2018-13, Fair Value Measurement (Topic 820)Disclosure Framework—Changes to the Disclosure Requirements for Fair Value Measurement.ASU2018-13 updates the disclosure requirements for fair value measurements by modifying or removing certain disclosures and adding certain new disclosures. The amendments are effective for fiscal years, and interim periods within those fiscal years, beginning after December 15, 2019. Early adoption is permitted. Management has adopted the removal and modification of disclosures early, as permitted, and will adopt the additional new disclosures at the effective date.
11. SUBSEQUENT EVENT
On March 11, 2020, the World Health Organization announced that it had made the assessment that coronavirus disease 2019 (“COVID-19”) is a pandemic. The impacts of COVID-19 is adversely affecting the entire global economy, individual companies and investment products, and the market in general. There is significant uncertainty around the extent and duration of business disruptions related to COVID-19 and the impact may be short term or may last for an extended period of time. The risk of further spreading of COVID-19 has led to significant uncertainty and volatility in the financial markets and the value of the Fund and the securities in which the Fund invests may be adversely affected by impacts caused by COVID-19.
Wells Fargo Classic Value Fund | 23
Table of Contents
PROXY VOTING INFORMATION
A description of the policies and procedures used to determine how to vote proxies relating to portfolio securities is available, upon request, by calling1-800-222-8222, visiting our website atwfam.com, or visiting the SEC website at sec.gov. Information regarding how the proxies related to portfolio securities were voted during the most recent12-month period ended June 30 is available on the website atwfam.comor by visiting the SEC website at sec.gov.
QUARTERLY PORTFOLIO HOLDINGS INFORMATION
The Fund files its complete schedule of portfolio holdings with the SEC for the first and third quarters of each fiscal year as an exhibit to its reports on FormN-PORT. Shareholders may view the filed FormN-PORT by visiting the SEC website at sec.gov.
24 | Wells Fargo Classic Value Fund
Table of Contents
Other information (unaudited)
BOARD OF TRUSTEES AND OFFICERS
Each of the Trustees and Officers1 listed in the table below acts in identical capacities for each fund in the Wells Fargo family of funds, which consists of 149 mutual funds comprising the Wells Fargo Funds Trust, Wells Fargo Variable Trust, Wells Fargo Master Trust and fourclosed-end funds (collectively the “Fund Complex”). This table should be read in conjunction with the Prospectus and the Statement of Additional Information2. The mailing address of each Trustee and Officer is 525 Market Street, 12th Floor, San Francisco, CA 94105. Each Trustee and Officer serves an indefinite term, however, each Trustee serves such term until reaching the mandatory retirement age established by the Trustees.
Independent Trustees
| Name and year of birth | Position held and length of service* | Principal occupations during past five years or longer | Current other public company or investment company directorships | |||
| William R. Ebsworth (Born 1957) | Trustee, since 2015 | Retired. From 1984 to 2013, equities analyst, portfolio manager, research director and chief investment officer at Fidelity Management and Research Company in Boston, Tokyo, and Hong Kong, and retired in 2013 as Chief Investment Officer of Fidelity Strategic Advisers, Inc. where he led a team of investment professionals managing client assets. Prior thereto, Board member of Hong Kong Securities Clearing Co., Hong Kong Options Clearing Corp., the Thailand International Fund, Ltd., Fidelity Investments Life Insurance Company, and Empire Fidelity Investments Life Insurance Company. Audit Committee Chair and Investment Committee Chair of the Vincent Memorial Hospital Endowment(non-profit organization). Mr. Ebsworth is a CFA® charterholder. | N/A | |||
| Jane A. Freeman (Born 1953) | Trustee, since 2015; Chair Liaison, since 2018 | Retired. From 2012 to 2014 and 1999 to 2008, Chief Financial Officer of Scientific Learning Corporation. From 2008 to 2012, Ms. Freeman provided consulting services related to strategic business projects. Prior to 1999, Portfolio Manager at Rockefeller & Co. and Scudder, Stevens & Clark. Board member of the Harding Loevner Funds from 1996 to 2014, serving as both Lead Independent Director and chair of the Audit Committee. Board member of the Russell Exchange Traded Funds Trust from 2011 to 2012 and the chair of the Audit Committee. Ms. Freeman is a Board Member of The Ruth Bancroft Garden(non-profit organization). She is also an inactive Chartered Financial Analyst. | N/A | |||
| Isaiah Harris, Jr. (Born 1952) | Trustee, since 2009; Audit Committee Chairman, since 2019 | Retired. Chairman of the Board of CIGNA Corporation since 2009, and Director since 2005. From 2003 to 2011, Director of Deluxe Corporation. Prior thereto, President and CEO of BellSouth Advertising and Publishing Corp. from 2005 to 2007, President and CEO of BellSouth Enterprises from 2004 to 2005 and President of BellSouth Consumer Services from 2000 to 2003. Emeritus member of the Iowa State University Foundation Board of Governors. Emeritus Member of the Advisory Board of Iowa State University School of Business. Advisory Board Member, Palm Harbor Academy (private school). Advisory Board Member, Child Evangelism Fellowship(non-profit). Mr. Harris is a certified public accountant (inactive status). | CIGNA Corporation | |||
| Judith M. Johnson (Born 1949) | Trustee, since 2008; Audit Committee Chairman, from 2009 to 2018 | Retired. Prior thereto, Chief Executive Officer and Chief Investment Officer of Minneapolis Employees Retirement Fund from 1996 to 2008. Ms. Johnson is an attorney, certified public accountant and a certified managerial accountant. | N/A | |||
Wells Fargo Classic Value Fund | 25
Table of Contents
Other information (unaudited)
| Name and year of birth | Position held and length of service* | Principal occupations during past five years or longer | Current other public company or investment company directorships | |||
| David F. Larcker (Born 1950) | Trustee, since 2009 | James Irvin Miller Professor of Accounting at the Graduate School of Business, Stanford University, Director of the Corporate Governance Research Initiative and Senior Faculty of The Rock Center for Corporate Governance since 2006. From 2005 to 2008, Professor of Accounting at the Graduate School of Business, Stanford University. Prior thereto, Ernst & Young Professor of Accounting at The Wharton School, University of Pennsylvania from 1985 to 2005. | N/A | |||
| Olivia S. Mitchell (Born 1953) | Trustee, since 2006; Nominating and Governance Committee Chair, since 2018 | International Foundation of Employee Benefit Plans Professor, Wharton School of the University of Pennsylvania since 1993. Director of Wharton’s Pension Research Council and Boettner Center on Pensions & Retirement Research, and Research Associate at the National Bureau of Economic Research. Previously, Cornell University Professor from 1978 to 1993. | N/A | |||
| Timothy J. Penny (Born 1951) | Trustee, since 1996; Chairman, since 2018 | President and Chief Executive Officer of Southern Minnesota Initiative Foundation, anon-profit organization, since 2007. Member of the Board of Trustees of NorthStar Education Finance, Inc., anon-profit organization, since 2007. | N/A | |||
| James G. Polisson (Born 1959) | Trustee, since 2018 | Retired. Chief Marketing Officer, Source (ETF) UK Services, Ltd, from 2015 to 2017. From 2012 to 2015, Principal of The Polisson Group, LLC, a management consulting, corporate advisory and principal investing company. Chief Executive Officer and Managing Director at Russell Investments, Global Exchange Traded Funds from 2010 to 2012. Managing Director of Barclays Global Investors from 1998 to 2010 and Global Chief Marketing Officer for iShares and Barclays Global Investors from 2000 to 2010. Trustee of the San Francisco Mechanics’ Institute, anon-profit organization, from 2013 to 2015. Board member of the Russell Exchange Traded Fund Trust from 2011 to 2012. Director of Barclays Global Investors Holdings Deutschland GmbH from 2006 to 2009. Mr. Polisson is an attorney and has a retired status with the Massachusetts and District of Columbia Bar Associations. | N/A | |||
| Pamela Wheelock3 (Born 1959) | Trustee, since January 2020; previously Trustee from January 2018 to July 2019 | Board member of the Destination Medical Center Economic Development Agency, Rochester, Minnesota since 2019. Acting Commissioner, Minnesota Department of Human Services, July 2019 through September 2019. Human Services Manager (part-time), Minnesota Department of Human Services, October 2019 through December 2019. Chief Operating Officer, Twin Cities Habitat for Humanity from 2017 to 2019. Vice President of University Services, University of Minnesota from 2012 to 2016. Prior thereto, on the Board of Directors, Governance Committee and Finance Committee for the Minnesota Philanthropy Partners (Saint Paul Foundation) from 2012 to 2018, Interim Chief Executive Officer of Blue Cross Blue Shield of Minnesota from 2011 to 2012, Chairman of the Board from 2009 to 2012 and Board Director from 2003 to 2015. Vice President, Leadership and Community Engagement, Bush Foundation, Saint Paul, Minnesota (a private foundation) from 2009 to 2011. Executive Vice President and Chief Financial Officer, Minnesota Sports and Entertainment from 2004 to 2009 and Senior Vice President from 2002 to 2004. Executive Vice President of the Minnesota Wild Foundation from 2004 to 2008. Commissioner of Finance, State of Minnesota, from 1999 to 2002. Currently Board Chair of the Minnesota Wild Foundation since 2010. | N/A | |||
| * | Length of service dates reflect the Trustee’s commencement of service with the Trust’s predecessor entities, where applicable. |
26 | Wells Fargo Classic Value Fund
Table of Contents
Other information (unaudited)
Officers
| Name and year of birth | Position held and length of service | Principal occupations during past five years or longer | ||
| Andrew Owen (Born 1960) | President, since 2017 | Executive Vice President of Wells Fargo & Company and Head of Affiliated Managers, Wells Fargo Asset Management, since 2014. In addition, Mr. Owen is currently President, Chief Executive Officer and Director of Wells Fargo Funds Management, LLC since 2017. Prior thereto, Executive Vice President responsible for marketing, investments and product development for Wells Fargo Funds Management, LLC, from 2009 to 2014. | ||
| Jeremy DePalma1 (Born 1974) | Treasurer, since 2012 | Senior Vice President of Wells Fargo Funds Management, LLC since 2009. Senior Vice President of Evergreen Investment Management Company, LLC from 2008 to 2010 and head of the Fund Reporting and Control Team within Fund Administration from 2005 to 2010. | ||
| Michelle Rhee (Born 1966) | Chief Legal Officer, since 2019 | Secretary of Wells Fargo Funds Management, LLC, Chief Legal Counsel of Wells Fargo Asset Management and Assistant General Counsel of Wells Fargo Bank, N.A. since 2018. Associate General Counsel and Managing Director of Bank of America Corporation from 2004 to 2018. | ||
| Catherine Kennedy (Born 1969) | Secretary, since 2019 | Vice President of Wells Fargo Funds Management, LLC and Senior Counsel of the Wells Fargo Legal Department since 2010. Vice President and Senior Counsel of Evergreen Investment Management Company, LLC from 1998 to 2010. | ||
| Michael H. Whitaker(Born 1967) | Chief Compliance Officer, since 2016 | Chief Compliance Officer of Wells Fargo Asset Management since 2016. Senior Vice President and Chief Compliance Officer for Fidelity Investments from 2007 to 2016. | ||
| David Berardi (Born 1975) | Assistant Treasurer, since 2009 | Vice President of Wells Fargo Funds Management, LLC since 2009. Vice President of Evergreen Investment Management Company, LLC from 2008 to 2010. Manager of Fund Reporting and Control for Evergreen Investment Management Company, LLC from 2004 to 2010. | ||
| 1 | Jeremy DePalma acts as Treasurer of 85 funds and Assistant Treasurer of 64 funds in the Fund Complex. |
| 2 | The Statement of Additional Information includes additional information about the Trustees and is available, without charge, upon request, by calling1-800-222-8222 or by visiting the website atwfam.com. |
| 3 | Pamela Wheelock wasre-appointed to the Board effective January 1, 2020. |
Wells Fargo Classic Value Fund | 27
Table of Contents
Effective on or about May 1, 2020, if you purchase Fund shares through a Janney Montgomery Scott LLC (“Janney”) brokerage account, you will be eligible for the following load waivers(front-end sales charge waivers and contingent deferred sales charge (“CDSC”), orback-end sales charge, waivers) and discounts, which may differ from those disclosed elsewhere in the Fund’s Prospectus or SAI.
| Front-end sales charge* waivers on Class A shares available at Janney |
| Shares purchased through reinvestment of capital gains distributions and dividend reinvestment when purchasing shares of the same fund (but not any other fund within the fund family). |
| Shares purchased by employees and registered representatives of Janney or its affiliates and their family members as designated by Janney. |
| Shares purchased from the proceeds of redemptions within the same fund family, provided (1) the repurchase occurs within ninety (90) days following the redemption, (2) the redemption and purchase occur in the same account, and (3) redeemed shares were subject to afront-end or deferred sales load (i.e., right of reinstatement). |
| Employer-sponsored retirement plans (e.g., 401(k) plans, 457 plans, employer-sponsored 403(b) plans, profit sharing and money purchase pension plans and defined benefit plans). For purposes of this provision, employer-sponsored retirement plans do not include SEP IRAs, Simple IRAs,SAR-SEPs or Keogh plans. |
| Shares acquired through a right of reinstatement. |
| Class C shares that are no longer subject to a contingent deferred sales charge and are converted to Class A shares of the same fund pursuant to Janney’s policies and procedures. |
| CDSC waivers on Class A and Class C shares available at Janney |
| Shares sold upon the death or disability of the shareholder. |
| Shares sold as part of a systematic withdrawal plan as described in the Fund’s Prospectus. |
| Shares purchased in connection with a return of excess contributions from an IRA account. |
| Shares sold as part of a required minimum distribution for IRA and retirement accounts if the redemption is taken in or after the year the shareholder reaches qualified age based on applicable IRS regulations. |
| Shares sold to pay Janney fees but only if the transaction is initiated by Janney. |
| Shares acquired through a right of reinstatement. |
| Shares exchanged into the same share class of a different fund. |
| Front-end sales charge* discounts available at Janney; breakpoints, rights of accumulation and/or letters of intent |
| Breakpoints as described in the Fund’s Prospectus. |
| Rights of accumulation (“ROA”), which entitle shareholders to breakpoint discounts, will be automatically calculated based on the aggregated holding of fund family assets held by accounts within the purchaser’s household at Janney. Eligible fund family assets not held at Janney may be included in the ROA calculation only if the shareholder notifies his or her financial advisor about such assets. |
| Letters of intent which allow for breakpoint discounts based on anticipated purchases within a fund family, over a13-month time period. Eligible fund family assets not held at Janney Montgomery Scott may be included in the calculation of letters of intent only if the shareholder notifies his or her financial advisor about such assets. |
| * | Also referred to as an “initial sales charge.” |
28 | Wells Fargo Classic Value Fund
Table of Contents
For more information
More information about Wells Fargo Funds is available free upon request. To obtain literature, please write, visit the Fund’s website, or call:
Wells Fargo Funds
P.O. Box 219967
Kansas City, MO 64121-9967
Website:wfam.com
Individual investors:1-800-222-8222
Retail investment professionals:1-888-877-9275
Institutional investment professionals:1-866-765-0778

This report and the financial statements contained herein are submitted for the general information of the shareholders of the Fund. If this report is used for promotional purposes, distribution of the report must be accompanied or preceded by a current prospectus. Before investing, please consider the investment objectives, risks, charges, and expenses of the investment. For a current prospectus and, if available, a summary prospectus, containing this information, call1-800-222-8222 or visit the Fund’s website atwfam.com. Read the prospectus carefully before you invest or send money.
Wells Fargo Asset Management (WFAM) is the trade name for certain investment advisory/management firms owned by Wells Fargo & Company. These firms include but are not limited to Wells Capital Management Incorporated and Wells Fargo Funds Management, LLC. Certain products managed by WFAM entities are distributed by Wells Fargo Funds Distributor, LLC (a broker-dealer and Member FINRA).
This material is for general informational and educational purposes only and is NOT intended to provide investment advice or a recommendation of any kind—including a recommendation for any specific investment, strategy, or plan.
INVESTMENT PRODUCTS: NOT FDIC INSURED ◾ NO BANK GUARANTEE ◾ MAY LOSE VALUE
© 2020 Wells Fargo & Company. All rights reserved
PAR-0220-03826 03-20
SA207/SAR207 01-20
Table of Contents

Semi-Annual Report
January 31, 2020
Wells Fargo Large Cap Core Fund
Beginning on January 1, 2021, as permitted by new regulations adopted by the Securities and Exchange Commission, paper copies of the Wells Fargo Funds’ annual and semi-annual shareholder reports issued after this date will no longer be sent by mail, unless you specifically request paper copies of the reports. Instead, the reports will be made available on the Funds’ website, and you will be notified by mail each time a report is posted and provided with a website address to access the report.
If you already elected to receive shareholder reports electronically, you will not be affected by this change and you need not take any action. You may elect to receive shareholder reports and other communications from the Fund electronically at any time by contacting your financial intermediary (such as a broker-dealer or bank) or, if you are a direct investor, by calling1-800-222-8222 or by enrolling at wellsfargo.com/advantagedelivery.
You may elect to receive all future reports in paper free of charge. If you invest through a financial intermediary, you can contact your financial intermediary to request that you continue to receive paper copies of your shareholder reports; if you invest directly with the Fund, you can call 1-800-222-8222. Your election to receive reports in paper will apply to all Wells Fargo Funds held in your account with your financial intermediary or, if you are a direct investor, to all Wells Fargo Funds that you hold.
Table of Contents
|
Reduce clutter. Save trees. |
Sign up for electronic delivery of prospectuses and shareholder reports atwellsfargo.com/advantagedelivery |
The views expressed and any forward-looking statements are as of January 31, 2020, unless otherwise noted, and are those of the Fund managers and/or Wells Fargo Asset Management. Discussions of individual securities, or the markets generally, or any Wells Fargo Fund are not intended as individual recommendations. Future events or results may vary significantly from those expressed in any forward-looking statements. The views expressed are subject to change at any time in response to changing circumstances in the market. Wells Fargo Asset Management and the Fund disclaim any obligation to publicly update or revise any views expressed or forward-looking statements.
INVESTMENT PRODUCTS: NOT FDIC INSURED ◾ NO BANK GUARANTEE ◾ MAY LOSE VALUE
Wells Fargo Large Cap Core Fund | 1
Table of Contents
Letter to shareholders (unaudited)

Andrew Owen
President
Wells Fargo Funds
“As the period began, U.S.-China trade tensions continued with no signs of compromise.”
Dear Shareholder:
We are pleased to offer you this semi-annual report for the Wells Fargo Large Cap Core Fund for thesix-month period that ended January 31, 2020. Despite some market volatility, the period was strongly positive for financial markets as supportive central banks more than offset concerns over slowing global economic growth and international trade tensions.
Overall, both fixed-income and equity investors enjoyed healthy annual returns, with U.S. markets leading the way. For the period, U.S. stocks, based on the S&P 500 Index,1 gained 9.31% and international stocks, as measured by the MSCI ACWI ex USA Index (Net),2 returned 5.37%. The MSCI EM Index (Net)3 gained a more modest 3.36%. For bond investors, the Bloomberg Barclays U.S. Aggregate Bond Index4 added 4.20%, the Bloomberg Barclays Global Aggregateex-USD Index5 returned 1.58%, the Bloomberg Barclays Municipal Bond Index6 gained 3.33%, and the ICE BofA U.S. High Yield Index7 added 3.34%.
The period began with uncertainty, leading to central bank support.
In August as the period began, U.S.-China trade tensions continued with no signs of compromise. Evidence of a continued global economic slowdown mounted, and central banks in China, New Zealand, and Thailand cut interest rates. Industrial and manufacturing data declined in China, Canada, Japan, and Germany. Adding to global uncertainty, Italy’s prime minister resigned, many feared a crackdown in Hong Kong as protestors sustained their calls for reform, and Boris Johnson planned to suspend Parliament as Brexit’s deadline neared.
In the U.S., the Federal Reserve (Fed) cut interest rates a second time in the third quarter in September. U.S. manufacturing data disappointed investors. The U.S. Congress announced it would pursue an impeachment investigation of President Trump. Meanwhile, the Brexit impasse showed no signs of resolution. Officials in China said that hitting the country’s economic growth goals for the year would be difficult considering the weight of tariffs and trade restrictions. Although the S&P 500 Index finished the third quarter with the bestyear-to-date returns in more than 20 years, concerns about future returns remained.
The fourth quarter started on a strong note, with U.S.-China trade tensions relaxing in October along with renewed optimism for a U.K. Brexit deal and positive macroeconomic data. The initial estimate of U.S. third-quarter gross domestic product growth was a resilient 1.9% annualized rate, while the U.S. unemployment rate fell to a50-year low of 3.5% in September. However, despite resilience among U.S. consumers, business
| 1 | The S&P 500 Index consists of 500 stocks chosen for market size, liquidity, and industry group representation. It is a market-value-weighted index with each stock’s weight in the index proportionate to its market value. You cannot invest directly in an index. |
| 2 | The Morgan Stanley Capital International (MSCI) All Country World Index (ACWI) ex USA Index (Net) is a free-float-adjusted market-capitalization-weighted index that is designed to measure the equity market performance of developed markets, excluding the United States. Source: MSCI. MSCI makes no express or implied warranties or representations and shall have no liability whatsoever with respect to any MSCI data contained herein. The MSCI data may not be further redistributed or used as a basis for other indices or any securities or financial products. This report is not approved, reviewed, or produced by MSCI. You cannot invest directly in an index. |
| 3 | The MSCI Emerging Markets (EM) Index (Net) is a free-float-adjusted market-capitalization-weighted index that is designed to measure equity market performance of emerging markets. You cannot invest directly in an index. |
| 4 | The Bloomberg Barclays U.S. Aggregate Bond Index is a broad-based benchmark that measures the investment-grade, U.S. dollar-denominated, fixed-rate taxable bond market, including Treasuries, government-related and corporate securities, mortgage-backed securities (agency fixed-rate and hybrid adjustable-rate mortgage pass-throughs), asset-backed securities, and commercial mortgage-backed securities. You cannot invest directly in an index. |
| 5 | The Bloomberg Barclays Global Aggregateex-USD Index is an unmanaged index that provides a broad-based measure of the global investment-grade fixed-income markets excluding the U.S. dollar-denominated debt market. You cannot invest directly in an index. |
| 6 | The Bloomberg Barclays Municipal Bond Index is an unmanaged index composed of long-termtax-exempt bonds with a minimum credit rating of Baa. You cannot invest directly in an index. |
| 7 | The ICE BofA U.S. High Yield Index is a market-capitalization-weighted index of domestic and Yankee high-yield bonds. The index tracks the performance of high-yield securities traded in the U.S. bond market. You cannot invest directly in an index. Copyright 2020. ICE Data Indices, LLC. All rights reserved. |
2 | Wells Fargo Large Cap Core Fund
Table of Contents
Letter to shareholders (unaudited)
confidence declined while manufacturing activity contracted. Concerned with a potential economic slowdown, the Fed lowered interest rates another quarter point in late October, its third rate cut in four months. This helped push the S&P 500 Index to a newall-time high, while emerging market equities rallied and global bonds declined overall, reflecting a broad pickup in risk appetite.
Equity markets continued to rally in November despite ongoing geopolitical risks. Hopes for a U.S.-China trade deal buoyed investor confidence. U.S. business sentiment improved slightly, and manufacturing and services activity picked up. Throughout the month, central bank actions were on hold. With that positive backdrop, developed market equities outpaced those in emerging markets, and U.S. stocks, as reflected by the S&P 500 Index, outperformednon-U.S. stocks overall. While consumer confidence and purchasing manager activity rose in the eurozone, China reported weakening manufacturing and consumer data. Bond yields rose marginally, leading to slightly negative returns for global government and investment-grade corporate bonds.
Financial markets ended 2019 on a broadly positive note, with the U.S. and China reaching an accord on a Phase One trade deal, with some details to be worked out. That, along with the landslide win by thepro-Brexit U.K. Conservative Party in a national election and ongoing central bank support, gave investors greater certainty and confidence. U.S. economic indicators were generally positive, with the exception of manufacturing activity and business confidence. However, consumer confidence was resilient, fed by a robust labor market, tame inflation, and lower interest rates, which boosted housing affordability and stimulated homebuyer activity. The impeachment of U.S. President Donald Trump, while historically noteworthy, had little impact on markets. Meanwhile, slowing Chinese economic activity, partly attributable to the trade war, led to further government stimulus atyear-end through lower reserve ratios, allowing banks to lend more money.
Theyear-end rally continued in early January 2020. However, capital market volatility picked up in late January on concerns over the unknown impact of the coronavirus on the global economy and stock markets. With sentiment somewhat souring, perceived safe havens did well in January. The U.S. dollar and Japanese yen both rose and government bonds outperformed equities. While the S&P 500 Index held its ground, emerging market equities tumbled, including those in Asia that are most exposed to viruses—physical or economic—originating in China.
Following the end of the reporting period, the coronavirus continued its global spread, resulting in disruptions to global markets, including through border closings, restrictions on travel and large gatherings, expedited and enhanced health screenings, quarantines, cancellations, business and school closings, disruptions to employment and supply chains, reduced productivity, and reduced customer and client activity in multiple markets and sectors. The risk of further spreading of the coronavirus has led to significant uncertainty and volatility in the financial markets. The full extent of the coronavirus’s impact on the global economy cannot necessarily be foreseen and the impacts may be short term or may last for an extended period of time.
Don’t let short-term uncertainty derail long-term investment goals.
Periods of investment uncertainty can present challenges, but experience has taught us that maintaining long-term investment goals can be an effective way to plan for the future. To help you create a sound strategy based on your personal goals and risk tolerance, Wells Fargo Funds offers more than 100 mutual funds spanning a wide range of asset classes and investment styles. Although diversification cannot guarantee an investment profit or prevent losses, we believe it can be an effective way to manage investment risk and potentially smooth out overall portfolio performance. We
“Financial markets ended 2019 on a broadly positive note, with the U.S. and China reaching an accord on a Phase One trade deal.”
|
For further information about your Fund, contact your investment professional, visit our website at wfam.com, or call us directly at1-800-222-8222. |
Wells Fargo Large Cap Core Fund | 3
Table of Contents
Letter to shareholders (unaudited)
encourage investors to know their investments and to understand that appropriate levels of risk-taking may unlock opportunities.
Thank you for choosing to invest with Wells Fargo Funds. We appreciate your confidence in us and remain committed to helping you meet your financial needs.
Sincerely,

Andrew Owen
President
Wells Fargo Funds
4 | Wells Fargo Large Cap Core Fund
Table of Contents
Performance highlights (unaudited)
Investment objective
The Fund seeks long-term capital appreciation.
Manager
Wells Fargo Funds Management, LLC
Subadviser
Wells Capital Management Incorporated
Portfolio managers
John R. Campbell, CFA®‡
Jeff C. Moser, CFA®‡
Average annual total returns (%) as of January 31, 20201
| Including sales charge | Excluding sales charge | Expense ratios2 (%) | ||||||||||||||||||||||||||||||||
| Inception date | 1 year | 5 year | 10 year | 1 year | 5 year | 10 year | Gross | Net3 | ||||||||||||||||||||||||||
| Class A (EGOAX) | 12-17-2007 | 8.38 | 8.13 | 11.89 | 15.00 | 9.41 | 12.56 | 1.19 | 1.08 | |||||||||||||||||||||||||
| Class C (EGOCX) | 12-17-2007 | 13.20 | 8.60 | 11.72 | 14.20 | 8.60 | 11.72 | 1.94 | 1.83 | |||||||||||||||||||||||||
| Class R (EGOHX)4 | 9-30-2015 | – | – | – | 14.75 | 9.14 | 12.30 | 1.44 | 1.33 | |||||||||||||||||||||||||
| Class R6 (EGORX)5 | 9-30-2015 | – | – | – | 15.53 | 10.55 | 13.41 | 0.76 | 0.65 | |||||||||||||||||||||||||
| Administrator Class (WFLLX)6 | 7-16-2010 | – | – | – | 15.20 | 9.56 | 12.79 | 1.11 | 0.97 | |||||||||||||||||||||||||
| Institutional Class (EGOIX) | 12-17-2007 | – | – | – | 15.44 | 9.89 | 13.08 | 0.86 | 0.67 | |||||||||||||||||||||||||
| S&P 500 Index7 | – | – | – | – | 21.68 | 12.37 | 13.97 | – | – | |||||||||||||||||||||||||
Figures quoted represent past performance, which is no guarantee of future results, and do not reflect taxes that shareholder may pay on an investment in a fund. Investment return and principal value of an investment will fluctuate so that an investor’s shares, when redeemed, may be worth more or less than their original cost. Performance shown without sales charges would be lower if sales charges were reflected. Current performance may be lower or higher than the performance data quoted, which assumes the reinvestment of dividends and capital gains. Current month-end performance is available on the Fund’s website,wfam.com.
Index returns do not include transaction costs associated with buying and selling securities, any mutual fund fees or expenses, or any taxes. It is not possible to invest directly in an index.
For Class A shares, the maximum front-end sales charge is 5.75%. For Class C shares, the maximum contingent deferred sales charge is 1.00%. Performance including a contingent deferred sales charge assumes the sales charge for the corresponding time period. Class R, Class R6, Administrator Class, and Institutional Class shares are sold without a front-end sales charge or contingent deferred sales charge.
Stock values fluctuate in response to the activities of individual companies and general market and economic conditions. Certain investment strategies tend to increase the total risk of an investment (relative to the broader market). The Fund is exposed to foreign investment risk and focused portfolio risk. Consult the Fund’s prospectus for additional information on these and other risks.
Please see footnotes on page 6.
Wells Fargo Large Cap Core Fund | 5
Table of Contents
Performance highlights (unaudited)
| Ten largest holdings (%) as of January 31, 20208 | ||||
Apple Incorporated | 4.20 | |||
Microsoft Corporation | 3.59 | |||
Costco Wholesale Corporation | 2.91 | |||
JPMorgan Chase & Company | 2.68 | |||
The Home Depot Incorporated | 2.57 | |||
American Tower Corporation | 2.53 | |||
Baxter International Incorporated | 2.38 | |||
Alphabet Incorporated Class C | 2.35 | |||
CBRE Group Incorporated Class A | 2.34 | |||
Lockheed Martin Corporation | 2.30 | |||
| Sector distribution as of January 31, 20209 |
|
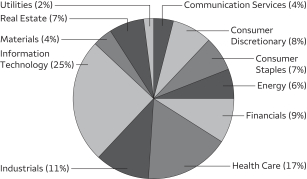
| ‡ | CFA® and Chartered Financial Analyst® are trademarks owned by CFA Institute. |
| 1 | Historical performance prior to July 19, 2010, is based on the performance of the Fund’s predecessor, Evergreen Golden Large Cap Core Fund. |
| 2 | Reflects the expense ratios as stated in the most recent prospectuses. The expense ratios shown are subject to change and may differ from the annualized expense ratios shown in the financial highlights of this report. |
| 3 | The manager has contractually committed through November 30, 2020, to waive fees and/or reimburse expenses to the extent necessary to cap total annual fund operating expenses after fee waivers at 1.08% for Class A, 1.83% for Class C, 1.33% for Class R, 0.65% for Class R6, 0.97% for Administrator Class, and 0.67% for Institutional Class. Brokerage commissions, stamp duty fees, interest, taxes, acquired fund fees and expenses (if any), and extraordinary expenses are excluded from the expense cap. Prior to or after the commitment expiration date, the cap may be increased or the commitment to maintain the cap may be terminated only with the approval of the Board of Trustees. Without this cap, the Fund’s returns would have been lower. The expense ratio paid by an investor is the net expense ratio (the total annual fund operating expenses after fee waivers) as stated in the prospectuses. |
| 4 | Historical performance shown for the Class R shares prior to their inception reflects the performance of the Administrator Class shares, adjusted to reflect higher expenses applicable to the Class R shares. |
| 5 | Historical performance shown for the Class R6 shares prior to their inception reflects the performance of the Institutional Class shares, adjusted to reflect higher expenses applicable to the Class R6 shares. |
| 6 | Historical performance shown for the Administrator Class shares prior to their inception reflects the performance of the Institutional Class shares, adjusted to reflect higher expenses applicable to the Administrator Class shares. |
| 7 | The S&P 500 Index consists of 500 stocks chosen for market size, liquidity, and industry group representation. It is a market-value-weighted index with each stock’s weight in the index proportionate to its market value. You cannot invest directly in an index. |
| 8 | The ten largest holdings, excluding cash, cash equivalents and any money market funds, are calculated based on the value of the investments divided by total net assets of the Fund. Holdings are subject to change and may have changed since the date specified. |
| 9 | Amounts are calculated based on the total long-term investments of the Fund. These amounts are subject to change and may have changed since the date specified. |
6 | Wells Fargo Large Cap Core Fund
Table of Contents
As a shareholder of the Fund, you incur two types of costs: (1) transaction costs, including sales charges (loads) on purchase payments and contingent deferred sales charges (if any) on redemptions and (2) ongoing costs, including management fees, distribution (12b-1) and/or shareholder servicing fees, and other Fund expenses. This example is intended to help you understand your ongoing costs (in dollars) of investing in the Fund and to compare these costs with the ongoing costs of investing in other mutual funds.
The example is based on an investment of $1,000 invested at the beginning of the six-month period and held for the entire period from August 1, 2019 to January 31, 2020.
Actual expenses
The “Actual” line of the table below provides information about actual account values and actual expenses. You may use the information in this line, together with the amount you invested, to estimate the expenses that you paid over the period. Simply divide your account value by $1,000 (for example, an $8,600 account value divided by $1,000 = 8.6), then multiply the result by the number in the “Actual” line under the heading entitled “Expenses paid during period” for your applicable class of shares to estimate the expenses you paid on your account during this period.
Hypothetical example for comparison purposes
The “Hypothetical” line of the table below provides information about hypothetical account values and hypothetical expenses based on the Fund’s actual expense ratio and an assumed rate of return of 5% per year before expenses, which is not the Fund’s actual return. The hypothetical account values and expenses may not be used to estimate the actual ending account balance or expenses you paid for the period. You may use this information to compare the ongoing costs of investing in the Fund and other funds. To do so, compare this 5% hypothetical example with the 5% hypothetical examples that appear in the shareholder reports of the other funds.
Please note that the expenses shown in the table are meant to highlight your ongoing costs only and do not reflect any transactional costs, such as sales charges (loads) and contingent deferred sales charges. Therefore, the “Hypothetical” line of the table is useful in comparing ongoing costs only and will not help you determine the relative total costs of owning different funds. In addition, if these transactional costs were included, your costs would have been higher.
Beginning account value 8-1-2019 | Ending account value 1-31-2020 | Expenses paid during the period1 | Annualized net expense ratio | |||||||||||||
Class A | ||||||||||||||||
Actual | $ | 1,000.00 | $ | 1,063.91 | $ | 5.45 | 1.05 | % | ||||||||
Hypothetical (5% return before expenses) | $ | 1,000.00 | $ | 1,019.86 | $ | 5.33 | 1.05 | % | ||||||||
Class C | ||||||||||||||||
Actual | $ | 1,000.00 | $ | 1,059.87 | $ | 9.48 | 1.83 | % | ||||||||
Hypothetical (5% return before expenses) | $ | 1,000.00 | $ | 1,015.94 | $ | 9.27 | 1.83 | % | ||||||||
Class R | ||||||||||||||||
Actual | $ | 1,000.00 | $ | 1,062.85 | $ | 6.90 | 1.33 | % | ||||||||
Hypothetical (5% return before expenses) | $ | 1,000.00 | $ | 1,018.45 | $ | 6.75 | 1.33 | % | ||||||||
Class R6 | ||||||||||||||||
Actual | $ | 1,000.00 | $ | 1,065.63 | $ | 3.37 | 0.65 | % | ||||||||
Hypothetical (5% return before expenses) | $ | 1,000.00 | $ | 1,021.87 | $ | 3.30 | 0.65 | % | ||||||||
Administrator Class | ||||||||||||||||
Actual | $ | 1,000.00 | $ | 1,064.49 | $ | 5.03 | 0.97 | % | ||||||||
Hypothetical (5% return before expenses) | $ | 1,000.00 | $ | 1,020.26 | $ | 4.93 | 0.97 | % | ||||||||
Institutional Class | ||||||||||||||||
Actual | $ | 1,000.00 | $ | 1,065.49 | $ | 3.48 | 0.67 | % | ||||||||
Hypothetical (5% return before expenses) | $ | 1,000.00 | $ | 1,021.77 | $ | 3.40 | 0.67 | % | ||||||||
| 1 | Expenses paid is equal to the annualized net expense ratio of each class multiplied by the average account value over the period, multiplied by the number of days in the most recent fiscal half-year divided by the number of days in the fiscal year (to reflect the one-half-year period). |
Wells Fargo Large Cap Core Fund | 7
Table of Contents
Portfolio of investments—January 31, 2020 (unaudited)
| Shares | Value | |||||||||||||||
| Common Stocks: 99.22% | ||||||||||||||||
Communication Services: 4.26% | ||||||||||||||||
| Interactive Media & Services: 2.35% | ||||||||||||||||
Alphabet Incorporated Class C † | 9,907 | $ | 14,208,917 | |||||||||||||
|
| |||||||||||||||
| Media: 1.91% | ||||||||||||||||
Discovery Communications Incorporated Class A †« | 395,824 | 11,581,810 | ||||||||||||||
|
| |||||||||||||||
Consumer Discretionary: 7.87% | ||||||||||||||||
| Auto Components: 1.31% | ||||||||||||||||
Lear Corporation | 63,973 | 7,880,194 | ||||||||||||||
|
| |||||||||||||||
| Multiline Retail: 1.98% | ||||||||||||||||
Target Corporation | 108,163 | 11,977,971 | ||||||||||||||
|
| |||||||||||||||
| Specialty Retail: 4.58% | ||||||||||||||||
The Home Depot Incorporated | 68,207 | 15,558,017 | ||||||||||||||
The TJX Companies Incorporated | 205,752 | 12,147,598 | ||||||||||||||
| 27,705,615 | ||||||||||||||||
|
| |||||||||||||||
Consumer Staples: 7.02% | ||||||||||||||||
| Food & Staples Retailing: 7.02% | ||||||||||||||||
Casey’s General Stores Incorporated | 75,203 | 12,097,155 | ||||||||||||||
Costco Wholesale Corporation | 57,540 | 17,579,621 | ||||||||||||||
Walmart Incorporated | 111,750 | 12,794,258 | ||||||||||||||
| 42,471,034 | ||||||||||||||||
|
| |||||||||||||||
Energy: 6.28% | ||||||||||||||||
| Oil, Gas & Consumable Fuels: 6.28% | ||||||||||||||||
Chevron Corporation | 74,152 | 7,944,645 | ||||||||||||||
ConocoPhillips | 176,396 | 10,483,214 | ||||||||||||||
Exxon Mobil Corporation | 139,247 | 8,650,024 | ||||||||||||||
Marathon Petroleum Corporation | 199,406 | 10,867,627 | ||||||||||||||
| 37,945,510 | ||||||||||||||||
|
| |||||||||||||||
Financials: 8.76% | ||||||||||||||||
| Banks: 6.03% | ||||||||||||||||
Citizens Financial Group Incorporated | 238,201 | 8,880,133 | ||||||||||||||
Fifth Third Bancorp | 398,240 | 11,329,928 | ||||||||||||||
JPMorgan Chase & Company | 122,600 | 16,227,336 | ||||||||||||||
| 36,437,397 | ||||||||||||||||
|
| |||||||||||||||
| Capital Markets: 1.40% | ||||||||||||||||
Evercore Partners Incorporated Class A | 110,770 | 8,487,197 | ||||||||||||||
|
| |||||||||||||||
| Insurance: 1.33% | ||||||||||||||||
Prudential Financial Incorporated | 88,512 | 8,059,903 | ||||||||||||||
|
| |||||||||||||||
Health Care: 16.75% | ||||||||||||||||
| Biotechnology: 2.99% | ||||||||||||||||
AbbVie Incorporated | 92,877 | 7,524,895 | ||||||||||||||
Amgen Incorporated | 48,738 | 10,529,845 | ||||||||||||||
| 18,054,740 | ||||||||||||||||
|
| |||||||||||||||
The accompanying notes are an integral part of these financial statements.
8 | Wells Fargo Large Cap Core Fund
Table of Contents
Portfolio of investments—January 31, 2020 (unaudited)
| Shares | Value | |||||||||||||||
| Health Care Equipment & Supplies: 4.24% | ||||||||||||||||
Baxter International Incorporated | 160,997 | $ | 14,364,152 | |||||||||||||
Varian Medical Systems Incorporated † | 80,288 | 11,286,084 | ||||||||||||||
| 25,650,236 | ||||||||||||||||
|
| |||||||||||||||
| Health Care Providers & Services: 5.66% | ||||||||||||||||
Anthem Incorporated | 40,621 | 10,775,939 | ||||||||||||||
Centene Corporation † | 172,833 | 10,855,641 | ||||||||||||||
UnitedHealth Group Incorporated | 46,229 | 12,595,091 | ||||||||||||||
| 34,226,671 | ||||||||||||||||
|
| |||||||||||||||
| Pharmaceuticals: 3.86% | ||||||||||||||||
Bristol-Myers Squibb Company | 200,783 | 12,639,290 | ||||||||||||||
Johnson & Johnson | 71,782 | 10,686,186 | ||||||||||||||
| 23,325,476 | ||||||||||||||||
|
| |||||||||||||||
Industrials: 10.63% | ||||||||||||||||
| Aerospace & Defense: 2.30% | ||||||||||||||||
Lockheed Martin Corporation | 32,517 | 13,921,178 | ||||||||||||||
|
| |||||||||||||||
| Airlines: 1.67% | ||||||||||||||||
Delta Air Lines Incorporated | 180,767 | 10,075,953 | ||||||||||||||
|
| |||||||||||||||
| Construction & Engineering: 1.84% | ||||||||||||||||
EMCOR Group Incorporated | 135,291 | 11,116,861 | ||||||||||||||
|
| |||||||||||||||
| Machinery: 3.20% | ||||||||||||||||
Allison Transmission Holdings Incorporated | 222,705 | 9,843,561 | ||||||||||||||
Cummins Incorporated | 59,528 | 9,522,694 | ||||||||||||||
| 19,366,255 | ||||||||||||||||
|
| |||||||||||||||
| Trading Companies & Distributors: 1.62% | ||||||||||||||||
Applied Industrial Technologies Incorporated | 151,911 | 9,808,893 | ||||||||||||||
|
| |||||||||||||||
Information Technology: 25.32% | ||||||||||||||||
| Communications Equipment: 1.79% | ||||||||||||||||
Cisco Systems Incorporated | 235,485 | 10,825,245 | ||||||||||||||
|
| |||||||||||||||
| Electronic Equipment, Instruments & Components: 6.31% | ||||||||||||||||
CDW Corporation of Delaware | 100,776 | 13,146,229 | ||||||||||||||
Jabil Circuit Incorporated | 326,401 | 12,693,735 | ||||||||||||||
Zebra Technologies Corporation Class A † | 51,509 | 12,311,681 | ||||||||||||||
| 38,151,645 | ||||||||||||||||
|
| |||||||||||||||
| Semiconductors & Semiconductor Equipment: 2.25% | ||||||||||||||||
Intel Corporation | 212,848 | 13,607,373 | ||||||||||||||
|
| |||||||||||||||
| Software: 10.77% | ||||||||||||||||
Fortinet Incorporated † | 120,594 | 13,911,724 | ||||||||||||||
Intuit Incorporated | 39,406 | 11,048,654 | ||||||||||||||
Microsoft Corporation | 127,353 | 21,679,302 | ||||||||||||||
Oracle Corporation | 192,343 | 10,088,390 | ||||||||||||||
VMware Incorporated Class A † | 56,557 | 8,373,829 | ||||||||||||||
| 65,101,899 | ||||||||||||||||
|
| |||||||||||||||
The accompanying notes are an integral part of these financial statements.
Wells Fargo Large Cap Core Fund | 9
Table of Contents
Portfolio of investments—January 31, 2020 (unaudited)
| Shares | Value | |||||||||||||||
| Technology Hardware, Storage & Peripherals: 4.20% | ||||||||||||||||
Apple Incorporated | 82,137 | $ | 25,422,223 | |||||||||||||
|
| |||||||||||||||
Materials: 3.64% | ||||||||||||||||
| Chemicals: 1.35% | ||||||||||||||||
Huntsman Corporation | 395,548 | 8,132,467 | ||||||||||||||
|
| |||||||||||||||
| Metals & Mining: 2.29% | ||||||||||||||||
Reliance Steel & Aluminum Company | 120,830 | 13,871,284 | ||||||||||||||
|
| |||||||||||||||
Real Estate: 7.02% | ||||||||||||||||
| Equity REITs: 4.68% | ||||||||||||||||
American Tower Corporation | 65,968 | 15,287,424 | ||||||||||||||
Prologis Incorporated | 139,682 | 12,973,664 | ||||||||||||||
| 28,261,088 | ||||||||||||||||
|
| |||||||||||||||
| Real Estate Management & Development: 2.34% | ||||||||||||||||
CBRE Group Incorporated Class A † | 231,935 | 14,159,632 | ||||||||||||||
|
| |||||||||||||||
Utilities: 1.67% | ||||||||||||||||
| Independent Power & Renewable Electricity Producers: 1.67% | ||||||||||||||||
Vistra Energy Corporation | 449,003 | 10,111,548 | ||||||||||||||
|
| |||||||||||||||
Total Common Stocks (Cost $447,021,675) | 599,946,215 | |||||||||||||||
|
| |||||||||||||||
| Yield | ||||||||||||||||
| Short-Term Investments: 1.29% | ||||||||||||||||
| Investment Companies: 1.29% | ||||||||||||||||
Securities Lending Cash Investments LLC (l)(r)(u) | 1.70 | % | 1,518,628 | 1,518,779 | ||||||||||||
Wells Fargo Government Money Market Fund Select Class (l)(u) | 1.51 | 6,272,987 | 6,272,987 | |||||||||||||
Total Short-Term Investments (Cost $7,791,766) | 7,791,766 | |||||||||||||||
|
| |||||||||||||||
| Total investments in securities (Cost $454,813,441) | 100.51 | % | 607,737,981 | |||||
Other assets and liabilities, net | (0.51 | ) | (3,092,808 | ) | ||||
|
|
|
| |||||
| Total net assets | 100.00 | % | $ | 604,645,173 | ||||
|
|
|
| |||||
| † | Non-income-earning security |
| « | All or a portion of this security is on loan. |
| (l) | The issuer of the security is an affiliated person of the Fund as defined in the Investment Company Act of 1940. |
| (r) | The investment is a non-registered investment company purchased with cash collateral received from securities on loan. |
| (u) | The rate represents the 7-day annualized yield at period end. |
Abbreviations:
| REIT | Real estate investment trust |
The accompanying notes are an integral part of these financial statements.
10 | Wells Fargo Large Cap Core Fund
Table of Contents
Portfolio of investments—January 31, 2020 (unaudited)
Investments in Affiliates
An affiliated investment is an investment in which the Fund owns at least 5% of the outstanding voting shares of the issuer or as a result of other relationships, such as the Fund and the issuer having the same investment manager. Transactions with issuers that were either affiliated persons of the Fund at the beginning of the period or the end of the period were as follows:
Shares beginning of period | Shares purchased | Shares sold | Shares end of period | Net realized gains (losses) | Net change in unrealized gains (losses) | Income from affiliated securities | Value, end of period | % of net assets | ||||||||||||||||||||||||||||
| Short-Term Investments | ||||||||||||||||||||||||||||||||||||
Investment Companies | ||||||||||||||||||||||||||||||||||||
Securities Lending Cash Investments LLC | 0 | 52,163,595 | (50,644,967 | ) | 1,518,628 | $ | (648 | ) | $ | 0 | $ | 42,033 | # | $ | 1,518,779 | |||||||||||||||||||||
Wells Fargo Government Money Market Fund Select Class | 5,360,147 | 306,549,836 | (305,636,996 | ) | 6,272,987 | 0 | 0 | 61,960 | 6,272,987 | |||||||||||||||||||||||||||
|
|
|
|
|
|
|
|
|
| |||||||||||||||||||||||||||
| $ | (648 | ) | $ | 0 | $ | 103,993 | $ | 7,791,766 | 1.29 | % | ||||||||||||||||||||||||||
|
|
|
|
|
|
|
|
|
| |||||||||||||||||||||||||||
| # | Amount shown represents income before fees and rebates. |
The accompanying notes are an integral part of these financial statements.
Wells Fargo Large Cap Core Fund | 11
Table of Contents
Statement of assets and liabilities—January 31, 2020 (unaudited)
Assets | ||||
Investments in unaffiliated securities (including $1,478,048 of securities loaned), at value (cost $447,021,675) | $ | 599,946,215 | ||
Investments in affiliated securities, at value (cost $7,791,766) | 7,791,766 | |||
Receivable for Fund shares sold | 110,419 | |||
Receivable for dividends | 358,975 | |||
Receivable for securities lending income, net | 1,686 | |||
Prepaid expenses and other assets | 45,812 | |||
|
| |||
Total assets | 608,254,873 | |||
|
| |||
Liabilities | ||||
Payable upon receipt of securities loaned | 1,519,445 | |||
Payable for Fund shares redeemed | 1,591,894 | |||
Management fee payable | 328,421 | |||
Administration fees payable | 108,740 | |||
Distribution fees payable | 31,567 | |||
Trustees’ fees and expenses payable | 6,222 | |||
Accrued expenses and other liabilities | 23,411 | |||
|
| |||
Total liabilities | 3,609,700 | |||
|
| |||
Total net assets | $ | 604,645,173 | ||
|
| |||
Net assets consist of | ||||
Paid-in capital | $ | 401,767,565 | ||
Total distributable earnings | 202,877,608 | |||
|
| |||
Total net assets | $ | 604,645,173 | ||
|
| |||
Computation of net asset value and offering price per share | ||||
Net assets – Class A | $ | 331,412,467 | ||
Shares outstanding – Class A1 | 20,388,832 | |||
Net asset value per share – Class A | $16.25 | |||
Maximum offering price per share – Class A2 | $17.24 | |||
Net assets – Class C | $ | 43,935,377 | ||
Shares outstanding – Class C1 | 2,744,195 | |||
Net asset value per share – Class C | $16.01 | |||
Net assets – Class R | $ | 2,309,713 | ||
Shares outstanding – Class R1 | 141,979 | |||
Net asset value per share – Class R | $16.27 | |||
Net assets – Class R6 | $ | 8,067,610 | ||
Shares outstanding – Class R61 | 494,213 | |||
Net asset value per share – Class R6 | $16.32 | |||
Net assets – Administrator Class | $ | 12,280,452 | ||
Shares outstanding – Administrator Class1 | 744,042 | |||
Net asset value per share – Administrator Class | $16.51 | |||
Net assets – Institutional Class | $ | 206,639,554 | ||
Shares outstanding – Institutional Class1 | 12,643,236 | |||
Net asset value per share – Institutional Class | $16.34 | |||
| 1 | The Fund has an unlimited number of authorized shares. |
| 2 | Maximum offering price is computed as 100/94.25 of net asset value. On investments of $50,000 or more, the offering price is reduced. |
The accompanying notes are an integral part of these financial statements.
12 | Wells Fargo Large Cap Core Fund
Table of Contents
Statement of operations—six months ended January 31, 2020 (unaudited)
Investment income | ||||
Dividends | $ | 7,481,102 | ||
Income from affiliated securities | 69,079 | |||
|
| |||
Total investment income | 7,550,181 | |||
|
| |||
Expenses | ||||
Management fee | 2,773,366 | |||
Administration fees | ||||
Class A | 361,024 | |||
Class C | 48,915 | |||
Class R | 2,261 | |||
Class R6 | 1,782 | |||
Administrator Class | 9,682 | |||
Institutional Class | 249,328 | |||
Shareholder servicing fees | ||||
Class A | 429,790 | |||
Class C | 58,232 | |||
Class R | 2,692 | |||
Administrator Class | 18,620 | |||
Distribution fees | ||||
Class C | 174,627 | |||
Class R | 2,681 | |||
Custody and accounting fees | 29,555 | |||
Professional fees | 23,745 | |||
Registration fees | 61,149 | |||
Shareholder report expenses | 76,437 | |||
Trustees’ fees and expenses | 11,526 | |||
Interest expense | 706 | |||
Other fees and expenses | 14,142 | |||
|
| |||
Total expenses | 4,350,260 | |||
Less: Fee waivers and/or expense reimbursements | ||||
Fund-level | (656,786 | ) | ||
Class A | (58,548 | ) | ||
Administrator Class | (10 | ) | ||
|
| |||
Net expenses | 3,634,916 | |||
|
| |||
Net investment income | 3,915,265 | |||
|
| |||
Realized and unrealized gains (losses) on investments | ||||
Net realized gains (losses) on | ||||
Unaffiliated securities | 88,772,989 | |||
Affiliated securities | (648 | ) | ||
|
| |||
Net realized gains on investments | 88,772,341 | |||
Net change in unrealized gains (losses) on investments | (44,792,900 | ) | ||
|
| |||
Net realized and unrealized gains (losses) on investments | 43,979,441 | |||
|
| |||
Net increase in net assets resulting from operations | $ | 47,894,706 | ||
|
| |||
The accompanying notes are an integral part of these financial statements.
Wells Fargo Large Cap Core Fund | 13
Table of Contents
Statement of changes in net assets
Six months ended (unaudited) | Year ended July 31, 2019 | |||||||||||||||
Operations | ||||||||||||||||
Net investment income | $ | 3,915,265 | $ | 17,281,991 | ||||||||||||
Net realized gains on investments | 88,772,341 | 109,914,369 | ||||||||||||||
Net change in unrealized gains (losses) on investments | (44,792,900 | ) | (118,294,629 | ) | ||||||||||||
|
| |||||||||||||||
Net increase in net assets resulting from operations | 47,894,706 | 8,901,731 | ||||||||||||||
|
| |||||||||||||||
Distributions to shareholders from net investment income and net realized gains | ||||||||||||||||
Class A | (61,566,588 | ) | (37,574,345 | ) | ||||||||||||
Class C | (7,938,179 | ) | (5,864,767 | ) | ||||||||||||
Class R | (385,920 | ) | (218,389 | ) | ||||||||||||
Class R6 | (1,869,850 | ) | (1,664,230 | ) | ||||||||||||
Administrator Class | (2,568,605 | ) | (2,269,291 | ) | ||||||||||||
Institutional Class | (59,147,753 | ) | (74,264,283 | ) | ||||||||||||
|
| |||||||||||||||
Total distributions to shareholders | (133,476,895 | ) | (121,855,305 | ) | ||||||||||||
|
| |||||||||||||||
Capital share transactions | Shares | Shares | ||||||||||||||
Proceeds from shares sold | ||||||||||||||||
Class A | 876,506 | 15,775,701 | 2,037,136 | 37,064,625 | ||||||||||||
Class C | 133,314 | 2,230,827 | 396,352 | 7,080,379 | ||||||||||||
Class R | 25,710 | 452,167 | 14,501 | 264,703 | ||||||||||||
Class R6 | 15,794 | 275,121 | 159,006 | 3,008,830 | ||||||||||||
Administrator Class | 14,089 | 249,183 | 58,875 | 1,101,323 | ||||||||||||
Institutional Class | 2,006,924 | 35,208,475 | 8,077,444 | 146,618,727 | ||||||||||||
|
| |||||||||||||||
| 54,191,474 | 195,138,587 | |||||||||||||||
|
| |||||||||||||||
Reinvestment of distributions | ||||||||||||||||
Class A | 3,568,341 | 58,962,830 | 2,156,895 | 36,026,156 | ||||||||||||
Class C | 419,517 | 6,752,912 | 305,502 | 4,991,915 | ||||||||||||
Class R | 23,014 | 379,887 | 12,855 | 214,625 | ||||||||||||
Class R6 | 25,087 | 417,888 | 23,922 | 403,097 | ||||||||||||
Administrator Class | 151,848 | 2,548,476 | 133,494 | 2,258,572 | ||||||||||||
Institutional Class | 3,285,183 | 54,781,650 | 4,092,477 | 68,868,016 | ||||||||||||
|
| |||||||||||||||
| 123,843,643 | 112,762,381 | |||||||||||||||
|
| |||||||||||||||
Payment for shares redeemed | ||||||||||||||||
Class A | (2,417,280 | ) | (43,817,465 | ) | (3,169,819 | ) | (58,713,000 | ) | ||||||||
Class C | (423,443 | ) | (7,396,768 | ) | (1,097,796 | ) | (19,481,544 | ) | ||||||||
Class R | (16,711 | ) | (298,552 | ) | (15,514 | ) | (283,465 | ) | ||||||||
Class R6 | (254,672 | ) | (4,834,133 | ) | (202,585 | ) | (3,787,142 | ) | ||||||||
Administrator Class | (302,329 | ) | (5,441,592 | ) | (520,733 | ) | (9,967,464 | ) | ||||||||
Institutional Class | (24,766,774 | ) | (447,139,826 | ) | (13,024,243 | ) | (237,625,707 | ) | ||||||||
|
| |||||||||||||||
| (508,928,336 | ) | (329,858,322 | ) | |||||||||||||
|
| |||||||||||||||
Net decrease in net assets resulting from capital share transactions | (330,893,219 | ) | (21,957,354 | ) | ||||||||||||
|
| |||||||||||||||
Total decrease in net assets | (416,475,408 | ) | (134,910,928 | ) | ||||||||||||
|
| |||||||||||||||
Net assets | ||||||||||||||||
Beginning of period | 1,021,120,581 | 1,156,031,509 | ||||||||||||||
|
| |||||||||||||||
End of period | $ | 604,645,173 | $ | 1,021,120,581 | ||||||||||||
|
| |||||||||||||||
The accompanying notes are an integral part of these financial statements.
14 | Wells Fargo Large Cap Core Fund
Table of Contents
(For a share outstanding throughout each period)
| Six months ended January 31, 2020 (unaudited) | Year ended July 31 | |||||||||||||||||||||||
| CLASS A | 2019 | 2018 | 2017 | 2016 | 2015 | |||||||||||||||||||
Net asset value, beginning of period | $18.57 | $20.82 | $18.01 | $15.13 | $15.81 | $14.30 | ||||||||||||||||||
Net investment income | 0.07 | 1 | 0.25 | 0.15 | 0.15 | 0.10 | 0.06 | |||||||||||||||||
Net realized and unrealized gains (losses) on investments | 1.12 | (0.29 | ) | 3.01 | 2.85 | (0.60 | ) | 1.50 | ||||||||||||||||
|
|
|
|
|
|
|
|
|
|
|
| |||||||||||||
Total from investment operations | 1.19 | (0.04 | ) | 3.16 | 3.00 | (0.50 | ) | 1.56 | ||||||||||||||||
Distributions to shareholders from | ||||||||||||||||||||||||
Net investment income | (0.29 | ) | (0.16 | ) | (0.13 | ) | (0.12 | ) | (0.05 | ) | (0.05 | ) | ||||||||||||
Net realized gains | (3.22 | ) | (2.05 | ) | (0.22 | ) | 0.00 | (0.13 | ) | 0.00 | ||||||||||||||
|
|
|
|
|
|
|
|
|
|
|
| |||||||||||||
Total distributions to shareholders | (3.51 | ) | (2.21 | ) | (0.35 | ) | (0.12 | ) | (0.18 | ) | (0.05 | ) | ||||||||||||
Net asset value, end of period | $16.25 | $18.57 | $20.82 | $18.01 | $15.13 | $15.81 | ||||||||||||||||||
Total return2 | 6.39 | % | 1.10 | % | 17.66 | % | 19.94 | % | (3.18 | )% | 10.99 | % | ||||||||||||
Ratios to average net assets (annualized) | ||||||||||||||||||||||||
Gross expenses | 1.21 | % | 1.19 | % | 1.18 | % | 1.19 | % | 1.20 | % | 1.26 | % | ||||||||||||
Net expenses | 1.05 | % | 1.08 | % | 1.10 | % | 1.14 | % | 1.14 | % | 1.14 | % | ||||||||||||
Net investment income | 0.76 | % | 1.42 | % | 0.73 | % | 0.82 | % | 0.80 | % | 0.35 | % | ||||||||||||
Supplemental data | ||||||||||||||||||||||||
Portfolio turnover rate | 7 | % | 45 | % | 33 | % | 50 | % | 51 | % | 44 | % | ||||||||||||
Net assets, end of period (000s omitted) | $331,412 | $341,045 | $360,937 | $329,974 | $359,971 | $97,041 | ||||||||||||||||||
| 1 | Calculated based upon average shares outstanding |
| 2 | Total return calculations do not include any sales charges. Returns for periods of less than one year are not annualized. |
The accompanying notes are an integral part of these financial statements.
Wells Fargo Large Cap Core Fund | 15
Table of Contents
Financial highlights
(For a share outstanding throughout each period)
| Six months ended January 31, 2020 (unaudited) | Year ended July 31 | |||||||||||||||||||||||
| CLASS C | 2019 | 2018 | 2017 | 2016 | 2015 | |||||||||||||||||||
Net asset value, beginning of period | $18.22 | $20.44 | $17.70 | $14.87 | $15.61 | $14.17 | ||||||||||||||||||
Net investment income (loss) | (0.00 | )1 | 0.13 | (0.00 | )1 | 0.00 | 2 | 0.00 | 2,3 | (0.06 | )3 | |||||||||||||
Net realized and unrealized gains (losses) on investments | 1.10 | (0.30 | ) | 2.96 | 2.83 | (0.61 | ) | 1.50 | ||||||||||||||||
|
|
|
|
|
|
|
|
|
|
|
| |||||||||||||
Total from investment operations | 1.10 | (0.17 | ) | 2.96 | 2.83 | (0.61 | ) | 1.44 | ||||||||||||||||
Distributions to shareholders from | ||||||||||||||||||||||||
Net investment income | (0.09 | ) | 0.00 | 0.00 | 0.00 | 0.00 | 0.00 | |||||||||||||||||
Net realized gains | (3.22 | ) | (2.05 | ) | (0.22 | ) | 0.00 | (0.13 | ) | 0.00 | ||||||||||||||
|
|
|
|
|
|
|
|
|
|
|
| |||||||||||||
Total distributions to shareholders | (3.31 | ) | (2.05 | ) | (0.22 | ) | 0.00 | (0.13 | ) | 0.00 | ||||||||||||||
Net asset value, end of period | $16.01 | $18.22 | $20.44 | $17.70 | $14.87 | $15.61 | ||||||||||||||||||
Total return4 | 5.99 | % | 0.34 | % | 16.78 | % | 19.03 | % | (3.90 | )% | 10.16 | % | ||||||||||||
Ratios to average net assets (annualized) | ||||||||||||||||||||||||
Gross expenses | 1.96 | % | 1.94 | % | 1.93 | % | 1.94 | % | 1.95 | % | 2.01 | % | ||||||||||||
Net expenses | 1.83 | % | 1.83 | % | 1.85 | % | 1.89 | % | 1.89 | % | 1.89 | % | ||||||||||||
Net investment income (loss) | (0.02 | )% | 0.67 | % | (0.02 | )% | 0.07 | % | 0.02 | % | (0.38 | )% | ||||||||||||
Supplemental data | ||||||||||||||||||||||||
Portfolio turnover rate | 7 | % | 45 | % | 33 | % | 50 | % | 51 | % | 44 | % | ||||||||||||
Net assets, end of period (000s omitted) | $43,935 | $47,649 | $61,529 | $60,697 | $71,512 | $53,076 | ||||||||||||||||||
| 1 | Amount is more than $(0.005). |
| 2 | Amount is less than $0.005. |
| 3 | Calculated based upon average shares outstanding |
| 4 | Total return calculations do not include any sales charges. Returns for periods of less than one year are not annualized. |
The accompanying notes are an integral part of these financial statements.
16 | Wells Fargo Large Cap Core Fund
Table of Contents
Financial highlights
(For a share outstanding throughout each period)
| Six months ended January 31, 2020 (unaudited) | Year ended July 31 | |||||||||||||||||||
| CLASS R | 2019 | 2018 | 2017 | 20161 | ||||||||||||||||
Net asset value, beginning of period | $18.57 | $20.81 | $18.04 | $15.17 | $14.66 | |||||||||||||||
Net investment income | 0.04 | 0.21 | 0.12 | 0.13 | 0.06 | |||||||||||||||
Net realized and unrealized gains (losses) on investments | 1.13 | (0.29 | ) | 2.99 | 2.84 | 0.66 | ||||||||||||||
|
|
|
|
|
|
|
|
|
| |||||||||||
Total from investment operations | 1.17 | (0.08 | ) | 3.11 | 2.97 | 0.72 | ||||||||||||||
Distributions to shareholders from | ||||||||||||||||||||
Net investment income | (0.25 | ) | (0.11 | ) | (0.12 | ) | (0.10 | ) | (0.08 | ) | ||||||||||
Net realized gains | (3.22 | ) | (2.05 | ) | (0.22 | ) | 0.00 | (0.13 | ) | |||||||||||
|
|
|
|
|
|
|
|
|
| |||||||||||
Total distributions to shareholders | (3.47 | ) | (2.16 | ) | (0.34 | ) | (0.10 | ) | (0.21 | ) | ||||||||||
Net asset value, end of period | $16.27 | $18.57 | $20.81 | $18.04 | $15.17 | |||||||||||||||
Total return2 | 6.28 | % | 0.87 | % | 17.37 | % | 19.64 | % | 4.90 | % | ||||||||||
Ratios to average net assets (annualized) | ||||||||||||||||||||
Gross expenses | 1.46 | % | 1.44 | % | 1.43 | % | 1.44 | % | 1.46 | % | ||||||||||
Net expenses | 1.33 | % | 1.33 | % | 1.34 | % | 1.39 | % | 1.39 | % | ||||||||||
Net investment income | 0.44 | % | 1.18 | % | 0.48 | % | 0.51 | % | 0.52 | % | ||||||||||
Supplemental data | ||||||||||||||||||||
Portfolio turnover rate | 7 | % | 45 | % | 33 | % | 50 | % | 51 | % | ||||||||||
Net assets, end of period (000s omitted) | $2,310 | $2,043 | $2,042 | $1,369 | $26 | |||||||||||||||
| 1 | For the period from September 30, 2015 (commencement of class operations) to July 31, 2016 |
| 2 | Returns for periods of less than one year are not annualized. |
The accompanying notes are an integral part of these financial statements.
Wells Fargo Large Cap Core Fund | 17
Table of Contents
Financial highlights
(For a share outstanding throughout each period)
| Six months ended January 31, 2020 (unaudited) | Year ended July 31 | |||||||||||||||||||
| CLASS R6 | 2019 | 2018 | 2017 | 20161 | ||||||||||||||||
Net asset value, beginning of period | $18.68 | $20.92 | $18.09 | $15.24 | $14.66 | |||||||||||||||
Net investment income | 0.12 | 2 | 0.34 | 0.22 | 2 | 0.25 | 2 | 0.20 | ||||||||||||
Net realized and unrealized gains (losses) on investments | 1.11 | (0.30 | ) | 3.04 | 3.33 | 0.62 | ||||||||||||||
|
|
|
|
|
|
|
|
|
| |||||||||||
Total from investment operations | 1.23 | 0.04 | 3.26 | 3.58 | 0.82 | |||||||||||||||
Distributions to shareholders from | ||||||||||||||||||||
Net investment income | (0.37 | ) | (0.23 | ) | (0.21 | ) | (0.73 | ) | (0.11 | ) | ||||||||||
Net realized gains | (3.22 | ) | (2.05 | ) | (0.22 | ) | 0.00 | (0.13 | ) | |||||||||||
|
|
|
|
|
|
|
|
|
| |||||||||||
Total distributions to shareholders | (3.59 | ) | (2.28 | ) | (0.43 | ) | (0.73 | ) | (0.24 | ) | ||||||||||
Net asset value, end of period | $16.32 | $18.68 | $20.92 | $18.09 | $15.24 | |||||||||||||||
Total return3 | 6.56 | % | 1.60 | % | 18.16 | % | 24.01 | % | 5.57 | % | ||||||||||
Ratios to average net assets (annualized) | ||||||||||||||||||||
Gross expenses | 0.78 | % | 0.75 | % | 0.75 | % | 0.76 | % | 0.77 | % | ||||||||||
Net expenses | 0.65 | % | 0.65 | % | 0.65 | % | 0.68 | % | 0.68 | % | ||||||||||
Net investment income | 1.25 | % | 1.83 | % | 1.08 | % | 1.62 | % | 1.31 | % | ||||||||||
Supplemental data | ||||||||||||||||||||
Portfolio turnover rate | 7 | % | 45 | % | 33 | % | 50 | % | 51 | % | ||||||||||
Net assets, end of period (000s omitted) | $8,068 | $13,223 | $15,225 | $122 | $2,449 | |||||||||||||||
| 1 | For the period from September 30, 2015 (commencement of class operations) to July 31, 2016 |
| 2 | Calculated based upon average shares outstanding |
| 3 | Returns for periods of less than one year are not annualized. |
The accompanying notes are an integral part of these financial statements.
18 | Wells Fargo Large Cap Core Fund
Table of Contents
Financial highlights
(For a share outstanding throughout each period)
| Six months ended January 31, 2020 (unaudited) | Year ended July 31 | |||||||||||||||||||||||
| ADMINISTRATOR CLASS | 2019 | 2018 | 2017 | 2016 | 2015 | |||||||||||||||||||
Net asset value, beginning of period | $18.82 | $21.05 | $18.21 | $15.18 | $15.87 | $14.34 | ||||||||||||||||||
Net investment income | 0.08 | 1 | 0.29 | 1 | 0.17 | 1 | 0.16 | 1 | 0.15 | 0.10 | ||||||||||||||
Net realized and unrealized gains (losses) on investments | 1.14 | (0.30 | ) | 3.05 | 2.87 | (0.62 | ) | 1.50 | ||||||||||||||||
|
|
|
|
|
|
|
|
|
|
|
| |||||||||||||
Total from investment operations | 1.22 | (0.01 | ) | 3.22 | 3.03 | (0.47 | ) | 1.60 | ||||||||||||||||
Distributions to shareholders from | ||||||||||||||||||||||||
Net investment income | (0.31 | ) | (0.17 | ) | (0.16 | ) | (0.00 | )2 | (0.09 | ) | (0.07 | ) | ||||||||||||
Net realized gains | (3.22 | ) | (2.05 | ) | (0.22 | ) | 0.00 | (0.13 | ) | 0.00 | ||||||||||||||
|
|
|
|
|
|
|
|
|
|
|
| |||||||||||||
Total distributions to shareholders | (3.53 | ) | (2.22 | ) | (0.38 | ) | (0.00 | )2 | (0.22 | ) | (0.07 | ) | ||||||||||||
Net asset value, end of period | $16.51 | $18.82 | $21.05 | $18.21 | $15.18 | $15.87 | ||||||||||||||||||
Total return3 | 6.45 | % | 1.26 | % | 17.81 | % | 19.99 | % | (2.98 | )% | 11.28 | % | ||||||||||||
Ratios to average net assets (annualized) | ||||||||||||||||||||||||
Gross expenses | 1.12 | % | 1.10 | % | 1.10 | % | 1.10 | % | 1.12 | % | 1.11 | % | ||||||||||||
Net expenses | 0.97 | % | 0.97 | % | 0.98 | % | 1.00 | % | 0.96 | % | 0.90 | % | ||||||||||||
Net investment income | 0.87 | % | 1.52 | % | 0.86 | % | 1.00 | % | 0.95 | % | 0.61 | % | ||||||||||||
Supplemental data | ||||||||||||||||||||||||
Portfolio turnover rate | 7 | % | 45 | % | 33 | % | 50 | % | 51 | % | 44 | % | ||||||||||||
Net assets, end of period (000s omitted) | $12,280 | $16,566 | $25,444 | $32,091 | $57,879 | $83,692 | ||||||||||||||||||
| 1 | Calculated based upon average shares outstanding |
| 2 | Amount is less than $0.005. |
| 3 | Returns for periods of less than one year are not annualized. |
The accompanying notes are an integral part of these financial statements.
Wells Fargo Large Cap Core Fund | 19
Table of Contents
Financial highlights
(For a share outstanding throughout each period)
| Six months ended January 31, 2020 (unaudited) | Year ended July 31 | |||||||||||||||||||||||
| INSTITUTIONAL CLASS | 2019 | 2018 | 2017 | 2016 | 2015 | |||||||||||||||||||
Net asset value, beginning of period | $18.70 | $20.95 | $18.12 | $15.23 | $15.91 | $14.35 | ||||||||||||||||||
Net investment income | 0.12 | 1 | 0.34 | 0.23 | 0.18 | 0.18 | 1 | 0.14 | 1 | |||||||||||||||
Net realized and unrealized gains (losses) on investments | 1.11 | (0.30 | ) | 3.03 | 2.91 | (0.62 | ) | 1.50 | ||||||||||||||||
|
|
|
|
|
|
|
|
|
|
|
| |||||||||||||
Total from investment operations | 1.23 | 0.04 | 3.26 | 3.09 | (0.44 | ) | 1.64 | |||||||||||||||||
Distributions to shareholders from | ||||||||||||||||||||||||
Net investment income | (0.37 | ) | (0.24 | ) | (0.21 | ) | (0.20 | ) | (0.11 | ) | (0.08 | ) | ||||||||||||
Net realized gains | (3.22 | ) | (2.05 | ) | (0.22 | ) | 0.00 | (0.13 | ) | 0.00 | ||||||||||||||
|
|
|
|
|
|
|
|
|
|
|
| |||||||||||||
Total distributions to shareholders | (3.59 | ) | (2.29 | ) | (0.43 | ) | (0.20 | ) | (0.24 | ) | (0.08 | ) | ||||||||||||
Net asset value, end of period | $16.34 | $18.70 | $20.95 | $18.12 | $15.23 | $15.91 | ||||||||||||||||||
Total return2 | 6.55 | % | 1.56 | % | 18.16 | % | 20.43 | % | (2.75 | )% | 11.51 | % | ||||||||||||
Ratios to average net assets (annualized) | ||||||||||||||||||||||||
Gross expenses | 0.87 | % | 0.86 | % | 0.85 | % | 0.86 | % | 0.87 | % | 0.84 | % | ||||||||||||
Net expenses | 0.67 | % | 0.67 | % | 0.68 | % | 0.70 | % | 0.70 | % | 0.66 | % | ||||||||||||
Net investment income | 1.29 | % | 1.82 | % | 1.15 | % | 1.23 | % | 1.22 | % | 0.86 | % | ||||||||||||
Supplemental data | ||||||||||||||||||||||||
Portfolio turnover rate | 7 | % | 45 | % | 33 | % | 50 | % | 51 | % | 44 | % | ||||||||||||
Net assets, end of period (000s omitted) | $206,640 | $600,595 | $690,855 | $621,864 | $412,678 | $63,235 | ||||||||||||||||||
| 1 | Calculated based upon average shares outstanding |
| 2 | Returns for periods of less than one year are not annualized. |
The accompanying notes are an integral part of these financial statements.
20 | Wells Fargo Large Cap Core Fund
Table of Contents
Notes to financial statements (unaudited)
1. ORGANIZATION
Wells Fargo Funds Trust (the “Trust”), a Delaware statutory trust organized on March 10, 1999, is an open-end management investment company registered under the Investment Company Act of 1940, as amended (the “1940 Act”). As an investment company, the Trust follows the accounting and reporting guidance in Financial Accounting Standards Board (“FASB”) Accounting Standards Codification Topic 946, Financial Services – Investment Companies. These financial statements report on the Wells Fargo Large Cap Core Fund (the “Fund”) which is a diversified series of the Trust.
2. SIGNIFICANT ACCOUNTING POLICIES
The following significant accounting policies, which are consistently followed in the preparation of the financial statements of the Fund, are in conformity with U.S. generally accepted accounting principles which require management to make estimates and assumptions that affect the reported amounts of assets and liabilities, disclosure of contingent assets and liabilities at the date of the financial statements, and the reported amounts of revenues and expenses during the reporting period. Actual results could differ from those estimates.
Securities valuation
All investments are valued each business day as of the close of regular trading on the New York Stock Exchange (generally 4 p.m. Eastern Time), although the Fund may deviate from this calculation time under unusual or unexpected circumstances.
Equity securities that are listed on a foreign or domestic exchange or market are valued at the official closing price or, if none, the last sales price. If no sale occurs on the principal exchange or market that day, a fair value price will be determined in accordance with the Fund’s Valuation Procedures.
Investments in registered open-end investment companies are valued at net asset value. Interests in non-registered investment companies that are redeemable at net asset value are fair valued normally at net asset value.
Investments which are not valued using any of the methods discussed above are valued at their fair value, as determined in good faith by the Board of Trustees of the Fund. The Board of Trustees has established a Valuation Committee comprised of the Trustees and has delegated to it the authority to take any actions regarding the valuation of portfolio securities that the Valuation Committee deems necessary or appropriate, including determining the fair value of portfolio securities, unless the determination has been delegated to the Wells Fargo Asset Management Pricing Committee at Wells Fargo Funds Management, LLC (“Funds Management”). The Board of Trustees retains the authority to make or ratify any valuation decisions or approve any changes to the Valuation Procedures as it deems appropriate. On a quarterly basis, the Board of Trustees receives reports on any valuation actions taken by the Valuation Committee or the Wells Fargo Asset Management Pricing Committee which may include items for ratification.
Securities lending
The Fund may lend its securities from time to time in order to earn additional income in the form of fees or interest on securities received as collateral or the investment of any cash received as collateral. When securities are on loan, the Fund receives interest or dividends on those securities. Cash collateral received in connection with its securities lending transactions is invested in Securities Lending Cash Investments, LLC (the “Securities Lending Fund”). Investments in Securities Lending Fund are valued at the evaluated bid price provided by an independent pricing service. Income earned from investment in the Securities Lending Fund (net of fees and rebates), if any, is included in income from affiliated securities on the Statement of Operations.
In a securities lending transaction, the net asset value of the Fund is affected by an increase or decrease in the value of the securities loaned and by an increase or decrease in the value of the instrument in which collateral is invested. The amount of securities lending activity undertaken by the Fund fluctuates from time to time. The Fund has the right under the lending agreement to recover the securities from the borrower on demand. In the event of default or bankruptcy by the borrower, the Fund may be prevented from recovering the loaned securities or gaining access to the collateral or may experience delays or costs in doing so. In such an event, the terms of the agreement allows the unaffiliated securities lending agent to use the collateral to purchase replacement securities on behalf of the Fund or pay the Fund the market value of the loaned securities. The Fund bears the risk of loss with respect to depreciation of its investment of the cash collateral.
Security transactions and income recognition
Securities transactions are recorded on a trade date basis. Realized gains or losses are recorded on the basis of identified cost.
Dividend income is recognized on the ex-dividend date.
Distributions to shareholders
Distributions to shareholders from net investment income and any net realized gains are recorded on the ex-dividend date and paid at least annually. Such distributions are determined in accordance with income tax regulations and may differ from U.S. generally
Wells Fargo Large Cap Core Fund | 21
Table of Contents
Notes to financial statements (unaudited)
accepted accounting principles. Dividend sources are estimated at the time of declaration. The tax character of distributions is determined as of the Fund’s fiscal year end. Therefore, a portion of the Fund’s distributions made prior to the Fund’s fiscal year end may be categorized as a tax return of capital at year end.
Federal and other taxes
The Fund intends to continue to qualify as a regulated investment company by distributing substantially all of its investment company taxable income and any net realized capital gains (after reduction for capital loss carryforwards) sufficient to relieve it from all, or substantially all, federal income taxes. Accordingly, no provision for federal income taxes was required.
The Fund’s income and federal excise tax returns and all financial records supporting those returns for the prior three fiscal years are subject to examination by the federal and Delaware revenue authorities. Management has analyzed the Fund’s tax positions taken on federal, state, and foreign tax returns for all open tax years and does not believe that there are any uncertain tax positions that require recognition of a tax liability.
As of January 31, 2020, the aggregate cost of all investments for federal income tax purposes was $454,867,846 and the unrealized gains (losses) consisted of:
Gross unrealized gains | $ | 173,582,260 | ||
Gross unrealized losses | (20,712,125 | ) | ||
Net unrealized gains | $ | 152,870,135 | ||
Class allocations
The separate classes of shares offered by the Fund differ principally in applicable sales charges, distribution, shareholder servicing, and administration fees. Class specific expenses are charged directly to that share class. Investment income, common fund-level expenses, and realized and unrealized gains (losses) on investments are allocated daily to each class of shares based on the relative proportion of net assets of each class.
3. FAIR VALUATION MEASUREMENTS
Fair value measurements of investments are determined within a framework that has established a fair value hierarchy based upon the various data inputs utilized in determining the value of the Fund’s investments. The three-level hierarchy gives the highest priority to unadjusted quoted prices in active markets for identical assets or liabilities (Level 1) and the lowest priority to unobservable inputs (Level 3). The Fund’s investments are classified within the fair value hierarchy based on the lowest level of input that is significant to the fair value measurement. The inputs are summarized into three broad levels as follows:
| ∎ | Level 1 – quoted prices in active markets for identical securities |
| ∎ | Level 2 – other significant observable inputs (including quoted prices for similar securities, interest rates, prepayment speeds, credit risk, etc.) |
| ∎ | Level 3 – significant unobservable inputs (including the Fund’s own assumptions in determining the fair value of investments) |
The inputs or methodologies used for valuing investments in securities are not necessarily an indication of the risk associated with investing in those securities.
22 | Wells Fargo Large Cap Core Fund
Table of Contents
Notes to financial statements (unaudited)
The following is a summary of the inputs used in valuing the Fund’s assets and liabilities as of January 31, 2020:
Quoted prices (Level 1) | Other significant observable inputs (Level 2) | Significant unobservable inputs (Level 3) | Total | |||||||||||||
Assets | ||||||||||||||||
Investments in: | ||||||||||||||||
Common stocks | ||||||||||||||||
Communication services | $ | 25,790,727 | $ | 0 | $ | 0 | $ | 25,790,727 | ||||||||
Consumer discretionary | 47,563,780 | 0 | 0 | 47,563,780 | ||||||||||||
Consumer staples | 42,471,034 | 0 | 0 | 42,471,034 | ||||||||||||
Energy | 37,945,510 | 0 | 0 | 37,945,510 | ||||||||||||
Financials | 52,984,497 | 0 | 0 | 52,984,497 | ||||||||||||
Health care | 101,257,123 | 0 | 0 | 101,257,123 | ||||||||||||
Industrials | 64,289,140 | 0 | 0 | 64,289,140 | ||||||||||||
Information technology | 153,108,385 | 0 | 0 | 153,108,385 | ||||||||||||
Materials | 22,003,751 | 0 | 0 | 22,003,751 | ||||||||||||
Real estate | 42,420,720 | 0 | 0 | 42,420,720 | ||||||||||||
Utilities | 10,111,548 | 0 | 0 | 10,111,548 | ||||||||||||
Short-term investments | ||||||||||||||||
Investment companies | 7,791,766 | 0 | 0 | 7,791,766 | ||||||||||||
Total assets | $ | 607,737,981 | $ | 0 | $ | 0 | $ | 607,737,981 | ||||||||
Additional sector, industry or geographic detail is included in the Portfolio of Investments.
For the six months ended January 31, 2020, the Fund did not have any transfers into/out of Level 3.
4. TRANSACTIONS WITH AFFILIATES
Management fee
Funds Management, an indirect wholly owned subsidiary of Wells Fargo & Company (“Wells Fargo”), is the manager of the Fund and provides advisory and fund-level administrative services under an investment management agreement. Under the investment management agreement, Funds Management is responsible for, among other services, implementing the investment objectives and strategies of the Fund, supervising the subadviser and providing fund-level administrative services in connection with the Fund’s operations. As compensation for its services under the investment management agreement, Funds Management is entitled to receive a management fee at the following annual rate based on the Fund’s average daily net assets:
| Average daily net assets | Management fee | |||
First $500 million | 0.700 | % | ||
Next $500 million | 0.675 | |||
Next $1 billion | 0.650 | |||
Next $2 billion | 0.625 | |||
Next $1 billion | 0.600 | |||
Next $3 billion | 0.590 | |||
Next $2 billion | 0.565 | |||
Next $2 billion | 0.555 | |||
Next $4 billion | 0.530 | |||
Over $16 billion | 0.505 | |||
For the six months ended January 31, 2020, the management fee was equivalent to an annual rate of 0.69% of the Fund’s average daily net assets.
Wells Fargo Large Cap Core Fund | 23
Table of Contents
Notes to financial statements (unaudited)
Funds Management has retained the services of a subadviser to provide daily portfolio management to the Fund. The fee for subadvisory services is borne by Funds Management. Wells Capital Management Incorporated (“WellsCap”), an affiliate of Funds Management and an indirect wholly owned subsidiary of Wells Fargo, is the subadviser to the Fund and is entitled to receive a fee from Funds Management at an annual rate starting at 0.35% and declining to 0.30% as the average daily net assets of the Fund increase.
Administration fees
Under a class-level administration agreement, Funds Management provides class-level administrative services to the Fund, which includes paying fees and expenses for services provided by the transfer agent, sub-transfer agents, omnibus account servicers and record-keepers. As compensation for its services under the class-level administration agreement, Funds Management receives an annual fee which is calculated based on the average daily net assets of each class as follows:
Class-level administration fee | ||||
Class A, Class C, Class R | 0.21 | % | ||
Class R6 | 0.03 | |||
Administrator Class, Institutional Class | 0.13 | |||
Waivers and/or expense reimbursements
Funds Management has contractually waived and/or reimbursed management and administration fees to the extent necessary to maintain certain net operating expense ratios for the Fund. When each class of the Fund has exceeded its expense cap, Funds Management has waived fees and/or reimbursed expenses from fund-level expenses on a proportionate basis and then from class specific expenses. When only certain classes exceed their expense caps, waivers and/or reimbursements are applied against class specific expenses before fund-level expenses. Funds Management has committed through November 30, 2020 to waive fees and/or reimburse expenses to the extent necessary to cap the Fund’s expenses at 1.08% for Class A shares, 1.83% for Class C shares, 1.33% for Class R shares, 0.65% for Class R6 shares, 0.97% for Administrator Class shares, and 0.67% for Institutional Class shares. Prior to or after the commitment expiration date, the cap may be increased or the commitment to maintain the cap may be terminated only with the approval of the Board of Trustees.
Distribution fees
The Trust has adopted a distribution plan for Class C and Class R shares of the Fund pursuant to Rule 12b-1 under the 1940 Act. Distribution fees are charged to Class C and Class R shares and paid to Wells Fargo Funds Distributor, LLC (“Funds Distributor”), the principal underwriter, at an annual rate of 0.75% of the average daily net assets of Class C shares and 0.25% of the average daily net assets of Class R shares.
In addition, Funds Distributor is entitled to receive the front-end sales charge from the purchase of Class A shares and a contingent deferred sales charge on the redemption of certain Class A shares. Funds Distributor is also entitled to receive the contingent deferred sales charges from redemptions of Class C shares. For the six months ended January 31, 2020, Funds Distributor received $2,257 from the sale of Class A shares and $29 in contingent deferred sales charges from redemptions of Class C shares. No contingent deferred sales charges were incurred by Class A shares for the six months ended January 31, 2020.
Shareholder servicing fees
The Trust has entered into contracts with one or more shareholder servicing agents, whereby Class A, Class C, Class R, and Administrator Class of the Fund are charged a fee at an annual rate of 0.25% of the average daily net assets of each respective class. A portion of these total shareholder servicing fees were paid to affiliates of Wells Fargo.
Interfund transactions
The Fund may purchase or sell portfolio investment securities to certain other Wells Fargo affiliates pursuant to Rule 17a-7 under the 1940 Act and under procedures adopted by the Board of Trustees. The procedures have been designed to ensure that these interfund transactions, which do not incur broker commissions, are effected at current market prices.
5. INVESTMENT PORTFOLIO TRANSACTIONS
Purchases and sales of investments, excluding U.S. government obligations (if any) and short-term securities, for the six months ended January 31, 2020 were $59,034,930 and $518,803,464, respectively.
24 | Wells Fargo Large Cap Core Fund
Table of Contents
Notes to financial statements (unaudited)
6. SECURITIES LENDING TRANSACTIONS
The Fund lends its securities through an unaffiliated securities lending agent and receives collateral in the form of cash or securities with a value at least equal to the value of the securities on loan. The value of the loaned securities is determined at the close of each business day and any increases or decreases in the required collateral are exchanged between the Fund and the counterparty on the next business day. Cash collateral received is invested in the Securities Lending Fund which seeks to provide a positive return compared to the daily Fed Funds Open Rate by investing in high-quality, U.S. dollar-denominated short-term money market instruments and is exempt from registration under Section 3(c)(7) of the 1940 Act. Securities Lending Fund is managed by Funds Management and is subadvised by WellsCap. Funds Management receives an advisory fee starting at 0.05% and declining to 0.01% as the average daily net assets of the Securities Lending Fund increase. All of the fees received by Funds Management are paid to WellsCap for its services as subadviser.
In the event of counterparty default or the failure of a borrower to return a loaned security, the Fund has the right to use the collateral to offset any losses incurred. As of January 31, 2020, the Fund had securities lending transactions with the following counterparties which are subject to offset:
| Counterparty | Value of securities on loan | Collateral received1 | Net amount | |||||
BNP Paribas Securities Corp. | $1,478,048 | $(1,478,048) | $ | 0 | ||||
| 1 | Collateral received within this table is limited to the collateral for the net transaction with the counterparty. |
7. BANK BORROWINGS
The Trust (excluding the money market funds), Wells Fargo Master Trust and Wells Fargo Variable Trust are parties to a $280,000,000 revolving credit agreement whereby the Fund is permitted to use bank borrowings for temporary or emergency purposes, such as to fund shareholder redemption requests. Interest under the credit agreement is charged to the Fund based on a borrowing rate equal to the higher of the Federal Funds rate in effect on that day plus 1.25% or the overnight LIBOR rate in effect on that day plus 1.25%. In addition, an annual commitment fee equal to 0.25% of the unused balance is allocated to each participating fund.
During the six months ended January 31, 2020, the Fund had average borrowings outstanding of $24,429 (on an annualized basis) at an average interest rate of 2.89% and paid interest in the amount of $706.
8. CONCENTRATION RISK
Concentration risks result from exposure to a limited number of sectors. As of the end of the period, the Fund invests a concentration of its portfolio in the information technology sector. A fund that invests a substantial portion of its assets in any sector may be more affected by changes in that sector than would be a fund whose investments are not heavily weighted in any sector.
9. INDEMNIFICATION
Under the Trust’s organizational documents, the officers and Trustees have been granted certain indemnification rights against certain liabilities that may arise out of performance of their duties to the Trust. Additionally, in the normal course of business, the Trust may enter into contracts with service providers that contain a variety of indemnification clauses. The Trust’s maximum exposure under these arrangements is dependent on future claims that may be made against the Fund and, therefore, cannot be estimated.
10. NEW ACCOUNTING PRONOUNCEMENT
In August 2018, FASB issued Accounting Standards Update (“ASU”) No. 2018-13, Fair Value Measurement (Topic 820)Disclosure Framework—Changes to the Disclosure Requirements for Fair Value Measurement. ASU 2018-13 updates the disclosure requirements for fair value measurements by modifying or removing certain disclosures and adding certain new disclosures. The amendments are effective for fiscal years, and interim periods within those fiscal years, beginning after December 15, 2019. Early adoption is permitted. Management has adopted the removal and modification of disclosures early, as permitted, and will adopt the additional new disclosures at the effective date.
11. SUBSEQUENT EVENT
On March 11, 2020, the World Health Organization announced that it had made the assessment that coronavirus disease 2019 (“COVID-19”) is a pandemic. The impacts of COVID-19 is adversely affecting the entire global economy, individual companies
Wells Fargo Large Cap Core Fund | 25
Table of Contents
Notes to financial statements (unaudited)
and investment products, and the market in general. There is significant uncertainty around the extent and duration of business disruptions related to COVID-19 and the impact may be short term or may last for an extended period of time. The risk of further spreading of COVID-19 has led to significant uncertainty and volatility in the financial markets and the value of the Fund and the securities in which the Fund invests may be adversely affected by impacts caused by COVID-19.
26 | Wells Fargo Large Cap Core Fund
Table of Contents
PROXY VOTING INFORMATION
A description of the policies and procedures used to determine how to vote proxies relating to portfolio securities is available, upon request, by calling1-800-222-8222, visiting our website atwfam.com, or visiting the SEC website at sec.gov. Information regarding how the proxies related to portfolio securities were voted during the most recent 12-month period ended June 30 is available on the website atwfam.comor by visiting the SEC website at sec.gov.
QUARTERLY PORTFOLIO HOLDINGS INFORMATION
The Fund files its complete schedule of portfolio holdings with the SEC for the first and third quarters of each fiscal year as an exhibit to its reports on Form N-PORT. Shareholders may view the filed Form N-PORT by visiting the SEC website at sec.gov.
Wells Fargo Large Cap Core Fund | 27
Table of Contents
Other information (unaudited)
BOARD OF TRUSTEES AND OFFICERS
Each of the Trustees and Officers1 listed in the table below acts in identical capacities for each fund in the Wells Fargo family of funds, which consists of 149 mutual funds comprising the Wells Fargo Funds Trust, Wells Fargo Variable Trust, Wells Fargo Master Trust and four closed-end funds (collectively the “Fund Complex”). This table should be read in conjunction with the Prospectus and the Statement of Additional Information2. The mailing address of each Trustee and Officer is 525 Market Street, 12th Floor, San Francisco, CA 94105. Each Trustee and Officer serves an indefinite term, however, each Trustee serves such term until reaching the mandatory retirement age established by the Trustees.
Independent Trustees
Name and year of birth | Position held and length of service* | Principal occupations during past five years or longer | Current other public company or investment company directorships | |||
William R. Ebsworth (Born 1957) | Trustee, since 2015 | Retired. From 1984 to 2013, equities analyst, portfolio manager, research director and chief investment officer at Fidelity Management and Research Company in Boston, Tokyo, and Hong Kong, and retired in 2013 as Chief Investment Officer of Fidelity Strategic Advisers, Inc. where he led a team of investment professionals managing client assets. Prior thereto, Board member of Hong Kong Securities Clearing Co., Hong Kong Options Clearing Corp., the Thailand International Fund, Ltd., Fidelity Investments Life Insurance Company, and Empire Fidelity Investments Life Insurance Company. Audit Committee Chair and Investment Committee Chair of the Vincent Memorial Hospital Endowment (non-profit organization). Mr. Ebsworth is a CFA® charterholder. | N/A | |||
Jane A. Freeman (Born 1953) | Trustee, since 2015; Chair Liaison, since 2018 | Retired. From 2012 to 2014 and 1999 to 2008, Chief Financial Officer of Scientific Learning Corporation. From 2008 to 2012, Ms. Freeman provided consulting services related to strategic business projects. Prior to 1999, Portfolio Manager at Rockefeller & Co. and Scudder, Stevens & Clark. Board member of the Harding Loevner Funds from 1996 to 2014, serving as both Lead Independent Director and chair of the Audit Committee. Board member of the Russell Exchange Traded Funds Trust from 2011 to 2012 and the chair of the Audit Committee. Ms. Freeman is a Board Member of The Ruth Bancroft Garden (non-profit organization). She is also an inactive Chartered Financial Analyst. | N/A | |||
Isaiah Harris, Jr. (Born 1952) | Trustee, since 2009; Audit Committee Chairman, since 2019 | Retired. Chairman of the Board of CIGNA Corporation since 2009, and Director since 2005. From 2003 to 2011, Director of Deluxe Corporation. Prior thereto, President and CEO of BellSouth Advertising and Publishing Corp. from 2005 to 2007, President and CEO of BellSouth Enterprises from 2004 to 2005 and President of BellSouth Consumer Services from 2000 to 2003. Emeritus member of the Iowa State University Foundation Board of Governors. Emeritus Member of the Advisory Board of Iowa State University School of Business. Advisory Board Member, Palm Harbor Academy (private school). Advisory Board Member, Child Evangelism Fellowship (non-profit). Mr. Harris is a certified public accountant (inactive status). | CIGNA Corporation | |||
Judith M. Johnson (Born 1949) | Trustee, since 2008; Audit Committee Chairman, from 2009 to 2018 | Retired. Prior thereto, Chief Executive Officer and Chief Investment Officer of Minneapolis Employees Retirement Fund from 1996 to 2008. Ms. Johnson is an attorney, certified public accountant and a certified managerial accountant. | N/A | |||
28 | Wells Fargo Large Cap Core Fund
Table of Contents
Other information (unaudited)
Name and year of birth | Position held and length of service* | Principal occupations during past five years or longer | Current other public company or investment company directorships | |||
David F. Larcker (Born 1950) | Trustee, since 2009 | James Irvin Miller Professor of Accounting at the Graduate School of Business, Stanford University, Director of the Corporate Governance Research Initiative and Senior Faculty of The Rock Center for Corporate Governance since 2006. From 2005 to 2008, Professor of Accounting at the Graduate School of Business, Stanford University. Prior thereto, Ernst & Young Professor of Accounting at The Wharton School, University of Pennsylvania from 1985 to 2005. | N/A | |||
Olivia S. Mitchell (Born 1953) | Trustee, since 2006; Nominating and Governance Committee Chair, since 2018 | International Foundation of Employee Benefit Plans Professor, Wharton School of the University of Pennsylvania since 1993. Director of Wharton’s Pension Research Council and Boettner Center on Pensions & Retirement Research, and Research Associate at the National Bureau of Economic Research. Previously, Cornell University Professor from 1978 to 1993. | N/A | |||
Timothy J. Penny (Born 1951) | Trustee, since 1996; Chairman, since 2018 | President and Chief Executive Officer of Southern Minnesota Initiative Foundation, a non-profit organization, since 2007. Member of the Board of Trustees of NorthStar Education Finance, Inc., a non-profit organization, since 2007. | N/A | |||
James G. Polisson (Born 1959) | Trustee, since 2018 | Retired. Chief Marketing Officer, Source (ETF) UK Services, Ltd, from 2015 to 2017. From 2012 to 2015, Principal of The Polisson Group, LLC, a management consulting, corporate advisory and principal investing company. Chief Executive Officer and Managing Director at Russell Investments, Global Exchange Traded Funds from 2010 to 2012. Managing Director of Barclays Global Investors from 1998 to 2010 and Global Chief Marketing Officer for iShares and Barclays Global Investors from 2000 to 2010. Trustee of the San Francisco Mechanics’ Institute, a non-profit organization, from 2013 to 2015. Board member of the Russell Exchange Traded Fund Trust from 2011 to 2012. Director of Barclays Global Investors Holdings Deutschland GmbH from 2006 to 2009. Mr. Polisson is an attorney and has a retired status with the Massachusetts and District of Columbia Bar Associations. | N/A | |||
Pamela Wheelock3 (Born 1959) | Trustee, since January 2020; previously Trustee from January 2018 to July 2019 | Board member of the Destination Medical Center Economic Development Agency, Rochester, Minnesota since 2019. Acting Commissioner, Minnesota Department of Human Services, July 2019 through September 2019. Human Services Manager (part-time), Minnesota Department of Human Services, October 2019 through December 2019. Chief Operating Officer, Twin Cities Habitat for Humanity from 2017 to 2019. Vice President of University Services, University of Minnesota from 2012 to 2016. Prior thereto, on the Board of Directors, Governance Committee and Finance Committee for the Minnesota Philanthropy Partners (Saint Paul Foundation) from 2012 to 2018, Interim Chief Executive Officer of Blue Cross Blue Shield of Minnesota from 2011 to 2012, Chairman of the Board from 2009 to 2012 and Board Director from 2003 to 2015. Vice President, Leadership and Community Engagement, Bush Foundation, Saint Paul, Minnesota (a private foundation) from 2009 to 2011. Executive Vice President and Chief Financial Officer, Minnesota Sports and Entertainment from 2004 to 2009 and Senior Vice President from 2002 to 2004. Executive Vice President of the Minnesota Wild Foundation from 2004 to 2008. Commissioner of Finance, State of Minnesota, from 1999 to 2002. Currently Board Chair of the Minnesota Wild Foundation since 2010. | N/A | |||
| * | Length of service dates reflect the Trustee’s commencement of service with the Trust’s predecessor entities, where applicable. |
Wells Fargo Large Cap Core Fund | 29
Table of Contents
Other information (unaudited)
Officers
Name and year of birth | Position held and length of service | Principal occupations during past five years or longer | ||
Andrew Owen (Born 1960) | President, since 2017 | Executive Vice President of Wells Fargo & Company and Head of Affiliated Managers, Wells Fargo Asset Management, since 2014. In addition, Mr. Owen is currently President, Chief Executive Officer and Director of Wells Fargo Funds Management, LLC since 2017. Prior thereto, Executive Vice President responsible for marketing, investments and product development for Wells Fargo Funds Management, LLC, from 2009 to 2014. | ||
Jeremy DePalma1 (Born 1974) | Treasurer, since 2012 | Senior Vice President of Wells Fargo Funds Management, LLC since 2009. Senior Vice President of Evergreen Investment Management Company, LLC from 2008 to 2010 and head of the Fund Reporting and Control Team within Fund Administration from 2005 to 2010. | ||
Michelle Rhee (Born 1966) | Chief Legal Officer, since 2019 | Secretary of Wells Fargo Funds Management, LLC, Chief Legal Counsel of Wells Fargo Asset Management and Assistant General Counsel of Wells Fargo Bank, N.A. since 2018. Associate General Counsel and Managing Director of Bank of America Corporation from 2004 to 2018. | ||
Catherine Kennedy (Born 1969) | Secretary, since 2019 | Vice President of Wells Fargo Funds Management, LLC and Senior Counsel of the Wells Fargo Legal Department since 2010. Vice President and Senior Counsel of Evergreen Investment Management Company, LLC from 1998 to 2010. | ||
Michael H. Whitaker (Born 1967) | Chief Compliance Officer, since 2016 | Chief Compliance Officer of Wells Fargo Asset Management since 2016. Senior Vice President and Chief Compliance Officer for Fidelity Investments from 2007 to 2016. | ||
David Berardi (Born 1975) | Assistant Treasurer, since 2009 | Vice President of Wells Fargo Funds Management, LLC since 2009. Vice President of Evergreen Investment Management Company, LLC from 2008 to 2010. Manager of Fund Reporting and Control for Evergreen Investment Management Company, LLC from 2004 to 2010. | ||
| 1 | Jeremy DePalma acts as Treasurer of 85 funds and Assistant Treasurer of 64 funds in the Fund Complex. |
| 2 | The Statement of Additional Information includes additional information about the Trustees and is available, without charge, upon request, by calling1-800-222-8222 or by visiting the website atwfam.com. |
| 3 | Pamela Wheelock was re-appointed to the Board effective January 1, 2020. |
30 | Wells Fargo Large Cap Core Fund
Table of Contents
Effective on or about May 1, 2020, if you purchase Fund shares through a Janney Montgomery Scott LLC (“Janney”) brokerage account, you will be eligible for the following load waivers (front-end sales charge waivers and contingent deferred sales charge (“CDSC”), or back-end sales charge, waivers) and discounts, which may differ from those disclosed elsewhere in the Fund’s Prospectus or SAI.
| Front-end sales charge* waivers on Class A shares available at Janney |
| Shares purchased through reinvestment of capital gains distributions and dividend reinvestment when purchasing shares of the same fund (but not any other fund within the fund family). |
| Shares purchased by employees and registered representatives of Janney or its affiliates and their family members as designated by Janney. |
| Shares purchased from the proceeds of redemptions within the same fund family, provided (1) the repurchase occurs within ninety (90) days following the redemption, (2) the redemption and purchase occur in the same account, and (3) redeemed shares were subject to a front-end or deferred sales load (i.e., right of reinstatement). |
| Employer-sponsored retirement plans (e.g., 401(k) plans, 457 plans, employer-sponsored 403(b) plans, profit sharing and money purchase pension plans and defined benefit plans). For purposes of this provision, employer-sponsored retirement plans do not include SEP IRAs, Simple IRAs, SAR-SEPs or Keogh plans. |
| Shares acquired through a right of reinstatement. |
| Class C shares that are no longer subject to a contingent deferred sales charge and are converted to Class A shares of the same fund pursuant to Janney’s policies and procedures. |
| CDSC waivers on Class A and Class C shares available at Janney |
| Shares sold upon the death or disability of the shareholder. |
| Shares sold as part of a systematic withdrawal plan as described in the Fund’s Prospectus. |
| Shares purchased in connection with a return of excess contributions from an IRA account. |
| Shares sold as part of a required minimum distribution for IRA and retirement accounts if the redemption is taken in or after the year the shareholder reaches qualified age based on applicable IRS regulations. |
| Shares sold to pay Janney fees but only if the transaction is initiated by Janney. |
| Shares acquired through a right of reinstatement. |
| Shares exchanged into the same share class of a different fund. |
| Front-end sales charge* discounts available at Janney; breakpoints, rights of accumulation and/or letters of intent |
| Breakpoints as described in the Fund’s Prospectus. |
| Rights of accumulation (“ROA”), which entitle shareholders to breakpoint discounts, will be automatically calculated based on the aggregated holding of fund family assets held by accounts within the purchaser’s household at Janney. Eligible fund family assets not held at Janney may be included in the ROA calculation only if the shareholder notifies his or her financial advisor about such assets. |
| Letters of intent which allow for breakpoint discounts based on anticipated purchases within a fund family, over a 13-month time period. Eligible fund family assets not held at Janney Montgomery Scott may be included in the calculation of letters of intent only if the shareholder notifies his or her financial advisor about such assets. |
| * | Also referred to as an “initial sales charge.” |
Wells Fargo Large Cap Core Fund | 31
Table of Contents
This page is intentionally left blank.
Table of Contents
For more information
More information about Wells Fargo Funds is available free upon request. To obtain literature, please write, visit the Fund’s website, or call:
Wells Fargo Funds
P.O. Box 219967
Kansas City, MO 64121-9967
Website:wfam.com
Individual investors:1-800-222-8222
Retail investment professionals:1-888-877-9275
Institutional investment professionals:1-866-765-0778

This report and the financial statements contained herein are submitted for the general information of the shareholders of the Fund. If this report is used for promotional purposes, distribution of the report must be accompanied or preceded by a current prospectus. Before investing, please consider the investment objectives, risks, charges, and expenses of the investment. For a current prospectus and, if available, a summary prospectus, containing this information, call1-800-222-8222 or visit the Fund’s website atwfam.com. Read the prospectus carefully before you invest or send money.
Wells Fargo Asset Management (WFAM) is the trade name for certain investment advisory/management firms owned by Wells Fargo & Company. These firms include but are not limited to Wells Capital Management Incorporated and Wells Fargo Funds Management, LLC. Certain products managed by WFAM entities are distributed by Wells Fargo Funds Distributor, LLC (a broker-dealer and Member FINRA).
This material is for general informational and educational purposes only and is NOT intended to provide investment advice or a recommendation of any kind—including a recommendation for any specific investment, strategy, or plan.
INVESTMENT PRODUCTS: NOT FDIC INSURED ◾ NO BANK GUARANTEE ◾ MAY LOSE VALUE
© 2020 Wells Fargo & Company. All rights reserved
PAR-0220-03828 03-20
SA208/SAR208 01-20
Table of Contents

Semi-Annual Report
January 31, 2020
Wells Fargo Large Cap Growth Fund
Beginning on January 1, 2021, as permitted by new regulations adopted by the Securities and Exchange Commission, paper copies of the Wells Fargo Funds’ annual and semi-annual shareholder reports issued after this date will no longer be sent by mail, unless you specifically request paper copies of the reports. Instead, the reports will be made available on the Funds’ website, and you will be notified by mail each time a report is posted and provided with a website address to access the report.
If you already elected to receive shareholder reports electronically, you will not be affected by this change and you need not take any action. You may elect to receive shareholder reports and other communications from the Fund electronically at any time by contacting your financial intermediary (such as a broker-dealer or bank) or, if you are a direct investor, by calling1-800-222-8222 or by enrolling at wellsfargo.com/advantagedelivery.
You may elect to receive all future reports in paper free of charge. If you invest through a financial intermediary, you can contact your financial intermediary to request that you continue to receive paper copies of your shareholder reports; if you invest directly with the Fund, you can call 1-800-222-8222. Your election to receive reports in paper will apply to all Wells Fargo Funds held in your account with your financial intermediary or, if you are a direct investor, to all Wells Fargo Funds that you hold.
Table of Contents
|
Reduce clutter. Save trees. |
Sign up for electronic delivery of prospectuses and shareholder reports atwellsfargo.com/advantagedelivery |
The views expressed and any forward-looking statements are as of January 31, 2020, unless otherwise noted, and are those of the Fund managers and/or Wells Fargo Asset Management. Discussions of individual securities, or the markets generally, or any Wells Fargo Fund are not intended as individual recommendations. Future events or results may vary significantly from those expressed in any forward-looking statements. The views expressed are subject to change at any time in response to changing circumstances in the market. Wells Fargo Asset Management and the Fund disclaim any obligation to publicly update or revise any views expressed or forward-looking statements.
INVESTMENT PRODUCTS: NOT FDIC INSURED ◾ NO BANK GUARANTEE ◾ MAY LOSE VALUE
Wells Fargo Large Cap Growth Fund | 1
Table of Contents
Letter to shareholders (unaudited)

Andrew Owen
President
Wells Fargo Funds
“As the period began, U.S.-China trade tensions continued with no signs of compromise.”
Dear Shareholder:
We are pleased to offer you this semi-annual report for the Wells Fargo Large Cap Growth Fund for thesix-month period that ended January 31, 2020. Despite some market volatility, the period was strongly positive for financial markets as supportive central banks more than offset concerns over slowing global economic growth and international trade tensions.
Overall, both fixed-income and equity investors enjoyed healthy annual returns, with U.S. markets leading the way. For the period, U.S. stocks, based on the S&P 500 Index,1 gained 9.31% and international stocks, as measured by the MSCI ACWI ex USA Index (Net),2 returned 5.37%. The MSCI EM Index (Net)3 gained a more modest 3.36%. For bond investors, the Bloomberg Barclays U.S. Aggregate Bond Index4 added 4.20%, the Bloomberg Barclays Global Aggregateex-USD Index5 returned 1.58%, the Bloomberg Barclays Municipal Bond Index6 gained 3.33%, and the ICE BofA U.S. High Yield Index7 added 3.34%.
The period began with uncertainty, leading to central bank support.
In August as the period began, U.S.-China trade tensions continued with no signs of compromise. Evidence of a continued global economic slowdown mounted, and central banks in China, New Zealand, and Thailand cut interest rates. Industrial and manufacturing data declined in China, Canada, Japan, and Germany. Adding to global uncertainty, Italy’s prime minister resigned, many feared a crackdown in Hong Kong as protestors sustained their calls for reform, and Boris Johnson planned to suspend Parliament as Brexit’s deadline neared.
In the U.S., the Federal Reserve (Fed) cut interest rates a second time in the third quarter in September. U.S. manufacturing data disappointed investors. The U.S. Congress announced it would pursue an impeachment investigation of President Trump. Meanwhile, the Brexit impasse showed no signs of resolution. Officials in China said that hitting the country’s economic growth goals for the year would be difficult considering the weight of tariffs and trade restrictions. Although the S&P 500 Index finished the third quarter with the bestyear-to-date returns in more than 20 years, concerns about future returns remained.
The fourth quarter started on a strong note, with U.S.-China trade tensions relaxing in October along with renewed optimism for a U.K. Brexit deal and positive macroeconomic data. The initial estimate of U.S. third-quarter gross domestic product growth was a resilient 1.9% annualized rate, while the U.S. unemployment rate fell to a50-year low of 3.5% in September. However, despite resilience among U.S. consumers, business
| 1 | The S&P 500 Index consists of 500 stocks chosen for market size, liquidity, and industry group representation. It is a market-value-weighted index with each stock’s weight in the index proportionate to its market value. You cannot invest directly in an index. |
| 2 | The Morgan Stanley Capital International (MSCI) All Country World Index (ACWI) ex USA Index (Net) is a free-float-adjusted market-capitalization-weighted index that is designed to measure the equity market performance of developed markets, excluding the United States. Source: MSCI. MSCI makes no express or implied warranties or representations and shall have no liability whatsoever with respect to any MSCI data contained herein. The MSCI data may not be further redistributed or used as a basis for other indices or any securities or financial products. This report is not approved, reviewed, or produced by MSCI. You cannot invest directly in an index. |
| 3 | The MSCI Emerging Markets (EM) Index (Net) is a free-float-adjusted market-capitalization-weighted index that is designed to measure equity market performance of emerging markets. You cannot invest directly in an index. |
| 4 | The Bloomberg Barclays U.S. Aggregate Bond Index is a broad-based benchmark that measures the investment-grade, U.S. dollar-denominated, fixed-rate taxable bond market, including Treasuries, government-related and corporate securities, mortgage-backed securities (agency fixed-rate and hybrid adjustable-rate mortgage pass-throughs), asset-backed securities, and commercial mortgage-backed securities. You cannot invest directly in an index. |
| 5 | The Bloomberg Barclays Global Aggregateex-USD Index is an unmanaged index that provides a broad-based measure of the global investment-grade fixed-income markets excluding the U.S. dollar-denominated debt market. You cannot invest directly in an index. |
| 6 | The Bloomberg Barclays Municipal Bond Index is an unmanaged index composed of long-termtax-exempt bonds with a minimum credit rating of Baa. You cannot invest directly in an index. |
| 7 | The ICE BofA U.S. High Yield Index is a market-capitalization-weighted index of domestic and Yankee high-yield bonds. The index tracks the performance of high-yield securities traded in the U.S. bond market. You cannot invest directly in an index. Copyright 2020. ICE Data Indices, LLC. All rights reserved. |
2 | Wells Fargo Large Cap Growth Fund
Table of Contents
Letter to shareholders (unaudited)
confidence declined while manufacturing activity contracted. Concerned with a potential economic slowdown, the Fed lowered interest rates another quarter point in late October, its third rate cut in four months. This helped push the S&P 500 Index to a newall-time high, while emerging market equities rallied and global bonds declined overall, reflecting a broad pickup in risk appetite.
Equity markets continued to rally in November despite ongoing geopolitical risks. Hopes for a U.S.-China trade deal buoyed investor confidence. U.S. business sentiment improved slightly, and manufacturing and services activity picked up. Throughout the month, central bank actions were on hold. With that positive backdrop, developed market equities outpaced those in emerging markets, and U.S. stocks, as reflected by the S&P 500 Index, outperformednon-U.S. stocks overall. While consumer confidence and purchasing manager activity rose in the eurozone, China reported weakening manufacturing and consumer data. Bond yields rose marginally, leading to slightly negative returns for global government and investment-grade corporate bonds.
Financial markets ended 2019 on a broadly positive note, with the U.S. and China reaching an accord on a Phase One trade deal, with some details to be worked out. That, along with the landslide win by thepro-Brexit U.K. Conservative Party in a national election and ongoing central bank support, gave investors greater certainty and confidence. U.S. economic indicators were generally positive, with the exception of manufacturing activity and business confidence. However, consumer confidence was resilient, fed by a robust labor market, tame inflation, and lower interest rates, which boosted housing affordability and stimulated homebuyer activity. The impeachment of U.S. President Donald Trump, while historically noteworthy, had little impact on markets. Meanwhile, slowing Chinese economic activity, partly attributable to the trade war, led to further government stimulus atyear-end through lower reserve ratios, allowing banks to lend more money.
Theyear-end rally continued in early January 2020. However, capital market volatility picked up in late January on concerns over the unknown impact of the coronavirus on the global economy and stock markets. With sentiment somewhat souring, perceived safe havens did well in January. The U.S. dollar and Japanese yen both rose and government bonds outperformed equities. While the S&P 500 Index held its ground, emerging market equities tumbled, including those in Asia that are most exposed to viruses—physical or economic—originating in China.
Following the end of the reporting period, the coronavirus continued its global spread, resulting in disruptions to global markets, including through border closings, restrictions on travel and large gatherings, expedited and enhanced health screenings, quarantines, cancellations, business and school closings, disruptions to employment and supply chains, reduced productivity, and reduced customer and client activity in multiple markets and sectors. The risk of further spreading of the coronavirus has led to significant uncertainty and volatility in the financial markets. The full extent of the coronavirus’s impact on the global economy cannot necessarily be foreseen and the impacts may be short term or may last for an extended period of time.
Don’t let short-term uncertainty derail long-term investment goals.
Periods of investment uncertainty can present challenges, but experience has taught us that maintaining long-term investment goals can be an effective way to plan for the future. To help you create a sound strategy based on your personal goals and risk tolerance, Wells Fargo Funds offers more than 100 mutual funds spanning a wide range of asset classes and investment styles. Although diversification cannot guarantee an investment profit or prevent losses, we believe it can be an effective way to manage investment risk and potentially smooth out overall portfolio performance. We encourage investors to know their investments and to understand that appropriate levels of risk-taking may unlock opportunities.
“Financial markets ended 2019 on a broadly positive note, with the U.S. and China reaching an accord on a Phase One trade deal.”
|
For further information about your Fund, contact your investment professional, visit our website at wfam.com, or call us directly at1-800-222-8222. |
Wells Fargo Large Cap Growth Fund | 3
Table of Contents
Letter to shareholders (unaudited)
Thank you for choosing to invest with Wells Fargo Funds. We appreciate your confidence in us and remain committed to helping you meet your financial needs.
Sincerely,

Andrew Owen
President
Wells Fargo Funds
4 | Wells Fargo Large Cap Growth Fund
Table of Contents
Performance highlights (unaudited)
Investment objective
The Fund seeks long-term capital appreciation.
Manager
Wells Fargo Funds Management, LLC
Subadviser
Wells Capital Management Incorporated
Portfolio managers
Joseph M. Eberhardy, CFA®‡, CPA
Bob Gruendyke, CFA®‡
Thomas C. Ognar, CFA®‡
Average annual total returns (%) as of January 31, 2020
| Including sales charge | Excluding sales charge | Expense ratios1 (%) | ||||||||||||||||||||||||||||||||
| Inception date | 1 year | 5 year | 10 year | 1 year | 5 year | 10 year | Gross | Net2 | ||||||||||||||||||||||||||
| Class A (STAFX)3 | 7-30-2010 | 17.68 | 12.31 | 13.93 | 24.86 | 13.64 | 14.61 | 1.18 | 1.07 | |||||||||||||||||||||||||
| Class C (STOFX)4 | 7-30-2010 | 22.90 | 12.79 | 13.76 | 23.90 | 12.79 | 13.76 | 1.93 | 1.82 | |||||||||||||||||||||||||
| Class R (STMFX)5 | 6-15-2012 | – | – | – | 24.55 | 13.35 | 14.34 | 1.43 | 1.32 | |||||||||||||||||||||||||
| Class R4 (SLGRX)6 | 11-30-2012 | – | – | – | 25.21 | 13.97 | 14.96 | 0.90 | 0.80 | |||||||||||||||||||||||||
| Class R6 (STFFX)7 | 11-30-2012 | – | – | – | 25.37 | 14.13 | 15.07 | 0.75 | 0.65 | |||||||||||||||||||||||||
| Administrator Class (STDFX)8 | 7-30-2010 | – | – | – | 25.01 | 13.78 | 14.75 | 1.10 | 0.95 | |||||||||||||||||||||||||
| Institutional Class (STNFX)9 | 7-30-2010 | – | – | – | 25.26 | 14.03 | 15.01 | 0.85 | 0.75 | |||||||||||||||||||||||||
| Russell 1000® Growth Index10 | – | – | – | – | 27.94 | 15.49 | 15.99 | – | – | |||||||||||||||||||||||||
Figures quoted represent past performance, which is no guarantee of future results, and do not reflect taxes that shareholder may pay on an investment in a fund. Investment return and principal value of an investment will fluctuate so that an investor’s shares, when redeemed, may be worth more or less than their original cost. Performance shown without sales charges would be lower if sales charges were reflected. Current performance may be lower or higher than the performance data quoted, which assumes the reinvestment of dividends and capital gains. Currentmonth-end performance is available on the Fund’s website,wfam.com.
Please keep in mind that high double-digit returns were primarily achieved during favorable market conditions. You should not expect that such favorable returns can be consistently achieved. A fund’s performance, especially for short time periods, should not be the sole factor in making your investment decision.
Index returns do not include transaction costs associated with buying and selling securities, any mutual fund fees or expenses, or any taxes. It is not possible to invest directly in an index.
For Class A shares, the maximumfront-end sales charge is 5.75%. For Class C shares, the maximum contingent deferred sales charge is 1.00%. Performance including a contingent deferred sales charge assumes the sales charge for the corresponding time period. Class R, Class R4, Class R6, Administrator Class, and Institutional Class shares are sold without afront-end sales charge or contingent deferred sales charge.
Stock values fluctuate in response to the activities of individual companies and general market and economic conditions. Certain investment strategies tend to increase the total risk of an investment (relative to the broader market). The Fund is exposed to foreign investment risk. Consult the Fund’s prospectus for additional information on these and other risks.
Please see footnotes on page 6.
Wells Fargo Large Cap Growth Fund | 5
Table of Contents
Performance highlights (unaudited)
| Ten largest holdings (%) as of January 31, 202011 | ||||
Microsoft Corporation | 9.17 | |||
Amazon.com Incorporated | 7.29 | |||
MasterCard Incorporated Class A | 4.19 | |||
Alphabet Incorporated Class C | 3.72 | |||
Visa Incorporated Class A | 3.71 | |||
Alphabet Incorporated Class A | 3.69 | |||
Facebook Incorporated Class A | 3.56 | |||
Microchip Technology Incorporated | 3.30 | |||
Apple Incorporated | 3.23 | |||
CSX Corporation | 2.61 | |||
| Sector distribution as of January 31, 202012 |
|
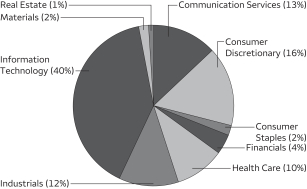
| ‡ | CFA® and Chartered Financial Analyst®are trademarks owned by CFA Institute. |
| 1 | Reflects the expense ratios as stated in the most recent prospectuses. The expense ratios shown are subject to change and may differ from the annualized expense ratios shown in the financial highlights of this report. |
| 2 | The manager has contractually committed through November 30, 2020, to waive fees and/or reimburse expenses to the extent necessary to cap total annual fund operating expenses after fee waivers at 1.07% for Class A, 1.82% for Class C, 1.32% for Class R, 0.80% Class R4, 0.65% for Class R6, 0.95% for Administrator Class, and 0.75% for Institutional Class. Brokerage commissions, stamp duty fees, interest, taxes, acquired fund fees and expenses (if any), and extraordinary expenses are excluded from the expense cap. Prior to or after the commitment expiration date, the cap may be increased or the commitment to maintain the cap may be terminated only with the approval of the Board of Trustees. Without this cap, the Fund’s returns would have been lower. The expense ratio paid by an investor is the net expense ratio (the total annual fund operating expenses after fee waivers) as stated in the prospectuses. |
| 3 | Historical performance shown for Class A shares prior to their inception reflects the performance of the former Investor Class shares, and includes the higher expenses applicable to the former Investor Class shares. If these expenses had not been included, returns for Class A shares would be higher. |
| 4 | Historical performance shown for the Class C shares prior to their inception reflects the performance of the former Investor Class shares, adjusted to reflect the higher expenses applicable to the Class C shares. |
| 5 | Historical performance shown for the Class R shares prior to their inception reflects the performance of the former Investor Class shares, adjusted to reflect the higher expenses applicable to the Class R shares. |
| 6 | Historical performance shown for the Class R4 shares prior to their inception reflects the performance of the Institutional Class shares, adjusted to reflect the higher expenses applicable to the Class R4 shares. |
| 7 | Historical performance shown for the Class R6 shares prior to their inception reflects the performance of the Institutional Class shares, and includes the higher expenses applicable to the Institutional Class shares. If these expenses had not been included, returns for the Class R6 shares would be higher. |
| 8 | Historical performance shown for the Administrator Class shares prior to their inception reflects the performance of the former Investor Class shares, and includes the higher expenses applicable to the former Investor Class shares. If these expenses had not been included, returns for the Administrator Class shares would be higher. |
| 9 | Historical performance shown for the Institutional Class shares prior to their inception reflects the performance of the former Investor Class shares, and includes the higher expenses applicable to the former Investor Class shares. If these expenses had not been included, returns for the Institutional Class shares would be higher. |
| 10 | The Russell 1000® Growth Index measures the performance of those Russell 1000 companies with higher price/book ratios and higher forecasted growth values. You cannot invest directly in an index. |
| 11 | The ten largest holdings, excluding cash, cash equivalents and any money market funds, are calculated based on the value of the investments divided by total net assets of the Fund. Holdings are subject to change and may have changed since the date specified. |
| 12 | Amounts are calculated based on the total long-term investments of the Fund. These amounts are subject to change and may have changed since the date specified. |
6 | Wells Fargo Large Cap Growth Fund
Table of Contents
As a shareholder of the Fund, you incur two types of costs: (1) transaction costs, including sales charges (loads) on purchase payments and contingent deferred sales charges (if any) on redemptions and (2) ongoing costs, including management fees, distribution(12b-1) and/or shareholder servicing fees, and other Fund expenses. This example is intended to help you understand your ongoing costs (in dollars) of investing in the Fund and to compare these costs with the ongoing costs of investing in other mutual funds.
The example is based on an investment of $1,000 invested at the beginning of thesix-month period and held for the entire period from August 1, 2019 to January 31, 2020.
Actual expenses
The “Actual” line of the table below provides information about actual account values and actual expenses. You may use the information in this line, together with the amount you invested, to estimate the expenses that you paid over the period. Simply divide your account value by $1,000 (for example, an $8,600 account value divided by $1,000 = 8.6), then multiply the result by the number in the “Actual” line under the heading entitled “Expenses paid during period” for your applicable class of shares to estimate the expenses you paid on your account during this period.
Hypothetical example for comparison purposes
The “Hypothetical” line of the table below provides information about hypothetical account values and hypothetical expenses based on the Fund’s actual expense ratio and an assumed rate of return of 5% per year before expenses, which is not the Fund’s actual return. The hypothetical account values and expenses may not be used to estimate the actual ending account balance or expenses you paid for the period. You may use this information to compare the ongoing costs of investing in the Fund and other funds. To do so, compare this 5% hypothetical example with the 5% hypothetical examples that appear in the shareholder reports of the other funds.
Please note that the expenses shown in the table are meant to highlight your ongoing costs only and do not reflect any transactional costs, such as sales charges (loads) and contingent deferred sales charges. Therefore, the “Hypothetical” line of the table is useful in comparing ongoing costs only and will not help you determine the relative total costs of owning different funds. In addition, if these transactional costs were included, your costs would have been higher.
| Beginning account value 8-1-2019 | Ending account value 1-31-2020 | Expenses paid during the period1 | Annualized net expense ratio | |||||||||||||
Class A | ||||||||||||||||
Actual | $ | 1,000.00 | $ | 1,090.25 | $ | 5.41 | 1.03 | % | ||||||||
Hypothetical (5% return before expenses) | $ | 1,000.00 | $ | 1,019.96 | $ | 5.23 | 1.03 | % | ||||||||
Class C | ||||||||||||||||
Actual | $ | 1,000.00 | $ | 1,085.92 | $ | 9.54 | 1.82 | % | ||||||||
Hypothetical (5% return before expenses) | $ | 1,000.00 | $ | 1,015.99 | $ | 9.22 | 1.82 | % | ||||||||
Class R | ||||||||||||||||
Actual | $ | 1,000.00 | $ | 1,088.64 | $ | 6.93 | 1.32 | % | ||||||||
Hypothetical (5% return before expenses) | $ | 1,000.00 | $ | 1,018.50 | $ | 6.70 | 1.32 | % | ||||||||
Class R4 | ||||||||||||||||
Actual | $ | 1,000.00 | $ | 1,091.68 | $ | 4.21 | 0.80 | % | ||||||||
Hypothetical (5% return before expenses) | $ | 1,000.00 | $ | 1,021.11 | $ | 4.06 | 0.80 | % | ||||||||
Class R6 | ||||||||||||||||
Actual | $ | 1,000.00 | $ | 1,092.55 | $ | 3.42 | 0.65 | % | ||||||||
Hypothetical (5% return before expenses) | $ | 1,000.00 | $ | 1,021.87 | $ | 3.30 | 0.65 | % | ||||||||
Administrator Class | ||||||||||||||||
Actual | $ | 1,000.00 | $ | 1,090.74 | $ | 4.99 | 0.95 | % | ||||||||
Hypothetical (5% return before expenses) | $ | 1,000.00 | $ | 1,020.36 | $ | 4.82 | 0.95 | % | ||||||||
Institutional Class | ||||||||||||||||
Actual | $ | 1,000.00 | $ | 1,091.96 | $ | 3.94 | 0.75 | % | ||||||||
Hypothetical (5% return before expenses) | $ | 1,000.00 | $ | 1,021.37 | $ | 3.81 | 0.75 | % | ||||||||
| 1 | Expenses paid is equal to the annualized net expense ratio of each class multiplied by the average account value over the period, multiplied by the number of days in the most recent fiscal half-year divided by the number of days in the fiscal year (to reflect theone-half-year period). |
Wells Fargo Large Cap Growth Fund | 7
Table of Contents
Portfolio of investments—January 31, 2020 (unaudited)
| Shares | Value | |||||||||||||||
| Common Stocks: 99.74% | ||||||||||||||||
Communication Services: 13.21% | ||||||||||||||||
| Entertainment: 0.86% | ||||||||||||||||
Netflix Incorporated † | 5,900 | $ | 2,036,031 | |||||||||||||
The Walt Disney Company | 48,480 | 6,705,269 | ||||||||||||||
| 8,741,300 | ||||||||||||||||
|
| |||||||||||||||
| Interactive Media & Services: 12.35% | ||||||||||||||||
Alphabet Incorporated Class A † | 26,320 | 37,710,770 | ||||||||||||||
Alphabet Incorporated Class C † | 26,510 | 38,021,437 | ||||||||||||||
Facebook Incorporated Class A † | 180,260 | 36,396,297 | ||||||||||||||
Match Group Incorporated †« | 39,290 | 3,073,264 | ||||||||||||||
Pinterest Incorporated Class A † | 503,346 | 11,088,712 | ||||||||||||||
| 126,290,480 | ||||||||||||||||
|
| |||||||||||||||
Consumer Discretionary: 16.17% | ||||||||||||||||
| Hotels, Restaurants & Leisure: 1.01% | ||||||||||||||||
Norwegian Cruise Line Holdings Limited † | 124,700 | 6,715,095 | ||||||||||||||
Royal Caribbean Cruises Limited | 30,600 | 3,582,648 | ||||||||||||||
| 10,297,743 | ||||||||||||||||
|
| |||||||||||||||
| Internet & Direct Marketing Retail: 7.29% | ||||||||||||||||
Amazon.com Incorporated † | 37,100 | 74,523,512 | ||||||||||||||
|
| |||||||||||||||
| Specialty Retail: 5.83% | ||||||||||||||||
Burlington Stores Incorporated † | 96,830 | 21,057,620 | ||||||||||||||
CarMax Incorporated † | 111,810 | 10,850,042 | ||||||||||||||
O’Reilly Automotive Incorporated † | 8,250 | 3,350,325 | ||||||||||||||
The Home Depot Incorporated | 67,530 | 15,403,593 | ||||||||||||||
ULTA Beauty Incorporated † | 33,440 | 8,958,910 | ||||||||||||||
| 59,620,490 | ||||||||||||||||
|
| |||||||||||||||
| Textiles, Apparel & Luxury Goods: 2.04% | ||||||||||||||||
Levi Strauss & Company Class A « | 709,050 | 13,925,742 | ||||||||||||||
Nike Incorporated Class B | 71,770 | 6,911,451 | ||||||||||||||
| 20,837,193 | ||||||||||||||||
|
| |||||||||||||||
Consumer Staples: 2.34% | ||||||||||||||||
| Beverages: 1.42% | ||||||||||||||||
The Coca-Cola Company | 248,670 | 14,522,328 | ||||||||||||||
|
| |||||||||||||||
| Personal Products: 0.92% | ||||||||||||||||
The Estee Lauder Companies Incorporated Class A | 48,120 | 9,391,099 | ||||||||||||||
|
| |||||||||||||||
Financials: 3.42% | ||||||||||||||||
| Capital Markets: 3.42% | ||||||||||||||||
CME Group Incorporated | 50,000 | 10,855,500 | ||||||||||||||
MarketAxess Holdings Incorporated | 17,220 | 6,098,980 | ||||||||||||||
The Charles Schwab Corporation | 395,180 | 18,000,449 | ||||||||||||||
| 34,954,929 | ||||||||||||||||
|
| |||||||||||||||
The accompanying notes are an integral part of these financial statements.
8 | Wells Fargo Large Cap Growth Fund
Table of Contents
Portfolio of investments—January 31, 2020 (unaudited)
| Shares | Value | |||||||||||||||
Health Care: 9.94% | ||||||||||||||||
| Biotechnology: 1.10% | ||||||||||||||||
Alexion Pharmaceuticals Incorporated † | 39,500 | $ | 3,925,905 | |||||||||||||
Vertex Pharmaceuticals Incorporated † | 32,320 | 7,338,256 | ||||||||||||||
| 11,264,161 | ||||||||||||||||
|
| |||||||||||||||
| Health Care Equipment & Supplies: 5.97% | ||||||||||||||||
Abbott Laboratories | 158,150 | 13,781,191 | ||||||||||||||
Baxter International Incorporated | 96,420 | 8,602,592 | ||||||||||||||
Boston Scientific Corporation † | 422,770 | 17,701,380 | ||||||||||||||
Edwards Lifesciences Corporation † | 30,940 | 6,802,468 | ||||||||||||||
Intuitive Surgical Incorporated † | 1,200 | 671,736 | ||||||||||||||
Medtronic plc | 27,700 | 3,197,688 | ||||||||||||||
Stryker Corporation | 48,560 | 10,231,592 | ||||||||||||||
| 60,988,647 | ||||||||||||||||
|
| |||||||||||||||
| Health Care Technology: 0.18% | ||||||||||||||||
Veeva Systems Incorporated Class A † | 12,700 | 1,861,947 | ||||||||||||||
|
| |||||||||||||||
| Life Sciences Tools & Services: 0.55% | ||||||||||||||||
Agilent Technologies Incorporated | 67,920 | 5,607,475 | ||||||||||||||
|
| |||||||||||||||
| Pharmaceuticals: 2.14% | ||||||||||||||||
Zoetis Incorporated | 163,130 | 21,893,677 | ||||||||||||||
|
| |||||||||||||||
Industrials: 11.92% | ||||||||||||||||
| Aerospace & Defense: 0.95% | ||||||||||||||||
The Boeing Company | 30,590 | 9,735,879 | ||||||||||||||
|
| |||||||||||||||
| Commercial Services & Supplies: 1.92% | ||||||||||||||||
Waste Connections Incorporated | 204,120 | 19,658,797 | ||||||||||||||
|
| |||||||||||||||
| Industrial Conglomerates: 1.46% | ||||||||||||||||
Roper Technologies Incorporated | 39,180 | 14,953,439 | ||||||||||||||
|
| |||||||||||||||
| Machinery: 0.75% | ||||||||||||||||
Fortive Corporation | 101,500 | 7,605,395 | ||||||||||||||
|
| |||||||||||||||
| Professional Services: 0.25% | ||||||||||||||||
TransUnion | 28,120 | 2,578,604 | ||||||||||||||
|
| |||||||||||||||
| Road & Rail: 6.59% | ||||||||||||||||
CSX Corporation | 349,220 | 26,659,455 | ||||||||||||||
Norfolk Southern Corporation | 102,850 | 21,414,399 | ||||||||||||||
Union Pacific Corporation | 107,310 | 19,253,560 | ||||||||||||||
| 67,327,414 | ||||||||||||||||
|
| |||||||||||||||
Information Technology: 40.06% | ||||||||||||||||
| IT Services: 13.55% | ||||||||||||||||
Fidelity National Information Services Incorporated | 178,473 | 25,639,431 | ||||||||||||||
Global Payments Incorporated | 28,900 | 5,648,505 | ||||||||||||||
MasterCard Incorporated Class A | 135,490 | 42,806,711 | ||||||||||||||
PayPal Holdings Incorporated † | 179,160 | 20,404,532 | ||||||||||||||
Square Incorporated Class A † | 80,730 | 6,029,724 | ||||||||||||||
Visa Incorporated Class A | 190,740 | 37,951,538 | ||||||||||||||
| 138,480,441 | ||||||||||||||||
|
| |||||||||||||||
The accompanying notes are an integral part of these financial statements.
Wells Fargo Large Cap Growth Fund | 9
Table of Contents
Portfolio of investments—January 31, 2020 (unaudited)
| Shares | Value | |||||||||||||||
Semiconductors & Semiconductor Equipment: 6.98% | ||||||||||||||||
Microchip Technology Incorporated | 345,790 | $ | 33,707,609 | |||||||||||||
NVIDIA Corporation | 34,810 | 8,230,128 | ||||||||||||||
NXP Semiconductors NV | 61,100 | 7,751,146 | ||||||||||||||
Texas Instruments Incorporated | 179,780 | 21,690,457 | ||||||||||||||
| 71,379,340 | ||||||||||||||||
|
| |||||||||||||||
| Software: 16.30% | ||||||||||||||||
Adobe Incorporated † | 40,300 | 14,150,942 | ||||||||||||||
Microsoft Corporation | 550,490 | 93,709,913 | ||||||||||||||
Salesforce.com Incorporated † | 77,320 | 14,096,209 | ||||||||||||||
ServiceNow Incorporated † | 44,980 | 15,213,585 | ||||||||||||||
Splunk Incorporated † | 108,190 | 16,797,579 | ||||||||||||||
VMware Incorporated Class A † | 85,830 | 12,707,990 | ||||||||||||||
| 166,676,218 | ||||||||||||||||
|
| |||||||||||||||
| Technology Hardware, Storage & Peripherals: 3.23% | ||||||||||||||||
Apple Incorporated | 106,670 | 33,015,432 | ||||||||||||||
|
| |||||||||||||||
Materials: 2.03% | ||||||||||||||||
| Chemicals: 2.03% | ||||||||||||||||
Air Products & Chemicals Incorporated | 45,970 | 10,973,499 | ||||||||||||||
Linde plc | 48,410 | 9,833,523 | ||||||||||||||
| 20,807,022 | ||||||||||||||||
|
| |||||||||||||||
Real Estate: 0.65% | ||||||||||||||||
| Real Estate Management & Development: 0.65% | ||||||||||||||||
CBRE Group Incorporated Class A † | 109,620 | 6,692,302 | ||||||||||||||
|
| |||||||||||||||
Total Common Stocks (Cost $458,401,351) | 1,019,705,264 | |||||||||||||||
|
| |||||||||||||||
| Yield | ||||||||||||||||
| Short-Term Investments: 0.67% | ||||||||||||||||
| Investment Companies: 0.67% | ||||||||||||||||
Securities Lending Cash Investments LLC (l)(r)(u) | 1.70 | % | 3,353,840 | 3,354,176 | ||||||||||||
Wells Fargo Government Money Market Fund Select Class (l)(u) | 1.51 | 3,467,316 | 3,467,316 | |||||||||||||
Total Short-Term Investments (Cost $6,821,492) | 6,821,492 | |||||||||||||||
|
| |||||||||||||||
| Total investments in securities (Cost $465,222,843) | 100.41 | % | 1,026,526,756 | |||||
Other assets and liabilities, net | (0.41 | ) | (4,225,045 | ) | ||||
|
|
|
| |||||
| Total net assets | 100.00 | % | $ | 1,022,301,711 | ||||
|
|
|
| |||||
| † | Non-income-earning security |
| « | All or a portion of this security is on loan. |
| (l) | The issuer of the security is an affiliated person of the Fund as defined in the Investment Company Act of 1940. |
| (r) | The investment is anon-registered investment company purchased with cash collateral received from securities on loan. |
| (u) | The rate represents the7-day annualized yield at period end. |
The accompanying notes are an integral part of these financial statements.
10 | Wells Fargo Large Cap Growth Fund
Table of Contents
Portfolio of investments—January 31, 2020 (unaudited)
Investments in Affiliates
An affiliated investment is an investment in which the Fund owns at least 5% of the outstanding voting shares of the issuer or as a result of other relationships, such as the Fund and the issuer having the same investment manager. Transactions with issuers that were either affiliated persons of the Fund at the beginning of the period or the end of the period were as follows:
Shares, period | Shares purchased | Shares sold | Shares, end of period | Net realized gains (losses) | Net change in unrealized gains (losses) | Income from affiliated securities | Value, end of period | % of net assets | ||||||||||||||||||||||||||||
| Short-Term Investments | ||||||||||||||||||||||||||||||||||||
Investment Companies | ||||||||||||||||||||||||||||||||||||
Securities Lending Cash Investments LLC | 39,213,509 | 140,102,855 | (175,962,524 | ) | 3,353,840 | $ | 601 | $ | 124 | $ | 183,749 | # | $ | 3,354,176 | ||||||||||||||||||||||
Wells Fargo Government Money Market Fund Select Class | 5,937,879 | 88,051,751 | (90,522,314 | ) | 3,467,316 | 0 | 0 | 47,103 | 3,467,316 | |||||||||||||||||||||||||||
|
|
|
|
|
|
|
|
|
| |||||||||||||||||||||||||||
| $ | 601 | $ | 124 | $ | 230,852 | $ | 6,821,492 | 0.67 | % | |||||||||||||||||||||||||||
|
|
|
|
|
|
|
|
|
| |||||||||||||||||||||||||||
| # | Amount shown represents income before fees and rebates. |
The accompanying notes are an integral part of these financial statements.
Wells Fargo Large Cap Growth Fund | 11
Table of Contents
Statement of assets and liabilities—January 31, 2020 (unaudited)
Assets | ||||
Investments in unaffiliated securities (including $3,285,355 of securities loaned), at value (cost $458,401,351) | $ | 1,019,705,264 | ||
Investments in affiliated securities, at value (cost $6,821,492) | 6,821,492 | |||
Receivable for Fund shares sold | 355,363 | |||
Receivable for dividends | 362,667 | |||
Receivable for securities lending income, net | 8,404 | |||
Prepaid expenses and other assets | 34,606 | |||
|
| |||
Total assets | 1,027,287,796 | |||
|
| |||
Liabilities | ||||
Payable upon receipt of securities loaned | 3,352,823 | |||
Payable for investments purchased | 81,865 | |||
Payable for Fund shares redeemed | 655,066 | |||
Management fee payable | 538,527 | |||
Administration fees payable | 132,976 | |||
Distribution fees payable | 8,478 | |||
Trustees’ fees and expenses payable | 5,499 | |||
Accrued expenses and other liabilities | 210,851 | |||
|
| |||
Total liabilities | 4,986,085 | |||
|
| |||
Total net assets | $ | 1,022,301,711 | ||
|
| |||
Net assets consist of | ||||
Paid-in capital | $ | 425,761,548 | ||
Total distributable earnings | 596,540,163 | |||
|
| |||
Total net assets | $ | 1,022,301,711 | ||
|
| |||
Computation of net asset value and offering price per share | ||||
Net assets – Class A | $ | 544,848,083 | ||
Shares outstanding – Class A1 | 12,438,094 | |||
Net asset value per share – Class A | $43.80 | |||
Maximum offering price per share – Class A2 | $46.47 | |||
Net assets – Class C | $ | 10,768,947 | ||
Shares outstanding – Class C1 | 280,570 | |||
Net asset value per share – Class C | $38.38 | |||
Net assets – Class R | $ | 4,466,390 | ||
Shares outstanding – Class R1 | 105,712 | |||
Net asset value per share – Class R | $42.25 | |||
Net assets – Class R4 | $ | 1,088,858 | ||
Share outstanding – Class R41 | 23,970 | |||
Net asset value per share – Class R4 | $45.43 | |||
Net assets – Class R6 | $ | 317,823,564 | ||
Shares outstanding – Class R61 | 6,945,086 | |||
Net asset value per share – Class R6 | $45.76 | |||
Net assets – Administrator Class | $ | 72,836,939 | ||
Shares outstanding – Administrator Class1 | 1,636,015 | |||
Net asset value per share – Administrator Class | $44.52 | |||
Net assets – Institutional Class | $ | 70,468,930 | ||
Shares outstanding – Institutional Class1 | 1,547,521 | |||
Net asset value per share – Institutional Class | $45.54 | |||
| 1 | The Fund has an unlimited number of authorized shares. |
| 2 | Maximum offering price is computed as 100/94.25 of net asset value. On investments of $50,000 or more, the offering price is reduced. |
The accompanying notes are an integral part of these financial statements.
12 | Wells Fargo Large Cap Growth Fund
Table of Contents
Statement of operations—six months ended January 31, 2020 (unaudited)
Investment income | ||||
Dividends (net of foreign withholding taxes of $13,406) | $ | 4,239,172 | ||
Income from affiliated securities | 130,604 | |||
|
| |||
Total investment income | 4,369,776 | |||
|
| |||
Expenses | ||||
Management fee | 3,491,562 | |||
Administration fees | ||||
Class A | 558,561 | |||
Class C | 11,631 | |||
Class R | 4,724 | |||
Class R4 | 381 | |||
Class R6 | 48,393 | |||
Administrator Class | 45,116 | |||
Institutional Class | 49,078 | |||
Shareholder servicing fees | ||||
Class A | 664,954 | |||
Class C | 13,846 | |||
Class R | 5,623 | |||
Class R4 | 476 | |||
Administrator Class | 86,761 | |||
Distribution fees | ||||
Class C | 41,499 | |||
Class R | 5,451 | |||
Custody and accounting fees | 22,184 | |||
Professional fees | 21,790 | |||
Registration fees | 59,135 | |||
Shareholder report expenses | 39,867 | |||
Trustees’ fees and expenses | 10,864 | |||
Other fees and expenses | 14,651 | |||
|
| |||
Total expenses | 5,196,547 | |||
Less: Fee waivers and/or expense reimbursements | ||||
Fund-level | (555,257 | ) | ||
Class A | (106,124 | ) | ||
Administrator Class | (13 | ) | ||
|
| |||
Net expenses | 4,535,153 | |||
|
| |||
Net investment loss | (165,377 | ) | ||
|
| |||
Realized and unrealized gains (losses) on investments | ||||
Net realized gains on | ||||
Unaffiliated securities | 50,013,352 | |||
Affiliated securities | 601 | |||
|
| |||
Net realized gains on investments | 50,013,953 | |||
|
| |||
Net change in unrealized gains (losses) on | ||||
Unaffiliated securities | 37,754,819 | |||
Affiliated securities | 124 | |||
|
| |||
Net change in unrealized gains (losses) on investments | 37,754,943 | |||
|
| |||
Net realized and unrealized gains (losses) on investments | 87,768,896 | |||
|
| |||
Net increase in net assets resulting from operations | $ | 87,603,519 | ||
|
| |||
The accompanying notes are an integral part of these financial statements.
Wells Fargo Large Cap Growth Fund | 13
Table of Contents
Statement of changes in net assets
| Six months ended January 31, 2020 (unaudited) | Year ended July 31, 2019 | |||||||||||||||
Operations | ||||||||||||||||
Net investment income (loss) | $ | (165,377 | ) | $ | 885,116 | |||||||||||
Net realized gains on investments | 50,013,953 | 127,678,132 | ||||||||||||||
Net change in unrealized gains (losses) on investments | 37,754,943 | (27,477,455 | ) | |||||||||||||
|
| |||||||||||||||
Net increase in net assets resulting from operations | 87,603,519 | 101,085,793 | ||||||||||||||
|
| |||||||||||||||
Distributions to shareholders from net investment income and net realized gains | ||||||||||||||||
Class A | (48,085,264 | ) | (111,706,240 | ) | ||||||||||||
Class C | (1,095,349 | ) | (3,431,246 | ) | ||||||||||||
Class R | (417,971 | ) | (1,280,121 | ) | ||||||||||||
Class R4 | (85,773 | ) | (455,047 | ) | ||||||||||||
Class R6 | (29,201,378 | ) | (66,047,400 | ) | ||||||||||||
Administrator Class | (6,247,883 | ) | (14,492,251 | ) | ||||||||||||
Institutional Class | (6,697,849 | ) | (18,149,003 | ) | ||||||||||||
|
| |||||||||||||||
Total distributions to shareholders | (91,831,467 | ) | (215,561,308 | ) | ||||||||||||
|
| |||||||||||||||
Capital share transactions | Shares | Shares | ||||||||||||||
Proceeds from shares sold | ||||||||||||||||
Class A | 141,655 | 6,123,178 | 399,711 | 17,356,631 | ||||||||||||
Class C | 12,591 | 473,678 | 71,966 | 2,571,501 | ||||||||||||
Class R | 18,772 | 774,997 | 49,362 | 1,986,257 | ||||||||||||
Class R4 | 3,334 | 151,363 | 9,684 | 457,992 | ||||||||||||
Class R6 | 571,713 | 25,957,232 | 780,490 | 34,878,326 | ||||||||||||
Administrator Class | 91,033 | 4,023,794 | 156,702 | 7,081,152 | ||||||||||||
Institutional Class | 85,747 | 3,864,506 | 275,036 | 12,403,795 | ||||||||||||
|
| |||||||||||||||
| 41,368,748 | 76,735,654 | |||||||||||||||
|
| |||||||||||||||
Reinvestment of distributions | ||||||||||||||||
Class A | 1,127,992 | 46,360,475 | 2,918,252 | 107,245,772 | ||||||||||||
Class C | 25,717 | 927,347 | 92,097 | 3,029,996 | ||||||||||||
Class R | 4,263 | 169,064 | 9,145 | 326,200 | ||||||||||||
Class R4 | 1,974 | 84,285 | 11,892 | 451,084 | ||||||||||||
Class R6 | 647,777 | 27,895,355 | 1,625,721 | 62,084,213 | ||||||||||||
Administrator Class | 149,395 | 6,242,050 | 388,367 | 14,470,567 | ||||||||||||
Institutional Class | 140,193 | 6,001,246 | 407,144 | 15,475,547 | ||||||||||||
|
| |||||||||||||||
| 87,679,822 | 203,083,379 | |||||||||||||||
|
| |||||||||||||||
Payment for shares redeemed | ||||||||||||||||
Class A | (795,070 | ) | (34,522,194 | ) | (1,635,497 | ) | (70,467,127 | ) | ||||||||
Class C | (49,676 | ) | (1,906,076 | ) | (197,048 | ) | (7,247,118 | ) | ||||||||
Class R | (22,289 | ) | (937,825 | ) | (64,781 | ) | (2,603,006 | ) | ||||||||
Class R4 | (927 | ) | (41,707 | ) | (41,238 | ) | (1,706,882 | ) | ||||||||
Class R6 | (1,373,279 | ) | (61,755,422 | ) | (1,438,307 | ) | (65,749,149 | ) | ||||||||
Administrator Class | (100,966 | ) | (4,466,876 | ) | (555,121 | ) | (25,132,488 | ) | ||||||||
Institutional Class | (428,031 | ) | (19,239,540 | ) | (729,747 | ) | (33,022,472 | ) | ||||||||
|
| |||||||||||||||
| (122,869,640 | ) | (205,928,242 | ) | |||||||||||||
|
| |||||||||||||||
Net increase in net assets resulting from capital share transactions | 6,178,930 | 73,890,791 | ||||||||||||||
|
| |||||||||||||||
Total increase (decrease) in net assets | 1,950,982 | (40,584,724 | ) | |||||||||||||
|
| |||||||||||||||
Net assets | ||||||||||||||||
Beginning of period | 1,020,350,729 | 1,060,935,453 | ||||||||||||||
|
| |||||||||||||||
End of period | $ | 1,022,301,711 | $ | 1,020,350,729 | ||||||||||||
|
| |||||||||||||||
The accompanying notes are an integral part of these financial statements.
14 | Wells Fargo Large Cap Growth Fund
Table of Contents
(For a share outstanding throughout each period)
| Six months ended January 31, 2020 (unaudited) | Year ended July 31 | |||||||||||||||||||||||
| CLASS A | 2019 | 2018 | 2017 | 2016 | 2015 | |||||||||||||||||||
Net asset value, beginning of period | $44.23 | $52.01 | $50.10 | $46.05 | $49.55 | $45.30 | ||||||||||||||||||
Net investment loss | (0.04 | )1 | (0.03 | )1 | (0.08 | ) | (0.03 | )1 | (0.03 | )1 | (0.01 | )1 | ||||||||||||
Net realized and unrealized gains (losses) on investments | 3.76 | 3.47 | 12.56 | 6.39 | (0.92 | ) | 6.33 | |||||||||||||||||
|
|
|
|
|
|
|
|
|
|
|
| |||||||||||||
Total from investment operations | 3.72 | 3.44 | 12.48 | 6.36 | (0.95 | ) | 6.32 | |||||||||||||||||
Distributions to shareholders from | ||||||||||||||||||||||||
Net investment income | 0.00 | 0.00 | 0.00 | 0.00 | (0.00 | )2 | 0.00 | |||||||||||||||||
Net realized gains | (4.15 | ) | (11.22 | ) | (10.57 | ) | (2.31 | ) | (2.55 | ) | (2.07 | ) | ||||||||||||
|
|
|
|
|
|
|
|
|
|
|
| |||||||||||||
Total distributions to shareholders | (4.15 | ) | (11.22 | ) | (10.57 | ) | (2.31 | ) | (2.55 | ) | (2.07 | ) | ||||||||||||
Net asset value, end of period | $43.80 | $44.23 | $52.01 | $50.10 | $46.05 | $49.55 | ||||||||||||||||||
Total return3 | 9.02 | % | 11.00 | % | 27.98 | % | 14.60 | % | (1.83 | )% | 14.35 | % | ||||||||||||
Ratios to average net assets (annualized) | ||||||||||||||||||||||||
Gross expenses | 1.18 | % | 1.18 | % | 1.17 | % | 1.17 | % | 1.16 | % | 1.20 | % | ||||||||||||
Net expenses | 1.03 | % | 1.07 | % | 1.07 | % | 1.07 | % | 1.07 | % | 1.07 | % | ||||||||||||
Net investment loss | (0.17 | )% | (0.07 | )% | (0.16 | )% | (0.06 | )% | (0.06 | )% | (0.02 | )% | ||||||||||||
Supplemental data | ||||||||||||||||||||||||
Portfolio turnover rate | 12 | % | 43 | % | 34 | % | 40 | % | 31 | % | 26 | % | ||||||||||||
Net assets, end of period (000s omitted) | $544,848 | $529,110 | $534,694 | $516,410 | $576,502 | $184,504 | ||||||||||||||||||
| 1 | Calculated based upon average shares outstanding |
| 2 | Amount is less than $0.005. |
| 3 | Total return calculations do not include any sales charges. Returns for periods of less than one year are not annualized. |
The accompanying notes are an integral part of these financial statements.
Wells Fargo Large Cap Growth Fund | 15
Table of Contents
Financial highlights
(For a share outstanding throughout each period)
| Six months ended January 31, 2020 (unaudited) | Year ended July 31 | |||||||||||||||||||||||
| CLASS C | 2019 | 2018 | 2017 | 2016 | 2015 | |||||||||||||||||||
Net asset value, beginning of period | $39.41 | $47.97 | $47.25 | $43.88 | $47.68 | $43.99 | ||||||||||||||||||
Net investment loss | (0.19 | )1 | (0.32 | )1 | (0.31 | ) | (0.35 | )1 | (0.32 | )1 | (0.42 | ) | ||||||||||||
Net realized and unrealized gains (losses) on investments | 3.31 | 2.98 | 11.60 | 6.03 | (0.93 | ) | 6.18 | |||||||||||||||||
|
|
|
|
|
|
|
|
|
|
|
| |||||||||||||
Total from investment operations | 3.12 | 2.66 | 11.29 | 5.68 | (1.25 | ) | 5.76 | |||||||||||||||||
Distributions to shareholders from | ||||||||||||||||||||||||
Net realized gains | (4.15 | ) | (11.22 | ) | (10.57 | ) | (2.31 | ) | (2.55 | ) | (2.07 | ) | ||||||||||||
Net asset value, end of period | $38.38 | $39.41 | $47.97 | $47.25 | $43.88 | $47.68 | ||||||||||||||||||
Total return2 | 8.59 | % | 10.17 | % | 27.03 | % | 13.74 | % | (2.56 | )% | 13.47 | % | ||||||||||||
Ratios to average net assets (annualized) | ||||||||||||||||||||||||
Gross expenses | 1.93 | % | 1.93 | % | 1.92 | % | 1.91 | % | 1.91 | % | 1.95 | % | ||||||||||||
Net expenses | 1.82 | % | 1.82 | % | 1.82 | % | 1.82 | % | 1.82 | % | 1.82 | % | ||||||||||||
Net investment loss | (0.96 | )% | (0.80 | )% | (0.90 | )% | (0.81 | )% | (0.75 | )% | (0.77 | )% | ||||||||||||
Supplemental data | ||||||||||||||||||||||||
Portfolio turnover rate | 12 | % | 43 | % | 34 | % | 40 | % | 31 | % | 26 | % | ||||||||||||
Net assets, end of period (000s omitted) | $10,769 | $11,504 | $15,586 | $14,640 | $18,877 | $22,839 | ||||||||||||||||||
| 1 | Calculated based upon average shares outstanding |
| 2 | Total return calculations do not include any sales charges. Returns for periods of less than one year are not annualized. |
The accompanying notes are an integral part of these financial statements.
16 | Wells Fargo Large Cap Growth Fund
Table of Contents
Financial highlights
(For a share outstanding throughout each period)
| Six months ended January 31, 2020 (unaudited) | Year ended July 31 | |||||||||||||||||||||||
| CLASS R | 2019 | 2018 | 2017 | 2016 | 2015 | |||||||||||||||||||
Net asset value, beginning of period | $42.86 | $50.89 | $49.34 | $45.50 | $49.11 | $45.03 | ||||||||||||||||||
Net investment loss | (0.10 | )1 | (0.13 | )1 | (0.20 | )1 | (0.14 | )1 | (0.10 | )1 | (0.16 | )1 | ||||||||||||
Net realized and unrealized gains (losses) on investments | 3.64 | 3.32 | 12.32 | 6.29 | (0.96 | ) | 6.31 | |||||||||||||||||
|
|
|
|
|
|
|
|
|
|
|
| |||||||||||||
Total from investment operations | 3.54 | 3.19 | 12.12 | 6.15 | (1.06 | ) | 6.15 | |||||||||||||||||
Distributions to shareholders from | ||||||||||||||||||||||||
Net realized gains | (4.15 | ) | (11.22 | ) | (10.57 | ) | (2.31 | ) | (2.55 | ) | (2.07 | ) | ||||||||||||
Net asset value, end of period | $42.25 | $42.86 | $50.89 | $49.34 | $45.50 | $49.11 | ||||||||||||||||||
Total return2 | 8.86 | % | 10.74 | % | 27.65 | % | 14.30 | % | (2.08 | )% | 14.05 | % | ||||||||||||
Ratios to average net assets (annualized) | ||||||||||||||||||||||||
Gross expenses | 1.42 | % | 1.42 | % | 1.42 | % | 1.41 | % | 1.41 | % | 1.45 | % | ||||||||||||
Net expenses | 1.32 | % | 1.32 | % | 1.32 | % | 1.32 | % | 1.32 | % | 1.32 | % | ||||||||||||
Net investment loss | (0.46 | )% | (0.29 | )% | (0.40 | )% | (0.31 | )% | (0.23 | )% | (0.28 | )% | ||||||||||||
Supplemental data | ||||||||||||||||||||||||
Portfolio turnover rate | 12 | % | 43 | % | 34 | % | 40 | % | 31 | % | 26 | % | ||||||||||||
Net assets, end of period (000s omitted) | $4,466 | $4,499 | $5,661 | $6,387 | $8,218 | $12,086 | ||||||||||||||||||
| 1 | Calculated based upon average shares outstanding |
| 2 | Returns for periods of less than one year are not annualized. |
The accompanying notes are an integral part of these financial statements.
Wells Fargo Large Cap Growth Fund | 17
Table of Contents
Financial highlights
(For a share outstanding throughout each period)
| Six months ended January 31, 2020 (unaudited) | Year ended July 31 | |||||||||||||||||||||||
| CLASS R4 | 2019 | 2018 | 2017 | 2016 | 2015 | |||||||||||||||||||
Net asset value, beginning of period | $45.72 | $53.23 | $50.94 | $46.69 | $50.23 | $45.76 | ||||||||||||||||||
Net investment income | 0.01 | 1 | 0.11 | 1 | 0.05 | 1 | 0.11 | 1 | 0.13 | 0.07 | ||||||||||||||
Net realized and unrealized gains (losses) on investments | 3.92 | 3.60 | 12.81 | 6.50 | (0.95 | ) | 6.47 | |||||||||||||||||
|
|
|
|
|
|
|
|
|
|
|
| |||||||||||||
Total from investment operations | 3.93 | 3.71 | 12.86 | 6.61 | (0.82 | ) | 6.54 | |||||||||||||||||
Distributions to shareholders from | ||||||||||||||||||||||||
Net investment income | (0.07 | ) | 0.00 | 0.00 | (0.05 | ) | (0.17 | ) | 0.00 | |||||||||||||||
Net realized gains | (4.15 | ) | (11.22 | ) | (10.57 | ) | (2.31 | ) | (2.55 | ) | (2.07 | ) | ||||||||||||
|
|
|
|
|
|
|
|
|
|
|
| |||||||||||||
Total distributions to shareholders | (4.22 | ) | (11.22 | ) | (10.57 | ) | (2.36 | ) | (2.72 | ) | (2.07 | ) | ||||||||||||
Net asset value, end of period | $45.43 | $45.72 | $53.23 | $50.94 | $46.69 | $50.23 | ||||||||||||||||||
Total return2 | 9.17 | % | 11.32 | % | 28.31 | % | 14.96 | % | (1.54 | )% | 14.69 | % | ||||||||||||
Ratios to average net assets (annualized) | ||||||||||||||||||||||||
Gross expenses | 0.90 | % | 0.90 | % | 0.90 | % | 0.88 | % | 0.88 | % | 0.87 | % | ||||||||||||
Net expenses | 0.80 | % | 0.80 | % | 0.80 | % | 0.80 | % | 0.78 | % | 0.75 | % | ||||||||||||
Net investment income | 0.05 | % | 0.24 | % | 0.10 | % | 0.25 | % | 0.27 | % | 0.17 | % | ||||||||||||
Supplemental data | ||||||||||||||||||||||||
Portfolio turnover rate | 12 | % | 43 | % | 34 | % | 40 | % | 31 | % | 26 | % | ||||||||||||
Net assets, end of period (000s omitted) | $1,089 | $896 | $2,089 | $337 | $8,400 | $7,205 | ||||||||||||||||||
| 1 | Calculated based upon average shares outstanding |
| 2 | Returns for periods of less than one year are not annualized. |
The accompanying notes are an integral part of these financial statements.
18 | Wells Fargo Large Cap Growth Fund
Table of Contents
Financial highlights
(For a share outstanding throughout each period)
| Six months ended January 31, 2020 (unaudited) | Year ended July 31 | |||||||||||||||||||||||
| CLASS R6 | 2019 | 2018 | 2017 | 2016 | 2015 | |||||||||||||||||||
Net asset value, beginning of period | $46.06 | $53.49 | $51.12 | $46.82 | $50.34 | $45.82 | ||||||||||||||||||
Net investment income | 0.06 | 0.16 | 1 | 0.14 | 0.17 | 0.22 | 0.07 | 1 | ||||||||||||||||
Net realized and unrealized gains (losses) on investments | 3.92 | 3.65 | 12.85 | 6.52 | (0.97 | ) | 6.56 | |||||||||||||||||
|
|
|
|
|
|
|
|
|
|
|
| |||||||||||||
Total from investment operations | 3.98 | 3.81 | 12.99 | 6.69 | (0.75 | ) | 6.63 | |||||||||||||||||
Distributions to shareholders from | ||||||||||||||||||||||||
Net investment income | (0.13 | ) | (0.02 | ) | (0.05 | ) | (0.08 | ) | (0.22 | ) | (0.04 | ) | ||||||||||||
Net realized gains | (4.15 | ) | (11.22 | ) | (10.57 | ) | (2.31 | ) | (2.55 | ) | (2.07 | ) | ||||||||||||
|
|
|
|
|
|
|
|
|
|
|
| |||||||||||||
Total distributions to shareholders | (4.28 | ) | (11.24 | ) | (10.62 | ) | (2.39 | ) | (2.77 | ) | (2.11 | ) | ||||||||||||
Net asset value, end of period | $45.76 | $46.06 | $53.49 | $51.12 | $46.82 | $50.34 | ||||||||||||||||||
Total return2 | 9.25 | % | 11.46 | % | 28.51 | % | 15.09 | % | (1.39 | )% | 14.88 | % | ||||||||||||
Ratios to average net assets (annualized) | ||||||||||||||||||||||||
Gross expenses | 0.75 | % | 0.75 | % | 0.75 | % | 0.74 | % | 0.73 | % | 0.72 | % | ||||||||||||
Net expenses | 0.65 | % | 0.65 | % | 0.65 | % | 0.65 | % | 0.64 | % | 0.60 | % | ||||||||||||
Net investment income | 0.21 | % | 0.35 | % | 0.27 | % | 0.36 | % | 0.39 | % | 0.13 | % | ||||||||||||
Supplemental data | ||||||||||||||||||||||||
Portfolio turnover rate | 12 | % | 43 | % | 34 | % | 40 | % | 31 | % | 26 | % | ||||||||||||
Net assets, end of period (000s omitted) | $317,824 | $326,990 | $327,943 | $307,048 | $225,805 | $117,741 | ||||||||||||||||||
| 1 | Calculated based upon average shares outstanding |
| 2 | Returns for periods of less than one year are not annualized. |
The accompanying notes are an integral part of these financial statements.
Wells Fargo Large Cap Growth Fund | 19
Table of Contents
Financial highlights
(For a share outstanding throughout each period)
| Six months ended January 31, 2020 (unaudited) | Year ended July 31 | |||||||||||||||||||||||
| ADMINISTRATOR CLASS | 2019 | 2018 | 2017 | 2016 | 2015 | |||||||||||||||||||
Net asset value, beginning of period | $44.87 | $52.54 | $50.46 | $46.32 | $49.84 | $45.50 | ||||||||||||||||||
Net investment income (loss) | (0.02 | ) | 0.02 | (0.01 | ) | 0.05 | 0.05 | 0.05 | ||||||||||||||||
Net realized and unrealized gains (losses) on investments | 3.83 | 3.53 | 12.66 | 6.41 | (0.94 | ) | 6.36 | |||||||||||||||||
|
|
|
|
|
|
|
|
|
|
|
| |||||||||||||
Total from investment operations | 3.81 | 3.55 | 12.65 | 6.46 | (0.89 | ) | 6.41 | |||||||||||||||||
Distributions to shareholders from | ||||||||||||||||||||||||
Net investment income | (0.01 | ) | 0.00 | 0.00 | (0.01 | ) | (0.08 | ) | 0.00 | |||||||||||||||
Net realized gains | (4.15 | ) | (11.22 | ) | (10.57 | ) | (2.31 | ) | (2.55 | ) | (2.07 | ) | ||||||||||||
|
|
|
|
|
|
|
|
|
|
|
| |||||||||||||
Total distributions to shareholders | (4.16 | ) | (11.22 | ) | (10.57 | ) | (2.32 | ) | (2.63 | ) | (2.07 | ) | ||||||||||||
Net asset value, end of period | $44.52 | $44.87 | $52.54 | $50.46 | $46.32 | $49.84 | ||||||||||||||||||
Total return1 | 9.07 | % | 11.14 | % | 28.14 | % | 14.75 | % | (1.71 | )% | 14.48 | % | ||||||||||||
Ratios to average net assets (annualized) | ||||||||||||||||||||||||
Gross expenses | 1.10 | % | 1.10 | % | 1.09 | % | 1.08 | % | 1.08 | % | 1.05 | % | ||||||||||||
Net expenses | 0.95 | % | 0.95 | % | 0.95 | % | 0.95 | % | 0.95 | % | 0.95 | % | ||||||||||||
Net investment income (loss) | (0.09 | )% | 0.05 | % | (0.03 | )% | 0.06 | % | 0.12 | % | 0.10 | % | ||||||||||||
Supplemental data | ||||||||||||||||||||||||
Portfolio turnover rate | 12 | % | 43 | % | 34 | % | 40 | % | 31 | % | 26 | % | ||||||||||||
Net assets, end of period (000s omitted) | $72,837 | $67,158 | $79,154 | $80,937 | $237,577 | $262,535 | ||||||||||||||||||
| 1 | Returns for periods of less than one year are not annualized. |
The accompanying notes are an integral part of these financial statements.
20 | Wells Fargo Large Cap Growth Fund
Table of Contents
Financial highlights
(For a share outstanding throughout each period)
| Six months ended January 31, 2020 (unaudited) | Year ended July 31 | |||||||||||||||||||||||
| INSTITUTIONAL CLASS | 2019 | 2018 | 2017 | 2016 | 2015 | |||||||||||||||||||
Net asset value, beginning of period | $45.84 | $53.31 | $51.00 | $46.74 | $50.30 | $45.80 | ||||||||||||||||||
Net investment income | 0.03 | 1 | 0.12 | 1 | 0.10 | 1 | 0.12 | 1 | 0.17 | 1 | 0.19 | 1 | ||||||||||||
Net realized and unrealized gains (losses) on investments | 3.91 | 3.63 | 12.80 | 6.51 | (0.96 | ) | 6.41 | |||||||||||||||||
|
|
|
|
|
|
|
|
|
|
|
| |||||||||||||
Total from investment operations | 3.94 | 3.75 | 12.90 | 6.63 | (0.79 | ) | 6.60 | |||||||||||||||||
Distributions to shareholders from | ||||||||||||||||||||||||
Net investment income | (0.09 | ) | 0.00 | (0.02 | ) | (0.06 | ) | (0.22 | ) | (0.03 | ) | |||||||||||||
Net realized gains | (4.15 | ) | (11.22 | ) | (10.57 | ) | (2.31 | ) | (2.55 | ) | (2.07 | ) | ||||||||||||
|
|
|
|
|
|
|
|
|
|
|
| |||||||||||||
Total distributions to shareholders | (4.24 | ) | (11.22 | ) | (10.59 | ) | (2.37 | ) | (2.77 | ) | (2.10 | ) | ||||||||||||
Net asset value, end of period | $45.54 | $45.84 | $53.31 | $51.00 | $46.74 | $50.30 | ||||||||||||||||||
Total return2 | 9.20 | % | 11.37 | % | 28.37 | % | 14.98 | % | (1.49 | )% | 14.82 | % | ||||||||||||
Ratios to average net assets (annualized) | ||||||||||||||||||||||||
Gross expenses | 0.85 | % | 0.85 | % | 0.84 | % | 0.83 | % | 0.83 | % | 0.78 | % | ||||||||||||
Net expenses | 0.75 | % | 0.75 | % | 0.75 | % | 0.75 | % | 0.71 | % | 0.65 | % | ||||||||||||
Net investment income | 0.11 | % | 0.26 | % | 0.18 | % | 0.27 | % | 0.37 | % | 0.40 | % | ||||||||||||
Supplemental data | ||||||||||||||||||||||||
Portfolio turnover rate | 12 | % | 43 | % | 34 | % | 40 | % | 31 | % | 26 | % | ||||||||||||
Net assets, end of period (000s omitted) | $70,469 | $80,194 | $95,809 | $169,836 | $316,310 | $534,975 | ||||||||||||||||||
| 1 | Calculated based upon average shares outstanding |
| 2 | Returns for periods of less than one year are not annualized. |
The accompanying notes are an integral part of these financial statements.
Wells Fargo Large Cap Growth Fund | 21
Table of Contents
Notes to financial statements (unaudited)
1. ORGANIZATION
Wells Fargo Funds Trust (the “Trust”), a Delaware statutory trust organized on March 10, 1999, is anopen-end management investment company registered under the Investment Company Act of 1940, as amended (the “1940 Act”). As an investment company, the Trust follows the accounting and reporting guidance in Financial Accounting Standards Board (“FASB”)Accounting Standards Codification Topic 946, Financial Services – Investment Companies. These financial statements report on the Wells Fargo Large Cap Growth Fund (the “Fund”) which is a diversified series of the Trust.
2. SIGNIFICANT ACCOUNTING POLICIES
The following significant accounting policies, which are consistently followed in the preparation of the financial statements of the Fund, are in conformity with U.S. generally accepted accounting principles which require management to make estimates and assumptions that affect the reported amounts of assets and liabilities, disclosure of contingent assets and liabilities at the date of the financial statements, and the reported amounts of revenues and expenses during the reporting period. Actual results could differ from those estimates.
Securities valuation
All investments are valued each business day as of the close of regular trading on the New York Stock Exchange (generally 4 p.m. Eastern Time), although the Fund may deviate from this calculation time under unusual or unexpected circumstances.
Equity securities that are listed on a foreign or domestic exchange or market are valued at the official closing price or, if none, the last sales price. If no sale occurs on the principal exchange or market that day, a fair value price will be determined in accordance with the Fund’s Valuation Procedures.
Investments in registeredopen-end investment companies are valued at net asset value. Interests innon-registered investment companies that are redeemable at net asset value are fair valued normally at net asset value.
Investments which are not valued using any of the methods discussed above are valued at their fair value, as determined in good faith by the Board of Trustees of the Fund. The Board of Trustees has established a Valuation Committee comprised of the Trustees and has delegated to it the authority to take any actions regarding the valuation of portfolio securities that the Valuation Committee deems necessary or appropriate, including determining the fair value of portfolio securities, unless the determination has been delegated to the Wells Fargo Asset Management Pricing Committee at Wells Fargo Funds Management, LLC (“Funds Management”). The Board of Trustees retains the authority to make or ratify any valuation decisions or approve any changes to the Valuation Procedures as it deems appropriate. On a quarterly basis, the Board of Trustees receives reports on any valuation actions taken by the Valuation Committee or the Wells Fargo Asset Management Pricing Committee which may include items for ratification.
Foreign currency translation
The accounting records of the Fund are maintained in U.S. dollars. The values of other assets and liabilities denominated in foreign currencies are translated into U.S. dollars at rates provided by an independent foreign currency pricing source at a time each business day specified by the Wells Fargo Asset Management Pricing Committee. Purchases and sales of securities, and income and expenses are converted at the rate of exchange on the respective dates of such transactions. Net realized foreign exchange gains or losses arise from sales of foreign currencies, currency gains or losses realized between the trade and settlement dates on securities transactions, and the difference between the amounts of dividends, interest and foreign withholding taxes recorded and the U.S. dollar equivalent of the amounts actually paid or received. Net unrealized foreign exchange gains and losses arise from changes in the fair value of assets and liabilities other than investments in securities resulting from changes in exchange rates. The changes in net assets arising from changes in exchange rates of securities and the changes in net assets resulting from changes in market prices of securities are not separately presented. Such changes are included in net realized and unrealized gains or losses from investments.
Securities lending
The Fund may lend its securities from time to time in order to earn additional income in the form of fees or interest on securities received as collateral or the investment of any cash received as collateral. When securities are on loan, the Fund receives interest or dividends on those securities. Cash collateral received in connection with its securities lending transactions is invested in Securities Lending Cash Investments, LLC (the “Securities Lending Fund”). Investments in Securities Lending Fund are valued at the evaluated bid price provided by an independent pricing service. Income earned from investment in the Securities Lending Fund (net of fees and rebates), if any, is included in income from affiliated securities on the Statement of Operations.
22 | Wells Fargo Large Cap Growth Fund
Table of Contents
Notes to financial statements (unaudited)
In a securities lending transaction, the net asset value of the Fund is affected by an increase or decrease in the value of the securities loaned and by an increase or decrease in the value of the instrument in which collateral is invested. The amount of securities lending activity undertaken by the Fund fluctuates from time to time. The Fund has the right under the lending agreement to recover the securities from the borrower on demand. In the event of default or bankruptcy by the borrower, the Fund may be prevented from recovering the loaned securities or gaining access to the collateral or may experience delays or costs in doing so. In such an event, the terms of the agreement allows the unaffiliated securities lending agent to use the collateral to purchase replacement securities on behalf of the Fund or pay the Fund the market value of the loaned securities. The Fund bears the risk of loss with respect to depreciation of its investment of the cash collateral.
Security transactions and income recognition
Securities transactions are recorded on a trade date basis. Realized gains or losses are recorded on the basis of identified cost.
Dividend income is recognized on theex-dividend date. Dividend income is recorded net of foreign taxes withheld where recovery of such taxes is not assured.
Distributions to shareholders
Distributions to shareholders from net investment income and any net realized gains are recorded on theex-dividend date and paid at least annually. Such distributions are determined in accordance with income tax regulations and may differ from U.S. generally accepted accounting principles. Dividend sources are estimated at the time of declaration. The tax character of distributions is determined as of the Fund’s fiscal year end. Therefore, a portion of the Fund’s distributions made prior to the Fund’s fiscal year end may be categorized as a tax return of capital at year end.
Federal and other taxes
The Fund intends to continue to qualify as a regulated investment company by distributing substantially all of its investment company taxable income and any net realized capital gains (after reduction for capital loss carryforwards) sufficient to relieve it from all, or substantially all, federal income taxes. Accordingly, no provision for federal income taxes was required.
The Fund’s income and federal excise tax returns and all financial records supporting those returns for the prior three fiscal years are subject to examination by the federal and Delaware revenue authorities. Management has analyzed the Fund’s tax positions taken on federal, state, and foreign tax returns for all open tax years and does not believe that there are any uncertain tax positions that require recognition of a tax liability.
As of January 31, 2020, the aggregate cost of all investments for federal income tax purposes was $465,084,265 and the unrealized gains (losses) consisted of:
Gross unrealized gains | $ | 561,916,565 | ||
Gross unrealized losses | (474,074 | ) | ||
Net unrealized gains | $ | 561,442,491 | ||
Class allocations
The separate classes of shares offered by the Fund differ principally in applicable sales charges, distribution, shareholder servicing, and administration fees. Class specific expenses are charged directly to that share class. Investment income, common fund-level expenses, and realized and unrealized gains (losses) on investments are allocated daily to each class of shares based on the relative proportion of net assets of each class.
3. FAIR VALUATION MEASUREMENTS
Fair value measurements of investments are determined within a framework that has established a fair value hierarchy based upon the various data inputs utilized in determining the value of the Fund’s investments. The three-level hierarchy gives the highest priority to unadjusted quoted prices in active markets for identical assets or liabilities (Level 1) and the lowest priority to unobservable inputs (Level 3). The Fund’s investments are classified within the fair value hierarchy based on the lowest level of input that is significant to the fair value measurement. The inputs are summarized into three broad levels as follows:
| ∎ | Level 1 – quoted prices in active markets for identical securities |
| ∎ | Level 2 – other significant observable inputs (including quoted prices for similar securities, interest rates, prepayment speeds, credit risk, etc.) |
| ∎ | Level 3 – significant unobservable inputs (including the Fund’s own assumptions in determining the fair value of investments) |
Wells Fargo Large Cap Growth Fund | 23
Table of Contents
Notes to financial statements (unaudited)
The inputs or methodologies used for valuing investments in securities are not necessarily an indication of the risk associated with investing in those securities.
The following is a summary of the inputs used in valuing the Fund’s assets and liabilities as of January 31, 2020:
| Quoted prices (Level 1) | Other significant observable inputs (Level 2) | Significant (Level 3) | Total | |||||||||||||
Assets | ||||||||||||||||
Investments in: | ||||||||||||||||
Common stocks | ||||||||||||||||
Communication services | $ | 135,031,780 | $ | 0 | $ | 0 | $ | 135,031,780 | ||||||||
Consumer discretionary | 165,278,938 | 0 | 0 | 165,278,938 | ||||||||||||
Consumer staples | 23,913,427 | 0 | 0 | 23,913,427 | ||||||||||||
Financials | 34,954,929 | 0 | 0 | 34,954,929 | ||||||||||||
Health care | 101,615,907 | 0 | 0 | 101,615,907 | ||||||||||||
Industrials | 121,859,528 | 0 | 0 | 121,859,528 | ||||||||||||
Information technology | 409,551,431 | 0 | 0 | 409,551,431 | ||||||||||||
Materials | 20,807,022 | 0 | 0 | 20,807,022 | ||||||||||||
Real estate | 6,692,302 | 0 | 0 | 6,692,302 | ||||||||||||
Short-term investments | ||||||||||||||||
Investment companies | 6,821,492 | 0 | 0 | 6,821,492 | ||||||||||||
Total assets | $ | 1,026,526,756 | $ | 0 | $ | 0 | $ | 1,026,526,756 | ||||||||
Additional sector, industry or geographic detail is included in the Portfolio of Investments.
For the six months ended January 31, 2020, the Fund did not have any transfers into/out of Level 3.
4. TRANSACTIONS WITH AFFILIATES
Management fee
Funds Management, an indirect wholly owned subsidiary of Wells Fargo & Company (“Wells Fargo”), is the manager of the Fund and provides advisory and fund-level administrative services under an investment management agreement. Under the investment management agreement, Funds Management is responsible for, among other services, implementing the investment objectives and strategies of the Fund, supervising the subadviser and providing fund-level administrative services in connection with the Fund’s operations. As compensation for its services under the investment management agreement, Funds Management is entitled to receive a management fee at the following annual rate based on the Fund’s average daily net assets:
| Average daily net assets | Management fee | |
First $500 million | 0.700% | |
Next $500 million | 0.675 | |
Next $1 billion | 0.650 | |
Next $2 billion | 0.625 | |
Next $1 billion | 0.600 | |
Next $3 billion | 0.590 | |
Next $2 billion | 0.565 | |
Next $2 billion | 0.555 | |
Next $4 billion | 0.530 | |
Over $16 billion | 0.505 | |
For the six months ended January 31, 2020, the management fee was equivalent to an annual rate of 0.69% of the Fund’s average daily net assets.
24 | Wells Fargo Large Cap Growth Fund
Table of Contents
Notes to financial statements (unaudited)
Funds Management has retained the services of a subadviser to provide daily portfolio management to the Fund. The fee for subadvisory services is borne by Funds Management. Wells Capital Management Incorporated (“WellsCap”), an affiliate of Funds Management and an indirect wholly owned subsidiary of Wells Fargo, is the subadviser to the Fund and is entitled to receive a fee from Funds Management at an annual rate starting at 0.30% and declining to 0.20% as the average daily net assets of the Fund increase.
Administration fees
Under a class-level administration agreement, Funds Management provides class-level administrative services to the Fund, which includes paying fees and expenses for services provided by the transfer agent,sub-transfer agents, omnibus account servicers and record-keepers. As compensation for its services under the class-level administration agreement, Funds Management receives an annual fee which is calculated based on the average daily net assets of each class as follows:
| Class-level administration fee | ||||
Class A, Class C, Class R | 0.21 | % | ||
Class R4 | 0.08 | |||
Class R6 | 0.03 | |||
Administrator Class, Institutional Class | 0.13 | |||
Waivers and/or expense reimbursements
Funds Management has contractually waived and/or reimbursed management and administration fees to the extent necessary to maintain certain net operating expense ratios for the Fund. When each class of the Fund has exceeded its expense cap, Funds Management has waived fees and/or reimbursed expenses from fund-level expenses on a proportionate basis and then from class specific expenses. When only certain classes exceed their expense caps, waivers and/or reimbursements are applied against class specific expenses before fund-level expenses. Funds Management has committed through November 30, 2020 to waive fees and/or reimburse expenses to the extent necessary to cap the Fund’s expenses at 1.07% for Class A shares, 1.82% for Class C shares, 1.32% for Class R shares, 0.80% for Class R4 shares, 0.65% for Class R6 shares, 0.95% for Administrator Class shares, and 0.75% for Institutional Class shares. Prior to or after the commitment expiration date, the cap may be increased or the commitment to maintain the cap may be terminated only with the approval of the Board of Trustees.
Distribution fees
The Trust has adopted a distribution plan for Class C and Class R shares of the Fund pursuant to Rule12b-1 under the 1940 Act. Distribution fees are charged to Class C and Class R shares and paid to Wells Fargo Funds Distributor, LLC (“Funds Distributor”), the principal underwriter, at an annual rate of 0.75% of the average daily net assets of Class C shares and 0.25% of the average daily net assets of Class R shares.
In addition, Funds Distributor is entitled to receive thefront-end sales charge from the purchase of Class A shares and a contingent deferred sales charge on the redemption of certain Class A shares. Funds Distributor is also entitled to receive the contingent deferred sales charges from redemptions of Class C shares. For the six months ended January 31, 2020, Funds Distributor received $530 from the sale of Class A shares. No contingent deferred sales charges were incurred by Class A and Class C shares for the six months ended January 31, 2020.
Shareholder servicing fees
The Trust has entered into contracts with one or more shareholder servicing agents, whereby Class A, Class C, Class R, and Administrator Class of the Fund are charged a fee at an annual rate of 0.25% of the average daily net assets of each respective class. Class R4 is charged a fee at an annual rate of 0.10% of its average daily net assets. A portion of these total shareholder servicing fees were paid to affiliates of Wells Fargo.
Interfund transactions
The Fund may purchase or sell portfolio investment securities to certain other Wells Fargo affiliates pursuant to Rule17a-7 under the 1940 Act and under procedures adopted by the Board of Trustees. The procedures have been designed to ensure that these interfund transactions, which do not incur broker commissions, are effected at current market prices.
5. INVESTMENT PORTFOLIO TRANSACTIONS
Purchases and sales of investments, excluding U.S. government obligations (if any) and short-term securities, for the six months ended January 31, 2020 were $121,811,042 and $201,526,269, respectively.
Wells Fargo Large Cap Growth Fund | 25
Table of Contents
Notes to financial statements (unaudited)
6. SECURITIES LENDING TRANSACTIONS
The Fund lends its securities through an unaffiliated securities lending agent and receives collateral in the form of cash or securities with a value at least equal to the value of the securities on loan. The value of the loaned securities is determined at the close of each business day and any increases or decreases in the required collateral are exchanged between the Fund and the counterparty on the next business day. Cash collateral received is invested in the Securities Lending Fund which seeks to provide a positive return compared to the daily Fed Funds Open Rate by investing in high-quality, U.S. dollar-denominated short-term money market instruments and is exempt from registration under Section 3(c)(7) of the 1940 Act. Securities Lending Fund is managed by Funds Management and is subadvised by WellsCap. Funds Management receives an advisory fee starting at 0.05% and declining to 0.01% as the average daily net assets of the Securities Lending Fund increase. All of the fees received by Funds Management are paid to WellsCap for its services as subadviser.
In the event of counterparty default or the failure of a borrower to return a loaned security, the Fund has the right to use the collateral to offset any losses incurred. As of January 31, 2020, the Fund had securities lending transactions with the following counterparties which are subject to offset:
| Counterparty | Value of securities on loan | Collateral received1 | Net amount | |||||||||
Barclays Capital Inc. | $ | 405,250 | $ | (405,250 | ) | $ | 0 | |||||
Citigroup Global Markets Inc. | 2,520,655 | (2,520,655 | ) | 0 | ||||||||
Morgan Stanley & Co. LLC | 359,450 | (359,450 | ) | 0 | ||||||||
| 1 | Collateral received within this table is limited to the collateral for the net transaction with the counterparty. |
7. BANK BORROWINGS
The Trust (excluding the money market funds), Wells Fargo Master Trust and Wells Fargo Variable Trust are parties to a $280,000,000 revolving credit agreement whereby the Fund is permitted to use bank borrowings for temporary or emergency purposes, such as to fund shareholder redemption requests. Interest under the credit agreement is charged to the Fund based on a borrowing rate equal to the higher of the Federal Funds rate in effect on that day plus 1.25% or the overnight LIBOR rate in effect on that day plus 1.25%. In addition, an annual commitment fee equal to 0.25% of the unused balance is allocated to each participating fund.
For the six months ended January 31, 2020, there were no borrowings by the Fund under the agreement.
8. CONCENTRATION RISK
Concentration risks result from exposure to a limited number of sectors. As of the end of the period, the Fund invests a concentration of its portfolio in the information technology sector. A fund that invests a substantial portion of its assets in any sector may be more affected by changes in that sector than would be a fund whose investments are not heavily weighted in any sector.
9. INDEMNIFICATION
Under the Trust’s organizational documents, the officers and Trustees have been granted certain indemnification rights against certain liabilities that may arise out of performance of their duties to the Trust. Additionally, in the normal course of business, the Trust may enter into contracts with service providers that contain a variety of indemnification clauses. The Trust’s maximum exposure under these arrangements is dependent on future claims that may be made against the Fund and, therefore, cannot be estimated.
10. NEW ACCOUNTING PRONOUNCEMENT
In August 2018, FASB issued Accounting Standards Update (“ASU”)No. 2018-13, Fair Value Measurement (Topic 820)Disclosure Framework—Changes to the Disclosure Requirements for Fair Value Measurement. ASU2018-13 updates the disclosure requirements for fair value measurements by modifying or removing certain disclosures and adding certain new disclosures. The amendments are effective for fiscal years, and interim periods within those fiscal years, beginning after December 15, 2019. Early adoption is permitted. Management has adopted the removal and modification of disclosures early, as permitted, and will adopt the additional new disclosures at the effective date.
26 | Wells Fargo Large Cap Growth Fund
Table of Contents
Notes to financial statements (unaudited)
11. SUBSEQUENT EVENT
On March 11, 2020, the World Health Organization announced that it had made the assessment that coronavirus disease 2019 (“COVID-19”) is a pandemic. The impacts of COVID-19 is adversely affecting the entire global economy, individual companies and investment products, and the market in general. There is significant uncertainty around the extent and duration of business disruptions related to COVID-19 and the impact may be short term or may last for an extended period of time. The risk of further spreading of COVID-19 has led to significant uncertainty and volatility in the financial markets and the value of the Fund and the securities in which the Fund invests may be adversely affected by impacts caused by COVID-19.
Wells Fargo Large Cap Growth Fund | 27
Table of Contents
PROXY VOTING INFORMATION
A description of the policies and procedures used to determine how to vote proxies relating to portfolio securities is available, upon request, by calling1-800-222-8222, visiting our website atwfam.com, or visiting the SEC website at sec.gov. Information regarding how the proxies related to portfolio securities were voted during the most recent12-month period ended June 30 is available on the website atwfam.comor by visiting the SEC website at sec.gov.
QUARTERLY PORTFOLIO HOLDINGS INFORMATION
The Fund files its complete schedule of portfolio holdings with the SEC for the first and third quarters of each fiscal year as an exhibit to its reports on FormN-PORT. Shareholders may view the filed FormN-PORT by visiting the SEC website at sec.gov.
28 | Wells Fargo Large Cap Growth Fund
Table of Contents
Other information (unaudited)
BOARD OF TRUSTEES AND OFFICERS
Each of the Trustees and Officers1 listed in the table below acts in identical capacities for each fund in the Wells Fargo family of funds, which consists of 149 mutual funds comprising the Wells Fargo Funds Trust, Wells Fargo Variable Trust, Wells Fargo Master Trust and fourclosed-end funds (collectively the “Fund Complex”). This table should be read in conjunction with the Prospectus and the Statement of Additional Information2. The mailing address of each Trustee and Officer is 525 Market Street, 12th Floor, San Francisco, CA 94105. Each Trustee and Officer serves an indefinite term, however, each Trustee serves such term until reaching the mandatory retirement age established by the Trustees.
Independent Trustees
| Name and year of birth | Position held and length of service* | Principal occupations during past five years or longer | Current other public company or investment company directorships | |||
| William R. Ebsworth (Born 1957) | Trustee, since 2015 | Retired. From 1984 to 2013, equities analyst, portfolio manager, research director and chief investment officer at Fidelity Management and Research Company in Boston, Tokyo, and Hong Kong, and retired in 2013 as Chief Investment Officer of Fidelity Strategic Advisers, Inc. where he led a team of investment professionals managing client assets. Prior thereto, Board member of Hong Kong Securities Clearing Co., Hong Kong Options Clearing Corp., the Thailand International Fund, Ltd., Fidelity Investments Life Insurance Company, and Empire Fidelity Investments Life Insurance Company. Audit Committee Chair and Investment Committee Chair of the Vincent Memorial Hospital Endowment(non-profit organization). Mr. Ebsworth is a CFA® charterholder. | N/A | |||
| Jane A. Freeman (Born 1953) | Trustee, since 2015; Chair Liaison, since 2018 | Retired. From 2012 to 2014 and 1999 to 2008, Chief Financial Officer of Scientific Learning Corporation. From 2008 to 2012, Ms. Freeman provided consulting services related to strategic business projects. Prior to 1999, Portfolio Manager at Rockefeller & Co. and Scudder, Stevens & Clark. Board member of the Harding Loevner Funds from 1996 to 2014, serving as both Lead Independent Director and chair of the Audit Committee. Board member of the Russell Exchange Traded Funds Trust from 2011 to 2012 and the chair of the Audit Committee. Ms. Freeman is a Board Member of The Ruth Bancroft Garden(non-profit organization). She is also an inactive Chartered Financial Analyst. | N/A | |||
| Isaiah Harris, Jr. (Born 1952) | Trustee, since 2009; Audit Committee Chairman, since 2019 | Retired. Chairman of the Board of CIGNA Corporation since 2009, and Director since 2005. From 2003 to 2011, Director of Deluxe Corporation. Prior thereto, President and CEO of BellSouth Advertising and Publishing Corp. from 2005 to 2007, President and CEO of BellSouth Enterprises from 2004 to 2005 and President of BellSouth Consumer Services from 2000 to 2003. Emeritus member of the Iowa State University Foundation Board of Governors. Emeritus Member of the Advisory Board of Iowa State University School of Business. Advisory Board Member, Palm Harbor Academy (private school). Advisory Board Member, Child Evangelism Fellowship(non-profit). Mr. Harris is a certified public accountant (inactive status). | CIGNA Corporation | |||
| Judith M. Johnson (Born 1949) | Trustee, since 2008; Audit Committee Chairman, from 2009 to 2018 | Retired. Prior thereto, Chief Executive Officer and Chief Investment Officer of Minneapolis Employees Retirement Fund from 1996 to 2008. Ms. Johnson is an attorney, certified public accountant and a certified managerial accountant. | N/A | |||
Wells Fargo Large Cap Growth Fund | 29
Table of Contents
Other information (unaudited)
| Name and year of birth | Position held and length of service* | Principal occupations during past five years or longer | Current other public company or investment company directorships | |||
| David F. Larcker (Born 1950) | Trustee, since 2009 | James Irvin Miller Professor of Accounting at the Graduate School of Business, Stanford University, Director of the Corporate Governance Research Initiative and Senior Faculty of The Rock Center for Corporate Governance since 2006. From 2005 to 2008, Professor of Accounting at the Graduate School of Business, Stanford University. Prior thereto, Ernst & Young Professor of Accounting at The Wharton School, University of Pennsylvania from 1985 to 2005. | N/A | |||
| Olivia S. Mitchell (Born 1953) | Trustee, since 2006; Nominating and Governance Committee Chair, since 2018 | International Foundation of Employee Benefit Plans Professor, Wharton School of the University of Pennsylvania since 1993. Director of Wharton’s Pension Research Council and Boettner Center on Pensions & Retirement Research, and Research Associate at the National Bureau of Economic Research. Previously, Cornell University Professor from 1978 to 1993. | N/A | |||
| Timothy J. Penny (Born 1951) | Trustee, since 1996; Chairman, since 2018 | President and Chief Executive Officer of Southern Minnesota Initiative Foundation, anon-profit organization, since 2007. Member of the Board of Trustees of NorthStar Education Finance, Inc., anon-profit organization, since 2007. | N/A | |||
| James G. Polisson (Born 1959) | Trustee, since 2018 | Retired. Chief Marketing Officer, Source (ETF) UK Services, Ltd, from 2015 to 2017. From 2012 to 2015, Principal of The Polisson Group, LLC, a management consulting, corporate advisory and principal investing company. Chief Executive Officer and Managing Director at Russell Investments, Global Exchange Traded Funds from 2010 to 2012. Managing Director of Barclays Global Investors from 1998 to 2010 and Global Chief Marketing Officer for iShares and Barclays Global Investors from 2000 to 2010. Trustee of the San Francisco Mechanics’ Institute, anon-profit organization, from 2013 to 2015. Board member of the Russell Exchange Traded Fund Trust from 2011 to 2012. Director of Barclays Global Investors Holdings Deutschland GmbH from 2006 to 2009. Mr. Polisson is an attorney and has a retired status with the Massachusetts and District of Columbia Bar Associations. | N/A | |||
| Pamela Wheelock3 (Born 1959) | Trustee, since January 2020; previously Trustee from January 2018 to July 2019 | Board member of the Destination Medical Center Economic Development Agency, Rochester, Minnesota since 2019. Acting Commissioner, Minnesota Department of Human Services, July 2019 through September 2019. Human Services Manager (part-time), Minnesota Department of Human Services, October 2019 through December 2019. Chief Operating Officer, Twin Cities Habitat for Humanity from 2017 to 2019. Vice President of University Services, University of Minnesota from 2012 to 2016. Prior thereto, on the Board of Directors, Governance Committee and Finance Committee for the Minnesota Philanthropy Partners (Saint Paul Foundation) from 2012 to 2018, Interim Chief Executive Officer of Blue Cross Blue Shield of Minnesota from 2011 to 2012, Chairman of the Board from 2009 to 2012 and Board Director from 2003 to 2015. Vice President, Leadership and Community Engagement, Bush Foundation, Saint Paul, Minnesota (a private foundation) from 2009 to 2011. Executive Vice President and Chief Financial Officer, Minnesota Sports and Entertainment from 2004 to 2009 and Senior Vice President from 2002 to 2004. Executive Vice President of the Minnesota Wild Foundation from 2004 to 2008. Commissioner of Finance, State of Minnesota, from 1999 to 2002. Currently Board Chair of the Minnesota Wild Foundation since 2010. | N/A | |||
| * | Length of service dates reflect the Trustee’s commencement of service with the Trust’s predecessor entities, where applicable. |
30 | Wells Fargo Large Cap Growth Fund
Table of Contents
Other information (unaudited)
Officers
| Name and year of birth | Position held and length of service | Principal occupations during past five years or longer | ||
| Andrew Owen (Born 1960) | President, since 2017 | Executive Vice President of Wells Fargo & Company and Head of Affiliated Managers, Wells Fargo Asset Management, since 2014. In addition, Mr. Owen is currently President, Chief Executive Officer and Director of Wells Fargo Funds Management, LLC since 2017. Prior thereto, Executive Vice President responsible for marketing, investments and product development for Wells Fargo Funds Management, LLC, from 2009 to 2014. | ||
| Jeremy DePalma1 (Born 1974) | Treasurer, since 2012 | Senior Vice President of Wells Fargo Funds Management, LLC since 2009. Senior Vice President of Evergreen Investment Management Company, LLC from 2008 to 2010 and head of the Fund Reporting and Control Team within Fund Administration from 2005 to 2010. | ||
| Michelle Rhee (Born 1966) | Chief Legal Officer, since 2019 | Secretary of Wells Fargo Funds Management, LLC, Chief Legal Counsel of Wells Fargo Asset Management and Assistant General Counsel of Wells Fargo Bank, N.A. since 2018. Associate General Counsel and Managing Director of Bank of America Corporation from 2004 to 2018. | ||
| Catherine Kennedy (Born 1969) | Secretary, since 2019 | Vice President of Wells Fargo Funds Management, LLC and Senior Counsel of the Wells Fargo Legal Department since 2010. Vice President and Senior Counsel of Evergreen Investment Management Company, LLC from 1998 to 2010. | ||
| Michael H. Whitaker(Born 1967) | Chief Compliance Officer, since 2016 | Chief Compliance Officer of Wells Fargo Asset Management since 2016. Senior Vice President and Chief Compliance Officer for Fidelity Investments from 2007 to 2016. | ||
| David Berardi (Born 1975) | Assistant Treasurer, since 2009 | Vice President of Wells Fargo Funds Management, LLC since 2009. Vice President of Evergreen Investment Management Company, LLC from 2008 to 2010. Manager of Fund Reporting and Control for Evergreen Investment Management Company, LLC from 2004 to 2010. | ||
| 1 | Jeremy DePalma acts as Treasurer of 85 funds and Assistant Treasurer of 64 funds in the Fund Complex. |
| 2 | The Statement of Additional Information includes additional information about the Trustees and is available, without charge, upon request, by calling1-800-222-8222 or by visiting the website atwfam.com. |
| 3 | Pamela Wheelock wasre-appointed to the Board effective January 1, 2020. |
Wells Fargo Large Cap Growth Fund | 31
Table of Contents
Effective on or about May 1, 2020, if you purchase Fund shares through a Janney Montgomery Scott LLC (“Janney”) brokerage account, you will be eligible for the following load waivers(front-end sales charge waivers and contingent deferred sales charge (“CDSC”), orback-end sales charge, waivers) and discounts, which may differ from those disclosed elsewhere in the Fund’s Prospectus or SAI.
| Front-end sales charge* waivers on Class A shares available at Janney |
| Shares purchased through reinvestment of capital gains distributions and dividend reinvestment when purchasing shares of the same fund (but not any other fund within the fund family). |
| Shares purchased by employees and registered representatives of Janney or its affiliates and their family members as designated by Janney. |
| Shares purchased from the proceeds of redemptions within the same fund family, provided (1) the repurchase occurs within ninety (90) days following the redemption, (2) the redemption and purchase occur in the same account, and (3) redeemed shares were subject to afront-end or deferred sales load (i.e., right of reinstatement). |
| Employer-sponsored retirement plans (e.g., 401(k) plans, 457 plans, employer-sponsored 403(b) plans, profit sharing and money purchase pension plans and defined benefit plans). For purposes of this provision, employer-sponsored retirement plans do not include SEP IRAs, Simple IRAs,SAR-SEPs or Keogh plans. |
| Shares acquired through a right of reinstatement. |
| Class C shares that are no longer subject to a contingent deferred sales charge and are converted to Class A shares of the same fund pursuant to Janney’s policies and procedures. |
| CDSC waivers on Class A and Class C shares available at Janney |
| Shares sold upon the death or disability of the shareholder. |
| Shares sold as part of a systematic withdrawal plan as described in the Fund’s Prospectus. |
| Shares purchased in connection with a return of excess contributions from an IRA account. |
| Shares sold as part of a required minimum distribution for IRA and retirement accounts if the redemption is taken in or after the year the shareholder reaches qualified age based on applicable IRS regulations. |
| Shares sold to pay Janney fees but only if the transaction is initiated by Janney. |
| Shares acquired through a right of reinstatement. |
| Shares exchanged into the same share class of a different fund. |
| Front-end sales charge* discounts available at Janney; breakpoints, rights of accumulation and/or letters of intent |
| Breakpoints as described in the Fund’s Prospectus. |
| Rights of accumulation (“ROA”), which entitle shareholders to breakpoint discounts, will be automatically calculated based on the aggregated holding of fund family assets held by accounts within the purchaser’s household at Janney. Eligible fund family assets not held at Janney may be included in the ROA calculation only if the shareholder notifies his or her financial advisor about such assets. |
| Letters of intent which allow for breakpoint discounts based on anticipated purchases within a fund family, over a13-month time period. Eligible fund family assets not held at Janney Montgomery Scott may be included in the calculation of letters of intent only if the shareholder notifies his or her financial advisor about such assets. |
| * | Also referred to as an “initial sales charge.” |
32 | Wells Fargo Large Cap Growth Fund
Table of Contents
This page is intentionally left blank.
Table of Contents
This page is intentionally left blank.
Table of Contents
For more information
More information about Wells Fargo Funds is available free upon request. To obtain literature, please write, visit the Fund’s website, or call:
Wells Fargo Funds
P.O. Box 219967
Kansas City, MO 64121-9967
Website:wfam.com
Individual investors:1-800-222-8222
Retail investment professionals:1-888-877-9275
Institutional investment professionals:1-866-765-0778

This report and the financial statements contained herein are submitted for the general information of the shareholders of the Fund. If this report is used for promotional purposes, distribution of the report must be accompanied or preceded by a current prospectus. Before investing, please consider the investment objectives, risks, charges, and expenses of the investment. For a current prospectus and, if available, a summary prospectus, containing this information, call1-800-222-8222 or visit the Fund’s website atwfam.com. Read the prospectus carefully before you invest or send money.
Wells Fargo Asset Management (WFAM) is the trade name for certain investment advisory/management firms owned by Wells Fargo & Company. These firms include but are not limited to Wells Capital Management Incorporated and Wells Fargo Funds Management, LLC. Certain products managed by WFAM entities are distributed by Wells Fargo Funds Distributor, LLC (a broker-dealer and Member FINRA).
This material is for general informational and educational purposes only and is NOT intended to provide investment advice or a recommendation of any kind—including a recommendation for any specific investment, strategy, or plan.
INVESTMENT PRODUCTS: NOT FDIC INSURED ◾ NO BANK GUARANTEE ◾ MAY LOSE VALUE
© 2020 Wells Fargo & Company. All rights reserved
PAR-0020-03834 03-20
SA209/SAR209 01-20
Table of Contents

Semi-Annual Report
January 31, 2020
Wells Fargo
Large Company Value Fund
Beginning on January 1, 2021, as permitted by new regulations adopted by the Securities and Exchange Commission, paper copies of the Wells Fargo Funds’ annual and semi-annual shareholder reports issued after this date will no longer be sent by mail, unless you specifically request paper copies of the reports. Instead, the reports will be made available on the Funds’ website, and you will be notified by mail each time a report is posted and provided with a website address to access the report.
If you already elected to receive shareholder reports electronically, you will not be affected by this change and you need not take any action. You may elect to receive shareholder reports and other communications from the Fund electronically at any time by contacting your financial intermediary (such as a broker-dealer or bank) or, if you are a direct investor, by calling1-800-222-8222 or by enrolling at wellsfargo.com/advantagedelivery.
You may elect to receive all future reports in paper free of charge. If you invest through a financial intermediary, you can contact your financial intermediary to request that you continue to receive paper copies of your shareholder reports; if you invest directly with the Fund, you can call 1-800-222-8222. Your election to receive reports in paper will apply to all Wells Fargo Funds held in your account with your financial intermediary or, if you are a direct investor, to all Wells Fargo Funds that you hold.
Table of Contents
|
Reduce clutter. Save trees. |
Sign up for electronic delivery of prospectuses and shareholder reports atwellsfargo.com/advantagedelivery |
The views expressed and any forward-looking statements are as of January 31, 2020, unless otherwise noted, and are those of the Fund managers and/or Wells Fargo Asset Management. Discussions of individual securities, or the markets generally, or any Wells Fargo Fund are not intended as individual recommendations. Future events or results may vary significantly from those expressed in any forward-looking statements. The views expressed are subject to change at any time in response to changing circumstances in the market. Wells Fargo Asset Management and the Fund disclaim any obligation to publicly update or revise any views expressed or forward-looking statements.
INVESTMENT PRODUCTS: NOT FDIC INSURED ◾ NO BANK GUARANTEE ◾ MAY LOSE VALUE
Wells Fargo Large Company Value Fund | 1
Table of Contents
Letter to shareholders (unaudited)

Andrew Owen
President
Wells Fargo Funds
“As the period began, U.S.-China trade tensions continued with no signs of compromise.”
Dear Shareholder:
We are pleased to offer you this semi-annual report for the Wells Fargo Large Company Value Fund for thesix-month period that ended January 31, 2020. Despite some market volatility, the period was strongly positive for financial markets as supportive central banks more than offset concerns over slowing global economic growth and international trade tensions.
Overall, both fixed-income and equity investors enjoyed healthy annual returns, with U.S. markets leading the way. For the period, U.S. stocks, based on the S&P 500 Index,1 gained 9.31% and international stocks, as measured by the MSCI ACWI ex USA Index (Net),2 returned 5.37%. The MSCI EM Index (Net)3 gained a more modest 3.36%. For bond investors, the Bloomberg Barclays U.S. Aggregate Bond Index4 added 4.20%, the Bloomberg Barclays Global Aggregateex-USD Index5 returned 1.58%, the Bloomberg Barclays Municipal Bond Index6 gained 3.33%, and the ICE BofA U.S. High Yield Index7 added 3.34%.
The period began with uncertainty, leading to central bank support.
In August as the period began, U.S.-China trade tensions continued with no signs of compromise. Evidence of a continued global economic slowdown mounted, and central banks in China, New Zealand, and Thailand cut interest rates. Industrial and manufacturing data declined in China, Canada, Japan, and Germany. Adding to global uncertainty, Italy’s prime minister resigned, many feared a crackdown in Hong Kong as protestors sustained their calls for reform, and Boris Johnson planned to suspend Parliament as Brexit’s deadline neared.
In the U.S., the Federal Reserve (Fed) cut interest rates a second time in the third quarter in September. U.S. manufacturing data disappointed investors. The U.S. Congress announced it would pursue an impeachment investigation of President Trump. Meanwhile, the Brexit impasse showed no signs of resolution. Officials in China said that hitting the country’s economic growth goals for the year would be difficult considering the weight of tariffs and trade restrictions. Although the S&P 500 Index finished the third quarter with the bestyear-to-date returns in more than 20 years, concerns about future returns remained.
The fourth quarter started on a strong note, with U.S.-China trade tensions relaxing in October along with renewed optimism for a U.K. Brexit deal and positive macroeconomic data. The initial estimate of U.S. third-quarter gross domestic product growth was a resilient 1.9% annualized rate, while the U.S. unemployment rate fell to a50-year low of 3.5% in September. However, despite resilience among U.S. consumers, business
| 1 | The S&P 500 Index consists of 500 stocks chosen for market size, liquidity, and industry group representation. It is a market-value-weighted index with each stock’s weight in the index proportionate to its market value. You cannot invest directly in an index. |
| 2 | The Morgan Stanley Capital International (MSCI) All Country World Index (ACWI) ex USA Index (Net) is a free-float-adjusted market-capitalization-weighted index that is designed to measure the equity market performance of developed markets, excluding the United States. Source: MSCI. MSCI makes no express or implied warranties or representations and shall have no liability whatsoever with respect to any MSCI data contained herein. The MSCI data may not be further redistributed or used as a basis for other indices or any securities or financial products. This report is not approved, reviewed, or produced by MSCI. You cannot invest directly in an index. |
| 3 | The MSCI Emerging Markets (EM) Index (Net) is a free-float-adjusted market-capitalization-weighted index that is designed to measure equity market performance of emerging markets. You cannot invest directly in an index. |
| 4 | The Bloomberg Barclays U.S. Aggregate Bond Index is a broad-based benchmark that measures the investment-grade, U.S. dollar-denominated, fixed-rate taxable bond market, including Treasuries, government-related and corporate securities, mortgage-backed securities (agency fixed-rate and hybrid adjustable-rate mortgage pass-throughs), asset-backed securities, and commercial mortgage-backed securities. You cannot invest directly in an index. |
| 5 | The Bloomberg Barclays Global Aggregateex-USD Index is an unmanaged index that provides a broad-based measure of the global investment-grade fixed-income markets excluding the U.S. dollar-denominated debt market. You cannot invest directly in an index. |
| 6 | The Bloomberg Barclays Municipal Bond Index is an unmanaged index composed of long-termtax-exempt bonds with a minimum credit rating of Baa. You cannot invest directly in an index. |
| 7 | The ICE BofA U.S. High Yield Index is a market-capitalization-weighted index of domestic and Yankee high-yield bonds. The index tracks the performance of high-yield securities traded in the U.S. bond market. You cannot invest directly in an index. Copyright 2020. ICE Data Indices, LLC. All rights reserved. |
2 | Wells Fargo Large Company Value Fund
Table of Contents
Letter to shareholders (unaudited)
confidence declined while manufacturing activity contracted. Concerned with a potential economic slowdown, the Fed lowered interest rates another quarter point in late October, its third rate cut in four months. This helped push the S&P 500 Index to a newall-time high, while emerging market equities rallied and global bonds declined overall, reflecting a broad pickup in risk appetite.
Equity markets continued to rally in November despite ongoing geopolitical risks. Hopes for a U.S.-China trade deal buoyed investor confidence. U.S. business sentiment improved slightly, and manufacturing and services activity picked up. Throughout the month, central bank actions were on hold. With that positive backdrop, developed market equities outpaced those in emerging markets, and U.S. stocks, as reflected by the S&P 500 Index, outperformednon-U.S. stocks overall. While consumer confidence and purchasing manager activity rose in the eurozone, China reported weakening manufacturing and consumer data. Bond yields rose marginally, leading to slightly negative returns for global government and investment-grade corporate bonds.
Financial markets ended 2019 on a broadly positive note, with the U.S. and China reaching an accord on a Phase One trade deal, with some details to be worked out. That, along with the landslide win by thepro-Brexit U.K. Conservative Party in a national election and ongoing central bank support, gave investors greater certainty and confidence. U.S. economic indicators were generally positive, with the exception of manufacturing activity and business confidence. However, consumer confidence was resilient, fed by a robust labor market, tame inflation, and lower interest rates, which boosted housing affordability and stimulated homebuyer activity. The impeachment of U.S. President Donald Trump, while historically noteworthy, had little impact on markets. Meanwhile, slowing Chinese economic activity, partly attributable to the trade war, led to further government stimulus atyear-end through lower reserve ratios, allowing banks to lend more money.
Theyear-end rally continued in early January 2020. However, capital market volatility picked up in late January on concerns over the unknown impact of the coronavirus on the global economy and stock markets. With sentiment somewhat souring, perceived safe havens did well in January. The U.S. dollar and Japanese yen both rose and government bonds outperformed equities. While the S&P 500 Index held its ground, emerging market equities tumbled, including those in Asia that are most exposed to viruses—physical or economic—originating in China.
Following the end of the reporting period, the coronavirus continued its global spread, resulting in disruptions to global markets, including through border closings, restrictions on travel and large gatherings, expedited and enhanced health screenings, quarantines, cancellations, business and school closings, disruptions to employment and supply chains, reduced productivity, and reduced customer and client activity in multiple markets and sectors. The risk of further spreading of the coronavirus has led to significant uncertainty and volatility in the financial markets. The full extent of the coronavirus’s impact on the global economy cannot necessarily be foreseen and the impacts may be short term or may last for an extended period of time.
Don’t let short-term uncertainty derail long-term investment goals.
Periods of investment uncertainty can present challenges, but experience has taught us that maintaining long-term investment goals can be an effective way to plan for the future. To help you create a sound strategy based on your personal goals and risk tolerance, Wells Fargo Funds offers more than 100 mutual funds spanning a wide range of asset classes and investment styles. Although diversification cannot guarantee an investment profit or prevent losses, we believe it can be an effective way to manage investment risk
“Financial markets ended 2019 on a broadly positive note, with the U.S. and China reaching an accord on a Phase One trade deal.”
|
For further information about your Fund, contact your investment professional, visit our website at wfam.com, or call us directly at1-800-222-8222. |
Wells Fargo Large Company Value Fund | 3
Table of Contents
Letter to shareholders (unaudited)
and potentially smooth out overall portfolio performance. We encourage investors to know their investments and to understand that appropriate levels of risk-taking may unlock opportunities.
Thank you for choosing to invest with Wells Fargo Funds. We appreciate your confidence in us and remain committed to helping you meet your financial needs.
Sincerely,

Andrew Owen
President
Wells Fargo Funds
4 | Wells Fargo Large Company Value Fund
Table of Contents
Performance highlights (unaudited)
Investment objective
The Fund seeks long-term capital appreciation.
Manager
Wells Fargo Funds Management, LLC
Subadviser
Wells Capital Management Incorporated
Portfolio managers
Dennis Bein, CFA®‡
Ryan Brown, CFA®‡
Harindra de Silva, Ph.D., CFA®‡
Average annual total returns (%) as of January 31, 2020
| Including sales charge | Excluding sales charge | Expense ratios1 (%) | ||||||||||||||||||||||||||||||||
| Inception date | 1 year | 5 year | 10 year | 1 year | 5 year | 10 year | Gross | Net2 | ||||||||||||||||||||||||||
| Class A (WLCAX) | 3-31-2008 | 6.02 | 5.75 | 8.94 | 12.51 | 7.01 | 9.58 | 0.97 | 0.83 | |||||||||||||||||||||||||
| Class C (WFLVX) | 3-31-2008 | 10.68 | 6.20 | 8.77 | 11.68 | 6.20 | 8.77 | 1.72 | 1.58 | |||||||||||||||||||||||||
| Class R6 (WTLVX)3 | 4-7-2017 | – | – | – | 13.02 | 7.47 | 10.08 | 0.54 | 0.40 | |||||||||||||||||||||||||
| Administrator Class (WWIDX) | 12-31-2001 | – | – | – | 12.69 | 7.14 | 9.79 | 0.89 | 0.75 | |||||||||||||||||||||||||
| Institutional Class (WLCIX) | 3-31-2008 | – | – | – | 12.87 | 7.40 | 10.05 | 0.64 | 0.50 | |||||||||||||||||||||||||
| Russell 1000® Value Index4 | – | – | – | – | 14.88 | 8.70 | 11.87 | – | – | |||||||||||||||||||||||||
Figures quoted represent past performance, which is no guarantee of future results, and do not reflect taxes that shareholder may pay on an investment in a fund. Investment return and principal value of an investment will fluctuate so that an investor’s shares, when redeemed, may be worth more or less than their original cost. Performance shown without sales charges would be lower if sales charges were reflected. Current performance may be lower or higher than the performance data quoted, which assumes the reinvestment of dividends and capital gains. Current month-end performance is available on the Fund’s website,wfam.com.
Index returns do not include transaction costs associated with buying and selling securities, any mutual fund fees or expenses, or any taxes. It is not possible to invest directly in an index.
For Class A shares, the maximum front-end sales charge is 5.75%. For Class C shares, the maximum contingent deferred sales charge is 1.00%. Performance including a contingent deferred sales charge assumes the sales charge for the corresponding time period. Class R6, Administrator Class, and Institutional Class shares are sold without a front-end sales charge or contingent deferred sales charge.
Stock values fluctuate in response to the activities of individual companies and general market and economic conditions. Certain investment strategies tend to increase the total risk of an investment (relative to the broader market). The Fund is exposed to foreign investment risk. Consult the Fund’s prospectus for additional information on these and other risks.
Please see footnotes on page 6.
Wells Fargo Large Company Value Fund | 5
Table of Contents
Performance highlights (unaudited)
| Ten largest holdings (%) as of January 31, 20205 | ||||
Berkshire Hathaway Incorporated Class B | 4.11 | |||
Intel Corporation | 3.72 | |||
Bank of America Corporation | 3.41 | |||
Johnson & Johnson | 3.31 | |||
PepsiCo Incorporated | 3.23 | |||
Pfizer Incorporated | 3.10 | |||
Verizon Communications Incorporated | 2.68 | |||
Duke Energy Corporation | 2.57 | |||
BlackRock Incorporated | 2.49 | |||
Gilead Sciences Incorporated | 2.29 | |||
| Sector distribution as of January 31, 20206 |
|
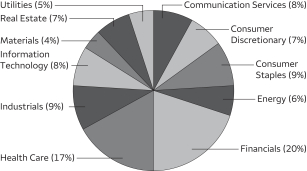
| ‡ | CFA® and Chartered Financial Analyst® are trademarks owned by CFA Institute. |
| 1 | Reflects the expense ratios as stated in the most recent prospectuses. The expense ratios shown are subject to change and may differ from the annualized expense ratios shown in the financial highlights of this report. |
| 2 | The manager has contractually committed through November 30, 2020, to waive fees and/or reimburse expenses to the extent necessary to cap total annual fund operating expenses after fee waivers at 0.83% for Class A, 1.58% for Class C, 0.40% for Class R6, 0.75% for Administrator Class, and 0.50% for Institutional Class. Brokerage commissions, stamp duty fees, interest, taxes, acquired fund fees and expenses (if any), and extraordinary expenses are excluded from the expense cap. Prior to or after the commitment expiration date, the cap may be increased or the commitment to maintain the cap may be terminated only with the approval of the Board of Trustees. Without this cap, the Fund’s returns would have been lower. The expense ratio paid by an investor is the net expense ratio (the total annual fund operating expenses after fee waivers) as stated in the prospectuses. |
| 3 | Historical performance shown for the Class R6 shares prior to their inception reflects the performance of the Institutional Class shares, and is not adjusted to reflect the Class R6 expenses. If these expenses had been included, returns for the Class R6 shares would be higher. |
| 4 | The Russell 1000® Value Index measures the performance of those Russell 1000 companies with lower price/book ratios and lower forecasted growth values. You cannot invest directly in an index. |
| 5 | The ten largest holdings, excluding cash, cash equivalents and any money market funds, are calculated based on the value of the investments divided by total net assets of the Fund. Holdings are subject to change and may have changed since the date specified. |
| 6 | Amounts are calculated based on the total long-term investments of the Fund. These amounts are subject to change and may have changed since the date specified. |
6 | Wells Fargo Large Company Value Fund
Table of Contents
As a shareholder of the Fund, you incur two types of costs: (1) transaction costs, including sales charges (loads) on purchase payments and contingent deferred sales charges (if any) on redemptions and (2) ongoing costs, including management fees, distribution (12b-1) and/or shareholder servicing fees, and other Fund expenses. This example is intended to help you understand your ongoing costs (in dollars) of investing in the Fund and to compare these costs with the ongoing costs of investing in other mutual funds.
The example is based on an investment of $1,000 invested at the beginning of the six-month period and held for the entire period from August 1, 2019 to January 31, 2020.
Actual expenses
The “Actual” line of the table below provides information about actual account values and actual expenses. You may use the information in this line, together with the amount you invested, to estimate the expenses that you paid over the period. Simply divide your account value by $1,000 (for example, an $8,600 account value divided by $1,000 = 8.6), then multiply the result by the number in the “Actual” line under the heading entitled “Expenses paid during period” for your applicable class of shares to estimate the expenses you paid on your account during this period.
Hypothetical example for comparison purposes
The “Hypothetical” line of the table below provides information about hypothetical account values and hypothetical expenses based on the Fund’s actual expense ratio and an assumed rate of return of 5% per year before expenses, which is not the Fund’s actual return. The hypothetical account values and expenses may not be used to estimate the actual ending account balance or expenses you paid for the period. You may use this information to compare the ongoing costs of investing in the Fund and other funds. To do so, compare this 5% hypothetical example with the 5% hypothetical examples that appear in the shareholder reports of the other funds.
Please note that the expenses shown in the table are meant to highlight your ongoing costs only and do not reflect any transactional costs, such as sales charges (loads) and contingent deferred sales charges. Therefore, the “Hypothetical” line of the table is useful in comparing ongoing costs only and will not help you determine the relative total costs of owning different funds. In addition, if these transactional costs were included, your costs would have been higher.
| Beginning account value 8-1-2019 | Ending account value 1-31-2020 | Expenses paid during the period1 | Annualized net expense ratio | |||||||||||||
Class A | ||||||||||||||||
Actual | $ | 1,000.00 | $ | 1,057.60 | $ | 4.14 | 0.80 | % | ||||||||
Hypothetical (5% return before expenses) | $ | 1,000.00 | $ | 1,021.11 | $ | 4.06 | 0.80 | % | ||||||||
Class C | ||||||||||||||||
Actual | $ | 1,000.00 | $ | 1,053.67 | $ | 8.16 | 1.58 | % | ||||||||
Hypothetical (5% return before expenses) | $ | 1,000.00 | $ | 1,017.19 | $ | 8.01 | 1.58 | % | ||||||||
Class R6 | ||||||||||||||||
Actual | $ | 1,000.00 | $ | 1,060.09 | $ | 2.07 | 0.40 | % | ||||||||
Hypothetical (5% return before expenses) | $ | 1,000.00 | $ | 1,023.13 | $ | 2.03 | 0.40 | % | ||||||||
Administrator Class | ||||||||||||||||
Actual | $ | 1,000.00 | $ | 1,057.93 | $ | 3.83 | 0.74 | % | ||||||||
Hypothetical (5% return before expenses) | $ | 1,000.00 | $ | 1,021.42 | $ | 3.76 | 0.74 | % | ||||||||
Institutional Class | ||||||||||||||||
Actual | $ | 1,000.00 | $ | 1,059.15 | $ | 2.59 | 0.50 | % | ||||||||
Hypothetical (5% return before expenses) | $ | 1,000.00 | $ | 1,022.62 | $ | 2.54 | 0.50 | % | ||||||||
| 1 | Expenses paid is equal to the annualized net expense ratio of each class multiplied by the average account value over the period, multiplied by the number of days in the most recent fiscal half-year divided by the number of days in the fiscal year (to reflect the one-half-year period). |
Wells Fargo Large Company Value Fund | 7
Table of Contents
Portfolio of investments—January 31, 2020 (unaudited)
| Shares | Value | |||||||||||||||
| Common Stocks: 98.19% | ||||||||||||||||
Communication Services: 8.01% | ||||||||||||||||
| Diversified Telecommunication Services: 4.19% | ||||||||||||||||
AT&T Incorporated | 85,422 | $ | 3,213,576 | |||||||||||||
Verizon Communications Incorporated | 96,099 | 5,712,125 | ||||||||||||||
| 8,925,701 | ||||||||||||||||
|
| |||||||||||||||
| Interactive Media & Services: 1.81% | ||||||||||||||||
Facebook Incorporated Class A † | 19,098 | 3,856,077 | ||||||||||||||
|
| |||||||||||||||
| Media: 2.01% | ||||||||||||||||
Comcast Corporation Class A | 81,594 | 3,524,045 | ||||||||||||||
Interpublic Group of Companies Incorporated | 33,413 | 758,475 | ||||||||||||||
| 4,282,520 | ||||||||||||||||
|
| |||||||||||||||
Consumer Discretionary: 7.09% | ||||||||||||||||
| Diversified Consumer Services: 0.04% | ||||||||||||||||
Laureate Education Incorporated Class A † | 4,458 | 92,905 | ||||||||||||||
|
| |||||||||||||||
| Hotels, Restaurants & Leisure: 1.02% | ||||||||||||||||
Boyd Gaming Corporation | 2,201 | 65,700 | ||||||||||||||
MGM Resorts International | 50,200 | 1,559,212 | ||||||||||||||
Royal Caribbean Cruises Limited | 4,606 | 539,270 | ||||||||||||||
| 2,164,182 | ||||||||||||||||
|
| |||||||||||||||
| Household Durables: 0.20% | ||||||||||||||||
Skyline Champion Corporation † | 14,439 | 415,121 | ||||||||||||||
|
| |||||||||||||||
| Specialty Retail: 4.08% | ||||||||||||||||
Aaron’s Incorporated | 15,573 | 924,413 | ||||||||||||||
Lowe’s Companies Incorporated | 36,306 | 4,220,209 | ||||||||||||||
O’Reilly Automotive Incorporated † | 7,154 | 2,905,239 | ||||||||||||||
The TJX Companies Incorporated | 10,769 | 635,802 | ||||||||||||||
| 8,685,663 | ||||||||||||||||
|
| |||||||||||||||
| Textiles, Apparel & Luxury Goods: 1.75% | ||||||||||||||||
lululemon athletica Incorporated † | 14,829 | 3,549,914 | ||||||||||||||
PVH Corporation | 2,081 | 181,401 | ||||||||||||||
| 3,731,315 | ||||||||||||||||
|
| |||||||||||||||
Consumer Staples: 8.36% | ||||||||||||||||
| Beverages: 3.23% | ||||||||||||||||
PepsiCo Incorporated | 48,394 | 6,872,916 | ||||||||||||||
|
| |||||||||||||||
| Food & Staples Retailing: 3.40% | ||||||||||||||||
Costco Wholesale Corporation | 14,871 | 4,543,388 | ||||||||||||||
The Kroger Company | 95,721 | 2,571,066 | ||||||||||||||
US Foods Holding Corporation † | 396 | 15,907 | ||||||||||||||
Walmart Incorporated | 1,026 | 117,467 | ||||||||||||||
| 7,247,828 | ||||||||||||||||
|
| |||||||||||||||
| Food Products: 0.96% | ||||||||||||||||
Sanderson Farms Incorporated | 14,856 | 2,045,523 | ||||||||||||||
|
| |||||||||||||||
| Household Products: 0.48% | ||||||||||||||||
The Procter & Gamble Company | 8,296 | 1,033,848 | ||||||||||||||
|
| |||||||||||||||
The accompanying notes are an integral part of these financial statements.
8 | Wells Fargo Large Company Value Fund
Table of Contents
Portfolio of investments—January 31, 2020 (unaudited)
| Shares | Value | |||||||||||||||
| Tobacco: 0.29% | ||||||||||||||||
Altria Group Incorporated | 12,836 | $ | 610,095 | |||||||||||||
|
| |||||||||||||||
Energy: 6.11% | ||||||||||||||||
| Oil, Gas & Consumable Fuels: 6.11% | ||||||||||||||||
ConocoPhillips | 77,893 | 4,629,181 | ||||||||||||||
Marathon Petroleum Corporation | 976 | 53,192 | ||||||||||||||
ONEOK Incorporated | 35,825 | 2,682,218 | ||||||||||||||
The Williams Companies Incorporated | 58,866 | 1,217,938 | ||||||||||||||
Valero Energy Corporation | 51,966 | 4,381,253 | ||||||||||||||
WPX Energy Incorporated † | 4,845 | 57,898 | ||||||||||||||
| 13,021,680 | ||||||||||||||||
|
| |||||||||||||||
Financials: 19.18% | ||||||||||||||||
| Banks: 9.01% | ||||||||||||||||
Bank of America Corporation | 221,393 | 7,268,332 | ||||||||||||||
Bank of N.T. Butterfield & Son Limited | 21,782 | 723,598 | ||||||||||||||
Citigroup Incorporated | 52,918 | 3,937,628 | ||||||||||||||
Comerica Incorporated | 38,227 | 2,337,963 | ||||||||||||||
JPMorgan Chase & Company | 31,868 | 4,218,048 | ||||||||||||||
PacWest Bancorp | 20,365 | 713,793 | ||||||||||||||
| 19,199,362 | ||||||||||||||||
|
| |||||||||||||||
| Capital Markets: 4.12% | ||||||||||||||||
Bank of New York Mellon Corporation | 49,493 | 2,216,297 | ||||||||||||||
BlackRock Incorporated | 10,043 | 5,296,176 | ||||||||||||||
LPL Financial Holdings Incorporated | 8,703 | 801,807 | ||||||||||||||
Morgan Stanley | 8,996 | 470,131 | ||||||||||||||
| 8,784,411 | ||||||||||||||||
|
| |||||||||||||||
| Consumer Finance: 0.72% | ||||||||||||||||
OneMain Holdings Incorporated | 36,111 | 1,530,023 | ||||||||||||||
|
| |||||||||||||||
| Diversified Financial Services: 4.43% | ||||||||||||||||
Berkshire Hathaway Incorporated Class B † | 39,031 | 8,759,727 | ||||||||||||||
Cannae Holdings Incorporated † | 16,463 | 669,386 | ||||||||||||||
| 9,429,113 | ||||||||||||||||
|
| |||||||||||||||
| Insurance: 0.90% | ||||||||||||||||
Aon plc | 5,044 | 1,110,941 | ||||||||||||||
Assured Guaranty Limited | 8,181 | 375,017 | ||||||||||||||
National General Holdings Corporation | 19,495 | 424,406 | ||||||||||||||
| 1,910,364 | ||||||||||||||||
|
| |||||||||||||||
Health Care: 16.94% | ||||||||||||||||
| Biotechnology: 3.72% | ||||||||||||||||
Alexion Pharmaceuticals Incorporated † | 1,507 | 149,781 | ||||||||||||||
Amgen Incorporated | 1,714 | 370,310 | ||||||||||||||
Arena Pharmaceuticals Incorporated † | 55,553 | 2,538,217 | ||||||||||||||
Gilead Sciences Incorporated | 77,116 | 4,873,731 | ||||||||||||||
| 7,932,039 | ||||||||||||||||
|
| |||||||||||||||
| Health Care Equipment & Supplies: 3.49% | ||||||||||||||||
Baxter International Incorporated | 50,565 | 4,511,409 | ||||||||||||||
Integer Holdings Corporation † | 3,440 | 293,776 | ||||||||||||||
Tandem Diabetes Care Incorporated † | 11,722 | 891,341 | ||||||||||||||
West Pharmaceutical Services Incorporated | 11,171 | 1,742,117 | ||||||||||||||
| 7,438,643 | ||||||||||||||||
|
| |||||||||||||||
The accompanying notes are an integral part of these financial statements.
Wells Fargo Large Company Value Fund | 9
Table of Contents
Portfolio of investments—January 31, 2020 (unaudited)
| Shares | Value | |||||||||||||||
| Health Care Providers & Services: 1.04% | ||||||||||||||||
Laboratory Corporation of America Holdings † | 12,612 | $ | 2,212,145 | |||||||||||||
|
| |||||||||||||||
| Life Sciences Tools & Services: 1.88% | ||||||||||||||||
Charles River Laboratories International Incorporated † | 958 | 148,088 | ||||||||||||||
IQVIA Holdings Incorporated † | 9,099 | 1,412,620 | ||||||||||||||
Thermo Fisher Scientific Incorporated | 7,777 | 2,435,679 | ||||||||||||||
| 3,996,387 | ||||||||||||||||
|
| |||||||||||||||
| Pharmaceuticals: 6.81% | ||||||||||||||||
Johnson & Johnson | 47,294 | 7,040,658 | ||||||||||||||
Pfizer Incorporated | 177,245 | 6,600,604 | ||||||||||||||
Zoetis Incorporated | 6,399 | 858,810 | ||||||||||||||
| 14,500,072 | ||||||||||||||||
|
| |||||||||||||||
Industrials: 8.75% | ||||||||||||||||
| Aerospace & Defense: 3.29% | ||||||||||||||||
General Dynamics Corporation | 23,783 | 4,172,490 | ||||||||||||||
Lockheed Martin Corporation | 3,041 | 1,301,913 | ||||||||||||||
Moog Incorporated Class A | 1,029 | 92,209 | ||||||||||||||
United Technologies Corporation | 9,637 | 1,447,477 | ||||||||||||||
| 7,014,089 | ||||||||||||||||
|
| |||||||||||||||
| Airlines: 1.54% | ||||||||||||||||
SkyWest Incorporated | 59,354 | 3,274,560 | ||||||||||||||
|
| |||||||||||||||
| Commercial Services & Supplies: 2.26% | ||||||||||||||||
Republic Services Incorporated | 50,640 | 4,813,332 | ||||||||||||||
|
| |||||||||||||||
| Electrical Equipment: 0.02% | ||||||||||||||||
Eaton Corporation plc | 427 | 40,339 | ||||||||||||||
|
| |||||||||||||||
| Machinery: 0.66% | ||||||||||||||||
Crane Company | 1,750 | 149,555 | ||||||||||||||
Hillenbrand Incorporated | 43,006 | 1,248,464 | ||||||||||||||
| 1,398,019 | ||||||||||||||||
|
| |||||||||||||||
| Road & Rail: 0.93% | ||||||||||||||||
Union Pacific Corporation | 11,080 | 1,987,974 | ||||||||||||||
|
| |||||||||||||||
| Trading Companies & Distributors: 0.05% | ||||||||||||||||
Applied Industrial Technologies Incorporated | 1,545 | 99,761 | ||||||||||||||
|
| |||||||||||||||
| Information Technology: 7.45% | ||||||||||||||||
| IT Services: 0.74% | ||||||||||||||||
MasterCard Incorporated Class A | 4,987 | 1,575,593 | ||||||||||||||
|
| |||||||||||||||
| Semiconductors & Semiconductor Equipment: 4.87% | ||||||||||||||||
Intel Corporation | 123,775 | 7,912,934 | ||||||||||||||
NVIDIA Corporation | 10,413 | 2,461,946 | ||||||||||||||
| 10,374,880 | ||||||||||||||||
|
| |||||||||||||||
| Software: 1.84% | ||||||||||||||||
Intuit Incorporated | 13,969 | 3,916,628 | ||||||||||||||
Progress Software Corporation | 1 | 45 | ||||||||||||||
| 3,916,673 | ||||||||||||||||
|
| |||||||||||||||
The accompanying notes are an integral part of these financial statements.
10 | Wells Fargo Large Company Value Fund
Table of Contents
Portfolio of investments—January 31, 2020 (unaudited)
| Shares | Value | |||||||||||||||
| Technology Hardware, Storage & Peripherals: 0.00% | ||||||||||||||||
HP Incorporated | 3 | $ | 64 | |||||||||||||
|
| |||||||||||||||
Materials: 4.08% | ||||||||||||||||
| Chemicals: 1.67% | ||||||||||||||||
Celanese Corporation Series A | 207 | 21,425 | ||||||||||||||
Eastman Chemical Company | 49,481 | 3,526,511 | ||||||||||||||
| 3,547,936 | ||||||||||||||||
|
| |||||||||||||||
| Containers & Packaging: 0.40% | ||||||||||||||||
WestRock Company | 21,957 | 856,323 | ||||||||||||||
|
| |||||||||||||||
| Metals & Mining: 2.01% | ||||||||||||||||
Newmont Goldcorp Corporation | 95,089 | 4,284,710 | ||||||||||||||
|
| |||||||||||||||
Real Estate: 7.14% | ||||||||||||||||
| Equity REITs: 7.14% | ||||||||||||||||
Apple Hospitality REIT Incorporated | 34,496 | 518,130 | ||||||||||||||
Equity Commonwealth | 1,488 | 48,792 | ||||||||||||||
Gaming and Leisure Properties Incorporated | 101,319 | 4,787,829 | ||||||||||||||
Mack-Cali Realty Corporation | 130,242 | 2,860,114 | ||||||||||||||
Outfront Media Incorporated | 26,724 | 794,772 | ||||||||||||||
Piedmont Office Realty Trust Incorporated Class A | 120,134 | 2,785,907 | ||||||||||||||
The Geo Group Incorporated | 76,038 | 1,201,400 | ||||||||||||||
Weingarten Realty Investors | 21,024 | 611,798 | ||||||||||||||
Weyerhaeuser Company | 55,115 | 1,595,579 | ||||||||||||||
| 15,204,321 | ||||||||||||||||
|
| |||||||||||||||
Utilities: 5.08% | ||||||||||||||||
| Electric Utilities: 4.17% | ||||||||||||||||
Duke Energy Corporation | 56,165 | 5,483,389 | ||||||||||||||
NextEra Energy Incorporated | 12,697 | 3,405,335 | ||||||||||||||
| 8,888,724 | ||||||||||||||||
|
| |||||||||||||||
| Multi-Utilities: 0.91% | ||||||||||||||||
MDU Resources Group Incorporated | 65,003 | 1,924,739 | ||||||||||||||
|
| |||||||||||||||
Total Common Stocks (Cost $189,937,572) |
| 209,119,970 | ||||||||||||||
|
| |||||||||||||||
Yield | ||||||||||||||||
| Short-Term Investments: 1.42% | ||||||||||||||||
| Investment Companies: 1.42% | ||||||||||||||||
Wells Fargo Government Money Market Fund Select Class (l)(u) | 1.51 | % | 3,035,628 | 3,035,628 | ||||||||||||
|
| |||||||||||||||
Total Short-Term Investments (Cost $3,035,628) | 3,035,628 | |||||||||||||||
|
| |||||||||||||||
| Total investments in securities (Cost $192,973,200) | 99.61 | % | 212,155,598 | |||||
Other assets and liabilities, net | 0.39 | 820,173 | ||||||
|
|
|
| |||||
| Total net assets | 100.00 | % | $ | 212,975,771 | ||||
|
|
|
| |||||
| † | Non-income-earning security |
| (l) | The issuer of the security is an affiliated person of the Fund as defined in the Investment Company Act of 1940. |
| (u) | The rate represents the 7-day annualized yield at period end. |
Abbreviations:
| REIT | Real estate investment trust |
The accompanying notes are an integral part of these financial statements.
Wells Fargo Large Company Value Fund | 11
Table of Contents
Portfolio of investments—January 31, 2020 (unaudited)
Futures Contracts
| Description | Number of contracts | Expiration date | Notional cost | Notional value | Unrealized gains | Unrealized losses | ||||||||||||||||||
Long | ||||||||||||||||||||||||
S&P 500 E-Mini Index | 24 | 3-20-2020 | $ | 3,881,376 | $ | 3,868,800 | $ | 0 | $ | (12,576 | ) | |||||||||||||
Investments in Affiliates
An affiliated investment is an investment in which the Fund owns at least 5% of the outstanding voting shares of the issuer or as a result of other relationships, such as the Fund and the issuer having the same investment manager. Transactions with issuers that were either affiliated persons of the Fund at the beginning of the period or the end of the period were as follows:
| Shares, beginning of period | Shares purchased | Shares sold | Shares, end of period | Net realized gains (losses) | Net change in unrealized gains (losses) | Income from affiliated securities | Value, end of period | % of net assets | ||||||||||||||||||||||||||||
| Short-Term Investments | ||||||||||||||||||||||||||||||||||||
Investment Companies | ||||||||||||||||||||||||||||||||||||
Securities Lending Cash Investments LLC * | 0 | 4,235,951 | (4,235,951 | ) | 0 | $ | 0 | $ | 0 | $ | 999 | # | $ | 0 | ||||||||||||||||||||||
Wells Fargo Government Money Market Fund Select Class | 1,645,324 | 16,788,628 | (15,398,324 | ) | 3,035,628 | 0 | 0 | 26,765 | 3,035,628 | |||||||||||||||||||||||||||
|
|
|
|
|
|
|
|
|
| |||||||||||||||||||||||||||
| $ | 0 | $ | 0 | $ | 27,764 | $ | 3,035,628 | 1.42 | % | |||||||||||||||||||||||||||
|
|
|
|
|
|
|
|
|
| |||||||||||||||||||||||||||
| * | No longer held at the end of the period. |
| # | Amount shown represents income before fees and rebates. |
The accompanying notes are an integral part of these financial statements.
12 | Wells Fargo Large Company Value Fund
Table of Contents
Statement of assets and liabilities—January 31, 2020 (unaudited)
Assets | ||||
Investments in unaffiliated securities, at value (cost $189,937,572) | $ | 209,119,970 | ||
Investments in affiliated securities, at value (cost $3,035,628) | 3,035,628 | |||
Segregated cash for futures contracts | 800,000 | |||
Receivable for Fund shares sold | 44,880 | |||
Receivable for dividends | 319,551 | |||
Prepaid expenses and other assets | 108,419 | |||
|
| |||
Total assets | 213,428,448 | |||
|
| |||
Liabilities | ||||
Payable for Fund shares redeemed | 212,644 | |||
Payable for daily variation margin on open futures contracts | 78,880 | |||
Management fee payable | 51,449 | |||
Administration fees payable | 40,188 | |||
Distribution fee payable | 568 | |||
Shareholder servicing fees payable | 48,595 | |||
Trustees’ fees and expenses payable | 5,454 | |||
Accrued expenses and other liabilities | 14,899 | |||
|
| |||
Total liabilities | 452,677 | |||
|
| |||
Total net assets | $ | 212,975,771 | ||
|
| |||
Net assets consist of | ||||
Paid-in capital | $ | 188,797,830 | ||
Total distributable earnings | 24,177,941 | |||
|
| |||
Total net assets | $ | 212,975,771 | ||
|
| |||
Computation of net asset value and offering price per share | ||||
Net assets – Class A | $ | 195,750,914 | ||
Shares outstanding – Class A1 | 14,538,401 | |||
Net asset value per share – Class A | $13.46 | |||
Maximum offering price per share – Class A2 | $14.28 | |||
Net assets – Class C | $ | 727,651 | ||
Shares outstanding – Class C1 | 52,212 | |||
Net asset value per share – Class C | $13.94 | |||
Net assets – Class R6 | $ | 20,951 | ||
Shares outstanding – Class R61 | 1,549 | |||
Net asset value per share – Class R6 | $13.53 | |||
Net assets – Administrator Class | $ | 13,304,418 | ||
Shares outstanding – Administrator Class1 | 978,597 | |||
Net asset value per share – Administrator Class | $13.60 | |||
Net assets – Institutional Class | $ | 3,171,837 | ||
Shares outstanding – Institutional Class1 | 234,240 | |||
Net asset value per share – Institutional Class | $13.54 | |||
| 1 | The Fund has an unlimited number of authorized shares. |
| 2 | Maximum offering price is computed as 100/94.25 of net asset value. On investments of $50,000 or more, the offering price is reduced. |
The accompanying notes are an integral part of these financial statements.
Wells Fargo Large Company Value Fund | 13
Table of Contents
Statement of operations—six months ended January 31, 2020 (unaudited)
Investment income | ||||
Dividends | $ | 3,016,661 | ||
Income from affiliated securities | 27,022 | |||
|
| |||
Total investment income | 3,043,683 | |||
|
| |||
Expenses | ||||
Management fee | 430,501 | |||
Administration fees | ||||
Class A | 207,360 | |||
Class C | 872 | |||
Class R6 | 4 | |||
Administrator Class | 9,102 | |||
Institutional Class | 1,891 | |||
Shareholder servicing fees | ||||
Class A | 246,857 | |||
Class C | 1,039 | |||
Administrator Class | 17,504 | |||
Distribution fee | ||||
Class C | 3,105 | |||
Custody and accounting fees | 11,210 | |||
Professional fees | 20,598 | |||
Registration fees | 40,767 | |||
Shareholder report expenses | 30,575 | |||
Trustees’ fees and expenses | 10,864 | |||
Other fees and expenses | 6,813 | |||
|
| |||
Total expenses | 1,039,062 | |||
Less: Fee waivers and/or expense reimbursements | ||||
Fund-level | (153,451 | ) | ||
Class A | (24,797 | ) | ||
Class C | (4 | ) | ||
Administrator Class | (332 | ) | ||
|
| |||
Net expenses | 860,478 | |||
|
| |||
Net investment income | 2,183,205 | |||
|
| |||
Realized and unrealized gains (losses) on investments | ||||
Net realized gains on | ||||
Unaffiliated securities | 8,532,549 | |||
Futures contracts | 421,077 | |||
|
| |||
Net realized gains on investments | 8,953,626 | |||
|
| |||
Net change in unrealized gains (losses) on | ||||
Unaffiliated securities | 760,890 | |||
Futures contracts | (10,517 | ) | ||
|
| |||
Net change in unrealized gains (losses) on investments | 750,373 | |||
|
| |||
Net realized and unrealized gains (losses) on investments | 9,703,999 | |||
|
| |||
Net increase in net assets resulting from operations | $ | 11,887,204 | ||
|
| |||
The accompanying notes are an integral part of these financial statements.
14 | Wells Fargo Large Company Value Fund
Table of Contents
Statement of changes in net assets
| Six months ended January 31, 2020 (unaudited) | Year ended July 31, 2019 | |||||||||||||||
Operations | ||||||||||||||||
Net investment income | $ | 2,183,205 | $ | 4,187,678 | ||||||||||||
Net realized gains (losses) on investments | 8,953,626 | (1,776,559 | ) | |||||||||||||
Net change in unrealized gains (losses) on investments | 750,373 | (1,219,504 | ) | |||||||||||||
|
| |||||||||||||||
Net increase in net assets resulting from operations | 11,887,204 | 1,191,615 | ||||||||||||||
|
| |||||||||||||||
Distributions to shareholders from net investment income and net realized gains | ||||||||||||||||
Class A | (2,935,092 | ) | (23,627,979 | ) | ||||||||||||
Class C | (6,507 | ) | (266,385 | ) | ||||||||||||
Class R6 | (445 | ) | (2,636 | ) | ||||||||||||
Administrator Class | (222,708 | ) | (1,888,886 | ) | ||||||||||||
Institutional Class | (56,719 | ) | (1,871,851 | ) | ||||||||||||
|
| |||||||||||||||
Total distributions to shareholders | (3,221,471 | ) | (27,657,737 | ) | ||||||||||||
|
| |||||||||||||||
Capital share transactions | Shares | Shares | ||||||||||||||
Proceeds from shares sold | ||||||||||||||||
Class A | 92,726 | 1,211,227 | 328,569 | 4,172,689 | ||||||||||||
Class C | 1,179 | 16,335 | 6,704 | 85,717 | ||||||||||||
Administrator Class | 9,714 | 126,608 | 14,518 | 189,634 | ||||||||||||
Institutional Class | 51,629 | 695,335 | 68,756 | 908,749 | ||||||||||||
|
| |||||||||||||||
| 2,049,505 | 5,356,789 | |||||||||||||||
|
| |||||||||||||||
Reinvestment of distributions | ||||||||||||||||
Class A | 217,711 | 2,862,786 | 1,878,949 | 23,010,284 | ||||||||||||
Class C | 422 | 5,689 | 19,913 | 248,892 | ||||||||||||
Administrator Class | 16,334 | 217,188 | 150,186 | 1,857,902 | ||||||||||||
Institutional Class | 4,202 | 55,871 | 39,382 | 487,708 | ||||||||||||
|
| |||||||||||||||
| 3,141,534 | 25,604,786 | |||||||||||||||
|
| |||||||||||||||
Payment for shares redeemed | ||||||||||||||||
Class A | (942,318 | ) | (12,365,613 | ) | (1,858,015 | ) | (24,202,649 | ) | ||||||||
Class C | (21,801 | ) | (291,038 | ) | (151,734 | ) | (1,973,099 | ) | ||||||||
Administrator Class | (108,542 | ) | (1,470,116 | ) | (251,379 | ) | (3,187,791 | ) | ||||||||
Institutional Class | (47,636 | ) | (617,832 | ) | (1,090,005 | ) | (12,813,608 | ) | ||||||||
|
| |||||||||||||||
| (14,744,599 | ) | (42,177,147 | ) | |||||||||||||
|
| |||||||||||||||
Net decrease in net assets resulting from capital share transactions | (9,553,560 | ) | (11,215,572 | ) | ||||||||||||
|
| |||||||||||||||
Total decrease in net assets | (887,827 | ) | (37,681,694 | ) | ||||||||||||
|
| |||||||||||||||
Net assets | ||||||||||||||||
Beginning of period | 213,863,598 | 251,545,292 | ||||||||||||||
|
| |||||||||||||||
End of period | $ | 212,975,771 | $ | 213,863,598 | ||||||||||||
|
| |||||||||||||||
The accompanying notes are an integral part of these financial statements.
Wells Fargo Large Company Value Fund | 15
Table of Contents
(For a share outstanding throughout each period)
| Six months ended January 31, 2020 (unaudited) | Year ended July 31 | |||||||||||||||||||||||
| CLASS A | 2019 | 2018 | 2017 | 2016 | 2015 | |||||||||||||||||||
Net asset value, beginning of period | $12.92 | $14.46 | $16.54 | $14.58 | $16.10 | $16.82 | ||||||||||||||||||
Net investment income | 0.14 | 0.24 | 0.19 | 0.14 | 0.17 | 0.13 | 1 | |||||||||||||||||
Net realized and unrealized gains (losses) on investments | 0.60 | (0.15 | ) | 1.29 | 1.93 | (0.41 | ) | 0.78 | ||||||||||||||||
|
|
|
|
|
|
|
|
|
|
|
| |||||||||||||
Total from investment operations | 0.74 | 0.09 | 1.48 | 2.07 | (0.24 | ) | 0.91 | |||||||||||||||||
Distributions to shareholders from | ||||||||||||||||||||||||
Net investment income | (0.13 | ) | (0.25 | ) | (0.18 | ) | (0.11 | ) | (0.16 | ) | (0.13 | ) | ||||||||||||
Net realized gains | (0.07 | ) | (1.38 | ) | (3.38 | ) | 0.00 | (1.12 | ) | (1.50 | ) | |||||||||||||
|
|
|
|
|
|
|
|
|
|
|
| |||||||||||||
Total distributions to shareholders | (0.20 | ) | (1.63 | ) | (3.56 | ) | (0.11 | ) | (1.28 | ) | (1.63 | ) | ||||||||||||
Net asset value, end of period | $13.46 | $12.92 | $14.46 | $16.54 | $14.58 | $16.10 | ||||||||||||||||||
Total return2 | 5.76 | % | 1.44 | % | 9.39 | % | 14.24 | % | (0.98 | )% | 5.72 | % | ||||||||||||
Ratios to average net assets (annualized) | ||||||||||||||||||||||||
Gross expenses | 0.97 | % | 0.97 | % | 0.94 | % | 1.09 | % | 1.24 | % | 1.27 | % | ||||||||||||
Net expenses | 0.80 | % | 0.83 | % | 0.83 | % | 0.96 | % | 1.10 | % | 1.10 | % | ||||||||||||
Net investment income | 2.02 | % | 1.84 | % | 1.28 | % | 0.91 | % | 1.19 | % | 0.76 | % | ||||||||||||
Supplemental data | ||||||||||||||||||||||||
Portfolio turnover rate | 123 | % | 221 | % | 258 | % | 221 | % | 50 | % | 71 | % | ||||||||||||
Net assets, end of period (000s omitted) | $195,751 | $196,075 | $214,247 | $221,207 | $218,922 | $104,453 | ||||||||||||||||||
| 1 | Calculated based upon average shares outstanding |
| 2 | Total return calculations do not include any sales charges. Returns for periods of less than one year are not annualized. |
The accompanying notes are an integral part of these financial statements.
16 | Wells Fargo Large Company Value Fund
Table of Contents
Financial highlights
(For a share outstanding throughout each period)
| Six months ended January 31, 2020 (unaudited) | Year ended July 31 | |||||||||||||||||||||||
| CLASS C | 2019 | 2018 | 2017 | 2016 | 2015 | |||||||||||||||||||
Net asset value, beginning of period | $13.34 | $14.81 | $16.86 | $14.90 | $16.41 | $17.12 | ||||||||||||||||||
Net investment income | 0.09 | 1 | 0.16 | 1 | 0.08 | 0.03 | 1 | 0.06 | 0.00 | 2 | ||||||||||||||
Net realized and unrealized gains (losses) on investments | 0.62 | (0.15 | ) | 1.30 | 1.96 | (0.40 | ) | 0.80 | ||||||||||||||||
|
|
|
|
|
|
|
|
|
|
|
| |||||||||||||
Total from investment operations | 0.71 | 0.01 | 1.38 | 1.99 | (0.34 | ) | 0.80 | |||||||||||||||||
Distributions to shareholders from | ||||||||||||||||||||||||
Net investment income | (0.04 | ) | (0.10 | ) | (0.05 | ) | (0.03 | ) | (0.05 | ) | (0.01 | ) | ||||||||||||
Net realized gains | (0.07 | ) | (1.38 | ) | (3.38 | ) | 0.00 | (1.12 | ) | (1.50 | ) | |||||||||||||
|
|
|
|
|
|
|
|
|
|
|
| |||||||||||||
Total distributions to shareholders | (0.11 | ) | (1.48 | ) | (3.43 | ) | (0.03 | ) | (1.17 | ) | (1.51 | ) | ||||||||||||
Net asset value, end of period | $13.94 | $13.34 | $14.81 | $16.86 | $14.90 | $16.41 | ||||||||||||||||||
Total return3 | 5.37 | % | 0.76 | % | 8.49 | % | 13.40 | % | (1.68 | )% | 4.92 | % | ||||||||||||
Ratios to average net assets (annualized) | ||||||||||||||||||||||||
Gross expenses | 1.72 | % | 1.71 | % | 1.69 | % | 1.84 | % | 1.99 | % | 2.02 | % | ||||||||||||
Net expenses | 1.58 | % | 1.58 | % | 1.58 | % | 1.72 | % | 1.85 | % | 1.85 | % | ||||||||||||
Net investment income | 1.28 | % | 1.15 | % | 0.55 | % | 0.16 | % | 0.44 | % | 0.01 | % | ||||||||||||
Supplemental data | ||||||||||||||||||||||||
Portfolio turnover rate | 123 | % | 221 | % | 258 | % | 221 | % | 50 | % | 71 | % | ||||||||||||
Net assets, end of period (000s omitted) | $728 | $966 | $2,926 | $3,356 | $3,674 | $4,488 | ||||||||||||||||||
| 1 | Calculated based upon average shares outstanding |
| 2 | Amount is less than $0.005. |
| 3 | Total return calculations do not include any sales charges. Returns for periods of less than one year are not annualized. |
The accompanying notes are an integral part of these financial statements.
Wells Fargo Large Company Value Fund | 17
Table of Contents
Financial highlights
(For a share outstanding throughout each period)
| Six months ended January 31, 2020 (unaudited) | Year ended July 31 | |||||||||||||||
| CLASS R6 | 2019 | 2018 | 20171 | |||||||||||||
Net asset value, beginning of period | $13.04 | $14.59 | $16.66 | $16.14 | ||||||||||||
Net investment income | 0.16 | 0.30 | 0.26 | 0.03 | 2 | |||||||||||
Net realized and unrealized gains (losses) on investments | 0.62 | (0.14 | ) | 1.30 | 0.49 | |||||||||||
|
|
|
|
|
|
|
| |||||||||
Total from investment operations | 0.78 | 0.16 | 1.56 | 0.52 | ||||||||||||
Distributions to shareholders from | ||||||||||||||||
Net investment income | (0.22 | ) | (0.33 | ) | (0.25 | ) | 0.00 | |||||||||
Net realized gains | (0.07 | ) | (1.38 | ) | (3.38 | ) | 0.00 | |||||||||
|
|
|
|
|
|
|
| |||||||||
Total distributions to shareholders | (0.29 | ) | (1.71 | ) | (3.63 | ) | 0.00 | |||||||||
Net asset value, end of period | $13.53 | $13.04 | $14.59 | $16.66 | ||||||||||||
Total return3 | 6.01 | % | 1.92 | % | 9.88 | % | 3.22 | % | ||||||||
Ratios to average net assets (annualized) | ||||||||||||||||
Gross expenses | 0.55 | % | 0.55 | % | 0.51 | % | 0.49 | % | ||||||||
Net expenses | 0.40 | % | 0.40 | % | 0.40 | % | 0.40 | % | ||||||||
Net investment income | 2.43 | % | 2.26 | % | 1.73 | % | 0.52 | % | ||||||||
Supplemental data | ||||||||||||||||
Portfolio turnover rate | 123 | % | 221 | % | 258 | % | 221 | % | ||||||||
Net assets, end of period (000s omitted) | $21 | $20 | $23 | $26 | ||||||||||||
| 1 | For the period from April 7, 2017 (commencement of class operations) to July 31, 2017 |
| 2 | Calculated based upon average shares outstanding |
| 3 | Returns for periods of less than one year are not annualized. |
The accompanying notes are an integral part of these financial statements.
18 | Wells Fargo Large Company Value Fund
Table of Contents
Financial highlights
(For a share outstanding throughout each period)
| Six months ended January 31, 2020 (unaudited) | Year ended July 31 | |||||||||||||||||||||||
| ADMINISTRATOR CLASS | 2019 | 2018 | 2017 | 2016 | 2015 | |||||||||||||||||||
Net asset value, beginning of period | $13.06 | $14.59 | $16.66 | $14.68 | $16.20 | $16.93 | ||||||||||||||||||
Net investment income | 0.14 | 1 | 0.26 | 0.20 | 0.16 | 1 | 0.20 | 0.17 | ||||||||||||||||
Net realized and unrealized gains (losses) on investments | 0.61 | (0.14 | ) | 1.30 | 1.94 | (0.41 | ) | 0.78 | ||||||||||||||||
|
|
|
|
|
|
|
|
|
|
|
| |||||||||||||
Total from investment operations | 0.75 | 0.12 | 1.50 | 2.10 | (0.21 | ) | 0.95 | |||||||||||||||||
Distributions to shareholders from | ||||||||||||||||||||||||
Net investment income | (0.14 | ) | (0.27 | ) | (0.19 | ) | (0.12 | ) | (0.19 | ) | (0.18 | ) | ||||||||||||
Net realized gains | (0.07 | ) | (1.38 | ) | (3.38 | ) | 0.00 | (1.12 | ) | (1.50 | ) | |||||||||||||
|
|
|
|
|
|
|
|
|
|
|
| |||||||||||||
Total distributions to shareholders | (0.21 | ) | (1.65 | ) | (3.57 | ) | (0.12 | ) | (1.31 | ) | (1.68 | ) | ||||||||||||
Net asset value, end of period | $13.60 | $13.06 | $14.59 | $16.66 | $14.68 | $16.20 | ||||||||||||||||||
Total return2 | 5.79 | % | 1.61 | % | 9.44 | % | 14.35 | % | (0.79 | )% | 5.95 | % | ||||||||||||
Ratios to average net assets (annualized) | ||||||||||||||||||||||||
Gross expenses | 0.89 | % | 0.89 | % | 0.86 | % | 1.01 | % | 1.16 | % | 1.12 | % | ||||||||||||
Net expenses | 0.74 | % | 0.75 | % | 0.75 | % | 0.87 | % | 0.93 | % | 0.85 | % | ||||||||||||
Net investment income | 2.09 | % | 1.93 | % | 1.37 | % | 1.01 | % | 1.35 | % | 1.01 | % | ||||||||||||
Supplemental data | ||||||||||||||||||||||||
Portfolio turnover rate | 123 | % | 221 | % | 258 | % | 221 | % | 50 | % | 71 | % | ||||||||||||
Net assets, end of period (000s omitted) | $13,304 | $13,854 | $16,744 | $18,296 | $24,164 | $30,177 | ||||||||||||||||||
| 1 | Calculated based upon average shares outstanding |
| 2 | Returns for periods of less than one year are not annualized. |
The accompanying notes are an integral part of these financial statements.
Wells Fargo Large Company Value Fund | 19
Table of Contents
Financial highlights
(For a share outstanding throughout each period)
| Six months ended January 31, 2020 (unaudited) | Year ended July 31 | |||||||||||||||||||||||
| INSTITUTIONAL CLASS | 2019 | 2018 | 2017 | 2016 | 2015 | |||||||||||||||||||
Net asset value, beginning of period | $13.04 | $14.58 | $16.65 | $14.66 | $16.17 | $16.91 | ||||||||||||||||||
Net investment income | 0.15 | 0.29 | 1 | 0.24 | 0.19 | 1 | 0.21 | 1 | 0.20 | 1 | ||||||||||||||
Net realized and unrealized gains (losses) on investments | 0.62 | (0.14 | ) | 1.30 | 1.94 | (0.38 | ) | 0.78 | ||||||||||||||||
|
|
|
|
|
|
|
|
|
|
|
| |||||||||||||
Total from investment operations | 0.77 | 0.15 | 1.54 | 2.13 | (0.17 | ) | 0.98 | |||||||||||||||||
Distributions to shareholders from | ||||||||||||||||||||||||
Net investment income | (0.20 | ) | (0.31 | ) | (0.23 | ) | (0.14 | ) | (0.22 | ) | (0.22 | ) | ||||||||||||
Net realized gains | (0.07 | ) | (1.38 | ) | (3.38 | ) | 0.00 | (1.12 | ) | (1.50 | ) | |||||||||||||
|
|
|
|
|
|
|
|
|
|
|
| |||||||||||||
Total distributions to shareholders | (0.27 | ) | (1.69 | ) | (3.61 | ) | (0.14 | ) | (1.34 | ) | (1.72 | ) | ||||||||||||
Net asset value, end of period | $13.54 | $13.04 | $14.58 | $16.65 | $14.66 | $16.17 | ||||||||||||||||||
Total return2 | 5.91 | % | 1.86 | % | 9.77 | % | 14.61 | % | (0.54 | )% | 6.14 | % | ||||||||||||
Ratios to average net assets (annualized) | ||||||||||||||||||||||||
Gross expenses | 0.64 | % | 0.63 | % | 0.62 | % | 0.74 | % | 0.91 | % | 0.85 | % | ||||||||||||
Net expenses | 0.50 | % | 0.50 | % | 0.50 | % | 0.61 | % | 0.74 | % | 0.65 | % | ||||||||||||
Net investment income | 2.32 | % | 2.14 | % | 1.60 | % | 1.21 | % | 1.52 | % | 1.23 | % | ||||||||||||
Supplemental data | ||||||||||||||||||||||||
Portfolio turnover rate | 123 | % | 221 | % | 258 | % | 221 | % | 50 | % | 71 | % | ||||||||||||
Net assets, end of period (000s omitted) | $3,172 | $2,948 | $17,606 | $16,321 | $9,343 | $1,483 | ||||||||||||||||||
| 1 | Calculated based upon average shares outstanding |
| 2 | Returns for periods of less than one year are not annualized. |
The accompanying notes are an integral part of these financial statements.
20 | Wells Fargo Large Company Value Fund
Table of Contents
Notes to financial statements (unaudited)
1. ORGANIZATION
Wells Fargo Funds Trust (the “Trust”), a Delaware statutory trust organized on March 10, 1999, is an open-end management investment company registered under the Investment Company Act of 1940, as amended (the “1940 Act”). As an investment company, the Trust follows the accounting and reporting guidance in Financial Accounting Standards Board (“FASB”) Accounting Standards Codification Topic 946, Financial Services – Investment Companies. These financial statements report on the Wells Fargo Large Company Value Fund (the “Fund”) which is a diversified series of the Trust.
2. SIGNIFICANT ACCOUNTING POLICIES
The following significant accounting policies, which are consistently followed in the preparation of the financial statements of the Fund, are in conformity with U.S. generally accepted accounting principles which require management to make estimates and assumptions that affect the reported amounts of assets and liabilities, disclosure of contingent assets and liabilities at the date of the financial statements, and the reported amounts of revenues and expenses during the reporting period. Actual results could differ from those estimates.
Securities valuation
All investments are valued each business day as of the close of regular trading on the New York Stock Exchange (generally 4 p.m. Eastern Time), although the Fund may deviate from this calculation time under unusual or unexpected circumstances.
Equity securities and futures that are listed on a foreign or domestic exchange or market are valued at the official closing price or, if none, the last sales price. If no sale occurs on the principal exchange or market that day, a fair value price will be determined in accordance with the Fund’s Valuation Procedures.
Investments in registered open-end investment companies are valued at net asset value. Interests in non-registered investment companies that are redeemable at net asset value are fair valued normally at net asset value.
Investments which are not valued using any of the methods discussed above are valued at their fair value, as determined in good faith by the Board of Trustees of the Fund. The Board of Trustees has established a Valuation Committee comprised of the Trustees and has delegated to it the authority to take any actions regarding the valuation of portfolio securities that the Valuation Committee deems necessary or appropriate, including determining the fair value of portfolio securities, unless the determination has been delegated to the Wells Fargo Asset Management Pricing Committee at Wells Fargo Funds Management, LLC (“Funds Management”). The Board of Trustees retains the authority to make or ratify any valuation decisions or approve any changes to the Valuation Procedures as it deems appropriate. On a quarterly basis, the Board of Trustees receives reports on any valuation actions taken by the Valuation Committee or the Wells Fargo Asset Management Pricing Committee which may include items for ratification.
Securities lending
The Fund may lend its securities from time to time in order to earn additional income in the form of fees or interest on securities received as collateral or the investment of any cash received as collateral. When securities are on loan, the Fund receives interest or dividends on those securities. Cash collateral received in connection with its securities lending transactions is invested in Securities Lending Cash Investments, LLC (the “Securities Lending Fund”). Investments in Securities Lending Fund are valued at the evaluated bid price provided by an independent pricing service. Income earned from investment in the Securities Lending Fund (net of fees and rebates), if any, is included in income from affiliated securities on the Statement of Operations.
In a securities lending transaction, the net asset value of the Fund is affected by an increase or decrease in the value of the securities loaned and by an increase or decrease in the value of the instrument in which collateral is invested. The amount of securities lending activity undertaken by the Fund fluctuates from time to time. The Fund has the right under the lending agreement to recover the securities from the borrower on demand. In the event of default or bankruptcy by the borrower, the Fund may be prevented from recovering the loaned securities or gaining access to the collateral or may experience delays or costs in doing so. In such an event, the terms of the agreement allows the unaffiliated securities lending agent to use the collateral to purchase replacement securities on behalf of the Fund or pay the Fund the market value of the loaned securities. The Fund bears the risk of loss with respect to depreciation of its investment of the cash collateral.
Foreign currency translation
The accounting records of the Fund are maintained in U.S. dollars. The values of other assets and liabilities denominated in foreign currencies are translated into U.S. dollars at rates provided by an independent foreign currency pricing source at a time each business day specified by the Wells Fargo Asset Management Pricing Committee. Purchases and sales of securities, and income and expenses are converted at the rate of exchange on the respective dates of such transactions. Net realized foreign exchange gains or losses arise from sales of foreign currencies, currency gains or losses realized between the trade and settlement dates on
Wells Fargo Large Company Value Fund | 21
Table of Contents
Notes to financial statements (unaudited)
securities transactions, and the difference between the amounts of dividends, interest and foreign withholding taxes recorded and the U.S. dollar equivalent of the amounts actually paid or received. Net unrealized foreign exchange gains and losses arise from changes in the fair value of assets and liabilities other than investments in securities resulting from changes in exchange rates. The changes in net assets arising from changes in exchange rates of securities and the changes in net assets resulting from changes in market prices of securities are not separately presented. Such changes are included in net realized and unrealized gains or losses from investments.
Futures contracts
Futures contracts are agreements between the Fund and a counterparty to buy or sell a specific amount of a commodity, financial instrument or currency at a specified price and on a specified date. The Fund may buy and sell futures contracts in order to gain exposure to, or protect against, changes in security values and is subject to equity price risk. The primary risks associated with the use of futures contracts are the imperfect correlation between changes in market values of securities held by the Fund and the prices of futures contracts, and the possibility of an illiquid market. Futures contracts are generally entered into on a regulated futures exchange and cleared through a clearinghouse associated with the exchange. With futures contracts, there is minimal counterparty risk to the Fund since futures contracts are exchange traded and the exchange’s clearinghouse, as the counterparty to all exchange traded futures, guarantees the futures contracts against default.
Upon entering into a futures contracts, the Fund is required to deposit either cash or securities (initial margin) with the broker in an amount equal to a certain percentage of the contract value. Subsequent payments (variation margin) are paid to or from the broker each day equal to the daily changes in the contract value. Such payments are recorded as unrealized gains or losses and, if any, shown as variation margin receivable (payable) in the Statement of Assets and Liabilities. Should the Fund fail to make requested variation margin payments, the broker can gain access to the initial margin to satisfy the Fund’s payment obligations. When the contracts are closed, a realized gain or loss is recorded in the Statement of Operations.
Security transactions and income recognition
Securities transactions are recorded on a trade date basis. Realized gains or losses are recorded on the basis of identified cost.
Dividend income is recognized on the ex-dividend date.
Distributions to shareholders
Distributions to shareholders from net investment income and any net realized gains are recorded on the ex-dividend date and paid at least annually. Such distributions are determined in accordance with income tax regulations and may differ from U.S. generally accepted accounting principles. Dividend sources are estimated at the time of declaration. The tax character of distributions is determined as of the Fund’s fiscal year end. Therefore, a portion of the Fund’s distributions made prior to the Fund’s fiscal year end may be categorized as a tax return of capital at year end.
Federal and other taxes
The Fund intends to continue to qualify as a regulated investment company by distributing substantially all of its investment company taxable income and any net realized capital gains (after reduction for capital loss carryforwards) sufficient to relieve it from all, or substantially all, federal income taxes. Accordingly, no provision for federal income taxes was required.
The Fund’s income and federal excise tax returns and all financial records supporting those returns for the prior three fiscal years are subject to examination by the federal and Delaware revenue authorities. Management has analyzed the Fund’s tax positions taken on federal, state, and foreign tax returns for all open tax years and does not believe that there are any uncertain tax positions that require recognition of a tax liability.
As of January 31, 2020, the aggregate cost of all investments for federal income tax purposes was $191,721,843 and the unrealized gains (losses) consisted of:
Gross unrealized gains | $ | 22,740,265 | ||
Gross unrealized losses | (2,319,086 | ) | ||
Net unrealized gains | $ | 20,421,179 | ||
As of July 31, 2019, the Fund had current year net deferred post-October capital losses consisting of $2,430,946 in short-term losses which were recognized on the first day of the current fiscal year.
22 | Wells Fargo Large Company Value Fund
Table of Contents
Notes to financial statements (unaudited)
Class allocations
The separate classes of shares offered by the Fund differ principally in applicable sales charges, distribution, shareholder servicing, and administration fees. Class specific expenses are charged directly to that share class. Investment income, common fund-level expenses, and realized and unrealized gains (losses) on investments are allocated daily to each class of shares based on the relative proportion of net assets of each class.
3. FAIR VALUATION MEASUREMENTS
Fair value measurements of investments are determined within a framework that has established a fair value hierarchy based upon the various data inputs utilized in determining the value of the Fund’s investments. The three-level hierarchy gives the highest priority to unadjusted quoted prices in active markets for identical assets or liabilities (Level 1) and the lowest priority to unobservable inputs (Level 3). The Fund’s investments are classified within the fair value hierarchy based on the lowest level of input that is significant to the fair value measurement. The inputs are summarized into three broad levels as follows:
| ∎ | Level 1 – quoted prices in active markets for identical securities |
| ∎ | Level 2 – other significant observable inputs (including quoted prices for similar securities, interest rates, prepayment speeds, credit risk, etc.) |
| ∎ | Level 3 – significant unobservable inputs (including the Fund’s own assumptions in determining the fair value of investments) |
The inputs or methodologies used for valuing investments in securities are not necessarily an indication of the risk associated with investing in those securities.
The following is a summary of the inputs used in valuing the Fund’s assets and liabilities as of January 31, 2020:
| Quoted prices (Level 1) | Other significant observable inputs (Level 2) | Significant (Level 3) | Total | |||||||||||||
Assets | ||||||||||||||||
Investments in: | ||||||||||||||||
Common stocks | ||||||||||||||||
Communication services | $ | 17,064,298 | $ | 0 | $ | 0 | $ | 17,064,298 | ||||||||
Consumer discretionary | 15,089,186 | 0 | 0 | 15,089,186 | ||||||||||||
Consumer staples | 17,810,210 | 0 | 0 | 17,810,210 | ||||||||||||
Energy | 13,021,680 | 0 | 0 | 13,021,680 | ||||||||||||
Financials | 40,853,273 | 0 | 0 | 40,853,273 | ||||||||||||
Health care | 36,079,286 | 0 | 0 | 36,079,286 | ||||||||||||
Industrials | 18,628,074 | 0 | 0 | 18,628,074 | ||||||||||||
Information technology | 15,867,210 | 0 | 0 | 15,867,210 | ||||||||||||
Materials | 8,688,969 | 0 | 0 | 8,688,969 | ||||||||||||
Real Estate | 15,204,321 | 0 | 0 | 15,204,321 | ||||||||||||
Utilities | 10,813,463 | 0 | 0 | 10,813,463 | ||||||||||||
Short-term investments | ||||||||||||||||
Investment companies | 3,035,628 | 0 | 0 | 3,035,628 | ||||||||||||
Total assets | $ | 212,155,598 | $ | 0 | $ | 0 | $ | 212,155,598 | ||||||||
Liabilities | ||||||||||||||||
Futures contracts | $ | 12,576 | $ | 0 | $ | 0 | $ | 12,576 | ||||||||
Total liabilities | $ | 12,576 | $ | 0 | $ | 0 | $ | 12,576 | ||||||||
Additional sector, industry or geographic detail is included in the Portfolio of Investments.
Futures contracts are reported at their cumulative unrealized gains (losses) at measurement date as reported in the table following the Portfolio of Investments. For futures contracts the current day’s variation margin is reported on the Statement of Assets and Liabilities. All other assets and liabilities are reported at their market value at measurement date.
For the six months ended January 31, 2020, the Fund did not have any transfers into/out of Level 3.
Wells Fargo Large Company Value Fund | 23
Table of Contents
Notes to financial statements (unaudited)
4. TRANSACTIONS WITH AFFILIATES
Management fee
Funds Management, an indirect wholly owned subsidiary of Wells Fargo & Company (“Wells Fargo”), is the manager of the Fund and provides advisory and fund-level administrative services under an investment management agreement. Under the investment management agreement, Funds Management is responsible for, among other services, implementing the investment objectives and strategies of the Fund, supervising the subadviser and providing fund-level administrative services in connection with the Fund’s operations. As compensation for its services under the investment management agreement, Funds Management is entitled to receive a management fee at the following annual rate based on the Fund’s average daily net assets:
| Average daily net assets | Management fee | |||
First $1 billion | 0.400 | % | ||
Next $4 billion | 0.375 | |||
Next $5 billion | 0.340 | |||
Over $10 billion | 0.330 | |||
For the six months ended January 31, 2020, the management fee was equivalent to an annual rate of 0.40% of the Fund’s average daily net assets.
Funds Management has retained the services of a subadviser to provide daily portfolio management to the Fund. The fee for subadvisory services is borne by Funds Management. Wells Capital Management Incorporated (“WellsCap”), an affiliate of Funds Management and an indirect wholly owned subsidiary of Wells Fargo, is the subadviser to the Fund and is entitled to receive a fee from Funds Management at an annual rate starting at 0.25% and declining to 0.15% as the average daily net assets of the Fund increase.
Administration fees
Under a class-level administration agreement, Funds Management provides class-level administrative services to the Fund, which includes paying fees and expenses for services provided by the transfer agent, sub-transfer agents, omnibus account servicers and record-keepers. As compensation for its services under the class-level administration agreement, Funds Management receives an annual fee which is calculated based on the average daily net assets of each class as follows:
| Class-level administration fee | ||||
Class A, Class C | 0.21 | % | ||
Class R6 | 0.03 | |||
Administrator Class, Institutional Class | 0.13 | |||
Waivers and/or expense reimbursements
Funds Management has contractually waived and/or reimbursed management and administration fees to the extent necessary to maintain certain net operating expense ratios for the Fund. When each class of the Fund has exceeded its expense cap, Funds Management has waived fees and/or reimbursed expenses from fund-level expenses on a proportionate basis and then from class specific expenses. When only certain classes exceed their expense caps, waivers and/or reimbursements are applied against class specific expenses before fund-level expenses. Funds Management has committed through November 30, 2020 to waive fees and/or reimburse expenses to the extent necessary to cap the Fund’s expenses at 0.83% for Class A shares, 1.58% for Class C shares, 0.40% for Class R6 shares, 0.75% for Administrator Class shares and 0.50% for Institutional Class shares. Prior to or after the commitment expiration date, the cap may be increased or the commitment to maintain the cap may be terminated only with the approval of the Board of Trustees.
Distribution fee
The Trust has adopted a distribution plan for Class C shares of the Fund pursuant to Rule 12b-1 under the 1940 Act. A distribution fee is charged to Class C shares and paid to Wells Fargo Funds Distributor, LLC (“Funds Distributor”), the principal underwriter, at an annual rate of 0.75% of the average daily net assets of Class C shares.
In addition, Funds Distributor is entitled to receive the front-end sales charge from the purchase of Class A shares and a contingent deferred sales charge on the redemption of certain Class A shares. Funds Distributor is also entitled to receive the contingent
24 | Wells Fargo Large Company Value Fund
Table of Contents
Notes to financial statements (unaudited)
deferred sales charges from redemptions of Class C shares. For the six months ended January 31, 2020, Funds Distributor received $635 from the sale of Class A shares. No contingent deferred sales charges were incurred by Class A and Class C shares for the six months ended January 31, 2020.
Shareholder servicing fees
The Trust has entered into contracts with one or more shareholder servicing agents, whereby Class A, Class C, and Administrator Class of the Fund are charged a fee at an annual rate of 0.25% of the average daily net assets of each respective class. A portion of these total shareholder servicing fees were paid to affiliates of Wells Fargo.
Interfund transactions
The Fund may purchase or sell portfolio investment securities to certain other Wells Fargo affiliates pursuant to Rule 17a-7 under the 1940 Act and under procedures adopted by the Board of Trustees. The procedures have been designed to ensure that these interfund transactions, which do not incur broker commissions, are effected at current market prices.
5. INVESTMENT PORTFOLIO TRANSACTIONS
Purchases and sales of investments, excluding U.S. government obligations (if any) and short-term securities, for the six months ended January 31, 2020 were $257,183,077 and $268,555,231, respectively.
6. SECURITIES LENDING TRANSACTIONS
The Fund lends its securities through an unaffiliated securities lending agent and receives collateral in the form of cash or securities with a value at least equal to the value of the securities on loan. The value of the loaned securities is determined at the close of each business day and any increases or decreases in the required collateral are exchanged between the Fund and the counterparty on the next business day. Cash collateral received is invested in the Securities Lending Fund which seeks to provide a positive return compared to the daily Fed Funds Open Rate by investing in high-quality, U.S. dollar-denominated short-term money market instruments and is exempt from registration under Section 3(c)(7) of the 1940 Act. Securities Lending Fund is managed by Funds Management and is subadvised by WellsCap. Funds Management receives an advisory fee starting at 0.05% and declining to 0.01% as the average daily net assets of the Securities Lending Fund increase. All of the fees received by Funds Management are paid to WellsCap for its services as subadviser.
In the event of counterparty default or the failure of a borrower to return a loaned security, the Fund has the right to use the collateral to offset any losses incurred. As of January 31, 2020, the Fund did not have any securities on loan.
7. DERIVATIVE TRANSACTIONS
During the six months ended January 31, 2020, the Fund entered into futures contracts to gain market exposure. The Fund had an average notional amount of $3,863,925 in long futures contracts during the six months ended January 31, 2020.
The fair value, realized gains or losses and change in unrealized gains or losses, if any, on derivative instruments are reflected in the corresponding financial statement captions.
8. BANK BORROWINGS
The Trust (excluding the money market funds), Wells Fargo Master Trust and Wells Fargo Variable Trust are parties to a $280,000,000 revolving credit agreement whereby the Fund is permitted to use bank borrowings for temporary or emergency purposes, such as to fund shareholder redemption requests. Interest under the credit agreement is charged to the Fund based on a borrowing rate equal to the higher of the Federal Funds rate in effect on that day plus 1.25% or the overnight LIBOR rate in effect on that day plus 1.25%. In addition, an annual commitment fee equal to 0.25% of the unused balance is allocated to each participating fund.
For the six months ended January 31, 2020, there were no borrowings by the Fund under the agreement.
9. INDEMNIFICATION
Under the Trust’s organizational documents, the officers and Trustees have been granted certain indemnification rights against certain liabilities that may arise out of performance of their duties to the Trust. Additionally, in the normal course of business, the Trust may enter into contracts with service providers that contain a variety of indemnification clauses. The Trust’s maximum exposure under these arrangements is dependent on future claims that may be made against the Fund and, therefore, cannot be estimated.
Wells Fargo Large Company Value Fund | 25
Table of Contents
Notes to financial statements (unaudited)
10. NEW ACCOUNTING PRONOUNCEMENT
In August 2018, FASB issued Accounting Standards Update (“ASU”) No. 2018-13, Fair Value Measurement (Topic 820)Disclosure Framework—Changes to the Disclosure Requirements for Fair Value Measurement. ASU 2018-13 updates the disclosure requirements for fair value measurements by modifying or removing certain disclosures and adding certain new disclosures. The amendments are effective for fiscal years, and interim periods within those fiscal years, beginning after December 15, 2019. Early adoption is permitted. Management has adopted the removal and modification of disclosures early, as permitted, and will adopt the additional new disclosures at the effective date.
11. SUBSEQUENT EVENT
On March 11, 2020, the World Health Organization announced that it had made the assessment that coronavirus disease 2019 (“COVID-19”) is a pandemic. The impacts of COVID-19 is adversely affecting the entire global economy, individual companies and investment products, and the market in general. There is significant uncertainty around the extent and duration of business disruptions related to COVID-19 and the impact may be short term or may last for an extended period of time. The risk of further spreading of COVID-19 has led to significant uncertainty and volatility in the financial markets and the value of the Fund and the securities in which the Fund invests may be adversely affected by impacts caused by COVID-19.
26 | Wells Fargo Large Company Value Fund
Table of Contents
PROXY VOTING INFORMATION
A description of the policies and procedures used to determine how to vote proxies relating to portfolio securities is available, upon request, by calling1-800-222-8222, visiting our website atwfam.com, or visiting the SEC website at sec.gov. Information regarding how the proxies related to portfolio securities were voted during the most recent 12-month period ended June 30 is available on the website atwfam.comor by visiting the SEC website at sec.gov.
QUARTERLY PORTFOLIO HOLDINGS INFORMATION
The Fund files its complete schedule of portfolio holdings with the SEC for the first and third quarters of each fiscal year as an exhibit to its reports on Form N-PORT. Shareholders may view the filed Form N-PORT by visiting the SEC website at sec.gov.
Wells Fargo Large Company Value Fund | 27
Table of Contents
Other information (unaudited)
BOARD OF TRUSTEES AND OFFICERS
Each of the Trustees and Officers1 listed in the table below acts in identical capacities for each fund in the Wells Fargo family of funds, which consists of 149 mutual funds comprising the Wells Fargo Funds Trust, Wells Fargo Variable Trust, Wells Fargo Master Trust and four closed-end funds (collectively the “Fund Complex”). This table should be read in conjunction with the Prospectus and the Statement of Additional Information2. The mailing address of each Trustee and Officer is 525 Market Street, 12th Floor, San Francisco, CA 94105. Each Trustee and Officer serves an indefinite term, however, each Trustee serves such term until reaching the mandatory retirement age established by the Trustees.
Independent Trustees
Name and year of birth | Position held and length of service* | Principal occupations during past five years or longer | Current other public company or directorships | |||
William R. Ebsworth (Born 1957) | Trustee, since 2015 | Retired. From 1984 to 2013, equities analyst, portfolio manager, research director and chief investment officer at Fidelity Management and Research Company in Boston, Tokyo, and Hong Kong, and retired in 2013 as Chief Investment Officer of Fidelity Strategic Advisers, Inc. where he led a team of investment professionals managing client assets. Prior thereto, Board member of Hong Kong Securities Clearing Co., Hong Kong Options Clearing Corp., the Thailand International Fund, Ltd., Fidelity Investments Life Insurance Company, and Empire Fidelity Investments Life Insurance Company. Audit Committee Chair and Investment Committee Chair of the Vincent Memorial Hospital Endowment (non-profit organization). Mr. Ebsworth is a CFA® charterholder. | N/A | |||
Jane A. Freeman (Born 1953) | Trustee, since 2015; Chair Liaison, since 2018 | Retired. From 2012 to 2014 and 1999 to 2008, Chief Financial Officer of Scientific Learning Corporation. From 2008 to 2012, Ms. Freeman provided consulting services related to strategic business projects. Prior to 1999, Portfolio Manager at Rockefeller & Co. and Scudder, Stevens & Clark. Board member of the Harding Loevner Funds from 1996 to 2014, serving as both Lead Independent Director and chair of the Audit Committee. Board member of the Russell Exchange Traded Funds Trust from 2011 to 2012 and the chair of the Audit Committee. Ms. Freeman is a Board Member of The Ruth Bancroft Garden (non-profit organization). She is also an inactive Chartered Financial Analyst. | N/A | |||
Isaiah Harris, Jr. (Born 1952) | Trustee, since 2009; Audit Committee Chairman, since 2019 | Retired. Chairman of the Board of CIGNA Corporation since 2009, and Director since 2005. From 2003 to 2011, Director of Deluxe Corporation. Prior thereto, President and CEO of BellSouth Advertising and Publishing Corp. from 2005 to 2007, President and CEO of BellSouth Enterprises from 2004 to 2005 and President of BellSouth Consumer Services from 2000 to 2003. Emeritus member of the Iowa State University Foundation Board of Governors. Emeritus Member of the Advisory Board of Iowa State University School of Business. Advisory Board Member, Palm Harbor Academy (private school). Advisory Board Member, Child Evangelism Fellowship (non-profit). Mr. Harris is a certified public accountant (inactive status). | CIGNA Corporation | |||
| Judith M. Johnson (Born 1949) | Trustee, since 2008; Audit Committee Chairman, from 2009 to 2018 | Retired. Prior thereto, Chief Executive Officer and Chief Investment Officer of Minneapolis Employees Retirement Fund from 1996 to 2008. Ms. Johnson is an attorney, certified public accountant and a certified managerial accountant. | N/A | |||
28 | Wells Fargo Large Company Value Fund
Table of Contents
Other information (unaudited)
Name and year of birth | Position held and length of service* | Principal occupations during past five years or longer | Current other public company or directorships | |||
David F. Larcker (Born 1950) | Trustee, since 2009 | James Irvin Miller Professor of Accounting at the Graduate School of Business, Stanford University, Director of the Corporate Governance Research Initiative and Senior Faculty of The Rock Center for Corporate Governance since 2006. From 2005 to 2008, Professor of Accounting at the Graduate School of Business, Stanford University. Prior thereto, Ernst & Young Professor of Accounting at The Wharton School, University of Pennsylvania from 1985 to 2005. | N/A | |||
Olivia S. Mitchell (Born 1953) | Trustee, since 2006; Nominating and Governance Committee Chair, since 2018 | International Foundation of Employee Benefit Plans Professor, Wharton School of the University of Pennsylvania since 1993. Director of Wharton’s Pension Research Council and Boettner Center on Pensions & Retirement Research, and Research Associate at the National Bureau of Economic Research. Previously, Cornell University Professor from 1978 to 1993. | N/A | |||
Timothy J. Penny (Born 1951) | Trustee, since 1996; Chairman, since 2018 | President and Chief Executive Officer of Southern Minnesota Initiative Foundation, a non-profit organization, since 2007. Member of the Board of Trustees of NorthStar Education Finance, Inc., a non-profit organization, since 2007. | N/A | |||
James G. Polisson (Born 1959) | Trustee, since 2018 | Retired. Chief Marketing Officer, Source (ETF) UK Services, Ltd, from 2015 to 2017. From 2012 to 2015, Principal of The Polisson Group, LLC, a management consulting, corporate advisory and principal investing company. Chief Executive Officer and Managing Director at Russell Investments, Global Exchange Traded Funds from 2010 to 2012. Managing Director of Barclays Global Investors from 1998 to 2010 and Global Chief Marketing Officer for iShares and Barclays Global Investors from 2000 to 2010. Trustee of the San Francisco Mechanics’ Institute, a non-profit organization, from 2013 to 2015. Board member of the Russell Exchange Traded Fund Trust from 2011 to 2012. Director of Barclays Global Investors Holdings Deutschland GmbH from 2006 to 2009. Mr. Polisson is an attorney and has a retired status with the Massachusetts and District of Columbia Bar Associations. | N/A | |||
Pamela Wheelock3 (Born 1959) | Trustee, since January 2020; previously Trustee from January 2018 to July 2019 | Board member of the Destination Medical Center Economic Development Agency, Rochester, Minnesota since 2019. Acting Commissioner, Minnesota Department of Human Services, July 2019 through September 2019. Human Services Manager (part-time), Minnesota Department of Human Services, October 2019 through December 2019. Chief Operating Officer, Twin Cities Habitat for Humanity from 2017 to 2019. Vice President of University Services, University of Minnesota from 2012 to 2016. Prior thereto, on the Board of Directors, Governance Committee and Finance Committee for the Minnesota Philanthropy Partners (Saint Paul Foundation) from 2012 to 2018, Interim Chief Executive Officer of Blue Cross Blue Shield of Minnesota from 2011 to 2012, Chairman of the Board from 2009 to 2012 and Board Director from 2003 to 2015. Vice President, Leadership and Community Engagement, Bush Foundation, Saint Paul, Minnesota (a private foundation) from 2009 to 2011. Executive Vice President and Chief Financial Officer, Minnesota Sports and Entertainment from 2004 to 2009 and Senior Vice President from 2002 to 2004. Executive Vice President of the Minnesota Wild Foundation from 2004 to 2008. Commissioner of Finance, State of Minnesota, from 1999 to 2002. Currently Board Chair of the Minnesota Wild Foundation since 2010. | N/A | |||
| * | Length of service dates reflect the Trustee’s commencement of service with the Trust’s predecessor entities, where applicable. |
Wells Fargo Large Company Value Fund | 29
Table of Contents
Other information (unaudited)
Officers
Name and year of birth | Position held and length of service | Principal occupations during past five years or longer | ||
Andrew Owen (Born 1960) | President, since 2017 | Executive Vice President of Wells Fargo & Company and Head of Affiliated Managers, Wells Fargo Asset Management, since 2014. In addition, Mr. Owen is currently President, Chief Executive Officer and Director of Wells Fargo Funds Management, LLC since 2017. Prior thereto, Executive Vice President responsible for marketing, investments and product development for Wells Fargo Funds Management, LLC, from 2009 to 2014. | ||
Jeremy DePalma1 (Born 1974) | Treasurer, since 2012 | Senior Vice President of Wells Fargo Funds Management, LLC since 2009. Senior Vice President of Evergreen Investment Management Company, LLC from 2008 to 2010 and head of the Fund Reporting and Control Team within Fund Administration from 2005 to 2010. | ||
Michelle Rhee (Born 1966) | Chief Legal Officer, since 2019 | Secretary of Wells Fargo Funds Management, LLC, Chief Legal Counsel of Wells Fargo Asset Management and Assistant General Counsel of Wells Fargo Bank, N.A. since 2018. Associate General Counsel and Managing Director of Bank of America Corporation from 2004 to 2018. | ||
Catherine Kennedy (Born 1969) | Secretary, since 2019 | Vice President of Wells Fargo Funds Management, LLC and Senior Counsel of the Wells Fargo Legal Department since 2010. Vice President and Senior Counsel of Evergreen Investment Management Company, LLC from 1998 to 2010. | ||
Michael H. Whitaker (Born 1967) | Chief Compliance Officer, since 2016 | Chief Compliance Officer of Wells Fargo Asset Management since 2016. Senior Vice President and Chief Compliance Officer for Fidelity Investments from 2007 to 2016. | ||
David Berardi (Born 1975) | Assistant Treasurer, since 2009 | Vice President of Wells Fargo Funds Management, LLC since 2009. Vice President of Evergreen Investment Management Company, LLC from 2008 to 2010. Manager of Fund Reporting and Control for Evergreen Investment Management Company, LLC from 2004 to 2010. | ||
| 1 | Jeremy DePalma acts as Treasurer of 85 funds and Assistant Treasurer of 64 funds in the Fund Complex. |
| 2 | The Statement of Additional Information includes additional information about the Trustees and is available, without charge, upon request, by calling 1-800-222-8222 or by visiting the website atwfam.com. |
| 3 | Pamela Wheelock was re-appointed to the Board effective January 1, 2020. |
30 | Wells Fargo Large Company Value Fund
Table of Contents
Effective on or about May 1, 2020, if you purchase Fund shares through a Janney Montgomery Scott LLC (“Janney”) brokerage account, you will be eligible for the following load waivers (front-end sales charge waivers and contingent deferred sales charge (“CDSC”), or back-end sales charge, waivers) and discounts, which may differ from those disclosed elsewhere in the Fund’s Prospectus or SAI.
| Front-end sales charge* waivers on Class A shares available at Janney |
| Shares purchased through reinvestment of capital gains distributions and dividend reinvestment when purchasing shares of the same fund (but not any other fund within the fund family). |
| Shares purchased by employees and registered representatives of Janney or its affiliates and their family members as designated by Janney. |
| Shares purchased from the proceeds of redemptions within the same fund family, provided (1) the repurchase occurs within ninety (90) days following the redemption, (2) the redemption and purchase occur in the same account, and (3) redeemed shares were subject to a front-end or deferred sales load (i.e., right of reinstatement). |
| Employer-sponsored retirement plans (e.g., 401(k) plans, 457 plans, employer-sponsored 403(b) plans, profit sharing and money purchase pension plans and defined benefit plans). For purposes of this provision, employer-sponsored retirement plans do not include SEP IRAs, Simple IRAs, SAR-SEPs or Keogh plans. |
| Shares acquired through a right of reinstatement. |
| Class C shares that are no longer subject to a contingent deferred sales charge and are converted to Class A shares of the same fund pursuant to Janney’s policies and procedures. |
| CDSC waivers on Class A and Class C shares available at Janney |
| Shares sold upon the death or disability of the shareholder. |
| Shares sold as part of a systematic withdrawal plan as described in the Fund’s Prospectus. |
| Shares purchased in connection with a return of excess contributions from an IRA account. |
| Shares sold as part of a required minimum distribution for IRA and retirement accounts if the redemption is taken in or after the year the shareholder reaches qualified age based on applicable IRS regulations. |
| Shares sold to pay Janney fees but only if the transaction is initiated by Janney. |
| Shares acquired through a right of reinstatement. |
| Shares exchanged into the same share class of a different fund. |
| Front-end sales charge* discounts available at Janney; breakpoints, rights of accumulation and/or letters of intent |
| Breakpoints as described in the Fund’s Prospectus. |
| Rights of accumulation (“ROA”), which entitle shareholders to breakpoint discounts, will be automatically calculated based on the aggregated holding of fund family assets held by accounts within the purchaser’s household at Janney. Eligible fund family assets not held at Janney may be included in the ROA calculation only if the shareholder notifies his or her financial advisor about such assets. |
| Letters of intent which allow for breakpoint discounts based on anticipated purchases within a fund family, over a 13-month time period. Eligible fund family assets not held at Janney Montgomery Scott may be included in the calculation of letters of intent only if the shareholder notifies his or her financial advisor about such assets. |
| * | Also referred to as an “initial sales charge.” |
Wells Fargo Large Company Value Fund | 31
Table of Contents
This page is intentionally left blank.
Table of Contents
This page is intentionally left blank.
Table of Contents
This page is intentionally left blank.
Table of Contents
For more information
More information about Wells Fargo Funds is available free upon request. To obtain literature, please write, visit the Fund’s website, or call:
Wells Fargo Funds
P.O. Box 219967
Kansas City, MO 64121-9967
Website:wfam.com
Individual investors:1-800-222-8222
Retail investment professionals:1-888-877-9275
Institutional investment professionals:1-866-765-0778

This report and the financial statements contained herein are submitted for the general information of the shareholders of the Fund. If this report is used for promotional purposes, distribution of the report must be accompanied or preceded by a current prospectus. Before investing, please consider the investment objectives, risks, charges, and expenses of the investment. For a current prospectus and, if available, a summary prospectus, containing this information, call1-800-222-8222 or visit the Fund’s website atwfam.com. Read the prospectus carefully before you invest or send money.
Wells Fargo Asset Management (WFAM) is the trade name for certain investment advisory/management firms owned by Wells Fargo & Company. These firms include but are not limited to Wells Capital Management Incorporated and Wells Fargo Funds Management, LLC. Certain products managed by WFAM entities are distributed by Wells Fargo Funds Distributor, LLC (a broker-dealer and Member FINRA).
This material is for general informational and educational purposes only and is NOT intended to provide investment advice or a recommendation of any kind—including a recommendation for any specific investment, strategy, or plan.
INVESTMENT PRODUCTS: NOT FDIC INSURED ◾ NO BANK GUARANTEE ◾ MAY LOSE VALUE
© 2020 Wells Fargo & Company. All rights reserved
PAR-0020-03837 03-20
SA210/SAR210 01-20
Table of Contents

Semi-Annual Report
January 31, 2020
Wells Fargo
Low Volatility U.S. Equity Fund
Beginning on January 1, 2021, as permitted by new regulations adopted by the Securities and Exchange Commission, paper copies of the Wells Fargo Funds’ annual and semi-annual shareholder reports issued after this date will no longer be sent by mail, unless you specifically request paper copies of the reports. Instead, the reports will be made available on the Funds’ website, and you will be notified by mail each time a report is posted and provided with a website address to access the report.
If you already elected to receive shareholder reports electronically, you will not be affected by this change and you need not take any action. You may elect to receive shareholder reports and other communications from the Fund electronically at any time by contacting your financial intermediary (such as a broker-dealer or bank) or, if you are a direct investor, by calling1-800-222-8222 or by enrolling at wellsfargo.com/advantagedelivery.
You may elect to receive all future reports in paper free of charge. If you invest through a financial intermediary, you can contact your financial intermediary to request that you continue to receive paper copies of your shareholder reports; if you invest directly with the Fund, you can call 1-800-222-8222. Your election to receive reports in paper will apply to all Wells Fargo Funds held in your account with your financial intermediary or, if you are a direct investor, to all Wells Fargo Funds that you hold.
Table of Contents
|
Reduce clutter. Save trees. |
Sign up for electronic delivery of prospectuses and shareholder reports atwellsfargo.com/advantagedelivery |
The views expressed and any forward-looking statements are as of January 31, 2020, unless otherwise noted, and are those of the Fund managers and/or Wells Fargo Asset Management. Discussions of individual securities, or the markets generally, or any Wells Fargo Fund are not intended as individual recommendations. Future events or results may vary significantly from those expressed in any forward-looking statements. The views expressed are subject to change at any time in response to changing circumstances in the market. Wells Fargo Asset Management and the Fund disclaim any obligation to publicly update or revise any views expressed or forward-looking statements.
INVESTMENT PRODUCTS: NOT FDIC INSURED ◾ NO BANK GUARANTEE ◾ MAY LOSE VALUE
Wells Fargo Low Volatility U.S. Equity Fund | 1
Table of Contents
Letter to shareholders (unaudited)

Andrew Owen
President
Wells Fargo Funds
“As the period began, U.S.-China trade tensions continued with no signs of compromise.”
Dear Shareholder:
We are pleased to offer you this semi-annual report for the Wells Fargo Low Volatility U.S. Equity Fund for thesix-month period that ended January 31, 2020. Despite some market volatility, the period was strongly positive for financial markets as supportive central banks more than offset concerns over slowing global economic growth and international trade tensions.
Overall, both fixed-income and equity investors enjoyed healthy annual returns, with U.S. markets leading the way. For the period, U.S. stocks, based on the S&P 500 Index,1 gained 9.31% and international stocks, as measured by the MSCI ACWI ex USA Index (Net),2 returned 5.37%. The MSCI EM Index (Net)3 gained a more modest 3.36%. For bond investors, the Bloomberg Barclays U.S. Aggregate Bond Index4 added 4.20%, the Bloomberg Barclays Global Aggregateex-USD Index5 returned 1.58%, the Bloomberg Barclays Municipal Bond Index6 gained 3.33%, and the ICE BofA U.S. High Yield Index7 added 3.34%.
The period began with uncertainty, leading to central bank support.
In August as the period began, U.S.-China trade tensions continued with no signs of compromise. Evidence of a continued global economic slowdown mounted, and central banks in China, New Zealand, and Thailand cut interest rates. Industrial and manufacturing data declined in China, Canada, Japan, and Germany. Adding to global uncertainty, Italy’s prime minister resigned, many feared a crackdown in Hong Kong as protestors sustained their calls for reform, and Boris Johnson planned to suspend Parliament as Brexit’s deadline neared.
In the U.S., the Federal Reserve (Fed) cut interest rates a second time in the third quarter in September. U.S. manufacturing data disappointed investors. The U.S. Congress announced it would pursue an impeachment investigation of President Trump. Meanwhile, the Brexit impasse showed no signs of resolution. Officials in China said that hitting the country’s economic growth goals for the year would be difficult considering the weight of tariffs and trade restrictions. Although the S&P 500 Index finished the third quarter with the bestyear-to-date returns in more than 20 years, concerns about future returns remained.
The fourth quarter started on a strong note, with U.S.-China trade tensions relaxing in October along with renewed optimism for a U.K. Brexit deal and positive macroeconomic data. The initial estimate of U.S. third-quarter gross domestic product growth was a resilient 1.9% annualized rate, while the U.S. unemployment rate fell to a50-year low of 3.5% in September. However, despite resilience among U.S. consumers, business confidence declined while manufacturing activity contracted. Concerned with a potential economic slowdown, the Fed lowered interest rates another quarter point in late
| 1 | The S&P 500 Index consists of 500 stocks chosen for market size, liquidity, and industry group representation. It is a market-value-weighted index with each stock’s weight in the index proportionate to its market value. You cannot invest directly in an index. |
| 2 | The Morgan Stanley Capital International (MSCI) All Country World Index (ACWI) ex USA Index (Net) is a free-float-adjusted market-capitalization-weighted index that is designed to measure the equity market performance of developed markets, excluding the United States. Source: MSCI. MSCI makes no express or implied warranties or representations and shall have no liability whatsoever with respect to any MSCI data contained herein. The MSCI data may not be further redistributed or used as a basis for other indices or any securities or financial products. This report is not approved, reviewed, or produced by MSCI. You cannot invest directly in an index. |
| 3 | The MSCI Emerging Markets (EM) Index (Net) is a free-float-adjusted market-capitalization-weighted index that is designed to measure equity market performance of emerging markets. You cannot invest directly in an index. |
| 4 | The Bloomberg Barclays U.S. Aggregate Bond Index is a broad-based benchmark that measures the investment-grade, U.S. dollar-denominated, fixed-rate taxable bond market, including Treasuries, government-related and corporate securities, mortgage-backed securities (agency fixed-rate and hybrid adjustable-rate mortgage pass-throughs), asset-backed securities, and commercial mortgage-backed securities. You cannot invest directly in an index. |
| 5 | The Bloomberg Barclays Global Aggregateex-USD Index is an unmanaged index that provides a broad-based measure of the global investment-grade fixed-income markets excluding the U.S. dollar-denominated debt market. You cannot invest directly in an index. |
| 6 | The Bloomberg Barclays Municipal Bond Index is an unmanaged index composed of long-termtax-exempt bonds with a minimum credit rating of Baa. You cannot invest directly in an index. |
| 7 | The ICE BofA U.S. High Yield Index is a market-capitalization-weighted index of domestic and Yankee high-yield bonds. The index tracks the performance of high-yield securities traded in the U.S. bond market. You cannot invest directly in an index. Copyright 2020. ICE Data Indices, LLC. All rights reserved. |
2 | Wells Fargo Low Volatility U.S. Equity Fund
Table of Contents
Letter to shareholders (unaudited)
October, its third rate cut in four months. This helped push the S&P 500 Index to a newall-time high, while emerging market equities rallied and global bonds declined overall, reflecting a broad pickup in risk appetite.
Equity markets continued to rally in November despite ongoing geopolitical risks. Hopes for a U.S.-China trade deal buoyed investor confidence. U.S. business sentiment improved slightly, and manufacturing and services activity picked up. Throughout the month, central bank actions were on hold. With that positive backdrop, developed market equities outpaced those in emerging markets, and U.S. stocks, as reflected by the S&P 500 Index, outperformednon-U.S. stocks overall. While consumer confidence and purchasing manager activity rose in the eurozone, China reported weakening manufacturing and consumer data. Bond yields rose marginally, leading to slightly negative returns for global government and investment-grade corporate bonds.
Financial markets ended 2019 on a broadly positive note, with the U.S. and China reaching an accord on a Phase One trade deal, with some details to be worked out. That, along with the landslide win by thepro-Brexit U.K. Conservative Party in a national election and ongoing central bank support, gave investors greater certainty and confidence. U.S. economic indicators were generally positive, with the exception of manufacturing activity and business confidence. However, consumer confidence was resilient, fed by a robust labor market, tame inflation, and lower interest rates, which boosted housing affordability and stimulated homebuyer activity. The impeachment of U.S. President Donald Trump, while historically noteworthy, had little impact on markets. Meanwhile, slowing Chinese economic activity, partly attributable to the trade war, led to further government stimulus atyear-end through lower reserve ratios, allowing banks to lend more money.
Theyear-end rally continued in early January 2020. However, capital market volatility picked up in late January on concerns over the unknown impact of the coronavirus on the global economy and stock markets. With sentiment somewhat souring, perceived safe havens did well in January. The U.S. dollar and Japanese yen both rose and government bonds outperformed equities. While the S&P 500 Index held its ground, emerging market equities tumbled, including those in Asia that are most exposed to viruses—physical or economic—originating in China.
Following the end of the reporting period, the coronavirus continued its global spread, resulting in disruptions to global markets, including through border closings, restrictions on travel and large gatherings, expedited and enhanced health screenings, quarantines, cancellations, business and school closings, disruptions to employment and supply chains, reduced productivity, and reduced customer and client activity in multiple markets and sectors. The risk of further spreading of the coronavirus has led to significant uncertainty and volatility in the financial markets. The full extent of the coronavirus’s impact on the global economy cannot necessarily be foreseen and the impacts may be short term or may last for an extended period of time.
Don’t let short-term uncertainty derail long-term investment goals.
Periods of investment uncertainty can present challenges, but experience has taught us that maintaining long-term investment goals can be an effective way to plan for the future. To help you create a sound strategy based on your personal goals and risk tolerance, Wells Fargo Funds offers more than 100 mutual funds spanning a wide range of asset classes and investment styles. Although diversification cannot guarantee an investment profit or prevent losses, we believe it can be an effective way to manage investment risk and potentially smooth out overall portfolio performance. We encourage investors to know their investments and to understand that appropriate levels of risk-taking may unlock opportunities.
Thank you for choosing to invest with Wells Fargo Funds. We appreciate your confidence in us and remain committed to helping you meet your financial needs.
Sincerely,

Andrew Owen
President
Wells Fargo Funds
“Financial markets ended 2019 on a broadly positive note, with the U.S. and China reaching an accord on a Phase One trade deal.”
|
For further information about your Fund, contact your investment professional, visit our website at wfam.com, or call us directly at1-800-222-8222. |
Wells Fargo Low Volatility U.S. Equity Fund | 3
Table of Contents
Performance highlights (unaudited)
Investment objective
The Fund seeks long-term capital appreciation.
Manager
Wells Fargo Funds Management, LLC
Subadviser
Wells Capital Management Incorporated
Portfolio managers
Dennis Bein, CFA®‡
Ryan Brown, CFA®‡
Harindra de Silva, Ph.D., CFA®‡
Average annual total returns (%) as of January 31, 2020
| Including sales charge | Excluding sales charge | Expense ratios1 (%) | ||||||||||||||||||||||||
| Inception date | 1 year | Since inception | 1 year | Since inception | Gross | Net2 | ||||||||||||||||||||
| Class A (WLVLX) | 10-31-2016 | 16.69 | 10.25 | 23.78 | 12.27 | 1.50 | 0.73 | |||||||||||||||||||
| Class C (WLVKX) | 10-31-2016 | 21.81 | 11.44 | 22.81 | 11.44 | 2.25 | 1.48 | |||||||||||||||||||
| Class R6 (WLVJX) | 10-31-2016 | – | – | 24.19 | 12.74 | 1.07 | 0.30 | |||||||||||||||||||
| Administrator Class (WLVDX) | 10-31-2016 | – | – | 23.82 | 12.35 | 1.42 | 0.65 | |||||||||||||||||||
| Institutional Class (WLVOX) | 10-31-2016 | – | – | 24.17 | 12.65 | 1.17 | 0.40 | |||||||||||||||||||
| Russell 1000® Index3 | – | – | – | 21.39 | 15.87 | * | – | – | ||||||||||||||||||
| * | Based on the inception date of the oldest Fund class. |
Figures quoted represent past performance,which is no guarantee of future results, and do not reflect taxes that shareholder may pay on an investment in a fund. Investment return and principal value of an investment will fluctuate so that an investor’s shares, when redeemed, may be worth more or less than their original cost. Performance shown without sales charges would be lower if sales charges were reflected. Current performance may be lower or higher than the performance data quoted, which assumes the reinvestment of dividends and capital gains. Current month-end performance is available on the Fund’s website,wfam.com.
Index returns do not include transaction costs associated with buying and selling securities, any mutual fund fees or expenses, or any taxes. It is not possible to invest directly in an index.
For Class A shares, the maximumfront-end sales charge is 5.75%. For Class C shares, the maximum contingent deferred sales charge is 1.00%. Performance including a contingent deferred sales charge assumes the sales charge for the corresponding time period. Class R6, Administrator Class, and Institutional Class shares are sold without afront-end sales charge or contingent deferred sales charge.
Stock values fluctuate in response to the activities of individual companies and general market and economic conditions. Certain investment strategies tend to increase the total risk of an investment (relative to the broader market). The Fund is exposed to smaller-company securities risk. Consult the Fund’s prospectus for additional information on these and other risks.
Please see footnotes on page 5.
4 | Wells Fargo Low Volatility U.S. Equity Fund
Table of Contents
Performance highlights (unaudited)
| Ten largest holdings (%) as of January 31, 20204 | ||||
American Electric Power Company Incorporated | 2.73 | |||
Republic Services Incorporated | 2.57 | |||
PepsiCo Incorporated | 2.53 | |||
Starwood Property Trust Incorporated | 2.53 | |||
Gaming and Leisure Properties Incorporated | 2.52 | |||
CMS Energy Corporation | 2.47 | |||
Waste Management Incorporated | 2.45 | |||
AptarGroup Incorporated | 2.30 | |||
CME Group Incorporated | 2.28 | |||
Northrop Grumman Corporation | 2.15 | |||
| Sector distribution as of January 31, 20205 |
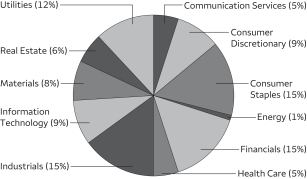 |
| ‡ | CFA® and Chartered Financial Analyst® are trademarks owned by CFA Institute. |
| 1 | Reflects the expense ratios as stated in the most recent prospectuses. The expense ratios shown are subject to change and may differ from the annualized expense ratios shown in the financial highlights of this report. |
| 2 | The manager has contractually committed through November 30, 2020, to waive fees and/or reimburse expenses to the extent necessary to cap total annual fund operating expenses after fee waivers at 0.73% for Class A, 1.48% for Class C, 0.30% for Class R6, 0.65% for Administrator Class, and 0.40% for Institutional Class. Brokerage commissions, stamp duty fees, interest, taxes, acquired fund fees and expenses (if any), and extraordinary expenses are excluded from the expense cap. Prior to or after the commitment expiration date, the cap may be increased or the commitment to maintain the cap may be terminated only with the approval of the Board of Trustees. Without this cap, the Fund’s returns would have been lower. The expense ratio paid by an investor is the net expense ratio (the total annual fund operating expenses after fee waivers) as stated in the prospectuses. |
| 3 | The Russell 1000® Index measures the performance of the 1,000 largest companies in the Russell 3000® Index, which represents approximately 92% of the total market capitalization of the Russell 3000® Index. You cannot invest directly in an index. |
| 4 | The ten largest holdings, excluding cash, cash equivalents and any money market funds, are calculated based on the value of the investments divided by total net assets of the Fund. Holdings are subject to change and may have changed since the date specified. |
| 5 | Amounts are calculated based on the total long-term investments of the Fund. These amounts are subject to change and may have changed since the date specified. |
Wells Fargo Low Volatility U.S. Equity Fund | 5
Table of Contents
As a shareholder of the Fund, you incur two types of costs: (1) transaction costs, including sales charges (loads) on purchase payments and contingent deferred sales charges (if any) on redemptions and (2) ongoing costs, including management fees, distribution(12b-1) and/or shareholder servicing fees, and other Fund expenses. This example is intended to help you understand your ongoing costs (in dollars) of investing in the Fund and to compare these costs with the ongoing costs of investing in other mutual funds.
The example is based on an investment of $1,000 invested at the beginning of thesix-month period and held for the entire period from August 1, 2019 to January 31, 2020.
Actual expenses
The “Actual” line of the table below provides information about actual account values and actual expenses. You may use the information in this line, together with the amount you invested, to estimate the expenses that you paid over the period. Simply divide your account value by $1,000 (for example, an $8,600 account value divided by $1,000 = 8.6), then multiply the result by the number in the “Actual” line under the heading entitled “Expenses paid during period” for your applicable class of shares to estimate the expenses you paid on your account during this period.
Hypothetical example for comparison purposes
The “Hypothetical” line of the table below provides information about hypothetical account values and hypothetical expenses based on the Fund’s actual expense ratio and an assumed rate of return of 5% per year before expenses, which is not the Fund’s actual return. The hypothetical account values and expenses may not be used to estimate the actual ending account balance or expenses you paid for the period. You may use this information to compare the ongoing costs of investing in the Fund and other funds. To do so, compare this 5% hypothetical example with the 5% hypothetical examples that appear in the shareholder reports of the other funds.
Please note that the expenses shown in the table are meant to highlight your ongoing costs only and do not reflect any transactional costs, such as sales charges (loads) and contingent deferred sales charges. Therefore, the “Hypothetical” line of the table is useful in comparing ongoing costs only and will not help you determine the relative total costs of owning different funds. In addition, if these transactional costs were included, your costs would have been higher.
| Beginning account value 8-1-2019 | Ending account value 1-31-2020 | Expenses paid during the period1 | Annualized net expense ratio | |||||||||||||
Class A | ||||||||||||||||
Actual | $ | 1,000.00 | $ | 1,079.11 | $ | 3.66 | 0.70 | % | ||||||||
Hypothetical (5% return before expenses) | $ | 1,000.00 | $ | 1,021.62 | $ | 3.56 | 0.70 | % | ||||||||
Class C | ||||||||||||||||
Actual | $ | 1,000.00 | $ | 1,074.74 | $ | 7.72 | 1.48 | % | ||||||||
Hypothetical (5% return before expenses) | $ | 1,000.00 | $ | 1,017.70 | $ | 7.51 | 1.48 | % | ||||||||
Class R6 | ||||||||||||||||
Actual | $ | 1,000.00 | $ | 1,080.92 | $ | 1.57 | 0.30 | % | ||||||||
Hypothetical (5% return before expenses) | $ | 1,000.00 | $ | 1,023.63 | $ | 1.53 | 0.30 | % | ||||||||
Administrator Class | ||||||||||||||||
Actual | $ | 1,000.00 | $ | 1,079.28 | $ | 3.40 | 0.65 | % | ||||||||
Hypothetical (5% return before expenses) | $ | 1,000.00 | $ | 1,021.87 | $ | 3.30 | 0.65 | % | ||||||||
Institutional Class | ||||||||||||||||
Actual | $ | 1,000.00 | $ | 1,080.72 | $ | 2.09 | 0.40 | % | ||||||||
Hypothetical (5% return before expenses) | $ | 1,000.00 | $ | 1,023.13 | $ | 2.03 | 0.40 | % | ||||||||
| 1 | Expenses paid is equal to the annualized net expense ratio of each class multiplied by the average account value over the period, multiplied by the number of days in the most recent fiscal half-year divided by the number of days in the fiscal year (to reflect theone-half-year period). |
6 | Wells Fargo Low Volatility U.S. Equity Fund
Table of Contents
Portfolio of investments—January 31, 2020 (unaudited)
| Shares | Value | |||||||||||||||
| Common Stocks: 97.32% | ||||||||||||||||
Communication Services: 5.25% | ||||||||||||||||
| Diversified Telecommunication Services: 0.13% | ||||||||||||||||
Verizon Communications Incorporated | 1,263 | $ | 75,073 | |||||||||||||
|
| |||||||||||||||
| Entertainment: 2.33% | ||||||||||||||||
Cinemark Holdings Incorporated | 27,552 | 868,164 | ||||||||||||||
The Madison Square Garden Company Class A † | 1,187 | 351,578 | ||||||||||||||
The Walt Disney Company | 1,166 | 161,269 | ||||||||||||||
| 1,381,011 | ||||||||||||||||
|
| |||||||||||||||
| Interactive Media & Services: 0.39% | ||||||||||||||||
IAC Corporation † | 961 | 234,090 | ||||||||||||||
|
| |||||||||||||||
| Media: 2.40% | ||||||||||||||||
Cable One Incorporated | 599 | 1,020,714 | ||||||||||||||
John Wiley & Sons Incorporated Class A | 798 | 34,809 | ||||||||||||||
Omnicom Group Incorporated | 4,907 | 369,546 | ||||||||||||||
| 1,425,069 | ||||||||||||||||
|
| |||||||||||||||
Consumer Discretionary: 8.34% | ||||||||||||||||
| Auto Components: 0.52% | ||||||||||||||||
Gentex Corporation | 10,262 | 305,500 | ||||||||||||||
|
| |||||||||||||||
| Diversified Consumer Services: 3.72% | ||||||||||||||||
Bright Horizons Family Solutions Incorporated † | 7,708 | 1,262,031 | ||||||||||||||
Frontdoor Incorporated † | 13,338 | 567,932 | ||||||||||||||
Graham Holdings Company Class B | 77 | 42,290 | ||||||||||||||
Grand Canyon Education Incorporated † | 4,308 | 337,230 | ||||||||||||||
| 2,209,483 | ||||||||||||||||
|
| |||||||||||||||
| Hotels, Restaurants & Leisure: 0.19% | ||||||||||||||||
Six Flags Entertainment Corporation | 2,886 | 110,043 | ||||||||||||||
|
| |||||||||||||||
| Household Durables: 0.76% | ||||||||||||||||
NVR Incorporated † | 118 | 450,402 | ||||||||||||||
|
| |||||||||||||||
| Specialty Retail: 2.31% | ||||||||||||||||
Ross Stores Incorporated | 6,921 | 776,467 | ||||||||||||||
The TJX Companies Incorporated | 1,901 | 112,235 | ||||||||||||||
ULTA Beauty Incorporated † | 1,789 | 479,291 | ||||||||||||||
| 1,367,993 | ||||||||||||||||
|
| |||||||||||||||
| Textiles, Apparel & Luxury Goods: 0.84% | ||||||||||||||||
lululemon athletica Incorporated † | 1,689 | 404,330 | ||||||||||||||
Nike Incorporated Class B | 1,002 | 96,493 | ||||||||||||||
| 500,823 | ||||||||||||||||
|
| |||||||||||||||
Consumer Staples: 14.68% | ||||||||||||||||
| Beverages: 4.14% | ||||||||||||||||
PepsiCo Incorporated | 10,550 | 1,498,311 | ||||||||||||||
The Coca-Cola Company | 16,399 | 957,702 | ||||||||||||||
| 2,456,013 | ||||||||||||||||
|
| |||||||||||||||
The accompanying notes are an integral part of these financial statements.
Wells Fargo Low Volatility U.S. Equity Fund | 7
Table of Contents
Portfolio of investments—January 31, 2020 (unaudited)
| Shares | Value | |||||||||||||||
| Food & Staples Retailing: 1.30% | ||||||||||||||||
Costco Wholesale Corporation | 2,525 | $ | 771,438 | |||||||||||||
|
| |||||||||||||||
| Food Products: 5.82% | ||||||||||||||||
Flowers Foods Incorporated | 18,745 | 403,580 | ||||||||||||||
General Mills Incorporated | 16,051 | 838,183 | ||||||||||||||
Lamb Weston Holdings Incorporated | 7,725 | 705,370 | ||||||||||||||
The Hershey Company | 7,949 | 1,233,446 | ||||||||||||||
The J.M. Smucker Company | 1,956 | 202,661 | ||||||||||||||
Tyson Foods Incorporated Class A | 867 | 71,640 | ||||||||||||||
| 3,454,880 | ||||||||||||||||
|
| |||||||||||||||
| Household Products: 1.33% | ||||||||||||||||
Colgate-Palmolive Company | 6,020 | 444,156 | ||||||||||||||
The Clorox Company | 2,176 | 342,307 | ||||||||||||||
| 786,463 | ||||||||||||||||
|
| |||||||||||||||
| Tobacco: 2.09% | ||||||||||||||||
Altria Group Incorporated | 15,159 | 720,507 | ||||||||||||||
Philip Morris International Incorporated | 6,249 | 516,792 | ||||||||||||||
| 1,237,299 | ||||||||||||||||
|
| |||||||||||||||
Energy: 0.58% | ||||||||||||||||
| Energy Equipment & Services: 0.45% | ||||||||||||||||
Baker Hughes Incorporated | 12,379 | 268,129 | ||||||||||||||
|
| |||||||||||||||
| Oil, Gas & Consumable Fuels: 0.13% | ||||||||||||||||
ConocoPhillips | 1,276 | 75,833 | ||||||||||||||
|
| |||||||||||||||
Financials: 14.70% | ||||||||||||||||
| Banks: 0.13% | ||||||||||||||||
Popular Incorporated | 1,430 | 80,023 | ||||||||||||||
|
| |||||||||||||||
| Capital Markets: 7.34% | ||||||||||||||||
Cboe Holdings Incorporated | 9,243 | 1,138,922 | ||||||||||||||
CME Group Incorporated | 6,227 | 1,351,944 | ||||||||||||||
Intercontinental Exchange Incorporated | 1,732 | 172,750 | ||||||||||||||
Janus Henderson Group plc | 32,980 | 833,405 | ||||||||||||||
MarketAxess Holdings Incorporated | 1,563 | 553,583 | ||||||||||||||
VIRTU Financial Incorporated Class A | 18,213 | 303,975 | ||||||||||||||
| 4,354,579 | ||||||||||||||||
|
| |||||||||||||||
| Insurance: 2.58% | ||||||||||||||||
American Financial Group Incorporated | 5,506 | 598,998 | ||||||||||||||
American National Insurance Company | 379 | 41,751 | ||||||||||||||
Arch Capital Group Limited † | 6,753 | 298,212 | ||||||||||||||
Assurant Incorporated | 2,747 | 358,648 | ||||||||||||||
Old Republic International Corporation | 10,458 | 235,828 | ||||||||||||||
| 1,533,437 | ||||||||||||||||
|
| |||||||||||||||
| Mortgage REITs: 3.26% | ||||||||||||||||
Chimera Investment Corporation | 59 | 1,251 | ||||||||||||||
MFA Financial Incorporated | 55,154 | 430,201 | ||||||||||||||
Starwood Property Trust Incorporated | 58,435 | 1,499,441 | ||||||||||||||
| 1,930,893 | ||||||||||||||||
|
| |||||||||||||||
The accompanying notes are an integral part of these financial statements.
8 | Wells Fargo Low Volatility U.S. Equity Fund
Table of Contents
Portfolio of investments—January 31, 2020 (unaudited)
| Shares | Value | |||||||||||||||
| Thrifts & Mortgage Finance: 1.39% | ||||||||||||||||
MGIC Investment Corporation | 59,625 | $ | 822,229 | |||||||||||||
|
| |||||||||||||||
Health Care: 4.90% | ||||||||||||||||
| Health Care Equipment & Supplies: 0.97% | ||||||||||||||||
West Pharmaceutical Services Incorporated | 3,710 | 578,575 | ||||||||||||||
|
| |||||||||||||||
| Health Care Providers & Services: 3.12% | ||||||||||||||||
Anthem Incorporated | 1 | 265 | ||||||||||||||
Chemed Corporation | 2,564 | 1,197,491 | ||||||||||||||
Laboratory Corporation of America Holdings † | 2,933 | 514,448 | ||||||||||||||
Quest Diagnostics Incorporated | 1,270 | 140,551 | ||||||||||||||
| 1,852,755 | ||||||||||||||||
|
| |||||||||||||||
| Life Sciences Tools & Services: 0.81% | ||||||||||||||||
Bio-Rad Laboratories Incorporated Class A † | 1,325 | 478,219 | ||||||||||||||
|
| |||||||||||||||
Industrials: 14.51% | ||||||||||||||||
| Aerospace & Defense: 6.58% | ||||||||||||||||
BWX Technologies Incorporated | 6,278 | 399,218 | ||||||||||||||
Curtiss-Wright Corporation | 6,736 | 979,616 | ||||||||||||||
HEICO Corporation Class A | 1,363 | 131,052 | ||||||||||||||
Huntington Ingalls Industries Incorporated | 1,270 | 331,470 | ||||||||||||||
Lockheed Martin Corporation | 1,828 | 782,603 | ||||||||||||||
Northrop Grumman Corporation | 3,409 | 1,276,909 | ||||||||||||||
| 3,900,868 | ||||||||||||||||
|
| |||||||||||||||
| Commercial Services & Supplies: 5.01% | ||||||||||||||||
Republic Services Incorporated | 16,009 | 1,521,655 | ||||||||||||||
Waste Management Incorporated | 11,923 | 1,451,029 | ||||||||||||||
| 2,972,684 | ||||||||||||||||
|
| |||||||||||||||
| Industrial Conglomerates: 0.50% | ||||||||||||||||
Honeywell International Incorporated | 1,720 | 297,938 | ||||||||||||||
|
| |||||||||||||||
| Machinery: 2.42% | ||||||||||||||||
Crane Company | 9,904 | 846,396 | ||||||||||||||
The Toro Company | 7,327 | 586,307 | ||||||||||||||
| 1,432,703 | ||||||||||||||||
|
| |||||||||||||||
Information Technology: 9.12% | ||||||||||||||||
| Communications Equipment: 0.92% | ||||||||||||||||
Motorola Solutions Incorporated | 3,081 | 545,337 | ||||||||||||||
|
| |||||||||||||||
| Electronic Equipment, Instruments & Components: 1.87% | ||||||||||||||||
CDW Corporation of Delaware | 3,524 | 459,706 | ||||||||||||||
FLIR Systems Incorporated | 2,974 | 153,280 | ||||||||||||||
National Instruments Corporation | 11,172 | 498,606 | ||||||||||||||
| 1,111,592 | ||||||||||||||||
|
| |||||||||||||||
| IT Services: 6.17% | ||||||||||||||||
Amdocs Limited | 12,802 | 921,104 | ||||||||||||||
Booz Allen Hamilton Holding Corporation | 10,823 | 844,627 | ||||||||||||||
Genpact Limited | 21,169 | 937,152 | ||||||||||||||
Jack Henry & Associates Incorporated | 514 | 76,864 | ||||||||||||||
The accompanying notes are an integral part of these financial statements.
Wells Fargo Low Volatility U.S. Equity Fund | 9
Table of Contents
Portfolio of investments—January 31, 2020 (unaudited)
| Shares | Value | |||||||||||||||
| IT Services (continued) | ||||||||||||||||
Paychex Incorporated | 10,271 | $ | 880,944 | |||||||||||||
| 3,660,691 | ||||||||||||||||
|
| |||||||||||||||
| Software: 0.16% | ||||||||||||||||
Citrix Systems Incorporated | 778 | 94,309 | ||||||||||||||
|
| |||||||||||||||
Materials: 7.81% | ||||||||||||||||
| Chemicals: 1.47% | ||||||||||||||||
Ecolab Incorporated | 4,438 | 870,336 | ||||||||||||||
|
| |||||||||||||||
| Containers & Packaging: 3.43% | ||||||||||||||||
AptarGroup Incorporated | 11,816 | 1,364,866 | ||||||||||||||
Avery Dennison Corporation | 2,940 | 385,846 | ||||||||||||||
Sonoco Products Company | 5,008 | 286,157 | ||||||||||||||
| 2,036,869 | ||||||||||||||||
|
| |||||||||||||||
| Metals & Mining: 2.91% | ||||||||||||||||
Newmont Goldcorp Corporation | 14,818 | 667,699 | ||||||||||||||
Reliance Steel & Aluminum Company | 4,623 | 530,720 | ||||||||||||||
Royal Gold Incorporated | 4,569 | 526,897 | ||||||||||||||
| 1,725,316 | ||||||||||||||||
|
| |||||||||||||||
Real Estate: 5.52% | ||||||||||||||||
| Equity REITs: 5.52% | ||||||||||||||||
Apple Hospitality REIT Incorporated | 234 | 3,515 | ||||||||||||||
Camden Property Trust | 824 | 92,642 | ||||||||||||||
Equity Commonwealth | 25,700 | 842,703 | ||||||||||||||
Gaming and Leisure Properties Incorporated | 31,584 | 1,492,502 | ||||||||||||||
VICI Properties Incorporated | 31,488 | 843,878 | ||||||||||||||
| 3,275,240 | ||||||||||||||||
|
| |||||||||||||||
Utilities: 11.91% | ||||||||||||||||
| Electric Utilities: 6.78% | ||||||||||||||||
American Electric Power Company Incorporated | 15,509 | 1,616,348 | ||||||||||||||
Hawaiian Electric Industries Incorporated | 8,736 | 427,278 | ||||||||||||||
IDACORP Incorporated | 6,029 | 676,394 | ||||||||||||||
NextEra Energy Incorporated | 979 | 262,568 | ||||||||||||||
Pinnacle West Capital Corporation | 10,652 | 1,040,594 | ||||||||||||||
| 4,023,182 | ||||||||||||||||
|
| |||||||||||||||
| Multi-Utilities: 5.13% | ||||||||||||||||
Ameren Corporation | 1,347 | 110,521 | ||||||||||||||
CMS Energy Corporation | 21,383 | 1,464,949 | ||||||||||||||
Consolidated Edison Incorporated | 11,130 | 1,046,220 | ||||||||||||||
DTE Energy Company | 3,144 | 416,926 | ||||||||||||||
| 3,038,616 | ||||||||||||||||
|
| |||||||||||||||
Total Common Stocks (Cost $50,306,630) | 57,725,933 | |||||||||||||||
|
| |||||||||||||||
The accompanying notes are an integral part of these financial statements.
10 | Wells Fargo Low Volatility U.S. Equity Fund
Table of Contents
Portfolio of investments—January 31, 2020 (unaudited)
| Yield | Shares | Value | ||||||||||||||
| Short-Term Investments: 2.49% | ||||||||||||||||
Investment Companies: 2.49% | ||||||||||||||||
Wells Fargo Government Money Market Fund Select Class (I)(u) | 1.51 | % | 1,475,243 | $ | 1,475,243 | |||||||||||
|
| |||||||||||||||
Total Short-Term Investments (Cost $1,475,243) | 1,475,243 | |||||||||||||||
|
| |||||||||||||||
| Total investments in securities (Cost $51,781,873) | 99.81 | % | 59,201,176 | |||||
Other assets and liabilities, net | 0.19 | 112,474 | ||||||
|
|
|
| |||||
| Total net assets | 100.00 | % | $ | 59,313,650 | ||||
|
|
|
| |||||
| † | Non-income-earning security |
| (I) | The issue of the security is an affiliated person of the fund as defined in the investment company Act of 1940. |
| (u) | The rate represents the7-day annualized yield at the period end. |
Abbreviations:
| REIT | Real estate investment trust |
Investments in Affiliates
An affiliated investment is an investment in which the Fund owns at least 5% of the outstanding voting shares of the issuer or as a result of other relationships, such as the Fund and the issuer having the same investment manager. Transactions with issuers that were either affiliated persons of the Fund at the beginning of the period or the end of the period were as follows:
| Shares, beginning of period | Shares purchased | Shares sold | Shares, end of period | Net realized gains (losses) | Net change in unrealized gains (losses) | Income from affiliated securities | Value, period | % of net assets | ||||||||||||||||||||||||||||
| Short-Term Investments | ||||||||||||||||||||||||||||||||||||
Investment Companies | ||||||||||||||||||||||||||||||||||||
Wells Fargo Government Money Market Fund Select Class | 1,153,395 | 23,023,526 | (22,701,678 | ) | 1,475,243 | $ | 0 | $ | 0 | $ | 13,542 | $ | 1,475,243 | 2.49 | % | |||||||||||||||||||||
The accompanying notes are an integral part of these financial statements.
Wells Fargo Low Volatility U.S. Equity Fund | 11
Table of Contents
Statement of assets and liabilities—January 31, 2020 (unaudited)
Assets | ||||
Investments in unaffiliated securities, at value (cost $50,306,630) | $ | 57,725,933 | ||
Investments in affiliated securities, at value (cost $1,475,243) | 1,475,243 | |||
Receivable for Fund shares sold | 125,000 | |||
Receivable for dividends | 38,853 | |||
Receivable from manager | 7,037 | |||
Prepaid expenses and other assets | 29,556 | |||
|
| |||
Total assets | 59,401,622 | |||
|
| |||
Liabilities | ||||
Shareholder report expenses payable | 33,408 | |||
Professional fees payable | 33,313 | |||
Custodian and accounting fees payable | 7,532 | |||
Administration fees payable | 6,948 | |||
Trustees’ fees and expenses payable | 5,569 | |||
Payable for Fund shares redeemed | 300 | |||
Distribution fee payable | 273 | |||
Accrued expenses and other liabilities | 629 | |||
|
| |||
Total liabilities | 87,972 | |||
|
| |||
Total net assets | $ | 59,313,650 | ||
|
| |||
Net assets consist of | ||||
Paid-in capital | $ | 51,637,258 | ||
Total distributable earnings | 7,676,392 | |||
|
| |||
Total net assets | $ | 59,313,650 | ||
|
| |||
Computation of net asset value and offering price per share | ||||
Net assets – Class A | $ | 1,861,535 | ||
Shares outstanding – Class A1 | 149,151 | |||
Net asset value per share – Class A | $12.48 | |||
Maximum offering price per share – Class A2 | $13.24 | |||
Net assets – Class C | $ | 405,424 | ||
Shares outstanding – Class C1 | 32,652 | |||
Net asset value per share – Class C | $12.42 | |||
Net assets – Class R6 | $ | 1,253,279 | ||
Shares outstanding – Class R61 | 100,480 | |||
Net asset value per share – Class R6 | $12.47 | |||
Net assets – Administrator Class | $ | 125,158 | ||
Shares outstanding – Administrator Class1 | 10,042 | |||
Net asset value per share – Administrator Class | $12.46 | |||
Net assets – Institutional Class | $ | 55,668,254 | ||
Shares outstanding – Institutional Class1 | 4,454,229 | |||
Net asset value per share – Institutional Class | $12.50 | |||
| ¹ | The Fund has an unlimited number of authorized shares. |
| ² | Maximum offering price is computed as 100/94.25 of net asset value. On investments of $50,000 or more, the offering price is reduced. |
The accompanying notes are an integral part of these financial statements.
12 | Wells Fargo Low Volatility U.S. Equity Fund
Table of Contents
Statement of operations—six months ended January 31, 2020 (unaudited)
Investment income | ||||
Dividends (net of foreign withholding taxes of $82) | $ | 556,327 | ||
Income from affiliated securities | 13,542 | |||
|
| |||
Total investment income | 569,869 | |||
|
| |||
Expenses | ||||
Management fee | 97,253 | |||
Administration fees | ||||
Class A | 1,793 | |||
Class C | 384 | |||
Class R6 | 188 | |||
Administrator Class | 82 | |||
Institutional Class | 29,363 | |||
Shareholder servicing fees | ||||
Class A | 2,134 | |||
Class C | 457 | |||
Administrator Class | 156 | |||
Distribution fee | ||||
Class C | 1,295 | |||
Custody and accounting fees | 6,484 | |||
Professional fees | 27,182 | |||
Registration fees | 45,421 | |||
Shareholder report expenses | 25,478 | |||
Trustees’ fees and expenses | 10,864 | |||
Other fees and expenses | 4,622 | |||
|
| |||
Total expenses | 253,156 | |||
Less: Fee waivers and/or expense reimbursements | ||||
Fund-level | (119,867 | ) | ||
Class A | (2,284 | ) | ||
Class C | (352 | ) | ||
Class R6 | (188 | ) | ||
Administrator Class | (150 | ) | ||
Institutional Class | (29,363 | ) | ||
|
| |||
Net expenses | 100,952 | |||
|
| |||
Net investment income | 468,917 | |||
|
| |||
Realized and unrealized gains (losses) on investments | ||||
Net realized gains on investments | 1,717,630 | |||
Net change in unrealized gains (losses) on investments | 1,914,017 | |||
|
| |||
Net realized and unrealized gains (losses) on investments | 3,631,647 | |||
|
| |||
Net increase in net assets resulting from operations | $ | 4,100,564 | ||
|
| |||
The accompanying notes are an integral part of these financial statements.
Wells Fargo Low Volatility U.S. Equity Fund | 13
Table of Contents
Statement of changes in net assets
| Six months ended January 31, 2020 (unaudited) | Year ended July 31, 2019 | |||||||||||||||
Operations | ||||||||||||||||
Net investment income | $ | 468,917 | $ | 797,854 | ||||||||||||
Net realized gains on investments | 1,717,630 | 1,004,676 | ||||||||||||||
Net change in unrealized gains (losses) on investments | 1,914,017 | 2,805,492 | ||||||||||||||
|
| |||||||||||||||
Net increase in net assets resulting from operations | 4,100,564 | 4,608,022 | ||||||||||||||
|
| |||||||||||||||
Distributions to shareholders from net investment income and net realized gains | ||||||||||||||||
Class A | (74,979 | ) | (97,183 | ) | ||||||||||||
Class C | (14,949 | ) | (13,679 | ) | ||||||||||||
Class R6 | (59,692 | ) | (88,854 | ) | ||||||||||||
Administrator Class | (5,557 | ) | (8,480 | ) | ||||||||||||
Institutional Class | (2,494,914 | ) | (2,610,423 | ) | ||||||||||||
|
| |||||||||||||||
Total distributions to shareholders | (2,650,091 | ) | (2,818,619 | ) | ||||||||||||
|
| |||||||||||||||
Capital share transactions | Shares | Shares | ||||||||||||||
Proceeds from shares sold | ||||||||||||||||
Class A | 18,700 | 226,966 | 22,375 | 258,259 | ||||||||||||
Class C | 6,978 | 84,734 | 14,213 | 159,144 | ||||||||||||
Institutional Class | 1,544,435 | 19,112,172 | 98,413 | 1,093,577 | ||||||||||||
|
| |||||||||||||||
| 19,423,872 | 1,510,980 | |||||||||||||||
|
| |||||||||||||||
Reinvestment of distributions | ||||||||||||||||
Class A | 5,757 | 69,533 | 8,338 | 88,821 | ||||||||||||
Class C | 857 | 10,265 | 567 | 5,999 | ||||||||||||
Institutional Class | 39,815 | 481,655 | 50,399 | 537,420 | ||||||||||||
|
| |||||||||||||||
| 561,453 | 632,240 | |||||||||||||||
|
| |||||||||||||||
Payment for shares redeemed | ||||||||||||||||
Class A | (2,581 | ) | (31,653 | ) | (16,971 | ) | (182,876 | ) | ||||||||
Class C | (546 | ) | (6,706 | ) | (5,662 | ) | (66,877 | ) | ||||||||
Institutional Class | (147,354 | ) | (1,798,044 | ) | (205,601 | ) | (2,340,479 | ) | ||||||||
|
| |||||||||||||||
| (1,836,403 | ) | (2,590,232 | ) | |||||||||||||
|
| |||||||||||||||
Net increase (decrease) in net assets resulting from capital share transactions | 18,148,922 | (447,012 | ) | |||||||||||||
|
| |||||||||||||||
Total increase in net assets | 19,599,395 | 1,342,391 | ||||||||||||||
|
| |||||||||||||||
Net assets | ||||||||||||||||
Beginning of period | 39,714,255 | 38,371,864 | ||||||||||||||
|
| |||||||||||||||
End of period | $ | 59,313,650 | $ | 39,714,255 | ||||||||||||
|
| |||||||||||||||
The accompanying notes are an integral part of these financial statements.
14 | Wells Fargo Low Volatility U.S. Equity Fund
Table of Contents
(For a share outstanding throughout each period)
| Six months ended January 31, 2020 (unaudited) | Year ended July 31 | |||||||||||||||
| CLASS A | 2019 | 2018 | 20171 | |||||||||||||
Net asset value, beginning of period | $12.09 | $11.56 | $11.21 | $10.00 | ||||||||||||
Net investment income | 0.09 | 0.19 | 0.16 | 0.13 | ||||||||||||
Net realized and unrealized gains (losses) on investments | 0.84 | 1.17 | 0.54 | 1.12 | ||||||||||||
|
|
|
|
|
|
|
| |||||||||
Total from investment operations | 0.93 | 1.36 | 0.70 | 1.25 | ||||||||||||
Distributions to shareholders from | ||||||||||||||||
Net investment income | (0.19 | ) | (0.18 | ) | (0.17 | ) | (0.04 | ) | ||||||||
Net realized gains | (0.35 | ) | (0.65 | ) | (0.18 | ) | 0.00 | |||||||||
|
|
|
|
|
|
|
| |||||||||
Total distributions to shareholders | (0.54 | ) | (0.83 | ) | (0.35 | ) | (0.04 | ) | ||||||||
Net asset value, end of period | $12.48 | $12.09 | $11.56 | $11.21 | ||||||||||||
Total return2 | 7.91 | % | 12.87 | % | 6.32 | % | 12.53 | % | ||||||||
Ratios to average net assets (annualized) | ||||||||||||||||
Gross expenses | 1.36 | % | 1.50 | % | 1.55 | % | 1.61 | % | ||||||||
Net expenses | 0.70 | % | 0.76 | % | 0.83 | % | 0.82 | % | ||||||||
Net investment income | 1.63 | % | 1.83 | % | 1.53 | % | 1.78 | % | ||||||||
Supplemental data | ||||||||||||||||
Portfolio turnover rate | 33 | % | 74 | % | 75 | % | 39 | % | ||||||||
Net assets, end of period (000s omitted) | $1,862 | $1,539 | $1,312 | $1,096 | ||||||||||||
| 1 | For the period from October 31, 2016 (commencement of class operations) to July 31, 2017 |
| 2 | Total return calculations do not include any sales charges. Returns for periods of less than one year are not annualized. |
The accompanying notes are an integral part of these financial statements.
Wells Fargo Low Volatility U.S. Equity Fund | 15
Table of Contents
Financial highlights
(For a share outstanding throughout each period)
| Six months ended January 31, 2020 (unaudited) | Year ended July 31 | |||||||||||||||
| CLASS C | 2019 | 2018 | 20171 | |||||||||||||
Net asset value, beginning of period | $12.01 | $11.49 | $11.16 | $10.00 | ||||||||||||
Net investment income | 0.04 | 0.11 | 0.08 | 0.08 | ||||||||||||
Net realized and unrealized gains (losses) on investments | 0.84 | 1.17 | 0.52 | 1.11 | ||||||||||||
|
|
|
|
|
|
|
| |||||||||
Total from investment operations | 0.88 | 1.28 | 0.60 | 1.19 | ||||||||||||
Distributions to shareholders from | ||||||||||||||||
Net investment income | (0.12 | ) | (0.11 | ) | (0.09 | ) | (0.03 | ) | ||||||||
Net realized gains | (0.35 | ) | (0.65 | ) | (0.18 | ) | 0.00 | |||||||||
|
|
|
|
|
|
|
| |||||||||
Total distributions to shareholders | (0.47 | ) | (0.76 | ) | (0.27 | ) | (0.03 | ) | ||||||||
Net asset value, end of period | $12.42 | $12.01 | $11.49 | $11.16 | ||||||||||||
Total return2 | 7.47 | % | 12.15 | % | 5.45 | % | 11.91 | % | ||||||||
Ratios to average net assets (annualized) | ||||||||||||||||
Gross expenses | 2.07 | % | 2.18 | % | 2.31 | % | 2.40 | % | ||||||||
Net expenses | 1.48 | % | 1.51 | % | 1.58 | % | 1.58 | % | ||||||||
Net investment income | 0.85 | % | 1.10 | % | 0.76 | % | 1.01 | % | ||||||||
Supplemental data | ||||||||||||||||
Portfolio turnover rate | 33 | % | 74 | % | 75 | % | 39 | % | ||||||||
Net assets, end of period (000s omitted) | $405 | $305 | $187 | $112 | ||||||||||||
| 1 | For the period from October 31, 2016 (commencement of class operations) to July 31, 2017 |
| 2 | Total return calculations do not include any sales charges. Returns for periods of less than one year are not annualized. |
The accompanying notes are an integral part of these financial statements.
16 | Wells Fargo Low Volatility U.S. Equity Fund
Table of Contents
Financial highlights
(For a share outstanding throughout each period)
| Six months ended January 31, 2020 (unaudited) | Year ended July 31 | |||||||||||||||
| CLASS R6 | 2019 | 2018 | 20171 | |||||||||||||
Net asset value, beginning of period | $12.11 | $11.58 | $11.24 | $10.00 | ||||||||||||
Net investment income | 0.13 | 0.26 | 0.22 | 0.18 | ||||||||||||
Net realized and unrealized gains (losses) on investments | 0.83 | 1.15 | 0.52 | 1.11 | ||||||||||||
|
|
|
|
|
|
|
| |||||||||
Total from investment operations | 0.96 | 1.41 | 0.74 | 1.29 | ||||||||||||
Distributions to shareholders from | ||||||||||||||||
Net investment income | (0.25 | ) | (0.23 | ) | (0.22 | ) | (0.05 | ) | ||||||||
Net realized gains | (0.35 | ) | (0.65 | ) | (0.18 | ) | 0.00 | |||||||||
|
|
|
|
|
|
|
| |||||||||
Total distributions to shareholders | (0.60 | ) | (0.88 | ) | (0.40 | ) | (0.05 | ) | ||||||||
Net asset value, end of period | $12.47 | $12.11 | $11.58 | $11.24 | ||||||||||||
Total return2 | 8.09 | % | 13.39 | % | 6.70 | % | 12.94 | % | ||||||||
Ratios to average net assets (annualized) | ||||||||||||||||
Gross expenses | 0.94 | % | 1.07 | % | 1.12 | % | 1.22 | % | ||||||||
Net expenses | 0.30 | % | 0.33 | % | 0.40 | % | 0.40 | % | ||||||||
Net investment income | 2.03 | % | 2.27 | % | 1.96 | % | 2.19 | % | ||||||||
Supplemental data | ||||||||||||||||
Portfolio turnover rate | 33 | % | 74 | % | 75 | % | 39 | % | ||||||||
Net assets, end of period (000s omitted) | $1,253 | $1,217 | $1,164 | $1,129 | ||||||||||||
| 1 | For the period from October 31, 2016 (commencement of class operations) to July 31, 2017 |
| 2 | Returns for periods of less than one year are not annualized. |
The accompanying notes are an integral part of these financial statements.
Wells Fargo Low Volatility U.S. Equity Fund | 17
Table of Contents
Financial highlights
(For a share outstanding throughout each period)
| Six months ended January 31, 2020 (unaudited) | Year ended July 31 | |||||||||||||||
| ADMINISTRATOR CLASS | 2019 | 2018 | 20171 | |||||||||||||
Net asset value, beginning of period | $12.08 | $11.55 | $11.21 | $10.00 | ||||||||||||
Net investment income | 0.10 | 0.22 | 0.18 | 0.15 | ||||||||||||
Net realized and unrealized gains (losses) on investments | 0.84 | 1.15 | 0.53 | 1.10 | ||||||||||||
|
|
|
|
|
|
|
| |||||||||
Total from investment operations | 0.94 | 1.37 | 0.71 | 1.25 | ||||||||||||
Distributions to shareholders from | ||||||||||||||||
Net investment income | (0.21 | ) | (0.19 | ) | (0.19 | ) | (0.04 | ) | ||||||||
Net realized gains | (0.35 | ) | (0.65 | ) | (0.18 | ) | 0.00 | |||||||||
|
|
|
|
|
|
|
| |||||||||
Total distributions to shareholders | (0.56 | ) | (0.84 | ) | (0.37 | ) | (0.04 | ) | ||||||||
Net asset value, end of period | $12.46 | $12.08 | $11.55 | $11.21 | ||||||||||||
Total return2 | 7.93 | % | 13.00 | % | 6.36 | % | 12.57 | % | ||||||||
Ratios to average net assets (annualized) | ||||||||||||||||
Gross expenses | 1.29 | % | 1.42 | % | 1.47 | % | 1.57 | % | ||||||||
Net expenses | 0.65 | % | 0.68 | % | 0.75 | % | 0.75 | % | ||||||||
Net investment income | 1.68 | % | 1.92 | % | 1.61 | % | 1.87 | % | ||||||||
Supplemental data | ||||||||||||||||
Portfolio turnover rate | 33 | % | 74 | % | 75 | % | 39 | % | ||||||||
Net assets, end of period (000s omitted) | $125 | $121 | $116 | $113 | ||||||||||||
| 1 | For the period from October 31, 2016 (commencement of class operations) to July 31, 2017 |
| 2 | Returns for periods of less than one year are not annualized. |
The accompanying notes are an integral part of these financial statements.
18 | Wells Fargo Low Volatility U.S. Equity Fund
Table of Contents
Financial highlights
(For a share outstanding throughout each period)
| Six months ended January 31, 2020 (unaudited) | Year ended July 31 | |||||||||||||||
| INSTITUTIONAL CLASS | 2019 | 2018 | 20171 | |||||||||||||
Net asset value, beginning of period | $12.11 | $11.58 | $11.23 | $10.00 | ||||||||||||
Net investment income | 0.12 | 2 | 0.25 | 0.20 | 0.16 | |||||||||||
Net realized and unrealized gains (losses) on investments | 0.83 | 1.15 | 0.54 | 1.12 | ||||||||||||
|
|
|
|
|
|
|
| |||||||||
Total from investment operations | 0.95 | 1.40 | 0.74 | 1.28 | ||||||||||||
Distributions to shareholders from | ||||||||||||||||
Net investment income | (0.21 | ) | (0.22 | ) | (0.21 | ) | (0.05 | ) | ||||||||
Net realized gains | (0.35 | ) | (0.65 | ) | (0.18 | ) | 0.00 | |||||||||
|
|
|
|
|
|
|
| |||||||||
Total distributions to shareholders | (0.56 | ) | (0.87 | ) | (0.39 | ) | (0.05 | ) | ||||||||
Net asset value, end of period | $12.50 | $12.11 | $11.58 | $11.23 | ||||||||||||
Total return3 | 8.07 | % | 13.28 | % | 6.64 | % | 12.82 | % | ||||||||
Ratios to average net assets (annualized) | ||||||||||||||||
Gross expenses | 1.02 | % | 1.17 | % | 1.22 | % | 1.31 | % | ||||||||
Net expenses | 0.40 | % | 0.43 | % | 0.50 | % | 0.50 | % | ||||||||
Net investment income | 1.95 | % | 2.17 | % | 1.87 | % | 2.09 | % | ||||||||
Supplemental data | ||||||||||||||||
Portfolio turnover rate | 33 | % | 74 | % | 75 | % | 39 | % | ||||||||
Net assets, end of period (000s omitted) | $55,668 | $36,533 | $35,593 | $33,169 | ||||||||||||
| 1 | For the period from October 31, 2016 (commencement of class operations) to July 31, 2017 |
| 2 | Calculated based upon average shares outstanding |
| 3 | Returns for periods of less than one year are not annualized. |
The accompanying notes are an integral part of these financial statements.
Wells Fargo Low Volatility U.S. Equity Fund | 19
Table of Contents
Notes to financial statements (unaudited)
1. ORGANIZATION
Wells Fargo Funds Trust (the “Trust”), a Delaware statutory trust organized on March 10, 1999, is anopen-end management investment company registered under the Investment Company Act of 1940, as amended (the “1940 Act”). As an investment company, the Trust follows the accounting and reporting guidance in Financial Accounting Standards Board (“FASB”)Accounting Standards Codification Topic 946, Financial Services – Investment Companies. These financial statements report on the Wells Fargo Low Volatility U.S. Equity Fund (the “Fund”) which is a diversified series of the Trust.
2. SIGNIFICANT ACCOUNTING POLICIES
The following significant accounting policies, which are consistently followed in the preparation of the financial statements of the Fund, are in conformity with U.S. generally accepted accounting principles which require management to make estimates and assumptions that affect the reported amounts of assets and liabilities, disclosure of contingent assets and liabilities at the date of the financial statements, and the reported amounts of revenues and expenses during the reporting period. Actual results could differ from those estimates.
Securities valuation
All investments are valued each business day as of the close of regular trading on the New York Stock Exchange (generally 4 p.m. Eastern Time), although the Fund may deviate from this calculation time under unusual or unexpected circumstances.
Equity securities that are listed on a foreign or domestic exchange or market are valued at the official closing price or, if none, the last sales price. If no sale occurs on the principal exchange or market that day, a fair value price will be determined in accordance with the Fund’s Valuation Procedures.
Investments in registeredopen-end investment companies are valued at net asset value.
Investments which are not valued using any of the methods discussed above are valued at their fair value, as determined in good faith by the Board of Trustees of the Fund. The Board of Trustees has established a Valuation Committee comprised of the Trustees and has delegated to it the authority to take any actions regarding the valuation of portfolio securities that the Valuation Committee deems necessary or appropriate, including determining the fair value of portfolio securities, unless the determination has been delegated to the Wells Fargo Asset Management Pricing Committee at Wells Fargo Funds Management, LLC (“Funds Management”). The Board of Trustees retains the authority to make or ratify any valuation decisions or approve any changes to the Valuation Procedures as it deems appropriate. On a quarterly basis, the Board of Trustees receives reports on any valuation actions taken by the Valuation Committee or the Wells Fargo Asset Management Pricing Committee which may include items for ratification.
Security transactions and income recognition
Securities transactions are recorded on a trade date basis. Realized gains or losses are recorded on the basis of identified cost.
Dividend income is recognized on theex-dividend date. Dividend income is recorded net of foreign taxes withheld where recovery of such taxes is not assured.
Distributions to shareholders
Distributions to shareholders from net investment income and any net realized gains are recorded on theex-dividend date and paid at least annually. Such distributions are determined in accordance with income tax regulations and may differ from U.S. generally accepted accounting principles. Dividend sources are estimated at the time of declaration. The tax character of distributions is determined as of the Fund’s fiscal year end. Therefore, a portion of the Fund’s distributions made prior to the Fund’s fiscal year end may be categorized as a tax return of capital at year end.
Federal and other taxes
The Fund intends to continue to qualify as a regulated investment company by distributing substantially all of its investment company taxable income and any net realized capital gains (after reduction for capital loss carryforwards) sufficient to relieve it from all, or substantially all, federal income taxes. Accordingly, no provision for federal income taxes was required.
The Fund’s income and federal excise tax returns and all financial records supporting those returns for the prior three fiscal years are subject to examination by the federal and Delaware revenue authorities. Management has analyzed the Fund’s tax positions taken on federal, state, and foreign tax returns for all open tax years and does not believe that there are any uncertain tax positions that require recognition of a tax liability.
20 | Wells Fargo Low Volatility U.S. Equity Fund
Table of Contents
Notes to financial statements (unaudited)
As of January 31, 2020, the aggregate cost of all investments for federal income tax purposes was $51,775,298 and the unrealized gains (losses) consisted of:
Gross unrealized gains | $ | 8,019,075 | ||
Gross unrealized losses | (593,197 | ) | ||
Net unrealized gains | $ | 7,425,878 | ||
Class allocations
The separate classes of shares offered by the Fund differ principally in applicable sales charges, distribution, shareholder servicing, and administration fees. Class specific expenses are charged directly to that share class. Investment income, common fund-level expenses, and realized and unrealized gains (losses) on investments are allocated daily to each class of shares based on the relative proportion of net assets of each class.
3. FAIR VALUATION MEASUREMENTS
Fair value measurements of investments are determined within a framework that has established a fair value hierarchy based upon the various data inputs utilized in determining the value of the Fund’s investments. The three-level hierarchy gives the highest priority to unadjusted quoted prices in active markets for identical assets or liabilities (Level 1) and the lowest priority to unobservable inputs (Level 3). The Fund’s investments are classified within the fair value hierarchy based on the lowest level of input that is significant to the fair value measurement. The inputs are summarized into three broad levels as follows:
| ∎ | Level 1 – quoted prices in active markets for identical securities |
| ∎ | Level 2 – other significant observable inputs (including quoted prices for similar securities, interest rates, prepayment speeds, credit risk, etc.) |
| ∎ | Level 3 – significant unobservable inputs (including the Fund’s own assumptions in determining the fair value of investments) |
The inputs or methodologies used for valuing investments in securities are not necessarily an indication of the risk associated with investing in those securities.
The following is a summary of the inputs used in valuing the Fund’s assets and liabilities as of January 31, 2020:
| Quoted prices (Level 1) | Other significant observable inputs (Level 2) | Significant (Level 3) | Total | |||||||||||||
Assets | ||||||||||||||||
Investments in: | ||||||||||||||||
Common stocks | ||||||||||||||||
Communication services | $ | 3,115,243 | $ | 0 | $ | 0 | $ | 3,115,243 | ||||||||
Consumer discretionary | 4,944,244 | 0 | 0 | 4,944,244 | ||||||||||||
Consumer staples | 8,706,093 | 0 | 0 | 8,706,093 | ||||||||||||
Energy | 343,962 | 0 | 0 | 343,962 | ||||||||||||
Financials | 8,721,161 | 0 | 0 | 8,721,161 | ||||||||||||
Health care | 2,909,549 | 0 | 0 | 2,909,549 | ||||||||||||
Industrials | 8,604,193 | 0 | 0 | 8,604,193 | ||||||||||||
Information technology | 5,411,929 | 0 | 0 | 5,411,929 | ||||||||||||
Materials | 4,632,521 | 0 | 0 | 4,632,521 | ||||||||||||
Real estate | 3,275,240 | 0 | 0 | 3,275,240 | ||||||||||||
Utilities | 7,061,798 | 0 | 0 | 7,061,798 | ||||||||||||
Short-term investments | ||||||||||||||||
Investment companies | 1,475,243 | 0 | 0 | 1,475,243 | ||||||||||||
Total assets | $ | 59,201,176 | $ | 0 | $ | 0 | $ | 59,201,176 | ||||||||
Additional sector, industry or geographic detail is included in the Portfolio of Investments.
For the six months ended January 31, 2020, the Fund did not have any transfers into/out of Level 3.
Wells Fargo Low Volatility U.S. Equity Fund | 21
Table of Contents
Notes to financial statements (unaudited)
4. TRANSACTIONS WITH AFFILIATES
Management fee
Funds Management, an indirect wholly owned subsidiary of Wells Fargo & Company (“Wells Fargo”), is the manager of the Fund and provides advisory and fund-level administrative services under an investment management agreement. Under the investment management agreement, Funds Management is responsible for, among other services, implementing the investment objectives and strategies of the Fund, supervising the subadviser and providing fund-level administrative services in connection with the Fund’s operations. As compensation for its services under the investment management agreement, Funds Management is entitled to receive a management fee at the following annual rate based on the Fund’s average daily net assets:
| Average daily net assets | Management fee | |||
First $1 billion | 0.400 | % | ||
Next $4 billion | 0.375 | |||
Next $5 billion | 0.340 | |||
Over $10 billion | 0.330 | |||
For the six months ended January 31, 2020, the management fee was equivalent to an annual rate of 0.40% of the Fund’s average daily net assets.
Funds Management has retained the services of a subadviser to provide daily portfolio management to the Fund. The fee for subadvisory services is borne by Funds Management. Wells Capital Management Incorporated, an affiliate of Funds Management and an indirect wholly owned subsidiary of Wells Fargo, is the subadviser to the Fund and is entitled to receive a fee from Funds Management at an annual rate starting at 0.20% and declining to 0.12% as the average daily net assets of the Fund increase.
Administration fees
Under a class-level administration agreement, Funds Management provides class-level administrative services to the Fund, which includes paying fees and expenses for services provided by the transfer agent,sub-transfer agents, omnibus account servicers and record-keepers. As compensation for its services under the class-level administration agreement, Funds Management receives an annual fee which is calculated based on the average daily net assets of each class as follows:
| Class-level administration fee | ||||
Class A, Class C | 0.21 | % | ||
Class R6 | 0.03 | |||
Administrator Class, Institutional Class | 0.13 | |||
Waivers and/or expense reimbursements
Funds Management has contractually waived and/or reimbursed management and administration fees to the extent necessary to maintain certain net operating expense ratios for the Fund. When each class of the Fund has exceeded its expense cap, Funds Management has waived fees and/or reimbursed expenses from fund-level expenses on a proportionate basis and then from class specific expenses. When only certain classes exceed their expense caps, waivers and/or reimbursements are applied against class specific expenses before fund-level expenses. Funds Management has committed through November 30, 2020 to waive fees and/or reimburse expenses to the extent necessary to cap the Fund’s expenses at 0.73% for Class A shares, 1.48% for Class C shares, 0.30% for Class R6 shares, 0.65% for Administrator Class shares, and 0.40% for Institutional Class shares. Prior to or after the commitment expiration date, the cap may be increased or the commitment to maintain the cap may be terminated only with the approval of the Board of Trustees.
Distribution fee
The Trust has adopted a distribution plan for Class C shares of the Fund pursuant to Rule12b-1 under the 1940 Act. A distribution fee is charged to Class C shares and paid to Wells Fargo Funds Distributor, LLC (“Funds Distributor”), the principal underwriter, at an annual rate of 0.75% of the average daily net assets of Class C shares.
In addition, Funds Distributor is entitled to receive thefront-end sales charge from the purchase of Class A shares and a contingent deferred sales charge on the redemption of certain Class A shares. Funds Distributor is also entitled to receive the contingent deferred sales charges from redemptions of Class C shares. Funds Distributor did not receive anyfront-end or contingent deferred sales charges from Class A or Class C shares for the six months ended January 31, 2020.
22 | Wells Fargo Low Volatility U.S. Equity Fund
Table of Contents
Notes to financial statements (unaudited)
Shareholder servicing fees
The Trust has entered into contracts with one or more shareholder servicing agents, whereby Class A, Class C, and Administrator Class of the Fund are charged a fee at an annual rate of 0.25% of the average daily net assets of each respective class. A portion of these total shareholder servicing fees were paid to affiliates of Wells Fargo.
Interfund transactions
The Fund may purchase or sell portfolio investment securities to certain other Wells Fargo affiliates pursuant to Rule17a-7 under the 1940 Act and under procedures adopted by the Board of Trustees. The procedures have been designed to ensure that these interfund transactions, which do not incur broker commissions, are effected at current market prices.
5. INVESTMENT PORTFOLIO TRANSACTIONS
Purchases and sales of investments, excluding U.S. government obligations (if any) and short-term securities, for the six months ended January 31, 2020 were $31,066,589 and $15,548,484, respectively.
6. BANK BORROWINGS
The Trust (excluding the money market funds), Wells Fargo Master Trust and Wells Fargo Variable Trust are parties to a $280,000,000 revolving credit agreement whereby the Fund is permitted to use bank borrowings for temporary or emergency purposes, such as to fund shareholder redemption requests. Interest under the credit agreement is charged to the Fund based on a borrowing rate equal to the higher of the Federal Funds rate in effect on that day plus 1.25% or the overnight LIBOR rate in effect on that day plus 1.25%. In addition, an annual commitment fee equal to 0.25% of the unused balance is allocated to each participating fund.
For the six months ended January 31, 2020, there were no borrowings by the Fund under the agreement.
7. INDEMNIFICATION
Under the Trust’s organizational documents, the officers and Trustees have been granted certain indemnification rights against certain liabilities that may arise out of performance of their duties to the Trust. Additionally, in the normal course of business, the Trust may enter into contracts with service providers that contain a variety of indemnification clauses. The Trust’s maximum exposure under these arrangements is dependent on future claims that may be made against the Fund and, therefore, cannot be estimated.
8. NEW ACCOUNTING PRONOUNCEMENT
In August 2018, FASB issued Accounting Standards Update (“ASU”)No. 2018-13, Fair Value Measurement (Topic 820)Disclosure Framework—Changes to the Disclosure Requirements for Fair Value Measurement. ASU2018-13 updates the disclosure requirements for fair value measurements by modifying or removing certain disclosures and adding certain new disclosures. The amendments are effective for fiscal years, and interim periods within those fiscal years, beginning after December 15, 2019. Early adoption is permitted. Management has adopted the removal and modification of disclosures early, as permitted, and will adopt the additional new disclosures at the effective date.
9. SUBSEQUENT EVENT
On March 11, 2020, the World Health Organization announced that it had made the assessment that coronavirus disease 2019 (“COVID-19”) is a pandemic. The impacts of COVID-19 is adversely affecting the entire global economy, individual companies and investment products, and the market in general. There is significant uncertainty around the extent and duration of business disruptions related to COVID-19 and the impact may be short term or may last for an extended period of time. The risk of further spreading of COVID-19 has led to significant uncertainty and volatility in the financial markets and the value of the Fund and the securities in which the Fund invests may be adversely affected by impacts caused by COVID-19.
Wells Fargo Low Volatility U.S. Equity Fund | 23
Table of Contents
PROXY VOTING INFORMATION
A description of the policies and procedures used to determine how to vote proxies relating to portfolio securities is available, upon request, by calling1-800-222-8222, visiting our website atwfam.com, or visiting the SEC website at sec.gov. Information regarding how the proxies related to portfolio securities were voted during the most recent12-month period ended June 30 is available on the website atwfam.comor by visiting the SEC website at sec.gov.
QUARTERLY PORTFOLIO HOLDINGS INFORMATION
The Fund files its complete schedule of portfolio holdings with the SEC for the first and third quarters of each fiscal year as an exhibit to its reports on FormN-PORT. Shareholders may view the filed FormN-PORT by visiting the SEC website at sec.gov.
24 | Wells Fargo Low Volatility U.S. Equity Fund
Table of Contents
Other information (unaudited)
BOARD OF TRUSTEES AND OFFICERS
Each of the Trustees and Officers1 listed in the table below acts in identical capacities for each fund in the Wells Fargo family of funds, which consists of 149 mutual funds comprising the Wells Fargo Funds Trust, Wells Fargo Variable Trust, Wells Fargo Master Trust and fourclosed-end funds (collectively the “Fund Complex”). This table should be read in conjunction with the Prospectus and the Statement of Additional Information2. The mailing address of each Trustee and Officer is 525 Market Street, 12th Floor, San Francisco, CA 94105. Each Trustee and Officer serves an indefinite term, however, each Trustee serves such term until reaching the mandatory retirement age established by the Trustees.
Independent Trustees
| Name and year of birth | Position held and length of service* | Principal occupations during past five years or longer | Current other public company or investment company directorships | |||
| William R. Ebsworth (Born 1957) | Trustee, since 2015 | Retired. From 1984 to 2013, equities analyst, portfolio manager, research director and chief investment officer at Fidelity Management and Research Company in Boston, Tokyo, and Hong Kong, and retired in 2013 as Chief Investment Officer of Fidelity Strategic Advisers, Inc. where he led a team of investment professionals managing client assets. Prior thereto, Board member of Hong Kong Securities Clearing Co., Hong Kong Options Clearing Corp., the Thailand International Fund, Ltd., Fidelity Investments Life Insurance Company, and Empire Fidelity Investments Life Insurance Company. Audit Committee Chair and Investment Committee Chair of the Vincent Memorial Hospital Endowment(non-profit organization). Mr. Ebsworth is a CFA® charterholder. | N/A | |||
| Jane A. Freeman (Born 1953) | Trustee, since 2015; Chair Liaison, since 2018 | Retired. From 2012 to 2014 and 1999 to 2008, Chief Financial Officer of Scientific Learning Corporation. From 2008 to 2012, Ms. Freeman provided consulting services related to strategic business projects. Prior to 1999, Portfolio Manager at Rockefeller & Co. and Scudder, Stevens & Clark. Board member of the Harding Loevner Funds from 1996 to 2014, serving as both Lead Independent Director and chair of the Audit Committee. Board member of the Russell Exchange Traded Funds Trust from 2011 to 2012 and the chair of the Audit Committee. Ms. Freeman is a Board Member of The Ruth Bancroft Garden(non-profit organization). She is also an inactive Chartered Financial Analyst. | N/A | |||
| Isaiah Harris, Jr. (Born 1952) | Trustee, since 2009; Audit Committee Chairman, since 2019 | Retired. Chairman of the Board of CIGNA Corporation since 2009, and Director since 2005. From 2003 to 2011, Director of Deluxe Corporation. Prior thereto, President and CEO of BellSouth Advertising and Publishing Corp. from 2005 to 2007, President and CEO of BellSouth Enterprises from 2004 to 2005 and President of BellSouth Consumer Services from 2000 to 2003. Emeritus member of the Iowa State University Foundation Board of Governors. Emeritus Member of the Advisory Board of Iowa State University School of Business. Advisory Board Member, Palm Harbor Academy (private school). Advisory Board Member, Child Evangelism Fellowship(non-profit). Mr. Harris is a certified public accountant (inactive status). | CIGNA Corporation | |||
| Judith M. Johnson (Born 1949) | Trustee, since 2008; Audit Committee Chairman, from 2009 to 2018 | Retired. Prior thereto, Chief Executive Officer and Chief Investment Officer of Minneapolis Employees Retirement Fund from 1996 to 2008. Ms. Johnson is an attorney, certified public accountant and a certified managerial accountant. | N/A | |||
Wells Fargo Low Volatility U.S. Equity Fund | 25
Table of Contents
Other information (unaudited)
| Name and year of birth | Position held and length of service* | Principal occupations during past five years or longer | Current other public company or investment company directorships | |||
| David F. Larcker (Born 1950) | Trustee, since 2009 | James Irvin Miller Professor of Accounting at the Graduate School of Business, Stanford University, Director of the Corporate Governance Research Initiative and Senior Faculty of The Rock Center for Corporate Governance since 2006. From 2005 to 2008, Professor of Accounting at the Graduate School of Business, Stanford University. Prior thereto, Ernst & Young Professor of Accounting at The Wharton School, University of Pennsylvania from 1985 to 2005. | N/A | |||
| Olivia S. Mitchell (Born 1953) | Trustee, since 2006; Nominating and Governance Committee Chair, since 2018 | International Foundation of Employee Benefit Plans Professor, Wharton School of the University of Pennsylvania since 1993. Director of Wharton’s Pension Research Council and Boettner Center on Pensions & Retirement Research, and Research Associate at the National Bureau of Economic Research. Previously, Cornell University Professor from 1978 to 1993. | N/A | |||
| Timothy J. Penny (Born 1951) | Trustee, since 1996; Chairman, since 2018 | President and Chief Executive Officer of Southern Minnesota Initiative Foundation, anon-profit organization, since 2007. Member of the Board of Trustees of NorthStar Education Finance, Inc., anon-profit organization, since 2007. | N/A | |||
| James G. Polisson (Born 1959) | Trustee, since 2018 | Retired. Chief Marketing Officer, Source (ETF) UK Services, Ltd, from 2015 to 2017. From 2012 to 2015, Principal of The Polisson Group, LLC, a management consulting, corporate advisory and principal investing company. Chief Executive Officer and Managing Director at Russell Investments, Global Exchange Traded Funds from 2010 to 2012. Managing Director of Barclays Global Investors from 1998 to 2010 and Global Chief Marketing Officer for iShares and Barclays Global Investors from 2000 to 2010. Trustee of the San Francisco Mechanics’ Institute, anon-profit organization, from 2013 to 2015. Board member of the Russell Exchange Traded Fund Trust from 2011 to 2012. Director of Barclays Global Investors Holdings Deutschland GmbH from 2006 to 2009. Mr. Polisson is an attorney and has a retired status with the Massachusetts and District of Columbia Bar Associations. | N/A | |||
| Pamela Wheelock3 (Born 1959) | Trustee, since January 2020; previously Trustee from January 2018 to July 2019 | Board member of the Destination Medical Center Economic Development Agency, Rochester, Minnesota since 2019. Acting Commissioner, Minnesota Department of Human Services, July 2019 through September 2019. Human Services Manager (part-time), Minnesota Department of Human Services, October 2019 through December 2019. Chief Operating Officer, Twin Cities Habitat for Humanity from 2017 to 2019. Vice President of University Services, University of Minnesota from 2012 to 2016. Prior thereto, on the Board of Directors, Governance Committee and Finance Committee for the Minnesota Philanthropy Partners (Saint Paul Foundation) from 2012 to 2018, Interim Chief Executive Officer of Blue Cross Blue Shield of Minnesota from 2011 to 2012, Chairman of the Board from 2009 to 2012 and Board Director from 2003 to 2015. Vice President, Leadership and Community Engagement, Bush Foundation, Saint Paul, Minnesota (a private foundation) from 2009 to 2011. Executive Vice President and Chief Financial Officer, Minnesota Sports and Entertainment from 2004 to 2009 and Senior Vice President from 2002 to 2004. Executive Vice President of the Minnesota Wild Foundation from 2004 to 2008. Commissioner of Finance, State of Minnesota, from 1999 to 2002. Currently Board Chair of the Minnesota Wild Foundation since 2010. | N/A | |||
| * | Length of service dates reflect the Trustee’s commencement of service with the Trust’s predecessor entities, where applicable. |
26 | Wells Fargo Low Volatility U.S. Equity Fund
Table of Contents
Other information (unaudited)
Officers
| Name and year of birth | Position held and length of service | Principal occupations during past five years or longer | ||
| Andrew Owen (Born 1960) | President, since 2017 | Executive Vice President of Wells Fargo & Company and Head of Affiliated Managers, Wells Fargo Asset Management, since 2014. In addition, Mr. Owen is currently President, Chief Executive Officer and Director of Wells Fargo Funds Management, LLC since 2017. Prior thereto, Executive Vice President responsible for marketing, investments and product development for Wells Fargo Funds Management, LLC, from 2009 to 2014. | ||
| Nancy Wiser1 (Born 1967) | Treasurer, since 2012 | Executive Vice President of Wells Fargo Funds Management, LLC since 2011. Chief Operating Officer and Chief Compliance Officer at LightBox Capital Management LLC, from 2008 to 2011. | ||
| Michelle Rhee (Born 1966) | Chief Legal Officer, since 2019 | Secretary of Wells Fargo Funds Management, LLC, Chief Legal Counsel of Wells Fargo Asset Management and Assistant General Counsel of Wells Fargo Bank, N.A. since 2018. Associate General Counsel and Managing Director of Bank of America Corporation from 2004 to 2018. | ||
| Catherine Kennedy (Born 1969) | Secretary, since 2019 | Vice President of Wells Fargo Funds Management, LLC and Senior Counsel of the Wells Fargo Legal Department since 2010. Vice President and Senior Counsel of Evergreen Investment Management Company, LLC from 1998 to 2010. | ||
| Michael H. Whitaker(Born 1967) | Chief Compliance Officer, since 2016 | Chief Compliance Officer of Wells Fargo Asset Management since 2016. Senior Vice President and Chief Compliance Officer for Fidelity Investments from 2007 to 2016. | ||
| David Berardi (Born 1975) | Assistant Treasurer, since 2009 | Vice President of Wells Fargo Funds Management, LLC since 2009. Vice President of Evergreen Investment Management Company, LLC from 2008 to 2010. Manager of Fund Reporting and Control for Evergreen Investment Management Company, LLC from 2004 to 2010. | ||
| Jeremy DePalma1 (Born 1974) | Assistant Treasurer, since 2009 | Senior Vice President of Wells Fargo Funds Management, LLC since 2009. Senior Vice President of Evergreen Investment Management Company, LLC from 2008 to 2010 and head of the Fund Reporting and Control Team within Fund Administration from 2005 to 2010. | ||
| 1 | Nancy Wiser acts as Treasurer of 64 funds in the Fund Complex. Jeremy DePalma acts as Treasurer of 85 funds and Assistant Treasurer of 64 funds in the Fund Complex. |
| 2 | The Statement of Additional Information includes additional information about the Trustees and is available, without charge, upon request, by calling1-800-222-8222 or by visiting the website atwfam.com. |
| 3 | Pamela Wheelock wasre-appointed to the Board effective January 1, 2020. |
Wells Fargo Low Volatility U.S. Equity Fund | 27
Table of Contents
Effective on or about May 1, 2020, if you purchase Fund shares through a Janney Montgomery Scott LLC (“Janney”) brokerage account, you will be eligible for the following load waivers(front-end sales charge waivers and contingent deferred sales charge (“CDSC”), orback-end sales charge, waivers) and discounts, which may differ from those disclosed elsewhere in the Fund’s Prospectus or SAI.
| Front-end sales charge* waivers on Class A shares available at Janney |
| Shares purchased through reinvestment of capital gains distributions and dividend reinvestment when purchasing shares of the same fund (but not any other fund within the fund family). |
| Shares purchased by employees and registered representatives of Janney or its affiliates and their family members as designated by Janney. |
| Shares purchased from the proceeds of redemptions within the same fund family, provided (1) the repurchase occurs within ninety (90) days following the redemption, (2) the redemption and purchase occur in the same account, and (3) redeemed shares were subject to afront-end or deferred sales load (i.e., right of reinstatement). |
| Employer-sponsored retirement plans (e.g., 401(k) plans, 457 plans, employer-sponsored 403(b) plans, profit sharing and money purchase pension plans and defined benefit plans). For purposes of this provision, employer-sponsored retirement plans do not include SEP IRAs, Simple IRAs,SAR-SEPs or Keogh plans. |
| Shares acquired through a right of reinstatement. |
| Class C shares that are no longer subject to a contingent deferred sales charge and are converted to Class A shares of the same fund pursuant to Janney’s policies and procedures. |
| CDSC waivers on Class A and Class C shares available at Janney |
| Shares sold upon the death or disability of the shareholder. |
| Shares sold as part of a systematic withdrawal plan as described in the Fund’s Prospectus. |
| Shares purchased in connection with a return of excess contributions from an IRA account. |
| Shares sold as part of a required minimum distribution for IRA and retirement accounts if the redemption is taken in or after the year the shareholder reaches qualified age based on applicable IRS regulations. |
| Shares sold to pay Janney fees but only if the transaction is initiated by Janney. |
| Shares acquired through a right of reinstatement. |
| Shares exchanged into the same share class of a different fund. |
| Front-end sales charge* discounts available at Janney; breakpoints, rights of accumulation and/or letters of intent |
| Breakpoints as described in the Fund’s Prospectus. |
| Rights of accumulation (“ROA”), which entitle shareholders to breakpoint discounts, will be automatically calculated based on the aggregated holding of fund family assets held by accounts within the purchaser’s household at Janney. Eligible fund family assets not held at Janney may be included in the ROA calculation only if the shareholder notifies his or her financial advisor about such assets. |
| Letters of intent which allow for breakpoint discounts based on anticipated purchases within a fund family, over a13-month time period. Eligible fund family assets not held at Janney Montgomery Scott may be included in the calculation of letters of intent only if the shareholder notifies his or her financial advisor about such assets. |
| * | Also referred to as an “initial sales charge.” |
28 | Wells Fargo Low Volatility U.S. Equity Fund
Table of Contents
For more information
More information about Wells Fargo Funds is available free upon request. To obtain literature, please write, visit the Fund’s website, or call:
Wells Fargo Funds
P.O. Box 219967
Kansas City, MO 64121-9967
Website:wfam.com
Individual investors:1-800-222-8222
Retail investment professionals:1-888-877-9275
Institutional investment professionals:1-866-765-0778

This report and the financial statements contained herein are submitted for the general information of the shareholders of the Fund. If this report is used for promotional purposes, distribution of the report must be accompanied or preceded by a current prospectus. Before investing, please consider the investment objectives, risks, charges, and expenses of the investment. For a current prospectus and, if available, a summary prospectus, containing this information, call1-800-222-8222 or visit the Fund’s website atwfam.com. Read the prospectus carefully before you invest or send money.
Wells Fargo Asset Management (WFAM) is the trade name for certain investment advisory/management firms owned by Wells Fargo & Company. These firms include but are not limited to Wells Capital Management Incorporated and Wells Fargo Funds Management, LLC. Certain products managed by WFAM entities are distributed by Wells Fargo Funds Distributor, LLC (a broker-dealer and Member FINRA).
This material is for general informational and educational purposes only and is NOT intended to provide investment advice or a recommendation of any kind—including a recommendation for any specific investment, strategy, or plan.
INVESTMENT PRODUCTS: NOT FDIC INSURED ◾ NO BANK GUARANTEE ◾ MAY LOSE VALUE
© 2020 Wells Fargo & Company. All rights reserved
PAR-0020-03839 03-20
SA270/SAR270 01-20
Table of Contents

Semi-Annual Report
January 31, 2020
Wells Fargo Omega Growth Fund
Beginning on January 1, 2021, as permitted by new regulations adopted by the Securities and Exchange Commission, paper copies of the Wells Fargo Funds’ annual and semi-annual shareholder reports issued after this date will no longer be sent by mail, unless you specifically request paper copies of the reports. Instead, the reports will be made available on the Funds’ website, and you will be notified by mail each time a report is posted and provided with a website address to access the report.
If you already elected to receive shareholder reports electronically, you will not be affected by this change and you need not take any action. You may elect to receive shareholder reports and other communications from the Fund electronically at any time by contacting your financial intermediary (such as a broker-dealer or bank) or, if you are a direct investor, by calling1-800-222-8222 or by enrolling at wellsfargo.com/advantagedelivery.
You may elect to receive all future reports in paper free of charge. If you invest through a financial intermediary, you can contact your financial intermediary to request that you continue to receive paper copies of your shareholder reports; if you invest directly with the Fund, you can call 1-800-222-8222. Your election to receive reports in paper will apply to all Wells Fargo Funds held in your account with your financial intermediary or, if you are a direct investor, to all Wells Fargo Funds that you hold.
Table of Contents
|
Reduce clutter. Save trees. |
Sign up for electronic delivery of prospectuses and shareholder reports atwellsfargo.com/advantagedelivery |
The views expressed and any forward-looking statements are as of January 31, 2020, unless otherwise noted, and are those of the Fund managers and/or Wells Fargo Asset Management. Discussions of individual securities, or the markets generally, or any Wells Fargo Fund are not intended as individual recommendations. Future events or results may vary significantly from those expressed in any forward-looking statements. The views expressed are subject to change at any time in response to changing circumstances in the market. Wells Fargo Asset Management and the Fund disclaim any obligation to publicly update or revise any views expressed or forward-looking statements.
INVESTMENT PRODUCTS: NOT FDIC INSURED ◾ NO BANK GUARANTEE ◾ MAY LOSE VALUE
Wells Fargo Omega Growth Fund | 1
Table of Contents
Letter to shareholders (unaudited)

Andrew Owen
President
Wells Fargo Funds
“As the period began, U.S.-China trade tensions continued with no signs of compromise.”
Dear Shareholder:
We are pleased to offer you this semi-annual report for the Wells Fargo Omega Growth Fund for thesix-month period that ended January 31, 2020. Despite some market volatility, the period was strongly positive for financial markets as supportive central banks more than offset concerns over slowing global economic growth and international trade tensions.
Overall, both fixed-income and equity investors enjoyed healthy annual returns, with U.S. markets leading the way. For the period, U.S. stocks, based on the S&P 500 Index,1 gained 9.31% and international stocks, as measured by the MSCI ACWI ex USA Index (Net),2 returned 5.37%. The MSCI EM Index (Net)3 gained a more modest 3.36%. For bond investors, the Bloomberg Barclays U.S. Aggregate Bond Index4 added 4.20%, the Bloomberg Barclays Global Aggregateex-USD Index5 returned 1.58%, the Bloomberg Barclays Municipal Bond Index6 gained 3.33%, and the ICE BofA U.S. High Yield Index7 added 3.34%.
The period began with uncertainty, leading to central bank support.
In August as the period began, U.S.-China trade tensions continued with no signs of compromise. Evidence of a continued global economic slowdown mounted, and central banks in China, New Zealand, and Thailand cut interest rates. Industrial and manufacturing data declined in China, Canada, Japan, and Germany. Adding to global uncertainty, Italy’s prime minister resigned, many feared a crackdown in Hong Kong as protestors sustained their calls for reform, and Boris Johnson planned to suspend Parliament as Brexit’s deadline neared.
In the U.S., the Federal Reserve (Fed) cut interest rates a second time in the third quarter in September. U.S. manufacturing data disappointed investors. The U.S. Congress announced it would pursue an impeachment investigation of President Trump. Meanwhile, the Brexit impasse showed no signs of resolution. Officials in China said that hitting the country’s economic growth goals for the year would be difficult considering the weight of tariffs and trade restrictions. Although the S&P 500 Index finished the third quarter with the bestyear-to-date returns in more than 20 years, concerns about future returns remained.
The fourth quarter started on a strong note, with U.S.-China trade tensions relaxing in October along with renewed optimism for a U.K. Brexit deal and positive macroeconomic data. The initial estimate of U.S. third-quarter gross domestic product growth was a resilient 1.9% annualized rate, while the U.S. unemployment rate fell to a50-year low of 3.5% in September. However, despite resilience among U.S. consumers, business
| 1 | The S&P 500 Index consists of 500 stocks chosen for market size, liquidity, and industry group representation. It is a market-value-weighted index with each stock’s weight in the index proportionate to its market value. You cannot invest directly in an index. |
| 2 | The Morgan Stanley Capital International (MSCI) All Country World Index (ACWI) ex USA Index (Net) is a free-float-adjusted market-capitalization-weighted index that is designed to measure the equity market performance of developed markets, excluding the United States. Source: MSCI. MSCI makes no express or implied warranties or representations and shall have no liability whatsoever with respect to any MSCI data contained herein. The MSCI data may not be further redistributed or used as a basis for other indices or any securities or financial products. This report is not approved, reviewed, or produced by MSCI. You cannot invest directly in an index. |
| 3 | The MSCI Emerging Markets (EM) Index (Net) is a free-float-adjusted market-capitalization-weighted index that is designed to measure equity market performance of emerging markets. You cannot invest directly in an index. |
| 4 | The Bloomberg Barclays U.S. Aggregate Bond Index is a broad-based benchmark that measures the investment-grade, U.S. dollar-denominated, fixed-rate taxable bond market, including Treasuries, government-related and corporate securities, mortgage-backed securities (agency fixed-rate and hybrid adjustable-rate mortgage pass-throughs), asset-backed securities, and commercial mortgage-backed securities. You cannot invest directly in an index. |
| 5 | The Bloomberg Barclays Global Aggregateex-USD Index is an unmanaged index that provides a broad-based measure of the global investment-grade fixed-income markets excluding the U.S. dollar-denominated debt market. You cannot invest directly in an index. |
| 6 | The Bloomberg Barclays Municipal Bond Index is an unmanaged index composed of long-termtax-exempt bonds with a minimum credit rating of Baa. You cannot invest directly in an index. |
| 7 | The ICE BofA U.S. High Yield Index is a market-capitalization-weighted index of domestic and Yankee high-yield bonds. The index tracks the performance of high-yield securities traded in the U.S. bond market. You cannot invest directly in an index. Copyright 2020. ICE Data Indices, LLC. All rights reserved. |
2 | Wells Fargo Omega Growth Fund
Table of Contents
Letter to shareholders (unaudited)
confidence declined while manufacturing activity contracted. Concerned with a potential economic slowdown, the Fed lowered interest rates another quarter point in late October, its third rate cut in four months. This helped push the S&P 500 Index to a newall-time high, while emerging market equities rallied and global bonds declined overall, reflecting a broad pickup in risk appetite.
Equity markets continued to rally in November despite ongoing geopolitical risks. Hopes for a U.S.-China trade deal buoyed investor confidence. U.S. business sentiment improved slightly, and manufacturing and services activity picked up. Throughout the month, central bank actions were on hold. With that positive backdrop, developed market equities outpaced those in emerging markets, and U.S. stocks, as reflected by the S&P 500 Index, outperformednon-U.S. stocks overall. While consumer confidence and purchasing manager activity rose in the eurozone, China reported weakening manufacturing and consumer data. Bond yields rose marginally, leading to slightly negative returns for global government and investment-grade corporate bonds.
Financial markets ended 2019 on a broadly positive note, with the U.S. and China reaching an accord on a Phase One trade deal, with some details to be worked out. That, along with the landslide win by thepro-Brexit U.K. Conservative Party in a national election and ongoing central bank support, gave investors greater certainty and confidence. U.S. economic indicators were generally positive, with the exception of manufacturing activity and business confidence. However, consumer confidence was resilient, fed by a robust labor market, tame inflation, and lower interest rates, which boosted housing affordability and stimulated homebuyer activity. The impeachment of U.S. President Donald Trump, while historically noteworthy, had little impact on markets. Meanwhile, slowing Chinese economic activity, partly attributable to the trade war, led to further government stimulus atyear-end through lower reserve ratios, allowing banks to lend more money.
Theyear-end rally continued in early January 2020. However, capital market volatility picked up in late January on concerns over the unknown impact of the coronavirus on the global economy and stock markets. With sentiment somewhat souring, perceived safe havens did well in January. The U.S. dollar and Japanese yen both rose and government bonds outperformed equities. While the S&P 500 Index held its ground, emerging market equities tumbled, including those in Asia that are most exposed to viruses—physical or economic—originating in China.
Following the end of the reporting period, the coronavirus continued its global spread, resulting in disruptions to global markets, including through border closings, restrictions on travel and large gatherings, expedited and enhanced health screenings, quarantines, cancellations, business and school closings, disruptions to employment and supply chains, reduced productivity, and reduced customer and client activity in multiple markets and sectors. The risk of further spreading of the coronavirus has led to significant uncertainty and volatility in the financial markets. The full extent of the coronavirus’s impact on the global economy cannot necessarily be foreseen and the impacts may be short term or may last for an extended period of time.
Don’t let short-term uncertainty derail long-term investment goals.
Periods of investment uncertainty can present challenges, but experience has taught us that maintaining long-term investment goals can be an effective way to plan for the future. To help you create a sound strategy based on your personal goals and risk tolerance, Wells Fargo Funds offers more than 100 mutual funds spanning a wide range of asset classes and investment styles. Although diversification cannot guarantee an investment profit or prevent losses, we believe it can be an effective way to manage investment risk and potentially smooth out overall portfolio performance. We encourage investors to know their investments and to understand that appropriate levels of risk-taking may unlock opportunities.
“Financial markets ended 2019 on a broadly positive note, with the U.S. and China reaching an accord on a Phase One trade deal.”
|
For further information about your Fund, contact your investment professional, visit our website at wfam.com, or call us directly at1-800-222-8222. |
Wells Fargo Omega Growth Fund | 3
Table of Contents
Letter to shareholders (unaudited)
Thank you for choosing to invest with Wells Fargo Funds. We appreciate your confidence in us and remain committed to helping you meet your financial needs.
Sincerely,

Andrew Owen
President
Wells Fargo Funds
4 | Wells Fargo Omega Growth Fund
Table of Contents
Performance highlights (unaudited)
Investment objective
The Fund seeks long-term capital appreciation.
Manager
Wells Fargo Funds Management, LLC
Subadviser
Wells Capital Management Incorporated
Portfolio managers
Michael T. Smith, CFA®‡
Christopher J. Warner, CFA®‡
Average annual total returns (%) as of January 31, 20201
| Including sales charge | Excluding sales charge | Expense ratios2 (%) | ||||||||||||||||||||||||||||||||
| Inception date | 1 year | 5 year | 10 year | 1 year | 5 year | 10 year | Gross | Net3 | ||||||||||||||||||||||||||
| Class A (EKOAX) | 4-29-1968 | 19.44 | 12.99 | 13.97 | 26.73 | 14.33 | 14.65 | 1.28 | 1.28 | |||||||||||||||||||||||||
| Class C (EKOCX) | 8-2-1993 | 24.77 | 13.48 | 13.79 | 25.77 | 13.48 | 13.79 | 2.03 | 2.03 | |||||||||||||||||||||||||
| Class R (EKORX) | 10-10-2003 | – | – | – | 26.41 | 14.06 | 14.36 | 1.53 | 1.53 | |||||||||||||||||||||||||
| Administrator Class (EOMYX) | 1-13-1997 | – | – | – | 26.97 | 14.56 | 14.90 | 1.20 | 1.10 | |||||||||||||||||||||||||
| Institutional Class (EKONX)4 | 7-30-2010 | – | – | – | 27.26 | 14.85 | 15.18 | 0.95 | 0.85 | |||||||||||||||||||||||||
| Russell 3000® Growth Index5 | – | – | – | – | 26.94 | 15.05 | 15.80 | – | – | |||||||||||||||||||||||||
Figures quoted represent past performance, which is no guarantee of future results, and do not reflect taxes that shareholder may pay on an investment in a fund. Investment return and principal value of an investment will fluctuate so that an investor’s shares, when redeemed, may be worth more or less than their original cost. Performance shown without sales charges would be lower if sales charges were reflected. Current performance may be lower or higher than the performance data quoted, which assumes the reinvestment of dividends and capital gains. Currentmonth-end performance is available on the Fund’s website,wfam.com.
Please keep in mind that high double-digit returns were primarily achieved during favorable market conditions. You should not expect that such favorable returns can be consistently achieved. A fund’s performance, especially for short time periods, should not be the sole factor in making your investment decision.
Index returns do not include transaction costs associated with buying and selling securities, any mutual fund fees or expenses, or any taxes. It is not possible to invest directly in an index.
For Class A shares, the maximumfront-end sales charge is 5.75%. For Class C shares, the maximum contingent deferred sales charge is 1.00%. Performance including a contingent deferred sales charge assumes the sales charge for the corresponding time period. Class R, Administrator Class, and Institutional Class shares are sold without afront-end sales charge or contingent deferred sales charge.
Stock values fluctuate in response to the activities of individual companies and general market and economic conditions. Certain investment strategies tend to increase the total risk of an investment (relative to the broader market). The Fund is exposed to foreign investment risk and smaller-company securities risk. Consult the Fund’s prospectus for additional information on these and other risks.
Please see footnotes on page 6.
Wells Fargo Omega Growth Fund | 5
Table of Contents
Performance highlights (unaudited)
| Ten largest holdings (%) as of January 31, 20206 | ||||
Microsoft Corporation | 9.34 | |||
Amazon.com Incorporated | 5.99 | |||
Alphabet Incorporated Class A | 4.19 | |||
Visa Incorporated Class A | 4.06 | |||
UnitedHealth Group Incorporated | 3.33 | |||
Merck & Company Incorporated | 2.49 | |||
ServiceNow Incorporated | 2.44 | |||
Waste Connections Incorporated | 2.30 | |||
PayPal Holdings Incorporated | 2.10 | |||
EPAM Systems Incorporated | 1.97 | |||
| Sector distribution as of January 31, 20207 |
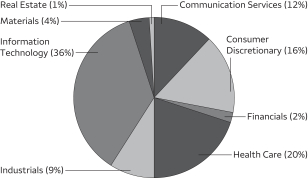 |
| ‡ | CFA® and Chartered Financial Analyst® are trademarks owned by CFA Institute. |
| 1 | Historical performance shown prior to July 19, 2010, is based on the performance of the Fund’s predecessor, Evergreen Omega Fund. |
| 2 | Reflects the expense ratios as stated in the most recent prospectuses. The expense ratios shown are subject to change and may differ from the annualized expense ratios shown in the financial highlights of this report. |
| 3 | The manager has contractually committed through November 30, 2020, to waive fees and/or reimburse expenses to the extent necessary to cap total annual fund operating expenses after fee waivers at 1.30% for Class A, 2.05% for Class C, 1.55% for Class R, 1.10% for Administrator Class, and 0.85% for Institutional Class. Brokerage commissions, stamp duty fees, interest, taxes, acquired fund fees and expenses (if any), and extraordinary expenses are excluded from the expense cap. Prior to or after the commitment expiration date, the cap may be increased or the commitment to maintain the cap may be terminated only with the approval of the Board of Trustees. Without this cap, the Fund’s returns would have been lower. The expense ratio paid by an investor is the net expense ratio (the total annual fund operating expenses after fee waivers) as stated in the prospectuses. |
| 4 | Historical performance shown for the Institutional Class shares prior to their inception reflects the performance of the Administrator Class shares, and includes the higher expenses applicable to the Administrator Class shares. If these expenses had not been included, returns for the Institutional Class shares would be higher. |
| 5 | The Russell 3000® Growth Index measures the performance of those Russell 3000® Index companies with higher price/book ratios and higher forecasted growth values. You cannot invest directly in an index. |
| 6 | The ten largest holdings, excluding cash, cash equivalents and any money market funds, are calculated based on the value of the investments divided by total net assets of the Fund. Holdings are subject to change and may have changed since the date specified. |
| 7 | Amounts are calculated based on the total long-term investments of the Fund. These amounts are subject to change and may have changed since the date specified. |
6 | Wells Fargo Omega Growth Fund
Table of Contents
As a shareholder of the Fund, you incur two types of costs: (1) transaction costs, including sales charges (loads) on purchase payments and contingent deferred sales charges (if any) on redemptions and (2) ongoing costs, including management fees, distribution(12b-1) and/or shareholder servicing fees, and other Fund expenses. This example is intended to help you understand your ongoing costs (in dollars) of investing in the Fund and to compare these costs with the ongoing costs of investing in other mutual funds.
The example is based on an investment of $1,000 invested at the beginning of thesix-month period and held for the entire period from August 1, 2019 to January 31, 2020.
Actual expenses
The “Actual” line of the table below provides information about actual account values and actual expenses. You may use the information in this line, together with the amount you invested, to estimate the expenses that you paid over the period. Simply divide your account value by $1,000 (for example, an $8,600 account value divided by $1,000 = 8.6), then multiply the result by the number in the “Actual” line under the heading entitled “Expenses paid during period” for your applicable class of shares to estimate the expenses you paid on your account during this period.
Hypothetical example for comparison purposes
The “Hypothetical” line of the table below provides information about hypothetical account values and hypothetical expenses based on the Fund’s actual expense ratio and an assumed rate of return of 5% per year before expenses, which is not the Fund’s actual return. The hypothetical account values and expenses may not be used to estimate the actual ending account balance or expenses you paid for the period. You may use this information to compare the ongoing costs of investing in the Fund and other funds. To do so, compare this 5% hypothetical example with the 5% hypothetical examples that appear in the shareholder reports of the other funds.
Please note that the expenses shown in the table are meant to highlight your ongoing costs only and do not reflect any transactional costs, such as sales charges (loads) and contingent deferred sales charges. Therefore, the “Hypothetical” line of the table is useful in comparing ongoing costs only and will not help you determine the relative total costs of owning different funds. In addition, if these transactional costs were included, your costs would have been higher.
| Beginning account value 8-1-2019 | Ending account value 1-31-2020 | Expenses paid during the period1 | Annualized net expense ratio | |||||||||||||
Class A | ||||||||||||||||
Actual | $ | 1,000.00 | $ | 1,078.29 | $ | 6.69 | 1.28 | % | ||||||||
Hypothetical (5% return before expenses) | $ | 1,000.00 | $ | 1,018.70 | $ | 6.50 | 1.28 | % | ||||||||
Class C | ||||||||||||||||
Actual | $ | 1,000.00 | $ | 1,074.16 | $ | 10.58 | 2.03 | % | ||||||||
Hypothetical (5% return before expenses) | $ | 1,000.00 | $ | 1,014.93 | $ | 10.28 | 2.03 | % | ||||||||
Class R | ||||||||||||||||
Actual | $ | 1,000.00 | $ | 1,076.99 | $ | 7.94 | 1.52 | % | ||||||||
Hypothetical (5% return before expenses) | $ | 1,000.00 | $ | 1,017.50 | $ | 7.71 | 1.52 | % | ||||||||
Administrator Class | ||||||||||||||||
Actual | $ | 1,000.00 | $ | 1,079.42 | $ | 5.65 | 1.08 | % | ||||||||
Hypothetical (5% return before expenses) | $ | 1,000.00 | $ | 1,019.71 | $ | 5.48 | 1.08 | % | ||||||||
Institutional Class | ||||||||||||||||
Actual | $ | 1,000.00 | $ | 1,080.60 | $ | 4.45 | 0.85 | % | ||||||||
Hypothetical (5% return before expenses) | $ | 1,000.00 | $ | 1,020.86 | $ | 4.32 | 0.85 | % | ||||||||
| 1 | Expenses paid is equal to the annualized net expense ratio of each class multiplied by the average account value over the period, multiplied by the number of days in the most recent fiscal half-year divided by the number of days in the fiscal year (to reflect theone-half-year period). |
Wells Fargo Omega Growth Fund | 7
Table of Contents
Portfolio of investments—January 31, 2020 (unaudited)
| Shares | Value | |||||||||||||||
| Common Stocks: 100.05% | ||||||||||||||||
Communication Services: 11.82% | ||||||||||||||||
| Entertainment: 3.79% | ||||||||||||||||
Netflix Incorporated † | 37,000 | $ | 12,768,330 | |||||||||||||
Nintendo Company Limited ADR | 226,338 | 10,388,914 | ||||||||||||||
Take-Two Interactive Software Incorporated † | 76,100 | 9,485,104 | ||||||||||||||
| 32,642,348 | ||||||||||||||||
|
| |||||||||||||||
| Interactive Media & Services: 8.03% | ||||||||||||||||
Alphabet Incorporated Class A † | 25,200 | 36,106,056 | ||||||||||||||
Alphabet Incorporated Class C † | 7,585 | 10,878,635 | ||||||||||||||
IAC Corporation † | 50,700 | 12,350,013 | ||||||||||||||
Tencent Holdings Limited ADR | 207,800 | 9,955,698 | ||||||||||||||
| 69,290,402 | ||||||||||||||||
|
| |||||||||||||||
Consumer Discretionary: 15.82% | ||||||||||||||||
| Auto Components: 1.21% | ||||||||||||||||
Aptiv plc | 122,900 | 10,420,691 | ||||||||||||||
|
| |||||||||||||||
| Automobiles: 0.86% | ||||||||||||||||
Ferrari NV | 44,100 | 7,444,962 | ||||||||||||||
|
| |||||||||||||||
| Diversified Consumer Services: 1.17% | ||||||||||||||||
Bright Horizons Family Solutions Incorporated † | 61,457 | 10,062,355 | ||||||||||||||
|
| |||||||||||||||
| Hotels, Restaurants & Leisure: 3.62% | ||||||||||||||||
Chipotle Mexican Grill Incorporated † | 16,500 | 14,301,540 | ||||||||||||||
Domino’s Pizza Incorporated | 24,300 | 6,846,525 | ||||||||||||||
Vail Resorts Incorporated | 42,902 | 10,060,948 | ||||||||||||||
| 31,209,013 | ||||||||||||||||
|
| |||||||||||||||
| Internet & Direct Marketing Retail: 7.34% | ||||||||||||||||
Amazon.com Incorporated † | 25,700 | 51,624,104 | ||||||||||||||
MercadoLibre Incorporated † | 17,600 | 11,668,800 | ||||||||||||||
| 63,292,904 | ||||||||||||||||
|
| |||||||||||||||
| Specialty Retail: 1.62% | ||||||||||||||||
The Home Depot Incorporated | 61,400 | 14,005,340 | ||||||||||||||
|
| |||||||||||||||
Financials: 2.60% | ||||||||||||||||
| Capital Markets: 2.60% | ||||||||||||||||
Intercontinental Exchange Incorporated | 146,800 | 14,641,832 | ||||||||||||||
Raymond James Financial Incorporated | 84,902 | 7,762,590 | ||||||||||||||
| 22,404,422 | ||||||||||||||||
|
| |||||||||||||||
Health Care: 20.67% | ||||||||||||||||
| Biotechnology: 1.69% | ||||||||||||||||
Exact Sciences Corporation † | 129,700 | 12,098,416 | ||||||||||||||
Sarepta Therapeutics Incorporated † | 21,600 | 2,504,736 | ||||||||||||||
| 14,603,152 | ||||||||||||||||
|
| |||||||||||||||
The accompanying notes are an integral part of these financial statements.
8 | Wells Fargo Omega Growth Fund
Table of Contents
Portfolio of investments—January 31, 2020 (unaudited)
| Shares | Value | |||||||||||||||
| Health Care Equipment & Supplies: 8.74% | ||||||||||||||||
Alcon Incorporated † | 182,400 | $ | 10,750,656 | |||||||||||||
Align Technology Incorporated † | 34,100 | 8,767,110 | ||||||||||||||
Boston Scientific Corporation † | 393,200 | 16,463,284 | ||||||||||||||
DexCom Incorporated † | 61,400 | 14,782,050 | ||||||||||||||
Edwards Lifesciences Corporation † | 40,900 | 8,992,274 | ||||||||||||||
Intuitive Surgical Incorporated † | 28,000 | 15,673,840 | ||||||||||||||
| 75,429,214 | ||||||||||||||||
|
| |||||||||||||||
| Health Care Providers & Services: 4.57% | ||||||||||||||||
HealthEquity Incorporated † | 162,348 | 10,724,709 | ||||||||||||||
UnitedHealth Group Incorporated | 105,300 | 28,688,985 | ||||||||||||||
| 39,413,694 | ||||||||||||||||
|
| |||||||||||||||
| Health Care Technology: 1.13% | ||||||||||||||||
Veeva Systems Incorporated Class A † | 66,300 | 9,720,243 | ||||||||||||||
|
| |||||||||||||||
| Life Sciences Tools & Services: 0.92% | ||||||||||||||||
Illumina Incorporated † | 27,400 | 7,947,918 | ||||||||||||||
|
| |||||||||||||||
| Pharmaceuticals: 3.62% | ||||||||||||||||
Elanco Animal Health Incorporated † | 313,719 | 9,693,917 | ||||||||||||||
Eli Lilly & Company | 1 | 140 | ||||||||||||||
Merck & Company Incorporated | 251,700 | 21,505,248 | ||||||||||||||
| 31,199,305 | ||||||||||||||||
|
| |||||||||||||||
Industrials: 8.71% |
| |||||||||||||||
| Commercial Services & Supplies: 3.63% | ||||||||||||||||
Cintas Corporation | 40,900 | 11,409,873 | ||||||||||||||
Waste Connections Incorporated | 206,322 | 19,870,872 | ||||||||||||||
| 31,280,745 | ||||||||||||||||
|
| |||||||||||||||
| Construction & Engineering: 1.25% | ||||||||||||||||
Jacobs Engineering Group Incorporated | 117,000 | 10,826,010 | ||||||||||||||
|
| |||||||||||||||
| Professional Services: 1.88% | ||||||||||||||||
IHS Markit Limited | 205,800 | 16,229,388 | ||||||||||||||
|
| |||||||||||||||
| Road & Rail: 1.95% | ||||||||||||||||
Union Pacific Corporation | 93,600 | 16,793,712 | ||||||||||||||
|
| |||||||||||||||
Information Technology: 35.91% |
| |||||||||||||||
| Communications Equipment: 1.90% | ||||||||||||||||
Motorola Solutions Incorporated | 92,600 | 16,390,200 | ||||||||||||||
|
| |||||||||||||||
| Electronic Equipment, Instruments & Components: 1.13% | ||||||||||||||||
Zebra Technologies Corporation Class A † | 40,900 | 9,775,918 | ||||||||||||||
|
| |||||||||||||||
| IT Services: 18.77% | ||||||||||||||||
Black Knight Incorporated † | 220,500 | 14,755,860 | ||||||||||||||
EPAM Systems Incorporated † | 74,341 | 16,960,156 | ||||||||||||||
Euronet Worldwide Incorporated † | 90,700 | 14,297,948 | ||||||||||||||
Fiserv Incorporated † | 134,440 | 15,945,928 | ||||||||||||||
Global Payments Incorporated | 86,049 | 16,818,277 | ||||||||||||||
PayPal Holdings Incorporated † | 159,000 | 18,108,510 | ||||||||||||||
The accompanying notes are an integral part of these financial statements.
Wells Fargo Omega Growth Fund | 9
Table of Contents
Portfolio of investments—January 31, 2020 (unaudited)
| Shares | Value | |||||||||||||||
| IT Services (continued) | ||||||||||||||||
Shopify Incorporated Class A † | 13,600 | $ | 6,332,976 | |||||||||||||
Square Incorporated Class A † | 120,000 | 8,962,800 | ||||||||||||||
Visa Incorporated Class A | 175,804 | 34,979,722 | ||||||||||||||
WEX Incorporated † | 67,702 | 14,685,918 | ||||||||||||||
| 161,848,095 | ||||||||||||||||
|
| |||||||||||||||
| Software: 14.11% | ||||||||||||||||
Atlassian Corporation plc Class A † | 49,700 | 7,305,900 | ||||||||||||||
Autodesk Incorporated † | 65,300 | 12,854,305 | ||||||||||||||
Microsoft Corporation | 473,200 | 80,552,836 | ||||||||||||||
ServiceNow Incorporated † | 62,100 | 21,004,083 | ||||||||||||||
| 121,717,124 | ||||||||||||||||
|
| |||||||||||||||
Materials: 3.93% | ||||||||||||||||
| Chemicals: 2.55% | ||||||||||||||||
Ingevity Corporation † | 79,500 | 5,184,990 | ||||||||||||||
The Sherwin-Williams Company | 30,200 | 16,821,098 | ||||||||||||||
| 22,006,088 | ||||||||||||||||
|
| |||||||||||||||
| Construction Materials: 1.38% | ||||||||||||||||
Vulcan Materials Company | 83,900 | 11,882,757 | ||||||||||||||
|
| |||||||||||||||
Real Estate: 0.59% | ||||||||||||||||
| Equity REITs: 0.59% | ||||||||||||||||
SBA Communications Corporation | 20,300 | 5,066,066 | ||||||||||||||
|
| |||||||||||||||
Total Common Stocks (Cost $480,159,182) | 862,902,066 | |||||||||||||||
|
| |||||||||||||||
| Yield | ||||||||||||||||
| Short-Term Investments: 0.40% | ||||||||||||||||
| Investment Companies: 0.40% | ||||||||||||||||
Wells Fargo Government Money Market Fund Select Class (l)(u) | 1.51 | % | 3,425,270 | 3,425,270 | ||||||||||||
|
| |||||||||||||||
Total Short-Term Investments (Cost $3,425,270) | 3,425,270 | |||||||||||||||
|
| |||||||||||||||
| Total investments in securities (Cost $483,584,452) | 100.45 | % | 866,327,336 | |||||
Other assets and liabilities, net | (0.45 | ) | (3,866,007 | ) | ||||
|
|
|
| |||||
| Total net assets | 100.00 | % | $ | 862,461,329 | ||||
|
|
|
| |||||
| † | Non-income-earning security |
| (l) | The issuer of the security is an affiliated person of the Fund as defined in the Investment Company Act of 1940. |
| (u) | The rate represents the7-day annualized yield at period end. |
Abbreviations:
| ADR | American depositary receipt |
| REIT | Real estate investment trust |
The accompanying notes are an integral part of these financial statements.
10 | Wells Fargo Omega Growth Fund
Table of Contents
Portfolio of investments—January 31, 2020 (unaudited)
Investments in Affiliates
An affiliated investment is an investment in which the Fund owns at least 5% of the outstanding voting shares of the issuer or as a result of other relationships, such as the Fund and the issuer having the same investment manager. Transactions with issuers that were either affiliated persons of the Fund at the beginning of the period or the end of the period were as follows:
| Shares, beginning of period | Shares purchased | Shares sold | Shares, end of period | Net realized gains (losses) | Net change in unrealized gains (losses) | Income from affiliated securities | Value, end of period | % of net assets | ||||||||||||||||||||||||||||
| Short-Term Investments | ||||||||||||||||||||||||||||||||||||
Investment Companies | ||||||||||||||||||||||||||||||||||||
Securities Lending Cash Investments LLC* | 0 | 21,600,925 | (21,600,925 | ) | 0 | $ | 1,057 | $ | 0 | $ | 72,051 | # | $ | 0 | ||||||||||||||||||||||
Wells Fargo Government Money Market Fund Select Class | 6,308,644 | 78,016,942 | (80,900,316 | ) | 3,425,270 | 0 | 0 | 52,675 | 3,425,270 | |||||||||||||||||||||||||||
|
|
|
|
|
|
|
|
|
| |||||||||||||||||||||||||||
| $ | 1,057 | $ | 0 | $ | 124,726 | $ | 3,425,270 | 0.40 | % | |||||||||||||||||||||||||||
|
|
|
|
|
|
|
|
|
| |||||||||||||||||||||||||||
| * | No longer held at the end of the period |
| # | Amount shown represents income before fees and rebates. |
The accompanying notes are an integral part of these financial statements.
Wells Fargo Omega Growth Fund | 11
Table of Contents
Statement of assets and liabilities—January 31, 2020 (unaudited)
Assets | ||||
Investments in unaffiliated securities, at value (cost $480,159,182) | $ | 862,902,066 | ||
Investments in affiliated securities, at value (cost $3,425,270) | 3,425,270 | |||
Receivable for investments sold | 109,718 | |||
Receivable for Fund shares sold | 181,842 | |||
Receivable for dividends | 51,039 | |||
Receivable for securities lending income | 2,125 | |||
Prepaid expenses and other assets | 52,539 | |||
|
| |||
Total assets | 866,724,599 | |||
|
| |||
Liabilities | ||||
Payable for investments purchased | 2,069,530 | |||
Payable for Fund shares redeemed | 1,209,309 | |||
Management fee payable | 601,119 | |||
Administration fees payable | 156,908 | |||
Distribution fees payable | 16,306 | |||
Trustees’ fees and expenses payable | 5,593 | |||
Accrued expenses and other liabilities | 204,505 | |||
|
| |||
Total liabilities | 4,263,270 | |||
|
| |||
Total net assets | $ | 862,461,329 | ||
|
| |||
Net assets consist of | ||||
Paid-in capital | $ | 463,101,457 | ||
Total distributable earnings | 399,359,872 | |||
|
| |||
Total net assets | $ | 862,461,329 | ||
|
| |||
Computation of net asset value and offering price per share | ||||
Net assets – Class A | $ | 728,733,566 | ||
Shares outstanding – Class A1 | 12,959,105 | |||
Net asset value per share – Class A | $56.23 | |||
Maximum offering price per share – Class A2 | $59.66 | |||
Net assets – Class C | $ | 21,811,810 | ||
Shares outstanding – Class C1 | 619,436 | |||
Net asset value per share – Class C | $35.21 | |||
Net assets – Class R | $ | 4,661,552 | ||
Shares outstanding – Class R1 | 88,748 | |||
Net asset value per share – Class R | $52.53 | |||
Net assets – Administrator Class | $ | 25,937,454 | ||
Shares outstanding – Administrator Class1 | 417,614 | |||
Net asset value per share – Administrator Class | $62.11 | |||
Net assets – Institutional Class | $ | 81,316,947 | ||
Shares outstanding – Institutional Class1 | 1,261,419 | |||
Net asset value per share – Institutional Class | $64.46 | |||
| 1 | The Fund has an unlimited number of authorized shares. |
| 2 | Maximum offering price is computed as 100/94.25 of net asset value. On investments of $50,000 or more, the offering price is reduced. |
The accompanying notes are an integral part of these financial statements.
12 | Wells Fargo Omega Growth Fund
Table of Contents
Statement of operations—six months ended January 31, 2020 (unaudited)
Investment income | ||||
Dividends (net of foreign withholding taxes of $27,912) | $ | 2,524,438 | ||
Income from affiliated securities | 64,889 | |||
|
| |||
Total investment income | 2,589,327 | |||
|
| |||
Expenses | ||||
Management fee | 3,287,217 | |||
Administration fees | ||||
Class A | 745,832 | |||
Class C | 24,430 | |||
Class R | 5,903 | |||
Administrator Class | 16,437 | |||
Institutional Class | 50,842 | |||
Shareholder servicing fees | ||||
Class A | 887,895 | |||
Class C | 29,083 | |||
Class R | 6,793 | |||
Administrator Class | 31,610 | |||
Distribution fees | ||||
Class C | 87,139 | |||
Class R | 6,970 | |||
Custody and accounting fees | 21,615 | |||
Professional fees | 26,589 | |||
Registration fees | 43,100 | |||
Shareholder report expenses | 61,151 | |||
Trustees’ fees and expenses | 10,864 | |||
Other fees and expenses | 10,681 | |||
|
| |||
Total expenses | 5,354,151 | |||
Less: Fee waivers and/or expense reimbursements | ||||
Class A | (22,211 | ) | ||
Class C | (172 | ) | ||
Administrator Class | (15,534 | ) | ||
Institutional Class | (39,835 | ) | ||
|
| |||
Net expenses | 5,276,399 | |||
|
| |||
Net investment loss | (2,687,072 | ) | ||
|
| |||
Realized and unrealized gains (losses) on investments | ||||
Net realized gains on | ||||
Unaffiliated securities | 34,262,791 | |||
Affiliated securities | 1,057 | |||
|
| |||
Net realized gains on investments | 34,263,848 | |||
Net change in unrealized gains (losses) on investments | 31,362,676 | |||
|
| |||
Net realized and unrealized gains (losses) on investments | 65,626,524 | |||
|
| |||
Net increase in net assets resulting from operations | $ | 62,939,452 | ||
|
| |||
The accompanying notes are an integral part of these financial statements.
Wells Fargo Omega Growth Fund | 13
Table of Contents
Statement of changes in net assets
| Six months ended January 31, 2020 (unaudited) | Year ended July 31, 2019 | |||||||||||||||
Operations | ||||||||||||||||
Net investment loss | $ | (2,687,072 | ) | $ | (5,063,447 | ) | ||||||||||
Net realized gains on investments | 34,263,848 | 47,925,154 | ||||||||||||||
Net change in unrealized gains (losses) on investments | 31,362,676 | 60,465,004 | ||||||||||||||
|
| |||||||||||||||
Net increase in net assets resulting from operations | 62,939,452 | 103,326,711 | ||||||||||||||
|
| |||||||||||||||
Distributions to shareholders from net investment income and net realized gains | ||||||||||||||||
Class A | (38,639,530 | ) | (68,419,305 | ) | ||||||||||||
Class C | (1,862,430 | ) | (8,678,201 | ) | ||||||||||||
Class R | (304,034 | ) | (707,933 | ) | ||||||||||||
Administrator Class | (1,255,690 | ) | (2,403,661 | ) | ||||||||||||
Institutional Class | (3,766,464 | ) | (6,323,228 | ) | ||||||||||||
|
| |||||||||||||||
Total distributions to shareholders | (45,828,148 | ) | (86,532,328 | ) | ||||||||||||
|
| |||||||||||||||
Capital share transactions | Shares | Shares | ||||||||||||||
Proceeds from shares sold | ||||||||||||||||
Class A | 153,922 | 8,309,125 | 957,256 | 46,969,436 | ||||||||||||
Class C | 15,820 | 549,290 | 74,164 | 2,327,314 | ||||||||||||
Class R | 8,860 | 450,044 | 28,311 | 1,316,755 | ||||||||||||
Administrator Class | 4,951 | 299,784 | 21,538 | 1,243,245 | ||||||||||||
Institutional Class | 93,835 | 5,792,851 | 247,352 | 14,363,418 | ||||||||||||
|
| |||||||||||||||
| 15,401,094 | 66,220,168 | |||||||||||||||
|
| |||||||||||||||
Reinvestment of distributions | ||||||||||||||||
Class A | 697,108 | 37,030,375 | 1,458,710 | 65,102,208 | ||||||||||||
Class C | 53,921 | 1,795,565 | 288,212 | 8,392,731 | ||||||||||||
Class R | 4,691 | 232,868 | 9,582 | 402,155 | ||||||||||||
Administrator Class | 19,576 | 1,148,300 | 44,842 | 2,194,127 | ||||||||||||
Institutional Class | 61,188 | 3,723,927 | 123,606 | 6,249,540 | ||||||||||||
|
| |||||||||||||||
| 43,931,035 | 82,340,761 | |||||||||||||||
|
| |||||||||||||||
Payment for shares redeemed | ||||||||||||||||
Class A | (835,394 | ) | (45,443,354 | ) | (1,573,949 | ) | (79,522,009 | ) | ||||||||
Class C | (179,288 | ) | (6,237,955 | ) | (1,265,970 | ) | (40,375,871 | ) | ||||||||
Class R | (42,454 | ) | (2,185,033 | ) | (64,569 | ) | (3,197,822 | ) | ||||||||
Administrator Class | (38,394 | ) | (2,286,101 | ) | (41,328 | ) | (2,257,844 | ) | ||||||||
Institutional Class | (97,148 | ) | (6,055,886 | ) | (227,834 | ) | (13,026,557 | ) | ||||||||
|
| |||||||||||||||
| (62,208,329 | ) | (138,380,103 | ) | |||||||||||||
|
| |||||||||||||||
Net increase (decrease) in net assets resulting from capital share transactions | (2,876,200 | ) | 10,180,826 | |||||||||||||
|
| |||||||||||||||
Total increase in net assets | 14,235,104 | 26,975,209 | ||||||||||||||
|
| |||||||||||||||
Net assets | ||||||||||||||||
Beginning of period | 848,226,225 | 821,251,016 | ||||||||||||||
|
| |||||||||||||||
End of period | $ | 862,461,329 | $ | 848,226,225 | ||||||||||||
|
| |||||||||||||||
The accompanying notes are an integral part of these financial statements.
14 | Wells Fargo Omega Growth Fund
Table of Contents
(For a share outstanding throughout each period)
| Six months ended January 31, 2020 (unaudited) | Year ended July 31 | |||||||||||||||||||||||
| CLASS A | 2019 | 2018 | 2017 | 2016 | 2015 | |||||||||||||||||||
Net asset value, beginning of period | $55.19 | $54.77 | $49.43 | $42.73 | $48.29 | $49.99 | ||||||||||||||||||
Net investment loss | (0.18 | ) | (0.33 | )1 | (0.32 | )1 | (0.22 | )1 | (0.19 | )1 | (0.28 | )1 | ||||||||||||
Net realized and unrealized gains (losses) on investments | 4.32 | 6.56 | 12.57 | 8.07 | (1.44 | ) | 5.12 | |||||||||||||||||
|
|
|
|
|
|
|
|
|
|
|
| |||||||||||||
Total from investment operations | 4.14 | 6.23 | 12.25 | 7.85 | (1.63 | ) | 4.84 | |||||||||||||||||
Distributions to shareholders from | ||||||||||||||||||||||||
Net realized gains | (3.10 | ) | (5.81 | ) | (6.91 | ) | (1.15 | ) | (3.93 | ) | (6.54 | ) | ||||||||||||
Net asset value, end of period | $56.23 | $55.19 | $54.77 | $49.43 | $42.73 | $48.29 | ||||||||||||||||||
Total return2 | 7.83 | % | 13.89 | % | 26.86 | % | 18.88 | % | (3.07 | )% | 10.65 | % | ||||||||||||
Ratios to average net assets (annualized) | ||||||||||||||||||||||||
Gross expenses | 1.28 | % | 1.28 | % | 1.28 | % | 1.28 | % | 1.28 | % | 1.32 | % | ||||||||||||
Net expenses | 1.28 | % | 1.28 | % | 1.28 | % | 1.28 | % | 1.28 | % | 1.30 | % | ||||||||||||
Net investment loss | (0.66 | )% | (0.64 | )% | (0.63 | )% | (0.50 | )% | (0.47 | )% | (0.58 | )% | ||||||||||||
Supplemental data | ||||||||||||||||||||||||
Portfolio turnover rate | 14 | % | 39 | % | 48 | % | 76 | % | 84 | % | 94 | % | ||||||||||||
Net assets, end of period (000s omitted) | $728,734 | $714,411 | $662,751 | $581,967 | $573,304 | $685,005 | ||||||||||||||||||
| 1 | Calculated based upon average shares outstanding |
| 2 | Total return calculations do not include any sales charges. Returns for periods of less than one year are not annualized. |
The accompanying notes are an integral part of these financial statements.
Wells Fargo Omega Growth Fund | 15
Table of Contents
Financial highlights
(For a share outstanding throughout each period)
| Six months ended January 31, 2020 (unaudited) | Year ended July 31 | |||||||||||||||||||||||
| CLASS C | 2019 | 2018 | 2017 | 2016 | 2015 | |||||||||||||||||||
Net asset value, beginning of period | $35.83 | $38.02 | $36.47 | $32.07 | $37.55 | $40.56 | ||||||||||||||||||
Net investment loss | (0.25 | )1 | (0.48 | )1 | (0.50 | )1 | (0.41 | )1 | (0.39 | )1 | (0.51 | )1 | ||||||||||||
Net realized and unrealized gains (losses) on investments | 2.73 | 4.10 | 8.96 | 5.96 | (1.16 | ) | 4.04 | |||||||||||||||||
|
|
|
|
|
|
|
|
|
|
|
| |||||||||||||
Total from investment operations | 2.48 | 3.62 | 8.46 | 5.55 | (1.55 | ) | 3.53 | |||||||||||||||||
Distributions to shareholders from | ||||||||||||||||||||||||
Net realized gains | (3.10 | ) | (5.81 | ) | (6.91 | ) | (1.15 | ) | (3.93 | ) | (6.54 | ) | ||||||||||||
Net asset value, end of period | $35.21 | $35.83 | $38.02 | $36.47 | $32.07 | $37.55 | ||||||||||||||||||
Total return2 | 7.42 | % | 13.04 | % | 25.88 | % | 18.00 | % | (3.75 | )% | 9.79 | % | ||||||||||||
Ratios to average net assets (annualized) | ||||||||||||||||||||||||
Gross expenses | 2.03 | % | 2.03 | % | 2.03 | % | 2.03 | % | 2.03 | % | 2.07 | % | ||||||||||||
Net expenses | 2.03 | % | 2.03 | % | 2.03 | % | 2.03 | % | 2.03 | % | 2.05 | % | ||||||||||||
Net investment loss | (1.41 | )% | (1.40 | )% | (1.38 | )% | (1.24 | )% | (1.22 | )% | (1.33 | )% | ||||||||||||
Supplemental data | ||||||||||||||||||||||||
Portfolio turnover rate | 14 | % | 39 | % | 48 | % | 76 | % | 84 | % | 94 | % | ||||||||||||
Net assets, end of period (000s omitted) | $21,812 | $26,122 | $62,074 | $62,543 | $74,337 | $99,100 | ||||||||||||||||||
| 1 | Calculated based upon average shares outstanding |
| 2 | Total return calculations do not include any sales charges. Returns for periods of less than one year are not annualized. |
The accompanying notes are an integral part of these financial statements.
16 | Wells Fargo Omega Growth Fund
Table of Contents
Financial highlights
(For a share outstanding throughout each period)
| Six months ended January 31, 2020 (unaudited) | Year ended July 31 | |||||||||||||||||||||||
| CLASS R | 2019 | 2018 | 2017 | 2016 | 2015 | |||||||||||||||||||
Net asset value, beginning of period | $51.82 | $51.92 | $47.30 | $41.04 | $46.66 | $48.62 | ||||||||||||||||||
Net investment loss | (0.23 | )1 | (0.43 | )1 | (0.43 | )1 | (0.30 | )1 | (0.29 | )1 | (0.39 | )1 | ||||||||||||
Net realized and unrealized gains (losses) on investments | 4.04 | 6.14 | 11.96 | 7.71 | (1.40 | ) | 4.97 | |||||||||||||||||
|
|
|
|
|
|
|
|
|
|
|
| |||||||||||||
Total from investment operations | 3.81 | 5.71 | 11.53 | 7.41 | (1.69 | ) | 4.58 | |||||||||||||||||
Distributions to shareholders from | ||||||||||||||||||||||||
Net realized gains | (3.10 | ) | (5.81 | ) | (6.91 | ) | (1.15 | ) | (3.93 | ) | (6.54 | ) | ||||||||||||
Net asset value, end of period | $52.53 | $51.82 | $51.92 | $47.30 | $41.04 | $46.66 | ||||||||||||||||||
Total return2 | 7.70 | % | 13.63 | % | 26.53 | % | 18.58 | % | (3.30 | )% | 10.38 | % | ||||||||||||
Ratios to average net assets (annualized) | ||||||||||||||||||||||||
Gross expenses | 1.52 | % | 1.53 | % | 1.53 | % | 1.53 | % | 1.53 | % | 1.57 | % | ||||||||||||
Net expenses | 1.52 | % | 1.53 | % | 1.53 | % | 1.53 | % | 1.53 | % | 1.55 | % | ||||||||||||
Net investment loss | (0.90 | )% | (0.88 | )% | (0.88 | )% | (0.72 | )% | (0.71 | )% | (0.83 | )% | ||||||||||||
Supplemental data | ||||||||||||||||||||||||
Portfolio turnover rate | 14 | % | 39 | % | 48 | % | 76 | % | 84 | % | 94 | % | ||||||||||||
Net assets, end of period (000s omitted) | $4,662 | $6,097 | $7,494 | $6,298 | $10,122 | $17,199 | ||||||||||||||||||
| 1 | Calculated based upon average shares outstanding |
| 2 | Returns for periods of less than one year are not annualized. |
The accompanying notes are an integral part of these financial statements.
Wells Fargo Omega Growth Fund | 17
Table of Contents
Financial highlights
(For a share outstanding throughout each period)
| Six months ended January 31, 2020 (unaudited) | Year ended July 31 | |||||||||||||||||||||||
| ADMINISTRATOR CLASS | 2019 | 2018 | 2017 | 2016 | 2015 | |||||||||||||||||||
Net asset value, beginning of period | $60.58 | $59.39 | $52.99 | $45.65 | $51.20 | $52.50 | ||||||||||||||||||
Net investment loss | (0.14 | )1 | (0.25 | )1 | (0.25 | )1 | (0.12 | )1 | (0.12 | )1 | (0.17 | )1 | ||||||||||||
Net realized and unrealized gains (losses) on investments | 4.77 | 7.25 | 13.56 | 8.61 | (1.50 | ) | 5.41 | |||||||||||||||||
|
|
|
|
|
|
|
|
|
|
|
| |||||||||||||
Total from investment operations | 4.63 | 7.00 | 13.31 | 8.49 | (1.62 | ) | 5.24 | |||||||||||||||||
Distributions to shareholders from | ||||||||||||||||||||||||
Net realized gains | (3.10 | ) | (5.81 | ) | (6.91 | ) | (1.15 | ) | (3.93 | ) | (6.54 | ) | ||||||||||||
Net asset value, end of period | $62.11 | $60.58 | $59.39 | $52.99 | $45.65 | $51.20 | ||||||||||||||||||
Total return2 | 7.94 | % | 14.12 | % | 27.07 | % | 19.08 | % | (2.84 | )% | 10.91 | % | ||||||||||||
Ratios to average net assets (annualized) | ||||||||||||||||||||||||
Gross expenses | 1.20 | % | 1.20 | % | 1.20 | % | 1.20 | % | 1.19 | % | 1.15 | % | ||||||||||||
Net expenses | 1.08 | % | 1.10 | % | 1.10 | % | 1.10 | % | 1.08 | % | 1.05 | % | ||||||||||||
Net investment loss | (0.47 | )% | (0.45 | )% | (0.45 | )% | (0.25 | )% | (0.27 | )% | (0.33 | )% | ||||||||||||
Supplemental data | ||||||||||||||||||||||||
Portfolio turnover rate | 14 | % | 39 | % | 48 | % | 76 | % | 84 | % | 94 | % | ||||||||||||
Net assets, end of period (000s omitted) | $25,937 | $26,141 | $24,140 | $19,754 | $38,039 | $86,756 | ||||||||||||||||||
| 1 | Calculated based upon average shares outstanding |
| 2 | Returns for periods of less than one year are not annualized. |
The accompanying notes are an integral part of these financial statements.
18 | Wells Fargo Omega Growth Fund
Table of Contents
Financial highlights
(For a share outstanding throughout each period)
| Six months ended January 31, 2020 (unaudited) | Year ended July 31 | |||||||||||||||||||||||
| INSTITUTIONAL CLASS | 2019 | 2018 | 2017 | 2016 | 2015 | |||||||||||||||||||
Net asset value, beginning of period | $62.69 | $61.10 | $54.21 | $46.55 | $52.01 | $53.10 | ||||||||||||||||||
Net investment income (loss) | (0.07 | )1 | (0.12 | )1 | (0.11 | )1 | (0.03 | )1 | (0.00 | )2 | (0.04 | )1 | ||||||||||||
Net realized and unrealized gains (losses) on investments | 4.94 | 7.52 | 13.91 | 8.84 | (1.53 | ) | 5.49 | |||||||||||||||||
|
|
|
|
|
|
|
|
|
|
|
| |||||||||||||
Total from investment operations | 4.87 | 7.40 | 13.80 | 8.81 | (1.53 | ) | 5.45 | |||||||||||||||||
Distributions to shareholders from | ||||||||||||||||||||||||
Net realized gains | (3.10 | ) | (5.81 | ) | (6.91 | ) | (1.15 | ) | (3.93 | ) | (6.54 | ) | ||||||||||||
Net asset value, end of period | $64.46 | $62.69 | $61.10 | $54.21 | $46.55 | $52.01 | ||||||||||||||||||
Total return3 | 8.06 | % | 14.39 | % | 27.39 | % | 19.40 | % | (2.61 | )% | 11.20 | % | ||||||||||||
Ratios to average net assets (annualized) | ||||||||||||||||||||||||
Gross expenses | 0.95 | % | 0.95 | % | 0.95 | % | 0.95 | % | 0.95 | % | 0.90 | % | ||||||||||||
Net expenses | 0.85 | % | 0.85 | % | 0.85 | % | 0.85 | % | 0.83 | % | 0.80 | % | ||||||||||||
Net investment income (loss) | (0.24 | )% | (0.20 | )% | (0.20 | )% | (0.06 | )% | (0.01 | )% | (0.09 | )% | ||||||||||||
Supplemental data | ||||||||||||||||||||||||
Portfolio turnover rate | 14 | % | 39 | % | 48 | % | 76 | % | 84 | % | 94 | % | ||||||||||||
Net assets, end of period (000s omitted) | $81,317 | $75,456 | $64,792 | $62,987 | $76,980 | $87,085 | ||||||||||||||||||
| 1 | Calculated based upon average shares outstanding |
| 2 | Amount is more than $(0.005). |
| 3 | Returns for periods of less than one year are not annualized. |
The accompanying notes are an integral part of these financial statements.
Wells Fargo Omega Growth Fund | 19
Table of Contents
Notes to financial statements (unaudited)
1. ORGANIZATION
Wells Fargo Funds Trust (the “Trust”), a Delaware statutory trust organized on March 10, 1999, is anopen-end management investment company registered under the Investment Company Act of 1940, as amended (the “1940 Act”). As an investment company, the Trust follows the accounting and reporting guidance in Financial Accounting Standards Board (“FASB”)Accounting Standards Codification Topic 946, Financial Services – Investment Companies. These financial statements report on the Wells Fargo Omega Growth Fund (the “Fund”) which is a diversified series of the Trust.
2. SIGNIFICANT ACCOUNTING POLICIES
The following significant accounting policies, which are consistently followed in the preparation of the financial statements of the Fund, are in conformity with U.S. generally accepted accounting principles which require management to make estimates and assumptions that affect the reported amounts of assets and liabilities, disclosure of contingent assets and liabilities at the date of the financial statements, and the reported amounts of revenues and expenses during the reporting period. Actual results could differ from those estimates.
Securities valuation
All investments are valued each business day as of the close of regular trading on the New York Stock Exchange (generally 4 p.m. Eastern Time), although the Fund may deviate from this calculation time under unusual or unexpected circumstances.
Equity securities that are listed on a foreign or domestic exchange or market are valued at the official closing price or, if none, the last sales price. If no sale occurs on the principal exchange or market that day, a fair value price will be determined in accordance with the Fund’s Valuation Procedures.
Investments in registeredopen-end investment companies are valued at net asset value. Interests innon-registered investment companies that are redeemable at net asset value are fair valued normally at net asset value.
Investments which are not valued using any of the methods discussed above are valued at their fair value, as determined in good faith by the Board of Trustees of the Fund. The Board of Trustees has established a Valuation Committee comprised of the Trustees and has delegated to it the authority to take any actions regarding the valuation of portfolio securities that the Valuation Committee deems necessary or appropriate, including determining the fair value of portfolio securities, unless the determination has been delegated to the Wells Fargo Asset Management Pricing Committee at Wells Fargo Funds Management, LLC (“Funds Management”). The Board of Trustees retains the authority to make or ratify any valuation decisions or approve any changes to the Valuation Procedures as it deems appropriate. On a quarterly basis, the Board of Trustees receives reports on any valuation actions taken by the Valuation Committee or the Wells Fargo Asset Management Pricing Committee which may include items for ratification.
Foreign currency translation
The accounting records of the Fund are maintained in U.S. dollars. The values of other assets and liabilities denominated in foreign currencies are translated into U.S. dollars at rates provided by an independent foreign currency pricing source at a time each business day specified by the Wells Fargo Asset Management Pricing Committee. Purchases and sales of securities, and income and expenses are converted at the rate of exchange on the respective dates of such transactions. Net realized foreign exchange gains or losses arise from sales of foreign currencies, currency gains or losses realized between the trade and settlement dates on securities transactions, and the difference between the amounts of dividends, interest and foreign withholding taxes recorded and the U.S. dollar equivalent of the amounts actually paid or received. Net unrealized foreign exchange gains and losses arise from changes in the fair value of assets and liabilities other than investments in securities resulting from changes in exchange rates. The changes in net assets arising from changes in exchange rates of securities and the changes in net assets resulting from changes in market prices of securities are not separately presented. Such changes are included in net realized and unrealized gains or losses from investments.
Securities lending
The Fund may lend its securities from time to time in order to earn additional income in the form of fees or interest on securities received as collateral or the investment of any cash received as collateral. When securities are on loan, the Fund receives interest or dividends on those securities. Cash collateral received in connection with its securities lending transactions is invested in Securities Lending Cash Investments, LLC (the “Securities Lending Fund”). Investments in Securities Lending Fund are valued at the evaluated bid price provided by an independent pricing service. Income earned from investment in the Securities Lending Fund (net of fees and rebates), if any, is included in income from affiliated securities on the Statement of Operations.
In a securities lending transaction, the net asset value of the Fund is affected by an increase or decrease in the value of the securities loaned and by an increase or decrease in the value of the instrument in which collateral is invested. The amount of securities lending activity undertaken by the Fund fluctuates from time to time. The Fund has the right under the lending
20 | Wells Fargo Omega Growth Fund
Table of Contents
Notes to financial statements (unaudited)
agreement to recover the securities from the borrower on demand. In the event of default or bankruptcy by the borrower, the Fund may be prevented from recovering the loaned securities or gaining access to the collateral or may experience delays or costs in doing so. In such an event, the terms of the agreement allows the unaffiliated securities lending agent to use the collateral to purchase replacement securities on behalf of the Fund or pay the Fund the market value of the loaned securities. The Fund bears the risk of loss with respect to depreciation of its investment of the cash collateral.
Security transactions and income recognition
Securities transactions are recorded on a trade date basis. Realized gains or losses are recorded on the basis of identified cost.
Dividend income is recognized on theex-dividend date. Dividend income is recorded net of foreign taxes withheld where recovery of such taxes is not assured.
Distributions to shareholders
Distributions to shareholders from net investment income and any net realized gains are recorded on theex-dividend date and paid at least annually. Such distributions are determined in accordance with income tax regulations and may differ from U.S. generally accepted accounting principles. Dividend sources are estimated at the time of declaration. The tax character of distributions is determined as of the Fund’s fiscal year end. Therefore, a portion of the Fund’s distributions made prior to the Fund’s fiscal year end may be categorized as a tax return of capital at year end.
Federal and other taxes
The Fund intends to continue to qualify as a regulated investment company by distributing substantially all of its investment company taxable income and any net realized capital gains (after reduction for capital loss carryforwards) sufficient to relieve it from all, or substantially all, federal income taxes. Accordingly, no provision for federal income taxes was required.
The Fund’s income and federal excise tax returns and all financial records supporting those returns for the prior three fiscal years are subject to examination by the federal and Delaware revenue authorities. Management has analyzed the Fund’s tax positions taken on federal, state, and foreign tax returns for all open tax years and does not believe that there are any uncertain tax positions that require recognition of a tax liability.
As of January 31, 2020, the aggregate cost of all investments for federal income tax purposes was $482,754,769 and the unrealized gains (losses) consisted of:
Gross unrealized gains | $ | 386,721,852 | ||
Gross unrealized losses | (3,149,285 | ) | ||
Net unrealized gains | $ | 383,572,567 | ||
As of July 31, 2019, the Fund had a qualified late-year ordinary loss of $2,084,034 which was recognized on the first day of the current fiscal year.
Class allocations
The separate classes of shares offered by the Fund differ principally in applicable sales charges, distribution, shareholder servicing, and administration fees. Class specific expenses are charged directly to that share class. Investment income, common fund-level expenses, and realized and unrealized gains (losses) on investments are allocated daily to each class of shares based on the relative proportion of net assets of each class.
3. FAIR VALUATION MEASUREMENTS
Fair value measurements of investments are determined within a framework that has established a fair value hierarchy based upon the various data inputs utilized in determining the value of the Fund’s investments. The three-level hierarchy gives the highest priority to unadjusted quoted prices in active markets for identical assets or liabilities (Level 1) and the lowest priority to unobservable inputs (Level 3). The Fund’s investments are classified within the fair value hierarchy based on the lowest level of input that is significant to the fair value measurement. The inputs are summarized into three broad levels as follows:
| ∎ | Level 1 – quoted prices in active markets for identical securities |
| ∎ | Level 2 – other significant observable inputs (including quoted prices for similar securities, interest rates, prepayment speeds, credit risk, etc.) |
| ∎ | Level 3 – significant unobservable inputs (including the Fund’s own assumptions in determining the fair value of investments) |
The inputs or methodologies used for valuing investments in securities are not necessarily an indication of the risk associated with investing in those securities.
Wells Fargo Omega Growth Fund | 21
Table of Contents
Notes to financial statements (unaudited)
The following is a summary of the inputs used in valuing the Fund’s assets and liabilities as of January 31, 2020:
| Quoted prices (Level 1) | Other significant observable inputs (Level 2) | Significant (Level 3) | Total | |||||||||||||
Assets | ||||||||||||||||
Investments in: | ||||||||||||||||
Common stocks | ||||||||||||||||
Communication services | $ | 101,932,750 | $ | 0 | $ | 0 | $ | 101,932,750 | ||||||||
Consumer discretionary | 136,435,265 | 0 | 0 | 136,435,265 | ||||||||||||
Financials | 22,404,422 | 0 | 0 | 22,404,422 | ||||||||||||
Health care | 178,313,526 | 0 | 0 | 178,313,526 | ||||||||||||
Industrials | 75,129,855 | 0 | 0 | 75,129,855 | ||||||||||||
Information technology | 309,731,337 | 0 | 0 | 309,731,337 | ||||||||||||
Materials | 33,888,845 | 0 | 0 | 33,888,845 | ||||||||||||
Real estate | 5,066,066 | 0 | 0 | 5,066,066 | ||||||||||||
Short-term investments | ||||||||||||||||
Investment companies | 3,425,270 | 0 | 0 | 3,425,270 | ||||||||||||
Total assets | $ | 866,327,336 | $ | 0 | $ | 0 | $ | 866,327,336 | ||||||||
Additional sector, industry or geographic detail is included in the Portfolio of Investments.
For the six months ended January 31, 2020, the Fund did not have any transfers into/out of Level 3.
4. TRANSACTIONS WITH AFFILIATES
Management fee
Funds Management, an indirect wholly owned subsidiary of Wells Fargo & Company (“Wells Fargo”), is the manager of the Fund and provides advisory and fund-level administrative services under an investment management agreement. Under the investment management agreement, Funds Management is responsible for, among other services, implementing the investment objectives and strategies of the Fund, supervising the subadviser and providing fund-level administrative services in connection with the Fund’s operations. As compensation for its services under the investment management agreement, Funds Management is entitled to receive a management fee at the following annual rate based on the Fund’s average daily net assets:
| Average daily net assets | Management fee | |||
First $500 million | 0.800 | % | ||
Next $500 million | 0.750 | |||
Next $1 billion | 0.700 | |||
Next $2 billion | 0.675 | |||
Next $1 billion | 0.650 | |||
Next $3 billion | 0.640 | |||
Next $2 billion | 0.615 | |||
Next $2 billion | 0.605 | |||
Next $4 billion | 0.580 | |||
Over $16 billion | 0.555 | |||
For the six months ended January 31, 2020, the management fee was equivalent to an annual rate of 0.78% of the Fund’s average daily net assets.
Funds Management has retained the services of a subadviser to provide daily portfolio management to the Fund. The fee for subadvisory services is borne by Funds Management. Wells Capital Management Incorporated (“WellsCap”), an affiliate of Funds Management and an indirect wholly owned subsidiary of Wells Fargo, is the subadviser to the Fund and is entitled to receive a fee from Funds Management at an annual rate starting at 0.45% and declining to 0.30% as the average daily net assets of the Fund increase.
22 | Wells Fargo Omega Growth Fund
Table of Contents
Notes to financial statements (unaudited)
Administration fees
Under a class-level administration agreement, Funds Management provides class-level administrative services to the Fund, which includes paying fees and expenses for services provided by the transfer agent,sub-transfer agents, omnibus account servicers and record-keepers. As compensation for its services under the class-level administration agreement, Funds Management receives an annual fee which is calculated based on the average daily net assets of each class as follows:
| Class-level administration fee | ||||
Class A, Class C, Class R | 0.21 | % | ||
Administrator Class, Institutional Class | 0.13 | |||
Waivers and/or expense reimbursements
Funds Management has contractually waived and/or reimbursed management and administration fees to the extent necessary to maintain certain net operating expense ratios for the Fund. When each class of the Fund has exceeded its expense cap, Funds Management has waived fees and/or reimbursed expenses from fund-level expenses on a proportionate basis and then from class specific expenses. When only certain classes exceed their expense caps, waivers and/or reimbursements are applied against class specific expenses before fund-level expenses. Funds Management has committed through November 30, 2020 to waive fees and/or reimburse expenses to the extent necessary to cap the Fund’s expenses at 1.30% for Class A shares, 2.05% for Class C shares, 1.55% for Class R shares, 1.10% for Administrator Class shares, and 0.85% for Institutional Class shares. Prior to or after the commitment expiration date, the cap may be increased or the commitment to maintain the cap may be terminated only with the approval of the Board of Trustees.
Distribution fees
The Trust has adopted a distribution plan for Class C and Class R shares of the Fund pursuant to Rule12b-1 under the 1940 Act. Distribution fees are charged to Class C and Class R shares and paid to Wells Fargo Funds Distributor, LLC (“Funds Distributor”), the principal underwriter, at an annual rate of 0.75% of the average daily net assets of Class C shares and 0.25% of the average daily net assets of Class R shares.
In addition, Funds Distributor is entitled to receive thefront-end sales charge from the purchase of Class A shares and a contingent deferred sales charge on the redemption of certain Class A shares. Funds Distributor is also entitled to receive the contingent deferred sales charges from redemptions of Class C shares. For the six months ended January 31, 2020, Funds Distributor received $6,931 from the sale of Class A shares and $14 in contingent deferred sales charges from redemptions of Class C shares. No contingent deferred sales charges were incurred by Class A shares for the six months ended January 31, 2020.
Shareholder servicing fees
The Trust has entered into contracts with one or more shareholder servicing agents, whereby Class A, Class C, Class R, and Administrator Class of the Fund are charged a fee at an annual rate of 0.25% of the average daily net assets of each respective class. A portion of these total shareholder servicing fees were paid to affiliates of Wells Fargo.
Interfund transactions
The Fund may purchase or sell portfolio investment securities to certain other Wells Fargo affiliates pursuant to Rule17a-7 under the 1940 Act and under procedures adopted by the Board of Trustees. The procedures have been designed to ensure that these interfund transactions, which do not incur broker commissions, are effected at current market prices.
5. INVESTMENT PORTFOLIO TRANSACTIONS
Purchases and sales of investments, excluding U.S. government obligations (if any) and short-term securities, for the six months ended January 31, 2020 were $118,831,846 and $166,827,415, respectively.
6. SECURITIES LENDING TRANSACTIONS
The Fund lends its securities through an unaffiliated securities lending agent and receives collateral in the form of cash or securities with a value at least equal to the value of the securities on loan. The value of the loaned securities is determined at the close of each business day and any increases or decreases in the required collateral are exchanged between the Fund and the counterparty on the next business day. Cash collateral received is invested in the Securities Lending Fund which seeks to provide a positive return compared to the daily Fed Funds Open Rate by investing in high-quality, U.S. dollar-denominated short-term money market instruments and is exempt from registration under Section 3(c)(7) of the 1940 Act. Securities Lending Fund is managed by Funds Management and is subadvised by WellsCap. Funds Management receives an advisory fee starting at 0.05% and declining to 0.01% as the average daily net assets of the Securities Lending Fund increase. All of the fees received by Funds Management are paid to WellsCap for its services as subadviser.
Wells Fargo Omega Growth Fund | 23
Table of Contents
Notes to financial statements (unaudited)
In the event of counterparty default or the failure of a borrower to return a loaned security, the Fund has the right to use the collateral to offset any losses incurred. As of January 31, 2020, the Fund did not have any securities on loan.
7. BANK BORROWINGS
The Trust (excluding the money market funds), Wells Fargo Master Trust and Wells Fargo Variable Trust are parties to a $280,000,000 revolving credit agreement whereby the Fund is permitted to use bank borrowings for temporary or emergency purposes, such as to fund shareholder redemption requests. Interest under the credit agreement is charged to the Fund based on a borrowing rate equal to the higher of the Federal Funds rate in effect on that day plus 1.25% or the overnight LIBOR rate in effect on that day plus 1.25%. In addition, an annual commitment fee equal to 0.25% of the unused balance is allocated to each participating fund.
For the six months ended January 31, 2020, there were no borrowings by the Fund under the agreement.
8. CONCENTRATION RISK
Concentration risks result from exposure to a limited number of sectors. As of the end of the period, the Fund invests a concentration of its portfolio in the information technology sector. A fund that invests a substantial portion of its assets in any sector may be more affected by changes in that sector than would be a fund whose investments are not heavily weighted in any sector.
9. INDEMNIFICATION
Under the Trust’s organizational documents, the officers and Trustees have been granted certain indemnification rights against certain liabilities that may arise out of performance of their duties to the Trust. Additionally, in the normal course of business, the Trust may enter into contracts with service providers that contain a variety of indemnification clauses. The Trust’s maximum exposure under these arrangements is dependent on future claims that may be made against the Fund and, therefore, cannot be estimated.
10. NEW ACCOUNTING PRONOUNCEMENT
In August 2018, FASB issued Accounting Standards Update (“ASU”)No. 2018-13, Fair Value Measurement (Topic 820)Disclosure Framework—Changes to the Disclosure Requirements for Fair Value Measurement. ASU2018-13 updates the disclosure requirements for fair value measurements by modifying or removing certain disclosures and adding certain new disclosures. The amendments are effective for fiscal years, and interim periods within those fiscal years, beginning after December 15, 2019. Early adoption is permitted. Management has adopted the removal and modification of disclosures early, as permitted, and will adopt the additional new disclosures at the effective date.
11. SUBSEQUENT EVENT
On March 11, 2020, the World Health Organization announced that it had made the assessment that coronavirus disease 2019 (“COVID-19”) is a pandemic. The impacts of COVID-19 is adversely affecting the entire global economy, individual companies and investment products, and the market in general. There is significant uncertainty around the extent and duration of business disruptions related to COVID-19 and the impact may be short term or may last for an extended period of time. The risk of further spreading of COVID-19 has led to significant uncertainty and volatility in the financial markets and the value of the Fund and the securities in which the Fund invests may be adversely affected by impacts caused by COVID-19.
24 | Wells Fargo Omega Growth Fund
Table of Contents
PROXY VOTING INFORMATION
A description of the policies and procedures used to determine how to vote proxies relating to portfolio securities is available, upon request, by calling1-800-222-8222, visiting our website atwfam.com, or visiting the SEC website at sec.gov. Information regarding how the proxies related to portfolio securities were voted during the most recent12-month period ended June 30 is available on the website atwfam.comor by visiting the SEC website at sec.gov.
QUARTERLY PORTFOLIO HOLDINGS INFORMATION
The Fund files its complete schedule of portfolio holdings with the SEC for the first and third quarters of each fiscal year as an exhibit to its reports on FormN-PORT. Shareholders may view the filed FormN-PORT by visiting the SEC website at sec.gov.
Wells Fargo Omega Growth Fund | 25
Table of Contents
Other information (unaudited)
BOARD OF TRUSTEES AND OFFICERS
Each of the Trustees and Officers1 listed in the table below acts in identical capacities for each fund in the Wells Fargo family of funds, which consists of 149 mutual funds comprising the Wells Fargo Funds Trust, Wells Fargo Variable Trust, Wells Fargo Master Trust and fourclosed-end funds (collectively the “Fund Complex”). This table should be read in conjunction with the Prospectus and the Statement of Additional Information2. The mailing address of each Trustee and Officer is 525 Market Street, 12th Floor, San Francisco, CA 94105. Each Trustee and Officer serves an indefinite term, however, each Trustee serves such term until reaching the mandatory retirement age established by the Trustees.
Independent Trustees
Name and year of birth | Position held and length of service* | Principal occupations during past five years or longer | Current other public company or investment company directorships | |||
| William R. Ebsworth (Born 1957) | Trustee, since 2015 | Retired. From 1984 to 2013, equities analyst, portfolio manager, research director and chief investment officer at Fidelity Management and Research Company in Boston, Tokyo, and Hong Kong, and retired in 2013 as Chief Investment Officer of Fidelity Strategic Advisers, Inc. where he led a team of investment professionals managing client assets. Prior thereto, Board member of Hong Kong Securities Clearing Co., Hong Kong Options Clearing Corp., the Thailand International Fund, Ltd., Fidelity Investments Life Insurance Company, and Empire Fidelity Investments Life Insurance Company. Audit Committee Chair and Investment Committee Chair of the Vincent Memorial Hospital Endowment(non-profit organization). Mr. Ebsworth is a CFA® charterholder. | N/A | |||
| Jane A. Freeman (Born 1953) | Trustee, since 2015; Chair Liaison, since 2018 | Retired. From 2012 to 2014 and 1999 to 2008, Chief Financial Officer of Scientific Learning Corporation. From 2008 to 2012, Ms. Freeman provided consulting services related to strategic business projects. Prior to 1999, Portfolio Manager at Rockefeller & Co. and Scudder, Stevens & Clark. Board member of the Harding Loevner Funds from 1996 to 2014, serving as both Lead Independent Director and chair of the Audit Committee. Board member of the Russell Exchange Traded Funds Trust from 2011 to 2012 and the chair of the Audit Committee. Ms. Freeman is a Board Member of The Ruth Bancroft Garden(non-profit organization). She is also an inactive Chartered Financial Analyst. | N/A | |||
| Isaiah Harris, Jr. (Born 1952) | Trustee, since 2009; Audit Committee Chairman, since 2019 | Retired. Chairman of the Board of CIGNA Corporation since 2009, and Director since 2005. From 2003 to 2011, Director of Deluxe Corporation. Prior thereto, President and CEO of BellSouth Advertising and Publishing Corp. from 2005 to 2007, President and CEO of BellSouth Enterprises from 2004 to 2005 and President of BellSouth Consumer Services from 2000 to 2003. Emeritus member of the Iowa State University Foundation Board of Governors. Emeritus Member of the Advisory Board of Iowa State University School of Business. Advisory Board Member, Palm Harbor Academy (private school). Advisory Board Member, Child Evangelism Fellowship(non-profit). Mr. Harris is a certified public accountant (inactive status). | CIGNA Corporation | |||
| Judith M. Johnson (Born 1949) | Trustee, since 2008; Audit Committee Chairman, from 2009 to 2018 | Retired. Prior thereto, Chief Executive Officer and Chief Investment Officer of Minneapolis Employees Retirement Fund from 1996 to 2008. Ms. Johnson is an attorney, certified public accountant and a certified managerial accountant. | N/A | |||
26 | Wells Fargo Omega Growth Fund
Table of Contents
Other information (unaudited)
Name and year of birth | Position held and length of service* | Principal occupations during past five years or longer | Current other public company or investment company directorships | |||
| David F. Larcker (Born 1950) | Trustee, since 2009 | James Irvin Miller Professor of Accounting at the Graduate School of Business, Stanford University, Director of the Corporate Governance Research Initiative and Senior Faculty of The Rock Center for Corporate Governance since 2006. From 2005 to 2008, Professor of Accounting at the Graduate School of Business, Stanford University. Prior thereto, Ernst & Young Professor of Accounting at The Wharton School, University of Pennsylvania from 1985 to 2005. | N/A | |||
| Olivia S. Mitchell (Born 1953) | Trustee, since 2006; Nominating and Governance Committee Chair, since 2018 | International Foundation of Employee Benefit Plans Professor, Wharton School of the University of Pennsylvania since 1993. Director of Wharton’s Pension Research Council and Boettner Center on Pensions & Retirement Research, and Research Associate at the National Bureau of Economic Research. Previously, Cornell University Professor from 1978 to 1993. | N/A | |||
| Timothy J. Penny (Born 1951) | Trustee, since 1996; Chairman, since 2018 | President and Chief Executive Officer of Southern Minnesota Initiative Foundation, anon-profit organization, since 2007. Member of the Board of Trustees of NorthStar Education Finance, Inc., anon-profit organization, since 2007. | N/A | |||
| James G. Polisson (Born 1959) | Trustee, since 2018 | Retired. Chief Marketing Officer, Source (ETF) UK Services, Ltd, from 2015 to 2017. From 2012 to 2015, Principal of The Polisson Group, LLC, a management consulting, corporate advisory and principal investing company. Chief Executive Officer and Managing Director at Russell Investments, Global Exchange Traded Funds from 2010 to 2012. Managing Director of Barclays Global Investors from 1998 to 2010 and Global Chief Marketing Officer for iShares and Barclays Global Investors from 2000 to 2010. Trustee of the San Francisco Mechanics’ Institute, anon-profit organization, from 2013 to 2015. Board member of the Russell Exchange Traded Fund Trust from 2011 to 2012. Director of Barclays Global Investors Holdings Deutschland GmbH from 2006 to 2009. Mr. Polisson is an attorney and has a retired status with the Massachusetts and District of Columbia Bar Associations. | N/A | |||
| Pamela Wheelock3 (Born 1959) | Trustee, since January 2020; previously Trustee from January 2018 to July 2019 | Board member of the Destination Medical Center Economic Development Agency, Rochester, Minnesota since 2019. Acting Commissioner, Minnesota Department of Human Services, July 2019 through September 2019. Human Services Manager (part-time), Minnesota Department of Human Services, October 2019 through December 2019. Chief Operating Officer, Twin Cities Habitat for Humanity from 2017 to 2019. Vice President of University Services, University of Minnesota from 2012 to 2016. Prior thereto, on the Board of Directors, Governance Committee and Finance Committee for the Minnesota Philanthropy Partners (Saint Paul Foundation) from 2012 to 2018, Interim Chief Executive Officer of Blue Cross Blue Shield of Minnesota from 2011 to 2012, Chairman of the Board from 2009 to 2012 and Board Director from 2003 to 2015. Vice President, Leadership and Community Engagement, Bush Foundation, Saint Paul, Minnesota (a private foundation) from 2009 to 2011. Executive Vice President and Chief Financial Officer, Minnesota Sports and Entertainment from 2004 to 2009 and Senior Vice President from 2002 to 2004. Executive Vice President of the Minnesota Wild Foundation from 2004 to 2008. Commissioner of Finance, State of Minnesota, from 1999 to 2002. Currently Board Chair of the Minnesota Wild Foundation since 2010. | N/A | |||
| * | Length of service dates reflect the Trustee’s commencement of service with the Trust’s predecessor entities, where applicable. |
Wells Fargo Omega Growth Fund | 27
Table of Contents
Other information (unaudited)
Officers
Name and year of birth | Position held and length of service | Principal occupations during past five years or longer | ||
Andrew Owen (Born 1960) | President, since 2017 | Executive Vice President of Wells Fargo & Company and Head of Affiliated Managers, Wells Fargo Asset Management, since 2014. In addition, Mr. Owen is currently President, Chief Executive Officer and Director of Wells Fargo Funds Management, LLC since 2017. Prior thereto, Executive Vice President responsible for marketing, investments and product development for Wells Fargo Funds Management, LLC, from 2009 to 2014. | ||
| Jeremy DePalma1 (Born 1974) | Treasurer, since 2012 | Senior Vice President of Wells Fargo Funds Management, LLC since 2009. Senior Vice President of Evergreen Investment Management Company, LLC from 2008 to 2010 and head of the Fund Reporting and Control Team within Fund Administration from 2005 to 2010. | ||
Michelle Rhee (Born 1966) | Chief Legal Officer, since 2019 | Secretary of Wells Fargo Funds Management, LLC, Chief Legal Counsel of Wells Fargo Asset Management and Assistant General Counsel of Wells Fargo Bank, N.A. since 2018. Associate General Counsel and Managing Director of Bank of America Corporation from 2004 to 2018. | ||
Catherine Kennedy (Born 1969) | Secretary, since 2019 | Vice President of Wells Fargo Funds Management, LLC and Senior Counsel of the Wells Fargo Legal Department since 2010. Vice President and Senior Counsel of Evergreen Investment Management Company, LLC from 1998 to 2010. | ||
| Michael H. Whitaker(Born 1967) | Chief Compliance Officer, since 2016 | Chief Compliance Officer of Wells Fargo Asset Management since 2016. Senior Vice President and Chief Compliance Officer for Fidelity Investments from 2007 to 2016. | ||
David Berardi (Born 1975) | Assistant Treasurer, since 2009 | Vice President of Wells Fargo Funds Management, LLC since 2009. Vice President of Evergreen Investment Management Company, LLC from 2008 to 2010. Manager of Fund Reporting and Control for Evergreen Investment Management Company, LLC from 2004 to 2010. | ||
| 1 | Jeremy DePalma acts as Treasurer of 85 funds and Assistant Treasurer of 64 funds in the Fund Complex. |
| 2 | The Statement of Additional Information includes additional information about the Trustees and is available, without charge, upon request, by calling1-800-222-8222 or by visiting the website atwfam.com. |
| 3 | Pamela Wheelock wasre-appointed to the Board effective January 1, 2020. |
28 | Wells Fargo Omega Growth Fund
Table of Contents
Effective on or about May 1, 2020, if you purchase Fund shares through a Janney Montgomery Scott LLC (“Janney”) brokerage account, you will be eligible for the following load waivers(front-end sales charge waivers and contingent deferred sales charge (“CDSC”), orback-end sales charge, waivers) and discounts, which may differ from those disclosed elsewhere in the Fund’s Prospectus or SAI.
| Front-end sales charge* waivers on Class A shares available at Janney |
| Shares purchased through reinvestment of capital gains distributions and dividend reinvestment when purchasing shares of the same fund (but not any other fund within the fund family). |
| Shares purchased by employees and registered representatives of Janney or its affiliates and their family members as designated by Janney. |
| Shares purchased from the proceeds of redemptions within the same fund family, provided (1) the repurchase occurs within ninety (90) days following the redemption, (2) the redemption and purchase occur in the same account, and (3) redeemed shares were subject to afront-end or deferred sales load (i.e., right of reinstatement). |
| Employer-sponsored retirement plans (e.g., 401(k) plans, 457 plans, employer-sponsored 403(b) plans, profit sharing and money purchase pension plans and defined benefit plans). For purposes of this provision, employer-sponsored retirement plans do not include SEP IRAs, Simple IRAs,SAR-SEPs or Keogh plans. |
| Shares acquired through a right of reinstatement. |
| Class C shares that are no longer subject to a contingent deferred sales charge and are converted to Class A shares of the same fund pursuant to Janney’s policies and procedures. |
| CDSC waivers on Class A and Class C shares available at Janney |
| Shares sold upon the death or disability of the shareholder. |
| Shares sold as part of a systematic withdrawal plan as described in the Fund’s Prospectus. |
| Shares purchased in connection with a return of excess contributions from an IRA account. |
| Shares sold as part of a required minimum distribution for IRA and retirement accounts if the redemption is taken in or after the year the shareholder reaches qualified age based on applicable IRS regulations. |
| Shares sold to pay Janney fees but only if the transaction is initiated by Janney. |
| Shares acquired through a right of reinstatement. |
| Shares exchanged into the same share class of a different fund. |
| Front-end sales charge* discounts available at Janney; breakpoints, rights of accumulation and/or letters of intent |
| Breakpoints as described in the Fund’s Prospectus. |
| Rights of accumulation (“ROA”), which entitle shareholders to breakpoint discounts, will be automatically calculated based on the aggregated holding of fund family assets held by accounts within the purchaser’s household at Janney. Eligible fund family assets not held at Janney may be included in the ROA calculation only if the shareholder notifies his or her financial advisor about such assets. |
| Letters of intent which allow for breakpoint discounts based on anticipated purchases within a fund family, over a13-month time period. Eligible fund family assets not held at Janney Montgomery Scott may be included in the calculation of letters of intent only if the shareholder notifies his or her financial advisor about such assets. |
| * | Also referred to as an “initial sales charge.” |
Wells Fargo Omega Growth Fund | 29
Table of Contents
For more information
More information about Wells Fargo Funds is available free upon request. To obtain literature, please write, visit the Fund’s website, or call:
Wells Fargo Funds
P.O. Box 219967
Kansas City, MO 64121-9967
Website:wfam.com
Individual investors:1-800-222-8222
Retail investment professionals:1-888-877-9275
Institutional investment professionals:1-866-765-0778

This report and the financial statements contained herein are submitted for the general information of the shareholders of the Fund. If this report is used for promotional purposes, distribution of the report must be accompanied or preceded by a current prospectus. Before investing, please consider the investment objectives, risks, charges, and expenses of the investment. For a current prospectus and, if available, a summary prospectus, containing this information, call1-800-222-8222 or visit the Fund’s website atwfam.com. Read the prospectus carefully before you invest or send money.
Wells Fargo Asset Management (WFAM) is the trade name for certain investment advisory/management firms owned by Wells Fargo & Company. These firms include but are not limited to Wells Capital Management Incorporated and Wells Fargo Funds Management, LLC. Certain products managed by WFAM entities are distributed by Wells Fargo Funds Distributor, LLC (a broker-dealer and Member FINRA).
This material is for general informational and educational purposes only and is NOT intended to provide investment advice or a recommendation of any kind—including a recommendation for any specific investment, strategy, or plan.
INVESTMENT PRODUCTS: NOT FDIC INSURED ◾ NO BANK GUARANTEE ◾ MAY LOSE VALUE
© 2020 Wells Fargo & Company. All rights reserved
PAR-0020-03842 03-20
SA211/SAR211 01-20
Table of Contents

Semi-Annual Report
January 31, 2020
Wells Fargo
Premier Large Company Growth Fund
Beginning on January 1, 2021, as permitted by new regulations adopted by the Securities and Exchange Commission, paper copies of the Wells Fargo Funds’ annual and semi-annual shareholder reports issued after this date will no longer be sent by mail, unless you specifically request paper copies of the reports. Instead, the reports will be made available on the Funds’ website, and you will be notified by mail each time a report is posted and provided with a website address to access the report.
If you already elected to receive shareholder reports electronically, you will not be affected by this change and you need not take any action. You may elect to receive shareholder reports and other communications from the Fund electronically at any time by contacting your financial intermediary (such as a broker-dealer or bank) or, if you are a direct investor, by calling1-800-222-8222 or by enrolling at wellsfargo.com/advantagedelivery.
You may elect to receive all future reports in paper free of charge. If you invest through a financial intermediary, you can contact your financial intermediary to request that you continue to receive paper copies of your shareholder reports; if you invest directly with the Fund, you can call 1-800-222-8222. Your election to receive reports in paper will apply to all Wells Fargo Funds held in your account with your financial intermediary or, if you are a direct investor, to all Wells Fargo Funds that you hold.
Table of Contents
Contents
|
Reduce clutter. Save trees. |
Sign up for electronic delivery of prospectuses and shareholder reports atwellsfargo.com/advantagedelivery |
The views expressed and any forward-looking statements are as of January 31, 2020, unless otherwise noted, and are those of the Fund managers and/or Wells Fargo Asset Management. Discussions of individual securities, or the markets generally, or any Wells Fargo Fund are not intended as individual recommendations. Future events or results may vary significantly from those expressed in any forward-looking statements. The views expressed are subject to change at any time in response to changing circumstances in the market. Wells Fargo Asset Management and the Fund disclaim any obligation to publicly update or revise any views expressed or forward-looking statements.
INVESTMENT PRODUCTS: NOT FDIC INSURED ◾ NO BANK GUARANTEE ◾ MAY LOSE VALUE
Wells Fargo Premier Large Company Growth Fund | 1
Table of Contents
Letter to shareholders (unaudited)

Andrew Owen
President
Wells Fargo Funds
“As the period began, U.S.-China trade tensions continued with no signs of compromise.”
Dear Shareholder:
We are pleased to offer you this semi-annual report for the Wells Fargo Premier Large Company Growth Fund for thesix-month period that ended January 31, 2020. Despite some market volatility, the period was strongly positive for financial markets as supportive central banks more than offset concerns over slowing global economic growth and international trade tensions.
Overall, both fixed-income and equity investors enjoyed healthy annual returns, with U.S. markets leading the way. For the period, U.S. stocks, based on the S&P 500 Index,1 gained 9.31% and international stocks, as measured by the MSCI ACWI ex USA Index (Net),2 returned 5.37%. The MSCI EM Index (Net)3 gained a more modest 3.36%. For bond investors, the Bloomberg Barclays U.S. Aggregate Bond Index4 added 4.20%, the Bloomberg Barclays Global Aggregateex-USD Index5 returned 1.58%, the Bloomberg Barclays Municipal Bond Index6 gained 3.33%, and the ICE BofA U.S. High Yield Index7 added 3.34%.
The period began with uncertainty, leading to central bank support.
In August as the period began, U.S.-China trade tensions continued with no signs of compromise. Evidence of a continued global economic slowdown mounted, and central banks in China, New Zealand, and Thailand cut interest rates. Industrial and manufacturing data declined in China, Canada, Japan, and Germany. Adding to global uncertainty, Italy’s prime minister resigned, many feared a crackdown in Hong Kong as protestors sustained their calls for reform, and Boris Johnson planned to suspend Parliament as Brexit’s deadline neared.
In the U.S., the Federal Reserve (Fed) cut interest rates a second time in the third quarter in September. U.S. manufacturing data disappointed investors. The U.S. Congress announced it would pursue an impeachment investigation of President Trump. Meanwhile, the Brexit impasse showed no signs of resolution. Officials in China said that hitting the country’s economic growth goals for the year would be difficult considering the weight of tariffs and trade restrictions. Although the S&P 500 Index finished the third quarter with the bestyear-to-date returns in more than 20 years, concerns about future returns remained.
The fourth quarter started on a strong note, with U.S.-China trade tensions relaxing in October along with renewed optimism for a U.K. Brexit deal and positive macroeconomic data. The initial estimate of U.S. third-quarter gross domestic product growth was a resilient 1.9% annualized rate, while the U.S. unemployment rate fell to a50-year low of 3.5% in September. However, despite resilience among U.S. consumers, business
| 1 | The S&P 500 Index consists of 500 stocks chosen for market size, liquidity, and industry group representation. It is a market-value-weighted index with each stock’s weight in the index proportionate to its market value. You cannot invest directly in an index. |
| 2 | The Morgan Stanley Capital International (MSCI) All Country World Index (ACWI) ex USA Index (Net) is a free-float-adjusted market-capitalization-weighted index that is designed to measure the equity market performance of developed markets, excluding the United States. Source: MSCI. MSCI makes no express or implied warranties or representations and shall have no liability whatsoever with respect to any MSCI data contained herein. The MSCI data may not be further redistributed or used as a basis for other indices or any securities or financial products. This report is not approved, reviewed, or produced by MSCI. You cannot invest directly in an index. |
| 3 | The MSCI Emerging Markets (EM) Index (Net) is a free-float-adjusted market-capitalization-weighted index that is designed to measure equity market performance of emerging markets. You cannot invest directly in an index. |
| 4 | The Bloomberg Barclays U.S. Aggregate Bond Index is a broad-based benchmark that measures the investment-grade, U.S. dollar-denominated, fixed-rate taxable bond market, including Treasuries, government-related and corporate securities, mortgage-backed securities (agency fixed-rate and hybrid adjustable-rate mortgage pass-throughs), asset-backed securities, and commercial mortgage-backed securities. You cannot invest directly in an index. |
| 5 | The Bloomberg Barclays Global Aggregateex-USD Index is an unmanaged index that provides a broad-based measure of the global investment-grade fixed-income markets excluding the U.S. dollar-denominated debt market. You cannot invest directly in an index. |
| 6 | The Bloomberg Barclays Municipal Bond Index is an unmanaged index composed of long-termtax-exempt bonds with a minimum credit rating of Baa. You cannot invest directly in an index. |
| 7 | The ICE BofA U.S. High Yield Index is a market-capitalization-weighted index of domestic and Yankee high-yield bonds. The index tracks the performance of high-yield securities traded in the U.S. bond market. You cannot invest directly in an index. Copyright 2020. ICE Data Indices, LLC. All rights reserved. |
2 | Wells Fargo Premier Large Company Growth Fund
Table of Contents
Letter to shareholders (unaudited)
confidence declined while manufacturing activity contracted. Concerned with a potential economic slowdown, the Fed lowered interest rates another quarter point in late October, its third rate cut in four months. This helped push the S&P 500 Index to a newall-time high, while emerging market equities rallied and global bonds declined overall, reflecting a broad pickup in risk appetite.
Equity markets continued to rally in November despite ongoing geopolitical risks. Hopes for a U.S.-China trade deal buoyed investor confidence. U.S. business sentiment improved slightly, and manufacturing and services activity picked up. Throughout the month, central bank actions were on hold. With that positive backdrop, developed market equities outpaced those in emerging markets, and U.S. stocks, as reflected by the S&P 500 Index, outperformednon-U.S. stocks overall. While consumer confidence and purchasing manager activity rose in the eurozone, China reported weakening manufacturing and consumer data. Bond yields rose marginally, leading to slightly negative returns for global government and investment-grade corporate bonds.
Financial markets ended 2019 on a broadly positive note, with the U.S. and China reaching an accord on a Phase One trade deal, with some details to be worked out. That, along with the landslide win by thepro-Brexit U.K. Conservative Party in a national election and ongoing central bank support, gave investors greater certainty and confidence. U.S. economic indicators were generally positive, with the exception of manufacturing activity and business confidence. However, consumer confidence was resilient, fed by a robust labor market, tame inflation, and lower interest rates, which boosted housing affordability and stimulated homebuyer activity. The impeachment of U.S. President Donald Trump, while historically noteworthy, had little impact on markets. Meanwhile, slowing Chinese economic activity, partly attributable to the trade war, led to further government stimulus atyear-end through lower reserve ratios, allowing banks to lend more money.
Theyear-end rally continued in early January 2020. However, capital market volatility picked up in late January on concerns over the unknown impact of the coronavirus on the global economy and stock markets. With sentiment somewhat souring, perceived safe havens did well in January. The U.S. dollar and Japanese yen both rose and government bonds outperformed equities. While the S&P 500 Index held its ground, emerging market equities tumbled, including those in Asia that are most exposed to viruses—physical or economic—originating in China.
Following the end of the reporting period, the coronavirus continued its global spread, resulting in disruptions to global markets, including through border closings, restrictions on travel and large gatherings, expedited and enhanced health screenings, quarantines, cancellations, business and school closings, disruptions to employment and supply chains, reduced productivity, and reduced customer and client activity in multiple markets and sectors. The risk of further spreading of the coronavirus has led to significant uncertainty and volatility in the financial markets. The full extent of the coronavirus’s impact on the global economy cannot necessarily be foreseen and the impacts may be short term or may last for an extended period of time.
Don’t let short-term uncertainty derail long-term investment goals.
Periods of investment uncertainty can present challenges, but experience has taught us that maintaining long-term investment goals can be an effective way to plan for the future. To help you create a sound strategy based on your personal goals and risk tolerance, Wells Fargo Funds offers more than 100 mutual funds spanning a wide range of asset classes and investment styles. Although diversification cannot guarantee an investment profit or prevent losses, we believe it can be an effective way to manage investment risk and potentially smooth out overall portfolio performance. We encourage investors to know
“Financial markets ended 2019 on a broadly positive note, with the U.S. and China reaching an accord on a Phase One trade deal.”
|
For further information about your Fund, contact your investment professional, visit our website at wfam.com, or call us directly at1-800-222-8222. |
Wells Fargo Premier Large Company Growth Fund | 3
Table of Contents
Letter to shareholders (unaudited)
their investments and to understand that appropriate levels of risk-taking may unlock opportunities.
Thank you for choosing to invest with Wells Fargo Funds. We appreciate your confidence in us and remain committed to helping you meet your financial needs.
Sincerely,

Andrew Owen
President
Wells Fargo Funds
4 | Wells Fargo Premier Large Company Growth Fund
Table of Contents
Performance highlights (unaudited)
Investment objective
The Fund seeks long-term capital appreciation.
Manager
Wells Fargo Funds Management, LLC
Subadviser
Wells Capital Management Incorporated
Portfolio managers
Joseph M. Eberhardy, CFA®‡, CPA
Bob Gruendyke, CFA®‡
Thomas C. Ognar, CFA®‡
Average annual total returns (%) as of January 31, 20201
| Including sales charge | Excluding sales charge | Expense ratios2 (%) | ||||||||||||||||||||||||||||||||
| Inception date | 1 year | 5 year | 10 year | 1 year | 5 year | 10 year | Gross | Net3 | ||||||||||||||||||||||||||
| Class A (EKJAX) | 1-20-1998 | 18.38 | 12.03 | 13.75 | 25.56 | 13.36 | 14.43 | 1.15 | 1.11 | |||||||||||||||||||||||||
| Class C (EKJCX) | 1-22-1998 | 23.46 | 12.49 | 13.57 | 24.46 | 12.49 | 13.57 | 1.90 | 1.86 | |||||||||||||||||||||||||
| Class R4 (EKJRX)4 | 11-30-2012 | – | – | – | 25.87 | 13.69 | 14.79 | 0.87 | 0.80 | |||||||||||||||||||||||||
| Class R6 (EKJFX)5 | 11-30-2012 | – | – | – | 26.13 | 13.87 | 14.92 | 0.72 | 0.65 | |||||||||||||||||||||||||
| Administrator Class (WFPDX)6 | 7-16-2010 | – | – | – | 25.69 | 13.50 | 14.58 | 1.07 | 1.00 | |||||||||||||||||||||||||
| Institutional Class (EKJYX) | 6-30-1999 | – | – | – | 26.08 | 13.82 | 14.88 | 0.82 | 0.70 | |||||||||||||||||||||||||
| Russell 1000® Growth Index7 | – | – | – | – | 27.94 | 15.49 | 15.99 | – | – | |||||||||||||||||||||||||
Figures quoted represent past performance, which is no guarantee of future results, and do not reflect taxes that shareholder may pay on an investment in a fund. Investment return and principal value of an investment will fluctuate so that an investor’s shares, when redeemed, may be worth more or less than their original cost. Performance shown without sales charges would be lower if sales charges were reflected. Current performance may be lower or higher than the performance data quoted, which assumes the reinvestment of dividends and capital gains. Currentmonth-end performance is available on the Fund’s website,wfam.com.
Please keep in mind that high double-digit returns were primarily achieved during favorable market conditions. You should not expect that such favorable returns can be consistently achieved. A fund’s performance, especially for short time periods, should not be the sole factor in making your investment decision.
Index returns do not include transaction costs associated with buying and selling securities, any mutual fund fees or expenses, or any taxes. It is not possible to invest directly in an index.
For Class A shares, the maximumfront-end sales charge is 5.75%. For Class C shares, the maximum contingent deferred sales charge is 1.00%. Performance including a contingent deferred sales charge assumes the sales charge for the corresponding time period. Class R4, Class R6, Administrator Class, and Institutional Class shares are sold without afront-end sales charge or contingent deferred sales charge.
Stock values fluctuate in response to the activities of individual companies and general market and economic conditions. Certain investment strategies tend to increase the total risk of an investment (relative to the broader market). The Fund is exposed to foreign investment risk. Consult the Fund’s prospectus for additional information on these and other risks.
Please see footnotes on page 6.
Wells Fargo Premier Large Company Growth Fund | 5
Table of Contents
Performance highlights (unaudited)
| Ten largest holdings (%) as of January 31, 20208 | ||||
Amazon.com Incorporated | 7.16 | |||
Microsoft Corporation | 7.12 | |||
Alphabet Incorporated Class A | 5.72 | |||
MasterCard Incorporated Class A | 4.23 | |||
Visa Incorporated Class A | 3.39 | |||
Microchip Technology Incorporated | 2.59 | |||
CoStar Group Incorporated | 2.29 | |||
Zoetis Incorporated | 2.09 | |||
Facebook Incorporated Class A | 2.02 | |||
Texas Instruments Incorporated | 1.93 | |||
| Sector distribution as of January 31, 20209 |
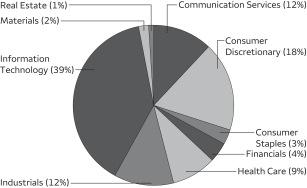 |
| ‡ | CFA® and Chartered Financial Analyst® are trademarks owned by CFA Institute. |
| 1 | Historical performance prior to July 19, 2010, is based on the performance of the Fund’s predecessor, Evergreen Large Company Growth Fund. |
| 2 | Reflects the expense ratios as stated in the most recent prospectuses. The expense ratios shown are subject to change and may differ from the annualized expense ratios shown in the financial highlights of this report. |
| 3 | The manager has contractually committed through November 30, 2020, to waive fees and/or reimburse expenses to the extent necessary to cap total annual fund operating expenses after fee waivers at 1.11% for Class A, 1.86% for Class C, 0.80% for Class R4, 0.65% for Class R6, 1.00% for Administrator Class, and 0.70% for Institutional Class. Brokerage commissions, stamp duty fees, interest, taxes, acquired fund fees and expenses (if any), and extraordinary expenses are excluded from the expense cap. Prior to or after the commitment expiration date, the cap may be increased or the commitment to maintain the cap may be terminated only with the approval of the Board of Trustees. Without this cap, the Fund’s returns would have been lower. The expense ratio paid by an investor is the net expense ratio (the total annual fund operating expenses after fee waivers) as stated in the prospectuses. |
| 4 | Historical performance shown for the Class R4 shares prior to their inception reflects the performance of the Institutional Class shares, adjusted to reflect the higher expenses applicable to Class R4 shares. |
| 5 | Historical performance shown for the Class R6 shares prior to their inception reflects the performance of the Institutional Class shares, and includes the higher expenses applicable to the Institutional Class shares. If these expenses had not been included, returns for the Class R6 shares would be higher. |
| 6 | Historical performance shown for the Administrator Class shares prior to their inception reflects the performance of the Institutional Class shares, adjusted to reflect the higher expenses applicable to the Administrator Class shares. |
| 7 | The Russell 1000® Growth Index measures the performance of those Russell 1000 companies with higher price/book ratios and higher forecasted growth values. You cannot invest directly in an index. |
| 8 | The ten largest holdings, excluding cash, cash equivalents and any money market funds, are calculated based on the value of the investments divided by total net assets of the Fund. Holdings are subject to change and may have changed since the date specified. |
| 9 | Amounts are calculated based on the total long-term investments of the Fund. These amounts are subject to change and may have changed since the date specified. |
6 | Wells Fargo Premier Large Company Growth Fund
Table of Contents
As a shareholder of the Fund, you incur two types of costs: (1) transaction costs, including sales charges (loads) on purchase payments and contingent deferred sales charges (if any) on redemptions and (2) ongoing costs, including management fees, distribution (12b-1) and/or shareholder servicing fees, and other Fund expenses. This example is intended to help you understand your ongoing costs (in dollars) of investing in the Fund and to compare these costs with the ongoing costs of investing in other mutual funds.
The example is based on an investment of $1,000 invested at the beginning of the six-month period and held for the entire period from August 1, 2019 to January 31, 2020.
Actual expenses
The “Actual” line of the table below provides information about actual account values and actual expenses. You may use the information in this line, together with the amount you invested, to estimate the expenses that you paid over the period. Simply divide your account value by $1,000 (for example, an $8,600 account value divided by $1,000 = 8.6), then multiply the result by the number in the “Actual” line under the heading entitled “Expenses paid during period” for your applicable class of shares to estimate the expenses you paid on your account during this period.
Hypothetical example for comparison purposes
The “Hypothetical” line of the table below provides information about hypothetical account values and hypothetical expenses based on the Fund’s actual expense ratio and an assumed rate of return of 5% per year before expenses, which is not the Fund’s actual return. The hypothetical account values and expenses may not be used to estimate the actual ending account balance or expenses you paid for the period. You may use this information to compare the ongoing costs of investing in the Fund and other funds. To do so, compare this 5% hypothetical example with the 5% hypothetical examples that appear in the shareholder reports of the other funds.
Please note that the expenses shown in the table are meant to highlight your ongoing costs only and do not reflect any transactional costs, such as sales charges (loads) and contingent deferred sales charges. Therefore, the “Hypothetical” line of the table is useful in comparing ongoing costs only and will not help you determine the relative total costs of owning different funds. In addition, if these transactional costs were included, your costs would have been higher.
| Beginning account value 8-1-2019 | Ending account value 1-31-2020 | Expenses paid during the period1 | Annualized net expense ratio | |||||||||||||
Class A | ||||||||||||||||
Actual | $ | 1,000.00 | $ | 1,080.40 | $ | 5.70 | 1.09 | % | ||||||||
Hypothetical (5% return before expenses) | $ | 1,000.00 | $ | 1,019.66 | $ | 5.53 | 1.09 | % | ||||||||
Class C | ||||||||||||||||
Actual | $ | 1,000.00 | $ | 1,075.44 | $ | 9.70 | 1.86 | % | ||||||||
Hypothetical (5% return before expenses) | $ | 1,000.00 | $ | 1,015.79 | $ | 9.42 | 1.86 | % | ||||||||
Class R4 | ||||||||||||||||
Actual | $ | 1,000.00 | $ | 1,081.99 | $ | 4.19 | 0.80 | % | ||||||||
Hypothetical (5% return before expenses) | $ | 1,000.00 | $ | 1,021.11 | $ | 4.06 | 0.80 | % | ||||||||
Class R6 | ||||||||||||||||
Actual | $ | 1,000.00 | $ | 1,082.75 | $ | 3.40 | 0.65 | % | ||||||||
Hypothetical (5% return before expenses) | $ | 1,000.00 | $ | 1,021.87 | $ | 3.30 | 0.65 | % | ||||||||
Administrator Class | ||||||||||||||||
Actual | $ | 1,000.00 | $ | 1,081.54 | $ | 5.23 | 1.00 | % | ||||||||
Hypothetical (5% return before expenses) | $ | 1,000.00 | $ | 1,020.11 | $ | 5.08 | 1.00 | % | ||||||||
Institutional Class | ||||||||||||||||
Actual | $ | 1,000.00 | $ | 1,082.44 | $ | 3.66 | 0.70 | % | ||||||||
Hypothetical (5% return before expenses) | $ | 1,000.00 | $ | 1,021.62 | $ | 3.56 | 0.70 | % | ||||||||
| 1 | Expenses paid is equal to the annualized net expense ratio of each class multiplied by the average account value over the period, multiplied by the number of days in the most recent fiscal half-year divided by the number of days in the fiscal year (to reflect the one-half-year period). |
Wells Fargo Premier Large Company Growth Fund | 7
Table of Contents
Portfolio of investments—January 31, 2020 (unaudited)
| Shares | Value | |||||||||||||||
| Common Stocks: 100.19% | ||||||||||||||||
Communication Services: 12.11% | ||||||||||||||||
| Entertainment: 2.00% | ||||||||||||||||
Live Nation Entertainment Incorporated † | 452,720 | $ | 30,857,395 | |||||||||||||
The Walt Disney Company | 173,770 | 24,034,129 | ||||||||||||||
| 54,891,524 | ||||||||||||||||
|
| |||||||||||||||
| Interactive Media & Services: 10.11% | ||||||||||||||||
Alphabet Incorporated Class A † | 109,890 | 157,448,194 | ||||||||||||||
Alphabet Incorporated Class C † | 19,818 | 28,423,570 | ||||||||||||||
Facebook Incorporated Class A † | 275,850 | 55,696,874 | ||||||||||||||
Match Group Incorporated †« | 171,830 | 13,440,543 | ||||||||||||||
Pinterest Incorporated Class A † | 1,056,395 | 23,272,382 | ||||||||||||||
| 278,281,563 | ||||||||||||||||
|
| |||||||||||||||
Consumer Discretionary: 17.92% | ||||||||||||||||
| Hotels, Restaurants & Leisure: 1.43% | ||||||||||||||||
Planet Fitness Incorporated Class A † | 270,720 | 21,871,469 | ||||||||||||||
Royal Caribbean Cruises Limited | 150,040 | 17,566,683 | ||||||||||||||
| 39,438,152 | ||||||||||||||||
|
| |||||||||||||||
| Household Durables: 0.29% | ||||||||||||||||
Roku Incorporated † | 65,480 | 7,919,806 | ||||||||||||||
|
| |||||||||||||||
| Internet & Direct Marketing Retail: 7.83% | ||||||||||||||||
Amazon.com Incorporated † | 98,070 | 196,995,170 | ||||||||||||||
MercadoLibre Incorporated † | 27,880 | 18,484,440 | ||||||||||||||
| 215,479,610 | ||||||||||||||||
|
| |||||||||||||||
| Specialty Retail: 5.99% | ||||||||||||||||
Burlington Stores Incorporated † | 196,700 | 42,776,349 | ||||||||||||||
CarMax Incorporated † | 293,465 | 28,477,844 | ||||||||||||||
Carvana Company †« | 129,590 | 10,270,008 | ||||||||||||||
Five Below Incorporated † | 204,970 | 23,206,703 | ||||||||||||||
Floor & Decor Holdings Incorporated † | 375,640 | 18,522,808 | ||||||||||||||
O’Reilly Automotive Incorporated † | 72,660 | 29,507,226 | ||||||||||||||
ULTA Beauty Incorporated † | 44,880 | 12,023,801 | ||||||||||||||
| 164,784,739 | ||||||||||||||||
|
| |||||||||||||||
| Textiles, Apparel & Luxury Goods: 2.38% | ||||||||||||||||
Deckers Outdoor Corporation † | 134,420 | 25,662,122 | ||||||||||||||
Levi Strauss & Company Class A | 708,039 | 13,905,886 | ||||||||||||||
lululemon athletica Incorporated † | 108,510 | 25,976,209 | ||||||||||||||
| 65,544,217 | ||||||||||||||||
|
| |||||||||||||||
Consumer Staples: 2.92% | ||||||||||||||||
| Beverages: 1.27% | ||||||||||||||||
The Coca-Cola Company | 598,560 | 34,955,904 | ||||||||||||||
|
| |||||||||||||||
| Food & Staples Retailing: 0.58% | ||||||||||||||||
Costco Wholesale Corporation | 52,770 | 16,122,290 | ||||||||||||||
|
| |||||||||||||||
| Personal Products: 1.07% | ||||||||||||||||
The Estee Lauder Companies Incorporated Class A | 150,400 | 29,352,064 | ||||||||||||||
|
| |||||||||||||||
The accompanying notes are an integral part of these financial statements.
8 | Wells Fargo Premier Large Company Growth Fund
Table of Contents
Portfolio of investments—January 31, 2020 (unaudited)
| Shares | Value | |||||||||||||||
Financials: 4.45% | ||||||||||||||||
| Capital Markets: 3.92% | ||||||||||||||||
CME Group Incorporated | 201,760 | $ | 43,804,114 | |||||||||||||
E*TRADE Financial Corporation | 293,985 | 12,529,641 | ||||||||||||||
MarketAxess Holdings Incorporated | 88,530 | 31,355,555 | ||||||||||||||
Tradeweb Markets Incorporated Class A | 437,540 | 20,205,597 | ||||||||||||||
| 107,894,907 | ||||||||||||||||
|
| |||||||||||||||
| Thrifts & Mortgage Finance: 0.53% | ||||||||||||||||
LendingTree Incorporated †« | 46,510 | 14,473,912 | ||||||||||||||
|
| |||||||||||||||
Health Care: 9.30% | ||||||||||||||||
| Biotechnology: 1.21% | ||||||||||||||||
Exact Sciences Corporation † | 213,030 | 19,871,438 | ||||||||||||||
Vertex Pharmaceuticals Incorporated † | 59,700 | 13,554,885 | ||||||||||||||
| 33,426,323 | ||||||||||||||||
|
| |||||||||||||||
| Health Care Equipment & Supplies: 4.53% | ||||||||||||||||
Abbott Laboratories | 458,720 | 39,972,861 | ||||||||||||||
Boston Scientific Corporation † | 1,126,840 | 47,180,791 | ||||||||||||||
Insulet Corporation † | 124,470 | 24,152,159 | ||||||||||||||
Novocure Limited † | 164,700 | 13,416,462 | ||||||||||||||
| 124,722,273 | ||||||||||||||||
|
| |||||||||||||||
| Health Care Technology: 0.79% | ||||||||||||||||
Veeva Systems Incorporated Class A † | 147,500 | 21,624,975 | ||||||||||||||
|
| |||||||||||||||
| Life Sciences Tools & Services: 0.68% | ||||||||||||||||
Repligen Corporation † | 186,730 | 18,745,825 | ||||||||||||||
|
| |||||||||||||||
| Pharmaceuticals: 2.09% | ||||||||||||||||
Zoetis Incorporated | 428,748 | 57,542,269 | ||||||||||||||
|
| |||||||||||||||
Industrials: 11.75% | ||||||||||||||||
| Aerospace & Defense: 0.92% | ||||||||||||||||
HEICO Corporation | 207,312 | 25,381,208 | ||||||||||||||
|
| |||||||||||||||
| Commercial Services & Supplies: 2.89% | ||||||||||||||||
Copart Incorporated † | 321,170 | 32,585,908 | ||||||||||||||
Waste Connections Incorporated | 486,165 | 46,822,551 | ||||||||||||||
| 79,408,459 | ||||||||||||||||
|
| |||||||||||||||
| Industrial Conglomerates: 1.13% | ||||||||||||||||
Roper Technologies Incorporated | 81,550 | 31,124,373 | ||||||||||||||
|
| |||||||||||||||
| Professional Services: 3.65% | ||||||||||||||||
CoStar Group Incorporated † | 96,680 | 63,131,073 | ||||||||||||||
TransUnion | 407,220 | 37,342,074 | ||||||||||||||
| 100,473,147 | ||||||||||||||||
|
| |||||||||||||||
| Road & Rail: 3.16% | ||||||||||||||||
CSX Corporation | 136,000 | 10,382,240 | ||||||||||||||
Norfolk Southern Corporation | 144,030 | 29,988,486 | ||||||||||||||
Union Pacific Corporation | 260,430 | 46,726,351 | ||||||||||||||
| 87,097,077 | ||||||||||||||||
|
| |||||||||||||||
The accompanying notes are an integral part of these financial statements.
Wells Fargo Premier Large Company Growth Fund | 9
Table of Contents
Portfolio of investments—January 31, 2020 (unaudited)
| Shares | Value | |||||||||||||||
Information Technology: 39.14% | ||||||||||||||||
| Electronic Equipment, Instruments & Components: 0.53% | ||||||||||||||||
TE Connectivity Limited | 157,500 | $ | 14,518,350 | |||||||||||||
|
| |||||||||||||||
| IT Services: 13.78% | ||||||||||||||||
Black Knight Incorporated † | 21,240 | 1,421,381 | ||||||||||||||
Euronet Worldwide Incorporated † | 188,106 | 29,653,030 | ||||||||||||||
Fidelity National Information Services Incorporated | 156,090 | 22,423,889 | ||||||||||||||
Global Payments Incorporated | 180,460 | 35,270,907 | ||||||||||||||
MasterCard Incorporated Class A | 368,680 | 116,480,759 | ||||||||||||||
PayPal Holdings Incorporated † | 309,100 | 35,203,399 | ||||||||||||||
Square Incorporated Class A † | 150,138 | 11,213,807 | ||||||||||||||
Visa Incorporated Class A | 468,770 | 93,271,167 | ||||||||||||||
WEX Incorporated † | 158,240 | 34,325,421 | ||||||||||||||
| 379,263,760 | ||||||||||||||||
|
| |||||||||||||||
| Semiconductors & Semiconductor Equipment: 6.66% | ||||||||||||||||
Microchip Technology Incorporated | 732,450 | 71,399,226 | ||||||||||||||
Monolithic Power Systems Incorporated | 137,730 | 23,575,244 | ||||||||||||||
NXP Semiconductors NV | 277,370 | 35,187,158 | ||||||||||||||
Texas Instruments Incorporated | 439,580 | 53,035,327 | ||||||||||||||
| 183,196,955 | ||||||||||||||||
|
| |||||||||||||||
| Software: 18.01% | ||||||||||||||||
Adobe Incorporated † | 134,419 | 47,199,888 | ||||||||||||||
Anaplan Incorporated † | 462,300 | 26,623,857 | ||||||||||||||
Cloudflare Incorporated Class A †« | 347,290 | 6,202,599 | ||||||||||||||
Dynatrace Incorporated † | 867,373 | 27,157,449 | ||||||||||||||
HubSpot Incorporated † | 117,267 | 21,218,291 | ||||||||||||||
Microsoft Corporation | 1,151,810 | 196,072,616 | ||||||||||||||
Proofpoint Incorporated † | 285,600 | 35,074,536 | ||||||||||||||
RealPage Incorporated † | 192,400 | 11,226,540 | ||||||||||||||
RingCentral Incorporated Class A † | 127,620 | 26,236,120 | ||||||||||||||
Salesforce.com Incorporated † | 219,300 | 39,980,583 | ||||||||||||||
ServiceNow Incorporated † | 95,820 | 32,409,199 | ||||||||||||||
Splunk Incorporated † | 168,335 | 26,135,692 | ||||||||||||||
| 495,537,370 | ||||||||||||||||
|
| |||||||||||||||
| Technology Hardware, Storage & Peripherals: 0.16% | ||||||||||||||||
Apple Incorporated | 14,640 | 4,531,226 | ||||||||||||||
|
| |||||||||||||||
Materials: 1.49% | ||||||||||||||||
| Chemicals: 1.49% | ||||||||||||||||
Linde plc | 202,280 | 41,089,136 | ||||||||||||||
|
| |||||||||||||||
Real Estate: 1.11% | ||||||||||||||||
| Equity REITs: 0.50% | ||||||||||||||||
SBA Communications Corporation | 55,300 | 13,800,668 | ||||||||||||||
|
| |||||||||||||||
| Real Estate Management & Development: 0.61% | ||||||||||||||||
CBRE Group Incorporated Class A † | 275,670 | 16,829,654 | ||||||||||||||
|
| |||||||||||||||
Total Common Stocks (Cost $1,420,140,611) | 2,757,451,736 | |||||||||||||||
|
| |||||||||||||||
The accompanying notes are an integral part of these financial statements.
10 | Wells Fargo Premier Large Company Growth Fund
Table of Contents
Portfolio of investments—January 31, 2020 (unaudited)
| Yield | Shares | Value | ||||||||||||||
| Short-Term Investments: 0.81% | ||||||||||||||||
| Investment Companies: 0.81% | ||||||||||||||||
Securities Lending Cash Investments LLC (l)(r)(u) | 1.70 | % | 18,861,232 | $ | 18,863,118 | |||||||||||
Wells Fargo Government Money Market Fund Select Class (l)(u) | 1.51 | 3,337,232 | 3,337,232 | |||||||||||||
Total Short-Term Investments (Cost $22,200,350) | 22,200,350 | |||||||||||||||
|
| |||||||||||||||
| Total investments in securities (Cost $1,442,340,961) | 101.00 | % | 2,779,652,086 | |||||
Other assets and liabilities, net | (1.00 | ) | (27,481,168 | ) | ||||
|
|
|
| |||||
| Total net assets | 100.00 | % | $ | 2,752,170,918 | ||||
|
|
|
| |||||
| † | Non-income-earning security |
| « | All or a portion of this security is on loan. |
| (l) | The issuer of the security is an affiliated person of the Fund as defined in the Investment Company Act of 1940. |
| (r) | The investment is anon-registered investment company purchased with cash collateral received from securities on loan. |
| (u) | The rate represents the7-day annualized yield at period end. |
Abbreviations:
| REIT | Real estate investment trust |
Investments in Affiliates
An affiliated investment is an investment in which the Fund owns at least 5% of the outstanding voting shares of the issuer or as a result of other relationships, such as the Fund and the issuer having the same investment manager. Transactions with issuers that were either affiliated persons of the Fund at the beginning of the period or the end of the period were as follows:
Shares, period | Shares purchased | Shares sold | Shares, end of period | Net realized gains (losses) | Net change in unrealized gains (losses) | Income from affiliated securities | Value, end of period | % of net assets | ||||||||||||||||||||||||||||
| Short-Term Investments | ||||||||||||||||||||||||||||||||||||
Investment Companies | ||||||||||||||||||||||||||||||||||||
Securities Lending Cash Investments LLC | 96,444,554 | 243,726,224 | (321,309,546 | ) | 18,861,232 | $ | 532 | $ | 0 | $ | 567,503 | # | $ | 18,863,118 | ||||||||||||||||||||||
Wells Fargo Government Money Market Fund Select Class | 2,551,452 | 217,566,147 | (216,780,367 | ) | 3,337,232 | 0 | 0 | 67,969 | 3,337,232 | |||||||||||||||||||||||||||
|
|
|
|
|
|
|
|
|
| |||||||||||||||||||||||||||
| $ | 532 | $ | 0 | $ | 635,472 | $ | 22,200,350 | 0.81 | % | |||||||||||||||||||||||||||
|
|
|
|
|
|
|
|
|
| |||||||||||||||||||||||||||
| # | Amount shown represents income before fees and rebates. |
The accompanying notes are an integral part of these financial statements.
Wells Fargo Premier Large Company Growth Fund | 11
Table of Contents
Statement of assets and liabilities—January 31, 2020 (unaudited)
Assets | ||||
Investments in unaffiliated securities (including $18,474,315 of securities loaned), at value (cost $1,420,140,611) | $ | 2,757,451,736 | ||
Investments in affiliated securities, at value (cost $22,200,350) | 22,200,350 | |||
Receivable for investments sold | 15,914,336 | |||
Receivable for Fund shares sold | 1,673,133 | |||
Receivable for dividends | 805,624 | |||
Receivable for securities lending income, net | 37,370 | |||
Prepaid expenses and other assets | 85,194 | |||
|
| |||
Total assets | 2,798,167,743 | |||
|
| |||
Liabilities | ||||
Payable upon receipt of securities loaned | 18,858,012 | |||
Payable for investments purchased | 6,082,245 | |||
Payable for Fund shares redeemed | 18,416,241 | |||
Management fee payable | 1,502,521 | |||
Administration fees payable | 334,312 | |||
Distribution fee payable | 89,249 | |||
Trustees’ fees and expenses payable | 5,601 | |||
Accrued expenses and other liabilities | 708,644 | |||
|
| |||
Total liabilities | 45,996,825 | |||
|
| |||
Total net assets | $ | 2,752,170,918 | ||
|
| |||
Net assets consist of | ||||
Paid-in capital | $ | 1,370,614,903 | ||
Total distributable earnings | 1,381,556,015 | |||
|
| |||
Total net assets | $ | 2,752,170,918 | ||
|
| |||
Computation of net asset value and offering price per share | ||||
Net assets – Class A | $ | 1,081,472,715 | ||
Shares outstanding – Class A1 | 76,450,553 | |||
Net asset value per share – Class A | $14.15 | |||
Maximum offering price per share – Class A2 | $15.01 | |||
Net assets – Class C | $ | 130,161,303 | ||
Shares outstanding – Class C1 | 12,933,058 | |||
Net asset value per share – Class C | $10.06 | |||
Net assets – Class R4 | $ | 3,185,240 | ||
Share outstanding – Class R41 | 213,298 | |||
Net asset value per share – Class R4 | $14.93 | |||
Net assets – Class R6 | $ | 871,859,606 | ||
Shares outstanding – Class R61 | 57,391,138 | |||
Net asset value per share – Class R6 | $15.19 | |||
Net assets – Administrator Class | $ | 34,385,267 | ||
Shares outstanding – Administrator Class1 | 2,375,685 | |||
Net asset value per share – Administrator Class | $14.47 | |||
Net assets – Institutional Class | $ | 631,106,787 | ||
Shares outstanding – Institutional Class1 | 41,743,531 | |||
Net asset value per share – Institutional Class | $15.12 | |||
| 1 | The Fund has an unlimited number of authorized shares. |
| 2 | Maximum offering price is computed as 100/94.25 of net asset value. On investments of $50,000 or more, the offering price is reduced. |
The accompanying notes are an integral part of these financial statements.
12 | Wells Fargo Premier Large Company Growth Fund
Table of Contents
Statement of operations—six months ended January 31, 2020 (unaudited)
Investment income | ||||
Dividends (net of foreign withholding taxes of $60,596) | $ | 8,082,125 | ||
Income from affiliated securities | 348,379 | |||
|
| |||
Total investment income | 8,430,504 | |||
|
| |||
Expenses | ||||
Management fee | 8,904,699 | |||
Administration fees | ||||
Class A | 1,105,462 | |||
Class C | 146,077 | |||
Class R4 | 1,569 | |||
Class R6 | 124,561 | |||
Administrator Class | 32,018 | |||
Institutional Class | 410,592 | |||
Shareholder servicing fees | ||||
Class A | 1,316,026 | |||
Class C | 173,901 | |||
Class R4 | 1,961 | |||
Administrator Class | 61,572 | |||
Distribution fee | ||||
Class C | 521,382 | |||
Custody and accounting fees | 61,151 | |||
Professional fees | 27,493 | |||
Registration fees | 66,376 | |||
Shareholder report expenses | 107,575 | |||
Trustees’ fees and expenses | 10,864 | |||
Other fees and expenses | 27,145 | |||
|
| |||
Total expenses | 13,100,424 | |||
Less: Fee waivers and/or expense reimbursements | ||||
Fund-level | (609,657 | ) | ||
Class A | (82,582 | ) | ||
Class C | (55 | ) | ||
Class R4 | (52 | ) | ||
Class R6 | (14,117 | ) | ||
Administrator Class | (911 | ) | ||
Institutional Class | (167,645 | ) | ||
|
| |||
Net expenses | 12,225,405 | |||
|
| |||
Net investment loss | (3,794,901 | ) | ||
|
| |||
Realized and unrealized gains (losses) on investments | ||||
Net realized gains on | ||||
Unaffiliated securities | 57,139,284 | |||
Affiliated securities | 532 | |||
|
| |||
Net realized gains on investments | 57,139,816 | |||
Net change in unrealized gains (losses) on investments | 155,946,069 | |||
|
| |||
Net realized and unrealized gains (losses) on investments | 213,085,885 | |||
|
| |||
Net increase in net assets resulting from operations | $ | 209,290,984 | ||
|
| |||
The accompanying notes are an integral part of these financial statements.
Wells Fargo Premier Large Company Growth Fund | 13
Table of Contents
Statement of changes in net assets
| Six months ended January 31, 2020 (unaudited) | Year ended July 31, 2019 | |||||||||||||||
Operations | ||||||||||||||||
Net investment loss | $ | (3,794,901 | ) | $ | (5,976,680 | ) | ||||||||||
Net realized gains on investments | 57,139,816 | 281,042,857 | ||||||||||||||
Net change in unrealized gains (losses) on investments | 155,946,069 | 880,406 | ||||||||||||||
|
| |||||||||||||||
Net increase in net assets resulting from operations | 209,290,984 | 275,946,583 | ||||||||||||||
|
| |||||||||||||||
Distributions to shareholders from net investment income and net realized gains | ||||||||||||||||
Class A | (79,445,426 | ) | (157,260,447 | ) | ||||||||||||
Class C | (13,534,953 | ) | (37,119,006 | ) | ||||||||||||
Class R4 | (288,415 | ) | (524,816 | ) | ||||||||||||
Class R6 | (58,912,621 | ) | (27,912,392 | ) | ||||||||||||
Administrator Class | (3,631,494 | ) | (7,935,426 | ) | ||||||||||||
Institutional Class | (44,767,006 | ) | (149,877,161 | ) | ||||||||||||
|
| |||||||||||||||
Total distributions to shareholders | (200,579,915 | ) | (380,629,248 | ) | ||||||||||||
|
| |||||||||||||||
Capital share transactions | Shares | Shares | ||||||||||||||
Proceeds from shares sold | ||||||||||||||||
Class A | 2,639,005 | 36,545,286 | 4,978,668 | 64,852,617 | ||||||||||||
Class C | 436,283 | 4,271,556 | 1,500,469 | 13,864,166 | ||||||||||||
Class R4 | 8,057 | 117,769 | 40,306 | 500,326 | ||||||||||||
Class R6 | 2,910,884 | 43,377,827 | 43,509,076 | 654,543,608 | ||||||||||||
Administrator Class | 121,964 | 1,731,063 | 330,627 | 4,405,388 | ||||||||||||
Institutional Class | 2,124,323 | 31,472,765 | 9,977,465 | 140,174,907 | ||||||||||||
|
| |||||||||||||||
| 117,516,266 | 878,341,012 | |||||||||||||||
|
| |||||||||||||||
Reinvestment of distributions | ||||||||||||||||
Class A | 5,635,528 | 74,670,743 | 12,562,848 | 146,357,178 | ||||||||||||
Class C | 1,226,541 | 11,578,543 | 3,761,732 | 32,426,128 | ||||||||||||
Class R4 | 20,542 | 287,184 | 42,768 | 522,194 | ||||||||||||
Class R6 | 4,072,770 | 57,914,790 | 2,036,361 | 25,210,147 | ||||||||||||
Administrator Class | 258,688 | 3,507,809 | 643,091 | 7,646,354 | ||||||||||||
Institutional Class | 2,794,274 | 39,538,976 | 11,058,800 | 136,355,009 | ||||||||||||
|
| |||||||||||||||
| 187,498,045 | 348,517,010 | |||||||||||||||
|
| |||||||||||||||
Payment for shares redeemed | ||||||||||||||||
Class A | (5,895,893 | ) | (81,941,522 | ) | (12,892,646 | ) | (172,044,344 | ) | ||||||||
Class C | (3,413,478 | ) | (34,496,843 | ) | (7,522,098 | ) | (72,094,200 | ) | ||||||||
Class R4 | (79,878 | ) | (1,182,169 | ) | (56,058 | ) | (848,702 | ) | ||||||||
Class R6 | (3,851,679 | ) | (57,333,081 | ) | (3,699,221 | ) | (52,309,727 | ) | ||||||||
Administrator Class | (1,390,949 | ) | (20,093,908 | ) | (1,338,333 | ) | (18,694,385 | ) | ||||||||
Institutional Class | (5,919,616 | ) | (87,605,003 | ) | (44,233,595 | ) | (636,259,361 | ) | ||||||||
|
| |||||||||||||||
| (282,652,526 | ) | (952,250,719 | ) | |||||||||||||
|
| |||||||||||||||
Net increase in net assets resulting from capital share transactions | 22,361,785 | 274,607,303 | ||||||||||||||
|
| |||||||||||||||
Total increase in net assets | 31,072,854 | 169,924,638 | ||||||||||||||
|
| |||||||||||||||
Net assets | ||||||||||||||||
Beginning of period | 2,721,098,064 | 2,551,173,426 | ||||||||||||||
|
| |||||||||||||||
End of period | $ | 2,752,170,918 | $ | 2,721,098,064 | ||||||||||||
|
| |||||||||||||||
The accompanying notes are an integral part of these financial statements.
14 | Wells Fargo Premier Large Company Growth Fund
Table of Contents
(For a share outstanding throughout each period)
| Six months ended January 31, 2020 (unaudited) | Year ended July 31 | |||||||||||||||||||||||
| CLASS A | 2019 | 2018 | 2017 | 2016 | 2015 | |||||||||||||||||||
Net asset value, beginning of period | $14.19 | $15.10 | $15.34 | $14.68 | $16.28 | $14.55 | ||||||||||||||||||
Net investment loss | (0.03 | ) | (0.05 | ) | (0.05 | ) | (0.03 | )1 | (0.03 | ) | (0.03 | ) | ||||||||||||
Net realized and unrealized gains (losses) on investments | 1.10 | 1.50 | 3.56 | 2.12 | (0.52 | ) | 1.97 | |||||||||||||||||
|
|
|
|
|
|
|
|
|
|
|
| |||||||||||||
Total from investment operations | 1.07 | 1.45 | 3.51 | 2.09 | (0.55 | ) | 1.94 | |||||||||||||||||
Distributions to shareholders from | ||||||||||||||||||||||||
Net realized gains | (1.11 | ) | (2.36 | ) | (3.75 | ) | (1.43 | ) | (1.05 | ) | (0.21 | ) | ||||||||||||
Net asset value, end of period | $14.15 | $14.19 | $15.10 | $15.34 | $14.68 | $16.28 | ||||||||||||||||||
Total return2 | 8.04 | % | 12.97 | % | 26.54 | % | 16.01 | % | (3.22 | )% | 13.46 | % | ||||||||||||
Ratios to average net assets (annualized) | ||||||||||||||||||||||||
Gross expenses | 1.14 | % | 1.15 | % | 1.15 | % | 1.14 | % | 1.13 | % | 1.16 | % | ||||||||||||
Net expenses | 1.09 | % | 1.11 | % | 1.11 | % | 1.11 | % | 1.11 | % | 1.12 | % | ||||||||||||
Net investment loss | (0.47 | )% | (0.40 | )% | (0.34 | )% | (0.20 | )% | (0.17 | )% | (0.18 | )% | ||||||||||||
Supplemental data | ||||||||||||||||||||||||
Portfolio turnover rate | 17 | % | 60 | % | 45 | % | 65 | % | 47 | % | 44 | % | ||||||||||||
Net assets, end of period (000s omitted) | $1,081,473 | $1,050,751 | $1,048,632 | $986,791 | $1,697,746 | $2,280,107 | ||||||||||||||||||
| 1 | Calculated based upon average shares outstanding |
| 2 | Total return calculations do not include any sales charges. Returns for periods of less than one year are not annualized. |
The accompanying notes are an integral part of these financial statements.
Wells Fargo Premier Large Company Growth Fund | 15
Table of Contents
Financial highlights
(For a share outstanding throughout each period)
| Six months ended January 31, 2020 (unaudited) | Year ended July 31 | |||||||||||||||||||||||
| CLASS C | 2019 | 2018 | 2017 | 2016 | 2015 | |||||||||||||||||||
Net asset value, beginning of period | $10.45 | $11.87 | $12.86 | $12.64 | $14.27 | $12.87 | ||||||||||||||||||
Net investment loss | (0.06 | )1 | (0.12 | )1 | (0.13 | )1 | (0.12 | )1 | (0.12 | )1 | (0.13 | )1 | ||||||||||||
Net realized and unrealized gains (losses) on investments | 0.78 | 1.06 | 2.89 | 1.77 | (0.46 | ) | 1.74 | |||||||||||||||||
|
|
|
|
|
|
|
|
|
|
|
| |||||||||||||
Total from investment operations | 0.72 | 0.94 | 2.76 | 1.65 | (0.58 | ) | 1.61 | |||||||||||||||||
Distributions to shareholders from | ||||||||||||||||||||||||
Net realized gains | (1.11 | ) | (2.36 | ) | (3.75 | ) | (1.43 | ) | (1.05 | ) | (0.21 | ) | ||||||||||||
Net asset value, end of period | $10.06 | $10.45 | $11.87 | $12.86 | $12.64 | $14.27 | ||||||||||||||||||
Total return2 | 7.54 | % | 12.09 | % | 25.68 | % | 15.05 | % | (3.92 | )% | 12.65 | % | ||||||||||||
Ratios to average net assets (annualized) | ||||||||||||||||||||||||
Gross expenses | 1.89 | % | 1.90 | % | 1.90 | % | 1.89 | % | 1.88 | % | 1.91 | % | ||||||||||||
Net expenses | 1.86 | % | 1.86 | % | 1.86 | % | 1.86 | % | 1.86 | % | 1.87 | % | ||||||||||||
Net investment loss | (1.24 | )% | (1.14 | )% | (1.09 | )% | (0.95 | )% | (0.92 | )% | (0.93 | )% | ||||||||||||
Supplemental data | ||||||||||||||||||||||||
Portfolio turnover rate | 17 | % | 60 | % | 45 | % | 65 | % | 47 | % | 44 | % | ||||||||||||
Net assets, end of period (000s omitted) | $130,161 | $153,404 | $201,138 | $206,026 | $296,896 | $388,290 | ||||||||||||||||||
| 1 | Calculated based upon average shares outstanding |
| 2 | Total return calculations do not include any sales charges. Returns for periods of less than one year are not annualized. |
The accompanying notes are an integral part of these financial statements.
16 | Wells Fargo Premier Large Company Growth Fund
Table of Contents
Financial highlights
(For a share outstanding throughout each period)
| Six months ended January 31, 2020 (unaudited) | Year ended July 31 | |||||||||||||||||||||||
| CLASS R4 | 2019 | 2018 | 2017 | 2016 | 2015 | |||||||||||||||||||
Net asset value, beginning of period | $14.89 | $15.69 | $15.75 | $15.00 | $16.56 | $14.75 | ||||||||||||||||||
Net investment income (loss) | (0.01 | )1 | (0.03 | ) | (0.00 | )1,2 | 0.01 | 1 | 0.02 | 1 | 0.02 | |||||||||||||
Net realized and unrealized gains (losses) on investments | 1.16 | 1.59 | 3.69 | 2.17 | (0.53 | ) | 2.00 | |||||||||||||||||
|
|
|
|
|
|
|
|
|
|
|
| |||||||||||||
Total from investment operations | 1.15 | 1.56 | 3.69 | 2.18 | (0.51 | ) | 2.02 | |||||||||||||||||
Distributions to shareholders from | ||||||||||||||||||||||||
Net realized gains | (1.11 | ) | (2.36 | ) | (3.75 | ) | (1.43 | ) | (1.05 | ) | (0.21 | ) | ||||||||||||
Net asset value, end of period | $14.93 | $14.89 | $15.69 | $15.75 | $15.00 | $16.56 | ||||||||||||||||||
Total return3 | 8.20 | % | 13.21 | % | 27.06 | % | 16.30 | % | (2.91 | )% | 13.82 | % | ||||||||||||
Ratios to average net assets (annualized) | ||||||||||||||||||||||||
Gross expenses | 0.86 | % | 0.87 | % | 0.87 | % | 0.86 | % | 0.85 | % | 0.83 | % | ||||||||||||
Net expenses | 0.80 | % | 0.80 | % | 0.80 | % | 0.80 | % | 0.80 | % | 0.80 | % | ||||||||||||
Net investment income (loss) | (0.18 | )% | (0.10 | )% | (0.02 | )% | 0.09 | % | 0.13 | % | 0.13 | % | ||||||||||||
Supplemental data | ||||||||||||||||||||||||
Portfolio turnover rate | 17 | % | 60 | % | 45 | % | 65 | % | 47 | % | 44 | % | ||||||||||||
Net assets, end of period (000s omitted) | $3,185 | $3,940 | $3,727 | $3,559 | $3,988 | $2,129 | ||||||||||||||||||
| 1 | Calculated based upon average shares outstanding |
| 2 | Amount is more than $(0.005). |
| 3 | Returns for periods of less than one year are not annualized. |
The accompanying notes are an integral part of these financial statements.
Wells Fargo Premier Large Company Growth Fund | 17
Table of Contents
Financial highlights
(For a share outstanding throughout each period)
| Six months ended January 31, 2020 (unaudited) | Year ended July 31 | |||||||||||||||||||||||
| CLASS R6 | 2019 | 2018 | 2017 | 2016 | 2015 | |||||||||||||||||||
Net asset value, beginning of period | $15.12 | $15.87 | $15.87 | $15.08 | $16.62 | $14.77 | ||||||||||||||||||
Net investment income (loss) | (0.00 | )1,2 | (0.00 | )1,2 | 0.02 | 1 | 0.03 | 1 | 0.04 | 1 | 0.05 | |||||||||||||
Net realized and unrealized gains (losses) on investments | 1.18 | 1.61 | 3.73 | 2.19 | (0.53 | ) | 2.01 | |||||||||||||||||
|
|
|
|
|
|
|
|
|
|
|
| |||||||||||||
Total from investment operations | 1.18 | 1.61 | 3.75 | 2.22 | (0.49 | ) | 2.06 | |||||||||||||||||
Distributions to shareholders from | ||||||||||||||||||||||||
Net realized gains | (1.11 | ) | (2.36 | ) | (3.75 | ) | (1.43 | ) | (1.05 | ) | (0.21 | ) | ||||||||||||
Net asset value, end of period | $15.19 | $15.12 | $15.87 | $15.87 | $15.08 | $16.62 | ||||||||||||||||||
Total return3 | 8.27 | % | 13.40 | % | 27.27 | % | 16.48 | % | (2.78 | )% | 14.00 | % | ||||||||||||
Ratios to average net assets (annualized) | ||||||||||||||||||||||||
Gross expenses | 0.71 | % | 0.71 | % | 0.72 | % | 0.71 | % | 0.70 | % | 0.68 | % | ||||||||||||
Net expenses | 0.65 | % | 0.65 | % | 0.65 | % | 0.65 | % | 0.65 | % | 0.65 | % | ||||||||||||
Net investment income (loss) | (0.03 | )% | (0.02 | )% | 0.12 | % | 0.25 | % | 0.28 | % | 0.29 | % | ||||||||||||
Supplemental data | ||||||||||||||||||||||||
Portfolio turnover rate | 17 | % | 60 | % | 45 | % | 65 | % | 47 | % | 44 | % | ||||||||||||
Net assets, end of period (000s omitted) | $871,860 | $820,383 | $196,934 | $170,657 | $179,198 | $166,768 | ||||||||||||||||||
| 1 | Calculated based upon average shares outstanding |
| 2 | Amount is more than $(0.005). |
| 3 | Returns for periods of less than one year are not annualized. |
The accompanying notes are an integral part of these financial statements.
18 | Wells Fargo Premier Large Company Growth Fund
Table of Contents
Financial highlights
(For a share outstanding throughout each period)
| Six months ended January 31, 2020 (unaudited) | Year ended July 31 | |||||||||||||||||||||||
| ADMINISTRATOR CLASS | 2019 | 2018 | 2017 | 2016 | 2015 | |||||||||||||||||||
Net asset value, beginning of period | $14.48 | $15.35 | $15.52 | $14.82 | $16.41 | $14.63 | ||||||||||||||||||
Net investment loss | (0.03 | )1 | (0.04 | )1 | (0.03 | )1 | (0.01 | )1 | (0.00 | )1,2 | (0.00 | )2 | ||||||||||||
Net realized and unrealized gains (losses) on investments | 1.13 | 1.53 | 3.61 | 2.14 | (0.54 | ) | 1.99 | |||||||||||||||||
|
|
|
|
|
|
|
|
|
|
|
| |||||||||||||
Total from investment operations | 1.10 | 1.49 | 3.58 | 2.13 | (0.54 | ) | 1.99 | |||||||||||||||||
Distributions to shareholders from | ||||||||||||||||||||||||
Net realized gains | (1.11 | ) | (2.36 | ) | (3.75 | ) | (1.43 | ) | (1.05 | ) | (0.21 | ) | ||||||||||||
Net asset value, end of period3 | $14.47 | $14.48 | $15.35 | $15.52 | $14.82 | $16.41 | ||||||||||||||||||
Total return | 8.15 | % | 13.02 | % | 26.70 | % | 16.14 | % | (3.13 | )% | 13.73 | % | ||||||||||||
Ratios to average net assets (annualized) | ||||||||||||||||||||||||
Gross expenses | 1.06 | % | 1.07 | % | 1.07 | % | 1.06 | % | 1.04 | % | 1.00 | % | ||||||||||||
Net expenses | 1.00 | % | 1.00 | % | 1.00 | % | 1.00 | % | 0.98 | % | 0.95 | % | ||||||||||||
Net investment loss | (0.38 | )% | (0.29 | )% | (0.22 | )% | (0.06 | )% | (0.02 | )% | (0.01 | )% | ||||||||||||
Supplemental data | ||||||||||||||||||||||||
Portfolio turnover rate | 17 | % | 60 | % | 45 | % | 65 | % | 47 | % | 44 | % | ||||||||||||
Net assets, end of period (000s omitted) | $34,385 | $49,042 | $57,582 | $82,998 | $292,900 | $1,129,970 | ||||||||||||||||||
| 1 | Calculated based upon average shares outstanding |
| 2 | Amount is more than $(0.005). |
| 3 | Returns for periods of less than one year are not annualized. |
The accompanying notes are an integral part of these financial statements.
Wells Fargo Premier Large Company Growth Fund | 19
Table of Contents
Financial highlights
(For a share outstanding throughout each period)
| Six months ended January 31, 2020 (unaudited) | Year ended July 31 | |||||||||||||||||||||||
| INSTITUTIONAL CLASS | 2019 | 2018 | 2017 | 2016 | 2015 | |||||||||||||||||||
Net asset value, beginning of period | $15.06 | $15.82 | $15.84 | $15.06 | $16.61 | $14.77 | ||||||||||||||||||
Net investment income (loss) | (0.01 | )1 | 0.00 | 1,2 | 0.01 | 1 | 0.02 | 1 | 0.03 | 1 | 0.03 | |||||||||||||
Net realized and unrealized gains (losses) on investments | 1.18 | 1.60 | 3.72 | 2.19 | (0.53 | ) | 2.02 | |||||||||||||||||
|
|
|
|
|
|
|
|
|
|
|
| |||||||||||||
Total from investment operations | 1.17 | 1.60 | 3.73 | 2.21 | (0.50 | ) | 2.05 | |||||||||||||||||
Distributions to shareholders from | ||||||||||||||||||||||||
Net realized gains | (1.11 | ) | (2.36 | ) | (3.75 | ) | (1.43 | ) | (1.05 | ) | (0.21 | ) | ||||||||||||
Net asset value, end of period | $15.12 | $15.06 | $15.82 | $15.84 | $15.06 | $16.61 | ||||||||||||||||||
Total return3 | 8.24 | % | 13.38 | % | 27.17 | % | 16.44 | % | (2.85 | )% | 14.01 | % | ||||||||||||
Ratios to average net assets (annualized) | ||||||||||||||||||||||||
Gross expenses | 0.81 | % | 0.82 | % | 0.82 | % | 0.81 | % | 0.80 | % | 0.74 | % | ||||||||||||
Net expenses | 0.70 | % | 0.70 | % | 0.70 | % | 0.70 | % | 0.70 | % | 0.70 | % | ||||||||||||
Net investment income (loss) | (0.08 | )% | 0.02 | % | 0.07 | % | 0.19 | % | 0.23 | % | 0.23 | % | ||||||||||||
Supplemental data | ||||||||||||||||||||||||
Portfolio turnover rate | 17 | % | 60 | % | 45 | % | 65 | % | 47 | % | 44 | % | ||||||||||||
Net assets, end of period (000s omitted) | $631,107 | $643,578 | $1,043,161 | $949,344 | $1,097,976 | $1,313,281 | ||||||||||||||||||
| 1 | Calculated based upon average shares outstanding |
| 2 | Amount is less than $0.005. |
| 3 | Returns for periods of less than one year are not annualized. |
The accompanying notes are an integral part of these financial statements.
20 | Wells Fargo Premier Large Company Growth Fund
Table of Contents
Notes to financial statements (unaudited)
1. ORGANIZATION
Wells Fargo Funds Trust (the “Trust”), a Delaware statutory trust organized on March 10, 1999, is anopen-end management investment company registered under the Investment Company Act of 1940, as amended (the “1940 Act”). As an investment company, the Trust follows the accounting and reporting guidance in Financial Accounting Standards Board (“FASB”)Accounting Standards Codification Topic 946, Financial Services – Investment Companies. These financial statements report on the Wells Fargo Premier Large Company Growth Fund (the “Fund”) which is a diversified series of the Trust.
2. SIGNIFICANT ACCOUNTING POLICIES
The following significant accounting policies, which are consistently followed in the preparation of the financial statements of the Fund, are in conformity with U.S. generally accepted accounting principles which require management to make estimates and assumptions that affect the reported amounts of assets and liabilities, disclosure of contingent assets and liabilities at the date of the financial statements, and the reported amounts of revenues and expenses during the reporting period. Actual results could differ from those estimates.
Securities valuation
All investments are valued each business day as of the close of regular trading on the New York Stock Exchange (generally 4 p.m. Eastern Time), although the Fund may deviate from this calculation time under unusual or unexpected circumstances.
Equity securities that are listed on a foreign or domestic exchange or market are valued at the official closing price or, if none, the last sales price. If no sale occurs on the principal exchange or market that day, a fair value price will be determined in accordance with the Fund’s Valuation Procedures.
Investments in registeredopen-end investment companies are valued at net asset value. Interests innon-registered investment companies that are redeemable at net asset value are fair valued normally at net asset value.
Investments which are not valued using any of the methods discussed above are valued at their fair value, as determined in good faith by the Board of Trustees of the Fund. The Board of Trustees has established a Valuation Committee comprised of the Trustees and has delegated to it the authority to take any actions regarding the valuation of portfolio securities that the Valuation Committee deems necessary or appropriate, including determining the fair value of portfolio securities, unless the determination has been delegated to the Wells Fargo Asset Management Pricing Committee at Wells Fargo Funds Management, LLC (“Funds Management”). The Board of Trustees retains the authority to make or ratify any valuation decisions or approve any changes to the Valuation Procedures as it deems appropriate. On a quarterly basis, the Board of Trustees receives reports on any valuation actions taken by the Valuation Committee or the Wells Fargo Asset Management Pricing Committee which may include items for ratification.
Foreign currency translation
The accounting records of the Fund are maintained in U.S. dollars. The values of other assets and liabilities denominated in foreign currencies are translated into U.S. dollars at rates provided by an independent foreign currency pricing source at a time each business day specified by the Wells Fargo Asset Management Pricing Committee. Purchases and sales of securities, and income and expenses are converted at the rate of exchange on the respective dates of such transactions. Net realized foreign exchange gains or losses arise from sales of foreign currencies, currency gains or losses realized between the trade and settlement dates on securities transactions, and the difference between the amounts of dividends, interest and foreign withholding taxes recorded and the U.S. dollar equivalent of the amounts actually paid or received. Net unrealized foreign exchange gains and losses arise from changes in the fair value of assets and liabilities other than investments in securities resulting from changes in exchange rates. The changes in net assets arising from changes in exchange rates of securities and the changes in net assets resulting from changes in market prices of securities are not separately presented. Such changes are included in net realized and unrealized gains or losses from investments.
Securities lending
The Fund may lend its securities from time to time in order to earn additional income in the form of fees or interest on securities received as collateral or the investment of any cash received as collateral. When securities are on loan, the Fund receives interest or dividends on those securities. Cash collateral received in connection with its securities lending transactions is invested in Securities Lending Cash Investments, LLC (the “Securities Lending Fund”). Investments in Securities Lending Fund are valued at the evaluated bid price provided by an independent pricing service. Income earned from investment in the Securities Lending Fund (net of fees and rebates), if any, is included in income from affiliated securities on the Statement of Operations.
In a securities lending transaction, the net asset value of the Fund is affected by an increase or decrease in the value of the securities loaned and by an increase or decrease in the value of the instrument in which collateral is invested. The amount of
Wells Fargo Premier Large Company Growth Fund | 21
Table of Contents
Notes to financial statements (unaudited)
securities lending activity undertaken by the Fund fluctuates from time to time. The Fund has the right under the lending agreement to recover the securities from the borrower on demand. In the event of default or bankruptcy by the borrower, the Fund may be prevented from recovering the loaned securities or gaining access to the collateral or may experience delays or costs in doing so. In such an event, the terms of the agreement allows the unaffiliated securities lending agent to use the collateral to purchase replacement securities on behalf of the Fund or pay the Fund the market value of the loaned securities. The Fund bears the risk of loss with respect to depreciation of its investment of the cash collateral.
Security transactions and income recognition
Securities transactions are recorded on a trade date basis. Realized gains or losses are recorded on the basis of identified cost.
Dividend income is recognized on theex-dividend date. Dividend income is recorded net of foreign taxes withheld where recovery of such taxes is not assured.
Distributions to shareholders
Distributions to shareholders from net investment income and any net realized gains are recorded on theex-dividend date and paid at least annually. Such distributions are determined in accordance with income tax regulations and may differ from U.S. generally accepted accounting principles. Dividend sources are estimated at the time of declaration. The tax character of distributions is determined as of the Fund’s fiscal year end. Therefore, a portion of the Fund’s distributions made prior to the Fund’s fiscal year end may be categorized as a tax return of capital at year end.
Federal and other taxes
The Fund intends to continue to qualify as a regulated investment company by distributing substantially all of its investment company taxable income and any net realized capital gains (after reduction for capital loss carryforwards) sufficient to relieve it from all, or substantially all, federal income taxes. Accordingly, no provision for federal income taxes was required.
The Fund’s income and federal excise tax returns and all financial records supporting those returns for the prior three fiscal years are subject to examination by the federal and Delaware revenue authorities. Management has analyzed the Fund’s tax positions taken on federal, state, and foreign tax returns for all open tax years and does not believe that there are any uncertain tax positions that require recognition of a tax liability.
As of January 31, 2020, the aggregate cost of all investments for federal income tax purposes was $1,443,136,533 and the unrealized gains (losses) consisted of:
Gross unrealized gains | $ | 1,343,729,050 | ||
Gross unrealized losses | (7,213,497 | ) | ||
Net unrealized gains | $ | 1,336,515,553 | ||
As of July 31, 2019, the Fund had a qualified late-year ordinary loss of $4,559,091 which was recognized on the first day of the current fiscal year.
Class allocations
The separate classes of shares offered by the Fund differ principally in applicable sales charges, distribution, shareholder servicing, and administration fees. Class specific expenses are charged directly to that share class. Investment income, common fund-level expenses, and realized and unrealized gains (losses) on investments are allocated daily to each class of shares based on the relative proportion of net assets of each class.
3. FAIR VALUATION MEASUREMENTS
Fair value measurements of investments are determined within a framework that has established a fair value hierarchy based upon the various data inputs utilized in determining the value of the Fund’s investments. The three-level hierarchy gives the highest priority to unadjusted quoted prices in active markets for identical assets or liabilities (Level 1) and the lowest priority to unobservable inputs (Level 3). The Fund’s investments are classified within the fair value hierarchy based on the lowest level of input that is significant to the fair value measurement. The inputs are summarized into three broad levels as follows:
| ∎ | Level 1 – quoted prices in active markets for identical securities |
| ∎ | Level 2 – other significant observable inputs (including quoted prices for similar securities, interest rates, prepayment speeds, credit risk, etc.) |
| ∎ | Level 3 – significant unobservable inputs (including the Fund’s own assumptions in determining the fair value of investments) |
22 | Wells Fargo Premier Large Company Growth Fund
Table of Contents
Notes to financial statements (unaudited)
The inputs or methodologies used for valuing investments in securities are not necessarily an indication of the risk associated with investing in those securities.
The following is a summary of the inputs used in valuing the Fund’s assets and liabilities as of January 31, 2020:
| Quoted prices (Level 1) | Other significant observable inputs (Level 2) | Significant (Level 3) | Total | |||||||||||||
Assets | ||||||||||||||||
Investments in: | ||||||||||||||||
Common stocks | ||||||||||||||||
Communication services | $ | 333,173,087 | $ | 0 | $ | 0 | $ | 333,173,087 | ||||||||
Consumer discretionary | 493,166,524 | 0 | 0 | 493,166,524 | ||||||||||||
Consumer staples | 80,430,258 | 0 | 0 | 80,430,258 | ||||||||||||
Financials | 122,368,819 | 0 | 0 | 122,368,819 | ||||||||||||
Health care | 256,061,665 | 0 | 0 | 256,061,665 | ||||||||||||
Industrials | 323,484,264 | 0 | 0 | 323,484,264 | ||||||||||||
Information technology | 1,077,047,661 | 0 | 0 | 1,077,047,661 | ||||||||||||
Materials | 41,089,136 | 0 | 0 | 41,089,136 | ||||||||||||
Real estate | 30,630,322 | 0 | 0 | 30,630,322 | ||||||||||||
Short-term investments | ||||||||||||||||
Investment companies | 22,200,350 | 0 | 0 | 22,200,350 | ||||||||||||
Total assets | $ | 2,779,652,086 | $ | 0 | $ | 0 | $ | 2,779,652,086 | ||||||||
Additional sector, industry or geographic detail is included in the Portfolio of Investments.
For the six months ended January 31, 2020, the Fund did not have any transfers into/out of Level 3.
4. TRANSACTIONS WITH AFFILIATES
Management fee
Funds Management, an indirect wholly owned subsidiary of Wells Fargo & Company (“Wells Fargo”), is the manager of the Fund and provides advisory and fund-level administrative services under an investment management agreement. Under the investment management agreement, Funds Management is responsible for, among other services, implementing the investment objectives and strategies of the Fund, supervising the subadviser and providing fund-level administrative services in connection with the Fund’s operations. As compensation for its services under the investment management agreement, Funds Management is entitled to receive a management fee at the following annual rate based on the Fund’s average daily net assets:
| Average daily net assets | Management fee | |||
First $500 million | 0.700 | % | ||
Next $500 million | 0.675 | |||
Next $1 billion | 0.650 | |||
Next $2 billion | 0.625 | |||
Next $1 billion | 0.600 | |||
Next $3 billion | 0.590 | |||
Next $2 billion | 0.565 | |||
Next $2 billion | 0.555 | |||
Next $4 billion | 0.530 | |||
Over $16 billion | 0.505 | |||
For the six months ended January 31, 2020, the management fee was equivalent to an annual rate of 0.66% of the Fund’s average daily net assets.
Wells Fargo Premier Large Company Growth Fund | 23
Table of Contents
Notes to financial statements (unaudited)
Funds Management has retained the services of a subadviser to provide daily portfolio management to the Fund. The fee for subadvisory services is borne by Funds Management. Wells Capital Management Incorporated (“WellsCap”), an affiliate of Funds Management and an indirect wholly owned subsidiary of Wells Fargo, is the subadviser to the Fund and is entitled to receive a fee from Funds Management at an annual rate starting at 0.35% and declining to 0.275% as the average daily net assets of the Fund increase.
Administration fees
Under a class-level administration agreement, Funds Management provides class-level administrative services to the Fund, which includes paying fees and expenses for services provided by the transfer agent,sub-transfer agents, omnibus account servicers and record-keepers. As compensation for its services under the class-level administration agreement, Funds Management receives an annual fee which is calculated based on the average daily net assets of each class as follows:
| Class-level administration fee | ||||
Class A, Class C | 0.21 | % | ||
Class R4 | 0.08 | |||
Class R6 | 0.03 | |||
Administrator Class, Institutional Class | 0.13 | |||
Waivers and/or expense reimbursements
Funds Management has contractually waived and/or reimbursed management and administration fees to the extent necessary to maintain certain net operating expense ratios for the Fund. When each class of the Fund has exceeded its expense cap, Funds Management has waived fees and/or reimbursed expenses from fund-level expenses on a proportionate basis and then from class specific expenses. When only certain classes exceed their expense caps, waivers and/or reimbursements are applied against class specific expenses before fund-level expenses. Funds Management has committed through November 30, 2020 to waive fees and/or reimburse expenses to the extent necessary to cap the Fund’s expenses at 1.11% for Class A shares, 1.86% for Class C shares, 0.80% for Class R4 shares, 0.65% for Class R6 shares, 1.00% for Administrator Class shares, and 0.70% for Institutional Class shares. Prior to or after the commitment expiration date, the cap may be increased or the commitment to maintain the cap may be terminated only with the approval of the Board of Trustees.
Distribution fee
The Trust has adopted a distribution plan for Class C shares of the Fund pursuant to Rule12b-1 under the 1940 Act. A distribution fee is charged to Class C shares and paid to Wells Fargo Funds Distributor, LLC (“Funds Distributor”), the principal underwriter, at an annual rate of 0.75% of the average daily net assets of Class C shares.
In addition, Funds Distributor is entitled to receive thefront-end sales charge from the purchase of Class A shares and a contingent deferred sales charge on the redemption of certain Class A shares. Funds Distributor is also entitled to receive the contingent deferred sales charges from redemptions of Class C shares. For the six months ended January 31, 2020, Funds Distributor received $10,659 from the sale of Class A shares and $14 in contingent deferred sales charges from redemptions of Class C. No contingent deferred sales charges were incurred by Class A shares for the six months ended January 31, 2020.
Shareholder servicing fees
The Trust has entered into contracts with one or more shareholder servicing agents, whereby Class A, Class C, and Administrator Class of the Fund are charged a fee at an annual rate of 0.25% of the average daily net assets of each respective class. Class R4 is charged a fee at an annual rate of 0.10% of its average daily net assets. A portion of these total shareholder servicing fees were paid to affiliates of Wells Fargo.
Interfund transactions
The Fund may purchase or sell portfolio investment securities to certain other Wells Fargo affiliates pursuant to Rule17a-7 under the 1940 Act and under procedures adopted by the Board of Trustees. The procedures have been designed to ensure that these interfund transactions, which do not incur broker commissions, are effected at current market prices.
5. INVESTMENT PORTFOLIO TRANSACTIONS
Purchases and sales of investments, excluding U.S. government obligations (if any) and short-term securities, for the six months ended January 31, 2020 were $461,581,765 and $633,111,391, respectively.
24 | Wells Fargo Premier Large Company Growth Fund
Table of Contents
Notes to financial statements (unaudited)
6. SECURITIES LENDING TRANSACTIONS
The Fund lends its securities through an unaffiliated securities lending agent and receives collateral in the form of cash or securities with a value at least equal to the value of the securities on loan. The value of the loaned securities is determined at the close of each business day and any increases or decreases in the required collateral are exchanged between the Fund and the counterparty on the next business day. Cash collateral received is invested in the Securities Lending Fund which seeks to provide a positive return compared to the daily Fed Funds Open Rate by investing in high-quality, U.S. dollar-denominated short-term money market instruments and is exempt from registration under Section 3(c)(7) of the 1940 Act. Securities Lending Fund is managed by Funds Management and is subadvised by WellsCap. Funds Management receives an advisory fee starting at 0.05% and declining to 0.01% as the average daily net assets of the Securities Lending Fund increase. All of the fees received by Funds Management are paid to WellsCap for its services as subadviser.
In the event of counterparty default or the failure of a borrower to return a loaned security, the Fund has the right to use the collateral to offset any losses incurred. As of January 31, 2020, the Fund had securities lending transactions with the following counterparties which are subject to offset:
| Counterparty | Value of securities on loan | Collateral received1 | Net amount | |||||
Barclays Capital Inc. | $810,500 | $(810,500) | $ | 0 | ||||
BNP Paribas Securities Corp. | 1,223,391 | (1,223,391) | 0 | |||||
Citigroup Global Markets Inc. | 20,757 | (20,757) | 0 | |||||
JPMorgan Securities LLC | 5,900,440 | (5,900,440) | 0 | |||||
Morgan Stanley & Co. LLC | 10,519,227 | (10,519,227) | 0 | |||||
| 1 | Collateral received within this table is limited to the collateral for the net transaction with the counterparty. |
7. BANK BORROWINGS
The Trust (excluding the money market funds), Wells Fargo Master Trust and Wells Fargo Variable Trust are parties to a $280,000,000 revolving credit agreement whereby the Fund is permitted to use bank borrowings for temporary or emergency purposes, such as to fund shareholder redemption requests. Interest under the credit agreement is charged to the Fund based on a borrowing rate equal to the higher of the Federal Funds rate in effect on that day plus 1.25% or the overnight LIBOR rate in effect on that day plus 1.25%. In addition, an annual commitment fee equal to 0.25% of the unused balance is allocated to each participating fund.
For the six months ended January 31, 2020, there were no borrowings by the Fund under the agreement.
8. CONCENTRATION RISK
Concentration risks result from exposure to a limited number of sectors. As of the end of the period, the Fund invests a concentration of its portfolio in the information technology sector. A fund that invests a substantial portion of its assets in any sector may be more affected by changes in that sector than would be a fund whose investments are not heavily weighted in any sector.
9. INDEMNIFICATION
Under the Trust’s organizational documents, the officers and Trustees have been granted certain indemnification rights against certain liabilities that may arise out of performance of their duties to the Trust. Additionally, in the normal course of business, the Trust may enter into contracts with service providers that contain a variety of indemnification clauses. The Trust’s maximum exposure under these arrangements is dependent on future claims that may be made against the Fund and, therefore, cannot be estimated.
10. NEW ACCOUNTING PRONOUNCEMENT
In August 2018, FASB issued Accounting Standards Update (“ASU”)No. 2018-13, Fair Value Measurement (Topic 820)Disclosure Framework—Changes to the Disclosure Requirements for Fair Value Measurement. ASU2018-13 updates the disclosure requirements for fair value measurements by modifying or removing certain disclosures and adding certain new disclosures. The amendments are effective for fiscal years, and interim periods within those fiscal years, beginning after December 15, 2019. Early adoption is permitted. Management has adopted the removal and modification of disclosures early, as permitted, and will adopt the additional new disclosures at the effective date.
Wells Fargo Premier Large Company Growth Fund | 25
Table of Contents
Notes to financial statements (unaudited)
11. SUBSEQUENT EVENT
On March 11, 2020, the World Health Organization announced that it had made the assessment that coronavirus disease 2019 (“COVID-19”) is a pandemic. The impacts of COVID-19 is adversely affecting the entire global economy, individual companies and investment products, and the market in general. There is significant uncertainty around the extent and duration of business disruptions related to COVID-19 and the impact may be short term or may last for an extended period of time. The risk of further spreading of COVID-19 has led to significant uncertainty and volatility in the financial markets and the value of the Fund and the securities in which the Fund invests may be adversely affected by impacts caused by COVID-19.
26 | Wells Fargo Premier Large Company Growth Fund
Table of Contents
PROXY VOTING INFORMATION
A description of the policies and procedures used to determine how to vote proxies relating to portfolio securities is available, upon request, by calling1-800-222-8222, visiting our website atwfam.com, or visiting the SEC website at sec.gov. Information regarding how the proxies related to portfolio securities were voted during the most recent12-month period ended June 30 is available on the website atwfam.comor by visiting the SEC website at sec.gov.
QUARTERLY PORTFOLIO HOLDINGS INFORMATION
The Fund files its complete schedule of portfolio holdings with the SEC for the first and third quarters of each fiscal year as an exhibit to its reports on FormN-PORT. Shareholders may view the filed FormN-PORT by visiting the SEC website at sec.gov.
Wells Fargo Premier Large Company Growth Fund | 27
Table of Contents
Other information (unaudited)
BOARD OF TRUSTEES AND OFFICERS
Each of the Trustees and Officers1 listed in the table below acts in identical capacities for each fund in the Wells Fargo family of funds, which consists of 149 mutual funds comprising the Wells Fargo Funds Trust, Wells Fargo Variable Trust, Wells Fargo Master Trust and fourclosed-end funds (collectively the “Fund Complex”). This table should be read in conjunction with the Prospectus and the Statement of Additional Information2. The mailing address of each Trustee and Officer is 525 Market Street, 12th Floor, San Francisco, CA 94105. Each Trustee and Officer serves an indefinite term, however, each Trustee serves such term until reaching the mandatory retirement age established by the Trustees.
Independent Trustees
| Name and year of birth | Position held and length of service* | Principal occupations during past five years or longer | Current other public company or investment company directorships | |||
| William R. Ebsworth (Born 1957) | Trustee, since 2015 | Retired. From 1984 to 2013, equities analyst, portfolio manager, research director and chief investment officer at Fidelity Management and Research Company in Boston, Tokyo, and Hong Kong, and retired in 2013 as Chief Investment Officer of Fidelity Strategic Advisers, Inc. where he led a team of investment professionals managing client assets. Prior thereto, Board member of Hong Kong Securities Clearing Co., Hong Kong Options Clearing Corp., the Thailand International Fund, Ltd., Fidelity Investments Life Insurance Company, and Empire Fidelity Investments Life Insurance Company. Audit Committee Chair and Investment Committee Chair of the Vincent Memorial Hospital Endowment(non-profit organization). Mr. Ebsworth is a CFA® charterholder. | N/A | |||
| Jane A. Freeman (Born 1953) | Trustee, since 2015; Chair Liaison, since 2018 | Retired. From 2012 to 2014 and 1999 to 2008, Chief Financial Officer of Scientific Learning Corporation. From 2008 to 2012, Ms. Freeman provided consulting services related to strategic business projects. Prior to 1999, Portfolio Manager at Rockefeller & Co. and Scudder, Stevens & Clark. Board member of the Harding Loevner Funds from 1996 to 2014, serving as both Lead Independent Director and chair of the Audit Committee. Board member of the Russell Exchange Traded Funds Trust from 2011 to 2012 and the chair of the Audit Committee. Ms. Freeman is a Board Member of The Ruth Bancroft Garden(non-profit organization). She is also an inactive Chartered Financial Analyst. | N/A | |||
| Isaiah Harris, Jr. (Born 1952) | Trustee, since 2009; Audit Committee Chairman, since 2019 | Retired. Chairman of the Board of CIGNA Corporation since 2009, and Director since 2005. From 2003 to 2011, Director of Deluxe Corporation. Prior thereto, President and CEO of BellSouth Advertising and Publishing Corp. from 2005 to 2007, President and CEO of BellSouth Enterprises from 2004 to 2005 and President of BellSouth Consumer Services from 2000 to 2003. Emeritus member of the Iowa State University Foundation Board of Governors. Emeritus Member of the Advisory Board of Iowa State University School of Business. Advisory Board Member, Palm Harbor Academy (private school). Advisory Board Member, Child Evangelism Fellowship(non-profit). Mr. Harris is a certified public accountant (inactive status). | CIGNA Corporation | |||
| Judith M. Johnson (Born 1949) | Trustee, since 2008; Audit Committee Chairman, from 2009 to 2018 | Retired. Prior thereto, Chief Executive Officer and Chief Investment Officer of Minneapolis Employees Retirement Fund from 1996 to 2008. Ms. Johnson is an attorney, certified public accountant and a certified managerial accountant. | N/A | |||
28 | Wells Fargo Premier Large Company Growth Fund
Table of Contents
Other information (unaudited)
| Name and year of birth | Position held and length of service* | Principal occupations during past five years or longer | Current other public company or investment company directorships | |||
| David F. Larcker (Born 1950) | Trustee, since 2009 | James Irvin Miller Professor of Accounting at the Graduate School of Business, Stanford University, Director of the Corporate Governance Research Initiative and Senior Faculty of The Rock Center for Corporate Governance since 2006. From 2005 to 2008, Professor of Accounting at the Graduate School of Business, Stanford University. Prior thereto, Ernst & Young Professor of Accounting at The Wharton School, University of Pennsylvania from 1985 to 2005. | N/A | |||
| Olivia S. Mitchell (Born 1953) | Trustee, since 2006; Nominating and Governance Committee Chair, since 2018 | International Foundation of Employee Benefit Plans Professor, Wharton School of the University of Pennsylvania since 1993. Director of Wharton’s Pension Research Council and Boettner Center on Pensions & Retirement Research, and Research Associate at the National Bureau of Economic Research. Previously, Cornell University Professor from 1978 to 1993. | N/A | |||
| Timothy J. Penny (Born 1951) | Trustee, since 1996; Chairman, since 2018 | President and Chief Executive Officer of Southern Minnesota Initiative Foundation, anon-profit organization, since 2007. Member of the Board of Trustees of NorthStar Education Finance, Inc., anon-profit organization, since 2007. | N/A | |||
| James G. Polisson (Born 1959) | Trustee, since 2018 | Retired. Chief Marketing Officer, Source (ETF) UK Services, Ltd, from 2015 to 2017. From 2012 to 2015, Principal of The Polisson Group, LLC, a management consulting, corporate advisory and principal investing company. Chief Executive Officer and Managing Director at Russell Investments, Global Exchange Traded Funds from 2010 to 2012. Managing Director of Barclays Global Investors from 1998 to 2010 and Global Chief Marketing Officer for iShares and Barclays Global Investors from 2000 to 2010. Trustee of the San Francisco Mechanics’ Institute, anon-profit organization, from 2013 to 2015. Board member of the Russell Exchange Traded Fund Trust from 2011 to 2012. Director of Barclays Global Investors Holdings Deutschland GmbH from 2006 to 2009. Mr. Polisson is an attorney and has a retired status with the Massachusetts and District of Columbia Bar Associations. | N/A | |||
| Pamela Wheelock3 (Born 1959) | Trustee, since January 2020; previously Trustee from January 2018 to July 2019 | Board member of the Destination Medical Center Economic Development Agency, Rochester, Minnesota since 2019. Acting Commissioner, Minnesota Department of Human Services, July 2019 through September 2019. Human Services Manager (part-time), Minnesota Department of Human Services, October 2019 through December 2019. Chief Operating Officer, Twin Cities Habitat for Humanity from 2017 to 2019. Vice President of University Services, University of Minnesota from 2012 to 2016. Prior thereto, on the Board of Directors, Governance Committee and Finance Committee for the Minnesota Philanthropy Partners (Saint Paul Foundation) from 2012 to 2018, Interim Chief Executive Officer of Blue Cross Blue Shield of Minnesota from 2011 to 2012, Chairman of the Board from 2009 to 2012 and Board Director from 2003 to 2015. Vice President, Leadership and Community Engagement, Bush Foundation, Saint Paul, Minnesota (a private foundation) from 2009 to 2011. Executive Vice President and Chief Financial Officer, Minnesota Sports and Entertainment from 2004 to 2009 and Senior Vice President from 2002 to 2004. Executive Vice President of the Minnesota Wild Foundation from 2004 to 2008. Commissioner of Finance, State of Minnesota, from 1999 to 2002. Currently Board Chair of the Minnesota Wild Foundation since 2010. | N/A | |||
| * | Length of service dates reflect the Trustee’s commencement of service with the Trust’s predecessor entities, where applicable. |
Wells Fargo Premier Large Company Growth Fund | 29
Table of Contents
Other information (unaudited)
Officers
| Name and year of birth | Position held and length of service | Principal occupations during past five years or longer | ||
| Andrew Owen (Born 1960) | President, since 2017 | Executive Vice President of Wells Fargo & Company and Head of Affiliated Managers, Wells Fargo Asset Management, since 2014. In addition, Mr. Owen is currently President, Chief Executive Officer and Director of Wells Fargo Funds Management, LLC since 2017. Prior thereto, Executive Vice President responsible for marketing, investments and product development for Wells Fargo Funds Management, LLC, from 2009 to 2014. | ||
| Jeremy DePalma1 (Born 1974) | Treasurer, since 2012 | Senior Vice President of Wells Fargo Funds Management, LLC since 2009. Senior Vice President of Evergreen Investment Management Company, LLC from 2008 to 2010 and head of the Fund Reporting and Control Team within Fund Administration from 2005 to 2010. | ||
| Michelle Rhee (Born 1966) | Chief Legal Officer, since 2019 | Secretary of Wells Fargo Funds Management, LLC, Chief Legal Counsel of Wells Fargo Asset Management and Assistant General Counsel of Wells Fargo Bank, N.A. since 2018. Associate General Counsel and Managing Director of Bank of America Corporation from 2004 to 2018. | ||
| Catherine Kennedy (Born 1969) | Secretary, since 2019 | Vice President of Wells Fargo Funds Management, LLC and Senior Counsel of the Wells Fargo Legal Department since 2010. Vice President and Senior Counsel of Evergreen Investment Management Company, LLC from 1998 to 2010. | ||
| Michael H. Whitaker(Born 1967) | Chief Compliance Officer, since 2016 | Chief Compliance Officer of Wells Fargo Asset Management since 2016. Senior Vice President and Chief Compliance Officer for Fidelity Investments from 2007 to 2016. | ||
| David Berardi (Born 1975) | Assistant Treasurer, since 2009 | Vice President of Wells Fargo Funds Management, LLC since 2009. Vice President of Evergreen Investment Management Company, LLC from 2008 to 2010. Manager of Fund Reporting and Control for Evergreen Investment Management Company, LLC from 2004 to 2010. | ||
| 1 | Jeremy DePalma acts as Treasurer of 85 funds and Assistant Treasurer of 64 funds in the Fund Complex. |
| 2 | The Statement of Additional Information includes additional information about the Trustees and is available, without charge, upon request, by calling1-800-222-8222 or by visiting the website atwfam.com. |
| 3 | Pamela Wheelock wasre-appointed to the Board effective January 1, 2020. |
30 | Wells Fargo Premier Large Company Growth Fund
Table of Contents
Effective on or about May 1, 2020, if you purchase Fund shares through a Janney Montgomery Scott LLC (“Janney”) brokerage account, you will be eligible for the following load waivers(front-end sales charge waivers and contingent deferred sales charge (“CDSC”), orback-end sales charge, waivers) and discounts, which may differ from those disclosed elsewhere in the Fund’s Prospectus or SAI.
| Front-end sales charge* waivers on Class A shares available at Janney |
| Shares purchased through reinvestment of capital gains distributions and dividend reinvestment when purchasing shares of the same fund (but not any other fund within the fund family). |
| Shares purchased by employees and registered representatives of Janney or its affiliates and their family members as designated by Janney. |
| Shares purchased from the proceeds of redemptions within the same fund family, provided (1) the repurchase occurs within ninety (90) days following the redemption, (2) the redemption and purchase occur in the same account, and (3) redeemed shares were subject to afront-end or deferred sales load (i.e., right of reinstatement). |
| Employer-sponsored retirement plans (e.g., 401(k) plans, 457 plans, employer-sponsored 403(b) plans, profit sharing and money purchase pension plans and defined benefit plans). For purposes of this provision, employer-sponsored retirement plans do not include SEP IRAs, Simple IRAs,SAR-SEPs or Keogh plans. |
| Shares acquired through a right of reinstatement. |
| Class C shares that are no longer subject to a contingent deferred sales charge and are converted to Class A shares of the same fund pursuant to Janney’s policies and procedures. |
| CDSC waivers on Class A and Class C shares available at Janney |
| Shares sold upon the death or disability of the shareholder. |
| Shares sold as part of a systematic withdrawal plan as described in the Fund’s Prospectus. |
| Shares purchased in connection with a return of excess contributions from an IRA account. |
| Shares sold as part of a required minimum distribution for IRA and retirement accounts if the redemption is taken in or after the year the shareholder reaches qualified age based on applicable IRS regulations. |
| Shares sold to pay Janney fees but only if the transaction is initiated by Janney. |
| Shares acquired through a right of reinstatement. |
| Shares exchanged into the same share class of a different fund. |
| Front-end sales charge* discounts available at Janney; breakpoints, rights of accumulation and/or letters of intent |
| Breakpoints as described in the Fund’s Prospectus. |
| Rights of accumulation (“ROA”), which entitle shareholders to breakpoint discounts, will be automatically calculated based on the aggregated holding of fund family assets held by accounts within the purchaser’s household at Janney. Eligible fund family assets not held at Janney may be included in the ROA calculation only if the shareholder notifies his or her financial advisor about such assets. |
| Letters of intent which allow for breakpoint discounts based on anticipated purchases within a fund family, over a13-month time period. Eligible fund family assets not held at Janney Montgomery Scott may be included in the calculation of letters of intent only if the shareholder notifies his or her financial advisor about such assets. |
| * | Also referred to as an “initial sales charge.” |
Wells Fargo Premier Large Company Growth Fund | 31
Table of Contents
This page is intentionally left blank.
Table of Contents
For more information
More information about Wells Fargo Funds is available free upon request. To obtain literature, please write, visit the Fund’s website, or call:
Wells Fargo Funds
P.O. Box 219967
Kansas City, MO 64121-9967
Website:wfam.com
Individual investors:1-800-222-8222
Retail investment professionals:1-888-877-9275
Institutional investment professionals:1-866-765-0778

This report and the financial statements contained herein are submitted for the general information of the shareholders of the Fund. If this report is used for promotional purposes, distribution of the report must be accompanied or preceded by a current prospectus. Before investing, please consider the investment objectives, risks, charges, and expenses of the investment. For a current prospectus and, if available, a summary prospectus, containing this information, call1-800-222-8222 or visit the Fund’s website atwfam.com. Read the prospectus carefully before you invest or send money.
Wells Fargo Asset Management (WFAM) is the trade name for certain investment advisory/management firms owned by Wells Fargo & Company. These firms include but are not limited to Wells Capital Management Incorporated and Wells Fargo Funds Management, LLC. Certain products managed by WFAM entities are distributed by Wells Fargo Funds Distributor, LLC (a broker-dealer and Member FINRA).
This material is for general informational and educational purposes only and is NOT intended to provide investment advice or a recommendation of any kind—including a recommendation for any specific investment, strategy, or plan.
INVESTMENT PRODUCTS: NOT FDIC INSURED ◾ NO BANK GUARANTEE ◾ MAY LOSE VALUE
© 2020 Wells Fargo & Company. All rights reserved
PAR-0020-03845 03-20
SA212/SAR212 01-20
Table of Contents
ITEM 2. CODE OF ETHICS
Not applicable.
ITEM 3. AUDIT COMMITTEE FINANCIAL EXPERT
Not applicable.
ITEM 4. PRINCIPAL ACCOUNTANT FEES AND SERVICES
Not applicable.
ITEM 5. AUDIT COMMITTEE OF LISTED REGISTRANTS
Not applicable.
ITEM 6. INVESTMENTS
A Portfolio of Investments for each series of Wells Fargo Funds Trust is included as part of the report to shareholders filed under Item 1 of this Form.
ITEM 7. DISCLOSURE OF PROXY VOTING POLICIES AND PROCEDURES FORCLOSED-END MANAGEMENT INVESTMENT COMPANIES
Not applicable.
ITEM 8. PORTFOLIO MANAGERS OFCLOSED-END MANAGEMENT INVESTMENT COMPANIES
Not applicable.
ITEM 9. PURCHASES OF EQUITY SECURITIES BYCLOSED-END MANAGEMENT INVESTMENT COMPANY AND AFFILIATED PURCHASERS
Not applicable.
ITEM 10. SUBMISSION OF MATTERS TO A VOTE OF SECURITY HOLDERS
There have been no material changes to the procedures by which shareholders may recommend nominees to the registrant’s Board of Trustees that have been implemented since the registrant’s last provided disclosure in response to the requirements of this Item.
Table of Contents
ITEM 11. CONTROLS AND PROCEDURES
(a) The President and Treasurer have concluded that the Wells Fargo Funds Trust disclosure controls and procedures (as defined in Rule30a-3(c) under the Investment Company Act of 1940) provide reasonable assurances that material information relating to the registrant is made known to them by the appropriate persons, based on their evaluation of these controls and procedures as of a date within 90 days of the filing of this report.
(b) There were no significant changes in the registrant’s internal controls over financial reporting (as defined in Rule30a-3(d) under the Investment Company Act of 1940) that occurred during the most recent fiscal half-year of the period covered by this report that materially affected, or is reasonably likely to materially affect, the registrant’s internal control over financial reporting.
ITEM 12. DISCLOSURES OF SECURITIES LENDING ACTIVITIES FORCLOSED-END MANAGEMENT INVESTMENT COMPANIES
Not applicable.
ITEM 13. EXHIBITS
(a)(1) Not applicable.
Table of Contents

SIGNATURES
Pursuant to the requirements of the Securities Exchange Act of 1934 and the Investment Company Act of 1940, the registrant has duly caused this report to be signed on its behalf by the undersigned, thereunto duly authorized.
| Wells Fargo Funds Trust | ||
| By: | ||
| /s/ | Andrew Owen | |
| Andrew Owen | ||
| President | ||
| Date: | March 31, 2020 | |
Pursuant to the requirements of the Securities Exchange Act of 1934 and the Investment Company Act of 1940, this report has been signed below by the following persons on behalf of the registrant and in the capacities and on the date indicated.
| Wells Fargo Funds Trust | ||
| By: | ||
| /s/ | Andrew Owen | |
| Andrew Owen | ||
| President | ||
| Date: | March 31, 2020 | |
| By: | ||
| /s/ | Nancy Wiser | |
| Nancy Wiser | ||
| Treasurer | ||
| Date: | March 31, 2020 | |
| By: | ||
| /s/ | Jeremy DePalma | |
| Jeremy DePalma | ||
| Treasurer | ||
| Date: | March 31, 2020 | |