
UNITED STATES
SECURITIES AND EXCHANGE COMMISSION
Washington, D.C. 20549
FORM N-CSR
CERTIFIED SHAREHOLDER REPORT OF REGISTERED
MANAGEMENT INVESTMENT COMPANIES
Investment Company Act file number: 811-09253
Allspring Funds Trust
(Exact name of registrant as specified in charter)
525 Market St., San Francisco, CA 94105
(Address of principal executive offices) (Zip code)
Matthew Prasse
Allspring Funds Management, LLC
525 Market St., San Francisco, CA 94105
(Name and address of agent for service)
Registrant’s telephone number, including area code: 800-222-8222
Date of fiscal year end: June 30
Registrant is making a filing for 13 of its series:
Allspring Alternative Risk Premia Fund, Allspring California Limited-Term Tax-Free Fund, Allspring California Tax-Free Fund, Allspring High Yield Municipal Bond Fund, Allspring Intermediate Tax/AMT-Free Fund, Allspring Minnesota Tax-Free Fund, Allspring Municipal Bond Fund, Allspring Municipal Sustainability Fund, Allspring Pennsylvania Tax-Free Fund, Allspring Short-Term Municipal Bond Fund, Allspring Strategic Municipal Bond Fund, Allspring Ultra Short-Term Municipal Income Fund and Allspring Wisconsin Tax-Free Fund
Date of reporting period: June 30, 2022
ITEM 1. REPORT TO STOCKHOLDERS

Limited-Term Tax-Free Fund
| 2 | |
| 6 | |
| 10 | |
| 11 | |
| Financial statements | |
| 26 | |
| 27 | |
| 28 | |
| 29 | |
| 33 | |
| 38 | |
| 39 |

| 1 | The S&P 500 Index consists of 500 stocks chosen for market size, liquidity, and industry group representation. It is a market-value-weighted index with each stock's weight in the index proportionate to its market value. You cannot invest directly in an index. |
| 2 | The Morgan Stanley Capital International (MSCI) All Country World Index (ACWI) ex USA Index (Net) is a free-float-adjusted market-capitalization-weighted index that is designed to measure the equity market performance of developed and emerging markets, excluding the U.S. Source: MSCI. MSCI makes no express or implied warranties or representations and shall have no liability whatsoever with respect to any MSCI data contained herein. The MSCI data may not be further redistributed or used as a basis for other indexes or any securities or financial products. This report is not approved, reviewed, or produced by MSCI. You cannot invest directly in an index. |
| 3 | The MSCI Emerging Markets (EM) Index (Net) (USD) is a free-float-adjusted market-capitalization-weighted index that is designed to measure equity market performance of emerging markets. You cannot invest directly in an index. |
| 4 | The Bloomberg U.S. Aggregate Bond Index is a broad-based benchmark that measures the investment-grade, U.S.-dollar-denominated, fixed-rate taxable bond market, including Treasuries, government-related and corporate securities, mortgage-backed securities (agency fixed-rate and hybrid adjustable-rate mortgage pass-throughs), asset-backed securities, and commercial mortgage-backed securities. You cannot invest directly in an index. |
| 5 | The Bloomberg Global Aggregate ex-USD Index (unhedged) is an unmanaged index that provides a broad-based measure of the global investment-grade fixed-income markets excluding the U.S.-dollar-denominated debt market. You cannot invest directly in an index. |
| 6 | The Bloomberg Municipal Bond Index is an unmanaged index composed of long-term tax-exempt bonds with a minimum credit rating of Baa. You cannot invest directly in an index. |
| 7 | The ICE BofA U.S. High Yield Index is a market-capitalization-weighted index of domestic and Yankee high-yield bonds. The index tracks the performance of high-yield securities traded in the U.S. bond market. You cannot invest directly in an index. Copyright 2022. ICE Data Indices, LLC. All rights reserved. |
| 1 | The Consumer Price Index (CPI) is a measure of the average change over time in the prices paid by urban consumers for a market basket of consumer goods and services. You cannot invest directly in an index. |
| 2 | The MSCI ACWI (Net) is a free-float-adjusted market-capitalization-weighted index that is designed to measure the equity market performance of developed and emerging markets. You cannot invest directly in an index. |

President
Allspring Funds
| Investment objective | The Fund seeks current income exempt from federal income tax and California individual income tax, consistent with capital preservation. |
| Manager | Allspring Funds Management, LLC |
| Subadviser | Allspring Global Investments, LLC |
| Portfolio managers | Terry J. Goode, Kim Nakahara, Adrian Van Poppel |
| Average annual total returns (%) as of June 30, 2022 | |||||||||||
| Including sales charge | Excluding sales charge | Expense ratios1 (%) | |||||||||
| Inception date | 1 year | 5 year | 10 year | 1 year | 5 year | 10 year | Gross | Net 2 | |||
| Class A (SFCIX) | 11-18-1992 | -7.32 | -0.20 | 0.82 | -5.42 | 0.20 | 1.02 | 0.85 | 0.80 | ||
| Class C (SFCCX) | 8-30-2002 | -7.13 | -0.55 | 0.42 | -6.13 | -0.55 | 0.42 | 1.60 | 1.55 | ||
| Administrator Class (SCTIX) | 9-6-1996 | – | – | – | -5.24 | 0.40 | 1.24 | 0.79 | 0.60 | ||
| Institutional Class (SFCNX)3 | 10-31-2014 | – | – | – | -5.15 | 0.50 | 1.30 | 0.52 | 0.50 | ||
| Bloomberg Municipal Bond 1-5 Year Blend Index4 | – | – | – | – | -3.62 | 1.06 | 1.23 | – | – | ||
| Bloomberg California Municipal 1-5 Year Blend Index5 | – | – | – | – | -3.59 | 0.85 | 1.15 | – | – | ||
| 1 | Reflects the expense ratios as stated in the most recent prospectuses. The expense ratios shown are subject to change and may differ from the annualized expense ratios shown in the financial highlights of this report. |
| 2 | The manager has contractually committed through October 31, 2022, to waive fees and/or reimburse expenses to the extent necessary to cap total annual fund operating expenses after fee waivers at 0.80% for Class A, 1.55% for Class C, 0.60% for Administrator Class, and 0.50% for Institutional Class. Brokerage commissions, stamp duty fees, interest, taxes, acquired fund fees and expenses (if any), and extraordinary expenses are excluded from the expense caps. Prior to or after the commitment expiration date, the caps may be increased or the commitment to maintain the caps may be terminated only with the approval of the Board of Trustees. Without these caps, the Fund’s returns would have been lower. The expense ratio paid by an investor is the net expense ratio (the total annual fund operating expenses after fee waivers) as stated in the prospectuses. |
| 3 | Historical performance shown for the Institutional Class shares prior to their inception reflects the performance of the Administrator Class shares, and includes the higher expenses applicable to the Administrator Class shares. If these expenses had not been included, returns for the Institutional Class shares would be higher. |
| 4 | The Bloomberg Municipal Bond 1–5 Year Blend Index is the 1–5 Year component of the Bloomberg Municipal Bond Index. The Bloomberg Municipal Bond Index is an unmanaged index composed of long-term tax-exempt bonds with a minimum credit rating of Baa. You cannot invest directly in an index. |
| 5 | The Bloomberg California Municipal 1-5 Year Blend Index is the 1-5 Year component of the Bloomberg California Municipal Bond Index. You cannot invest directly in an index. |
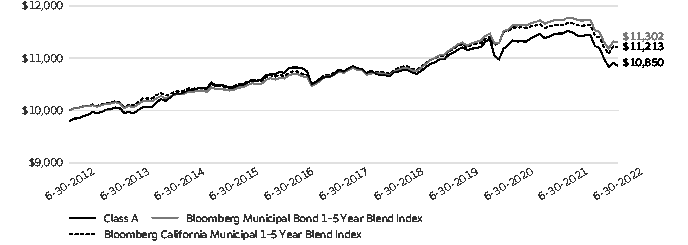
| 1 | The chart compares the performance of Class A shares for the most recent ten years with the Bloomberg Municipal Bond 1-5 Year Blend Index and Bloomberg California Municipal 1-5 Year Blend Index. The chart assumes a hypothetical investment of $10,000 in Class A shares and reflects all operating expenses and assumes the maximum initial sales charge of 2.00%. |
| ■ | The Fund underperformed both of its benchmarks, the Bloomberg Municipal Bond 1–5 Year Blend Index and the Bloomberg California Municipal 1–5 Year Blend Index, during the 12-month period that ended June 30, 2022. |
| ■ | The primary detractors from performance were the Fund’s longer yield-curve exposure and credit profile, followed by duration. |
| ■ | The portfolio benefited from strong security selection and sector allocations. The Fund was overweight the strongest-performing sectors (housing and education) and neutral to underweight the worst-performing sectors (industrial development revenue/pollution control revenue and electric). |
| Credit quality as of June 30, 20221 |
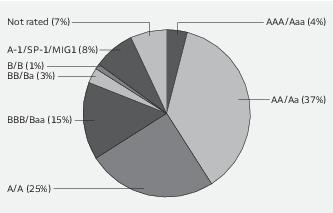
| 1 | The credit quality distribution of portfolio holdings reflected in the chart is based on ratings from Standard & Poor’s, Moody’s Investors Service, and/or Fitch Ratings Ltd. Credit quality ratings apply to the underlying holdings of the Fund and not to the Fund itself. The percentages of the portfolio with the ratings depicted in the chart are calculated based on the market value of fixed income securities held by the Fund. If a security was rated by all three rating agencies, the middle rating was utilized. If rated by two of the three rating agencies, the lower rating was utilized, and if rated by one of the rating agencies, that rating was utilized. Standard & Poor’s rates the creditworthiness of bonds, ranging from AAA (highest) to D (lowest). Ratings from A to CCC may be modified by the addition of a plus (+) or minus (-) sign to show relative standing within the rating categories. Standard & Poor’s rates the creditworthiness of short-term notes from SP-1 (highest) to SP-3 (lowest). Moody’s rates the creditworthiness of bonds, ranging from Aaa (highest) to C (lowest). Ratings Aa to B may be modified by the addition of a number 1 (highest) to 3 (lowest) to show relative standing within the ratings categories. Moody’s rates the creditworthiness of short-term U.S. tax-exempt municipal securities from MIG 1/VMIG 1 (highest) to SG (lowest). Fitch rates the creditworthiness of bonds, ranging from AAA (highest) to D (lowest). Credit quality distribution is subject to change and may have changed since the date specified. |
| Effective maturity distribution as of June 30, 20221 |
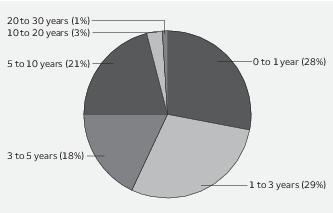
| 1 | Figures represent the percentage of the Fund's long-term investments. These amounts are subject to change and may have changed since the date specified. |
| * | The Bloomberg Municipal Bond Index is an unmanaged index composed of long-term tax-exempt bonds with a minimum credit rating of Baa. You cannot invest directly in an index. |
| Beginning account value 1-1-2022 | Ending account value 6-30-2022 | Expenses paid during the period1 | Annualized net expense ratio | |
| Class A | ||||
| Actual | $1,000.00 | $ 948.21 | $3.86 | 0.80% |
| Hypothetical (5% return before expenses) | $1,000.00 | $1,020.83 | $4.01 | 0.80% |
| Class C | ||||
| Actual | $1,000.00 | $ 944.67 | $7.47 | 1.55% |
| Hypothetical (5% return before expenses) | $1,000.00 | $1,017.11 | $7.75 | 1.55% |
| Administrator Class | ||||
| Actual | $1,000.00 | $ 949.21 | $2.90 | 0.60% |
| Hypothetical (5% return before expenses) | $1,000.00 | $1,021.82 | $3.01 | 0.60% |
| Institutional Class | ||||
| Actual | $1,000.00 | $ 948.72 | $2.42 | 0.50% |
| Hypothetical (5% return before expenses) | $1,000.00 | $1,022.32 | $2.51 | 0.50% |
| Principal | Value | ||||
| Closed end municipal bond fund obligations: 0.20% | |||||
| California: 0.20% | |||||
| Nuveen California AMT-Free Quality Municipal Income Fund MuniFund Preferred Shares Series A (10 shares) 1.41% 144Aø | $ 1,000,000 | $ 1,000,000 | |||
| Total Closed end municipal bond fund obligations (Cost $1,000,000) | 1,000,000 |
| Interest rate | Maturity date | ||||
| Municipal obligations: 95.07% | |||||
| California: 89.58% | |||||
| Airport revenue: 7.93% | |||||
| California Municipal Finance Authority Revenue Senior Lien Linxs APM Project Series A | 5.00% | 12-31-2023 | 1,100,000 | 1,140,140 | |
| California Municipal Finance Authority Revenue Senior Lien Linxs APM Project Series A | 5.00 | 6-30-2024 | 1,115,000 | 1,158,028 | |
| California Municipal Finance Authority Revenue Senior Lien Linxs APM Project Series A | 5.00 | 12-31-2024 | 750,000 | 784,762 | |
| California Municipal Finance Authority Revenue Senior Lien Linxs APM Project Series A | 5.00 | 6-30-2027 | 450,000 | 478,173 | |
| California Municipal Finance Authority Revenue Senior Lien Linxs APM Project Series A | 5.00 | 6-30-2028 | 390,000 | 413,574 | |
| California Municipal Finance Authority Revenue Senior Lien Linxs APM Project Series A | 5.00 | 12-31-2029 | 3,815,000 | 4,007,682 | |
| Los Angeles CA Department of Airports AMT Series B | 5.00 | 5-15-2024 | 5,000,000 | 5,243,934 | |
| Los Angeles CA Department of Airports AMT Series B | 5.00 | 5-15-2025 | 6,000,000 | 6,409,435 | |
| Los Angeles CA Department of Airports AMT Series B | 5.00 | 5-15-2026 | 2,500,000 | 2,715,670 | |
| Los Angeles CA Department of Airports AMT Subordinate Bond Series C | 5.00 | 5-15-2024 | 4,315,000 | 4,517,457 | |
| Palm Springs CA Airport Passenger Facility Charge Revenue Palm Springs International Airport (BAM Insured) | 5.00 | 6-1-2027 | 1,205,000 | 1,272,923 | |
| Port of Oakland Revenue Refunding Bond Series 11 | 5.00 | 11-1-2023 | 70,000 | 72,879 | |
| Port of Oakland Revenue Refunding Bond Series 11 | 5.00 | 11-1-2023 | 130,000 | 135,485 | |
| Port of Oakland Revenue Refunding Intermediate Lien Series E | 5.00 | 11-1-2026 | 1,200,000 | 1,312,126 | |
| Sacramento CA Airport System Subordinate Refunding Bond AMT Series F | 5.00 | 7-1-2022 | 2,590,000 | 2,590,000 | |
| Sacramento CA Airport System Subordinate Refunding Bond AMT Series F | 5.00 | 7-1-2023 | 2,585,000 | 2,657,186 | |
| Sacramento CA Airport System Subordinate Refunding Bond AMT Series F | 5.00 | 7-1-2024 | 1,760,000 | 1,843,293 | |
| San Diego County CA Regional Airport Authority Airport Revenue Refunding Bond AMT Subordinated Series C | 5.00 | 7-1-2027 | 750,000 | 816,599 | |
| San Diego County CA Regional Airport Authority Airport Revenue Refunding Bond AMT Subordinated Series C | 5.00 | 7-1-2028 | 1,000,000 | 1,093,995 | |
| San Diego County CA Regional Airport Authority Airport Revenue Refunding Bond AMT Subordinated Series C | 5.00 | 7-1-2029 | 1,000,000 | 1,098,964 | |
| San Francisco CA City & County Refunding Bond AMT Second Series A | 5.50 | 5-1-2028 | 250,000 | 255,364 | |
| 40,017,669 |
| Interest rate | Maturity date | Principal | Value | ||
| Education revenue: 7.20% | |||||
| California CDA Revenue Bond California Baptist University Series A 144A | 3.00% | 11-1-2022 | $ 485,000 | $ 484,975 | |
| California CDA Revenue Bond California Baptist University Series A | 5.13 | 11-1-2023 | 290,000 | 295,160 | |
| California Educational Facilities Authority Revenue Loma Linda University Series A | 5.00 | 4-1-2024 | 550,000 | 577,111 | |
| California Educational Facilities Authority Revenue Loma Linda University Series A | 5.00 | 4-1-2026 | 325,000 | 353,320 | |
| California Infrastructure and Economic Development Bank Colburn School Series 2022 (SIFMA Municipal Swap +0.90%) ± | 1.88 | 8-1-2072 | 5,000,000 | 4,954,101 | |
| California Municipal Finance Authority Charter School Revenue Albert Einstein Academies Project Series A | 6.00 | 8-1-2023 | 305,000 | 312,269 | |
| California Municipal Finance Authority Charter School Revenue Palmdale Aerospace Academy Project Series A 144A | 3.88 | 7-1-2028 | 1,310,000 | 1,260,766 | |
| California Municipal Finance Authority Revenue Bond Institute Arts | 4.00 | 10-1-2033 | 250,000 | 245,915 | |
| California Municipal Finance Authority Revenue Bond Institute Arts | 4.00 | 10-1-2035 | 350,000 | 341,374 | |
| California Municipal Finance Authority Revenue Refunding Bond Biola University | 5.00 | 10-1-2027 | 790,000 | 852,412 | |
| California Municipal Finance Authority Revenue Refunding Bond California Lutheran University | 5.00 | 10-1-2022 | 250,000 | 251,927 | |
| California Municipal Finance Authority Revenue Refunding Bond California Lutheran University | 5.00 | 10-1-2023 | 225,000 | 232,484 | |
| California Municipal Finance Authority Revenue Refunding Bond California Lutheran University | 5.00 | 10-1-2024 | 275,000 | 286,701 | |
| California Municipal Finance Authority Revenue Refunding Bond California Lutheran University | 5.00 | 10-1-2025 | 275,000 | 290,306 | |
| California Municipal Finance Authority Revenue Refunding Bond California Lutheran University | 5.00 | 10-1-2026 | 300,000 | 319,787 | |
| California Municipal Finance Authority Revenue Refunding Bond University of the Pacific Series A | 5.00 | 11-1-2024 | 600,000 | 635,859 | |
| California Municipal Finance Authority Revenue Refunding Bond University of the Pacific Series A | 5.00 | 11-1-2025 | 600,000 | 647,206 | |
| California Municipal Finance Authority Revenue Refunding Bond University of the Pacific Series A | 5.00 | 11-1-2026 | 625,000 | 684,201 | |
| California Municipal Finance Authority Revenue Refunding Bond University of the Pacific Series A | 5.00 | 11-1-2027 | 650,000 | 721,436 | |
| California Municipal Finance Authority Revenue Refunding Bond University of the Pacific Series A | 5.00 | 11-1-2028 | 700,000 | 784,812 | |
| California Municipal Finance Authority Revenue Refunding Bond University of the Pacific Series A | 5.00 | 11-1-2029 | 470,000 | 530,481 | |
| California Municipal Finance Authority Revenue Refunding Bond University of the Pacific Series A | 5.00 | 11-1-2030 | 500,000 | 568,843 | |
| California School Finance Authority Bright Star School Obligation Group 144A | 5.00 | 6-1-2027 | 1,110,000 | 1,127,711 | |
| California School Finance Authority Charter School Revenue Aspire Public Schools Issue #5 Series 144A | 2.13 | 8-1-2031 | 500,000 | 415,663 | |
| California School Finance Authority Charter School Revenue Classical Academies Vista Project 144A | 3.00 | 10-1-2031 | 375,000 | 334,716 | |
| California School Finance Authority Charter School Revenue Santa Clarita Valley International School Project 144A | 4.00 | 6-1-2031 | 260,000 | 249,579 | |
| California School Finance Authority Classical Academies Project Series A 144A | 3.25 | 10-1-2022 | 670,000 | 671,261 |
| Interest rate | Maturity date | Principal | Value | ||
| Education revenue (continued) | |||||
| California School Finance Authority Coastal Academy Project Series A 144A | 5.00% | 10-1-2022 | $ 75,000 | $ 75,451 | |
| California School Finance Authority Rocketship Education Series A 144A | 5.00 | 6-1-2026 | 400,000 | 411,493 | |
| California School Finance Authority School Facility Revenue Granada Hills Charter 144A | 4.00 | 7-1-2029 | 310,000 | 308,929 | |
| California University Revenue Systemwide Series B2 | 0.55 | 11-1-2049 | 6,500,000 | 5,687,694 | |
| Fullerton CA PFA Revenue Refunding Bond Marshall B Ketchum University | 4.00 | 2-1-2029 | 360,000 | 374,326 | |
| Fullerton CA PFA Revenue Refunding Bond Marshall B Ketchum University | 4.00 | 2-1-2031 | 415,000 | 422,698 | |
| Fullerton CA PFA Revenue Refunding Bond Marshall B Ketchum University | 4.00 | 2-1-2033 | 325,000 | 326,643 | |
| University of California Series AK | 5.00 | 5-15-2048 | 10,000,000 | 10,266,637 | |
| 36,304,247 | |||||
| GO revenue: 15.94% | |||||
| Bassett Unified School District Refunding Bond Series B (BAM Insured) | 5.00 | 8-1-2023 | 725,000 | 748,676 | |
| California Refunding Bond Various Purpose | 5.00 | 11-1-2022 | 2,500,000 | 2,531,018 | |
| California Refunding Bond Various Purpose | 5.00 | 10-1-2023 | 8,400,000 | 8,742,467 | |
| California Refunding Bond Various Purpose | 5.00 | 8-1-2025 | 3,500,000 | 3,799,514 | |
| California Refunding Bond Various Purpose Bidding Group C (BAM Insured) | 5.00 | 9-1-2027 | 8,500,000 | 9,407,681 | |
| California Series B | 5.00 | 9-1-2023 | 10,730,000 | 11,141,629 | |
| California Series E (SIFMA Municipal Swap +0.43%) ± | 1.41 | 12-1-2029 | 3,050,000 | 3,049,968 | |
| California Various Purpose | 5.25 | 10-1-2022 | 2,750,000 | 2,777,179 | |
| Carlsbad CA Unified School District Election 2018 Series B | 3.00 | 8-1-2031 | 300,000 | 294,713 | |
| Carlsbad CA Unified School District Election 2018 Series B | 3.00 | 8-1-2032 | 350,000 | 336,459 | |
| Carlsbad CA Unified School District Election 2018 Series B | 3.00 | 8-1-2034 | 300,000 | 281,686 | |
| Carlsbad CA Unified School District Election 2018 Series B | 3.00 | 8-1-2035 | 250,000 | 230,937 | |
| Carlsbad CA Unified School District Election 2018 Series B | 3.00 | 8-1-2036 | 350,000 | 317,841 | |
| Central California Unified School District Refunding Bond (AGM Insured) | 5.00 | 7-1-2022 | 750,000 | 750,000 | |
| Coachella Valley Unified School District (BAM Insured) | 4.00 | 8-1-2022 | 1,000,000 | 1,001,954 | |
| Dixon CA Unified School District (AGM Insured) | 5.00 | 8-1-2022 | 1,285,000 | 1,288,576 | |
| El Monte CA City School District CAB BAN ¤ | 0.00 | 4-1-2023 | 2,000,000 | 1,967,843 | |
| Hayward CA Unified School District Certificate of Participation (AGM Insured) | 5.00 | 8-1-2022 | 500,000 | 501,343 | |
| Hayward CA Unified School District Certificate of Participation (AGM Insured) | 5.00 | 8-1-2023 | 805,000 | 833,209 | |
| Inglewood CA Unified School District Election of 2012 Series B (BAM Insured) | 4.00 | 8-1-2022 | 200,000 | 200,400 | |
| Inglewood CA Unified School District Election of 2012 Series B (BAM Insured) | 5.00 | 8-1-2023 | 195,000 | 201,664 | |
| Inglewood CA Unified School District Election of 2012 Series B (BAM Insured) | 5.00 | 8-1-2024 | 150,000 | 158,442 | |
| Inglewood CA Unified School District Election of 2012 Series B (BAM Insured) | 5.00 | 8-1-2025 | 170,000 | 183,074 | |
| Inglewood CA Unified School District Election of 2012 Series B (BAM Insured) | 5.00 | 8-1-2026 | 235,000 | 257,658 | |
| Kern Community College District CAB BAN ¤ | 0.00 | 8-1-2023 | 2,000,000 | 1,940,300 | |
| Local Public Schools Funding Bond Authority School Facilities Improvement District # 2016-1 CA 2020 Election Series B (AGM Insured) | 3.00 | 8-1-2035 | 520,000 | 471,975 |
| Interest rate | Maturity date | Principal | Value | ||
| GO revenue (continued) | |||||
| Local Public Schools Funding Bond Authority School Facilities Improvement District #2016-1 CA 2020 Election Series B (AGM Insured) | 3.00% | 8-1-2033 | $ 225,000 | $ 212,135 | |
| Local Public Schools Funding Bond Authority School Facilities Improvement District #2016-1 CA 2020 Election Series B (AGM Insured) | 3.00 | 8-1-2034 | 375,000 | 348,934 | |
| Long Beach CA Harbor Revenue AMT Series C | 5.00 | 5-15-2027 | 500,000 | 536,346 | |
| Los Angeles CA Unified School District Refunding Bond Series D | 5.00 | 7-1-2023 | 6,180,000 | 6,383,407 | |
| Los Angeles CA Unified School District Series C | 4.00 | 7-1-2032 | 1,000,000 | 1,064,010 | |
| Newman-Crows Landing Unified School District 2022 ¤ | 0.00 | 8-1-2025 | 2,000,000 | 1,823,599 | |
| Oak Valley Hospital District Refunding Bond Los Angeles County CA RDA | 5.00 | 7-1-2022 | 750,000 | 750,000 | |
| Oak Valley Hospital District Refunding Bond Los Angeles County CA RDA | 5.00 | 7-1-2023 | 755,000 | 778,717 | |
| Oakland CA Unified School District Alameda County Election of 2012 Series A | 5.00 | 8-1-2022 | 750,000 | 752,048 | |
| Oakland CA Unified School District Alameda County Election of 2012 Series A | 5.00 | 8-1-2024 | 600,000 | 634,896 | |
| Oakland CA Unified School District Refunding Bond | 5.00 | 8-1-2025 | 1,540,000 | 1,660,337 | |
| Oakland CA Unified School District Refunding Bond Measure B Series B | 5.00 | 8-1-2026 | 500,000 | 549,021 | |
| Oakland CA Unified School District Refunding Bond Measure J Series C | 5.00 | 8-1-2025 | 795,000 | 857,122 | |
| Palomar CA Pomerado Health CAB Electric Series A (NPFGC Insured) ¤ | 0.00 | 8-1-2025 | 1,000,000 | 904,111 | |
| Pittsburg CA Unified School District (AGM Insured) | 4.00 | 8-1-2031 | 150,000 | 158,220 | |
| Pittsburg CA Unified School District (AGM Insured) | 4.00 | 8-1-2032 | 250,000 | 260,245 | |
| Sacramento CA City Unified School District Election of 2012 Measure Q Series E | 5.00 | 8-1-2029 | 1,500,000 | 1,653,911 | |
| Sacramento CA City Unified School District Election of 2012 Measure Q Series G (AGM Insured) | 4.00 | 8-1-2030 | 150,000 | 158,239 | |
| Sacramento CA City Unified School District Election of 2012 Measure Q Series G (AGM Insured) | 4.00 | 8-1-2031 | 200,000 | 209,993 | |
| Sacramento CA City Unified School District Election of 2012 Measure Q Series G (AGM Insured) | 4.00 | 8-1-2032 | 200,000 | 208,488 | |
| Sacramento CA City Unified School District Election of 2012 Measure Q Series G (AGM Insured) | 4.00 | 8-1-2033 | 200,000 | 206,726 | |
| Sacramento CA City Unified School Refunding Bond | 5.00 | 7-1-2022 | 485,000 | 485,000 | |
| San Bernardino CA City Unified School District Refunding Bond Series A (AGM Insured) | 1.25 | 8-1-2029 | 435,000 | 373,933 | |
| San Bernardino CA City Unified School District Refunding Bond Series A (AGM Insured) | 4.00 | 8-1-2031 | 875,000 | 925,722 | |
| San Gorgonio Memorial Healthcare District Refunding Bond | 4.00 | 8-1-2027 | 1,090,000 | 1,087,562 | |
| San Gorgonio Memorial Healthcare District Refunding Bond | 4.00 | 8-1-2030 | 580,000 | 562,387 | |
| San Gorgonio Memorial Healthcare District Refunding Bond | 5.00 | 8-1-2022 | 500,000 | 500,860 | |
| San Gorgonio Memorial Healthcare District Refunding Bond | 5.00 | 8-1-2023 | 1,000,000 | 1,017,453 | |
| Sierra Kings Health Care District Refunding Bond | 4.00 | 8-1-2022 | 425,000 | 425,740 | |
| Sierra Kings Health Care District Refunding Bond | 4.00 | 8-1-2023 | 405,000 | 413,210 | |
| Sierra Kings Health Care District Refunding Bond | 4.00 | 8-1-2024 | 420,000 | 433,278 | |
| Vacaville CA Unified School District Series C (BAM Insured) | 5.00 | 8-1-2022 | 675,000 | 676,878 | |
| 80,428,734 | |||||
| Health revenue: 9.51% | |||||
| California CDA Adventist Health Systems West Series A | 5.00 | 3-1-2024 | 800,000 | 839,402 | |
| California CDA Emanate Health Series A | 5.00 | 4-1-2028 | 755,000 | 825,947 |
| Interest rate | Maturity date | Principal | Value | ||
| Health revenue (continued) | |||||
| California CDA Emanate Health Series A | 5.00% | 4-1-2029 | $ 795,000 | $ 876,261 | |
| California CDA Health Facilities Catholic Series F (AGM Insured) € | 1.00 | 7-1-2040 | 1,000,000 | 1,000,000 | |
| California CDA Henry Mayo Newhall Memorial Hospital Series A (AGM Insured) | 5.00 | 10-1-2022 | 395,000 | 398,237 | |
| California CDA Henry Mayo Newhall Memorial Hospital Series A (AGM Insured) | 5.00 | 10-1-2023 | 500,000 | 518,190 | |
| California CDA Huntington Memorial Hospital | 5.00 | 7-1-2025 | 500,000 | 536,544 | |
| California CDA Huntington Memorial Hospital | 5.00 | 7-1-2026 | 500,000 | 545,024 | |
| California CDA Loma Linda University Medical Center Series A 144A | 5.00 | 12-1-2026 | 250,000 | 260,603 | |
| California CDA Loma Linda University Medical Center Series A 144A | 5.00 | 12-1-2027 | 300,000 | 312,130 | |
| California CDA Loma Linda University Medical Center Series A 144A | 5.00 | 12-1-2028 | 250,000 | 256,721 | |
| California CDA Viamonte Senior Living Project Series B | 3.00 | 7-1-2025 | 935,000 | 935,000 | |
| California HFFA Common Spirit Health Series A | 5.00 | 4-1-2032 | 1,500,000 | 1,643,205 | |
| California HFFA El Camino Hospital | 5.00 | 2-1-2025 | 1,000,000 | 1,064,642 | |
| California HFFA Memorial Health Services Series A | 5.00 | 10-1-2023 | 2,475,000 | 2,494,125 | |
| California HFFA On Lok Senior Health Services Series 2020 | 3.00 | 8-1-2022 | 325,000 | 325,245 | |
| California HFFA On Lok Senior Health Services Series 2020 | 3.00 | 8-1-2025 | 475,000 | 477,937 | |
| California HFFA On Lok Senior Health Services Series 2020 | 3.00 | 8-1-2028 | 400,000 | 395,244 | |
| California HFFA On Lok Senior Health Services Series 2020 | 3.00 | 8-1-2030 | 210,000 | 204,668 | |
| California HFFA Providence St Joseph Health Series B | 2.00 | 10-1-2036 | 5,000,000 | 4,853,241 | |
| California HFFA Revenue Adventist Health Series A | 3.00 | 3-1-2041 | 2,400,000 | 2,407,180 | |
| California HFFA Stanford Heath Care Series A | 3.00 | 8-15-2054 | 4,700,000 | 4,773,090 | |
| California HFFA Sutter Health Series A | 5.00 | 11-15-2023 | 2,500,000 | 2,603,289 | |
| California Municipal Finance Authority Community Medical Centers Series A | 5.00 | 2-1-2023 | 735,000 | 749,177 | |
| California Municipal Finance Authority Community Medical Centers Series A | 5.00 | 2-1-2024 | 500,000 | 523,380 | |
| California Municipal Finance Authority Open Door Community Health | 4.00 | 9-15-2030 | 790,000 | 845,787 | |
| California Municipal Finance Authority Open Door Community Health | 4.00 | 9-15-2033 | 890,000 | 930,271 | |
| California Municipal Finance Authority Revenue Bond Community Medical Centers Series A | 5.00 | 2-1-2025 | 1,000,000 | 1,058,220 | |
| California Municipal Finance Authority Revenue Refunding Bond Channing House Project Series A | 5.00 | 5-15-2023 | 925,000 | 950,469 | |
| California Municipal Finance Authority Revenue Refunding Bond Eisenhower Medical Center Series A | 5.00 | 7-1-2029 | 400,000 | 423,168 | |
| California Municipal Finance Authority Revenue Refunding Bond Paradise Valley Estates Project Series B1 | 2.25 | 7-1-2025 | 2,200,000 | 2,199,998 | |
| California Municipal Finance Authority Revenue Refunding Bond Paradise Valley Estates Project Series B2 | 2.00 | 7-1-2024 | 35,000 | 34,879 | |
| California Municipal Finance Authority Revenue Refunding Bond Series A 144A | 5.00 | 11-1-2029 | 1,170,000 | 1,216,533 | |
| California Municipal Finance Authority Revenue Refunding Bonds Eisenhower Medical Center Series A | 5.00 | 7-1-2027 | 1,650,000 | 1,772,804 | |
| California Municipal Finance Authority Senior Living Revenue Bonds Series 2022-B1 | 2.75 | 11-15-2027 | 520,000 | 470,347 | |
| California Municipal Finance Authority Senior Living Revenue Bonds Series 2022-B2 | 2.13 | 11-15-2026 | 565,000 | 519,560 | |
| California PFA Revenue Bond Henry Mayo Newhall Hospital Series A | 4.00 | 10-15-2028 | 360,000 | 364,473 |
| Interest rate | Maturity date | Principal | Value | ||
| Health revenue (continued) | |||||
| California PFA Revenue Bond Henry Mayo Newhall Hospital Series B | 4.00% | 10-15-2051 | $ 690,000 | $ 666,227 | |
| California PFA Senior Living Revenue Refunding Bond Enso Village Project Series B2 144A | 2.38 | 11-15-2028 | 1,000,000 | 917,989 | |
| Palomar Health California Certificate of Participation Health & Arch Health Partners Incorporated | 5.00 | 11-1-2022 | 375,000 | 378,488 | |
| Palomar Health California Certificate of Participation Health & Arch Health Partners Incorporated | 5.00 | 11-1-2023 | 300,000 | 309,384 | |
| Palomar Health California Certificate of Participation Health & Arch Health Partners Incorporated | 5.00 | 11-1-2024 | 300,000 | 314,525 | |
| Palomar Health California Certificate of Participation Health & Arch Health Partners Incorporated | 5.00 | 11-1-2025 | 330,000 | 350,864 | |
| Sierra View Local Health Care District Revenue Refunding Bond | 4.00 | 7-1-2023 | 500,000 | 509,491 | |
| Sierra View Local Health Care District Revenue Refunding Bond | 4.00 | 7-1-2025 | 580,000 | 597,483 | |
| Sierra View Local Health Care District Revenue Refunding Bond | 5.00 | 7-1-2027 | 630,000 | 683,818 | |
| Sierra View Local Health Care District Revenue Refunding Bond | 5.00 | 7-1-2029 | 630,000 | 693,582 | |
| Washington Township Health Care District Refunding Bond Series A | 4.00 | 7-1-2033 | 275,000 | 269,610 | |
| Washington Township Health Care District Refunding Bond Series A | 5.00 | 7-1-2023 | 600,000 | 615,267 | |
| Washington Township Health Care District Refunding Bond Series A | 5.00 | 7-1-2029 | 350,000 | 380,777 | |
| Washington Township Health Care District Refunding Bond Series A | 5.00 | 7-1-2030 | 300,000 | 327,720 | |
| Washington Township Health Care District Refunding Bond Series A | 5.00 | 7-1-2031 | 325,000 | 351,065 | |
| 47,971,281 | |||||
| Housing revenue: 8.91% | |||||
| California CDA Lancer Educational Student Housing Project Series A 144A | 3.00 | 6-1-2029 | 710,000 | 637,555 | |
| California CDA MFHR Refunding Bonds 2021 Series A (Landesbank Hessen-Thüringen LOC) ø | 1.04 | 3-1-2057 | 8,000,000 | 8,000,000 | |
| California CDA Student Housing Revenue Series 2021 (BAM Insured) | 5.00 | 5-15-2026 | 1,605,000 | 1,721,759 | |
| California CDA Uptown Newport Apartments Series 2017 AA & BB (East West Bank LOC) ø | 0.95 | 3-1-2057 | 10,020,000 | 10,020,000 | |
| California Enterprise Development Authority Student Housing Revenue Provident Group | 5.00 | 8-1-2029 | 200,000 | 210,571 | |
| California Enterprise Development Authority Student Housing Revenue Provident Group | 5.00 | 8-1-2030 | 325,000 | 341,726 | |
| California HFA Municipal Certificate of Participation Series 2 Class A | 4.00 | 3-20-2033 | 5,024,967 | 4,967,436 | |
| California HFA Municipal Certificates Series 2021-1 Class A | 3.50 | 11-20-2035 | 2,945,748 | 2,748,629 | |
| California Independent Cities Finance Authority Mobile Home Park Revenue Refunding Bond Union City Tropics | 4.25 | 5-15-2024 | 745,000 | 770,675 | |
| California Municipal Finance Authority Peppertree Senior Apartments Series A (FHLMC Insured, FHLMC LIQ) | 2.80 | 6-1-2023 | 2,500,000 | 2,522,358 | |
| California Municipal Finance Authority Student Housing Davis I LLC West Village Student Housing Project | 5.00 | 5-15-2024 | 1,200,000 | 1,241,981 | |
| California Municipal Finance Authority Student Housing Davis I LLC West Village Student Housing Project | 5.00 | 5-15-2025 | 3,435,000 | 3,600,712 |
| Interest rate | Maturity date | Principal | Value | ||
| Housing revenue (continued) | |||||
| California Municipal Finance Authority Student Housing Revenue Green Bond Orchard Park Student Housing Project (BAM Insured) | 4.00% | 5-15-2032 | $ 700,000 | $ 704,509 | |
| California Municipal Finance Authority Student Housing Revenue Green Bond Orchard Park Student Housing Project (BAM Insured) | 5.00 | 5-15-2029 | 400,000 | 437,674 | |
| California Municipal Finance Authority Student Housing Revenue Green Bond Orchard Park Student Housing Project (BAM Insured) | 5.00 | 5-15-2030 | 450,000 | 493,925 | |
| California Municipal Finance Authority Student Housing Revenue Green Bond Orchard Park Student Housing Project (BAM Insured) | 5.00 | 5-15-2031 | 400,000 | 440,343 | |
| FHLMC Multifamily Certificates Series M 057 Class A | 2.40 | 10-15-2029 | 5,980,000 | 5,688,081 | |
| Sacramento CA Housing Authority MFHR (FNMA Insured, FNMA LIQ) ø | 0.85 | 7-15-2029 | 415,000 | 415,000 | |
| 44,962,934 | |||||
| Industrial development revenue: 0.63% | |||||
| San Francisco CA City & County Airports Commission International Airport Revenue AMT Special Facilities Lease SFO Fuel Company Series 2019A | 5.00 | 1-1-2025 | 3,000,000 | 3,175,273 | |
| Miscellaneous revenue: 14.07% | |||||
| California CDA Community Infrastructure Program Revenue Series A | 4.00 | 9-2-2027 | 390,000 | 389,238 | |
| California CDA Community Infrastructure Program Revenue Series A | 4.00 | 9-2-2028 | 260,000 | 257,406 | |
| California CDA Monterey County Savers Bond Program (BAM Insured) | 5.00 | 8-1-2027 | 2,185,000 | 2,406,010 | |
| California CDA Refunding Bond (AGM Insured) | 5.00 | 11-15-2022 | 200,000 | 202,671 | |
| California HFA Revenue Bonds (San Francisco Supportive Housing -833 Bryant Apartments) 2020 Issue N- Social Bonds | 5.00 | 4-1-2029 | 630,000 | 713,921 | |
| California HFA Revenue Bonds (San Francisco Supportive Housing -833 Bryant Apartments) 2020 Issue N- Social Bonds | 5.00 | 4-1-2031 | 730,000 | 834,354 | |
| California Infrastructure and Economic Development Bank J Paul Getty Trust Series 2021-B2 | 3.00 | 10-1-2047 | 10,715,000 | 10,873,695 | |
| California Municipal Finance Authority Revenue Refunding Bond Southwestern Law School | 4.00 | 11-1-2031 | 175,000 | 174,004 | |
| California Municipal Finance Authority Revenue Refunding Bond Southwestern Law School | 5.00 | 11-1-2026 | 275,000 | 293,168 | |
| California Municipal Finance Authority Revenue Refunding Bond Southwestern Law School | 5.00 | 11-1-2027 | 290,000 | 310,878 | |
| California Municipal Finance Authority Revenue Refunding Bond Southwestern Law School | 5.00 | 11-1-2028 | 200,000 | 214,425 | |
| California Municipal Finance Authority Revenue Refunding Bond Southwestern Law School | 5.00 | 11-1-2029 | 210,000 | 225,871 | |
| California Municipal Finance Authority Revenue Refunding Bond Southwestern Law School | 5.00 | 11-1-2030 | 220,000 | 236,253 | |
| California Public Works Board Department of Corrections & Rehabilitation Series C | 5.00 | 10-1-2022 | 1,500,000 | 1,513,167 | |
| California Public Works Board Department of Corrections & Rehabilitation Series D | 5.00 | 9-1-2025 | 1,160,000 | 1,228,057 | |
| California Public Works Board Judicial Council Projects Series B | 5.00 | 10-1-2022 | 500,000 | 504,389 |
| Interest rate | Maturity date | Principal | Value | ||
| Miscellaneous revenue (continued) | |||||
| California Public Works Board Lease Revenue Refunding Bond Various Capital Project Series C %% | 5.00% | 8-1-2025 | $ 2,530,000 | $ 2,713,858 | |
| California Refunding Bond Various Purpose | 5.00 | 9-1-2022 | 2,240,000 | 2,253,733 | |
| Compton CA PFA Refunding Bond 144A | 4.00 | 9-1-2022 | 530,000 | 530,337 | |
| Compton CA PFA Refunding Bond 144A | 4.00 | 9-1-2027 | 2,000,000 | 2,000,734 | |
| Desert Sands Unified School District Certificate of Participation (BAM Insured) | 5.00 | 3-1-2024 | 1,500,000 | 1,574,381 | |
| El Centro CA Financing Authority Lease Revenue Refunding Bond Transportation Improvements Series B | 4.00 | 10-1-2026 | 140,000 | 147,481 | |
| El Centro CA Financing Authority Lease Revenue Refunding Bond Transportation Improvements Series B | 4.00 | 10-1-2027 | 365,000 | 385,782 | |
| El Centro CA Financing Authority Lease Revenue Refunding Bond Transportation Improvements Series B | 4.00 | 10-1-2028 | 255,000 | 269,826 | |
| El Centro CA Financing Authority Lease Revenue Refunding Bond Transportation Improvements Series B | 4.00 | 10-1-2029 | 265,000 | 281,243 | |
| El Centro CA Financing Authority Lease Revenue Refunding Bond Transportation Improvements Series B | 4.00 | 10-1-2030 | 275,000 | 291,156 | |
| El Centro CA Financing Authority Lease Revenue Refunding Bond Transportation Improvements Series B | 4.00 | 10-1-2031 | 285,000 | 301,256 | |
| Independent Cities Finance Authority California Sales Tax Revenue (AGM Insured) 144A | 4.00 | 6-1-2028 | 500,000 | 523,888 | |
| Independent Cities Finance Authority California Sales Tax Revenue (AGM Insured) 144A | 4.00 | 6-1-2030 | 550,000 | 577,037 | |
| Inglewood CA Unified School District School Facilities Authority (AGM Insured) | 5.25 | 10-15-2023 | 8,670,000 | 8,873,511 | |
| Irvine CA Limited Obligation Improvement Bonds Reassessment District #15-2 | 5.00 | 9-2-2023 | 800,000 | 824,200 | |
| Irvine CA Limited Obligation Improvement Bonds Reassessment District #15-2 | 5.00 | 9-2-2024 | 850,000 | 892,196 | |
| Irvine CA Limited Obligation Improvement Reassessment District | 4.00 | 9-2-2029 | 1,220,000 | 1,247,993 | |
| Irvine CA Limited Obligation Improvement Reassessment District (BAM Insured) | 4.00 | 9-2-2033 | 270,000 | 271,007 | |
| Lassen Municipal Utility District Certificate of Participation | 4.00 | 5-1-2029 | 485,000 | 497,432 | |
| Lassen Municipal Utility District Certificate of Participation | 4.00 | 5-1-2030 | 505,000 | 512,748 | |
| Lassen Municipal Utility District Certificate of Participation | 4.00 | 5-1-2031 | 525,000 | 528,327 | |
| Lassen Municipal Utility District Certificate of Participation | 4.00 | 5-1-2032 | 550,000 | 548,181 | |
| Lassen Municipal Utility District Certificate of Participation | 4.00 | 5-1-2033 | 570,000 | 566,726 | |
| Lassen Municipal Utility District Certificate of Participation | 4.00 | 5-1-2034 | 595,000 | 591,498 | |
| Lodi CA PFA Electric Refunding Bond (AGM Insured) | 5.00 | 9-1-2024 | 1,100,000 | 1,165,254 | |
| Los Angeles CA Municipal Improvement Corporation Lease Revenue Series C | 5.00 | 11-1-2030 | 2,340,000 | 2,727,478 | |
| Los Angeles CA Public Works Series D | 5.00 | 12-1-2027 | 1,605,000 | 1,743,589 | |
| Los Angeles CA Unified School District Certificate of Participation Headquarters Building Projects Series B | 5.00 | 10-1-2025 | 1,875,000 | 1,888,407 | |
| Mountain HFA California Utility System Revenue Refunding Bond Series A | 5.00 | 12-1-2029 | 520,000 | 576,774 | |
| Mountain HFA California Utility System Revenue Refunding Bond Series A | 5.00 | 12-1-2030 | 710,000 | 781,126 | |
| Mountain HFA California Utility System Revenue Refunding Bond Series A | 5.00 | 12-1-2031 | 745,000 | 814,379 | |
| Sacramento CA City Financing Refunding Bond Master Lease Program Facilities (BAM Insured) | 5.00 | 12-1-2022 | 800,000 | 811,083 | |
| Sacramento CA City Schools Joint Powers Financing Authority Series A (BAM Insured) | 5.00 | 3-1-2023 | 815,000 | 832,244 |
| Interest rate | Maturity date | Principal | Value | ||
| Miscellaneous revenue (continued) | |||||
| San Joaquin CA Area Flood Control Agency Smith Canal Area Assessment District Assessment Revenue (AGM Insured) | 5.00% | 10-1-2025 | $ 250,000 | $ 270,078 | |
| San Joaquin CA Area Flood Control Agency Smith Canal Area Assessment District Assessment Revenue (AGM Insured) | 5.00 | 10-1-2027 | 350,000 | 390,834 | |
| San Joaquin CA Area Flood Control Agency Smith Canal Area Assessment District Assessment Revenue (AGM Insured) | 5.00 | 10-1-2029 | 380,000 | 433,901 | |
| Santa Barbara County CA Solid Waste System Revenue Certificate of Participation AMT Series B | 5.00 | 12-1-2029 | 600,000 | 665,233 | |
| Santa Clara County CA Financing Capital Projects Series A | 4.00 | 2-1-2024 | 6,000,000 | 6,006,931 | |
| Santa Cruz County CA Capital Financing Public Facilities Project (AGM Insured) | 5.00 | 8-1-2022 | 165,000 | 165,445 | |
| Sutter Butte Flood Control Agency Assessment (BAM Insured) | 5.00 | 10-1-2023 | 1,280,000 | 1,331,381 | |
| Sutter Butte Flood Control Agency Assessment (BAM Insured) | 5.00 | 10-1-2024 | 715,000 | 761,258 | |
| Sutter Butte Flood Control Agency Assessment (BAM Insured) | 5.00 | 10-1-2025 | 1,575,000 | 1,711,755 | |
| Visalia CA Certificate of Participation (AGM Insured) | 5.00 | 12-1-2022 | 335,000 | 339,504 | |
| 70,998,692 | |||||
| Tax revenue: 14.88% | |||||
| California Community Facilities District #2015-01 | 5.00 | 9-1-2027 | 395,000 | 412,884 | |
| Carson CA RDA Project Area #1 Series A (AGM Insured) | 5.00 | 10-1-2022 | 600,000 | 605,208 | |
| Cathedral City CA RDA Refunding Bond Merged Redevelopment Project Series A | 5.00 | 8-1-2022 | 2,550,000 | 2,556,041 | |
| Cathedral City CA RDA Refunding Bond Merged Redevelopment Project Series A | 5.00 | 8-1-2023 | 1,735,000 | 1,796,930 | |
| Cathedral City CA RDA Refunding Bond Merged Redevelopment Project Series A (AGM Insured) | 5.00 | 8-1-2024 | 1,770,000 | 1,864,086 | |
| Cathedral City CA RDA Successor Agency Tax Allocation Revenue Refunding Bond Subordinated Merged Redevelopment Project Area (BAM Insured) | 4.00 | 8-1-2027 | 580,000 | 610,479 | |
| Cathedral City CA RDA Successor Agency Tax Allocation Revenue Refunding Bond Subordinated Merged Redevelopment Project Area (BAM Insured) | 4.00 | 8-1-2029 | 500,000 | 526,598 | |
| Cathedral City CA RDA Successor Agency Tax Allocation Revenue Refunding Bond Subordinated Merged Redevelopment Project Area (BAM Insured) | 4.00 | 8-1-2031 | 600,000 | 629,112 | |
| Chino CA PFA Local Agency Series A (AGM Insured) | 5.00 | 9-1-2022 | 1,830,000 | 1,840,493 | |
| Chino CA PFA Local Agency Series A (AGM Insured) | 5.00 | 9-1-2024 | 660,000 | 697,004 | |
| Commerce CA Successor Agency to the Community Development Commission Refunding Bond Series A (AGM Insured) | 5.00 | 8-1-2023 | 600,000 | 619,594 | |
| Compton CA Community Redevelopment Agency Successor Agency Tax Allocation Refunding Series A (AGM Insured) | 5.00 | 8-1-2025 | 4,095,000 | 4,381,040 | |
| Dinuba CA RDA Successor Agency to Merged City Project #2 (BAM Insured) | 5.00 | 9-1-2022 | 250,000 | 251,402 | |
| Fairfield CA RDA Successor Agency Tax Allocation Refunding Bond | 5.00 | 8-1-2022 | 2,395,000 | 2,401,045 | |
| Fairfield CA RDA Successor Agency Tax Allocation Refunding Bond | 5.00 | 8-1-2023 | 1,025,000 | 1,060,474 |
| Interest rate | Maturity date | Principal | Value | ||
| Tax revenue (continued) | |||||
| Fontana CA Special Tax Community Facilities District #90 Summit | 3.00% | 9-1-2025 | $ 110,000 | $ 107,820 | |
| Fontana CA Special Tax Community Facilities District #90 Summit | 4.00 | 9-1-2026 | 110,000 | 111,930 | |
| Fontana CA Special Tax Community Facilities District #90 Summit | 4.00 | 9-1-2027 | 125,000 | 127,031 | |
| Fontana CA Special Tax Community Facilities District #90 Summit | 4.00 | 9-1-2028 | 255,000 | 257,289 | |
| Fontana CA Special Tax Community Facilities District #90 Summit | 4.00 | 9-1-2030 | 140,000 | 138,388 | |
| Fontana CA Special Tax Community Facilities District #90 Summit | 4.00 | 9-1-2032 | 300,000 | 292,913 | |
| Fremont CA Community Facilities District | 5.00 | 9-1-2024 | 1,000,000 | 1,045,524 | |
| Garden Grove CA Agency Community Refunding Bond Garden Grove Community Project (BAM Insured) | 5.00 | 10-1-2022 | 3,015,000 | 3,040,146 | |
| Hollister CA RDA Refunding Bond Hollister Community Development Project (BAM Insured) | 5.00 | 10-1-2026 | 700,000 | 741,496 | |
| Inglewood CA Redevelopment Refunding Bond Subordinate Lien Merged Redevelopment Project (BAM Insured) | 5.00 | 5-1-2025 | 1,000,000 | 1,068,903 | |
| Irwindale CA CDA City Industrial Development Project (AGM Insured) | 5.00 | 7-15-2022 | 365,000 | 365,381 | |
| Irwindale CA CDA City Industrial Development Project (AGM Insured) | 5.00 | 7-15-2023 | 375,000 | 387,500 | |
| La Quinta CA RDA Project Areas #1 & 2 Series A | 5.00 | 9-1-2022 | 615,000 | 618,624 | |
| Lancaster CA RDA Refunding Bond Combined Redevelopment Project Areas (AGM Insured) | 5.00 | 8-1-2024 | 870,000 | 916,246 | |
| Lancaster CA RDA Refunding Bond Combined Redevelopment Project Areas (AGM Insured) | 5.00 | 8-1-2029 | 400,000 | 434,849 | |
| Lincoln CA Special Tax Refunding Bond Community Facilities District #2003-1 Lincoln Crossing Project | 4.00 | 9-1-2024 | 600,000 | 619,946 | |
| Lincoln CA Special Tax Refunding Bond Community Facilities District #2003-1 Lincoln Crossing Project | 5.00 | 9-1-2025 | 550,000 | 590,982 | |
| Menifee CA Union School District Public Series A | 4.00 | 9-1-2022 | 540,000 | 541,639 | |
| Oakdale CA Successor Agency to Oakdale Community RDA Series A (AGM Insured) | 5.00 | 6-1-2027 | 350,000 | 388,571 | |
| Orange County CA Community Facilities #2015-1 Esencia Village Series A | 5.00 | 8-15-2023 | 365,000 | 374,726 | |
| Orange County CA Community Facilities #2015-1 Esencia Village Series A | 5.00 | 8-15-2025 | 325,000 | 343,440 | |
| Pittsburg CA Successor Agency of Los Medanos Community Development (AGM Insured) | 5.00 | 8-1-2022 | 1,305,000 | 1,308,419 | |
| Pittsburg CA Successor Agency of Los Medanos Community Development (AGM Insured) | 5.00 | 8-1-2023 | 780,000 | 805,895 | |
| Poway CA Unified School District PFA Series B (BAM Insured) | 5.00 | 9-1-2024 | 1,115,000 | 1,183,570 | |
| Poway CA Unified School District PFA Series B (BAM Insured) | 5.00 | 9-1-2025 | 775,000 | 839,615 | |
| Rialto CA RDA Successor Agency to Merged Project Area | 5.00 | 9-1-2022 | 475,000 | 477,535 | |
| River Islands PFA Special Tax Communities Facilities District #2021-1 | 4.00 | 9-1-2030 | 200,000 | 193,660 | |
| River Islands PFA Special Tax Communities Facilities District #2021-1 | 4.00 | 9-1-2031 | 500,000 | 479,412 | |
| Riverside CA PFA Local Measure Certificate of Participation Riverside Pavement Rehabilitation Project (AGM Insured) | 5.00 | 6-1-2023 | 845,000 | 870,723 | |
| Roseville CA Finance Authority Special Refunding Bond Series A | 5.00 | 9-1-2023 | 400,000 | 415,110 |
| Interest rate | Maturity date | Principal | Value | ||
| Tax revenue (continued) | |||||
| Roseville CA Finance Authority Special Refunding Bond Series A | 5.00% | 9-1-2029 | $ 300,000 | $ 334,336 | |
| Roseville CA Special Tax Refunding Bond Fiddyment Ranch Community | 5.00 | 9-1-2024 | 1,905,000 | 1,986,843 | |
| Roseville CA Special Tax Refunding Bond Fiddyment Ranch Community | 5.00 | 9-1-2029 | 1,595,000 | 1,695,132 | |
| Sacramento CA Transient Occupancy Tax Revenue Convention Center Complex Senior | 5.00 | 6-1-2027 | 575,000 | 633,421 | |
| San Francisco CA City & County Community Facilities District #2016-1 Improvement Area #1 Special Tax Treasure Island | 4.00 | 9-1-2032 | 350,000 | 338,650 | |
| San Francisco CA City & County Community Facilities District #2016-1 Improvement Area #1 Special Tax Treasure Island | 4.00 | 9-1-2033 | 865,000 | 829,527 | |
| San Francisco CA City & County Community Facilities District #2016-1 Improvement Area #1 Special Tax Treasure Island | 4.00 | 9-1-2034 | 700,000 | 666,630 | |
| San Francisco CA City & County Improvement Area #2 Community Facilities District Series 2022 A 144A | 4.00 | 9-1-2032 | 1,150,000 | 1,107,227 | |
| San Francisco CA City & County RDA Successor Agency to Community Facilities District #6 Mission Bay South Series A | 5.00 | 8-1-2025 | 1,600,000 | 1,602,411 | |
| San Francisco CA City & County RDA Successor Agency to Mission Bay South Redevelopment Project Series A | 5.00 | 8-1-2022 | 375,000 | 375,969 | |
| San Marcos CA Unified School District Community Facilities District #5 (BAM Insured) | 5.00 | 9-1-2022 | 250,000 | 251,481 | |
| San Pablo CA RDA Series B (AGM Insured) | 5.00 | 6-15-2023 | 1,945,000 | 2,001,431 | |
| Santaluz Community Facilities District #2 CA Special Tax Refunding Bond Improvement Area #1 | 4.00 | 9-1-2029 | 685,000 | 721,481 | |
| Santaluz Community Facilities District #2 CA Special Tax Refunding Bond Improvement Area #1 | 4.00 | 9-1-2030 | 435,000 | 456,686 | |
| Stockton CA RDA Refunding Bond Series A (AGM Insured) | 5.00 | 9-1-2025 | 1,675,000 | 1,801,392 | |
| Successor Agency to the Richmond CA Community RDA Series A (BAM Insured) | 4.00 | 9-1-2027 | 1,150,000 | 1,219,160 | |
| Successor Agency to the Richmond CA Community RDA Series A (BAM Insured) | 4.50 | 9-1-2025 | 160,000 | 166,954 | |
| Successor Agency to the Richmond CA Community RDA Series A (BAM Insured) | 5.00 | 9-1-2022 | 300,000 | 301,677 | |
| Successor Agency to the Richmond CA Community RDA Series A (BAM Insured) | 5.00 | 9-1-2023 | 265,000 | 274,143 | |
| Successor Agency to the Richmond CA Community RDA Series A (BAM Insured) | 5.00 | 9-1-2025 | 150,000 | 158,117 | |
| Successor Agency to the Riverside County CA RDA Desert Communities Project Series D | 5.00 | 10-1-2022 | 445,000 | 448,701 | |
| Successor Agency to the Riverside County CA RDA Desert Communities Project Series D | 5.00 | 10-1-2023 | 470,000 | 487,393 | |
| Successor Agency to the Riverside County CA RDA Project Area #1 Series A | 5.00 | 10-1-2022 | 240,000 | 241,996 | |
| Successor Agency to the Riverside County CA RDA Project Area #1 Series A | 5.00 | 10-1-2023 | 460,000 | 477,023 | |
| Tender Option Bond Trust Receipts/Floater Certificates Series 2019-MIZ9003 (Mizuho Capital Markets LLC LOC, Mizuho Capital Markets LLC LIQ) 144Aø | 1.23 | 3-1-2036 | 10,000,000 | 10,000,000 | |
| Tracy CA Community Facilities District | 4.00 | 9-1-2022 | 180,000 | 180,464 | |
| Tracy CA Community Facilities District | 4.00 | 9-1-2024 | 135,000 | 137,462 | |
| Tracy CA Community Facilities District | 4.00 | 9-1-2025 | 155,000 | 158,327 |
| Interest rate | Maturity date | Principal | Value | ||
| Tax revenue (continued) | |||||
| Tracy CA Community Facilities District | 5.00% | 9-1-2028 | $ 425,000 | $ 453,541 | |
| Transbay Joint Powers Authority Green Tax Allocation Bond Senior Series A | 5.00 | 10-1-2029 | 500,000 | 569,167 | |
| Transbay Joint Powers Authority Green Tax Allocation Bond Senior Series A | 5.00 | 10-1-2030 | 500,000 | 570,319 | |
| Transbay Joint Powers Authority Green Tax Allocation Bond Senior Series A | 5.00 | 10-1-2031 | 400,000 | 454,307 | |
| Tustin CA Community Facilities District #6-1 Legacy Columbus Villages Series A | 5.00 | 9-1-2025 | 1,000,000 | 1,071,997 | |
| Upland CA Successor Agency to Merged Project Tax Allocation Bond (AGM Insured) | 5.00 | 9-1-2023 | 1,000,000 | 1,035,670 | |
| Vacaville CA RDA Tax Allocation Subordinate Refunding Bond Redevelopment Projects | 5.00 | 9-1-2022 | 1,050,000 | 1,055,487 | |
| Val Verde CA Unified School District (BAM Insured) | 5.00 | 10-1-2022 | 665,000 | 670,546 | |
| Yuba City CA RDA Refunding Bond (AGM Insured) | 5.00 | 9-1-2025 | 750,000 | 806,593 | |
| 75,081,334 | |||||
| Tobacco revenue: 1.51% | |||||
| California County Tobacco Securitization Agency (Sonoma County Securitization Corporation) Tobacco Settlement Bonds Series 2020A | 5.00 | 6-1-2029 | 950,000 | 1,028,489 | |
| California County Tobacco Securitization Agency (Sonoma County Securitization Corporation) Tobacco Settlement Bonds Series 2020A | 5.00 | 6-1-2030 | 200,000 | 217,170 | |
| California County Tobacco Securitization Agency (Sonoma County Securitization Corporation) Tobacco Settlement Bonds Series 2020A | 5.00 | 6-1-2031 | 225,000 | 243,966 | |
| California County Tobacco Securitization Agency (Sonoma County Securitization Corporation) Tobacco Settlement Bonds Series 2020A | 5.00 | 6-1-2032 | 250,000 | 269,807 | |
| California County Tobacco Securitization Agency Settlement Senior Refunding Bond Series A | 5.00 | 6-1-2030 | 450,000 | 488,632 | |
| California County Tobacco Securitization Agency Settlement Senior Refunding Bond Series A | 5.00 | 6-1-2031 | 550,000 | 593,996 | |
| California County Tobacco Securitization Agency Settlement Senior Refunding Bond Series A | 5.00 | 6-1-2032 | 300,000 | 322,559 | |
| Golden State Tobacco Securitization Corporation California Tobacco Settlement Refunding Bond Series A-1 | 5.00 | 6-1-2026 | 3,000,000 | 3,315,115 | |
| Golden State Tobacco Securitization Corporation California Tobacco Settlement Refunding Bond Series A-1 | 5.00 | 6-1-2028 | 1,000,000 | 1,126,034 | |
| 7,605,768 | |||||
| Transportation revenue: 0.99% | |||||
| Bay Area Toll Authority Toll Bridge Revenue Sanitary Francisco Bay Area Series E (SIFMA Municipal Swap +0.41%) ± | 1.39 | 4-1-2056 | 1,500,000 | 1,449,810 | |
| Sacramento CA Regional Transit District Revenue Refunding Bond Series A | 5.00 | 3-1-2030 | 400,000 | 462,444 | |
| Sacramento CA Regional Transit District Revenue Refunding Bond Series A | 5.00 | 3-1-2031 | 410,000 | 478,132 | |
| Sacramento CA Regional Transit District Revenue Refunding Bond Series A | 5.00 | 3-1-2033 | 1,425,000 | 1,643,556 | |
| San Joaquin CA Transportation Corridor Agency Toll Road Revenue Refunding Bond Senior Lien Series A | 5.00 | 1-15-2030 | 865,000 | 930,336 | |
| 4,964,278 |
| Interest rate | Maturity date | Principal | Value | ||
| Utilities revenue: 3.79% | |||||
| California CDA PCR Refunding Bond Southern CA Edison Company Series A | 1.75% | 9-1-2029 | $ 1,500,000 | $ 1,274,694 | |
| California Community Choice Financing Authority Clean Energy Project Revenue Series 2021-A | 4.00 | 10-1-2052 | 3,650,000 | 3,721,164 | |
| California Community Choice Financing Authority Clean Energy Project Revenue Series A 1 %% | 4.00 | 2-1-2027 | 2,290,000 | 2,337,381 | |
| California Community Choice Financing Authority Clean Energy Project Revenue Series A 1 %% | 4.00 | 2-1-2028 | 2,810,000 | 2,856,133 | |
| California Community Choice Financing Authority Clean Energy Project Revenue Series B 2 (SIFMA Municipal Swap +0.45%) ± | 1.43 | 2-1-2052 | 6,300,000 | 5,997,663 | |
| Los Angeles CA Department Water and Power Revenue Various Power System Series A2 (Royal Bank of Canada SPA) ø | 0.50 | 7-1-2051 | 2,300,000 | 2,300,000 | |
| Vernon CA Electric System Series A | 5.00 | 8-1-2026 | 600,000 | 641,747 | |
| 19,128,782 | |||||
| Water & sewer revenue: 4.22% | |||||
| Florin Resource Conservation District Series A (NPFGC Insured) | 5.00 | 9-1-2022 | 1,250,000 | 1,257,028 | |
| Irvine CA Limited Obligation Improvement Bonds Reassessment District #15-2 (Sumitomo Mitsui Banking Corporation LOC) ø | 0.78 | 7-1-2035 | 4,600,000 | 4,600,000 | |
| Lower Tule River Irrigation District California Revenue Refunding Bond Series A | 5.00 | 8-1-2027 | 680,000 | 756,774 | |
| Lower Tule River Irrigation District California Revenue Refunding Bond Series A | 5.00 | 8-1-2031 | 700,000 | 799,701 | |
| Middle Fork Project Finance Authority Revenue Refunding Bond | 5.00 | 4-1-2029 | 3,525,000 | 3,867,443 | |
| San Francisco CA City & County Public Utilities Commission Series C Green Bond | 2.13 | 10-1-2048 | 10,000,000 | 10,005,644 | |
| 21,286,590 | |||||
| 451,925,582 | |||||
| Guam: 1.04% | |||||
| Airport revenue: 0.26% | |||||
| Guam Port Authority AMT Series B | 5.00 | 7-1-2023 | 540,000 | 552,672 | |
| Guam Port Authority AMT Series B | 5.00 | 7-1-2024 | 750,000 | 780,305 | |
| 1,332,977 | |||||
| Miscellaneous revenue: 0.78% | |||||
| Guam Education Financing Foundation Certificate of Participation Refunding Bond Series A | 5.00 | 10-1-2023 | 3,840,000 | 3,912,808 | |
| 5,245,785 | |||||
| Illinois: 2.53% | |||||
| Miscellaneous revenue: 2.08% | |||||
| Illinois Refunding Bond | 5.00 | 2-1-2025 | 10,000,000 | 10,498,159 |
| Interest rate | Maturity date | Principal | Value | ||
| Tax revenue: 0.45% | |||||
| Metropolitan Pier & Exposition Authority McCormick Place Expansion Project Series B | 5.00% | 12-15-2025 | $ 650,000 | $ 683,088 | |
| Sales Tax Securitization Corporation Series 2017A | 5.00 | 1-1-2026 | 1,500,000 | 1,607,218 | |
| 2,290,306 | |||||
| 12,788,465 | |||||
| New Jersey: 0.22% | |||||
| Tax revenue: 0.22% | |||||
| New Jersey COVID-19 Emergency Series A | 5.00 | 6-1-2027 | 1,000,000 | 1,102,567 | |
| New York: 1.10% | |||||
| Airport revenue: 0.08% | |||||
| New York Transportation Development Corporation Special Facilities Revenue Terminal 4 John F. Kennedy International Airport | 5.00 | 12-1-2032 | 400,000 | 419,774 | |
| Industrial development revenue: 1.02% | |||||
| New York Transportation Development Corporation Special Facilities Revenue Delta Air Lines Incorporated LaGuardia Airport Terminals C&D Redevelopment | 5.00 | 1-1-2029 | 5,000,000 | 5,125,256 | |
| 5,545,030 | |||||
| Texas: 0.60% | |||||
| Industrial development revenue: 0.60% | |||||
| Houston TX Airport System AMT Revenue Refunding Bond United Airlines Incorporated Terminal E Project | 5.00 | 7-1-2029 | 3,000,000 | 3,004,882 | |
| Total Municipal obligations (Cost $491,838,058) | 479,612,311 |
| Yield | Shares | ||||
| Short-term investments: 5.25% | |||||
| Investment companies: 5.25% | |||||
| Allspring Municipal Cash Management Money Market Fund Institutional Class ♠∞## | 0.85 | 26,491,921 | 26,507,817 | ||
| Total Short-term investments (Cost $26,506,766) | 26,507,817 | ||||
| Total investments in securities (Cost $519,344,824) | 100.52% | 507,120,128 | |||
| Other assets and liabilities, net | (0.52) | (2,647,186) | |||
| Total net assets | 100.00% | $504,472,942 |
| 144A | The security may be resold in transactions exempt from registration, normally to qualified institutional buyers, pursuant to Rule 144A under the Securities Act of 1933. |
| ø | Variable rate demand notes are subject to a demand feature which reduces the effective maturity. The maturity date shown represents the final maturity date of the security. The interest rate is determined and reset by the issuer daily, weekly, or monthly depending upon the terms of the security. The rate shown is the rate in effect at period end. |
| ± | Variable rate investment. The rate shown is the rate in effect at period end. |
| ¤ | The security is issued in zero coupon form with no periodic interest payments. |
| € | The security is an auction-rate security which has an interest rate that resets at predetermined short-term intervals through a Dutch auction. The rate shown is the rate in effect at period end. |
| ## | All or a portion of this security is segregated for when-issued securities. |
| ♠ | The issuer of the security is an affiliated person of the Fund as defined in the Investment Company Act of 1940. |
| ∞ | The rate represents the 7-day annualized yield at period end. |
| %% | The security is purchased on a when-issued basis. |
| Abbreviations: | |
| AGM | Assured Guaranty Municipal |
| AMT | Alternative minimum tax |
| BAM | Build America Mutual Assurance Company |
| BAN | Bond anticipation notes |
| CAB | Capital appreciation bond |
| CDA | Community Development Authority |
| FHLMC | Federal Home Loan Mortgage Corporation |
| FNMA | Federal National Mortgage Association |
| GO | General obligation |
| HFA | Housing Finance Authority |
| HFFA | Health Facilities Financing Authority |
| LIQ | Liquidity agreement |
| LOC | Letter of credit |
| MFHR | Multifamily housing revenue |
| NPFGC | National Public Finance Guarantee Corporation |
| PCR | Pollution control revenue |
| PFA | Public Finance Authority |
| RDA | Redevelopment Authority |
| SIFMA | Securities Industry and Financial Markets Association |
| SPA | Standby purchase agreement |
| Value, beginning of period | Purchases | Sales proceeds | Net realized gains (losses) | Net change in unrealized gains (losses) | Value, end of period | Shares, end of period | Income from affiliated securities | |
| Short-term investments | ||||||||
| Allspring Municipal Cash Management Money Market Fund Institutional Class | $19,381,265 | $315,526,372 | $(308,407,400) | $6,546 | $1,034 | $26,507,817 | 26,491,921 | $19,976 |
| Assets | |
Investments in unaffiliated securities, at value (cost $492,838,058) | $ 480,612,311 |
Investments in affiliated securities, at value (cost $26,506,766) | 26,507,817 |
Cash | 95,469 |
Receivable for interest | 5,134,447 |
Receivable for Fund shares sold | 800,814 |
Receivable for investments sold | 470,000 |
Prepaid expenses and other assets | 22,176 |
Total assets | 513,643,034 |
| Liabilities | |
Payable for when-issued transactions | 8,003,028 |
Payable for Fund shares redeemed | 725,213 |
Dividends payable | 218,652 |
Management fee payable | 144,376 |
Administration fees payable | 38,378 |
Trustees’ fees and expenses payable | 2,477 |
Distribution fee payable | 2,304 |
Accrued expenses and other liabilities | 35,664 |
Total liabilities | 9,170,092 |
Total net assets | $504,472,942 |
| Net assets consist of | |
Paid-in capital | $ 529,257,328 |
Total distributable loss | (24,784,386) |
Total net assets | $504,472,942 |
| Computation of net asset value and offering price per share | |
Net assets – Class A | $ 84,928,234 |
Shares outstanding – Class A1 | 8,465,658 |
Net asset value per share – Class A | $10.03 |
Maximum offering price per share – Class A2 | $10.23 |
Net assets – Class C | $ 3,751,127 |
Shares outstanding – Class C1 | 373,998 |
Net asset value per share – Class C | $10.03 |
Net assets – Administrator Class | $ 31,946,899 |
Shares outstanding – Administrator Class1 | 3,233,725 |
Net asset value per share – Administrator Class | $9.88 |
Net assets – Institutional Class | $ 383,846,682 |
Shares outstanding – Institutional Class1 | 38,872,816 |
Net asset value per share – Institutional Class | $9.87 |
| 1 | The Fund has an unlimited number of authorized shares. |
| 2 | Maximum offering price is computed as 100/98 of net asset value. On investments of $100,000 or more, the offering price is reduced. |
| Investment income | |
Interest | $ 11,525,326 |
Income from affiliated securities | 19,976 |
Total investment income | 11,545,302 |
| Expenses | |
Management fee | 2,056,262 |
| Administration fees | |
Class A | 157,677 |
Class C | 7,311 |
Administrator Class | 31,750 |
Institutional Class | 304,551 |
| Shareholder servicing fees | |
Class A | 246,093 |
Class C | 11,344 |
Administrator Class | 79,245 |
| Distribution fee | |
Class C | 34,031 |
Custody and accounting fees | 25,549 |
Professional fees | 66,660 |
Registration fees | 60,627 |
Shareholder report expenses | 31,333 |
Trustees’ fees and expenses | 20,033 |
Other fees and expenses | 15,600 |
Total expenses | 3,148,066 |
| Less: Fee waivers and/or expense reimbursements | |
Fund-level | (114,731) |
Class A | (25,374) |
Class C | (1,008) |
Administrator Class | (53,921) |
Net expenses | 2,953,032 |
Net investment income | 8,592,270 |
| Realized and unrealized gains (losses) on investments | |
| Net realized gains (losses) on | |
Unaffiliated securities | (3,559,404) |
Affiliated securities | 6,546 |
Net realized losses on investments | (3,552,858) |
| Net change in unrealized gains (losses) on | |
Unaffiliated securities | (31,548,096) |
Affiliated securities | 1,034 |
Net change in unrealized gains (losses) on investments | (31,547,062) |
Net realized and unrealized gains (losses) on investments | (35,099,920) |
Net decrease in net assets resulting from operations | $(26,507,650) |
| Year ended June 30, 2022 | Year ended June 30, 2021 | |||
| Operations | ||||
Net investment income | $ 8,592,270 | $ 9,419,849 | ||
Net realized gains (losses) on investments | (3,552,858) | 302,293 | ||
Net change in unrealized gains (losses) on investments | (31,547,062) | 2,444,105 | ||
Net increase (decrease) in net assets resulting from operations | (26,507,650) | 12,166,247 | ||
| Distributions to shareholders from | ||||
| Net investment income and net realized gains | ||||
Class A | (1,417,298) | (1,618,458) | ||
Class C | (31,263) | (60,821) | ||
Administrator Class | (523,074) | (574,907) | ||
Institutional Class | (6,623,021) | (7,172,560) | ||
Total distributions to shareholders | (8,594,656) | (9,426,746) | ||
| Capital share transactions | Shares | Shares | ||
| Proceeds from shares sold | ||||
Class A | 1,227,534 | 13,008,495 | 1,821,487 | 19,591,892 |
Class C | 33,146 | 337,374 | 7,218 | 77,788 |
Administrator Class | 605,760 | 6,178,113 | 174,034 | 1,843,917 |
Institutional Class | 27,358,468 | 278,656,194 | 16,339,501 | 173,081,922 |
| 298,180,176 | 194,595,519 | |||
| Reinvestment of distributions | ||||
Class A | 123,975 | 1,295,806 | 139,511 | 1,501,487 |
Class C | 2,931 | 30,594 | 5,478 | 58,942 |
Administrator Class | 50,858 | 522,681 | 54,215 | 574,491 |
Institutional Class | 401,807 | 4,129,632 | 398,495 | 4,220,626 |
| 5,978,713 | 6,355,546 | |||
| Payment for shares redeemed | ||||
Class A | (2,790,407) | (29,285,529) | (2,159,775) | (23,256,332) |
Class C | (169,911) | (1,775,351) | (623,921) | (6,706,947) |
Administrator Class | (469,763) | (4,841,204) | (651,239) | (6,902,732) |
Institutional Class | (26,317,874) | (269,536,298) | (15,425,954) | (163,379,634) |
| (305,438,382) | (200,245,645) | |||
Net increase (decrease) in net assets resulting from capital share transactions | (1,279,493) | 705,420 | ||
Total increase (decrease) in net assets | (36,381,799) | 3,444,921 | ||
| Net assets | ||||
Beginning of period | 540,854,741 | 537,409,820 | ||
End of period | $ 504,472,942 | $ 540,854,741 | ||
| Year ended June 30 | |||||
| Class A | 2022 | 2021 | 2020 | 2019 | 2018 |
Net asset value, beginning of period | $10.76 | $10.71 | $10.76 | $10.61 | $10.79 |
Net investment income | 0.15 1 | 0.16 | 0.19 | 0.20 | 0.19 |
Net realized and unrealized gains (losses) on investments | (0.73) | 0.05 | (0.05) | 0.15 | (0.18) |
Total from investment operations | (0.58) | 0.21 | 0.14 | 0.35 | 0.01 |
| Distributions to shareholders from | |||||
Net investment income | (0.15) | (0.16) | (0.19) | (0.20) | (0.19) |
Net asset value, end of period | $10.03 | $10.76 | $10.71 | $10.76 | $10.61 |
Total return2 | (5.42)% | 1.99% | 1.30% | 3.33% | 0.05% |
| Ratios to average net assets (annualized) | |||||
Gross expenses | 0.85% | 0.85% | 0.85% | 0.85% | 0.84% |
Net expenses | 0.80% | 0.80% | 0.80% | 0.80% | 0.80% |
Net investment income | 1.44% | 1.51% | 1.76% | 1.87% | 1.73% |
| Supplemental data | |||||
Portfolio turnover rate | 32% | 18% | 27% | 11% | 45% |
Net assets, end of period (000s omitted) | $84,928 | $106,602 | $108,189 | $101,765 | $119,657 |
| 1 | Calculated based upon average shares outstanding |
| 2 | Total return calculations do not include any sales charges. |
| Year ended June 30 | |||||
| Class C | 2022 | 2021 | 2020 | 2019 | 2018 |
Net asset value, beginning of period | $10.76 | $10.71 | $10.76 | $10.61 | $10.79 |
Net investment income | 0.07 1 | 0.08 1 | 0.11 1 | 0.12 | 0.11 |
Net realized and unrealized gains (losses) on investments | (0.73) | 0.05 | (0.05) | 0.15 | (0.18) |
Total from investment operations | (0.66) | 0.13 | 0.06 | 0.27 | (0.07) |
| Distributions to shareholders from | |||||
Net investment income | (0.07) | (0.08) | (0.11) | (0.12) | (0.11) |
Net asset value, end of period | $10.03 | $10.76 | $10.71 | $10.76 | $10.61 |
Total return2 | (6.13)% | 1.23% | 0.54% | 2.56% | (0.70)% |
| Ratios to average net assets (annualized) | |||||
Gross expenses | 1.59% | 1.59% | 1.60% | 1.60% | 1.59% |
Net expenses | 1.55% | 1.55% | 1.55% | 1.55% | 1.55% |
Net investment income | 0.68% | 0.75% | 1.01% | 1.12% | 0.98% |
| Supplemental data | |||||
Portfolio turnover rate | 32% | 18% | 27% | 11% | 45% |
Net assets, end of period (000s omitted) | $3,751 | $5,464 | $11,981 | $19,929 | $26,868 |
| 1 | Calculated based upon average shares outstanding |
| 2 | Total return calculations do not include any sales charges. |
| Year ended June 30 | |||||
| Administrator Class | 2022 | 2021 | 2020 | 2019 | 2018 |
Net asset value, beginning of period | $10.60 | $10.55 | $10.60 | $10.45 | $10.63 |
Net investment income | 0.17 1 | 0.18 1 | 0.21 1 | 0.22 | 0.20 1 |
Net realized and unrealized gains (losses) on investments | (0.72) | 0.05 | (0.05) | 0.15 | (0.18) |
Total from investment operations | (0.55) | 0.23 | 0.16 | 0.37 | 0.02 |
| Distributions to shareholders from | |||||
Net investment income | (0.17) | (0.18) | (0.21) | (0.22) | (0.20) |
Net asset value, end of period | $9.88 | $10.60 | $10.55 | $10.60 | $10.45 |
Total return | (5.24)% | 2.21% | 1.50% | 3.56% | 0.23% |
| Ratios to average net assets (annualized) | |||||
Gross expenses | 0.79% | 0.79% | 0.78% | 0.79% | 0.78% |
Net expenses | 0.60% | 0.60% | 0.60% | 0.60% | 0.60% |
Net investment income | 1.65% | 1.71% | 1.95% | 2.07% | 1.93% |
| Supplemental data | |||||
Portfolio turnover rate | 32% | 18% | 27% | 11% | 45% |
Net assets, end of period (000s omitted) | $31,947 | $32,294 | $36,591 | $108,484 | $133,581 |
| 1 | Calculated based upon average shares outstanding |
| Year ended June 30 | |||||
| Institutional Class | 2022 | 2021 | 2020 | 2019 | 2018 |
Net asset value, beginning of period | $10.59 | $10.54 | $10.59 | $10.44 | $10.62 |
Net investment income | 0.18 | 0.19 | 0.22 | 0.23 | 0.21 |
Net realized and unrealized gains (losses) on investments | (0.72) | 0.05 | (0.05) | 0.15 | (0.18) |
Total from investment operations | (0.54) | 0.24 | 0.17 | 0.38 | 0.03 |
| Distributions to shareholders from | |||||
Net investment income | (0.18) | (0.19) | (0.22) | (0.23) | (0.21) |
Net asset value, end of period | $9.87 | $10.59 | $10.54 | $10.59 | $10.44 |
Total return | (5.15)% | 2.31% | 1.60% | 3.66% | 0.33% |
| Ratios to average net assets (annualized) | |||||
Gross expenses | 0.52% | 0.52% | 0.52% | 0.52% | 0.51% |
Net expenses | 0.50% | 0.50% | 0.50% | 0.50% | 0.50% |
Net investment income | 1.74% | 1.81% | 2.06% | 2.17% | 2.03% |
| Supplemental data | |||||
Portfolio turnover rate | 32% | 18% | 27% | 11% | 45% |
Net assets, end of period (000s omitted) | $383,847 | $396,495 | $380,649 | $322,273 | $325,973 |
| Gross unrealized gains | $ 2,451,889 |
| Gross unrealized losses | (14,736,687) |
| Net unrealized losses | $(12,284,798) |
| ■ | Level 1 – quoted prices in active markets for identical securities |
| ■ | Level 2 – other significant observable inputs (including quoted prices for similar securities, interest rates, prepayment speeds, credit risk, etc.) |
| ■ | Level 3 – significant unobservable inputs (including the Fund’s own assumptions in determining the fair value of investments) |
| Quoted prices (Level 1) | Other significant observable inputs (Level 2) | Significant unobservable inputs (Level 3) | Total | |
| Assets | ||||
| Investments in: | ||||
| Closed end municipal bond fund obligations | $ 0 | $ 1,000,000 | $0 | $ 1,000,000 |
| Municipal obligations | 0 | 479,612,311 | 0 | 479,612,311 |
| Short-term investments | ||||
| Investment companies | 26,507,817 | 0 | 0 | 26,507,817 |
| Total assets | $26,507,817 | $480,612,311 | $0 | $507,120,128 |
| Average daily net assets | Management fee |
| First $500 million | 0.400% |
| Next $500 million | 0.375 |
| Next $2 billion | 0.350 |
| Next $2 billion | 0.325 |
| Next $5 billion | 0.290 |
| Over $10 billion | 0.280 |
| Class-level administration fee | |
| Class A | 0.16% |
| Class C | 0.16 |
| Administrator Class | 0.10 |
| Institutional Class | 0.08 |
| Expense ratio caps | |
| Class A | 0.80% |
| Class C | 1.55 |
| Administrator Class | 0.60 |
| Institutional Class | 0.50 |
| Undistributed tax-exempt income | Unrealized losses | Capital loss carryforward |
| $1,028,699 | $(12,284,798) | $(13,309,635) |
Allspring Funds Trust:

| Name and year of birth | Position held and length of service* | Principal occupations during past five years or longer | Current other public company or investment company directorships |
| William R. Ebsworth (Born 1957) | Trustee, since 2015 | Retired. From 1984 to 2013, equities analyst, portfolio manager, research director and chief investment officer at Fidelity Management and Research Company in Boston, Tokyo, and Hong Kong, and retired in 2013 as Chief Investment Officer of Fidelity Strategic Advisers, Inc. where he led a team of investment professionals managing client assets. Prior thereto, Board member of Hong Kong Securities Clearing Co., Hong Kong Options Clearing Corp., the Thailand International Fund, Ltd., Fidelity Investments Life Insurance Company, and Empire Fidelity Investments Life Insurance Company. Audit Committee Chair and Investment Committee Chair of the Vincent Memorial Hospital Endowment (non-profit organization). Mr. Ebsworth is a CFA® charterholder. | N/A |
| Jane A. Freeman (Born 1953) | Trustee, since 2015; Chair Liaison, since 2018 | Retired. From 2012 to 2014 and 1999 to 2008, Chief Financial Officer of Scientific Learning Corporation. From 2008 to 2012, Ms. Freeman provided consulting services related to strategic business projects. Prior to 1999, Portfolio Manager at Rockefeller & Co. and Scudder, Stevens & Clark. Board member of the Harding Loevner Funds from 1996 to 2014, serving as both Lead Independent Director and chair of the Audit Committee. Board member of the Russell Exchange Traded Funds Trust from 2011 to 2012 and the chair of the Audit Committee. Ms. Freeman is also an inactive Chartered Financial Analyst. | N/A |
| Isaiah Harris, Jr. (Born 1952) | Trustee, since 2009; Audit Committee Chair, since 2019 | Retired. Chairman of the Board of CIGNA Corporation from 2009 to 2021, and Director from 2005 to 2008. From 2003 to 2011, Director of Deluxe Corporation. Prior thereto, President and CEO of BellSouth Advertising and Publishing Corp. from 2005 to 2007, President and CEO of BellSouth Enterprises from 2004 to 2005 and President of BellSouth Consumer Services from 2000 to 2003. Emeritus member of the Iowa State University Foundation Board of Governors. Emeritus Member of the Advisory Board of Iowa State University School of Business. Advisory Board Member, Palm Harbor Academy (private school). Advisory Board Member, Fellowship of Christian Athletes. Mr. Harris is a certified public accountant (inactive status). | N/A |
| David F. Larcker (Born 1950) | Trustee, since 2009 | James Irvin Miller Professor of Accounting at the Graduate School of Business (Emeritus), Stanford University, Director of the Corporate Governance Research Initiative and Senior Faculty of The Rock Center for Corporate Governance since 2006. From 2005 to 2008, Professor of Accounting at the Graduate School of Business, Stanford University. Prior thereto, Ernst & Young Professor of Accounting at The Wharton School, University of Pennsylvania from 1985 to 2005. | N/A |
| Name and year of birth | Position held and length of service* | Principal occupations during past five years or longer | Current other public company or investment company directorships |
| Olivia S. Mitchell (Born 1953) | Trustee, since 2006; Nominating and Governance Committee Chair, since 2018 | International Foundation of Employee Benefit Plans Professor since 1993, Wharton School of the University of Pennsylvania. Director of Wharton’s Pension Research Council and Boettner Center on Pensions & Retirement Research, and Research Associate at the National Bureau of Economic Research. Previously taught at Cornell University from 1978 to 1993. | N/A |
| Timothy J. Penny (Born 1951) | Trustee, since 1996; Chair, since 2018 | President and Chief Executive Officer of Southern Minnesota Initiative Foundation, a non-profit organization, since 2007. Member of the Board of Trustees of NorthStar Education Finance, Inc., a non-profit organization, since 2007. | N/A |
| James G. Polisson (Born 1959) | Trustee, since 2018 | Retired. Chief Marketing Officer, Source (ETF) UK Services, Ltd, from 2015 to 2017. From 2012 to 2015, Principal of The Polisson Group, LLC, a management consulting, corporate advisory and principal investing company. Chief Executive Officer and Managing Director at Russell Investments, Global Exchange Traded Funds from 2010 to 2012. Managing Director of Barclays Global Investors from 1998 to 2010 and Global Chief Marketing Officer for iShares and Barclays Global Investors from 2000 to 2010. Trustee of the San Francisco Mechanics’ Institute, a non-profit organization, from 2013 to 2015. Board member of the Russell Exchange Traded Fund Trust from 2011 to 2012. Director of Barclays Global Investors Holdings Deutschland GmbH from 2006 to 2009. Mr. Polisson is an attorney and has a retired status with the Massachusetts and District of Columbia Bar Associations. | N/A |
| Pamela Wheelock (Born 1959) | Trustee, since January 2020; previously Trustee from January 2018 to July 2019 | Board member of the Destination Medical Center Economic Development Agency, Rochester, Minnesota since 2019. Interim President of the McKnight Foundation from January to September 2020. McKnight Foundation Consultant, November 2020 to February 2021. Acting Commissioner, Minnesota Department of Human Services, July 2019 through September 2019. Consultant (part-time), Minnesota Department of Human Services, October 2019 through December 2019. Chief Operating Officer, Twin Cities Habitat for Humanity from 2017 to 2019. Vice President of University Services, University of Minnesota from 2012 to 2016. Prior thereto, on the Board of Directors, Governance Committee and Finance Committee for the Minnesota Philanthropy Partners (Saint Paul Foundation) from 2012 to 2018, Interim Chief Executive Officer of Blue Cross Blue Shield of Minnesota from 2011 to 2012, Chairman of the Board from 2009 to 2012 and Board Director from 2003 to 2015. Vice President, Leadership and Community Engagement, Bush Foundation, Saint Paul, Minnesota (a private foundation) from 2009 to 2011. Executive Vice President and Chief Financial Officer, Minnesota Sports and Entertainment from 2004 to 2009 and Senior Vice President from 2002 to 2004. Executive Vice President of the Minnesota Wild Foundation from 2004 to 2008. Commissioner of Finance, State of Minnesota, from 1999 to 2002. Currently Board Chair of the Minnesota Wild Foundation since 2010. | N/A |
| Name and year of birth | Position held and length of service | Principal occupations during past five years or longer |
| Andrew Owen (Born 1960) | President, since 2017 | President, Chief Executive Officer and Director of Allspring Funds Management, LLC since 2017 and co-president of Galliard Capital Management, LLC, an affiliate of Allspring Funds Management, LLC, since 2019. Prior thereto, Head of Affiliated Managers, Allspring Global Investments, from 2014 to 2019 and Executive Vice President responsible for marketing, investments and product development for Allspring Funds Management, LLC, from 2009 to 2014. In addition, Mr. Owen was an Executive Vice President of Wells Fargo & Company from 2014 to 2021. |
| Jeremy DePalma (Born 1974) | Treasurer, since 2012 (for certain funds in the Fund Complex); since 2021 (for the remaining funds in the Fund Complex) | Senior Vice President of Allspring Funds Management, LLC since 2009. Senior Vice President of Evergreen Investment Management Company, LLC from 2008 to 2010 and head of the Fund Reporting and Control Team within Fund Administration from 2005 to 2010. |
| Kate McKinley (Born 1977) | Chief Legal Officer, since 2021 | Chief Legal Officer of Allspring Global Investments since 2021. Prior thereto, held various roles at State Street Global Advisors beginning in 2010, including serving as Senior Vice President and General Counsel from 2019 to 2021, and Chief Operating Officer of the Institutional Client Group from 2016 - 2019. Prior to working at State Street Global Advisors served as Assistant General Counsel for Bank of America Corporation from 2005 to 2010 and as an Associate at WilmerHale from 2002 to 2005. |
| Christopher Baker (Born 1976) | Chief Compliance Officer, since 2022 | Global Chief Compliance Officer for Allspring Global Investments since 2022. Prior thereto, Chief Compliance Officer for State Street Global Advisors from 2018 to 2021. Senior Compliance Officer for the State Street divisions of Alternative Investment Solutions, Sector Solutions, and Global Marketing from 2015 to 2018. From 2010 to 2015 Vice President, Global Head of Investment and Marketing Compliance for State Street Global Advisors. |
| Matthew Prasse (Born 1983) | Secretary, since 2021 | Senior Counsel of the Allspring Legal Department since 2021. Senior Counsel of the Wells Fargo Legal Department from 2018 to 2021. Previously, Counsel for Barings LLC from 2015 to 2018. Prior to joining Barings, Associate at Morgan, Lewis & Bockius LLP from 2008 to 2015. |
P.O. Box 219967
Kansas City, MO 64121-9967

1-800-222-8222 or visit the Fund's website at allspringglobal.com. Read the prospectus carefully before you invest or send money.
A248/AR248 06-22

California Tax-Free Fund
| 2 | |
| 6 | |
| 11 | |
| 12 | |
| Financial statements | |
| 27 | |
| 28 | |
| 29 | |
| 30 | |
| 34 | |
| 39 | |
| 40 |

| 1 | The S&P 500 Index consists of 500 stocks chosen for market size, liquidity, and industry group representation. It is a market-value-weighted index with each stock's weight in the index proportionate to its market value. You cannot invest directly in an index. |
| 2 | The Morgan Stanley Capital International (MSCI) All Country World Index (ACWI) ex USA Index (Net) is a free-float-adjusted market-capitalization-weighted index that is designed to measure the equity market performance of developed and emerging markets, excluding the U.S. Source: MSCI. MSCI makes no express or implied warranties or representations and shall have no liability whatsoever with respect to any MSCI data contained herein. The MSCI data may not be further redistributed or used as a basis for other indexes or any securities or financial products. This report is not approved, reviewed, or produced by MSCI. You cannot invest directly in an index. |
| 3 | The MSCI Emerging Markets (EM) Index (Net) (USD) is a free-float-adjusted market-capitalization-weighted index that is designed to measure equity market performance of emerging markets. You cannot invest directly in an index. |
| 4 | The Bloomberg U.S. Aggregate Bond Index is a broad-based benchmark that measures the investment-grade, U.S.-dollar-denominated, fixed-rate taxable bond market, including Treasuries, government-related and corporate securities, mortgage-backed securities (agency fixed-rate and hybrid adjustable-rate mortgage pass-throughs), asset-backed securities, and commercial mortgage-backed securities. You cannot invest directly in an index. |
| 5 | The Bloomberg Global Aggregate ex-USD Index (unhedged) is an unmanaged index that provides a broad-based measure of the global investment-grade fixed-income markets excluding the U.S.-dollar-denominated debt market. You cannot invest directly in an index. |
| 6 | The Bloomberg Municipal Bond Index is an unmanaged index composed of long-term tax-exempt bonds with a minimum credit rating of Baa. You cannot invest directly in an index. |
| 7 | The ICE BofA U.S. High Yield Index is a market-capitalization-weighted index of domestic and Yankee high-yield bonds. The index tracks the performance of high-yield securities traded in the U.S. bond market. You cannot invest directly in an index. Copyright 2022. ICE Data Indices, LLC. All rights reserved. |
| 1 | The Consumer Price Index (CPI) is a measure of the average change over time in the prices paid by urban consumers for a market basket of consumer goods and services. You cannot invest directly in an index. |
| 2 | The MSCI ACWI (Net) is a free-float-adjusted market-capitalization-weighted index that is designed to measure the equity market performance of developed and emerging markets. You cannot invest directly in an index. |

President
Allspring Funds
| Investment objective | The Fund seeks current income exempt from federal income tax and California individual income tax. |
| Manager | Allspring Funds Management, LLC |
| Subadviser | Allspring Global Investments, LLC |
| Portfolio managers | Terry J. Goode, Kim Nakahara, Adrian Van Poppel |
| Average annual total returns (%) as of June 30, 2022 | |||||||||||
| Including sales charge | Excluding sales charge | Expense ratios1 (%) | |||||||||
| Inception date | 1 year | 5 year | 10 year | 1 year | 5 year | 10 year | Gross | Net 2 | |||
| Class A (SCTAX) | 10-6-1988 | -13.94 | -0.12 | 1.98 | -9.90 | 0.81 | 2.46 | 0.81 | 0.75 | ||
| Class C (SCTCX) | 7-1-1993 | -11.58 | 0.05 | 1.84 | -10.58 | 0.05 | 1.84 | 1.56 | 1.50 | ||
| Administrator Class (SGCAX) | 12-15-1997 | – | – | – | -9.77 | 1.00 | 2.66 | 0.75 | 0.55 | ||
| Institutional Class (SGTIX)3 | 10-31-2014 | – | – | – | -9.71 | 1.07 | 2.72 | 0.48 | 0.48 | ||
| Bloomberg California Municipal Bond Index4 | – | – | – | – | -8.58 | 1.43 | 2.58 | – | – | ||
| Bloomberg Municipal Bond Index5 | – | – | – | – | -8.57 | 1.51 | 2.38 | – | – | ||
| 1 | Reflects the expense ratios as stated in the most recent prospectuses. The expense ratios shown are subject to change and may differ from the annualized expense ratios shown in the financial highlights of this report. |
| 2 | The manager has contractually committed through October 31, 2022, to waive fees and/or reimburse expenses to the extent necessary to cap total annual fund operating expenses after fee waivers at 0.75% for Class A, 1.50% for Class C, 0.55% for Administrator Class, and 0.48% for Institutional Class. Brokerage commissions, stamp duty fees, interest, taxes, acquired fund fees and expenses (if any), and extraordinary expenses are excluded from the expense caps. Prior to or after the commitment expiration date, the caps may be increased or the commitment to maintain the caps may be terminated only with the approval of the Board of Trustees. Without these caps, the Fund’s returns would have been lower. The expense ratio paid by an investor is the net expense ratio (the total annual fund operating expenses after fee waivers) as stated in the prospectuses. |
| 3 | Historical performance shown for the Institutional Class shares prior to their inception reflects the performance of the Administrator Class shares, and includes the higher expenses applicable to the Administrator Class shares. If these expenses had not been included, returns for the Institutional Class shares would be higher. |
| 4 | The Bloomberg California Municipal Bond Index is the California component of the Bloomberg Municipal Bond Index. You cannot invest directly in an index. |
| 5 | The Bloomberg Municipal Bond Index is an unmanaged index composed of long-term tax-exempt bonds with a minimum credit rating of Baa. You cannot invest directly in an index. |

| 1 | The chart compares the performance of Class A shares for the most recent ten years with the Bloomberg California Municipal Bond Index and Bloomberg Municipal Bond Index. The chart assumes a hypothetical investment of $10,000 in Class A shares and reflects all operating expenses and assumes the maximum initial sales charge of 4.50%. |
| ■ | The Fund underperformed its primary benchmark, the Bloomberg California Municipal Bond Index, for the 12-month period that ended June 30, 2022. |
| ■ | The primary drivers that detracted from performance were the Fund’s longer duration relative to the index, overweight to the long bond maturity segment, and credit quality, with an overweight to the weaker-performing A-rated and BBB-rated categories. |
| ■ | Overall security selection slightly detracted from performance but was a contributor in the leasing, water/sewer, and transportation sectors. An overweight to premium coupons also helped performance. |
| ■ | Sector allocation was the largest contributor, with underweights to the weaker-performing local general obligation (GO) and transportation sectors, which both lagged the index. |
| Credit quality as of June 30, 20221 |
| 1 | The credit quality distribution of portfolio holdings reflected in the chart is based on ratings from Standard & Poor’s, Moody’s Investors Service, and/or Fitch Ratings Ltd. Credit quality ratings apply to the underlying holdings of the Fund and not to the Fund itself. The percentages of the portfolio with the ratings depicted in the chart are calculated based on the market value of fixed income securities held by the Fund. If a security was rated by all three rating agencies, the middle rating was utilized. If rated by two of the three rating agencies, the lower rating was utilized, and if rated by one of the rating agencies, that rating was utilized. Standard & Poor’s rates the creditworthiness of bonds, ranging from AAA (highest) to D (lowest). Ratings from A to CCC may be modified by the addition of a plus (+) or minus (-) sign to show relative standing within the rating categories. Standard & Poor’s rates the creditworthiness of short-term notes from SP-1 (highest) to SP-3 (lowest). Moody’s rates the creditworthiness of bonds, ranging from Aaa (highest) to C (lowest). Ratings Aa to B may be modified by the addition of a number 1 (highest) to 3 (lowest) to show relative standing within the ratings categories. Moody’s rates the creditworthiness of short-term U.S. tax-exempt municipal securities from MIG 1/VMIG 1 (highest) to SG (lowest). Fitch rates the creditworthiness of bonds, ranging from AAA (highest) to D (lowest). Credit quality distribution is subject to change and may have changed since the date specified. |
| Effective maturity distribution as of June 30, 20221 |
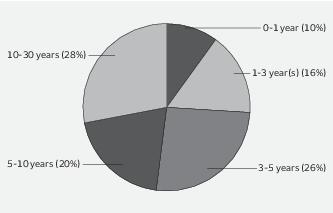
| 1 | Figures represent the percentage of the Fund's long-term investments. These amounts are subject to change and may have changed since the date specified. |
| Beginning account value 1-1-2022 | Ending account value 6-30-2022 | Expenses paid during the period1 | Annualized net expense ratio | |
| Class A | ||||
| Actual | $1,000.00 | $ 898.16 | $3.53 | 0.75% |
| Hypothetical (5% return before expenses) | $1,000.00 | $1,021.08 | $3.76 | 0.75% |
| Class C | ||||
| Actual | $1,000.00 | $ 894.57 | $7.05 | 1.50% |
| Hypothetical (5% return before expenses) | $1,000.00 | $1,017.36 | $7.50 | 1.50% |
| Administrator Class | ||||
| Actual | $1,000.00 | $ 898.49 | $2.59 | 0.55% |
| Hypothetical (5% return before expenses) | $1,000.00 | $1,022.07 | $2.76 | 0.55% |
| Institutional Class | ||||
| Actual | $1,000.00 | $ 898.80 | $2.26 | 0.48% |
| Hypothetical (5% return before expenses) | $1,000.00 | $1,022.41 | $2.41 | 0.48% |
| Principal | Value | ||||
| Closed end municipal bond fund obligations: 0.47% | |||||
| California: 0.47% | |||||
| Nuveen California AMT-Free Quality Municipal Income Fund MuniFund Preferred Shares Series A (50 shares) 1.41% 144Aø | $ 5,000,000 | $ 5,000,000 | |||
| Total Closed end municipal bond fund obligations (Cost $5,000,000) | 5,000,000 |
| Interest rate | Maturity date | ||||
| Municipal obligations: 97.10% | |||||
| California: 94.90% | |||||
| Airport revenue: 6.59% | |||||
| California Municipal Finance Authority AMT Senior Lien Linxs Apartment Project Series A | 5.00% | 12-31-2043 | 5,730,000 | 5,779,527 | |
| Los Angeles CA Department of Airports AMT Subordinated Bond 2018 Series D | 5.00 | 5-15-2048 | 2,520,000 | 2,643,449 | |
| Los Angeles CA Department of Airports AMT Subordinated Bond 2022 Series A | 4.00 | 5-15-2049 | 17,045,000 | 16,072,576 | |
| Los Angeles CA Department of Airports AMT Subordinated Bond Series A | 4.00 | 5-15-2044 | 3,500,000 | 3,362,264 | |
| Los Angeles CA Department of Airports AMT Subordinated Bond Series A | 5.00 | 5-15-2047 | 5,000,000 | 5,183,191 | |
| Sacramento County CA Airport System Refunding Bond AMT Senior Series C | 5.00 | 7-1-2037 | 7,300,000 | 7,670,864 | |
| Sacramento County CA Airport System Refunding Bond AMT Senior Series C | 5.00 | 7-1-2038 | 3,000,000 | 3,146,862 | |
| San Diego County CA Regional Airport Authority Revenue Refunding Subordinated Bond Series A | 5.00 | 7-1-2044 | 3,045,000 | 3,210,320 | |
| San Francisco CA City & County Airport Commission San Francisco International Airport Series 2022A | 4.00 | 5-1-2052 | 1,500,000 | 1,377,623 | |
| San Francisco CA City & County Airport Commission San Francisco International Airport Series A | 5.00 | 5-1-2047 | 7,715,000 | 7,944,573 | |
| San Francisco CA City & County Airport Commission San Francisco International Airport Series E | 5.00 | 5-1-2050 | 8,040,000 | 8,347,515 | |
| San Jose CA Airport AMT Refunding Bond Series A | 5.00 | 3-1-2047 | 4,000,000 | 4,115,316 | |
| San Jose CA Airport Refunding Bond Series B | 5.00 | 3-1-2042 | 1,750,000 | 1,830,528 | |
| 70,684,608 | |||||
| Education revenue: 7.71% | |||||
| California CDA Refunding Bond California Baptist University Series A 144A | 5.00 | 11-1-2032 | 1,135,000 | 1,187,755 | |
| California CDA Refunding Bond California Baptist University Series A 144A | 5.00 | 11-1-2041 | 2,875,000 | 2,977,960 | |
| California Educational Facilities Authority Loma Linda University Series A | 5.00 | 4-1-2042 | 2,645,000 | 2,808,641 | |
| California Educational Facilities Authority Revenue Bonds Series 2022A | 4.00 | 12-1-2050 | 2,735,000 | 2,395,596 | |
| California Educational Facilities Authority Stanford University Series V-2 | 5.00 | 4-1-2051 | 4,000,000 | 4,853,267 | |
| California Financial Authority Charter School Palmdale Aerospace Academy Project 144A | 5.00 | 7-1-2046 | 1,670,000 | 1,620,051 | |
| California Municipal Finance Authority California Baptist University Series A 144A | 5.00 | 11-1-2025 | 850,000 | 876,762 |
| Interest rate | Maturity date | Principal | Value | ||
| Education revenue (continued) | |||||
| California Municipal Finance Authority Charter School Albert Einstein Academies Project Series A | 6.75% | 8-1-2033 | $ 1,525,000 | $ 1,605,163 | |
| California Municipal Finance Authority Charter School Albert Einstein Academies Project Series A | 7.13 | 8-1-2043 | 1,000,000 | 1,056,200 | |
| California Municipal Finance Authority Charter School Palmdale Aerospace Academy Project 144A | 5.00 | 7-1-2041 | 1,250,000 | 1,236,399 | |
| California Municipal Finance Authority Education Revenue Bond Literacy First Charter Schools | 5.00 | 12-1-2039 | 1,390,000 | 1,434,330 | |
| California Municipal Finance Authority Education Revenue Bond Stream Charter School Project 144A | 5.00 | 6-15-2041 | 925,000 | 857,615 | |
| California Municipal Finance Authority Education Revenue Bond Stream Charter School Project Series A 144A | 5.00 | 6-15-2051 | 1,265,000 | 1,118,990 | |
| California Municipal Finance Authority Refunding Bond Biola University Incorporated | 5.00 | 10-1-2035 | 600,000 | 629,379 | |
| California Municipal Finance Authority Revenue | 4.00 | 10-1-2046 | 1,930,000 | 1,776,244 | |
| California Municipal Finance Authority Revenue | 4.00 | 10-1-2051 | 1,150,000 | 1,040,171 | |
| California Municipal Finance Authority Revenue Refunding Bond University Pacific Series A | 4.00 | 11-1-2042 | 1,600,000 | 1,511,257 | |
| California School Finance Authority Bright Star Schools Obligation Group 144A | 5.00 | 6-1-2047 | 1,000,000 | 985,938 | |
| California School Finance Authority Bright Star Schools Obligation Group 144A | 5.00 | 6-1-2054 | 1,000,000 | 973,521 | |
| California School Finance Authority Charter School Revenue Aspire Public Schools Series 2021A 144A | 4.00 | 8-1-2051 | 775,000 | 687,576 | |
| California School Finance Authority Charter School Revenue Aspire Public Schools 144A | 5.00 | 8-1-2050 | 3,540,000 | 3,647,219 | |
| California School Finance Authority Charter School Revenue Girls Athletic Leadership Schools 144A | 4.00 | 6-1-2051 | 905,000 | 673,822 | |
| California School Finance Authority Charter School Revenue Lifeline Education Charter School Project 144A | 5.00 | 7-1-2045 | 800,000 | 780,774 | |
| California School Finance Authority Classical Academies Vista Project 144A | 4.00 | 10-1-2046 | 1,250,000 | 1,069,906 | |
| California School Finance Authority Green Dot Public Schools Projects 144A | 4.00 | 8-1-2025 | 475,000 | 482,008 | |
| California School Finance Authority Green Dot Public Schools Projects 144A | 5.00 | 8-1-2035 | 2,525,000 | 2,583,995 | |
| California School Finance Authority KIPP Louisiana School Projects Series A 144A | 5.00 | 7-1-2035 | 1,000,000 | 1,024,265 | |
| California School Finance Authority Rocketship Education Series A 144A | 5.00 | 6-1-2036 | 945,000 | 961,558 | |
| California School Finance Authority Rocketship Education Series A 144A | 5.00 | 6-1-2046 | 2,100,000 | 2,119,670 | |
| California School Finance Authority Santa Clarita Valley International School Project 144A | 4.00 | 6-1-2041 | 500,000 | 429,341 | |
| California School Finance Authority Santa Clarita Valley International School Project 144A | 4.00 | 6-1-2051 | 650,000 | 521,358 | |
| California School Finance Authority School Facilities Revenue Granada Hills Charter 144A | 4.00 | 7-1-2048 | 680,000 | 574,617 | |
| California University Systemwide Refunding Bond Series A | 4.00 | 11-1-2038 | 8,000,000 | 8,024,822 | |
| California University Systemwide Refunding Bond Series A | 5.00 | 11-1-2045 | 6,400,000 | 6,712,607 | |
| Fullerton CA PFA Refunding Bond | 4.00 | 2-1-2051 | 2,500,000 | 2,275,899 | |
| Trustees of the California State University Systemwide Revenue Bonds Series 2017A | 5.00 | 11-1-2047 | 1,000,000 | 1,057,399 | |
| University of California Series AI | 5.00 | 5-15-2038 | 2,000,000 | 2,046,909 |
| Interest rate | Maturity date | Principal | Value | ||
| Education revenue (continued) | |||||
| University of California Series K | 4.00% | 5-15-2046 | $ 5,295,000 | $ 5,178,909 | |
| University of California Series M | 4.00 | 5-15-2047 | 11,155,000 | 10,882,035 | |
| 82,679,928 | |||||
| GO revenue: 23.11% | |||||
| Alvord CA Unified School District Election of 2012 Series A (AGM Insured) | 5.25 | 8-1-2037 | 1,620,000 | 1,681,583 | |
| Barstow CA Unified School District Election of 2016 Series C (AGM Insured) | 5.00 | 8-1-2050 | 1,195,000 | 1,310,378 | |
| Bassett CA Unified School District Refunding Bond Series B (BAM Insured) | 5.00 | 8-1-2027 | 1,050,000 | 1,132,032 | |
| Beaumont CA Unified School District Election of 2008 Series D (BAM Insured) | 5.25 | 8-1-2044 | 2,000,000 | 2,257,241 | |
| California Various Purposes | 4.00 | 3-1-2050 | 6,000,000 | 5,886,329 | |
| California Various Purposes | 5.00 | 9-1-2032 | 5,100,000 | 5,271,799 | |
| California Various Purposes (BAM Insured) | 5.00 | 9-1-2035 | 35,000,000 | 37,838,626 | |
| California Various Purposes | 5.00 | 2-1-2038 | 5,000,000 | 5,074,840 | |
| California Various Purposes | 5.00 | 10-1-2039 | 5,000,000 | 5,325,732 | |
| California Various Purposes | 5.00 | 4-1-2042 | 3,750,000 | 4,231,066 | |
| California Various Purposes | 5.00 | 8-1-2046 | 10,000,000 | 10,585,749 | |
| California Various Purposes | 5.00 | 4-1-2049 | 2,500,000 | 2,705,719 | |
| Centinela Valley CA Union High School District Election of 2008 Series B | 6.00 | 8-1-2036 | 2,500,000 | 2,611,593 | |
| Centinela Valley CA Union High School District Election of 2008 Series C | 5.00 | 8-1-2035 | 2,000,000 | 2,120,929 | |
| Cerritos CA Community College CAB Election of 2004 ¤ | 0.00 | 8-1-2029 | 1,750,000 | 1,390,835 | |
| Cerritos CA Community College CAB Election of 2004 ¤ | 0.00 | 8-1-2033 | 1,500,000 | 997,634 | |
| College of the Sequoias Tulare Area Improvement District #3 California CAB Election of 2008 Series A (AGC Insured) ¤ | 0.00 | 8-1-2024 | 1,000,000 | 948,348 | |
| Compton CA Community College CAB Election of 2002 Series C ¤ | 0.00 | 8-1-2035 | 3,445,000 | 2,026,494 | |
| Contra Costa County CA Community College District Election of 2006 | 5.00 | 8-1-2038 | 3,250,000 | 3,364,948 | |
| Delano CA Union High School Election of 2010 Series B (AGM Insured) | 5.75 | 8-1-2035 | 4,510,000 | 4,524,578 | |
| Escondido CA Union High School CAB Election of 2008 Series A (AGC Insured) ¤ | 0.00 | 8-1-2027 | 8,385,000 | 7,181,272 | |
| Escondido CA Union School District | 4.00 | 8-1-2043 | 2,150,000 | 2,098,486 | |
| Garden Grove CA Unified School District Election of 2010 Series C | 5.25 | 8-1-2037 | 2,000,000 | 2,076,028 | |
| Hayward CA Unified School District Refunding Bond | 5.00 | 8-1-2038 | 6,000,000 | 6,362,786 | |
| Inglewood CA Unified School District Election of 2012 GO Bond Series B (BAM Insured) | 5.00 | 8-1-2036 | 200,000 | 215,173 | |
| Inglewood CA Unified School District Election of 2012 GO Bond Series B (BAM Insured) | 5.00 | 8-1-2038 | 500,000 | 534,676 | |
| Lancaster CA School District Election of 2012 Series D (BAM Insured) | 4.00 | 8-1-2045 | 5,970,000 | 5,829,038 | |
| Lancaster CA School District Election of 2012 Series D (BAM Insured) | 4.00 | 8-1-2047 | 4,305,000 | 4,198,289 | |
| Long Beach CA Unified School District CAB Election of 2008 Series B ¤ | 0.00 | 8-1-2035 | 2,000,000 | 1,167,478 | |
| Long Beach CA Unified School District Election of 2016 Series B | 3.00 | 8-1-2041 | 4,650,000 | 3,976,191 | |
| Long Beach CA Unified School District Unrefunded Bond Election of 2008 Series A | 5.50 | 8-1-2026 | 95,000 | 95,284 |
| Interest rate | Maturity date | Principal | Value | ||
| GO revenue (continued) | |||||
| Los Angeles CA Community College District Refunding Bond | 4.00% | 8-1-2038 | $10,000,000 | $ 9,999,100 | |
| Lynwood CA Unified School District Election of 2012 Series A (AGM Insured) | 5.00 | 8-1-2033 | 5,000 | 5,169 | |
| Merced CA City School District Election of 2014 | 5.00 | 8-1-2045 | 1,000,000 | 1,053,185 | |
| Merced CA Union High School District CAB Series C ¤ | 0.00 | 8-1-2032 | 3,380,000 | 2,353,973 | |
| Mount San Antonio CA Community College District CAB Election of 2008 Series A ¤ | 0.00 | 8-1-2024 | 1,610,000 | 1,529,968 | |
| Norwalk-La Mirada CA Unified School District CAB Election of 2002 Series D (AGM Insured) ¤ | 0.00 | 8-1-2023 | 1,500,000 | 1,465,575 | |
| Oakland CA Unified School District Alameda (BAM Insured) | 4.00 | 8-1-2046 | 7,000,000 | 6,830,517 | |
| Oakland CA Unified School District Alameda | 5.00 | 8-1-2029 | 10,125,000 | 10,982,705 | |
| Oakland CA Unified School District Election of 2012 | 5.50 | 8-1-2023 | 260,000 | 265,965 | |
| Oakland CA Unified School District Election of 2012 Series A | 5.00 | 8-1-2040 | 3,600,000 | 3,910,312 | |
| Oxnard CA School District Election of 2012 Series D (AGM Insured) | 5.00 | 8-1-2034 | 1,695,000 | 1,838,469 | |
| Pajaro Valley CA Unified School District Election of 2012 Series A | 5.00 | 8-1-2038 | 1,700,000 | 1,760,127 | |
| Paramount CA Unified School District CAB Election of 2006 ¤ | 0.00 | 8-1-2033 | 2,500,000 | 1,648,329 | |
| Pomona CA Unified School District Series A (NPFGC Insured) | 6.55 | 8-1-2029 | 1,480,000 | 1,681,656 | |
| Poway CA Unified School District CAB Election of 2008 Improvement District 07-1-A ¤ | 0.00 | 8-1-2024 | 1,800,000 | 1,713,678 | |
| Rialto CA Unified School District CAB Election of 2010 Series A (AGM Insured) ¤ | 0.00 | 8-1-2026 | 3,320,000 | 2,943,840 | |
| Sacramento CA Unified School District Election of 2012 Series A (BAM Insured) | 5.25 | 8-1-2033 | 1,000,000 | 1,035,948 | |
| Sacramento CA Unified School District Election of 2012 Series C (AGM Insured) | 5.00 | 8-1-2033 | 2,735,000 | 2,909,437 | |
| San Bernardino County CA Community Election of 2008 Series D | 5.00 | 8-1-2045 | 2,000,000 | 2,169,285 | |
| San Bernardino County CA Unified School District Election of 2012 Series C (AGM Insured) | 5.00 | 8-1-2040 | 8,000,000 | 8,430,207 | |
| San Diego CA Community College Election of 2002 | 5.00 | 8-1-2031 | 4,000,000 | 4,141,474 | |
| San Diego CA Unified School District | 4.00 | 7-1-2047 | 2,025,000 | 1,966,175 | |
| San Gorgonio CA Memorial Healthcare Refunding Bond | 5.00 | 8-1-2032 | 1,750,000 | 1,771,067 | |
| San Gorgonio CA Memorial Healthcare Refunding Bond | 5.50 | 8-1-2028 | 2,525,000 | 2,595,124 | |
| San Joaquin CA Delta Community College District Election of 2004 Series C | 5.00 | 8-1-2033 | 3,195,000 | 3,388,184 | |
| San Joaquin CA Delta Community College District Election of 2004 Series C | 5.00 | 8-1-2034 | 3,315,000 | 3,515,439 | |
| San Jose CA Unified School District Santa Clara County | 4.00 | 8-1-2042 | 4,000,000 | 3,935,790 | |
| San Rafael CA City High School District CAB Election of 2002 Series B (NPFGC Insured) ¤ | 0.00 | 8-1-2023 | 1,260,000 | 1,231,083 | |
| San Rafael CA City High School District Election of 2015 Series C | 4.00 | 8-1-2043 | 1,500,000 | 1,464,060 | |
| Sanger CA Unified School District Refunding Bond (NPFGC Insured) | 5.60 | 8-1-2023 | 60,000 | 61,323 | |
| Santa Ana CA Unified School District CAB Election of 2008 Series B (AGC Insured) ¤ | 0.00 | 8-1-2038 | 15,000,000 | 7,617,711 | |
| Santa Rosa CA High School District Prerefunded Bond | 5.00 | 8-1-2024 | 750,000 | 752,048 | |
| Santa Rosa CA High School District Unrefunded Bond | 5.00 | 8-1-2024 | 255,000 | 255,696 | |
| Sierra Kings CA Health Care District | 5.00 | 8-1-2028 | 1,000,000 | 1,060,165 | |
| Sierra Kings CA Health Care District | 5.00 | 8-1-2032 | 1,500,000 | 1,579,080 |
| Interest rate | Maturity date | Principal | Value | ||
| GO revenue (continued) | |||||
| Sierra Kings CA Health Care District | 5.00% | 8-1-2037 | $ 1,750,000 | $ 1,832,732 | |
| Simi Valley CA Unified School District | 4.00 | 8-1-2048 | 3,250,000 | 3,167,269 | |
| Sonoma Valley CA Unified School District CAB Election of 2010 Series A ¤ | 0.00 | 8-1-2027 | 1,020,000 | 870,523 | |
| Stockton CA Unified School District Election of 2012 Series A (AGM Insured) | 5.00 | 8-1-2038 | 1,025,000 | 1,074,387 | |
| Tulare CA Local Health Care District Refunding Bond (BAM Insured) | 4.00 | 8-1-2039 | 1,850,000 | 1,790,194 | |
| Washington Township CA Health Care District Election of 2004 Series B | 5.50 | 8-1-2038 | 1,500,000 | 1,565,824 | |
| West Contra Costa CA Unified School District Election of 2005 Series B | 6.00 | 8-1-2027 | 1,080,000 | 1,260,755 | |
| Wiseburn CA School District CAB (AGC Insured) ¤ | 0.00 | 8-1-2027 | 1,525,000 | 1,306,728 | |
| 247,751,430 | |||||
| Health revenue: 16.45% | |||||
| Association of Bay Area Governments California Finance Authority for Nonprofit Corporation Insured Revenue Bond O'Connor Woods Series 2013 | 5.00 | 1-1-2043 | 5,000,000 | 5,134,548 | |
| Association of Bay Area Governments California Finance Authority for Nonprofit Corporation Insured Senior Living Revenue Bond Odd Fellows Home of California Series 2012 A | 5.00 | 4-1-2042 | 1,100,000 | 1,114,952 | |
| California CDA Adventist Health System Series A | 5.00 | 3-1-2045 | 2,500,000 | 2,581,643 | |
| California CDA Enloe Medical Center | 5.00 | 8-15-2033 | 1,650,000 | 1,769,758 | |
| California CDA Enloe Medical Center | 5.00 | 8-15-2035 | 1,000,000 | 1,070,356 | |
| California CDA Enloe Medical Center | 5.00 | 8-15-2038 | 2,000,000 | 2,123,851 | |
| California CDA Loma Linda University Medical Center Refunding Bond Series A | 5.25 | 12-1-2044 | 5,150,000 | 5,172,960 | |
| California CDA Redwoods Projects | 5.13 | 11-15-2035 | 1,500,000 | 1,567,027 | |
| California CDA Revenue Refunding Bond Adventist Health System West Series A | 5.00 | 3-1-2048 | 5,000,000 | 5,181,213 | |
| California Communities Marin General Hospital Series A | 5.00 | 8-1-2036 | 700,000 | 730,153 | |
| California Communities Marin General Hospital Series A | 5.00 | 8-1-2037 | 500,000 | 520,772 | |
| California Communities Marin General Hospital Series A | 5.00 | 8-1-2038 | 450,000 | 467,921 | |
| California HFFA | 4.00 | 11-15-2048 | 5,000,000 | 4,733,824 | |
| California HFFA | 4.00 | 11-1-2051 | 3,000,000 | 2,847,427 | |
| California HFFA | 5.00 | 11-15-2046 | 2,040,000 | 2,265,967 | |
| California HFFA | 5.00 | 11-15-2046 | 2,960,000 | 3,071,802 | |
| California HFFA City of Hope | 5.00 | 11-15-2049 | 8,000,000 | 8,152,430 | |
| California HFFA El Camino Hospital | 5.00 | 2-1-2035 | 3,000,000 | 3,216,583 | |
| California HFFA Health Kaiser Permanente Revenue Bonds Series 2006C | 5.00 | 6-1-2041 | 2,500,000 | 2,833,998 | |
| California HFFA LA Biomedical Research Institute at Harbor-UCLA Medical Center | 5.00 | 9-1-2048 | 6,095,000 | 6,178,130 | |
| California HFFA Lucile Salter Packard Children's Hospital | 4.00 | 5-15-2051 | 10,000,000 | 9,338,866 | |
| California HFFA Nevada Methodist Homes | 5.00 | 7-1-2030 | 1,830,000 | 1,929,282 | |
| California HFFA Nevada Methodist Homes | 5.00 | 7-1-2035 | 1,000,000 | 1,047,177 | |
| California HFFA Nevada Methodist Homes | 5.00 | 7-1-2045 | 4,500,000 | 4,700,534 | |
| California HFFA Refunding Bond Cedars-Sinai Medical Center Series B | 4.00 | 8-15-2039 | 10,500,000 | 10,504,229 | |
| California HFFA Refunding Bond Children's Hospital Series A | 5.00 | 8-15-2047 | 10,050,000 | 10,281,944 | |
| California HFFA Revenue Bonds CommonSpirit Health Care 2020A Series A | 4.00 | 4-1-2049 | 5,500,000 | 5,145,688 | |
| California HFFA Senior Health Services | 5.00 | 8-1-2040 | 700,000 | 744,933 |
| Interest rate | Maturity date | Principal | Value | ||
| Health revenue (continued) | |||||
| California HFFA Senior Health Services | 5.00% | 8-1-2050 | $ 1,000,000 | $ 1,049,714 | |
| California HFFA Series A | 4.00 | 11-1-2040 | 1,375,000 | 1,357,516 | |
| California HFFA Stanford Health Care Series A | 4.00 | 8-15-2050 | 11,000,000 | 10,507,305 | |
| California Municipal Finance Authority Refunding Bond Channing House Project Series A | 5.00 | 5-15-2034 | 1,000,000 | 1,089,140 | |
| California Municipal Finance Authority Refunding Bond Community Medical Centers Series A | 5.00 | 2-1-2047 | 6,625,000 | 6,849,157 | |
| California Municipal Finance Authority Refunding Bond Eisenhower Medical Center Series A | 5.00 | 7-1-2047 | 1,400,000 | 1,416,703 | |
| California Municipal Finance Authority Revenue | 4.00 | 12-1-2039 | 1,240,000 | 1,232,521 | |
| California Municipal Finance Authority Revenue | 4.00 | 9-15-2046 | 3,300,000 | 3,187,857 | |
| California Municipal Finance Authority Revenue | 4.00 | 12-1-2049 | 2,915,000 | 2,796,506 | |
| California Municipal Finance Authority Revenue | 4.00 | 9-15-2051 | 3,885,000 | 3,718,985 | |
| California Municipal Finance Authority Revenue | 5.00 | 7-1-2039 | 1,000,000 | 1,103,468 | |
| California Municipal Finance Authority Revenue | 5.00 | 7-1-2049 | 2,650,000 | 2,866,820 | |
| California Municipal Finance Authority Revenue Bonds Series 2021 Humangood California Obligated Group | 4.00 | 10-1-2049 | 2,250,000 | 2,073,473 | |
| California Municipal Finance Authority Revenue Community Health System Series 2021A | 4.00 | 2-1-2051 | 1,500,000 | 1,353,302 | |
| California PFA Refunding Bond Henry Mayo Newhall Hospital | 5.00 | 10-15-2037 | 500,000 | 516,343 | |
| California PFA Refunding Bond Henry Mayo Newhall Hospital | 5.00 | 10-15-2047 | 5,365,000 | 5,420,414 | |
| California PFA Senior Living Enso Village Project Series A 144A | 5.00 | 11-15-2051 | 1,255,000 | 1,162,302 | |
| California PFA Senior Living Enso Village Project Series A 144A | 5.00 | 11-15-2056 | 1,235,000 | 1,125,918 | |
| Palomar Health Refunding Bond | 5.00 | 11-1-2042 | 4,000,000 | 4,120,547 | |
| University of California Regents Medical Center Prerefunded Bond Series J | 5.25 | 5-15-2038 | 7,790,000 | 8,034,402 | |
| University of California Regents Medical Center Series J | 5.00 | 5-15-2033 | 2,265,000 | 2,331,239 | |
| University of California Regents Medical Center Series L | 4.00 | 5-15-2044 | 4,065,000 | 3,990,021 | |
| University of California Regents Medical Center Unrefunded Bond Series J | 5.25 | 5-15-2038 | 2,210,000 | 2,270,354 | |
| Washington Township CA Health Care District Series A | 5.00 | 7-1-2026 | 1,190,000 | 1,255,517 | |
| Washington Township CA Health Care District Series A | 5.00 | 7-1-2042 | 1,000,000 | 1,017,283 | |
| 176,274,775 | |||||
| Housing revenue: 6.67% | |||||
| California CDA Poway Retirement Housing Foundation Housing Incorporated Series A | 5.25 | 11-15-2035 | 1,500,000 | 1,554,042 | |
| California Community Housing Agency Essential Housing Revenue Creekwood Series A 144A | 4.00 | 2-1-2056 | 3,000,000 | 2,391,732 | |
| California Community Housing Agency Essential Housing Revenue Serenity at Larkspur Series C 144A | 5.00 | 2-1-2050 | 3,000,000 | 2,744,621 | |
| California Community Housing Agency Workforce Apartments Series A 144A | 5.00 | 4-1-2049 | 3,000,000 | 2,732,405 | |
| California Enterprise Development Authority Student Housing Revenue Provident Group | 5.00 | 8-1-2050 | 565,000 | 567,586 | |
| California HFA Municipal Certificate of Participation Series 2 Class A (FHLMC Insured) | 3.75 | 3-25-2035 | 12,635,552 | 12,644,359 | |
| California HFA Municipal Certificate of Participation Series 2 Class A | 4.00 | 3-20-2033 | 8,286,872 | 8,191,995 | |
| California HFA Municipal Certificate of Participation Series 3 Class A | 3.25 | 11-20-2036 | 4,956,362 | 4,513,893 |
| Interest rate | Maturity date | Principal | Value | ||
| Housing revenue (continued) | |||||
| California Municipal Finance Authority Mobile Home Park Revenue Caritas Projects Series 2021B | 4.00% | 8-15-2051 | $ 870,000 | $ 686,154 | |
| California Municipal Finance Authority Mobile Senior Caritas Projects Series A | 5.00 | 8-15-2029 | 500,000 | 525,997 | |
| California Municipal Finance Authority Special Finance Agency Essential Housing Revenue Bond Series 2021A-2 Junior Bonds Latitude33 144A | 4.00 | 12-1-2045 | 1,500,000 | 1,164,536 | |
| California Municipal Finance Authority Special Finance Agency XII California Essential Housing Revenue Bond Allure Apartments Series A-2 Junior Bonds 144A | 4.38 | 8-1-2049 | 1,800,000 | 1,377,325 | |
| California Municipal Finance Authority Student Housing Revenue Bond CHF Riverside I LLC - University of California Riverside North District Phase 1 Student Housing Project | 5.00 | 5-15-2029 | 625,000 | 673,966 | |
| California Municipal Finance Authority Student Housing Revenue CHF Davis I LLC Orchard Park (BAM Insured) | 4.00 | 5-15-2033 | 600,000 | 600,962 | |
| California Municipal Finance Authority Student Housing Revenue CHF Davis I LLC Orchard Park (BAM Insured) | 4.00 | 5-15-2034 | 700,000 | 699,051 | |
| California Municipal Finance Authority Student Housing Revenue CHF Davis I LLC Orchard Park (BAM Insured) | 4.00 | 5-15-2035 | 700,000 | 696,857 | |
| California Municipal Finance Authority Student Housing Revenue CHF Davis I LLC Orchard Park (BAM Insured) | 4.00 | 5-15-2036 | 600,000 | 595,546 | |
| California Municipal Finance Authority Student Housing Revenue CHF Davis I LLC Orchard Park (BAM Insured) | 4.00 | 5-15-2037 | 700,000 | 691,743 | |
| California Municipal Finance Authority Student Housing Revenue CHF Davis I LLC Orchard Park (BAM Insured) | 4.00 | 5-15-2038 | 750,000 | 737,800 | |
| California Municipal Finance Authority Student Housing Revenue CHF Davis I LLC Orchard Park (BAM Insured) | 4.00 | 5-15-2046 | 3,750,000 | 3,548,014 | |
| California Municipal Finance Authority Student Housing Revenue CHF Davis I LLC West Village Projects | 5.00 | 5-15-2051 | 6,700,000 | 6,857,106 | |
| California Municipal Finance Authority Student Housing Revenue CHF Riverside I LLC Projects | 5.00 | 5-15-2052 | 5,650,000 | 5,796,553 | |
| California Municipal Finance Authority Student Housing Revenue Series 2021 CHF Davis II L.L.C. Orchard Park Student Housing Project (BAM Insured) | 4.00 | 5-15-2040 | 1,100,000 | 1,072,639 | |
| California School Finance Authority College Housing Revenue NCCD-Santa Rosa Properties LLC Sonoma County Series 2021A | 4.00 | 11-1-2041 | 1,730,000 | 1,454,435 | |
| California Statewide CDA Community Improvement Authority Essential Housing Revenue Bond Altana Glendale Series A-2 144A | 4.00 | 10-1-2056 | 2,000,000 | 1,594,092 | |
| California Statewide CDA Community Improvement Authority Essential Housing Revenue Bond Mezzanine Lien Series 2021B 144A | 4.00 | 5-1-2057 | 1,500,000 | 1,073,809 | |
| California Statewide CDA Community Improvement Authority Essential Housing Revenue Bond Mezzanine Lien Series 2022B 144A | 5.00 | 9-1-2037 | 1,000,000 | 946,997 | |
| California Statewide CDA Community Improvement Authority Essential Housing Revenue Bond Social Bonds Series 2021B 144A | 4.00 | 4-1-2057 | 1,000,000 | 710,461 | |
| Independent Cities California Finance Authority Mobile Home Park Revenue | 5.00 | 5-15-2048 | 2,000,000 | 2,065,424 |
| Interest rate | Maturity date | Principal | Value | ||
| Housing revenue (continued) | |||||
| Independent Cities California Finance Refunding Bond Sanitary Juan Mobile Estates | 5.00% | 8-15-2030 | $ 1,000,000 | $ 1,029,400 | |
| Independent Cities California Finance Refunding Bond Santa Rose Leisure Mobile | 5.00 | 8-15-2046 | 1,570,000 | 1,596,420 | |
| 71,535,920 | |||||
| Miscellaneous revenue: 12.04% | |||||
| Alameda CA Joint Powers Authority Multiple Capital Projects Series A | 5.00 | 12-1-2034 | 1,005,000 | 1,041,576 | |
| Anaheim CA PFA CAB Subordinate Lien Bond Public Improvements Project Series C (AGM Insured) ¤ | 0.00 | 9-1-2025 | 10,000,000 | 9,115,257 | |
| Anaheim CA PFA Convention Center Expansion Project Series A | 5.00 | 5-1-2039 | 3,000,000 | 3,160,583 | |
| Anaheim CA PFA Convention Center Expansion Project Series A | 5.00 | 5-1-2046 | 4,200,000 | 4,424,816 | |
| California CDA Community Infrastructure Program Series 2021A | 4.00 | 9-2-2041 | 1,000,000 | 876,109 | |
| California CDA Water & Wastewater Pooled Financing Program Series B (AGM Insured) | 5.25 | 10-1-2027 | 1,040,000 | 1,042,988 | |
| California Communities Series A | 5.00 | 9-2-2047 | 1,995,000 | 2,053,574 | |
| California Enterprise Development Authority Lease Revenue Riverside County Library Facilities Project | 4.00 | 11-1-2049 | 1,900,000 | 1,799,332 | |
| California Infrastructure & Economic Development Bank Lease Revenue | 5.00 | 8-1-2044 | 4,000,000 | 4,290,348 | |
| California Infrastructure & Economic Development King City Joint Union High School | 5.75 | 8-15-2029 | 2,150,000 | 2,152,940 | |
| California Municipal Finance Authority Refunding Bond Southwestern Law School Series 2021 | 4.00 | 11-1-2041 | 575,000 | 534,238 | |
| California Public Works Board Judicial Council Projects Series A | 5.00 | 3-1-2038 | 7,000,000 | 7,114,398 | |
| California Public Works Board Various Capital Projects Series G | 5.00 | 11-1-2037 | 23,000,000 | 23,274,059 | |
| California Public Works Board Various Capital Projects Series I | 5.50 | 11-1-2033 | 2,000,000 | 2,081,324 | |
| Compton CA PFA Refunding Bond 144A | 4.00 | 9-1-2027 | 5,620,000 | 5,622,063 | |
| Fresno CA Joint Powers Financing Authority Lease Revenue Master Lease Projects Series A (AGM Insured) | 4.00 | 4-1-2046 | 1,225,000 | 1,178,490 | |
| Fullerton CA Joint Union High School Project Certificate of Participation (BAM Insured) | 5.00 | 9-1-2035 | 1,385,000 | 1,472,797 | |
| Independent Cities California Finance Authority Sales Tax Revenue (AGM Insured) 144A | 4.00 | 6-1-2041 | 1,700,000 | 1,639,689 | |
| Independent Cities California Finance Authority Sales Tax Revenue (AGM Insured) 144A | 4.00 | 6-1-2051 | 750,000 | 718,126 | |
| Irvine CA Improvement Bond Act 1915 Limited Obligation Reassessment District #15-2 | 5.00 | 9-2-2025 | 725,000 | 772,913 | |
| Irvine CA Improvement Bond Act 1915 Limited Obligation Reassessment District #15-2 | 5.00 | 9-2-2026 | 400,000 | 425,140 | |
| Irvine CA Improvement Bond Act 1915 Limited Obligation Reassessment District #15-2 | 5.00 | 9-2-2042 | 1,495,000 | 1,531,366 | |
| Jefferson CA Union High School District Certificate of Participation Teacher and Staff Housing Project (BAM Insured) | 4.00 | 8-1-2045 | 1,400,000 | 1,347,083 | |
| Los Angeles CA Public Works Financing Authority Series A | 5.00 | 12-1-2039 | 2,860,000 | 3,016,892 | |
| Modesto CA Irrigation District Financing Authority Series A | 5.00 | 10-1-2040 | 3,500,000 | 3,679,089 | |
| Montclair CA PFA Lease Refunding Bond (AGM Insured) | 5.00 | 10-1-2035 | 2,400,000 | 2,530,936 |
| Interest rate | Maturity date | Principal | Value | ||
| Miscellaneous revenue (continued) | |||||
| Mountain House CA Financing Authority Utility System Revenue Series A | 5.00% | 12-1-2034 | $ 535,000 | $ 576,052 | |
| North Coast County Water District San Mateo County Certificate of Participation 2021 (AGM Insured) | 4.00 | 10-1-2051 | 1,745,000 | 1,656,372 | |
| Porterville CA Water Revenue Certificate of Participation Water System Financing Project (AGM Insured) | 4.00 | 8-15-2045 | 625,000 | 601,346 | |
| Porterville CA Water Revenue Certificate of Participation Water System Financing Project (AGM Insured) | 4.00 | 8-15-2050 | 1,000,000 | 958,369 | |
| Riverside County CA Asset Leasing Corporation Riverside County Hospital Project (NPFGC Insured) ¤ | 0.00 | 6-1-2026 | 10,000,000 | 8,864,765 | |
| Sacramento CA City Financing Authority Refunding Bond Master Lease Program Facilities (BAM Insured) | 5.00 | 12-1-2035 | 1,300,000 | 1,388,372 | |
| Sacramento CA City School Joint Refunding Bond Series A (BAM Insured) | 5.00 | 3-1-2040 | 2,165,000 | 2,248,222 | |
| San Jose CA Unified School District CAB (AGM Insured) ¤ | 0.00 | 1-1-2026 | 3,175,000 | 2,915,018 | |
| San Marino CA Unified School District Certificate of Participation Los Angeles County Schools Pooled Financing Program Series A | 5.00 | 12-1-2041 | 500,000 | 500,829 | |
| San Mateo Foster City CA PFA Revenue Sanitary Mateo Street & Flood Control Projects | 4.00 | 5-1-2045 | 3,750,000 | 3,662,649 | |
| San Ysidro CA School District Certificate of Participation School Facilities Bridge Funding Program (BAM Insured) | 5.00 | 9-1-2037 | 250,000 | 251,453 | |
| San Ysidro CA School District Certificate of Participation School Facilities Bridge Funding Program (BAM Insured) | 5.00 | 9-1-2042 | 625,000 | 628,633 | |
| San Ysidro CA School District Certificate of Participation School Facilities Bridge Funding Program (BAM Insured) | 5.00 | 9-1-2047 | 1,000,000 | 1,005,813 | |
| Simi Valley CA Unified School District Capital Improvement Projects (Ambac Insured) | 5.25 | 8-1-2022 | 510,000 | 510,088 | |
| Stockton CA Unified School District Community Improvement Project | 5.00 | 2-1-2033 | 550,000 | 605,401 | |
| Sutter Butte CA Flood Control Agency (BAM Insured) | 5.00 | 10-1-2040 | 3,545,000 | 3,758,855 | |
| Torrance CA Certificate of Participation | 5.25 | 6-1-2039 | 5,385,000 | 5,713,765 | |
| Upland CA Certificate of Participation San Antonio Regional Hospital | 5.00 | 1-1-2047 | 1,955,000 | 2,004,110 | |
| Ventura County CA PFA Series A | 5.00 | 11-1-2038 | 4,250,000 | 4,300,641 | |
| 129,046,879 | |||||
| Tax revenue: 12.14% | |||||
| Beaumont CA Community Facilities District #93-1 Special Tax Improvement Area #17C | 5.00 | 9-1-2043 | 750,000 | 776,371 | |
| Beaumont CA Community Facilities District #93-1 Special Tax Improvement Area #17C | 5.00 | 9-1-2048 | 1,100,000 | 1,132,156 | |
| Beaumont CA Community Facilities District #93-1 Special Tax Improvement Area #8D Series A | 5.00 | 9-1-2043 | 750,000 | 776,371 | |
| Beaumont CA Community Facilities District #93-1 Special Tax Improvement Area #8D Series A | 5.00 | 9-1-2048 | 1,035,000 | 1,065,818 | |
| Belmont CA Community Facilities Special Tax District #2000-1 Library Project Series A (Ambac Insured) | 5.75 | 8-1-2030 | 3,190,000 | 3,696,263 | |
| California CDA Community Facilities District #2015-01 | 5.00 | 9-1-2047 | 1,420,000 | 1,456,295 | |
| California CDA Special Tax Community Facilities District #2017-01 | 5.00 | 9-1-2048 | 5,000,000 | 5,146,163 | |
| California CDA Special Tax Community Facilities District #2020-02 | 4.00 | 9-1-2051 | 1,150,000 | 972,869 | |
| Casitas CA Municipal Water District Community Facilities District #2013-1-OJAI Series B (BAM Insured) | 5.25 | 9-1-2047 | 5,000,000 | 5,387,583 |
| Interest rate | Maturity date | Principal | Value | ||
| Tax revenue (continued) | |||||
| Cathedral City CA RDA Successor Agency to Merged Redevelopment Project Tax Allocation Bond Series A (BAM Insured) | 4.00% | 8-1-2032 | $ 1,050,000 | $ 1,094,562 | |
| Cathedral City CA RDA Successor Agency to Merged Redevelopment Project Tax Allocation Bond Series A (BAM Insured) | 4.00 | 8-1-2034 | 1,250,000 | 1,284,658 | |
| Cathedral City CA RDA Successor Agency to Merged Redevelopment Project Tax Allocation Bond Series A (AGM Insured) | 5.00 | 8-1-2032 | 1,450,000 | 1,517,514 | |
| Cathedral City CA RDA Successor Agency to Merged Redevelopment Project Tax Allocation Bond Series A (AGM Insured) | 5.00 | 8-1-2033 | 880,000 | 921,096 | |
| Chino CA Community Facilities District Special Tax #2003-3 Improvement Area #7 | 5.00 | 9-1-2048 | 2,500,000 | 2,574,439 | |
| Chula Vista CA Community Facilities District Special Tax #16-I Improvement Area #1 | 5.00 | 9-1-2043 | 500,000 | 517,581 | |
| Chula Vista CA Community Facilities District Special Tax #16-I Improvement Area #1 | 5.00 | 9-1-2048 | 1,000,000 | 1,029,233 | |
| City of Roseville CA | 5.00 | 9-1-2045 | 1,280,000 | 1,328,638 | |
| Corona CA Community Facilities District #2018-1 Improvement Area #1 2018 Special Tax Bond Series A | 5.00 | 9-1-2048 | 1,000,000 | 1,025,460 | |
| Corona Norco CA Unified School Districts Special Tax Community Facilities District #16-1 | 5.00 | 9-1-2048 | 1,500,000 | 1,544,663 | |
| Dinuba CA RDA Merged City Redevelopment Project (BAM Insured) | 5.00 | 9-1-2033 | 1,500,000 | 1,574,285 | |
| Elk Grove CA Financing Authority Special Tax Refunding Bond (BAM Insured) | 5.00 | 9-1-2038 | 1,500,000 | 1,590,993 | |
| Fairfield CA Community Facilities District Special Tax Bond #2019 One Lake Improvement Area 144A | 5.00 | 9-1-2050 | 3,000,000 | 3,089,898 | |
| Folsom Ranch Financing Authority California Facilities District #20 Russell Ranch | 5.00 | 9-1-2048 | 1,650,000 | 1,699,129 | |
| Fremont CA Community Facilities District #1 Refunding Bond | 5.00 | 9-1-2040 | 2,700,000 | 2,758,341 | |
| Inglewood CA Redevelopment Successor Agency to Merged Redevelopment Project Tax Allocation Refunding Bond Subordinate Lien Series A (BAM Insured) | 5.00 | 5-1-2034 | 500,000 | 544,267 | |
| Inglewood CA Redevelopment Successor Agency to Merged Redevelopment Project Tax Allocation Refunding Bond Subordinate Lien Series A (BAM Insured) | 5.00 | 5-1-2038 | 305,000 | 328,201 | |
| Inland Valley CA Development Agency Series A | 5.25 | 9-1-2037 | 4,000,000 | 4,131,911 | |
| Irvine CA Unified School District Special Tax Community Facilities District #09 1 Series A (BAM Insured) | 4.00 | 9-1-2044 | 1,000,000 | 961,711 | |
| Irvine CA Unified School District Special Tax Community Facilities District #09 1 Series A (BAM Insured) | 4.00 | 9-1-2050 | 3,000,000 | 2,874,978 | |
| Lafayette CA RDA Refunding Bond Lafayette Redevelopment Project (AGM Insured) | 5.00 | 8-1-2033 | 1,500,000 | 1,571,597 | |
| Lafayette CA RDA Refunding Bond Lafayette Redevelopment Project (AGM Insured) | 5.00 | 8-1-2038 | 1,635,000 | 1,709,230 | |
| Lancaster CA RDA Tax Allocation Refunding Bond Combined Redevelopment Project Areas (AGM Insured) | 5.00 | 8-1-2033 | 1,200,000 | 1,297,667 | |
| Los Angeles CA Community Facilities District #11 Ponte Vista Special Tax Series 2021 | 4.00 | 9-1-2046 | 1,250,000 | 1,096,894 | |
| Oakland CA Redevelopment Successor Agency Refunding Bond Subordinate Series TE (AGM Insured) | 5.00 | 9-1-2035 | 2,545,000 | 2,716,643 | |
| Oakland CA Redevelopment Successor Agency Refunding Bond Subordinate Series TE (AGM Insured) | 5.00 | 9-1-2036 | 4,000,000 | 4,266,495 |
| Interest rate | Maturity date | Principal | Value | ||
| Tax revenue (continued) | |||||
| Orange County CA Community Facilities District #2015-1 Esencia Village Series A | 5.25% | 8-15-2045 | $ 1,950,000 | $ 2,002,818 | |
| Rancho Cucamonga CA RDA Rancho Redevelopment Project Area (AGM Insured) | 5.00 | 9-1-2032 | 1,870,000 | 1,963,474 | |
| Redwood City CA RDA CAB Redevelopment Project Area Series 2-A (Ambac Insured) ¤ | 0.00 | 7-15-2030 | 3,505,000 | 2,642,743 | |
| Rio Vista CA Community Facilities District Special Tax #2018-1 | 5.00 | 9-1-2048 | 1,185,000 | 1,219,641 | |
| Riverside County CA Community Facilities Districts Special Tax #05-8 | 5.00 | 9-1-2048 | 1,600,000 | 1,646,772 | |
| Romoland School District Community Facilities District #2004-1 Heritage Lake Improvement Area #4 Series 2018 Special Tax Bond | 5.00 | 9-1-2048 | 3,000,000 | 3,089,326 | |
| Sacramento CA Transient Occupancy Tax Convention Center Complex Series A | 5.00 | 6-1-2048 | 3,750,000 | 3,965,433 | |
| San Bernardino CA Special Tax Community Facilities District #2006-1 Series 2018 | 5.00 | 9-1-2048 | 1,200,000 | 1,235,079 | |
| San Clemente CA Special Tax Community Facilities District #2006-1 | 5.00 | 9-1-2040 | 965,000 | 986,138 | |
| San Clemente CA Special Tax Community Facilities District #2006-1 | 5.00 | 9-1-2046 | 1,175,000 | 1,194,963 | |
| San Diego CA RDA CAB Tax Allocation Centre (AGM Insured) ¤ | 0.00 | 9-1-2023 | 885,000 | 863,760 | |
| San Francisco CA City & County Community Facilities District #2016-1 Improvement Area #1 Special Tax Treasure Island | 4.00 | 9-1-2051 | 1,250,000 | 1,080,359 | |
| San Francisco CA City & County Community Facilities District #2016-1 Improvement Area #1 Special Tax Treasure Island Series 2021 | 4.00 | 9-1-2041 | 1,000,000 | 908,030 | |
| San Francisco CA City & County Community Facilities District #2016-1 Improvement Area #2 Special Tax Treasure Island Series 2022A 144A | 4.00 | 9-1-2052 | 1,750,000 | 1,471,835 | |
| San Francisco CA City & County Community Facilities District #2020-1 Mission Rock Facilities and Services Special Tax Series 2021C 144A | 4.00 | 9-1-2051 | 3,900,000 | 3,316,945 | |
| San Francisco CA City & County RDA CAB Mission Bay South Redevelopment Project Subordinate Bond Series D 144A¤ | 0.00 | 8-1-2026 | 4,000,000 | 3,319,471 | |
| San Francisco CA City & County RDA Mission Bay South Redevelopment Project Series A | 5.00 | 8-1-2043 | 2,500,000 | 2,607,267 | |
| San Francisco CA City & County RDA Tax Transbay Infrastructure Project Third Lien Series B (AGM Insured) | 5.00 | 8-1-2046 | 1,500,000 | 1,598,295 | |
| San Marcos CA Unified School District Special Tax Community Facilities District #4 (BAM Insured) | 5.00 | 9-1-2034 | 1,705,000 | 1,805,402 | |
| San Marcos CA Unified School District Special Tax Community Facilities District #5 (BAM Insured) | 5.00 | 9-1-2028 | 1,290,000 | 1,365,964 | |
| San Marcos CA Unified School District Special Tax Community Facilities District #5 (BAM Insured) | 5.00 | 9-1-2029 | 1,325,000 | 1,403,025 | |
| Sonoma CA CDA Successor Agency to Sonoma Redevelopment Project Tax Allocation Bond (NPFGC Insured) | 5.00 | 6-1-2033 | 1,325,000 | 1,429,034 | |
| Successor Agency to the Marina Redevelopment Agency Tax Allocation Bonds Series A | 5.00 | 9-1-2033 | 340,000 | 359,803 | |
| Successor Agency to the Marina Redevelopment Agency Tax Allocation Bonds Series A | 5.00 | 9-1-2038 | 400,000 | 420,265 |
| Interest rate | Maturity date | Principal | Value | ||
| Tax revenue (continued) | |||||
| Successor Agency to the Marina Redevelopment Agency Tax Allocation Bonds Series B | 5.00% | 9-1-2033 | $ 250,000 | $ 264,561 | |
| Successor Agency to the Marina Redevelopment Agency Tax Allocation Bonds Series B | 5.00 | 9-1-2038 | 250,000 | 262,665 | |
| Temescal Valley Water District Improvement Area #2 2021 Special Tax Bonds | 4.00 | 9-1-2051 | 930,000 | 802,051 | |
| Tender Option Bond Trust Receipts/Floater Certificates Series 2019-MIZ9003 (Mizuho Capital Markets LLC LOC, Mizuho Capital Markets LLC LIQ) 144Aø | 1.23 | 3-1-2036 | 11,225,000 | 11,225,000 | |
| Tracy Hills CA Improvement Area #1 Community Facilities District #2016-1 Special Tax Bonds Series 2018 | 5.00 | 9-1-2048 | 2,750,000 | 2,830,390 | |
| Transbay Joint Powers Authority Tax Allocation California Senior Series A Green Bonds | 5.00 | 10-1-2045 | 2,000,000 | 2,149,957 | |
| Transbay Joint Powers Authority Tax Allocation California Senior Series A Green Bonds | 5.00 | 10-1-2049 | 2,200,000 | 2,358,312 | |
| Tustin CA Community Facilities District Special Tax #2014-1 Legacy/Standard Pacific Series A | 5.00 | 9-1-2040 | 750,000 | 766,428 | |
| Tustin CA Community Facilities District Special Tax #2014-1 Legacy/Standard Pacific Series A | 5.00 | 9-1-2045 | 1,000,000 | 1,017,774 | |
| Union City CA Community RDA Successor Agency to Community Redevelopment Project Tax Allocation Refunding Bond Series A | 5.00 | 10-1-2036 | 1,000,000 | 1,068,212 | |
| 130,101,165 | |||||
| Tobacco revenue: 0.58% | |||||
| California County CA Tobacco Securitization Agency | 5.00 | 6-1-2050 | 1,170,000 | 1,181,944 | |
| California County CA Tobacco Securitization Agency CAB ¤ | 0.00 | 6-1-2055 | 14,000,000 | 2,281,593 | |
| Golden State Tobacco Securitization Corporation California Tobacco Settlement Refunding Bond Series A-1 | 5.00 | 6-1-2028 | 2,000,000 | 2,252,069 | |
| Northern California Tobacco Securitization Authority Tobacco Settlement CAB Asset-Backed Refunding Bonds Class 2 Series B-2 ¤ | 0.00 | 6-1-2060 | 3,250,000 | 467,734 | |
| 6,183,340 | |||||
| Transportation revenue: 2.44% | |||||
| Bay Area CA Toll Authority Toll Bridge Series S-4 | 5.00 | 4-1-2030 | 2,000,000 | 2,050,813 | |
| Bay Area CA Toll Authority Toll Bridge Series S-H | 5.00 | 4-1-2049 | 8,000,000 | 9,214,078 | |
| Foothill-Eastern Transportation Corridor Agency Junior Lien Road Revenue Series 2021C | 4.00 | 1-15-2043 | 2,045,000 | 1,890,320 | |
| Foothill-Eastern Corridor Transportation Agency Subordinated Bond Series B-3 | 5.50 | 1-15-2053 | 8,000,000 | 8,009,510 | |
| Riverside County CA Transportation Commission Toll Revenue 2021 Series B-1 | 4.00 | 6-1-2046 | 2,000,000 | 1,875,228 | |
| San Francisco CA Municipal Transportation Agency Revenue Bond | 5.00 | 3-1-2039 | 3,000,000 | 3,153,794 | |
| 26,193,743 | |||||
| Utilities revenue: 4.65% | |||||
| Banning CA Financing Authority Refunding Bond Electric System Project (AGM Insured) | 5.00 | 6-1-2037 | 5,000,000 | 5,285,214 | |
| Imperial CA Irrigation District Electric System Refunding Bond Series A | 5.00 | 11-1-2040 | 3,715,000 | 3,944,612 | |
| Imperial CA Irrigation District Electric System Refunding Bond Series A | 5.00 | 11-1-2045 | 1,060,000 | 1,120,709 | |
| Imperial CA Irrigation District Electric System Refunding Bond Series C | 5.00 | 11-1-2038 | 2,500,000 | 2,681,942 |
| Interest rate | Maturity date | Principal | Value | ||
| Utilities revenue (continued) | |||||
| Lassen CA Municipal Utility District Certificate of Participation | 4.00% | 5-1-2038 | $ 2,615,000 | $ 2,510,807 | |
| Lassen CA Municipal Utility District Certificate of Participation | 4.00 | 5-1-2041 | 2,250,000 | 2,145,146 | |
| Lassen CA Municipal Utility District Certificate of Participation | 4.00 | 5-1-2046 | 4,395,000 | 4,108,987 | |
| Lassen CA Municipal Utility District Certificate of Participation | 4.00 | 5-1-2051 | 2,340,000 | 2,153,130 | |
| Los Angeles CA Department of Water and Power Series E | 5.00 | 7-1-2044 | 12,475,000 | 13,008,579 | |
| M-S-R California Energy Authority Gas Series B | 7.00 | 11-1-2034 | 4,000,000 | 4,977,149 | |
| M-S-R California Energy Authority Gas Series C | 6.13 | 11-1-2029 | 995,000 | 1,110,291 | |
| Redding CA Joint Powers Financing Authority Election System Series A | 5.00 | 6-1-2032 | 440,000 | 471,888 | |
| Roseville CA Natural Gas Financing Authority | 5.00 | 2-15-2025 | 1,930,000 | 2,013,880 | |
| Southern California Public Power Authority Natural Gas Project #1 Series A | 5.25 | 11-1-2025 | 1,000,000 | 1,060,657 | |
| Walnut CA Energy Center Authority Series A | 5.00 | 1-1-2034 | 3,115,000 | 3,273,576 | |
| 49,866,567 | |||||
| Water & sewer revenue: 2.52% | |||||
| Adelanto CA Public Utility Authority Refunding Bond (AGM Insured) | 5.00 | 7-1-2039 | 2,000,000 | 2,160,144 | |
| Bakersfield CA Wastewater Revenue Refunding Bond Series A | 5.00 | 9-15-2032 | 1,615,000 | 1,856,763 | |
| Bay Area CA Water Supply & Conservation Agency Series A | 5.00 | 10-1-2034 | 6,000,000 | 6,145,702 | |
| Compton CA Sewer Revenue | 6.00 | 9-1-2039 | 1,775,000 | 1,777,047 | |
| El Dorado CA Irrigation District Refunding Bond Series A (AGM Insured) | 5.25 | 3-1-2039 | 2,000,000 | 2,110,643 | |
| Florin CA Resource Conservation Refunding Bond Second Senior Lien Series A (NPFGC Insured) | 5.00 | 9-1-2032 | 2,000,000 | 2,111,701 | |
| Merced CA Irrigation District Water & Hydroelectric System Series A (AGM Insured) | 5.00 | 10-1-2038 | 4,000,000 | 4,219,123 | |
| San Buenaventura CA Public Facilities Financing Authority Series B | 5.00 | 7-1-2042 | 4,000,000 | 4,000,000 | |
| Tulare CA Sewer Refunding Bond (AGM Insured) | 5.00 | 11-15-2041 | 1,500,000 | 1,592,456 | |
| Vallejo CA Refunding Bond | 5.25 | 5-1-2031 | 1,000,000 | 1,029,128 | |
| 27,002,707 | |||||
| 1,017,321,062 | |||||
| Guam: 0.63% | |||||
| Tax revenue: 0.09% | |||||
| Guam Government Business Privilege Tax Revenue Refunding Bond Series 2021 F | 4.00 | 1-1-2036 | 1,000,000 | 920,203 | |
| Water & sewer revenue: 0.54% | |||||
| Guam Government Waterworks Authority | 5.25 | 7-1-2033 | 1,500,000 | 1,549,579 | |
| Guam Government Waterworks Authority | 5.50 | 7-1-2043 | 3,125,000 | 3,235,909 | |
| Guam Government Waterworks Authority Series A | 5.00 | 1-1-2050 | 1,000,000 | 1,042,431 | |
| 5,827,919 | |||||
| 6,748,122 |
| Interest rate | Maturity date | Principal | Value | ||
| Illinois: 0.98% | |||||
| Miscellaneous revenue: 0.98% | |||||
| Illinois Refunding Bond | 5.00% | 2-1-2025 | $10,000,000 | $ 10,498,159 | |
| New York: 0.48% | |||||
| Industrial development revenue: 0.48% | |||||
| New York Transportation Development Corporation Special Facilities Revenue Delta Air Lines Incorporated LaGuardia Airport Terminals C&D Redevelopment | 5.00 | 1-1-2029 | 5,000,000 | 5,125,256 | |
| Ohio: 0.06% | |||||
| Tobacco revenue: 0.06% | |||||
| Buckeye Tobacco Settlement Financing Authority CAB ¤ | 0.00 | 6-1-2057 | 5,000,000 | 641,512 | |
| Texas: 0.05% | |||||
| Resource recovery revenue: 0.05% | |||||
| Port Arthur TX Navigation District Jefferson County Environmental Facilities Motiva Enterprises LLC Project Series C ø | 1.07 | 4-1-2040 | 500,000 | 500,000 | |
| Total Municipal obligations (Cost $1,071,259,467) | 1,040,834,111 |
| Yield | Shares | ||||
| Short-term investments: 1.05% | |||||
| Investment companies: 1.05% | |||||
| Allspring Municipal Cash Management Money Market Fund Institutional Class ♠∞ | 0.85 | 11,280,829 | 11,287,598 | ||
| Total Short-term investments (Cost $11,287,055) | 11,287,598 | ||||
| Total investments in securities (Cost $1,087,546,522) | 98.62% | 1,057,121,709 | |||
| Other assets and liabilities, net | 1.38 | 14,799,231 | |||
| Total net assets | 100.00% | $1,071,920,940 |
| 144A | The security may be resold in transactions exempt from registration, normally to qualified institutional buyers, pursuant to Rule 144A under the Securities Act of 1933. |
| ø | Variable rate demand notes are subject to a demand feature which reduces the effective maturity. The maturity date shown represents the final maturity date of the security. The interest rate is determined and reset by the issuer daily, weekly, or monthly depending upon the terms of the security. The rate shown is the rate in effect at period end. |
| ¤ | The security is issued in zero coupon form with no periodic interest payments. |
| ♠ | The issuer of the security is an affiliated person of the Fund as defined in the Investment Company Act of 1940. |
| ∞ | The rate represents the 7-day annualized yield at period end. |
| Abbreviations: | |
| AGC | Assured Guaranty Corporation |
| AGM | Assured Guaranty Municipal |
| Ambac | Ambac Financial Group Incorporated |
| AMT | Alternative minimum tax |
| BAM | Build America Mutual Assurance Company |
| CAB | Capital appreciation bond |
| CDA | Community Development Authority |
| FHLMC | Federal Home Loan Mortgage Corporation |
| GO | General obligation |
| HFA | Housing Finance Authority |
| HFFA | Health Facilities Financing Authority |
| LIQ | Liquidity agreement |
| LOC | Letter of credit |
| NPFGC | National Public Finance Guarantee Corporation |
| PFA | Public Finance Authority |
| RDA | Redevelopment Authority |
| Value, beginning of period | Purchases | Sales proceeds | Net realized gains (losses) | Net change in unrealized gains (losses) | Value, end of period | Shares, end of period | Income from affiliated securities | |
| Short-term investments | ||||||||
| Allspring Municipal Cash Management Money Market Fund Institutional Class | $5,813,031 | $315,449,185 | $(309,977,060) | $1,945 | $497 | $11,287,598 | 11,280,829 | $34,325 |
| Assets | |
Investments in unaffiliated securities, at value (cost $1,076,259,467) | $ 1,045,834,111 |
Investments in affiliated securities, at value (cost $11,287,055) | 11,287,598 |
Cash | 143,250 |
Receivable for interest | 13,184,275 |
Receivable for investments sold | 5,133,313 |
Receivable for Fund shares sold | 551,899 |
Prepaid expenses and other assets | 28,970 |
Total assets | 1,076,163,416 |
| Liabilities | |
Payable for Fund shares redeemed | 3,174,862 |
Dividends payable | 515,639 |
Management fee payable | 261,435 |
Administration fees payable | 106,398 |
Distribution fee payable | 7,206 |
Trustees’ fees and expenses payable | 1,389 |
Accrued expenses and other liabilities | 175,547 |
Total liabilities | 4,242,476 |
Total net assets | $1,071,920,940 |
| Net assets consist of | |
Paid-in capital | $ 1,149,359,796 |
Total distributable loss | (77,438,856) |
Total net assets | $1,071,920,940 |
| Computation of net asset value and offering price per share | |
Net assets – Class A | $ 412,552,999 |
Shares outstanding – Class A1 | 38,736,552 |
Net asset value per share – Class A | $10.65 |
Maximum offering price per share – Class A2 | $11.15 |
Net assets – Class C | $ 11,547,662 |
Shares outstanding – Class C1 | 1,063,281 |
Net asset value per share – Class C | $10.86 |
Net assets – Administrator Class | $ 343,153,931 |
Shares outstanding – Administrator Class1 | 32,159,303 |
Net asset value per share – Administrator Class | $10.67 |
Net assets – Institutional Class | $ 304,666,348 |
Shares outstanding – Institutional Class1 | 28,552,880 |
Net asset value per share – Institutional Class | $10.67 |
| 1 | The Fund has an unlimited number of authorized shares. |
| 2 | Maximum offering price is computed as 100/95.50 of net asset value. On investments of $50,000 or more, the offering price is reduced. |
| Investment income | |
Interest | $ 41,276,958 |
Income from affiliated securities | 34,325 |
Total investment income | 41,311,283 |
| Expenses | |
Management fee | 4,730,809 |
| Administration fees | |
Class A | 761,353 |
Class C | 25,738 |
Administrator Class | 382,847 |
Institutional Class | 295,791 |
| Shareholder servicing fees | |
Class A | 1,189,614 |
Class C | 40,093 |
Administrator Class | 953,714 |
| Distribution fee | |
Class C | 120,281 |
Custody and accounting fees | 45,344 |
Professional fees | 69,382 |
Registration fees | 60,582 |
Shareholder report expenses | 37,430 |
Trustees’ fees and expenses | 20,032 |
Other fees and expenses | 20,412 |
Total expenses | 8,753,422 |
| Less: Fee waivers and/or expense reimbursements | |
Class A | (295,894) |
Class C | (9,179) |
Administrator Class | (765,642) |
Institutional Class | (4,417) |
Net expenses | 7,678,290 |
Net investment income | 33,632,993 |
| Realized and unrealized gains (losses) on investments | |
| Net realized gains (losses) on | |
Unaffiliated securities | (19,019,831) |
Affiliated securities | 1,945 |
Net realized losses on investments | (19,017,886) |
| Net change in unrealized gains (losses) on | |
Unaffiliated securities | (139,863,035) |
Affiliated securities | 497 |
Net change in unrealized gains (losses) on investments | (139,862,538) |
Net realized and unrealized gains (losses) on investments | (158,880,424) |
Net decrease in net assets resulting from operations | $(125,247,431) |
| Year ended June 30, 2022 | Year ended June 30, 2021 | |||
| Operations | ||||
Net investment income | $ 33,632,993 | $ 34,287,664 | ||
Net realized gains (losses) on investments | (19,017,886) | 864,522 | ||
Net change in unrealized gains (losses) on investments | (139,862,538) | 21,767,053 | ||
Net increase (decrease) in net assets resulting from operations | (125,247,431) | 56,919,239 | ||
| Distributions to shareholders from | ||||
| Net investment income and net realized gains | ||||
Class A | (12,231,031) | (13,386,834) | ||
Class C | (290,228) | (425,903) | ||
Administrator Class | (10,633,943) | (9,623,409) | ||
Institutional Class | (10,482,832) | (10,938,359) | ||
Total distributions to shareholders | (33,638,034) | (34,374,505) | ||
| Capital share transactions | Shares | Shares | ||
| Proceeds from shares sold | ||||
Class A | 8,830,381 | 104,258,640 | 5,327,012 | 64,132,490 |
Class C | 77,931 | 931,768 | 249,799 | 3,071,761 |
Administrator Class | 7,732,532 | 89,652,025 | 7,040,860 | 85,143,861 |
Institutional Class | 13,875,016 | 158,722,682 | 11,782,367 | 142,462,275 |
| 353,565,115 | 294,810,387 | |||
| Reinvestment of distributions | ||||
Class A | 1,008,834 | 11,677,026 | 1,059,299 | 12,769,000 |
Class C | 24,246 | 287,042 | 33,625 | 413,210 |
Administrator Class | 907,189 | 10,502,816 | 785,181 | 9,483,708 |
Institutional Class | 392,088 | 4,547,445 | 413,903 | 4,998,852 |
| 27,014,329 | 27,664,770 | |||
| Payment for shares redeemed | ||||
Class A | (11,212,029) | (130,013,134) | (7,807,857) | (94,172,729) |
Class C | (579,735) | (6,824,136) | (1,000,471) | (12,267,500) |
Administrator Class | (7,910,999) | (89,148,723) | (1,706,901) | (20,630,018) |
Institutional Class | (17,310,888) | (195,721,790) | (8,105,883) | (97,903,173) |
| (421,707,783) | (224,973,420) | |||
Net increase (decrease) in net assets resulting from capital share transactions | (41,128,339) | 97,501,737 | ||
Total increase (decrease) in net assets | (200,013,804) | 120,046,471 | ||
| Net assets | ||||
Beginning of period | 1,271,934,744 | 1,151,888,273 | ||
End of period | $1,071,920,940 | $1,271,934,744 | ||
| Year ended June 30 | |||||
| Class A | 2022 | 2021 | 2020 | 2019 | 2018 |
Net asset value, beginning of period | $12.13 | $11.91 | $11.91 | $11.64 | $11.83 |
Net investment income | 0.30 | 0.32 | 0.35 | 0.37 | 0.37 |
Net realized and unrealized gains (losses) on investments | (1.48) | 0.22 | (0.00) 1 | 0.28 | (0.19) |
Total from investment operations | (1.18) | 0.54 | 0.35 | 0.65 | 0.18 |
| Distributions to shareholders from | |||||
Net investment income | (0.30) | (0.32) | (0.35) | (0.38) | (0.37) |
Net asset value, end of period | $10.65 | $12.13 | $11.91 | $11.91 | $11.64 |
Total return2 | (9.90)% | 4.59% | 2.93% | 5.70% | 1.55% |
| Ratios to average net assets (annualized) | |||||
Gross expenses | 0.81% | 0.81% | 0.81% | 0.83% | 0.83% |
Net expenses | 0.75% | 0.75% | 0.75% | 0.75% | 0.75% |
Net investment income | 2.57% | 2.66% | 2.92% | 3.22% | 3.15% |
| Supplemental data | |||||
Portfolio turnover rate | 17% | 9% | 23% | 9% | 33% |
Net assets, end of period (000s omitted) | $412,553 | $486,668 | $494,450 | $482,395 | $443,165 |
| 1 | Amount is more than $(0.005) |
| 2 | Total return calculations do not include any sales charges. |
| Year ended June 30 | |||||
| Class C | 2022 | 2021 | 2020 | 2019 | 2018 |
Net asset value, beginning of period | $12.37 | $12.14 | $12.15 | $11.87 | $12.07 |
Net investment income | 0.22 | 0.24 | 0.27 | 0.29 | 0.29 |
Net realized and unrealized gains (losses) on investments | (1.51) | 0.23 | (0.02) | 0.29 | (0.20) |
Total from investment operations | (1.29) | 0.47 | 0.25 | 0.58 | 0.09 |
| Distributions to shareholders from | |||||
Net investment income | (0.22) | (0.24) | (0.26) | (0.30) | (0.29) |
Net asset value, end of period | $10.86 | $12.37 | $12.14 | $12.15 | $11.87 |
Total return1 | (10.58)% | 3.86% | 2.08% | 4.95% | 0.74% |
| Ratios to average net assets (annualized) | |||||
Gross expenses | 1.56% | 1.56% | 1.56% | 1.58% | 1.58% |
Net expenses | 1.50% | 1.50% | 1.50% | 1.50% | 1.50% |
Net investment income | 1.80% | 1.91% | 2.18% | 2.47% | 2.40% |
| Supplemental data | |||||
Portfolio turnover rate | 17% | 9% | 23% | 9% | 33% |
Net assets, end of period (000s omitted) | $11,548 | $19,066 | $27,413 | $32,758 | $47,831 |
| 1 | Total return calculations do not include any sales charges. |
| Year ended June 30 | |||||
| Administrator Class | 2022 | 2021 | 2020 | 2019 | 2018 |
Net asset value, beginning of period | $12.16 | $11.93 | $11.94 | $11.66 | $11.86 |
Net investment income | 0.32 | 0.34 | 0.37 | 0.40 | 0.39 |
Net realized and unrealized gains (losses) on investments | (1.49) | 0.24 | (0.01) | 0.28 | (0.20) |
Total from investment operations | (1.17) | 0.58 | 0.36 | 0.68 | 0.19 |
| Distributions to shareholders from | |||||
Net investment income | (0.32) | (0.35) | (0.37) | (0.40) | (0.39) |
Net asset value, end of period | $10.67 | $12.16 | $11.93 | $11.94 | $11.66 |
Total return | (9.77)% | 4.89% | 3.05% | 5.99% | 1.67% |
| Ratios to average net assets (annualized) | |||||
Gross expenses | 0.75% | 0.75% | 0.75% | 0.77% | 0.77% |
Net expenses | 0.55% | 0.55% | 0.55% | 0.55% | 0.55% |
Net investment income | 2.78% | 2.86% | 3.13% | 3.43% | 3.34% |
| Supplemental data | |||||
Portfolio turnover rate | 17% | 9% | 23% | 9% | 33% |
Net assets, end of period (000s omitted) | $343,154 | $382,093 | $301,919 | $231,252 | $186,626 |
| Year ended June 30 | |||||
| Institutional Class | 2022 | 2021 | 2020 | 2019 | 2018 |
Net asset value, beginning of period | $12.16 | $11.93 | $11.94 | $11.66 | $11.86 |
Net investment income | 0.33 | 0.35 | 0.38 | 0.41 | 0.40 |
Net realized and unrealized gains (losses) on investments | (1.49) | 0.23 | (0.01) | 0.28 | (0.20) |
Total from investment operations | (1.16) | 0.58 | 0.37 | 0.69 | 0.20 |
| Distributions to shareholders from | |||||
Net investment income | (0.33) | (0.35) | (0.38) | (0.41) | (0.40) |
Net asset value, end of period | $10.67 | $12.16 | $11.93 | $11.94 | $11.66 |
Total return | (9.71)% | 4.96% | 3.12% | 6.07% | 1.74% |
| Ratios to average net assets (annualized) | |||||
Gross expenses | 0.48% | 0.48% | 0.48% | 0.50% | 0.50% |
Net expenses | 0.48% | 0.48% | 0.48% | 0.48% | 0.48% |
Net investment income | 2.83% | 2.93% | 3.19% | 3.49% | 3.42% |
| Supplemental data | |||||
Portfolio turnover rate | 17% | 9% | 23% | 9% | 33% |
Net assets, end of period (000s omitted) | $304,666 | $384,108 | $328,107 | $293,180 | $287,616 |
| Gross unrealized gains | $ 20,133,996 |
| Gross unrealized losses | (50,689,403) |
| Net unrealized losses | $(30,555,407) |
| ■ | Level 1 – quoted prices in active markets for identical securities |
| ■ | Level 2 – other significant observable inputs (including quoted prices for similar securities, interest rates, prepayment speeds, credit risk, etc.) |
| ■ | Level 3 – significant unobservable inputs (including the Fund’s own assumptions in determining the fair value of investments) |
| Quoted prices (Level 1) | Other significant observable inputs (Level 2) | Significant unobservable inputs (Level 3) | Total | |
| Assets | ||||
| Investments in: | ||||
| Closed end municipal bond fund obligations | $ 0 | $ 5,000,000 | $0 | $ 5,000,000 |
| Municipal obligations | 0 | 1,040,834,111 | 0 | 1,040,834,111 |
| Short-term investments | ||||
| Investment companies | 11,287,598 | 0 | 0 | 11,287,598 |
| Total assets | $11,287,598 | $1,045,834,111 | $0 | $1,057,121,709 |
| Average daily net assets | Management fee |
| First $500 million | 0.400% |
| Next $500 million | 0.375 |
| Next $2 billion | 0.350 |
| Next $2 billion | 0.325 |
| Next $5 billion | 0.290 |
| Over $10 billion | 0.280 |
| Class-level administration fee | |
| Class A | 0.16% |
| Class C | 0.16 |
| Administrator Class | 0.10 |
| Institutional Class | 0.08 |
| Expense ratio caps | |
| Class A | 0.75% |
| Class C | 1.50 |
| Administrator Class | 0.55 |
| Institutional Class | 0.48 |
| Undistributed tax-exempt income | Unrealized losses | Capital loss carryforward |
| $574,312 | $(30,555,407) | $(46,941,220) |
Allspring Funds Trust:

| Name and year of birth | Position held and length of service* | Principal occupations during past five years or longer | Current other public company or investment company directorships |
| William R. Ebsworth (Born 1957) | Trustee, since 2015 | Retired. From 1984 to 2013, equities analyst, portfolio manager, research director and chief investment officer at Fidelity Management and Research Company in Boston, Tokyo, and Hong Kong, and retired in 2013 as Chief Investment Officer of Fidelity Strategic Advisers, Inc. where he led a team of investment professionals managing client assets. Prior thereto, Board member of Hong Kong Securities Clearing Co., Hong Kong Options Clearing Corp., the Thailand International Fund, Ltd., Fidelity Investments Life Insurance Company, and Empire Fidelity Investments Life Insurance Company. Audit Committee Chair and Investment Committee Chair of the Vincent Memorial Hospital Endowment (non-profit organization). Mr. Ebsworth is a CFA® charterholder. | N/A |
| Jane A. Freeman (Born 1953) | Trustee, since 2015; Chair Liaison, since 2018 | Retired. From 2012 to 2014 and 1999 to 2008, Chief Financial Officer of Scientific Learning Corporation. From 2008 to 2012, Ms. Freeman provided consulting services related to strategic business projects. Prior to 1999, Portfolio Manager at Rockefeller & Co. and Scudder, Stevens & Clark. Board member of the Harding Loevner Funds from 1996 to 2014, serving as both Lead Independent Director and chair of the Audit Committee. Board member of the Russell Exchange Traded Funds Trust from 2011 to 2012 and the chair of the Audit Committee. Ms. Freeman is also an inactive Chartered Financial Analyst. | N/A |
| Isaiah Harris, Jr. (Born 1952) | Trustee, since 2009; Audit Committee Chair, since 2019 | Retired. Chairman of the Board of CIGNA Corporation from 2009 to 2021, and Director from 2005 to 2008. From 2003 to 2011, Director of Deluxe Corporation. Prior thereto, President and CEO of BellSouth Advertising and Publishing Corp. from 2005 to 2007, President and CEO of BellSouth Enterprises from 2004 to 2005 and President of BellSouth Consumer Services from 2000 to 2003. Emeritus member of the Iowa State University Foundation Board of Governors. Emeritus Member of the Advisory Board of Iowa State University School of Business. Advisory Board Member, Palm Harbor Academy (private school). Advisory Board Member, Fellowship of Christian Athletes. Mr. Harris is a certified public accountant (inactive status). | N/A |
| David F. Larcker (Born 1950) | Trustee, since 2009 | James Irvin Miller Professor of Accounting at the Graduate School of Business (Emeritus), Stanford University, Director of the Corporate Governance Research Initiative and Senior Faculty of The Rock Center for Corporate Governance since 2006. From 2005 to 2008, Professor of Accounting at the Graduate School of Business, Stanford University. Prior thereto, Ernst & Young Professor of Accounting at The Wharton School, University of Pennsylvania from 1985 to 2005. | N/A |
| Name and year of birth | Position held and length of service* | Principal occupations during past five years or longer | Current other public company or investment company directorships |
| Olivia S. Mitchell (Born 1953) | Trustee, since 2006; Nominating and Governance Committee Chair, since 2018 | International Foundation of Employee Benefit Plans Professor since 1993, Wharton School of the University of Pennsylvania. Director of Wharton’s Pension Research Council and Boettner Center on Pensions & Retirement Research, and Research Associate at the National Bureau of Economic Research. Previously taught at Cornell University from 1978 to 1993. | N/A |
| Timothy J. Penny (Born 1951) | Trustee, since 1996; Chair, since 2018 | President and Chief Executive Officer of Southern Minnesota Initiative Foundation, a non-profit organization, since 2007. Member of the Board of Trustees of NorthStar Education Finance, Inc., a non-profit organization, since 2007. | N/A |
| James G. Polisson (Born 1959) | Trustee, since 2018 | Retired. Chief Marketing Officer, Source (ETF) UK Services, Ltd, from 2015 to 2017. From 2012 to 2015, Principal of The Polisson Group, LLC, a management consulting, corporate advisory and principal investing company. Chief Executive Officer and Managing Director at Russell Investments, Global Exchange Traded Funds from 2010 to 2012. Managing Director of Barclays Global Investors from 1998 to 2010 and Global Chief Marketing Officer for iShares and Barclays Global Investors from 2000 to 2010. Trustee of the San Francisco Mechanics’ Institute, a non-profit organization, from 2013 to 2015. Board member of the Russell Exchange Traded Fund Trust from 2011 to 2012. Director of Barclays Global Investors Holdings Deutschland GmbH from 2006 to 2009. Mr. Polisson is an attorney and has a retired status with the Massachusetts and District of Columbia Bar Associations. | N/A |
| Pamela Wheelock (Born 1959) | Trustee, since January 2020; previously Trustee from January 2018 to July 2019 | Board member of the Destination Medical Center Economic Development Agency, Rochester, Minnesota since 2019. Interim President of the McKnight Foundation from January to September 2020. McKnight Foundation Consultant, November 2020 to February 2021. Acting Commissioner, Minnesota Department of Human Services, July 2019 through September 2019. Consultant (part-time), Minnesota Department of Human Services, October 2019 through December 2019. Chief Operating Officer, Twin Cities Habitat for Humanity from 2017 to 2019. Vice President of University Services, University of Minnesota from 2012 to 2016. Prior thereto, on the Board of Directors, Governance Committee and Finance Committee for the Minnesota Philanthropy Partners (Saint Paul Foundation) from 2012 to 2018, Interim Chief Executive Officer of Blue Cross Blue Shield of Minnesota from 2011 to 2012, Chairman of the Board from 2009 to 2012 and Board Director from 2003 to 2015. Vice President, Leadership and Community Engagement, Bush Foundation, Saint Paul, Minnesota (a private foundation) from 2009 to 2011. Executive Vice President and Chief Financial Officer, Minnesota Sports and Entertainment from 2004 to 2009 and Senior Vice President from 2002 to 2004. Executive Vice President of the Minnesota Wild Foundation from 2004 to 2008. Commissioner of Finance, State of Minnesota, from 1999 to 2002. Currently Board Chair of the Minnesota Wild Foundation since 2010. | N/A |
| Name and year of birth | Position held and length of service | Principal occupations during past five years or longer |
| Andrew Owen (Born 1960) | President, since 2017 | President, Chief Executive Officer and Director of Allspring Funds Management, LLC since 2017 and co-president of Galliard Capital Management, LLC, an affiliate of Allspring Funds Management, LLC, since 2019. Prior thereto, Head of Affiliated Managers, Allspring Global Investments, from 2014 to 2019 and Executive Vice President responsible for marketing, investments and product development for Allspring Funds Management, LLC, from 2009 to 2014. In addition, Mr. Owen was an Executive Vice President of Wells Fargo & Company from 2014 to 2021. |
| Jeremy DePalma (Born 1974) | Treasurer, since 2012 (for certain funds in the Fund Complex); since 2021 (for the remaining funds in the Fund Complex) | Senior Vice President of Allspring Funds Management, LLC since 2009. Senior Vice President of Evergreen Investment Management Company, LLC from 2008 to 2010 and head of the Fund Reporting and Control Team within Fund Administration from 2005 to 2010. |
| Kate McKinley (Born 1977) | Chief Legal Officer, since 2021 | Chief Legal Officer of Allspring Global Investments since 2021. Prior thereto, held various roles at State Street Global Advisors beginning in 2010, including serving as Senior Vice President and General Counsel from 2019 to 2021, and Chief Operating Officer of the Institutional Client Group from 2016 - 2019. Prior to working at State Street Global Advisors served as Assistant General Counsel for Bank of America Corporation from 2005 to 2010 and as an Associate at WilmerHale from 2002 to 2005. |
| Christopher Baker (Born 1976) | Chief Compliance Officer, since 2022 | Global Chief Compliance Officer for Allspring Global Investments since 2022. Prior thereto, Chief Compliance Officer for State Street Global Advisors from 2018 to 2021. Senior Compliance Officer for the State Street divisions of Alternative Investment Solutions, Sector Solutions, and Global Marketing from 2015 to 2018. From 2010 to 2015 Vice President, Global Head of Investment and Marketing Compliance for State Street Global Advisors. |
| Matthew Prasse (Born 1983) | Secretary, since 2021 | Senior Counsel of the Allspring Legal Department since 2021. Senior Counsel of the Wells Fargo Legal Department from 2018 to 2021. Previously, Counsel for Barings LLC from 2015 to 2018. Prior to joining Barings, Associate at Morgan, Lewis & Bockius LLP from 2008 to 2015. |
P.O. Box 219967
Kansas City, MO 64121-9967

1-800-222-8222 or visit the Fund's website at allspringglobal.com. Read the prospectus carefully before you invest or send money.
A249/AR249 06-22

High Yield Municipal Bond Fund
| 2 | |
| 6 | |
| 11 | |
| 12 | |
| Financial statements | |
| 23 | |
| 24 | |
| 25 | |
| 26 | |
| 31 | |
| 36 | |
| 37 |

| 1 | The S&P 500 Index consists of 500 stocks chosen for market size, liquidity, and industry group representation. It is a market-value-weighted index with each stock's weight in the index proportionate to its market value. You cannot invest directly in an index. |
| 2 | The Morgan Stanley Capital International (MSCI) All Country World Index (ACWI) ex USA Index (Net) is a free-float-adjusted market-capitalization-weighted index that is designed to measure the equity market performance of developed and emerging markets, excluding the U.S. Source: MSCI. MSCI makes no express or implied warranties or representations and shall have no liability whatsoever with respect to any MSCI data contained herein. The MSCI data may not be further redistributed or used as a basis for other indexes or any securities or financial products. This report is not approved, reviewed, or produced by MSCI. You cannot invest directly in an index. |
| 3 | The MSCI Emerging Markets (EM) Index (Net) (USD) is a free-float-adjusted market-capitalization-weighted index that is designed to measure equity market performance of emerging markets. You cannot invest directly in an index. |
| 4 | The Bloomberg U.S. Aggregate Bond Index is a broad-based benchmark that measures the investment-grade, U.S.-dollar-denominated, fixed-rate taxable bond market, including Treasuries, government-related and corporate securities, mortgage-backed securities (agency fixed-rate and hybrid adjustable-rate mortgage pass-throughs), asset-backed securities, and commercial mortgage-backed securities. You cannot invest directly in an index. |
| 5 | The Bloomberg Global Aggregate ex-USD Index (unhedged) is an unmanaged index that provides a broad-based measure of the global investment-grade fixed-income markets excluding the U.S.-dollar-denominated debt market. You cannot invest directly in an index. |
| 6 | The Bloomberg Municipal Bond Index is an unmanaged index composed of long-term tax-exempt bonds with a minimum credit rating of Baa. You cannot invest directly in an index. |
| 7 | The ICE BofA U.S. High Yield Index is a market-capitalization-weighted index of domestic and Yankee high-yield bonds. The index tracks the performance of high-yield securities traded in the U.S. bond market. You cannot invest directly in an index. Copyright 2022. ICE Data Indices, LLC. All rights reserved. |
| 1 | The Consumer Price Index (CPI) is a measure of the average change over time in the prices paid by urban consumers for a market basket of consumer goods and services. You cannot invest directly in an index. |
| 2 | The MSCI ACWI (Net) is a free-float-adjusted market-capitalization-weighted index that is designed to measure the equity market performance of developed and emerging markets. You cannot invest directly in an index. |

President
Allspring Funds
| Investment objective | The Fund seeks high current income exempt from federal income tax, and capital appreciation. |
| Manager | Allspring Funds Management, LLC |
| Subadviser | Allspring Global Investments, LLC |
| Portfolio managers | Dennis Derby, Terry J. Goode, Kerry Laurin |
| Average annual total returns (%) as of June 30, 2022 | |||||||||||
| Including sales charge | Excluding sales charge | Expense ratios1 (%) | |||||||||
| Inception date | 1 year | 5 year | Since inception | 1 year | 5 year | Since inception | Gross | Net 2 | |||
| Class A (WHYMX) | 1-31-2013 | -14.88 | 1.32 | 3.00 | -10.84 | 2.26 | 3.50 | 1.14 | 0.80 | ||
| Class C (WHYCX) | 1-31-2013 | -12.51 | 1.49 | 2.84 | -11.51 | 1.49 | 2.84 | 1.89 | 1.55 | ||
| Class R6 (EKHRX)3 | 7-31-2018 | – | – | – | -10.53 | 2.55 | 3.78 | 0.76 | 0.50 | ||
| Administrator Class (WHYDX) | 1-31-2013 | – | – | – | -10.65 | 2.38 | 3.62 | 1.08 | 0.70 | ||
| Institutional Class (WHYIX) | 1-31-2013 | – | – | – | -10.54 | 2.51 | 3.76 | 0.81 | 0.55 | ||
| High Yield Municipal Bond Blended Index4 | – | – | – | – | -9.67 | 2.80 | 3.14 * | – | – | ||
| Bloomberg High Yield Municipal Bond Index5 | – | – | – | – | -10.40 | 3.63 | 3.75 * | – | – | ||
| Bloomberg Municipal Bond Index6 | – | – | – | – | -8.57 | 1.51 | 2.17 * | – | – | ||
| * | Based on the inception date of the oldest Fund class. |
| 1 | Reflects the expense ratios as stated in the most recent prospectuses. The expense ratios shown are subject to change and may differ from the annualized expense ratios shown in the financial highlights of this report. |
| 2 | The manager has contractually committed through October 31, 2022, to waive fees and/or reimburse expenses to the extent necessary to cap total annual fund operating expenses after fee waivers at 0.80% for Class A, 1.55% for Class C, 0.50% for Class R6, 0.70% for Administrator Class, and 0.55% for Institutional Class. Brokerage commissions, stamp duty fees, interest, taxes, acquired fund fees and expenses (if any), and extraordinary expenses are excluded from the expense caps. Prior to or after the commitment expiration date, the caps may be increased or the commitment to maintain the caps may be terminated only with the approval of the Board of Trustees. Without these caps, the Fund’s returns would have been lower. The expense ratio paid by an investor is the net expense ratio (the total annual fund operating expenses after fee waivers) as stated in the prospectuses. |
| 3 | Historical performance shown for the Class R6 shares prior to their inception reflects the performance of the Institutional Class shares, and includes the higher expenses applicable to the Institutional Class shares. If these expenses had not been included, returns for the Class R6 shares would be higher. |
| 4 | Source: Allspring Funds Management, LLC. The High Yield Municipal Bond Blended Index is weighted 60% in the Bloomberg High Yield Municipal Bond Index and 40% in the Bloomberg Municipal Bond Index. Effective November 1, 2019, the Fund’s benchmark changed from Bloomberg Municipal Bond Index to the High Yield Municipal Bond Blended Index to better match the Fund’s investment strategy. You cannot invest directly in an index. |
| 5 | The Bloomberg High Yield Municipal Bond Index measures the non-investment-grade and nonrated U.S. dollar–denominated, fixed-rate, tax-exempt bond market within the 50 United States and four other qualifying regions (Washington, D.C.; Puerto Rico; Guam; and the Virgin Islands). The index allows state and local general obligation, revenue, insured, and prefunded bonds; however, historically the index has been composed of mostly revenue bonds. You cannot invest directly in an index. |
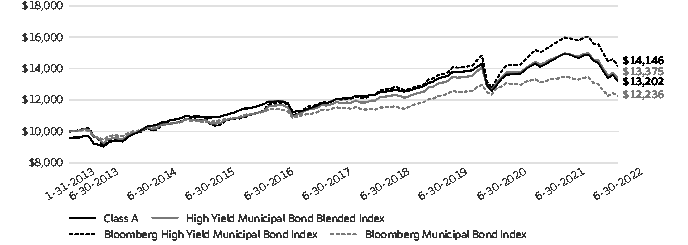
| 1 | The chart compares the performance of Class A shares since inception with the High Yield Municipal Bond Blended Index, Bloomberg High Yield Municipal Bond Index and Bloomberg Municipal Bond Index. The chart assumes a hypothetical investment of $10,000 in Class A shares and reflects all operating expenses and assumes the maximum initial sales charge of 4.50%. |
| 6 | The Bloomberg Municipal Bond Index is an unmanaged index composed of long-term tax-exempt bonds with a minimum credit rating of Baa. You cannot invest directly in an index. |
| ■ | The Fund underperformed its benchmarks, the High Yield Municipal Bond Blended Index, the Bloomberg High Yield Municipal Bond Index and the Bloomberg Municipal Bond Index for the year that ended June 30, 2022. |
| ■ | Yield-curve positioning detracted from performance due to an overweight to the weaker-performing long-maturity segments. Security selection also detracted from performance. |
| ■ | Sector allocation and credit quality were the largest contributors to performance, followed by duration positioning. |
| Credit quality as of June 30, 20221 |

| 1 | The credit quality distribution of portfolio holdings reflected in the chart is based on ratings from Standard & Poor’s, Moody’s Investors Service, and/or Fitch Ratings Ltd. Credit quality ratings apply to the underlying holdings of the Fund and not to the Fund itself. The percentages of the portfolio with the ratings depicted in the chart are calculated based on the market value of fixed income securities held by the Fund. If a security was rated by all three rating agencies, the middle rating was utilized. If rated by two of the three rating agencies, the lower rating was utilized, and if rated by one of the rating agencies, that rating was utilized. Standard & Poor’s rates the creditworthiness of bonds, ranging from AAA (highest) to D (lowest). Ratings from A to CCC may be modified by the addition of a plus (+) or minus (-) sign to show relative standing within the rating categories. Standard & Poor’s rates the creditworthiness of short-term notes from SP-1 (highest) to SP-3 (lowest). Moody’s rates the creditworthiness of bonds, ranging from Aaa (highest) to C (lowest). Ratings Aa to B may be modified by the addition of a number 1 (highest) to 3 (lowest) to show relative standing within the ratings categories. Moody’s rates the creditworthiness of short-term U.S. tax-exempt municipal securities from MIG 1/VMIG 1 (highest) to SG (lowest). Fitch rates the creditworthiness of bonds, ranging from AAA (highest) to D (lowest). Credit quality distribution is subject to change and may have changed since the date specified. |
| Effective maturity distribution as of June 30, 20221 |
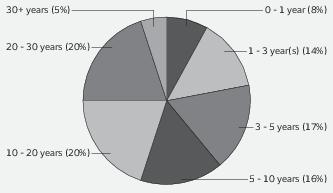
| 1 | Figures represent the percentage of the Fund's long-term investments. These amounts are subject to change and may have changed since the date specified. |
| * | The Thomson Reuters Municipal Market Data (MMD) AAA Curve is a proprietary yield curve that provides the offer-side of AAA-rated state general obligation bonds, as determined by the MMD analyst team. |
| Beginning account value 1-1-2022 | Ending account value 6-30-2022 | Expenses paid during the period1 | Annualized net expense ratio | |
| Class A | ||||
| Actual | $1,000.00 | $ 887.27 | $3.70 | 0.79% |
| Hypothetical (5% return before expenses) | $1,000.00 | $1,020.88 | $3.96 | 0.79% |
| Class C | ||||
| Actual | $1,000.00 | $ 884.00 | $7.24 | 1.55% |
| Hypothetical (5% return before expenses) | $1,000.00 | $1,017.11 | $7.75 | 1.55% |
| Class R6 | ||||
| Actual | $1,000.00 | $ 888.04 | $2.34 | 0.50% |
| Hypothetical (5% return before expenses) | $1,000.00 | $1,022.32 | $2.51 | 0.50% |
| Administrator Class | ||||
| Actual | $1,000.00 | $ 887.91 | $3.18 | 0.68% |
| Hypothetical (5% return before expenses) | $1,000.00 | $1,021.42 | $3.41 | 0.68% |
| Institutional Class | ||||
| Actual | $1,000.00 | $ 888.36 | $2.58 | 0.55% |
| Hypothetical (5% return before expenses) | $1,000.00 | $1,022.07 | $2.76 | 0.55% |
| Interest rate | Maturity date | Principal | Value | ||
| Municipal obligations: 94.14% | |||||
| Alabama: 0.68% | |||||
| Water & sewer revenue: 0.68% | |||||
| Jefferson County AL Warrants CAB Senior Lien Series B (AGM Insured) ¤ | 0.00% | 10-1-2027 | $ 920,000 | $ 737,473 | |
| Arizona: 2.84% | |||||
| Education revenue: 0.70% | |||||
| Florence AZ IDA Legacy Traditional School Project Queen Creek & Casa Grande Campuses | 5.00 | 7-1-2023 | 55,000 | 55,869 | |
| Phoenix AZ IDA Legacy Traditional Schools Project Series A 144A | 6.50 | 7-1-2034 | 500,000 | 527,293 | |
| Pima County AZ IDA Desert Heights Charter School Facility Refunding Bond | 6.00 | 5-1-2024 | 170,000 | 174,334 | |
| 757,496 | |||||
| Health revenue: 1.19% | |||||
| Tempe AZ IDA Mirabella at ASU Incorporated Project Series A 144A | 6.13 | 10-1-2052 | 1,400,000 | 1,297,752 | |
| Miscellaneous revenue: 0.95% | |||||
| Phoenix AZ Civic Improvement Corporation Series B | 5.00 | 7-1-2049 | 1,000,000 | 1,039,883 | |
| 3,095,131 | |||||
| California: 3.82% | |||||
| Education revenue: 0.45% | |||||
| California Infrastructure & Economic Development Bank Senior WFCS Portfolio Projects Series A1 144A | 5.00 | 1-1-2056 | 250,000 | 227,426 | |
| California Municipal Finance Authority Charter School Albert Einstein Academies Project Series A | 7.13 | 8-1-2043 | 250,000 | 264,050 | |
| 491,476 | |||||
| Health revenue: 0.43% | |||||
| California PFA Living Enso Village Project Refunding Bond Series A 144A | 5.00 | 11-15-2046 | 500,000 | 469,822 | |
| Housing revenue: 1.00% | |||||
| California Community Housing Agency Essential Housing Revenue Creekwood Series A 144A | 4.00 | 2-1-2056 | 500,000 | 398,622 | |
| California Statewide CDA Community Improvement Authority Essential Housing Revenue Bond Social Bonds Series 2021B 144A | 4.00 | 4-1-2057 | 500,000 | 355,231 | |
| California Statewide CDA Community Improvement Authority Essential Housing Revenue Bonds Mezzanine Lien Waterscape Apartments Series 2021B 144A | 4.00 | 9-1-2046 | 425,000 | 330,831 | |
| 1,084,684 | |||||
| Miscellaneous revenue: 0.92% | |||||
| Compton CA PFA Refunding Bond 144A | 4.00 | 9-1-2027 | 1,000,000 | 1,000,367 | |
| Tax revenue: 0.76% | |||||
| San Francisco CA City & County RDA CAB Mission Bay South Redevelopment Project Subordinate Bond Series D 144A¤ | 0.00 | 8-1-2026 | 1,000,000 | 829,868 |
| Interest rate | Maturity date | Principal | Value | ||
| Tobacco revenue: 0.26% | |||||
| Northern California Tobacco Securitization Authority Tobacco Settlement CAB Asset-Backed Refunding Bonds Class 2 Series B-2 ¤ | 0.00% | 6-1-2060 | $2,000,000 | $ 287,836 | |
| 4,164,053 | |||||
| Colorado: 11.46% | |||||
| Education revenue: 0.41% | |||||
| Colorado Educational & Cultural Facilities Authority Charter School New Summit 144A | 4.00 | 7-1-2061 | 600,000 | 448,469 | |
| GO revenue: 9.69% | |||||
| Aurora CO Cornerstar Metropolitan District Refunding Bond Series A | 5.25 | 12-1-2047 | 1,000,000 | 950,083 | |
| Berthoud-Heritage CO Metropolitan District # 10 Senior Limited Tax General Obligation Bonds Series 2022A | 4.75 | 12-1-2052 | 500,000 | 406,533 | |
| Colorado Big Dry Creek Metropolitan District Improvement & Refunding Bonds Limited Tax Series A | 5.75 | 12-1-2047 | 1,000,000 | 1,002,699 | |
| Colorado Chambers Highpoint Metropolitan District #2 | 5.00 | 12-1-2051 | 830,000 | 716,570 | |
| Colorado Clear Creek Transit Metropolitan District #2 Series A | 5.00 | 12-1-2050 | 1,000,000 | 866,368 | |
| Colorado Cottonwood Highlands Metropolitan District #1 Limited Tax Series A | 5.00 | 12-1-2049 | 900,000 | 834,712 | |
| Colorado Pronghorn Valley Metropolitan District Limited Tax Series A | 4.00 | 12-1-2051 | 250,000 | 193,830 | |
| Colorado Whispering Pines Metropolitan District #1 Series A | 5.00 | 12-1-2047 | 966,000 | 904,018 | |
| Denver CO International Business Center Metropolitan District #1 Series B | 6.00 | 12-1-2048 | 1,145,000 | 1,145,780 | |
| Eaton CO Area Park & Recreation District | 5.00 | 12-1-2023 | 810,000 | 821,621 | |
| Eaton CO Area Park & Recreation District | 5.50 | 12-1-2030 | 475,000 | 482,771 | |
| Great Western CO Metropolitan District #5 Refunding Bond | 4.75 | 12-1-2050 | 1,000,000 | 884,298 | |
| Hogback Metropolitan District Colorado Limited Tax Convertible Unlimited Tax Series A | 5.00 | 12-1-2051 | 585,000 | 505,052 | |
| Westgate Metropolitan District City of Colorado Springs General Obligation Limited Tax Bonds Series 2022 | 5.13 | 12-1-2051 | 1,000,000 | 837,256 | |
| 10,551,591 | |||||
| Tax revenue: 0.90% | |||||
| Pueblo CO Urban Renewal Authority Regional Tourism Act Project | 5.00 | 6-1-2036 | 1,000,000 | 982,267 | |
| Transportation revenue: 0.46% | |||||
| Colorado High Performance Transportation Enterprise US 36 & I-25 Managed Lanes | 5.75 | 1-1-2044 | 500,000 | 503,586 | |
| 12,485,913 | |||||
| Connecticut: 0.55% | |||||
| GO revenue: 0.55% | |||||
| Hartford CT Series A | 4.00 | 4-1-2032 | 325,000 | 326,762 | |
| Hartford CT Series A | 5.00 | 4-1-2024 | 105,000 | 107,400 | |
| Hartford CT Series B | 5.00 | 4-1-2033 | 50,000 | 50,760 | |
| Hartford CT Unrefunded Bond Series A | 5.00 | 4-1-2029 | 45,000 | 45,079 | |
| Hartford CT Unrefunded Bond Series A | 5.00 | 4-1-2030 | 70,000 | 70,118 | |
| 600,119 |
| Interest rate | Maturity date | Principal | Value | ||
| Delaware: 0.96% | |||||
| Education revenue: 0.96% | |||||
| Delaware EDA Odyssey Charter School Incorporated Project Series A 144A | 7.00% | 9-1-2045 | $1,000,000 | $ 1,048,311 | |
| District of Columbia: 1.64% | |||||
| Miscellaneous revenue: 1.23% | |||||
| District of Columbia Private Activity Revenue Bond Series 2022A | 5.50 | 2-28-2037 | 1,250,000 | 1,340,328 | |
| Tobacco revenue: 0.41% | |||||
| District of Columbia Tobacco Settlement Financing Corporation | 6.75 | 5-15-2040 | 435,000 | 446,532 | |
| 1,786,860 | |||||
| Florida: 5.67% | |||||
| Education revenue: 3.33% | |||||
| Florida Capital Trust Agency Educational Facilities Pineapple Cove Classical Academy Incorporated Project Series A 144A | 5.13 | 7-1-2039 | 2,000,000 | 1,976,536 | |
| Florida Development Finance Corporation Educational Facilities Renaissance Charter School Project Series A | 8.50 | 6-15-2044 | 250,000 | 265,541 | |
| Florida Development Finance Corporation Global Outreach Charter Project 144A | 4.00 | 6-30-2056 | 500,000 | 368,514 | |
| Miami-Dade County FL IDA Youth Co-Op Charter Schools Project Series A 144A | 6.00 | 9-15-2045 | 1,000,000 | 1,014,797 | |
| 3,625,388 | |||||
| Health revenue: 1.08% | |||||
| Holmes County FL Hospital Corporation Doctors Memorial Hospital Project | 6.00 | 11-1-2038 | 250,000 | 235,627 | |
| Lee County IDA Healthcare Facilities Revenue Bond Series 2022A | 5.25 | 10-1-2052 | 1,000,000 | 938,122 | |
| 1,173,749 | |||||
| Miscellaneous revenue: 0.92% | |||||
| City of Leesburg FL Special Assessment Revenue Bond Series 2022 %% | 5.13 | 5-1-2037 | 1,000,000 | 1,003,751 | |
| Water & sewer revenue: 0.34% | |||||
| Charlotte County FL IDA Town and Country Utilities Project Series A 144A | 4.00 | 10-1-2051 | 500,000 | 369,647 | |
| 6,172,535 | |||||
| Georgia: 3.89% | |||||
| Education revenue: 2.22% | |||||
| Georgia Private Colleges & Universities Authority Emory University Revenue Bond Series 2019B | 5.00 | 9-1-2048 | 1,000,000 | 1,075,767 | |
| Georgia Private Colleges & Universities Authority Mercer University Project Series 2022 %% | 5.25 | 10-1-2051 | 1,250,000 | 1,338,132 | |
| 2,413,899 |
| Interest rate | Maturity date | Principal | Value | ||
| Housing revenue: 0.75% | |||||
| Cobb County GA Development Authority Student Housing Kennesaw State University Foundation Project Refunding Bond Series C | 5.00% | 7-15-2028 | $ 800,000 | $ 814,019 | |
| Transportation revenue: 0.92% | |||||
| Georgia Road & Tollway Authority CCAB I-75 South Expressway Lanes Project Series B 144A¤ | 0.00 | 6-1-2049 | 1,000,000 | 1,007,490 | |
| 4,235,408 | |||||
| Idaho: 0.23% | |||||
| Education revenue: 0.23% | |||||
| Idaho Housing & Finance Association Legacy Public Charter School Incorporated Project Series A | 6.25 | 5-1-2043 | 250,000 | 252,385 | |
| Illinois: 10.31% | |||||
| Education revenue: 1.56% | |||||
| Illinois Finance Authority Acero Charter Schools Incorporated 144A | 4.00 | 10-1-2042 | 250,000 | 212,808 | |
| Illinois Finance Authority Charter School Aid Intrinsic Schools Belmont School Project Series A 144A | 5.25 | 12-1-2025 | 655,000 | 674,536 | |
| Illinois Finance Authority Charter School Art in Motion Project Social Bonds Series A 144A | 5.00 | 7-1-2051 | 1,000,000 | 814,223 | |
| 1,701,567 | |||||
| GO revenue: 4.59% | |||||
| Chicago IL Board of Education CAB School Reform Series A (NPFGC Insured) ¤ | 0.00 | 12-1-2025 | 500,000 | 443,761 | |
| Chicago IL Series A | 6.00 | 1-1-2038 | 1,500,000 | 1,610,254 | |
| Cook County IL School District #144 Prairie Hills CAB Refunding Bond Series C (AGM Insured) ¤ | 0.00 | 12-1-2025 | 730,000 | 654,652 | |
| Lake County IL Community Unit School District #187 North Chicago CAB Series A (AGM Insured) ¤ | 0.00 | 1-1-2023 | 590,000 | 583,356 | |
| Will County IL Community High School CAB Refunding Bond Series B (BAM Insured) ¤ | 0.00 | 1-1-2033 | 1,000,000 | 660,935 | |
| Will County IL Community High School Refunding Bond Series A (BAM Insured) | 3.25 | 1-1-2030 | 450,000 | 450,016 | |
| Will County IL Lincoln-Way Community High School District #210 CAB Refunding Bond Series B (BAM Insured) ¤ | 0.00 | 1-1-2027 | 685,000 | 594,611 | |
| 4,997,585 | |||||
| Miscellaneous revenue: 1.97% | |||||
| Chicago IL Certificate of Participation River Point Plaza Redevelopment Project Series A 144A | 4.84 | 4-15-2028 | 1,446,000 | 1,457,314 | |
| Illinois Finance Authority Educational Facility Senior Rogers Park Montessori School | 6.00 | 2-1-2034 | 680,000 | 693,425 | |
| 2,150,739 |
| Interest rate | Maturity date | Principal | Value | ||
| Tax revenue: 2.19% | |||||
| Hillside IL Tax Increment Refunding Bond | 5.00% | 1-1-2030 | $1,345,000 | $ 1,347,668 | |
| Illinois Sports Facilities Authority State Tax Supported CAB (Ambac Insured) ¤ | 0.00 | 6-15-2025 | 1,140,000 | 1,036,958 | |
| 2,384,626 | |||||
| 11,234,517 | |||||
| Indiana: 1.92% | |||||
| Education revenue: 1.92% | |||||
| Indiana Finance Authority Educational Facilities Multipurpose DePauw University Project Series 2022A | 5.00 | 7-1-2047 | 2,055,000 | 2,095,703 | |
| Iowa: 0.33% | |||||
| Tobacco revenue: 0.33% | |||||
| Iowa Tobacco Settlement Authority CAB Asset-Backed Bonds Class 2 Series B-2 ¤ | 0.00 | 6-1-2065 | 3,490,000 | 356,260 | |
| Kansas: 1.83% | |||||
| Health revenue: 0.81% | |||||
| Kansas State Development Finance Authority Revenue Bond Series A | 5.25 | 11-15-2033 | 1,000,000 | 883,671 | |
| Tax revenue: 1.02% | |||||
| Wyandotte County & Kansas City KS Special Obligation Improvement & Refunding Bonds Plaza Redevelopment Project | 4.00 | 12-1-2028 | 355,000 | 327,531 | |
| Wyandotte County & Kansas City KS Special Obligation Vacation Village Project Area 4 Major Multi-Sport Athletic Complex Project CAB Series 2015 144A¤ | 0.00 | 9-1-2034 | 2,760,000 | 776,914 | |
| 1,104,445 | |||||
| 1,988,116 | |||||
| Kentucky: 0.87% | |||||
| Health revenue: 0.87% | |||||
| Kentucky EDFA Rosedale Green Project Refunding Bond | 5.50 | 11-15-2035 | 1,000,000 | 943,013 | |
| Maryland: 1.34% | |||||
| Education revenue: 0.96% | |||||
| Prince George's County MD Chesapeake Lighthouse Charter School Project Series 2016-A 144A | 6.90 | 8-1-2041 | 1,000,000 | 1,048,675 | |
| Miscellaneous revenue: 0.38% | |||||
| Maryland Economic Development Corporation Special Obligation Covington Project | 4.00 | 9-1-2050 | 500,000 | 406,076 | |
| 1,454,751 | |||||
| Massachusetts: 0.88% | |||||
| Health revenue: 0.88% | |||||
| Massachusetts Development Finance Agency Revenue Refunding Bond Series 2022 | 5.13 | 1-1-2040 | 1,000,000 | 962,554 |
| Interest rate | Maturity date | Principal | Value | ||
| Michigan: 2.99% | |||||
| Education revenue: 0.38% | |||||
| Michigan Finance Authority Limited Obligation Refunding Bond Public School Academy Bradford | 4.80% | 9-1-2040 | $ 150,000 | $ 129,202 | |
| Michigan Public Educational Facilities Authority Limited Obligation Crescent Academy Project | 7.00 | 10-1-2036 | 292,500 | 292,681 | |
| 421,883 | |||||
| Miscellaneous revenue: 1.21% | |||||
| Charyl Stockwell Academy Michigan Public School Refunding Bond | 4.88 | 10-1-2023 | 140,000 | 139,218 | |
| Michigan Finance Authority Local Government Loan Program City of Detroit Financial Recovery Refunding Bonds Series F | 4.50 | 10-1-2029 | 1,000,000 | 1,007,792 | |
| Michigan Public Educational Facilities Authority Chandler Park Academy Project | 6.35 | 11-1-2028 | 170,000 | 170,126 | |
| 1,317,136 | |||||
| Tax revenue: 1.40% | |||||
| Detroit MI Downtown Development Authority CAB ¤ | 0.00 | 7-1-2024 | 20,000 | 18,136 | |
| Detroit MI Downtown Development Authority CAB ¤ | 0.00 | 7-1-2025 | 580,000 | 497,933 | |
| Michigan Finance Authority Local Government Loan Program Public Lighting Authority Refunding Bonds Series B | 5.00 | 7-1-2044 | 1,000,000 | 1,007,540 | |
| 1,523,609 | |||||
| 3,262,628 | |||||
| Minnesota: 2.74% | |||||
| Education revenue: 1.60% | |||||
| Deephaven MN Charter School Eagle Ridge Academy Project Series 2015-A | 4.40 | 7-1-2025 | 65,000 | 65,363 | |
| Deephaven MN Charter School Eagle Ridge Academy Project Series 2015-A | 5.00 | 7-1-2030 | 195,000 | 198,899 | |
| St. Cloud MN Charter School Lease Revenue Bonds Athlos Academy of St. Cloud Series A 144A | 5.25 | 6-1-2032 | 1,000,000 | 965,873 | |
| Woodbury MN Charter School Woodbury Leadership Academy | 4.00 | 7-1-2051 | 660,000 | 513,374 | |
| 1,743,509 | |||||
| Health revenue: 0.46% | |||||
| Shakopee MN Senior Housing Revenue Benedictine Living Community LLC Project 144A | 5.85 | 11-1-2058 | 500,000 | 499,058 | |
| Housing revenue: 0.68% | |||||
| Minneapolis MN Student Housing Riverton Community Housing Project Refunding Bond | 4.70 | 8-1-2026 | 335,000 | 337,884 | |
| Minneapolis MN Student Housing Riverton Community Housing Project Refunding Bond | 4.80 | 8-1-2027 | 400,000 | 403,439 | |
| 741,323 | |||||
| 2,983,890 |
| Interest rate | Maturity date | Principal | Value | ||
| Missouri: 0.61% | |||||
| Tax revenue: 0.61% | |||||
| Blue Springs MO Special Obligation Tax Improvement & Refunding Bonds Adams Farm Project Series A | 4.00% | 6-1-2026 | $ 70,000 | $ 67,134 | |
| Richmond Heights MO Francis Place Redevelopment Project | 5.63 | 11-1-2025 | 615,000 | 597,205 | |
| 664,339 | |||||
| New Jersey: 3.86% | |||||
| Education revenue: 1.09% | |||||
| Camden County NJ Improvement Authority Charter School Revenue Bond Series 2022 144A | 5.00 | 7-15-2042 | 1,175,000 | 1,183,625 | |
| GO revenue: 0.97% | |||||
| Newark NJ Qualified General Improvement Series A | 5.00 | 7-15-2027 | 1,000,000 | 1,061,264 | |
| Industrial development revenue: 0.23% | |||||
| New Jersey EDA Continental Airlines Incorporated Project | 5.25 | 9-15-2029 | 250,000 | 252,877 | |
| Transportation revenue: 1.57% | |||||
| New Jersey TTFA CAB Series A ¤ | 0.00 | 12-15-2031 | 1,000,000 | 678,449 | |
| New Jersey TTFA Transportation System Series C | 5.25 | 6-15-2032 | 1,000,000 | 1,033,454 | |
| 1,711,903 | |||||
| 4,209,669 | |||||
| New Mexico: 1.06% | |||||
| Tax revenue: 1.06% | |||||
| Winrock Town Center NM Tax Increment Development District #1 Senior Lien Gross Receipts Tax Increment Bonds Series 2022 144A | 4.25 | 5-1-2040 | 1,375,000 | 1,160,008 | |
| New York: 7.42% | |||||
| Airport revenue: 1.58% | |||||
| New York Transportation Development Corporation Special Facilities Revenue Bond Series 2022 | 5.00 | 12-1-2041 | 1,660,000 | 1,716,399 | |
| Education revenue: 3.94% | |||||
| Build NYC Resource Corporation Friends of Hellenic Classical 144A | 5.00 | 12-1-2041 | 1,200,000 | 1,195,456 | |
| Build NYC Resource Corporation New World Preparatory Charter School | 4.00 | 6-15-2051 | 690,000 | 545,121 | |
| Hempstead NY Local Development Corporation The Academy Charter School Project Series A | 4.60 | 2-1-2051 | 500,000 | 390,724 | |
| Hempstead NY Local Development Corporation The Academy Charter School Project Series A | 5.73 | 2-1-2050 | 1,000,000 | 1,006,659 | |
| New York Dormitory Authority Supported Debt St. Josephs College | 4.00 | 7-1-2035 | 400,000 | 385,120 | |
| New York Dormitory Authority Supported Debt St. Josephs College | 5.00 | 7-1-2051 | 750,000 | 774,584 | |
| 4,297,664 |
| Interest rate | Maturity date | Principal | Value | ||
| Health revenue: 1.66% | |||||
| Dutchess County NY Local Development Corporation Series B | 4.00% | 7-1-2049 | $ 910,000 | $ 810,610 | |
| Westchester County NY Local Development Corporation Revenue Bond Series 2016 | 5.00 | 11-1-2046 | 1,000,000 | 1,000,072 | |
| 1,810,682 | |||||
| Tobacco revenue: 0.24% | |||||
| Suffolk County NY Tobacco Securitization Corporation Settlement CAB Asset-Backed Bonds ¤ | 0.00 | 6-1-2066 | 2,500,000 | 256,913 | |
| 8,081,658 | |||||
| Ohio: 3.04% | |||||
| Education revenue: 0.45% | |||||
| Ohio Higher Education Facility Commission The Cleveland Institute of Music 2022 Project | 5.38 | 12-1-2052 | 500,000 | 494,484 | |
| Resource recovery revenue: 0.80% | |||||
| Southern Ohio Port Authority Exempt Facility Revenue PureCycle Project 144A | 7.00 | 12-1-2042 | 1,000,000 | 865,184 | |
| Tobacco revenue: 1.79% | |||||
| Buckeye Tobacco Settlement Financing Authority CAB ¤ | 0.00 | 6-1-2057 | 8,000,000 | 1,026,419 | |
| Buckeye Tobacco Settlement Financing Authority CAB | 5.00 | 6-1-2055 | 985,000 | 927,505 | |
| 1,953,924 | |||||
| 3,313,592 | |||||
| Oregon: 1.94% | |||||
| Health revenue: 1.94% | |||||
| Oregon Facilities Authority Revenue Refunding Bond Samaritan Health Services Project Series A | 5.00 | 10-1-2040 | 1,685,000 | 1,772,082 | |
| Polk County OR Hospital Facility Authority Revenue Bond Dallas Retirement Village Project Series 2015-A | 5.00 | 7-1-2025 | 345,000 | 345,282 | |
| 2,117,364 | |||||
| Pennsylvania: 4.27% | |||||
| Education revenue: 0.61% | |||||
| Allegheny County PA IDA Propel Charter School Sunrise Project | 5.25 | 7-15-2023 | 25,000 | 25,253 | |
| Philadelphia PA IDA Independence Charter School Project | 5.00 | 6-15-2039 | 250,000 | 250,486 | |
| Philadelphia PA IDA Tacony Academy Charter School Project | 6.88 | 6-15-2033 | 375,000 | 386,965 | |
| 662,704 | |||||
| Health revenue: 1.84% | |||||
| Lancaster County Hospital Authority Series 2021 | 5.00 | 11-1-2051 | 1,000,000 | 1,049,486 | |
| Quakertown PA General Authority Health LifeQuest Obligated Group Refunding Bond Series C | 5.30 | 7-1-2042 | 1,000,000 | 953,248 | |
| 2,002,734 | |||||
| Miscellaneous revenue: 0.87% | |||||
| Chester County PA IDA Woodlands at Graystone Project Series 2018 144A | 5.13 | 3-1-2048 | 987,000 | 952,129 |
| Interest rate | Maturity date | Principal | Value | ||
| Utilities revenue: 0.95% | |||||
| Philadelphia PA Gas Works Revenue Fifteenth Series | 5.00% | 8-1-2047 | $1,000,000 | $ 1,039,018 | |
| 4,656,585 | |||||
| South Carolina: 2.28% | |||||
| Education revenue: 1.01% | |||||
| South Carolina Jobs EDA Refunding Bond Columbia College Project | 5.75 | 10-1-2045 | 500,000 | 473,612 | |
| South Carolina Jobs EDA York Preparatory Academy Project Series A | 5.75 | 11-1-2023 | 65,000 | 67,108 | |
| South Carolina Jobs EDA York Preparatory Academy Project Series A | 7.25 | 11-1-2045 | 500,000 | 557,206 | |
| 1,097,926 | |||||
| Health revenue: 0.83% | |||||
| South Carolina Jobs EDA Residential Facilities Revenue Episcopal Home Still Hopes Refunding Bond Series A | 5.00 | 4-1-2048 | 1,000,000 | 904,762 | |
| Resource recovery revenue: 0.44% | |||||
| South Carolina Jobs EDA † | 8.00 | 12-6-2029 | 100,000 | 82,637 | |
| South Carolina Jobs EDA Solid Waste Disposal AMT RePower South Berkeley LLC Project Green Bond 144A† | 6.25 | 2-1-2045 | 1,000,000 | 400,000 | |
| 482,637 | |||||
| 2,485,325 | |||||
| Tennessee: 1.03% | |||||
| Tax revenue: 1.03% | |||||
| Bristol TN Industrial Development Board Sales Tax CAB Series B 144A¤ | 0.00 | 12-1-2031 | 1,000,000 | 608,780 | |
| Nashville TN Metropolitan Development & Housing Agency Tax Increment Fifth & Broadway Development Project 144A | 5.13 | 6-1-2036 | 500,000 | 509,792 | |
| 1,118,572 | |||||
| Texas: 3.22% | |||||
| Education revenue: 1.56% | |||||
| Arlington TX Higher Education Finance Corporation Refunding Bond Wayside Schools Series A | 4.00 | 8-15-2046 | 860,000 | 695,711 | |
| Arlington TX Higher Education Finance Corporation Universal Academy Series A | 7.00 | 3-1-2034 | 320,000 | 330,894 | |
| Pottsboro TX Higher Education Finance Corporation Imagine International Academy of North Texas Series A | 3.88 | 8-15-2026 | 695,000 | 677,055 | |
| 1,703,660 | |||||
| GO revenue: 0.89% | |||||
| Port Isabel TX Series 2019 144A | 5.10 | 2-15-2049 | 950,000 | 969,580 | |
| Tax revenue: 0.39% | |||||
| Baytown TX Municipal Development District Hotel Second Lien Baytown Convention 144A | 5.00 | 10-1-2050 | 500,000 | 426,011 | |
| Transportation revenue: 0.19% | |||||
| Texas Private Activity Bond Surface Transportation Corporation Project NTE Mobility Partners Segments LLC | 7.00 | 12-31-2038 | 200,000 | 206,741 |
| Interest rate | Maturity date | Principal | Value | ||
| Utilities revenue: 0.19% | |||||
| Texas Gas Supply SA Energy Acquisition Public Facilities Corporation | 5.50% | 8-1-2027 | $ 190,000 | $ 206,240 | |
| 3,512,232 | |||||
| Utah: 2.36% | |||||
| Education revenue: 0.91% | |||||
| Utah Charter School Finance Authority Freedom Academy Foundation St. George 144A | 5.00 | 6-15-2041 | 1,020,000 | 987,216 | |
| Miscellaneous revenue: 0.71% | |||||
| Mida Mountain Village Public Infrastructure District Utah Special Assessment Revenue Bonds Area #2 Series 2021 144A | 4.00 | 8-1-2050 | 1,000,000 | 773,781 | |
| Tax revenue: 0.74% | |||||
| Utah Inland Port Authority Crossroads Public Infrastructure District Tax Differential Revenue 144A | 4.38 | 6-1-2052 | 1,000,000 | 808,349 | |
| 2,569,346 | |||||
| Virginia: 0.78% | |||||
| Health revenue: 0.78% | |||||
| Roanoke VA EDA Residential Care Richfield Living | 5.13 | 9-1-2055 | 1,210,000 | 845,798 | |
| West Virginia: 1.40% | |||||
| Tax revenue: 1.40% | |||||
| Monongalia County WV Commission Improvement & Refunding Bonds University Town Center Series A 144A | 5.75 | 6-1-2043 | 1,500,000 | 1,526,796 | |
| Wisconsin: 5.92% | |||||
| Education revenue: 4.67% | |||||
| Public Finance Authority WI Education Revenue Bond Uwharrie Charter Academy Project Series 2022A 144A | 5.00 | 6-15-2042 | 1,310,000 | 1,260,370 | |
| Wisconsin PFA Charter School Voyager Funding Incorporated Project Series A | 4.13 | 10-1-2024 | 95,000 | 95,616 | |
| Wisconsin PFA Coral Academy Science Las Vegas Series A | 5.00 | 7-1-2024 | 160,000 | 162,694 | |
| Wisconsin PFA Educational Facility Revenue Refunding Bond Estancia Valley Classical 144A | 4.25 | 7-1-2051 | 1,000,000 | 746,582 | |
| Wisconsin PFA Research Triangle High School Project Series 2015-A 144A | 5.63 | 7-1-2045 | 1,000,000 | 1,016,315 | |
| Wisconsin PFA Revenue and Revenue Refunding Bonds Roseman University Sciences Project Series 2022 144A | 4.00 | 4-1-2052 | 625,000 | 499,034 | |
| Wisconsin PFA Wilson Preparatory Academy Series A 144A | 5.00 | 6-15-2039 | 1,285,000 | 1,305,630 | |
| 5,086,241 | |||||
| Health revenue: 1.25% | |||||
| Wisconsin HEFA Wisconsin Illinois Senior Housing Incorporated Series 2018-A | 5.25 | 8-1-2048 | 1,500,000 | 1,359,884 | |
| 6,446,125 | |||||
| Total Municipal obligations (Cost $109,235,221) | 102,567,029 |
| Yield | Shares | Value | |||
| Short-term investments: 5.13% | |||||
| Investment companies: 5.13% | |||||
| Allspring Municipal Cash Management Money Market Fund Institutional Class ♠∞## | 0.85% | 5,590,566 | $ 5,593,920 | ||
| Total Short-term investments (Cost $5,593,920) | 5,593,920 | ||||
| Total investments in securities (Cost $114,829,141) | 99.27% | 108,160,949 | |||
| Other assets and liabilities, net | 0.73 | 792,927 | |||
| Total net assets | 100.00% | $108,953,876 |
| ¤ | The security is issued in zero coupon form with no periodic interest payments. |
| 144A | The security may be resold in transactions exempt from registration, normally to qualified institutional buyers, pursuant to Rule 144A under the Securities Act of 1933. |
| † | Non-income-earning security |
| ## | All or a portion of this security is segregated for when-issued securities. |
| ♠ | The issuer of the security is an affiliated person of the Fund as defined in the Investment Company Act of 1940. |
| ∞ | The rate represents the 7-day annualized yield at period end. |
| %% | The security is purchased on a when-issued basis. |
| Abbreviations: | |
| AGM | Assured Guaranty Municipal |
| Ambac | Ambac Financial Group Incorporated |
| AMT | Alternative minimum tax |
| BAM | Build America Mutual Assurance Company |
| CAB | Capital appreciation bond |
| CCAB | Convertible capital appreciation bond |
| CDA | Community Development Authority |
| EDA | Economic Development Authority |
| EDFA | Economic Development Finance Authority |
| GO | General obligation |
| HEFA | Health & Educational Facilities Authority |
| IDA | Industrial Development Authority |
| NPFGC | National Public Finance Guarantee Corporation |
| PFA | Public Finance Authority |
| RDA | Redevelopment Authority |
| TTFA | Transportation Trust Fund Authority |
| Value, beginning of period | Purchases | Sales proceeds | Net realized gains (losses) | Net change in unrealized gains (losses) | Value, end of period | Shares, end of period | Income from affiliated securities | |
| Short-term investments | ||||||||
| Allspring Municipal Cash Management Money Market Fund Institutional Class | $2,812,701 | $68,384,175 | $(65,605,604) | $2,648 | $0 | $5,593,920 | 5,590,566 | $13,822 |
| Assets | |
Investments in unaffiliated securities, at value (cost $109,235,221) | $ 102,567,029 |
Investments in affiliated securities, at value (cost $5,593,920) | 5,593,920 |
Receivable for Fund shares sold | 1,267,649 |
Receivable for interest | 1,256,477 |
Receivable for investments sold | 876,687 |
Prepaid expenses and other assets | 49,740 |
Total assets | 111,611,502 |
| Liabilities | |
Payable for when-issued transactions | 2,380,100 |
Payable for Fund shares redeemed | 197,695 |
Management fee payable | 25,333 |
Dividends payable | 16,229 |
Administration fees payable | 10,623 |
Distribution fee payable | 3,956 |
Trustees’ fees and expenses payable | 2,488 |
Accrued expenses and other liabilities | 21,202 |
Total liabilities | 2,657,626 |
Total net assets | $108,953,876 |
| Net assets consist of | |
Paid-in capital | $ 117,350,153 |
Total distributable loss | (8,396,277) |
Total net assets | $108,953,876 |
| Computation of net asset value and offering price per share | |
Net assets – Class A | $ 37,137,913 |
Shares outstanding – Class A1 | 3,883,169 |
Net asset value per share – Class A | $9.56 |
Maximum offering price per share – Class A2 | $10.01 |
Net assets – Class C | $ 6,435,097 |
Shares outstanding – Class C1 | 672,831 |
Net asset value per share – Class C | $9.56 |
Net assets – Class R6 | $ 23,185 |
Shares outstanding – Class R61 | 2,418 |
Net asset value per share – Class R6 | $9.59 |
Net assets – Administrator Class | $ 8,586,791 |
Shares outstanding – Administrator Class1 | 897,508 |
Net asset value per share – Administrator Class | $9.57 |
Net assets – Institutional Class | $ 56,770,890 |
Shares outstanding – Institutional Class1 | 5,936,341 |
Net asset value per share – Institutional Class | $9.56 |
| 1 | The Fund has an unlimited number of authorized shares. |
| 2 | Maximum offering price is computed as 100/95.50 of net asset value. On investments of $50,000 or more, the offering price is reduced. |
| Investment income | |
Interest | $ 4,529,398 |
Income from affiliated securities | 13,822 |
Total investment income | 4,543,220 |
| Expenses | |
Management fee | 514,811 |
| Administration fees | |
Class A | 62,808 |
Class C | 12,480 |
Class R6 | 7 |
Administrator Class | 9,340 |
Institutional Class | 37,234 |
| Shareholder servicing fees | |
Class A | 96,919 |
Class C | 19,129 |
Administrator Class | 23,274 |
| Distribution fee | |
Class C | 57,386 |
Custody and accounting fees | 9,166 |
Professional fees | 58,762 |
Registration fees | 73,416 |
Shareholder report expenses | 31,102 |
Trustees’ fees and expenses | 20,033 |
Other fees and expenses | 8,441 |
Total expenses | 1,034,308 |
| Less: Fee waivers and/or expense reimbursements | |
Fund-level | (227,255) |
Class A | (35,329) |
Class C | (5,460) |
Administrator Class | (13,076) |
Net expenses | 753,188 |
Net investment income | 3,790,032 |
| Realized and unrealized gains (losses) on investments | |
| Net realized gains (losses) on | |
Unaffiliated securities | (1,708,278) |
Affiliated securities | 2,648 |
Net realized losses on investments | (1,705,630) |
Net change in unrealized gains (losses) on investments | (13,871,298) |
Net realized and unrealized gains (losses) on investments | (15,576,928) |
Net decrease in net assets resulting from operations | $(11,786,896) |
| Year ended June 30, 2022 | Year ended June 30, 2021 | |||
| Operations | ||||
Net investment income | $ 3,790,032 | $ 3,440,985 | ||
Net realized gains (losses) on investments | (1,705,630) | 911,892 | ||
Net change in unrealized gains (losses) on investments | (13,871,298) | 5,105,151 | ||
Net increase (decrease) in net assets resulting from operations | (11,786,896) | 9,458,028 | ||
| Distributions to shareholders from | ||||
| Net investment income and net realized gains | ||||
Class A | (1,572,805) | (1,172,015) | ||
Class C | (252,745) | (269,688) | ||
Class R6 | (1,044) | (1,024) | ||
Administrator Class | (384,186) | (411,592) | ||
Institutional Class | (1,958,274) | (1,575,840) | ||
Total distributions to shareholders | (4,169,054) | (3,430,159) | ||
| Capital share transactions | Shares | Shares | ||
| Proceeds from shares sold | ||||
Class A | 1,829,910 | 19,247,400 | 1,673,934 | 18,163,880 |
Class C | 121,872 | 1,282,715 | 79,503 | 849,819 |
Administrator Class | 874,425 | 8,646,964 | 315,942 | 3,377,804 |
Institutional Class | 5,497,610 | 54,759,627 | 1,898,693 | 20,587,992 |
| 83,936,706 | 42,979,495 | |||
| Reinvestment of distributions | ||||
Class A | 141,735 | 1,500,548 | 102,915 | 1,113,891 |
Class C | 23,517 | 249,871 | 24,792 | 267,616 |
Class R6 | 62 | 645 | 0 | 0 |
Administrator Class | 20,739 | 219,472 | 23,595 | 254,696 |
Institutional Class | 185,327 | 1,946,947 | 144,580 | 1,563,015 |
| 3,917,483 | 3,199,218 | |||
| Payment for shares redeemed | ||||
Class A | (1,451,197) | (15,179,217) | (790,074) | (8,625,088) |
Class C | (231,805) | (2,409,232) | (231,430) | (2,501,505) |
Administrator Class | (866,104) | (8,538,467) | (536,005) | (5,758,070) |
Institutional Class | (3,730,743) | (36,960,703) | (1,610,196) | (17,407,832) |
| (63,087,619) | (34,292,495) | |||
Net increase in net assets resulting from capital share transactions | 24,766,570 | 11,886,218 | ||
Total increase in net assets | 8,810,620 | 17,914,087 | ||
| Net assets | ||||
Beginning of period | 100,143,256 | 82,229,169 | ||
End of period | $108,953,876 | $100,143,256 | ||
| Year ended June 30 | |||||
| Class A | 2022 | 2021 | 2020 | 2019 | 2018 |
Net asset value, beginning of period | $11.16 | $10.43 | $10.97 | $10.59 | $10.37 |
Net investment income | 0.38 | 0.41 | 0.44 | 0.39 | 0.40 |
Net realized and unrealized gains (losses) on investments | (1.56) | 0.73 | (0.54) | 0.38 | 0.22 |
Total from investment operations | (1.18) | 1.14 | (0.10) | 0.77 | 0.62 |
| Distributions to shareholders from | |||||
Net investment income | (0.38) | (0.41) | (0.44) | (0.39) | (0.40) |
Net realized gains | (0.04) | 0.00 | 0.00 | 0.00 | 0.00 |
Total distributions to shareholders | (0.42) | (0.41) | (0.44) | (0.39) | (0.40) |
Net asset value, end of period | $9.56 | $11.16 | $10.43 | $10.97 | $10.59 |
Total return1 | (10.84)% | 10.98% | (0.98)% | 7.43% | 6.11% |
| Ratios to average net assets (annualized) | |||||
Gross expenses | 1.10% | 1.14% | 1.12% | 1.09% | 1.07% |
Net expenses | 0.80% | 0.80% | 0.80% | 0.80% | 0.85% |
Net investment income | 3.61% | 3.74% | 4.05% | 3.68% | 3.82% |
| Supplemental data | |||||
Portfolio turnover rate | 30% | 55% | 14% | 20% | 50% |
Net assets, end of period (000s omitted) | $37,138 | $37,514 | $24,791 | $23,674 | $17,086 |
| 1 | Total return calculations do not include any sales charges. |
| Year ended June 30 | |||||
| Class C | 2022 | 2021 | 2020 | 2019 | 2018 |
Net asset value, beginning of period | $11.16 | $10.44 | $10.97 | $10.59 | $10.37 |
Net investment income | 0.30 | 0.32 | 0.36 | 0.31 | 0.32 |
Net realized and unrealized gains (losses) on investments | (1.55) | 0.72 | (0.53) | 0.38 | 0.22 |
Total from investment operations | (1.25) | 1.04 | (0.17) | 0.69 | 0.54 |
| Distributions to shareholders from | |||||
Net investment income | (0.31) | (0.32) | (0.36) | (0.31) | (0.32) |
Net realized gains | (0.04) | 0.00 | 0.00 | 0.00 | 0.00 |
Total distributions to shareholders | (0.35) | (0.32) | (0.36) | (0.31) | (0.32) |
Net asset value, end of period | $9.56 | $11.16 | $10.44 | $10.97 | $10.59 |
Total return1 | (11.51)% | 10.14% | (1.63)% | 6.63% | 5.32% |
| Ratios to average net assets (annualized) | |||||
Gross expenses | 1.84% | 1.89% | 1.87% | 1.84% | 1.82% |
Net expenses | 1.55% | 1.55% | 1.55% | 1.55% | 1.60% |
Net investment income | 2.84% | 3.02% | 3.29% | 2.91% | 3.09% |
| Supplemental data | |||||
Portfolio turnover rate | 30% | 55% | 14% | 20% | 50% |
Net assets, end of period (000s omitted) | $6,435 | $8,471 | $9,250 | $9,955 | $8,896 |
| 1 | Total return calculations do not include any sales charges. |
| Year ended June 30 | ||||
| Class R6 | 2022 | 2021 | 2020 | 2019 1 |
Net asset value, beginning of period | $11.16 | $10.44 | $10.98 | $10.61 |
Net investment income | 0.42 | 0.44 | 0.47 | 0.39 |
Net realized and unrealized gains (losses) on investments | (1.55) | 0.71 | (0.54) | 0.37 |
Total from investment operations | (1.13) | 1.15 | (0.07) | 0.76 |
| Distributions to shareholders from | ||||
Net investment income | (0.40) | (0.43) | (0.47) | (0.39) |
Net realized gains | (0.04) | 0.00 | 0.00 | 0.00 |
Total distributions to shareholders | (0.44) | (0.43) | (0.47) | (0.39) |
Net asset value, end of period | $9.59 | $11.16 | $10.44 | $10.98 |
Total return2 | (10.53)% | 11.28% | (0.68)% | 7.29% |
| Ratios to average net assets (annualized) | ||||
Gross expenses | 0.72% | 0.76% | 0.73% | 0.71% |
Net expenses | 0.50% | 0.50% | 0.50% | 0.50% |
Net investment income | 3.91% | 4.07% | 4.34% | 3.96% |
| Supplemental data | ||||
Portfolio turnover rate | 30% | 55% | 14% | 20% |
Net assets, end of period (000s omitted) | $23 | $26 | $25 | $26 |
| 1 | For the period from July 31, 2018 (commencement of class operations) to June 30, 2019 |
| 2 | Returns for periods of less than one year are not annualized. |
| Year ended June 30 | |||||
| Administrator Class | 2022 | 2021 | 2020 | 2019 | 2018 |
Net asset value, beginning of period | $11.16 | $10.44 | $10.98 | $10.59 | $10.37 |
Net investment income | 0.40 | 0.42 | 0.45 | 0.40 | 0.41 |
Net realized and unrealized gains (losses) on investments | (1.55) | 0.72 | (0.54) | 0.39 | 0.22 |
Total from investment operations | (1.15) | 1.14 | (0.09) | 0.79 | 0.63 |
| Distributions to shareholders from | |||||
Net investment income | (0.40) | (0.42) | (0.45) | (0.40) | (0.41) |
Net realized gains | (0.04) | 0.00 | 0.00 | 0.00 | 0.00 |
Total distributions to shareholders | (0.44) | (0.42) | (0.45) | (0.40) | (0.41) |
Net asset value, end of period | $9.57 | $11.16 | $10.44 | $10.98 | $10.59 |
Total return | (10.65)% | 11.10% | (0.87)% | 7.64% | 6.21% |
| Ratios to average net assets (annualized) | |||||
Gross expenses | 1.05% | 1.08% | 1.05% | 1.03% | 1.01% |
Net expenses | 0.68% | 0.69% | 0.70% | 0.71% | 0.75% |
Net investment income | 3.73% | 3.88% | 4.12% | 3.69% | 3.93% |
| Supplemental data | |||||
Portfolio turnover rate | 30% | 55% | 14% | 20% | 50% |
Net assets, end of period (000s omitted) | $8,587 | $9,692 | $11,115 | $15,704 | $24,627 |
| Year ended June 30 | |||||
| Institutional Class | 2022 | 2021 | 2020 | 2019 | 2018 |
Net asset value, beginning of period | $11.15 | $10.43 | $10.97 | $10.59 | $10.37 |
Net investment income | 0.41 | 0.43 | 0.46 | 0.42 | 0.43 |
Net realized and unrealized gains (losses) on investments | (1.55) | 0.72 | (0.53) | 0.38 | 0.22 |
Total from investment operations | (1.14) | 1.15 | (0.07) | 0.80 | 0.65 |
| Distributions to shareholders from | |||||
Net investment income | (0.41) | (0.43) | (0.47) | (0.42) | (0.43) |
Net realized gains | (0.04) | 0.00 | 0.00 | 0.00 | 0.00 |
Total distributions to shareholders | (0.45) | (0.43) | (0.47) | (0.42) | (0.43) |
Net asset value, end of period | $9.56 | $11.15 | $10.43 | $10.97 | $10.59 |
Total return | (10.54)% | 11.15% | (0.74)% | 7.70% | 6.37% |
| Ratios to average net assets (annualized) | |||||
Gross expenses | 0.77% | 0.81% | 0.78% | 0.76% | 0.74% |
Net expenses | 0.55% | 0.55% | 0.55% | 0.55% | 0.60% |
Net investment income | 3.87% | 4.00% | 4.24% | 3.92% | 4.09% |
| Supplemental data | |||||
Portfolio turnover rate | 30% | 55% | 14% | 20% | 50% |
Net assets, end of period (000s omitted) | $56,771 | $44,440 | $37,049 | $85,187 | $75,560 |
| Gross unrealized gains | $ 1,631,096 |
| Gross unrealized losses | (8,397,584) |
| Net unrealized losses | $(6,766,488) |
| ■ | Level 1 – quoted prices in active markets for identical securities |
| ■ | Level 2 – other significant observable inputs (including quoted prices for similar securities, interest rates, prepayment speeds, credit risk, etc.) |
| ■ | Level 3 – significant unobservable inputs (including the Fund’s own assumptions in determining the fair value of investments) |
| Quoted prices (Level 1) | Other significant observable inputs (Level 2) | Significant unobservable inputs (Level 3) | Total | |
| Assets | ||||
| Investments in: | ||||
| Municipal obligations | $ 0 | $ 102,567,029 | $0 | $ 102,567,029 |
| Short-term investments | ||||
| Investment companies | 5,593,920 | 0 | 0 | 5,593,920 |
| Total assets | $5,593,920 | $102,567,029 | $0 | $108,160,949 |
| Average daily net assets | Management fee |
| First $500 million | 0.500% |
| Next $500 million | 0.475 |
| Next $2 billion | 0.450 |
| Next $2 billion | 0.425 |
| Next $5 billion | 0.390 |
| Over $10 billion | 0.380 |
| Class-level administration fee | |
| Class A | 0.16% |
| Class C | 0.16 |
| Class R6 | 0.03 |
| Administrator Class | 0.10 |
| Institutional Class | 0.08 |
| Expense ratio caps | |
| Class A | 0.80% |
| Class C | 1.55 |
| Class R6 | 0.50 |
| Administrator Class | 0.70 |
| Institutional Class | 0.55 |
| Year ended June 30 | ||
| 2022 | 2021 | |
| Ordinary income | $ 363,427 | $ 0 |
| Tax-exempt income | 3,800,802 | 3,430,159 |
| Long-term capital gain | 4,825 | 0 |
| Undistributed tax-exempt income | Unrealized losses | Post-October capital losses deferred |
| $96,895 | $(6,766,488) | $(1,710,455) |
Allspring Funds Trust:

| Name and year of birth | Position held and length of service* | Principal occupations during past five years or longer | Current other public company or investment company directorships |
| William R. Ebsworth (Born 1957) | Trustee, since 2015 | Retired. From 1984 to 2013, equities analyst, portfolio manager, research director and chief investment officer at Fidelity Management and Research Company in Boston, Tokyo, and Hong Kong, and retired in 2013 as Chief Investment Officer of Fidelity Strategic Advisers, Inc. where he led a team of investment professionals managing client assets. Prior thereto, Board member of Hong Kong Securities Clearing Co., Hong Kong Options Clearing Corp., the Thailand International Fund, Ltd., Fidelity Investments Life Insurance Company, and Empire Fidelity Investments Life Insurance Company. Audit Committee Chair and Investment Committee Chair of the Vincent Memorial Hospital Endowment (non-profit organization). Mr. Ebsworth is a CFA® charterholder. | N/A |
| Jane A. Freeman (Born 1953) | Trustee, since 2015; Chair Liaison, since 2018 | Retired. From 2012 to 2014 and 1999 to 2008, Chief Financial Officer of Scientific Learning Corporation. From 2008 to 2012, Ms. Freeman provided consulting services related to strategic business projects. Prior to 1999, Portfolio Manager at Rockefeller & Co. and Scudder, Stevens & Clark. Board member of the Harding Loevner Funds from 1996 to 2014, serving as both Lead Independent Director and chair of the Audit Committee. Board member of the Russell Exchange Traded Funds Trust from 2011 to 2012 and the chair of the Audit Committee. Ms. Freeman is also an inactive Chartered Financial Analyst. | N/A |
| Isaiah Harris, Jr. (Born 1952) | Trustee, since 2009; Audit Committee Chair, since 2019 | Retired. Chairman of the Board of CIGNA Corporation from 2009 to 2021, and Director from 2005 to 2008. From 2003 to 2011, Director of Deluxe Corporation. Prior thereto, President and CEO of BellSouth Advertising and Publishing Corp. from 2005 to 2007, President and CEO of BellSouth Enterprises from 2004 to 2005 and President of BellSouth Consumer Services from 2000 to 2003. Emeritus member of the Iowa State University Foundation Board of Governors. Emeritus Member of the Advisory Board of Iowa State University School of Business. Advisory Board Member, Palm Harbor Academy (private school). Advisory Board Member, Fellowship of Christian Athletes. Mr. Harris is a certified public accountant (inactive status). | N/A |
| David F. Larcker (Born 1950) | Trustee, since 2009 | James Irvin Miller Professor of Accounting at the Graduate School of Business (Emeritus), Stanford University, Director of the Corporate Governance Research Initiative and Senior Faculty of The Rock Center for Corporate Governance since 2006. From 2005 to 2008, Professor of Accounting at the Graduate School of Business, Stanford University. Prior thereto, Ernst & Young Professor of Accounting at The Wharton School, University of Pennsylvania from 1985 to 2005. | N/A |
| Name and year of birth | Position held and length of service* | Principal occupations during past five years or longer | Current other public company or investment company directorships |
| Olivia S. Mitchell (Born 1953) | Trustee, since 2006; Nominating and Governance Committee Chair, since 2018 | International Foundation of Employee Benefit Plans Professor since 1993, Wharton School of the University of Pennsylvania. Director of Wharton’s Pension Research Council and Boettner Center on Pensions & Retirement Research, and Research Associate at the National Bureau of Economic Research. Previously taught at Cornell University from 1978 to 1993. | N/A |
| Timothy J. Penny (Born 1951) | Trustee, since 1996; Chair, since 2018 | President and Chief Executive Officer of Southern Minnesota Initiative Foundation, a non-profit organization, since 2007. Member of the Board of Trustees of NorthStar Education Finance, Inc., a non-profit organization, since 2007. | N/A |
| James G. Polisson (Born 1959) | Trustee, since 2018 | Retired. Chief Marketing Officer, Source (ETF) UK Services, Ltd, from 2015 to 2017. From 2012 to 2015, Principal of The Polisson Group, LLC, a management consulting, corporate advisory and principal investing company. Chief Executive Officer and Managing Director at Russell Investments, Global Exchange Traded Funds from 2010 to 2012. Managing Director of Barclays Global Investors from 1998 to 2010 and Global Chief Marketing Officer for iShares and Barclays Global Investors from 2000 to 2010. Trustee of the San Francisco Mechanics’ Institute, a non-profit organization, from 2013 to 2015. Board member of the Russell Exchange Traded Fund Trust from 2011 to 2012. Director of Barclays Global Investors Holdings Deutschland GmbH from 2006 to 2009. Mr. Polisson is an attorney and has a retired status with the Massachusetts and District of Columbia Bar Associations. | N/A |
| Pamela Wheelock (Born 1959) | Trustee, since January 2020; previously Trustee from January 2018 to July 2019 | Board member of the Destination Medical Center Economic Development Agency, Rochester, Minnesota since 2019. Interim President of the McKnight Foundation from January to September 2020. McKnight Foundation Consultant, November 2020 to February 2021. Acting Commissioner, Minnesota Department of Human Services, July 2019 through September 2019. Consultant (part-time), Minnesota Department of Human Services, October 2019 through December 2019. Chief Operating Officer, Twin Cities Habitat for Humanity from 2017 to 2019. Vice President of University Services, University of Minnesota from 2012 to 2016. Prior thereto, on the Board of Directors, Governance Committee and Finance Committee for the Minnesota Philanthropy Partners (Saint Paul Foundation) from 2012 to 2018, Interim Chief Executive Officer of Blue Cross Blue Shield of Minnesota from 2011 to 2012, Chairman of the Board from 2009 to 2012 and Board Director from 2003 to 2015. Vice President, Leadership and Community Engagement, Bush Foundation, Saint Paul, Minnesota (a private foundation) from 2009 to 2011. Executive Vice President and Chief Financial Officer, Minnesota Sports and Entertainment from 2004 to 2009 and Senior Vice President from 2002 to 2004. Executive Vice President of the Minnesota Wild Foundation from 2004 to 2008. Commissioner of Finance, State of Minnesota, from 1999 to 2002. Currently Board Chair of the Minnesota Wild Foundation since 2010. | N/A |
| Name and year of birth | Position held and length of service | Principal occupations during past five years or longer |
| Andrew Owen (Born 1960) | President, since 2017 | President, Chief Executive Officer and Director of Allspring Funds Management, LLC since 2017 and co-president of Galliard Capital Management, LLC, an affiliate of Allspring Funds Management, LLC, since 2019. Prior thereto, Head of Affiliated Managers, Allspring Global Investments, from 2014 to 2019 and Executive Vice President responsible for marketing, investments and product development for Allspring Funds Management, LLC, from 2009 to 2014. In addition, Mr. Owen was an Executive Vice President of Wells Fargo & Company from 2014 to 2021. |
| Jeremy DePalma (Born 1974) | Treasurer, since 2012 (for certain funds in the Fund Complex); since 2021 (for the remaining funds in the Fund Complex) | Senior Vice President of Allspring Funds Management, LLC since 2009. Senior Vice President of Evergreen Investment Management Company, LLC from 2008 to 2010 and head of the Fund Reporting and Control Team within Fund Administration from 2005 to 2010. |
| Kate McKinley (Born 1977) | Chief Legal Officer, since 2021 | Chief Legal Officer of Allspring Global Investments since 2021. Prior thereto, held various roles at State Street Global Advisors beginning in 2010, including serving as Senior Vice President and General Counsel from 2019 to 2021, and Chief Operating Officer of the Institutional Client Group from 2016 - 2019. Prior to working at State Street Global Advisors served as Assistant General Counsel for Bank of America Corporation from 2005 to 2010 and as an Associate at WilmerHale from 2002 to 2005. |
| Christopher Baker (Born 1976) | Chief Compliance Officer, since 2022 | Global Chief Compliance Officer for Allspring Global Investments since 2022. Prior thereto, Chief Compliance Officer for State Street Global Advisors from 2018 to 2021. Senior Compliance Officer for the State Street divisions of Alternative Investment Solutions, Sector Solutions, and Global Marketing from 2015 to 2018. From 2010 to 2015 Vice President, Global Head of Investment and Marketing Compliance for State Street Global Advisors. |
| Matthew Prasse (Born 1983) | Secretary, since 2021 | Senior Counsel of the Allspring Legal Department since 2021. Senior Counsel of the Wells Fargo Legal Department from 2018 to 2021. Previously, Counsel for Barings LLC from 2015 to 2018. Prior to joining Barings, Associate at Morgan, Lewis & Bockius LLP from 2008 to 2015. |
P.O. Box 219967
Kansas City, MO 64121-9967

1-800-222-8222 or visit the Fund's website at allspringglobal.com. Read the prospectus carefully before you invest or send money.
A264/AR264 06-22

Intermediate Tax/AMT-Free Fund
| 2 | |
| 6 | |
| 11 | |
| 12 | |
| Financial statements | |
| 46 | |
| 47 | |
| 48 | |
| 49 | |
| 54 | |
| 59 | |
| 60 |

| 1 | The S&P 500 Index consists of 500 stocks chosen for market size, liquidity, and industry group representation. It is a market-value-weighted index with each stock's weight in the index proportionate to its market value. You cannot invest directly in an index. |
| 2 | The Morgan Stanley Capital International (MSCI) All Country World Index (ACWI) ex USA Index (Net) is a free-float-adjusted market-capitalization-weighted index that is designed to measure the equity market performance of developed and emerging markets, excluding the U.S. Source: MSCI. MSCI makes no express or implied warranties or representations and shall have no liability whatsoever with respect to any MSCI data contained herein. The MSCI data may not be further redistributed or used as a basis for other indexes or any securities or financial products. This report is not approved, reviewed, or produced by MSCI. You cannot invest directly in an index. |
| 3 | The MSCI Emerging Markets (EM) Index (Net) (USD) is a free-float-adjusted market-capitalization-weighted index that is designed to measure equity market performance of emerging markets. You cannot invest directly in an index. |
| 4 | The Bloomberg U.S. Aggregate Bond Index is a broad-based benchmark that measures the investment-grade, U.S.-dollar-denominated, fixed-rate taxable bond market, including Treasuries, government-related and corporate securities, mortgage-backed securities (agency fixed-rate and hybrid adjustable-rate mortgage pass-throughs), asset-backed securities, and commercial mortgage-backed securities. You cannot invest directly in an index. |
| 5 | The Bloomberg Global Aggregate ex-USD Index (unhedged) is an unmanaged index that provides a broad-based measure of the global investment-grade fixed-income markets excluding the U.S.-dollar-denominated debt market. You cannot invest directly in an index. |
| 6 | The Bloomberg Municipal Bond Index is an unmanaged index composed of long-term tax-exempt bonds with a minimum credit rating of Baa. You cannot invest directly in an index. |
| 7 | The ICE BofA U.S. High Yield Index is a market-capitalization-weighted index of domestic and Yankee high-yield bonds. The index tracks the performance of high-yield securities traded in the U.S. bond market. You cannot invest directly in an index. Copyright 2022. ICE Data Indices, LLC. All rights reserved. |
| 1 | The Consumer Price Index (CPI) is a measure of the average change over time in the prices paid by urban consumers for a market basket of consumer goods and services. You cannot invest directly in an index. |
| 2 | The MSCI ACWI (Net) is a free-float-adjusted market-capitalization-weighted index that is designed to measure the equity market performance of developed and emerging markets. You cannot invest directly in an index. |

President
Allspring Funds
| Investment objective | The Fund seeks current income exempt from federal income tax. |
| Manager | Allspring Funds Management, LLC |
| Subadviser | Allspring Global Investments, LLC |
| Portfolio managers | Bruce R. Johns, Robert J. Miller, Adrian Van Poppel, Nicholos Venditti |
| Average annual total returns (%) as of June 30, 2022 | |||||||||||
| Including sales charge | Excluding sales charge | Expense ratios1 (%) | |||||||||
| Inception date | 1 year | 5 year | 10 year | 1 year | 5 year | 10 year | Gross | Net 2 | |||
| Class A (WFTAX) | 7-31-2007 | -9.79 | 0.56 | 1.52 | -7.00 | 1.18 | 1.83 | 0.80 | 0.70 | ||
| Class C (WFTFX) | 7-31-2007 | -8.70 | 0.42 | 1.22 | -7.70 | 0.42 | 1.22 | 1.55 | 1.45 | ||
| Class R6 (WFRTX)3 | 7-31-2018 | – | – | – | -6.71 | 1.47 | 2.11 | 0.42 | 0.40 | ||
| Administrator Class (WFITX) | 3-31-2008 | – | – | – | -6.99 | 1.26 | 1.92 | 0.74 | 0.60 | ||
| Institutional Class (WITIX) | 3-31-2008 | – | – | – | -6.84 | 1.43 | 2.09 | 0.47 | 0.45 | ||
| Bloomberg Municipal Bond 1-15 Year Blend Index4 | – | – | – | – | -6.53 | 1.47 | 2.08 | – | – | ||
| 1 | Reflects the expense ratios as stated in the most recent prospectuses. The expense ratios shown are subject to change and may differ from the annualized expense ratios shown in the financial highlights of this report. |
| 2 | The manager has contractually committed through October 31, 2022, to waive fees and/or reimburse expenses to the extent necessary to cap total annual fund operating expenses after fee waivers at 0.70% for Class A, 1.45% for Class C, 0.40% for Class R6, 0.60% for Administrator Class, and 0.45% for Institutional Class. Brokerage commissions, stamp duty fees, interest, taxes, acquired fund fees and expenses (if any), and extraordinary expenses are excluded from the expense caps. Prior to or after the commitment expiration date, the caps may be increased or the commitment to maintain the caps may be terminated only with the approval of the Board of Trustees. Without these caps, the Fund’s returns would have been lower. The expense ratio paid by an investor is the net expense ratio (the total annual fund operating expenses after fee waivers) as stated in the prospectuses. |
| 3 | Historical performance shown for the Class R6 shares prior to their inception reflects the performance of the Institutional Class shares, and includes the higher expenses applicable to the Institutional Class shares. If these expenses had not been included, returns for the Class R6 shares would be higher. |
| 4 | The Bloomberg Municipal Bond 1–15 Year Blend Index is the 1–15 year component of the Bloomberg Municipal Bond Index. The Bloomberg Municipal Bond Index is an unmanaged index composed of long-term tax-exempt bonds with a minimum credit rating of Baa. You cannot invest directly in an index. |

| 1 | The chart compares the performance of Class A shares for the most recent ten years with the Bloomberg Municipal Bond 1-15 Year Blend Index. The chart assumes a hypothetical investment of $10,000 in Class A shares and reflects all operating expenses and assumes the maximum initial sales charge of 3.00%. |
| ■ | The Fund underperformed its benchmark, the Bloomberg Municipal Bond 1-15 Year Blend Index, for the 12-month period ended June 30, 2022. |
| ■ | Our overweight to lower-investment-grade bonds (A-rated and BBB-rated) detracted as higher-quality bonds (AA-rated and AAA-rated) outperformed. |
| ■ | Duration, yield-curve positioning, and sector positioning contributed to performance while credit lagged. |
| ■ | We tactically moved duration at the beginning of the period from long relative to the benchmark to short. The market sold off during the period, so our short duration was positive. |
| ■ | Curve positioning was the largest contributor to performance. Our moderate underweight to the 12- to 17-year parts of the yield curve was especially advantageous as this was the worst-performing maturity range in the index. |
| ■ | Our underweight to higher-beta (more volatile) sectors, such as housing, hospital, industrial development revenue/pollution control revenue (IDR/PCR), and transportation, was positive as these sectors underperformed. |
| Credit quality as of June 30, 20221 |

| 1 | The credit quality distribution of portfolio holdings reflected in the chart is based on ratings from Standard & Poor’s, Moody’s Investors Service, and/or Fitch Ratings Ltd. Credit quality ratings apply to the underlying holdings of the Fund and not to the Fund itself. The percentages of the portfolio with the ratings depicted in the chart are calculated based on the market value of fixed income securities held by the Fund. If a security was rated by all three rating agencies, the middle rating was utilized. If rated by two of the three rating agencies, the lower rating was utilized, and if rated by one of the rating agencies, that rating was utilized. Standard & Poor’s rates the creditworthiness of bonds, ranging from AAA (highest) to D (lowest). Ratings from A to CCC may be modified by the addition of a plus (+) or minus (-) sign to show relative standing within the rating categories. Standard & Poor’s rates the creditworthiness of short-term notes from SP-1 (highest) to SP-3 (lowest). Moody’s rates the creditworthiness of bonds, ranging from Aaa (highest) to C (lowest). Ratings Aa to B may be modified by the addition of a number 1 (highest) to 3 (lowest) to show relative standing within the ratings categories. Moody’s rates the creditworthiness of short-term U.S. tax-exempt municipal securities from MIG 1/VMIG 1 (highest) to SG (lowest). Fitch rates the creditworthiness of bonds, ranging from AAA (highest) to D (lowest). Credit quality distribution is subject to change and may have changed since the date specified. |
| Effective maturity distribution as of June 30, 20221 |

| 1 | Figures represent the percentage of the Fund's long-term investments. These amounts are subject to change and may have changed since the date specified. |
| * | The Bloomberg Municipal Bond Index is an unmanaged index composed of long-term tax-exempt bonds with a minimum credit rating of Baa. You cannot invest directly in an index |
| Beginning account value 1-1-2022 | Ending account value 6-30-2022 | Expenses paid during the period1 | Annualized net expense ratio | |
| Class A | ||||
| Actual | $1,000.00 | $ 928.87 | $3.35 | 0.70% |
| Hypothetical (5% return before expenses) | $1,000.00 | $1,021.32 | $3.51 | 0.70% |
| Class C | ||||
| Actual | $1,000.00 | $ 925.40 | $6.92 | 1.45% |
| Hypothetical (5% return before expenses) | $1,000.00 | $1,017.60 | $7.25 | 1.45% |
| Class R6 | ||||
| Actual | $1,000.00 | $ 930.32 | $1.91 | 0.40% |
| Hypothetical (5% return before expenses) | $1,000.00 | $1,022.81 | $2.01 | 0.40% |
| Administrator Class | ||||
| Actual | $1,000.00 | $ 928.54 | $2.87 | 0.60% |
| Hypothetical (5% return before expenses) | $1,000.00 | $1,021.82 | $3.01 | 0.60% |
| Institutional Class | ||||
| Actual | $1,000.00 | $ 929.30 | $2.15 | 0.45% |
| Hypothetical (5% return before expenses) | $1,000.00 | $1,022.56 | $2.26 | 0.45% |
| Principal | Value | ||||
| Closed end municipal bond fund obligations: 0.14% | |||||
| Other: 0.14% | |||||
| Nuveen AMT-Free Municipal Credit Income Fund Preferred Shares Series C (100 shares) 1.41% 144Aø | $ 2,000,000 | $ 2,000,000 | |||
| Total Closed end municipal bond fund obligations (Cost $2,000,000) | 2,000,000 |
| Interest rate | Maturity date | ||||
| Municipal obligations: 98.61% | |||||
| Alabama: 0.97% | |||||
| Education revenue: 0.23% | |||||
| Auburn AL Refunding Bond Series A | 4.00% | 6-1-2033 | 1,000,000 | 1,019,536 | |
| University of West Alabama General Fee Bond (AGM Insured) | 4.00 | 1-1-2033 | 595,000 | 606,689 | |
| University of West Alabama General Fee Bond (AGM Insured) | 4.00 | 1-1-2035 | 865,000 | 874,863 | |
| University of West Alabama General Fee Bond (AGM Insured) | 4.00 | 1-1-2037 | 920,000 | 925,538 | |
| 3,426,626 | |||||
| Utilities revenue: 0.74% | |||||
| Southeast Alabama Energy Authority Commodity Supply Project #2 Series B | 4.00 | 12-1-2051 | 1,000,000 | 995,568 | |
| Southeast Alabama Gas Supply District Project #2 Series B (1 Month LIBOR +0.85%) ± | 1.56 | 6-1-2049 | 10,000,000 | 9,853,904 | |
| 10,849,472 | |||||
| 14,276,098 | |||||
| Alaska: 0.27% | |||||
| Miscellaneous revenue: 0.27% | |||||
| Matanuska-Susitna Borough AK Goode Creek Correctional Project | 4.00 | 9-1-2030 | 3,870,000 | 3,970,601 | |
| Arizona: 1.60% | |||||
| Education revenue: 0.43% | |||||
| Arizona Board of Regents University of Arizona System Series A | 5.00 | 6-1-2037 | 2,645,000 | 2,897,226 | |
| Arizona IDA Education Facility Revenue Bonds Series 2021A | 4.00 | 7-1-2034 | 335,000 | 310,254 | |
| Arizona IDA Education Facility Revenue Bonds Series 2021A | 4.00 | 7-1-2035 | 240,000 | 220,541 | |
| Arizona IDA Education Facility Revenue Bonds Series 2021A | 4.00 | 7-1-2035 | 345,000 | 317,028 | |
| Arizona IDA Education Facility Revenue Bonds Series 2021A | 4.00 | 7-1-2036 | 220,000 | 200,884 | |
| Arizona IDA Education Facility Revenue Bonds Series 2021A | 4.00 | 7-1-2036 | 315,000 | 287,630 | |
| Arizona IDA Education Facility Revenue Bonds Series 2021A | 5.00 | 7-1-2033 | 315,000 | 323,845 | |
| Pima County AZ Community College District Series 2019 | 5.00 | 7-1-2034 | 500,000 | 553,049 |
| Interest rate | Maturity date | Principal | Value | ||
| Education revenue (continued) | |||||
| Pima County AZ Community College District Series 2019 | 5.00% | 7-1-2035 | $ 600,000 | $ 662,614 | |
| Pima County AZ Community College District Series 2019 | 5.00 | 7-1-2036 | 500,000 | 551,463 | |
| 6,324,534 | |||||
| GO revenue: 0.04% | |||||
| Estrella Mountain Ranch AZ Community Facilities District Refunding Bond (AGM Insured) | 5.00 | 7-15-2025 | 585,000 | 629,453 | |
| Health revenue: 0.05% | |||||
| Tempe AZ IDA Refunding Bonds Friendship Village of Tempe Project Series 2021A | 4.00 | 12-1-2028 | 370,000 | 352,846 | |
| Tempe AZ IDA Refunding Bonds Friendship Village of Tempe Project Series 2021A | 4.00 | 12-1-2029 | 385,000 | 361,400 | |
| 714,246 | |||||
| Miscellaneous revenue: 0.74% | |||||
| Arizona Refunding Bond Certificate of Participation | 5.00 | 9-1-2027 | 3,040,000 | 3,286,697 | |
| Phoenix AZ Civic Improvement Corporation Series D | 5.00 | 7-1-2024 | 190,000 | 199,938 | |
| Phoenix AZ Civic Improvement Corporation Series D | 5.00 | 7-1-2036 | 7,000,000 | 7,469,089 | |
| 10,955,724 | |||||
| Tax revenue: 0.34% | |||||
| San Luis AZ Pledged Excise Tax Series A (BAM Insured) | 5.00 | 7-1-2027 | 450,000 | 473,987 | |
| San Luis AZ Pledged Excise Tax Series A (BAM Insured) | 5.00 | 7-1-2028 | 700,000 | 736,893 | |
| San Luis AZ Pledged Excise Tax Series A (BAM Insured) | 5.00 | 7-1-2034 | 3,680,000 | 3,854,158 | |
| 5,065,038 | |||||
| 23,688,995 | |||||
| Arkansas: 0.16% | |||||
| Miscellaneous revenue: 0.16% | |||||
| Arkansas Development Finance Authority Arkansas Division of Emergency Management Project | 4.00 | 6-1-2033 | 500,000 | 516,680 | |
| Arkansas Development Finance Authority Arkansas Division of Emergency Management Project | 4.00 | 6-1-2035 | 1,000,000 | 1,025,098 | |
| Arkansas Development Finance Authority Arkansas Division of Emergency Management Project | 4.00 | 6-1-2036 | 850,000 | 868,167 | |
| 2,409,945 | |||||
| California: 4.90% | |||||
| Airport revenue: 0.51% | |||||
| Sacramento CA Airport System Senior Bond Series A | 5.00 | 7-1-2026 | 1,315,000 | 1,434,454 | |
| Sacramento CA Airport System Senior Bond Series B | 5.00 | 7-1-2032 | 600,000 | 655,030 | |
| Sacramento CA Airport System Senior Bond Series B | 5.00 | 7-1-2033 | 500,000 | 543,166 | |
| Sacramento CA Airport System Senior Bond Series B | 5.00 | 7-1-2034 | 1,000,000 | 1,080,504 | |
| Sacramento CA Airport System Senior Bond Series E | 5.00 | 7-1-2026 | 750,000 | 818,130 | |
| Sacramento CA Airport System Senior Bond Series E | 5.00 | 7-1-2027 | 1,750,000 | 1,930,945 | |
| Sacramento CA Airport System Senior Bond Series E | 5.00 | 7-1-2028 | 1,000,000 | 1,114,132 | |
| 7,576,361 | |||||
| Education revenue: 0.11% | |||||
| California CDA Series A | 6.90 | 8-1-2031 | 1,565,000 | 1,568,926 |
| Interest rate | Maturity date | Principal | Value | ||
| GO revenue: 1.98% | |||||
| California Refunding Bond Various Purposes | 5.00% | 8-1-2030 | $ 1,575,000 | $ 1,720,675 | |
| Compton CA Community College District Election of 2002 CAB Series C ¤ | 0.00 | 8-1-2029 | 1,565,000 | 1,218,127 | |
| Compton CA Community College District Election of 2002 CAB Series C ¤ | 0.00 | 8-1-2031 | 2,400,000 | 1,704,177 | |
| Los Angeles CA Unified School District Los Angeles County Series RYQ | 4.00 | 7-1-2037 | 2,000,000 | 2,008,631 | |
| Monterey County CA Alisal Union School District Series A (BAM Insured) | 5.25 | 8-1-2042 | 1,500,000 | 1,629,114 | |
| New Haven CA Unified School District CAB Project (AGC Insured) ¤ | 0.00 | 8-1-2033 | 5,590,000 | 3,661,716 | |
| Patterson CA Unified School District CAB Election of 2008 Project Series B (AGM Insured) ¤ | 0.00 | 8-1-2033 | 3,000,000 | 1,977,995 | |
| Rio Hondo CA Community College District ¤ | 0.00 | 8-1-2030 | 2,315,000 | 1,752,054 | |
| San Diego CA Unified School District Election of 1998 Series E-2 (AGM Insured) | 5.50 | 7-1-2027 | 5,000,000 | 5,733,093 | |
| Sylvan CA Unified School District CAB Election of 2006 (AGM Insured) ¤ | 0.00 | 8-1-2031 | 2,590,000 | 1,847,296 | |
| Sylvan CA Unified School District CAB Election of 2006 (AGM Insured) ¤ | 0.00 | 8-1-2032 | 2,800,000 | 1,908,076 | |
| West Contra Costa CA Unified School District Election of 2005 Series C-1 (AGC Insured) ¤ | 0.00 | 8-1-2026 | 4,620,000 | 4,111,373 | |
| 29,272,327 | |||||
| Health revenue: 0.16% | |||||
| California Municipal Finance Authority Institute of Aging Project | 5.00 | 8-15-2032 | 975,000 | 1,070,300 | |
| California Municipal Finance Authority Institute of Aging Project | 5.00 | 8-15-2033 | 1,150,000 | 1,258,835 | |
| 2,329,135 | |||||
| Housing revenue: 0.13% | |||||
| California HFA Municipal Certificate of Participation Series 2 Class A | 4.00 | 3-20-2033 | 960,797 | 949,797 | |
| Tender Option Bond Trust Receipts/Certificates Series 2020-MIZ9012 (Mizuho Capital Markets LLC LIQ) 144Aø | 1.16 | 10-1-2036 | 999,000 | 999,000 | |
| 1,948,797 | |||||
| Miscellaneous revenue: 0.37% | |||||
| Anaheim CA PFA Convention Center Expansion Project Series A | 5.00 | 5-1-2039 | 2,500,000 | 2,633,819 | |
| Foothill de Anza CA Community College District Certificate of Participation | 5.00 | 4-1-2033 | 500,000 | 532,915 | |
| Gold Coast Transit District California Transit Finance Corporation Certificate of Participation | 5.00 | 7-1-2027 | 520,000 | 573,511 | |
| San Diego CA Public Facilities Financing Authority Capital Improvement Projects Series B | 5.00 | 10-15-2027 | 500,000 | 541,083 | |
| San Diego CA Public Facilities Financing Authority Capital Improvement Projects Series B | 5.00 | 10-15-2028 | 1,000,000 | 1,080,629 | |
| 5,361,957 | |||||
| Transportation revenue: 0.67% | |||||
| Bay Area CA Toll Authority Toll Bridge Series A (SIFMA Municipal Swap +1.25%) ± | 2.23 | 4-1-2036 | 9,810,000 | 9,883,524 |
| Interest rate | Maturity date | Principal | Value | ||
| Utilities revenue: 0.97% | |||||
| California Community Choice Financing Authority Clean Energy Project Green Bond Series B-1 | 4.00% | 2-1-2052 | $ 4,000,000 | $ 3,997,093 | |
| M-S-R California Energy Authority Gas Series B | 7.00 | 11-1-2034 | 2,035,000 | 2,532,125 | |
| M-S-R California Energy Authority Gas Series C | 7.00 | 11-1-2034 | 3,000,000 | 3,732,862 | |
| Sacramento CA Municipal Utility District Series B | 5.00 | 8-15-2030 | 1,075,000 | 1,112,415 | |
| Vernon CA Electric System Series A | 5.00 | 8-1-2026 | 600,000 | 641,747 | |
| Vernon CA Electric System Series A | 5.00 | 8-1-2031 | 1,160,000 | 1,265,957 | |
| Victorville California Electric Revenue Series A | 5.00 | 5-1-2033 | 500,000 | 544,258 | |
| Victorville California Electric Revenue Series A | 5.00 | 5-1-2034 | 500,000 | 540,142 | |
| 14,366,599 | |||||
| 72,307,626 | |||||
| Colorado: 1.12% | |||||
| GO revenue: 0.45% | |||||
| Adams 12 Five Star Schools | 5.00 | 12-15-2028 | 3,800,000 | 4,196,522 | |
| Mesa County CO Valley School District #51 Grand Junction | 5.50 | 12-1-2035 | 2,175,000 | 2,451,772 | |
| 6,648,294 | |||||
| Miscellaneous revenue: 0.45% | |||||
| Colorado Certificate of Participation Series A | 4.00 | 12-15-2036 | 1,500,000 | 1,503,658 | |
| Regents of the University of Colorado Certificate of Participation Series A | 5.00 | 11-1-2028 | 5,000,000 | 5,210,308 | |
| 6,713,966 | |||||
| Tax revenue: 0.18% | |||||
| Colorado Regional Transportation District Denver Transit Partners Eagle P3 Project Series A & B | 5.00 | 7-15-2028 | 885,000 | 934,252 | |
| Colorado Regional Transportation District Denver Transit Partners Eagle P3 Project Series A & B | 5.00 | 1-15-2029 | 600,000 | 633,568 | |
| Colorado Regional Transportation District Denver Transit Partners Eagle P3 Project Series A & B | 5.00 | 1-15-2030 | 1,000,000 | 1,056,774 | |
| 2,624,594 | |||||
| Water & sewer revenue: 0.04% | |||||
| Central Weld County CO Water District Revenue Bond (AGM Insured) | 4.00 | 12-1-2033 | 500,000 | 531,969 | |
| 16,518,823 | |||||
| Connecticut: 1.61% | |||||
| Education revenue: 0.48% | |||||
| Connecticut HEFAR University of Hartford Issue Series N | 5.00 | 7-1-2029 | 480,000 | 503,722 | |
| Connecticut HEFAR University of Hartford Issue Series N | 5.00 | 7-1-2030 | 870,000 | 906,116 | |
| Connecticut Higher Education Supplemental Loan Authority Loan Program Series D | 3.00 | 11-15-2035 | 1,000,000 | 1,025,337 | |
| University of Connecticut Series A | 5.00 | 3-15-2032 | 4,355,000 | 4,672,033 | |
| 7,107,208 | |||||
| GO revenue: 0.80% | |||||
| Bridgeport CT Series A | 5.00 | 6-1-2031 | 1,855,000 | 2,099,058 | |
| Connecticut Series B | 4.00 | 6-1-2034 | 750,000 | 770,044 | |
| Connecticut Series B | 5.00 | 6-15-2027 | 3,000,000 | 3,221,004 | |
| Connecticut Series F | 5.00 | 11-15-2032 | 300,000 | 320,222 |
| Interest rate | Maturity date | Principal | Value | ||
| GO revenue (continued) | |||||
| Hamden CT Refunding Bond Series A (BAM Insured) | 5.00% | 8-15-2029 | $ 500,000 | $ 548,470 | |
| Hamden CT Refunding Bond Series A (BAM Insured) | 5.00 | 8-15-2030 | 1,200,000 | 1,303,419 | |
| Hamden CT Series A (BAM Insured) | 5.00 | 8-15-2026 | 2,000,000 | 2,177,966 | |
| Hamden CT Series A (BAM Insured) | 5.00 | 8-15-2027 | 1,200,000 | 1,321,004 | |
| 11,761,187 | |||||
| Health revenue: 0.19% | |||||
| Connecticut HEFA Revenue Bonds Stamford Hospital Issue Series M | 4.00 | 7-1-2038 | 2,000,000 | 1,817,900 | |
| Connecticut HEFAR Stamford Hospital Issue Series M | 4.00 | 7-1-2035 | 1,000,000 | 942,020 | |
| 2,759,920 | |||||
| Tax revenue: 0.14% | |||||
| Connecticut Special Tax Obligation Bonds Transportation Infrastructure Purposes Series A | 4.00 | 9-1-2036 | 1,000,000 | 1,002,660 | |
| Connecticut Special Tax Obligation Bonds Transportation Infrastructure Purposes Series A | 5.00 | 8-1-2030 | 1,000,000 | 1,066,088 | |
| 2,068,748 | |||||
| 23,697,063 | |||||
| Delaware: 0.14% | |||||
| Education revenue: 0.14% | |||||
| Delaware EDA Odyssey Charter School Project Series B 144A | 6.75 | 9-1-2035 | 2,000,000 | 2,098,530 | |
| District of Columbia: 1.98% | |||||
| GO revenue: 0.87% | |||||
| District of Columbia Series 2014C | 5.00 | 6-1-2034 | 3,000,000 | 3,113,697 | |
| District of Columbia Series 2014C | 5.00 | 6-1-2035 | 1,620,000 | 1,679,260 | |
| District of Columbia Series 2016A | 5.00 | 6-1-2033 | 5,000,000 | 5,390,835 | |
| District of Columbia Series 2017A | 5.00 | 6-1-2033 | 2,400,000 | 2,623,087 | |
| 12,806,879 | |||||
| Miscellaneous revenue: 0.42% | |||||
| District of Columbia Federal Highway Grant Anticipation Bond | 5.00 | 12-1-2025 | 3,520,000 | 3,568,044 | |
| District of Columbia Federal Highway Grant Anticipation Bond | 5.25 | 12-1-2025 | 2,630,000 | 2,637,265 | |
| 6,205,309 | |||||
| Tax revenue: 0.21% | |||||
| Washington Convention and Sports Authority Dedicated Tax Refunding Bond Senior Lien Series A | 4.00 | 10-1-2034 | 750,000 | 759,431 | |
| Washington Convention and Sports Authority Dedicated Tax Refunding Bond Senior Lien Series B | 4.00 | 10-1-2033 | 720,000 | 735,876 | |
| Washington Convention and Sports Authority Dedicated Tax Refunding Bond Senior Lien Series B | 4.00 | 10-1-2034 | 650,000 | 658,173 | |
| Washington Convention and Sports Authority Dedicated Tax Refunding Bond Senior Lien Series B | 4.00 | 10-1-2035 | 1,000,000 | 1,003,973 | |
| 3,157,453 |
| Interest rate | Maturity date | Principal | Value | ||
| Transportation revenue: 0.31% | |||||
| Washington Metropolitan Airport Authority Dulles Toll Road Series B | 5.00% | 10-1-2034 | $ 1,250,000 | $ 1,311,320 | |
| Washington Metropolitan Area Transit Authority Series B | 5.00 | 7-1-2032 | 3,000,000 | 3,303,893 | |
| 4,615,213 | |||||
| Water & sewer revenue: 0.17% | |||||
| District of Columbia Water & Sewer Authority Public Utility Senior Lien Series A | 5.00 | 10-1-2037 | 2,260,000 | 2,482,009 | |
| 29,266,863 | |||||
| Florida: 7.08% | |||||
| Airport revenue: 0.83% | |||||
| Hillsborough FL Aviation Authority Tampa International Airport Customer Facility Series A | 5.00 | 10-1-2044 | 8,335,000 | 8,457,970 | |
| Jacksonville FL Port Authority Series B | 5.00 | 11-1-2035 | 2,045,000 | 2,249,569 | |
| Miami-Dade County FL Aviation Refunding Bond Series A | 4.00 | 10-1-2035 | 1,600,000 | 1,578,110 | |
| 12,285,649 | |||||
| Health revenue: 0.82% | |||||
| Florida Health System Lee Memorial Hospital Series A | 5.00 | 4-1-2036 | 4,500,000 | 4,783,156 | |
| Highlands County FL Health Facilities Authority Adventist Health System Series A-2 ø | 0.91 | 11-15-2037 | 3,000,000 | 3,000,000 | |
| Jacksonville FL HCFR Series E ø | 0.91 | 8-1-2036 | 2,000,000 | 2,000,000 | |
| Miami-Dade County FL Health Facilities Authority Nicklaus Children's Hospital Project | 5.00 | 8-1-2031 | 500,000 | 531,464 | |
| Miami-Dade County FL Health Facilities Authority Nicklaus Children's Hospital Project | 5.00 | 8-1-2033 | 1,645,000 | 1,732,333 | |
| 12,046,953 | |||||
| Miscellaneous revenue: 2.45% | |||||
| Boynton Beach FL PFA Capital Improvement Series 2018 | 4.00 | 7-1-2030 | 2,090,000 | 2,227,325 | |
| Boynton Beach FL PFA Capital Improvement Series 2018 | 5.00 | 7-1-2035 | 3,590,000 | 3,944,041 | |
| Duval County FL School Board Certificate of Participation Series B | 5.00 | 7-1-2028 | 2,500,000 | 2,686,459 | |
| Duval County FL School Board Certificate of Participation Series B | 5.00 | 7-1-2029 | 5,000,000 | 5,368,428 | |
| Miami-Dade County FL School Board Certificate of Participation Series D | 5.00 | 11-1-2027 | 6,600,000 | 6,969,875 | |
| Monroe County FL School Board Certificate of Participation Series A | 5.00 | 6-1-2034 | 1,500,000 | 1,645,515 | |
| Monroe County FL School Board Certificate of Participation Series A | 5.00 | 6-1-2035 | 1,000,000 | 1,095,546 | |
| Orange County FL School Board Certificate of Participation Series C | 5.00 | 8-1-2029 | 2,000,000 | 2,158,134 | |
| Orlando FL Senior Tourist Development 6th Cent Contract Payment Bond Series A (AGM Insured) | 5.00 | 11-1-2032 | 2,000,000 | 2,225,708 | |
| Orlando FL Senior Tourist Development 6th Cent Contract Payment Bond Series A (AGM Insured) | 5.00 | 11-1-2033 | 4,500,000 | 4,970,741 | |
| Orlando FL Senior Tourist Development 6th Cent Contract Payment Bond Series A (AGM Insured) | 5.00 | 11-1-2034 | 600,000 | 660,821 | |
| Palm Beach County FL Refunding Bond | 5.00 | 5-1-2029 | 2,000,000 | 2,187,984 | |
| 36,140,577 |
| Interest rate | Maturity date | Principal | Value | ||
| Tax revenue: 0.52% | |||||
| Miami-Dade County FL Special Obligation Series A | 5.00% | 10-1-2023 | $ 700,000 | $ 706,196 | |
| Polk County FL School District | 5.00 | 10-1-2033 | 2,915,000 | 3,272,908 | |
| Tampa FL Sports Authority Stadium Project | 5.00 | 1-1-2025 | 3,550,000 | 3,748,608 | |
| 7,727,712 | |||||
| Transportation revenue: 0.29% | |||||
| Florida Mid-Bay Bridge Authority Series A | 5.00 | 10-1-2025 | 1,250,000 | 1,320,364 | |
| Miami-Dade County FL Expressway Authority Toll System (AGM Insured, Citibank NA LIQ) 144Aø | 1.06 | 7-1-2035 | 1,050,000 | 1,050,000 | |
| Osceola County FL Transportation Improvement & Refunding Bond Series A-1 | 5.00 | 10-1-2034 | 375,000 | 393,142 | |
| Osceola County FL Transportation Improvement & Refunding Bond Series A-1 | 5.00 | 10-1-2035 | 400,000 | 418,378 | |
| Osceola County FL Transportation Improvement & Refunding Bond Series A-1 | 5.00 | 10-1-2036 | 600,000 | 626,160 | |
| Osceola County FL Transportation Improvement & Refunding Bond Series A-1 | 5.00 | 10-1-2037 | 525,000 | 547,369 | |
| 4,355,413 | |||||
| Utilities revenue: 0.66% | |||||
| Fort Pierce FL Utilities Authority Refunding Bond Series A (AGM Insured) | 5.00 | 10-1-2035 | 500,000 | 562,455 | |
| Fort Pierce FL Utilities Authority Refunding Bond Series A (AGM Insured) | 5.00 | 10-1-2037 | 1,040,000 | 1,163,103 | |
| Jacksonville FL Electric System Revenue Bonds Series 2008A (Royal Bank of Canada SPA) ø | 0.93 | 10-1-2036 | 8,000,000 | 8,000,000 | |
| 9,725,558 | |||||
| Water & sewer revenue: 1.51% | |||||
| North Sumter County FL Utility Dependent District Bond (BAM Insured) | 5.00 | 10-1-2031 | 500,000 | 564,650 | |
| North Sumter County FL Utility Dependent District Bond (BAM Insured) | 5.00 | 10-1-2032 | 950,000 | 1,069,904 | |
| North Sumter County FL Utility Dependent District Bond (BAM Insured) | 5.00 | 10-1-2035 | 1,290,000 | 1,450,025 | |
| North Sumter County FL Utility Dependent District Bond (BAM Insured) | 5.00 | 10-1-2036 | 880,000 | 986,317 | |
| Tohopekaliga Water Authority Florida Utility System Series 2020 144A | 5.00 | 10-1-2025 | 12,000,000 | 13,061,582 | |
| Wildwood Utility Dependent District South Sumter Utility Project (BAM Insured) | 5.00 | 10-1-2029 | 400,000 | 452,819 | |
| Wildwood Utility Dependent District South Sumter Utility Project (BAM Insured) | 5.00 | 10-1-2031 | 200,000 | 229,469 | |
| Wildwood Utility Dependent District South Sumter Utility Project (BAM Insured) | 5.00 | 10-1-2033 | 800,000 | 910,707 | |
| Wildwood Utility Dependent District South Sumter Utility Project (BAM Insured) | 5.00 | 10-1-2034 | 900,000 | 1,022,028 | |
| Wildwood Utility Dependent District South Sumter Utility Project (BAM Insured) | 5.00 | 10-1-2035 | 750,000 | 849,844 | |
| Wildwood Utility Dependent District South Sumter Utility Project (BAM Insured) | 5.00 | 10-1-2037 | 1,500,000 | 1,693,100 | |
| 22,290,445 | |||||
| 104,572,307 |
| Interest rate | Maturity date | Principal | Value | ||
| Georgia: 1.39% | |||||
| Health revenue: 0.10% | |||||
| Brookhaven GA Development Authority Children's Healthcare Series A | 5.00% | 7-1-2035 | $ 1,300,000 | $ 1,419,248 | |
| Industrial development revenue: 0.03% | |||||
| George L. Smith II Georgia World Congress Center Authority Convention Center Series 2021A | 4.00 | 1-1-2036 | 500,000 | 457,307 | |
| Utilities revenue: 1.26% | |||||
| Burke County GA Development Authority Oglethorpe Power Corporation Vogtle Project Series A | 1.50 | 1-1-2040 | 3,000,000 | 2,875,158 | |
| Burke County GA Development Authority Oglethorpe Power Corporation Vogtle Project Series E | 3.25 | 11-1-2045 | 6,000,000 | 6,022,886 | |
| Dalton GA Utilities Bond | 4.00 | 3-1-2033 | 1,100,000 | 1,108,887 | |
| Dalton GA Utilities Bond | 4.00 | 3-1-2034 | 1,200,000 | 1,201,747 | |
| Georgia Municipal Electric Authority General Resolution Project Series A | 4.00 | 1-1-2036 | 1,500,000 | 1,478,312 | |
| Georgia Municipal Electric Authority Project One Series A | 5.00 | 1-1-2035 | 925,000 | 984,830 | |
| Georgia Municipal Electric Authority Units 3 & 4 Project Series A | 5.00 | 1-1-2032 | 525,000 | 564,792 | |
| Georgia Municipal Electric Authority Units 3 & 4 Project Series A | 5.00 | 1-1-2034 | 930,000 | 987,659 | |
| Georgia Municipal Electric Authority Units 3 & 4 Project Series A | 5.00 | 1-1-2035 | 600,000 | 636,149 | |
| Main Street Natural Gas Incorporated Georgia Gas Project Series A | 5.00 | 5-15-2029 | 2,600,000 | 2,764,777 | |
| 18,625,197 | |||||
| 20,501,752 | |||||
| Guam: 0.32% | |||||
| Airport revenue: 0.05% | |||||
| Guam International Airport Authority | 5.00 | 10-1-2023 | 775,000 | 793,063 | |
| Tax revenue: 0.09% | |||||
| Guam Government Business Privilege Tax Revenue Refunding Bonds Series F | 4.00 | 1-1-2042 | 1,500,000 | 1,323,442 | |
| Water & sewer revenue: 0.18% | |||||
| Guam Government Waterworks Authority | 5.25 | 7-1-2033 | 2,500,000 | 2,582,632 | |
| 4,699,137 | |||||
| Hawaii: 0.08% | |||||
| Airport revenue: 0.08% | |||||
| Hawaii Harbor System Series C | 4.00 | 7-1-2036 | 500,000 | 510,174 | |
| Hawaii Harbor System Series C | 4.00 | 7-1-2037 | 600,000 | 621,322 | |
| 1,131,496 | |||||
| Illinois: 15.37% | |||||
| Airport revenue: 1.51% | |||||
| Chicago IL Midway Airport Second Lien Refunding Bond Series B | 4.00 | 1-1-2035 | 2,860,000 | 2,828,557 |
| Interest rate | Maturity date | Principal | Value | ||
| Airport revenue (continued) | |||||
| Chicago IL O'Hare International Airport Senior Lien (AGM Insured) | 5.13% | 1-1-2030 | $ 2,610,000 | $ 2,642,543 | |
| Chicago IL O'Hare International Airport Senior Lien (AGM Insured) | 5.13 | 1-1-2031 | 3,335,000 | 3,375,293 | |
| Chicago IL O'Hare International Airport Senior Lien Series A | 4.00 | 1-1-2038 | 1,000,000 | 982,578 | |
| Chicago IL O'Hare International Airport Senior Lien Series B | 5.00 | 1-1-2030 | 8,025,000 | 8,398,971 | |
| Chicago IL O'Hare International Airport Senior Lien Series B | 5.00 | 1-1-2036 | 1,530,000 | 1,644,631 | |
| Peoria IL Metropolitan Airport Authority Series D | 5.00 | 12-1-2027 | 2,250,000 | 2,475,689 | |
| 22,348,262 | |||||
| Education revenue: 0.91% | |||||
| Illinois Finance Authority Academic Facilities University of Illinois at Urbana-Champaign Project Series A | 5.00 | 10-1-2026 | 450,000 | 493,864 | |
| Illinois Finance Authority Academic Facilities University of Illinois at Urbana-Champaign Project Series A | 5.00 | 10-1-2031 | 400,000 | 449,505 | |
| Illinois Finance Authority Academic Facilities University of Illinois at Urbana-Champaign Project Series A | 5.00 | 10-1-2039 | 700,000 | 769,961 | |
| Illinois Finance Authority Bradley University Project Series C | 5.00 | 8-1-2032 | 2,500,000 | 2,581,877 | |
| Illinois Finance Authority Refunding Bond Bradley University Project Series A | 4.00 | 8-1-2035 | 805,000 | 751,108 | |
| Illinois Finance Authority Revenue Acero Charter Schools Incorporated 144A | 4.00 | 10-1-2034 | 440,000 | 401,188 | |
| Illinois Finance Authority Revenue Acero Charter Schools Incorporated 144A | 4.00 | 10-1-2035 | 1,025,000 | 927,475 | |
| Illinois Finance Authority University of Chicago Series 2021A | 5.00 | 10-1-2033 | 2,000,000 | 2,334,796 | |
| Illinois Finance Authority Wesleyan University | 5.00 | 9-1-2026 | 680,000 | 731,597 | |
| Northern Illinois University Board of Trustees Certificate of Participation (AGM Insured) | 5.00 | 9-1-2024 | 1,000,000 | 1,051,748 | |
| Southern Illinois University Refunding Bond Housing And Auxiliary Facilities System (BAM Insured) | 4.00 | 4-1-2029 | 400,000 | 413,225 | |
| Southern Illinois University Refunding Bond Housing And Auxiliary Facilities System (BAM Insured) | 4.00 | 4-1-2030 | 525,000 | 538,920 | |
| University of Illinois Board of Trustees Auxiliary Facilities System Revenue Refunding Bonds Series 2013A | 4.00 | 4-1-2030 | 2,000,000 | 2,002,451 | |
| 13,447,715 | |||||
| GO revenue: 2.58% | |||||
| Bolingbrook, Will & DuPage Counties IL Refunding Bond Series A (AGM Insured) | 5.00 | 1-1-2023 | 85,000 | 86,402 | |
| Chicago IL Board of Education CAB School Reform Series B-1 (NPFGC Insured) ¤ | 0.00 | 12-1-2025 | 3,380,000 | 2,999,824 | |
| Chicago IL CAB Series C ¤ | 0.00 | 1-1-2023 | 2,500,000 | 2,464,461 | |
| Chicago IL Park District Series B (BAM Insured) | 5.00 | 1-1-2029 | 2,000,000 | 2,090,048 | |
| Cook County IL Community College District #508 | 5.25 | 12-1-2025 | 1,665,000 | 1,704,383 | |
| Cook County IL Community College District #508 | 5.25 | 12-1-2027 | 1,295,000 | 1,321,018 | |
| Cook County IL Community College District #508 | 5.25 | 12-1-2028 | 1,250,000 | 1,274,216 | |
| Cook County IL Community College District #508 | 5.25 | 12-1-2030 | 3,000,000 | 3,053,751 | |
| Cook County IL Community College District #508 | 5.25 | 12-1-2031 | 3,200,000 | 3,255,432 | |
| Cook County IL Series A | 5.00 | 11-15-2029 | 1,000,000 | 1,081,676 | |
| Cook County IL Series A | 5.00 | 11-15-2034 | 1,300,000 | 1,391,341 | |
| Cook County IL Series B | 5.00 | 11-15-2023 | 600,000 | 625,037 |
| Interest rate | Maturity date | Principal | Value | ||
| GO revenue (continued) | |||||
| Cook County IL Series C | 5.00% | 11-15-2024 | $ 2,175,000 | $ 2,198,561 | |
| Cook County IL Series C | 5.00 | 11-15-2025 | 2,450,000 | 2,475,735 | |
| Illinois Series 2014 (AGM Insured) | 5.00 | 4-1-2026 | 5,000,000 | 5,192,496 | |
| Illinois Series A | 5.00 | 3-1-2033 | 1,000,000 | 1,074,714 | |
| Sangamon County IL Limited Tax (BAM Insured) | 4.00 | 12-15-2036 | 450,000 | 463,769 | |
| Sangamon County IL Limited Tax (BAM Insured) | 4.00 | 12-15-2040 | 300,000 | 302,944 | |
| Sangamon, Logan & Menard Counties IL Williamsville Community Unit School District Series B (BAM Insured) | 4.00 | 12-1-2037 | 700,000 | 723,267 | |
| Sangamon, Logan & Menard Counties IL Williamsville Community Unit School District Series B (BAM Insured) | 5.00 | 12-1-2034 | 400,000 | 448,784 | |
| Sangamon, Logan & Menard Counties IL Williamsville Community Unit School District Series B (BAM Insured) | 5.00 | 12-1-2035 | 450,000 | 503,999 | |
| Sangamon, Logan & Menard Counties IL Williamsville Community Unit School District Series B (BAM Insured) | 5.00 | 12-1-2036 | 500,000 | 559,007 | |
| Stephenson County IL School District #145 Prerefunded Series 2018A (AGM Insured) | 5.00 | 2-1-2033 | 285,000 | 321,997 | |
| Stephenson County IL School District #145 Unrefunded Series 2018A (AGM Insured) | 5.00 | 2-1-2033 | 1,265,000 | 1,411,659 | |
| Waukegan IL Series B (AGM Insured) | 4.00 | 12-30-2024 | 1,030,000 | 1,066,842 | |
| 38,091,363 | |||||
| Health revenue: 0.24% | |||||
| Illinois Finance Authority Ann & Robert H. Laurie Children's Hospital Project of Chicago | 5.00 | 8-15-2034 | 1,000,000 | 1,067,098 | |
| Illinois Finance Authority Edward Elmhurst Healthcare Series A | 5.00 | 1-1-2026 | 1,000,000 | 1,089,539 | |
| Illinois Finance Authority Health Services Facility Lease Bond | 5.00 | 10-1-2032 | 520,000 | 554,905 | |
| Illinois Finance Authority Lutheran Life Communities Obligated Group Series A | 5.00 | 11-1-2035 | 900,000 | 855,378 | |
| 3,566,920 | |||||
| Housing revenue: 0.78% | |||||
| Illinois Housing Development Authority Social Bonds Series D (GNMA / FNMA / FHLMC Insured, Bank of Montreal SPA) ø | 0.95 | 4-1-2045 | 7,860,000 | 7,860,000 | |
| Northern Illinois University Auxiliary Facilities System (BAM Insured) | 4.00 | 10-1-2033 | 1,000,000 | 1,015,964 | |
| Northern Illinois University Auxiliary Facilities System (BAM Insured) | 4.00 | 10-1-2036 | 1,650,000 | 1,649,621 | |
| Northern Illinois University Auxiliary Facilities System (BAM Insured) | 5.00 | 10-1-2031 | 900,000 | 1,011,008 | |
| 11,536,593 | |||||
| Miscellaneous revenue: 0.40% | |||||
| Illinois Finance Authority Refunding Bonds Field Museum of Natural History (U.S. SOFR +1.20%) ± | 1.04 | 11-1-2034 | 1,500,000 | 1,488,087 | |
| Illinois Refunding Bond | 5.00 | 8-1-2024 | 1,000,000 | 1,002,376 | |
| Illinois Series 2013 | 5.50 | 7-1-2026 | 2,300,000 | 2,359,527 | |
| Peoria IL Public Building Commission Illinois School District Facilities Refunding Bond (BAM Insured) | 5.00 | 12-1-2024 | 1,000,000 | 1,068,134 | |
| 5,918,124 | |||||
| Tax revenue: 6.17% | |||||
| Chicago IL Sales Tax Securitization Bond Series A | 5.00 | 1-1-2029 | 1,000,000 | 1,107,594 |
| Interest rate | Maturity date | Principal | Value | ||
| Tax revenue (continued) | |||||
| Chicago IL Sales Tax Securitization Bond Series C | 5.00% | 1-1-2027 | $ 4,370,000 | $ 4,748,378 | |
| Chicago IL Sales Tax Securitization Bond Series C | 5.25 | 1-1-2035 | 4,700,000 | 5,158,468 | |
| Cook County IL Sales Tax Bond Series 2017 | 5.00 | 11-15-2033 | 4,000,000 | 4,379,346 | |
| Cook County IL Sales Tax Bond Series 2018 | 5.25 | 11-15-2035 | 2,000,000 | 2,206,879 | |
| Cook County IL Sales Tax Bond Series 2021A | 5.00 | 11-15-2036 | 1,160,000 | 1,258,356 | |
| Cook County IL Sales Tax Bond Series 2021A | 5.00 | 11-15-2037 | 1,625,000 | 1,748,238 | |
| Illinois Regional Transportation Authority (NPFGC Insured) | 6.50 | 7-1-2026 | 8,615,000 | 9,527,401 | |
| Illinois Sales Tax Build Illinois Junior Obligation | 5.00 | 6-15-2025 | 6,000,000 | 6,126,606 | |
| Illinois Sports Facilities Authority State Tax Supported Refunding Bond | 5.00 | 6-15-2028 | 1,000,000 | 1,021,603 | |
| Illinois Sports Facilities Authority State Tax Supported Refunding Bond (AGM Insured) | 5.00 | 6-15-2028 | 2,500,000 | 2,605,673 | |
| Illinois Sports Facilities Authority State Tax Supported Refunding Bond (AGM Insured) | 5.25 | 6-15-2030 | 4,000,000 | 4,177,048 | |
| Illinois Sports Facilities Authority State Tax Supported Refunding Bond (AGM Insured) | 5.25 | 6-15-2032 | 3,000,000 | 3,128,156 | |
| Metropolitan Pier & Exposition Authority CAB McCormick Place Expansion Project Series A (NPFGC Insured) ¤ | 0.00 | 12-15-2029 | 33,200,000 | 24,907,716 | |
| Metropolitan Pier & Exposition Authority CAB McCormick Place Expansion Project Series A (NPFGC Insured) ¤ | 0.00 | 12-15-2030 | 12,800,000 | 9,155,680 | |
| Metropolitan Pier & Exposition Authority CAB McCormick Place Expansion Project Series B (NPFGC Insured) ¤ | 0.00 | 6-15-2029 | 10,000,000 | 7,676,802 | |
| Southwestern Illinois Development Authority Local Government Program Collinsville Limited | 5.00 | 3-1-2025 | 2,685,000 | 2,089,545 | |
| 91,023,489 | |||||
| Tobacco revenue: 0.21% | |||||
| Railsplitter Tobacco Settlement Authority | 5.00 | 6-1-2024 | 3,000,000 | 3,138,145 | |
| Transportation revenue: 0.20% | |||||
| Illinois Toll Highway Authority Senior Bond Class A | 5.00 | 1-1-2037 | 1,250,000 | 1,382,048 | |
| Illinois Toll Highway Authority Senior Bond Class A | 5.00 | 1-1-2038 | 1,355,000 | 1,494,719 | |
| 2,876,767 | |||||
| Water & sewer revenue: 2.37% | |||||
| Chicago IL Refunding Bond Second Lien Project | 5.00 | 11-1-2023 | 1,515,000 | 1,531,019 | |
| Chicago IL Refunding Bond Second Lien Project | 5.00 | 11-1-2025 | 620,000 | 625,000 | |
| Chicago IL Refunding Bond Second Lien Project | 5.00 | 11-1-2026 | 2,000,000 | 2,015,487 | |
| Chicago IL Refunding Bond Second Lien Project | 5.00 | 11-1-2028 | 3,000,000 | 3,022,603 | |
| Chicago IL Refunding Bond Second Lien Project | 5.00 | 11-1-2029 | 1,490,000 | 1,500,027 | |
| Chicago IL Refunding Bond Second Lien Project | 5.00 | 11-1-2033 | 1,000,000 | 1,026,023 | |
| Chicago IL Refunding Bond Second Lien Project (AGM Insured) | 5.25 | 11-1-2033 | 2,000,000 | 2,182,116 | |
| Chicago IL Waste Water Transmission Second Lien | 5.00 | 1-1-2024 | 2,000,000 | 2,004,815 | |
| Chicago IL Waste Water Transmission Second Lien | 5.00 | 1-1-2027 | 2,865,000 | 2,958,933 | |
| Chicago IL Waste Water Transmission Second Lien | 5.00 | 1-1-2028 | 3,500,000 | 3,504,991 | |
| Chicago IL Waste Water Transmission Second Lien | 5.00 | 1-1-2029 | 4,700,000 | 4,705,887 | |
| Chicago IL Waste Water Transmission Second Lien | 5.00 | 1-1-2032 | 1,000,000 | 1,018,478 | |
| Chicago IL Waste Water Transmission Second Lien | 5.00 | 1-1-2033 | 1,000,000 | 1,017,393 | |
| Chicago IL Waste Water Transmission Second Lien | 5.00 | 1-1-2034 | 1,000,000 | 1,016,750 | |
| Illinois Finance Authority Clean Water Initiative Revolving Fund Bond | 5.25 | 7-1-2035 | 3,000,000 | 3,400,779 | |
| Sangamon IL Water Commission Refunding Bond (AGM Insured) | 4.00 | 1-1-2029 | 525,000 | 549,327 |
| Interest rate | Maturity date | Principal | Value | ||
| Water & sewer revenue (continued) | |||||
| Sangamon IL Water Commission Refunding Bond (AGM Insured) | 4.00% | 1-1-2030 | $ 600,000 | $ 628,010 | |
| Sangamon IL Water Commission Refunding Bond (AGM Insured) | 4.00 | 1-1-2031 | 625,000 | 653,831 | |
| Sangamon IL Water Commission Refunding Bond (AGM Insured) | 4.00 | 1-1-2033 | 500,000 | 518,698 | |
| Sangamon IL Water Commission Refunding Bond (AGM Insured) | 4.00 | 1-1-2036 | 570,000 | 586,929 | |
| Sangamon IL Water Commission Refunding Bond (AGM Insured) | 4.00 | 1-1-2037 | 525,000 | 538,831 | |
| 35,005,927 | |||||
| 226,953,305 | |||||
| Indiana: 1.52% | |||||
| Airport revenue: 0.08% | |||||
| Indianapolis IN Local Public Improvement Bond Bank Series I | 5.00 | 1-1-2033 | 1,120,000 | 1,238,595 | |
| Industrial development revenue: 0.17% | |||||
| Indiana Finance Authority PCR Bonds Series 2010B | 2.50 | 11-1-2030 | 2,925,000 | 2,545,035 | |
| Miscellaneous revenue: 0.96% | |||||
| Dubois IN Greater Jasper School Building Corporation First Mortgage Bond | 5.00 | 7-15-2029 | 1,625,000 | 1,810,489 | |
| Indiana Finance Authority Stadium Project Series A | 5.25 | 2-1-2028 | 2,000,000 | 2,169,160 | |
| Indianapolis IN Local Public Improvement Bond Bank Series E | 5.00 | 1-1-2027 | 760,000 | 832,060 | |
| Indianapolis IN Local Public Improvement Bond Bank Series E | 5.00 | 1-1-2028 | 1,000,000 | 1,094,816 | |
| Indianapolis IN Local Public Improvement Bond Bank Series E | 5.00 | 1-1-2029 | 735,000 | 804,690 | |
| Indianapolis IN Local Public Improvement Bond Bank Series E | 5.00 | 1-1-2030 | 1,375,000 | 1,505,372 | |
| Indianapolis IN Local Public Improvement Bond Bank Series E | 5.00 | 1-1-2031 | 1,000,000 | 1,094,816 | |
| Indianapolis IN Local Public Improvement Bond Bank Series E | 5.00 | 1-1-2033 | 1,545,000 | 1,691,490 | |
| Indianapolis IN Local Public Improvement Bond Bank Series E | 5.00 | 1-1-2034 | 2,000,000 | 2,189,631 | |
| North West Hendricks IN Multi-School Building Corporation Ad Valorem Property Tax Mortgage Bond | 4.00 | 7-15-2031 | 900,000 | 954,000 | |
| 14,146,524 | |||||
| Utilities revenue: 0.07% | |||||
| Indiana Finance Authority Midwestern Disaster Relief Ohio Valley Electric Corporation Project Series 2012A | 4.25 | 11-1-2030 | 1,000,000 | 984,867 |
| Interest rate | Maturity date | Principal | Value | ||
| Water & sewer revenue: 0.24% | |||||
| Indiana Finance Authority First Lien Wastewater Utility Clean Water Project Series A | 5.00% | 10-1-2030 | $ 2,315,000 | $ 2,425,291 | |
| Indiana Finance Authority First Lien Wastewater Utility Clean Water Project Series A | 5.00 | 10-1-2031 | 1,035,000 | 1,082,243 | |
| 3,507,534 | |||||
| 22,422,555 | |||||
| Iowa: 0.38% | |||||
| GO revenue: 0.17% | |||||
| Altoona IA Annual Appropriation Urban Renewal Refunding Bond | 5.00 | 6-1-2027 | 2,310,000 | 2,529,939 | |
| Utilities revenue: 0.21% | |||||
| Iowa Gas Project Public Expenditure and Financial Accountability Incorporated | 5.00 | 9-1-2049 | 3,000,000 | 3,149,703 | |
| 5,679,642 | |||||
| Kansas: 0.25% | |||||
| Miscellaneous revenue: 0.19% | |||||
| Kansas Development Finance Authority Agro-Defense Facility Series G | 5.00 | 4-1-2030 | 2,650,000 | 2,715,739 | |
| Tax revenue: 0.06% | |||||
| Wyandotte County & Kansas City KS Special Obligation Vacation Village Project Area 4 Major Multi-Sport Athletic Complex Project CAB Series 2015 144A¤ | 0.00 | 9-1-2034 | 3,195,000 | 899,362 | |
| 3,615,101 | |||||
| Kentucky: 0.17% | |||||
| Education revenue: 0.10% | |||||
| Kentucky Bond Development Corporation Educational Facilities Danville Centre College | 4.00 | 6-1-2030 | 170,000 | 177,393 | |
| Kentucky Bond Development Corporation Educational Facilities Danville Centre College | 4.00 | 6-1-2031 | 260,000 | 269,069 | |
| Kentucky Bond Development Corporation Educational Facilities Danville Centre College | 4.00 | 6-1-2032 | 230,000 | 235,274 | |
| Kentucky Bond Development Corporation Educational Facilities Danville Centre College | 4.00 | 6-1-2033 | 180,000 | 182,012 | |
| Kentucky Bond Development Corporation Educational Facilities Danville Centre College | 4.00 | 6-1-2035 | 460,000 | 452,422 | |
| Kentucky Bond Development Corporation Educational Facilities Danville Centre College | 4.00 | 6-1-2036 | 235,000 | 227,880 | |
| 1,544,050 | |||||
| Transportation revenue: 0.07% | |||||
| Kentucky Public Transportation Infrastructure Authority Downtown Crossing Project CAB Series B ¤ | 0.00 | 7-1-2029 | 1,400,000 | 1,028,942 | |
| 2,572,992 |
| Interest rate | Maturity date | Principal | Value | ||
| Louisiana: 2.55% | |||||
| Airport revenue: 0.20% | |||||
| New Orleans LA Aviation Board Consolidated Rental Car Project (AGM Insured) | 5.00% | 1-1-2035 | $ 2,000,000 | $ 2,136,947 | |
| New Orleans LA Aviation Board North Terminal Project Series A | 5.00 | 1-1-2033 | 750,000 | 793,569 | |
| 2,930,516 | |||||
| Education revenue: 0.38% | |||||
| Louisiana PFA Loyola University Project CAB ¤ | 0.00 | 10-1-2027 | 3,380,000 | 3,223,563 | |
| Louisiana PFA Loyola University Project CAB ¤ | 0.00 | 10-1-2028 | 2,500,000 | 2,371,227 | |
| 5,594,790 | |||||
| Miscellaneous revenue: 1.16% | |||||
| Lafayette LA Communications System (AGM Insured) | 5.00 | 11-1-2025 | 1,500,000 | 1,628,501 | |
| Louisiana PFA Archdiocese of New Orleans Project | 5.00 | 7-1-2024 | 1,000,000 | 940,000 | |
| Louisiana PFA Archdiocese of New Orleans Project | 5.00 | 7-1-2025 | 600,000 | 564,000 | |
| Louisiana PFA Archdiocese of New Orleans Project | 5.00 | 7-1-2026 | 500,000 | 470,000 | |
| Louisiana Unclaimed Property Special Bond 1-49 South Project | 5.00 | 9-1-2026 | 2,000,000 | 2,163,570 | |
| Louisiana Unclaimed Property Special Bond 1-49 South Project | 5.00 | 9-1-2027 | 2,700,000 | 2,922,535 | |
| Louisiana Unclaimed Property Special Bond 1-49 South Project | 5.00 | 9-1-2028 | 2,405,000 | 2,603,221 | |
| Louisiana Unclaimed Property Special Bond 1-49 South Project | 5.00 | 9-1-2029 | 2,695,000 | 2,917,123 | |
| Louisiana Unclaimed Property Special Bond 1-49 South Project | 5.00 | 9-1-2030 | 2,700,000 | 2,922,535 | |
| 17,131,485 | |||||
| Tax revenue: 0.15% | |||||
| Jefferson LA Sales Tax District Series B (AGM Insured) | 5.00 | 12-1-2031 | 1,000,000 | 1,099,197 | |
| Jefferson LA Sales Tax District Series B (AGM Insured) | 5.00 | 12-1-2032 | 1,000,000 | 1,094,772 | |
| 2,193,969 | |||||
| Transportation revenue: 0.22% | |||||
| Greater New Orleans LA Expressway Commission Toll Subordinate Lien Bond (AGM Insured) | 5.00 | 11-1-2031 | 1,000,000 | 1,080,004 | |
| Greater New Orleans LA Expressway Commission Toll Subordinate Lien Bond (AGM Insured) | 5.00 | 11-1-2032 | 1,000,000 | 1,079,008 | |
| Greater New Orleans LA Expressway Commission Toll Subordinate Lien Bond (AGM Insured) | 5.00 | 11-1-2033 | 1,000,000 | 1,078,345 | |
| 3,237,357 | |||||
| Water & sewer revenue: 0.44% | |||||
| Greater Ouachita LA Waterworks and Sewer System Refunding Bond (BAM Insured) | 4.00 | 9-1-2030 | 500,000 | 537,057 | |
| Greater Ouachita LA Waterworks and Sewer System Refunding Bond (BAM Insured) | 4.00 | 9-1-2031 | 600,000 | 641,379 | |
| Greater Ouachita LA Waterworks and Sewer System Refunding Bond (BAM Insured) | 4.00 | 9-1-2032 | 655,000 | 696,061 | |
| Louisiana Local Government Environmental Facilities & CDA East Baton Rouge Series A | 5.00 | 2-1-2030 | 1,000,000 | 1,048,670 | |
| New Orleans LA Sewerage Service Series B (AGM Insured) | 4.00 | 6-1-2035 | 400,000 | 417,747 | |
| New Orleans LA Sewerage Service Series B (AGM Insured) | 4.00 | 6-1-2036 | 325,000 | 336,555 |
| Interest rate | Maturity date | Principal | Value | ||
| Water & sewer revenue (continued) | |||||
| New Orleans LA Sewerage Service Series B (AGM Insured) | 4.00% | 6-1-2037 | $ 335,000 | $ 343,757 | |
| New Orleans LA Sewerage Service Series B | 5.00 | 6-1-2032 | 1,000,000 | 1,129,658 | |
| New Orleans LA Sewerage Service Series B | 5.00 | 6-1-2033 | 695,000 | 782,258 | |
| New Orleans LA Sewerage Service Series B | 5.00 | 6-1-2034 | 600,000 | 673,757 | |
| 6,606,899 | |||||
| 37,695,016 | |||||
| Maine: 0.57% | |||||
| Education revenue: 0.37% | |||||
| Maine Health and HEFAR University of New England Series A | 5.00 | 7-1-2029 | 1,015,000 | 1,096,329 | |
| Maine Health and HEFAR University of New England Series A | 5.00 | 7-1-2030 | 1,200,000 | 1,291,082 | |
| Maine Health and HEFAR University of New England Series A | 5.00 | 7-1-2032 | 1,415,000 | 1,514,084 | |
| Maine Health and HEFAR University of New England Series A | 5.00 | 7-1-2033 | 1,485,000 | 1,585,119 | |
| 5,486,614 | |||||
| Health revenue: 0.20% | |||||
| Maine Health and HEFAR Series A | 4.00 | 7-1-2036 | 800,000 | 788,747 | |
| Maine Health and HEFAR Series A | 4.00 | 7-1-2037 | 1,150,000 | 1,135,125 | |
| Maine Health and HEFAR Series A | 5.00 | 7-1-2035 | 1,000,000 | 1,074,985 | |
| 2,998,857 | |||||
| 8,485,471 | |||||
| Maryland: 0.92% | |||||
| Education revenue: 0.30% | |||||
| Maryland Economic Development Corporation Student Housing Salisbury University Project | 5.00 | 6-1-2027 | 500,000 | 500,296 | |
| Maryland HEFAR Stevenson University Series 2021A | 4.00 | 6-1-2035 | 470,000 | 444,696 | |
| Maryland HEFAR Stevenson University Series 2021A | 4.00 | 6-1-2037 | 450,000 | 420,328 | |
| Maryland HEFAR Stevenson University Series 2021A | 4.00 | 6-1-2039 | 500,000 | 460,657 | |
| Westminster MD Educational Facilities McDaniel College | 5.00 | 11-1-2026 | 2,450,000 | 2,630,235 | |
| 4,456,212 | |||||
| Health revenue: 0.29% | |||||
| Tender Option Bond Trust Receipts/Certificates Series 2021-XG0335 (Bank of America NA LOC, Bank of America NA LIQ) 144Aø | 0.94 | 7-1-2051 | 4,345,000 | 4,345,000 | |
| Miscellaneous revenue: 0.19% | |||||
| Prince Georges County MD Upper Marlboro Courthouse Project Series A | 5.00 | 5-1-2028 | 1,215,000 | 1,377,472 | |
| Prince Georges County MD Upper Marlboro Courthouse Project Series A | 5.00 | 5-1-2029 | 1,275,000 | 1,438,370 | |
| 2,815,842 |
| Interest rate | Maturity date | Principal | Value | ||
| Tax revenue: 0.10% | |||||
| Howard County MD Downtown Columbia Project Series A 144A | 4.00% | 2-15-2028 | $ 480,000 | $ 468,449 | |
| Howard County MD Downtown Columbia Project Series A 144A | 4.13 | 2-15-2034 | 1,000,000 | 934,477 | |
| 1,402,926 | |||||
| Water & sewer revenue: 0.04% | |||||
| Baltimore MD Mayor and City Council Project Series A | 5.00 | 7-1-2035 | 500,000 | 565,692 | |
| 13,585,672 | |||||
| Massachusetts: 0.39% | |||||
| GO revenue: 0.32% | |||||
| Massachusetts Series B | 5.00 | 7-1-2035 | 1,500,000 | 1,668,355 | |
| Massachusetts Series B | 5.00 | 7-1-2036 | 2,700,000 | 2,993,847 | |
| 4,662,202 | |||||
| Health revenue: 0.07% | |||||
| Massachusetts Development Finance Agency Wellforce Issue Series C (AGM Insured) | 5.00 | 10-1-2033 | 525,000 | 569,444 | |
| Massachusetts Development Finance Agency Wellforce Issue Series C (AGM Insured) | 5.00 | 10-1-2034 | 500,000 | 539,291 | |
| 1,108,735 | |||||
| 5,770,937 | |||||
| Michigan: 3.05% | |||||
| Airport revenue: 0.10% | |||||
| Wayne County MI Airport Authority Detroit Metropolitan Bond Series A | 5.00 | 12-1-2032 | 800,000 | 857,281 | |
| Wayne County MI Airport Authority Detroit Metropolitan Bond Series A | 5.00 | 12-1-2034 | 600,000 | 640,578 | |
| 1,497,859 | |||||
| Education revenue: 0.43% | |||||
| Flint MI International Academy Public School | 5.38 | 10-1-2022 | 505,000 | 505,334 | |
| Flint MI International Academy Public School | 5.50 | 10-1-2027 | 1,985,000 | 1,985,244 | |
| Michigan State University Board of Trustees | 5.00 | 2-15-2036 | 1,325,000 | 1,439,388 | |
| Western Michigan University Board of Trustees | 5.25 | 11-15-2027 | 600,000 | 627,981 | |
| Western Michigan University Board of Trustees | 5.25 | 11-15-2029 | 1,000,000 | 1,046,634 | |
| Western Michigan University Board of Trustees (AGM Insured) | 5.25 | 11-15-2033 | 750,000 | 784,976 | |
| 6,389,557 | |||||
| GO revenue: 0.40% | |||||
| Kent County MI Limited Tax Capital Improvement Bond | 5.00 | 6-1-2030 | 1,040,000 | 1,143,503 | |
| Pinckney MI Community School District (Qualified School Board Loan Fund Insured) | 5.00 | 5-1-2025 | 2,040,000 | 2,136,832 | |
| Pinckney MI Community School District (Qualified School Board Loan Fund Insured) | 5.00 | 5-1-2026 | 2,505,000 | 2,620,240 | |
| 5,900,575 | |||||
| Health revenue: 0.28% | |||||
| Michigan Finance Authority Sparrow Obligated Group | 5.00 | 11-15-2023 | 400,000 | 404,591 |
| Interest rate | Maturity date | Principal | Value | ||
| Health revenue (continued) | |||||
| Michigan Finance Authority Sparrow Obligated Group | 5.00% | 11-15-2026 | $ 800,000 | $ 808,783 | |
| Michigan Finance Authority Trinity Health Credit Group Series MI-2 | 4.00 | 12-1-2035 | 3,000,000 | 2,981,787 | |
| 4,195,161 | |||||
| Housing revenue: 0.14% | |||||
| Michigan Housing Development Authority Series C (U.S. Bank NA SPA) ø | 0.90 | 12-1-2035 | 2,000,000 | 2,000,000 | |
| Miscellaneous revenue: 0.21% | |||||
| Michigan Finance Authority Local Government Loan Program Series F | 4.00 | 10-1-2024 | 3,000,000 | 3,038,483 | |
| Water & sewer revenue: 1.49% | |||||
| Great Lakes MI Water Authority Sewage Disposal System Series C | 5.00 | 7-1-2030 | 3,350,000 | 3,599,358 | |
| Michigan Finance Authority Local Government Loan Program Series D (NPFGC Insured) | 5.00 | 7-1-2025 | 1,000,000 | 1,051,107 | |
| Michigan Finance Authority Local Government Loan Program Series D | 5.00 | 7-1-2030 | 12,000,000 | 12,435,390 | |
| Michigan Finance Authority Local Government Loan Program Series D (AGM Insured) | 5.00 | 7-1-2035 | 2,750,000 | 2,848,700 | |
| Michigan Finance Authority Local Government Loan Program Series D (AGM Insured) | 5.00 | 7-1-2037 | 2,000,000 | 2,069,434 | |
| 22,003,989 | |||||
| 45,025,624 | |||||
| Minnesota: 0.07% | |||||
| GO revenue: 0.07% | |||||
| Hennepin County MN Series 2018B (TD Bank NA SPA) ø | 0.90 | 12-1-2038 | 1,000,000 | 1,000,000 | |
| Mississippi: 1.11% | |||||
| Health revenue: 0.21% | |||||
| Mississippi Hospital Equipment & Facilities Authority North Mississippi Health Services Series IV | 5.00 | 10-1-2037 | 1,000,000 | 1,058,615 | |
| Mississippi Hospital Equipment & Facilities Authority North Mississippi Health Services Series IV | 5.00 | 10-1-2038 | 1,000,000 | 1,056,424 | |
| Mississippi Hospital Equipment & Facilities Authority North Mississippi Health Services Series IV | 5.00 | 10-1-2039 | 1,000,000 | 1,054,641 | |
| 3,169,680 | |||||
| Water & sewer revenue: 0.90% | |||||
| Mississippi Development Bank Special Obligation Bonds Series 2012A Jackson Water & Sewer System Project (AGM Insured) | 5.00 | 9-1-2030 | 9,150,000 | 9,178,363 | |
| Mississippi Development Bank Special Obligation Bonds Series 2013 Jackson Water & Sewer System Project (AGM Insured) | 6.00 | 12-1-2023 | 1,145,000 | 1,203,858 | |
| West Rankin MS Utility Authority Series 2018 (AGM Insured) | 5.00 | 1-1-2026 | 525,000 | 562,500 | |
| West Rankin MS Utility Authority Series 2018 (AGM Insured) | 5.00 | 1-1-2027 | 435,000 | 466,071 |
| Interest rate | Maturity date | Principal | Value | ||
| Water & sewer revenue (continued) | |||||
| West Rankin MS Utility Authority Series 2018 (AGM Insured) | 5.00% | 1-1-2034 | $ 750,000 | $ 803,572 | |
| West Rankin MS Utility Authority Series 2018 (AGM Insured) | 5.00 | 1-1-2035 | 1,000,000 | 1,071,429 | |
| 13,285,793 | |||||
| 16,455,473 | |||||
| Missouri: 0.50% | |||||
| Education revenue: 0.17% | |||||
| Missouri HEFA Webster University Project | 5.00 | 4-1-2027 | 2,450,000 | 2,586,053 | |
| Health revenue: 0.15% | |||||
| Missouri HEFAR Barnes-Jewish Christian Health System Series C | 5.00 | 5-1-2052 | 2,000,000 | 2,202,502 | |
| Miscellaneous revenue: 0.18% | |||||
| Poplar Bluff MO School District (AGM Insured) | 5.00 | 3-1-2032 | 1,500,000 | 1,565,367 | |
| Poplar Bluff MO School District (AGM Insured) | 5.00 | 3-1-2034 | 1,000,000 | 1,043,744 | |
| 2,609,111 | |||||
| 7,397,666 | |||||
| Nebraska: 0.22% | |||||
| Health revenue: 0.08% | |||||
| Douglas County NE Hospital Authority Children's Hospital Obligated Group Series A | 4.00 | 11-15-2038 | 1,200,000 | 1,173,068 | |
| Utilities revenue: 0.14% | |||||
| Nebraska Central Plains Energy Gas Project #4 | 5.00 | 3-1-2050 | 2,000,000 | 2,059,880 | |
| 3,232,948 | |||||
| Nevada: 0.95% | |||||
| GO revenue: 0.93% | |||||
| Clark County NV Refunding Bond | 5.00 | 6-1-2030 | 3,955,000 | 4,374,046 | |
| Clark County NV Refunding Bond Series B | 5.00 | 11-1-2028 | 5,000,000 | 5,510,134 | |
| Clark County NV Stadium Improvement Bond Series A | 5.00 | 6-1-2032 | 1,615,000 | 1,792,718 | |
| Las Vegas NV Series A | 5.00 | 5-1-2031 | 1,985,000 | 2,077,043 | |
| 13,753,941 | |||||
| Miscellaneous revenue: 0.02% | |||||
| Las Vegas NV Special Improvement District #607 | 4.25 | 6-1-2024 | 200,000 | 202,642 | |
| 13,956,583 | |||||
| New Hampshire: 0.18% | |||||
| Housing revenue: 0.18% | |||||
| New Hampshire HFA | 4.80 | 7-1-2028 | 300,000 | 304,436 | |
| New Hampshire National Finance Authority Municipal Certificates Series A | 4.13 | 1-20-2034 | 2,414,672 | 2,375,466 | |
| 2,679,902 |
| Interest rate | Maturity date | Principal | Value | ||
| New Jersey: 2.69% | |||||
| Airport revenue: 0.31% | |||||
| South Jersey NJ Port Corporation Marine Terminal Refunding Bond Series S | 5.00% | 1-1-2028 | $ 2,130,000 | $ 2,241,901 | |
| South Jersey NJ Port Corporation Marine Terminal Refunding Bond Series S | 5.00 | 1-1-2029 | 2,200,000 | 2,304,988 | |
| 4,546,889 | |||||
| GO revenue: 0.34% | |||||
| Trenton City NJ (BAM Insured) | 5.00 | 12-1-2024 | 1,775,000 | 1,888,186 | |
| Trenton City NJ (BAM Insured) | 5.00 | 12-1-2025 | 1,860,000 | 2,018,173 | |
| Trenton City NJ (BAM Insured) | 5.00 | 12-1-2026 | 1,000,000 | 1,080,735 | |
| 4,987,094 | |||||
| Miscellaneous revenue: 0.49% | |||||
| New Jersey EDA Motor Vehicle Surcharge Revenue Refunding Bonds Series A | 3.13 | 7-1-2029 | 445,000 | 421,710 | |
| New Jersey EDA Motor Vehicle Surcharge Revenue Refunding Bonds Series A | 5.00 | 7-1-2033 | 2,500,000 | 2,623,485 | |
| New Jersey Educational Facilities Authority | 5.00 | 6-15-2026 | 3,015,000 | 3,114,833 | |
| North Hudson NJ Sewerage Authority Gross Revenue Senior Lien Lease Certificates Series 2021 (AGM Insured) | 5.00 | 6-1-2038 | 1,000,000 | 1,170,962 | |
| 7,330,990 | |||||
| Tax revenue: 0.93% | |||||
| New Jersey EDA Motor Vehicle Surcharge Unrefunded Bonds Series A (NPFGC Insured) | 5.25 | 7-1-2026 | 2,320,000 | 2,512,817 | |
| New Jersey Garden State Preservation Trust Open & Farmland Series A (AGM Insured) | 5.75 | 11-1-2028 | 5,000,000 | 5,605,180 | |
| New Jersey TTFA Transportation System Series AA | 5.00 | 6-15-2036 | 2,000,000 | 2,134,255 | |
| New Jersey TTFA Transportation System Series AA | 5.00 | 6-15-2038 | 3,250,000 | 3,451,898 | |
| 13,704,150 | |||||
| Transportation revenue: 0.62% | |||||
| New Jersey TTFA CAB Transportation System Series A ¤ | 0.00 | 12-15-2030 | 2,000,000 | 1,427,027 | |
| New Jersey TTFA CAB Transportation System Series C (Ambac Insured) ¤ | 0.00 | 12-15-2026 | 3,500,000 | 3,025,616 | |
| New Jersey TTFA Transportation System Series A | 5.00 | 12-15-2036 | 2,000,000 | 2,100,475 | |
| New Jersey TTFA Transportation System Series C | 5.25 | 6-15-2032 | 2,500,000 | 2,583,636 | |
| 9,136,754 | |||||
| 39,705,877 | |||||
| New Mexico: 1.23% | |||||
| GO revenue: 0.18% | |||||
| Albuquerque NM Municipal School District #12 Bernalillo & Sandoval Counties | 5.00 | 8-1-2026 | 1,205,000 | 1,331,020 | |
| Albuquerque NM Municipal School District #12 Bernalillo & Sandoval Counties | 5.00 | 8-1-2034 | 1,150,000 | 1,276,733 | |
| 2,607,753 | |||||
| Industrial development revenue: 0.15% | |||||
| Farmington NM PCR | 1.80 | 4-1-2029 | 2,540,000 | 2,190,081 |
| Interest rate | Maturity date | Principal | Value | ||
| Miscellaneous revenue: 0.72% | |||||
| Clayton NM Jail Project Improvement & Refunding Bond (NPFGC Insured) | 5.00% | 11-1-2028 | $ 9,265,000 | $ 9,661,737 | |
| Clayton NM Jail Project Improvement & Refunding Bond (NPFGC Insured) | 5.00 | 11-1-2029 | 1,000,000 | 1,038,755 | |
| 10,700,492 | |||||
| Utilities revenue: 0.18% | |||||
| New Mexico Municipal Energy Acquisition Authority Gas Supply Revenue Refunding & Acquisition Bond Subordinated Series A (Royal Bank of Canada LIQ) | 5.00 | 11-1-2039 | 2,570,000 | 2,708,108 | |
| 18,206,434 | |||||
| New York: 12.12% | |||||
| Airport revenue: 0.15% | |||||
| New York Transportation Development Corporation Special Facilities Revenue Terminal 4 John F. Kennedy International Airport Project Series 2020C | 5.00 | 12-1-2035 | 1,000,000 | 1,054,035 | |
| New York Transportation Development Corporation Special Facilities Revenue Terminal 4 John F. Kennedy International Airport Project Series 2020C | 5.00 | 12-1-2029 | 1,160,000 | 1,244,886 | |
| 2,298,921 | |||||
| Education revenue: 1.35% | |||||
| Dutchess County NY Local Development Corporation The Culinary Institute of America Project Series A-1 | 5.00 | 7-1-2027 | 335,000 | 356,034 | |
| Hempstead NY Local Development Corporation The Academy Charter School Project Series A | 4.45 | 2-1-2041 | 5,500,000 | 4,526,046 | |
| Hempstead NY Local Development Corporation The Academy Charter School Project Series A | 5.53 | 2-1-2040 | 2,725,000 | 2,743,291 | |
| Hempstead NY Local Development Corporation The Academy Charter School Project Series A | 5.89 | 2-1-2032 | 2,745,000 | 2,845,903 | |
| Hempstead NY Local Development Corporation The Academy Charter School Project Series A | 6.24 | 2-1-2047 | 1,750,000 | 1,822,414 | |
| Hempstead NY Local Development Corporation The Academy Charter School Project Series B | 5.57 | 2-1-2041 | 4,140,000 | 4,167,745 | |
| Monroe County NY Industrial Development Monroe Community College Project Series A (AGM Insured) | 5.00 | 1-15-2023 | 645,000 | 656,775 | |
| Monroe County NY Industrial Development Monroe Community College Project Series A (AGM Insured) | 5.00 | 1-15-2024 | 905,000 | 947,035 | |
| Westchester County NY Local Development Pace University Series B ø | 1.37 | 5-1-2044 | 1,910,000 | 1,910,000 | |
| 19,975,243 | |||||
| GO revenue: 1.09% | |||||
| Hempstead NY Public Improvement Series A | 4.00 | 6-15-2028 | 5,000,000 | 5,283,141 | |
| New York Fiscal Subordinate Bond Series 2017A-6 (JPMorgan Chase & Company SPA) ø | 0.65 | 8-1-2044 | 480,000 | 480,000 | |
| New York NY Series B | 5.00 | 12-1-2032 | 2,000,000 | 2,159,502 | |
| New York NY Series C | 5.00 | 8-1-2031 | 5,000,000 | 5,328,370 | |
| New York NY Subordinated Series D1 | 5.25 | 5-1-2040 | 1,500,000 | 1,686,120 | |
| Yonkers NY Series C (AGM Insured) | 5.00 | 3-15-2035 | 1,000,000 | 1,128,536 | |
| 16,065,669 |
| Interest rate | Maturity date | Principal | Value | ||
| Health revenue: 0.54% | |||||
| New York Dormitory Authority Catholic Health Systems Obligated Group Revenue Bond Series 2019B (Manufacturers & Traders Trust Company LOC) ø | 0.98% | 7-1-2048 | $ 7,925,000 | $ 7,925,000 | |
| Industrial development revenue: 0.06% | |||||
| New York Liberty Development Corporation Refunding Bonds 4 World Trade Center Project | 2.80 | 9-15-2069 | 1,000,000 | 903,397 | |
| Miscellaneous revenue: 0.34% | |||||
| New York Dormitory Authority Series D | 5.00 | 10-1-2031 | 2,005,000 | 2,233,058 | |
| New York NY Transitional Finance Authority Building Aid Bond Series S-1 | 5.00 | 7-15-2032 | 2,530,000 | 2,770,453 | |
| 5,003,511 | |||||
| Tax revenue: 4.11% | |||||
| New York Convention Center Development Corporation | 5.00 | 11-15-2028 | 8,000,000 | 8,557,887 | |
| New York Dormitory Authority Series A | 5.00 | 3-15-2028 | 5,000,000 | 5,337,103 | |
| New York Dormitory Authority Series A | 5.00 | 2-15-2031 | 3,000,000 | 3,231,792 | |
| New York Dormitory Authority Series D | 4.00 | 2-15-2039 | 5,000,000 | 4,923,212 | |
| New York Dormitory Authority Series E | 5.00 | 3-15-2035 | 15,000,000 | 16,435,248 | |
| New York Metropolitan Transportation Authority Dedicated Tax Fund Refunding Bond Series 2016A | 5.25 | 11-15-2034 | 2,000,000 | 2,153,279 | |
| New York NY Transitional Finance Authority Series B | 5.00 | 8-1-2027 | 1,145,000 | 1,211,594 | |
| New York NY Transitional Finance Authority Series C | 5.00 | 11-1-2027 | 5,000,000 | 5,348,753 | |
| New York NY Transitional Finance Authority Subordinate Bond Series B-1 | 5.00 | 11-1-2028 | 1,000,000 | 1,076,358 | |
| New York Urban Development Corporation Personal Income Tax Series A | 5.00 | 3-15-2031 | 3,815,000 | 3,990,747 | |
| New York Urban Development Corporation Personal Income Tax Series A | 5.00 | 3-15-2032 | 5,000,000 | 5,396,766 | |
| New York Urban Development Corporation Personal Income Tax Series C | 4.00 | 3-15-2037 | 3,000,000 | 2,987,824 | |
| 60,650,563 | |||||
| Transportation revenue: 3.96% | |||||
| New York Metropolitan Transportation Authority Refunding Bond Series A | 5.00 | 11-15-2030 | 4,010,000 | 4,047,601 | |
| New York Metropolitan Transportation Authority Refunding Bond Series B | 5.00 | 11-15-2033 | 2,175,000 | 2,279,371 | |
| New York Metropolitan Transportation Authority Refunding Bond Series D | 5.00 | 11-15-2028 | 2,450,000 | 2,478,954 | |
| New York Metropolitan Transportation Authority Refunding Bond Series D | 5.00 | 11-15-2031 | 3,415,000 | 3,592,901 | |
| New York Metropolitan Transportation Authority Refunding Bond Subordinated Series C1 | 5.25 | 11-15-2031 | 11,540,000 | 12,126,278 | |
| New York Metropolitan Transportation Authority Refunding Bond Subordinated Series D1 | 5.00 | 11-15-2030 | 2,010,000 | 2,102,836 | |
| New York Metropolitan Transportation Authority Refunding Green Bonds and Climate Bond | 5.00 | 11-15-2027 | 12,640,000 | 13,572,928 | |
| New York Metropolitan Transportation Authority Refunding Green Bonds Series D1 | 5.00 | 11-15-2034 | 2,000,000 | 2,087,658 | |
| Triborough Bridge & Tunnel Authority New York Revenues Refunding Bond Series C | 5.00 | 11-15-2034 | 4,165,000 | 4,600,903 |
| Interest rate | Maturity date | Principal | Value | ||
| Transportation revenue (continued) | |||||
| Triborough Bridge & Tunnel Authority New York Revenues Refunding Bond Series C | 5.00% | 11-15-2035 | $ 5,015,000 | $ 5,525,227 | |
| Triborough Bridge & Tunnel Authority Subordinated Bonds Series B-2 (State Street Bank & Trust Company LOC) ø | 1.19 | 1-1-2032 | 6,000,000 | 6,000,000 | |
| 58,414,657 | |||||
| Utilities revenue: 0.09% | |||||
| New York Utility Debt Securitization Authority | 5.00 | 12-15-2032 | 1,250,000 | 1,302,851 | |
| Water & sewer revenue: 0.43% | |||||
| New York NY Municipal Water Finance Authority Series GG | 5.00 | 6-15-2029 | 1,295,000 | 1,396,530 | |
| New York NY Municipal Water Finance Authority Series HH | 5.00 | 6-15-2037 | 4,000,000 | 4,239,607 | |
| Western Nassau NY Water Authority Series A | 5.00 | 4-1-2027 | 385,000 | 412,793 | |
| Western Nassau NY Water Authority Series A | 5.00 | 4-1-2028 | 300,000 | 321,078 | |
| 6,370,008 | |||||
| 178,909,820 | |||||
| North Carolina: 0.19% | |||||
| Miscellaneous revenue: 0.19% | |||||
| North Carolina Grant Anticipation Vehicle Bond | 5.00 | 3-1-2029 | 2,470,000 | 2,618,595 | |
| Tender Option Bond Trust Receipts/Certificates Series 2021-XG0331 (Deutsche Bank LIQ) 144Aø | 1.04 | 6-1-2048 | 146,500 | 146,500 | |
| 2,765,095 | |||||
| Ohio: 1.44% | |||||
| Education revenue: 0.08% | |||||
| Ohio HEFAR Xavier University Project | 5.00 | 5-1-2029 | 1,080,000 | 1,205,782 | |
| Health revenue: 0.08% | |||||
| Hamilton OH Hospital Facilities UC Health | 5.00 | 9-15-2035 | 1,100,000 | 1,171,897 | |
| Miscellaneous revenue: 0.37% | |||||
| Cincinnati OH City School District Improvement Project Certificate of Participation | 5.00 | 12-15-2025 | 2,095,000 | 2,242,598 | |
| Clermont County OH Port Authority West Clermont Local School District Project (BAM Insured) | 5.00 | 12-1-2025 | 500,000 | 543,545 | |
| Clermont County OH Port Authority West Clermont Local School District Project (BAM Insured) | 5.00 | 12-1-2026 | 600,000 | 651,023 | |
| Clermont County OH Port Authority West Clermont Local School District Project (BAM Insured) | 5.00 | 12-1-2028 | 1,250,000 | 1,350,762 | |
| RiverSouth OH Lazarus Building Redevelopment Series A | 5.75 | 12-1-2027 | 625,000 | 625,181 | |
| 5,413,109 | |||||
| Tax revenue: 0.19% | |||||
| Cleveland OH Subordinate Lien Income Tax Refunding Bond Series B-1 | 5.00 | 10-1-2030 | 2,500,000 | 2,782,158 | |
| Tobacco revenue: 0.14% | |||||
| Buckeye Tobacco Settlement Financing Authority Refunding Bond | 4.00 | 6-1-2038 | 2,100,000 | 2,046,260 |
| Interest rate | Maturity date | Principal | Value | ||
| Transportation revenue: 0.07% | |||||
| Ohio Turnpike Commission Junior Lien Infrastructure Projects Series A-1 | 5.25% | 2-15-2029 | $ 1,000,000 | $ 1,022,227 | |
| Utilities revenue: 0.44% | |||||
| Cleveland OH Public Power System Refunding Bond (AGM Insured) | 5.00 | 11-15-2033 | 625,000 | 690,738 | |
| Hamilton OH Electric System Improvement & Refunding Bond (BAM Insured) | 4.00 | 10-1-2034 | 710,000 | 741,470 | |
| Hamilton OH Electric System Improvement & Refunding Bond (BAM Insured) | 4.00 | 10-1-2035 | 1,000,000 | 1,042,433 | |
| Lancaster OH Port Authority Gas Supply Series A (Royal Bank of Canada LIQ) | 5.00 | 8-1-2049 | 3,000,000 | 3,146,458 | |
| Ohio Air Quality Development Authority Ohio Valley Electric Corporation Project Series 2019A | 3.25 | 9-1-2029 | 1,000,000 | 936,934 | |
| 6,558,033 | |||||
| Water & sewer revenue: 0.07% | |||||
| Ohio Water Development Authority Pollution Control Series A | 5.00 | 12-1-2031 | 1,000,000 | 1,105,469 | |
| 21,304,935 | |||||
| Oklahoma: 2.80% | |||||
| Education revenue: 0.05% | |||||
| Oklahoma Agricultural and Mechanical Colleges Refunding Bond Series A | 4.00 | 9-1-2036 | 750,000 | 767,869 | |
| Miscellaneous revenue: 2.44% | |||||
| Cache OK Educational Facilities Authority Cache Public Schools Project Series A | 5.00 | 9-1-2025 | 3,055,000 | 3,287,450 | |
| Canadian County OK Education Facilities Authority Mustang Public Schools Project | 5.00 | 9-1-2027 | 2,000,000 | 2,205,988 | |
| Canadian County OK Education Facilities Authority Mustang Public Schools Project | 5.00 | 9-1-2028 | 2,180,000 | 2,401,802 | |
| Carter County OK Public Facilities Authority Educational Facilities Plainview Public School Project | 5.00 | 12-1-2026 | 1,000,000 | 1,102,735 | |
| Carter County OK Public Facilities Authority Educational Facilities Plainview Public School Project | 5.00 | 12-1-2027 | 1,000,000 | 1,102,297 | |
| Carter County OK Public Facilities Authority Educational Facilities Plainview Public School Project | 5.00 | 12-1-2028 | 1,285,000 | 1,413,072 | |
| Cleveland County OK Educational Facilities Authority Noble Public Schools Project | 5.00 | 9-1-2027 | 700,000 | 775,535 | |
| Cleveland County OK Educational Facilities Authority Noble Public Schools Project | 5.00 | 9-1-2028 | 400,000 | 444,513 | |
| Cleveland County OK Educational Facilities Authority Noble Public Schools Project | 5.00 | 9-1-2029 | 250,000 | 276,832 | |
| Cleveland County OK Educational Facilities Authority Noble Public Schools Project | 5.00 | 9-1-2031 | 675,000 | 740,896 | |
| Comanche County OK Educational Facilities Authority Elgin Public Schools Project Series A | 5.00 | 12-1-2032 | 1,600,000 | 1,763,360 | |
| Dewey County OK Educational Facilities Authority Seiling Public Schools Project | 5.00 | 9-1-2026 | 1,230,000 | 1,351,055 | |
| Dewey County OK Educational Facilities Authority Seiling Public Schools Project | 5.00 | 9-1-2027 | 1,240,000 | 1,359,984 | |
| Garvin County OK Educational Facilities Authority Lindsay Public Schools Project | 5.00 | 9-1-2026 | 1,000,000 | 1,077,983 |
| Interest rate | Maturity date | Principal | Value | ||
| Miscellaneous revenue (continued) | |||||
| Garvin County OK Educational Facilities Authority Lindsay Public Schools Project | 5.00% | 9-1-2027 | $ 1,245,000 | $ 1,340,909 | |
| Grady County OK Educational Facilities Tuttle Public Schools Project | 5.00 | 9-1-2023 | 1,000,000 | 1,036,020 | |
| Grady County OK Educational Facilities Tuttle Public Schools Project | 5.00 | 9-1-2025 | 500,000 | 538,992 | |
| Grady County OK Educational Facilities Tuttle Public Schools Project | 5.00 | 9-1-2028 | 1,160,000 | 1,247,531 | |
| Muskogee OK Industrial Trust Educational Facilities Lease Muskogee Public Schools Project | 4.00 | 9-1-2029 | 3,000,000 | 3,138,227 | |
| Muskogee OK Industrial Trust Educational Facilities Lease Muskogee Public Schools Project | 4.00 | 9-1-2032 | 3,000,000 | 3,054,343 | |
| Oklahoma Development Finance Authority State System of Higher Education Series B | 5.00 | 6-1-2030 | 500,000 | 562,325 | |
| Oklahoma Development Finance Authority State System of Higher Education Series B | 5.00 | 6-1-2031 | 520,000 | 581,681 | |
| Oklahoma Development Finance Authority State System of Higher Education Series B | 5.00 | 6-1-2032 | 550,000 | 612,145 | |
| Pontotoc County OK Educational Facilities Authority Ada Public Schools Project | 4.00 | 9-1-2032 | 450,000 | 462,896 | |
| Pontotoc County OK Educational Facilities Authority Ada Public Schools Project | 4.00 | 9-1-2033 | 800,000 | 817,195 | |
| Pontotoc County OK Educational Facilities Authority Ada Public Schools Project | 4.00 | 9-1-2034 | 625,000 | 634,888 | |
| Pontotoc County OK Educational Facilities Authority Ada Public Schools Project | 4.00 | 9-1-2035 | 810,000 | 818,478 | |
| Pontotoc County OK Educational Facilities Authority Ada Public Schools Project | 4.00 | 9-1-2036 | 1,000,000 | 1,005,381 | |
| Tulsa County OK Industrial Authority Educational Facilities Glenpool Public Schools Project Series A | 5.00 | 9-1-2025 | 880,000 | 951,971 | |
| 36,106,484 | |||||
| Tax revenue: 0.29% | |||||
| Oklahoma City OK Public Property Authority | 5.00 | 10-1-2026 | 1,495,000 | 1,624,320 | |
| Oklahoma City OK Public Property Authority | 5.00 | 10-1-2027 | 1,140,000 | 1,237,495 | |
| Oklahoma City OK Public Property Authority | 5.00 | 10-1-2028 | 1,265,000 | 1,371,122 | |
| 4,232,937 | |||||
| Water & sewer revenue: 0.02% | |||||
| McGee Creek Oklahoma Authority (NPFGC Insured) | 6.00 | 1-1-2023 | 250,000 | 254,483 | |
| 41,361,773 | |||||
| Oregon: 0.87% | |||||
| Airport revenue: 0.16% | |||||
| Portland International Airport Refunding Bond Series 26A | 4.00 | 7-1-2037 | 565,000 | 567,824 | |
| Portland International Airport Refunding Bond Series 26A | 5.00 | 7-1-2033 | 400,000 | 449,959 | |
| Portland International Airport Refunding Bond Series 26B | 5.00 | 7-1-2033 | 530,000 | 596,196 | |
| Portland International Airport Refunding Bond Series 26B | 5.00 | 7-1-2037 | 705,000 | 776,262 | |
| 2,390,241 |
| Interest rate | Maturity date | Principal | Value | ||
| GO revenue: 0.50% | |||||
| Benton & Linn Counties OR Corvallis School District Series B (AGM Insured) | 5.00% | 6-15-2031 | $ 5,110,000 | $ 5,735,754 | |
| Washington & Multnomah Counties OR Beaverton School District Series D (AGM Insured) | 5.00 | 6-15-2035 | 1,500,000 | 1,640,961 | |
| 7,376,715 | |||||
| Health revenue: 0.21% | |||||
| Oregon Facilities Authority Asante Project Series A | 5.00 | 8-15-2037 | 1,400,000 | 1,486,492 | |
| Oregon Facilities Authority Samaritan Health Services Project Series A | 5.00 | 10-1-2026 | 1,500,000 | 1,619,884 | |
| 3,106,376 | |||||
| 12,873,332 | |||||
| Pennsylvania: 11.76% | |||||
| Airport revenue: 0.06% | |||||
| Philadelphia PA Airport Refunding Bond Series A | 5.00 | 7-1-2028 | 315,000 | 344,913 | |
| Philadelphia PA Airport Refunding Bond Series A | 5.00 | 7-1-2031 | 450,000 | 482,668 | |
| 827,581 | |||||
| Education revenue: 0.98% | |||||
| Chester County PA IDA Collegium Charter School Project Series A | 5.00 | 10-15-2027 | 1,500,000 | 1,537,353 | |
| Northampton County PA General Purpose Authority College Refunding Bond | 5.00 | 11-1-2027 | 1,000,000 | 1,112,518 | |
| Northeastern Pennsylvania Hospital & Education Authority Series A | 5.00 | 3-1-2026 | 885,000 | 933,813 | |
| Northeastern Pennsylvania Hospital & Education Authority Series A | 5.00 | 3-1-2028 | 660,000 | 688,776 | |
| Pennsylvania HEFAR Series AR | 5.00 | 6-15-2025 | 1,000,000 | 1,075,735 | |
| Pennsylvania HEFAR Series AS | 5.00 | 6-15-2027 | 2,190,000 | 2,386,335 | |
| Pennsylvania HEFAR Series LL1 | 5.00 | 11-1-2022 | 1,310,000 | 1,324,837 | |
| Pennsylvania Public School Building Authority Community College of Philadelphia Project Series A | 5.00 | 6-15-2025 | 2,265,000 | 2,413,884 | |
| Philadelphia PA IDA | 6.13 | 6-15-2023 | 200,000 | 205,622 | |
| Philadelphia PA IDA | 7.00 | 5-1-2026 | 610,000 | 611,018 | |
| Philadelphia PA Public School Building Authority (BAM Insured) | 5.00 | 6-15-2026 | 2,000,000 | 2,146,742 | |
| 14,436,633 | |||||
| GO revenue: 4.64% | |||||
| Allegheny County PA Moon Area School District Series A | 5.00 | 11-15-2024 | 3,425,000 | 3,628,532 | |
| Allegheny County PA Series 72 | 5.25 | 12-1-2033 | 4,045,000 | 4,238,233 | |
| Central Dauphin PA School District | 5.00 | 2-1-2030 | 1,110,000 | 1,220,637 | |
| Norristown PA Area School District Montgomery County Series 2018 (BAM Insured) | 5.00 | 9-1-2035 | 2,035,000 | 2,224,339 | |
| Philadelphia PA Refunding Bond (AGM Insured) | 5.00 | 8-1-2025 | 7,000,000 | 7,592,498 | |
| Philadelphia PA Refunding Bond Series A | 5.00 | 8-1-2024 | 1,000,000 | 1,056,698 | |
| Philadelphia PA Refunding Bond Series A | 5.00 | 7-15-2026 | 3,000,000 | 3,143,177 | |
| Philadelphia PA Refunding Bond Series A | 5.25 | 7-15-2028 | 2,590,000 | 2,723,322 | |
| Philadelphia PA Refunding Bond Series A | 5.25 | 7-15-2029 | 4,410,000 | 4,637,007 | |
| Philadelphia PA Refunding Bond Series A | 5.25 | 7-15-2032 | 4,380,000 | 4,605,463 | |
| Philadelphia PA School District Refunding Bond Series F | 5.00 | 9-1-2028 | 5,000,000 | 5,477,598 | |
| Philadelphia PA School District Refunding Bond Series F | 5.00 | 9-1-2029 | 5,000,000 | 5,465,207 |
| Interest rate | Maturity date | Principal | Value | ||
| GO revenue (continued) | |||||
| Philadelphia PA School District Refunding Bond Series F | 5.00% | 9-1-2031 | $ 1,240,000 | $ 1,352,817 | |
| Philadelphia PA School District Refunding Bond Series F | 5.00 | 9-1-2032 | 1,000,000 | 1,063,016 | |
| Philadelphia PA School District Series A | 5.00 | 9-1-2032 | 2,300,000 | 2,535,152 | |
| Philadelphia PA School District Series C | 5.00 | 9-1-2033 | 6,180,000 | 6,782,390 | |
| Philadelphia PA Series A | 5.00 | 8-1-2027 | 1,685,000 | 1,879,484 | |
| Philadelphia PA Series A | 5.00 | 8-1-2033 | 2,020,000 | 2,177,413 | |
| Pittsburgh PA Moon Area School District Series A | 5.00 | 11-15-2029 | 1,000,000 | 1,063,459 | |
| Reading Berks PA Series A (BAM Insured) | 5.00 | 11-1-2026 | 1,000,000 | 1,092,584 | |
| Reading PA School District (AGM Insured) | 5.00 | 3-1-2037 | 2,000,000 | 2,161,997 | |
| Reading PA School District (AGM Insured) | 5.00 | 3-1-2038 | 1,735,000 | 1,872,869 | |
| Scranton Lackawanna County PA School District Bond Series A (BAM Insured) | 5.00 | 6-1-2037 | 500,000 | 551,562 | |
| 68,545,454 | |||||
| Health revenue: 1.27% | |||||
| Allegheny County PA Hospital Development Authority University of Pittsburgh Medical Center Series A | 4.00 | 7-15-2037 | 2,000,000 | 1,956,510 | |
| Allegheny County PA Hospital Development Authority University of Pittsburgh Medical Center Series A | 5.00 | 7-15-2025 | 155,000 | 164,677 | |
| Allegheny County PA Hospital Development Authority University of Pittsburgh Medical Center Series A | 5.00 | 7-15-2031 | 3,750,000 | 4,117,934 | |
| Allegheny County PA Hospital Development Authority University of Pittsburgh Medical Center Series B (NPFGC Insured) | 6.00 | 7-1-2025 | 2,605,000 | 2,840,139 | |
| Cumberland County PA Municipal Authority Diakon Lutheran Social Ministries Project | 5.00 | 1-1-2025 | 170,000 | 181,715 | |
| Cumberland County PA Municipal Authority Diakon Lutheran Social Ministries Project | 5.00 | 1-1-2025 | 445,000 | 475,666 | |
| Cumberland County PA Municipal Authority Diakon Lutheran Social Ministries Project | 5.00 | 1-1-2025 | 725,000 | 754,067 | |
| Cumberland County PA Municipal Authority Diakon Lutheran Social Ministries Project | 5.00 | 1-1-2026 | 155,000 | 165,681 | |
| Cumberland County PA Municipal Authority Diakon Lutheran Social Ministries Project | 5.00 | 1-1-2026 | 390,000 | 416,876 | |
| Cumberland County PA Municipal Authority Diakon Lutheran Social Ministries Project | 5.00 | 1-1-2026 | 825,000 | 856,844 | |
| Cumberland County PA Municipal Authority Diakon Lutheran Social Ministries Project | 5.00 | 1-1-2027 | 150,000 | 160,337 | |
| Cumberland County PA Municipal Authority Diakon Lutheran Social Ministries Project | 5.00 | 1-1-2027 | 365,000 | 390,153 | |
| Cumberland County PA Municipal Authority Diakon Lutheran Social Ministries Project | 5.00 | 1-1-2027 | 710,000 | 735,171 | |
| Montgomery County PA HEFA Thomas Jefferson University | 4.00 | 9-1-2037 | 1,000,000 | 994,733 | |
| Pennsylvania EDFA University of Pittsburgh Medical Center Series A | 5.00 | 4-15-2031 | 1,000,000 | 1,108,432 | |
| Pennsylvania EDFA University of Pittsburgh Medical Center Series A | 5.00 | 4-15-2034 | 1,650,000 | 1,808,771 | |
| Pennsylvania EDFA University of Pittsburgh Medical Center Series A | 5.00 | 4-15-2035 | 1,450,000 | 1,586,339 | |
| 18,714,045 | |||||
| Miscellaneous revenue: 2.03% | |||||
| Delaware County PA Vocational & Technical School Authority (BAM Insured) | 5.25 | 11-1-2033 | 2,000,000 | 2,089,284 | |
| Pennsylvania Certificate of Participation (AGM Insured) | 5.00 | 11-1-2023 | 1,900,000 | 1,976,864 |
| Interest rate | Maturity date | Principal | Value | ||
| Miscellaneous revenue (continued) | |||||
| Pennsylvania Certificate of Participation (AGM Insured) | 5.00% | 11-1-2024 | $ 1,660,000 | $ 1,763,085 | |
| Pennsylvania Certificate of Participation Municipal Real Estate Payment Series A | 5.00 | 7-1-2028 | 435,000 | 485,939 | |
| Pennsylvania Certificate of Participation Municipal Real Estate Payment Series A | 5.00 | 7-1-2029 | 480,000 | 532,863 | |
| Pennsylvania Certificate of Participation Municipal Real Estate Payment Series A | 5.00 | 7-1-2030 | 375,000 | 415,514 | |
| Pennsylvania Public School Building Authority Chester Upland School District Project Series B | 5.25 | 9-15-2030 | 1,990,000 | 2,219,990 | |
| Pennsylvania Public School Building Authority Harrisburg School District Project Series A (AGM Insured) | 5.00 | 12-1-2028 | 480,000 | 532,910 | |
| Pennsylvania Public School Building Authority Harrisburg School District Project Series A (AGM Insured) | 5.00 | 12-1-2028 | 3,020,000 | 3,313,075 | |
| Pennsylvania Public School Building Authority Harrisburg School District Project Series A (AGM Insured) | 5.00 | 12-1-2033 | 920,000 | 1,021,411 | |
| Pennsylvania Public School Building Authority Harrisburg School District Project Series A (AGM Insured) | 5.00 | 12-1-2033 | 3,505,000 | 3,802,592 | |
| Pennsylvania Public School Building Authority Harrisburg School District Project Series B-2 (BAM Insured) | 5.00 | 12-1-2025 | 340,000 | 362,175 | |
| Pennsylvania Public School Building Authority Harrisburg School District Project Series B-2 (BAM Insured) | 5.00 | 12-1-2026 | 645,000 | 685,973 | |
| Pennsylvania Public School Building Authority Harrisburg School District Project Series B-2 (BAM Insured) | 5.00 | 12-1-2027 | 360,000 | 381,999 | |
| Pennsylvania Public School Building Authority School District of Philadelphia Project Series B (AGM Insured) | 5.00 | 6-1-2029 | 2,000,000 | 2,262,425 | |
| Philadelphia PA Municipal Authority Juvenile Justice Services Center | 5.00 | 4-1-2031 | 3,630,000 | 3,960,398 | |
| Philadelphia PA Municipal Authority Juvenile Justice Services Center | 5.00 | 4-1-2034 | 1,800,000 | 1,956,194 | |
| Southeastern Pennsylvania Transportation Authority | 5.00 | 3-1-2028 | 725,000 | 813,555 | |
| York County PA School of Technology Authority Series B (BAM Insured) | 5.00 | 2-15-2027 | 800,000 | 844,054 | |
| York County PA School of Technology Authority Series B (BAM Insured) | 5.00 | 2-15-2029 | 500,000 | 527,004 | |
| 29,947,304 | |||||
| Resource recovery revenue: 0.40% | |||||
| Lancaster County PA Solid Waste Management Authority Series A | 5.25 | 12-15-2028 | 5,665,000 | 5,941,168 | |
| Tax revenue: 0.16% | |||||
| Allentown PA Neighborhood Improvement Zone Development Authority Tax Revenue Refunding Bonds Series 2022 | 5.00 | 5-1-2033 | 700,000 | 753,082 | |
| Allentown PA Neighborhood Improvement Zone Development Authority Tax Revenue Refunding Bonds Series 2022 | 5.00 | 5-1-2034 | 750,000 | 805,169 | |
| Allentown PA Neighborhood Improvement Zone Development Authority Tax Revenue Refunding Bonds Series 2022 | 5.00 | 5-1-2035 | 750,000 | 803,237 | |
| 2,361,488 |
| Interest rate | Maturity date | Principal | Value | ||
| Tobacco revenue: 0.37% | |||||
| Commonwealth Financing Authority Tobacco Master Settlement Payment | 5.00% | 6-1-2027 | $ 2,500,000 | $ 2,728,816 | |
| Commonwealth Financing Authority Tobacco Master Settlement Payment | 5.00 | 6-1-2028 | 2,500,000 | 2,750,530 | |
| 5,479,346 | |||||
| Transportation revenue: 1.30% | |||||
| Pennsylvania Turnpike Commission Refunding Bond | 5.00 | 6-1-2027 | 1,000,000 | 1,118,147 | |
| Pennsylvania Turnpike Commission Refunding Bond | 5.00 | 12-1-2033 | 3,780,000 | 3,956,893 | |
| Pennsylvania Turnpike Commission Refunding Bond (AGM Insured) | 6.00 | 12-1-2030 | 4,220,000 | 4,905,619 | |
| Pennsylvania Turnpike Commission Subordinate Bond Series B | 5.00 | 6-1-2031 | 5,000,000 | 5,377,331 | |
| Pennsylvania Turnpike Commission Subordinate Bond Series C (AGM Insured) | 6.25 | 6-1-2033 | 1,350,000 | 1,522,188 | |
| Pennsylvania Turnpike Commission Subordinate Bond Series E | 6.38 | 12-1-2038 | 2,000,000 | 2,306,346 | |
| 19,186,524 | |||||
| Water & sewer revenue: 0.55% | |||||
| Pennsylvania Capital Region Water System Series of 2017 | 5.00 | 7-15-2030 | 1,180,000 | 1,312,154 | |
| Pennsylvania Capital Region Water System Series of 2018 | 5.00 | 7-15-2030 | 1,500,000 | 1,689,072 | |
| Philadelphia PA Water and Wastewater Bond Series B | 5.00 | 11-1-2027 | 1,535,000 | 1,697,292 | |
| Philadelphia PA Water and Wastewater Bond Series B | 5.00 | 11-1-2033 | 1,760,000 | 1,929,537 | |
| Pittsburgh PA Water and Sewer Authority First Lien Series B (AGM Insured) | 5.00 | 9-1-2031 | 670,000 | 760,347 | |
| Pittsburgh PA Water and Sewer Authority First Lien Series B (AGM Insured) | 5.00 | 9-1-2033 | 675,000 | 760,532 | |
| 8,148,934 | |||||
| 173,588,477 | |||||
| South Carolina: 0.63% | |||||
| Education revenue: 0.42% | |||||
| South Carolina Jobs EDA Furman University Project | 5.00 | 10-1-2028 | 700,000 | 748,315 | |
| South Carolina Jobs EDA Furman University Project | 5.00 | 10-1-2030 | 1,885,000 | 2,009,677 | |
| South Carolina Jobs EDA Furman University Project | 5.00 | 10-1-2031 | 2,155,000 | 2,294,783 | |
| South Carolina Jobs EDA York Preparatory Academy Project Series A | 7.00 | 11-1-2033 | 1,090,000 | 1,208,572 | |
| 6,261,347 | |||||
| Health revenue: 0.02% | |||||
| South Carolina Jobs EDA Prisma Health Obligated Group Series C ø | 1.23 | 5-1-2048 | 275,000 | 275,000 | |
| Miscellaneous revenue: 0.19% | |||||
| Laurens County SC Education Assistance for District #55 | 5.00 | 12-1-2025 | 1,000,000 | 1,078,573 | |
| Scago SC Educational Facilities Corporation for Sumter County School District #17 | 5.00 | 12-1-2022 | 1,720,000 | 1,743,476 | |
| 2,822,049 | |||||
| 9,358,396 |
| Interest rate | Maturity date | Principal | Value | ||
| Tennessee: 0.92% | |||||
| Education revenue: 0.04% | |||||
| Franklin County TN HEFA | 5.00% | 9-1-2030 | $ 560,000 | $ 563,229 | |
| Housing revenue: 0.12% | |||||
| Chattanooga TN Health Educational & Housing Facilities University of Tennessee at Chattanooga Project | 5.00 | 10-1-2023 | 750,000 | 761,476 | |
| Chattanooga TN Health Educational & Housing Facilities University of Tennessee at Chattanooga Project | 5.00 | 10-1-2028 | 1,000,000 | 1,021,192 | |
| 1,782,668 | |||||
| Utilities revenue: 0.76% | |||||
| Tennessee Energy Acquisition Corporation Gas Project Series 2018 | 4.00 | 11-1-2049 | 11,000,000 | 11,169,832 | |
| 13,515,729 | |||||
| Texas: 6.34% | |||||
| Airport revenue: 0.79% | |||||
| Dallas & Fort Worth TX International Airport Refunding Bond Series A | 4.00 | 11-1-2034 | 2,500,000 | 2,505,446 | |
| Houston TX Airport System Subordinate Lien Refunding Bond Series D | 5.00 | 7-1-2033 | 3,010,000 | 3,266,461 | |
| Houston TX Airport System Subordinate Lien Refunding Bond Series D | 5.00 | 7-1-2034 | 3,500,000 | 3,781,764 | |
| Houston TX Airport System Subordinate Lien Refunding Bond Series D | 5.00 | 7-1-2035 | 2,000,000 | 2,152,028 | |
| 11,705,699 | |||||
| Education revenue: 0.32% | |||||
| University of Houston Series B | 5.25 | 7-1-2026 | 4,225,000 | 4,699,432 | |
| GO revenue: 2.64% | |||||
| Austin TX Independent School District Series B | 5.00 | 8-1-2026 | 1,450,000 | 1,566,888 | |
| Austin TX Public Improvement Bond | 5.00 | 9-1-2030 | 960,000 | 1,063,261 | |
| Bexar County TX Hospital District Refunding Bond | 5.00 | 2-15-2037 | 1,250,000 | 1,362,242 | |
| Collin County TX Unlimited Tax Road & Refunding Bond | 5.00 | 2-15-2026 | 1,000,000 | 1,071,993 | |
| Collin County TX Unlimited Tax Road & Refunding Bond | 5.00 | 2-15-2027 | 1,300,000 | 1,390,168 | |
| Crane County TX Water District Unlimited Tax Bond | 5.00 | 2-15-2026 | 1,000,000 | 1,067,294 | |
| Crane County TX Water District Unlimited Tax Bond | 5.00 | 2-15-2030 | 1,130,000 | 1,212,724 | |
| Crane County TX Water District Unlimited Tax Bond | 5.00 | 2-15-2031 | 1,000,000 | 1,073,207 | |
| Del Rio TX Refunding Bond (BAM Insured) | 4.00 | 6-1-2023 | 720,000 | 734,817 | |
| Del Rio TX Refunding Bond (BAM Insured) | 4.00 | 6-1-2024 | 745,000 | 771,735 | |
| Denton County TX Permanent Improvement & Refunding Bond | 5.00 | 7-15-2030 | 1,000,000 | 1,059,843 | |
| Eagle Pass TX Certificate of Participation (AGM Insured) | 4.00 | 3-1-2037 | 695,000 | 708,412 | |
| El Paso County TX Hospital District | 5.00 | 8-15-2028 | 2,045,000 | 2,092,908 | |
| El Paso County TX Refunding Bond Series A | 5.00 | 2-15-2031 | 2,000,000 | 2,141,571 | |
| El Paso County TX Refunding Bond Series A | 5.00 | 2-15-2032 | 2,120,000 | 2,265,570 | |
| Flower Mound, Denton & Tarrant Counties Refunding Bond | 4.00 | 3-1-2026 | 755,000 | 788,817 | |
| Fort Worth TX Independent School District Unlimited Tax Refunding and School Building Bond | 5.00 | 2-15-2026 | 3,000,000 | 3,282,593 | |
| Harris County TX Toll Road Project Series C (AGM Insured) | 5.25 | 8-15-2027 | 4,000,000 | 4,566,998 | |
| Hays County TX Limited Tax Bond | 5.00 | 2-15-2027 | 1,000,000 | 1,112,483 | |
| Plano TX GO Bonds Series 2017 | 5.00 | 9-1-2030 | 2,155,000 | 2,366,701 | |
| San Antonio TX Certificate of Obligation | 5.00 | 8-1-2036 | 3,990,000 | 4,437,824 |
| Interest rate | Maturity date | Principal | Value | ||
| GO revenue (continued) | |||||
| San Antonio TX Independent School District Unlimited Tax Series 2018 | 5.00% | 8-15-2037 | $ 2,000,000 | $ 2,142,350 | |
| Viridian TX Municipal Management District Unlimited Road Improvement Bond (BAM Insured) | 4.00 | 12-1-2030 | 710,000 | 722,460 | |
| 39,002,859 | |||||
| Miscellaneous revenue: 0.45% | |||||
| Austin TX Community College District Public Facility Corporation Series 2018C | 5.00 | 8-1-2026 | 565,000 | 622,931 | |
| Austin TX Community College District Public Facility Corporation Series 2018C | 5.00 | 8-1-2029 | 400,000 | 443,237 | |
| Austin TX Community College District Public Facility Corporation Series 2018C | 5.00 | 8-1-2030 | 500,000 | 551,877 | |
| Lower Colorado River TX Authority Refunding Bond | 5.50 | 5-15-2031 | 2,500,000 | 2,560,358 | |
| Nueces River TX Water Supply Facility Corpus Christi Lake Texana Project | 5.00 | 7-15-2026 | 1,000,000 | 1,075,745 | |
| Nueces River TX Water Supply Facility Corpus Christi Lake Texana Project | 5.00 | 7-15-2027 | 1,250,000 | 1,341,232 | |
| 6,595,380 | |||||
| Tax revenue: 0.58% | |||||
| Houston TX Old Spanish Trail Almeda Corridors RDA (BAM Insured) | 4.00 | 9-1-2031 | 1,540,000 | 1,617,575 | |
| Texas Midtown RDA Refunding Bond (BAM Insured) | 5.25 | 1-1-2027 | 1,880,000 | 1,906,434 | |
| Texas Midtown RDA Refunding Bond (BAM Insured) | 5.25 | 1-1-2029 | 2,390,000 | 2,421,614 | |
| Texas Midtown RDA Refunding Bond (BAM Insured) | 5.25 | 1-1-2030 | 1,500,000 | 1,519,328 | |
| Texas Midtown RDA Refunding Bond (BAM Insured) | 5.25 | 1-1-2031 | 1,000,000 | 1,012,592 | |
| 8,477,543 | |||||
| Transportation revenue: 0.53% | |||||
| Texas Grand Parkway Transportation Corporation System Series A | 5.00 | 10-1-2034 | 1,500,000 | 1,637,512 | |
| Texas Private Activity Bond Surface Transportation Corporation Senior Lien Series 2019A | 5.00 | 12-31-2035 | 3,000,000 | 3,111,652 | |
| Texas Private Activity Bond Surface Transportation Corporation Senior Lien Series 2019A | 5.00 | 12-31-2036 | 3,015,000 | 3,121,565 | |
| 7,870,729 | |||||
| Utilities revenue: 0.61% | |||||
| Austin TX Refunding Bond (NPFGC Insured) | 5.25 | 5-15-2025 | 895,000 | 945,754 | |
| Brownsville TX Utilities System Refunding Bond | 5.00 | 9-1-2026 | 2,190,000 | 2,361,886 | |
| Brownsville TX Utilities System Refunding Bond | 5.00 | 9-1-2029 | 1,500,000 | 1,598,388 | |
| Brownsville TX Utilities System Refunding Bond | 5.00 | 9-1-2030 | 2,500,000 | 2,657,336 | |
| Weatherford TX Utility System Refunding & Improvement Bond (AGM Insured) | 5.00 | 9-1-2025 | 1,000,000 | 1,076,089 | |
| Weatherford TX Utility System Refunding & Improvement Bond (AGM Insured) | 5.00 | 9-1-2026 | 375,000 | 405,026 | |
| 9,044,479 | |||||
| Water & sewer revenue: 0.42% | |||||
| Amarillo TX Waterworks and Sewer System Bond Series B | 5.00 | 4-1-2028 | 645,000 | 726,497 | |
| North Harris County TX Regional Water Authority Senior Lien (BAM Insured) | 5.00 | 12-15-2029 | 1,215,000 | 1,228,170 |
| Interest rate | Maturity date | Principal | Value | ||
| Water & sewer revenue (continued) | |||||
| Tarrant TX Water Project Refunding Bond | 4.00% | 2-1-2027 | $ 1,000,000 | $ 1,056,417 | |
| Texas Water Development Board State Implementation Series A | 4.00 | 10-15-2032 | 3,000,000 | 3,153,777 | |
| 6,164,861 | |||||
| 93,560,982 | |||||
| Utah: 0.37% | |||||
| Education revenue: 0.13% | |||||
| University of Utah (Citibank NA LIQ) 144Aø | 1.01 | 2-1-2023 | 680,000 | 680,000 | |
| Utah Charter School Finance Authority Refunding Bond (CSCE Insured) | 4.00 | 4-15-2023 | 400,000 | 406,709 | |
| Utah Charter School Finance Authority Refunding Bond 144A | 4.50 | 6-15-2027 | 885,000 | 890,139 | |
| 1,976,848 | |||||
| Miscellaneous revenue: 0.24% | |||||
| West Valley UT Municipal Building Authority (AGM Insured) | 5.00 | 2-1-2028 | 1,000,000 | 1,095,852 | |
| West Valley UT Municipal Building Authority (AGM Insured) | 5.00 | 2-1-2032 | 1,555,000 | 1,680,428 | |
| West Valley UT Municipal Building Authority (AGM Insured) | 5.00 | 2-1-2033 | 645,000 | 695,599 | |
| 3,471,879 | |||||
| 5,448,727 | |||||
| Virginia: 0.13% | |||||
| Tax revenue: 0.13% | |||||
| Greater Richmond Virginia Convention Center | 5.00 | 6-15-2025 | 1,000,000 | 1,077,215 | |
| Marquis VA CDA CAB Series C ¤ | 0.00 | 9-1-2041 | 1,772,000 | 84,813 | |
| Marquis VA CDA CCAB Series 2015 144A | 4.88 | 9-1-2045 | 386,000 | 177,295 | |
| Marquis VA CDA Series B | 3.66 | 9-1-2041 | 1,274,000 | 574,834 | |
| 1,914,157 | |||||
| Washington: 5.20% | |||||
| Education revenue: 0.07% | |||||
| Washington EDFA | 5.00 | 6-1-2028 | 1,000,000 | 1,051,208 | |
| GO revenue: 2.11% | |||||
| King County WA Public Hospital District #1 Valley Medical Center Refunding Bond | 5.00 | 12-1-2026 | 775,000 | 852,921 | |
| King County WA Public Hospital District #1 Valley Medical Center Refunding Bond | 5.00 | 12-1-2029 | 1,600,000 | 1,743,448 | |
| King County WA Public Hospital District #1 Valley Medical Center Refunding Bond | 5.00 | 12-1-2031 | 6,665,000 | 7,207,968 | |
| King County WA Public Hospital District #1 Valley Medical Center Refunding Bond | 5.00 | 12-1-2032 | 2,905,000 | 3,125,501 | |
| King County WA Public Hospital District #1 Valley Medical Center Refunding Bond | 5.00 | 12-1-2033 | 7,045,000 | 7,555,751 | |
| Washington Various Purposes Bond Series C | 5.00 | 2-1-2034 | 5,800,000 | 6,219,984 | |
| Washington Various Purposes Refunding Bond Series B | 5.00 | 7-1-2028 | 4,000,000 | 4,341,355 | |
| 31,046,928 |
| Interest rate | Maturity date | Principal | Value | ||
| Health revenue: 0.34% | |||||
| Washington HCFR Fred Hutchinson Cancer Research Center | 5.00% | 1-1-2026 | $ 2,250,000 | $ 2,423,887 | |
| Washington HCFR Fred Hutchinson Cancer Research Center | 5.00 | 1-1-2027 | 1,050,000 | 1,131,147 | |
| Washington HCFR Fred Hutchinson Cancer Research Center | 5.00 | 1-1-2028 | 1,350,000 | 1,454,332 | |
| 5,009,366 | |||||
| Housing revenue: 0.98% | |||||
| King County WA Housing Authority Refunding Bond | 4.00 | 6-1-2026 | 560,000 | 587,241 | |
| King County WA Housing Authority Refunding Bond | 4.00 | 12-1-2026 | 430,000 | 452,681 | |
| King County WA Housing Authority Refunding Bond | 4.00 | 6-1-2027 | 590,000 | 620,567 | |
| King County WA Housing Authority Refunding Bond | 4.00 | 12-1-2027 | 400,000 | 421,320 | |
| King County WA Housing Authority Refunding Bond | 4.00 | 6-1-2028 | 360,000 | 379,387 | |
| King County WA Housing Authority Refunding Bond | 4.00 | 12-1-2028 | 375,000 | 395,666 | |
| King County WA Housing Authority Refunding Bond | 4.00 | 12-1-2029 | 960,000 | 1,014,534 | |
| King County WA Housing Authority Refunding Bond | 4.00 | 12-1-2030 | 575,000 | 604,531 | |
| King County WA Housing Authority Refunding Bond | 4.00 | 12-1-2031 | 450,000 | 471,200 | |
| Snohomish County WA Housing Authority Carvel Apartments Project | 5.00 | 4-1-2032 | 1,955,000 | 2,139,897 | |
| Snohomish County WA Housing Authority Carvel Apartments Project | 5.00 | 4-1-2033 | 1,550,000 | 1,687,350 | |
| Snohomish County WA Housing Authority Carvel Apartments Project | 5.00 | 4-1-2034 | 655,000 | 709,814 | |
| Washington Housing Finance Commission Downtowner Apartments Project (FHLMC LIQ) | 3.70 | 7-1-2030 | 5,000,000 | 5,014,764 | |
| 14,498,952 | |||||
| Miscellaneous revenue: 0.73% | |||||
| Washington Certificate of Participation Series B | 5.00 | 7-1-2037 | 1,585,000 | 1,748,157 | |
| Washington Motor Vehicle Fuel Tax Refunding Bond Series D | 5.00 | 7-1-2031 | 5,830,000 | 6,167,721 | |
| Washington Office Building Refunding Bond | 5.00 | 7-1-2026 | 2,750,000 | 2,896,035 | |
| 10,811,913 | |||||
| Resource recovery revenue: 0.35% | |||||
| Seattle WA Solid Waste System Improvement & Refunding Bond | 4.00 | 6-1-2033 | 1,175,000 | 1,219,724 | |
| Tacoma WA Solid Waste Refunding Bond Series B | 5.00 | 12-1-2027 | 620,000 | 678,789 | |
| Tacoma WA Solid Waste Refunding Bond Series B | 5.00 | 12-1-2028 | 1,455,000 | 1,591,827 | |
| Tacoma WA Solid Waste Refunding Bond Series B | 5.00 | 12-1-2029 | 1,525,000 | 1,667,815 | |
| 5,158,155 | |||||
| Utilities revenue: 0.62% | |||||
| Chelan County WA Public Utility District #1 Refunding Bond Series A | 4.00 | 7-1-2038 | 2,805,000 | 2,849,028 | |
| Lewis County WA Public Utility District Refunding Bond | 5.25 | 4-1-2032 | 6,115,000 | 6,340,772 | |
| 9,189,800 | |||||
| 76,766,322 | |||||
| West Virginia: 0.87% | |||||
| GO revenue: 0.30% | |||||
| West Virginia Road Bond Series B | 5.00 | 12-1-2036 | 4,000,000 | 4,423,702 |
| Interest rate | Maturity date | Principal | Value | ||
| Health revenue: 0.10% | |||||
| West Virginia Hospital Finance Authority West Virginia University Health System Series A | 5.00% | 6-1-2031 | $ 375,000 | $ 398,064 | |
| West Virginia Hospital Finance Authority West Virginia University Health System Series A | 5.00 | 6-1-2032 | 980,000 | 1,033,264 | |
| 1,431,328 | |||||
| Miscellaneous revenue: 0.47% | |||||
| West Virginia EDA Excess Lottery Series A | 5.00 | 7-1-2038 | 2,980,000 | 3,318,206 | |
| West Virginia School Building Authority Capital Improvement Bond Series A | 5.00 | 7-1-2027 | 1,595,000 | 1,723,067 | |
| West Virginia School Building Authority Capital Improvement Bond Series A | 5.00 | 7-1-2029 | 1,755,000 | 1,886,420 | |
| 6,927,693 | |||||
| 12,782,723 | |||||
| Wisconsin: 1.23% | |||||
| Education revenue: 0.32% | |||||
| Wisconsin PFA KU Campus Development Corporation Central District Development Project | 5.00 | 3-1-2032 | 4,315,000 | 4,642,215 | |
| Health revenue: 0.46% | |||||
| Wisconsin HEFA Series 2053 ø | 1.29 | 2-15-2053 | 1,500,000 | 1,500,000 | |
| Wisconsin HEFA Series A | 4.00 | 11-15-2039 | 2,250,000 | 2,222,606 | |
| Wisconsin PFA Revenue Providence St. Joseph Health Obligated Group Series C | 4.00 | 10-1-2041 | 3,000,000 | 3,068,581 | |
| 6,791,187 | |||||
| Housing revenue: 0.26% | |||||
| Whitewater WI CDA Multifamily Revenue Various Housing Wisconsin Housing Preservation (BMO Harris Bank NA LOC) ø | 0.91 | 6-1-2042 | 1,030,000 | 1,030,000 | |
| Wisconsin Housing & EDA Series A (FHLB SPA) ø | 0.90 | 4-1-2046 | 2,850,000 | 2,850,000 | |
| 3,880,000 | |||||
| Miscellaneous revenue: 0.08% | |||||
| Milwaukee WI RDA Public Schools | 5.00 | 11-15-2029 | 420,000 | 461,335 | |
| Milwaukee WI RDA Public Schools | 5.00 | 11-15-2030 | 635,000 | 696,121 | |
| 1,157,456 | |||||
| Tax revenue: 0.11% | |||||
| Wisconsin Center District Senior Dedicated Tax Bond Series C (AGM Insured) ¤ | 0.00 | 12-15-2034 | 1,250,000 | 750,472 | |
| Wisconsin Center District Senior Dedicated Tax Bond Series C (AGM Insured) ¤ | 0.00 | 12-15-2035 | 1,600,000 | 912,624 | |
| 1,663,096 | |||||
| 18,133,954 | |||||
| Total Municipal obligations (Cost $1,468,502,487) | 1,455,864,856 | ||||
| Total investments in securities (Cost $1,470,502,487) | 98.75% | 1,457,864,856 | |||
| Other assets and liabilities, net | 1.25 | 18,443,219 | |||
| Total net assets | 100.00% | $1,476,308,075 |
| 144A | The security may be resold in transactions exempt from registration, normally to qualified institutional buyers, pursuant to Rule 144A under the Securities Act of 1933. |
| ø | Variable rate demand notes are subject to a demand feature which reduces the effective maturity. The maturity date shown represents the final maturity date of the security. The interest rate is determined and reset by the issuer daily, weekly, or monthly depending upon the terms of the security. The rate shown is the rate in effect at period end. |
| ± | Variable rate investment. The rate shown is the rate in effect at period end. |
| ¤ | The security is issued in zero coupon form with no periodic interest payments. |
| Abbreviations: | |
| AGC | Assured Guaranty Corporation |
| AGM | Assured Guaranty Municipal |
| Ambac | Ambac Financial Group Incorporated |
| BAM | Build America Mutual Assurance Company |
| CAB | Capital appreciation bond |
| CCAB | Convertible capital appreciation bond |
| CDA | Community Development Authority |
| EDA | Economic Development Authority |
| EDFA | Economic Development Finance Authority |
| FHLB | Federal Home Loan Bank |
| FHLMC | Federal Home Loan Mortgage Corporation |
| FNMA | Federal National Mortgage Association |
| GNMA | Government National Mortgage Association |
| GO | General obligation |
| HCFR | Healthcare facilities revenue |
| HEFA | Health & Educational Facilities Authority |
| HEFAR | Higher Education Facilities Authority Revenue |
| HFA | Housing Finance Authority |
| IDA | Industrial Development Authority |
| LIBOR | London Interbank Offered Rate |
| LIQ | Liquidity agreement |
| LOC | Letter of credit |
| NPFGC | National Public Finance Guarantee Corporation |
| PCR | Pollution control revenue |
| PFA | Public Finance Authority |
| RDA | Redevelopment Authority |
| SIFMA | Securities Industry and Financial Markets Association |
| SOFR | Secured Overnight Financing Rate |
| SPA | Standby purchase agreement |
| TTFA | Transportation Trust Fund Authority |
| Assets | |
Investments in unaffiliated securities, at value (cost $1,470,502,487) | $ 1,457,864,856 |
Cash | 5,302,982 |
Receivable for interest | 16,915,567 |
Receivable for Fund shares sold | 2,307,938 |
Receivable for investments sold | 35,000 |
Prepaid expenses and other assets | 17,974 |
Total assets | 1,482,444,317 |
| Liabilities | |
Payable for Fund shares redeemed | 4,381,613 |
Dividends payable | 1,160,365 |
Management fee payable | 404,380 |
Administration fees payable | 91,525 |
Distribution fee payable | 5,094 |
Trustees’ fees and expenses payable | 1,853 |
Accrued expenses and other liabilities | 91,412 |
Total liabilities | 6,136,242 |
Total net assets | $1,476,308,075 |
| Net assets consist of | |
Paid-in capital | $ 1,497,246,335 |
Total distributable loss | (20,938,260) |
Total net assets | $1,476,308,075 |
| Computation of net asset value and offering price per share | |
Net assets – Class A | $ 200,565,655 |
Shares outstanding – Class A1 | 18,510,046 |
Net asset value per share – Class A | $10.84 |
Maximum offering price per share – Class A2 | $11.18 |
Net assets – Class C | $ 8,267,667 |
Shares outstanding – Class C1 | 762,984 |
Net asset value per share – Class C | $10.84 |
Net assets – Class R6 | $ 476,328,454 |
Shares outstanding – Class R61 | 43,909,776 |
Net asset value per share – Class R6 | $10.85 |
Net assets – Administrator Class | $ 29,201,888 |
Shares outstanding – Administrator Class1 | 2,693,290 |
Net asset value per share – Administrator Class | $10.84 |
Net assets – Institutional Class | $ 761,944,411 |
Shares outstanding – Institutional Class1 | 70,215,585 |
Net asset value per share – Institutional Class | $10.85 |
| 1 | The Fund has an unlimited number of authorized shares. |
| 2 | Maximum offering price is computed as 100/97.00 of net asset value. On investments of $50,000 or more, the offering price is reduced. |
| Investment income | |
Interest | $ 52,162,485 |
| Expenses | |
Management fee | 6,642,863 |
| Administration fees | |
Class A | 366,347 |
Class C | 15,591 |
Class R6 | 191,199 |
Administrator Class | 38,398 |
Institutional Class | 701,103 |
| Shareholder servicing fees | |
Class A | 571,064 |
Class C | 24,261 |
Administrator Class | 94,852 |
| Distribution fee | |
Class C | 72,782 |
Custody and accounting fees | 93,706 |
Professional fees | 85,833 |
Registration fees | 125,343 |
Shareholder report expenses | 69,869 |
Trustees’ fees and expenses | 20,033 |
Other fees and expenses | 52,684 |
Total expenses | 9,165,928 |
| Less: Fee waivers and/or expense reimbursements | |
Fund-level | (472,542) |
Class A | (183,173) |
Class C | (6,821) |
Administrator Class | (42,238) |
Net expenses | 8,461,154 |
Net investment income | 43,701,331 |
| Realized and unrealized gains (losses) on investments | |
Net realized gains on investments | 6,953,488 |
Net change in unrealized gains (losses) on investments | (169,556,314) |
Net realized and unrealized gains (losses) on investments | (162,602,826) |
Net decrease in net assets resulting from operations | $(118,901,495) |
| Year ended June 30, 2022 | Year ended June 30, 2021 | |||
| Operations | ||||
Net investment income | $ 43,701,331 | $ 53,787,094 | ||
Net realized gains on investments | 6,953,488 | 28,079,093 | ||
Net change in unrealized gains (losses) on investments | (169,556,314) | 11,018,704 | ||
Net increase (decrease) in net assets resulting from operations | (118,901,495) | 92,884,891 | ||
| Distributions to shareholders from | ||||
| Net investment income and net realized gains | ||||
Class A | (5,093,391) | (5,430,306) | ||
Class C | (142,620) | (199,452) | ||
Class R6 | (15,955,578) | (21,437,694) | ||
Administrator Class | (885,212) | (1,131,729) | ||
Institutional Class | (21,622,788) | (25,557,772) | ||
Total distributions to shareholders | (43,699,589) | (53,756,953) | ||
| Capital share transactions | Shares | Shares | ||
| Proceeds from shares sold | ||||
Class A | 1,251,183 | 14,251,621 | 2,517,766 | 29,826,922 |
Class C | 86,124 | 960,368 | 179,989 | 2,134,820 |
Class R6 | 12,915,001 | 149,434,203 | 16,904,544 | 200,647,417 |
Administrator Class | 283,136 | 3,208,139 | 540,975 | 6,436,253 |
Institutional Class | 28,939,320 | 328,622,467 | 15,114,595 | 179,682,905 |
| 496,476,798 | 418,728,317 | |||
| Reinvestment of distributions | ||||
Class A | 421,216 | 4,831,998 | 436,176 | 5,175,278 |
Class C | 12,279 | 140,958 | 16,407 | 194,593 |
Class R6 | 81,145 | 931,361 | 332,078 | 3,935,648 |
Administrator Class | 73,451 | 845,963 | 91,539 | 1,086,703 |
Institutional Class | 1,785,945 | 20,535,850 | 1,890,955 | 22,464,870 |
| 27,286,130 | 32,857,092 | |||
| Payment for shares redeemed | ||||
Class A | (3,811,202) | (43,275,042) | (3,609,130) | (42,841,998) |
Class C | (341,331) | (3,962,953) | (818,394) | (9,682,479) |
Class R6 | (30,140,846) | (347,586,987) | (54,972,301) | (651,320,507) |
Administrator Class | (1,650,035) | (19,002,588) | (1,798,153) | (21,293,473) |
Institutional Class | (38,031,014) | (430,638,034) | (35,376,643) | (420,166,305) |
| (844,465,604) | (1,145,304,762) | |||
Net decrease in net assets resulting from capital share transactions | (320,702,676) | (693,719,353) | ||
Total decrease in net assets | (483,303,760) | (654,591,415) | ||
| Net assets | ||||
Beginning of period | 1,959,611,835 | 2,614,203,250 | ||
End of period | $1,476,308,075 | $ 1,959,611,835 | ||
| Year ended June 30 | |||||
| Class A | 2022 | 2021 | 2020 | 2019 | 2018 |
Net asset value, beginning of period | $11.92 | $11.72 | $11.66 | $11.31 | $11.46 |
Net investment income | 0.26 | 0.26 | 0.26 | 0.28 | 0.27 |
Net realized and unrealized gains (losses) on investments | (1.08) | 0.20 | 0.05 | 0.35 | (0.15) |
Total from investment operations | (0.82) | 0.46 | 0.31 | 0.63 | 0.12 |
| Distributions to shareholders from | |||||
Net investment income | (0.26) | (0.26) | (0.25) | (0.28) | (0.27) |
Net asset value, end of period | $10.84 | $11.92 | $11.72 | $11.66 | $11.31 |
Total return1 | (7.00)% | 3.92% | 2.72% | 5.67% | 1.08% |
| Ratios to average net assets (annualized) | |||||
Gross expenses | 0.81% | 0.80% | 0.79% | 0.80% | 0.80% |
Net expenses | 0.70% | 0.70% | 0.70% | 0.70% | 0.70% |
Net investment income | 2.22% | 2.16% | 2.18% | 2.47% | 2.38% |
| Supplemental data | |||||
Portfolio turnover rate | 7% | 12% | 24% | 14% | 14% |
Net assets, end of period (000s omitted) | $200,566 | $246,130 | $249,724 | $263,113 | $287,408 |
| 1 | Total return calculations do not include any sales charges. |
| Year ended June 30 | |||||
| Class C | 2022 | 2021 | 2020 | 2019 | 2018 |
Net asset value, beginning of period | $11.92 | $11.72 | $11.66 | $11.31 | $11.46 |
Net investment income | 0.17 | 0.17 | 0.17 | 0.20 | 0.19 |
Net realized and unrealized gains (losses) on investments | (1.08) | 0.20 | 0.06 | 0.35 | (0.15) |
Total from investment operations | (0.91) | 0.37 | 0.23 | 0.55 | 0.04 |
| Distributions to shareholders from | |||||
Net investment income | (0.17) | (0.17) | (0.17) | (0.20) | (0.19) |
Net asset value, end of period | $10.84 | $11.92 | $11.72 | $11.66 | $11.31 |
Total return1 | (7.70)% | 3.14% | 1.95% | 4.88% | 0.32% |
| Ratios to average net assets (annualized) | |||||
Gross expenses | 1.55% | 1.55% | 1.54% | 1.55% | 1.55% |
Net expenses | 1.45% | 1.45% | 1.45% | 1.45% | 1.45% |
Net investment income | 1.46% | 1.40% | 1.43% | 1.73% | 1.63% |
| Supplemental data | |||||
Portfolio turnover rate | 7% | 12% | 24% | 14% | 14% |
Net assets, end of period (000s omitted) | $8,268 | $11,990 | $19,082 | $26,737 | $35,421 |
| 1 | Total return calculations do not include any sales charges. |
| Year ended June 30 | ||||
| Class R6 | 2022 | 2021 | 2020 | 2019 1 |
Net asset value, beginning of period | $11.93 | $11.74 | $11.67 | $11.33 |
Net investment income | 0.29 | 0.29 | 0.29 | 0.29 |
Net realized and unrealized gains (losses) on investments | (1.08) | 0.19 | 0.07 | 0.34 |
Total from investment operations | (0.79) | 0.48 | 0.36 | 0.63 |
| Distributions to shareholders from | ||||
Net investment income | (0.29) | (0.29) | (0.29) | (0.29) |
Net asset value, end of period | $10.85 | $11.93 | $11.74 | $11.67 |
Total return2 | (6.71)% | 4.14% | 3.110% | 5.65% |
| Ratios to average net assets (annualized) | ||||
Gross expenses | 0.43% | 0.42% | 0.41% | 0.41% |
Net expenses | 0.40% | 0.40% | 0.40% | 0.40% |
Net investment income | 2.50% | 2.44% | 2.48% | 2.75% |
| Supplemental data | ||||
Portfolio turnover rate | 7% | 12% | 24% | 14% |
Net assets, end of period (000s omitted) | $476,328 | $728,547 | $1,159,305 | $996,477 |
| 1 | For the period from July 31, 2018 (commencement of class operations) to June 30, 2019 |
| 2 | Returns for periods of less than one year are not annualized. |
| Year ended June 30 | |||||
| Administrator Class | 2022 | 2021 | 2020 | 2019 | 2018 |
Net asset value, beginning of period | $11.93 | $11.73 | $11.67 | $11.32 | $11.47 |
Net investment income | 0.27 | 0.27 | 0.27 | 0.29 | 0.28 |
Net realized and unrealized gains (losses) on investments | (1.09) | 0.20 | 0.06 | 0.35 | (0.15) |
Total from investment operations | (0.82) | 0.47 | 0.33 | 0.64 | 0.13 |
| Distributions to shareholders from | |||||
Net investment income | (0.27) | (0.27) | (0.27) | (0.29) | (0.28) |
Net asset value, end of period | $10.84 | $11.93 | $11.73 | $11.67 | $11.32 |
Total return | (6.99)% | 4.02% | 2.82% | 5.77% | 1.18% |
| Ratios to average net assets (annualized) | |||||
Gross expenses | 0.74% | 0.73% | 0.73% | 0.74% | 0.73% |
Net expenses | 0.60% | 0.60% | 0.60% | 0.60% | 0.60% |
Net investment income | 2.31% | 2.25% | 2.28% | 2.57% | 2.48% |
| Supplemental data | |||||
Portfolio turnover rate | 7% | 12% | 24% | 14% | 14% |
Net assets, end of period (000s omitted) | $29,202 | $47,552 | $60,435 | $177,742 | $183,624 |
| Year ended June 30 | |||||
| Institutional Class | 2022 | 2021 | 2020 | 2019 | 2018 |
Net asset value, beginning of period | $11.94 | $11.74 | $11.68 | $11.33 | $11.47 |
Net investment income | 0.29 | 0.29 | 0.28 | 0.31 | 0.30 |
Net realized and unrealized gains (losses) on investments | (1.09) | 0.20 | 0.06 | 0.35 | (0.14) |
Total from investment operations | (0.80) | 0.49 | 0.34 | 0.66 | 0.16 |
| Distributions to shareholders from | |||||
Net investment income | (0.29) | (0.29) | (0.28) | (0.31) | (0.30) |
Net asset value, end of period | $10.85 | $11.94 | $11.74 | $11.68 | $11.33 |
Total return | (6.84)% | 4.17% | 2.97% | 5.93% | 1.42% |
| Ratios to average net assets (annualized) | |||||
Gross expenses | 0.48% | 0.47% | 0.46% | 0.47% | 0.47% |
Net expenses | 0.45% | 0.45% | 0.45% | 0.45% | 0.45% |
Net investment income | 2.47% | 2.40% | 2.43% | 2.72% | 2.64% |
| Supplemental data | |||||
Portfolio turnover rate | 7% | 12% | 24% | 14% | 14% |
Net assets, end of period (000s omitted) | $761,944 | $925,392 | $1,125,657 | $1,199,588 | $1,932,382 |
| Gross unrealized gains | $ 20,620,783 |
| Gross unrealized losses | (34,374,843) |
| Net unrealized losses | $(13,754,060) |
| ■ | Level 1 – quoted prices in active markets for identical securities |
| ■ | Level 2 – other significant observable inputs (including quoted prices for similar securities, interest rates, prepayment speeds, credit risk, etc.) |
| ■ | Level 3 – significant unobservable inputs (including the Fund’s own assumptions in determining the fair value of investments) |
| Quoted prices (Level 1) | Other significant observable inputs (Level 2) | Significant unobservable inputs (Level 3) | Total | |
| Assets | ||||
| Investments in: | ||||
| Closed end municipal bond fund obligations | $0 | $ 2,000,000 | $0 | $ 2,000,000 |
| Municipal obligations | 0 | 1,455,864,856 | 0 | 1,455,864,856 |
| Total assets | $0 | $1,457,864,856 | $0 | $1,457,864,856 |
| Average daily net assets | Management fee |
| First $500 million | 0.400% |
| Next $500 million | 0.375 |
| Next $2 billion | 0.350 |
| Next $2 billion | 0.325 |
| Next $5 billion | 0.290 |
| Over $10 billion | 0.280 |
| Class-level administration fee | |
| Class A | 0.16% |
| Class C | 0.16 |
| Class R6 | 0.03 |
| Administrator Class | 0.10 |
| Institutional Class | 0.08 |
| Expense ratio caps | |
| Class A | 0.70% |
| Class C | 1.45 |
| Class R6 | 0.40 |
| Administrator Class | 0.60 |
| Institutional Class | 0.45 |
| Undistributed tax-exempt income | Unrealized losses | Capital loss carryforward |
| $1,415,547 | $(13,754,060) | $(7,431,668) |
Allspring Funds Trust:

| Name and year of birth | Position held and length of service* | Principal occupations during past five years or longer | Current other public company or investment company directorships |
| William R. Ebsworth (Born 1957) | Trustee, since 2015 | Retired. From 1984 to 2013, equities analyst, portfolio manager, research director and chief investment officer at Fidelity Management and Research Company in Boston, Tokyo, and Hong Kong, and retired in 2013 as Chief Investment Officer of Fidelity Strategic Advisers, Inc. where he led a team of investment professionals managing client assets. Prior thereto, Board member of Hong Kong Securities Clearing Co., Hong Kong Options Clearing Corp., the Thailand International Fund, Ltd., Fidelity Investments Life Insurance Company, and Empire Fidelity Investments Life Insurance Company. Audit Committee Chair and Investment Committee Chair of the Vincent Memorial Hospital Endowment (non-profit organization). Mr. Ebsworth is a CFA® charterholder. | N/A |
| Jane A. Freeman (Born 1953) | Trustee, since 2015; Chair Liaison, since 2018 | Retired. From 2012 to 2014 and 1999 to 2008, Chief Financial Officer of Scientific Learning Corporation. From 2008 to 2012, Ms. Freeman provided consulting services related to strategic business projects. Prior to 1999, Portfolio Manager at Rockefeller & Co. and Scudder, Stevens & Clark. Board member of the Harding Loevner Funds from 1996 to 2014, serving as both Lead Independent Director and chair of the Audit Committee. Board member of the Russell Exchange Traded Funds Trust from 2011 to 2012 and the chair of the Audit Committee. Ms. Freeman is also an inactive Chartered Financial Analyst. | N/A |
| Isaiah Harris, Jr. (Born 1952) | Trustee, since 2009; Audit Committee Chair, since 2019 | Retired. Chairman of the Board of CIGNA Corporation from 2009 to 2021, and Director from 2005 to 2008. From 2003 to 2011, Director of Deluxe Corporation. Prior thereto, President and CEO of BellSouth Advertising and Publishing Corp. from 2005 to 2007, President and CEO of BellSouth Enterprises from 2004 to 2005 and President of BellSouth Consumer Services from 2000 to 2003. Emeritus member of the Iowa State University Foundation Board of Governors. Emeritus Member of the Advisory Board of Iowa State University School of Business. Advisory Board Member, Palm Harbor Academy (private school). Advisory Board Member, Fellowship of Christian Athletes. Mr. Harris is a certified public accountant (inactive status). | N/A |
| David F. Larcker (Born 1950) | Trustee, since 2009 | James Irvin Miller Professor of Accounting at the Graduate School of Business (Emeritus), Stanford University, Director of the Corporate Governance Research Initiative and Senior Faculty of The Rock Center for Corporate Governance since 2006. From 2005 to 2008, Professor of Accounting at the Graduate School of Business, Stanford University. Prior thereto, Ernst & Young Professor of Accounting at The Wharton School, University of Pennsylvania from 1985 to 2005. | N/A |
| Name and year of birth | Position held and length of service* | Principal occupations during past five years or longer | Current other public company or investment company directorships |
| Olivia S. Mitchell (Born 1953) | Trustee, since 2006; Nominating and Governance Committee Chair, since 2018 | International Foundation of Employee Benefit Plans Professor since 1993, Wharton School of the University of Pennsylvania. Director of Wharton’s Pension Research Council and Boettner Center on Pensions & Retirement Research, and Research Associate at the National Bureau of Economic Research. Previously taught at Cornell University from 1978 to 1993. | N/A |
| Timothy J. Penny (Born 1951) | Trustee, since 1996; Chair, since 2018 | President and Chief Executive Officer of Southern Minnesota Initiative Foundation, a non-profit organization, since 2007. Member of the Board of Trustees of NorthStar Education Finance, Inc., a non-profit organization, since 2007. | N/A |
| James G. Polisson (Born 1959) | Trustee, since 2018 | Retired. Chief Marketing Officer, Source (ETF) UK Services, Ltd, from 2015 to 2017. From 2012 to 2015, Principal of The Polisson Group, LLC, a management consulting, corporate advisory and principal investing company. Chief Executive Officer and Managing Director at Russell Investments, Global Exchange Traded Funds from 2010 to 2012. Managing Director of Barclays Global Investors from 1998 to 2010 and Global Chief Marketing Officer for iShares and Barclays Global Investors from 2000 to 2010. Trustee of the San Francisco Mechanics’ Institute, a non-profit organization, from 2013 to 2015. Board member of the Russell Exchange Traded Fund Trust from 2011 to 2012. Director of Barclays Global Investors Holdings Deutschland GmbH from 2006 to 2009. Mr. Polisson is an attorney and has a retired status with the Massachusetts and District of Columbia Bar Associations. | N/A |
| Pamela Wheelock (Born 1959) | Trustee, since January 2020; previously Trustee from January 2018 to July 2019 | Board member of the Destination Medical Center Economic Development Agency, Rochester, Minnesota since 2019. Interim President of the McKnight Foundation from January to September 2020. McKnight Foundation Consultant, November 2020 to February 2021. Acting Commissioner, Minnesota Department of Human Services, July 2019 through September 2019. Consultant (part-time), Minnesota Department of Human Services, October 2019 through December 2019. Chief Operating Officer, Twin Cities Habitat for Humanity from 2017 to 2019. Vice President of University Services, University of Minnesota from 2012 to 2016. Prior thereto, on the Board of Directors, Governance Committee and Finance Committee for the Minnesota Philanthropy Partners (Saint Paul Foundation) from 2012 to 2018, Interim Chief Executive Officer of Blue Cross Blue Shield of Minnesota from 2011 to 2012, Chairman of the Board from 2009 to 2012 and Board Director from 2003 to 2015. Vice President, Leadership and Community Engagement, Bush Foundation, Saint Paul, Minnesota (a private foundation) from 2009 to 2011. Executive Vice President and Chief Financial Officer, Minnesota Sports and Entertainment from 2004 to 2009 and Senior Vice President from 2002 to 2004. Executive Vice President of the Minnesota Wild Foundation from 2004 to 2008. Commissioner of Finance, State of Minnesota, from 1999 to 2002. Currently Board Chair of the Minnesota Wild Foundation since 2010. | N/A |
| Name and year of birth | Position held and length of service | Principal occupations during past five years or longer |
| Andrew Owen (Born 1960) | President, since 2017 | President, Chief Executive Officer and Director of Allspring Funds Management, LLC since 2017 and co-president of Galliard Capital Management, LLC, an affiliate of Allspring Funds Management, LLC, since 2019. Prior thereto, Head of Affiliated Managers, Allspring Global Investments, from 2014 to 2019 and Executive Vice President responsible for marketing, investments and product development for Allspring Funds Management, LLC, from 2009 to 2014. In addition, Mr. Owen was an Executive Vice President of Wells Fargo & Company from 2014 to 2021. |
| Jeremy DePalma (Born 1974) | Treasurer, since 2012 (for certain funds in the Fund Complex); since 2021 (for the remaining funds in the Fund Complex) | Senior Vice President of Allspring Funds Management, LLC since 2009. Senior Vice President of Evergreen Investment Management Company, LLC from 2008 to 2010 and head of the Fund Reporting and Control Team within Fund Administration from 2005 to 2010. |
| Kate McKinley (Born 1977) | Chief Legal Officer, since 2021 | Chief Legal Officer of Allspring Global Investments since 2021. Prior thereto, held various roles at State Street Global Advisors beginning in 2010, including serving as Senior Vice President and General Counsel from 2019 to 2021, and Chief Operating Officer of the Institutional Client Group from 2016 - 2019. Prior to working at State Street Global Advisors served as Assistant General Counsel for Bank of America Corporation from 2005 to 2010 and as an Associate at WilmerHale from 2002 to 2005. |
| Christopher Baker (Born 1976) | Chief Compliance Officer, since 2022 | Global Chief Compliance Officer for Allspring Global Investments since 2022. Prior thereto, Chief Compliance Officer for State Street Global Advisors from 2018 to 2021. Senior Compliance Officer for the State Street divisions of Alternative Investment Solutions, Sector Solutions, and Global Marketing from 2015 to 2018. From 2010 to 2015 Vice President, Global Head of Investment and Marketing Compliance for State Street Global Advisors. |
| Matthew Prasse (Born 1983) | Secretary, since 2021 | Senior Counsel of the Allspring Legal Department since 2021. Senior Counsel of the Wells Fargo Legal Department from 2018 to 2021. Previously, Counsel for Barings LLC from 2015 to 2018. Prior to joining Barings, Associate at Morgan, Lewis & Bockius LLP from 2008 to 2015. |
P.O. Box 219967
Kansas City, MO 64121-9967

1-800-222-8222 or visit the Fund's website at allspringglobal.com. Read the prospectus carefully before you invest or send money.
A251/AR251 06-22

Minnesota Tax-Free Fund
| 2 | |
| 6 | |
| 11 | |
| 12 | |
| Financial statements | |
| 22 | |
| 23 | |
| 24 | |
| 25 | |
| 29 | |
| 35 | |
| 36 |

| 1 | The S&P 500 Index consists of 500 stocks chosen for market size, liquidity, and industry group representation. It is a market-value-weighted index with each stock's weight in the index proportionate to its market value. You cannot invest directly in an index. |
| 2 | The Morgan Stanley Capital International (MSCI) All Country World Index (ACWI) ex USA Index (Net) is a free-float-adjusted market-capitalization-weighted index that is designed to measure the equity market performance of developed and emerging markets, excluding the U.S. Source: MSCI. MSCI makes no express or implied warranties or representations and shall have no liability whatsoever with respect to any MSCI data contained herein. The MSCI data may not be further redistributed or used as a basis for other indexes or any securities or financial products. This report is not approved, reviewed, or produced by MSCI. You cannot invest directly in an index. |
| 3 | The MSCI Emerging Markets (EM) Index (Net) (USD) is a free-float-adjusted market-capitalization-weighted index that is designed to measure equity market performance of emerging markets. You cannot invest directly in an index. |
| 4 | The Bloomberg U.S. Aggregate Bond Index is a broad-based benchmark that measures the investment-grade, U.S.-dollar-denominated, fixed-rate taxable bond market, including Treasuries, government-related and corporate securities, mortgage-backed securities (agency fixed-rate and hybrid adjustable-rate mortgage pass-throughs), asset-backed securities, and commercial mortgage-backed securities. You cannot invest directly in an index. |
| 5 | The Bloomberg Global Aggregate ex-USD Index (unhedged) is an unmanaged index that provides a broad-based measure of the global investment-grade fixed-income markets excluding the U.S.-dollar-denominated debt market. You cannot invest directly in an index. |
| 6 | The Bloomberg Municipal Bond Index is an unmanaged index composed of long-term tax-exempt bonds with a minimum credit rating of Baa. You cannot invest directly in an index. |
| 7 | The ICE BofA U.S. High Yield Index is a market-capitalization-weighted index of domestic and Yankee high-yield bonds. The index tracks the performance of high-yield securities traded in the U.S. bond market. You cannot invest directly in an index. Copyright 2022. ICE Data Indices, LLC. All rights reserved. |
| 1 | The Consumer Price Index (CPI) is a measure of the average change over time in the prices paid by urban consumers for a market basket of consumer goods and services. You cannot invest directly in an index. |
| 2 | The MSCI ACWI (Net) is a free-float-adjusted market-capitalization-weighted index that is designed to measure the equity market performance of developed and emerging markets. You cannot invest directly in an index. |

President
Allspring Funds
| Investment objective | The Fund seeks current income exempt from federal income tax and Minnesota individual income tax. |
| Manager | Allspring Funds Management, LLC |
| Subadviser | Allspring Global Investments, LLC |
| Portfolio managers | Bruce R. Johns, Kerry Laurin |
| Average annual total returns (%) as of June 30, 2022 | |||||||||||
| Including sales charge | Excluding sales charge | Expense ratios1 (%) | |||||||||
| Inception date | 1 year | 5 year | 10 year | 1 year | 5 year | 10 year | Gross | Net 2 | |||
| Class A (NMTFX) | 1-12-1988 | -10.79 | 0.18 | 1.38 | -6.59 | 1.10 | 1.85 | 0.92 | 0.85 | ||
| Class C (WMTCX) | 4-8-2005 | -8.29 | 0.35 | 1.24 | -7.29 | 0.35 | 1.24 | 1.67 | 1.60 | ||
| Administrator Class (NWMIX) | 8-2-1993 | – | – | – | -6.35 | 1.35 | 2.12 | 0.86 | 0.60 | ||
| Institutional Class (WMTIX)3 | 10-31-2016 | – | – | – | -6.28 ♠ | 1.42 | 2.16 | 0.59 | 0.52 | ||
| Bloomberg Municipal Bond Index4 | – | – | – | – | -8.57 | 1.51 | 2.38 | – | – | ||
| Bloomberg Minnesota Municipal Bond Index5 | – | – | – | – | -7.85 | 1.27 | 1.99 | – | – | ||
| ♠ | Total return differs from the return in the Financial Highlights in this report. The total return presented is calculated based on the Net Asset Value (NAV) at which the shareholder transactions were processed. The NAV and total return presented in the Financial Highlights reflects certain adjustments made to the net assets of the Fund that are necessary under U.S. generally accepted accounting principles. |
| 1 | Reflects the expense ratios as stated in the most recent prospectuses. The expense ratios shown are subject to change and may differ from the annualized expense ratios shown in the financial highlights of this report. |
| 2 | The manager has contractually committed through October 31, 2022, to waive fees and/or reimburse expenses to the extent necessary to cap total annual fund operating expenses after fee waivers at 0.85% for Class A, 1.60% for Class C, 0.60% for Administrator Class, and 0.52% for Institutional Class. Brokerage commissions, stamp duty fees, interest, taxes, acquired fund fees and expenses (if any), and extraordinary expenses are excluded from the expense caps. Prior to or after the commitment expiration date, the caps may be increased or the commitment to maintain the caps may be terminated only with the approval of the Board of Trustees. Without these caps, the Fund’s returns would have been lower. The expense ratio paid by an investor is the net expense ratio (the total annual fund operating expenses after fee waivers) as stated in the prospectuses. |
| 3 | Historical performance shown for the Institutional Class shares prior to their inception reflects the performance of the Administrator Class shares, and includes the higher expenses applicable to the Administrator Class shares. If these expenses had not been included, returns for the Institutional Class shares would be higher. |
| 4 | The Bloomberg Municipal Bond Index is an unmanaged index composed of long-term tax-exempt bonds with a minimum credit rating of Baa. You cannot invest directly in an index. |
| 5 | The Bloomberg Minnesota Municipal Bond Index is the Minnesota component of the Bloomberg Municipal Bond Index. You cannot invest directly in an index |
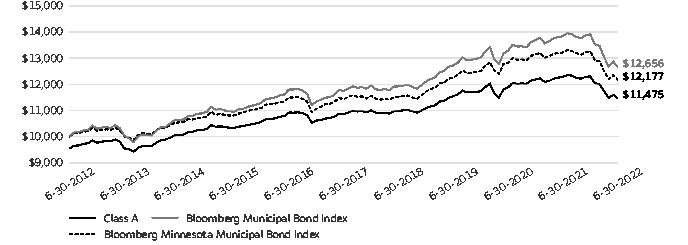
| 1 | The chart compares the performance of Class A shares for the most recent ten years with the Bloomberg Municipal Bond Index and Bloomberg Minnesota Municipal Bond Index. The chart assumes a hypothetical investment of $10,000 in Class A shares and reflects all operating expenses and assumes the maximum initial sales charge of 4.50%. |
| ■ | The Fund outperformed the Bloomberg Municipal Bond Index and the Bloomberg Minnesota Municipal Bond Index for the 12-month period that ended June 30, 2022. |
| ■ | The Fund’s conservative duration and yield-curve positioning contributed strongly to performance as rates increased across the entire yield curve during the period in response to the Federal Reserve’s (Fed’s) monetary tightening policy. We were underweight longer-term bonds, which underperformed. Our overweight to the 4- to 10-year part of the curve was a strong contributor as this part of the curve outperformed the index. |
| ■ | Our overweight to non-investment-grade bonds contributed to performance as this rating category outperformed. The Fund was underweight AA-rated bonds, which slightly outperformed the index, although our security selection within this rating category was strong. |
| ■ | The Fund’s broad sector allocation and security selection contributed to performance. We were slightly underweight general obligation (GO) bonds, which outperformed the index. We were slightly overweight revenue bonds, which underperformed. However, our security selection in this sector ultimately helped offset this sector’s negative performance. Specifically, we were overweight the education and hospital sectors, which underperformed, but our strong research-driven selection process within these sectors led to outperformance. |
| Credit quality as of June 30, 20221 |
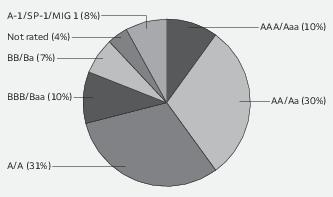
| 1 | The credit quality distribution of portfolio holdings reflected in the chart is based on ratings from Standard & Poor’s, Moody’s Investors Service, and/or Fitch Ratings Ltd. Credit quality ratings apply to the underlying holdings of the Fund and not to the Fund itself. The percentages of the portfolio with the ratings depicted in the chart are calculated based on the market value of fixed income securities held by the Fund. If a security was rated by all three rating agencies, the middle rating was utilized. If rated by two of the three rating agencies, the lower rating was utilized, and if rated by one of the rating agencies, that rating was utilized. Standard & Poor’s rates the creditworthiness of bonds, ranging from AAA (highest) to D (lowest). Ratings from A to CCC may be modified by the addition of a plus (+) or minus (-) sign to show relative standing within the rating categories. Standard & Poor’s rates the creditworthiness of short-term notes from SP-1 (highest) to SP-3 (lowest). Moody’s rates the creditworthiness of bonds, ranging from Aaa (highest) to C (lowest). Ratings Aa to B may be modified by the addition of a number 1 (highest) to 3 (lowest) to show relative standing within the ratings categories. Moody’s rates the creditworthiness of short-term U.S. tax-exempt municipal securities from MIG 1/VMIG 1 (highest) to SG (lowest). Fitch rates the creditworthiness of bonds, ranging from AAA (highest) to D (lowest). Credit quality distribution is subject to change and may have changed since the date specified. |
| Effective maturity distribution as of June 30, 20221 |

| 1 | Figures represent the percentage of the Fund's long-term investments. These amounts are subject to change and may have changed since the date specified. |
| Beginning account value 1-1-2022 | Ending account value 6-30-2022 | Expenses paid during the period1 | Annualized net expense ratio | |
| Class A | ||||
| Actual | $1,000.00 | $ 933.11 | $4.07 | 0.85% |
| Hypothetical (5% return before expenses) | $1,000.00 | $1,020.58 | $4.26 | 0.85% |
| Class C | ||||
| Actual | $1,000.00 | $ 929.62 | $7.66 | 1.60% |
| Hypothetical (5% return before expenses) | $1,000.00 | $1,016.86 | $8.00 | 1.60% |
| Administrator Class | ||||
| Actual | $1,000.00 | $ 935.12 | $2.88 | 0.60% |
| Hypothetical (5% return before expenses) | $1,000.00 | $1,021.82 | $3.01 | 0.60% |
| Institutional Class | ||||
| Actual | $1,000.00 | $ 934.64 | $2.49 | 0.52% |
| Hypothetical (5% return before expenses) | $1,000.00 | $1,022.22 | $2.61 | 0.52% |
| Interest rate | Maturity date | Principal | Value | ||
| Municipal obligations: 106.00% | |||||
| Alabama: 0.55% | |||||
| Utilities revenue: 0.55% | |||||
| Black Belt Energy Gas District Gas Supply Project #7 Series C-1 | 4.00% | 12-1-2025 | $1,000,000 | $ 1,017,999 | |
| Colorado: 0.57% | |||||
| Health revenue: 0.57% | |||||
| Colorado Health Facilities Authority Hospital CommonSpirit Health Series B-2 | 5.00 | 8-1-2049 | 1,000,000 | 1,056,721 | |
| Guam: 0.90% | |||||
| Airport revenue: 0.34% | |||||
| Guam Port Authority Series 2018B | 5.00 | 7-1-2035 | 605,000 | 641,612 | |
| Utilities revenue: 0.56% | |||||
| Guam Power Authority Series A %% | 5.00 | 10-1-2026 | 500,000 | 531,110 | |
| Guam Power Authority Series A (AGM Insured) øø | 5.00 | 10-1-2030 | 500,000 | 504,121 | |
| 1,035,231 | |||||
| 1,676,843 | |||||
| Illinois: 0.73% | |||||
| GO revenue: 0.56% | |||||
| Illinois Series A | 5.00 | 3-1-2024 | 500,000 | 518,065 | |
| Illinois Series A | 5.25 | 3-1-2037 | 500,000 | 537,035 | |
| 1,055,100 | |||||
| Miscellaneous revenue: 0.17% | |||||
| Chicago IL Special Assessment Improvement Bonds Refunding Series 2022 | 2.53 | 12-1-2025 | 335,000 | 316,562 | |
| 1,371,662 | |||||
| Minnesota: 102.34% | |||||
| Airport revenue: 2.95% | |||||
| Minneapolis & St. Paul MN Metropolitan Airports Commission Subordinate Bond Series 2014A | 5.00 | 1-1-2032 | 800,000 | 820,743 | |
| Minneapolis & St. Paul MN Metropolitan Airports Commission Subordinate Bond Series 2014B | 5.00 | 1-1-2026 | 1,250,000 | 1,288,278 | |
| Minneapolis & St. Paul MN Metropolitan Airports Commission Subordinate Bond Series 2016A | 5.00 | 1-1-2031 | 250,000 | 269,321 | |
| Minneapolis & St. Paul MN Metropolitan Airports Commission Subordinate Bond Series 2016C | 5.00 | 1-1-2046 | 1,000,000 | 1,036,750 | |
| Minneapolis & St. Paul MN Metropolitan Airports Commission Subordinate Bond Series 2016D | 5.00 | 1-1-2041 | 250,000 | 258,566 | |
| Minneapolis & St. Paul MN Metropolitan Airports Commission Subordinate Bond Series 2019A | 5.00 | 1-1-2031 | 500,000 | 557,933 | |
| Minneapolis & St. Paul MN Metropolitan Airports Commission Subordinate Bond Series 2019A | 5.00 | 1-1-2033 | 200,000 | 205,025 | |
| Minneapolis & St. Paul MN Metropolitan Airports Commission Subordinate Bond Series 2019B | 5.00 | 1-1-2025 | 1,000,000 | 1,057,184 | |
| 5,493,800 |
| Interest rate | Maturity date | Principal | Value | ||
| Education revenue: 23.24% | |||||
| Brooklyn Park MN Charter School Athlos Leadership Academy Project Series 2015A | 5.50% | 7-1-2040 | $ 750,000 | $ 739,888 | |
| Cologne MN Charter School Cologne Academy Project Series 2014A | 5.00 | 7-1-2029 | 590,000 | 596,556 | |
| Cologne MN Charter School Cologne Academy Project Series 2014A | 5.00 | 7-1-2034 | 500,000 | 502,060 | |
| Columbus MN Charter School New Millennium Academy Project Series 2015A | 5.50 | 7-1-2030 | 1,000,000 | 925,513 | |
| Deephaven MN Charter School Eagle Ridge Academy Project Series 2015A | 5.25 | 7-1-2040 | 500,000 | 507,861 | |
| Deephaven MN Charter School Eagle Ridge Academy Project Series 2016A | 4.00 | 7-1-2025 | 125,000 | 124,582 | |
| Deephaven MN Charter School Eagle Ridge Academy Project Series 2016A | 4.00 | 7-1-2026 | 100,000 | 99,127 | |
| Deephaven MN Charter School Eagle Ridge Academy Project Series 2016A | 4.00 | 7-1-2027 | 100,000 | 98,621 | |
| Deephaven MN Charter School Eagle Ridge Academy Project Series 2016A | 5.25 | 7-1-2037 | 400,000 | 408,300 | |
| Forest Lakes MN Charter School Lakes International Language Academy Project Series 2014A | 5.50 | 8-1-2036 | 500,000 | 508,977 | |
| Ham Lake MN Charter School DaVinci Academy Project Series 2012A | 4.00 | 7-1-2028 | 370,000 | 366,116 | |
| Ham Lake MN Charter School DaVinci Academy Project Series 2016A | 5.00 | 7-1-2031 | 625,000 | 640,877 | |
| Hugo MN Charter School Lease Revenue Bonds Noble Academy Project Series 2014A | 4.00 | 7-1-2022 | 480,000 | 480,000 | |
| Hugo MN Charter School Lease Revenue Bonds Noble Academy Project Series 2014A | 5.00 | 7-1-2029 | 600,000 | 605,643 | |
| Minneapolis MN Charter School Northeast College Preparatory Project | 5.00 | 7-1-2055 | 700,000 | 604,384 | |
| Minneapolis MN Charter School Yinghua Academy Project Series 2013A | 5.00 | 7-1-2023 | 70,000 | 70,463 | |
| Minnesota HEFAR Bethel University Series 2017 | 5.00 | 5-1-2037 | 1,250,000 | 1,260,145 | |
| Minnesota HEFAR College of St. Scholastica Series 2019 | 4.00 | 12-1-2040 | 1,000,000 | 968,394 | |
| Minnesota HEFAR College of St. Scholastica Series 7R | 4.25 | 12-1-2027 | 400,000 | 401,457 | |
| Minnesota HEFAR Hamline University Series 2017B | 5.00 | 10-1-2035 | 1,000,000 | 1,016,149 | |
| Minnesota HEFAR Macalester College | 5.00 | 3-1-2028 | 400,000 | 440,127 | |
| Minnesota HEFAR Macalester College | 5.00 | 3-1-2030 | 500,000 | 549,832 | |
| Minnesota HEFAR St. Benedict College Series 2017 | 4.00 | 3-1-2036 | 410,000 | 405,091 | |
| Minnesota HEFAR St. Catherine University Refunding Bond Series A | 5.00 | 10-1-2025 | 570,000 | 606,609 | |
| Minnesota HEFAR St. Catherine University Series A | 5.00 | 10-1-2045 | 2,000,000 | 2,094,860 | |
| Minnesota HEFAR St. Johns University | 4.00 | 10-1-2034 | 200,000 | 198,730 | |
| Minnesota HEFAR St. Johns University | 4.00 | 10-1-2035 | 170,000 | 168,358 | |
| Minnesota HEFAR St. Johns University | 4.00 | 10-1-2039 | 200,000 | 193,249 | |
| Minnesota HEFAR St. Johns University | 4.00 | 10-1-2040 | 200,000 | 192,238 | |
| Minnesota HEFAR St. Olaf College | 4.00 | 10-1-2046 | 2,750,000 | 2,689,123 | |
| Minnesota HEFAR St. Thomas University Green Bond Series A | 5.00 | 10-1-2026 | 295,000 | 320,415 | |
| Minnesota HEFAR St. Thomas University Green Bond Series A | 5.00 | 10-1-2052 | 1,000,000 | 1,038,969 | |
| Minnesota HEFAR St. Thomas University Series 2019 | 4.00 | 10-1-2041 | 515,000 | 484,136 | |
| Minnesota HEFAR St. Thomas University Series 2019 | 5.00 | 10-1-2040 | 750,000 | 795,770 | |
| Minnesota HEFAR St. Thomas University Series 8L | 5.00 | 4-1-2028 | 920,000 | 988,154 | |
| Minnesota HEFAR St. Thomas University Series 8L | 5.00 | 4-1-2029 | 750,000 | 804,147 | |
| Minnesota HEFAR St. Thomas University Series 8L | 5.00 | 4-1-2035 | 750,000 | 791,464 | |
| Minnesota HEFAR St. Thomas University Series B | 5.00 | 10-1-2036 | 775,000 | 835,570 |
| Interest rate | Maturity date | Principal | Value | ||
| Education revenue (continued) | |||||
| Minnesota Office of Higher Education Supplemental Student Loan Program Revenue Bonds | 4.00% | 11-1-2037 | $1,425,000 | $ 1,419,871 | |
| Minnesota Office of Higher Education Supplemental Student Loan Program Revenue Bonds | 5.00 | 11-1-2027 | 500,000 | 549,751 | |
| Minnesota Office of Higher Education Supplemental Student Loan Program Revenue Bonds Series 2018 | 5.00 | 11-1-2026 | 700,000 | 755,903 | |
| Minnesota State Colleges & Universities Refunding Bonds Series 2017A | 5.00 | 10-1-2027 | 500,000 | 555,457 | |
| Moorhead MN Educational Facilities Revenue Bonds The Concordia College Corporation Project Series 2016 | 5.00 | 12-1-2025 | 2,000,000 | 2,079,358 | |
| Otsego MN Charter School Kaleidoscope Charter School Project Series 2014A | 4.15 | 9-1-2024 | 275,000 | 272,141 | |
| Otsego MN Charter School Kaleidoscope Charter School Project Series 2014A | 5.00 | 9-1-2034 | 1,100,000 | 1,065,837 | |
| Rice County MN Educational Facilities Shattuck-St. Mary's School Project 144A | 5.00 | 8-1-2022 | 930,000 | 932,554 | |
| St. Cloud MN Charter School Lease Revenue Bonds Athlos Academy of St. Cloud Series A 144A | 5.25 | 6-1-2032 | 355,000 | 342,885 | |
| St. Cloud MN Charter School Lease Revenue Bonds Stride Academy Project Series 2016A | 5.00 | 4-1-2036 | 750,000 | 602,970 | |
| St. Paul MN Housing & RDA Charter School Hmong College Preparatory Academy Project Series 2016A | 5.25 | 9-1-2031 | 1,000,000 | 1,026,776 | |
| St. Paul MN Housing & RDA Charter School Hmong College Preparatory Academy Project Series 2020A | 5.00 | 9-1-2055 | 400,000 | 376,578 | |
| St. Paul MN Housing & RDA Charter School Lease Revenue Twin Cities Academy Project Series 2015A | 5.00 | 7-1-2035 | 925,000 | 931,880 | |
| St. Paul MN Housing & RDA Charter School Lease Revenue Twin Cities German Immersion School Project Series 2013A | 4.00 | 7-1-2023 | 45,000 | 45,024 | |
| St. Paul MN Housing & RDA Charter School Lease Revenue Twin Cities German Immersion School Project Series 2019A | 5.00 | 7-1-2055 | 750,000 | 718,930 | |
| St. Paul MN Housing & RDA Conservatory for Performing Artists Series A | 4.00 | 3-1-2028 | 150,000 | 144,686 | |
| St. Paul MN Housing & RDA Hope Community Academy Project Series 2015A | 5.00 | 12-1-2034 | 1,645,000 | 1,524,151 | |
| Tender Option Bond Trust Receipts/Certificates Series 2018-XF2760 (Morgan Stanley Bank LIQ) 144Aø | 1.11 | 11-1-2037 | 1,425,000 | 1,425,000 | |
| University of Minnesota Series 2017A | 5.00 | 9-1-2042 | 770,000 | 827,472 | |
| University of Minnesota Series 2019A | 5.00 | 4-1-2044 | 2,000,000 | 2,180,029 | |
| University of Minnesota State Supported Biomedical Science Series 2011B | 5.00 | 8-1-2035 | 500,000 | 587,288 | |
| Woodbury MN Charter School Refunding Bond MSA Building Company Series A | 4.00 | 12-1-2050 | 500,000 | 423,560 | |
| 43,310,056 | |||||
| GO revenue: 23.17% | |||||
| Becker MN Independent School District #726 Series 2022B (State School District Credit Program Insured) | 4.00 | 2-1-2024 | 190,000 | 195,958 | |
| Becker MN Independent School District #726 Series 2022B (State School District Credit Program Insured) | 4.00 | 2-1-2026 | 100,000 | 104,943 | |
| Brainerd MN Independent School District #181 School Building Series A (State School District Credit Program Insured) | 4.00 | 2-1-2043 | 225,000 | 226,286 | |
| Chaska MN Series C | 5.00 | 2-1-2028 | 235,000 | 263,686 | |
| Chaska MN Series C | 5.00 | 2-1-2029 | 250,000 | 282,951 |
| Interest rate | Maturity date | Principal | Value | ||
| GO revenue (continued) | |||||
| Chaska MN Series C | 5.00% | 2-1-2030 | $ 230,000 | $ 263,143 | |
| Duluth MN Independent School District #709 Certificate of Participation Series 2019B (State School District Credit Program Insured) ¤ | 0.00 | 2-1-2033 | 1,075,000 | 685,468 | |
| Elk River MN Series A | 3.00 | 12-1-2044 | 2,000,000 | 1,718,417 | |
| Hastings MN Independent School District #200 CAB Series A (State School District Credit Program Insured) ¤ | 0.00 | 2-1-2032 | 1,305,000 | 945,607 | |
| Hastings MN Independent School District #200 CAB Series A (State School District Credit Program Insured) ¤ | 0.00 | 2-1-2033 | 1,145,000 | 794,852 | |
| Hennepin County MN Series 2016B | 5.00 | 12-1-2029 | 450,000 | 498,013 | |
| Hennepin County MN Series 2017C | 5.00 | 12-1-2031 | 2,000,000 | 2,207,228 | |
| Hennepin County MN Series 2018B (TD Bank NA SPA) ø | 0.90 | 12-1-2038 | 3,500,000 | 3,500,000 | |
| Hennepin County MN Series 2020A | 5.00 | 12-1-2029 | 2,160,000 | 2,514,362 | |
| Long Prairie MN Sewer Revenue Bond Series 2018A (Minnesota Credit Program Insured) | 5.00 | 2-1-2025 | 160,000 | 169,602 | |
| Long Prairie MN Sewer Revenue Bond Series 2018A (Minnesota Credit Program Insured) | 5.00 | 2-1-2026 | 185,000 | 199,440 | |
| Minneapolis MN Special School District #1 Series A (State School District Credit Program Insured) | 4.00 | 2-1-2040 | 1,150,000 | 1,160,953 | |
| Minnesota Series 2018A | 5.00 | 8-1-2032 | 2,700,000 | 3,019,254 | |
| Minnesota Series A | 5.00 | 8-1-2039 | 1,750,000 | 1,986,025 | |
| Minnesota Trunk Highway Series B | 4.00 | 8-1-2031 | 250,000 | 265,781 | |
| Minnesota Various Purpose Bonds Series 2015A ## | 5.00 | 8-1-2028 | 3,400,000 | 3,687,789 | |
| Moorhead MN Improvement Series C | 4.00 | 2-1-2027 | 435,000 | 458,014 | |
| Nashwauk-Keewatin MN Independent School District #319 Series 2022A (State School District Credit Program Insured) | 5.00 | 2-1-2030 | 250,000 | 286,758 | |
| Nashwauk-Keewatin MN Independent School District #319 Series 2022A (State School District Credit Program Insured) | 5.00 | 2-1-2031 | 325,000 | 376,028 | |
| North St. Paul and Maplewood MN Independent School District #622 Facilities Maintenance Series B (State School District Credit Program Insured) | 4.00 | 2-1-2029 | 2,735,000 | 2,934,866 | |
| Ramsey County MN Series A | 5.00 | 2-1-2023 | 2,220,000 | 2,262,821 | |
| Red Lake County MN Central Independent School District #2906 Series 2022A (State School District Credit Program Insured) | 5.00 | 2-1-2030 | 275,000 | 316,040 | |
| Red Lake County MN Central Independent School District #2906 Series 2022A (State School District Credit Program Insured) | 5.00 | 2-1-2031 | 165,000 | 191,178 | |
| Red Lake County MN Central Independent School District #2906 Series 2022A (State School District Credit Program Insured) | 5.00 | 2-1-2032 | 250,000 | 290,945 | |
| Red Lake County MN Central Independent School District #2906 Series 2022A (State School District Credit Program Insured) | 5.00 | 2-1-2033 | 310,000 | 359,957 | |
| Rosemount MN Independent School District #196 School Building Series 2016A (State School District Credit Program Insured) | 5.00 | 2-1-2027 | 1,500,000 | 1,644,977 | |
| Roseville MN Independent School District #623 School Building Series A (State School District Credit Program Insured) | 5.00 | 2-1-2031 | 2,090,000 | 2,291,047 | |
| Saint Cloud MN Independent School District #742 Series B (State School District Credit Program Insured) | 5.00 | 2-1-2031 | 200,000 | 227,544 |
| Interest rate | Maturity date | Principal | Value | ||
| GO revenue (continued) | |||||
| Sartell MN Independent School District #748 St. Stephen Public Schools GO Series 2016A (State School District Credit Program Insured) | 5.00% | 2-1-2027 | $1,450,000 | $ 1,553,489 | |
| Shakopee MN Independent School District #720 Series A (State School District Credit Program Insured) | 5.00 | 2-1-2023 | 1,000,000 | 1,019,867 | |
| Shakopee MN Independent School District #720 Series B (State School District Credit Program Insured) | 5.00 | 2-1-2025 | 405,000 | 432,960 | |
| St. Cloud MN Series A | 4.00 | 2-1-2028 | 460,000 | 490,859 | |
| St. Cloud MN Series A | 4.00 | 2-1-2029 | 475,000 | 504,525 | |
| St. Cloud MN Series A | 4.00 | 2-1-2030 | 495,000 | 523,833 | |
| St. Francis MN Independent School District #15 Series A (State School District Credit Program Insured) | 5.00 | 2-1-2027 | 485,000 | 494,720 | |
| St. Francis MN Independent School District #15 Series A (State School District Credit Program Insured) | 5.00 | 2-1-2028 | 220,000 | 224,244 | |
| Worthington MN Independent School District #518 School Building Series A (State School District Credit Program Insured) | 4.00 | 2-1-2030 | 440,000 | 462,739 | |
| Worthington MN Independent School District #518 School Building Series A (State School District Credit Program Insured) | 4.00 | 2-1-2032 | 530,000 | 554,834 | |
| Worthington MN Independent School District #518 School Building Series A (State School District Credit Program Insured) | 4.00 | 2-1-2033 | 555,000 | 577,446 | |
| 43,169,449 | |||||
| Health revenue: 20.52% | |||||
| Center City MN HCFR Hazelden Betty Ford Foundation Project Series 2014 | 5.00 | 11-1-2026 | 750,000 | 775,694 | |
| Center City MN HCFR Hazelden Betty Ford Foundation Project Series 2014 | 5.00 | 11-1-2027 | 500,000 | 516,000 | |
| Center City MN HCFR Hazelden Betty Ford Foundation Project Series 2014 | 5.00 | 11-1-2029 | 300,000 | 306,908 | |
| Duluth MN EDA HCFR Essentia Health Series A | 5.00 | 2-15-2048 | 650,000 | 669,803 | |
| Duluth MN EDA HCFR Essentia Health Series A | 5.25 | 2-15-2053 | 2,500,000 | 2,613,459 | |
| Maple Grove MN HCFR Maple Grove Hospital Corporation | 5.00 | 5-1-2030 | 850,000 | 898,695 | |
| Maple Grove MN HCFR North Memorial Health Care Series 2015 | 5.00 | 9-1-2023 | 655,000 | 675,921 | |
| Maple Grove MN HCFR Series 2017 | 5.00 | 5-1-2031 | 500,000 | 525,874 | |
| Maple Grove MN HCFR Series 2017 | 5.00 | 5-1-2032 | 500,000 | 522,360 | |
| Minneapolis & St. Paul MN Housing & RDA Allina Health System | 5.00 | 11-15-2025 | 225,000 | 244,383 | |
| Minneapolis & St. Paul MN Housing & RDA Allina Health System | 5.00 | 11-15-2026 | 645,000 | 713,529 | |
| Minneapolis & St. Paul MN Housing & RDA Allina Health System | 5.00 | 11-15-2029 | 1,000,000 | 1,143,219 | |
| Minneapolis & St. Paul MN Housing & RDA Allina Health System Series 2017A | 5.00 | 11-15-2029 | 1,000,000 | 1,097,851 | |
| Minneapolis MN Health Care System Fairview Health Services Series 2015A | 5.00 | 11-15-2033 | 2,000,000 | 2,071,943 | |
| Minneapolis MN Health Care System Fairview Health Services Series 2018A | 5.00 | 11-15-2035 | 270,000 | 284,433 | |
| Minneapolis MN Health Care System Fairview Health Services Series 2018A | 5.00 | 11-15-2036 | 400,000 | 420,740 | |
| Minneapolis MN Health Care System Revenue Allina Health System | 4.00 | 11-15-2038 | 975,000 | 971,417 |
| Interest rate | Maturity date | Principal | Value | ||
| Health revenue (continued) | |||||
| Minneapolis MN Health Care System Revenue Refunded Bond Fairview Health Services Series A | 5.00% | 11-15-2049 | $1,000,000 | $ 1,033,911 | |
| Plato MN Health Care Facilities Bond Glencoe Regional Health Services Project Series 2017 | 5.00 | 4-1-2041 | 550,000 | 565,712 | |
| Rochester MN HCFR Mayo Clinic ø | 0.93 | 11-15-2047 | 700,000 | 700,000 | |
| Rochester MN HCFR Mayo Clinic Series B (Northern Trust Company SPA) ø | 0.93 | 11-15-2038 | 7,000,000 | 7,000,000 | |
| Saint Cloud MN Health Care CentraCare Health System Obligated Group Series A | 5.00 | 5-1-2027 | 1,785,000 | 1,894,794 | |
| Shakopee MN Senior Housing Revenue Benedictine Living Community LLC Project 144A | 5.85 | 11-1-2058 | 750,000 | 748,587 | |
| Shakopee MN St. Francis Regional Medical Center Series 2014 | 5.00 | 9-1-2027 | 700,000 | 725,117 | |
| Shakopee MN St. Francis Regional Medical Center Series 2014 | 5.00 | 9-1-2029 | 725,000 | 745,351 | |
| St. Cloud MN Health Care Revenue Bonds Series 2016A | 5.00 | 5-1-2030 | 2,000,000 | 2,096,063 | |
| St. Cloud MN Health Care Revenue Bonds Series 2016A | 5.00 | 5-1-2031 | 2,000,000 | 2,090,778 | |
| St. Cloud MN Health Care Revenue CentraCare Health System Series A | 5.00 | 5-1-2028 | 1,550,000 | 1,634,935 | |
| St. Paul MN Housing & RDA Fairview Health Services Series 2017A | 5.00 | 11-15-2034 | 565,000 | 593,952 | |
| St. Paul MN Housing & RDA Healthfirst Care Systems Project Series 2015A | 5.00 | 11-15-2027 | 1,000,000 | 1,083,599 | |
| St. Paul MN Housing & RDA Healthpartners Obligation Group Series 2015A | 5.00 | 7-1-2025 | 520,000 | 554,135 | |
| St. Paul MN Housing & RDA Healthpartners Obligation Group Series 2015A | 5.00 | 7-1-2028 | 225,000 | 236,262 | |
| St. Paul MN Housing & RDA Healthpartners Obligation Group Series 2015A | 5.00 | 7-1-2031 | 2,010,000 | 2,087,595 | |
| 38,243,020 | |||||
| Housing revenue: 4.22% | |||||
| Minneapolis MN Student Housing Riverton Community Housing Project Series 2014 | 5.00 | 8-1-2032 | 860,000 | 865,007 | |
| Minnesota HFA Rental Housing Series C (Department of Housing and Urban Development Insured) | 0.30 | 2-1-2024 | 1,500,000 | 1,454,743 | |
| Minnesota HFA Residential Housing Series D (SIFMA Municipal Swap +0.43%)(GNMA / FNMA / FHLMC Insured) ± | 1.41 | 1-1-2045 | 750,000 | 749,145 | |
| Minnesota HFA Residential Housing Series E (GNMA / FNMA / FHLMC Insured) | 1.75 | 1-1-2028 | 640,000 | 600,154 | |
| Minnesota HFA Residential Housing Series E (GNMA / FNMA / FHLMC Insured) | 1.75 | 7-1-2028 | 500,000 | 464,416 | |
| Minnesota HFA State Appropriation Bonds Series 2015A | 4.00 | 8-1-2031 | 300,000 | 313,918 | |
| Minnesota HFA State Appropriation Bonds Series 2015A | 5.00 | 8-1-2027 | 1,665,000 | 1,764,277 | |
| Minnesota HFA State Appropriation Bonds Series 2015A | 5.00 | 8-1-2032 | 500,000 | 525,333 | |
| Minnesota HFA State Appropriation Housing Infrastructure Series B | 5.00 | 8-1-2029 | 320,000 | 363,897 | |
| Minnesota HFA State Appropriation Housing Infrastructure Series B | 5.00 | 8-1-2030 | 465,000 | 533,322 | |
| Minnesota HFA State Appropriation Housing Infrastructure Series D | 5.00 | 8-1-2028 | 200,000 | 225,399 | |
| 7,859,611 |
| Interest rate | Maturity date | Principal | Value | ||
| Miscellaneous revenue: 15.99% | |||||
| Anoka Hennepin MN Independent School District #11 Certificate of Participation Series 2014A | 5.00% | 2-1-2034 | $1,000,000 | $ 1,041,849 | |
| Center City MN HCFR Hazelden Betty Ford Foundation Project Series 2019 | 4.00 | 11-1-2030 | 250,000 | 247,893 | |
| Center City MN HCFR Hazelden Betty Ford Foundation Project Series 2019 | 4.00 | 11-1-2031 | 250,000 | 245,785 | |
| Center City MN HCFR Hazelden Betty Ford Foundation Project Series 2019 | 4.00 | 11-1-2034 | 300,000 | 288,664 | |
| Duluth MN Independent School District #709 Certificate of Participation Series 2019A | 4.00 | 3-1-2026 | 700,000 | 694,802 | |
| Duluth MN Independent School District #709 Certificate of Participation Series 2019B (State School District Credit Program Insured) | 5.00 | 2-1-2026 | 395,000 | 429,769 | |
| Duluth MN Independent School District #709 Certificate of Participation Series 2019B (State School District Credit Program Insured) | 5.00 | 2-1-2028 | 700,000 | 780,835 | |
| Goodhue County MN Education District #6051 Red Wing Certificate of Participation Series 2014A | 5.00 | 2-1-2029 | 750,000 | 784,712 | |
| Lake Agassiz Education Cooperative #0397-52 Certificate of Participation Series A | 3.00 | 2-1-2028 | 290,000 | 282,287 | |
| Lake Agassiz Education Cooperative #0397-52 Certificate of Participation Series A | 3.00 | 2-1-2029 | 300,000 | 287,428 | |
| Lake Agassiz Education Cooperative #0397-52 Certificate of Participation Series A | 3.00 | 2-1-2030 | 310,000 | 292,968 | |
| Minneapolis MN Special School District #1 Certificate of Participation Series A | 5.00 | 4-1-2024 | 300,000 | 314,841 | |
| Minnesota General Fund Appropriation Bonds Series 2012B | 5.00 | 3-1-2027 | 2,000,000 | 2,016,144 | |
| Minnesota General Fund Appropriation Bonds Series 2012B | 5.00 | 3-1-2029 | 2,000,000 | 2,016,144 | |
| Minnesota General Fund Appropriation Bonds Series 2014A | 5.00 | 6-1-2033 | 1,000,000 | 1,027,420 | |
| Minnesota Legislative Office Facility Project Certificate of Participation Series 2014 | 5.00 | 6-1-2023 | 435,000 | 447,644 | |
| Minnesota Rural Water Finance Authority Public Projects Construction Notes | 0.25 | 8-1-2022 | 2,750,000 | 2,745,987 | |
| Minnesota Rural Water Financial Authority Public Projects Construction Notes | 2.63 | 12-1-2023 | 1,500,000 | 1,500,161 | |
| Minnetonka MN Independent School District #276 Certificate of Participation Series 2016F | 5.00 | 2-1-2025 | 205,000 | 209,097 | |
| Minnetonka MN Independent School District #276 Certificate of Participation Series 2018C | 5.75 | 2-1-2042 | 2,145,000 | 2,342,659 | |
| Northeastern Minnesota Metropolitan Intermediate School District #916 Certificate of Participation Series 2013A | 4.00 | 2-1-2024 | 1,100,000 | 1,112,290 | |
| Northeastern Minnesota Metropolitan Intermediate School District #916 Certificate of Participation Series 2015B | 5.00 | 2-1-2034 | 1,500,000 | 1,593,873 | |
| Plymouth MN Intermediate School District #287 Certificate of Participation Series 2016A | 4.00 | 5-1-2026 | 500,000 | 520,576 | |
| Plymouth MN Intermediate School District #287 Certificate of Participation Series 2016A | 4.00 | 5-1-2027 | 1,000,000 | 1,037,179 | |
| Plymouth MN Intermediate School District #287 Certificate of Participation Series A | 4.00 | 2-1-2023 | 230,000 | 232,525 | |
| Plymouth MN Intermediate School District #287 Certificate of Participation Series A | 4.00 | 2-1-2024 | 130,000 | 133,525 | |
| Plymouth MN Intermediate School District #287 Certificate of Participation Series A | 4.00 | 2-1-2025 | 215,000 | 223,021 | |
| St. Cloud MN Independent School District #742 Certificate of Participation Series 2017A | 5.00 | 2-1-2032 | 500,000 | 532,063 |
| Interest rate | Maturity date | Principal | Value | ||
| Miscellaneous revenue (continued) | |||||
| St. Cloud MN Independent School District #742 Certificate of Participation Series 2017A | 5.00% | 2-1-2034 | $ 350,000 | $ 371,904 | |
| St. Cloud MN Infrastructure Management Series B | 4.00 | 2-1-2028 | 245,000 | 261,436 | |
| St. Cloud MN Infrastructure Management Series B | 4.00 | 2-1-2029 | 255,000 | 270,850 | |
| St. Cloud MN Infrastructure Management Series B | 4.00 | 2-1-2030 | 260,000 | 275,144 | |
| St. Paul MN Independent School District #625 Certificate of Participation Series C (State School District Credit Program Insured) | 5.00 | 2-1-2030 | 2,965,000 | 3,252,552 | |
| White Bear Lake MN Independent School District #624 Certificate of Participation Series B | 5.00 | 4-1-2026 | 830,000 | 900,780 | |
| White Bear Lake MN Refunding Bonds YMCA of Greater Twin Cities Project Series 2018 | 5.00 | 6-1-2032 | 1,000,000 | 1,076,326 | |
| 29,791,133 | |||||
| Resource recovery revenue: 0.65% | |||||
| Douglas County MN Refunding Bond Solid Waste Series A | 5.00 | 8-1-2030 | 1,055,000 | 1,205,026 | |
| Tax revenue: 0.76% | |||||
| Hennepin County MN Series 2019B | 5.00 | 12-15-2031 | 1,260,000 | 1,423,175 | |
| Transportation revenue: 0.87% | |||||
| St. Paul MN Housing & RDA Parking Enterprise Refunding Bonds Series 2017A | 4.00 | 8-1-2026 | 525,000 | 537,112 | |
| St. Paul MN Housing & RDA Parking Enterprise Refunding Bonds Series 2017A | 4.00 | 8-1-2027 | 545,000 | 555,430 | |
| St. Paul MN Housing & RDA Parking Enterprise Refunding Bonds Series 2017A | 5.00 | 8-1-2025 | 500,000 | 520,349 | |
| 1,612,891 | |||||
| Utilities revenue: 9.97% | |||||
| Central Minnesota Municipal Power Agency Brookings Southeast Twin Cities Transmission Project Revenue Refunding Bonds Series 2021 (AGM Insured) | 4.00 | 1-1-2042 | 350,000 | 347,794 | |
| Central Minnesota Municipal Power Agency Brookings Southeast Twin Cities Transmission Project Revenue Refunding Bonds Series 2021 (AGM Insured) | 5.00 | 1-1-2029 | 315,000 | 355,392 | |
| Central Minnesota Municipal Power Agency Brookings Southeast Twin Cities Transmission Project Revenue Refunding Bonds Series 2021 (AGM Insured) | 5.00 | 1-1-2030 | 210,000 | 239,017 | |
| Central Minnesota Municipal Power Agency Brookings Southeast Twin Cities Transmission Project Revenue Refunding Bonds Series 2021 (AGM Insured) | 5.00 | 1-1-2031 | 350,000 | 398,637 | |
| Elk River MN Electric Series B | 5.00 | 8-1-2028 | 300,000 | 337,026 | |
| Hutchinson MN Public Utility Revenue Refunding Bonds Series 2012A | 5.00 | 12-1-2026 | 700,000 | 709,899 | |
| Minnesota Municipal Gas Agency Series 2022 (Royal Bank of Canada LIQ) | 4.00 | 12-1-2052 | 3,000,000 | 3,074,804 | |
| Northern Minnesota Municipal Power Agency Electric System | 5.00 | 1-1-2036 | 100,000 | 107,901 | |
| Northern Minnesota Municipal Power Agency Electric System Series 2013A | 4.00 | 1-1-2028 | 450,000 | 454,469 | |
| Northern Minnesota Municipal Power Agency Electric System Series 2013A | 5.00 | 1-1-2031 | 745,000 | 756,624 | |
| Northern Minnesota Municipal Power Agency Electric System Series 2016 | 5.00 | 1-1-2025 | 205,000 | 218,613 | |
| Northern Minnesota Municipal Power Agency Electric System Series 2016 | 5.00 | 1-1-2030 | 520,000 | 564,739 |
| Interest rate | Maturity date | Principal | Value | ||
| Utilities revenue (continued) | |||||
| Northern Minnesota Municipal Power Agency Electric System Series 2016 | 5.00% | 1-1-2031 | $ 350,000 | $ 379,991 | |
| Northern Minnesota Municipal Power Agency Electric System Series 2017 | 5.00 | 1-1-2041 | 400,000 | 429,273 | |
| Rochester MN Electric Utility Revenue Series 2013B | 5.00 | 12-1-2025 | 315,000 | 328,960 | |
| Rochester MN Electric Utility Revenue Series 2013B | 5.00 | 12-1-2026 | 250,000 | 261,079 | |
| Rochester MN Electric Utility Revenue Series 2017A | 5.00 | 12-1-2037 | 500,000 | 553,348 | |
| Southern Minnesota Municipal Power Agency Badger Coulee Project Series 2019A | 5.00 | 1-1-2032 | 700,000 | 795,666 | |
| Southern Minnesota Municipal Power Agency Badger Coulee Project Series 2019A | 5.00 | 1-1-2033 | 560,000 | 632,329 | |
| Southern Minnesota Municipal Power Agency Badger Coulee Project Series 2019A | 5.00 | 1-1-2034 | 615,000 | 691,180 | |
| Southern Minnesota Municipal Power Agency Series A | 5.00 | 1-1-2041 | 480,000 | 518,123 | |
| St. Paul MN Port Authority District Energy Revenue Series 1 | 3.00 | 10-1-2023 | 200,000 | 202,433 | |
| St. Paul MN Port Authority District Energy Revenue Series 1 | 3.00 | 10-1-2027 | 100,000 | 100,426 | |
| St. Paul MN Port Authority District Energy Revenue Series 1 | 3.00 | 10-1-2034 | 225,000 | 204,582 | |
| St. Paul MN Port Authority District Energy Revenue Series 1 | 4.00 | 10-1-2028 | 400,000 | 422,995 | |
| St. Paul MN Port Authority District Energy Revenue Series 1 | 4.00 | 10-1-2041 | 500,000 | 504,326 | |
| Western Minnesota Municipal Power Agency Series A | 5.00 | 1-1-2027 | 1,565,000 | 1,586,726 | |
| Western Minnesota Municipal Power Agency Series A | 5.00 | 1-1-2030 | 1,000,000 | 1,012,363 | |
| Western Minnesota Municipal Power Agency Series A | 5.00 | 1-1-2031 | 1,000,000 | 1,083,943 | |
| Western Minnesota Municipal Power Agency Series A | 5.00 | 1-1-2032 | 1,250,000 | 1,308,163 | |
| 18,580,821 | |||||
| 190,688,982 | |||||
| New York: 0.15% | |||||
| Health revenue: 0.15% | |||||
| Westchester County NY Local Development Corporation Kendal on Hudson Obligated Group Series B %% | 5.00 | 1-1-2027 | 275,000 | 282,659 | |
| Puerto Rico: 0.76% | |||||
| Health revenue: 0.76% | |||||
| Puerto Rico Industrial Tourist Educational Medical & Environmental Control Facilities Financing Authority Hospital Auxilio Mutuo Obligated Group Project | 4.00 | 7-1-2037 | 275,000 | 251,955 | |
| Puerto Rico Industrial Tourist Educational Medical & Environmental Control Facilities Financing Authority Hospital Auxilio Mutuo Obligated Group Project | 5.00 | 7-1-2028 | 760,000 | 830,571 | |
| Puerto Rico Industrial Tourist Educational Medical & Environmental Control Facilities Financing Authority Hospital Auxilio Mutuo Obligated Group Project | 5.00 | 7-1-2031 | 300,000 | 332,366 | |
| 1,414,892 | |||||
| Total Municipal obligations (Cost $203,167,329) | 197,509,758 | ||||
| Total investments in securities (Cost $203,167,329) | 106.00% | 197,509,758 | |||
| Other assets and liabilities, net | (6.00) | (11,179,484) | |||
| Total net assets | 100.00% | $186,330,274 |
| øø | The interest rate is determined and reset by the issuer periodically depending upon the terms of the security. The rate shown is the rate in effect at period end. |
| 144A | The security may be resold in transactions exempt from registration, normally to qualified institutional buyers, pursuant to Rule 144A under the Securities Act of 1933. |
| ø | Variable rate demand notes are subject to a demand feature which reduces the effective maturity. The maturity date shown represents the final maturity date of the security. The interest rate is determined and reset by the issuer daily, weekly, or monthly depending upon the terms of the security. The rate shown is the rate in effect at period end. |
| ¤ | The security is issued in zero coupon form with no periodic interest payments. |
| ## | All or a portion of this security is segregated for when-issued securities. |
| ± | Variable rate investment. The rate shown is the rate in effect at period end. |
| %% | The security is purchased on a when-issued basis. |
| Abbreviations: | |
| AGM | Assured Guaranty Municipal |
| CAB | Capital appreciation bond |
| EDA | Economic Development Authority |
| FHLMC | Federal Home Loan Mortgage Corporation |
| FNMA | Federal National Mortgage Association |
| GNMA | Government National Mortgage Association |
| GO | General obligation |
| HCFR | Healthcare facilities revenue |
| HEFAR | Higher Education Facilities Authority Revenue |
| HFA | Housing Finance Authority |
| LIQ | Liquidity agreement |
| RDA | Redevelopment Authority |
| SIFMA | Securities Industry and Financial Markets Association |
| SPA | Standby purchase agreement |
| Assets | |
Investments in unaffiliated securities, at value (cost $203,167,329) | $ 197,509,758 |
Cash | 2,834,752 |
Receivable for investments sold | 3,101,256 |
Receivable for interest | 2,544,879 |
Receivable for Fund shares sold | 191,994 |
Prepaid expenses and other assets | 51,745 |
Total assets | 206,234,384 |
| Liabilities | |
Payable for Fund shares redeemed | 18,914,353 |
Payable for when-issued transactions | 820,830 |
Dividends payable | 90,068 |
Management fee payable | 48,089 |
Administration fees payable | 15,992 |
Distribution fee payable | 711 |
Trustees’ fees and expenses payable | 500 |
Accrued expenses and other liabilities | 13,567 |
Total liabilities | 19,904,110 |
Total net assets | $186,330,274 |
| Net assets consist of | |
Paid-in capital | $ 191,444,235 |
Total distributable loss | (5,113,961) |
Total net assets | $186,330,274 |
| Computation of net asset value and offering price per share | |
Net assets – Class A | $ 27,430,655 |
Shares outstanding – Class A1 | 2,713,038 |
Net asset value per share – Class A | $10.11 |
Maximum offering price per share – Class A2 | $10.59 |
Net assets – Class C | $ 1,146,892 |
Shares outstanding – Class C1 | 113,422 |
Net asset value per share – Class C | $10.11 |
Net assets – Administrator Class | $ 53,577,873 |
Shares outstanding – Administrator Class1 | 5,299,799 |
Net asset value per share – Administrator Class | $10.11 |
Net assets – Institutional Class | $ 104,174,854 |
Shares outstanding – Institutional Class1 | 10,297,647 |
Net asset value per share – Institutional Class | $10.12 |
| 1 | The Fund has an unlimited number of authorized shares. |
| 2 | Maximum offering price is computed as 100/95.50 of net asset value. On investments of $50,000 or more, the offering price is reduced. |
| Investment income | |
Interest | $ 4,687,056 |
| Expenses | |
Management fee | 743,866 |
| Administration fees | |
Class A | 47,206 |
Class C | 2,894 |
Administrator Class | 59,741 |
Institutional Class | 75,931 |
| Shareholder servicing fees | |
Class A | 73,758 |
Class C | 4,484 |
Administrator Class | 147,401 |
| Distribution fee | |
Class C | 13,451 |
Custody and accounting fees | 10,250 |
Professional fees | 67,343 |
Registration fees | 54,850 |
Shareholder report expenses | 30,847 |
Trustees’ fees and expenses | 20,033 |
Other fees and expenses | 10,512 |
Total expenses | 1,362,567 |
| Less: Fee waivers and/or expense reimbursements | |
Fund-level | (117,929) |
Administrator Class | (113,508) |
Net expenses | 1,131,130 |
Net investment income | 3,555,926 |
| Realized and unrealized gains (losses) on investments | |
| Net realized gains (losses) on | |
Unaffiliated securities | (296,737) |
Futures contracts | 11,529 |
Net realized losses on investments | (285,208) |
Net change in unrealized gains (losses) on investments | (14,731,962) |
Net realized and unrealized gains (losses) on investments | (15,017,170) |
Net decrease in net assets resulting from operations | $(11,461,244) |
| Year ended June 30, 2022 | Year ended June 30, 2021 | |||
| Operations | ||||
Net investment income | $ 3,555,926 | $ 3,653,766 | ||
Net realized gains (losses) on investments | (285,208) | 254,311 | ||
Net change in unrealized gains (losses) on investments | (14,731,962) | 2,217,903 | ||
Net increase (decrease) in net assets resulting from operations | (11,461,244) | 6,125,980 | ||
| Distributions to shareholders from | ||||
| Net investment income and net realized gains | ||||
Class A | (530,893) | (548,293) | ||
Class C | (18,937) | (27,913) | ||
Administrator Class | (1,225,069) | (1,347,984) | ||
Institutional Class | (2,025,072) | (1,731,460) | ||
Total distributions to shareholders | (3,799,971) | (3,655,650) | ||
| Capital share transactions | Shares | Shares | ||
| Proceeds from shares sold | ||||
Class A | 175,543 | 1,829,918 | 323,370 | 3,550,192 |
Class C | 11,415 | 122,003 | 7,552 | 83,001 |
Administrator Class | 1,338,902 | 14,180,966 | 1,282,905 | 14,097,375 |
Institutional Class | 7,339,926 | 75,455,903 | 2,957,625 | 32,571,701 |
| 91,588,790 | 50,302,269 | |||
| Reinvestment of distributions | ||||
Class A | 49,574 | 529,205 | 49,779 | 546,374 |
Class C | 1,768 | 18,934 | 2,540 | 27,869 |
Administrator Class | 114,150 | 1,218,535 | 121,253 | 1,330,716 |
Institutional Class | 135,521 | 1,445,764 | 100,771 | 1,106,654 |
| 3,212,438 | 3,011,613 | |||
| Payment for shares redeemed | ||||
Class A | (378,627) | (4,030,884) | (205,563) | (2,256,143) |
Class C | (86,673) | (903,922) | (193,345) | (2,116,163) |
Administrator Class | (1,665,542) | (17,447,828) | (2,334,032) | (25,663,314) |
Institutional Class | (5,504,066) | (56,987,358) | (1,208,730) | (13,262,498) |
| (79,369,992) | (43,298,118) | |||
Net increase in net assets resulting from capital share transactions | 15,431,236 | 10,015,764 | ||
Total increase in net assets | 170,021 | 12,486,094 | ||
| Net assets | ||||
Beginning of period | 186,160,253 | 173,674,159 | ||
End of period | $186,330,274 | $186,160,253 | ||
| Year ended June 30 | |||||
| Class A | 2022 | 2021 | 2020 | 2019 | 2018 |
Net asset value, beginning of period | $11.02 | $10.86 | $10.77 | $10.51 | $10.68 |
Net investment income | 0.18 | 0.20 1 | 0.23 | 0.27 1 | 0.28 1 |
Net realized and unrealized gains (losses) on investments | (0.90) | 0.16 | 0.09 | 0.26 | (0.16) |
Total from investment operations | (0.72) | 0.36 | 0.32 | 0.53 | 0.12 |
| Distributions to shareholders from | |||||
Net investment income | (0.18) | (0.20) | (0.23) | (0.27) | (0.28) |
Net realized gains | (0.01) | 0.00 | 0.00 | 0.00 | (0.01) |
Total distributions to shareholders | (0.19) | (0.20) | (0.23) | (0.27) | (0.29) |
Net asset value, end of period | $10.11 | $11.02 | $10.86 | $10.77 | $10.51 |
Total return2 | (6.59)% | 3.32% | 2.99% | 5.13% | 1.10% |
| Ratios to average net assets (annualized) | |||||
Gross expenses | 0.91% | 0.92% | 0.93% | 0.94% | 0.85% |
Net expenses | 0.85% | 0.85% | 0.85% | 0.85% | 0.84% |
Net investment income | 1.67% | 1.80% | 2.12% | 2.57% | 2.64% |
| Supplemental data | |||||
Portfolio turnover rate | 11% | 9% | 16% | 18% | 15% |
Net assets, end of period (000s omitted) | $27,431 | $31,586 | $29,317 | $27,399 | $29,554 |
| 1 | Calculated based upon average shares outstanding |
| 2 | Total return calculations do not include any sales charges. |
| Year ended June 30 | |||||
| Class C | 2022 | 2021 | 2020 | 2019 | 2018 |
Net asset value, beginning of period | $11.02 | $10.86 | $10.77 | $10.51 | $10.68 |
Net investment income | 0.10 1 | 0.12 1 | 0.15 1 | 0.19 | 0.20 |
Net realized and unrealized gains (losses) on investments | (0.90) | 0.16 | 0.09 | 0.26 | (0.16) |
Total from investment operations | (0.80) | 0.28 | 0.24 | 0.45 | 0.04 |
| Distributions to shareholders from | |||||
Net investment income | (0.10) | (0.12) | (0.15) | (0.19) | (0.20) |
Net realized gains | (0.01) | 0.00 | 0.00 | 0.00 | (0.01) |
Total distributions to shareholders | (0.11) | (0.12) | (0.15) | (0.19) | (0.21) |
Net asset value, end of period | $10.11 | $11.02 | $10.86 | $10.77 | $10.51 |
Total return2 | (7.29)% | 2.54% | 2.22% | 4.35% | 0.34% |
| Ratios to average net assets (annualized) | |||||
Gross expenses | 1.66% | 1.66% | 1.68% | 1.69% | 1.59% |
Net expenses | 1.60% | 1.60% | 1.60% | 1.60% | 1.59% |
Net investment income | 0.91% | 1.06% | 1.37% | 1.83% | 1.89% |
| Supplemental data | |||||
Portfolio turnover rate | 11% | 9% | 16% | 18% | 15% |
Net assets, end of period (000s omitted) | $1,147 | $2,060 | $4,020 | $5,254 | $7,387 |
| 1 | Calculated based upon average shares outstanding |
| 2 | Total return calculations do not include any sales charges. |
| Year ended June 30 | |||||
| Administrator Class | 2022 | 2021 | 2020 | 2019 | 2018 |
Net asset value, beginning of period | $11.02 | $10.86 | $10.76 | $10.51 | $10.68 |
Net investment income | 0.21 | 0.23 1 | 0.26 1 | 0.30 1 | 0.31 1 |
Net realized and unrealized gains (losses) on investments | (0.90) | 0.16 | 0.10 | 0.25 | (0.16) |
Total from investment operations | (0.69) | 0.39 | 0.36 | 0.55 | 0.15 |
| Distributions to shareholders from | |||||
Net investment income | (0.21) | (0.23) | (0.26) | (0.30) | (0.31) |
Net realized gains | (0.01) | 0.00 | 0.00 | 0.00 | (0.01) |
Total distributions to shareholders | (0.22) | (0.23) | (0.26) | (0.30) | (0.32) |
Net asset value, end of period | $10.11 | $11.02 | $10.86 | $10.76 | $10.51 |
Total return | (6.35)% | 3.58% | 3.34% | 5.29% | 1.34% |
| Ratios to average net assets (annualized) | |||||
Gross expenses | 0.85% | 0.86% | 0.87% | 0.88% | 0.78% |
Net expenses | 0.60% | 0.60% | 0.60% | 0.60% | 0.60% |
Net investment income | 1.92% | 2.06% | 2.38% | 2.81% | 2.89% |
| Supplemental data | |||||
Portfolio turnover rate | 11% | 9% | 16% | 18% | 15% |
Net assets, end of period (000s omitted) | $53,578 | $60,727 | $69,954 | $95,072 | $85,259 |
| 1 | Calculated based upon average shares outstanding |
| Year ended June 30 | |||||
| Institutional Class | 2022 | 2021 | 2020 | 2019 | 2018 |
Net asset value, beginning of period | $11.02 | $10.87 | $10.77 | $10.52 | $10.69 |
Net investment income | 0.21 | 0.23 | 0.26 | 0.30 | 0.32 |
Net realized and unrealized gains (losses) on investments | (0.89) | 0.15 | 0.10 | 0.25 | (0.16) |
Total from investment operations | (0.68) | 0.38 | 0.36 | 0.55 | 0.16 |
| Distributions to shareholders from | |||||
Net investment income | (0.21) | (0.23) | (0.26) | (0.30) | (0.32) |
Net realized gains | (0.01) | 0.00 | 0.00 | 0.00 | (0.01) |
Total distributions to shareholders | (0.22) | (0.23) | (0.26) | (0.30) | (0.33) |
Net asset value, end of period | $10.12 | $11.02 | $10.87 | $10.77 | $10.52 |
Total return | (6.19)% | 3.56% | 3.42% | 5.37% | 1.43% |
| Ratios to average net assets (annualized) | |||||
Gross expenses | 0.58% | 0.59% | 0.60% | 0.61% | 0.52% |
Net expenses | 0.52% | 0.52% | 0.52% | 0.52% | 0.52% |
Net investment income | 2.01% | 2.13% | 2.43% | 2.89% | 2.98% |
| Supplemental data | |||||
Portfolio turnover rate | 11% | 9% | 16% | 18% | 15% |
Net assets, end of period (000s omitted) | $104,175 | $91,787 | $70,383 | $35,630 | $29,639 |
| Gross unrealized gains | $ 639,421 |
| Gross unrealized losses | (6,296,990) |
| Net unrealized losses | $(5,657,569) |
| ■ | Level 1 – quoted prices in active markets for identical securities |
| ■ | Level 2 – other significant observable inputs (including quoted prices for similar securities, interest rates, prepayment speeds, credit risk, etc.) |
| ■ | Level 3 – significant unobservable inputs (including the Fund’s own assumptions in determining the fair value of investments) |
| Quoted prices (Level 1) | Other significant observable inputs (Level 2) | Significant unobservable inputs (Level 3) | Total | |
| Assets | ||||
| Investments in: | ||||
| Municipal obligations | $0 | $197,509,758 | $0 | $197,509,758 |
| Average daily net assets | Management fee |
| First $500 million | 0.400% |
| Next $500 million | 0.375 |
| Next $2 billion | 0.350 |
| Next $2 billion | 0.325 |
| Next $5 billion | 0.290 |
| Over $10 billion | 0.280 |
| Class-level administration fee | |
| Class A | 0.16% |
| Class C | 0.16 |
| Administrator Class | 0.10 |
| Institutional Class | 0.08 |
| Expense ratio caps | |
| Class A | 0.85% |
| Class C | 1.60 |
| Administrator Class | 0.60 |
| Institutional Class | 0.52 |
| Year ended June 30 | ||
| 2022 | 2021 | |
| Ordinary income | $ 113,376 | $ 0 |
| Tax-exempt income | 3,556,241 | 3,655,650 |
| Long-term capital gain | 130,354 | 0 |
| Undistributed tax-exempt income | Unrealized losses | Capital loss carryforward |
| $918,884 | $(5,657,569) | $(285,208) |
Allspring Funds Trust:

| Name and year of birth | Position held and length of service* | Principal occupations during past five years or longer | Current other public company or investment company directorships |
| William R. Ebsworth (Born 1957) | Trustee, since 2015 | Retired. From 1984 to 2013, equities analyst, portfolio manager, research director and chief investment officer at Fidelity Management and Research Company in Boston, Tokyo, and Hong Kong, and retired in 2013 as Chief Investment Officer of Fidelity Strategic Advisers, Inc. where he led a team of investment professionals managing client assets. Prior thereto, Board member of Hong Kong Securities Clearing Co., Hong Kong Options Clearing Corp., the Thailand International Fund, Ltd., Fidelity Investments Life Insurance Company, and Empire Fidelity Investments Life Insurance Company. Audit Committee Chair and Investment Committee Chair of the Vincent Memorial Hospital Endowment (non-profit organization). Mr. Ebsworth is a CFA® charterholder. | N/A |
| Jane A. Freeman (Born 1953) | Trustee, since 2015; Chair Liaison, since 2018 | Retired. From 2012 to 2014 and 1999 to 2008, Chief Financial Officer of Scientific Learning Corporation. From 2008 to 2012, Ms. Freeman provided consulting services related to strategic business projects. Prior to 1999, Portfolio Manager at Rockefeller & Co. and Scudder, Stevens & Clark. Board member of the Harding Loevner Funds from 1996 to 2014, serving as both Lead Independent Director and chair of the Audit Committee. Board member of the Russell Exchange Traded Funds Trust from 2011 to 2012 and the chair of the Audit Committee. Ms. Freeman is also an inactive Chartered Financial Analyst. | N/A |
| Isaiah Harris, Jr. (Born 1952) | Trustee, since 2009; Audit Committee Chair, since 2019 | Retired. Chairman of the Board of CIGNA Corporation from 2009 to 2021, and Director from 2005 to 2008. From 2003 to 2011, Director of Deluxe Corporation. Prior thereto, President and CEO of BellSouth Advertising and Publishing Corp. from 2005 to 2007, President and CEO of BellSouth Enterprises from 2004 to 2005 and President of BellSouth Consumer Services from 2000 to 2003. Emeritus member of the Iowa State University Foundation Board of Governors. Emeritus Member of the Advisory Board of Iowa State University School of Business. Advisory Board Member, Palm Harbor Academy (private school). Advisory Board Member, Fellowship of Christian Athletes. Mr. Harris is a certified public accountant (inactive status). | N/A |
| David F. Larcker (Born 1950) | Trustee, since 2009 | James Irvin Miller Professor of Accounting at the Graduate School of Business (Emeritus), Stanford University, Director of the Corporate Governance Research Initiative and Senior Faculty of The Rock Center for Corporate Governance since 2006. From 2005 to 2008, Professor of Accounting at the Graduate School of Business, Stanford University. Prior thereto, Ernst & Young Professor of Accounting at The Wharton School, University of Pennsylvania from 1985 to 2005. | N/A |
| Name and year of birth | Position held and length of service* | Principal occupations during past five years or longer | Current other public company or investment company directorships |
| Olivia S. Mitchell (Born 1953) | Trustee, since 2006; Nominating and Governance Committee Chair, since 2018 | International Foundation of Employee Benefit Plans Professor since 1993, Wharton School of the University of Pennsylvania. Director of Wharton’s Pension Research Council and Boettner Center on Pensions & Retirement Research, and Research Associate at the National Bureau of Economic Research. Previously taught at Cornell University from 1978 to 1993. | N/A |
| Timothy J. Penny (Born 1951) | Trustee, since 1996; Chair, since 2018 | President and Chief Executive Officer of Southern Minnesota Initiative Foundation, a non-profit organization, since 2007. Member of the Board of Trustees of NorthStar Education Finance, Inc., a non-profit organization, since 2007. | N/A |
| James G. Polisson (Born 1959) | Trustee, since 2018 | Retired. Chief Marketing Officer, Source (ETF) UK Services, Ltd, from 2015 to 2017. From 2012 to 2015, Principal of The Polisson Group, LLC, a management consulting, corporate advisory and principal investing company. Chief Executive Officer and Managing Director at Russell Investments, Global Exchange Traded Funds from 2010 to 2012. Managing Director of Barclays Global Investors from 1998 to 2010 and Global Chief Marketing Officer for iShares and Barclays Global Investors from 2000 to 2010. Trustee of the San Francisco Mechanics’ Institute, a non-profit organization, from 2013 to 2015. Board member of the Russell Exchange Traded Fund Trust from 2011 to 2012. Director of Barclays Global Investors Holdings Deutschland GmbH from 2006 to 2009. Mr. Polisson is an attorney and has a retired status with the Massachusetts and District of Columbia Bar Associations. | N/A |
| Pamela Wheelock (Born 1959) | Trustee, since January 2020; previously Trustee from January 2018 to July 2019 | Board member of the Destination Medical Center Economic Development Agency, Rochester, Minnesota since 2019. Interim President of the McKnight Foundation from January to September 2020. McKnight Foundation Consultant, November 2020 to February 2021. Acting Commissioner, Minnesota Department of Human Services, July 2019 through September 2019. Consultant (part-time), Minnesota Department of Human Services, October 2019 through December 2019. Chief Operating Officer, Twin Cities Habitat for Humanity from 2017 to 2019. Vice President of University Services, University of Minnesota from 2012 to 2016. Prior thereto, on the Board of Directors, Governance Committee and Finance Committee for the Minnesota Philanthropy Partners (Saint Paul Foundation) from 2012 to 2018, Interim Chief Executive Officer of Blue Cross Blue Shield of Minnesota from 2011 to 2012, Chairman of the Board from 2009 to 2012 and Board Director from 2003 to 2015. Vice President, Leadership and Community Engagement, Bush Foundation, Saint Paul, Minnesota (a private foundation) from 2009 to 2011. Executive Vice President and Chief Financial Officer, Minnesota Sports and Entertainment from 2004 to 2009 and Senior Vice President from 2002 to 2004. Executive Vice President of the Minnesota Wild Foundation from 2004 to 2008. Commissioner of Finance, State of Minnesota, from 1999 to 2002. Currently Board Chair of the Minnesota Wild Foundation since 2010. | N/A |
| Name and year of birth | Position held and length of service | Principal occupations during past five years or longer |
| Andrew Owen (Born 1960) | President, since 2017 | President, Chief Executive Officer and Director of Allspring Funds Management, LLC since 2017 and co-president of Galliard Capital Management, LLC, an affiliate of Allspring Funds Management, LLC, since 2019. Prior thereto, Head of Affiliated Managers, Allspring Global Investments, from 2014 to 2019 and Executive Vice President responsible for marketing, investments and product development for Allspring Funds Management, LLC, from 2009 to 2014. In addition, Mr. Owen was an Executive Vice President of Wells Fargo & Company from 2014 to 2021. |
| Jeremy DePalma (Born 1974) | Treasurer, since 2012 (for certain funds in the Fund Complex); since 2021 (for the remaining funds in the Fund Complex) | Senior Vice President of Allspring Funds Management, LLC since 2009. Senior Vice President of Evergreen Investment Management Company, LLC from 2008 to 2010 and head of the Fund Reporting and Control Team within Fund Administration from 2005 to 2010. |
| Kate McKinley (Born 1977) | Chief Legal Officer, since 2021 | Chief Legal Officer of Allspring Global Investments since 2021. Prior thereto, held various roles at State Street Global Advisors beginning in 2010, including serving as Senior Vice President and General Counsel from 2019 to 2021, and Chief Operating Officer of the Institutional Client Group from 2016 - 2019. Prior to working at State Street Global Advisors served as Assistant General Counsel for Bank of America Corporation from 2005 to 2010 and as an Associate at WilmerHale from 2002 to 2005. |
| Christopher Baker (Born 1976) | Chief Compliance Officer, since 2022 | Global Chief Compliance Officer for Allspring Global Investments since 2022. Prior thereto, Chief Compliance Officer for State Street Global Advisors from 2018 to 2021. Senior Compliance Officer for the State Street divisions of Alternative Investment Solutions, Sector Solutions, and Global Marketing from 2015 to 2018. From 2010 to 2015 Vice President, Global Head of Investment and Marketing Compliance for State Street Global Advisors. |
| Matthew Prasse (Born 1983) | Secretary, since 2021 | Senior Counsel of the Allspring Legal Department since 2021. Senior Counsel of the Wells Fargo Legal Department from 2018 to 2021. Previously, Counsel for Barings LLC from 2015 to 2018. Prior to joining Barings, Associate at Morgan, Lewis & Bockius LLP from 2008 to 2015. |
P.O. Box 219967
Kansas City, MO 64121-9967

1-800-222-8222 or visit the Fund's website at allspringglobal.com. Read the prospectus carefully before you invest or send money.
A252/AR252 06-22

| 2 | |
| 6 | |
| 11 | |
| 12 | |
| Financial statements | |
| 65 | |
| 66 | |
| 67 | |
| 68 | |
| 73 | |
| 79 | |
| 80 |

| 1 | The S&P 500 Index consists of 500 stocks chosen for market size, liquidity, and industry group representation. It is a market-value-weighted index with each stock's weight in the index proportionate to its market value. You cannot invest directly in an index. |
| 2 | The Morgan Stanley Capital International (MSCI) All Country World Index (ACWI) ex USA Index (Net) is a free-float-adjusted market-capitalization-weighted index that is designed to measure the equity market performance of developed and emerging markets, excluding the U.S. Source: MSCI. MSCI makes no express or implied warranties or representations and shall have no liability whatsoever with respect to any MSCI data contained herein. The MSCI data may not be further redistributed or used as a basis for other indexes or any securities or financial products. This report is not approved, reviewed, or produced by MSCI. You cannot invest directly in an index. |
| 3 | The MSCI Emerging Markets (EM) Index (Net) (USD) is a free-float-adjusted market-capitalization-weighted index that is designed to measure equity market performance of emerging markets. You cannot invest directly in an index. |
| 4 | The Bloomberg U.S. Aggregate Bond Index is a broad-based benchmark that measures the investment-grade, U.S.-dollar-denominated, fixed-rate taxable bond market, including Treasuries, government-related and corporate securities, mortgage-backed securities (agency fixed-rate and hybrid adjustable-rate mortgage pass-throughs), asset-backed securities, and commercial mortgage-backed securities. You cannot invest directly in an index. |
| 5 | The Bloomberg Global Aggregate ex-USD Index (unhedged) is an unmanaged index that provides a broad-based measure of the global investment-grade fixed-income markets excluding the U.S.-dollar-denominated debt market. You cannot invest directly in an index. |
| 6 | The Bloomberg Municipal Bond Index is an unmanaged index composed of long-term tax-exempt bonds with a minimum credit rating of Baa. You cannot invest directly in an index. |
| 7 | The ICE BofA U.S. High Yield Index is a market-capitalization-weighted index of domestic and Yankee high-yield bonds. The index tracks the performance of high-yield securities traded in the U.S. bond market. You cannot invest directly in an index. Copyright 2022. ICE Data Indices, LLC. All rights reserved. |
| 1 | The Consumer Price Index (CPI) is a measure of the average change over time in the prices paid by urban consumers for a market basket of consumer goods and services. You cannot invest directly in an index. |
| 2 | The MSCI ACWI (Net) is a free-float-adjusted market-capitalization-weighted index that is designed to measure the equity market performance of developed and emerging markets. You cannot invest directly in an index. |

President
Allspring Funds
| Investment objective | The Fund seeks current income exempt from federal income tax. |
| Manager | Allspring Funds Management, LLC |
| Subadviser | Allspring Global Investments, LLC |
| Portfolio managers | Terry J. Goode, Robert J. Miller, Nicholos Venditti |
| Average annual total returns (%) as of June 30, 2022 | |||||||||||
| Including sales charge | Excluding sales charge | Expense ratios1 (%) | |||||||||
| Inception date | 1 year | 5 year | 10 year | 1 year | 5 year | 10 year | Gross | Net 2 | |||
| Class A (WMFAX) | 4-8-2005 | -12.59 | 0.60 | 2.23 | -8.47 | 1.53 | 2.70 | 0.77 | 0.75 | ||
| Class C (WMFCX) | 4-8-2005 | -10.16 | 0.79 | 2.10 | -9.16 | 0.79 | 2.10 | 1.52 | 1.50 | ||
| Class R6 (WMBRX)3 | 7-31-2018 | – | – | – | -8.14 | 1.89 | 3.02 | 0.39 | 0.39 | ||
| Administrator Class (WMFDX) | 4-8-2005 | – | – | – | -8.42 | 1.68 | 2.85 | 0.71 | 0.60 | ||
| Institutional Class (WMBIX) | 3-31-2008 | – | – | – | -8.19 | 1.85 | 3.00 | 0.44 | 0.44 | ||
| Bloomberg Municipal Bond Index4 | – | – | – | – | -8.57 | 1.51 | 2.38 | – | – | ||
| 1 | Reflects the expense ratios as stated in the most recent prospectuses. The expense ratios shown are subject to change and may differ from the annualized expense ratios shown in the financial highlights of this report. |
| 2 | The manager has contractually committed through October 31, 2022, to waive fees and/or reimburse expenses to the extent necessary to cap total annual fund operating expenses after fee waivers at 0.75% for Class A, 1.50% for Class C, 0.40% for Class R6, 0.60% for Administrator Class, and 0.45% for Institutional Class. Brokerage commissions, stamp duty fees, interest, taxes, acquired fund fees and expenses (if any), and extraordinary expenses are excluded from the expense caps. Prior to or after the commitment expiration date, the caps may be increased or the commitment to maintain the caps may be terminated only with the approval of the Board of Trustees. Without these caps, the Fund’s returns would have been lower. The expense ratio paid by an investor is the net expense ratio (the total annual fund operating expenses after fee waivers) as stated in the prospectuses. |
| 3 | Historical performance shown for the Class R6 shares prior to their inception reflects the performance of the Institutional Class shares, and includes the higher expenses applicable to the Institutional Class shares. If these expenses had not been included, returns for the Class R6 shares would be higher. |
| 4 | The Bloomberg Municipal Bond Index is an unmanaged index composed of long-term tax-exempt bonds with a minimum credit rating of Baa. You cannot invest directly in an index. |

| 1 | The chart compares the performance of Class A shares for the most recent ten years with the Bloomberg Municipal Bond Index. The chart assumes a hypothetical investment of $10,000 in Class A shares and reflects all operating expenses and assumes the maximum initial sales charge of 4.50%. |
| ■ | The Fund (Class A, excluding sales charges) outperformed its benchmark, the Bloomberg Municipal Bond Index, for the 12-month period that ended June 30, 2022. Duration and sector positioning contributed to performance while yield curve and credit lagged. |
| ■ | We tactically moved duration at the beginning of the period from neutral to the benchmark to short. The market sold off during the period, so our short duration was positive. |
| ■ | Sector allocation was modestly positive with underweights to local general obligation (GO) bonds and housing, hospital, and lease-backed bonds being positive and security selection within sectors offsetting overweights to transportation, education, and special tax bonds, which underperformed the overall market. |
| ■ | Curve positioning was a modest detractor as we were underweight the shorter end of the yield curve and overweight the longer intermediate part of the curve. Shorter-dated bonds outperformed. |
| ■ | Our overweight to lower-investment-grade bonds (A-rated and BBB-rated) detracted as higher-quality bonds (AA-rated and AAA-rated) led the market. |
| Credit quality as of June 30, 20221 |
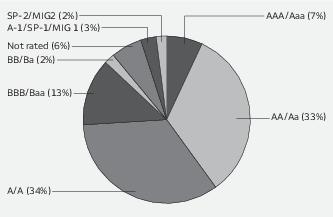
| 1 | The credit quality distribution of portfolio holdings reflected in the chart is based on ratings from Standard & Poor’s, Moody’s Investors Service, and/or Fitch Ratings Ltd. Credit quality ratings apply to the underlying holdings of the Fund and not to the Fund itself. The percentages of the portfolio with the ratings depicted in the chart are calculated based on the market value of fixed income securities held by the Fund. If a security was rated by all three rating agencies, the middle rating was utilized. If rated by two of the three rating agencies, the lower rating was utilized, and if rated by one of the rating agencies, that rating was utilized. Standard & Poor’s rates the creditworthiness of bonds, ranging from AAA (highest) to D (lowest). Ratings from A to CCC may be modified by the addition of a plus (+) or minus (-) sign to show relative standing within the rating categories. Standard & Poor’s rates the creditworthiness of short-term notes from SP-1 (highest) to SP-3 (lowest). Moody’s rates the creditworthiness of bonds, ranging from Aaa (highest) to C (lowest). Ratings Aa to B may be modified by the addition of a number 1 (highest) to 3 (lowest) to show relative standing within the ratings categories. Moody’s rates the creditworthiness of short-term U.S. tax-exempt municipal securities from MIG 1/VMIG 1 (highest) to SG (lowest). Fitch rates the creditworthiness of bonds, ranging from AAA (highest) to D (lowest). Credit quality distribution is subject to change and may have changed since the date specified. |
| * | The Thomson Reuters Municipal Market Data (MMD) AAA Curve is a proprietary yield curve that provides the offer-side of AAA-rated state general obligation bonds, as determined by the MMD analyst team. |
| Effective maturity distribution as of June 30, 20221 |

| 1 | Figures represent the percentage of the Fund's long-term investments. These amounts are subject to change and may have changed since the date specified. |
| Beginning account value 1-1-2022 | Ending account value 6-30-2022 | Expenses paid during the period1 | Annualized net expense ratio | |
| Class A | ||||
| Actual | $1,000.00 | $ 911.56 | $3.51 | 0.74% |
| Hypothetical (5% return before expenses) | $1,000.00 | $1,021.12 | $3.71 | 0.74% |
| Class C | ||||
| Actual | $1,000.00 | $ 908.13 | $7.10 | 1.50% |
| Hypothetical (5% return before expenses) | $1,000.00 | $1,017.36 | $7.50 | 1.50% |
| Class R6 | ||||
| Actual | $1,000.00 | $ 913.19 | $1.85 | 0.39% |
| Hypothetical (5% return before expenses) | $1,000.00 | $1,022.86 | $1.96 | 0.39% |
| Administrator Class | ||||
| Actual | $1,000.00 | $ 912.22 | $2.84 | 0.60% |
| Hypothetical (5% return before expenses) | $1,000.00 | $1,021.82 | $3.01 | 0.60% |
| Institutional Class | ||||
| Actual | $1,000.00 | $ 912.96 | $2.09 | 0.44% |
| Hypothetical (5% return before expenses) | $1,000.00 | $1,022.61 | $2.21 | 0.44% |
| Principal | Value | ||||
| Closed end municipal bond fund obligations: 0.51% | |||||
| California: 0.32% | |||||
| Nuveen California AMT-Free Quality Municipal Income Fund MuniFund Preferred Shares Series A (170 shares) 1.41% 144Aø | $17,000,000 | $ 17,000,000 | |||
| Other: 0.19% | |||||
| Nuveen AMT-Free Municipal Credit Income Fund Preferred Shares Series C (100 shares) 1.41% 144Aø | 10,000,000 | 10,000,000 | |||
| Total Closed end municipal bond fund obligations (Cost $27,000,000) | 27,000,000 |
| Interest rate | Maturity date | ||||
| Municipal obligations: 99.45% | |||||
| Alabama: 1.96% | |||||
| Airport revenue: 0.09% | |||||
| Birmingham AL Airport Authority Revenue (BAM Insured) | 4.00% | 7-1-2036 | 500,000 | 500,901 | |
| Birmingham AL Airport Authority Revenue (BAM Insured) | 4.00 | 7-1-2037 | 500,000 | 500,457 | |
| Birmingham AL Airport Authority Revenue (BAM Insured) | 4.00 | 7-1-2038 | 400,000 | 399,035 | |
| Birmingham AL Airport Authority Revenue (BAM Insured) | 5.00 | 7-1-2028 | 700,000 | 781,931 | |
| Birmingham AL Airport Authority Revenue (BAM Insured) | 5.00 | 7-1-2029 | 750,000 | 845,085 | |
| Birmingham AL Airport Authority Revenue (BAM Insured) | 5.00 | 7-1-2030 | 500,000 | 567,309 | |
| Birmingham AL Airport Authority Revenue (BAM Insured) | 5.00 | 7-1-2032 | 600,000 | 668,458 | |
| Birmingham AL Airport Authority Revenue (BAM Insured) | 5.00 | 7-1-2033 | 650,000 | 718,165 | |
| 4,981,341 | |||||
| GO revenue: 0.07% | |||||
| Birmingham AL CAB Series A1 | 5.00 | 3-1-2045 | 3,160,000 | 3,435,548 | |
| Health revenue: 0.04% | |||||
| UAB Medicine Finance Authority Series B | 5.00 | 9-1-2034 | 1,000,000 | 1,090,653 | |
| UAB Medicine Finance Authority Series B | 5.00 | 9-1-2035 | 1,000,000 | 1,085,433 | |
| 2,176,086 | |||||
| Tax revenue: 0.50% | |||||
| Alabama Federal Aid Highway Finance Authority Series A | 5.00 | 9-1-2035 | 24,000,000 | 26,572,140 | |
| Utilities revenue: 1.15% | |||||
| Black Belt Energy Gas District Gas Supply Revenue Bonds Series 2021A (Royal Bank of Canada LIQ) | 4.00 | 6-1-2051 | 5,500,000 | 5,577,450 | |
| Lower Alabama Gas Supply District Project #2 | 4.00 | 12-1-2050 | 20,590,000 | 20,894,061 | |
| Southeast Alabama Energy Authority Commodity Supply Project #2 Series B | 4.00 | 12-1-2051 | 3,000,000 | 2,986,703 | |
| Southeast Alabama Gas Supply District Project #2 Series 2018A | 4.00 | 6-1-2049 | 28,850,000 | 29,132,892 | |
| Southeast Energy Authority Alabama Project #1 Series A | 4.00 | 11-1-2051 | 2,465,000 | 2,480,215 | |
| 61,071,321 | |||||
| Water & sewer revenue: 0.11% | |||||
| Jefferson County AL CAB Series B (AGM Insured) ¤ | 0.00 | 10-1-2025 | 710,000 | 645,727 |
| Interest rate | Maturity date | Principal | Value | ||
| Water & sewer revenue (continued) | |||||
| Jefferson County AL CAB Series B (AGM Insured) ¤ | 0.00% | 10-1-2026 | $ 3,000,000 | $ 2,561,503 | |
| Jefferson County AL CAB Series B (AGM Insured) ¤ | 0.00 | 10-1-2029 | 4,115,000 | 2,886,289 | |
| 6,093,519 | |||||
| 104,329,955 | |||||
| Alaska: 0.04% | |||||
| Health revenue: 0.04% | |||||
| Alaska IDA Tanana Chiefs Conference Project | 5.00 | 10-1-2033 | 1,930,000 | 2,069,816 | |
| Arizona: 1.37% | |||||
| Education revenue: 0.38% | |||||
| Arizona Board of Regents University of Arizona Series C | 5.00 | 8-1-2027 | 1,000,000 | 1,114,413 | |
| Arizona Board of Regents University of Arizona Series C | 5.00 | 8-1-2029 | 1,005,000 | 1,145,628 | |
| Arizona IDA Kipp NYC Public Charter School Project | 4.00 | 7-1-2061 | 1,500,000 | 1,176,003 | |
| Arizona IDA Kipp NYC Public Charter School Project | 4.00 | 7-1-2061 | 3,000,000 | 2,352,006 | |
| La Paz County AZ IDA Educational Facility Imagine Schools West Middle Project Series A 144A | 5.75 | 6-15-2038 | 1,085,000 | 1,073,805 | |
| La Paz County AZ IDA Educational Facility Imagine Schools West Middle Project Series A 144A | 5.88 | 6-15-2048 | 2,435,000 | 2,339,494 | |
| Phoenix AZ IDA Legacy Traditional Schools Project Series A 144A | 6.50 | 7-1-2034 | 2,000,000 | 2,109,171 | |
| Pima County AZ IDA American Leadership Project 144A | 4.00 | 6-15-2029 | 2,905,000 | 2,790,624 | |
| Pima County AZ IDA American Leadership Project 144A | 4.00 | 6-15-2041 | 3,195,000 | 2,718,524 | |
| Pima County AZ IDA Noah Webster Schools-Pima Project | 7.00 | 12-15-2043 | 3,225,000 | 3,343,285 | |
| 20,162,953 | |||||
| GO revenue: 0.07% | |||||
| Maricopa County AZ Special Health Care District Series D | 4.00 | 7-1-2035 | 3,500,000 | 3,626,156 | |
| Health revenue: 0.10% | |||||
| Arizona Health Facilities Authority Revenue Bond Banner Health Series A | 5.00 | 1-1-2044 | 5,000,000 | 5,228,884 | |
| Industrial development revenue: 0.08% | |||||
| Maricopa County AZ IDA Revenue Bonds Commercial Metals Company Project Series 2022 144A | 4.00 | 10-15-2047 | 4,000,000 | 3,398,749 | |
| Maricopa County AZ PCR Refunding Bonds Series A | 2.40 | 6-1-2035 | 1,000,000 | 775,505 | |
| 4,174,254 | |||||
| Miscellaneous revenue: 0.71% | |||||
| Navajo Nation AZ Refunding Bond Series A 144A | 5.50 | 12-1-2030 | 7,275,000 | 7,604,779 | |
| Phoenix AZ Civic Improvement Corporation Junior Lien Refunding Bond | 5.00 | 7-1-2034 | 8,805,000 | 9,531,856 | |
| Phoenix AZ Civic Improvement Corporation Junior Lien Refunding Bond Series 2019B | 5.00 | 7-1-2044 | 5,570,000 | 5,820,755 | |
| Phoenix AZ Civic Improvement Corporation Series A | 5.00 | 7-1-2034 | 13,875,000 | 14,785,805 | |
| 37,743,195 |
| Interest rate | Maturity date | Principal | Value | ||
| Water & sewer revenue: 0.03% | |||||
| Mesa AZ Utility System Revenue | 4.00% | 7-1-2042 | $ 1,000,000 | $ 981,338 | |
| Mesa AZ Utility System Revenue | 4.00 | 7-1-2043 | 1,000,000 | 976,121 | |
| 1,957,459 | |||||
| 72,892,901 | |||||
| Arkansas: 0.05% | |||||
| Miscellaneous revenue: 0.05% | |||||
| Arkansas Development Finance Authority Arkansas Division of Emergency Management | 4.00 | 6-1-2038 | 1,170,000 | 1,185,271 | |
| Arkansas Development Finance Authority Arkansas Division of Emergency Management | 4.00 | 6-1-2039 | 1,000,000 | 1,009,254 | |
| Arkansas Development Finance Authority Arkansas Division of Emergency Management | 4.00 | 6-1-2040 | 500,000 | 503,395 | |
| 2,697,920 | |||||
| California: 6.39% | |||||
| Airport revenue: 1.26% | |||||
| Los Angeles CA Department of Airports AMT Subordinate Revenue Bond | 5.00 | 5-15-2034 | 1,750,000 | 1,834,671 | |
| Los Angeles CA Department of Airports Subordinate Revenue Bonds | 5.00 | 5-15-2034 | 1,465,000 | 1,568,922 | |
| Los Angeles CA Department of Airports Subordinate Revenue Bonds Series A | 5.00 | 5-15-2046 | 7,000,000 | 7,439,566 | |
| Los Angeles CA Department of Airports Subordinate Revenue Bonds Series A | 5.25 | 5-15-2048 | 15,000,000 | 15,833,309 | |
| Port of Oakland CA Refunding Bonds Series H | 5.00 | 5-1-2026 | 2,500,000 | 2,702,653 | |
| Port of Oakland CA Refunding Bonds Series H | 5.00 | 5-1-2029 | 1,875,000 | 2,067,898 | |
| San Francisco CA City & County Airport Commission San Francisco International Airport Series 2022A | 4.00 | 5-1-2052 | 1,500,000 | 1,377,623 | |
| San Francisco CA City & County Airport Commission San Francisco International Airport Series B | 5.00 | 5-1-2046 | 30,000,000 | 30,949,566 | |
| San Francisco CA City & County Airport Commission San Francisco International Airport Series B | 5.00 | 5-1-2052 | 3,000,000 | 3,144,728 | |
| 66,918,936 | |||||
| Education revenue: 0.16% | |||||
| California Municipal Finance Authority Charter School Albert Einstein Academies Project Series A | 7.13 | 8-1-2043 | 2,230,000 | 2,355,325 | |
| California School Finance Authority Charter School Revenue Bonds Series A 144A | 5.00 | 8-1-2042 | 1,000,000 | 1,038,755 | |
| University of California Series K | 4.00 | 5-15-2046 | 5,075,000 | 4,963,733 | |
| 8,357,813 | |||||
| GO revenue: 0.91% | |||||
| Alhambra CA Unified School District CAB Election of 2008 Series B (AGM Insured) ¤ | 0.00 | 8-1-2031 | 2,175,000 | 1,579,191 | |
| Alhambra CA Unified School District CAB Election of 2008 Series B (AGC Insured) ¤ | 0.00 | 8-1-2031 | 7,500,000 | 5,445,485 | |
| Alhambra CA Unified School District CAB Election of 2008 Series B (AGM Insured) ¤ | 0.00 | 8-1-2032 | 3,795,000 | 2,637,772 | |
| Alhambra CA Unified School District CAB Election of 2008 Series B (AGM Insured) ¤ | 0.00 | 8-1-2034 | 5,000,000 | 3,177,474 |
| Interest rate | Maturity date | Principal | Value | ||
| GO revenue (continued) | |||||
| Alhambra CA Unified School District CAB Election of 2008 Series B (AGM Insured) ¤ | 0.00% | 8-1-2035 | $ 6,700,000 | $ 4,069,559 | |
| California Series A (State Street Bank & Trust Company LOC) ø | 0.78 | 5-1-2048 | 3,000,000 | 3,000,000 | |
| Colton CA Unified School District CAB Series B (AGM Insured) ¤ | 0.00 | 8-1-2031 | 1,000,000 | 726,712 | |
| Colton CA Unified School District CAB Series B (AGM Insured) ¤ | 0.00 | 8-1-2032 | 1,000,000 | 694,378 | |
| Colton CA Unified School District CAB Series B (AGM Insured) ¤ | 0.00 | 8-1-2033 | 1,000,000 | 662,204 | |
| Compton CA Community College District CAB Election of 2002 Series C ¤ | 0.00 | 8-1-2032 | 2,515,000 | 1,705,415 | |
| Compton CA Community College District CAB Election of 2002 Series C ¤ | 0.00 | 8-1-2033 | 2,000,000 | 1,293,133 | |
| El Monte CA Union High School District CAB Election of 2008 (AGM Insured) ¤ | 0.00 | 6-1-2030 | 2,000,000 | 1,518,031 | |
| El Monte CA Union High School District CAB Election of 2008 (AGM Insured) ¤ | 0.00 | 6-1-2031 | 2,000,000 | 1,450,543 | |
| El Monte CA Union High School District CAB Election of 2008 (AGM Insured) ¤ | 0.00 | 6-1-2032 | 1,660,000 | 1,149,441 | |
| El Monte CA Union High School District CAB Election of 2008 (AGM Insured) ¤ | 0.00 | 6-1-2033 | 1,230,000 | 811,492 | |
| Los Angeles CA Unified School District Series R | 4.00 | 7-1-2044 | 11,000,000 | 10,859,432 | |
| Ontario Montclair CA School District CAB (AGC Insured) ¤ | 0.00 | 8-1-2028 | 1,500,000 | 1,228,397 | |
| Ontario Montclair CA School District CAB (AGC Insured) ¤ | 0.00 | 8-1-2030 | 2,000,000 | 1,500,504 | |
| San Diego CA Unified School District CAB Series C ¤ | 0.00 | 7-1-2031 | 2,000,000 | 1,428,966 | |
| San Diego CA Unified School District CAB Series C ¤ | 0.00 | 7-1-2033 | 1,000,000 | 648,189 | |
| San Diego CA Unified School District CAB Series C ¤ | 0.00 | 7-1-2034 | 2,000,000 | 1,234,048 | |
| Wiseburn CA School District CAB Election of 2010 Series B (AGM Insured) ¤ | 0.00 | 8-1-2034 | 2,530,000 | 1,566,656 | |
| 48,387,022 | |||||
| Health revenue: 0.98% | |||||
| California CDA Health Facilities Catholic Series E (AGM Insured) € | 1.39 | 7-1-2040 | 21,550,000 | 21,550,000 | |
| California HFFA Stanford Health Care Series A | 4.00 | 8-15-2050 | 13,450,000 | 12,847,568 | |
| California PFA Enso Village Project Series B-3 144A | 2.13 | 11-15-2027 | 4,000,000 | 3,716,446 | |
| University of California Regents University Medical Center Pooled Revenue Bonds 2016 Series L | 4.00 | 5-15-2037 | 10,025,000 | 10,050,787 | |
| University of California Regents University Medical Center Pooled Revenue Bonds 2016 Series L | 5.00 | 5-15-2047 | 3,885,000 | 4,075,178 | |
| 52,239,979 | |||||
| Housing revenue: 0.57% | |||||
| California CDA MFHR Refunding Bonds 2021 Series A (Landesbank Hessen-Thüringen LOC) ø | 1.04 | 3-1-2057 | 20,730,000 | 20,730,000 | |
| California CDA Uptown Newport Apartments Series 2017 AA & BB (East West Bank LOC) ø | 0.95 | 3-1-2057 | 4,500,000 | 4,500,000 | |
| California Community Housing Agency Essential Housing Revenue Serenity at Larkspur Series C 144A | 5.00 | 2-1-2050 | 1,000,000 | 914,874 | |
| California HFA Municipal Certificate of Participation Series 2 Class A | 4.00 | 3-20-2033 | 3,122,590 | 3,086,839 | |
| California Statewide CDA Community Improvement Authority Bond Mezzanine Pasadena Portfolio 144A | 4.00 | 12-1-2056 | 1,500,000 | 1,128,121 | |
| 30,359,834 |
| Interest rate | Maturity date | Principal | Value | ||
| Miscellaneous revenue: 0.75% | |||||
| Anaheim CA PFA Convention Center Expansion Project Series A | 5.00% | 5-1-2046 | $ 8,500,000 | $ 8,954,984 | |
| California Public Works Board Judicial Council Project Series A | 5.00 | 3-1-2031 | 3,260,000 | 3,317,994 | |
| Mesa CA Water District Certificate of Participation | 4.00 | 3-15-2039 | 500,000 | 500,687 | |
| Mesa CA Water District Certificate of Participation | 4.00 | 3-15-2040 | 500,000 | 499,409 | |
| Mesa CA Water District Certificate of Participation | 4.00 | 3-15-2045 | 1,200,000 | 1,191,319 | |
| Ontario Public Financing Authority Series A (AGM Insured) | 5.00 | 11-1-2047 | 2,750,000 | 3,012,574 | |
| Pasadena CA PFA CAB Rose Bowl Series A ¤ | 0.00 | 3-1-2027 | 2,095,000 | 1,810,432 | |
| Pasadena CA PFA CAB Rose Bowl Series A ¤ | 0.00 | 3-1-2028 | 4,450,000 | 3,695,526 | |
| Pasadena CA PFA CAB Rose Bowl Series A ¤ | 0.00 | 3-1-2029 | 4,520,000 | 3,600,182 | |
| Pasadena CA PFA CAB Rose Bowl Series A ¤ | 0.00 | 3-1-2031 | 2,185,000 | 1,591,939 | |
| Pasadena CA PFA CAB Rose Bowl Series A ¤ | 0.00 | 3-1-2032 | 2,000,000 | 1,394,279 | |
| Pasadena CA PFA CAB Rose Bowl Series A ¤ | 0.00 | 3-1-2033 | 4,295,000 | 2,858,914 | |
| Tender Option Bond Trust Receipts/Floater Certificates Series 2021-XG0318 (Deutsche Bank LIQ) 144Aø | 1.04 | 6-15-2055 | 7,500,000 | 7,500,000 | |
| 39,928,239 | |||||
| Resource recovery revenue: 0.64% | |||||
| California PCFA Series 2017 A-1 144A | 2.00 | 11-1-2042 | 14,000,000 | 13,999,776 | |
| California PCFA Series A 144A | 2.00 | 8-1-2023 | 20,000,000 | 19,997,838 | |
| 33,997,614 | |||||
| Tax revenue: 0.02% | |||||
| San Diego County CA Regional Transportation Commission Limited Tax Series A | 5.00 | 4-1-2048 | 915,000 | 976,196 | |
| Tobacco revenue: 0.03% | |||||
| California County CA Tobacco Securitization Agency | 4.00 | 6-1-2039 | 500,000 | 480,132 | |
| California County CA Tobacco Securitization Agency | 4.00 | 6-1-2040 | 300,000 | 286,414 | |
| California County CA Tobacco Securitization Agency | 4.00 | 6-1-2049 | 1,200,000 | 1,036,248 | |
| 1,802,794 | |||||
| Transportation revenue: 0.59% | |||||
| Bay Area CA Toll Authority Toll Bridge Series A (SIFMA Municipal Swap +1.25%) ± | 2.23 | 4-1-2036 | 23,545,000 | 23,721,465 | |
| Foothill-Eastern Transportation Corridor Agency Junior Lien Road Revenue Series 2021C | 4.00 | 1-15-2043 | 8,500,000 | 7,857,078 | |
| 31,578,543 | |||||
| Utilities revenue: 0.48% | |||||
| California Community Choice Financing Authority Clean Energy Project Green Bond Series B-1 | 4.00 | 2-1-2052 | 5,000,000 | 4,996,367 | |
| M-S-R California Energy Authority Gas Series B | 6.13 | 11-1-2029 | 15,070,000 | 16,816,161 | |
| Vernon CA Electric System Revenue Series A | 5.00 | 8-1-2039 | 450,000 | 478,227 | |
| Vernon CA Electric System Revenue Series A | 5.00 | 8-1-2040 | 375,000 | 397,239 | |
| Vernon CA Electric System Revenue Series A | 5.00 | 8-1-2041 | 420,000 | 443,631 | |
| Victorville CA Electric Revenue Bonds Series 2022A | 5.00 | 5-1-2036 | 1,210,000 | 1,301,388 | |
| Victorville CA Electric Revenue Bonds Series 2022A | 5.00 | 5-1-2037 | 1,005,000 | 1,076,089 | |
| 25,509,102 | |||||
| 340,056,072 |
| Interest rate | Maturity date | Principal | Value | ||
| Colorado: 4.92% | |||||
| Airport revenue: 0.75% | |||||
| Denver CO City & County Airport System Revenue Series 2012A | 5.00% | 12-1-2034 | $12,855,000 | $ 14,287,203 | |
| Denver CO City & County Airport System Revenue Series 2012A | 5.00 | 12-1-2037 | 3,130,000 | 3,298,624 | |
| Denver CO City & County Airport System Revenue Series 2012B | 5.00 | 12-1-2027 | 10,000,000 | 10,950,993 | |
| Denver CO City & County Airport System Revenue Series 2012B | 5.00 | 11-15-2030 | 2,000,000 | 2,026,125 | |
| Denver CO City & County Airport System Revenue Series 2018A | 5.00 | 12-1-2034 | 9,000,000 | 9,576,572 | |
| 40,139,517 | |||||
| Education revenue: 0.72% | |||||
| Colorado Board of Governors State University Enterprise System Revenue Prerefunded Bond Series 2018 E-1 | 5.00 | 3-1-2040 | 390,000 | 417,858 | |
| Colorado Board of Governors State University Enterprise System Revenue Prerefunded Bond Series 2018 E-1 | 5.00 | 3-1-2040 | 555,000 | 594,644 | |
| Colorado Board of Governors State University Enterprise System Revenue Prerefunded Bonds Series 2013C | 5.25 | 3-1-2033 | 725,000 | 742,045 | |
| Colorado Board of Governors State University Enterprise System Revenue Unrefunded Bond Series 2018 E-1 | 5.00 | 3-1-2040 | 1,055,000 | 1,133,189 | |
| Colorado ECFA Alexander Dawson School LLC Project | 5.00 | 2-15-2040 | 1,000,000 | 1,002,532 | |
| Colorado ECFA Charter School Aspen Ridge School Project Series 2015A 144A | 4.13 | 7-1-2026 | 250,000 | 248,320 | |
| Colorado ECFA Charter School Banning Lewis Ranch Academy Project Series A | 6.00 | 12-15-2037 | 3,110,000 | 3,367,732 | |
| Colorado ECFA Charter School Banning Lewis Ranch Academy Project Series B-2 | 7.00 | 12-15-2046 | 3,940,000 | 4,454,134 | |
| Colorado ECFA Charter School Ben Franklin Academy Project | 5.00 | 7-1-2036 | 750,000 | 780,506 | |
| Colorado ECFA Charter School Community Leadership Academy Second Campus Project | 7.00 | 8-1-2033 | 1,075,000 | 1,108,361 | |
| Colorado ECFA Charter School District Montessori Charter School Project | 5.00 | 7-15-2037 | 1,150,000 | 1,151,277 | |
| Colorado ECFA Charter School New Summit Charter School 144A | 4.00 | 7-1-2051 | 715,000 | 560,449 | |
| Colorado ECFA Charter School Refunding & Improvement Bonds Skyview Academy Project 2014 144A | 4.13 | 7-1-2024 | 110,000 | 110,037 | |
| Colorado ECFA Charter School Refunding & Improvement Bonds University Laboratory School Project 2015 | 5.00 | 12-15-2028 | 600,000 | 624,018 | |
| Colorado ECFA Charter School Rocky Mountain Classical Academy Project Series A | 7.50 | 9-1-2033 | 5,015,000 | 5,330,519 | |
| Colorado ECFA Charter School Rocky Mountain Classical Academy Project Series A | 8.00 | 9-1-2043 | 5,930,000 | 6,333,241 | |
| Colorado ECFA Charter School Rocky Mountain Classical Academy Project Series A | 8.13 | 9-1-2048 | 3,795,000 | 4,058,450 | |
| Colorado ECFA Charter School Twin Peaks Charter Academy | 6.50 | 3-15-2043 | 1,290,000 | 1,291,913 | |
| Colorado ECFA Refunding Bonds The University Corporation for Atmosphere Research Project Series B | 5.00 | 9-1-2030 | 1,770,000 | 1,780,205 |
| Interest rate | Maturity date | Principal | Value | ||
| Education revenue (continued) | |||||
| Colorado ECFA School Refunding & Improvement Bonds | 5.00% | 3-15-2035 | $ 2,000,000 | $ 2,190,889 | |
| Colorado ECFA Union Colony School Project Revenue Bond Series 2018 | 5.00 | 4-1-2048 | 715,000 | 753,144 | |
| 38,033,463 | |||||
| GO revenue: 0.18% | |||||
| Aurora CO Cornerstar Metropolitan District Refunding Bond Series A | 5.25 | 12-1-2047 | 1,000,000 | 950,083 | |
| Aurora CO Park 70 Metropolitan District | 5.00 | 12-1-2046 | 1,000,000 | 1,028,377 | |
| Broadway Station Metropolitan District #3 Series A | 5.00 | 12-1-2049 | 1,250,000 | 1,173,748 | |
| Colorado International Center Metropolitan District #3 Refunding Bonds | 4.63 | 12-1-2031 | 559,000 | 533,657 | |
| Thompson Crossing Metropolitan District #4 Refunding & Improvement Bonds | 5.00 | 12-1-2049 | 2,125,000 | 1,975,379 | |
| Weld County CO Eaton Area Park & Recreation District Series 2015 | 5.50 | 12-1-2038 | 1,075,000 | 1,092,587 | |
| Wheatlands CO Metropolitan District #2 Refunding Bond (BAM Insured) | 5.00 | 12-1-2030 | 650,000 | 703,723 | |
| Wiggins CO School District #50 (BAM Insured) | 4.00 | 12-1-2046 | 2,335,000 | 2,315,039 | |
| 9,772,593 | |||||
| Health revenue: 0.24% | |||||
| Aspen Valley Hospital District Refunding Bonds Series 2012 | 5.00 | 10-15-2033 | 600,000 | 601,501 | |
| Colorado Health Facilities Authority CommonSpirit Health Series A2 | 5.00 | 8-1-2044 | 4,000,000 | 4,086,168 | |
| Colorado Health Facilities Authority Evangelical Lutheran Good Samaritan Society Series 2015A | 5.00 | 6-1-2040 | 1,000,000 | 1,076,969 | |
| Colorado Health Facilities Authority Refunding & Improvement Bonds Christian Living Project | 4.00 | 1-1-2042 | 1,000,000 | 818,879 | |
| Colorado Health Facilities Authority Revenue Bonds Hospital Advent Health Obligated Group Series A | 4.00 | 11-15-2043 | 3,500,000 | 3,454,371 | |
| Colorado Health Facilities Authority Revenue Parkview Medical Center Incorporated | 4.00 | 9-1-2045 | 500,000 | 457,596 | |
| Colorado Health Facilities Authority Sisters of Charity Leavenworth Health System Series 2013A | 5.50 | 1-1-2035 | 1,000,000 | 1,037,566 | |
| Colorado Health Facilities Authority Sunny Vista Living Center Series 2015A 144A | 5.00 | 12-1-2025 | 615,000 | 570,668 | |
| Denver CO Health & Hospital Authority Refunding Bonds Series 2017A 144A | 5.00 | 12-1-2034 | 500,000 | 522,072 | |
| 12,625,790 | |||||
| Miscellaneous revenue: 1.32% | |||||
| Colorado Bridge Enterprise Revenue | 4.00 | 12-31-2029 | 2,705,000 | 2,807,400 | |
| Colorado Bridge Enterprise Revenue | 4.00 | 6-30-2030 | 3,115,000 | 3,225,932 | |
| Colorado Bridge Enterprise Revenue | 4.00 | 6-30-2031 | 665,000 | 686,332 | |
| Colorado Certificate of Participation Rural Colorado Series A | 4.00 | 12-15-2038 | 8,150,000 | 8,033,317 | |
| Colorado Certificate of Participation Rural Colorado Series A | 4.00 | 12-15-2039 | 3,250,000 | 3,190,487 | |
| Colorado E-470 Public Highway Authority CAB Series A (NPFGC Insured) ¤ | 0.00 | 9-1-2034 | 4,000,000 | 2,423,989 | |
| Colorado Regional Transportation District Certificate of Participation Series 2014A | 5.00 | 6-1-2044 | 2,000,000 | 2,030,227 | |
| Colton CA Unified School District CAB Series 2022 | 6.00 | 12-15-2039 | 4,225,000 | 5,184,530 |
| Interest rate | Maturity date | Principal | Value | ||
| Miscellaneous revenue (continued) | |||||
| Colton CA Unified School District CAB Series 2022 | 6.00% | 12-15-2041 | $27,500,000 | $ 33,591,300 | |
| Denver CO School District #1 Certificate of Participation Series B | 5.00 | 12-15-2035 | 1,000,000 | 1,073,819 | |
| Denver CO School District #1 Certificate of Participation Series B | 5.00 | 12-15-2045 | 1,200,000 | 1,276,384 | |
| Longmont CO Certificate of Participation Series 2014 | 5.00 | 12-1-2034 | 1,000,000 | 1,043,605 | |
| Westminster CO Certificate of Participation Series 2015A | 5.00 | 12-1-2035 | 2,000,000 | 2,146,326 | |
| Westminster CO Public Schools Certificate of Participation Series 2019 (AGM Insured) | 5.00 | 12-1-2048 | 3,500,000 | 3,763,309 | |
| 70,476,957 | |||||
| Tax revenue: 1.21% | |||||
| Colorado Park Creek Metropolitan District Refunding Bonds Series A | 5.00 | 12-1-2045 | 500,000 | 528,730 | |
| Colorado Regional Transportation District Certificate of Participation Series P-3 | 4.00 | 7-15-2039 | 800,000 | 722,786 | |
| Colorado Regional Transportation District Certificate of Participation Series P-3 | 5.00 | 1-15-2031 | 500,000 | 527,560 | |
| Colorado Regional Transportation District Certificate of Participation Series P-3 | 5.00 | 7-15-2031 | 500,000 | 526,310 | |
| Colorado Regional Transportation District Fastracks Project Series 2013A | 5.00 | 11-1-2031 | 1,000,000 | 1,011,817 | |
| Colorado Regional Transportation District Fastracks Project Series A | 5.00 | 11-1-2041 | 50,945,000 | 54,992,066 | |
| Commerce City CO Sales and Use Tax Revenue Bond Series 2014 (AGM Insured) | 5.00 | 8-1-2044 | 1,250,000 | 1,323,485 | |
| Denver CO City & County Refunding & Improvement Bonds Series A | 5.00 | 8-1-2044 | 3,000,000 | 3,214,661 | |
| Thornton CO Development Authority East 144th Avenue and I-25 Project Series B | 5.00 | 12-1-2034 | 1,375,000 | 1,444,188 | |
| 64,291,603 | |||||
| Transportation revenue: 0.27% | |||||
| Colorado E-470 Public Highway Authority CAB Series B (NPFGC Insured) ¤ | 0.00 | 9-1-2022 | 4,600,000 | 4,587,124 | |
| Colorado E-470 Public Highway Authority Senior Revenue Bond Series 2020-A | 5.00 | 9-1-2040 | 2,000,000 | 2,087,631 | |
| Colorado E-470 Public Highway Authority Senior Revenue Bonds Series 2020-A | 5.00 | 9-1-2034 | 1,300,000 | 1,456,511 | |
| Colorado E-470 Public Highway Authority Senior Revenue Bonds Series 2020-A | 5.00 | 9-1-2035 | 1,250,000 | 1,397,711 | |
| Colorado E-470 Public Highway Authority Senior Revenue Bonds Series 2020-A | 5.00 | 9-1-2036 | 1,400,000 | 1,562,656 | |
| Colorado High Performance Transportation Enterprise US 36 & I-25 Managed Lanes | 5.75 | 1-1-2044 | 3,360,000 | 3,384,095 | |
| 14,475,728 | |||||
| Utilities revenue: 0.06% | |||||
| Colorado Springs CO Utilities System Improvement Bonds Series 2013 B-2 | 5.00 | 11-15-2038 | 3,000,000 | 3,109,950 | |
| Water & sewer revenue: 0.17% | |||||
| Aurora CO Water Revenue Refunding Bond First Lien | 5.00 | 8-1-2046 | 5,000,000 | 5,537,279 | |
| Central Weld County CO Water District (AGM Insured) | 4.00 | 12-1-2035 | 800,000 | 838,466 | |
| Central Weld County CO Water District (AGM Insured) | 4.00 | 12-1-2037 | 400,000 | 417,812 |
| Interest rate | Maturity date | Principal | Value | ||
| Water & sewer revenue (continued) | |||||
| Central Weld County CO Water District (AGM Insured) | 4.00% | 12-1-2038 | $ 400,000 | $ 405,971 | |
| Central Weld County CO Water District (AGM Insured) | 4.00 | 12-1-2039 | 450,000 | 456,140 | |
| Central Weld County CO Water District (AGM Insured) | 4.00 | 12-1-2040 | 500,000 | 505,722 | |
| East Cherry Creek Valley CO Water and Sanitation District | 5.00 | 11-15-2032 | 750,000 | 807,047 | |
| 8,968,437 | |||||
| 261,894,038 | |||||
| Connecticut: 1.48% | |||||
| Education revenue: 0.31% | |||||
| Connecticut HEFA Trinity College Series R | 4.00 | 6-1-2045 | 2,500,000 | 2,402,355 | |
| Connecticut HEFA Trinity College Series R | 5.00 | 6-1-2037 | 950,000 | 1,028,098 | |
| Connecticut HEFA Trinity College Series R | 5.00 | 6-1-2038 | 1,000,000 | 1,079,790 | |
| Connecticut HEFA Trinity College Series R | 5.00 | 6-1-2039 | 1,600,000 | 1,724,515 | |
| Connecticut HEFA Trinity College Series R | 5.00 | 6-1-2040 | 1,100,000 | 1,183,225 | |
| Connecticut HEFA University of Hartford Series N | 5.00 | 7-1-2031 | 75,000 | 77,658 | |
| Connecticut HEFA University of Hartford Series N | 5.00 | 7-1-2032 | 550,000 | 567,342 | |
| Connecticut HEFA University of Hartford Series N | 5.00 | 7-1-2033 | 605,000 | 622,061 | |
| Connecticut HEFA University of Hartford Series N | 5.00 | 7-1-2034 | 450,000 | 461,509 | |
| Connecticut Higher Education Supplemental Loan Authority AMT | 3.25 | 11-15-2036 | 1,400,000 | 1,223,644 | |
| Connecticut Higher Education Supplemental Loan Authority AMT | 5.00 | 11-15-2027 | 610,000 | 659,914 | |
| Connecticut Higher Education Supplemental Loan Authority AMT | 5.00 | 11-15-2028 | 530,000 | 576,778 | |
| Connecticut Higher Education Supplemental Loan Authority AMT | 5.00 | 11-15-2029 | 535,000 | 585,552 | |
| University of Connecticut Series A | 5.00 | 2-15-2039 | 1,510,000 | 1,650,814 | |
| University of Connecticut Series A | 5.00 | 2-15-2040 | 2,500,000 | 2,726,069 | |
| 16,569,324 | |||||
| GO revenue: 0.25% | |||||
| Bridgeport CT Series A | 4.00 | 6-1-2039 | 1,750,000 | 1,761,949 | |
| Connecticut Series B | 5.00 | 6-1-2041 | 1,250,000 | 1,385,777 | |
| Hartford CT Series A | 5.00 | 4-1-2028 | 3,165,000 | 3,223,059 | |
| Hartford CT Series B | 5.00 | 4-1-2025 | 1,220,000 | 1,245,354 | |
| Hartford CT Series B | 5.00 | 4-1-2026 | 1,470,000 | 1,499,287 | |
| Hartford CT Series B | 5.00 | 4-1-2027 | 1,000,000 | 1,019,285 | |
| New Haven CT Series A (AGM Insured) | 5.00 | 8-1-2039 | 3,000,000 | 3,281,976 | |
| 13,416,687 | |||||
| Health revenue: 0.14% | |||||
| Connecticut HEFA McLean Series A 144A | 5.00 | 1-1-2045 | 1,000,000 | 999,949 | |
| Connecticut HEFA Stamford Hospital Series M | 5.00 | 7-1-2032 | 2,705,000 | 2,977,519 | |
| Connecticut HEFA Stamford Hospital Series M | 5.00 | 7-1-2033 | 3,000,000 | 3,236,126 | |
| 7,213,594 | |||||
| Miscellaneous revenue: 0.09% | |||||
| Connecticut GO 2012 Series E | 5.00 | 9-15-2032 | 4,860,000 | 4,895,031 | |
| Tax revenue: 0.69% | |||||
| Connecticut Special Tax Obligation Revenue Transportation Infrastructure Purpose Series 2014A | 5.00 | 9-1-2028 | 10,105,000 | 10,621,988 |
| Interest rate | Maturity date | Principal | Value | ||
| Tax revenue (continued) | |||||
| Connecticut Special Tax Obligation Revenue Transportation Infrastructure Purpose Series 2018B | 5.00% | 10-1-2036 | $ 5,000,000 | $ 5,445,579 | |
| Connecticut Special Tax Obligation Revenue Transportation Infrastructure Purpose Series 2018B | 5.00 | 10-1-2037 | 7,500,000 | 8,153,081 | |
| Connecticut Special Tax Obligation Revenue Transportation Infrastructure Purpose Series 2020A | 5.00 | 5-1-2040 | 1,700,000 | 1,867,114 | |
| Connecticut Special Tax Obligation Revenue Transportation Infrastructure Purpose Series 2021A (AGM Insured) | 4.00 | 5-1-2038 | 5,000,000 | 5,066,445 | |
| Connecticut Special Tax Obligation Revenue Transportation Infrastructure Purpose Series 2021D | 4.00 | 11-1-2039 | 2,000,000 | 1,995,356 | |
| Connecticut Special Tax Obligation Revenue Transportation Infrastructure Purpose Series 2021D | 4.00 | 11-1-2040 | 3,500,000 | 3,477,800 | |
| 36,627,363 | |||||
| 78,721,999 | |||||
| Delaware: 0.54% | |||||
| Education revenue: 0.20% | |||||
| Delaware EDA Odyssey Charter School Incorporated Project Series A 144A | 7.00 | 9-1-2045 | 7,500,000 | 7,862,333 | |
| Kent County DE Charter School Incorporated Project | 4.00 | 5-1-2024 | 125,000 | 123,974 | |
| Kent County DE Charter School Incorporated Project Series A | 4.00 | 5-1-2041 | 2,750,000 | 2,406,190 | |
| 10,392,497 | |||||
| Miscellaneous revenue: 0.08% | |||||
| Delaware EDA YMCA of Delaware Project (PNC Bank NA LOC) ø | 0.91 | 5-1-2036 | 4,100,000 | 4,100,000 | |
| Tax revenue: 0.01% | |||||
| Delaware Series 2002A | 5.50 | 7-1-2029 | 696,866 | 718,478 | |
| Transportation revenue: 0.25% | |||||
| Delaware River & Bay Authority Project | 4.00 | 1-1-2039 | 650,000 | 648,568 | |
| Delaware River & Bay Authority Project | 4.00 | 1-1-2040 | 485,000 | 482,040 | |
| Delaware River & Bay Authority Project | 4.00 | 1-1-2041 | 320,000 | 320,871 | |
| Delaware River & Bay Authority Project | 4.00 | 1-1-2042 | 550,000 | 550,510 | |
| Delaware River & Bay Authority Project | 4.00 | 1-1-2046 | 1,000,000 | 979,787 | |
| Delaware River & Bay Authority Project %% | 5.00 | 1-1-2031 | 1,000,000 | 1,134,013 | |
| Delaware River & Bay Authority Project %% | 5.00 | 1-1-2032 | 1,100,000 | 1,254,168 | |
| Delaware River & Bay Authority Project %% | 5.00 | 1-1-2033 | 1,100,000 | 1,248,080 | |
| Delaware River & Bay Authority Project %% | 5.00 | 1-1-2038 | 410,000 | 455,755 | |
| Delaware River & Bay Authority Project %% | 5.00 | 1-1-2039 | 450,000 | 499,179 | |
| Delaware River & Bay Authority Project %% | 5.00 | 1-1-2040 | 465,000 | 514,253 | |
| Delaware River & Bay Authority Project %% | 5.00 | 1-1-2041 | 500,000 | 551,877 | |
| Delaware River & Bay Authority Project %% | 5.00 | 1-1-2042 | 520,000 | 572,544 | |
| Delaware Transportation Authority U.S. 301 Project | 5.00 | 6-1-2055 | 3,950,000 | 4,053,057 | |
| 13,264,702 | |||||
| 28,475,677 |
| Interest rate | Maturity date | Principal | Value | ||
| District of Columbia: 1.09% | |||||
| Airport revenue: 0.22% | |||||
| Metropolitan Washington DC Airports Authority Subordinated Lien Bond Series 2021A | 5.00% | 10-1-2032 | $ 5,000,000 | $ 5,556,802 | |
| Metropolitan Washington DC Airports Authority Subordinated Lien Bond Series B | 4.00 | 10-1-2038 | 2,500,000 | 2,458,628 | |
| Metropolitan Washington DC Airports Authority Subordinated Lien Bond Series B | 4.00 | 10-1-2039 | 3,405,000 | 3,343,048 | |
| 11,358,478 | |||||
| GO revenue: 0.10% | |||||
| District of Columbia Series A | 5.00 | 6-1-2037 | 5,000,000 | 5,408,648 | |
| Miscellaneous revenue: 0.40% | |||||
| District of Columbia Revenue Refunding Bonds National Public Radio Incorporated | 4.00 | 4-1-2033 | 3,400,000 | 3,610,736 | |
| District of Columbia Series A | 5.00 | 10-15-2044 | 10,000,000 | 10,904,762 | |
| District of Columbia Series A | 5.00 | 2-1-2046 | 6,150,000 | 6,810,992 | |
| 21,326,490 | |||||
| Tax revenue: 0.10% | |||||
| Washington DC Convention and Sports Authority Refunding Bond Senior Lien Series A | 4.00 | 10-1-2036 | 670,000 | 667,269 | |
| Washington DC Convention and Sports Authority Refunding Bond Senior Lien Series A | 4.00 | 10-1-2037 | 1,000,000 | 986,029 | |
| Washington DC Convention and Sports Authority Refunding Bond Senior Lien Series A | 4.00 | 10-1-2037 | 1,115,000 | 1,099,423 | |
| Washington DC Convention and Sports Authority Refunding Bond Senior Lien Series A | 4.00 | 10-1-2038 | 1,000,000 | 992,943 | |
| Washington DC Convention and Sports Authority Refunding Bond Senior Lien Series A | 4.00 | 10-1-2039 | 640,000 | 625,338 | |
| Washington DC Convention and Sports Authority Refunding Bond Senior Lien Series A | 4.00 | 10-1-2039 | 1,000,000 | 977,090 | |
| 5,348,092 | |||||
| Transportation revenue: 0.27% | |||||
| Metropolitan Washington DC Airports Authority Subordinated Lien Bond Series B (AGM Insured) | 4.00 | 10-1-2049 | 8,000,000 | 7,545,641 | |
| Washington DC Metropolitan Area Transit Authority Series A | 4.00 | 7-15-2040 | 6,000,000 | 6,011,883 | |
| Washington DC Metropolitan Area Transit Authority Series A | 4.00 | 7-15-2045 | 1,000,000 | 980,663 | |
| 14,538,187 | |||||
| 57,979,895 | |||||
| Florida: 6.06% | |||||
| Airport revenue: 2.87% | |||||
| Broward County FL Airport System Revenue Bond AMT Series 2015A | 5.00 | 10-1-2034 | 1,750,000 | 1,875,323 | |
| Broward County FL Airport System Revenue Bond AMT Series 2015A | 5.00 | 10-1-2036 | 12,440,000 | 12,904,920 | |
| Broward County FL Airport System Revenue Bond AMT Series 2015A | 5.00 | 10-1-2038 | 2,000,000 | 2,115,416 | |
| Broward County FL Port Facilities Revenue AMT Series B | 4.00 | 9-1-2044 | 7,300,000 | 6,695,760 |
| Interest rate | Maturity date | Principal | Value | ||
| Airport revenue (continued) | |||||
| Greater Orlando FL Aviation Authority Revenue AMT Series A | 5.00% | 10-1-2046 | $ 3,000,000 | $ 3,098,551 | |
| Hillsborough County FL Aviation Authority Revenue Tampa International Airport Series A | 5.00 | 10-1-2048 | 7,000,000 | 7,280,439 | |
| Hillsborough County FL Aviation Authority Revenue Tampa International Airport Series B | 5.00 | 10-1-2040 | 1,000,000 | 1,064,017 | |
| Hillsborough County FL Aviation Authority Revenue Tampa International Airport Series E | 5.00 | 10-1-2048 | 10,000,000 | 10,450,780 | |
| Hillsborough County FL Aviation Authority Revenue Tampa International Airport Series F | 5.00 | 10-1-2048 | 17,000,000 | 18,005,712 | |
| Jacksonville FL Port Authority Series B | 5.00 | 11-1-2044 | 4,080,000 | 4,412,522 | |
| Jacksonville FL Port Authority Series B | 5.00 | 11-1-2048 | 9,870,000 | 10,632,623 | |
| Miami-Dade County FL Aviation Refunding Bond AMT | 5.00 | 10-1-2032 | 14,000,000 | 14,486,392 | |
| Miami-Dade County FL Aviation Refunding Bond AMT Series A | 4.00 | 10-1-2038 | 3,250,000 | 3,166,187 | |
| Miami-Dade County FL Aviation Refunding Bond AMT Series A | 4.00 | 10-1-2041 | 1,500,000 | 1,449,970 | |
| Miami-Dade County FL Aviation Refunding Bond AMT Series A | 5.00 | 10-1-2033 | 5,000,000 | 5,168,280 | |
| Miami-Dade County FL Aviation Refunding Bond AMT Series A | 5.00 | 10-1-2049 | 18,750,000 | 19,448,685 | |
| Miami-Dade County FL Aviation Refunding Bond AMT Series B | 5.00 | 10-1-2040 | 18,000,000 | 18,704,900 | |
| Miami-Dade County FL Aviation Refunding Bonds AMT | 5.00 | 10-1-2030 | 11,000,000 | 11,411,143 | |
| Miami-Dade County FL Seaport AMT Series B | 6.00 | 10-1-2033 | 500,000 | 524,275 | |
| 152,895,895 | |||||
| Education revenue: 0.64% | |||||
| Capital Trust Agency Florida Educational Facilities Revenue Renaissance Charter School Incorporated 144A | 5.00 | 6-15-2039 | 3,610,000 | 3,615,007 | |
| Florida Development Finance Corporation Educational Facilities Renaissance Charter School Project Series A | 8.50 | 6-15-2044 | 13,290,000 | 14,116,161 | |
| Florida Higher Educational Facilities Authority Jacksonville University Project Series A-1 144A | 5.00 | 6-1-2048 | 2,000,000 | 1,935,037 | |
| Lakeland FL Educational Facilities Authority Florida Southern College Project Series A | 5.00 | 9-1-2025 | 530,000 | 533,056 | |
| Lakeland FL Educational Facilities Authority Florida Southern College Project Series A | 5.00 | 9-1-2028 | 1,195,000 | 1,201,890 | |
| Pinellas County FL Educational Facilities Authority Barry University Project | 5.00 | 10-1-2027 | 1,600,000 | 1,604,011 | |
| Volusia County FL Educational Facility Authority Embry-Riddle Aeronautical University | 5.00 | 10-15-2044 | 6,500,000 | 6,902,893 | |
| Volusia County FL Educational Facility Authority Embry-Riddle Aeronautical University | 5.00 | 10-15-2049 | 4,000,000 | 4,226,270 | |
| 34,134,325 | |||||
| GO revenue: 0.56% | |||||
| Miami-Dade County FL School District | 5.00 | 3-15-2046 | 15,000,000 | 15,843,875 | |
| Miami-Dade County FL Series 2014-A | 5.00 | 7-1-2043 | 12,935,000 | 13,806,214 | |
| 29,650,089 | |||||
| Health revenue: 0.44% | |||||
| Atlantic Beach FL HCFR Fleet Landing Project Series B | 5.63 | 11-15-2043 | 5,000,000 | 5,074,474 |
| Interest rate | Maturity date | Principal | Value | ||
| Health revenue (continued) | |||||
| Hillsborough County FL IDA BayCare Health System Series C (TD Bank NA LOC) ø | 0.90% | 11-1-2038 | $ 1,500,000 | $ 1,500,000 | |
| Holmes County FL Hospital Corporation Doctors Memorial Hospital Project | 6.00 | 11-1-2038 | 2,500,000 | 2,356,275 | |
| Jacksonville FL HCFR Brooks Rehabilitation | 4.00 | 11-1-2045 | 3,500,000 | 3,135,486 | |
| Lee County FL IDA Shell Point Alliance | 5.00 | 11-15-2044 | 5,350,000 | 5,362,736 | |
| Lee County FL IDA Shell Point Alliance | 5.00 | 11-15-2049 | 1,000,000 | 991,101 | |
| St. John's County FL IDA Vicars Landing Project Series A | 4.00 | 12-15-2046 | 1,500,000 | 1,124,057 | |
| Tampa FL Hospital Revenue H. Lee Moffitt Cancer Center Project | 4.00 | 7-1-2038 | 1,025,000 | 1,001,233 | |
| Tampa FL Hospital Revenue H. Lee Moffitt Cancer Center Project | 4.00 | 7-1-2045 | 2,500,000 | 2,360,183 | |
| Tampa FL Hospital Revenue H. Lee Moffitt Cancer Center Project | 5.00 | 7-1-2040 | 700,000 | 740,152 | |
| 23,645,697 | |||||
| Housing revenue: 0.06% | |||||
| Florida Housing Finance Corporation Journet Place Apartments Series 1 | 7.60 | 12-15-2047 | 765,000 | 820,367 | |
| Florida Housing Finance Corporation Villa Capri Phase III | 7.60 | 12-15-2042 | 2,485,000 | 2,488,416 | |
| 3,308,783 | |||||
| Industrial development revenue: 0.05% | |||||
| Florida Development Finance Corporation Solid Waste AMT Pro USA Incorporated | 3.00 | 6-1-2032 | 3,500,000 | 2,833,775 | |
| Miscellaneous revenue: 0.38% | |||||
| Hillsborough County FL Communications Services | 5.00 | 10-1-2038 | 8,000,000 | 8,583,015 | |
| Indigo FL Community Development District Series C | 7.00 | 5-1-2030 | 2,536,248 | 1,775,374 | |
| Lakeside Plantation FL Community Development District Series A | 6.95 | 5-1-2031 | 846,000 | 846,714 | |
| Marshall Creek Florida Community Development District | 5.00 | 5-1-2032 | 1,530,000 | 1,460,272 | |
| Marshall Creek Florida Community Development District | 6.32 | 5-1-2045 | 115,000 | 106,033 | |
| Orlando FL Capital Improvement Special Revenue Series B | 5.00 | 10-1-2033 | 1,525,000 | 1,619,520 | |
| Orlando FL Capital Improvement Special Revenue Series B | 5.00 | 10-1-2035 | 1,680,000 | 1,781,852 | |
| Orlando FL Capital Improvement Special Revenue Series B | 5.00 | 10-1-2036 | 1,765,000 | 1,870,413 | |
| Pinellas County FL IDA Drs. Kiran & Pallavi Patel Project | 5.00 | 7-1-2039 | 2,000,000 | 2,017,591 | |
| 20,060,784 | |||||
| Resource recovery revenue: 0.08% | |||||
| Florida Development Finance Corporation Solid Waste AMT Pro USA Incorporated 144A | 5.00 | 8-1-2029 | 4,000,000 | 3,994,144 | |
| Tax revenue: 0.19% | |||||
| Broward County FL Tourist Development Revenue Convention Center Expansion Revenue Project | 4.00 | 9-1-2047 | 10,000,000 | 9,862,061 | |
| Transportation revenue: 0.28% | |||||
| Central Florida Expressway Authority Series 2021 (AGM Insured) | 4.00 | 7-1-2039 | 6,070,000 | 6,054,693 |
| Interest rate | Maturity date | Principal | Value | ||
| Transportation revenue (continued) | |||||
| Florida Department of Transportation Series A (AGM Insured) | 4.00% | 7-1-2038 | $ 4,185,000 | $ 4,225,111 | |
| Osceola County FL Transportation Revenue Refunding Bonds and Improvement Osceola Parkway Series 2019A-1 | 5.00 | 10-1-2044 | 4,250,000 | 4,366,538 | |
| 14,646,342 | |||||
| Utilities revenue: 0.11% | |||||
| Fort Pierce Utilities Authority Refunding Bonds Series 2022A (AGM Insured) | 5.00 | 10-1-2038 | 1,000,000 | 1,113,464 | |
| Fort Pierce Utilities Authority Refunding Bonds Series 2022A (AGM Insured) | 5.00 | 10-1-2042 | 1,000,000 | 1,102,897 | |
| Jacksonville FL Electric System Revenue Bonds Series 2008A (Royal Bank of Canada SPA) ø | 0.93 | 10-1-2036 | 2,000,000 | 2,000,000 | |
| Lakeland FL Energy System Revenue Bond Series 2021 | 5.00 | 10-1-2048 | 1,250,000 | 1,492,816 | |
| 5,709,177 | |||||
| Water & sewer revenue: 0.40% | |||||
| Daytona Beach FL Refunding & Improvement Bonds Project (AGM Insured) | 5.00 | 11-1-2031 | 1,155,000 | 1,167,553 | |
| Daytona Beach FL Refunding & Improvement Bonds Project (AGM Insured) | 5.00 | 11-1-2032 | 1,465,000 | 1,480,970 | |
| Florida Keys Aqueduct Authority Series A | 5.00 | 9-1-2041 | 2,750,000 | 2,889,297 | |
| North Sumter County FL Utility Dependent District (BAM Insured) | 5.00 | 10-1-2044 | 3,000,000 | 3,297,762 | |
| North Sumter County FL Utility Dependent District | 5.00 | 10-1-2049 | 3,250,000 | 3,545,647 | |
| Wildwood Utility Dependent District South Sumter Utility Project (BAM Insured) | 5.00 | 10-1-2046 | 8,250,000 | 9,065,206 | |
| 21,446,435 | |||||
| 322,187,507 | |||||
| Georgia: 2.85% | |||||
| Education revenue: 0.21% | |||||
| Cobb County GA Development Authority Charter Learning Center Foundation Central Project Series A ♣ | 6.38 | 7-1-2025 | 1,705,000 | 1,435,518 | |
| Georgia Private Colleges & Universities Authority Emory University Revenue Bond Series 2019B | 5.00 | 9-1-2048 | 4,000,000 | 4,303,068 | |
| Georgia Private Colleges & Universities Authority Mercer University Project | 5.00 | 10-1-2040 | 5,000,000 | 5,164,148 | |
| 10,902,734 | |||||
| Energy revenue: 0.07% | |||||
| Municipal Electric Authority of Georgia Project One Subordinated Bond Series A | 5.00 | 1-1-2044 | 3,580,000 | 3,710,595 | |
| Health revenue: 0.20% | |||||
| Brookhaven GA Development Authority Childrens Healthcare of Atlanta | 4.00 | 7-1-2044 | 6,000,000 | 5,804,836 | |
| Fulton County GA Development Authority Hospital Revenue Bond Series A | 5.00 | 4-1-2047 | 2,250,000 | 2,348,233 | |
| The Glynn-Brunswick Memorial Hospital Authority Revenue Anticipation Certificates Series 2015 | 5.00 | 8-1-2034 | 2,580,000 | 2,644,751 | |
| 10,797,820 |
| Interest rate | Maturity date | Principal | Value | ||
| Industrial development revenue: 0.05% | |||||
| George L Smith II Georgia World Congress Center Authority Convention Center Hotel Series B 144A | 5.00% | 1-1-2054 | $ 3,000,000 | $ 2,566,718 | |
| Tax revenue: 0.15% | |||||
| Metropolitan Atlanta Rapid Third Indenture Series B | 5.00 | 7-1-2044 | 7,500,000 | 7,973,255 | |
| Transportation revenue: 0.14% | |||||
| Georgia Road & Tollway Authority CAB I-75 South Expressway Lanes Project Series A 144A¤ | 0.00 | 6-1-2034 | 3,750,000 | 1,945,254 | |
| Georgia Road & Tollway Authority CCAB I-75 South Expressway Lanes Project Series B 144A¤ | 0.00 | 6-1-2049 | 5,600,000 | 5,641,945 | |
| 7,587,199 | |||||
| Utilities revenue: 2.03% | |||||
| Bartow County Development Authority Pollution Control Georgia Power Company Plant Bowen Project | 2.75 | 12-1-2032 | 20,000,000 | 19,983,060 | |
| Burke County GA Development Authority Georgia Power Company Plant Vogtle Project | 2.93 | 11-1-2053 | 14,750,000 | 14,705,014 | |
| Burke County GA Development Authority Georgia Power Company Plant Vogtle Project Series 2 | 2.93 | 11-1-2048 | 10,000,000 | 9,969,501 | |
| Burke County GA Development Authority Georgia Power Company Vogtle Project Series 5 | 2.20 | 10-1-2032 | 1,500,000 | 1,395,016 | |
| Burke County GA Development Authority Oglethorpe Power Corporation Vogtle Project Series F | 3.00 | 11-1-2045 | 5,000,000 | 5,010,432 | |
| Dalton GA Utilities Revenue | 4.00 | 3-1-2040 | 1,000,000 | 968,038 | |
| Dalton GA Utilities Revenue | 4.00 | 3-1-2041 | 1,000,000 | 967,318 | |
| Georgia Municipal Electric Authority Power Series EE (Ambac Insured) | 7.25 | 1-1-2024 | 400,000 | 430,850 | |
| Main Street Natural Gas Incorporated Gas Supply Revenue Bonds Series 2021A | 4.00 | 7-1-2052 | 8,500,000 | 8,715,008 | |
| Main Street Natural Gas Incorporated Gas Supply Revenue Bonds Series 2022C 144A | 4.00 | 8-1-2052 | 27,000,000 | 26,554,851 | |
| Main Street Natural Gas Incorporated Georgia Gas Project Series A | 5.00 | 5-15-2032 | 3,745,000 | 3,957,748 | |
| Main Street Natural Gas Incorporated Georgia Gas Project Subordinate Bond Series B (1 Month LIBOR +0.75%) ± | 1.46 | 4-1-2048 | 5,100,000 | 5,063,216 | |
| Municipal Electric Authority of Georgia Plant Vogtle Units 3&4 Project M | 5.00 | 1-1-2037 | 1,100,000 | 1,155,884 | |
| Municipal Electric Authority of Georgia Plant Vogtle Units 3&4 Project M | 5.00 | 1-1-2038 | 1,100,000 | 1,150,874 | |
| Municipal Electric Authority of Georgia Project One Subordinated Bond Series A | 4.00 | 1-1-2040 | 1,075,000 | 1,038,328 | |
| Tender Option Bond Trust Receipts/Certificates Series 2021-XG0308 (Bank of America NA LIQ) 144Aø | 0.97 | 1-1-2052 | 7,000,000 | 7,000,000 | |
| 108,065,138 | |||||
| 151,603,459 | |||||
| Guam: 0.11% | |||||
| Airport revenue: 0.01% | |||||
| Guam Port Authority Private Activity AMT Series 2018B | 5.00 | 7-1-2030 | 500,000 | 536,969 | |
| Housing revenue: 0.00% | |||||
| Guam Housing Corporation Guaranteed Mortgage-Backed Securities Series A (FHLMC Insured) | 5.75 | 9-1-2031 | 60,000 | 60,217 |
| Interest rate | Maturity date | Principal | Value | ||
| Tax revenue: 0.05% | |||||
| Guam Government Business Privilege Tax Revenue Refunding Bonds Series F | 4.00% | 1-1-2042 | $ 2,750,000 | $ 2,426,311 | |
| Water & sewer revenue: 0.05% | |||||
| Guam Government Waterworks Authority Series 2013 | 5.25 | 7-1-2023 | 1,000,000 | 1,025,892 | |
| Guam Government Waterworks Authority Series A | 5.00 | 1-1-2050 | 1,600,000 | 1,667,890 | |
| 2,693,782 | |||||
| 5,717,279 | |||||
| Hawaii: 0.53% | |||||
| Airport revenue: 0.53% | |||||
| Hawaii Airports System Revenue Series 2020A | 5.00 | 7-1-2034 | 6,800,000 | 7,334,218 | |
| Hawaii Airports System Revenue Series A | 5.00 | 7-1-2048 | 7,000,000 | 7,270,967 | |
| Hawaii AMT Series A | 4.00 | 7-1-2033 | 1,250,000 | 1,296,340 | |
| Hawaii AMT Series A | 4.00 | 7-1-2034 | 875,000 | 899,214 | |
| Hawaii AMT Series A | 4.00 | 7-1-2035 | 625,000 | 636,628 | |
| Hawaii AMT Series A | 4.00 | 7-1-2036 | 300,000 | 302,999 | |
| Hawaii AMT Series A | 5.00 | 7-1-2041 | 9,500,000 | 9,790,678 | |
| Hawaii AMT Series C | 4.00 | 7-1-2040 | 425,000 | 429,959 | |
| 27,961,003 | |||||
| Idaho: 0.13% | |||||
| Education revenue: 0.13% | |||||
| Idaho Housing & Finance Association Idaho Arts Charter School Incorporated Project Series A | 5.75 | 12-1-2032 | 450,000 | 457,537 | |
| Idaho Housing & Finance Association Legacy Public Charter School Incorporated Project Series A | 5.85 | 5-1-2033 | 565,000 | 570,001 | |
| Idaho Housing & Finance Association Legacy Public Charter School Incorporated Project Series A | 6.25 | 5-1-2043 | 1,365,000 | 1,378,020 | |
| Idaho Housing & Finance Association Nonprofit CAB North Star Charter School Series B 144A¤ | 0.00 | 7-1-2049 | 1,276,564 | 221,857 | |
| Idaho Housing & Finance Association Nonprofit North Star Charter School Series A | 6.75 | 7-1-2048 | 1,322,876 | 1,402,413 | |
| Idaho Housing & Finance Association Nonprofit Refunding Bonds Liberty Charter School Incorporated 144A | 4.00 | 6-1-2030 | 1,255,000 | 1,245,855 | |
| Idaho Housing & Finance Association Nonprofit Refunding Bonds Liberty Charter School Incorporated 144A | 4.00 | 6-1-2038 | 1,715,000 | 1,588,680 | |
| 6,864,363 | |||||
| Illinois: 12.91% | |||||
| Airport revenue: 1.05% | |||||
| Chicago IL O'Hare International Airport AMT Passenger Facility Charge Refunding Bonds Series B | 5.00 | 1-1-2032 | 8,000,000 | 8,012,385 | |
| Chicago IL O'Hare International Airport AMT Passenger Facility Charge Series B | 5.00 | 1-1-2026 | 5,000,000 | 5,009,912 | |
| Chicago IL O'Hare International Airport AMT Senior Lien Series 2015A | 5.00 | 1-1-2030 | 5,000,000 | 5,178,288 | |
| Chicago IL O'Hare International Airport AMT Senior Lien Series 2020A | 4.00 | 1-1-2035 | 7,500,000 | 7,468,290 | |
| Chicago IL O'Hare International Airport AMT Senior Lien Series 2020A | 5.00 | 1-1-2034 | 5,000,000 | 5,496,712 |
| Interest rate | Maturity date | Principal | Value | ||
| Airport revenue (continued) | |||||
| Chicago IL O'Hare International Airport AMT Senior Lien Series C | 5.50% | 1-1-2044 | $ 4,000,000 | $ 4,044,079 | |
| Chicago IL O'Hare International Airport Customer Facility Charge Senior Lien (AGM Insured) | 5.50 | 1-1-2043 | 4,530,000 | 4,583,381 | |
| Chicago IL O'Hare International Airport Customer Facility Charge Senior Lien Series D | 5.75 | 1-1-2043 | 4,500,000 | 4,539,845 | |
| Chicago IL O'Hare International Airport Senior Lien Series B | 5.00 | 1-1-2039 | 10,250,000 | 10,740,957 | |
| Chicago IL O'Hare International Airport Transportation Infrastructure Properties Obligated Group | 5.00 | 7-1-2038 | 1,000,000 | 1,030,723 | |
| 56,104,572 | |||||
| Education revenue: 0.40% | |||||
| Illinois Finance Authority Acero Charter Schools Incorporated 144A | 4.00 | 10-1-2042 | 1,250,000 | 1,064,038 | |
| Illinois Finance Authority Bradley University Project Series A | 4.00 | 8-1-2043 | 750,000 | 655,459 | |
| Illinois Finance Authority Charter Schools Project Series A | 6.25 | 9-1-2039 | 7,955,000 | 8,160,239 | |
| Illinois Finance Authority University of Chicago Series A | 5.00 | 10-1-2036 | 1,500,000 | 1,735,604 | |
| Illinois Finance Authority University of Chicago Series A | 5.00 | 10-1-2037 | 1,350,000 | 1,553,557 | |
| Illinois Finance Authority University of Chicago Series A | 5.00 | 10-1-2038 | 1,500,000 | 1,730,273 | |
| Southern Illinois State University Series 04 (BAM Insured) | 4.00 | 4-1-2035 | 500,000 | 480,518 | |
| Southern Illinois State University Series 04 (BAM Insured) | 4.00 | 4-1-2037 | 1,000,000 | 949,115 | |
| Southern Illinois State University Series 04 (BAM Insured) | 5.00 | 4-1-2032 | 500,000 | 541,678 | |
| University of Illinois Auxiliary Facilities Systems CAB Series A (NPFGC Insured) ¤ | 0.00 | 4-1-2026 | 2,355,000 | 2,112,235 | |
| University of Illinois Auxiliary Facilities Systems CAB Series A (NPFGC Insured) ¤ | 0.00 | 4-1-2027 | 2,435,000 | 2,107,932 | |
| 21,090,648 | |||||
| GO revenue: 3.04% | |||||
| Chicago IL Board of Education CAB City Colleges (NPFGC Insured) ¤ | 0.00 | 1-1-2025 | 9,935,000 | 9,130,487 | |
| Chicago IL Board of Education CAB School Reform Series B-1 (NPFGC Insured) ¤ | 0.00 | 12-1-2023 | 2,930,000 | 2,809,440 | |
| Chicago IL Board of Education CAB School Reform Series B-1 (NPFGC Insured) ¤ | 0.00 | 12-1-2026 | 4,245,000 | 3,614,851 | |
| Chicago IL Board of Education Series 2021A | 5.00 | 12-1-2035 | 6,630,000 | 6,826,840 | |
| Chicago IL Board of Education Series 2021A | 5.00 | 12-1-2036 | 2,000,000 | 2,059,339 | |
| Chicago IL Board of Education Series 2021A | 5.00 | 12-1-2040 | 2,000,000 | 2,039,051 | |
| Chicago IL CAB City Colleges (NPFGC Insured) ¤ | 0.00 | 1-1-2030 | 5,995,000 | 4,403,821 | |
| Chicago IL CAB Project & Refunding Bond Series C (AGM Insured) ¤ | 0.00 | 1-1-2026 | 7,360,000 | 6,567,159 | |
| Chicago IL Series 2021A | 5.00 | 1-1-2034 | 11,790,000 | 12,223,712 | |
| Chicago IL Series 2021B | 4.00 | 1-1-2038 | 6,615,000 | 6,182,764 | |
| Chicago IL Series A | 5.00 | 1-1-2027 | 1,410,000 | 1,491,107 | |
| Chicago IL Series A | 6.00 | 1-1-2038 | 3,000,000 | 3,220,508 | |
| Cook County IL Series C (AGM Insured) | 5.00 | 11-15-2024 | 4,240,000 | 4,288,252 | |
| Cook County IL Series C | 5.00 | 11-15-2025 | 3,490,000 | 3,526,660 | |
| Cook County IL Series C | 5.00 | 11-15-2027 | 325,000 | 328,224 | |
| Illinois Series 1 (NPFGC Insured) | 6.00 | 11-1-2026 | 3,200,000 | 3,471,012 | |
| Illinois Series 2006 | 5.50 | 1-1-2030 | 2,900,000 | 3,236,699 | |
| Illinois Series 2014 (AGM Insured) | 5.00 | 4-1-2026 | 3,000,000 | 3,115,498 | |
| Illinois Series 2016 | 5.00 | 11-1-2027 | 1,175,000 | 1,255,985 | |
| Illinois Series 2022A | 5.50 | 3-1-2042 | 3,500,000 | 3,802,867 |
| Interest rate | Maturity date | Principal | Value | ||
| GO revenue (continued) | |||||
| Illinois Series A (AGM Insured) | 5.00% | 4-1-2024 | $ 3,000,000 | $ 3,061,004 | |
| Illinois Series B | 5.00 | 10-1-2028 | 2,750,000 | 2,974,025 | |
| Illinois Series B | 5.50 | 5-1-2024 | 2,500,000 | 2,618,874 | |
| Illinois Series C | 4.00 | 10-1-2038 | 4,820,000 | 4,543,874 | |
| Kane, Cook & DuPage Counties IL Refunding Bond Series D | 5.00 | 1-1-2028 | 830,000 | 865,125 | |
| Kane, Cook & DuPage Counties IL Refunding Bond Series D | 5.00 | 1-1-2033 | 2,000,000 | 2,082,539 | |
| Kane, Cook & DuPage Counties IL School District #46 CAB Series B (Ambac Insured) ¤ | 0.00 | 1-1-2023 | 16,725,000 | 16,569,493 | |
| Kane, Cook & DuPage Counties IL School District #46 Elgin Refunding Bond Series D | 5.00 | 1-1-2035 | 1,850,000 | 1,924,687 | |
| Kendall, Kane & Will Counties IL CAB School District #308 (AGM Insured) ¤ | 0.00 | 2-1-2025 | 855,000 | 800,379 | |
| Kendall, Kane & Will Counties IL CAB School District #308 (AGM Insured) ¤ | 0.00 | 2-1-2026 | 5,050,000 | 4,578,489 | |
| Kendall, Kane & Will Counties IL CAB School District #308 (AGM Insured) ¤ | 0.00 | 2-1-2027 | 12,050,000 | 10,561,795 | |
| Lake County IL School District #24 Millburn CAB (NPFGC Insured) ¤ | 0.00 | 1-1-2024 | 2,000,000 | 1,926,009 | |
| Lake County IL School District #38 Big Hollow CAB (Ambac Insured) ¤ | 0.00 | 2-1-2024 | 5,385,000 | 5,148,734 | |
| McHenry & Kane Counties IL Community Consolidated School District #158 CAB (AGM / FGIC Insured) ¤ | 0.00 | 1-1-2023 | 705,000 | 698,479 | |
| Metropolitan Water Reclamation District of Greater Chicago Refunding Bond Series C | 5.25 | 12-1-2032 | 1,565,000 | 1,840,537 | |
| Peoria IL Refunding Bonds Series A (BAM Insured) | 5.00 | 1-1-2029 | 2,000,000 | 2,258,988 | |
| Sangamon Logan & Menard Counties IL Community Unit School District #15 Williamsville Series B (BAM Insured) | 4.00 | 12-1-2044 | 1,500,000 | 1,529,009 | |
| Tazewell County IL School District #51 (NPFGC Insured) | 9.00 | 12-1-2023 | 350,000 | 382,433 | |
| Will County IL Community High School CAB Refunding Bond Series B (BAM Insured) ¤ | 0.00 | 1-1-2032 | 400,000 | 277,714 | |
| Will County IL Community High School CAB Refunding Bond Series B (BAM Insured) ¤ | 0.00 | 1-1-2033 | 2,830,000 | 1,870,447 | |
| Will County IL Community High School Refunding Bond Series 2022A (AGM Insured) %% | 5.50 | 2-1-2041 | 3,660,000 | 4,074,705 | |
| Will County IL Community High School Refunding Bond Series B (BAM Insured) | 5.00 | 1-1-2028 | 500,000 | 505,965 | |
| Will County IL Community Unit School District #201 Crete-Monee Prerefunded Bond CAB (NPFGC Insured) ¤ | 0.00 | 11-1-2023 | 70,000 | 68,204 | |
| Will County IL Community Unit School District #201 Crete-Monee Prerefunded Bond CAB (NPFGC Insured) ¤ | 0.00 | 11-1-2023 | 430,000 | 418,418 | |
| Will County IL Lincoln-Way Community High School District #210 Unrefunded Bond CAB (AGM Insured) ¤ | 0.00 | 1-1-2026 | 7,000,000 | 6,301,965 | |
| 161,476,167 | |||||
| Health revenue: 0.38% | |||||
| Illinois Finance Authority Carle Foundation Series A | 4.00 | 8-15-2040 | 8,600,000 | 8,107,739 | |
| Illinois Finance Authority Carle Foundation Series A | 4.00 | 8-15-2048 | 2,450,000 | 2,239,969 | |
| Illinois Finance Authority Friendship Village of Schaumberg | 5.00 | 2-15-2022 | 1,680,000 | 1,176,000 | |
| Illinois Finance Authority Health Services Facility Lease Revenue Provident Group UIC Surgery Center | 4.00 | 10-1-2050 | 2,000,000 | 1,718,769 |
| Interest rate | Maturity date | Principal | Value | ||
| Health revenue (continued) | |||||
| Illinois Finance Authority Lutheran Life Communities | 5.00% | 11-1-2040 | $ 4,900,000 | $ 4,517,969 | |
| Illinois Finance Authority Northwestern Memorial Project | 4.00 | 7-15-2039 | 2,250,000 | 2,223,037 | |
| 19,983,483 | |||||
| Housing revenue: 0.08% | |||||
| Northern Illinois University Auxiliary Facilities System (BAM Insured) | 4.00 | 10-1-2037 | 1,650,000 | 1,628,325 | |
| Tender Option Bond Trust Receipts/Floater Certificates Series 2020-YX1119 (GNMA / FNMA / FHLMC Insured, Barclays Bank plc LIQ) 144Aø | 0.96 | 4-1-2041 | 2,425,000 | 2,425,000 | |
| 4,053,325 | |||||
| Miscellaneous revenue: 0.75% | |||||
| Chicago IL Certificate of Participation River Point Plaza Redevelopment Project Series A 144A | 4.84 | 4-15-2028 | 3,799,000 | 3,828,725 | |
| Illinois Refunding Bond | 5.00 | 8-1-2024 | 2,000,000 | 2,004,753 | |
| Illinois Refunding Bond | 5.00 | 8-1-2025 | 6,165,000 | 6,179,651 | |
| Illinois Series 2013 | 5.25 | 7-1-2030 | 2,500,000 | 2,553,565 | |
| Illinois Series 2013 | 5.50 | 7-1-2025 | 6,000,000 | 6,152,632 | |
| Illinois Series 2013 | 5.50 | 7-1-2026 | 4,450,000 | 4,565,172 | |
| Illinois Series 2013 | 5.50 | 7-1-2033 | 4,000,000 | 4,083,738 | |
| Illinois Series 2021A | 5.00 | 3-1-2046 | 2,500,000 | 2,566,994 | |
| Illinois Series C | 5.00 | 11-1-2029 | 2,965,000 | 3,156,279 | |
| Royal Bank of Canada Municipal Products Incorporated Trust Series E-151 (Royal Bank of Canada LOC, Royal Bank of Canada LIQ) 144Aø | 0.95 | 11-30-2023 | 5,000,000 | 5,000,000 | |
| 40,091,509 | |||||
| Tax revenue: 5.26% | |||||
| Chicago IL Motor Fuel Tax Refunding Bonds Series 2013 | 5.00 | 1-1-2024 | 680,000 | 710,616 | |
| Chicago IL Refunding Bonds Series 2002 | 5.00 | 1-1-2028 | 4,430,000 | 4,729,722 | |
| Chicago IL Refunding Bonds Series 2002 | 5.00 | 1-1-2029 | 1,500,000 | 1,601,486 | |
| Chicago IL Sales Tax Refunding Bond | 5.00 | 1-1-2027 | 3,000,000 | 3,202,972 | |
| Chicago IL Sales Tax Refunding Bond | 5.00 | 1-1-2030 | 4,325,000 | 4,617,618 | |
| Chicago IL Transit Authority Sales Tax Receipts Bonds (AGM Insured) | 5.00 | 12-1-2044 | 4,000,000 | 4,130,734 | |
| Chicago IL Transit Authority Sales Tax Receipts Bonds | 5.00 | 12-1-2046 | 18,250,000 | 18,960,898 | |
| Chicago IL Transit Authority Sales Tax Receipts Bonds Series A | 5.00 | 12-1-2045 | 1,750,000 | 1,867,074 | |
| Cook County IL Sales Tax Revenue Bonds Series 2012 | 5.00 | 11-15-2037 | 2,500,000 | 2,528,999 | |
| Cook County IL Series A | 4.00 | 11-15-2041 | 2,000,000 | 1,863,138 | |
| Illinois Regional Transportation Authority (AGM Insured) | 5.75 | 6-1-2023 | 145,000 | 150,187 | |
| Illinois Regional Transportation Authority Series A | 5.00 | 6-1-2044 | 22,840,000 | 24,136,983 | |
| Illinois Regional Transportation Authority Series A (AGM Insured) | 5.75 | 6-1-2034 | 19,000,000 | 22,468,712 | |
| Illinois Regional Transportation Authority Series A (NPFGC Insured) | 6.00 | 7-1-2027 | 10,620,000 | 11,868,583 | |
| Illinois Regional Transportation Authority Series A (NPFGC Insured) | 6.00 | 7-1-2033 | 5,000,000 | 6,000,826 | |
| Illinois Regional Transportation Authority Series B (NPFGC Insured) | 5.50 | 6-1-2027 | 16,845,000 | 18,398,104 | |
| Illinois Sales Tax Build Illinois Junior Obligation | 5.00 | 6-15-2023 | 10,000,000 | 10,228,116 | |
| Illinois Sales Tax Revenue Bond Junior Obligation Tax-Exempt Series A (BAM Insured) | 4.00 | 6-15-2034 | 2,000,000 | 2,021,398 |
| Interest rate | Maturity date | Principal | Value | ||
| Tax revenue (continued) | |||||
| Illinois Sales Tax Revenue Bond Junior Obligation Tax-Exempt Series A (BAM Insured) | 4.13% | 6-15-2037 | $ 1,945,000 | $ 1,969,378 | |
| Illinois Sales Tax Revenue Bond Junior Obligation Tax-Exempt Series C | 5.00 | 6-15-2028 | 3,500,000 | 3,790,351 | |
| Illinois Sales Tax Revenue Bond Junior Obligation Tax-Exempt Series D | 4.00 | 6-15-2030 | 12,000,000 | 12,133,582 | |
| Illinois Sales Tax Securitization Series A | 4.00 | 1-1-2048 | 5,430,000 | 5,035,678 | |
| Illinois Sales Tax Securitization Series A | 5.00 | 1-1-2038 | 3,000,000 | 3,198,169 | |
| Illinois Sales Tax Securitization Series C | 5.00 | 1-1-2024 | 2,500,000 | 2,613,689 | |
| Illinois Sports Facilities Authority Refunding Bonds State Tax Supported CAB (Ambac Insured) ¤ | 0.00 | 6-15-2026 | 2,030,000 | 1,776,961 | |
| Illinois Sports Facilities Authority State Tax Supported CAB (Ambac Insured) ¤ | 0.00 | 6-15-2024 | 17,570,000 | 16,574,703 | |
| Illinois Sports Facilities Authority State Tax Supported CAB (Ambac Insured) ¤ | 0.00 | 6-15-2025 | 2,575,000 | 2,342,252 | |
| Illinois Sports Facilities Authority State Tax Supported Refunding Bond (AGM Insured) | 5.00 | 6-15-2025 | 3,745,000 | 3,940,424 | |
| Illinois Sports Facilities Authority State Tax Supported Refunding Bond (AGM Insured) | 5.00 | 6-15-2026 | 4,775,000 | 4,992,550 | |
| Illinois Sports Facilities Authority State Tax Supported Refunding Bond (AGM Insured) | 5.00 | 6-15-2027 | 8,845,000 | 9,235,980 | |
| Illinois Sports Facilities Authority State Tax Supported Refunding Bond (AGM Insured) | 5.00 | 6-15-2028 | 4,030,000 | 4,200,345 | |
| Illinois Sports Facilities Authority State Tax Supported Refunding Bond (AGM Insured) | 5.25 | 6-15-2032 | 3,500,000 | 3,649,515 | |
| Metropolitan Pier & Exposition Authority CAB McCormick Place Expansion Project Series A (NPFGC Insured) ¤ | 0.00 | 12-15-2026 | 12,245,000 | 10,502,390 | |
| Metropolitan Pier & Exposition Authority CAB McCormick Place Expansion Project Series A (NPFGC Insured) ¤ | 0.00 | 12-15-2030 | 25,700,000 | 18,382,889 | |
| Metropolitan Pier & Exposition Authority CAB McCormick Place Expansion Project Series A (NPFGC Insured) ¤ | 0.00 | 6-15-2031 | 10,060,000 | 7,008,281 | |
| Metropolitan Pier & Exposition Authority CAB McCormick Place Expansion Project Series A (NPFGC Insured) ¤ | 0.00 | 12-15-2031 | 9,800,000 | 6,667,285 | |
| Metropolitan Pier & Exposition Authority CAB McCormick Place Expansion Project Series B (NPFGC Insured) ¤ | 0.00 | 6-15-2029 | 12,085,000 | 9,277,415 | |
| Metropolitan Pier & Exposition Authority Revenue Refunding Bonds McCormick Place Expansion Project Series A | 4.00 | 12-15-2042 | 2,500,000 | 2,235,257 | |
| Sales Tax Securitization Corporation Second Lien Sales Tax | 4.00 | 1-1-2038 | 8,950,000 | 8,638,233 | |
| Southwestern Illinois Development Authority Local Government Program Collinsville Limited | 5.00 | 3-1-2025 | 3,055,000 | 2,377,490 | |
| 280,028,983 | |||||
| Tobacco revenue: 0.06% | |||||
| Railsplitter Tobacco Settlement Authority | 5.00 | 6-1-2024 | 3,000,000 | 3,138,145 | |
| Transportation revenue: 0.75% | |||||
| Chicago IL Public Building Commission Transit Authority (Ambac Insured) | 5.25 | 3-1-2025 | 2,960,000 | 3,157,222 | |
| Chicago IL Public Building Commission Transit Authority (Ambac Insured) | 5.25 | 3-1-2027 | 3,400,000 | 3,751,646 | |
| Illinois Toll Highway Authority | 5.00 | 1-1-2031 | 5,000,000 | 5,694,820 | |
| Illinois Toll Highway Authority Senior Series A | 5.00 | 1-1-2043 | 9,000,000 | 9,799,854 |
| Interest rate | Maturity date | Principal | Value | ||
| Transportation revenue (continued) | |||||
| Illinois Toll Highway Authority Senior Series A | 5.00% | 1-1-2046 | $15,000,000 | $ 16,217,381 | |
| Illinois Toll Highway Authority Senior Series B | 5.00 | 1-1-2039 | 1,500,000 | 1,536,065 | |
| 40,156,988 | |||||
| Utilities revenue: 0.30% | |||||
| Illinois Municipal Electric Agency Power Supply System Series A | 5.00 | 2-1-2030 | 7,000,000 | 7,518,980 | |
| Illinois Municipal Electric Agency Power Supply System Series A | 5.00 | 2-1-2031 | 8,000,000 | 8,593,120 | |
| 16,112,100 | |||||
| Water & sewer revenue: 0.84% | |||||
| Chicago IL Refunding Bond Second Lien Project | 5.00 | 11-1-2029 | 4,600,000 | 4,630,956 | |
| Chicago IL Wastewater Refunding Bond Second Lien Bond Series C | 5.00 | 1-1-2039 | 5,000,000 | 5,164,196 | |
| Chicago IL Wastewater Transmission Second Lien Series 2012 | 5.00 | 1-1-2027 | 5,000,000 | 5,007,907 | |
| Chicago IL Wastewater Transmission Second Lien Series 2014 | 5.00 | 1-1-2039 | 11,525,000 | 11,690,198 | |
| Chicago IL Wastewater Transmission Second Lien Series 2014 | 5.00 | 1-1-2044 | 4,425,000 | 4,478,830 | |
| Chicago IL Waterworks Second Lien (AGM Insured) | 5.25 | 11-1-2032 | 3,250,000 | 3,553,876 | |
| Chicago IL Waterworks Second Lien Series 2012 | 5.00 | 11-1-2030 | 5,000,000 | 5,034,261 | |
| Illinois Finance Authority Clean Water Initiative | 4.00 | 7-1-2038 | 5,000,000 | 5,054,558 | |
| 44,614,782 | |||||
| 686,850,702 | |||||
| Indiana: 2.04% | |||||
| Education revenue: 0.33% | |||||
| Indiana Finance Authority Educational Facilities Multipurpose DePauw University Project Series 2022A | 5.00 | 7-1-2047 | 17,000,000 | 17,336,728 | |
| Indiana Finance Authority Educational Facilities Multipurpose KIPP Indianapolis Incorporated Project | 5.00 | 7-1-2040 | 350,000 | 352,879 | |
| 17,689,607 | |||||
| Health revenue: 0.44% | |||||
| Indiana Finance Authority Health System Revenue Bonds Franciscan Alliance Incorporated Obligated Group Series C | 4.00 | 11-1-2033 | 12,885,000 | 12,917,582 | |
| Indiana Finance Authority Health System Revenue Bonds Franciscan Alliance Incorporated Obligated Group Series C | 4.00 | 11-1-2036 | 5,000,000 | 5,008,233 | |
| Indiana Finance Authority Marion General Hospital Series A | 4.00 | 7-1-2045 | 2,560,000 | 2,384,127 | |
| Indiana HFFA Ascension Health Credit Group | 5.00 | 11-15-2034 | 2,750,000 | 2,910,982 | |
| 23,220,924 | |||||
| Industrial development revenue: 0.49% | |||||
| Indiana Finance Authority Ohio River Bridges East End Crossing Project Series A | 5.00 | 7-1-2035 | 9,970,000 | 10,260,315 | |
| Indiana Finance Authority Ohio River Bridges East End Crossing Project Series A | 5.00 | 7-1-2040 | 2,720,000 | 2,799,203 |
| Interest rate | Maturity date | Principal | Value | ||
| Industrial development revenue (continued) | |||||
| Indiana Finance Authority Tax-Exempt Private Activity Bonds Series 2013 | 5.00% | 7-1-2048 | $10,000,000 | $ 10,291,189 | |
| Valparaiso IN Pratt Paper LLC Project | 5.88 | 1-1-2024 | 290,000 | 295,619 | |
| Whiting IN Industry Environmental Facilities | 5.00 | 3-1-2046 | 2,500,000 | 2,538,172 | |
| 26,184,498 | |||||
| Miscellaneous revenue: 0.34% | |||||
| Carmel IN Local Public Improvement Multipurpose Bonds | 5.00 | 7-15-2031 | 6,000,000 | 6,520,546 | |
| Clarke County IN Building Corporation Series 2022 | 6.00 | 7-15-2038 | 5,000,000 | 6,115,550 | |
| Hobart Industry Building Corporation First Mortgage | 4.00 | 7-15-2035 | 2,295,000 | 2,397,533 | |
| Indianapolis IN Industry Local Public Improvement Bond Bank Series A (AGM Insured) | 4.00 | 6-1-2041 | 3,000,000 | 2,954,791 | |
| 17,988,420 | |||||
| Tax revenue: 0.08% | |||||
| Indianapolis IN Industry Local Public Improvement Bond Bank Community Justice Campus Courthouse & Jail Project | 5.00 | 2-1-2049 | 4,000,000 | 4,358,666 | |
| Utilities revenue: 0.19% | |||||
| Indiana Finance Authority Midwestern Disaster Relief Ohio Valley Electric Corporation Project | 3.00 | 11-1-2030 | 4,000,000 | 3,618,603 | |
| Indiana Finance Authority Midwestern Disaster Relief Ohio Valley Electric Corporation Project Series 2012A | 4.25 | 11-1-2030 | 3,000,000 | 2,954,602 | |
| Indiana Finance Authority Ohio Valley Electric Corporation Project Series A | 3.00 | 11-1-2030 | 4,000,000 | 3,618,603 | |
| 10,191,808 | |||||
| Water & sewer revenue: 0.17% | |||||
| Evansville IN Waterworks Series 2022A (BAM Insured) | 5.00 | 7-1-2047 | 2,250,000 | 2,452,436 | |
| Fishers Industry Sewage Works Revenue (BAM Insured) | 4.00 | 7-1-2043 | 3,450,000 | 3,480,672 | |
| Fishers Industry Sewage Works Revenue (BAM Insured) | 4.00 | 7-1-2045 | 3,160,000 | 3,146,469 | |
| 9,079,577 | |||||
| 108,713,500 | |||||
| Iowa: 0.04% | |||||
| GO revenue: 0.04% | |||||
| Altoona IA Annual Appropriation Urban Renewal Series C | 5.00 | 6-1-2031 | 1,805,000 | 1,964,902 | |
| Kansas: 0.44% | |||||
| Tax revenue: 0.44% | |||||
| Kansas Department of Transportation Series C | 4.00 | 9-1-2030 | 6,650,000 | 6,662,304 | |
| Kansas Department of Transportation Series C | 4.00 | 9-1-2032 | 7,500,000 | 7,511,972 | |
| Wyandotte County & Kansas City KS Special Obligation Vacation Village Project Area 4 Major Multi-Sport Athletic Complex Project CAB Series 2015 144A¤ | 0.00 | 9-1-2034 | 33,280,000 | 9,368,001 | |
| 23,542,277 |
| Interest rate | Maturity date | Principal | Value | ||
| Kentucky: 1.67% | |||||
| Education revenue: 0.03% | |||||
| Kentucky Bond Development Corporation Danville Centre College Project | 4.00% | 6-1-2046 | $ 800,000 | $ 717,450 | |
| Kentucky Bond Development Corporation Danville Centre College Project | 4.00 | 6-1-2051 | 1,250,000 | 1,099,357 | |
| 1,816,807 | |||||
| Health revenue: 0.24% | |||||
| Kentucky EDFA Norton Healthcare Incorporated Series B (NPFGC Insured) ¤ | 0.00 | 10-1-2024 | 9,260,000 | 8,674,611 | |
| Kentucky EDFA Norton Healthcare Incorporated Series B (NPFGC Insured) ¤ | 0.00 | 10-1-2028 | 5,140,000 | 4,113,855 | |
| 12,788,466 | |||||
| Miscellaneous revenue: 0.05% | |||||
| Kentucky State University Certificate of Participation University Project (BAM Insured) | 4.00 | 11-1-2046 | 640,000 | 636,491 | |
| Kentucky State University Certificate of Participation University Project (BAM Insured) | 4.00 | 11-1-2051 | 1,000,000 | 991,969 | |
| Kentucky State University Certificate of Participation University Project (BAM Insured) | 4.00 | 11-1-2056 | 1,000,000 | 981,745 | |
| 2,610,205 | |||||
| Transportation revenue: 0.16% | |||||
| Kentucky Public Transportation Infrastructure Authority Downtown Crossing Project CAB Series B ¤ | 0.00 | 7-1-2030 | 2,000,000 | 1,369,691 | |
| Kentucky Public Transportation Infrastructure Authority Downtown Crossing Project CAB Series B ¤ | 0.00 | 7-1-2031 | 2,780,000 | 1,770,390 | |
| Kentucky Public Transportation Infrastructure Authority Downtown Crossing Project CAB Series B ¤ | 0.00 | 7-1-2032 | 2,500,000 | 1,478,470 | |
| Kentucky Public Transportation Infrastructure Authority Downtown Crossing Project CAB Series C | 0.00 | 7-1-2033 | 1,000,000 | 1,081,925 | |
| Kentucky Public Transportation Infrastructure Authority Downtown Crossing Project CAB Series C | 0.00 | 7-1-2034 | 2,505,000 | 2,705,727 | |
| 8,406,203 | |||||
| Utilities revenue: 1.19% | |||||
| Kentucky Public Energy Authority Gas Supply Series A-1 | 4.00 | 12-1-2049 | 18,455,000 | 18,701,031 | |
| Kentucky Public Energy Authority Gas Supply Series A2 | 4.00 | 4-1-2048 | 8,190,000 | 8,267,704 | |
| Kentucky Public Energy Authority Gas Supply Series B | 4.00 | 1-1-2049 | 23,250,000 | 23,528,926 | |
| Kentucky Public Energy Authority Gas Supply Series C | 4.00 | 12-1-2049 | 5,385,000 | 5,456,790 | |
| Tender Option Bond Trust Receipts/ Floater Certificates Series 2022-XM0980 (Morgan Stanley Bank LIQ) 144Aø | 1.03 | 8-1-2052 | 7,500,000 | 7,500,000 | |
| 63,454,451 | |||||
| 89,076,132 | |||||
| Louisiana: 0.54% | |||||
| Airport revenue: 0.31% | |||||
| New Orleans LA Aviation Board AMT Series B (AGM Insured) | 5.00 | 1-1-2033 | 3,000,000 | 3,102,216 | |
| New Orleans LA Aviation Board AMT Series B | 5.00 | 1-1-2034 | 4,500,000 | 4,618,296 |
| Interest rate | Maturity date | Principal | Value | ||
| Airport revenue (continued) | |||||
| New Orleans LA Aviation Board General Airport North Terminal Project Series 2017B | 5.00% | 1-1-2048 | $ 1,145,000 | $ 1,174,074 | |
| New Orleans LA Aviation Board Gulf Opportunity Zone Consolidated Rental Car Project (AGM Insured) | 5.00 | 1-1-2036 | 1,750,000 | 1,862,879 | |
| New Orleans LA Aviation Board Gulf Opportunity Zone Consolidated Rental Car Project (AGM Insured) | 5.00 | 1-1-2037 | 1,750,000 | 1,854,357 | |
| New Orleans LA Aviation Board Gulf Opportunity Zone Consolidated Rental Car Project (AGM Insured) | 5.00 | 1-1-2038 | 1,500,000 | 1,586,850 | |
| Port of New Orleans LA AMT Series E | 5.00 | 4-1-2040 | 2,000,000 | 2,118,345 | |
| 16,317,017 | |||||
| Miscellaneous revenue: 0.03% | |||||
| Louisiana Local Government Environmental Facilities and CDA Jefferson Parish Gomesa Project 144Aøø | 4.00 | 11-1-2044 | 1,880,000 | 1,509,536 | |
| Water & sewer revenue: 0.20% | |||||
| East Baton Rouge LA Refunding Bonds Multi Modal Series A | 1.30 | 2-1-2041 | 6,075,000 | 5,274,677 | |
| New Orleans LA Series B (AGM Insured) | 4.00 | 6-1-2038 | 350,000 | 355,915 | |
| New Orleans LA Series B (AGM Insured) | 4.00 | 6-1-2039 | 400,000 | 403,274 | |
| New Orleans LA Series B (AGM Insured) | 4.00 | 6-1-2040 | 350,000 | 352,138 | |
| New Orleans LA Series B | 4.00 | 6-1-2050 | 1,200,000 | 1,161,676 | |
| New Orleans LA Series B | 5.00 | 6-1-2045 | 1,500,000 | 1,647,789 | |
| Shreveport LA Series B (AGM Insured) | 4.00 | 12-1-2036 | 730,000 | 751,305 | |
| Shreveport LA Series B (AGM Insured) | 4.00 | 12-1-2044 | 1,000,000 | 992,852 | |
| 10,939,626 | |||||
| 28,766,179 | |||||
| Maine: 0.20% | |||||
| Health revenue: 0.20% | |||||
| Maine HEFA Mainehealth Series A | 4.00 | 7-1-2040 | 1,700,000 | 1,661,777 | |
| Maine HEFA Mainehealth Series A | 4.00 | 7-1-2045 | 4,500,000 | 4,317,612 | |
| Maine HEFA Series A | 4.00 | 7-1-2046 | 500,000 | 469,464 | |
| Maine HEFA Series A | 4.00 | 7-1-2050 | 1,000,000 | 917,896 | |
| Maine HEFA Series A | 5.00 | 7-1-2028 | 1,445,000 | 1,583,117 | |
| Maine HEFA Series A | 5.00 | 7-1-2029 | 455,000 | 523,207 | |
| Maine HEFA Series A | 5.00 | 7-1-2029 | 1,080,000 | 1,188,998 | |
| 10,662,071 | |||||
| Maryland: 0.45% | |||||
| Education revenue: 0.33% | |||||
| Maryland Economic Development Corporation Salisbury University Project | 5.00 | 6-1-2030 | 200,000 | 200,076 | |
| Maryland Economic Development Corporation Student Housing Salisbury University Project | 5.00 | 6-1-2027 | 235,000 | 235,139 | |
| Prince George's County MD Chesapeake Lighthouse Charter School Project Series 2016-A | 5.75 | 8-1-2033 | 1,585,000 | 1,613,853 | |
| Prince George's County MD Chesapeake Lighthouse Charter School Project Series 2016-A 144A | 6.90 | 8-1-2041 | 8,480,000 | 8,892,761 | |
| Prince George's County MD Chesapeake Lighthouse Charter School Project Series 2016-A | 7.00 | 8-1-2046 | 6,085,000 | 6,407,116 | |
| 17,348,945 |
| Interest rate | Maturity date | Principal | Value | ||
| Health revenue: 0.03% | |||||
| Maryland HEFA Frederick Health System | 4.00% | 7-1-2045 | $ 745,000 | $ 696,162 | |
| Maryland HEFA Frederick Health System | 4.00 | 7-1-2050 | 850,000 | 780,212 | |
| 1,476,374 | |||||
| Miscellaneous revenue: 0.04% | |||||
| Maryland Economic Development Corporation Special Obligation Covington Project | 4.00 | 9-1-2050 | 2,500,000 | 2,030,381 | |
| Water & sewer revenue: 0.05% | |||||
| Baltimore MD Water Projects Series A | 4.00 | 7-1-2039 | 500,000 | 500,053 | |
| Baltimore MD Water Projects Series A | 4.00 | 7-1-2040 | 500,000 | 498,789 | |
| Baltimore MD Water Projects Series A | 4.00 | 7-1-2045 | 2,000,000 | 1,979,596 | |
| 2,978,438 | |||||
| 23,834,138 | |||||
| Massachusetts: 2.29% | |||||
| Airport revenue: 0.09% | |||||
| Massachusetts AMT Series B | 4.00 | 7-1-2046 | 2,965,000 | 2,813,384 | |
| Massachusetts Port Authority AMT Series E | 5.00 | 7-1-2046 | 1,975,000 | 2,100,591 | |
| 4,913,975 | |||||
| Education revenue: 0.15% | |||||
| Lowell MA Collegiate Charter School Revenue | 5.00 | 6-15-2039 | 1,000,000 | 992,073 | |
| Lowell MA Collegiate Charter School Revenue | 5.00 | 6-15-2049 | 1,750,000 | 1,675,084 | |
| Massachusetts Development Finance Agency Lasell University Project | 4.00 | 7-1-2045 | 2,400,000 | 2,010,630 | |
| Massachusetts Development Finance Agency Lasell University Project | 4.00 | 7-1-2050 | 2,750,000 | 2,231,466 | |
| Massachusetts Development Finance Agency Suffolk University Project Series 2021 | 4.00 | 7-1-2051 | 1,000,000 | 867,479 | |
| 7,776,732 | |||||
| GO revenue: 0.18% | |||||
| Massachusetts | 5.00 | 3-1-2041 | 7,500,000 | 7,715,045 | |
| Massachusetts Series E | 5.25 | 9-1-2048 | 1,765,000 | 1,936,603 | |
| 9,651,648 | |||||
| Health revenue: 0.14% | |||||
| Massachusetts Development Finance Agency Revenue Massachusetts General/Brigham & Women's Hospital Series A-2 | 4.00 | 7-1-2040 | 1,000,000 | 988,737 | |
| Massachusetts Development Finance Agency Revenue Massachusetts General/Brigham & Women's Hospital Series A-2 | 4.00 | 7-1-2041 | 1,200,000 | 1,185,012 | |
| Massachusetts Development Finance Agency Revenue Wellforce Incorporated Series C (AGM Insured) | 4.00 | 10-1-2045 | 2,500,000 | 2,369,657 | |
| Massachusetts HEFA Partners Healthcare Systems Series F3 (TD Bank NA LOC) ø | 0.88 | 7-1-2040 | 835,000 | 835,000 | |
| Tender Option Bond Trust Receipts/Floater Certificates Series 2020-XF2891 (Barclays Bank plc LOC, AGM Insured, Barclays Bank plc LIQ) 144Aø | 1.02 | 10-1-2045 | 2,245,000 | 2,245,000 | |
| 7,623,406 |
| Interest rate | Maturity date | Principal | Value | ||
| Tax revenue: 0.91% | |||||
| Massachusetts Series F | 5.00% | 11-1-2041 | $ 5,000,000 | $ 5,405,155 | |
| Massachusetts Transportation Fund Revenue Rail Enhancement & Accelerated Bridge Programs Series A | 5.00 | 6-1-2047 | 6,485,000 | 6,917,188 | |
| Massachusetts Transportation Fund Revenue Rail Enhancement & Accelerated Bridge Programs Series A | 5.00 | 6-1-2048 | 11,510,000 | 12,410,351 | |
| Massachusetts Transportation Fund Revenue Rail Enhancement & Accelerated Bridge Programs Series A | 5.00 | 6-1-2049 | 21,500,000 | 23,363,009 | |
| 48,095,703 | |||||
| Water & sewer revenue: 0.82% | |||||
| Massachusetts Water Resources Authority General Revenue Refunding Bonds Series B (AGM Insured) | 5.25 | 8-1-2036 | 19,180,000 | 23,788,647 | |
| Massachusetts Water Resources Authority General Revenue Refunding Bonds Series B (AGM Insured) | 5.25 | 8-1-2038 | 16,000,000 | 20,048,672 | |
| 43,837,319 | |||||
| 121,898,783 | |||||
| Michigan: 3.67% | |||||
| Airport revenue: 0.17% | |||||
| Wayne County MI Airport Authority AMT | 5.00 | 12-1-2029 | 6,000,000 | 6,307,231 | |
| Wayne County MI Airport Authority AMT (BAM Insured) | 5.00 | 12-1-2046 | 1,400,000 | 1,475,624 | |
| Wayne County MI Airport Authority AMT Series 2021B | 5.00 | 12-1-2041 | 1,145,000 | 1,219,627 | |
| 9,002,482 | |||||
| Education revenue: 0.21% | |||||
| Michigan Finance Authority Limited Obligation Refunding Bond Public School Academy Bradford | 4.30 | 9-1-2030 | 1,195,000 | 1,095,056 | |
| Michigan Finance Authority Limited Obligation Refunding Bond Public School Academy Bradford | 4.80 | 9-1-2040 | 1,205,000 | 1,037,926 | |
| Michigan Finance Authority Limited Obligation Refunding Bond Public School Academy Bradford | 5.00 | 9-1-2050 | 4,530,000 | 3,763,041 | |
| Michigan Finance Authority Refunding Bond Higher Education Facilities | 4.00 | 12-1-2041 | 4,750,000 | 4,343,608 | |
| Michigan Public Educational Facilities Authority Limited Obligation Crescent Academy Project | 7.00 | 10-1-2036 | 1,082,500 | 1,083,171 | |
| 11,322,802 | |||||
| GO revenue: 0.14% | |||||
| Livonia MI Public Schools School District Building & Site Series I | 5.00 | 5-1-2026 | 1,075,000 | 1,103,412 | |
| Livonia MI Public Schools School District Building & Site Series I | 5.00 | 5-1-2028 | 1,450,000 | 1,488,324 | |
| Livonia MI Public Schools School District Building & Site Series I | 5.00 | 5-1-2029 | 1,350,000 | 1,385,681 | |
| Livonia MI Public Schools School District Building & Site Series I | 5.00 | 5-1-2030 | 1,775,000 | 1,821,914 | |
| Livonia MI Public Schools School District Building & Site Series I | 5.00 | 5-1-2031 | 1,425,000 | 1,462,663 | |
| 7,261,994 | |||||
| Health revenue: 0.34% | |||||
| Kentwood MI EDA Limited Obligation Holland Home Project | 4.00 | 11-15-2031 | 1,000,000 | 928,042 |
| Interest rate | Maturity date | Principal | Value | ||
| Health revenue (continued) | |||||
| Kentwood MI EDA Limited Obligation Holland Home Project | 4.00% | 11-15-2045 | $ 750,000 | $ 601,316 | |
| Michigan Finance Authority Hospital Revenue & Refunding Bonds Series 2015 | 5.00 | 11-15-2045 | 8,000,000 | 8,149,108 | |
| Michigan Finance Authority Hospital Revenue & Refunding Bonds Series 2016 | 5.00 | 12-1-2034 | 8,055,000 | 8,485,943 | |
| 18,164,409 | |||||
| Housing revenue: 0.11% | |||||
| Michigan State Housing Development AMT Refunding Bond Series B (TD Bank NA SPA) ø | 0.94 | 6-1-2038 | 6,000,000 | 6,000,000 | |
| Miscellaneous revenue: 1.09% | |||||
| Michigan Building Authority Refunding Facilities Program Bond Series I | 5.00 | 4-15-2041 | 13,000,000 | 13,823,488 | |
| Michigan Finance Authority Charter Company Wayne Criminal Justice Center Project | 4.00 | 11-1-2048 | 6,000,000 | 5,695,014 | |
| Michigan Finance Authority Local Government Loan Program City of Detroit Financial Recovery Refunding Bonds Series F | 4.50 | 10-1-2029 | 7,000,000 | 7,054,541 | |
| Michigan Finance Authority Local Government Loan Program Series H-1 | 5.00 | 10-1-2031 | 1,340,000 | 1,400,571 | |
| Michigan Finance Authority Local Government Loan Program Series H-1 | 5.00 | 10-1-2032 | 2,000,000 | 2,089,076 | |
| Michigan Finance Authority Local Government Loan Program Series H-1 | 5.00 | 10-1-2033 | 2,975,000 | 3,105,526 | |
| Michigan Finance Authority Local Government Loan Program Series H-1 | 5.00 | 10-1-2034 | 6,615,000 | 6,900,842 | |
| Michigan Finance Authority Local Government Loan Program Series H-1 | 5.00 | 10-1-2039 | 7,955,000 | 8,268,932 | |
| Michigan Municipal Bond Authority Local Government Loan Program Series B Group A (Ambac Insured) | 5.25 | 12-1-2023 | 920,000 | 920,274 | |
| Michigan Municipal Bond Authority Local Government Loan Program Series C (Ambac Insured) | 4.75 | 5-1-2027 | 4,610,000 | 4,756,444 | |
| Tender Option Bond Trust Receipts/Certificates Series 2021 XF1115 (Deutsche Bank LIQ) 144Aø | 1.04 | 10-15-2051 | 3,860,000 | 3,860,000 | |
| 57,874,708 | |||||
| Tax revenue: 0.47% | |||||
| Michigan Finance Authority Local Government Loan Program Public Lighting Authority Refunding Bonds Series B | 5.00 | 7-1-2039 | 7,895,000 | 7,982,972 | |
| Michigan Finance Authority Local Government Loan Program Public Lighting Authority Refunding Bonds Series B | 5.00 | 7-1-2044 | 16,845,000 | 16,972,011 | |
| 24,954,983 | |||||
| Water & sewer revenue: 1.14% | |||||
| Great Lakes Michigan Water Authority Sewage Disposal System Series 2016-C | 5.00 | 7-1-2036 | 8,500,000 | 9,044,613 | |
| Great Lakes Michigan Water Authority Water Supply System Series 2016-D | 4.00 | 7-1-2032 | 11,000,000 | 11,260,888 | |
| Great Lakes Michigan Water Authority Water Supply System Series 2016-D (AGM Insured) | 4.00 | 7-1-2033 | 11,000,000 | 11,280,102 | |
| Michigan Finance Authority Local Government Loan Program Detroit Refunding Bond Series D-4 | 5.00 | 7-1-2031 | 6,500,000 | 6,726,932 |
| Interest rate | Maturity date | Principal | Value | ||
| Water & sewer revenue (continued) | |||||
| Michigan Finance Authority Local Government Loan Program Detroit Refunding Bond Series D-6 (NPFGC Insured) | 5.00% | 7-1-2027 | $ 1,000,000 | $ 1,047,127 | |
| Michigan Finance Authority Local Government Loan Program Detroit Refunding Bond Series D-6 (NPFGC Insured) | 5.00 | 7-1-2036 | 3,250,000 | 3,361,560 | |
| Michigan Finance Authority Local Government Loan Program Series C (NPFGC Insured) | 5.00 | 7-1-2025 | 2,000,000 | 2,102,213 | |
| Michigan Finance Authority Local Government Loan Program Series C (NPFGC Insured) | 5.00 | 7-1-2026 | 1,945,000 | 2,040,140 | |
| Michigan Finance Authority Local Government Loan Program Series C (NPFGC Insured) | 5.00 | 7-1-2027 | 2,260,000 | 2,366,507 | |
| Michigan Finance Authority Local Government Loan Program Series C (NPFGC Insured) | 5.00 | 7-1-2028 | 3,480,000 | 3,631,596 | |
| Michigan Finance Authority Local Government Loan Program Series C (NPFGC Insured) | 5.00 | 7-1-2032 | 5,750,000 | 5,964,259 | |
| Michigan Finance Authority Local Government Loan Program Series C | 5.00 | 7-1-2035 | 2,000,000 | 2,090,264 | |
| 60,916,201 | |||||
| 195,497,579 | |||||
| Minnesota: 0.42% | |||||
| Airport revenue: 0.01% | |||||
| Minneapolis & St. Paul MN Metropolitan Refunding Bonds Series A | 5.00 | 1-1-2027 | 500,000 | 516,467 | |
| GO revenue: 0.03% | |||||
| Hennepin County MN Series 2018A | 5.00 | 12-1-2037 | 1,000,000 | 1,095,614 | |
| Shakopee MN Independent School District #720 Capital Facilities (State School District Credit Program Insured) | 4.00 | 2-1-2030 | 225,000 | 236,267 | |
| Shakopee MN Independent School District #720 Capital Facilities (State School District Credit Program Insured) | 4.00 | 2-1-2032 | 240,000 | 250,538 | |
| 1,582,419 | |||||
| Health revenue: 0.30% | |||||
| Minneapolis MN Fairview Health Services Series 2018A | 4.00 | 11-15-2048 | 2,315,000 | 2,126,955 | |
| Shakopee MN Senior Housing Revenue Benedictine Living Community LLC Project 144A | 5.85 | 11-1-2058 | 14,000,000 | 13,973,631 | |
| 16,100,586 | |||||
| Utilities revenue: 0.08% | |||||
| Rochester MN Electric Utility Revenue Refunding Bond Series A | 5.00 | 12-1-2042 | 3,895,000 | 4,267,893 | |
| 22,467,365 | |||||
| Mississippi: 0.14% | |||||
| Water & sewer revenue: 0.14% | |||||
| Mississippi Development Bank Special Obligation Bonds Series 2012A Jackson Water & Sewer System Project (AGM Insured) | 5.00 | 9-1-2030 | 7,465,000 | 7,488,140 |
| Interest rate | Maturity date | Principal | Value | ||
| Missouri: 0.84% | |||||
| GO revenue: 0.10% | |||||
| St. Louis MO Special Administrative Board of St. Louis School District | 4.00% | 4-1-2030 | $ 4,840,000 | $ 5,061,538 | |
| Miscellaneous revenue: 0.73% | |||||
| Kansas City MO IDA | 5.00 | 3-1-2037 | 3,000,000 | 3,161,714 | |
| Kansas City MO IDA Series B (AGM Insured) | 5.00 | 3-1-2049 | 23,075,000 | 23,956,183 | |
| Missouri Public Utilities Commission Interim Construction Notes Series 2022 | 0.75 | 8-1-2023 | 12,000,000 | 11,794,560 | |
| 38,912,457 | |||||
| Tax revenue: 0.01% | |||||
| Blue Springs MO Special Obligation Tax Improvement & Refunding Bonds Adams Farm Project Series A | 4.00 | 6-1-2026 | 805,000 | 772,045 | |
| 44,746,040 | |||||
| Nebraska: 0.19% | |||||
| Health revenue: 0.02% | |||||
| Douglas County NE Hospital Authority Series 2 | 4.00 | 11-15-2040 | 1,150,000 | 1,116,557 | |
| Utilities revenue: 0.17% | |||||
| Central Plains Energy Project Nebraska Refunding Bond Gas Project #3 Series 2012 | 5.00 | 9-1-2027 | 1,020,000 | 1,025,460 | |
| Central Plains Energy Project Nebraska Refunding Bond Gas Project #3 Series 2012 | 5.25 | 9-1-2037 | 1,800,000 | 1,810,329 | |
| Central Plains Energy Project Nebraska Refunding Bond Gas Project #3 Series A 2017-A | 5.00 | 9-1-2033 | 6,000,000 | 6,412,487 | |
| 9,248,276 | |||||
| 10,364,833 | |||||
| Nevada: 2.12% | |||||
| GO revenue: 2.10% | |||||
| Clark County NV Refunding Bond Limited Tax | 4.00 | 7-1-2032 | 6,000,000 | 6,259,206 | |
| Clark County NV School District Series A (AGM Insured) | 4.00 | 6-15-2035 | 9,585,000 | 9,854,560 | |
| Clark County NV School District Series A (AGM Insured) | 4.00 | 6-15-2036 | 850,000 | 882,090 | |
| Clark County NV School District Series A (AGM Insured) | 4.00 | 6-15-2037 | 900,000 | 925,516 | |
| Clark County NV School District Series A (AGM Insured) | 4.00 | 6-15-2038 | 850,000 | 863,266 | |
| Clark County NV School District Series A (AGM Insured) | 4.00 | 6-15-2039 | 1,000,000 | 1,006,867 | |
| Clark County NV School District Series A (AGM Insured) | 5.00 | 6-15-2030 | 875,000 | 1,002,391 | |
| Clark County NV School District Series A (AGM Insured) | 5.00 | 6-15-2032 | 900,000 | 1,022,475 | |
| Clark County NV School District Series A (AGM Insured) | 5.00 | 6-15-2033 | 825,000 | 927,664 | |
| Clark County NV School District Series A (AGM Insured) | 5.00 | 6-15-2034 | 950,000 | 1,065,783 | |
| Clark County NV School District Series A (AGM Insured) | 5.00 | 6-15-2035 | 1,000,000 | 1,119,620 | |
| Clark County NV Series A | 5.00 | 6-1-2043 | 9,360,000 | 10,091,604 | |
| Clark County NV Series A | 5.00 | 5-1-2048 | 50,215,000 | 53,866,148 | |
| Henderson NV Limited Tax Utility System Series A-1 | 4.00 | 6-1-2045 | 9,140,000 | 8,979,822 | |
| Henderson NV Series B-1 | 4.00 | 6-1-2039 | 4,060,000 | 4,115,337 | |
| Henderson NV Series B-1 | 4.00 | 6-1-2040 | 3,340,000 | 3,378,544 | |
| Las Vegas NV Series A | 4.00 | 2-1-2038 | 1,335,000 | 1,353,430 | |
| Las Vegas NV Water District Series 2022A | 4.00 | 6-1-2034 | 4,600,000 | 4,803,315 | |
| 111,517,638 |
| Interest rate | Maturity date | Principal | Value | ||
| Industrial development revenue: 0.02% | |||||
| Clark County NV Southern California Edison Company Project | 2.10% | 6-1-2031 | $ 1,250,000 | $ 1,031,065 | |
| Miscellaneous revenue: 0.00% | |||||
| Las Vegas NV Special Improvement District #60 Local Improvement | 5.00 | 6-1-2023 | 220,000 | 223,295 | |
| Las Vegas NV Special Improvement District #60 Local Improvement | 5.00 | 6-1-2024 | 90,000 | 92,532 | |
| 315,827 | |||||
| 112,864,530 | |||||
| New Hampshire: 0.28% | |||||
| Health revenue: 0.07% | |||||
| New Hampshire HEFA Kendal at Hanover Project Series B (TD Bank NA LOC) ø | 0.91 | 10-1-2030 | 3,960,000 | 3,960,000 | |
| Housing revenue: 0.12% | |||||
| New Hampshire National Finance Authority Municipal Certificates Series A | 4.13 | 1-20-2034 | 6,278,148 | 6,176,211 | |
| Industrial development revenue: 0.09% | |||||
| New Hampshire Finance Authority Lonza Biologics Incorporated (Landesbank Hessen-Thüringen LOC) ø | 0.97 | 9-1-2030 | 5,000,000 | 5,000,000 | |
| 15,136,211 | |||||
| New Jersey: 3.42% | |||||
| Airport revenue: 0.03% | |||||
| South Jersey Port Corporation Marine Terminal Refunding Bond Series 2016S | 5.00 | 1-1-2039 | 1,350,000 | 1,390,059 | |
| Education revenue: 0.19% | |||||
| Atlantic City NJ Improvement Authority Stockton University Project (AGM Insured) | 4.00 | 7-1-2047 | 750,000 | 704,947 | |
| New Jersey Educational Facilities Authority Higher Education Facilities Trust Fund | 5.00 | 6-15-2025 | 5,830,000 | 6,036,850 | |
| Rutgers University Series L | 5.00 | 5-1-2033 | 3,560,000 | 3,657,054 | |
| 10,398,851 | |||||
| GO revenue: 0.37% | |||||
| Bayonne NJ School Refunding Bonds (AGM Insured) | 5.00 | 7-15-2023 | 2,505,000 | 2,586,419 | |
| Newark NJ Qualified General Improvement Series A | 5.00 | 7-15-2025 | 5,000,000 | 5,306,179 | |
| Newark NJ Qualified General Improvement Series A | 5.00 | 7-15-2026 | 2,205,000 | 2,344,111 | |
| Newark NJ Qualified General Improvement Series A | 5.00 | 7-15-2027 | 6,035,000 | 6,404,726 | |
| Newark NJ Qualified General Improvement Series A | 5.25 | 7-15-2024 | 1,325,000 | 1,391,495 | |
| Newark NJ Qualified General Improvement Series B | 5.00 | 7-15-2025 | 385,000 | 408,576 | |
| Newark NJ Qualified General Improvement Series B | 5.00 | 7-15-2026 | 395,000 | 418,387 | |
| Newark NJ Qualified General Improvement Series B | 5.00 | 7-15-2027 | 405,000 | 428,364 | |
| Newark NJ Qualified General Improvement Series B | 5.25 | 7-15-2024 | 375,000 | 393,819 | |
| 19,682,076 |
| Interest rate | Maturity date | Principal | Value | ||
| Industrial development revenue: 0.19% | |||||
| New Jersey EDA | 5.00% | 3-1-2025 | $ 4,000,000 | $ 4,071,592 | |
| New Jersey EDA Continental Airlines Incorporated Project | 5.25 | 9-15-2029 | 5,960,000 | 6,028,597 | |
| 10,100,189 | |||||
| Miscellaneous revenue: 0.70% | |||||
| New Jersey EDA Motor Vehicle Surcharge Revenue Refunding Bonds Series A | 3.13 | 7-1-2029 | 2,620,000 | 2,482,878 | |
| New Jersey EDA School Facilities Construction Refunding Bond Series NN | 5.00 | 3-1-2026 | 11,000,000 | 11,193,292 | |
| Newark NJ Housing Authority & Port Authority Port Newark Marine Terminal Rental Refunding Bond Newark Redevelopment Project (NPFGC Insured) | 5.00 | 1-1-2032 | 7,620,000 | 8,203,744 | |
| Newark NJ Housing Authority & Port Authority Port Newark Marine Terminal Rental Refunding Bond Newark Redevelopment Project (NPFGC Insured) | 5.25 | 1-1-2024 | 1,225,000 | 1,261,442 | |
| Tender Option Bond Trust Receipts/Floater Certificates Series 2016-XM0226 (BHAC / NPFGC Insured, Bank of America NA LIQ) 144Aø | 0.95 | 9-11-2025 | 4,000,000 | 4,000,000 | |
| Union County NJ Utilities Authority Refunding Bond AMT Covanta Union Series A | 5.25 | 12-1-2031 | 9,960,000 | 9,978,607 | |
| 37,119,963 | |||||
| Tax revenue: 0.55% | |||||
| New Jersey Garden State Preservation Trust Open & Farmland Series A (AGM Insured) | 5.75 | 11-1-2028 | 15,000,000 | 16,815,539 | |
| New Jersey Series 2020-A | 4.00 | 6-1-2030 | 2,550,000 | 2,695,377 | |
| New Jersey Series 2020-A | 4.00 | 6-1-2031 | 9,500,000 | 10,024,640 | |
| 29,535,556 | |||||
| Transportation revenue: 1.39% | |||||
| New Jersey TTFA CAB Series A ¤ | 0.00 | 12-15-2028 | 10,100,000 | 7,939,622 | |
| New Jersey TTFA CAB Series A ¤ | 0.00 | 12-15-2029 | 11,875,000 | 8,902,515 | |
| New Jersey TTFA CAB Series A ¤ | 0.00 | 12-15-2031 | 4,500,000 | 3,053,021 | |
| New Jersey TTFA CAB Transportation System Series A ¤ | 0.00 | 12-15-2026 | 1,150,000 | 988,066 | |
| New Jersey TTFA CAB Transportation System Series A ¤ | 0.00 | 12-15-2030 | 8,000,000 | 5,708,107 | |
| New Jersey TTFA Program Bonds Series AA | 5.00 | 6-15-2038 | 2,000,000 | 2,137,695 | |
| New Jersey TTFA Series A ¤ | 0.00 | 12-15-2039 | 10,000,000 | 4,357,998 | |
| New Jersey TTFA Series A (NPFGC Insured) | 5.75 | 6-15-2025 | 10,000,000 | 10,847,296 | |
| New Jersey TTFA Series AA | 4.00 | 6-15-2045 | 2,195,000 | 2,034,081 | |
| New Jersey TTFA Series AA | 5.00 | 6-15-2039 | 3,000,000 | 3,180,214 | |
| New Jersey TTFA Series AA | 5.00 | 6-15-2044 | 1,000,000 | 1,014,248 | |
| New Jersey TTFA Series AA | 5.00 | 6-15-2045 | 3,500,000 | 3,649,755 | |
| New Jersey TTFA Series AA | 5.25 | 6-15-2033 | 10,000,000 | 10,151,872 | |
| New Jersey TTFA Transportation System Series A | 5.00 | 12-15-2036 | 1,500,000 | 1,575,356 | |
| New Jersey TTFA Transportation System Series C | 5.25 | 6-15-2032 | 8,000,000 | 8,267,634 | |
| 73,807,480 | |||||
| 182,034,174 |
| Interest rate | Maturity date | Principal | Value | ||
| New Mexico: 0.30% | |||||
| Industrial development revenue: 0.20% | |||||
| Farmington NM PCR | 1.80% | 4-1-2029 | $ 5,000,000 | $ 4,311,183 | |
| Farmington NM PCR | 1.80 | 4-1-2029 | 7,000,000 | 6,035,656 | |
| 10,346,839 | |||||
| Utilities revenue: 0.10% | |||||
| New Mexico Municipal Energy Acquisition Authority Gas Supply Revenue Refunding & Acquisition Bond Subordinated Series A (Royal Bank of Canada LIQ) | 5.00 | 11-1-2039 | 5,140,000 | 5,416,215 | |
| 15,763,054 | |||||
| New York: 11.05% | |||||
| Airport revenue: 1.18% | |||||
| New York Transportation Development Corporation Special Facilities Revenue Terminal 4 John F Kennedy International Airport | 3.00 | 8-1-2031 | 2,000,000 | 1,825,632 | |
| New York Transportation Development Corporation Special Facilities Revenue Terminal 4 John F Kennedy International Airport | 4.00 | 12-1-2039 | 700,000 | 650,173 | |
| New York Transportation Development Corporation Special Facilities Revenue Terminal 4 John F Kennedy International Airport | 4.00 | 12-1-2040 | 900,000 | 830,349 | |
| New York Transportation Development Corporation Special Facilities Revenue Terminal 4 John F Kennedy International Airport | 5.00 | 12-1-2036 | 1,750,000 | 1,839,715 | |
| New York Transportation Development Corporation Special Facilities Revenue Terminal 4 John F Kennedy International Airport | 5.00 | 12-1-2037 | 700,000 | 726,901 | |
| New York Transportation Development Corporation Special Facilities Revenue Terminal 4 John F Kennedy International Airport | 5.00 | 12-1-2037 | 1,750,000 | 1,834,768 | |
| New York Transportation Development Corporation Special Facilities Revenue Terminal 4 John F Kennedy International Airport | 5.00 | 12-1-2037 | 2,000,000 | 2,086,260 | |
| New York Transportation Development Corporation Special Facilities Revenue Terminal 4 John F Kennedy International Airport | 5.00 | 12-1-2038 | 3,000,000 | 3,125,813 | |
| New York Transportation Development Corporation Special Facilities Revenue Terminal 4 John F Kennedy International Airport | 5.00 | 12-1-2039 | 13,000,000 | 13,514,684 | |
| New York Transportation Development Corporation Special Facilities Revenue Terminal 4 John F Kennedy International Airport | 5.00 | 12-1-2042 | 3,385,000 | 3,496,359 | |
| New York Transportation Development Corporation Special Facilities Revenue Terminal 4 John F. Kennedy International Airport | 5.00 | 12-1-2032 | 1,000,000 | 1,049,435 | |
| New York Transportation Development Corporation Special Facilities Revenue Terminal 4 John F. Kennedy International Airport Project Series 2020C | 5.00 | 12-1-2035 | 2,475,000 | 2,608,737 | |
| Port Authority of New York & New Jersey Series 193 | 5.00 | 10-15-2028 | 1,760,000 | 1,861,645 | |
| Port Authority of New York & New Jersey Series 205 | 5.25 | 11-15-2039 | 16,580,000 | 18,114,852 | |
| Port Authority of New York & New Jersey Series 211 | 5.00 | 9-1-2048 | 2,000,000 | 2,179,689 |
| Interest rate | Maturity date | Principal | Value | ||
| Airport revenue (continued) | |||||
| Port Authority of New York & New Jersey Series 218 | 4.00% | 11-1-2041 | $ 2,275,000 | $ 2,147,012 | |
| Port Authority of New York & New Jersey Series 221 | 4.00 | 7-15-2045 | 5,000,000 | 4,667,095 | |
| 62,559,119 | |||||
| Education revenue: 0.52% | |||||
| Hempstead NY Local Development Corporation The Academy Charter School Project Series A | 4.60 | 2-1-2051 | 5,000,000 | 3,907,237 | |
| Hempstead NY Local Development Corporation The Academy Charter School Project Series A | 5.73 | 2-1-2050 | 10,030,000 | 10,096,794 | |
| New York Dormitory Authority Barnard College Series A | 4.00 | 7-1-2045 | 1,270,000 | 1,195,237 | |
| New York Dormitory Authority Barnard College Series A | 4.00 | 7-1-2049 | 1,000,000 | 921,086 | |
| New York Dormitory Authority Iona College | 5.00 | 7-1-2027 | 335,000 | 357,712 | |
| New York Dormitory Authority New York University Series A | 5.00 | 7-1-2049 | 4,265,000 | 4,605,769 | |
| New York Dormitory Authority St. John's University Series A | 4.00 | 7-1-2048 | 2,000,000 | 1,844,996 | |
| Westchester County NY Local Development Pace University Series B ø | 1.37 | 5-1-2044 | 5,000,000 | 5,000,000 | |
| 27,928,831 | |||||
| GO revenue: 1.06% | |||||
| New York NY Fiscal 2020 Subordinate Bond Series B-1 | 4.00 | 8-1-2039 | 3,000,000 | 2,971,214 | |
| New York NY Fiscal 2020 Subordinate Bond Series B-1 | 5.00 | 10-1-2038 | 2,650,000 | 2,907,339 | |
| New York NY Fiscal 2022 Subordinate Bond Series D-1 | 5.25 | 5-1-2041 | 6,000,000 | 6,730,719 | |
| New York NY Fiscal 2022 Subordinate Bond Series D-1 | 5.25 | 5-1-2042 | 1,000,000 | 1,116,310 | |
| New York NY General Obligation Bonds Subseries F-1 | 5.00 | 3-1-2043 | 4,000,000 | 4,350,477 | |
| New York NY General Obligation Bonds Subseries F-1 | 5.00 | 3-1-2050 | 6,000,000 | 6,487,428 | |
| New York NY Series E-1 | 5.00 | 3-1-2039 | 8,800,000 | 9,393,195 | |
| New York NY Series F-1 | 5.00 | 3-1-2032 | 3,000,000 | 3,067,854 | |
| New York NY Series S-2 | 5.00 | 7-15-2041 | 13,805,000 | 14,409,611 | |
| Yonkers NY Series 2022-C (AGM Insured) | 5.00 | 3-15-2036 | 2,000,000 | 2,250,674 | |
| Yonkers NY Series 2022-C (AGM Insured) | 5.00 | 3-15-2037 | 1,100,000 | 1,233,022 | |
| Yonkers NY Series 2022-C (AGM Insured) | 5.00 | 3-15-2038 | 1,140,000 | 1,273,479 | |
| 56,191,322 | |||||
| Health revenue: 0.14% | |||||
| Tender Option Bond Trust/Floater Certificates Series 2020-XG0294 (FHA Insured, Bank of America NA LIQ) 144Aø | 0.95 | 2-1-2050 | 4,200,000 | 4,200,000 | |
| Westchester County NY Kendal on Hudson Project Series 2013 | 5.00 | 1-1-2028 | 1,805,000 | 1,822,577 | |
| Westchester County NY Local Development Corporation Purchase Senior Learning Community Incorporated 144A | 2.88 | 7-1-2026 | 1,500,000 | 1,400,955 | |
| 7,423,532 | |||||
| Industrial development revenue: 0.78% | |||||
| Monroe County NY IDA Continuing Development Services Project (Citizens Bank LOC) ø | 1.01 | 7-1-2027 | 575,000 | 575,000 | |
| New York Liberty Development Corporation Refunding Bonds 1 World Trade Center Project | 4.00 | 2-15-2043 | 4,500,000 | 4,327,331 | |
| New York Liberty Development Corporation Refunding Bonds 4 World Trade Center Project | 2.80 | 9-15-2069 | 1,000,000 | 903,397 | |
| New York Transportation Development Corporation New York State Thruway Service Areas Project | 4.00 | 10-31-2041 | 2,000,000 | 1,750,493 |
| Interest rate | Maturity date | Principal | Value | ||
| Industrial development revenue (continued) | |||||
| New York Transportation Development Corporation New York State Thruway Service Areas Project | 4.00% | 10-31-2046 | $ 1,500,000 | $ 1,263,071 | |
| New York Transportation Development Corporation Special Facilities AMT Revenue | 5.00 | 1-1-2032 | 12,000,000 | 12,211,536 | |
| New York Transportation Development Corporation Special Facility AMT Revenue Delta Air Lines Incorporated LaGuardia Airport Terminals C&D Redevelopment | 5.00 | 10-1-2035 | 20,000,000 | 20,226,826 | |
| 41,257,654 | |||||
| Miscellaneous revenue: 0.18% | |||||
| New York Dormitory Authority Non-State Supported School Districts Bond Financing Program Series A (AGM Insured) | 5.00 | 10-1-2034 | 1,750,000 | 1,929,302 | |
| New York Dormitory Authority Non-State Supported School Districts Bond Financing Program Series A (AGM Insured) | 5.00 | 10-1-2035 | 1,000,000 | 1,101,335 | |
| New York NY IDA Queens Baseball Stadium Project (AGM Insured) | 5.00 | 1-1-2031 | 1,000,000 | 1,111,620 | |
| New York Transportation Development Corporation New York State Thruway Service Areas Project | 4.00 | 3-15-2044 | 5,000,000 | 4,887,126 | |
| New York Western Regional Off Track Betting Corporation 144A | 4.13 | 12-1-2041 | 1,000,000 | 788,620 | |
| 9,818,003 | |||||
| Resource recovery revenue: 0.10% | |||||
| New York NY Environmental Facilities Corporation Waste Management Incorporated Project Series 2012 | 2.00 | 5-1-2030 | 5,150,000 | 5,149,784 | |
| Tax revenue: 3.54% | |||||
| New York Dormitory Authority Series A | 4.00 | 3-15-2042 | 6,000,000 | 5,872,993 | |
| New York Dormitory Authority Series A | 4.00 | 3-15-2044 | 2,700,000 | 2,635,274 | |
| New York Dormitory Authority Series A | 5.00 | 2-15-2034 | 3,790,000 | 4,067,646 | |
| New York Dormitory Authority Series D | 4.00 | 2-15-2039 | 5,000,000 | 4,923,212 | |
| New York Dormitory Authority Series D | 5.00 | 2-15-2048 | 12,500,000 | 13,516,551 | |
| New York Dormitory Authority State Personal Income Tax Series B | 4.00 | 3-15-2046 | 11,300,000 | 11,003,227 | |
| New York Dormitory Authority State Personal Income Tax Series B | 5.00 | 2-15-2045 | 7,330,000 | 7,587,169 | |
| New York Dormitory Authority State Personal Income Tax Series E | 5.00 | 2-15-2044 | 10,000 | 10,735 | |
| New York Dormitory Authority State Personal Income Tax Series E | 5.00 | 2-15-2044 | 9,590,000 | 9,938,580 | |
| New York NY Transitional Finance Authority Building Aid Revenue Fiscal Year 2015 Series S1 | 5.00 | 7-15-2040 | 3,155,000 | 3,280,350 | |
| New York NY Transitional Finance Authority Building Aid Revenue Fiscal Year 2019 Subordinate Bond Series S3 A | 4.00 | 7-15-2038 | 4,500,000 | 4,405,734 | |
| New York NY Transitional Finance Authority Future Tax Secured Revenue Series A2 | 5.00 | 8-1-2037 | 12,140,000 | 13,092,552 | |
| New York NY Transitional Finance Authority Future Tax Secured Revenue Series I | 5.00 | 5-1-2033 | 5,395,000 | 5,504,552 | |
| New York NY Transitional Finance Authority Future Tax Secured Subordinate Bond | 4.00 | 11-1-2035 | 5,000,000 | 5,043,243 | |
| New York NY Transitional Finance Authority Future Tax Secured Subordinate Bond | 5.00 | 5-1-2038 | 5,000,000 | 5,451,251 |
| Interest rate | Maturity date | Principal | Value | ||
| Tax revenue (continued) | |||||
| New York NY Transitional Finance Authority Future Tax Secured Subordinate Bond Series A | 5.00% | 8-1-2031 | $17,075,000 | $ 18,011,069 | |
| New York NY Transitional Finance Authority Future Tax Secured Subordinate Bond Series E | 4.00 | 2-1-2038 | 4,000,000 | 3,995,046 | |
| New York NY Transitional Finance Authority Future Tax Secured Subordinate Bond Series F1 | 5.00 | 5-1-2042 | 2,390,000 | 2,543,531 | |
| New York Urban Development Corporation Series 2020A | 5.00 | 3-15-2041 | 3,750,000 | 4,081,953 | |
| New York Urban Development Corporation Series 2020A | 5.00 | 3-15-2042 | 4,075,000 | 4,425,867 | |
| New York Urban Development Corporation Series 2020C | 4.00 | 3-15-2042 | 8,045,000 | 7,853,542 | |
| New York Urban Development Corporation Series 2020C | 5.00 | 3-15-2047 | 8,000,000 | 8,630,015 | |
| New York Urban Development Corporation Series 2020E | 4.00 | 3-15-2043 | 8,040,000 | 7,816,736 | |
| Tender Option Bond Trust Receipts/Certificates Series 2021-XF1109 (Deutsche Bank LIQ) 144Aø | 1.04 | 3-15-2048 | 3,630,000 | 3,630,000 | |
| Triborough Bridge & Tunnel Authority Series 2020-A | 4.00 | 5-15-2042 | 2,250,000 | 2,208,101 | |
| Triborough Bridge & Tunnel Authority Series 2022-A | 5.00 | 5-15-2047 | 15,000,000 | 16,431,221 | |
| Triborough Bridge & Tunnel Authority Series 2022-B %% | 5.00 | 5-15-2039 | 10,240,000 | 11,410,084 | |
| Triborough Bridge & Tunnel Authority Subordinated Bond Series A1 | 4.00 | 5-15-2046 | 1,250,000 | 1,213,365 | |
| 188,583,599 | |||||
| Transportation revenue: 1.49% | |||||
| New York Metropolitan Transportation Authority Refunding Bond Series A | 5.00 | 11-15-2030 | 950,000 | 958,908 | |
| New York Metropolitan Transportation Authority Refunding Green Bonds Series D1 | 5.00 | 11-15-2034 | 5,000,000 | 5,219,146 | |
| New York Metropolitan Transportation Authority Revenue Various Refunding Bonds Transportation Subordinated Series G-3 (SIFMA Municipal Swap +0.43%) ± | 1.41 | 11-1-2031 | 15,000,000 | 14,993,828 | |
| New York Metropolitan Transportation Authority Series 2019C (AGM Insured) | 5.00 | 11-15-2041 | 9,700,000 | 10,300,136 | |
| New York Metropolitan Transportation Authority Series D | 5.00 | 11-15-2029 | 20,000,000 | 20,236,358 | |
| New York Metropolitan Transportation Authority Subordinated Bond Series A1 | 5.00 | 11-15-2040 | 3,425,000 | 3,561,150 | |
| New York Metropolitan Transportation Authority Subordinated Bond Series A-1 | 5.00 | 11-15-2048 | 7,300,000 | 7,623,056 | |
| Triborough Bridge & Tunnel Authority Series 2020-A | 5.00 | 11-15-2049 | 7,750,000 | 8,317,223 | |
| Triborough Bridge & Tunnel Authority Subordinated Bonds series B-2 (State Street Bank & Trust Company LOC) ø | 1.11 | 1-1-2032 | 5,900,000 | 5,900,000 | |
| Triborough Bridge & Tunnel Authority Subordinated Bonds Series B-2 (State Street Bank & Trust Company LOC) ø | 1.19 | 1-1-2032 | 1,950,000 | 1,950,000 | |
| 79,059,805 | |||||
| Utilities revenue: 0.59% | |||||
| New York Utility Debt Securitization Authority Restructuring Bonds | 5.00 | 12-15-2032 | 22,785,000 | 24,404,947 | |
| New York Utility Debt Securitization Authority Restructuring Bonds | 5.00 | 12-15-2037 | 3,780,000 | 4,009,166 | |
| New York Utility Debt Securitization Authority Restructuring Bonds | 5.00 | 12-15-2040 | 2,870,000 | 3,153,423 | |
| 31,567,536 |
| Interest rate | Maturity date | Principal | Value | ||
| Water & sewer revenue: 1.47% | |||||
| New York NY Environmental Facilities Corporation Municipal Water Trust | 4.00% | 6-15-2049 | $ 5,000,000 | $ 4,877,041 | |
| New York NY Environmental Facilities Corporation Municipal Water Trust | 5.00 | 6-15-2048 | 10,035,000 | 10,914,509 | |
| New York NY Municipal Water Finance Authority 2nd General Resolution Series 2018 | 5.00 | 6-15-2048 | 3,000,000 | 3,221,141 | |
| New York NY Municipal Water Finance Authority 2nd General Resolution Series AA | 5.00 | 6-15-2035 | 25,000,000 | 27,557,183 | |
| New York NY Municipal Water Finance Authority 2nd General Resolution Series BB | 5.00 | 6-15-2047 | 2,330,000 | 2,345,539 | |
| New York NY Municipal Water Finance Authority 2nd General Resolution Series FF | 4.00 | 6-15-2041 | 15,000,000 | 14,890,883 | |
| New York NY Water Finance Authority Series DD | 5.25 | 6-15-2047 | 11,490,000 | 12,581,001 | |
| Western Nassau County NY Water Authority Series A | 4.00 | 4-1-2046 | 1,100,000 | 1,071,076 | |
| Western Nassau County NY Water Authority Series A | 4.00 | 4-1-2051 | 1,000,000 | 962,425 | |
| 78,420,798 | |||||
| 587,959,983 | |||||
| North Carolina: 0.52% | |||||
| Airport revenue: 0.07% | |||||
| Raleigh Durham NC Airport Authority Refunding Bond AMT Series A | 5.00 | 5-1-2035 | 3,400,000 | 3,680,015 | |
| Education revenue: 0.12% | |||||
| North Carolina Capital Facilities Finance Agency Forest University Series 2016 | 5.00 | 1-1-2033 | 1,000,000 | 1,080,588 | |
| North Carolina Capital Facilities Finance Agency Meredith College Series 2018 | 5.00 | 6-1-2038 | 500,000 | 520,454 | |
| University of North Carolina at Ashville Series 2017 | 5.00 | 6-1-2042 | 625,000 | 663,633 | |
| University of North Carolina at Greensboro Series 2014 | 5.00 | 4-1-2033 | 2,000,000 | 2,100,343 | |
| University of North Carolina at Greensboro Series 2014 | 5.00 | 4-1-2039 | 1,620,000 | 1,701,278 | |
| University of North Carolina Chapel Hill Series 2009- A (TD Bank NA SPA) ø | 0.88 | 2-1-2024 | 580,000 | 580,000 | |
| 6,646,296 | |||||
| Health revenue: 0.09% | |||||
| Charlotte-Mecklenburg NC Hospital Authority Health Care Refunding Bonds Series 2018 | 5.00 | 1-15-2036 | 500,000 | 538,528 | |
| North Carolina Medical Care Commission Deerfield Episcopal Retirement Community Project Series 2016 | 5.00 | 11-1-2031 | 1,500,000 | 1,600,407 | |
| North Carolina Medical Care Commission Forest Duke Project | 4.00 | 9-1-2051 | 1,100,000 | 973,619 | |
| North Carolina Medical Care Commission Presbyterian Homes Project Series 2016C | 4.00 | 10-1-2031 | 1,500,000 | 1,452,555 | |
| 4,565,109 |
| Interest rate | Maturity date | Principal | Value | ||
| Housing revenue: 0.04% | |||||
| North Carolina Facilities Finance Agency The Arc of North Carolina Project Series 2017A (Department of Housing and Urban Development Insured) | 5.00% | 10-1-2034 | $ 1,000,000 | $ 1,044,379 | |
| North Carolina Facilities Finance Agency The North Carolina A&T University Foundation LLC Project Series 2015A (AGC Insured) | 5.00 | 6-1-2027 | 1,000,000 | 1,068,521 | |
| 2,112,900 | |||||
| Miscellaneous revenue: 0.07% | |||||
| Charlotte NC Certificate of Participation Equipment Acquisition and Public Facilities Series A | 5.00 | 12-1-2026 | 1,160,000 | 1,162,285 | |
| Charlotte NC Certificate of Participation Transit Projects Series C | 5.00 | 6-1-2030 | 1,000,000 | 1,022,419 | |
| Raleigh NC Limited Obligation Series A | 5.00 | 10-1-2033 | 1,000,000 | 1,050,201 | |
| Wilmington NC Limited Obligation Series A | 5.00 | 6-1-2030 | 400,000 | 433,590 | |
| 3,668,495 | |||||
| Transportation revenue: 0.13% | |||||
| North Carolina Department of Transportation I-77 HOT Lanes Project Series 2015 | 5.00 | 6-30-2028 | 1,275,000 | 1,314,191 | |
| North Carolina Turnpike Authority Monroe Expressway Toll Revenue Bond Series 2016A | 5.00 | 7-1-2042 | 500,000 | 507,973 | |
| North Carolina Turnpike Authority Triangle Expressway System (AGM Insured) | 5.00 | 1-1-2049 | 4,500,000 | 4,915,761 | |
| 6,737,925 | |||||
| 27,410,740 | |||||
| North Dakota: 0.26% | |||||
| Miscellaneous revenue: 0.18% | |||||
| University of North Dakota Infrastructure Energy Improvement Project Green Certificates Series A | 5.00 | 4-1-2057 | 9,000,000 | 9,566,308 | |
| Water & sewer revenue: 0.08% | |||||
| North Dakota PFA Revolving Fund Program Series A | 5.00 | 10-1-2038 | 3,780,000 | 4,218,332 | |
| 13,784,640 | |||||
| Ohio: 2.21% | |||||
| Education revenue: 0.08% | |||||
| Allen County OH Port Authority | 4.00 | 12-1-2035 | 650,000 | 607,603 | |
| Allen County OH Port Authority | 4.00 | 12-1-2040 | 720,000 | 645,292 | |
| Ohio HEFA Kenyon College 2023 Project %% | 5.00 | 7-1-2037 | 3,100,000 | 3,252,718 | |
| 4,505,613 | |||||
| GO revenue: 0.03% | |||||
| Highland OH Local School District Medina County School Improvement Series A | 5.25 | 12-1-2054 | 1,500,000 | 1,548,606 | |
| Health revenue: 0.81% | |||||
| Cleveland Cuyahoga County OH Facilities Improvement Centers for Dialysis | 5.00 | 12-1-2047 | 5,205,000 | 5,222,209 | |
| Franklin County OH Trinity Health Credit Group | 4.00 | 12-1-2044 | 3,450,000 | 3,259,883 | |
| Hamilton County OH Hospital Facilities Revenue Bonds | 5.00 | 11-15-2041 | 2,250,000 | 2,599,018 | |
| Hamilton County OH Hospital Facilities Revenue Bonds | 5.00 | 9-15-2045 | 7,500,000 | 7,801,136 |
| Interest rate | Maturity date | Principal | Value | ||
| Health revenue (continued) | |||||
| Lucas County OH Hospital Revenue Promedica Healthcare Obligation | 5.25% | 11-15-2048 | $15,000,000 | $ 14,358,135 | |
| Middleburg Heights OH Hospital Revenue Refunding Bonds Facilities Southwest General Health | 4.00 | 8-1-2041 | 1,100,000 | 1,060,759 | |
| Middleburg Heights OH Hospital Revenue Refunding Bonds Facilities Southwest General Health | 4.00 | 8-1-2047 | 3,000,000 | 2,781,373 | |
| Middleburg Heights OH Hospital Revenue Refunding Bonds Facilities Southwest General Health Center | 4.00 | 8-1-2041 | 3,730,000 | 3,507,544 | |
| Montgomery County OH Hospital Revenue Refunding Bonds | 4.00 | 11-15-2039 | 3,000,000 | 2,677,164 | |
| 43,267,221 | |||||
| Miscellaneous revenue: 0.82% | |||||
| Ohio Private Activity Bond AMT Portsmouth Bypass Project (AGM Insured) | 5.00 | 12-31-2026 | 2,030,000 | 2,161,952 | |
| Ohio Private Activity Bond AMT Portsmouth Bypass Project (AGM Insured) | 5.00 | 12-31-2028 | 1,610,000 | 1,703,732 | |
| Ohio Private Activity Bond AMT Portsmouth Bypass Project (AGM Insured) | 5.00 | 12-31-2030 | 2,250,000 | 2,369,788 | |
| Ohio Private Activity Bond AMT Portsmouth Bypass Project (AGM Insured) | 5.00 | 12-31-2035 | 12,000,000 | 12,562,050 | |
| Ohio Private Activity Bond AMT Portsmouth Bypass Project (AGM Insured) | 5.00 | 12-31-2039 | 2,500,000 | 2,574,042 | |
| Ohio Series A | 5.00 | 2-1-2036 | 4,265,000 | 4,575,333 | |
| Ohio Special Obligation Various Capital Facilities Lease ø | 0.90 | 12-1-2041 | 5,000,000 | 5,000,000 | |
| Ohio Water Development Authority Drinking Water Assistance Fund | 5.00 | 12-1-2035 | 5,390,000 | 5,877,910 | |
| Ohio Water Development Authority Drinking Water Assistance Fund | 5.00 | 12-1-2036 | 2,000,000 | 2,178,445 | |
| Ohio Water Development Authority Fresh Water Series B | 5.00 | 12-1-2034 | 1,895,000 | 2,069,003 | |
| RiverSouth OH Lazarus Building Redevelopment Series A | 5.75 | 12-1-2027 | 2,575,000 | 2,575,744 | |
| 43,647,999 | |||||
| Tax revenue: 0.10% | |||||
| Franklin County OH | 5.00 | 6-1-2048 | 5,000,000 | 5,418,850 | |
| Transportation revenue: 0.33% | |||||
| Ohio Turnpike Commission CAB Series A-4 ¤ | 0.00 | 2-15-2034 | 8,500,000 | 9,565,039 | |
| Ohio Turnpike Commission CAB Series A-4 %% | 5.00 | 2-15-2039 | 7,000,000 | 7,802,325 | |
| 17,367,364 | |||||
| Utilities revenue: 0.04% | |||||
| Ohio Air Quality Refunding Bonds Series 2022B | 4.25 | 11-1-2039 | 2,000,000 | 2,024,670 | |
| 117,780,323 | |||||
| Oklahoma: 1.06% | |||||
| Airport revenue: 0.58% | |||||
| Oklahoma City OK Airport Trust Series 33 | 5.00 | 7-1-2043 | 9,000,000 | 9,367,160 | |
| Oklahoma City OK Airport Trust Series 33 | 5.00 | 7-1-2047 | 11,500,000 | 11,915,734 | |
| Tulsa OK Airports Improvement Trust AMT Series A (BAM Insured) | 5.00 | 6-1-2035 | 1,055,000 | 1,107,812 |
| Interest rate | Maturity date | Principal | Value | ||
| Airport revenue (continued) | |||||
| Tulsa OK Airports Improvement Trust Series A (AGM Insured) | 5.00% | 6-1-2043 | $ 4,485,000 | $ 4,670,327 | |
| Tulsa OK Airports Improvement Trust Series A (AGM Insured) | 5.25 | 6-1-2048 | 3,770,000 | 3,950,732 | |
| 31,011,765 | |||||
| Miscellaneous revenue: 0.45% | |||||
| Garfield County OK Educational Facilities Authority Enid Public Schools Project Series A | 5.00 | 9-1-2030 | 2,000,000 | 2,168,839 | |
| Garfield County OK Educational Facilities Authority Enid Public Schools Project Series A | 5.00 | 9-1-2031 | 1,145,000 | 1,240,258 | |
| Muskogee OK Industrial Trust Educational Facilities Lease Muskogee Public Schools Project | 4.00 | 9-1-2030 | 4,440,000 | 4,565,860 | |
| Muskogee OK Industrial Trust Educational Facilities Lease Muskogee Public Schools Project | 4.00 | 9-1-2031 | 5,520,000 | 5,645,954 | |
| Muskogee OK Industrial Trust Educational Facilities Lease Muskogee Public Schools Project | 4.00 | 9-1-2032 | 4,000,000 | 4,072,457 | |
| Oklahoma Development Finance Authority Revenue Bonds Series 2022A | 5.25 | 6-1-2037 | 4,535,000 | 5,126,842 | |
| Pontotoc County OK Education Facilities Authority Ada Public Schools Project | 4.00 | 9-1-2040 | 1,000,000 | 973,608 | |
| 23,793,818 | |||||
| Transportation revenue: 0.02% | |||||
| Oklahoma Turnpike Authority Revenue Series A | 5.00 | 1-1-2042 | 1,000,000 | 1,049,404 | |
| Water & sewer revenue: 0.01% | |||||
| McGee Creek Oklahoma Authority (NPFGC Insured) | 6.00 | 1-1-2023 | 645,000 | 656,566 | |
| 56,511,553 | |||||
| Oregon: 0.51% | |||||
| GO revenue: 0.15% | |||||
| Jackson County OR School District #005 (AGM Insured) | 5.00 | 6-15-2030 | 2,560,000 | 2,900,706 | |
| Jackson County OR School District #005 (AGM Insured) | 5.00 | 6-15-2031 | 2,125,000 | 2,389,258 | |
| Jackson County OR School District #005 (AGM Insured) | 5.00 | 6-15-2032 | 2,350,000 | 2,625,857 | |
| 7,915,821 | |||||
| Health revenue: 0.32% | |||||
| Clackamas County OR Hospital Facility Authority Senior Living Rose Ville Series A | 5.13 | 11-15-2040 | 500,000 | 489,201 | |
| Clackamas County OR Hospital Facility Authority Senior Living Rose Ville Series A | 5.25 | 11-15-2050 | 500,000 | 472,529 | |
| Clackamas County OR Hospital Facility Authority Senior Living Rose Ville Series A | 5.38 | 11-15-2055 | 1,000,000 | 953,082 | |
| Medford OR Hospital Facilities Refunding Bonds Asante Project Series A (AGM Insured) | 4.00 | 8-15-2045 | 13,650,000 | 13,075,234 | |
| Oregon Health Sciences University Revenue Series A | 4.00 | 7-1-2044 | 2,000,000 | 1,957,387 | |
| 16,947,433 |
| Interest rate | Maturity date | Principal | Value | ||
| Utilities revenue: 0.04% | |||||
| Eugene OR Electric Utility Revenue Series A | 4.00% | 8-1-2045 | $ 1,260,000 | $ 1,256,445 | |
| Eugene OR Electric Utility Revenue Series A | 4.00 | 8-1-2049 | 800,000 | 789,242 | |
| 2,045,687 | |||||
| 26,908,941 | |||||
| Pennsylvania: 5.51% | |||||
| Airport revenue: 0.70% | |||||
| Allegheny County PA Airport Authority Series 2021A (AGM Insured) | 4.00 | 1-1-2046 | 2,000,000 | 1,884,898 | |
| Allegheny County PA Airport Authority Series 2021A | 5.00 | 1-1-2036 | 10,000,000 | 10,698,199 | |
| Philadelphia PA Airport Series A | 5.00 | 7-1-2047 | 9,950,000 | 10,233,341 | |
| Philadelphia PA Airport Series B | 5.00 | 7-1-2029 | 1,000,000 | 1,074,880 | |
| Philadelphia PA Airport Series B | 5.00 | 7-1-2031 | 750,000 | 796,664 | |
| Philadelphia PA Airport Series B | 5.00 | 7-1-2042 | 7,860,000 | 8,126,710 | |
| Philadelphia PA Airport Series C | 4.00 | 7-1-2037 | 1,695,000 | 1,632,616 | |
| Philadelphia PA Airport Series C | 4.00 | 7-1-2038 | 1,260,000 | 1,205,280 | |
| Philadelphia PA Airport Series C | 4.00 | 7-1-2039 | 1,830,000 | 1,741,286 | |
| 37,393,874 | |||||
| Education revenue: 0.23% | |||||
| Montgomery County PA Higher Education & Health Authority Arcadia University | 5.00 | 4-1-2024 | 1,540,000 | 1,596,607 | |
| Montgomery County PA Higher Education & Health Authority Arcadia University | 5.00 | 4-1-2025 | 1,625,000 | 1,696,892 | |
| Pennsylvania Higher Educational Facilities Revenue Drexel University Series A (AGM Insured) | 5.00 | 5-1-2046 | 4,885,000 | 5,310,833 | |
| Philadelphia PA IDA 1st Philadelphia Preparatory Charter School Project Series A | 7.00 | 6-15-2033 | 2,000,000 | 2,128,093 | |
| Philadelphia PA IDA New Foundations Charter School Project | 6.00 | 12-15-2027 | 270,000 | 275,425 | |
| Philadelphia PA IDA University Revenue Refunding Bond St. Joseph's University Project | 4.00 | 11-1-2038 | 1,000,000 | 942,917 | |
| 11,950,767 | |||||
| GO revenue: 0.37% | |||||
| Allegheny County PA West Mifflin Area School District (AGM Insured) | 5.00 | 4-1-2025 | 1,180,000 | 1,256,112 | |
| Allegheny County PA West Mifflin Area School District (AGM Insured) | 5.00 | 4-1-2026 | 1,200,000 | 1,299,213 | |
| Allegheny County PA West Mifflin Area School District (AGM Insured) | 5.00 | 4-1-2027 | 1,000,000 | 1,102,552 | |
| North Pocono PA School District Notes Series A (AGM Insured) | 4.00 | 9-15-2029 | 2,170,000 | 2,327,374 | |
| North Pocono PA School District Notes Series A (AGM Insured) | 4.00 | 9-15-2032 | 1,750,000 | 1,823,600 | |
| Philadelphia PA School District Series A | 5.00 | 9-1-2024 | 2,075,000 | 2,192,238 | |
| Philadelphia PA School District Series F | 5.00 | 9-1-2035 | 3,820,000 | 4,015,285 | |
| Williamsport PA Area School District (AGM Insured) | 4.00 | 3-1-2032 | 1,440,000 | 1,473,081 | |
| Williamsport PA Area School District (AGM Insured) | 4.00 | 3-1-2033 | 1,490,000 | 1,519,379 | |
| Williamsport PA Area School District (AGM Insured) | 4.00 | 3-1-2034 | 1,555,000 | 1,576,213 | |
| Williamsport PA Area School District (AGM Insured) | 4.00 | 3-1-2035 | 1,205,000 | 1,219,400 | |
| 19,804,447 |
| Interest rate | Maturity date | Principal | Value | ||
| Health revenue: 1.51% | |||||
| Allegheny County PA Hospital Development Authority Series 2017D-2 (SIFMA Municipal Swap +0.70%) ± | 1.68% | 11-15-2047 | $10,000,000 | $ 9,968,906 | |
| Allegheny County PA Hospital Development Authority Series A | 4.00 | 7-15-2039 | 2,250,000 | 2,180,076 | |
| Chester County PA HEFA Main Line Health System Series A | 4.00 | 9-1-2050 | 3,500,000 | 3,321,090 | |
| Geisinger PA Health System Series A-1 | 4.00 | 2-15-2047 | 10,000,000 | 9,418,374 | |
| Montgomery County PA HEFA Thomas Jefferson University | 4.00 | 9-1-2035 | 2,750,000 | 2,751,130 | |
| Montgomery County PA HEFA Thomas Jefferson University | 4.00 | 9-1-2038 | 1,000,000 | 990,494 | |
| Montgomery County PA HEFA Thomas Jefferson University | 5.00 | 9-1-2031 | 4,100,000 | 4,415,006 | |
| Montgomery County PA Higher Education & Health Authority Series 2018D ø | 1.21 | 9-1-2050 | 16,425,000 | 16,425,000 | |
| Pennsylvania EDFA Series 2013A | 5.00 | 7-1-2038 | 6,000,000 | 6,087,234 | |
| Pennsylvania EDFA Series 2022A | 5.00 | 2-15-2036 | 1,000,000 | 1,107,367 | |
| Pennsylvania EDFA Series 2022A | 5.00 | 2-15-2038 | 2,150,000 | 2,359,555 | |
| Pennsylvania EDFA Series 2022A | 5.00 | 2-15-2039 | 3,500,000 | 3,827,021 | |
| Pennsylvania EDFA Series A-1 | 4.00 | 4-15-2045 | 6,500,000 | 6,084,690 | |
| Pennsylvania Higher Educational Facilities Revenue University of Pennsylvania Series A | 5.00 | 8-15-2042 | 3,000,000 | 3,173,100 | |
| Quakertown PA General Authority Health LifeQuest Obligated Group Series C | 4.50 | 7-1-2027 | 750,000 | 733,710 | |
| Quakertown PA General Authority Health LifeQuest Obligated Group Series C | 5.00 | 7-1-2032 | 1,000,000 | 972,560 | |
| The Hospitals and Higher Education Facilities Authority of Philadelphia Revenue Bonds Series 2022 (AGM Insured) | 5.00 | 7-1-2037 | 4,175,000 | 4,517,272 | |
| Westmoreland County PA IDA Excela Health Project Series A | 4.00 | 7-1-2037 | 625,000 | 584,989 | |
| Westmoreland County PA IDA Excela Health Project Series A | 5.00 | 7-1-2029 | 700,000 | 760,202 | |
| Westmoreland County PA IDA Excela Health Project Series A | 5.00 | 7-1-2030 | 550,000 | 599,626 | |
| 80,277,402 | |||||
| Industrial development revenue: 0.33% | |||||
| Pennsylvania EDFA Bridges FinCo LP | 5.00 | 12-31-2030 | 600,000 | 618,321 | |
| Pennsylvania EDFA Bridges FinCo LP | 5.00 | 12-31-2034 | 16,375,000 | 16,734,487 | |
| 17,352,808 | |||||
| Miscellaneous revenue: 0.81% | |||||
| Delaware Valley Regional Finance Authority Local Government Public Improvements Project | 5.75 | 7-1-2032 | 9,525,000 | 11,407,666 | |
| Delaware Valley Regional Finance Authority Local Government Series C (Ambac Insured) | 7.75 | 7-1-2027 | 4,025,000 | 4,974,811 | |
| Pennsylvania Finance Authority Pennsylvania Hills Project Series B (NPFGC Insured) ¤ | 0.00 | 12-1-2025 | 1,060,000 | 955,063 | |
| State Public School Building Authority Pennsylvania Philadelphia School District Project Series A | 5.00 | 6-1-2024 | 2,250,000 | 2,355,324 | |
| State Public School Building Authority Pennsylvania Philadelphia School District Project Series A | 5.00 | 6-1-2034 | 1,915,000 | 2,067,723 | |
| State Public School Building Authority Pennsylvania Philadelphia School District Project Series A | 5.00 | 6-1-2035 | 16,715,000 | 18,033,722 | |
| Waverly Township Municipal Authority Career Technology Center (BAM Insured) | 4.00 | 2-15-2030 | 1,065,000 | 1,129,641 |
| Interest rate | Maturity date | Principal | Value | ||
| Miscellaneous revenue (continued) | |||||
| Waverly Township Municipal Authority Career Technology Center (BAM Insured) | 4.00% | 2-15-2031 | $ 1,110,000 | $ 1,169,998 | |
| Waverly Township Municipal Authority Career Technology Center (BAM Insured) | 4.00 | 2-15-2032 | 1,155,000 | 1,197,703 | |
| 43,291,651 | |||||
| Resource recovery revenue: 0.09% | |||||
| Pennsylvania EDFA Solid Waste Disposal Waste Management Incorporated Project Series 2013 | 2.00 | 8-1-2045 | 5,000,000 | 4,999,791 | |
| Tax revenue: 0.17% | |||||
| Allentown PA Neighborhood Improvement Zone Development Authority Refunding Bond | 5.00 | 5-1-2036 | 750,000 | 801,628 | |
| Allentown PA Neighborhood Improvement Zone Development Authority Refunding Bond | 5.00 | 5-1-2042 | 2,000,000 | 2,091,802 | |
| Pennsylvania Turnpike Commission Series B | 5.00 | 12-1-2043 | 6,000,000 | 6,328,304 | |
| 9,221,734 | |||||
| Transportation revenue: 1.00% | |||||
| Delaware River Port Authority Project Series 2013 | 5.00 | 1-1-2040 | 17,000,000 | 17,250,895 | |
| Pennsylvania Turnpike Commission Motor License Series B-2 | 5.00 | 12-1-2035 | 9,900,000 | 10,737,488 | |
| Pennsylvania Turnpike Commission Series A | 4.00 | 12-1-2046 | 3,000,000 | 2,800,551 | |
| Pennsylvania Turnpike Commission Series A | 5.00 | 12-1-2044 | 5,905,000 | 6,335,349 | |
| Pennsylvania Turnpike Commission Series A-1 | 5.00 | 12-1-2047 | 1,750,000 | 1,850,933 | |
| Pennsylvania Turnpike Commission Series C | 5.00 | 12-1-2046 | 4,125,000 | 4,443,782 | |
| Pennsylvania Turnpike Commission Subordinate Bond Series B-1 | 5.00 | 6-1-2027 | 1,150,000 | 1,270,176 | |
| Pennsylvania Turnpike Commission Subordinate Bond Series B-1 | 5.00 | 6-1-2028 | 1,450,000 | 1,578,725 | |
| Pennsylvania Turnpike Commission Subordinate Bond Series B-2 | 5.00 | 6-1-2027 | 1,260,000 | 1,391,671 | |
| Pennsylvania Turnpike Commission Subordinate Bond Series B-2 | 5.00 | 6-1-2028 | 5,005,000 | 5,449,322 | |
| 53,108,892 | |||||
| Utilities revenue: 0.04% | |||||
| Pennsylvania EDFA Exempt Facilities Refunding Bond Energy Supply LLC (MUFG Bank Limited LOC) ø | 1.50 | 12-1-2038 | 2,000,000 | 2,000,000 | |
| Water & sewer revenue: 0.26% | |||||
| Luzerne County PA IDA Refunding Bonds AMT Pennsylvania American Water Company Project | 2.45 | 12-1-2039 | 5,500,000 | 5,205,248 | |
| Philadelphia PA Series B | 5.00 | 7-1-2033 | 8,000,000 | 8,529,894 | |
| 13,735,142 | |||||
| 293,136,508 | |||||
| Puerto Rico: 0.02% | |||||
| Tax revenue: 0.02% | |||||
| Puerto Rico Highway & Transportation Authority Series CC (AGM Insured) | 5.50 | 7-1-2029 | 825,000 | 861,172 |
| Interest rate | Maturity date | Principal | Value | ||
| Rhode Island: 0.08% | |||||
| Airport revenue: 0.04% | |||||
| Rhode Island Commerce Corporation First Lien Special Facility Airport Corporation Intermodal Facility Project Series 2018 | 5.00% | 7-1-2031 | $ 2,115,000 | $ 2,284,432 | |
| Education revenue: 0.04% | |||||
| Rhonde Island HEFA Building Corporation Providence College Series A | 5.00 | 11-1-2046 | 1,855,000 | 2,038,159 | |
| 4,322,591 | |||||
| South Carolina: 0.66% | |||||
| Education revenue: 0.20% | |||||
| South Carolina Jobs EDA York Preparatory Academy Project Series A | 7.25 | 11-1-2045 | 1,500,000 | 1,671,618 | |
| University of South Carolina Athletic Facilities Series A | 5.00 | 5-1-2043 | 8,155,000 | 8,759,791 | |
| 10,431,409 | |||||
| Health revenue: 0.22% | |||||
| South Carolina Jobs EDA Prisma Health Obligated Group Series C ø | 1.23 | 5-1-2048 | 12,000,000 | 12,000,000 | |
| Resource recovery revenue: 0.04% | |||||
| South Carolina Jobs EDA † | 8.00 | 12-6-2029 | 370,000 | 305,758 | |
| South Carolina Jobs EDA Solid Waste Disposal AMT RePower South Berkeley LLC Project Green Bond 144A† | 6.00 | 2-1-2035 | 1,880,000 | 752,000 | |
| South Carolina Jobs EDA Solid Waste Disposal AMT RePower South Berkeley LLC Project Green Bond 144A† | 6.25 | 2-1-2045 | 2,750,000 | 1,100,000 | |
| 2,157,758 | |||||
| Utilities revenue: 0.20% | |||||
| Patriots Energy Group Financing Agency South Carolina Series A (Royal Bank of Canada LIQ) | 4.00 | 10-1-2048 | 9,040,000 | 9,205,445 | |
| South Carolina Public Service Authority Refunding & Improvement Bonds Series A | 4.00 | 12-1-2040 | 1,500,000 | 1,427,106 | |
| 10,632,551 | |||||
| 35,221,718 | |||||
| South Dakota: 0.39% | |||||
| Health revenue: 0.26% | |||||
| South Dakota HEFA Sanford Health Project Series E | 5.00 | 11-1-2042 | 13,465,000 | 13,624,120 | |
| Housing revenue: 0.13% | |||||
| South Dakota Board of Regents Housing & Auxiliary Facilities System | 5.00 | 4-1-2023 | 750,000 | 768,269 | |
| South Dakota Board of Regents Housing & Auxiliary Facilities System | 5.00 | 4-1-2024 | 1,100,000 | 1,154,802 | |
| South Dakota Board of Regents Housing & Auxiliary Facilities System | 5.00 | 4-1-2025 | 1,000,000 | 1,071,362 | |
| South Dakota Board of Regents Housing & Auxiliary Facilities System | 5.00 | 4-1-2026 | 1,540,000 | 1,678,217 |
| Interest rate | Maturity date | Principal | Value | ||
| Housing revenue (continued) | |||||
| South Dakota Board of Regents Housing & Auxiliary Facilities System | 5.00% | 4-1-2032 | $ 1,010,000 | $ 1,107,413 | |
| South Dakota Board of Regents Housing & Auxiliary Facilities System | 5.00 | 4-1-2033 | 1,250,000 | 1,363,911 | |
| 7,143,974 | |||||
| 20,768,094 | |||||
| Tennessee: 0.87% | |||||
| Utilities revenue: 0.87% | |||||
| Tennergy Corporation Tennessee Gas Series A | 4.00 | 12-1-2051 | 25,000,000 | 25,139,018 | |
| Tennessee Energy Acquisition Corporation Gas Project Series 2018 | 4.00 | 11-1-2049 | 20,000,000 | 20,308,786 | |
| Tennessee Energy Acquisition Corporation Series A | 5.25 | 9-1-2026 | 1,020,000 | 1,083,506 | |
| 46,531,310 | |||||
| Texas: 8.26% | |||||
| Airport revenue: 0.47% | |||||
| Austin TX Airport System AMT | 5.00 | 11-15-2039 | 8,000,000 | 8,269,637 | |
| Austin TX Airport System AMT | 5.00 | 11-15-2044 | 3,500,000 | 3,601,921 | |
| Austin TX Airport System AMT Series 2022 | 5.00 | 11-15-2040 | 3,000,000 | 3,223,552 | |
| Houston TX Airport System Subordinate Bond Lien AMT | 5.00 | 7-15-2027 | 2,500,000 | 2,535,026 | |
| Houston TX Airport System Subordinate Bond Lien AMT Series A | 5.00 | 7-1-2041 | 4,750,000 | 4,960,795 | |
| Port of Houston TX Series 2021 | 4.00 | 10-1-2039 | 2,500,000 | 2,494,204 | |
| 25,085,135 | |||||
| Education revenue: 0.73% | |||||
| Clifton TX Higher Education Finance Corporation International Leadership Series A | 5.75 | 8-15-2038 | 2,000,000 | 2,025,374 | |
| Clifton TX Higher Education Finance Corporation International Leadership Texas Series 2021T | 4.00 | 8-15-2047 | 3,000,000 | 2,767,690 | |
| Clifton TX Higher Education Finance Corporation International Leadership Texas Series 2022A | 4.00 | 8-15-2047 | 2,500,000 | 2,461,487 | |
| Clifton TX Higher Education Finance Corporation International Leadership Texas Series D | 6.00 | 8-15-2038 | 6,000,000 | 6,127,225 | |
| Clifton TX Higher Education Finance Corporation International Leadership Texas Series D | 6.13 | 8-15-2048 | 6,750,000 | 6,878,300 | |
| Hale Center Education Facilities Corporation Refunding and Improvement Bonds Wayland Baptist University Project Series 2022 | 5.00 | 3-1-2031 | 2,140,000 | 2,253,178 | |
| Southwest Texas Higher Education Authority Incorporated Southern Methodist University Project | 5.00 | 10-1-2030 | 1,460,000 | 1,618,960 | |
| Southwest Texas Higher Education Authority Incorporated Southern Methodist University Project | 5.00 | 10-1-2032 | 650,000 | 715,096 | |
| Southwest Texas Higher Education Authority Incorporated Southern Methodist University Project | 5.00 | 10-1-2039 | 750,000 | 814,665 | |
| Southwest Texas Higher Education Authority Incorporated Southern Methodist University Project | 5.00 | 10-1-2040 | 1,000,000 | 1,084,681 | |
| Southwest Texas Higher Education Authority Incorporated Southern Methodist University Project | 5.00 | 10-1-2041 | 900,000 | 975,029 |
| Interest rate | Maturity date | Principal | Value | ||
| Education revenue (continued) | |||||
| Tender Option Bond Trust Receipts/Certificates Series 2021 MS0002 (Morgan Stanley Bank LIQ) 144Aø | 1.11% | 6-15-2056 | $ 8,000,000 | $ 8,000,000 | |
| University of Houston Refunding Bonds Series 2022A | 5.00 | 2-15-2047 | 3,000,000 | 3,303,066 | |
| 39,024,751 | |||||
| GO revenue: 2.00% | |||||
| El Paso TX | 4.00 | 8-15-2031 | 6,500,000 | 6,708,265 | |
| Houston TX Public Improvement Refunding Bonds Series A | 4.00 | 3-1-2034 | 1,000,000 | 1,026,591 | |
| Houston TX Public Improvement Refunding Bonds Series A | 5.00 | 3-1-2029 | 2,160,000 | 2,385,058 | |
| Nacogdoches TX Independent School District | 5.00 | 2-15-2049 | 8,560,000 | 9,330,502 | |
| Palestine TX Certificate of Obligation (AGM Insured) | 4.00 | 2-15-2051 | 4,000,000 | 3,736,720 | |
| Port Isabel TX Series 2019 144A | 5.10 | 2-15-2049 | 955,000 | 974,683 | |
| Royse City TX Independent School District | 5.00 | 8-15-2034 | 3,025,000 | 3,240,304 | |
| Salado TX Independent School District | 5.00 | 2-15-2049 | 1,605,000 | 1,749,469 | |
| San Antonio TX Independent School District | 5.00 | 8-15-2048 | 13,000,000 | 13,825,074 | |
| Sugar Land TX Refunding Bonds | 5.00 | 2-15-2030 | 1,250,000 | 1,376,517 | |
| Temple TX Refunding Bonds | 5.00 | 8-1-2032 | 1,070,000 | 1,133,492 | |
| Tender Option Bond Trust Receipts/Floater Certificates Series 2021-XL0182 (Deutsche Bank LOC, Deutsche Bank LIQ) 144Aø | 1.04 | 7-1-2046 | 2,285,000 | 2,285,000 | |
| Texas Refunding Bond Series B | 5.00 | 10-1-2036 | 24,500,000 | 26,191,037 | |
| Travis County TX | 5.00 | 3-1-2036 | 12,470,000 | 14,008,022 | |
| Travis County TX | 5.00 | 3-1-2039 | 6,250,000 | 6,979,511 | |
| Viridian TX Municipal Management District Texas Road Improvement Project Series 2019 (BAM Insured) | 4.00 | 12-1-2033 | 555,000 | 561,991 | |
| Viridian TX Municipal Management District Texas Road Improvement Project Series 2019 (BAM Insured) | 4.00 | 12-1-2034 | 630,000 | 637,323 | |
| Viridian TX Municipal Management District Texas Road Improvement Project Series 2019 (BAM Insured) | 4.00 | 12-1-2034 | 835,000 | 844,705 | |
| Viridian TX Municipal Management District Texas Road Improvement Project Series 2019 (BAM Insured) | 4.00 | 12-1-2035 | 655,000 | 661,889 | |
| Viridian TX Municipal Management District Texas Road Improvement Project Series 2019 (BAM Insured) | 4.00 | 12-1-2035 | 865,000 | 874,098 | |
| Viridian TX Municipal Management District Texas Road Improvement Project Series 2019 (BAM Insured) | 4.00 | 12-1-2036 | 680,000 | 685,927 | |
| Viridian TX Municipal Management District Texas Road Improvement Project Series 2019 (BAM Insured) | 4.00 | 12-1-2036 | 905,000 | 912,888 | |
| Williamson County TX | 4.00 | 2-15-2031 | 6,195,000 | 6,288,855 | |
| 106,417,921 | |||||
| Health revenue: 0.20% | |||||
| Harris County TX Health Facilities Development Corporation Series A3 (AGM Insured) € | 1.75 | 7-1-2031 | 3,000,000 | 3,000,000 | |
| Harris County TX Texas Childrens Hospital Series A | 4.00 | 10-1-2037 | 3,000,000 | 3,008,007 | |
| Harris County TX Texas Childrens Hospital Series A | 4.00 | 10-1-2038 | 2,300,000 | 2,301,241 | |
| New Hope ECFA Children's Health System of Texas Project Series A | 4.00 | 8-15-2033 | 2,050,000 | 2,033,787 | |
| 10,343,035 |
| Interest rate | Maturity date | Principal | Value | ||
| Housing revenue: 0.09% | |||||
| Alamito TX Public Facilities Corporation MFHR Housing Authority of El Paso Rental Assistance Demonstration Conversion Program (Department of Housing and Urban Development Insured) | 2.90% | 5-1-2037 | $ 5,000,000 | $ 5,015,452 | |
| Miscellaneous revenue: 0.42% | |||||
| Lewisville TX Combination Contract Castle Hills Public Improvement Bonds District #6 144A | 6.00 | 9-1-2037 | 1,770,000 | 1,835,762 | |
| Lewisville TX Combination Contract Castle Hills Public Improvement Bonds District #6 144A | 6.00 | 9-1-2037 | 8,355,000 | 8,665,420 | |
| Lower Colorado TX River Authority Series A | 5.00 | 5-15-2033 | 2,475,000 | 2,522,804 | |
| Texas PFA | 4.00 | 2-1-2034 | 5,000,000 | 5,010,115 | |
| Texas PFA | 4.00 | 2-1-2035 | 2,000,000 | 2,000,418 | |
| Texas PFA | 4.00 | 2-1-2036 | 2,175,000 | 2,169,753 | |
| 22,204,272 | |||||
| Resource recovery revenue: 0.15% | |||||
| Port Arthur TX Navigation District Jefferson County Environmental Facilities Motiva Enterprises LLC Project Series E ø | 1.18 | 11-1-2040 | 8,100,000 | 8,100,000 | |
| Tax revenue: 0.15% | |||||
| Dallas TX Area Rapid Transit Sales Tax Revenue Series A | 5.00 | 12-1-2048 | 5,000,000 | 5,464,646 | |
| Old Spanish Trail/Almeda Corridors RDA (BAM Insured) | 4.00 | 9-1-2036 | 1,125,000 | 1,161,603 | |
| Old Spanish Trail/Almeda Corridors RDA (BAM Insured) | 4.00 | 9-1-2037 | 1,430,000 | 1,474,317 | |
| 8,100,566 | |||||
| Transportation revenue: 1.48% | |||||
| Central Texas Regional Mobility Authority Senior Lien Series A | 5.00 | 1-1-2033 | 3,740,000 | 3,802,966 | |
| Central Texas Regional Mobility Authority Senior Lien Series A | 5.00 | 1-1-2044 | 3,000,000 | 3,166,914 | |
| Central Texas Regional Mobility Authority Senior Lien Series A | 5.00 | 1-1-2049 | 2,450,000 | 2,571,221 | |
| Central Texas Regional Mobility Authority Senior Lien Series B | 4.00 | 1-1-2041 | 800,000 | 764,164 | |
| Central Texas Regional Mobility Authority Senior Lien Series B | 5.00 | 1-1-2046 | 1,600,000 | 1,687,642 | |
| Grand Parkway Transportation Corporation CAB Series B øø | 0.00 | 10-1-2029 | 1,015,000 | 1,080,857 | |
| Grand Parkway Transportation Corporation CAB Series B øø | 0.00 | 10-1-2030 | 2,000,000 | 2,126,189 | |
| Grand Parkway Transportation Corporation CAB Series B | 4.00 | 10-1-2039 | 2,500,000 | 2,513,390 | |
| Grand Parkway Transportation Corporation Series C | 4.00 | 10-1-2045 | 28,185,000 | 27,195,109 | |
| North Texas Tollway Authority Series A | 5.00 | 1-1-2033 | 3,600,000 | 3,759,343 | |
| North Texas Tollway Authority Series A | 5.00 | 1-1-2035 | 4,000,000 | 4,169,616 | |
| Tender Option Bond Trust Receipts Series 2019-XM0756 (Deutsche Bank LIQ) 144Aø | 0.73 | 6-30-2058 | 6,000,000 | 6,000,000 | |
| Texas Private Activity Bond Surface Transportation Corporation Project NTE Mobility Partners Segments LLC | 4.00 | 12-31-2037 | 3,000,000 | 2,753,235 |
| Interest rate | Maturity date | Principal | Value | ||
| Transportation revenue (continued) | |||||
| Texas Private Activity Bond Surface Transportation Corporation Project NTE Mobility Partners Segments LLC | 6.75% | 6-30-2043 | $ 4,000,000 | $ 4,116,328 | |
| Texas Private Activity Bond Surface Transportation Corporation Project NTE Mobility Partners Segments LLC | 7.00 | 12-31-2038 | 12,500,000 | 12,921,326 | |
| 78,628,300 | |||||
| Utilities revenue: 0.15% | |||||
| Lower Colorado TX River Authority Series A (AGM Insured) | 4.00 | 5-15-2040 | 2,500,000 | 2,509,356 | |
| Texas Municipal Gas Acquisition & Supply Corporation Refunding Bond | 5.00 | 12-15-2032 | 5,000,000 | 5,328,807 | |
| 7,838,163 | |||||
| Water & sewer revenue: 2.42% | |||||
| Austin TX Water & Wastewater Refunding Bond | 5.00 | 11-15-2045 | 15,065,000 | 16,028,247 | |
| Brownsville TX Refunding Bonds Series 2022 (BAM Insured) | 5.00 | 9-1-2046 | 1,000,000 | 1,060,600 | |
| Brownsville TX Refunding Bonds Series 2022 (BAM Insured) | 5.00 | 9-1-2051 | 1,000,000 | 1,054,262 | |
| Dallas TX Waterworks & Sewer System Refunding Bond Series A | 5.00 | 10-1-2030 | 3,810,000 | 4,104,877 | |
| Tarrant TX Regional Water District | 5.00 | 9-1-2034 | 3,500,000 | 3,714,481 | |
| Tarrant TX Regional Water District | 5.00 | 3-1-2049 | 15,000,000 | 15,761,418 | |
| Texas Series A | 4.00 | 10-15-2036 | 5,000,000 | 5,140,450 | |
| Texas Series B | 5.00 | 4-15-2049 | 42,000,000 | 45,392,122 | |
| Texas Water Development Board Series 2017-A | 4.00 | 10-15-2037 | 11,650,000 | 11,924,351 | |
| Texas Water Development Board Series 2020 | 4.00 | 8-1-2038 | 2,500,000 | 2,537,803 | |
| Texas Water Implementation Fund Series A | 4.00 | 10-15-2036 | 1,015,000 | 1,049,096 | |
| Texas Water Implementation Fund Series A | 4.00 | 10-15-2037 | 4,000,000 | 4,104,960 | |
| Texas Water Implementation Fund Series A | 4.00 | 10-15-2038 | 6,500,000 | 6,597,993 | |
| Texas Water Implementation Fund Series A | 4.00 | 10-15-2044 | 9,905,000 | 9,998,920 | |
| 128,469,580 | |||||
| 439,227,175 | |||||
| Utah: 0.65% | |||||
| Airport revenue: 0.59% | |||||
| Salt Lake City UT AMT Series A | 5.00 | 7-1-2034 | 5,910,000 | 6,423,084 | |
| Salt Lake City UT AMT Series A | 5.00 | 7-1-2035 | 5,000,000 | 5,402,416 | |
| Salt Lake City UT AMT Series A | 5.00 | 7-1-2036 | 2,500,000 | 2,638,312 | |
| Salt Lake City UT AMT Series A | 5.00 | 7-1-2043 | 1,500,000 | 1,574,953 | |
| Salt Lake City UT AMT Series A | 5.00 | 7-1-2043 | 2,500,000 | 2,603,331 | |
| Salt Lake City UT AMT Series A | 5.00 | 7-1-2048 | 3,500,000 | 3,656,171 | |
| Salt Lake City UT AMT Series A | 5.00 | 7-1-2048 | 5,500,000 | 5,698,197 | |
| Salt Lake City UT AMT Series A | 5.25 | 7-1-2048 | 3,000,000 | 3,148,939 | |
| 31,145,403 | |||||
| Education revenue: 0.04% | |||||
| University of Utah (Citibank NA LIQ) 144Aø | 1.01 | 2-1-2023 | 2,000,000 | 2,000,000 |
| Interest rate | Maturity date | Principal | Value | ||
| Miscellaneous revenue: 0.02% | |||||
| Mida Mountain Village Public Infrastructure District Utah Special Assessment Revenue Bonds Area #2 Series 2021 144A | 4.00% | 8-1-2050 | $ 1,500,000 | $ 1,160,672 | |
| 34,306,075 | |||||
| Virginia: 0.37% | |||||
| GO revenue: 0.12% | |||||
| Norfolk VA Series C | 4.00 | 9-1-2032 | 5,810,000 | 6,230,146 | |
| Health revenue: 0.05% | |||||
| Roanoke VA EDA Residential Care Facility Revenue Richfield Living Project | 5.00 | 9-1-2040 | 3,290,000 | 2,473,134 | |
| Tax revenue: 0.01% | |||||
| Marquis VA CDA CAB Series C ¤ | 0.00 | 9-1-2041 | 1,824,000 | 87,302 | |
| Marquis VA CDA CCAB Series 2015 144A | 4.88 | 9-1-2045 | 397,000 | 182,348 | |
| Marquis VA CDA Series B | 3.66 | 9-1-2041 | 1,310,000 | 591,078 | |
| 860,728 | |||||
| Transportation revenue: 0.19% | |||||
| Virginia Small Business Financing Authority Series 2022 | 4.00 | 1-1-2040 | 1,800,000 | 1,667,305 | |
| Virginia Small Business Financing Authority Series 2022 %% | 4.00 | 1-1-2040 | 3,250,000 | 3,017,797 | |
| Virginia Small Business Financing Authority Series 2022 | 4.00 | 1-1-2048 | 6,000,000 | 5,330,195 | |
| 10,015,297 | |||||
| 19,579,305 | |||||
| Washington: 3.71% | |||||
| Airport revenue: 0.47% | |||||
| Port of Seattle WA AMT Intermediate Lien | 5.00 | 4-1-2044 | 16,000,000 | 16,792,683 | |
| Port of Seattle WA AMT Intermediate Lien | 5.00 | 8-1-2046 | 7,865,000 | 8,307,827 | |
| 25,100,510 | |||||
| Education revenue: 0.05% | |||||
| Washington HEFA Seattle University Project | 4.00 | 5-1-2045 | 1,000,000 | 925,287 | |
| Washington HEFA Seattle University Project | 5.00 | 5-1-2030 | 760,000 | 845,572 | |
| Washington HEFA Seattle University Project | 5.00 | 5-1-2032 | 335,000 | 368,374 | |
| Washington HEFA Seattle University Project | 5.00 | 5-1-2033 | 300,000 | 328,705 | |
| 2,467,938 | |||||
| GO revenue: 1.86% | |||||
| Clark County WA School District #114 (AGM Insured) | 4.00 | 12-1-2031 | 9,000,000 | 9,554,717 | |
| Clark County WA School District #114 (AGM Insured) | 4.00 | 12-1-2034 | 2,500,000 | 2,619,015 | |
| King County WA Public Hospital District #1 Valley Medical Center Refunding Bond | 5.00 | 12-1-2029 | 8,940,000 | 9,741,517 | |
| King County WA Public Hospital District #1 Valley Medical Center Refunding Bond | 5.00 | 12-1-2035 | 9,430,000 | 10,037,864 | |
| King County WA School District #210 Federal Way (AGM Insured) | 4.00 | 12-1-2033 | 10,000,000 | 10,480,733 | |
| King County WA School District #414 Lake Washington (AGM Insured) | 5.00 | 12-1-2033 | 570,000 | 635,221 |
| Interest rate | Maturity date | Principal | Value | ||
| GO revenue (continued) | |||||
| King County WA School District #414 Lake Washington (AGM Insured) | 5.00% | 12-1-2034 | $ 1,000,000 | $ 1,112,575 | |
| Seattle WA | 4.00 | 12-1-2040 | 2,500,000 | 2,510,894 | |
| Snohomish County WA School District (AGM Insured) | 5.00 | 12-1-2031 | 1,500,000 | 1,609,321 | |
| Washington Motor Vehicle Fuel Tax Series B | 5.00 | 8-1-2032 | 8,545,000 | 9,136,657 | |
| Washington Series 2017-A | 5.00 | 8-1-2033 | 1,500,000 | 1,624,047 | |
| Washington Series 2017-A | 5.00 | 8-1-2040 | 3,500,000 | 3,751,822 | |
| Washington Series 2017-A | 5.00 | 8-1-2041 | 2,500,000 | 2,677,895 | |
| Washington Series 2021-F | 5.00 | 6-1-2038 | 6,500,000 | 7,378,363 | |
| Washington Series 2022-C | 5.00 | 2-1-2044 | 16,000,000 | 18,022,555 | |
| Washington Series RA | 4.00 | 7-1-2030 | 7,950,000 | 7,950,000 | |
| 98,843,196 | |||||
| Health revenue: 0.24% | |||||
| Spokane WA Housing Finance Commission Riverview Retirement Community Project | 5.00 | 1-1-2023 | 255,000 | 256,097 | |
| Washington HCFR Providence Health & Services Series 2012A | 5.00 | 10-1-2042 | 2,160,000 | 2,172,357 | |
| Washington Health Care Facilities Authority Commonspirit Health Series A-2 | 5.00 | 8-1-2038 | 3,000,000 | 3,117,422 | |
| Washington Health Care Facilities Authority Seattle Cancer Care Alliance | 4.00 | 9-1-2045 | 3,000,000 | 2,788,426 | |
| Washington Health Care Facilities Authority Seattle Cancer Care Alliance 144A | 4.00 | 12-1-2045 | 2,450,000 | 2,276,452 | |
| Washington Health Care Facilities Authority Seattle Cancer Care Alliance | 5.00 | 9-1-2040 | 1,000,000 | 1,058,318 | |
| Washington Health Care Facilities Authority Seattle Childrens Hospital Series 2017A | 5.00 | 10-1-2047 | 1,055,000 | 1,103,412 | |
| 12,772,484 | |||||
| Miscellaneous revenue: 0.39% | |||||
| FYI Properties Lease Revenue Refunding Bonds Washington State District Project Series 2019 | 5.00 | 6-1-2037 | 7,395,000 | 8,028,599 | |
| FYI Properties Lease Revenue Refunding Bonds Washington State District Project Series 2019 | 5.00 | 6-1-2038 | 1,750,000 | 1,891,755 | |
| Washington Certificate of Participation | 5.00 | 7-1-2038 | 1,660,000 | 1,821,755 | |
| Washington Certificate of Participation | 5.00 | 7-1-2039 | 1,745,000 | 1,900,570 | |
| Washington Certificate of Participation | 5.00 | 7-1-2040 | 1,480,000 | 1,604,260 | |
| Washington Certificate of Participation | 5.00 | 7-1-2041 | 1,555,000 | 1,682,940 | |
| Washington Certificate of Participation Series A | 5.00 | 7-1-2038 | 3,265,000 | 3,564,400 | |
| 20,494,279 | |||||
| Tax revenue: 0.40% | |||||
| Washington Convention Center Junior Lodging Tax Notes | 4.00 | 7-1-2031 | 5,250,000 | 5,010,758 | |
| Washington Motor Vehicle Fuel Tax Series B | 5.00 | 6-1-2036 | 5,000,000 | 5,634,791 | |
| Washington Series 2021-A | 5.00 | 8-1-2036 | 3,500,000 | 3,951,314 | |
| Washington Series B | 5.00 | 8-1-2037 | 6,400,000 | 6,883,315 | |
| 21,480,178 | |||||
| Utilities revenue: 0.05% | |||||
| Energy Northwest Washington Electric Revenue Refunding Bonds Columbia Generating Station | 5.00 | 7-1-2034 | 2,500,000 | 2,843,650 |
| Interest rate | Maturity date | Principal | Value | ||
| Water & sewer revenue: 0.25% | |||||
| King County WA Refunding Bonds | 5.00% | 7-1-2042 | $ 4,660,000 | $ 5,062,565 | |
| King County WA Refunding Bonds Series A | 5.00 | 7-1-2047 | 7,510,000 | 8,046,430 | |
| 13,108,995 | |||||
| 197,111,230 | |||||
| West Virginia: 0.14% | |||||
| GO revenue: 0.05% | |||||
| Ohio County WV Board of Education | 3.00 | 6-1-2026 | 2,680,000 | 2,731,952 | |
| Tax revenue: 0.09% | |||||
| Monongalia County WV Commission Improvement & Refunding Bonds University Town Center Series A 144A | 4.13 | 6-1-2043 | 1,600,000 | 1,423,471 | |
| Monongalia County WV Commission Improvement & Refunding Bonds University Town Center Series A 144A | 5.50 | 6-1-2037 | 2,500,000 | 2,539,539 | |
| Monongalia County WV Commission Improvement & Refunding Bonds University Town Center Series A 144A | 5.75 | 6-1-2043 | 675,000 | 687,058 | |
| 4,650,068 | |||||
| 7,382,020 | |||||
| Wisconsin: 3.70% | |||||
| Education revenue: 0.64% | |||||
| Milwaukee WI RDA Science Education Consortium Incorporated Project Series A | 6.00 | 8-1-2033 | 2,120,000 | 2,161,140 | |
| Milwaukee WI RDA Science Education Consortium Incorporated Project Series A | 6.25 | 8-1-2043 | 4,650,000 | 4,734,457 | |
| Wisconsin HEFA Marquette University Project Series 2022 %% | 5.00 | 10-1-2031 | 6,690,000 | 7,605,110 | |
| Wisconsin HEFA Marquette University Project Series 2022 %% | 5.00 | 10-1-2032 | 7,040,000 | 8,022,555 | |
| Wisconsin PFA Carolina International School Series A 144A | 6.00 | 8-1-2023 | 165,000 | 167,406 | |
| Wisconsin PFA Carolina International School Series A 144A | 6.75 | 8-1-2033 | 2,430,000 | 2,495,748 | |
| Wisconsin PFA Carolina International School Series A 144A | 7.00 | 8-1-2043 | 1,575,000 | 1,614,697 | |
| Wisconsin PFA Carolina International School Series A 144A | 7.20 | 8-1-2048 | 940,000 | 964,445 | |
| Wisconsin PFA Charter School Revenue American Preparatory Academy 144A | 5.00 | 7-15-2039 | 1,375,000 | 1,376,188 | |
| Wisconsin PFA Wisland Revenue Northwest Nazarene University | 4.25 | 10-1-2049 | 5,410,000 | 4,807,779 | |
| 33,949,525 | |||||
| GO revenue: 0.51% | |||||
| Verona WI Area School District Building & Improvement Bonds | 4.00 | 4-1-2027 | 3,385,000 | 3,573,347 | |
| Verona WI Area School District Building & Improvement Bonds | 4.00 | 4-1-2028 | 1,380,000 | 1,451,223 |
| Interest rate | Maturity date | Principal | Value | ||
| GO revenue (continued) | |||||
| Verona WI Area School District Building & Improvement Bonds | 5.00% | 4-1-2026 | $ 3,310,000 | $ 3,633,167 | |
| Wisconsin Series 2019A ø | 1.20 | 5-1-2029 | 18,300,000 | 18,300,000 | |
| 26,957,737 | |||||
| Health revenue: 0.90% | |||||
| Wisconsin HEFA Ascension Senior Credit Group Series A | 4.50 | 11-15-2039 | 4,925,000 | 4,994,753 | |
| Wisconsin HEFA Ascension Senior Credit Group Series A | 5.00 | 11-15-2035 | 12,000,000 | 12,752,276 | |
| Wisconsin HEFA Froedtert Health Incorporated Series 2012A | 5.00 | 4-1-2042 | 8,000,000 | 8,040,933 | |
| Wisconsin PFA Series A ## | 4.00 | 10-1-2049 | 24,500,000 | 22,239,973 | |
| 48,027,935 | |||||
| Housing revenue: 0.86% | |||||
| Tender Option Bond Trust Receipts/Floater Certificates Series 2020-XF2871 (Mizuho Capital Markets LLC LOC, Mizuho Capital Markets LLC LIQ) 144Aø | 1.13 | 11-1-2025 | 9,991,000 | 9,991,000 | |
| Wisconsin HEFA Aspirus Wausau Hospital Incorporated Obligated Group Series 2004B (JPMorgan Chase & Company LOC) ø | 0.90 | 8-15-2034 | 1,500,000 | 1,500,000 | |
| Wisconsin Housing & EDA Series B (FHLB SPA) ø | 0.90 | 5-1-2055 | 3,000,000 | 3,000,000 | |
| Wisconsin PFA Student Housing Revenue (AGM Insured) | 4.00 | 7-1-2023 | 350,000 | 356,920 | |
| Wisconsin PFA Student Housing Revenue (AGM Insured) | 4.00 | 7-1-2024 | 800,000 | 819,310 | |
| Wisconsin PFA Student Housing Revenue (AGM Insured) | 4.00 | 7-1-2025 | 920,000 | 948,264 | |
| Wisconsin PFA Student Housing Revenue (AGM Insured) | 5.00 | 7-1-2026 | 1,360,000 | 1,457,395 | |
| Wisconsin PFA Student Housing Revenue (AGM Insured) | 5.00 | 7-1-2027 | 1,675,000 | 1,814,867 | |
| Wisconsin PFA Student Housing Revenue (AGM Insured) | 5.00 | 7-1-2028 | 2,025,000 | 2,204,993 | |
| Wisconsin PFA Student Housing Revenue (AGM Insured) | 5.00 | 7-1-2029 | 2,190,000 | 2,367,663 | |
| Wisconsin PFA Student Housing Revenue (AGM Insured) | 5.00 | 7-1-2030 | 2,300,000 | 2,475,187 | |
| Wisconsin PFA Student Housing Revenue (AGM Insured) | 5.00 | 7-1-2031 | 1,415,000 | 1,513,366 | |
| Wisconsin PFA Student Housing Revenue (AGM Insured) | 5.00 | 7-1-2048 | 16,775,000 | 17,469,339 | |
| 45,918,304 | |||||
| Industrial development revenue: 0.12% | |||||
| Wisconsin PFA Series 2022A | 5.00 | 2-1-2042 | 2,500,000 | 2,557,558 | |
| Wisconsin PFA Series 2022A 144A | 5.50 | 2-1-2042 | 4,000,000 | 3,820,820 | |
| 6,378,378 | |||||
| Miscellaneous revenue: 0.07% | |||||
| Wisconsin Series A | 5.00 | 6-1-2033 | 3,420,000 | 3,673,239 | |
| Tax revenue: 0.60% | |||||
| Mount Pleasant WI Series A ## | 5.00 | 4-1-2043 | 20,205,000 | 22,039,606 | |
| Mount Pleasant WI Series A | 5.00 | 4-1-2048 | 650,000 | 689,129 | |
| Mount Pleasant WI Series A | 5.00 | 4-1-2048 | 6,910,000 | 7,325,970 | |
| Wisconsin Center District CAB Series C (AGM Insured) ¤ | 0.00 | 12-15-2037 | 1,600,000 | 824,828 | |
| Wisconsin Center District CAB Series C (AGM Insured) ¤ | 0.00 | 12-15-2038 | 1,600,000 | 782,081 | |
| 31,661,614 | |||||
| 196,566,732 | |||||
| Total Municipal obligations (Cost $5,463,867,802) | 5,290,492,604 |
| Yield | Shares | Value | |||
| Short-term investments: 0.28% | |||||
| Investment companies: 0.28% | |||||
| Allspring Municipal Cash Management Money Market Fund Institutional Class ♠∞## | 0.85% | 15,138,668 | $ 15,147,751 | ||
| Total Short-term investments (Cost $15,147,039) | 15,147,751 | ||||
| Total investments in securities (Cost $5,506,014,841) | 100.24% | 5,332,640,355 | |||
| Other assets and liabilities, net | (0.24) | (12,730,640) | |||
| Total net assets | 100.00% | $5,319,909,715 |
| 144A | The security may be resold in transactions exempt from registration, normally to qualified institutional buyers, pursuant to Rule 144A under the Securities Act of 1933. |
| ø | Variable rate demand notes are subject to a demand feature which reduces the effective maturity. The maturity date shown represents the final maturity date of the security. The interest rate is determined and reset by the issuer daily, weekly, or monthly depending upon the terms of the security. The rate shown is the rate in effect at period end. |
| ¤ | The security is issued in zero coupon form with no periodic interest payments. |
| € | The security is an auction-rate security which has an interest rate that resets at predetermined short-term intervals through a Dutch auction. The rate shown is the rate in effect at period end. |
| ± | Variable rate investment. The rate shown is the rate in effect at period end. |
| øø | The interest rate is determined and reset by the issuer periodically depending upon the terms of the security. The rate shown is the rate in effect at period end. |
| † | Non-income-earning security |
| ## | All or a portion of this security is segregated for when-issued securities. |
| ♠ | The issuer of the security is an affiliated person of the Fund as defined in the Investment Company Act of 1940. |
| ∞ | The rate represents the 7-day annualized yield at period end. |
| %% | The security is purchased on a when-issued basis. |
| ♣ | On the last interest date, partial interest was paid. |
| Abbreviations: | |
| AGC | Assured Guaranty Corporation |
| AGM | Assured Guaranty Municipal |
| Ambac | Ambac Financial Group Incorporated |
| AMT | Alternative minimum tax |
| BAM | Build America Mutual Assurance Company |
| BHAC | Berkshire Hathaway Assurance Corporation |
| CAB | Capital appreciation bond |
| CCAB | Convertible capital appreciation bond |
| CDA | Community Development Authority |
| ECFA | Educational & Cultural Facilities Authority |
| EDA | Economic Development Authority |
| EDFA | Economic Development Finance Authority |
| FGIC | Financial Guaranty Insurance Corporation |
| FHA | Federal Housing Administration |
| FHLB | Federal Home Loan Bank |
| FHLMC | Federal Home Loan Mortgage Corporation |
| FNMA | Federal National Mortgage Association |
| GNMA | Government National Mortgage Association |
| GO | General obligation |
| HCFR | Healthcare facilities revenue |
| HEFA | Health & Educational Facilities Authority |
| HFA | Housing Finance Authority |
| HFFA | Health Facilities Financing Authority |
| IDA | Industrial Development Authority |
| LIBOR | London Interbank Offered Rate |
| LIQ | Liquidity agreement |
| LOC | Letter of credit |
| MFHR | Multifamily housing revenue |
| NPFGC | National Public Finance Guarantee Corporation |
| PCFA | Pollution Control Financing Authority |
| PCR | Pollution control revenue |
| PFA | Public Finance Authority |
| RDA | Redevelopment Authority |
| SIFMA | Securities Industry and Financial Markets Association |
| SPA | Standby purchase agreement |
| TTFA | Transportation Trust Fund Authority |
| Value, beginning of period | Purchases | Sales proceeds | Net realized gains (losses) | Net change in unrealized gains (losses) | Value, end of period | Shares, end of period | Income from affiliated securities | |
| Short-term investments | ||||||||
| Allspring Municipal Cash Management Money Market Fund Institutional Class | $40,464,418 | $1,079,985,752 | $(1,105,312,360) | $9,269 | $672 | $15,147,751 | 15,138,668 | $113,354 |
| Assets | |
Investments in unaffiliated securities, at value (cost $5,490,867,802) | $ 5,317,492,604 |
Investments in affiliated securities, at value (cost $15,147,039) | 15,147,751 |
Cash | 1,301,169 |
Cash due from broker | 1,030,000 |
Receivable for interest | 56,246,710 |
Receivable for Fund shares sold | 6,176,805 |
Receivable for investments sold | 660,231 |
Prepaid expenses and other assets | 410,597 |
Total assets | 5,398,465,867 |
| Liabilities | |
Payable for when-issued transactions | 54,567,053 |
Payable for Fund shares redeemed | 19,583,909 |
Dividends payable | 2,259,635 |
Management fee payable | 1,424,250 |
Administration fees payable | 421,373 |
Distribution fee payable | 21,613 |
Accrued expenses and other liabilities | 278,319 |
Total liabilities | 78,556,152 |
Total net assets | $5,319,909,715 |
| Net assets consist of | |
Paid-in capital | $ 5,561,634,048 |
Total distributable loss | (241,724,333) |
Total net assets | $5,319,909,715 |
| Computation of net asset value and offering price per share | |
Net assets – Class A | $ 902,670,544 |
Shares outstanding – Class A1 | 93,078,147 |
Net asset value per share – Class A | $9.70 |
Maximum offering price per share – Class A2 | $10.16 |
Net assets – Class C | $ 34,561,028 |
Shares outstanding – Class C1 | 3,564,780 |
Net asset value per share – Class C | $9.70 |
Net assets – Class R6 | $ 612,487,493 |
Shares outstanding – Class R61 | 63,145,096 |
Net asset value per share – Class R6 | $9.70 |
Net assets – Administrator Class | $ 1,034,622,962 |
Shares outstanding – Administrator Class1 | 106,652,092 |
Net asset value per share – Administrator Class | $9.70 |
Net assets – Institutional Class | $ 2,735,567,688 |
Shares outstanding – Institutional Class1 | 282,093,534 |
Net asset value per share – Institutional Class | $9.70 |
| 1 | The Fund has an unlimited number of authorized shares. |
| 2 | Maximum offering price is computed as 100/95.50 of net asset value. On investments of $50,000 or more, the offering price is reduced. |
| Investment income | |
Interest | $ 161,502,248 |
Income from affiliated securities | 113,354 |
Total investment income | 161,615,602 |
| Expenses | |
Management fee | 18,983,911 |
| Administration fees | |
Class A | 1,654,678 |
Class C | 70,960 |
Class R6 | 135,585 |
Administrator Class | 984,140 |
Institutional Class | 2,432,148 |
| Shareholder servicing fees | |
Class A | 2,582,628 |
Class C | 110,468 |
Administrator Class | 2,455,798 |
| Distribution fee | |
Class C | 331,403 |
Custody and accounting fees | 223,919 |
Professional fees | 94,670 |
Registration fees | 125,141 |
Shareholder report expenses | 202,823 |
Trustees’ fees and expenses | 22,599 |
Other fees and expenses | 142,966 |
Total expenses | 30,553,837 |
| Less: Fee waivers and/or expense reimbursements | |
Class A | (219,910) |
Class C | (5,476) |
Class R6 | (145) |
Administrator Class | (1,043,564) |
Net expenses | 29,284,742 |
Net investment income | 132,330,860 |
| Realized and unrealized gains (losses) on investments | |
| Net realized gains (losses) on | |
Unaffiliated securities | (30,598,931) |
Affiliated securities | 9,269 |
Futures contracts | 893,624 |
Net realized losses on investments | (29,696,038) |
| Net change in unrealized gains (losses) on | |
Unaffiliated securities | (586,936,571) |
Affiliated securities | 672 |
Net change in unrealized gains (losses) on investments | (586,935,899) |
Net realized and unrealized gains (losses) on investments | (616,631,937) |
Net decrease in net assets resulting from operations | $(484,301,077) |
| Year ended June 30, 2022 | Year ended June 30, 2021 | |||
| Operations | ||||
Net investment income | $ 132,330,860 | $ 134,781,046 | ||
Net realized gains (losses) on investments | (29,696,038) | 15,805,341 | ||
Net change in unrealized gains (losses) on investments | (586,935,899) | 127,280,285 | ||
Net increase (decrease) in net assets resulting from operations | (484,301,077) | 277,866,672 | ||
| Distributions to shareholders from | ||||
| Net investment income and net realized gains | ||||
Class A | (22,307,254) | (25,211,823) | ||
Class C | (618,947) | (889,494) | ||
Class R6 | (11,522,096) | (8,467,864) | ||
Administrator Class | (22,759,543) | (23,389,257) | ||
Institutional Class | (75,114,595) | (76,419,530) | ||
Total distributions to shareholders | (132,322,435) | (134,377,968) | ||
| Capital share transactions | Shares | Shares | ||
| Proceeds from shares sold | ||||
Class A | 3,555,083 | 37,023,328 | 7,824,157 | 83,782,080 |
Class C | 298,478 | 3,190,333 | 396,452 | 4,252,290 |
Class R6 | 100,043,556 | 1,000,180,422 | 13,132,472 | 140,931,974 |
Administrator Class | 143,501,780 | 1,460,363,388 | 24,204,311 | 259,598,991 |
Institutional Class | 109,281,926 | 1,122,718,011 | 83,790,289 | 900,375,605 |
| 3,623,475,482 | 1,388,940,940 | |||
| Reinvestment of distributions | ||||
Class A | 1,906,296 | 19,851,582 | 2,094,902 | 22,466,432 |
Class C | 56,879 | 592,739 | 78,354 | 839,374 |
Class R6 | 13,432 | 139,556 | 4,378 | 46,957 |
Administrator Class | 2,179,944 | 22,612,571 | 2,163,748 | 23,216,878 |
Institutional Class | 6,625,814 | 68,879,804 | 6,174,976 | 66,232,557 |
| 112,076,252 | 112,802,198 | |||
| Payment for shares redeemed | ||||
Class A | (14,894,404) | (153,994,313) | (15,326,206) | (164,421,449) |
Class C | (1,430,615) | (14,862,619) | (3,405,090) | (36,367,488) |
Class R6 | (71,421,897) | (708,522,552) | (4,795,499) | (51,480,317) |
Administrator Class | (131,372,943) | (1,338,909,878) | (30,433,625) | (325,486,035) |
Institutional Class | (114,743,308) | (1,161,120,631) | (93,944,436) | (1,008,488,419) |
| (3,377,409,993) | (1,586,243,708) | |||
Net increase (decrease) in net assets resulting from capital share transactions | 358,141,741 | (84,500,570) | ||
Total increase (decrease) in net assets | (258,481,771) | 58,988,134 | ||
| Net assets | ||||
Beginning of period | 5,578,391,486 | 5,519,403,352 | ||
End of period | $ 5,319,909,715 | $ 5,578,391,486 | ||
| Year ended June 30 | |||||
| Class A | 2022 | 2021 | 2020 | 2019 | 2018 |
Net asset value, beginning of period | $10.83 | $10.55 | $10.55 | $10.21 | $10.25 |
Net investment income | 0.23 | 0.24 | 0.25 | 0.30 1 | 0.32 |
Net realized and unrealized gains (losses) on investments | (1.13) | 0.28 | 0.01 | 0.34 | (0.02) |
Total from investment operations | (0.90) | 0.52 | 0.26 | 0.64 | 0.30 |
| Distributions to shareholders from | |||||
Net investment income | (0.23) | (0.24) | (0.25) | (0.30) | (0.32) |
Net realized gains | 0.00 | 0.00 | (0.01) | 0.00 | (0.02) |
Total distributions to shareholders | (0.23) | (0.24) | (0.26) | (0.30) | (0.34) |
Net asset value, end of period | $9.70 | $10.83 | $10.55 | $10.55 | $10.21 |
Total return2 | (8.47)% | 4.95% | 2.54% | 6.35% | 2.97% |
| Ratios to average net assets (annualized) | |||||
Gross expenses | 0.77% | 0.77% | 0.77% | 0.78% | 0.79% |
Net expenses | 0.74% | 0.74% | 0.74% | 0.75% | 0.75% |
Net investment income | 2.16% | 2.22% | 2.40% | 2.89% | 3.10% |
| Supplemental data | |||||
Portfolio turnover rate | 18% | 16% | 24% | 20% | 19% |
Net assets, end of period (000s omitted) | $902,671 | $1,110,503 | $1,138,934 | $1,206,717 | $1,179,800 |
| 1 | Calculated based upon average shares outstanding |
| 2 | Total return calculations do not include any sales charges. |
| Year ended June 30 | |||||
| Class C | 2022 | 2021 | 2020 | 2019 | 2018 |
Net asset value, beginning of period | $10.83 | $10.55 | $10.55 | $10.21 | $10.24 |
Net investment income | 0.15 1 | 0.16 1 | 0.17 | 0.22 | 0.24 |
Net realized and unrealized gains (losses) on investments | (1.13) | 0.28 | 0.01 | 0.34 | (0.01) |
Total from investment operations | (0.98) | 0.44 | 0.18 | 0.56 | 0.23 |
| Distributions to shareholders from | |||||
Net investment income | (0.15) | (0.16) | (0.17) | (0.22) | (0.24) |
Net realized gains | 0.00 | 0.00 | (0.01) | 0.00 | (0.02) |
Total distributions to shareholders | (0.15) | (0.16) | (0.18) | (0.22) | (0.26) |
Net asset value, end of period | $9.70 | $10.83 | $10.55 | $10.55 | $10.21 |
Total return2 | (9.16)% | 4.16% | 1.77% | 5.56% | 2.30% |
| Ratios to average net assets (annualized) | |||||
Gross expenses | 1.51% | 1.51% | 1.51% | 1.53% | 1.54% |
Net expenses | 1.50% | 1.50% | 1.50% | 1.50% | 1.50% |
Net investment income | 1.40% | 1.47% | 1.64% | 2.15% | 2.35% |
| Supplemental data | |||||
Portfolio turnover rate | 18% | 16% | 24% | 20% | 19% |
Net assets, end of period (000s omitted) | $34,561 | $50,251 | $79,863 | $98,411 | $132,529 |
| 1 | Calculated based upon average shares outstanding |
| 2 | Total return calculations do not include any sales charges. |
| Year ended June 30 | ||||
| Class R6 | 2022 | 2021 | 2020 | 2019 1 |
Net asset value, beginning of period | $10.83 | $10.55 | $10.55 | $10.21 |
Net investment income | 0.26 | 0.28 | 0.29 | 0.30 |
Net realized and unrealized gains (losses) on investments | (1.13) | 0.28 | 0.01 | 0.34 |
Total from investment operations | (0.87) | 0.56 | 0.30 | 0.64 |
| Distributions to shareholders from | ||||
Net investment income | (0.26) | (0.28) | (0.29) | (0.30) |
Net realized gains | 0.00 | 0.00 | (0.01) | 0.00 |
Total distributions to shareholders | (0.26) | (0.28) | (0.30) | (0.30) |
Net asset value, end of period | $9.70 | $10.83 | $10.55 | $10.55 |
Total return2 | (8.14)% | 5.33% | 2.90% | 6.43% |
| Ratios to average net assets (annualized) | ||||
Gross expenses | 0.39% | 0.39% | 0.39% | 0.40% |
Net expenses | 0.39% | 0.39% | 0.39% | 0.40% |
Net investment income | 2.55% | 2.58% | 2.76% | 3.16% |
| Supplemental data | ||||
Portfolio turnover rate | 18% | 16% | 24% | 20% |
Net assets, end of period (000s omitted) | $612,487 | $373,876 | $276,204 | $72,655 |
| 1 | For the period from July 31, 2018 (commencement of class operations) to June 30, 2019 |
| 2 | Returns for periods of less than one year are not annualized. |
| Year ended June 30 | |||||
| Administrator Class | 2022 | 2021 | 2020 | 2019 | 2018 |
Net asset value, beginning of period | $10.84 | $10.56 | $10.55 | $10.21 | $10.25 |
Net investment income | 0.24 | 0.25 | 0.27 | 0.31 1 | 0.33 1 |
Net realized and unrealized gains (losses) on investments | (1.14) | 0.28 | 0.02 | 0.34 | (0.02) |
Total from investment operations | (0.90) | 0.53 | 0.29 | 0.65 | 0.31 |
| Distributions to shareholders from | |||||
Net investment income | (0.24) | (0.25) | (0.27) | (0.31) | (0.33) |
Net realized gains | 0.00 | 0.00 | (0.01) | 0.00 | (0.02) |
Total distributions to shareholders | (0.24) | (0.25) | (0.28) | (0.31) | (0.35) |
Net asset value, end of period | $9.70 | $10.84 | $10.56 | $10.55 | $10.21 |
Total return | (8.42)% | 5.10% | 2.78% | 6.51% | 3.13% |
| Ratios to average net assets (annualized) | |||||
Gross expenses | 0.71% | 0.71% | 0.71% | 0.72% | 0.73% |
Net expenses | 0.60% | 0.60% | 0.60% | 0.60% | 0.60% |
Net investment income | 2.31% | 2.37% | 2.54% | 3.02% | 3.27% |
| Supplemental data | |||||
Portfolio turnover rate | 18% | 16% | 24% | 20% | 19% |
Net assets, end of period (000s omitted) | $1,034,623 | $1,000,652 | $1,017,781 | $832,318 | $227,116 |
| 1 | Calculated based upon average shares outstanding |
| Year ended June 30 | |||||
| Institutional Class | 2022 | 2021 | 2020 | 2019 | 2018 |
Net asset value, beginning of period | $10.83 | $10.55 | $10.55 | $10.21 | $10.24 |
Net investment income | 0.26 | 0.27 | 0.29 | 0.33 | 0.35 |
Net realized and unrealized gains (losses) on investments | (1.13) | 0.28 | 0.01 | 0.34 | (0.01) |
Total from investment operations | (0.87) | 0.55 | 0.30 | 0.67 | 0.34 |
| Distributions to shareholders from | |||||
Net investment income | (0.26) | (0.27) | (0.29) | (0.33) | (0.35) |
Net realized gains | 0.00 | 0.00 | (0.01) | 0.00 | (0.02) |
Total distributions to shareholders | (0.26) | (0.27) | (0.30) | (0.33) | (0.37) |
Net asset value, end of period | $9.70 | $10.83 | $10.55 | $10.55 | $10.21 |
Total return | (8.19)% | 5.28% | 2.85% | 6.67% | 3.37% |
| Ratios to average net assets (annualized) | |||||
Gross expenses | 0.44% | 0.44% | 0.44% | 0.45% | 0.46% |
Net expenses | 0.44% | 0.44% | 0.44% | 0.45% | 0.46% |
Net investment income | 2.47% | 2.53% | 2.71% | 3.15% | 3.40% |
| Supplemental data | |||||
Portfolio turnover rate | 18% | 16% | 24% | 20% | 19% |
Net assets, end of period (000s omitted) | $2,735,568 | $3,043,109 | $3,006,622 | $2,862,588 | $1,425,703 |
| Gross unrealized gains | $ 57,519,663 |
| Gross unrealized losses | (232,505,009) |
| Net unrealized losses | $(174,985,346) |
| ■ | Level 1 – quoted prices in active markets for identical securities |
| ■ | Level 2 – other significant observable inputs (including quoted prices for similar securities, interest rates, prepayment speeds, credit risk, etc.) |
| ■ | Level 3 – significant unobservable inputs (including the Fund’s own assumptions in determining the fair value of investments) |
| Quoted prices (Level 1) | Other significant observable inputs (Level 2) | Significant unobservable inputs (Level 3) | Total | |
| Assets | ||||
| Investments in: | ||||
| Closed end municipal bond fund obligations | $ 0 | $ 27,000,000 | $0 | $ 27,000,000 |
| Municipal obligations | 0 | 5,290,492,604 | 0 | 5,290,492,604 |
| Short-term investments | ||||
| Investment companies | 15,147,751 | 0 | 0 | 15,147,751 |
| Total assets | $15,147,751 | $5,317,492,604 | $0 | $5,332,640,355 |
| Average daily net assets | Management fee |
| First $500 million | 0.400% |
| Next $500 million | 0.375 |
| Next $2 billion | 0.350 |
| Next $2 billion | 0.325 |
| Next $5 billion | 0.290 |
| Over $10 billion | 0.280 |
| Class-level administration fee | |
| Class A | 0.16% |
| Class C | 0.16 |
| Class R6 | 0.03 |
| Administrator Class | 0.10 |
| Institutional Class | 0.08 |
| Expense ratio caps | |
| Class A | 0.75% |
| Class C | 1.50 |
| Class R6 | 0.40 |
| Administrator Class | 0.60 |
| Institutional Class | 0.45 |
| Undistributed tax-exempt income | Unrealized losses | Capital loss carryforward |
| $2,033,831 | $(174,985,346) | $(66,440,968) |
Allspring Funds Trust:

| Name and year of birth | Position held and length of service* | Principal occupations during past five years or longer | Current other public company or investment company directorships |
| William R. Ebsworth (Born 1957) | Trustee, since 2015 | Retired. From 1984 to 2013, equities analyst, portfolio manager, research director and chief investment officer at Fidelity Management and Research Company in Boston, Tokyo, and Hong Kong, and retired in 2013 as Chief Investment Officer of Fidelity Strategic Advisers, Inc. where he led a team of investment professionals managing client assets. Prior thereto, Board member of Hong Kong Securities Clearing Co., Hong Kong Options Clearing Corp., the Thailand International Fund, Ltd., Fidelity Investments Life Insurance Company, and Empire Fidelity Investments Life Insurance Company. Audit Committee Chair and Investment Committee Chair of the Vincent Memorial Hospital Endowment (non-profit organization). Mr. Ebsworth is a CFA® charterholder. | N/A |
| Jane A. Freeman (Born 1953) | Trustee, since 2015; Chair Liaison, since 2018 | Retired. From 2012 to 2014 and 1999 to 2008, Chief Financial Officer of Scientific Learning Corporation. From 2008 to 2012, Ms. Freeman provided consulting services related to strategic business projects. Prior to 1999, Portfolio Manager at Rockefeller & Co. and Scudder, Stevens & Clark. Board member of the Harding Loevner Funds from 1996 to 2014, serving as both Lead Independent Director and chair of the Audit Committee. Board member of the Russell Exchange Traded Funds Trust from 2011 to 2012 and the chair of the Audit Committee. Ms. Freeman is also an inactive Chartered Financial Analyst. | N/A |
| Isaiah Harris, Jr. (Born 1952) | Trustee, since 2009; Audit Committee Chair, since 2019 | Retired. Chairman of the Board of CIGNA Corporation from 2009 to 2021, and Director from 2005 to 2008. From 2003 to 2011, Director of Deluxe Corporation. Prior thereto, President and CEO of BellSouth Advertising and Publishing Corp. from 2005 to 2007, President and CEO of BellSouth Enterprises from 2004 to 2005 and President of BellSouth Consumer Services from 2000 to 2003. Emeritus member of the Iowa State University Foundation Board of Governors. Emeritus Member of the Advisory Board of Iowa State University School of Business. Advisory Board Member, Palm Harbor Academy (private school). Advisory Board Member, Fellowship of Christian Athletes. Mr. Harris is a certified public accountant (inactive status). | N/A |
| David F. Larcker (Born 1950) | Trustee, since 2009 | James Irvin Miller Professor of Accounting at the Graduate School of Business (Emeritus), Stanford University, Director of the Corporate Governance Research Initiative and Senior Faculty of The Rock Center for Corporate Governance since 2006. From 2005 to 2008, Professor of Accounting at the Graduate School of Business, Stanford University. Prior thereto, Ernst & Young Professor of Accounting at The Wharton School, University of Pennsylvania from 1985 to 2005. | N/A |
| Name and year of birth | Position held and length of service* | Principal occupations during past five years or longer | Current other public company or investment company directorships |
| Olivia S. Mitchell (Born 1953) | Trustee, since 2006; Nominating and Governance Committee Chair, since 2018 | International Foundation of Employee Benefit Plans Professor since 1993, Wharton School of the University of Pennsylvania. Director of Wharton’s Pension Research Council and Boettner Center on Pensions & Retirement Research, and Research Associate at the National Bureau of Economic Research. Previously taught at Cornell University from 1978 to 1993. | N/A |
| Timothy J. Penny (Born 1951) | Trustee, since 1996; Chair, since 2018 | President and Chief Executive Officer of Southern Minnesota Initiative Foundation, a non-profit organization, since 2007. Member of the Board of Trustees of NorthStar Education Finance, Inc., a non-profit organization, since 2007. | N/A |
| James G. Polisson (Born 1959) | Trustee, since 2018 | Retired. Chief Marketing Officer, Source (ETF) UK Services, Ltd, from 2015 to 2017. From 2012 to 2015, Principal of The Polisson Group, LLC, a management consulting, corporate advisory and principal investing company. Chief Executive Officer and Managing Director at Russell Investments, Global Exchange Traded Funds from 2010 to 2012. Managing Director of Barclays Global Investors from 1998 to 2010 and Global Chief Marketing Officer for iShares and Barclays Global Investors from 2000 to 2010. Trustee of the San Francisco Mechanics’ Institute, a non-profit organization, from 2013 to 2015. Board member of the Russell Exchange Traded Fund Trust from 2011 to 2012. Director of Barclays Global Investors Holdings Deutschland GmbH from 2006 to 2009. Mr. Polisson is an attorney and has a retired status with the Massachusetts and District of Columbia Bar Associations. | N/A |
| Pamela Wheelock (Born 1959) | Trustee, since January 2020; previously Trustee from January 2018 to July 2019 | Board member of the Destination Medical Center Economic Development Agency, Rochester, Minnesota since 2019. Interim President of the McKnight Foundation from January to September 2020. McKnight Foundation Consultant, November 2020 to February 2021. Acting Commissioner, Minnesota Department of Human Services, July 2019 through September 2019. Consultant (part-time), Minnesota Department of Human Services, October 2019 through December 2019. Chief Operating Officer, Twin Cities Habitat for Humanity from 2017 to 2019. Vice President of University Services, University of Minnesota from 2012 to 2016. Prior thereto, on the Board of Directors, Governance Committee and Finance Committee for the Minnesota Philanthropy Partners (Saint Paul Foundation) from 2012 to 2018, Interim Chief Executive Officer of Blue Cross Blue Shield of Minnesota from 2011 to 2012, Chairman of the Board from 2009 to 2012 and Board Director from 2003 to 2015. Vice President, Leadership and Community Engagement, Bush Foundation, Saint Paul, Minnesota (a private foundation) from 2009 to 2011. Executive Vice President and Chief Financial Officer, Minnesota Sports and Entertainment from 2004 to 2009 and Senior Vice President from 2002 to 2004. Executive Vice President of the Minnesota Wild Foundation from 2004 to 2008. Commissioner of Finance, State of Minnesota, from 1999 to 2002. Currently Board Chair of the Minnesota Wild Foundation since 2010. | N/A |
| Name and year of birth | Position held and length of service | Principal occupations during past five years or longer |
| Andrew Owen (Born 1960) | President, since 2017 | President, Chief Executive Officer and Director of Allspring Funds Management, LLC since 2017 and co-president of Galliard Capital Management, LLC, an affiliate of Allspring Funds Management, LLC, since 2019. Prior thereto, Head of Affiliated Managers, Allspring Global Investments, from 2014 to 2019 and Executive Vice President responsible for marketing, investments and product development for Allspring Funds Management, LLC, from 2009 to 2014. In addition, Mr. Owen was an Executive Vice President of Wells Fargo & Company from 2014 to 2021. |
| Jeremy DePalma (Born 1974) | Treasurer, since 2012 (for certain funds in the Fund Complex); since 2021 (for the remaining funds in the Fund Complex) | Senior Vice President of Allspring Funds Management, LLC since 2009. Senior Vice President of Evergreen Investment Management Company, LLC from 2008 to 2010 and head of the Fund Reporting and Control Team within Fund Administration from 2005 to 2010. |
| Kate McKinley (Born 1977) | Chief Legal Officer, since 2021 | Chief Legal Officer of Allspring Global Investments since 2021. Prior thereto, held various roles at State Street Global Advisors beginning in 2010, including serving as Senior Vice President and General Counsel from 2019 to 2021, and Chief Operating Officer of the Institutional Client Group from 2016 - 2019. Prior to working at State Street Global Advisors served as Assistant General Counsel for Bank of America Corporation from 2005 to 2010 and as an Associate at WilmerHale from 2002 to 2005. |
| Christopher Baker (Born 1976) | Chief Compliance Officer, since 2022 | Global Chief Compliance Officer for Allspring Global Investments since 2022. Prior thereto, Chief Compliance Officer for State Street Global Advisors from 2018 to 2021. Senior Compliance Officer for the State Street divisions of Alternative Investment Solutions, Sector Solutions, and Global Marketing from 2015 to 2018. From 2010 to 2015 Vice President, Global Head of Investment and Marketing Compliance for State Street Global Advisors. |
| Matthew Prasse (Born 1983) | Secretary, since 2021 | Senior Counsel of the Allspring Legal Department since 2021. Senior Counsel of the Wells Fargo Legal Department from 2018 to 2021. Previously, Counsel for Barings LLC from 2015 to 2018. Prior to joining Barings, Associate at Morgan, Lewis & Bockius LLP from 2008 to 2015. |
P.O. Box 219967
Kansas City, MO 64121-9967

1-800-222-8222 or visit the Fund's website at allspringglobal.com. Read the prospectus carefully before you invest or send money.
A253/AR253 06-22

Municipal Sustainability Fund
| 2 | |
| 6 | |
| 10 | |
| 11 | |
| Financial statements | |
| 18 | |
| 19 | |
| 20 | |
| 21 | |
| 26 | |
| 31 | |
| 32 |

| 1 | The S&P 500 Index consists of 500 stocks chosen for market size, liquidity, and industry group representation. It is a market-value-weighted index with each stock's weight in the index proportionate to its market value. You cannot invest directly in an index. |
| 2 | The Morgan Stanley Capital International (MSCI) All Country World Index (ACWI) ex USA Index (Net) is a free-float-adjusted market-capitalization-weighted index that is designed to measure the equity market performance of developed and emerging markets, excluding the U.S. Source: MSCI. MSCI makes no express or implied warranties or representations and shall have no liability whatsoever with respect to any MSCI data contained herein. The MSCI data may not be further redistributed or used as a basis for other indexes or any securities or financial products. This report is not approved, reviewed, or produced by MSCI. You cannot invest directly in an index. |
| 3 | The MSCI Emerging Markets (EM) Index (Net) (USD) is a free-float-adjusted market-capitalization-weighted index that is designed to measure equity market performance of emerging markets. You cannot invest directly in an index. |
| 4 | The Bloomberg U.S. Aggregate Bond Index is a broad-based benchmark that measures the investment-grade, U.S.-dollar-denominated, fixed-rate taxable bond market, including Treasuries, government-related and corporate securities, mortgage-backed securities (agency fixed-rate and hybrid adjustable-rate mortgage pass-throughs), asset-backed securities, and commercial mortgage-backed securities. You cannot invest directly in an index. |
| 5 | The Bloomberg Global Aggregate ex-USD Index (unhedged) is an unmanaged index that provides a broad-based measure of the global investment-grade fixed-income markets excluding the U.S.-dollar-denominated debt market. You cannot invest directly in an index. |
| 6 | The Bloomberg Municipal Bond Index is an unmanaged index composed of long-term tax-exempt bonds with a minimum credit rating of Baa. You cannot invest directly in an index. |
| 7 | The ICE BofA U.S. High Yield Index is a market-capitalization-weighted index of domestic and Yankee high-yield bonds. The index tracks the performance of high-yield securities traded in the U.S. bond market. You cannot invest directly in an index. Copyright 2022. ICE Data Indices, LLC. All rights reserved. |
| 1 | The Consumer Price Index (CPI) is a measure of the average change over time in the prices paid by urban consumers for a market basket of consumer goods and services. You cannot invest directly in an index. |
| 2 | The MSCI ACWI (Net) is a free-float-adjusted market-capitalization-weighted index that is designed to measure the equity market performance of developed and emerging markets. You cannot invest directly in an index. |

President
Allspring Funds
| Investment objective | The Fund seeks current income exempt from federal income tax. |
| Manager | Allspring Funds Management, LLC |
| Subadviser | Allspring Global Investments, LLC |
| Portfolio managers | Terry J. Goode, Robert J. Miller, Nicholos Venditti |
| Average annual total returns (%) as of June 30, 2022 | |||||||||
| Including sales charge | Excluding sales charge | Expense ratios1(%) | |||||||
| Inception date | 1 year | Since inception | 1 year | Since inception | Gross | Net 2 | |||
| Class A (WMSAX) | 2-28-2020 | -13.54 | -3.11 | -9.47 | -1.19 | 1.85 | 0.75 | ||
| Class C (WMSCX) | 2-28-2020 | -10.49 | -1.64 | -9.60 | -1.64 | 2.60 | 1.50 | ||
| Class R6 (WMSRX) | 2-28-2020 | - | - | -9.16 | -0.84 | 1.47 | 0.40 | ||
| Administrator Class (WMSDX) | 2-28-2020 | - | - | -9.34 | -1.04 | 1.79 | 0.60 | ||
| Institutional Class (WMSIX) | 2-28-2020 | - | - | -9.20 | -0.89 | 1.52 | 0.45 | ||
| Bloomberg Municipal Bond Index3 | – | - | - | -8.57 | -2.49* | - | - | ||
| * | Based on the inception date of the oldest Fund class. |
| 1 | Reflects the expense ratios as stated in the most recent prospectuses. The expense ratios shown are subject to change and may differ from the annualized expense ratios shown in the financial highlights of this report. |
| 2 | The manager has contractually committed through October 31, 2022, to waive fees and/or reimburse expenses to the extent necessary to cap total annual fund operating expenses after fee waivers at 0.75% for Class A, 1.50% for Class C, 0.40% for Class R6, 0.60% for Administrator Class, and 0.45% for Institutional Class. Brokerage commissions, stamp duty fees, interest, taxes, acquired fund fees and expenses (if any), and extraordinary expenses are excluded from the expense caps. Prior to or after the commitment expiration date, the caps may be increased or the commitment to maintain the caps may be terminated only with the approval of the Board of Trustees. Without these caps, the Fund’s returns would have been lower. The expense ratio paid by an investor is the net expense ratio (the total annual fund operating expenses after fee waivers) as stated in the prospectuses. |
| 3 | The Bloomberg Municipal Bond Index is an unmanaged index composed of long-term tax-exempt bonds with a minimum credit rating of Baa. You cannot invest directly in an index. |

| 1 | The chart compares the performance of Class A shares since inception with the Bloomberg Municipal Bond Index. The chart assumes a hypothetical investment of $10,000 in Class A shares and reflects all operating expenses and assumes the maximum initial sales charge of 4.50%. |
| ■ | The Fund underperformed its benchmark, the Bloomberg Municipal Bond Index, for the 12-month period that ended June 30, 2022. |
| ■ | Quality allocation and security selection were detractors from performance. |
| ■ | Duration was also a detractor from relative performance as municipal rates rose, especially in the second half of the period, while the Fund was long duration relative to the index. Yield-curve positioning offset some of the negative performance due to duration positioning, with an underweight to the weaker-performing long-maturity segments. |
| ■ | Sector allocation contributed to performance. |
| Credit quality as of June 30, 20221 |

| 1 | The credit quality distribution of portfolio holdings reflected in the chart is based on ratings from Standard & Poor’s, Moody’s Investors Service, and/or Fitch Ratings Ltd. Credit quality ratings apply to the underlying holdings of the Fund and not to the Fund itself. The percentages of the portfolio with the ratings depicted in the chart are calculated based on the market value of fixed income securities held by the Fund. If a security was rated by all three rating agencies, the middle rating was utilized. If rated by two of the three rating agencies, the lower rating was utilized, and if rated by one of the rating agencies, that rating was utilized. Standard & Poor’s rates the creditworthiness of bonds, ranging from AAA (highest) to D (lowest). Ratings from A to CCC may be modified by the addition of a plus (+) or minus (-) sign to show relative standing within the rating categories. Standard & Poor’s rates the creditworthiness of short-term notes from SP-1 (highest) to SP-3 (lowest). Moody’s rates the creditworthiness of bonds, ranging from Aaa (highest) to C (lowest). Ratings Aa to B may be modified by the addition of a number 1 (highest) to 3 (lowest) to show relative standing within the ratings categories. Moody’s rates the creditworthiness of short-term U.S. tax-exempt municipal securities from MIG 1/VMIG 1 (highest) to SG (lowest). Fitch rates the creditworthiness of bonds, ranging from AAA (highest) to D (lowest). Credit quality distribution is subject to change and may have changed since the date specified. |
| Effective maturity distribution as of June 30, 20221 |

| 1 | Figures represent the percentage of the Fund's long-term investments. These amounts are subject to change and may have changed since the date specified. |
| Beginning account value 1-1-2022 | Ending account value 6-30-2022 | Expenses paid during the period1 | Annualized net expense ratio | |
| Class A | ||||
| Actual | $1,000.00 | $ 904.18 | $ 3.54 | 0.75% |
| Hypothetical (5% return before expenses) | $1,000.00 | $1,021.08 | $ 3.76 | 0.75% |
| Class C | ||||
| Actual | $1,000.00 | $ 906.23 | $1.51 2 | 0.32% 2 |
| Hypothetical (5% return before expenses) | $1,000.00 | $1,023.21 | $1.61 2 | 0.32% 2 |
| Class R6 | ||||
| Actual | $1,000.00 | $ 905.76 | $ 1.89 | 0.40% |
| Hypothetical (5% return before expenses) | $1,000.00 | $1,022.81 | $ 2.01 | 0.40% |
| Administrator Class | ||||
| Actual | $1,000.00 | $ 904.86 | $ 2.83 | 0.60% |
| Hypothetical (5% return before expenses) | $1,000.00 | $1,021.82 | $ 3.01 | 0.60% |
| Institutional Class | ||||
| Actual | $1,000.00 | $ 905.53 | $ 2.13 | 0.45% |
| Hypothetical (5% return before expenses) | $1,000.00 | $1,022.56 | $ 2.26 | 0.45% |
| Interest rate | Maturity date | Principal | Value | ||
| Municipal obligations: 98.01% | |||||
| Alabama: 1.04% | |||||
| Education revenue: 1.04% | |||||
| University of North Alabama Revenue Bonds General Fee Series A | 5.00% | 11-1-2022 | $ 265,000 | $ 265,672 | |
| Arizona: 1.21% | |||||
| GO revenue: 1.21% | |||||
| Maricopa County AZ Elementary School District #25 Liberty School Improvement Project 2019 Series A (AGM Insured) | 5.00 | 7-1-2023 | 300,000 | 309,574 | |
| California: 8.47% | |||||
| Education revenue: 0.43% | |||||
| California Municipal Finance Authority Education Revenue Bond Stream Charter School Project Series A 144A | 5.00 | 6-15-2051 | 125,000 | 110,572 | |
| GO revenue: 2.14% | |||||
| Newman-Crows Landing Unified School District 2022 ¤ | 0.00 | 8-1-2025 | 600,000 | 547,080 | |
| Health revenue: 0.42% | |||||
| California Municipal Finance Authority Revenue Refunding Bonds Eisenhower Medical Center Series A | 5.00 | 7-1-2027 | 100,000 | 107,443 | |
| Housing revenue: 2.63% | |||||
| California Municipal Finance Authority Special Finance Agency XII California Essential Housing Revenue Bond Allure Apartments Series A-2 Junior Bonds 144A | 4.38 | 8-1-2049 | 200,000 | 153,036 | |
| California Municipal Finance Authority Student Housing Revenue Bond CHF Riverside I LLC - University of California Riverside North District Phase 1 Student Housing Project | 5.00 | 5-15-2029 | 375,000 | 404,380 | |
| California Statewide CDA Community Improvement Authority Essential Housing Revenue Bonds Mezzanine Lien Waterscape Apartments Series 2021B 144A | 4.00 | 9-1-2046 | 150,000 | 116,764 | |
| 674,180 | |||||
| Miscellaneous revenue: 2.85% | |||||
| California Infrastructure & Economic Development Bank Lease Revenue Teachers Retirement | 5.00 | 8-1-2030 | 310,000 | 349,415 | |
| San Francisco City & County CA 49 South Van Ness Project Green Bond Series A | 4.00 | 4-1-2034 | 370,000 | 378,975 | |
| 728,390 | |||||
| 2,167,665 | |||||
| Colorado: 5.52% | |||||
| Education revenue: 2.28% | |||||
| Colorado ECFA Revenue Improvement & Refunding Bonds Charter School | 5.00 | 3-15-2027 | 535,000 | 584,358 | |
| Health revenue: 1.93% | |||||
| Colorado Health Facilities Authority Revenue Bonds Hospital Advent Health Obligated Group Series A | 4.00 | 11-15-2043 | 500,000 | 493,482 |
| Interest rate | Maturity date | Principal | Value | ||
| Tax revenue: 1.31% | |||||
| Regional Colorado Transportation District Private Activity Bond Denver Transit Partners Eagle P3 Project Series A | 4.00% | 7-15-2040 | $ 375,000 | $ 336,183 | |
| 1,414,023 | |||||
| District of Columbia: 1.08% | |||||
| Water & sewer revenue: 1.08% | |||||
| District of Columbia Water & Sewer Authority Public Utility Green Bond Series A | 5.00 | 10-1-2038 | 250,000 | 277,486 | |
| Florida: 0.44% | |||||
| Education revenue: 0.44% | |||||
| Florida Development Finance Corporation Educational Facilities United Cerebral Palsy Charter Schools Projects Social Bonds Series A | 5.00 | 6-1-2050 | 125,000 | 112,041 | |
| Georgia: 1.05% | |||||
| Education revenue: 1.05% | |||||
| Georgia Private Colleges & Universities Authority Mercer University Project Series 2022 %% | 5.25 | 10-1-2051 | 250,000 | 267,626 | |
| Guam: 1.02% | |||||
| Water & sewer revenue: 1.02% | |||||
| Guam Government Waterworks Authority Series A | 5.00 | 1-1-2050 | 250,000 | 260,608 | |
| Idaho: 1.57% | |||||
| Health revenue: 1.57% | |||||
| Idaho Health Facilities Authority Hospital Trinity Health Credit Group Series A | 5.00 | 12-1-2047 | 385,000 | 402,419 | |
| Illinois: 18.54% | |||||
| Education revenue: 2.51% | |||||
| Illinois Finance Authority LEARN Charter School Project | 4.00 | 11-1-2051 | 750,000 | 643,774 | |
| GO revenue: 3.63% | |||||
| Chicago IL Series A | 6.00 | 1-1-2038 | 375,000 | 402,563 | |
| Decatur IL Green Bond (BAM Insured) | 5.00 | 3-1-2024 | 375,000 | 389,973 | |
| Kendall, Kane & Will Counties IL CAB School District #308 (AGM Insured) ¤ | 0.00 | 2-1-2027 | 155,000 | 135,857 | |
| 928,393 | |||||
| Health revenue: 2.40% | |||||
| Southwestern Illinois Development Authority Health Facility Revenue Bonds Series 2017A | 5.00 | 2-15-2025 | 580,000 | 614,166 | |
| Miscellaneous revenue: 2.42% | |||||
| Illinois Finance Authority Clean Water Initiative Revolving Fund | 5.00 | 7-1-2024 | 585,000 | 618,999 | |
| Tax revenue: 2.06% | |||||
| Chicago IL Transit Authority Sales Tax Receipts (AGM Insured) | 5.00 | 12-1-2046 | 500,000 | 528,156 | |
| Transportation revenue: 2.69% | |||||
| Chicago IL Public Building Commission Chicago Transit Authority (Ambac Insured) | 5.25 | 3-1-2031 | 600,000 | 688,310 |
| Interest rate | Maturity date | Principal | Value | ||
| Water & sewer revenue: 2.83% | |||||
| Chicago IL Wastewater Transmission Series C | 5.00% | 1-1-2024 | $ 700,000 | $ 725,127 | |
| 4,746,925 | |||||
| Indiana: 4.38% | |||||
| Miscellaneous revenue: 2.25% | |||||
| Indiana Finance Authority State Revolving Fund Program Refunding Green Bonds Series E | 5.00 | 2-1-2047 | 500,000 | 575,294 | |
| Water & sewer revenue: 2.13% | |||||
| Indiana Finance Authority State Revolving Fund Program Refunding Green Bonds Series B | 5.00 | 2-1-2028 | 500,000 | 545,086 | |
| 1,120,380 | |||||
| Louisiana: 0.63% | |||||
| Water & sewer revenue: 0.63% | |||||
| New Orleans LA Water Revenue (BAM Insured) | 5.00 | 12-1-2034 | 150,000 | 160,403 | |
| Maryland: 1.92% | |||||
| Housing revenue: 1.92% | |||||
| Maryland CDA Department of Housing & Community Multifamily Development Woodside Gardens Series A 144A | 1.33 | 1-1-2024 | 500,000 | 491,947 | |
| Massachusetts: 3.81% | |||||
| Education revenue: 2.11% | |||||
| Massachusetts Development Finance Agency Boston College Issue Series U | 5.00 | 7-1-2025 | 500,000 | 539,093 | |
| Health revenue: 1.70% | |||||
| Massachusetts Development Finance Agency Milford Regional Medical Center Series G 144A | 5.00 | 7-15-2025 | 125,000 | 131,098 | |
| Massachusetts Development Finance Agency Revenue Bonds Boston Medical Center Issue Series D | 5.00 | 7-1-2044 | 300,000 | 304,161 | |
| 435,259 | |||||
| 974,352 | |||||
| Michigan: 4.18% | |||||
| Miscellaneous revenue: 2.11% | |||||
| Michigan Building Authority Series I | 5.00 | 10-15-2031 | 500,000 | 540,657 | |
| Tax revenue: 0.39% | |||||
| Michigan Finance Authority Local Government Loan Program Public Lighting Authority Refunding Bonds Series B | 5.00 | 7-1-2044 | 100,000 | 100,754 | |
| Water & sewer revenue: 1.68% | |||||
| Great Lakes MI Water Authority Water Supply System Series D | 5.00 | 7-1-2031 | 400,000 | 428,692 | |
| 1,070,103 |
| Interest rate | Maturity date | Principal | Value | ||
| Minnesota: 0.37% | |||||
| Education revenue: 0.37% | |||||
| St. Paul MN Housing & RDA Charter School Hmong College Preparatory Academy Project Series 2020A | 5.00% | 9-1-2055 | $ 100,000 | $ 94,145 | |
| Nevada: 4.72% | |||||
| GO revenue: 4.72% | |||||
| Clark County NV Flood Control District | 5.00 | 11-1-2029 | 500,000 | 568,636 | |
| Clark County NV School District Building Series A | 4.00 | 6-15-2035 | 625,000 | 640,709 | |
| 1,209,345 | |||||
| New Jersey: 1.52% | |||||
| Miscellaneous revenue: 1.08% | |||||
| New Jersey EDA Series XX | 4.00 | 6-15-2024 | 270,000 | 276,852 | |
| Tax revenue: 0.44% | |||||
| New Jersey Garden State Preservation Trust Open & Farmland Series A (AGM Insured) | 5.75 | 11-1-2028 | 100,000 | 112,104 | |
| 388,956 | |||||
| New York: 6.91% | |||||
| Education revenue: 4.19% | |||||
| Allegany County NY Capital Resource Corporation Tax-Exempt Revenue Bonds Series 2022A | 5.00 | 12-1-2026 | 390,000 | 409,599 | |
| Build New York City Resource Corporation Richmond Preparatory Charter School Social Impact Project Series A 144A | 5.00 | 6-1-2041 | 150,000 | 149,086 | |
| New York Dormitory Authority Non-State Supported Debt Series A | 5.00 | 7-1-2038 | 270,000 | 296,750 | |
| Tompkins County Development Corporation Tax-Exempt Revenue Refunding Bonds Series 2017 | 5.00 | 7-1-2041 | 205,000 | 216,925 | |
| 1,072,360 | |||||
| GO revenue: 0.51% | |||||
| Poughkeepsie City NY Refunding Bonds Public Improvement | 5.00 | 6-1-2024 | 125,000 | 130,092 | |
| Water & sewer revenue: 2.21% | |||||
| New York Environmental Facilities Corporation Clean Water & Drinking Water New York City Municipal Water Finance Authority Project Series A | 5.00 | 6-15-2032 | 500,000 | 567,040 | |
| 1,769,492 | |||||
| North Carolina: 0.73% | |||||
| Housing revenue: 0.73% | |||||
| North Carolina Capital Facilities Finance Refunding Bonds The Arc of North Carolina Projects Series A (Department of Housing and Urban Development Insured) | 5.00 | 10-1-2024 | 180,000 | 186,261 | |
| Oklahoma: 0.97% | |||||
| Miscellaneous revenue: 0.97% | |||||
| McIntosh County Educational Facilities Authority Educational Facilities Lease Revenue Bonds Series 2022 | 2.00 | 9-1-2023 | 250,000 | 249,477 |
| Interest rate | Maturity date | Principal | Value | ||
| Oregon: 3.89% | |||||
| GO revenue: 2.14% | |||||
| Bend OR Series 2020 | 5.00% | 6-1-2050 | $ 500,000 | $ 547,001 | |
| Health revenue: 1.75% | |||||
| Oregon State Facilities Authority Revenue Refunding Bonds Samaritan Health Services Project | 5.00 | 10-1-2031 | 430,000 | 449,335 | |
| 996,336 | |||||
| Pennsylvania: 8.97% | |||||
| Education revenue: 2.84% | |||||
| Allegheny County PA Higher Education Robert Morris University | 5.00 | 10-15-2037 | 250,000 | 251,288 | |
| Philadelphia PA IDA Saint Joseph's University Series C | 4.00 | 11-1-2037 | 500,000 | 474,645 | |
| 725,933 | |||||
| Health revenue: 3.93% | |||||
| Lancaster County Hospital Authority Series 2021 | 5.00 | 11-1-2051 | 625,000 | 655,929 | |
| Westmoreland County PA IDA Excela Health Project Series A | 4.00 | 7-1-2037 | 375,000 | 350,994 | |
| 1,006,923 | |||||
| Transportation revenue: 2.20% | |||||
| Pennsylvania Turnpike Commission Turnpike Series B-1 | 5.25 | 6-1-2047 | 535,000 | 563,317 | |
| 2,296,173 | |||||
| South Carolina: 1.15% | |||||
| Education revenue: 1.15% | |||||
| South Carolina Jobs EDA Revenue Wofford College Project | 5.00 | 4-1-2033 | 270,000 | 293,419 | |
| Texas: 3.45% | |||||
| GO revenue: 2.53% | |||||
| Dallas County TX Hospital District Limited Tax | 5.00 | 8-15-2030 | 625,000 | 646,982 | |
| Water & sewer revenue: 0.92% | |||||
| Texas Water Development Board State Water Implementation Revenue Fund For Texas Revenue Bonds Series 2018B | 5.00 | 4-15-2024 | 225,000 | 237,210 | |
| 884,192 | |||||
| Utah: 4.49% | |||||
| Housing revenue: 4.49% | |||||
| Utah Board of Higher Education University of Utah Bonds Series 2022B %% | 5.00 | 8-1-2042 | 1,000,000 | 1,148,487 | |
| Washington: 5.33% | |||||
| Education revenue: 0.62% | |||||
| Washington HEFAR Seattle University Project | 5.00 | 5-1-2027 | 145,000 | 157,968 | |
| GO revenue: 2.69% | |||||
| King County WA Public Hospital District #1 Valley Medical Center Refunding Bond | 5.00 | 12-1-2026 | 625,000 | 687,839 |
| Interest rate | Maturity date | Principal | Value | ||
| Utilities revenue: 2.02% | |||||
| Chelan County WA Public Utility District #001 Consolidated Revenue Refunding Bonds Governmental Series A | 4.00% | 7-1-2036 | $ 500,000 | $ 518,584 | |
| 1,364,391 | |||||
| Wisconsin: 0.65% | |||||
| Health revenue: 0.65% | |||||
| PFA Hospital Revenue Bonds Carson Valley Medical Center Series A | 4.00 | 12-1-2051 | 200,000 | 167,602 | |
| Total Municipal obligations (Cost $26,492,675) | 25,089,500 |
| Yield | Shares | ||||
| Short-term investments: 6.47% | |||||
| Investment companies: 6.47% | |||||
| Allspring Municipal Cash Management Money Market Fund Institutional Class ♠∞## | 0.85 | 1,656,384 | 1,657,378 | ||
| Total Short-term investments (Cost $1,657,204) | 1,657,378 | ||||
| Total investments in securities (Cost $28,149,879) | 104.48% | 26,746,878 | |||
| Other assets and liabilities, net | (4.48) | (1,147,297) | |||
| Total net assets | 100.00% | $25,599,581 |
| 144A | The security may be resold in transactions exempt from registration, normally to qualified institutional buyers, pursuant to Rule 144A under the Securities Act of 1933. |
| ¤ | The security is issued in zero coupon form with no periodic interest payments. |
| ## | All or a portion of this security is segregated for when-issued securities. |
| ♠ | The issuer of the security is an affiliated person of the Fund as defined in the Investment Company Act of 1940. |
| ∞ | The rate represents the 7-day annualized yield at period end. |
| %% | The security is purchased on a when-issued basis. |
| Abbreviations: | |
| AGM | Assured Guaranty Municipal |
| Ambac | Ambac Financial Group Incorporated |
| BAM | Build America Mutual Assurance Company |
| CAB | Capital appreciation bond |
| CDA | Community Development Authority |
| ECFA | Educational & Cultural Facilities Authority |
| EDA | Economic Development Authority |
| GO | General obligation |
| HEFAR | Higher Education Facilities Authority Revenue |
| IDA | Industrial Development Authority |
| PFA | Public Finance Authority |
| RDA | Redevelopment Authority |
| Value, beginning of period | Purchases | Sales proceeds | Net realized gains (losses) | Net change in unrealized gains (losses) | Value, end of period | Shares, end of period | Income from affiliated securities | |
| Short-term investments | ||||||||
| Allspring Municipal Cash Management Money Market Fund Institutional Class | $302,778 | $11,649,571 | $(10,295,344) | $199 | $174 | $1,657,378 | 1,656,384 | $189 |
| Assets | |
Investments in unaffiliated securities, at value (cost $26,492,675) | $ 25,089,500 |
Investments in affiliated securities, at value (cost $1,657,204) | 1,657,378 |
Receivable for interest | 297,302 |
Receivable from manager | 4,151 |
Receivable for investments sold | 3,926 |
Prepaid expenses and other assets | 8,878 |
Total assets | 27,061,135 |
| Liabilities | |
Payable for when-issued transactions | 1,440,200 |
Trustees’ fees and expenses payable | 2,610 |
Payable for Fund shares redeemed | 1,142 |
Administration fees payable | 1,022 |
Distribution fee payable | 309 |
Accrued expenses and other liabilities | 16,271 |
Total liabilities | 1,461,554 |
Total net assets | $25,599,581 |
| Net assets consist of | |
Paid-in capital | $ 27,448,378 |
Total distributable loss | (1,848,797) |
Total net assets | $25,599,581 |
| Computation of net asset value and offering price per share | |
Net assets – Class A | $ 1,161,256 |
Shares outstanding – Class A1 | 62,003 |
Net asset value per share – Class A | $18.73 |
Maximum offering price per share – Class A2 | $19.61 |
Net assets – Class C | $ 946,944 |
Shares outstanding – Class C1 | 50,283 |
Net asset value per share – Class C | $18.83 |
Net assets – Class R6 | $ 19,928,795 |
Shares outstanding – Class R61 | 1,064,072 |
Net asset value per share – Class R6 | $18.73 |
Net assets – Administrator Class | $ 1,088,791 |
Shares outstanding – Administrator Class1 | 58,134 |
Net asset value per share – Administrator Class | $18.73 |
Net assets – Institutional Class | $ 2,473,795 |
Shares outstanding – Institutional Class1 | 132,087 |
Net asset value per share – Institutional Class | $18.73 |
| 1 | The Fund has an unlimited number of authorized shares. |
| 2 | Maximum offering price is computed as 100/95.50 of net asset value. On investments of $50,000 or more, the offering price is reduced. |
| Investment income | |
Interest | $ 639,456 |
Income from affiliated securities | 189 |
Total investment income | 639,645 |
| Expenses | |
Management fee | 109,046 |
| Administration fees | |
Class A | 2,021 |
Class C | 1,626 |
Class R6 | 6,410 |
Administrator Class | 1,163 |
Institutional Class | 1,962 |
| Shareholder servicing fees | |
Class A | 3,157 |
Class C | 2,541 |
Administrator Class | 2,908 |
| Distribution fee | |
Class C | 7,622 |
Custody and accounting fees | 5,334 |
Professional fees | 22,681 |
Registration fees | 67,192 |
Shareholder report expenses | 23,044 |
Trustees’ fees and expenses | 20,032 |
Other fees and expenses | 5,944 |
Total expenses | 282,683 |
| Less: Fee waivers and/or expense reimbursements | |
Fund-level | (152,441) |
Class A | (375) |
Class C | (6,586) |
Administrator Class | (1,386) |
Net expenses | 121,895 |
Net investment income | 517,750 |
| Realized and unrealized gains (losses) on investments | |
| Net realized gains (losses) on | |
Unaffiliated securities | (195,808) |
Affiliated securities | 199 |
Net realized losses on investments | (195,609) |
| Net change in unrealized gains (losses) on | |
Unaffiliated securities | (2,945,229) |
Affiliated securities | 174 |
Net change in unrealized gains (losses) on investments | (2,945,055) |
Net realized and unrealized gains (losses) on investments | (3,140,664) |
Net decrease in net assets resulting from operations | $(2,622,914) |
| Year ended June 30, 2022 | Year ended June 30, 2021 | |||
| Operations | ||||
Net investment income | $ 517,750 | $ 500,443 | ||
Net realized gains (losses) on investments | (195,609) | 128,381 | ||
Net change in unrealized gains (losses) on investments | (2,945,055) | 723,884 | ||
Net increase (decrease) in net assets resulting from operations | (2,622,914) | 1,352,708 | ||
| Distributions to shareholders from | ||||
| Net investment income and net realized gains | ||||
Class A | (20,430) | (17,573) | ||
Class C | (9,713) | (9,545) | ||
Class R6 | (420,586) | (432,065) | ||
Administrator Class | (20,570) | (19,469) | ||
Institutional Class | (47,135) | (20,488) | ||
Total distributions to shareholders | (518,434) | (499,140) | ||
| Capital share transactions | Shares | Shares | ||
| Proceeds from shares sold | ||||
Class A | 11,757 | 247,206 | 6,252 | 129,818 |
Administrator Class | 1,286 | 26,349 | 12,749 | 268,337 |
Institutional Class | 116,315 | 2,407,016 | 5,584 | 116,637 |
| 2,680,571 | 514,792 | |||
| Reinvestment of distributions | ||||
Class A | 663 | 13,052 | 25 | 530 |
Class C | 283 | 5,551 | 0 | 0 |
Class R6 | 14,072 | 277,876 | 0 | 0 |
Administrator Class | 658 | 12,951 | 45 | 932 |
Institutional Class | 1,957 | 38,861 | 20 | 429 |
| 348,291 | 1,891 | |||
| Payment for shares redeemed | ||||
Class A | (5,387) | (109,248) | (1,408) | (29,021) |
Administrator Class | (482) | (9,946) | (6,122) | (128,854) |
Institutional Class | (41,768) | (819,382) | (21) | (433) |
| (938,576) | (158,308) | |||
Net increase in net assets resulting from capital share transactions | 2,090,286 | 358,375 | ||
Total increase (decrease) in net assets | (1,051,062) | 1,211,943 | ||
| Net assets | ||||
Beginning of period | 26,650,643 | 25,438,700 | ||
End of period | $25,599,581 | $26,650,643 | ||
| Year ended June 30 | |||
| Class A | 2022 | 2021 | 2020 1 |
Net asset value, beginning of period | $21.03 | $20.35 | $20.00 |
Net investment income | 0.32 | 0.34 | 0.10 |
Net realized and unrealized gains (losses) on investments | (2.29) | 0.68 | 0.35 |
Total from investment operations | (1.97) | 1.02 | 0.45 |
| Distributions to shareholders from | |||
Net investment income | (0.33) | (0.34) | (0.10) |
Net asset value, end of period | $18.73 | $21.03 | $20.35 |
Total return2 | (9.47)% | 5.04% | 2.27% |
| Ratios to average net assets (annualized) | |||
Gross expenses | 1.34% | 1.85% | 2.26% |
Net expenses | 0.75% | 0.75% | 0.75% |
Net investment income | 1.60% | 1.64% | 1.52% |
| Supplemental data | |||
Portfolio turnover rate | 31% | 77% | 32% |
Net assets, end of period (000s omitted) | $1,161 | $1,156 | $1,020 |
| 1 | For the period from February 28, 2020 (commencement of class operations) to June 30, 2020 |
| 2 | Total return calculations do not include any sales charges. Returns for periods of less than one year are not annualized. |
| Year ended June 30 | |||
| Class C | 2022 | 2021 | 2020 1 |
Net asset value, beginning of period | $21.03 | $20.35 | $20.00 |
Net investment income | 0.30 | 0.19 | 0.05 |
Net realized and unrealized gains (losses) on investments | (2.31) | 0.68 | 0.36 |
Total from investment operations | (2.01) | 0.87 | 0.41 |
| Distributions to shareholders from | |||
Net investment income | (0.19) | (0.19) | (0.06) |
Net asset value, end of period | $18.83 | $21.03 | $20.35 |
Total return2 | (9.60)% | 4.30% | 2.04% |
| Ratios to average net assets (annualized) | |||
Gross expenses | 2.09% | 2.35% | 3.01% |
Net expenses | 0.88% * | 1.46% * | 1.50% |
Net investment income | 1.47% | 0.93% | 0.78% |
| Supplemental data | |||
Portfolio turnover rate | 31% | 77% | 32% |
Net assets, end of period (000s omitted) | $947 | $1,051 | $1,017 |
| * | Ratio includes class-level expenses which were voluntarily waived by the investment manager. Without this voluntary waiver, the net expense ratio would be increased by the following amounts: |
| Year ended June 30, 2022 | 0.62% |
| Year ended June 30, 2021 | 0.04% |
| 1 | For the period from February 28, 2020 (commencement of class operations) to June 30, 2020 |
| 2 | Total return calculations do not include any sales charges. Returns for periods of less than one year are not annualized. |
| Year ended June 30 | |||
| Class R6 | 2022 | 2021 | 2020 1 |
Net asset value, beginning of period | $21.03 | $20.35 | $20.00 |
Net investment income | 0.39 | 0.41 | 0.13 2 |
Net realized and unrealized gains (losses) on investments | (2.29) | 0.68 | 0.35 |
Total from investment operations | (1.90) | 1.09 | 0.48 |
| Distributions to shareholders from | |||
Net investment income | (0.40) | (0.41) | (0.13) |
Net asset value, end of period | $18.73 | $21.03 | $20.35 |
Total return3 | (9.16)% | 5.41% | 2.39% |
| Ratios to average net assets (annualized) | |||
Gross expenses | 0.96% | 1.48% | 1.88% |
Net expenses | 0.40% | 0.40% | 0.40% |
Net investment income | 1.95% | 1.99% | 1.87% |
| Supplemental data | |||
Portfolio turnover rate | 31% | 77% | 32% |
Net assets, end of period (000s omitted) | $19,929 | $22,082 | $21,367 |
| 1 | For the period from February 28, 2020 (commencement of class operations) to June 30, 2020 |
| 2 | Calculated based upon average shares outstanding |
| 3 | Returns for periods of less than one year are not annualized. |
| Year ended June 30 | |||
| Administrator Class | 2022 | 2021 | 2020 1 |
Net asset value, beginning of period | $21.03 | $20.35 | $20.00 |
Net investment income | 0.35 | 0.37 | 0.11 |
Net realized and unrealized gains (losses) on investments | (2.29) | 0.68 | 0.35 |
Total from investment operations | (1.94) | 1.05 | 0.46 |
| Distributions to shareholders from | |||
Net investment income | (0.36) | (0.37) | (0.11) |
Net asset value, end of period | $18.73 | $21.03 | $20.35 |
Total return2 | (9.34)% | 5.20% | 2.32% |
| Ratios to average net assets (annualized) | |||
Gross expenses | 1.28% | 1.77% | 2.20% |
Net expenses | 0.60% | 0.60% | 0.60% |
Net investment income | 1.75% | 1.80% | 1.67% |
| Supplemental data | |||
Portfolio turnover rate | 31% | 77% | 32% |
Net assets, end of period (000s omitted) | $1,089 | $1,192 | $1,017 |
| 1 | For the period from February 28, 2020 (commencement of class operations) to June 30, 2020 |
| 2 | Returns for periods of less than one year are not annualized. |
| Year ended June 30 | |||
| Institutional Class | 2022 | 2021 | 2020 1 |
Net asset value, beginning of period | $21.03 | $20.35 | $20.00 |
Net investment income | 0.39 | 0.40 | 0.12 |
Net realized and unrealized gains (losses) on investments | (2.30) | 0.68 | 0.35 |
Total from investment operations | (1.91) | 1.08 | 0.47 |
| Distributions to shareholders from | |||
Net investment income | (0.39) | (0.40) | (0.12) |
Net asset value, end of period | $18.73 | $21.03 | $20.35 |
Total return2 | (9.20)% | 5.36% | 2.37% |
| Ratios to average net assets (annualized) | |||
Gross expenses | 1.01% | 1.52% | 1.93% |
Net expenses | 0.45% | 0.45% | 0.45% |
Net investment income | 1.90% | 1.94% | 1.82% |
| Supplemental data | |||
Portfolio turnover rate | 31% | 77% | 32% |
Net assets, end of period (000s omitted) | $2,474 | $1,169 | $1,017 |
| 1 | For the period from February 28, 2020 (commencement of class operations) to June 30, 2020 |
| 2 | Returns for periods of less than one year are not annualized. |
| Gross unrealized gains | $ 36,271 |
| Gross unrealized losses | (1,439,272) |
| Net unrealized losses | $(1,403,001) |
| Paid-in capital | Total distributable loss |
| $(2,293) | $2,293 |
| ■ | Level 1 – quoted prices in active markets for identical securities |
| ■ | Level 2 – other significant observable inputs (including quoted prices for similar securities, interest rates, prepayment speeds, credit risk, etc.) |
| ■ | Level 3 – significant unobservable inputs (including the Fund’s own assumptions in determining the fair value of investments) |
| Quoted prices (Level 1) | Other significant observable inputs (Level 2) | Significant unobservable inputs (Level 3) | Total | |
| Assets | ||||
| Investments in: | ||||
| Municipal obligations | $ 0 | $ 25,089,500 | $0 | $ 25,089,500 |
| Short-term investments | ||||
| Investment companies | 1,657,378 | 0 | 0 | 1,657,378 |
| Total assets | $1,657,378 | $25,089,500 | $0 | $26,746,878 |
| Average daily net assets | Management fee |
| First $500 million | 0.400% |
| Next $500 million | 0.375 |
| Next $2 billion | 0.350 |
| Next $2 billion | 0.325 |
| Next $5 billion | 0.290 |
| Over $10 billion | 0.280 |
| Class-level administration fee | |
| Class A | 0.16% |
| Class C | 0.16 |
| Class R6 | 0.03 |
| Administrator Class | 0.10 |
| Institutional Class | 0.08 |
| Expense ratio caps | |
| Class A | 0.75% |
| Class C | 1.50 |
| Class R6 | 0.40 |
| Administrator Class | 0.60 |
| Institutional Class | 0.45 |
| Unrealized losses | Capital loss carryforward |
| $(1,403,001) | $(445,796) |
Allspring Funds Trust:

| Name and year of birth | Position held and length of service* | Principal occupations during past five years or longer | Current other public company or investment company directorships |
| William R. Ebsworth (Born 1957) | Trustee, since 2015 | Retired. From 1984 to 2013, equities analyst, portfolio manager, research director and chief investment officer at Fidelity Management and Research Company in Boston, Tokyo, and Hong Kong, and retired in 2013 as Chief Investment Officer of Fidelity Strategic Advisers, Inc. where he led a team of investment professionals managing client assets. Prior thereto, Board member of Hong Kong Securities Clearing Co., Hong Kong Options Clearing Corp., the Thailand International Fund, Ltd., Fidelity Investments Life Insurance Company, and Empire Fidelity Investments Life Insurance Company. Audit Committee Chair and Investment Committee Chair of the Vincent Memorial Hospital Endowment (non-profit organization). Mr. Ebsworth is a CFA® charterholder. | N/A |
| Jane A. Freeman (Born 1953) | Trustee, since 2015; Chair Liaison, since 2018 | Retired. From 2012 to 2014 and 1999 to 2008, Chief Financial Officer of Scientific Learning Corporation. From 2008 to 2012, Ms. Freeman provided consulting services related to strategic business projects. Prior to 1999, Portfolio Manager at Rockefeller & Co. and Scudder, Stevens & Clark. Board member of the Harding Loevner Funds from 1996 to 2014, serving as both Lead Independent Director and chair of the Audit Committee. Board member of the Russell Exchange Traded Funds Trust from 2011 to 2012 and the chair of the Audit Committee. Ms. Freeman is also an inactive Chartered Financial Analyst. | N/A |
| Isaiah Harris, Jr. (Born 1952) | Trustee, since 2009; Audit Committee Chair, since 2019 | Retired. Chairman of the Board of CIGNA Corporation from 2009 to 2021, and Director from 2005 to 2008. From 2003 to 2011, Director of Deluxe Corporation. Prior thereto, President and CEO of BellSouth Advertising and Publishing Corp. from 2005 to 2007, President and CEO of BellSouth Enterprises from 2004 to 2005 and President of BellSouth Consumer Services from 2000 to 2003. Emeritus member of the Iowa State University Foundation Board of Governors. Emeritus Member of the Advisory Board of Iowa State University School of Business. Advisory Board Member, Palm Harbor Academy (private school). Advisory Board Member, Fellowship of Christian Athletes. Mr. Harris is a certified public accountant (inactive status). | N/A |
| David F. Larcker (Born 1950) | Trustee, since 2009 | James Irvin Miller Professor of Accounting at the Graduate School of Business (Emeritus), Stanford University, Director of the Corporate Governance Research Initiative and Senior Faculty of The Rock Center for Corporate Governance since 2006. From 2005 to 2008, Professor of Accounting at the Graduate School of Business, Stanford University. Prior thereto, Ernst & Young Professor of Accounting at The Wharton School, University of Pennsylvania from 1985 to 2005. | N/A |
| Name and year of birth | Position held and length of service* | Principal occupations during past five years or longer | Current other public company or investment company directorships |
| Olivia S. Mitchell (Born 1953) | Trustee, since 2006; Nominating and Governance Committee Chair, since 2018 | International Foundation of Employee Benefit Plans Professor since 1993, Wharton School of the University of Pennsylvania. Director of Wharton’s Pension Research Council and Boettner Center on Pensions & Retirement Research, and Research Associate at the National Bureau of Economic Research. Previously taught at Cornell University from 1978 to 1993. | N/A |
| Timothy J. Penny (Born 1951) | Trustee, since 1996; Chair, since 2018 | President and Chief Executive Officer of Southern Minnesota Initiative Foundation, a non-profit organization, since 2007. Member of the Board of Trustees of NorthStar Education Finance, Inc., a non-profit organization, since 2007. | N/A |
| James G. Polisson (Born 1959) | Trustee, since 2018 | Retired. Chief Marketing Officer, Source (ETF) UK Services, Ltd, from 2015 to 2017. From 2012 to 2015, Principal of The Polisson Group, LLC, a management consulting, corporate advisory and principal investing company. Chief Executive Officer and Managing Director at Russell Investments, Global Exchange Traded Funds from 2010 to 2012. Managing Director of Barclays Global Investors from 1998 to 2010 and Global Chief Marketing Officer for iShares and Barclays Global Investors from 2000 to 2010. Trustee of the San Francisco Mechanics’ Institute, a non-profit organization, from 2013 to 2015. Board member of the Russell Exchange Traded Fund Trust from 2011 to 2012. Director of Barclays Global Investors Holdings Deutschland GmbH from 2006 to 2009. Mr. Polisson is an attorney and has a retired status with the Massachusetts and District of Columbia Bar Associations. | N/A |
| Pamela Wheelock (Born 1959) | Trustee, since January 2020; previously Trustee from January 2018 to July 2019 | Board member of the Destination Medical Center Economic Development Agency, Rochester, Minnesota since 2019. Interim President of the McKnight Foundation from January to September 2020. McKnight Foundation Consultant, November 2020 to February 2021. Acting Commissioner, Minnesota Department of Human Services, July 2019 through September 2019. Consultant (part-time), Minnesota Department of Human Services, October 2019 through December 2019. Chief Operating Officer, Twin Cities Habitat for Humanity from 2017 to 2019. Vice President of University Services, University of Minnesota from 2012 to 2016. Prior thereto, on the Board of Directors, Governance Committee and Finance Committee for the Minnesota Philanthropy Partners (Saint Paul Foundation) from 2012 to 2018, Interim Chief Executive Officer of Blue Cross Blue Shield of Minnesota from 2011 to 2012, Chairman of the Board from 2009 to 2012 and Board Director from 2003 to 2015. Vice President, Leadership and Community Engagement, Bush Foundation, Saint Paul, Minnesota (a private foundation) from 2009 to 2011. Executive Vice President and Chief Financial Officer, Minnesota Sports and Entertainment from 2004 to 2009 and Senior Vice President from 2002 to 2004. Executive Vice President of the Minnesota Wild Foundation from 2004 to 2008. Commissioner of Finance, State of Minnesota, from 1999 to 2002. Currently Board Chair of the Minnesota Wild Foundation since 2010. | N/A |
| Name and year of birth | Position held and length of service | Principal occupations during past five years or longer |
| Andrew Owen (Born 1960) | President, since 2017 | President, Chief Executive Officer and Director of Allspring Funds Management, LLC since 2017 and co-president of Galliard Capital Management, LLC, an affiliate of Allspring Funds Management, LLC, since 2019. Prior thereto, Head of Affiliated Managers, Allspring Global Investments, from 2014 to 2019 and Executive Vice President responsible for marketing, investments and product development for Allspring Funds Management, LLC, from 2009 to 2014. In addition, Mr. Owen was an Executive Vice President of Wells Fargo & Company from 2014 to 2021. |
| Jeremy DePalma (Born 1974) | Treasurer, since 2012 (for certain funds in the Fund Complex); since 2021 (for the remaining funds in the Fund Complex) | Senior Vice President of Allspring Funds Management, LLC since 2009. Senior Vice President of Evergreen Investment Management Company, LLC from 2008 to 2010 and head of the Fund Reporting and Control Team within Fund Administration from 2005 to 2010. |
| Kate McKinley (Born 1977) | Chief Legal Officer, since 2021 | Chief Legal Officer of Allspring Global Investments since 2021. Prior thereto, held various roles at State Street Global Advisors beginning in 2010, including serving as Senior Vice President and General Counsel from 2019 to 2021, and Chief Operating Officer of the Institutional Client Group from 2016 - 2019. Prior to working at State Street Global Advisors served as Assistant General Counsel for Bank of America Corporation from 2005 to 2010 and as an Associate at WilmerHale from 2002 to 2005. |
| Christopher Baker (Born 1976) | Chief Compliance Officer, since 2022 | Global Chief Compliance Officer for Allspring Global Investments since 2022. Prior thereto, Chief Compliance Officer for State Street Global Advisors from 2018 to 2021. Senior Compliance Officer for the State Street divisions of Alternative Investment Solutions, Sector Solutions, and Global Marketing from 2015 to 2018. From 2010 to 2015 Vice President, Global Head of Investment and Marketing Compliance for State Street Global Advisors. |
| Matthew Prasse (Born 1983) | Secretary, since 2021 | Senior Counsel of the Allspring Legal Department since 2021. Senior Counsel of the Wells Fargo Legal Department from 2018 to 2021. Previously, Counsel for Barings LLC from 2015 to 2018. Prior to joining Barings, Associate at Morgan, Lewis & Bockius LLP from 2008 to 2015. |
P.O. Box 219967
Kansas City, MO 64121-9967

1-800-222-8222 or visit the Fund's website at allspringglobal.com. Read the prospectus carefully before you invest or send money.
A297/AR297 06-22

Pennsylvania Tax-Free Fund
| 2 | |
| 6 | |
| 11 | |
| 12 | |
| Financial statements | |
| 18 | |
| 19 | |
| 20 | |
| 21 | |
| 24 | |
| 29 | |
| 30 |

| 1 | The S&P 500 Index consists of 500 stocks chosen for market size, liquidity, and industry group representation. It is a market-value-weighted index with each stock's weight in the index proportionate to its market value. You cannot invest directly in an index. |
| 2 | The Morgan Stanley Capital International (MSCI) All Country World Index (ACWI) ex USA Index (Net) is a free-float-adjusted market-capitalization-weighted index that is designed to measure the equity market performance of developed and emerging markets, excluding the U.S. Source: MSCI. MSCI makes no express or implied warranties or representations and shall have no liability whatsoever with respect to any MSCI data contained herein. The MSCI data may not be further redistributed or used as a basis for other indexes or any securities or financial products. This report is not approved, reviewed, or produced by MSCI. You cannot invest directly in an index. |
| 3 | The MSCI Emerging Markets (EM) Index (Net) (USD) is a free-float-adjusted market-capitalization-weighted index that is designed to measure equity market performance of emerging markets. You cannot invest directly in an index. |
| 4 | The Bloomberg U.S. Aggregate Bond Index is a broad-based benchmark that measures the investment-grade, U.S.-dollar-denominated, fixed-rate taxable bond market, including Treasuries, government-related and corporate securities, mortgage-backed securities (agency fixed-rate and hybrid adjustable-rate mortgage pass-throughs), asset-backed securities, and commercial mortgage-backed securities. You cannot invest directly in an index. |
| 5 | The Bloomberg Global Aggregate ex-USD Index (unhedged) is an unmanaged index that provides a broad-based measure of the global investment-grade fixed-income markets excluding the U.S.-dollar-denominated debt market. You cannot invest directly in an index. |
| 6 | The Bloomberg Municipal Bond Index is an unmanaged index composed of long-term tax-exempt bonds with a minimum credit rating of Baa. You cannot invest directly in an index. |
| 7 | The ICE BofA U.S. High Yield Index is a market-capitalization-weighted index of domestic and Yankee high-yield bonds. The index tracks the performance of high-yield securities traded in the U.S. bond market. You cannot invest directly in an index. Copyright 2022. ICE Data Indices, LLC. All rights reserved. |
| 1 | The Consumer Price Index (CPI) is a measure of the average change over time in the prices paid by urban consumers for a market basket of consumer goods and services. You cannot invest directly in an index. |
| 2 | The MSCI ACWI (Net) is a free-float-adjusted market-capitalization-weighted index that is designed to measure the equity market performance of developed and emerging markets. You cannot invest directly in an index. |

President
Allspring Funds
| Investment objective | The Fund seeks current income exempt from federal income tax and Pennsylvania individual income tax. |
| Manager | Allspring Funds Management, LLC |
| Subadviser | Allspring Global Investments, LLC |
| Portfolio managers | Bruce R. Johns, Kerry Laurin, Robert J. Miller |
| Average annual total returns (%) as of June 30, 2022 | |||||||||||
| Including sales charge | Excluding sales charge | Expense ratios1 (%) | |||||||||
| Inception date | 1 year | 5 year | 10 year | 1 year | 5 year | 10 year | Gross | Net 2 | |||
| Class A (EKVAX) | 12-27-1990 | -12.42 | 0.24 | 1.85 | -8.32 | 1.16 | 2.32 | 0.94 | 0.74 | ||
| Class C (EKVCX) | 2-1-1993 | -10.03 | 0.40 | 1.71 | -9.03 | 0.40 | 1.71 | 1.69 | 1.49 | ||
| Institutional Class (EKVYX) | 11-24-1997 | – | – | – | -8.10 | 1.42 | 2.58 | 0.61 | 0.49 | ||
| Bloomberg Municipal Bond Index3 | – | – | – | – | -8.57 | 1.51 | 2.38 | – | – | ||
| Bloomberg Pennsylvania Municipal Bond Index4 | – | – | – | – | -8.98 | 1.75 | 2.65 | – | – | ||
| 1 | Reflects the expense ratios as stated in the most recent prospectuses. The expense ratios shown are subject to change and may differ from the annualized expense ratios shown in the financial highlights of this report. |
| 2 | The manager has contractually committed through October 31, 2022, to waive fees and/or reimburse expenses to the extent necessary to cap total annual fund operating expenses after fee waivers at 0.74% for Class A, 1.49% for Class C, and 0.49% for Institutional Class. Brokerage commissions, stamp duty fees, interest, taxes, acquired fund fees and expenses (if any), and extraordinary expenses are excluded from the expense caps. Prior to or after the commitment expiration date, the caps may be increased or the commitment to maintain the caps may be terminated only with the approval of the Board of Trustees. Without these caps, the Fund’s returns would have been lower. The expense ratio paid by an investor is the net expense ratio (the total annual fund operating expenses after fee waivers) as stated in the prospectuses. |
| 3 | The Bloomberg Municipal Bond Index is an unmanaged index composed of long-term tax-exempt bonds with a minimum credit rating of Baa. You cannot invest directly in an index. |
| 4 | The Bloomberg Pennsylvania Municipal Bond Index is a Pennsylvania-specific total return index. The index is composed of Pennsylvania bonds. The bonds are all investment-grade, fixed-rate, long-term maturities (greater than two years) and are selected from issues larger than $50 million dated since January 1984. Bonds are added to the index and weighted and updated monthly, with a one-month lag. You cannot invest directly in an index. |
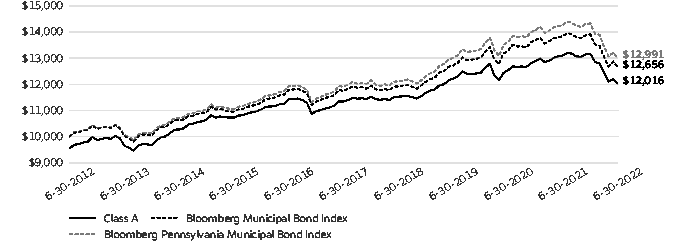
| 1 | The chart compares the performance of Class A shares for the most recent ten years with the Bloomberg Municipal Bond Index and Bloomberg Pennsylvania Municipal Bond Index. The chart assumes a hypothetical investment of $10,000 in Class A shares and reflects all operating expenses and assumes the maximum initial sales charge of 4.50%. |
| ■ | The Fund (Class A, excluding sales charges) outperformed both the Bloomberg Municipal Bond Index and the Bloomberg Pennsylvania Municipal Bond Index for the 12-month period that ended June 30, 2022. |
| ■ | The Fund’s conservative duration positioning and yield-curve positioning contributed strongly to performance as rates increased across the entire yield curve during the period in response to the U.S. Federal Reserve’s (Fed) monetary tightening policy. We were underweight longer-term bonds, which strongly underperformed. We were underweight shorter-term bonds, which outperformed, but our selection was strong. |
| ■ | The Fund’s broad sector allocation and security selection contributed to performance. We were slightly underweight general obligation (GO) bonds, which outperformed the index. We were slightly overweight revenue bonds, which underperformed. However, our strong research-driven security selection process ultimately helped offset this sector’s negative performance. Specifically, we were underweight the transportation sector, which underperformed, and overweight the education sector, which outperformed. |
| ■ | Credit quality was neutral to performance. We were overweight BBB-rated bonds, which outperformed the benchmark index. We were underweight A-rated bonds, which essentially performed in line with the benchmark index, although we had strong security selection within this category. |
| Credit quality as of June 30, 20221 |
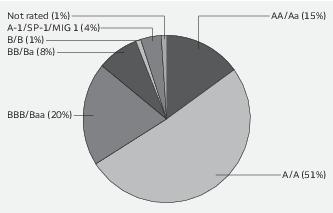
| 1 | The credit quality distribution of portfolio holdings reflected in the chart is based on ratings from Standard & Poor’s, Moody’s Investors Service, and/or Fitch Ratings Ltd. Credit quality ratings apply to the underlying holdings of the Fund and not to the Fund itself. The percentages of the portfolio with the ratings depicted in the chart are calculated based on the market value of fixed income securities held by the Fund. If a security was rated by all three rating agencies, the middle rating was utilized. If rated by two of the three rating agencies, the lower rating was utilized, and if rated by one of the rating agencies, that rating was utilized. Standard & Poor’s rates the creditworthiness of bonds, ranging from AAA (highest) to D (lowest). Ratings from A to CCC may be modified by the addition of a plus (+) or minus (-) sign to show relative standing within the rating categories. Standard & Poor’s rates the creditworthiness of short-term notes from SP-1 (highest) to SP-3 (lowest). Moody’s rates the creditworthiness of bonds, ranging from Aaa (highest) to C (lowest). Ratings Aa to B may be modified by the addition of a number 1 (highest) to 3 (lowest) to show relative standing within the ratings categories. Moody’s rates the creditworthiness of short-term U.S. tax-exempt municipal securities from MIG 1/VMIG 1 (highest) to SG (lowest). Fitch rates the creditworthiness of bonds, ranging from AAA (highest) to D (lowest). Credit quality distribution is subject to change and may have changed since the date specified. |
| Effective maturity distribution as of June 30, 20221 |
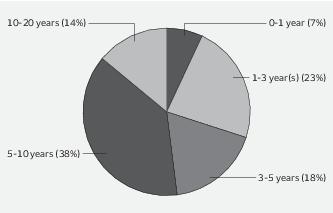
| 1 | Figures represent the percentage of the Fund's long-term investments. These amounts are subject to change and may have changed since the date specified. |
| Beginning account value 1-1-2022 | Ending account value 6-30-2022 | Expenses paid during the period1 | Annualized net expense ratio | |
| Class A | ||||
| Actual | $1,000.00 | $ 912.44 | $3.51 | 0.74% |
| Hypothetical (5% return before expenses) | $1,000.00 | $1,021.12 | $3.71 | 0.74% |
| Class C | ||||
| Actual | $1,000.00 | $ 908.66 | $7.05 | 1.49% |
| Hypothetical (5% return before expenses) | $1,000.00 | $1,017.41 | $7.45 | 1.49% |
| Institutional Class | ||||
| Actual | $1,000.00 | $ 913.56 | $2.32 | 0.49% |
| Hypothetical (5% return before expenses) | $1,000.00 | $1,022.36 | $2.46 | 0.49% |
| Interest rate | Maturity date | Principal | Value | ||
| Municipal obligations: 98.82% | |||||
| Guam: 0.94% | |||||
| Airport revenue: 0.54% | |||||
| Guam Port Authority AMT Series B | 5.00% | 7-1-2032 | $ 550,000 | $ 587,798 | |
| Tax revenue: 0.40% | |||||
| Guam Government Business Privilege Tax Revenue Refunding Bonds Series F | 4.00 | 1-1-2042 | 500,000 | 441,147 | |
| 1,028,945 | |||||
| Illinois: 0.28% | |||||
| Miscellaneous revenue: 0.28% | |||||
| Chicago IL Special Assessment Improvement Bonds Refunding Series 2022 | 2.27 | 12-1-2024 | 315,000 | 301,938 | |
| New Jersey: 0.30% | |||||
| Tax revenue: 0.30% | |||||
| New Jersey COVID-19 Emergency Series A | 5.00 | 6-1-2027 | 300,000 | 330,770 | |
| Pennsylvania: 97.30% | |||||
| Airport revenue: 3.43% | |||||
| Allegheny County PA Airport Authority Pittsburgh International Airport Series A | 5.00 | 1-1-2051 | 1,500,000 | 1,561,366 | |
| Philadelphia PA Airport Refunding Bond AMT Series A | 5.00 | 6-15-2030 | 1,500,000 | 1,562,312 | |
| Philadelphia PA Airport Revenue Refunding Bonds Series 2015A | 5.00 | 6-15-2026 | 580,000 | 612,887 | |
| 3,736,565 | |||||
| Education revenue: 22.87% | |||||
| Allegheny County PA Higher Education Building Authority Duquesne University Series A | 4.00 | 3-1-2040 | 1,500,000 | 1,444,836 | |
| Allegheny County PA Higher Education Robert Morris University | 5.00 | 10-15-2037 | 750,000 | 753,864 | |
| Chester County PA IDA Avon Grove Charter School Project Refunding Bond Series A | 5.00 | 12-15-2047 | 1,160,000 | 1,165,528 | |
| Chester County PA IDA Collegium Charter School Project Refunding Bond Series A | 5.00 | 10-15-2022 | 375,000 | 376,497 | |
| Chester County PA IDA Collegium Charter School Project Series A | 5.13 | 10-15-2037 | 1,000,000 | 1,013,229 | |
| Chester County PA IDA Renaissance Academy Charter School Project | 3.75 | 10-1-2024 | 375,000 | 379,306 | |
| Cumberland County PA Municipal Authority Revenue Bonds Series 2016 | 5.00 | 5-1-2032 | 940,000 | 1,013,716 | |
| Delaware County PA Neumann University Bond | 5.00 | 10-1-2039 | 250,000 | 252,700 | |
| Huntingdon County PA AICUP Financing Program | 5.00 | 10-1-2051 | 2,000,000 | 2,031,397 | |
| Latrobe PA IDA Seton Hall University | 4.00 | 3-1-2051 | 800,000 | 638,904 | |
| Lehigh County PA General Purpose Authority Charter School Revenue Bonds Series 2022 | 4.00 | 6-1-2032 | 675,000 | 661,713 | |
| Lehigh County PA IDA Seven Generations Charter School | 4.00 | 5-1-2051 | 750,000 | 572,273 | |
| Montgomery County PA Higher Education & Health Authority Arcadia University Refunding Bond | 5.00 | 4-1-2030 | 1,500,000 | 1,551,702 | |
| Montgomery County PA IDA Germantown Academy Project | 4.00 | 10-1-2041 | 450,000 | 407,441 | |
| Montgomery County PA IDA Germantown Academy Project | 4.00 | 10-1-2046 | 225,000 | 196,579 |
| Interest rate | Maturity date | Principal | Value | ||
| Education revenue (continued) | |||||
| Montgomery County PA IDA Germantown Academy Project | 4.00% | 10-1-2051 | $ 825,000 | $ 703,753 | |
| Northeastern Pennsylvania Hospital & Education Authority Refunding Bond Wilkes University Project Series B | 5.25 | 3-1-2037 | 1,000,000 | 1,033,571 | |
| Pennsylvania Higher Educational University Pennsylvania Ursinus College Project Series A | 5.00 | 11-1-2026 | 500,000 | 526,036 | |
| Pennsylvania Higher Educational University Pennsylvania Ursinus College Project Series A | 5.00 | 11-1-2027 | 300,000 | 317,118 | |
| Pennsylvania State University Refunding Bond Series B | 5.00 | 9-1-2034 | 2,175,000 | 2,355,948 | |
| Philadelphia PA IDA 1st Philadelphia Preparatory Charter School Project Series A | 7.00 | 6-15-2033 | 1,000,000 | 1,064,047 | |
| Philadelphia PA IDA Charter School Philadelphia Performing Arts 144A | 5.00 | 6-15-2029 | 220,000 | 224,067 | |
| Philadelphia PA IDA Charter School Philadelphia Performing Arts 144A | 5.00 | 6-15-2030 | 145,000 | 146,929 | |
| Philadelphia PA IDA Independence Charter School Project | 5.00 | 6-15-2039 | 250,000 | 250,486 | |
| Philadelphia PA IDA La Salle University | 5.00 | 5-1-2036 | 1,355,000 | 1,297,492 | |
| Philadelphia PA IDA Tacony Academy Charter School Project | 6.88 | 6-15-2033 | 1,000,000 | 1,031,908 | |
| Philadelphia PA IDA Temple University 1st Series 2016 | 5.00 | 4-1-2029 | 1,000,000 | 1,060,684 | |
| Philadelphia PA IDA West Philadelphia Achievement Charter Elementary School Project | 7.50 | 5-1-2031 | 1,285,000 | 1,287,112 | |
| South Central Pennsylvania General Authority AICUP Financing Program York College | 4.00 | 5-1-2032 | 330,000 | 327,587 | |
| South Central Pennsylvania General Authority AICUP Financing Program York College | 4.00 | 5-1-2033 | 315,000 | 311,018 | |
| South Central Pennsylvania General Authority AICUP Financing Program York College | 4.00 | 5-1-2034 | 550,000 | 540,677 | |
| 24,938,118 | |||||
| GO revenue: 19.44% | |||||
| Blue Mountain PA School District Series B (AGM Insured) | 4.00 | 8-1-2035 | 250,000 | 257,973 | |
| Blue Mountain PA School District Series B (AGM Insured) | 4.00 | 8-1-2036 | 350,000 | 357,780 | |
| Blue Mountain PA School District Series B (AGM Insured) | 4.00 | 8-1-2037 | 350,000 | 354,349 | |
| Blue Mountain PA School District Series B (AGM Insured) | 4.00 | 8-1-2038 | 250,000 | 253,153 | |
| Central Dauphin PA School District | 5.00 | 2-1-2037 | 2,075,000 | 2,222,019 | |
| Coatesville PA Area School District CAB Series C (BAM Insured) ¤ | 0.00 | 10-1-2033 | 1,000,000 | 613,068 | |
| Erie PA City School District Limited Tax Series A (AGM Insured) | 5.00 | 4-1-2034 | 515,000 | 569,785 | |
| North Allegheny PA School District | 5.00 | 5-1-2030 | 100,000 | 115,107 | |
| North Eastern Pennsylvania School District | 5.00 | 5-1-2031 | 290,000 | 332,389 | |
| Oil City PA Series A (AGM Insured) | 4.00 | 12-1-2039 | 315,000 | 318,982 | |
| Oil City PA Series A (AGM Insured) | 4.00 | 12-1-2040 | 250,000 | 253,124 | |
| Oil City PA Series A (AGM Insured) | 4.00 | 12-1-2041 | 250,000 | 252,320 | |
| Oil City PA Series A (AGM Insured) | 4.00 | 12-1-2042 | 200,000 | 201,694 | |
| Parkland PA School District Series A | 4.00 | 2-1-2029 | 300,000 | 323,654 | |
| Parkland PA School District Series B | 4.00 | 2-1-2036 | 650,000 | 659,870 | |
| Penn-Delco School District | 4.00 | 6-1-2045 | 1,000,000 | 1,001,402 | |
| Pequea Valley School District | 4.00 | 5-15-2049 | 750,000 | 736,335 | |
| Philadelphia PA Refunding Bond Series A | 5.25 | 7-15-2033 | 1,500,000 | 1,577,213 | |
| Philadelphia PA School District Refunding Bond Series A (AGM / FGIC Insured) | 5.00 | 6-1-2024 | 1,325,000 | 1,395,847 | |
| Philadelphia PA School District Series B | 5.00 | 9-1-2043 | 1,235,000 | 1,300,917 | |
| Philadelphia PA Series A | 5.00 | 8-1-2036 | 1,250,000 | 1,342,058 | |
| Pittsburgh PA (BAM Insured) | 5.00 | 9-1-2030 | 500,000 | 531,513 | |
| Pittsburgh PA Moon Area School District Series A | 5.00 | 11-15-2029 | 1,445,000 | 1,536,698 |
| Interest rate | Maturity date | Principal | Value | ||
| GO revenue (continued) | |||||
| Reading PA School District Series A (AGM Insured) | 5.00% | 2-1-2033 | $1,500,000 | $ 1,592,330 | |
| West Mifflin PA Area School District (AGM Insured) | 5.00 | 4-1-2028 | 1,000,000 | 1,099,587 | |
| West Shore PA School District | 5.00 | 11-15-2048 | 1,500,000 | 1,622,656 | |
| Wilkes-Barre School District Luzerne County PA Series 2019 (BAM Insured) | 5.00 | 4-15-2027 | 100,000 | 110,381 | |
| Wilkes-Barre School District Luzerne County PA Series 2019 (BAM Insured) | 5.00 | 4-15-2028 | 120,000 | 134,192 | |
| Wilkes-Barre School District Luzerne County PA Series 2019 (BAM Insured) | 5.00 | 4-15-2029 | 50,000 | 56,650 | |
| Wilkes-Barre School District Luzerne County PA Series 2019 (BAM Insured) | 5.00 | 4-15-2030 | 70,000 | 79,364 | |
| 21,202,410 | |||||
| Health revenue: 22.17% | |||||
| Allegheny County PA Hospital Development Authority Allegheny Health Network | 4.00 | 4-1-2044 | 1,810,000 | 1,711,996 | |
| Allegheny County PA Hospital Development Authority Health Center Series B (NPFGC Insured) | 6.00 | 7-1-2027 | 1,800,000 | 2,046,979 | |
| Allegheny County PA Hospital Development Authority Series 2017D-2 (SIFMA Municipal Swap +0.70%) ± | 1.68 | 11-15-2047 | 1,000,000 | 996,891 | |
| Berks County PA IDA Tower Health Project | 5.00 | 11-1-2037 | 930,000 | 879,436 | |
| Bucks County PA IDA St. Lukes University Health Network | 4.00 | 8-15-2050 | 400,000 | 364,137 | |
| Cumberland County PA Municipal Authority | 5.00 | 1-1-2028 | 265,000 | 283,262 | |
| Cumberland County PA Municipal Authority Revenue Bonds Lutheran Social Ministeries 2015 | 5.00 | 1-1-2028 | 640,000 | 684,104 | |
| Cumberland County PA Municipal Authority Revenue Bonds Lutheran Social Ministeries 2015 | 5.00 | 1-1-2028 | 1,185,000 | 1,223,012 | |
| Dauphin County PA General Authority Pinnacle Health System Project Series A | 5.00 | 6-1-2035 | 1,000,000 | 1,035,936 | |
| Doylestown PA Hospital Authority Doylestown Hospital Series A | 5.00 | 7-1-2049 | 250,000 | 231,241 | |
| East Hempfield Township PA IDA Willow Valley Communities Project Refunding Bond | 5.00 | 12-1-2028 | 450,000 | 475,537 | |
| East Hempfield Township PA IDA Willow Valley Communities Project Refunding Bond | 5.00 | 12-1-2029 | 375,000 | 394,943 | |
| Geisinger PA Health System Series A-1 | 4.00 | 4-1-2050 | 1,000,000 | 906,695 | |
| Lancaster County PA Hospital Authority St. Annes Retirement Community Incorporated | 5.00 | 3-1-2045 | 500,000 | 462,929 | |
| Montgomery County PA Higher Education and Health Authority Thomas Jefferson University Revenue Bonds Series 2022B | 5.00 | 5-1-2052 | 1,000,000 | 1,050,688 | |
| Montgomery County PA IDA ACTS Retirement Life Communities | 5.00 | 11-15-2045 | 1,000,000 | 1,042,253 | |
| Montgomery County PA IDA Waverly Heights Limited Project | 5.00 | 12-1-2044 | 1,000,000 | 1,056,059 | |
| Northampton County PA St. Luke's Hospital of Bethlehem Series A | 5.00 | 8-15-2033 | 1,435,000 | 1,483,859 | |
| Pennsylvania EDFA Series A | 5.00 | 10-15-2035 | 645,000 | 713,737 | |
| Pennsylvania EDFA Series A | 5.00 | 10-15-2036 | 800,000 | 883,446 | |
| Pennsylvania EDFA Series A-1 | 4.00 | 4-15-2037 | 700,000 | 684,933 | |
| Pennsylvania Higher Educational University of Pennsylvania Health System Series A | 5.00 | 8-15-2040 | 1,500,000 | 1,558,585 | |
| Pennsylvania Higher Educational University of Pennsylvania Health System Series A | 5.00 | 8-15-2047 | 1,500,000 | 1,572,289 | |
| The Hospitals and Higher Education Facilities Authority of Philadelphia Revenue Bonds Series 2022 (AGM Insured) | 5.00 | 7-1-2037 | 1,000,000 | 1,081,981 |
| Interest rate | Maturity date | Principal | Value | ||
| Health revenue (continued) | |||||
| West Cornwall Township PA Municipal Authority Healthcare Facilities Lebanon Valley Brethren Home Project | 4.00% | 11-15-2022 | $ 70,000 | $ 70,206 | |
| West Cornwall Township PA Municipal Authority Healthcare Facilities Lebanon Valley Brethren Home Project | 4.00 | 11-15-2023 | 75,000 | 75,781 | |
| West Cornwall Township PA Municipal Authority Healthcare Facilities Lebanon Valley Brethren Home Project | 4.00 | 11-15-2041 | 370,000 | 347,610 | |
| West Cornwall Township PA Municipal Authority Healthcare Facilities Lebanon Valley Brethren Home Project | 4.00 | 11-15-2046 | 525,000 | 479,112 | |
| Westmoreland County PA IDA Excela Health Project Series A | 4.00 | 7-1-2037 | 400,000 | 374,393 | |
| 24,172,030 | |||||
| Housing revenue: 1.41% | |||||
| Chester County PA IDA University Student Housing LLC Project Series A | 5.00 | 8-1-2030 | 555,000 | 557,047 | |
| Pennsylvania Housing Finance Agency MFHR Sherman Hills Series 2022 (Department of Housing and Urban Development Insured) | 1.25 | 2-1-2025 | 1,000,000 | 978,361 | |
| 1,535,408 | |||||
| Miscellaneous revenue: 16.32% | |||||
| Delaware County PA Neumann University Refunding Bond | 5.00 | 10-1-2031 | 1,500,000 | 1,523,673 | |
| Delaware County PA Vocational & Technical School Authority (BAM Insured) | 5.25 | 11-1-2033 | 1,000,000 | 1,044,642 | |
| Delaware Valley Regional Finance Authority Local Government Series A (Ambac Insured) | 5.50 | 8-1-2028 | 2,000,000 | 2,273,627 | |
| Delaware Valley Regional Finance Authority Local Government Series D (TD Bank NA LOC) ø | 0.90 | 11-1-2055 | 3,000,000 | 3,000,000 | |
| Pennsylvania Certificate of Participation Series A | 5.00 | 7-1-2038 | 1,000,000 | 1,090,041 | |
| Pennsylvania Commonwealth Financing Authority Refunding Bond Series B | 5.00 | 6-1-2031 | 250,000 | 285,466 | |
| Pennsylvania EDFA Sewage Sludge Disposal Refunding Bond Philadelphia Bioslides Facility | 4.00 | 1-1-2030 | 1,000,000 | 1,012,827 | |
| Pennsylvania Financing Authority Pennsylvania Hills Project CAB Series B (NPFGC Insured) ¤ | 0.00 | 12-1-2022 | 1,200,000 | 1,189,986 | |
| Pennsylvania Financing Authority Pennsylvania Hills Project CAB Series B (NPFGC Insured) ¤ | 0.00 | 12-1-2023 | 3,790,000 | 3,656,795 | |
| Pennsylvania Public School Building Authority Chester Upland School District Project Series B | 5.25 | 9-15-2030 | 540,000 | 602,409 | |
| Pennsylvania Public School Building Authority Chester Upland School District Project Series C (AGM Insured) | 5.00 | 9-15-2026 | 875,000 | 877,183 | |
| Pennsylvania Public School Building Authority Harrisburg School District Project Series B-2 (BAM Insured) | 5.00 | 12-1-2027 | 360,000 | 381,999 | |
| Philadelphia PA Industrial Philadelphia Museum of Art Energy Saving Program Series A | 5.00 | 2-15-2038 | 785,000 | 854,475 | |
| 17,793,123 | |||||
| Tax revenue: 0.48% | |||||
| Allentown PA Neighborhood Improvement Zone Development Authority Refunding Bond | 5.00 | 5-1-2042 | 500,000 | 522,951 | |
| Transportation revenue: 5.44% | |||||
| Delaware River PA Joint Toll Bridge Commission | 5.00 | 7-1-2042 | 580,000 | 624,510 |
| Interest rate | Maturity date | Principal | Value | ||
| Transportation revenue (continued) | |||||
| Pennsylvania Turnpike Commission Series A-2 | 5.00% | 12-1-2048 | $2,000,000 | $ 2,119,991 | |
| Pennsylvania Turnpike Commission Subordinate Bond Series A | 5.50 | 12-1-2042 | 3,000,000 | 3,188,950 | |
| 5,933,451 | |||||
| Utilities revenue: 0.95% | |||||
| Philadelphia PA Gas Works Revenue Fifteenth Series | 5.00 | 8-1-2047 | 1,000,000 | 1,039,018 | |
| Water & sewer revenue: 4.79% | |||||
| Capital Region Pennsylvania Water & Sewer System Refunding Bond | 5.00 | 7-15-2037 | 1,000,000 | 1,097,756 | |
| Lehigh County PA General Purpose Authority CAB Allentown Project ¤ | 0.00 | 12-1-2030 | 2,000,000 | 1,454,541 | |
| Luzerne County PA IDA Refunding Bonds AMT Pennsylvania American Water Company Project | 2.45 | 12-1-2039 | 500,000 | 473,204 | |
| Philadelphia PA Water & Wastewater Refunding Bond Series A | 5.00 | 10-1-2038 | 2,000,000 | 2,196,046 | |
| 5,221,547 | |||||
| 106,094,621 | |||||
| Total Municipal obligations (Cost $111,280,882) | 107,756,274 |
| Yield | Shares | ||||
| Short-term investments: 0.34% | |||||
| Investment companies: 0.34% | |||||
| Allspring Municipal Cash Management Money Market Fund Institutional Class ♠∞ | 0.85 | 367,506 | 367,726 | ||
| Total Short-term investments (Cost $367,689) | 367,726 | ||||
| Total investments in securities (Cost $111,648,571) | 99.16% | 108,124,000 | |||
| Other assets and liabilities, net | 0.84 | 920,517 | |||
| Total net assets | 100.00% | $109,044,517 |
| 144A | The security may be resold in transactions exempt from registration, normally to qualified institutional buyers, pursuant to Rule 144A under the Securities Act of 1933. |
| ¤ | The security is issued in zero coupon form with no periodic interest payments. |
| ± | Variable rate investment. The rate shown is the rate in effect at period end. |
| ø | Variable rate demand notes are subject to a demand feature which reduces the effective maturity. The maturity date shown represents the final maturity date of the security. The interest rate is determined and reset by the issuer daily, weekly, or monthly depending upon the terms of the security. The rate shown is the rate in effect at period end. |
| ♠ | The issuer of the security is an affiliated person of the Fund as defined in the Investment Company Act of 1940. |
| ∞ | The rate represents the 7-day annualized yield at period end. |
| Abbreviations: | |
| AGM | Assured Guaranty Municipal |
| Ambac | Ambac Financial Group Incorporated |
| AMT | Alternative minimum tax |
| BAM | Build America Mutual Assurance Company |
| CAB | Capital appreciation bond |
| EDFA | Economic Development Finance Authority |
| FGIC | Financial Guaranty Insurance Corporation |
| GO | General obligation |
| IDA | Industrial Development Authority |
| LOC | Letter of credit |
| MFHR | Multifamily housing revenue |
| NPFGC | National Public Finance Guarantee Corporation |
| SIFMA | Securities Industry and Financial Markets Association |
| Value, beginning of period | Purchases | Sales proceeds | Net realized gains (losses) | Net change in unrealized gains (losses) | Value, end of period | Shares, end of period | Income from affiliated securities | |
| Short-term investments | ||||||||
| Allspring Municipal Cash Management Money Market Fund Institutional Class | $787,071 | $43,485,422 | $(43,905,624) | $820 | $37 | $367,726 | 367,506 | $2,879 |
| Assets | |
Investments in unaffiliated securities, at value (cost $111,280,882) | $ 107,756,274 |
Investments in affiliated securities, at value (cost $367,689) | 367,726 |
Receivable for interest | 1,210,046 |
Receivable for Fund shares sold | 3,642 |
Prepaid expenses and other assets | 17,131 |
Total assets | 109,354,819 |
| Liabilities | |
Payable for Fund shares redeemed | 158,542 |
Dividends payable | 98,520 |
Management fee payable | 22,171 |
Administration fees payable | 9,784 |
Distribution fee payable | 2,297 |
Trustees’ fees and expenses payable | 1,561 |
Accrued expenses and other liabilities | 17,427 |
Total liabilities | 310,302 |
Total net assets | $109,044,517 |
| Net assets consist of | |
Paid-in capital | $ 113,166,624 |
Total distributable loss | (4,122,107) |
Total net assets | $109,044,517 |
| Computation of net asset value and offering price per share | |
Net assets – Class A | $ 34,755,231 |
Shares outstanding – Class A1 | 3,245,340 |
Net asset value per share – Class A | $10.71 |
Maximum offering price per share – Class A2 | $11.21 |
Net assets – Class C | $ 3,679,081 |
Shares outstanding – Class C1 | 344,154 |
Net asset value per share – Class C | $10.69 |
Net assets – Institutional Class | $ 70,610,205 |
Shares outstanding – Institutional Class1 | 6,593,173 |
Net asset value per share – Institutional Class | $10.71 |
| 1 | The Fund has an unlimited number of authorized shares. |
| 2 | Maximum offering price is computed as 100/95.50 of net asset value. On investments of $50,000 or more, the offering price is reduced. |
| Investment income | |
Interest | $ 3,975,851 |
Income from affiliated securities | 2,879 |
Total investment income | 3,978,730 |
| Expenses | |
Management fee | 505,130 |
| Administration fees | |
Class A | 65,602 |
Class C | 8,142 |
Institutional Class | 64,154 |
| Shareholder servicing fees | |
Class A | 102,489 |
Class C | 12,656 |
| Distribution fee | |
Class C | 37,934 |
Custody and accounting fees | 9,072 |
Professional fees | 54,809 |
Registration fees | 44,831 |
Shareholder report expenses | 23,824 |
Trustees’ fees and expenses | 20,033 |
Other fees and expenses | 9,260 |
Total expenses | 957,936 |
| Less: Fee waivers and/or expense reimbursements | |
Fund-level | (139,810) |
Class A | (42,012) |
Class C | (4,880) |
Net expenses | 771,234 |
Net investment income | 3,207,496 |
| Realized and unrealized gains (losses) on investments | |
| Net realized gains (losses) on | |
Unaffiliated securities | (545,701) |
Affiliated securities | 820 |
Futures contracts | 5,764 |
Net realized losses on investments | (539,117) |
| Net change in unrealized gains (losses) on | |
Unaffiliated securities | (13,227,613) |
Affiliated securities | 37 |
Net change in unrealized gains (losses) on investments | (13,227,576) |
Net realized and unrealized gains (losses) on investments | (13,766,693) |
Net decrease in net assets resulting from operations | $(10,559,197) |
| Year ended June 30, 2022 | Year ended June 30, 2021 | |||
| Operations | ||||
Net investment income | $ 3,207,496 | $ 3,565,698 | ||
Net realized gains (losses) on investments | (539,117) | 671,328 | ||
Net change in unrealized gains (losses) on investments | (13,227,576) | 1,724,132 | ||
Net increase (decrease) in net assets resulting from operations | (10,559,197) | 5,961,158 | ||
| Distributions to shareholders from | ||||
| Net investment income and net realized gains | ||||
Class A | (988,899) | (1,075,690) | ||
Class C | (83,574) | (132,697) | ||
Institutional Class | (2,135,212) | (2,271,663) | ||
Total distributions to shareholders | (3,207,685) | (3,480,050) | ||
| Capital share transactions | Shares | Shares | ||
| Proceeds from shares sold | ||||
Class A | 521,913 | 6,192,904 | 320,556 | 3,801,618 |
Class C | 7,149 | 81,001 | 28,621 | 340,569 |
Institutional Class | 1,209,101 | 13,809,591 | 766,728 | 9,122,470 |
| 20,083,496 | 13,264,657 | |||
| Reinvestment of distributions | ||||
Class A | 80,133 | 921,865 | 84,782 | 1,006,838 |
Class C | 7,039 | 81,111 | 10,615 | 125,775 |
Institutional Class | 83,220 | 955,668 | 84,467 | 1,003,170 |
| 1,958,644 | 2,135,783 | |||
| Payment for shares redeemed | ||||
Class A | (859,724) | (9,851,073) | (439,252) | (5,205,358) |
Class C | (212,560) | (2,462,760) | (212,548) | (2,515,177) |
Institutional Class | (1,544,113) | (17,311,128) | (866,403) | (10,302,242) |
| (29,624,961) | (18,022,777) | |||
Net decrease in net assets resulting from capital share transactions | (7,582,821) | (2,622,337) | ||
Total decrease in net assets | (21,349,703) | (141,229) | ||
| Net assets | ||||
Beginning of period | 130,394,220 | 130,535,449 | ||
End of period | $109,044,517 | $130,394,220 | ||
| Year ended June 30 | |||||
| Class A | 2022 | 2021 | 2020 | 2019 | 2018 |
Net asset value, beginning of period | $11.97 | $11.75 | $11.78 | $11.48 | $11.67 |
Net investment income | 0.28 | 0.31 | 0.35 | 0.35 | 0.38 |
Net realized and unrealized gains (losses) on investments | (1.26) | 0.22 | (0.04) | 0.32 | (0.19) |
Total from investment operations | (0.98) | 0.53 | 0.31 | 0.67 | 0.19 |
| Distributions to shareholders from | |||||
Net investment income | (0.28) | (0.31) | (0.34) | (0.34) | (0.38) |
Tax basis return of capital | 0.00 | 0.00 | 0.00 | (0.03) | 0.00 |
Total distributions to shareholders | (0.28) | (0.31) | (0.34) | (0.37) | (0.38) |
Net asset value, end of period | $10.71 | $11.97 | $11.75 | $11.78 | $11.48 |
Total return1 | (8.32)% | 4.52% | 2.65% | 6.00% | 1.62% |
| Ratios to average net assets (annualized) | |||||
Gross expenses | 0.94% | 0.94% | 0.97% | 0.96% | 0.91% |
Net expenses | 0.74% | 0.74% | 0.74% | 0.74% | 0.74% |
Net investment income | 2.41% | 2.64% | 2.92% | 3.07% | 3.25% |
| Supplemental data | |||||
Portfolio turnover rate | 20% | 21% | 14% | 9% | 10% |
Net assets, end of period (000s omitted) | $34,755 | $41,945 | $41,550 | $41,255 | $40,664 |
| 1 | Total return calculations do not include any sales charges. |
| Year ended June 30 | |||||
| Class C | 2022 | 2021 | 2020 | 2019 | 2018 |
Net asset value, beginning of period | $11.95 | $11.73 | $11.76 | $11.45 | $11.65 |
Net investment income | 0.19 1 | 0.22 | 0.27 | 0.26 1 | 0.29 1 |
Net realized and unrealized gains (losses) on investments | (1.26) | 0.22 | (0.05) | 0.34 | (0.20) |
Total from investment operations | (1.07) | 0.44 | 0.22 | 0.60 | 0.09 |
| Distributions to shareholders from | |||||
Net investment income | (0.19) | (0.22) | (0.25) | (0.26) | (0.29) |
Tax basis return of capital | 0.00 | 0.00 | 0.00 | (0.03) | 0.00 |
Total distributions to shareholders | (0.19) | (0.22) | (0.25) | (0.29) | (0.29) |
Net asset value, end of period | $10.69 | $11.95 | $11.73 | $11.76 | $11.45 |
Total return2 | (9.03)% | 3.74% | 1.89% | 5.31% | 0.77% |
| Ratios to average net assets (annualized) | |||||
Gross expenses | 1.68% | 1.68% | 1.72% | 1.70% | 1.66% |
Net expenses | 1.49% | 1.49% | 1.49% | 1.49% | 1.49% |
Net investment income | 1.64% | 1.89% | 2.23% | 2.32% | 2.50% |
| Supplemental data | |||||
Portfolio turnover rate | 20% | 21% | 14% | 9% | 10% |
Net assets, end of period (000s omitted) | $3,679 | $6,485 | $8,394 | $8,768 | $13,440 |
| 1 | Calculated based upon average shares outstanding |
| 2 | Total return calculations do not include any sales charges. |
| Year ended June 30 | |||||
| Institutional Class | 2022 | 2021 | 2020 | 2019 | 2018 |
Net asset value, beginning of period | $11.97 | $11.75 | $11.78 | $11.48 | $11.67 |
Net investment income | 0.31 | 0.34 | 0.38 | 0.38 | 0.40 |
Net realized and unrealized gains (losses) on investments | (1.26) | 0.21 | (0.04) | 0.32 | (0.18) |
Total from investment operations | (0.95) | 0.55 | 0.34 | 0.70 | 0.22 |
| Distributions to shareholders from | |||||
Net investment income | (0.31) | (0.33) | (0.37) | (0.37) | (0.41) |
Tax basis return of capital | 0.00 | 0.00 | 0.00 | (0.03) | 0.00 |
Total distributions to shareholders | (0.31) | (0.33) | (0.37) | (0.40) | (0.41) |
Net asset value, end of period | $10.71 | $11.97 | $11.75 | $11.78 | $11.48 |
Total return | (8.10)% | 4.78% | 2.91% | 6.27% | 1.88% |
| Ratios to average net assets (annualized) | |||||
Gross expenses | 0.61% | 0.61% | 0.64% | 0.62% | 0.58% |
Net expenses | 0.49% | 0.49% | 0.49% | 0.49% | 0.49% |
Net investment income | 2.66% | 2.88% | 3.18% | 3.31% | 3.50% |
| Supplemental data | |||||
Portfolio turnover rate | 20% | 21% | 14% | 9% | 10% |
Net assets, end of period (000s omitted) | $70,610 | $81,964 | $80,592 | $79,128 | $88,663 |
| Gross unrealized gains | $ 1,399,066 |
| Gross unrealized losses | (4,923,637) |
| Net unrealized losses | $(3,524,571) |
| ■ | Level 1 – quoted prices in active markets for identical securities |
| ■ | Level 2 – other significant observable inputs (including quoted prices for similar securities, interest rates, prepayment speeds, credit risk, etc.) |
| ■ | Level 3 – significant unobservable inputs (including the Fund’s own assumptions in determining the fair value of investments) |
| Quoted prices (Level 1) | Other significant observable inputs (Level 2) | Significant unobservable inputs (Level 3) | Total | |
| Assets | ||||
| Investments in: | ||||
| Municipal obligations | $ 0 | $ 107,756,274 | $0 | $ 107,756,274 |
| Short-term investments | ||||
| Investment companies | 367,726 | 0 | 0 | 367,726 |
| Total assets | $367,726 | $107,756,274 | $0 | $108,124,000 |
| Average daily net assets | Management fee |
| First $500 million | 0.400% |
| Next $500 million | 0.375 |
| Next $2 billion | 0.350 |
| Next $2 billion | 0.325 |
| Next $5 billion | 0.290 |
| Over $10 billion | 0.280 |
| Class-level administration fee | |
| Class A | 0.16% |
| Class C | 0.16 |
| Institutional Class | 0.08 |
| Expense ratio caps | |
| Class A | 0.74% |
| Class C | 1.49 |
| Institutional Class | 0.49 |
| Undistributed tax-exempt income | Unrealized losses | Capital loss carryforward |
| $111,940 | $(3,524,571) | $(599,906) |
Allspring Funds Trust:

| Name and year of birth | Position held and length of service* | Principal occupations during past five years or longer | Current other public company or investment company directorships |
| William R. Ebsworth (Born 1957) | Trustee, since 2015 | Retired. From 1984 to 2013, equities analyst, portfolio manager, research director and chief investment officer at Fidelity Management and Research Company in Boston, Tokyo, and Hong Kong, and retired in 2013 as Chief Investment Officer of Fidelity Strategic Advisers, Inc. where he led a team of investment professionals managing client assets. Prior thereto, Board member of Hong Kong Securities Clearing Co., Hong Kong Options Clearing Corp., the Thailand International Fund, Ltd., Fidelity Investments Life Insurance Company, and Empire Fidelity Investments Life Insurance Company. Audit Committee Chair and Investment Committee Chair of the Vincent Memorial Hospital Endowment (non-profit organization). Mr. Ebsworth is a CFA® charterholder. | N/A |
| Jane A. Freeman (Born 1953) | Trustee, since 2015; Chair Liaison, since 2018 | Retired. From 2012 to 2014 and 1999 to 2008, Chief Financial Officer of Scientific Learning Corporation. From 2008 to 2012, Ms. Freeman provided consulting services related to strategic business projects. Prior to 1999, Portfolio Manager at Rockefeller & Co. and Scudder, Stevens & Clark. Board member of the Harding Loevner Funds from 1996 to 2014, serving as both Lead Independent Director and chair of the Audit Committee. Board member of the Russell Exchange Traded Funds Trust from 2011 to 2012 and the chair of the Audit Committee. Ms. Freeman is also an inactive Chartered Financial Analyst. | N/A |
| Isaiah Harris, Jr. (Born 1952) | Trustee, since 2009; Audit Committee Chair, since 2019 | Retired. Chairman of the Board of CIGNA Corporation from 2009 to 2021, and Director from 2005 to 2008. From 2003 to 2011, Director of Deluxe Corporation. Prior thereto, President and CEO of BellSouth Advertising and Publishing Corp. from 2005 to 2007, President and CEO of BellSouth Enterprises from 2004 to 2005 and President of BellSouth Consumer Services from 2000 to 2003. Emeritus member of the Iowa State University Foundation Board of Governors. Emeritus Member of the Advisory Board of Iowa State University School of Business. Advisory Board Member, Palm Harbor Academy (private school). Advisory Board Member, Fellowship of Christian Athletes. Mr. Harris is a certified public accountant (inactive status). | N/A |
| David F. Larcker (Born 1950) | Trustee, since 2009 | James Irvin Miller Professor of Accounting at the Graduate School of Business (Emeritus), Stanford University, Director of the Corporate Governance Research Initiative and Senior Faculty of The Rock Center for Corporate Governance since 2006. From 2005 to 2008, Professor of Accounting at the Graduate School of Business, Stanford University. Prior thereto, Ernst & Young Professor of Accounting at The Wharton School, University of Pennsylvania from 1985 to 2005. | N/A |
| Name and year of birth | Position held and length of service* | Principal occupations during past five years or longer | Current other public company or investment company directorships |
| Olivia S. Mitchell (Born 1953) | Trustee, since 2006; Nominating and Governance Committee Chair, since 2018 | International Foundation of Employee Benefit Plans Professor since 1993, Wharton School of the University of Pennsylvania. Director of Wharton’s Pension Research Council and Boettner Center on Pensions & Retirement Research, and Research Associate at the National Bureau of Economic Research. Previously taught at Cornell University from 1978 to 1993. | N/A |
| Timothy J. Penny (Born 1951) | Trustee, since 1996; Chair, since 2018 | President and Chief Executive Officer of Southern Minnesota Initiative Foundation, a non-profit organization, since 2007. Member of the Board of Trustees of NorthStar Education Finance, Inc., a non-profit organization, since 2007. | N/A |
| James G. Polisson (Born 1959) | Trustee, since 2018 | Retired. Chief Marketing Officer, Source (ETF) UK Services, Ltd, from 2015 to 2017. From 2012 to 2015, Principal of The Polisson Group, LLC, a management consulting, corporate advisory and principal investing company. Chief Executive Officer and Managing Director at Russell Investments, Global Exchange Traded Funds from 2010 to 2012. Managing Director of Barclays Global Investors from 1998 to 2010 and Global Chief Marketing Officer for iShares and Barclays Global Investors from 2000 to 2010. Trustee of the San Francisco Mechanics’ Institute, a non-profit organization, from 2013 to 2015. Board member of the Russell Exchange Traded Fund Trust from 2011 to 2012. Director of Barclays Global Investors Holdings Deutschland GmbH from 2006 to 2009. Mr. Polisson is an attorney and has a retired status with the Massachusetts and District of Columbia Bar Associations. | N/A |
| Pamela Wheelock (Born 1959) | Trustee, since January 2020; previously Trustee from January 2018 to July 2019 | Board member of the Destination Medical Center Economic Development Agency, Rochester, Minnesota since 2019. Interim President of the McKnight Foundation from January to September 2020. McKnight Foundation Consultant, November 2020 to February 2021. Acting Commissioner, Minnesota Department of Human Services, July 2019 through September 2019. Consultant (part-time), Minnesota Department of Human Services, October 2019 through December 2019. Chief Operating Officer, Twin Cities Habitat for Humanity from 2017 to 2019. Vice President of University Services, University of Minnesota from 2012 to 2016. Prior thereto, on the Board of Directors, Governance Committee and Finance Committee for the Minnesota Philanthropy Partners (Saint Paul Foundation) from 2012 to 2018, Interim Chief Executive Officer of Blue Cross Blue Shield of Minnesota from 2011 to 2012, Chairman of the Board from 2009 to 2012 and Board Director from 2003 to 2015. Vice President, Leadership and Community Engagement, Bush Foundation, Saint Paul, Minnesota (a private foundation) from 2009 to 2011. Executive Vice President and Chief Financial Officer, Minnesota Sports and Entertainment from 2004 to 2009 and Senior Vice President from 2002 to 2004. Executive Vice President of the Minnesota Wild Foundation from 2004 to 2008. Commissioner of Finance, State of Minnesota, from 1999 to 2002. Currently Board Chair of the Minnesota Wild Foundation since 2010. | N/A |
| Name and year of birth | Position held and length of service | Principal occupations during past five years or longer |
| Andrew Owen (Born 1960) | President, since 2017 | President, Chief Executive Officer and Director of Allspring Funds Management, LLC since 2017 and co-president of Galliard Capital Management, LLC, an affiliate of Allspring Funds Management, LLC, since 2019. Prior thereto, Head of Affiliated Managers, Allspring Global Investments, from 2014 to 2019 and Executive Vice President responsible for marketing, investments and product development for Allspring Funds Management, LLC, from 2009 to 2014. In addition, Mr. Owen was an Executive Vice President of Wells Fargo & Company from 2014 to 2021. |
| Jeremy DePalma (Born 1974) | Treasurer, since 2012 (for certain funds in the Fund Complex); since 2021 (for the remaining funds in the Fund Complex) | Senior Vice President of Allspring Funds Management, LLC since 2009. Senior Vice President of Evergreen Investment Management Company, LLC from 2008 to 2010 and head of the Fund Reporting and Control Team within Fund Administration from 2005 to 2010. |
| Kate McKinley (Born 1977) | Chief Legal Officer, since 2021 | Chief Legal Officer of Allspring Global Investments since 2021. Prior thereto, held various roles at State Street Global Advisors beginning in 2010, including serving as Senior Vice President and General Counsel from 2019 to 2021, and Chief Operating Officer of the Institutional Client Group from 2016 - 2019. Prior to working at State Street Global Advisors served as Assistant General Counsel for Bank of America Corporation from 2005 to 2010 and as an Associate at WilmerHale from 2002 to 2005. |
| Christopher Baker (Born 1976) | Chief Compliance Officer, since 2022 | Global Chief Compliance Officer for Allspring Global Investments since 2022. Prior thereto, Chief Compliance Officer for State Street Global Advisors from 2018 to 2021. Senior Compliance Officer for the State Street divisions of Alternative Investment Solutions, Sector Solutions, and Global Marketing from 2015 to 2018. From 2010 to 2015 Vice President, Global Head of Investment and Marketing Compliance for State Street Global Advisors. |
| Matthew Prasse (Born 1983) | Secretary, since 2021 | Senior Counsel of the Allspring Legal Department since 2021. Senior Counsel of the Wells Fargo Legal Department from 2018 to 2021. Previously, Counsel for Barings LLC from 2015 to 2018. Prior to joining Barings, Associate at Morgan, Lewis & Bockius LLP from 2008 to 2015. |
P.O. Box 219967
Kansas City, MO 64121-9967

1-800-222-8222 or visit the Fund's website at allspringglobal.com. Read the prospectus carefully before you invest or send money.
A255/AR255 06-22

Short-Term Municipal Bond Fund
| 3 | |
| 7 | |
| 12 | |
| 13 | |
| Financial statements | |
| 51 | |
| 52 | |
| 53 | |
| 54 | |
| 59 | |
| 64 | |
| 65 |

| 1 | The S&P 500 Index consists of 500 stocks chosen for market size, liquidity, and industry group representation. It is a market-value-weighted index with each stock's weight in the index proportionate to its market value. You cannot invest directly in an index. |
| 2 | The Morgan Stanley Capital International (MSCI) All Country World Index (ACWI) ex USA Index (Net) is a free-float-adjusted market-capitalization-weighted index that is designed to measure the equity market performance of developed and emerging markets, excluding the U.S. Source: MSCI. MSCI makes no express or implied warranties or representations and shall have no liability whatsoever with respect to any MSCI data contained herein. The MSCI data may not be further redistributed or used as a basis for other indexes or any securities or financial products. This report is not approved, reviewed, or produced by MSCI. You cannot invest directly in an index. |
| 3 | The MSCI Emerging Markets (EM) Index (Net) (USD) is a free-float-adjusted market-capitalization-weighted index that is designed to measure equity market performance of emerging markets. You cannot invest directly in an index. |
| 4 | The Bloomberg U.S. Aggregate Bond Index is a broad-based benchmark that measures the investment-grade, U.S.-dollar-denominated, fixed-rate taxable bond market, including Treasuries, government-related and corporate securities, mortgage-backed securities (agency fixed-rate and hybrid adjustable-rate mortgage pass-throughs), asset-backed securities, and commercial mortgage-backed securities. You cannot invest directly in an index. |
| 5 | The Bloomberg Global Aggregate ex-USD Index (unhedged) is an unmanaged index that provides a broad-based measure of the global investment-grade fixed-income markets excluding the U.S.-dollar-denominated debt market. You cannot invest directly in an index. |
| 6 | The Bloomberg Municipal Bond Index is an unmanaged index composed of long-term tax-exempt bonds with a minimum credit rating of Baa. You cannot invest directly in an index. |
| 7 | The ICE BofA U.S. High Yield Index is a market-capitalization-weighted index of domestic and Yankee high-yield bonds. The index tracks the performance of high-yield securities traded in the U.S. bond market. You cannot invest directly in an index. Copyright 2022. ICE Data Indices, LLC. All rights reserved. |
| 1 | The Consumer Price Index (CPI) is a measure of the average change over time in the prices paid by urban consumers for a market basket of consumer goods and services. You cannot invest directly in an index. |
| 2 | The MSCI ACWI (Net) is a free-float-adjusted market-capitalization-weighted index that is designed to measure the equity market performance of developed and emerging markets. You cannot invest directly in an index. |

President
Allspring Funds
| Investment objective | The Fund seeks current income exempt from federal income tax consistent with capital preservation. |
| Manager | Allspring Funds Management, LLC |
| Subadviser | Allspring Global Investments, LLC |
| Portfolio managers | Bruce Johns, Nicholos Venditti |
| Average annual total returns (%) as of June 30, 2022 | |||||||||||
| Including sales charge | Excluding sales charge | Expense ratios1 (%) | |||||||||
| Inception date | 1 year | 5 year | 10 year | 1 year | 5 year | 10 year | Gross | Net 2 | |||
| Class A (WSMAX) | 7-18-2008 | -5.03 | 0.30 | 0.60 | -3.09 | 0.71 | 0.80 | 0.77 | 0.63 | ||
| Class C (WSSCX) | 1-31-2003 | -4.82 | -0.05 | 0.20 | -3.82 | -0.05 | 0.20 | 1.52 | 1.38 | ||
| Class R6 (WSSRX)3 | 7-31-2018 | – | – | – | -2.82 | 0.98 | 1.06 | 0.39 | 0.35 | ||
| Administrator Class (WSTMX) | 7-30-2010 | – | – | – | -3.08 | 0.73 | 0.81 | 0.71 | 0.60 | ||
| Institutional Class (WSBIX) | 3-31-2008 | – | – | – | -2.86 | 0.94 | 1.04 | 0.44 | 0.40 | ||
| Bloomberg 1-3 Year Composite Municipal Bond Index4 | – | – | – | – | -2.35 | 0.99 | 0.98 | – | – | ||
| 1 | Reflects the expense ratios as stated in the most recent prospectuses. The expense ratios shown are subject to change and may differ from the annualized expense ratios shown in the financial highlights of this report. |
| 2 | The manager has contractually committed through October 31, 2022, to waive fees and/or reimburse expenses to the extent necessary to cap total annual fund operating expenses after fee waivers at 0.63% for Class A, 1.38% for Class C, 0.35% for Class R6, 0.60% for Administrator Class, and 0.40% for Institutional Class. Brokerage commissions, stamp duty fees, interest, taxes, acquired fund fees and expenses (if any), and extraordinary expenses are excluded from the expense caps. Prior to or after the commitment expiration date, the caps may be increased or the commitment to maintain the caps may be terminated only with the approval of the Board of Trustees. Without these caps, the Fund’s returns would have been lower. The expense ratio paid by an investor is the net expense ratio (the total annual fund operating expenses after fee waivers) as stated in the prospectuses. |
| 3 | Historical performance shown for the Class R6 shares prior to their inception reflects the performance of the Institutional Class shares, and includes the higher expenses applicable to the Institutional Class shares. If these expenses had not been included, returns for the Class R6 shares would be higher. |
| 4 | The Bloomberg 1-3 Year Composite Municipal Bond Index is a blended index weighted 50% in the Bloomberg 1-Year Municipal Bond Index and 50% in the Bloomberg 3-Year Municipal Bond Index. You cannot invest directly in an index. |

| 1 | The chart compares the performance of Class A shares for the most recent ten years with the Bloomberg 1-3 Year Composite Municipal Bond Index. The chart assumes a hypothetical investment of $10,000 in Class A shares and reflects all operating expenses and assumes the maximum initial sales charge of 2.00%. |
| ■ | The Fund underperformed its benchmark, the Bloomberg 1–3 Year Composite Municipal Bond Index, for the 12-month period that ended June 30, 2022. |
| ■ | Credit-quality positioning detracted from performance as the Fund maintained an overweight allocation to lower-quality bonds, which underperformed, while being underweight higher-quality investment-grade credits. The barbell yield-curve positioning also detracted from performance as our overweight to long-dated bonds underperformed. |
| ■ | The Fund shortened its duration through the second half of 2021, which contributed to performance. An overweight allocation to the housing and transportation sectors contributed to relative performance. Security selection also added to performance versus the benchmark. |
| Credit quality as of June 30, 20221 |

| 1 | The credit quality distribution of portfolio holdings reflected in the chart is based on ratings from Standard & Poor’s, Moody’s Investors Service, and/or Fitch Ratings Ltd. Credit quality ratings apply to the underlying holdings of the Fund and not to the Fund itself. The percentages of the portfolio with the ratings depicted in the chart are calculated based on the market value of fixed income securities held by the Fund. If a security was rated by all three rating agencies, the middle rating was utilized. If rated by two of the three rating agencies, the lower rating was utilized, and if rated by one of the rating agencies, that rating was utilized. Standard & Poor’s rates the creditworthiness of bonds, ranging from AAA (highest) to D (lowest). Ratings from A to CCC may be modified by the addition of a plus (+) or minus (-) sign to show relative standing within the rating categories. Standard & Poor’s rates the creditworthiness of short-term notes from SP-1 (highest) to SP-3 (lowest). Moody’s rates the creditworthiness of bonds, ranging from Aaa (highest) to C (lowest). Ratings Aa to B may be modified by the addition of a number 1 (highest) to 3 (lowest) to show relative standing within the ratings categories. Moody’s rates the creditworthiness of short-term U.S. tax-exempt municipal securities from MIG 1/VMIG 1 (highest) to SG (lowest). Fitch rates the creditworthiness of bonds, ranging from AAA (highest) to D (lowest). Credit quality distribution is subject to change and may have changed since the date specified. |
| Effective maturity distribution as of June 30, 20221 |

| 1 | Figures represent the percentage of the Fund's long-term investments. These amounts are subject to change and may have changed since the date specified. |
| * | The Bloomberg Municipal Bond Index is an unmanaged index composed of long-term tax-exempt bonds with a minimum credit rating of Baa. You cannot invest directly in an index |
| Beginning account value 1-1-2022 | Ending account value 6-30-2022 | Expenses paid during the period1 | Annualized net expense ratio | |
| Class A | ||||
| Actual | $1,000.00 | $ 970.16 | $3.08 | 0.63% |
| Hypothetical (5% return before expenses) | $1,000.00 | $1,021.67 | $3.16 | 0.63% |
| Class C | ||||
| Actual | $1,000.00 | $ 966.54 | $6.73 | 1.38% |
| Hypothetical (5% return before expenses) | $1,000.00 | $1,017.95 | $6.90 | 1.38% |
| Class R6 | ||||
| Actual | $1,000.00 | $ 971.57 | $1.71 | 0.35% |
| Hypothetical (5% return before expenses) | $1,000.00 | $1,023.06 | $1.76 | 0.35% |
| Administrator Class | ||||
| Actual | $1,000.00 | $ 970.56 | $2.93 | 0.60% |
| Hypothetical (5% return before expenses) | $1,000.00 | $1,021.82 | $3.01 | 0.60% |
| Institutional Class | ||||
| Actual | $1,000.00 | $ 971.33 | $1.96 | 0.40% |
| Hypothetical (5% return before expenses) | $1,000.00 | $1,022.81 | $2.01 | 0.40% |
| Principal | Value | ||||
| Closed end municipal bond fund obligations: 1.20% | |||||
| California: 0.71% | |||||
| Nuveen California AMT-Free Quality Municipal Income Fund MuniFund Preferred Shares Series A (144 shares) 1.41% 144Aø | $14,400,000 | $ 14,400,000 | |||
| Other: 0.49% | |||||
| Nuveen AMT-Free Municipal Credit Income Fund MuniFund Preferred Shares Series B (10,000 shares) 1.41% 144Aø | 10,000,000 | 10,000,000 | |||
| Total Closed end municipal bond fund obligations (Cost $24,400,000) | 24,400,000 |
| Interest rate | Maturity date | ||||
| Municipal obligations: 99.09% | |||||
| Alabama: 3.45% | |||||
| Airport revenue: 0.10% | |||||
| Birmingham AL Airport Authority Series 2020 (BAM Insured) | 5.00% | 7-1-2023 | 475,000 | 489,447 | |
| Birmingham AL Airport Authority Series 2020 (BAM Insured) | 5.00 | 7-1-2026 | 900,000 | 982,827 | |
| Birmingham AL Airport Authority Series 2020 (BAM Insured) | 5.00 | 7-1-2027 | 500,000 | 553,664 | |
| 2,025,938 | |||||
| Industrial development revenue: 0.45% | |||||
| Mobile AL Industrial Development Board Alabama Power Company Barry Plant Project Series A | 1.00 | 6-1-2034 | 8,500,000 | 8,094,826 | |
| Selma AL Industrial Development Board Refunding Bonds Gulf Opportunity Zone International Paper Company | 2.00 | 11-1-2033 | 1,000,000 | 975,605 | |
| 9,070,431 | |||||
| Utilities revenue: 2.90% | |||||
| Black Belt Energy Gas District Gas Supply Project #7 Series C-1 | 4.00 | 12-1-2025 | 1,500,000 | 1,526,999 | |
| Black Belt Energy Gas District Gas Supply Project Series 2017A (Royal Bank of Canada LIQ) | 4.00 | 8-1-2047 | 3,880,000 | 3,880,000 | |
| Black Belt Energy Gas District Gas Supply Project Series 2022D-1 %% | 4.00 | 7-1-2052 | 3,500,000 | 3,603,749 | |
| Black Belt Energy Gas District Gas Supply Project Series A | 4.00 | 12-1-2048 | 8,000,000 | 8,139,454 | |
| Black Belt Energy Gas District Series 2021C-1 | 4.00 | 10-1-2052 | 3,900,000 | 3,947,212 | |
| Black Belt Energy Gas District Series A | 4.00 | 6-1-2024 | 3,640,000 | 3,697,457 | |
| Chatom AL Industrial Development Board Alabama Electric Series A (National Rural Utilities Cooperative Finance SPA) ø | 0.50 | 8-1-2037 | 12,000,000 | 12,000,000 | |
| Chatom AL Industrial Development Board Gulf Opportunity Zone PowerSouth Energy Cooperative Projects Series 2020 (AGM Insured) | 5.00 | 8-1-2024 | 985,000 | 1,039,409 | |
| Chatom AL Industrial Development Board Gulf Opportunity Zone PowerSouth Energy Cooperative Projects Series 2020 (AGM Insured) | 5.00 | 8-1-2025 | 425,000 | 457,032 |
| Interest rate | Maturity date | Principal | Value | ||
| Utilities revenue (continued) | |||||
| Chatom AL Industrial Development Board Gulf Opportunity Zone PowerSouth Energy Cooperative Projects Series 2020 (AGM Insured) | 5.00% | 8-1-2026 | $ 500,000 | $ 546,180 | |
| Southeast Alabama Gas Supply District Project #2 Series 2018A | 4.00 | 6-1-2049 | 20,060,000 | 20,256,700 | |
| 59,094,192 | |||||
| 70,190,561 | |||||
| Alaska: 0.56% | |||||
| Airport revenue: 0.20% | |||||
| Alaska International Airports System Revenue Refunding Bonds Series 2021C | 5.00 | 10-1-2026 | 3,000,000 | 3,248,475 | |
| Alaska International Airports System Revenue Refunding Bonds Series 2021C | 5.00 | 10-1-2028 | 775,000 | 851,844 | |
| 4,100,319 | |||||
| Health revenue: 0.21% | |||||
| Alaska Industrial Development and Export Authority Tanana Chiefs Conference Project | 5.00 | 10-1-2023 | 600,000 | 621,603 | |
| Alaska Industrial Development and Export Authority Tanana Chiefs Conference Project | 5.00 | 10-1-2024 | 750,000 | 787,233 | |
| Alaska Industrial Development and Export Authority Tanana Chiefs Conference Project | 5.00 | 10-1-2025 | 1,310,000 | 1,391,633 | |
| Alaska Industrial Development and Export Authority Tanana Chiefs Conference Project | 5.00 | 10-1-2026 | 1,385,000 | 1,489,973 | |
| 4,290,442 | |||||
| Miscellaneous revenue: 0.15% | |||||
| Alaska Municipal Bond Bank Refunding Bond Series 2020-1 | 5.00 | 12-1-2025 | 1,470,000 | 1,595,007 | |
| Alaska Municipal Bond Bank Refunding Bond Series 2020-1 | 5.00 | 12-1-2026 | 1,350,000 | 1,485,733 | |
| 3,080,740 | |||||
| 11,471,501 | |||||
| Arizona: 4.20% | |||||
| Education revenue: 0.85% | |||||
| Arizona IDA Education Facility Revenue Bonds Series 2021B | 5.00 | 7-1-2027 | 170,000 | 176,421 | |
| Arizona IDA Education Facility Revenue Bonds Series 2021B | 5.00 | 7-1-2028 | 175,000 | 180,939 | |
| Tender Option Bond Trust Receipts/Floater Certificates Series 2020-XF2862 (Mizuho Capital Markets LLC LOC, Mizuho Capital Markets LLC LIQ) 144Aø | 1.11 | 12-15-2047 | 17,000,000 | 17,000,000 | |
| 17,357,360 | |||||
| GO revenue: 0.14% | |||||
| Vistancia AZ Community Facilities District GO Series 2020 (BAM Insured) | 3.00 | 7-15-2022 | 700,000 | 700,333 |
| Interest rate | Maturity date | Principal | Value | ||
| GO revenue (continued) | |||||
| Vistancia AZ Community Facilities District GO Series 2020 (BAM Insured) | 4.00% | 7-15-2024 | $ 1,150,000 | $ 1,191,989 | |
| Vistancia AZ Community Facilities District GO Series 2020 (BAM Insured) | 4.00 | 7-15-2026 | 900,000 | 951,719 | |
| 2,844,041 | |||||
| Health revenue: 0.85% | |||||
| Arizona Health Facilities Authority Banner Health Series B (SIFMA Municipal Swap +0.25%) ± | 1.23 | 1-1-2046 | 4,000,000 | 3,890,026 | |
| Maricopa County AZ IDA Series 2019C (SIFMA Municipal Swap +0.57%) ± | 1.48 | 1-1-2035 | 4,570,000 | 4,541,140 | |
| Maricopa County AZ IDA Series 2019C (SIFMA Municipal Swap +0.80%) ± | 1.78 | 9-1-2048 | 9,000,000 | 8,970,174 | |
| 17,401,340 | |||||
| Industrial development revenue: 2.23% | |||||
| Chandler AZ IDA Intel Corporation Project | 2.40 | 12-1-2035 | 32,885,000 | 32,974,585 | |
| Chandler AZ IDA Intel Corporation Project | 2.70 | 12-1-2037 | 1,175,000 | 1,182,040 | |
| Chandler AZ IDA Intel Corporation Project | 5.00 | 6-1-2049 | 4,920,000 | 5,148,847 | |
| Phoenix AZ IDA Various Republic Services Incorporated Projects | 2.00 | 12-1-2035 | 6,000,000 | 5,999,351 | |
| 45,304,823 | |||||
| Miscellaneous revenue: 0.13% | |||||
| Phoenix AZ Civic Improvement Corporation Senior Lien Airport Revenue Refunding Bonds Series 2013 | 5.00 | 7-1-2028 | 2,500,000 | 2,551,802 | |
| 85,459,366 | |||||
| Arkansas: 0.19% | |||||
| Health revenue: 0.07% | |||||
| Batesville AR Public Facilities Board Hospital Series 2020 | 5.00 | 6-1-2025 | 1,385,000 | 1,454,867 | |
| Housing revenue: 0.10% | |||||
| Arkansas Development Finance Authority MFHR Cottages Apartments (Department of Housing and Urban Development Insured) | 1.25 | 12-1-2024 | 2,000,000 | 1,968,065 | |
| Tax revenue: 0.02% | |||||
| Cabot AR Sales Tax & Improvement Series B | 5.00 | 12-1-2028 | 435,000 | 491,947 | |
| 3,914,879 | |||||
| California: 4.38% | |||||
| Airport revenue: 0.13% | |||||
| Los Angeles CA Department Airports AMT Subordinate Bond Series D | 5.00 | 5-15-2027 | 2,500,000 | 2,758,221 | |
| GO revenue: 0.33% | |||||
| Kern Community College District CAB BAN ¤ | 0.00 | 8-1-2023 | 7,000,000 | 6,791,051 | |
| Health revenue: 0.14% | |||||
| California CDA Series 2020A | 5.00 | 4-1-2026 | 570,000 | 614,595 | |
| California CDA Series 2020A | 5.00 | 4-1-2027 | 845,000 | 916,493 | |
| Palomar CA Pomerado Health Care District Certificate of Participation Series C (AGM Insured) € | 1.50 | 11-1-2036 | 950,000 | 950,000 |
| Interest rate | Maturity date | Principal | Value | ||
| Health revenue (continued) | |||||
| Washington Township Health Care District Revenue Refunding Bonds Series 2020A | 5.00% | 7-1-2024 | $ 200,000 | $ 208,712 | |
| Washington Township Health Care District Revenue Refunding Bonds Series 2020A | 5.00 | 7-1-2025 | 200,000 | 212,065 | |
| 2,901,865 | |||||
| Housing revenue: 0.12% | |||||
| Tender Option Bond Trust Receipts/Certificates Series 2020-MIZ9012 (Mizuho Capital Markets LLC LIQ) 144Aø | 1.16 | 10-1-2036 | 2,355,000 | 2,355,000 | |
| Miscellaneous revenue: 0.41% | |||||
| California Infrastructure and Economic Development Bank J Paul Getty Trust Series 2021-B2 | 3.00 | 10-1-2047 | 1,000,000 | 1,014,811 | |
| Ceres CA Financing Authority Water System Revenue Bond Series 2020 | 0.50 | 6-1-2050 | 7,400,000 | 7,379,225 | |
| 8,394,036 | |||||
| Tax revenue: 0.07% | |||||
| Riverside County CA Public Financing Project Area #1 (BAM Insured) | 5.00 | 10-1-2026 | 1,250,000 | 1,345,876 | |
| Transportation revenue: 2.15% | |||||
| Bay Area Toll Authority Toll Bridge San Francisco Bay Area Series C (SIFMA Municipal Swap +0.45%) ± | 1.43 | 4-1-2056 | 2,750,000 | 2,693,976 | |
| Bay Area Toll Authority Toll Bridge San Francisco Bay Area Series C-1 (SIFMA Municipal Swap +0.90%) ± | 1.88 | 4-1-2045 | 25,500,000 | 25,530,189 | |
| Bay Area Toll Authority Toll Bridge San Francisco Bay Area Series D (SIFMA Municipal Swap +0.30%) ± | 1.28 | 4-1-2056 | 16,000,000 | 15,468,182 | |
| 43,692,347 | |||||
| Utilities revenue: 0.27% | |||||
| Lassen CA Municipal Utility District Certificate of Participation Series 2021 | 4.00 | 5-1-2024 | 400,000 | 409,442 | |
| Lassen CA Municipal Utility District Certificate of Participation Series 2021 | 4.00 | 5-1-2025 | 415,000 | 427,537 | |
| Lassen CA Municipal Utility District Certificate of Participation Series 2021 | 4.00 | 5-1-2026 | 435,000 | 449,944 | |
| Lassen CA Municipal Utility District Certificate of Participation Series 2021 | 4.00 | 5-1-2027 | 450,000 | 465,473 | |
| Lassen CA Municipal Utility District Certificate of Participation Series 2021 | 4.00 | 5-1-2028 | 470,000 | 484,115 | |
| Long Beach CA Bond Finance Authority Natural Gas Series B (3 Month LIBOR +1.43%) ± | 2.38 | 11-15-2026 | 2,000,000 | 1,962,796 | |
| Vernon California Electric System Series A | 5.00 | 8-1-2024 | 685,000 | 712,792 | |
| Vernon California Electric System Series A | 5.00 | 8-1-2025 | 500,000 | 527,952 | |
| 5,440,051 | |||||
| Water & sewer revenue: 0.76% | |||||
| California Department of Water Resources Central Valley Project Series AT (SIFMA Municipal Swap +0.37%) ± | 1.35 | 12-1-2035 | 15,500,000 | 15,490,824 | |
| 89,169,271 |
| Interest rate | Maturity date | Principal | Value | ||
| Colorado: 1.71% | |||||
| Airport revenue: 0.05% | |||||
| Denver CO City & County Department of Aviation Airport System Series A | 5.00% | 11-15-2024 | $ 1,000,000 | $ 1,010,469 | |
| Education revenue: 0.22% | |||||
| University of Colorado Enterprise and Refunding Bond Series C | 2.00 | 6-1-2054 | 2,000,000 | 1,973,002 | |
| University of Colorado Enterprise System Refunding Bond Series C3 Class A | 2.00 | 6-1-2051 | 2,500,000 | 2,441,509 | |
| 4,414,511 | |||||
| GO revenue: 0.18% | |||||
| Grand River CO Hospital District (AGM Insured) ## | 5.00 | 12-1-2022 | 1,450,000 | 1,469,018 | |
| Grand River CO Hospital District (AGM Insured) | 5.00 | 12-1-2024 | 1,140,000 | 1,201,991 | |
| Sand Creek CO Metropolitan District GO Series 2020A (AGM Insured) | 4.00 | 12-1-2024 | 550,000 | 571,742 | |
| Sand Creek CO Metropolitan District GO Series 2020A (AGM Insured) | 4.00 | 12-1-2025 | 400,000 | 419,803 | |
| 3,662,554 | |||||
| Health revenue: 0.68% | |||||
| Colorado Health Facilities Authority Hospital Adventhealth Obligated Group Series B | 5.00 | 11-15-2049 | 900,000 | 991,496 | |
| Colorado Health Facilities Authority Hospital Adventhealth Obligated Group Series C | 5.00 | 11-15-2036 | 3,165,000 | 3,486,102 | |
| Colorado Health Facilities Authority Improvement Christian Living | 4.00 | 1-1-2025 | 325,000 | 320,087 | |
| Colorado HFA Catholic Health Initiatives Series 2015-XF2195 (Morgan Stanley Bank LIQ) 144Aø | 1.05 | 10-1-2037 | 9,000,000 | 9,000,000 | |
| 13,797,685 | |||||
| Miscellaneous revenue: 0.40% | |||||
| Colorado Bridge Enterprise Central 70 Project Series 2017 | 4.00 | 12-31-2023 | 1,285,000 | 1,321,787 | |
| Colorado Bridge Enterprise Central 70 Project Series 2017 | 4.00 | 12-31-2025 | 2,455,000 | 2,549,472 | |
| Colorado Bridge Enterprise Central 70 Project Series 2017 | 4.00 | 6-30-2026 | 4,050,000 | 4,218,396 | |
| 8,089,655 | |||||
| Tax revenue: 0.02% | |||||
| Colorado Regional Transportation District Series 2020A & Series 2020B | 4.00 | 7-15-2033 | 500,000 | 475,684 | |
| Transportation revenue: 0.13% | |||||
| E-470 Public Highway Authority Colorado Series A | 5.00 | 9-1-2024 | 450,000 | 476,793 | |
| E-470 Public Highway Authority Colorado Series A | 5.00 | 9-1-2025 | 300,000 | 324,060 | |
| E-470 Public Highway Authority Colorado Series A | 5.00 | 9-1-2026 | 1,750,000 | 1,925,140 | |
| 2,725,993 | |||||
| Water & sewer revenue: 0.03% | |||||
| Central Weld County CO Water District Series 2020 (AGM Insured) | 5.00 | 12-1-2027 | 500,000 | 560,773 | |
| 34,737,324 |
| Interest rate | Maturity date | Principal | Value | ||
| Connecticut: 2.10% | |||||
| Education revenue: 0.51% | |||||
| Connecticut HEFAR University of Hartford Series N | 5.00% | 7-1-2024 | $ 120,000 | $ 123,511 | |
| Connecticut HEFAR University of Hartford Series N | 5.00 | 7-1-2025 | 140,000 | 145,430 | |
| Connecticut HEFAR Yale University Issue Series A | 1.10 | 7-1-2048 | 7,000,000 | 6,954,749 | |
| Connecticut Higher Education Supplemental Loan Authority Loan Program Series A | 3.60 | 11-15-2023 | 1,265,000 | 1,292,611 | |
| Connecticut Higher Education Supplemental Loan Authority Loan Program Series B | 5.00 | 11-15-2024 | 250,000 | 262,795 | |
| Connecticut Higher Education Supplemental Loan Authority Loan Program Series B | 5.00 | 11-15-2025 | 400,000 | 425,118 | |
| Connecticut Higher Education Supplemental Loan Authority Loan Program Series B | 5.00 | 11-15-2026 | 585,000 | 627,087 | |
| Connecticut Higher Education Supplemental Loan Authority Loan Program Series D | 5.00 | 11-15-2025 | 500,000 | 544,334 | |
| 10,375,635 | |||||
| GO revenue: 0.19% | |||||
| Bridgeport CT GO Refunding Bond Series 2021C | 5.00 | 2-15-2023 | 550,000 | 561,236 | |
| Bridgeport CT GO Refunding Bond Series 2021C | 5.00 | 2-15-2026 | 1,325,000 | 1,438,295 | |
| Connecticut Series C | 4.00 | 6-1-2025 | 1,000,000 | 1,046,984 | |
| Hamden CT GO Series 2020A (BAM Insured) | 5.00 | 8-1-2026 | 710,000 | 772,708 | |
| 3,819,223 | |||||
| Health revenue: 0.54% | |||||
| Connecticut HEFA Hartford Healthcare Series B1 | 5.00 | 7-1-2053 | 7,500,000 | 7,953,092 | |
| Connecticut HEFA Revenue Bond Stamford Hospital Issue Series M | 5.00 | 7-1-2026 | 375,000 | 401,273 | |
| Connecticut HEFA Revenue Bond Stamford Hospital Issue Series M | 5.00 | 7-1-2027 | 250,000 | 270,157 | |
| Connecticut HEFA Revenue Bond Stamford Hospital Issue Series M | 5.00 | 7-1-2028 | 300,000 | 325,310 | |
| Connecticut HEFA Yale New Haven Health Series A | 5.00 | 7-1-2028 | 1,975,000 | 2,063,963 | |
| 11,013,795 | |||||
| Housing revenue: 0.61% | |||||
| Connecticut HFA Mortgage Finance Program Bonds Series A Subseries A-4 (SIFMA Municipal Swap +0.30%) ± | 1.28 | 11-15-2050 | 12,500,000 | 12,357,198 | |
| Tax revenue: 0.25% | |||||
| Connecticut Special Tax Obligation Transportation Infrastructure Purposes Series A | 5.00 | 5-1-2026 | 1,200,000 | 1,318,320 | |
| Connecticut Special Tax Obligation Transportation Infrastructure Purposes Series A | 5.00 | 5-1-2027 | 3,400,000 | 3,799,582 | |
| 5,117,902 | |||||
| 42,683,753 | |||||
| Delaware: 0.19% | |||||
| Utilities revenue: 0.19% | |||||
| Delaware EDA Gas Facilities Delmarva Power & Light Company Series A | 1.05 | 1-1-2031 | 4,000,000 | 3,796,310 |
| Interest rate | Maturity date | Principal | Value | ||
| District of Columbia: 1.71% | |||||
| Airport revenue: 0.99% | |||||
| Metropolitan Washington DC Airports Authority Refunding Bond Series 2014A | 3.00% | 10-1-2022 | $ 6,500,000 | $ 6,522,446 | |
| Metropolitan Washington DC Airports Authority Series A | 5.00 | 10-1-2024 | 3,450,000 | 3,479,277 | |
| Metropolitan Washington DC Airports Authority Series A | 5.00 | 10-1-2026 | 1,180,000 | 1,285,109 | |
| Metropolitan Washington DC Airports Authority System Revenue Refunding AMT Series A | 5.00 | 10-1-2025 | 6,320,000 | 6,782,617 | |
| Metropolitan Washington DC Airports Authority System Revenue Refunding Bonds Series 2021A | 5.00 | 10-1-2027 | 1,000,000 | 1,101,215 | |
| Metropolitan Washington DC Airports Authority System Revenue Refunding Bonds Series 2021A | 5.00 | 10-1-2028 | 1,000,000 | 1,108,091 | |
| 20,278,755 | |||||
| Housing revenue: 0.32% | |||||
| District of Columbia HFA MFHR 1550 First Street Project | 2.80 | 6-1-2039 | 4,000,000 | 4,002,191 | |
| District of Columbia HFA MFHR Strand Residences Project | 1.45 | 2-1-2039 | 2,500,000 | 2,499,458 | |
| 6,501,649 | |||||
| Transportation revenue: 0.11% | |||||
| Metropolitan Washington DC Transit Authority Series A | 5.00 | 7-15-2025 | 2,000,000 | 2,165,996 | |
| Water & sewer revenue: 0.29% | |||||
| District of Columbia Water and Sewer Authority Public Utility Subordinated Lien Bond Series C | 1.75 | 10-1-2054 | 6,000,000 | 5,945,386 | |
| 34,891,786 | |||||
| Florida: 4.11% | |||||
| Airport revenue: 0.72% | |||||
| Broward County FL Airport System Series C | 5.00 | 10-1-2022 | 2,000,000 | 2,015,174 | |
| Greater Orlando Aviation Authority Orlando Florida Airport Facilities Prerefunded Bond | 5.00 | 10-1-2025 | 1,355,000 | 1,462,505 | |
| Greater Orlando Aviation Authority Orlando Florida Airport Facilities Unrefunded Bond | 5.00 | 10-1-2025 | 645,000 | 690,554 | |
| Miami-Dade County FL Aviation Refunding Bonds Series 2014 | 5.00 | 10-1-2028 | 10,000,000 | 10,376,331 | |
| 14,544,564 | |||||
| Education revenue: 0.23% | |||||
| Capital Projects Finance Authority Student Housing Refunding Bond Series 2020A-1 | 5.00 | 10-1-2024 | 500,000 | 514,358 | |
| Capital Projects Finance Authority Student Housing Refunding Bond Series 2020A-1 | 5.00 | 10-1-2025 | 1,000,000 | 1,035,572 | |
| Capital Projects Finance Authority Student Housing Refunding Bond Series 2020A-1 | 5.00 | 10-1-2026 | 1,000,000 | 1,038,180 | |
| Florida Higher Educational Facilities Financing Authority Educational Facilities Institute Technology | 5.00 | 10-1-2025 | 500,000 | 526,884 | |
| Florida Higher Educational Facilities Financing Authority Educational Facilities Institute Technology | 5.00 | 10-1-2026 | 750,000 | 797,940 | |
| Palm Beach County FL Educational Facilities Authority Revenue Bonds Series 2021 | 4.00 | 10-1-2026 | 250,000 | 254,796 |
| Interest rate | Maturity date | Principal | Value | ||
| Education revenue (continued) | |||||
| Palm Beach County FL Educational Facilities Authority Revenue Bonds Series 2021 | 4.00% | 10-1-2027 | $ 255,000 | $ 259,301 | |
| Palm Beach County FL Educational Facilities Authority Revenue Bonds Series 2021 | 4.00 | 10-1-2028 | 270,000 | 273,090 | |
| 4,700,121 | |||||
| Health revenue: 0.43% | |||||
| North Broward FL Hospital District Series B | 5.00 | 1-1-2023 | 1,700,000 | 1,723,850 | |
| North Broward FL Hospital District Series B | 5.00 | 1-1-2024 | 2,000,000 | 2,072,982 | |
| Pompano Beach FL Refunding Bond John Knox Village Project | 3.25 | 9-1-2023 | 665,000 | 661,178 | |
| St. Johns County FL IDA Vicars Landing Project A | 4.00 | 12-15-2022 | 115,000 | 114,855 | |
| St. Johns County FL IDA Vicars Landing Project A | 4.00 | 12-15-2023 | 115,000 | 114,313 | |
| St. Johns County FL IDA Vicars Landing Project A | 4.00 | 12-15-2024 | 145,000 | 143,073 | |
| St. Johns County FL IDA Vicars Landing Project A | 4.00 | 12-15-2025 | 180,000 | 175,585 | |
| St. Johns County FL IDA Vicars Landing Project A | 4.00 | 12-15-2026 | 185,000 | 178,275 | |
| St. Johns County FL IDA Vicars Landing Project A | 4.00 | 12-15-2027 | 215,000 | 204,168 | |
| St. Johns County FL IDA Vicars Landing Project A | 4.00 | 12-15-2028 | 200,000 | 186,787 | |
| Tender Option Bond Trust Receipts/Certificates 2020-XM0868 (JPMorgan Chase & Company LIQ) 144Aø | 1.06 | 2-15-2026 | 3,225,000 | 3,225,000 | |
| 8,800,066 | |||||
| Housing revenue: 0.44% | |||||
| Capital Trust Agency Florida College Park Towers Apartments Project (Department of Housing and Urban Development Insured) | 1.25 | 5-1-2024 | 9,000,000 | 8,929,527 | |
| Miscellaneous revenue: 0.52% | |||||
| Miami-Dade County FL School Board Certificate of Participation Series A | 5.00 | 5-1-2031 | 10,115,000 | 10,621,077 | |
| Resource recovery revenue: 0.09% | |||||
| Lee County FL Solid Waste System Refunding Bond | 5.00 | 10-1-2023 | 1,750,000 | 1,812,572 | |
| Tax revenue: 0.68% | |||||
| Department of Environmental Protection Florida Forever Series A | 5.00 | 7-1-2023 | 7,720,000 | 7,739,138 | |
| Leon County FL School District | 4.00 | 9-1-2026 | 6,000,000 | 6,135,186 | |
| 13,874,324 | |||||
| Transportation revenue: 0.05% | |||||
| Osceola County FL Transportation Improvement Osceola Parkway Series 2019A-1 | 5.00 | 10-1-2024 | 300,000 | 310,927 | |
| Osceola County FL Transportation Improvement Osceola Parkway Series 2019A-1 | 5.00 | 10-1-2026 | 735,000 | 775,656 | |
| 1,086,583 | |||||
| Utilities revenue: 0.04% | |||||
| Orlando FL Commission Utility System Series B | 1.25 | 10-1-2046 | 1,000,000 | 840,042 | |
| Water & sewer revenue: 0.91% | |||||
| North Sumter County FL Sumter County Utility Dependent District Utility Revenue Bonds Series 2021 (AGM Insured) | 5.00 | 10-1-2027 | 680,000 | 760,395 |
| Interest rate | Maturity date | Principal | Value | ||
| Water & sewer revenue (continued) | |||||
| North Sumter County FL Sumter County Utility Dependent District Utility Revenue Bonds Series 2021 (AGM Insured) | 5.00% | 10-1-2028 | $ 1,360,000 | $ 1,538,318 | |
| Tohopekaliga Water Authority Florida Utility System Series 2020 144A | 5.00 | 10-1-2025 | 14,160,000 | 15,412,667 | |
| Wildwood Utility Dependent District Utility South Sumter Utility Project (BAM Insured) | 5.00 | 10-1-2026 | 200,000 | 219,748 | |
| Wildwood Utility Dependent District Utility South Sumter Utility Project (BAM Insured) | 5.00 | 10-1-2027 | 200,000 | 222,712 | |
| Wildwood Utility Dependent District Utility South Sumter Utility Project (BAM Insured) | 5.00 | 10-1-2028 | 250,000 | 280,642 | |
| 18,434,482 | |||||
| 83,643,358 | |||||
| Georgia: 2.81% | |||||
| Health revenue: 0.05% | |||||
| Cobb County GA Kennestone Hospital Authority Series 2020B | 5.00 | 4-1-2026 | 1,000,000 | 1,074,555 | |
| Industrial development revenue: 0.26% | |||||
| Savannah GA EDA PCR International Paper Company Project Series B | 1.90 | 8-1-2024 | 4,250,000 | 4,176,359 | |
| Savannah GA EDA Recovery Zone Facility International | 2.00 | 11-1-2033 | 1,000,000 | 975,605 | |
| 5,151,964 | |||||
| Utilities revenue: 2.50% | |||||
| Burke County GA Development Authority Georgia Power Company Plant Vogtle Project | 1.55 | 12-1-2049 | 4,000,000 | 3,995,752 | |
| Burke County GA Development Authority Oglethorpe Power Corporation Vogtle Project Series F | 3.00 | 11-1-2045 | 22,050,000 | 22,096,005 | |
| Georgia Municipal Electric Authority Plant Vogtle Units 3&4 Project M | 5.00 | 1-1-2025 | 200,000 | 211,189 | |
| Georgia Municipal Electric Authority Plant Vogtle Units 3&4 Project M | 5.00 | 1-1-2026 | 300,000 | 321,960 | |
| Georgia Municipal Electric Authority Plant Vogtle Units 3&4 Project P | 5.00 | 1-1-2023 | 250,000 | 253,716 | |
| Georgia Municipal Electric Authority Plant Vogtle Units 3&4 Project P | 5.00 | 1-1-2024 | 400,000 | 416,089 | |
| Georgia Municipal Electric Authority Plant Vogtle Units 3&4 Project P | 5.00 | 1-1-2025 | 1,000,000 | 1,052,242 | |
| Main Street Natural Gas Incorporated Gas Supply Revenue Bonds Series 2018C (Royal Bank of Canada LIQ) | 4.00 | 8-1-2048 | 6,225,000 | 6,350,591 | |
| Main Street Natural Gas Incorporated Gas Supply Revenue Bonds Series 2021A | 4.00 | 7-1-2052 | 1,000,000 | 1,025,295 | |
| Main Street Natural Gas Incorporated Gas Supply Revenue Bonds Series 2021C | 4.00 | 12-1-2026 | 1,100,000 | 1,118,155 | |
| Main Street Natural Gas Incorporated Gas Supply Revenue Bonds Series 2021C | 4.00 | 12-1-2027 | 1,215,000 | 1,230,516 | |
| Main Street Natural Gas Incorporated Gas Supply Revenue Bonds Series 2022 | 4.00 | 12-1-2027 | 4,000,000 | 4,051,080 | |
| Main Street Natural Gas Incorporated Gas Supply Revenue Bonds Series 2022A | 4.00 | 12-1-2028 | 3,345,000 | 3,366,327 |
| Interest rate | Maturity date | Principal | Value | ||
| Utilities revenue (continued) | |||||
| Monroe County GA Development Authority PCR Georgia Power Company Plant Scherer Project First Series 2009 | 1.00% | 7-1-2049 | $ 2,500,000 | $ 2,222,546 | |
| Monroe County GA Development Authority PCR Oglethorpe Power Corporation Scherer Project Series A | 1.50 | 1-1-2039 | 1,500,000 | 1,437,579 | |
| Municipal Electric Authority of Georgia Plant Vogtle Units 3&4 Project J Bonds Series 2021A (AGM Insured) | 5.00 | 1-1-2027 | 165,000 | 179,287 | |
| Municipal Electric Authority of Georgia Plant Vogtle Units 3&4 Project J Bonds Series 2021A (AGM Insured) | 5.00 | 1-1-2028 | 200,000 | 219,486 | |
| Municipal Electric Authority of Georgia Plant Vogtle Units 3&4 Project J Bonds Series 2022A (AGM Insured) %% | 5.00 | 7-1-2027 | 300,000 | 327,843 | |
| Municipal Electric Authority of Georgia Plant Vogtle Units 3&4 Project J Bonds Series 2022A (AGM Insured) %% | 5.00 | 7-1-2028 | 300,000 | 330,165 | |
| Municipal Electric Authority of Georgia Plant Vogtle Units 3&4 Project J Bonds Series 2022A (AGM Insured) %% | 5.00 | 7-1-2029 | 600,000 | 664,326 | |
| 50,870,149 | |||||
| 57,096,668 | |||||
| Guam: 0.25% | |||||
| Tax revenue: 0.08% | |||||
| Government of Guam Business Privilege Series F | 5.00 | 1-1-2028 | 500,000 | 526,226 | |
| Government of Guam Business Privilege Series F | 5.00 | 1-1-2029 | 1,000,000 | 1,054,116 | |
| 1,580,342 | |||||
| Utilities revenue: 0.17% | |||||
| Guam Power Authority Series A %% | 5.00 | 10-1-2026 | 3,265,000 | 3,468,146 | |
| 5,048,488 | |||||
| Hawaii: 0.78% | |||||
| GO revenue: 0.21% | |||||
| Honolulu HI GO Bonds Series 2022A %% | 5.00 | 11-1-2024 | 1,000,000 | 1,062,254 | |
| Honolulu HI GO Bonds Series 2022A %% | 5.00 | 11-1-2025 | 3,000,000 | 3,254,905 | |
| 4,317,159 | |||||
| Miscellaneous revenue: 0.42% | |||||
| Hawaii Department of Transportation Airports Division Series 2013 | 5.25 | 8-1-2025 | 1,945,000 | 1,997,276 | |
| Hawaii Department of Transportation Airports Division Series 2013 | 5.25 | 8-1-2026 | 6,350,000 | 6,503,238 | |
| 8,500,514 | |||||
| Utilities revenue: 0.15% | |||||
| Hawaii Department of Budget & Finance Hawaiian Electric Company Series 2017A | 3.10 | 5-1-2026 | 3,000,000 | 2,977,449 | |
| 15,795,122 | |||||
| Illinois: 8.32% | |||||
| Airport revenue: 1.00% | |||||
| Chicago IL Midway Airport Refunding Bond Second Lien Series A | 5.00 | 1-1-2025 | 5,000,000 | 5,158,428 |
| Interest rate | Maturity date | Principal | Value | ||
| Airport revenue (continued) | |||||
| Chicago IL O'Hare International Airport Refunding Bond Passenger Facility | 5.00% | 1-1-2023 | $13,720,000 | $ 13,757,978 | |
| Chicago IL O'Hare International Airport Refunding Bond Passenger Facility | 5.00 | 1-1-2024 | 1,335,000 | 1,384,710 | |
| 20,301,116 | |||||
| Education revenue: 0.64% | |||||
| Illinois Finance Authority Benedictine University Refunding Bond | 5.00 | 10-1-2027 | 630,000 | 655,168 | |
| Illinois State University Auxiliary Facilities System Series A | 5.00 | 4-1-2024 | 2,325,000 | 2,374,683 | |
| Illinois State University Auxiliary Facilities System Series A (AGM Insured) | 5.00 | 4-1-2025 | 700,000 | 745,917 | |
| Illinois State University Auxiliary Facilities System Series B (AGM Insured) | 5.00 | 4-1-2024 | 415,000 | 433,859 | |
| Southern Illinois University Board of Trustees Southern Illnois University Housing and Auxiliary Facilities System Series A (BAM Insured) | 4.00 | 4-1-2026 | 825,000 | 855,689 | |
| Southern Illinois University Board of Trustees Southern Illnois University Housing and Auxiliary Facilities System Series A (BAM Insured) | 4.00 | 4-1-2027 | 780,000 | 811,841 | |
| Southern Illinois University Board of Trustees Southern Illnois University Housing and Auxiliary Facilities System Series A (BAM Insured) %% | 5.00 | 4-1-2027 | 400,000 | 433,548 | |
| Southern Illinois University Board of Trustees Southern Illnois University Housing and Auxiliary Facilities System Series A (BAM Insured) %% | 5.00 | 4-1-2028 | 500,000 | 545,294 | |
| University of Illinois Refunding Bond Auxiliary Facilities Series A | 5.00 | 4-1-2027 | 5,000,000 | 5,092,394 | |
| Western Illinois University Refunding Bond Auxiliary Facilities System (BAM Insured) | 4.00 | 4-1-2024 | 1,000,000 | 1,029,021 | |
| 12,977,414 | |||||
| GO revenue: 2.41% | |||||
| Boone, McHenry & DeKalb Counties IL Community Unit School District #100 GO Refunding School Bonds, Series 2021B | 4.00 | 1-1-2027 | 4,525,000 | 4,766,727 | |
| Boone, McHenry & DeKalb Counties IL Community Unit School District #100 GO Refunding School Bonds, Series 2021B | 4.00 | 1-1-2028 | 2,100,000 | 2,245,236 | |
| Chicago IL Board of Education Refunding Bond Series A (AGM Insured) | 5.00 | 12-1-2022 | 500,000 | 506,517 | |
| Chicago IL Board of Education Refunding Bond Series A (AGM Insured) | 5.00 | 12-1-2023 | 2,000,000 | 2,075,301 | |
| Chicago IL Board of Education Refunding Bond Series B | 5.00 | 12-1-2030 | 2,250,000 | 2,362,727 | |
| Chicago IL GO Series 2021A | 5.00 | 1-1-2027 | 3,935,000 | 4,161,351 | |
| Chicago IL GO Series 2021A | 5.00 | 1-1-2028 | 3,000,000 | 3,186,928 | |
| Chicago IL Refunding Bond Series A | 5.00 | 1-1-2026 | 5,000,000 | 5,241,684 | |
| Chicago IL Refunding Bonds Project Series 2015C | 5.00 | 1-1-2023 | 1,450,000 | 1,473,696 | |
| Chicago IL Series A | 5.00 | 1-1-2027 | 2,445,000 | 2,585,642 | |
| Chicago IL Unrefunded Balance Refunding Bonds Series C | 5.00 | 1-1-2023 | 3,300,000 | 3,353,930 | |
| Cook County IL GO Refunding Bonds Series 2021A | 5.00 | 11-15-2026 | 1,950,000 | 2,132,646 | |
| Cook County IL Refunding Bond Series A | 5.00 | 11-15-2025 | 1,200,000 | 1,291,677 | |
| DeKalb County IL Community Unit School District Series B (AGM Insured) ¤ | 0.00 | 1-1-2025 | 3,235,000 | 3,001,573 | |
| Grundy, Kendall & Will Counties IL Community High School District #111 Minooka Refund Bond | 4.00 | 5-1-2027 | 500,000 | 529,805 |
| Interest rate | Maturity date | Principal | Value | ||
| GO revenue (continued) | |||||
| Grundy, Kendall & Will Counties IL Community High School District #111 Minooka Refunding Bond | 4.00% | 5-1-2026 | $ 635,000 | $ 667,361 | |
| Illinois Series 2020 | 5.38 | 5-1-2023 | 1,000,000 | 1,023,394 | |
| Kane, Cook, DuPage, McHenry & DeKalb Counties IL Refunding Bond Series B | 4.00 | 12-15-2026 | 960,000 | 1,021,701 | |
| Kane, Cook, DuPage, McHenry & DeKalb Counties IL Refunding Bond Series B | 4.00 | 12-15-2027 | 795,000 | 851,067 | |
| Kendall, Kane & Will Counties IL Refunding Bond Series B ## | 5.00 | 10-1-2022 | 1,660,000 | 1,673,804 | |
| Kendall, Kane & Will Counties IL Refunding Bond Series B | 5.00 | 10-1-2023 | 825,000 | 855,014 | |
| Waukegan IL Series B (AGM Insured) | 4.00 | 12-30-2023 | 500,000 | 513,552 | |
| Whiteside & Lee Counties IL Community Unit School District Series A (BAM Insured) | 4.00 | 12-1-2024 | 1,490,000 | 1,548,901 | |
| Will County IL Community High School District #161 | 4.00 | 1-1-2024 | 2,000,000 | 2,055,769 | |
| 49,126,003 | |||||
| Health revenue: 0.65% | |||||
| Illinios Finance Authority Revenue Refunding Bonds Series 2022 | 4.00 | 10-15-2026 | 465,000 | 456,018 | |
| Illinios Finance Authority Revenue Refunding Bonds Series 2022 | 4.00 | 10-15-2027 | 480,000 | 466,613 | |
| Illinois Finance Authority Health Services Facility Series 2020 | 5.00 | 10-1-2025 | 500,000 | 531,954 | |
| Illinois Finance Authority Health Services Facility Series 2020 | 5.00 | 10-1-2026 | 500,000 | 539,134 | |
| Illinois Finance Authority Presbyterian Homes Obligated Group Series B (SIFMA Municipal Swap +0.70%) ± | 1.68 | 5-1-2042 | 2,250,000 | 2,173,250 | |
| Illinois Finance Authority Revenue Bonds Advocate Health Care Network | 4.00 | 11-1-2030 | 3,600,000 | 3,711,559 | |
| Illinois Finance Authority Series 2020B-2 | 5.00 | 5-15-2050 | 4,000,000 | 4,309,980 | |
| Southwestern Illinois Development Authority Health Facility Memorial Group Incorporated | 6.38 | 11-1-2023 | 1,035,000 | 1,072,687 | |
| 13,261,195 | |||||
| Housing revenue: 0.37% | |||||
| Illinois Housing Development Authority (SIFMA Municipal Swap +1.00%)(FNMA LOC, FNMA LIQ) ± | 1.98 | 5-15-2050 | 7,500,000 | 7,540,209 | |
| Miscellaneous revenue: 1.39% | |||||
| Chicago IL Board of Education Refunding Bond Series B | 4.00 | 12-1-2022 | 2,000,000 | 2,009,375 | |
| Chicago IL Board of Education Refunding Bond Series B | 5.00 | 12-1-2024 | 2,270,000 | 2,338,312 | |
| Chicago IL Board of Education Refunding Bond Series B | 5.00 | 12-1-2025 | 2,460,000 | 2,552,825 | |
| Chicago IL Special Assessment Improvement Bonds Series 2022 | 3.04 | 12-1-2028 | 270,000 | 245,756 | |
| Illinois Refunding Bond | 5.00 | 2-1-2023 | 8,775,000 | 8,906,558 | |
| Illinois Series 2017D | 5.00 | 11-1-2026 | 8,025,000 | 8,594,158 | |
| Illinois Series 2017D | 5.00 | 11-1-2027 | 3,335,000 | 3,596,074 | |
| 28,243,058 | |||||
| Tax revenue: 1.68% | |||||
| Hillside IL Refunding Bond Series 2018 | 5.00 | 1-1-2024 | 650,000 | 654,787 | |
| Huntley IL Special Service Area #6 Special Tax Refunding Bond (BAM Insured) | 2.20 | 3-1-2024 | 797,000 | 797,628 | |
| Illinois Sales Tax Revenue Junior Obligation Series A | 5.00 | 6-15-2023 | 5,825,000 | 5,957,878 | |
| Illinois Sales Tax Revenue Junior Obligation Series C | 4.00 | 6-15-2025 | 4,000,000 | 4,103,646 |
| Interest rate | Maturity date | Principal | Value | ||
| Tax revenue (continued) | |||||
| Illinois Sales Tax Revenue Refunding Bond Series C | 4.00% | 6-15-2023 | $ 3,315,000 | $ 3,359,887 | |
| Illinois Series 2013 | 5.00 | 6-15-2024 | 585,000 | 597,951 | |
| Illinois State Tax Revenue Junior Obligation Series D | 5.00 | 6-15-2027 | 1,275,000 | 1,357,700 | |
| Macon County IL Decatur School District #61 Series 2020 C (AGM Insured) | 4.00 | 1-1-2024 | 475,000 | 488,881 | |
| Macon County IL Decatur School District #61 Series 2020 C (AGM Insured) | 4.00 | 1-1-2027 | 600,000 | 635,782 | |
| Metropolitan Pier & Exposition Authority McCormick Place Project Non-Callable Bond Series B | 5.00 | 12-15-2022 | 7,000,000 | 7,084,778 | |
| Metropolitan Pier & Exposition Authority McCormick Place Project Refunding Bonds Series A | 3.00 | 6-15-2025 | 2,000,000 | 1,970,628 | |
| Sales Tax Securitization Corporation Second Lien Series 2020A | 5.00 | 1-1-2028 | 5,000,000 | 5,492,448 | |
| Village of Matteson IL GO Refunding Bonds Series 2021A (BAM Insured) | 4.00 | 12-1-2025 | 500,000 | 523,086 | |
| Village of Matteson IL GO Refunding Bonds Series 2021A (BAM Insured) | 4.00 | 12-1-2026 | 200,000 | 210,040 | |
| Village of Matteson IL GO Refunding Bonds Series 2021A (BAM Insured) | 4.00 | 12-1-2027 | 300,000 | 316,297 | |
| Village of Matteson IL GO Refunding Bonds Series 2021A (BAM Insured) | 4.00 | 12-1-2027 | 575,000 | 607,121 | |
| 34,158,538 | |||||
| Transportation revenue: 0.11% | |||||
| Illinois Toll Highway Authority Senior Refunding Bond Series C | 5.00 | 1-1-2027 | 2,050,000 | 2,269,324 | |
| Water & sewer revenue: 0.07% | |||||
| Geneva IL Waterworks Sewage Alternate Revenue Source Series 2021 | 4.00 | 2-1-2027 | 450,000 | 475,398 | |
| Geneva IL Waterworks Sewage Alternate Revenue Source Series 2021 | 4.00 | 2-1-2028 | 280,000 | 295,940 | |
| Village of Matteson IL GO Refunding Bonds Series 2021A (BAM Insured) | 4.00 | 12-1-2025 | 400,000 | 417,670 | |
| Waukegan Lake County IL First Lien Water & Sewer System Revenue Bonds Series 2020 (AGM Insured) | 5.00 | 12-30-2027 | 280,000 | 311,609 | |
| 1,500,617 | |||||
| 169,377,474 | |||||
| Indiana: 1.28% | |||||
| Health revenue: 0.74% | |||||
| Indiana Finance Authority Deaconess Health System Series B (SIFMA Municipal Swap +0.30%) ± | 1.21 | 3-1-2039 | 5,775,000 | 5,621,805 | |
| Indiana Finance Authority Health System Franciscan Alliance Incorporated Series B | 5.00 | 11-1-2022 | 1,000,000 | 1,011,588 | |
| Indiana Finance Authority Health System Franciscan Alliance Incorporated Series B | 5.00 | 11-1-2023 | 1,270,000 | 1,322,227 | |
| Indiana Finance Authority Health System Franciscan Alliance Incorporated Series B | 5.00 | 11-1-2024 | 3,000,000 | 3,189,807 | |
| Indiana Finance Authority Health System Franciscan Alliance Incorporated Series C | 5.00 | 11-1-2023 | 800,000 | 832,899 | |
| Indiana Finance Authority Health System Franciscan Alliance Incorporated Series C | 5.00 | 11-1-2024 | 1,000,000 | 1,063,269 | |
| Indiana Finance Authority Parkview Health Series A | 5.00 | 5-1-2023 | 1,010,000 | 1,036,527 |
| Interest rate | Maturity date | Principal | Value | ||
| Health revenue (continued) | |||||
| Indiana Finance Authority Senior Living Series A | 5.00% | 11-15-2022 | $ 500,000 | $ 502,271 | |
| Indiana Finance Authority Senior Living Series A | 5.00 | 11-15-2023 | 500,000 | 507,863 | |
| 15,088,256 | |||||
| Miscellaneous revenue: 0.54% | |||||
| Indianapolis Local Public Improvement Bond Series A | 5.00 | 6-1-2026 | 3,000,000 | 3,255,304 | |
| Indianapolis Local Public Improvement Bond Series A | 5.00 | 6-1-2027 | 6,000,000 | 6,603,826 | |
| Mishawaka RDA Lease Rental Revenue Bonds of 2021 (BAM Insured) | 5.00 | 2-15-2027 | 1,025,000 | 1,133,688 | |
| 10,992,818 | |||||
| 26,081,074 | |||||
| Iowa: 0.72% | |||||
| Education revenue: 0.11% | |||||
| Iowa Student Loan Liquidity Corporation AMT Senior Series B | 5.00 | 12-1-2022 | 500,000 | 506,312 | |
| Iowa Student Loan Liquidity Corporation AMT Senior Series B | 5.00 | 12-1-2023 | 700,000 | 725,861 | |
| Iowa Student Loan Liquidity Corporation AMT Senior Series B | 5.00 | 12-1-2024 | 1,000,000 | 1,055,576 | |
| 2,287,749 | |||||
| GO revenue: 0.09% | |||||
| Indianola IA GO Capital Loan Notes Series 2021 | 3.00 | 6-1-2027 | 855,000 | 873,350 | |
| Indianola IA GO Capital Loan Notes Series 2021 | 4.00 | 6-1-2028 | 880,000 | 945,140 | |
| 1,818,490 | |||||
| Utilities revenue: 0.52% | |||||
| Iowa Gas Project Public Expenditure and Financial Accountability Incorporated | 5.00 | 9-1-2049 | 10,000,000 | 10,499,009 | |
| 14,605,248 | |||||
| Kansas: 0.40% | |||||
| Health revenue: 0.10% | |||||
| Wichita KS Health Care Facilities Presbyterian Manors Incorporated | 4.00 | 5-15-2024 | 1,015,000 | 1,004,565 | |
| Wichita KS Health Care Facilities Presbyterian Manors Incorporated | 5.00 | 5-15-2025 | 1,055,000 | 1,062,478 | |
| 2,067,043 | |||||
| Housing revenue: 0.30% | |||||
| Wichita KS Multifamily Housing Verandas at Crestview Series I | 3.90 | 12-1-2024 | 5,900,000 | 6,008,207 | |
| 8,075,250 | |||||
| Kentucky: 3.38% | |||||
| Education revenue: 0.08% | |||||
| Columbia KY Educational Development Refunding Revenue Bonds Lindsey Wilson College Project Series 2021 | 4.00 | 12-1-2027 | 525,000 | 537,908 |
| Interest rate | Maturity date | Principal | Value | ||
| Education revenue (continued) | |||||
| Columbia KY Educational Development Refunding Revenue Bonds Lindsey Wilson College Project Series 2021 | 4.00% | 12-1-2028 | $ 545,000 | $ 554,979 | |
| Kentucky Bond Development Corporation City of Danville Centre College Series 2021 | 4.00 | 6-1-2026 | 210,000 | 219,105 | |
| Kentucky Bond Development Corporation City of Danville Centre College Series 2021 | 4.00 | 6-1-2028 | 250,000 | 262,909 | |
| 1,574,901 | |||||
| Health revenue: 0.21% | |||||
| Louisville & Jefferson Counties KY Metro Health System Revenue Norton Healthcare Incorporated Series C | 5.00 | 10-1-2047 | 4,000,000 | 4,268,720 | |
| Housing revenue: 0.44% | |||||
| Kentucky Housing Corporation MFHR City View Park Project | 1.16 | 2-1-2023 | 9,000,000 | 8,998,201 | |
| Industrial development revenue: 0.13% | |||||
| Boone County KY Poll Control Duke Energy Kentucky Incorporated Series A | 3.70 | 8-1-2027 | 2,750,000 | 2,763,823 | |
| Miscellaneous revenue: 0.02% | |||||
| Kentucky State University Certificate of Participation Series 2021 (BAM Insured) | 5.00 | 11-1-2027 | 160,000 | 178,339 | |
| Kentucky State University Certificate of Participation Series 2021 (BAM Insured) | 5.00 | 11-1-2028 | 200,000 | 225,340 | |
| 403,679 | |||||
| Unknown Revenue Source: 0.15% | |||||
| Rural Water Financing Agency KY Public Projects Construction Series A | 3.00 | 5-1-2024 | 3,000,000 | 3,001,555 | |
| Utilities revenue: 2.35% | |||||
| Kentucky Public Energy Authority Gas Supply Series A-1 | 4.00 | 12-1-2049 | 9,500,000 | 9,626,648 | |
| Kentucky Public Energy Authority Gas Supply Series B | 4.00 | 1-1-2049 | 26,085,000 | 26,397,937 | |
| Louisville & Jefferson Counties KY Metro Government PCR Series B | 1.35 | 11-1-2027 | 7,500,000 | 6,695,594 | |
| Trimble County KY PCR Bonds Louisville Gas and Electric Company Project Series 2016A | 1.30 | 9-1-2044 | 6,000,000 | 5,040,914 | |
| 47,761,093 | |||||
| 68,771,972 | |||||
| Louisiana: 1.55% | |||||
| Health revenue: 0.34% | |||||
| Louisiana Public Facilities Authority Hospital Revenue Louisiana Children's Medical Center Project | 5.00 | 6-1-2045 | 6,695,000 | 6,882,250 | |
| Industrial development revenue: 0.69% | |||||
| St John Baptist Parish LA Marathon Oil Corporation Project | 2.10 | 6-1-2037 | 14,450,000 | 13,972,834 |
| Interest rate | Maturity date | Principal | Value | ||
| Miscellaneous revenue: 0.30% | |||||
| Louisiana Local Government Environmental Facilities and CDA Subordinated Lien Bond East Baton Rouge øø | 0.88% | 2-1-2046 | $ 5,000,000 | $ 4,555,936 | |
| Louisiana State GO Bonds Series A | 5.00 | 2-1-2027 | 1,570,000 | 1,641,419 | |
| 6,197,355 | |||||
| Utilities revenue: 0.18% | |||||
| Lafayette LA Refunding Bond | 5.00 | 11-1-2023 | 3,680,000 | 3,722,885 | |
| Water & sewer revenue: 0.04% | |||||
| East Baton Rouge LA Refunding Bonds Multi Modal Series A | 1.30 | 2-1-2041 | 1,000,000 | 868,260 | |
| 31,643,584 | |||||
| Maine: 0.09% | |||||
| Education revenue: 0.02% | |||||
| Maine Finance Authority Supplemental Education Loan Program Class A Series A-1 (AGM Insured) | 5.00 | 12-1-2025 | 425,000 | 454,094 | |
| Health revenue: 0.07% | |||||
| Maine HEFAR Bonds Series 2020A | 5.00 | 7-1-2025 | 255,000 | 275,475 | |
| Maine HEFAR Bonds Series 2020A | 5.00 | 7-1-2025 | 545,000 | 580,776 | |
| Maine HEFAR Bonds Series 2020A | 5.00 | 7-1-2026 | 500,000 | 539,119 | |
| 1,395,370 | |||||
| 1,849,464 | |||||
| Maryland: 2.00% | |||||
| Housing revenue: 1.08% | |||||
| Maryland CDA Department of Housing & Community Multifamily Development Overlook Manor Townhouses Series C | 3.00 | 4-1-2024 | 5,000,000 | 5,032,269 | |
| Maryland CDA Department of Housing & Community Multifamily Development Windsor Valley III Apartments Series G (FHA Insured) | 1.05 | 12-1-2023 | 11,000,000 | 10,774,768 | |
| Maryland CDA Department of Housing & Community Multifamily Development Woodside Gardens Series A 144A | 1.33 | 1-1-2024 | 6,300,000 | 6,198,535 | |
| 22,005,572 | |||||
| Transportation revenue: 0.26% | |||||
| Maryland Economic Development Corporation Private Activity Green Bond Purple Line Light Rail Transit Partners LLC Series A-P3 | 5.00 | 11-12-2028 | 5,000,000 | 5,261,332 | |
| Utilities revenue: 0.66% | |||||
| Maryland Economic Development Corporation PCR Potomac Electric Power Company Project | 1.70 | 9-1-2022 | 13,500,000 | 13,498,642 | |
| 40,765,546 | |||||
| Massachusetts: 2.53% | |||||
| Education revenue: 0.12% | |||||
| Massachusetts Development Finance Agency Lasell University Series 2021 | 4.00 | 7-1-2027 | 250,000 | 246,443 |
| Interest rate | Maturity date | Principal | Value | ||
| Education revenue (continued) | |||||
| Massachusetts Development Finance Agency Lasell University Series 2021 | 4.00% | 7-1-2028 | $ 330,000 | $ 322,605 | |
| Massachusetts Development Finance Agency Springfield College Issue Series 2021A | 5.00 | 6-1-2026 | 420,000 | 444,067 | |
| Massachusetts Development Finance Agency Springfield College Issue Series 2021A | 5.00 | 6-1-2027 | 440,000 | 468,681 | |
| Massachusetts Educational Financing Authority AMT Issue K Series 2017A | 5.00 | 7-1-2022 | 1,000,000 | 1,000,000 | |
| 2,481,796 | |||||
| Health revenue: 0.50% | |||||
| Massachusetts Development Finance Agency Partners Healthcare System Series S-3 (SIFMA Municipal Swap +0.50%) ± | 1.48 | 7-1-2038 | 5,000,000 | 4,978,947 | |
| Massachusetts Development Finance Agency Revenue Bonds Boston Medical Center Issue Series C | 5.25 | 7-1-2027 | 1,850,000 | 1,854,673 | |
| Massachusetts Development Finance Agency Wellforce Issue Series C (AGM Insured) | 5.00 | 10-1-2026 | 300,000 | 324,848 | |
| Massachusetts Development Finance Agency Wellforce Issue Series C (AGM Insured) | 5.00 | 10-1-2027 | 410,000 | 448,785 | |
| Massachusetts Development Finance Authority Revenue Bonds Series 2019 T1 (SIFMA Municipal Swap +0.60%) 144A± | 1.58 | 7-1-2049 | 2,600,000 | 2,581,283 | |
| 10,188,536 | |||||
| Miscellaneous revenue: 1.21% | |||||
| Massachusetts Consolidated Loan Subordinate Bond Series D-2 øø | 1.70 | 8-1-2043 | 24,550,000 | 24,554,242 | |
| Tax revenue: 0.12% | |||||
| Massachusetts Bay Transportation Authority Series B Subseries B-1 | 5.00 | 7-1-2025 | 2,300,000 | 2,490,227 | |
| Transportation revenue: 0.58% | |||||
| Massachusetts Department of Transportation Refunding Bond | 5.00 | 1-1-2039 | 11,685,000 | 11,859,846 | |
| 51,574,647 | |||||
| Michigan: 2.23% | |||||
| Education revenue: 0.10% | |||||
| Board of Trustees of Northern Michigan University General Revenue Bonds Series 2018A | 5.00 | 12-1-2027 | 640,000 | 715,734 | |
| Lake Superior State University Board of Trustees Series 2021 (AGM Insured) | 4.00 | 11-15-2026 | 390,000 | 408,135 | |
| Lake Superior State University Board of Trustees Series 2021 (AGM Insured) | 4.00 | 11-15-2027 | 405,000 | 423,877 | |
| Lake Superior State University Board of Trustees Series 2021 (AGM Insured) | 4.00 | 11-15-2028 | 405,000 | 422,732 | |
| 1,970,478 |
| Interest rate | Maturity date | Principal | Value | ||
| GO revenue: 0.03% | |||||
| Clawson MI Public School Building and Site (Qualified School Board Loan Fund Insured) | 4.00% | 5-1-2026 | $ 285,000 | $ 300,517 | |
| Clawson MI Public School Building and Site (Qualified School Board Loan Fund Insured) | 4.00 | 5-1-2028 | 300,000 | 318,212 | |
| 618,729 | |||||
| Health revenue: 0.98% | |||||
| Kalamazoo MI Economic Development Corporation Series 2020B-2 | 2.63 | 5-15-2025 | 1,150,000 | 1,100,120 | |
| Michigan Finance Authority Bronson Healthcare Group Series B & C | 3.75 | 11-15-2049 | 7,600,000 | 7,859,684 | |
| Michigan Finance Authority Hospital Beaumont Spectrum Series 2022B (SIFMA Municipal Swap +0.75%) ± | 1.73 | 4-15-2047 | 10,500,000 | 10,499,983 | |
| Michigan Strategic Fund Limited Obligation Refunding Bond Holland Home Project | 4.00 | 11-15-2024 | 580,000 | 575,466 | |
| 20,035,253 | |||||
| Industrial development revenue: 1.02% | |||||
| Michigan Strategic Fund Limited Obligation Consumers Energy Company Project | 1.80 | 10-1-2049 | 19,500,000 | 18,860,092 | |
| Michigan Strategic Fund Limited Obligation Revenue Graphic Packaging International LLC | 4.00 | 10-1-2061 | 2,000,000 | 1,979,158 | |
| 20,839,250 | |||||
| Miscellaneous revenue: 0.10% | |||||
| Michigan Finance Authority Local Government Loan Program Series 2014H-1 | 5.00 | 10-1-2022 | 815,000 | 817,258 | |
| Michigan Finance Authority Senior Lien Distributable State Aid Charter County of Wayne Criminal Justice Center Project | 5.00 | 11-1-2022 | 1,150,000 | 1,162,649 | |
| 1,979,907 | |||||
| 45,443,617 | |||||
| Minnesota: 1.35% | |||||
| Airport revenue: 0.06% | |||||
| Minneapolis & St. Paul MN Metropolitan Airports Commission Subordinate Bond Series 2019B | 5.00 | 1-1-2025 | 1,100,000 | 1,162,903 | |
| GO revenue: 0.09% | |||||
| Hastings MN Independent School District #200 Series A (State School District Credit Program Insured) ¤ | 0.00 | 2-1-2023 | 815,000 | 807,335 | |
| Hastings MN Independent School District #200 Series A (State School District Credit Program Insured) ¤ | 0.00 | 2-1-2024 | 1,015,000 | 982,141 | |
| 1,789,476 | |||||
| Housing revenue: 0.40% | |||||
| Minnesota HFA Residential Housing Series D (SIFMA Municipal Swap +0.43%)(GNMA / FNMA / FHLMC Insured) ± | 1.41 | 1-1-2045 | 8,235,000 | 8,225,610 |
| Interest rate | Maturity date | Principal | Value | ||
| Miscellaneous revenue: 0.04% | |||||
| Duluth MN Independent School District Certificate of Participation Series B (State School District Credit Program Insured) | 5.00% | 2-1-2024 | $ 425,000 | $ 444,198 | |
| Duluth MN Independent School District Certificate of Participation Series B (State School District Credit Program Insured) | 5.00 | 2-1-2025 | 375,000 | 400,209 | |
| 844,407 | |||||
| Utilities revenue: 0.76% | |||||
| Central Minnesota Municipal Power Agency Brookings Southeast Twin (AGM Insured) | 5.00 | 1-1-2027 | 400,000 | 442,436 | |
| Central Minnesota Municipal Power Agency Brookings Southeast Twin (AGM Insured) | 5.00 | 1-1-2028 | 500,000 | 559,161 | |
| Minnseota Municpal Gas Agency Commodity Supply Revenue Bonds Series 2022 (U.S. SOFR +1.00%)(Royal Bank of Canada LIQ) ± | 2.02 | 12-1-2052 | 15,000,000 | 14,479,781 | |
| 15,481,378 | |||||
| 27,503,774 | |||||
| Mississippi: 0.40% | |||||
| Health revenue: 0.37% | |||||
| Mississippi Hospital Equipment & Facilities Authority Baptist Memorial Health Care Project øø | 0.20 | 9-1-2036 | 5,000,000 | 4,983,446 | |
| Mississippi Hospital Equipment & Facilities Authority Baptist Memorial Health Care Project | 5.00 | 9-1-2044 | 2,500,000 | 2,635,587 | |
| 7,619,033 | |||||
| Industrial development revenue: 0.03% | |||||
| Mississippi Business Finance Corporation Solid Waste Disposal Facilities Mississippi Power Company Project ø | 0.82 | 5-1-2028 | 520,000 | 520,000 | |
| 8,139,033 | |||||
| Missouri: 1.71% | |||||
| Housing revenue: 0.39% | |||||
| Port Authority of Kansas City MO MFHR Bonds Series 2022A (Department of Housing and Urban Development Insured) | 1.50 | 5-1-2024 | 8,000,000 | 7,943,878 | |
| Industrial development revenue: 1.32% | |||||
| Missouri Environmental Improvement and Energy Resources Authority Kansas City Power and Light Company Project | 2.75 | 5-1-2038 | 23,400,000 | 23,400,000 | |
| Missouri Environmental Improvement and Energy Resources Authority Kansas City Power and Light Company Project | 3.50 | 5-1-2038 | 3,500,000 | 3,510,938 | |
| 26,910,938 | |||||
| 34,854,816 |
| Interest rate | Maturity date | Principal | Value | ||
| Montana: 0.17% | |||||
| Health revenue: 0.17% | |||||
| Montana Facility Finance Authority Billings Clinic Obligated Group Series 2022A | 5.00% | 8-15-2024 | $ 375,000 | $ 396,128 | |
| Montana Facility Finance Authority Billings Clinic Obligated Group Series 2022A | 5.00 | 8-15-2025 | 325,000 | 349,848 | |
| Montana Facility Finance Authority Billings Clinic Obligated Group Series 2022A | 5.00 | 8-15-2027 | 500,000 | 553,929 | |
| Montana Facility Finance Authority Billings Clinic Obligated Group Series 2022A | 5.00 | 8-15-2028 | 2,015,000 | 2,249,112 | |
| 3,549,017 | |||||
| Nebraska: 0.67% | |||||
| Airport revenue: 0.05% | |||||
| Airport Authority of the City of Lincoln Airport Bonds Series 2021 | 5.00 | 7-1-2028 | 1,000,000 | 1,118,211 | |
| Education revenue: 0.11% | |||||
| Douglas County NE Educational Facilities Creighton University (SIFMA Municipal Swap +0.53%) ± | 1.51 | 7-1-2035 | 2,230,000 | 2,233,605 | |
| Health revenue: 0.17% | |||||
| Douglas County NE Hospital Authority Children's Hospital Obligated Group Series B | 5.00 | 11-15-2053 | 3,250,000 | 3,497,465 | |
| Utilities revenue: 0.34% | |||||
| Central Plains Energy Nebraska Gas Project #1 (Royal Bank of Canada LIQ) | 4.00 | 12-1-2049 | 5,610,000 | 5,763,011 | |
| Central Plains Energy Project Nebraska Refunding Bond Project #3 Series 2012 | 5.00 | 9-1-2042 | 1,075,000 | 1,080,754 | |
| 6,843,765 | |||||
| 13,693,046 | |||||
| Nevada: 0.27% | |||||
| GO revenue: 0.27% | |||||
| Clark County NV School District Series B (AGM Insured) | 5.00 | 6-15-2027 | 5,000,000 | 5,574,614 | |
| New Jersey: 5.22% | |||||
| Airport revenue: 0.27% | |||||
| New Jersey EDA Refunding Bond Port Newark Container Terminal LLC Project | 5.00 | 10-1-2022 | 1,755,000 | 1,763,078 | |
| New Jersey EDA Refunding Bond Port Newark Container Terminal LLC Project | 5.00 | 10-1-2023 | 1,500,000 | 1,534,859 | |
| New Jersey EDA Refunding Bond Port Newark Container Terminal LLC Project | 5.00 | 10-1-2024 | 2,000,000 | 2,078,406 | |
| 5,376,343 | |||||
| Education revenue: 0.12% | |||||
| State of New Jersey Higher Education Student Assistance Authority Student Loan Revenue Bonds Series 2012-1 | 5.00 | 12-1-2022 | 2,500,000 | 2,525,127 | |
| GO revenue: 0.80% | |||||
| New Jersey EDA Series G 144A | 5.25 | 9-1-2023 | 15,000,000 | 15,539,132 |
| Interest rate | Maturity date | Principal | Value | ||
| GO revenue (continued) | |||||
| The Board of Education of the City of Newark New Jersey School Energy Savings Obligation Refunding Bonds Series 2021 (BAM Insured) | 5.00% | 7-15-2027 | $ 350,000 | $ 388,432 | |
| The Board of Education of the City of Newark New Jersey School Energy Savings Obligation Refunding Bonds Series 2021 (BAM Insured) | 5.00 | 7-15-2028 | 350,000 | 392,370 | |
| 16,319,934 | |||||
| Housing revenue: 1.00% | |||||
| New Jersey Housing & Mortgage Finance Agency Single Family Housing Revenue Series B | 2.80 | 10-1-2022 | 4,560,000 | 4,568,655 | |
| New Jersey Housing & Mortgage Finance Agency Single Family Housing Revenue Series B | 2.90 | 4-1-2023 | 5,035,000 | 5,055,953 | |
| New Jersey Housing & Mortgage Finance Agency Single Family Housing Revenue Series B | 2.95 | 10-1-2023 | 4,710,000 | 4,732,180 | |
| New Jersey Housing & Mortgage Finance Agency Single Family Housing Revenue Series B | 3.10 | 4-1-2024 | 2,230,000 | 2,242,483 | |
| New Jersey Housing & Mortgage Finance Agency Single Family Housing Revenue Series B | 3.25 | 4-1-2025 | 2,535,000 | 2,548,448 | |
| New Jersey Housing & Mortgage Finance Agency Single Family Housing Revenue Series D | 2.90 | 10-1-2025 | 1,200,000 | 1,194,221 | |
| 20,341,940 | |||||
| Miscellaneous revenue: 1.85% | |||||
| New Jersey EDA School Facilities Construction Bond Series DDD | 5.00 | 6-15-2023 | 3,000,000 | 3,086,182 | |
| New Jersey EDA School Facilities Construction Bond Series DDD | 5.00 | 6-15-2024 | 2,605,000 | 2,722,674 | |
| New Jersey EDA Series BBB | 5.00 | 6-15-2023 | 4,000,000 | 4,114,910 | |
| New Jersey EDA Transportation Project New Jersey Transit Corporation Project Series B ## | 5.00 | 11-1-2022 | 26,000,000 | 26,300,440 | |
| Tender Option Bond Trust Receipts/Floater Certificates Series 2016-XM0226 (BHAC / NPFGC Insured, Bank of America NA LIQ) 144Aø | 0.95 | 9-11-2025 | 1,500,000 | 1,500,000 | |
| 37,724,206 | |||||
| Tax revenue: 0.11% | |||||
| New Jersey COVID-19 Emergency Series A | 5.00 | 6-1-2027 | 2,000,000 | 2,205,134 | |
| Transportation revenue: 1.07% | |||||
| New Jersey Turnpike Authority Series C-6 (1 Month LIBOR +0.75%) ± | 1.49 | 1-1-2030 | 21,820,000 | 21,824,296 | |
| 106,316,980 | |||||
| New York: 8.08% | |||||
| Airport revenue: 0.79% | |||||
| Albany County NY Airport Authority Airport Revenue Refunding Bonds, Series 2020B | 5.00 | 12-15-2026 | 1,070,000 | 1,152,673 | |
| New York Transportation Development Corporation Terminal 4 John F. Kennedy International Airport Project Series 2020A | 5.00 | 12-1-2026 | 490,000 | 519,116 | |
| New York Transportation Development Corporation Terminal 4 John F. Kennedy International Airport Project Series 2020A | 5.00 | 12-1-2027 | 500,000 | 529,646 |
| Interest rate | Maturity date | Principal | Value | ||
| Airport revenue (continued) | |||||
| New York Transportation Development Corporation Terminal 4 John F. Kennedy International Airport Project Series 2020A | 5.00% | 12-1-2028 | $ 500,000 | $ 530,133 | |
| New York Transportation Development Corporation Terminal 4 John F. Kennedy International Airport Project Series 2020A | 5.00 | 12-1-2029 | 500,000 | 530,304 | |
| New York Transportation Development Corporation Terminal 4 John F. Kennedy International Airport Project Series 2022 | 5.00 | 12-1-2027 | 5,000,000 | 5,296,465 | |
| Port of New York & Port of New Jersey Authority Consolidated Bonds 185th Series AMT | 5.00 | 9-1-2026 | 7,150,000 | 7,463,280 | |
| 16,021,617 | |||||
| Education revenue: 0.24% | |||||
| Hempstead NY Local Development Corporation Education Revenue Refunding Bonds The Academy Charter School Project Series A | 4.05 | 2-1-2031 | 1,000,000 | 885,549 | |
| Hempstead NY Local Development Corporation Education Revenue Refunding Bonds The Academy Charter School Project Series B | 4.76 | 2-1-2027 | 1,640,000 | 1,616,141 | |
| New York Dormitory Authority Iona College Series 2022 | 5.00 | 7-1-2028 | 825,000 | 883,989 | |
| New York Housing Finance Agency Affordable Housing Series K2 | 5.00 | 7-1-2025 | 600,000 | 630,391 | |
| St. Lawrence County NY Industrial Development Clarkson University Project Series B | 1.55 | 9-1-2042 | 1,000,000 | 945,882 | |
| 4,961,952 | |||||
| GO revenue: 0.20% | |||||
| Poughkeepsie Dutchess County NY Public Improvement Refunding Bond | 4.00 | 4-15-2027 | 480,000 | 497,510 | |
| Suffolk County NY Series A (BAM Insured) | 5.00 | 6-15-2028 | 3,215,000 | 3,599,111 | |
| 4,096,621 | |||||
| Health revenue: 0.38% | |||||
| Broome County NY Local Development Corporation Series 2020 (AGM Insured) | 5.00 | 4-1-2026 | 500,000 | 542,824 | |
| Broome County NY Local Development Corporation Series 2020 (AGM Insured) | 5.00 | 4-1-2027 | 950,000 | 1,045,788 | |
| New York Dormitory Authority Montefiore Obligated Group Series 2018A | 5.00 | 8-1-2026 | 1,000,000 | 1,059,373 | |
| New York Dormitory Authority Non State Supported Debt Northwell Health | 5.00 | 5-1-2048 | 4,000,000 | 4,134,124 | |
| Westchester County NY Local Development Corporation Purchase Senior Learning Community Incorporated 144A | 2.88 | 7-1-2026 | 1,000,000 | 933,970 | |
| 7,716,079 | |||||
| Housing revenue: 0.51% | |||||
| New York Housing Development MFHR Bonds Series C3 (Barclays Bank plc SPA) ø | 1.00 | 5-1-2062 | 5,000,000 | 5,000,000 | |
| New York Housing Finance Agency Affordable Housing Revenue Various Sustainability Bonds Series J-2 | 1.10 | 11-1-2061 | 2,500,000 | 2,251,044 | |
| New York Housing Finance Agency Affordable Housing Revenue Various Sustainability Bonds Series K-2 | 1.00 | 11-1-2061 | 500,000 | 456,598 |
| Interest rate | Maturity date | Principal | Value | ||
| Housing revenue (continued) | |||||
| New York NY Housing Development Corporation MFHR AMT Sustainable Neighborhood | 1.75% | 11-1-2023 | $ 400,000 | $ 398,513 | |
| New York NY Housing Development Corporation MFHR AMT Sustainable Neighborhood | 1.80 | 5-1-2024 | 400,000 | 396,851 | |
| New York NY Housing Development Corporation MFHR AMT Sustainable Neighborhood | 1.85 | 11-1-2024 | 400,000 | 395,596 | |
| New York NY Housing Development Corporation MFHR AMT Sustainable Neighborhood | 1.90 | 5-1-2025 | 515,000 | 507,914 | |
| New York NY Housing Development Corporation MFHR AMT Sustainable Neighborhood | 1.95 | 11-1-2025 | 520,000 | 510,676 | |
| New York NY Housing Development Corporation MFHR AMT Sustainable Neighborhood | 2.00 | 5-1-2026 | 535,000 | 520,904 | |
| 10,438,096 | |||||
| Industrial development revenue: 1.51% | |||||
| New York Transportation Development Corporation Special Facilities Revenue Delta Airlines Incorporated LaGuardia Airport Terminals C&D Redevelopment Project | 5.00 | 1-1-2024 | 7,205,000 | 7,327,097 | |
| New York Transportation Development Corporation Special Facilities Revenue Delta Airlines Incorporated LaGuardia Airport Terminals C&D Redevelopment Project | 5.00 | 1-1-2025 | 22,925,000 | 23,440,063 | |
| 30,767,160 | |||||
| Miscellaneous revenue: 0.18% | |||||
| New York Liberty Development Corporation Tax-Exempt Liberty Revenue Refunding Bonds Series 2021A | 1.20 | 11-15-2028 | 2,500,000 | 2,116,122 | |
| New York NY IDA Refunding Bonds Series 2021A (AGM Insured) | 5.00 | 1-1-2024 | 1,250,000 | 1,299,903 | |
| Public Housing Capital Fund Trust I (Department of Housing and Urban Development Insured) 144A | 4.50 | 7-1-2022 | 115,355 | 115,355 | |
| Public Housing Capital Fund Trust II (Department of Housing and Urban Development Insured) 144A | 4.50 | 7-1-2022 | 39,100 | 39,102 | |
| 3,570,482 | |||||
| Tax revenue: 1.44% | |||||
| New York NY Transitional Finance Authority Subordinate Bond Series 1-B (SIFMA Municipal Swap +0.80%) ± | 1.78 | 11-1-2022 | 4,975,000 | 4,989,792 | |
| Tender Option Bond Trust Receipts/Certificates Series 2021-XF1125 (Deutsche Bank LIQ) 144Aø | 1.04 | 5-15-2051 | 1,195,500 | 1,195,500 | |
| Triborough Bridge & Tunnel Authority Payroll Mobility Tax Senior Lien Series A | 2.00 | 5-15-2045 | 6,000,000 | 5,704,009 | |
| Triborough Bridge & Tunnel Authority Payroll Mobility Tax Senior Lien Series B %% | 5.00 | 5-15-2026 | 15,000,000 | 16,378,944 | |
| Triborough Bridge & Tunnel Authority Series 2022B %% | 5.00 | 5-15-2024 | 1,000,000 | 1,050,975 | |
| 29,319,220 | |||||
| Transportation revenue: 2.26% | |||||
| New York Metropolitan Transportation Authority BAN | 5.00 | 2-1-2023 | 10,400,000 | 10,576,988 | |
| New York Metropolitan Transportation Authority Refunding Green Bonds Series D1 | 5.00 | 11-15-2034 | 5,000,000 | 5,219,146 | |
| New York Metropolitan Transportation Authority Subordinate Bond Series D2 (SIFMA Municipal Swap +0.45%) ± | 1.43 | 11-15-2044 | 22,545,000 | 22,481,500 |
| Interest rate | Maturity date | Principal | Value | ||
| Transportation revenue (continued) | |||||
| New York Metropolitan Transportation Authority Transportation Revenue Refunding Bonds Series 2017D | 5.00% | 11-15-2026 | $ 4,475,000 | $ 4,792,284 | |
| Triborough Bridge and Tunnel Authority Revenue Refunding Bonds 2013A | 5.00 | 11-15-2026 | 2,770,000 | 2,839,529 | |
| 45,909,447 | |||||
| Utilities revenue: 0.45% | |||||
| Long Island Power Authority Electric System General Revenue Bonds Series B øø | 1.50 | 9-1-2051 | 3,500,000 | 3,314,523 | |
| Long Island Power Authority Electric System General Revenve Bonds Series B øø | 1.65 | 9-1-2049 | 6,000,000 | 5,891,459 | |
| 9,205,982 | |||||
| Water & sewer revenue: 0.12% | |||||
| New York City Municipal Water Finance Authority Water & Sewer System Series DD | 5.00 | 6-15-2026 | 2,225,000 | 2,451,697 | |
| 164,458,353 | |||||
| North Carolina: 0.72% | |||||
| Health revenue: 0.20% | |||||
| Charlotte Mecklenburg Hospital Authority North Carolina Health Care System Atrium Health Series E øø | 0.80 | 1-15-2048 | 1,500,000 | 1,418,927 | |
| North Carolina Medical Care Commission Health Care Facilities First Mortgage Lutheran Services Series A | 5.00 | 3-1-2026 | 245,000 | 246,773 | |
| North Carolina Medical Care Commission Health Care Facilities First Mortgage Lutheran Services Series A | 5.00 | 3-1-2027 | 295,000 | 295,830 | |
| North Carolina Medical Care Commission Health Care Facilities First Mortgage Lutheran Services Series A | 5.00 | 3-1-2028 | 305,000 | 304,534 | |
| North Carolina Medical Care Commission Retirement Facilities Entrance Fee Series 2020B-2 | 2.30 | 9-1-2025 | 1,250,000 | 1,184,356 | |
| North Carolina Medical Care Commission Retirement Facilities First Mortgage Series 2020B-2 | 2.50 | 10-1-2024 | 740,000 | 717,663 | |
| 4,168,083 | |||||
| Industrial development revenue: 0.05% | |||||
| Columbus County Industrial Facilities & PCFA Environmental Improvement Revenue Refunding Bond International Paper Company Project Series A | 2.00 | 11-1-2033 | 1,000,000 | 975,605 | |
| Resource recovery revenue: 0.37% | |||||
| North Carolina Capital Finance Republic Services Incorporated Project Series 2013 | 2.60 | 6-1-2038 | 7,500,000 | 7,501,689 | |
| Transportation revenue: 0.10% | |||||
| North Carolina Turnpike Authority Triangle Expressway System Series 2020 | 5.00 | 2-1-2024 | 2,000,000 | 2,082,118 | |
| 14,727,495 | |||||
| North Dakota: 0.17% | |||||
| Health revenue: 0.17% | |||||
| Grand Forks ND Health Care System Revenue Bonds Altru Health System Series 2021 | 5.00 | 12-1-2025 | 165,000 | 175,688 |
| Interest rate | Maturity date | Principal | Value | ||
| Health revenue (continued) | |||||
| Grand Forks ND Health Care System Revenue Bonds Altru Health System Series 2021 | 5.00% | 12-1-2026 | $ 225,000 | $ 242,367 | |
| Grand Forks ND Health Care System Revenue Bonds Altru Health System Series 2021 | 5.00 | 12-1-2027 | 1,125,000 | 1,219,157 | |
| Grand Forks ND Health Care System Revenue Bonds Altru Health System Series 2021 | 5.00 | 12-1-2028 | 1,650,000 | 1,794,219 | |
| 3,431,431 | |||||
| Ohio: 1.71% | |||||
| GO revenue: 0.16% | |||||
| Lake County OH Building Improvement BAN Series 2022 | 1.25 | 1-12-2023 | 3,300,000 | 3,290,889 | |
| Health revenue: 0.20% | |||||
| Hamilton County OH Hospital Facilities UC Health Series 2020 | 5.00 | 9-15-2026 | 655,000 | 708,266 | |
| Ohio Hospital Revenue Bonds Series 2020 | 5.00 | 11-15-2025 | 265,000 | 282,252 | |
| Ohio University Hospital Health System Series B | 5.00 | 1-15-2050 | 2,905,000 | 3,090,829 | |
| 4,081,347 | |||||
| Industrial development revenue: 0.18% | |||||
| Ohio Air Quality Development Authority Ohio Valley Electric Corporation Series A | 2.88 | 2-1-2026 | 3,750,000 | 3,591,156 | |
| Miscellaneous revenue: 0.04% | |||||
| Dayton OH City School District Certificate of Participation School Facilities Project | 3.00 | 12-1-2026 | 180,000 | 182,851 | |
| Dayton OH City School District Certificate of Participation School Facilities Project | 3.00 | 12-1-2027 | 270,000 | 272,969 | |
| Dayton OH City School District Certificate of Participation School Facilities Project | 4.00 | 12-1-2028 | 230,000 | 246,132 | |
| 701,952 | |||||
| Resource recovery revenue: 0.57% | |||||
| Ohio Air Quality Development Authority Refunding Bond American Electric Power Company Project | 1.90 | 5-1-2026 | 12,000,000 | 11,602,751 | |
| Tax revenue: 0.29% | |||||
| Akron OH Community Learning Centers Income Tax Revenue Refunding Bonds Series 2022 | 4.00 | 12-1-2028 | 2,000,000 | 2,152,438 | |
| Akron OH Community Learning Centers Income Tax Revenue Refunding Bonds Series 2022 | 4.00 | 12-1-2027 | 3,540,000 | 3,801,963 | |
| 5,954,401 | |||||
| Utilities revenue: 0.27% | |||||
| American Municipal Power Ohio Incorporated Fremont Energy Center | 5.00 | 2-15-2027 | 400,000 | 444,624 | |
| American Municipal Power Ohio Incorporated Fremont Energy Center | 5.00 | 2-15-2029 | 350,000 | 398,554 | |
| American Municipal Power Ohio Incorporated Hydroelectric Projects Series A | 5.00 | 2-15-2025 | 1,200,000 | 1,287,975 |
| Interest rate | Maturity date | Principal | Value | ||
| Utilities revenue (continued) | |||||
| American Municipal Power Ohio Incorporated Hydroelectric Projects Series A | 5.00% | 2-15-2026 | $ 1,500,000 | $ 1,640,751 | |
| American Municipal Power Ohio Incorporated Hydroelectric Projects Series A | 5.00 | 2-15-2027 | 1,600,000 | 1,778,495 | |
| 5,550,399 | |||||
| 34,772,895 | |||||
| Oklahoma: 1.12% | |||||
| Education revenue: 0.03% | |||||
| Oklahoma Development Finance Authority Refunding Bond Oklahoma City University Project | 4.00 | 8-1-2022 | 535,000 | 535,487 | |
| GO revenue: 0.15% | |||||
| Oklahoma County OK Independent School District #52 Series A | 3.00 | 1-1-2023 | 3,135,000 | 3,157,513 | |
| Health revenue: 0.17% | |||||
| Oklahoma Development Finance Authority Health System Revenue ø | 1.20 | 8-15-2031 | 1,850,000 | 1,850,000 | |
| Oklahoma Development Finance Authority Oklahoma University Medicine Project Series B | 5.00 | 8-15-2022 | 500,000 | 500,492 | |
| Oklahoma Development Finance Authority Oklahoma University Medicine Project Series B | 5.00 | 8-15-2023 | 500,000 | 502,442 | |
| Oklahoma Development Finance Authority Oklahoma University Medicine Project Series B | 5.00 | 8-15-2024 | 600,000 | 601,621 | |
| 3,454,555 | |||||
| Miscellaneous revenue: 0.73% | |||||
| Kay County OK Public Buildings Authority | 2.25 | 4-1-2024 | 720,000 | 707,285 | |
| Kay County OK Public Buildings Authority | 2.25 | 4-1-2025 | 735,000 | 710,654 | |
| Kay County OK Public Buildings Authority | 2.38 | 4-1-2026 | 750,000 | 714,658 | |
| Kingfisher OK Special Projects Authority Educational Facilities Kingfisher Public Schools Project | 4.00 | 3-1-2026 | 2,005,000 | 2,102,804 | |
| Mcintosh County OK Educational Facilities Authority Revenue Bonds Series 2022 | 2.00 | 9-1-2027 | 415,000 | 392,620 | |
| Oklahoma County OK Finance Authority Educational Facilities Jones Public Schools Project | 4.00 | 9-1-2025 | 550,000 | 569,999 | |
| Oklahoma County OK Finance Authority Educational Facilities Jones Public Schools Project | 4.00 | 9-1-2026 | 590,000 | 615,421 | |
| Ottawa County OK Educational Facilities Authority Educational Facilities Lease Miami Public Schools Project | 5.00 | 9-1-2023 | 830,000 | 855,354 | |
| Ottawa County OK Educational Facilities Authority Educational Facilities Lease Miami Public Schools Project | 5.00 | 9-1-2024 | 1,080,000 | 1,136,120 | |
| Ottawa County OK Educational Facilities Authority Educational Facilities Lease Miami Public Schools Project | 5.00 | 9-1-2025 | 930,000 | 995,207 | |
| Tulsa County OK Industrial Authority Educational Broken Arrow Public Schools Project | 5.00 | 9-1-2025 | 3,000,000 | 3,107,711 |
| Interest rate | Maturity date | Principal | Value | ||
| Miscellaneous revenue (continued) | |||||
| Wagoner County OK School Development Authority Wagoner Public Schools Project | 4.00% | 9-1-2025 | $ 1,255,000 | $ 1,297,176 | |
| Weatherford OK Industrial Trust Educational Facilities Lease Weatherford Public Schools Project | 5.00 | 3-1-2027 | 1,475,000 | 1,612,935 | |
| 14,817,944 | |||||
| Tax revenue: 0.04% | |||||
| Jackson County OK Facilities Authority Sales Tax Revenue Bonds Series 2022 | 4.00 | 10-1-2027 | 810,000 | 851,680 | |
| 22,817,179 | |||||
| Oregon: 0.16% | |||||
| Airport revenue: 0.07% | |||||
| Port of Portland International Airport Series C | 5.00 | 7-1-2026 | 1,240,000 | 1,335,561 | |
| GO revenue: 0.04% | |||||
| Port of Morrow County OR Full Faith Refunding Bond Series A | 4.00 | 6-1-2026 | 345,000 | 361,783 | |
| Port of Morrow County OR Full Faith Refunding Bond Series A | 4.00 | 6-1-2027 | 535,000 | 563,972 | |
| 925,755 | |||||
| Health revenue: 0.05% | |||||
| Multnomah County OR Hospital Facilities Authority Revenue Refunding Bonds Terwilliger Plaza Parkview | 0.95 | 6-1-2027 | 1,200,000 | 1,060,654 | |
| 3,321,970 | |||||
| Pennsylvania: 7.35% | |||||
| Airport revenue: 1.06% | |||||
| Allegheny County PA Airport Authority Airport Revenue Bonds, Series 2021A | 5.00 | 1-1-2026 | 1,600,000 | 1,709,423 | |
| Allegheny County PA Airport Authority Airport Revenue Bonds, Series 2021A | 5.00 | 1-1-2027 | 2,000,000 | 2,163,545 | |
| Allegheny County PA Airport Authority Airport Revenue Bonds, Series 2021A | 5.00 | 1-1-2028 | 2,000,000 | 2,185,346 | |
| Philadelphia PA Airport Revenue Refunding Bonds Series 2015A | 5.00 | 6-15-2023 | 1,410,000 | 1,447,153 | |
| Philadelphia PA Airport Revenue Refunding Bonds Series 2020A | 5.00 | 7-1-2026 | 1,160,000 | 1,265,374 | |
| Philadelphia PA Airport Revenue Refunding Bonds Series 2020A | 5.00 | 7-1-2027 | 1,400,000 | 1,545,442 | |
| Philadelphia PA Airport Revenue Refunding Bonds Series 2020C | 5.00 | 7-1-2024 | 10,745,000 | 11,232,206 | |
| 21,548,489 | |||||
| Education revenue: 0.89% | |||||
| Cumberland County PA Authority Association of Independent Colleges & Universities of Pennsylvania Financing Program Series T-1 | 3.15 | 5-1-2044 | 3,500,000 | 3,525,708 | |
| Huntingdon County PA General Authority Juniata College Project Series 2021-TT3 | 5.00 | 10-1-2027 | 385,000 | 413,883 | |
| Huntingdon County PA General Authority Juniata College Project Series 2021-TT3 | 5.00 | 10-1-2028 | 415,000 | 445,470 |
| Interest rate | Maturity date | Principal | Value | ||
| Education revenue (continued) | |||||
| Lehigh County PA General Purpose Authority (SIFMA Municipal Swap +0.58%) ± | 1.56% | 11-1-2037 | $10,050,000 | $ 10,036,278 | |
| Lehigh County PA General Purpose Authority Charter School Revenue Bonds Series 2022 | 4.00 | 6-1-2026 | 505,000 | 513,035 | |
| Lehigh County PA General Purpose Authority Charter School Revenue Bonds Series 2022 | 4.00 | 6-1-2028 | 1,090,000 | 1,100,381 | |
| Pennsylvania Higher Education Assistance Agency Education Loan Series A | 5.00 | 6-1-2026 | 1,475,000 | 1,589,730 | |
| Pennsylvania Higher Education Assistance Agency Education Loan Series A | 5.00 | 6-1-2028 | 500,000 | 539,747 | |
| 18,164,232 | |||||
| GO revenue: 1.25% | |||||
| Albert Gallatin School District Series A (AGM Insured) | 4.00 | 9-1-2025 | 1,130,000 | 1,187,472 | |
| Albert Gallatin School District Series B (AGM Insured) | 4.00 | 9-1-2025 | 350,000 | 367,801 | |
| Butler PA Area School District (AGM Insured) | 5.00 | 10-1-2023 | 1,280,000 | 1,331,381 | |
| Butler PA Area School District (AGM Insured) | 5.00 | 10-1-2024 | 2,965,000 | 3,136,742 | |
| Butler PA Area School District (AGM Insured) | 5.00 | 10-1-2025 | 4,695,000 | 5,061,412 | |
| Canon-McMillan School District PA GO Bonds, Series B of 2014 (AGM Insured) | 4.50 | 12-15-2028 | 2,000,000 | 2,045,605 | |
| Coatesville PA Area School District (AGM Insured) | 5.00 | 8-1-2023 | 1,000,000 | 1,032,982 | |
| Dunmore PA Series A (AGM Insured) | 2.00 | 9-1-2025 | 220,000 | 213,905 | |
| Dunmore PA Series A (AGM Insured) | 2.00 | 9-1-2027 | 200,000 | 187,125 | |
| Dunmore PA Series A (AGM Insured) | 2.00 | 9-1-2028 | 220,000 | 200,380 | |
| Laurel Highlands School District Series A (BAM Insured) | 4.00 | 2-1-2027 | 1,325,000 | 1,402,467 | |
| Oil City Venango County GO Bonds Series A of 2021 (AGM Insured) | 4.00 | 12-1-2026 | 200,000 | 211,797 | |
| Oil City Venango County GO Bonds Series A of 2021 (AGM Insured) | 4.00 | 12-1-2027 | 195,000 | 207,402 | |
| Oil City Venango County GO Bonds Series A of 2021 (AGM Insured) | 4.00 | 12-1-2028 | 200,000 | 213,371 | |
| Peoria PA GO Series 2016B | 5.00 | 1-1-2023 | 715,000 | 725,558 | |
| Philadelphia PA School District Refunding Bond | 5.00 | 9-1-2023 | 4,500,000 | 4,654,211 | |
| Philadelphia PA School District Series A | 5.00 | 9-1-2022 | 1,000,000 | 1,005,575 | |
| Philadelphia PA School District Series A | 5.00 | 9-1-2024 | 800,000 | 845,200 | |
| Scranton PA School District Series A | 5.00 | 6-1-2023 | 835,000 | 857,362 | |
| Scranton PA School District Series B (NPFGC Insured) | 5.00 | 6-1-2023 | 615,000 | 632,032 | |
| 25,519,780 | |||||
| Health revenue: 1.26% | |||||
| Allegheny County PA Hospital Development Authority Series 2017D-2 (SIFMA Municipal Swap +0.70%) ± | 1.68 | 11-15-2047 | 6,000,000 | 5,981,344 | |
| Berks County PA IDA Health System Revenue Bonds 2017 | 5.00 | 11-1-2022 | 250,000 | 251,351 | |
| Berks County PA IDA Health System Tower Health Project | 5.00 | 11-1-2023 | 1,000,000 | 1,016,112 | |
| Berks County PA IDA Health System Tower Health Project | 5.00 | 11-1-2024 | 1,000,000 | 1,014,384 | |
| Berks County PA Municipal Authority Revenue Bonds Series 2020A | 5.00 | 2-1-2023 | 1,300,000 | 1,311,300 | |
| Geisinger Authority Health System Series B | 5.00 | 4-1-2043 | 10,000,000 | 10,820,950 | |
| Montgomery County PA Higher Education & Health Authority Thomas Jefferson University Series A | 5.00 | 9-1-2023 | 1,050,000 | 1,086,595 |
| Interest rate | Maturity date | Principal | Value | ||
| Health revenue (continued) | |||||
| Philadelphia PA Hospitals & HEFAR Temple University Health System | 5.00% | 7-1-2022 | $ 2,000,000 | $ 2,000,000 | |
| Southcentral Pennsylvania General Authority Wellspan Health Obligation Group | 5.00 | 6-1-2027 | 2,085,000 | 2,193,367 | |
| 25,675,403 | |||||
| Housing revenue: 1.64% | |||||
| Pennsylvania HFA Limited Norris Homes Phase V | 1.40 | 1-1-2043 | 10,000,000 | 9,961,303 | |
| Pennsylvania HFA Single Family Series 125A | 2.38 | 10-1-2025 | 11,050,000 | 10,940,339 | |
| Pennsylvania HFA Single Family Series 137 | 5.00 | 10-1-2024 | 265,000 | 280,946 | |
| Pennsylvania HFA Single Family Series 137 | 5.00 | 10-1-2025 | 220,000 | 237,669 | |
| Pennsylvania HFA Single Family Series 137 | 5.00 | 4-1-2026 | 240,000 | 260,734 | |
| Pennsylvania Housing Finance Agency MFHR Sherman Hills Series 2022 (Department of Housing and Urban Development Insured) | 1.25 | 2-1-2025 | 7,000,000 | 6,848,529 | |
| Pennsylvania Housing Finance Agency Single Family Mortgage AMT Series 128A | 4.75 | 4-1-2033 | 4,670,000 | 4,803,228 | |
| 33,332,748 | |||||
| Industrial development revenue: 0.12% | |||||
| Lehigh County PA IDA Electric Utilities Corporation Series B | 1.80 | 2-15-2027 | 2,500,000 | 2,498,622 | |
| Miscellaneous revenue: 0.61% | |||||
| Pennsylvania EDFA Revenue Bonds Series 2015 | 5.00 | 6-30-2024 | 4,500,000 | 4,656,922 | |
| Pennsylvania EDFA Sewage Sludge Disposal Series 2020 | 3.00 | 1-1-2025 | 505,000 | 505,097 | |
| Pennsylvania EDFA Sewage Sludge Disposal Series 2020 | 4.00 | 1-1-2026 | 615,000 | 632,681 | |
| Pittsburgh & Allegheny Counties Sports & Exhibition Authority Series 2020 (AGM Insured) | 4.00 | 2-1-2024 | 1,700,000 | 1,749,298 | |
| Pittsburgh & Allegheny Counties Sports & Exhibition Authority Series 2020 (AGM Insured) | 5.00 | 2-1-2026 | 2,000,000 | 2,166,763 | |
| State Public School Building Authority Prerefunded Bond Series A (AGM Insured) | 5.00 | 12-1-2023 | 375,000 | 391,085 | |
| State Public School Building Authority Prerefunded Bond Series A (AGM Insured) | 5.00 | 12-1-2023 | 2,130,000 | 2,222,879 | |
| 12,324,725 | |||||
| Resource recovery revenue: 0.15% | |||||
| Pennsylvania EDFA Solid Waste Disposal Republic Services Incorporated Project Series 2014A | 1.90 | 6-1-2044 | 3,000,000 | 3,000,000 | |
| Tax revenue: 0.08% | |||||
| Allentown PA Neighborhood Improvement Zone Development Authority Tax Revenue Refunding Bonds Series 2022 | 5.00 | 5-1-2026 | 500,000 | 528,973 | |
| Allentown PA Neighborhood Improvement Zone Development Authority Tax Revenue Refunding Bonds Series 2022 | 5.00 | 5-1-2027 | 500,000 | 533,138 | |
| Allentown PA Neighborhood Improvement Zone Development Authority Tax Revenue Refunding Bonds Series 2022 | 5.00 | 5-1-2028 | 500,000 | 534,662 | |
| 1,596,773 | |||||
| Transportation revenue: 0.23% | |||||
| Lancaster PA Parking Authority Series A (BAM Insured) | 4.00 | 9-1-2025 | 530,000 | 552,352 |
| Interest rate | Maturity date | Principal | Value | ||
| Transportation revenue (continued) | |||||
| Lancaster PA Parking Authority Series A (BAM Insured) | 4.00% | 9-1-2026 | $ 545,000 | $ 572,534 | |
| Pennsylvania Turnpike Commission Series B (SIFMA Municipal Swap +0.70%) ± | 1.68 | 12-1-2023 | 2,880,000 | 2,881,627 | |
| Pennsylvania Turnpike Commission Series B 2020 | 5.00 | 12-1-2025 | 300,000 | 326,436 | |
| Pennsylvania Turnpike Commission Series B 2020 | 5.00 | 12-1-2026 | 350,000 | 387,961 | |
| 4,720,910 | |||||
| Water & sewer revenue: 0.06% | |||||
| Allegheny County Sanitary Authority Sewer Revenue Series A 2020 | 5.00 | 6-1-2026 | 850,000 | 932,260 | |
| Allegheny County Sanitary Authority Sewer Revenue Series A 2020 | 5.00 | 6-1-2027 | 300,000 | 333,829 | |
| 1,266,089 | |||||
| 149,647,771 | |||||
| Rhode Island: 0.46% | |||||
| Education revenue: 0.06% | |||||
| Rhode Island Student Loan Authority AMT Series A | 5.00 | 12-1-2023 | 1,175,000 | 1,220,900 | |
| Miscellaneous revenue: 0.40% | |||||
| Rhode Island & Providence Plantations Consolidated Capital Development Series A | 5.00 | 8-1-2023 | 8,045,000 | 8,067,089 | |
| 9,287,989 | |||||
| South Carolina: 0.25% | |||||
| Utilities revenue: 0.25% | |||||
| Piedmont SC Municipal Power Agency (NPFGC Insured) | 5.38 | 1-1-2025 | 4,645,000 | 4,987,706 | |
| Tennessee: 3.06% | |||||
| Health revenue: 0.42% | |||||
| Greeneville TN Health and Educational Ballad Health Series A | 5.00 | 7-1-2023 | 1,600,000 | 1,648,185 | |
| Knox County TN Health Educational & Housing Facility University Health System Incorporate | 5.00 | 4-1-2024 | 1,000,000 | 1,042,131 | |
| Tender Option Bond Trust Receipts/Certificates Series 2015-XF1023 (Barclays Bank plc LOC, Barclays Bank plc LIQ) 144Aøø | 0.95 | 1-1-2045 | 5,910,000 | 5,910,000 | |
| 8,600,316 | |||||
| Housing revenue: 0.39% | |||||
| Metropolitan Government Nashville & Davidson County TN Health & Educational Facilities Board Richland Hills Apartments Project (Department of Housing and Urban Development Insured) | 1.25 | 12-1-2024 | 8,000,000 | 7,872,260 | |
| Utilities revenue: 2.25% | |||||
| Memphis TN Light, Gas & Water Division Series 2020A | 5.00 | 12-1-2025 | 600,000 | 654,312 | |
| Memphis TN Light, Gas & Water Division Series 2020A | 5.00 | 12-1-2026 | 600,000 | 665,607 | |
| Memphis TN Light, Gas & Water Division Series 2020A | 5.00 | 12-1-2027 | 450,000 | 507,117 |
| Interest rate | Maturity date | Principal | Value | ||
| Utilities revenue (continued) | |||||
| Tennessee Energy Acquisition Corporation Gas Project Series 2017A | 4.00% | 5-1-2048 | $35,840,000 | $ 36,279,456 | |
| Tennessee Energy Acquisition Corporation Gas Project Series 2018 | 4.00 | 11-1-2049 | 7,500,000 | 7,615,795 | |
| 45,722,287 | |||||
| 62,194,863 | |||||
| Texas: 9.18% | |||||
| Airport revenue: 1.47% | |||||
| Austin TX Airport System Revenue Refunding Bonds Series 2019 | 5.00 | 11-15-2025 | 1,500,000 | 1,611,590 | |
| Dallas-Fort Worth TX International Airport Joint Revenue Refunding Bonds Series 2021B | 5.00 | 11-1-2026 | 2,850,000 | 3,126,063 | |
| Dallas-Fort Worth TX International Airport Series A | 5.00 | 11-1-2025 | 1,000,000 | 1,079,340 | |
| Dallas-Fort Worth TX International Airport Series B | 5.00 | 11-1-2023 | 500,000 | 505,663 | |
| El Paso TX Airport Series 2018 | 5.00 | 8-15-2025 | 3,110,000 | 3,322,700 | |
| Houston TX Airport System Refunding Bond Subordinated Lien Bond Series 2020A | 5.00 | 7-1-2026 | 1,000,000 | 1,079,021 | |
| Houston TX Airport System Refunding Bond Subordinated Lien Bond Series 2020A | 5.00 | 7-1-2027 | 1,000,000 | 1,091,216 | |
| Houston TX Airport System Refunding Bond Subordinated Lien Bond Series 2020B | 5.00 | 7-1-2026 | 1,500,000 | 1,636,260 | |
| Houston TX Airport System Refunding Bond Subordinated Lien Bond Series 2020B | 5.00 | 7-1-2027 | 3,000,000 | 3,311,662 | |
| Houston TX Airport System Refunding Bond Subordinated Lien Bond Series A | 5.00 | 7-1-2024 | 3,620,000 | 3,620,000 | |
| Houston TX Airport System Refunding Bond Subordinated Lien Bond Series B | 5.00 | 7-1-2027 | 6,090,000 | 6,090,000 | |
| Love Field Airport Modernization Corporation Texas General Airport Revenue Refunding Bonds Series 2021 | 5.00 | 11-1-2026 | 3,250,000 | 3,502,712 | |
| 29,976,227 | |||||
| Education revenue: 0.40% | |||||
| Arlington TX Higher Education Finance Corporation Education Revenue Bonds Series 2021A | 4.00 | 2-15-2027 | 350,000 | 369,012 | |
| Arlington TX Higher Education Finance Corporation Education Revenue Bonds Series 2021A | 4.00 | 2-15-2028 | 290,000 | 306,305 | |
| Clifton TX Higher Education Finance Corporation Education International Leadership Series D | 5.00 | 8-15-2022 | 1,000,000 | 1,001,608 | |
| Clifton TX Higher Education Finance Corporation Education International Leadership Series D | 5.00 | 8-15-2023 | 1,510,000 | 1,528,157 | |
| Clifton TX Higher Education Finance Corporation Education International Leadership Series D | 5.00 | 8-15-2024 | 3,125,000 | 3,177,393 | |
| Clifton TX Higher Education Revenue Bonds Series 2021T | 5.00 | 8-15-2025 | 360,000 | 382,517 | |
| Clifton TX Higher Education Revenue Bonds Series 2021T | 5.00 | 8-15-2027 | 500,000 | 542,736 | |
| Clifton TX Higher Education Revenue Bonds Series 2021T | 5.00 | 8-15-2028 | 300,000 | 327,306 | |
| Odessa TX College District Consolidated Fund Revenue Bonds Series 2021 (AGM Insured) | 4.00 | 7-1-2028 | 400,000 | 426,989 | |
| 8,062,023 |
| Interest rate | Maturity date | Principal | Value | ||
| GO revenue: 3.09% | |||||
| Andrews County Texas Hospital District Refunding Bond | 5.00% | 3-15-2027 | $ 1,750,000 | $ 1,913,864 | |
| Denton TX Independent School District Bonds Series 2014-B | 2.00 | 8-1-2044 | 550,000 | 545,072 | |
| Denton TX Independent School District Bonds Series 2014-B | 2.00 | 8-1-2044 | 3,520,000 | 3,477,231 | |
| Eanes TX Independent School District School Building Series B | 1.75 | 8-1-2039 | 7,465,000 | 7,311,606 | |
| Fort Bend TX Independent School District Various Refunding Series B øø | 0.72 | 8-1-2051 | 1,500,000 | 1,377,708 | |
| Hays Consolidated Independent School District Texas School Building Bonds Series 2018B | 2.70 | 8-15-2042 | 2,370,000 | 2,373,216 | |
| Hays Consolidated Independent School District Texas School Building Bonds Series 2018B | 2.70 | 8-15-2042 | 4,395,000 | 4,401,062 | |
| Hays TX School District Unlimited Tax School Building Series B | 2.70 | 8-15-2042 | 605,000 | 605,814 | |
| Houston TX Public Improvement Series A | 5.00 | 3-1-2023 | 3,500,000 | 3,578,466 | |
| Leander TX Independent School District Refunding CAB ¤ | 0.00 | 8-15-2023 | 1,065,000 | 1,044,038 | |
| McAllen TX Independent School District Series A | 5.00 | 2-15-2024 | 2,620,000 | 2,675,889 | |
| North East Independent School District Texas Series 2017 | 2.38 | 8-1-2047 | 7,135,000 | 7,140,883 | |
| North East Independent School District Texas Series 2019 | 2.20 | 8-1-2049 | 4,800,000 | 4,786,858 | |
| Northside Texas Independent School District School Building Bond Series 2018 | 2.75 | 8-1-2048 | 20,305,000 | 20,635,458 | |
| Port Arthur TX Jefferson and Orange Counties Combination Tax and Revenue Certificates of Obligation Series 2021 (BAM Insured) | 5.00 | 2-15-2028 | 365,000 | 408,100 | |
| Port Arthur TX Jefferson and Orange Counties Series 2021 (BAM Insured) | 5.00 | 2-15-2026 | 290,000 | 315,634 | |
| Port Arthur TX Jefferson and Orange Counties Series 2021 (BAM Insured) | 5.00 | 2-15-2027 | 310,000 | 342,587 | |
| 62,933,486 | |||||
| Health revenue: 0.54% | |||||
| Harris County TX Cultural Education Facilities Finance Corporation Hospital Memorial Hermann Health System (SIFMA Municipal Swap +0.57%) ± | 1.55 | 12-1-2049 | 11,000,000 | 10,967,182 | |
| Housing revenue: 1.05% | |||||
| Alamito TX Public Facilities Corporation MFHR Housing Authority of El Paso Rental Assistance Demonstration Conversion Program (Department of Housing and Urban Development Insured) | 2.90 | 5-1-2037 | 8,400,000 | 8,425,959 | |
| Dallas TX Housing Finance Corporation MFHR Estates at Shiloh | 1.25 | 7-1-2037 | 7,000,000 | 6,937,378 | |
| Odessa TX Housing Finance Corporation MFHR Vera Odessa Apartments (FHA Insured) øø | 0.35 | 9-1-2023 | 6,000,000 | 5,916,761 | |
| 21,280,098 | |||||
| Industrial development revenue: 0.08% | |||||
| Port of Beaumont Navigation District Jefferson County Dock and Wharf Facility Revenue Bonds Series 2021A 144A | 1.88 | 1-1-2026 | 800,000 | 736,786 |
| Interest rate | Maturity date | Principal | Value | ||
| Industrial development revenue (continued) | |||||
| Port of Beaumont Navigation District Jefferson County Dock and Wharf Facility Revenue Bonds Series 2021A 144A | 2.00% | 1-1-2027 | $ 525,000 | $ 472,384 | |
| Port of Beaumont Navigation District Jefferson County Dock and Wharf Facility Revenue Bonds Series 2021A 144A | 2.13 | 1-1-2028 | 575,000 | 505,628 | |
| 1,714,798 | |||||
| Tax revenue: 0.25% | |||||
| Baytown TX Municipal Development District Combination Limited Sales Tax Revenue and Third-Lien Hotel Revenue Bonds Series 2021C | 5.00 | 10-1-2025 | 480,000 | 518,862 | |
| Baytown TX Municipal Development District Combination Limited Sales Tax Revenue and Third-Lien Hotel Revenue Bonds Series 2021C | 5.00 | 10-1-2026 | 510,000 | 560,358 | |
| Baytown TX Municipal Development District Combination Limited Sales Tax Revenue and Third-Lien Hotel Revenue Bonds Series 2021C | 5.00 | 10-1-2027 | 845,000 | 940,956 | |
| Old Spanish Trail Almeda Corridors RDA Texas Refunding Bond Tax Increment Contract | 5.00 | 9-1-2025 | 2,805,000 | 3,016,659 | |
| 5,036,835 | |||||
| Utilities revenue: 1.40% | |||||
| Lower Colorado River Authority Refunding Bond | 5.00 | 5-15-2027 | 2,000,000 | 2,221,014 | |
| Lower Colorado River Authority Series 2022 (AGM Insured) | 5.00 | 5-15-2027 | 1,385,000 | 1,538,052 | |
| Lower Colorado River Authority Series 2022 (AGM Insured) | 5.00 | 5-15-2028 | 2,285,000 | 2,574,440 | |
| San Antonio TX Electric & Gas Systems Various Revenue Refunding Bonds Junior Lien Series 2020 | 1.75 | 2-1-2049 | 11,500,000 | 11,119,500 | |
| Texas Municipal Gas Acquisition & Supply Corporation Series A (SIFMA Municipal Swap +0.55%) ± | 1.53 | 9-15-2027 | 8,515,000 | 8,367,736 | |
| Texas Municipal Power Agency Transmission System Series 2021 (AGM Insured) | 3.00 | 9-1-2026 | 950,000 | 967,586 | |
| Texas Municipal Power Agency Transmission System Series 2021 (AGM Insured) | 3.00 | 9-1-2027 | 1,600,000 | 1,621,288 | |
| 28,409,616 | |||||
| Water & sewer revenue: 0.90% | |||||
| San Antonio TX Water System Junior Lien Series A | 2.63 | 5-1-2049 | 12,490,000 | 12,474,818 | |
| San Antonio TX Water System Junior Lien Series B | 2.00 | 5-1-2044 | 5,930,000 | 5,927,094 | |
| 18,401,912 | |||||
| 186,782,177 | |||||
| Utah: 0.47% | |||||
| Airport revenue: 0.45% | |||||
| Salt Lake City UT International Airport Series A | 5.00 | 7-1-2023 | 3,150,000 | 3,239,843 | |
| Salt Lake City UT International Airport Series A | 5.00 | 7-1-2024 | 2,000,000 | 2,094,651 | |
| Salt Lake City UT International Airport Series A | 5.00 | 7-1-2025 | 2,300,000 | 2,452,345 | |
| Salt Lake City UT Salt Lake City International Airport Airport Revenue Bonds Series 2021A | 5.00 | 7-1-2025 | 1,300,000 | 1,386,108 | |
| 9,172,947 |
| Interest rate | Maturity date | Principal | Value | ||
| Miscellaneous revenue: 0.02% | |||||
| Utah Infrastructure Agency Telecommunications Bond | 3.00% | 10-15-2026 | $ 310,000 | $ 300,032 | |
| 9,472,979 | |||||
| Vermont: 0.03% | |||||
| Education revenue: 0.03% | |||||
| Vermont Educational & Health Buildings Financing Agency Saint Michael's College Project | 5.00 | 10-1-2026 | 575,000 | 577,733 | |
| Virginia: 1.76% | |||||
| Education revenue: 0.05% | |||||
| Virginia College Building Authority Educational Facilities Regent University Project Series 2021 | 5.00 | 6-1-2026 | 300,000 | 318,205 | |
| Virginia College Building Authority Educational Facilities Regent University Project Series 2021 | 5.00 | 6-1-2027 | 275,000 | 293,820 | |
| Virginia College Building Authority Educational Facilities Regent University Project Series 2021 | 5.00 | 6-1-2028 | 300,000 | 320,874 | |
| 932,899 | |||||
| Industrial development revenue: 0.16% | |||||
| Peninsula VA Ports Authority Coal Terminal Refunding Bond Dominion Terminal Associates Project | 1.70 | 10-1-2033 | 3,300,000 | 3,297,757 | |
| Tax revenue: 0.07% | |||||
| Marquis VA CDA CAB Series A | 3.32 | 9-1-2036 | 2,169,000 | 987,487 | |
| Marquis VA CDA CAB Series C ¤ | 0.00 | 9-1-2041 | 3,493,000 | 167,185 | |
| Marquis VA CDA CCAB Series 2015 144A | 4.88 | 9-1-2045 | 680,000 | 312,334 | |
| 1,467,006 | |||||
| Transportation revenue: 1.06% | |||||
| Chesapeake VA Bay Bridge & Tunnel District First Tier Generation Resolution | 5.00 | 11-1-2023 | 14,115,000 | 14,586,418 | |
| Virginia Commonwealth Transportation Board Refunding Bond Series A | 5.00 | 5-15-2023 | 1,500,000 | 1,543,131 | |
| Virginia Small Business Financing Authority Revenue Bonds Series 2012 | 5.50 | 1-1-2042 | 5,525,000 | 5,525,000 | |
| 21,654,549 | |||||
| Utilities revenue: 0.42% | |||||
| York County EDA PCR Virginia Electric & Power Company Project Series A | 1.90 | 5-1-2033 | 8,500,000 | 8,436,571 | |
| 35,788,782 | |||||
| Washington: 2.69% | |||||
| Airport revenue: 0.20% | |||||
| Port of Seattle Refunding Bond Series B | 5.00 | 8-1-2023 | 4,155,000 | 4,162,766 | |
| GO revenue: 0.38% | |||||
| Washington Refunding Bond | 5.00 | 6-1-2025 | 1,000,000 | 1,080,782 | |
| Washington Refunding Bond | 5.00 | 6-1-2026 | 1,570,000 | 1,731,812 | |
| Washington Series A | 5.00 | 8-1-2022 | 4,800,000 | 4,813,321 | |
| 7,625,915 |
| Interest rate | Maturity date | Principal | Value | ||
| Health revenue: 0.59% | |||||
| Washington HCFR Authority CommonSpirit Health Series 2019B-3 | 5.00% | 8-1-2049 | $ 4,000,000 | $ 4,226,883 | |
| Washington Health Care Facilities Authority Commonspirit Health Series 2019B-2 | 5.00 | 8-1-2049 | 2,430,000 | 2,539,385 | |
| Washington Health Care Facilities Authority CommonSpirit Health Series B1 | 5.00 | 8-1-2049 | 2,500,000 | 2,587,326 | |
| Washington Health Care Facilities Authority Seattle Cancer Care Alliance 144A | 5.00 | 12-1-2025 | 275,000 | 295,027 | |
| Washington Health Care Facilities Authority Seattle Cancer Care Alliance 144A | 5.00 | 12-1-2026 | 285,000 | 309,075 | |
| Washington Housing Finance Commission Nonprofit Housing Revenue Eliseo Project Series B-2 144A | 2.13 | 7-1-2027 | 1,250,000 | 1,117,613 | |
| Washington Housing Finance Commission Nonprofit Housing Revenue Rockwood Retirement Communities 144A | 3.00 | 7-1-2027 | 1,000,000 | 894,224 | |
| 11,969,533 | |||||
| Housing revenue: 0.08% | |||||
| Housing Authority of the County of King Workforce Housing Preservation Pooled Refunding Revenue Bonds 2021 | 4.00 | 10-1-2027 | 300,000 | 317,231 | |
| Snohomish County WA Housing Authority Carvel Apartments Project | 5.00 | 4-1-2025 | 500,000 | 532,251 | |
| Snohomish County WA Housing Authority Carvel Apartments Project | 5.00 | 4-1-2026 | 730,000 | 789,002 | |
| 1,638,484 | |||||
| Miscellaneous revenue: 0.06% | |||||
| FYI Properties Refunding Bond State of Washington District Project | 5.00 | 6-1-2027 | 1,000,000 | 1,114,228 | |
| Tax revenue: 0.11% | |||||
| Central Puget Sound Washington Regional Refunding & Improvement Series S-1 | 5.00 | 11-1-2036 | 2,110,000 | 2,302,075 | |
| Utilities revenue: 1.27% | |||||
| Seattle WA Municipal Light & Power Refunding Bond Series B (SIFMA Municipal Swap +0.25%) ± | 1.23 | 5-1-2045 | 2,750,000 | 2,717,845 | |
| Seattle WA Municipal Light & Power Refunding Bond Series C-1 (SIFMA Municipal Swap +0.49%) ± | 1.47 | 11-1-2046 | 23,190,000 | 23,208,443 | |
| 25,926,288 | |||||
| 54,739,289 | |||||
| West Virginia: 0.10% | |||||
| GO revenue: 0.10% | |||||
| Berkeley County WV Board of Education Public School Series 2020 | 2.00 | 5-1-2023 | 1,000,000 | 1,002,794 | |
| Berkeley County WV Board of Education Public School Series 2020 | 2.00 | 5-1-2024 | 1,000,000 | 995,986 | |
| 1,998,780 |
| Interest rate | Maturity date | Principal | Value | ||
| Wisconsin: 3.05% | |||||
| Airport revenue: 0.08% | |||||
| Wisconsin Airport Facilities PFA Senior Obligation Group Series B | 5.00% | 7-1-2022 | $ 1,655,000 | $ 1,655,000 | |
| Health revenue: 2.49% | |||||
| Entrance Fee Principal PFA Searstone Project Series B-2 | 2.25 | 6-1-2027 | 1,845,000 | 1,664,804 | |
| Wisconsin HEFA Advocate Aurora Health Credit Group Series B-3 | 5.00 | 8-15-2054 | 2,000,000 | 2,104,045 | |
| Wisconsin HEFA Advocate Aurora Health Credit Group Series B-4 | 5.00 | 8-15-2054 | 1,450,000 | 1,537,609 | |
| Wisconsin HEFA Advocate Aurora Health Credit Group Series C-4 (SIFMA Municipal Swap +0.65%) ± | 1.63 | 8-15-2054 | 4,200,000 | 4,183,612 | |
| Wisconsin HEFA Ascension Health Alliance | 5.00 | 11-15-2033 | 12,000,000 | 12,740,447 | |
| Wisconsin HEFA Beloit Health System Incorporated | 5.00 | 7-1-2025 | 1,000,000 | 1,058,557 | |
| Wisconsin HEFA Beloit Health System Incorporated | 5.00 | 7-1-2026 | 1,060,000 | 1,136,734 | |
| Wisconsin HEFA Marshfield Clinic Health System Incorporated | 5.00 | 2-15-2052 | 3,000,000 | 3,163,294 | |
| Wisconsin HEFA Marshfield Clinic Health System Incorporated Series B2 | 5.00 | 2-15-2051 | 18,300,000 | 19,891,216 | |
| Wisconsin HEFA Saint John's Communities Incorporated Series 2022 %% | 4.00 | 9-15-2026 | 795,000 | 789,779 | |
| Wisconsin HEFA Saint John's Communities Incorporated Series 2022 %% | 4.00 | 9-15-2028 | 860,000 | 842,920 | |
| Wisconsin HEFA Saint John's Communities Incorporated Series B | 4.00 | 9-15-2027 | 140,000 | 137,864 | |
| Wisconsin HEFA Saint John's Communities Incorporated Series B | 4.00 | 9-15-2028 | 195,000 | 190,491 | |
| Wisconsin HEFA St. Camillus Health System Incorporated | 5.00 | 11-1-2024 | 155,000 | 156,886 | |
| Wisconsin HEFA St. Camillus Health System Incorporated | 5.00 | 11-1-2025 | 245,000 | 248,499 | |
| Wisconsin HEFA St. Camillus Health System Incorporated | 5.00 | 11-1-2026 | 355,000 | 360,486 | |
| Wisconsin Revenue Bonds PFA Series 2021A | 5.00 | 6-1-2027 | 200,000 | 215,935 | |
| Wisconsin Revenue Bonds PFA Series 2021A | 5.00 | 6-1-2028 | 225,000 | 243,885 | |
| 50,667,063 | |||||
| Miscellaneous revenue: 0.41% | |||||
| Wisconsin Refunding Bond Series A | 5.00 | 5-1-2023 | 8,015,000 | 8,238,182 | |
| Water & sewer revenue: 0.07% | |||||
| Clayton WI Water System and Sewer System Series C | 2.00 | 6-1-2026 | 1,600,000 | 1,520,226 | |
| 62,080,471 | |||||
| Total Municipal obligations (Cost $2,058,798,870) | 2,016,805,406 |
| Yield | Shares | ||||
| Short-term investments: 0.21% | |||||
| Investment companies: 0.21% | |||||
| Allspring Municipal Cash Management Money Market Fund Institutional Class ♠∞## | 0.85 | 4,261,754 | 4,264,311 | ||
| Total Short-term investments (Cost $4,264,212) | 4,264,311 | ||||
| Total investments in securities (Cost $2,087,463,082) | 100.50% | 2,045,469,717 | |||
| Other assets and liabilities, net | (0.50) | (10,206,316) | |||
| Total net assets | 100.00% | $2,035,263,401 |
| 144A | The security may be resold in transactions exempt from registration, normally to qualified institutional buyers, pursuant to Rule 144A under the Securities Act of 1933. |
| ø | Variable rate demand notes are subject to a demand feature which reduces the effective maturity. The maturity date shown represents the final maturity date of the security. The interest rate is determined and reset by the issuer daily, weekly, or monthly depending upon the terms of the security. The rate shown is the rate in effect at period end. |
| ± | Variable rate investment. The rate shown is the rate in effect at period end. |
| ¤ | The security is issued in zero coupon form with no periodic interest payments. |
| € | The security is an auction-rate security which has an interest rate that resets at predetermined short-term intervals through a Dutch auction. The rate shown is the rate in effect at period end. |
| ## | All or a portion of this security is segregated for when-issued securities. |
| øø | The interest rate is determined and reset by the issuer periodically depending upon the terms of the security. The rate shown is the rate in effect at period end. |
| ♠ | The issuer of the security is an affiliated person of the Fund as defined in the Investment Company Act of 1940. |
| ∞ | The rate represents the 7-day annualized yield at period end. |
| %% | The security is purchased on a when-issued basis. |
| Abbreviations: | |
| AGM | Assured Guaranty Municipal |
| AMT | Alternative minimum tax |
| BAM | Build America Mutual Assurance Company |
| BAN | Bond anticipation notes |
| BHAC | Berkshire Hathaway Assurance Corporation |
| CAB | Capital appreciation bond |
| CCAB | Convertible capital appreciation bond |
| CDA | Community Development Authority |
| EDA | Economic Development Authority |
| EDFA | Economic Development Finance Authority |
| FHA | Federal Housing Administration |
| FHLMC | Federal Home Loan Mortgage Corporation |
| FNMA | Federal National Mortgage Association |
| GNMA | Government National Mortgage Association |
| GO | General obligation |
| HCFR | Healthcare facilities revenue |
| HEFA | Health & Educational Facilities Authority |
| HEFAR | Higher Education Facilities Authority Revenue |
| HFA | Housing Finance Authority |
| IDA | Industrial Development Authority |
| LIBOR | London Interbank Offered Rate |
| LIQ | Liquidity agreement |
| LOC | Letter of credit |
| MFHR | Multifamily housing revenue |
| NPFGC | National Public Finance Guarantee Corporation |
| PCFA | Pollution Control Financing Authority |
| PCR | Pollution control revenue |
| PFA | Public Finance Authority |
| RDA | Redevelopment Authority |
| SIFMA | Securities Industry and Financial Markets Association |
| SOFR | Secured Overnight Financing Rate |
| SPA | Standby purchase agreement |
| Value, beginning of period | Purchases | Sales proceeds | Net realized gains (losses) | Net change in unrealized gains (losses) | Value, end of period | Shares, end of period | Income from affiliated securities | |
| Short-term investments | ||||||||
| Allspring Municipal Cash Management Money Market Fund Institutional Class | $41,242,575 | $1,082,039,956 | $(1,119,034,663) | $16,344 | $99 | $4,264,311 | 4,261,754 | $44,940 |
| Assets | |
Investments in unaffiliated securities, at value (cost $2,083,198,870) | $ 2,041,205,406 |
Investments in affiliated securities, at value (cost $4,264,212) | 4,264,311 |
Cash | 8,047,846 |
Receivable for interest | 17,524,320 |
Receivable for investments sold | 10,119,609 |
Receivable for Fund shares sold | 1,656,321 |
Total assets | 2,082,817,813 |
| Liabilities | |
Payable for when-issued transactions | 33,111,941 |
Payable for investments purchased | 6,500,000 |
Payable for Fund shares redeemed | 6,292,634 |
Management fee payable | 477,391 |
Dividends payable | 347,312 |
Administration fees payable | 156,316 |
Distribution fee payable | 3,128 |
Trustees’ fees and expenses payable | 1,591 |
Accrued expenses and other liabilities | 664,099 |
Total liabilities | 47,554,412 |
Total net assets | $2,035,263,401 |
| Net assets consist of | |
Paid-in capital | $ 2,137,164,925 |
Total distributable loss | (101,901,524) |
Total net assets | $2,035,263,401 |
| Computation of net asset value and offering price per share | |
Net assets – Class A | $ 522,582,064 |
Shares outstanding – Class A1 | 54,768,196 |
Net asset value per share – Class A | $9.54 |
Maximum offering price per share – Class A2 | $9.73 |
Net assets – Class C | $ 5,057,670 |
Shares outstanding – Class C1 | 530,069 |
Net asset value per share – Class C | $9.54 |
Net assets – Class R6 | $ 346,079,766 |
Shares outstanding – Class R61 | 36,201,414 |
Net asset value per share – Class R6 | $9.56 |
Net assets – Administrator Class | $ 6,372,296 |
Shares outstanding – Administrator Class1 | 668,012 |
Net asset value per share – Administrator Class | $9.54 |
Net assets – Institutional Class | $ 1,155,171,605 |
Shares outstanding – Institutional Class1 | 120,839,626 |
Net asset value per share – Institutional Class | $9.56 |
| 1 | The Fund has an unlimited number of authorized shares. |
| 2 | Maximum offering price is computed as 100/98 of net asset value. On investments of $100,000 or more, the offering price is reduced. |
| Investment income | |
Interest | $ 40,464,675 |
Income from affiliated securities | 44,940 |
Total investment income | 40,509,615 |
| Expenses | |
Management fee | 8,072,405 |
| Administration fees | |
Class A | 980,612 |
Class C | 8,811 |
Class R6 | 133,949 |
Administrator Class | 8,693 |
Institutional Class | 1,066,651 |
| Shareholder servicing fees | |
Class A | 1,528,271 |
Class C | 13,677 |
Administrator Class | 21,332 |
| Distribution fee | |
Class C | 41,019 |
Custody and accounting fees | 99,555 |
Professional fees | 69,074 |
Registration fees | 132,477 |
Shareholder report expenses | 79,164 |
Trustees’ fees and expenses | 20,033 |
Other fees and expenses | 48,716 |
Total expenses | 12,324,439 |
| Less: Fee waivers and/or expense reimbursements | |
Fund-level | (769,262) |
Class A | (674,170) |
Class C | (5,507) |
Administrator Class | (6,085) |
Net expenses | 10,869,415 |
Net investment income | 29,640,200 |
| Realized and unrealized gains (losses) on investments | |
| Net realized gains (losses) on | |
Unaffiliated securities | (6,822,881) |
Affiliated securities | 16,344 |
Net realized losses on investments | (6,806,537) |
| Net change in unrealized gains (losses) on | |
Unaffiliated securities | (94,969,301) |
Affiliated securities | 99 |
Net change in unrealized gains (losses) on investments | (94,969,202) |
Net realized and unrealized gains (losses) on investments | (101,775,739) |
Net decrease in net assets resulting from operations | $ (72,135,539) |
| Year ended June 30, 2022 | Year ended June 30, 2021 | |||
| Operations | ||||
Net investment income | $ 29,640,200 | $ 38,727,118 | ||
Net realized gains (losses) on investments | (6,806,537) | 362,169 | ||
Net change in unrealized gains (losses) on investments | (94,969,202) | 13,129,059 | ||
Net increase (decrease) in net assets resulting from operations | (72,135,539) | 52,218,346 | ||
| Distributions to shareholders from | ||||
| Net investment income and net realized gains | ||||
Class A | (6,448,479) | (8,650,299) | ||
Class C | (16,609) | (45,155) | ||
Class R6 | (5,926,588) | (7,553,665) | ||
Administrator Class | (101,255) | (174,423) | ||
Institutional Class | (17,109,887) | (22,698,377) | ||
Total distributions to shareholders | (29,602,818) | (39,121,919) | ||
| Capital share transactions | Shares | Shares | ||
| Proceeds from shares sold | ||||
Class A | 5,411,821 | 53,085,084 | 9,382,943 | 93,467,640 |
Class C | 93,167 | 892,311 | 123,795 | 1,233,557 |
Class R6 | 22,206,656 | 219,388,068 | 14,404,730 | 143,772,237 |
Administrator Class | 16,337 | 160,666 | 530,194 | 5,285,151 |
Institutional Class | 60,814,199 | 595,839,440 | 53,939,339 | 538,375,527 |
| 869,365,569 | 782,134,112 | |||
| Reinvestment of distributions | ||||
Class A | 634,297 | 6,198,439 | 837,695 | 8,344,092 |
Class C | 1,676 | 16,314 | 4,355 | 43,381 |
Class R6 | 248,231 | 2,427,229 | 391,799 | 3,909,923 |
Administrator Class | 9,270 | 90,839 | 16,340 | 162,837 |
Institutional Class | 1,635,626 | 16,004,191 | 1,938,996 | 19,350,456 |
| 24,737,012 | 31,810,689 | |||
| Payment for shares redeemed | ||||
Class A | (20,151,656) | (197,188,295) | (16,283,444) | (162,192,261) |
Class C | (264,125) | (2,599,228) | (1,129,453) | (11,242,141) |
Class R6 | (30,322,260) | (296,291,525) | (33,755,005) | (337,160,574) |
Administrator Class | (653,324) | (6,439,085) | (1,120,885) | (11,177,262) |
Institutional Class | (81,039,965) | (790,136,658) | (109,671,860) | (1,094,609,637) |
| (1,292,654,791) | (1,616,381,875) | |||
Net decrease in net assets resulting from capital share transactions | (398,552,210) | (802,437,074) | ||
Total decrease in net assets | (500,290,567) | (789,340,647) | ||
| Net assets | ||||
Beginning of period | 2,535,553,968 | 3,324,894,615 | ||
End of period | $ 2,035,263,401 | $ 2,535,553,968 | ||
| Year ended June 30 | |||||
| Class A | 2022 | 2021 | 2020 | 2019 | 2018 |
Net asset value, beginning of period | $9.95 | $9.92 | $9.92 | $9.83 | $9.85 |
Net investment income | 0.10 | 0.12 | 0.15 | 0.15 | 0.13 |
Net realized and unrealized gains (losses) on investments | (0.41) | 0.03 | (0.01) | 0.10 | (0.02) |
Total from investment operations | (0.31) | 0.15 | 0.14 | 0.25 | 0.11 |
| Distributions to shareholders from | |||||
Net investment income | (0.10) | (0.12) | (0.14) | (0.16) | (0.13) |
Tax basis return of capital | 0.00 | 0.00 | 0.00 | (0.00) 1 | 0.00 |
Total distributions to shareholders | (0.10) | (0.12) | (0.14) | (0.16) | (0.13) |
Net asset value, end of period | $9.54 | $9.95 | $9.92 | $9.92 | $9.83 |
Total return2 | (3.09)% | 1.52% | 1.47% | 2.57% | 1.15% |
| Ratios to average net assets (annualized) | |||||
Gross expenses | 0.76% | 0.77% | 0.76% | 0.76% | 0.77% |
Net expenses | 0.63% | 0.63% | 0.63% | 0.63% | 0.63% |
Net investment income | 1.05% | 1.20% | 1.52% | 1.59% | 1.34% |
| Supplemental data | |||||
Portfolio turnover rate | 28% | 20% | 35% | 33% | 31% |
Net assets, end of period (000s omitted) | $522,582 | $685,618 | $743,254 | $991,514 | $1,209,079 |
| 1 | Amount is less than $0.005. |
| 2 | Total return calculations do not include any sales charges. |
| Year ended June 30 | |||||
| Class C | 2022 | 2021 | 2020 | 2019 | 2018 |
Net asset value, beginning of period | $9.95 | $9.92 | $9.92 | $9.83 | $9.85 |
Net investment income | 0.03 | 0.05 | 0.08 | 0.08 | 0.06 |
Net realized and unrealized gains (losses) on investments | (0.41) | 0.03 | (0.01) | 0.10 | (0.02) |
Total from investment operations | (0.38) | 0.08 | 0.07 | 0.18 | 0.04 |
| Distributions to shareholders from | |||||
Net investment income | (0.03) | (0.05) | (0.07) | (0.09) | (0.06) |
Tax basis return of capital | 0.00 | 0.00 | 0.00 | (0.00) 1 | 0.00 |
Total distributions to shareholders | (0.03) | (0.05) | (0.07) | (0.09) | (0.06) |
Net asset value, end of period | $9.54 | $9.95 | $9.92 | $9.92 | $9.83 |
Total return2 | (3.82)% | 0.76% | 0.71% | 1.81% | 0.40% |
| Ratios to average net assets (annualized) | |||||
Gross expenses | 1.51% | 1.51% | 1.50% | 1.51% | 1.52% |
Net expenses | 1.38% | 1.38% | 1.38% | 1.38% | 1.38% |
Net investment income | 0.30% | 0.45% | 0.77% | 0.84% | 0.59% |
| Supplemental data | |||||
Portfolio turnover rate | 28% | 20% | 35% | 33% | 31% |
Net assets, end of period (000s omitted) | $5,058 | $6,962 | $16,870 | $34,381 | $48,101 |
| 1 | Amount is less than $0.005. |
| 2 | Total return calculations do not include any sales charges. |
| Year ended June 30 | ||||
| Class R6 | 2022 | 2021 | 2020 | 2019 1 |
Net asset value, beginning of period | $9.97 | $9.94 | $9.94 | $9.86 |
Net investment income | 0.13 | 0.15 | 0.18 | 0.17 |
Net realized and unrealized gains (losses) on investments | (0.41) | 0.03 | (0.01) | 0.08 |
Total from investment operations | (0.28) | 0.18 | 0.17 | 0.25 |
| Distributions to shareholders from | ||||
Net investment income | (0.13) | (0.15) | (0.17) | (0.17) |
Tax basis return of capital | 0.00 | 0.00 | 0.00 | (0.00) 2 |
Total distributions to shareholders | (0.13) | (0.15) | (0.17) | (0.17) |
Net asset value, end of period | $9.56 | $9.97 | $9.94 | $9.94 |
Total return3 | (2.82)% | 1.80% | 1.75% | 2.60% |
| Ratios to average net assets (annualized) | ||||
Gross expenses | 0.38% | 0.39% | 0.38% | 0.38% |
Net expenses | 0.35% | 0.35% | 0.35% | 0.35% |
Net investment income | 1.33% | 1.48% | 1.80% | 1.94% |
| Supplemental data | ||||
Portfolio turnover rate | 28% | 20% | 35% | 33% |
Net assets, end of period (000s omitted) | $346,080 | $439,530 | $626,312 | $787,524 |
| 1 | For the period from July 31, 2018 (commencement of class operations) to June 30, 2019 |
| 2 | Amount is less than $0.005. |
| 3 | Returns for periods of less than one year are not annualized. |
| Year ended June 30 | |||||
| Administrator Class | 2022 | 2021 | 2020 | 2019 | 2018 |
Net asset value, beginning of period | $9.96 | $9.92 | $9.93 | $9.84 | $9.86 |
Net investment income | 0.12 | 0.12 1 | 0.16 | 0.16 | 0.14 |
Net realized and unrealized gains (losses) on investments | (0.42) | 0.04 | (0.02) | 0.09 | (0.02) |
Total from investment operations | (0.30) | 0.16 | 0.14 | 0.25 | 0.12 |
| Distributions to shareholders from | |||||
Net investment income | (0.12) | (0.12) | (0.15) | (0.16) | (0.14) |
Tax basis return of capital | 0.00 | 0.00 | 0.00 | (0.00) 2 | 0.00 |
Total distributions to shareholders | (0.12) | (0.12) | (0.15) | (0.16) | (0.14) |
Net asset value, end of period | $9.54 | $9.96 | $9.92 | $9.93 | $9.84 |
Total return | (3.08)% | 1.65% | 1.39% | 2.60% | 1.18% |
| Ratios to average net assets (annualized) | |||||
Gross expenses | 0.70% | 0.71% | 0.69% | 0.70% | 0.71% |
Net expenses | 0.60% | 0.60% | 0.60% | 0.60% | 0.60% |
Net investment income | 1.07% | 1.23% | 1.55% | 1.62% | 1.36% |
| Supplemental data | |||||
Portfolio turnover rate | 28% | 20% | 35% | 33% | 31% |
Net assets, end of period (000s omitted) | $6,372 | $12,906 | $18,560 | $35,517 | $44,186 |
| 1 | Calculated based upon average shares outstanding |
| 2 | Amount is less than $0.005. |
| Year ended June 30 | |||||
| Institutional Class | 2022 | 2021 | 2020 | 2019 | 2018 |
Net asset value, beginning of period | $9.97 | $9.94 | $9.94 | $9.85 | $9.87 |
Net investment income | 0.13 | 0.14 | 0.17 | 0.18 | 0.16 |
Net realized and unrealized gains (losses) on investments | (0.41) | 0.03 | (0.00) 1 | 0.09 | (0.02) |
Total from investment operations | (0.28) | 0.17 | 0.17 | 0.27 | 0.14 |
| Distributions to shareholders from | |||||
Net investment income | (0.13) | (0.14) | (0.17) | (0.18) | (0.16) |
Tax basis return of capital | 0.00 | 0.00 | 0.00 | (0.00) 2 | 0.00 |
Total distributions to shareholders | (0.13) | (0.14) | (0.17) | (0.18) | (0.16) |
Net asset value, end of period | $9.56 | $9.97 | $9.94 | $9.94 | $9.85 |
Total return | (2.86)% | 1.75% | 1.70% | 2.81% | 1.39% |
| Ratios to average net assets (annualized) | |||||
Gross expenses | 0.43% | 0.44% | 0.43% | 0.43% | 0.44% |
Net expenses | 0.40% | 0.40% | 0.40% | 0.40% | 0.40% |
Net investment income | 1.29% | 1.42% | 1.74% | 1.80% | 1.58% |
| Supplemental data | |||||
Portfolio turnover rate | 28% | 20% | 35% | 33% | 31% |
Net assets, end of period (000s omitted) | $1,155,172 | $1,390,537 | $1,919,898 | $2,159,113 | $3,421,249 |
| 1 | Amount is more than $(0.005) |
| 2 | Amount is less than $0.005. |
| Gross unrealized gains | $ 3,791,047 |
| Gross unrealized losses | (45,784,414) |
| Net unrealized losses | $(41,993,367) |
| ■ | Level 1 – quoted prices in active markets for identical securities |
| ■ | Level 2 – other significant observable inputs (including quoted prices for similar securities, interest rates, prepayment speeds, credit risk, etc.) |
| ■ | Level 3 – significant unobservable inputs (including the Fund’s own assumptions in determining the fair value of investments) |
| Quoted prices (Level 1) | Other significant observable inputs (Level 2) | Significant unobservable inputs (Level 3) | Total | |
| Assets | ||||
| Investments in: | ||||
| Closed end municipal bond fund obligations | $ 0 | $ 24,400,000 | $0 | $ 24,400,000 |
| Municipal obligations | 0 | 2,016,805,406 | 0 | 2,016,805,406 |
| Short-term investments | ||||
| Investment companies | 4,264,311 | 0 | 0 | 4,264,311 |
| Total assets | $4,264,311 | $2,041,205,406 | $0 | $2,045,469,717 |
| Average daily net assets | Management fee |
| First $1 billion | 0.350% |
| Next $4 billion | 0.325 |
| Next $3 billion | 0.290 |
| Next $2 billion | 0.265 |
| Over $10 billion | 0.255 |
| Class-level administration fee | |
| Class A | 0.16% |
| Class C | 0.16 |
| Class R6 | 0.03 |
| Administrator Class | 0.10 |
| Institutional Class | 0.08 |
| Expense ratio caps | |
| Class A | 0.63% |
| Class C | 1.38 |
| Class R6 | 0.35 |
| Administrator Class | 0.60 |
| Institutional Class | 0.40 |
| Undistributed tax-exempt income | Unrealized losses | Capital loss carryforward |
| $929,920 | $(41,993,367) | $(60,480,834) |
Allspring Funds Trust:

| Name and year of birth | Position held and length of service* | Principal occupations during past five years or longer | Current other public company or investment company directorships |
| William R. Ebsworth (Born 1957) | Trustee, since 2015 | Retired. From 1984 to 2013, equities analyst, portfolio manager, research director and chief investment officer at Fidelity Management and Research Company in Boston, Tokyo, and Hong Kong, and retired in 2013 as Chief Investment Officer of Fidelity Strategic Advisers, Inc. where he led a team of investment professionals managing client assets. Prior thereto, Board member of Hong Kong Securities Clearing Co., Hong Kong Options Clearing Corp., the Thailand International Fund, Ltd., Fidelity Investments Life Insurance Company, and Empire Fidelity Investments Life Insurance Company. Audit Committee Chair and Investment Committee Chair of the Vincent Memorial Hospital Endowment (non-profit organization). Mr. Ebsworth is a CFA® charterholder. | N/A |
| Jane A. Freeman (Born 1953) | Trustee, since 2015; Chair Liaison, since 2018 | Retired. From 2012 to 2014 and 1999 to 2008, Chief Financial Officer of Scientific Learning Corporation. From 2008 to 2012, Ms. Freeman provided consulting services related to strategic business projects. Prior to 1999, Portfolio Manager at Rockefeller & Co. and Scudder, Stevens & Clark. Board member of the Harding Loevner Funds from 1996 to 2014, serving as both Lead Independent Director and chair of the Audit Committee. Board member of the Russell Exchange Traded Funds Trust from 2011 to 2012 and the chair of the Audit Committee. Ms. Freeman is also an inactive Chartered Financial Analyst. | N/A |
| Isaiah Harris, Jr. (Born 1952) | Trustee, since 2009; Audit Committee Chair, since 2019 | Retired. Chairman of the Board of CIGNA Corporation from 2009 to 2021, and Director from 2005 to 2008. From 2003 to 2011, Director of Deluxe Corporation. Prior thereto, President and CEO of BellSouth Advertising and Publishing Corp. from 2005 to 2007, President and CEO of BellSouth Enterprises from 2004 to 2005 and President of BellSouth Consumer Services from 2000 to 2003. Emeritus member of the Iowa State University Foundation Board of Governors. Emeritus Member of the Advisory Board of Iowa State University School of Business. Advisory Board Member, Palm Harbor Academy (private school). Advisory Board Member, Fellowship of Christian Athletes. Mr. Harris is a certified public accountant (inactive status). | N/A |
| David F. Larcker (Born 1950) | Trustee, since 2009 | James Irvin Miller Professor of Accounting at the Graduate School of Business (Emeritus), Stanford University, Director of the Corporate Governance Research Initiative and Senior Faculty of The Rock Center for Corporate Governance since 2006. From 2005 to 2008, Professor of Accounting at the Graduate School of Business, Stanford University. Prior thereto, Ernst & Young Professor of Accounting at The Wharton School, University of Pennsylvania from 1985 to 2005. | N/A |
| Name and year of birth | Position held and length of service* | Principal occupations during past five years or longer | Current other public company or investment company directorships |
| Olivia S. Mitchell (Born 1953) | Trustee, since 2006; Nominating and Governance Committee Chair, since 2018 | International Foundation of Employee Benefit Plans Professor since 1993, Wharton School of the University of Pennsylvania. Director of Wharton’s Pension Research Council and Boettner Center on Pensions & Retirement Research, and Research Associate at the National Bureau of Economic Research. Previously taught at Cornell University from 1978 to 1993. | N/A |
| Timothy J. Penny (Born 1951) | Trustee, since 1996; Chair, since 2018 | President and Chief Executive Officer of Southern Minnesota Initiative Foundation, a non-profit organization, since 2007. Member of the Board of Trustees of NorthStar Education Finance, Inc., a non-profit organization, since 2007. | N/A |
| James G. Polisson (Born 1959) | Trustee, since 2018 | Retired. Chief Marketing Officer, Source (ETF) UK Services, Ltd, from 2015 to 2017. From 2012 to 2015, Principal of The Polisson Group, LLC, a management consulting, corporate advisory and principal investing company. Chief Executive Officer and Managing Director at Russell Investments, Global Exchange Traded Funds from 2010 to 2012. Managing Director of Barclays Global Investors from 1998 to 2010 and Global Chief Marketing Officer for iShares and Barclays Global Investors from 2000 to 2010. Trustee of the San Francisco Mechanics’ Institute, a non-profit organization, from 2013 to 2015. Board member of the Russell Exchange Traded Fund Trust from 2011 to 2012. Director of Barclays Global Investors Holdings Deutschland GmbH from 2006 to 2009. Mr. Polisson is an attorney and has a retired status with the Massachusetts and District of Columbia Bar Associations. | N/A |
| Pamela Wheelock (Born 1959) | Trustee, since January 2020; previously Trustee from January 2018 to July 2019 | Board member of the Destination Medical Center Economic Development Agency, Rochester, Minnesota since 2019. Interim President of the McKnight Foundation from January to September 2020. McKnight Foundation Consultant, November 2020 to February 2021. Acting Commissioner, Minnesota Department of Human Services, July 2019 through September 2019. Consultant (part-time), Minnesota Department of Human Services, October 2019 through December 2019. Chief Operating Officer, Twin Cities Habitat for Humanity from 2017 to 2019. Vice President of University Services, University of Minnesota from 2012 to 2016. Prior thereto, on the Board of Directors, Governance Committee and Finance Committee for the Minnesota Philanthropy Partners (Saint Paul Foundation) from 2012 to 2018, Interim Chief Executive Officer of Blue Cross Blue Shield of Minnesota from 2011 to 2012, Chairman of the Board from 2009 to 2012 and Board Director from 2003 to 2015. Vice President, Leadership and Community Engagement, Bush Foundation, Saint Paul, Minnesota (a private foundation) from 2009 to 2011. Executive Vice President and Chief Financial Officer, Minnesota Sports and Entertainment from 2004 to 2009 and Senior Vice President from 2002 to 2004. Executive Vice President of the Minnesota Wild Foundation from 2004 to 2008. Commissioner of Finance, State of Minnesota, from 1999 to 2002. Currently Board Chair of the Minnesota Wild Foundation since 2010. | N/A |
| Name and year of birth | Position held and length of service | Principal occupations during past five years or longer |
| Andrew Owen (Born 1960) | President, since 2017 | President, Chief Executive Officer and Director of Allspring Funds Management, LLC since 2017 and co-president of Galliard Capital Management, LLC, an affiliate of Allspring Funds Management, LLC, since 2019. Prior thereto, Head of Affiliated Managers, Allspring Global Investments, from 2014 to 2019 and Executive Vice President responsible for marketing, investments and product development for Allspring Funds Management, LLC, from 2009 to 2014. In addition, Mr. Owen was an Executive Vice President of Wells Fargo & Company from 2014 to 2021. |
| Jeremy DePalma (Born 1974) | Treasurer, since 2012 (for certain funds in the Fund Complex); since 2021 (for the remaining funds in the Fund Complex) | Senior Vice President of Allspring Funds Management, LLC since 2009. Senior Vice President of Evergreen Investment Management Company, LLC from 2008 to 2010 and head of the Fund Reporting and Control Team within Fund Administration from 2005 to 2010. |
| Kate McKinley (Born 1977) | Chief Legal Officer, since 2021 | Chief Legal Officer of Allspring Global Investments since 2021. Prior thereto, held various roles at State Street Global Advisors beginning in 2010, including serving as Senior Vice President and General Counsel from 2019 to 2021, and Chief Operating Officer of the Institutional Client Group from 2016 - 2019. Prior to working at State Street Global Advisors served as Assistant General Counsel for Bank of America Corporation from 2005 to 2010 and as an Associate at WilmerHale from 2002 to 2005. |
| Christopher Baker (Born 1976) | Chief Compliance Officer, since 2022 | Global Chief Compliance Officer for Allspring Global Investments since 2022. Prior thereto, Chief Compliance Officer for State Street Global Advisors from 2018 to 2021. Senior Compliance Officer for the State Street divisions of Alternative Investment Solutions, Sector Solutions, and Global Marketing from 2015 to 2018. From 2010 to 2015 Vice President, Global Head of Investment and Marketing Compliance for State Street Global Advisors. |
| Matthew Prasse (Born 1983) | Secretary, since 2021 | Senior Counsel of the Allspring Legal Department since 2021. Senior Counsel of the Wells Fargo Legal Department from 2018 to 2021. Previously, Counsel for Barings LLC from 2015 to 2018. Prior to joining Barings, Associate at Morgan, Lewis & Bockius LLP from 2008 to 2015. |
P.O. Box 219967
Kansas City, MO 64121-9967

1-800-222-8222 or visit the Fund's website at allspringglobal.com. Read the prospectus carefully before you invest or send money.
A256/AR256 06-22

Strategic Municipal Bond Fund
| 2 | |
| 6 | |
| 10 | |
| 11 | |
| Financial statements | |
| 61 | |
| 62 | |
| 63 | |
| 64 | |
| 69 | |
| 75 | |
| 76 |

| 1 | The S&P 500 Index consists of 500 stocks chosen for market size, liquidity, and industry group representation. It is a market-value-weighted index with each stock's weight in the index proportionate to its market value. You cannot invest directly in an index. |
| 2 | The Morgan Stanley Capital International (MSCI) All Country World Index (ACWI) ex USA Index (Net) is a free-float-adjusted market-capitalization-weighted index that is designed to measure the equity market performance of developed and emerging markets, excluding the U.S. Source: MSCI. MSCI makes no express or implied warranties or representations and shall have no liability whatsoever with respect to any MSCI data contained herein. The MSCI data may not be further redistributed or used as a basis for other indexes or any securities or financial products. This report is not approved, reviewed, or produced by MSCI. You cannot invest directly in an index. |
| 3 | The MSCI Emerging Markets (EM) Index (Net) (USD) is a free-float-adjusted market-capitalization-weighted index that is designed to measure equity market performance of emerging markets. You cannot invest directly in an index. |
| 4 | The Bloomberg U.S. Aggregate Bond Index is a broad-based benchmark that measures the investment-grade, U.S.-dollar-denominated, fixed-rate taxable bond market, including Treasuries, government-related and corporate securities, mortgage-backed securities (agency fixed-rate and hybrid adjustable-rate mortgage pass-throughs), asset-backed securities, and commercial mortgage-backed securities. You cannot invest directly in an index. |
| 5 | The Bloomberg Global Aggregate ex-USD Index (unhedged) is an unmanaged index that provides a broad-based measure of the global investment-grade fixed-income markets excluding the U.S.-dollar-denominated debt market. You cannot invest directly in an index. |
| 6 | The Bloomberg Municipal Bond Index is an unmanaged index composed of long-term tax-exempt bonds with a minimum credit rating of Baa. You cannot invest directly in an index. |
| 7 | The ICE BofA U.S. High Yield Index is a market-capitalization-weighted index of domestic and Yankee high-yield bonds. The index tracks the performance of high-yield securities traded in the U.S. bond market. You cannot invest directly in an index. Copyright 2022. ICE Data Indices, LLC. All rights reserved. |
| 1 | The Consumer Price Index (CPI) is a measure of the average change over time in the prices paid by urban consumers for a market basket of consumer goods and services. You cannot invest directly in an index. |
| 2 | The MSCI ACWI (Net) is a free-float-adjusted market-capitalization-weighted index that is designed to measure the equity market performance of developed and emerging markets. You cannot invest directly in an index. |

President
Allspring Funds
| Investment objective | The Fund seeks current income exempt from regular federal income tax. |
| Manager | Allspring Funds Management, LLC |
| Subadviser | Allspring Global Investments, LLC |
| Portfolio managers | Terry J. Goode, Robert J. Miller, Nicholos Venditti |
| Average annual total returns (%) as of June 30, 2022 | |||||||||||
| Including sales charge | Excluding sales charge | Expense ratios1 (%) | |||||||||
| Inception date | 1 year | 5 year | 10 year | 1 year | 5 year | 10 year | Gross | Net 2 | |||
| Class A (VMPAX) | 12-1-1994 | -9.45 | 0.33 | 1.24 | -5.66 | 1.15 | 1.65 | 0.79 | 0.79 | ||
| Class C (DHICX) | 8-18-1997 | -7.34 | 0.39 | 1.05 | -6.34 | 0.39 | 1.05 | 1.54 | 1.54 | ||
| Class R6 (VMPRX)3 | 7-31-2018 | – | – | – | -5.30 | 1.48 | 1.88 | 0.41 | 0.41 | ||
| Administrator Class (VMPYX) | 10-6-1997 | – | – | – | -5.46 | 1.29 | 1.78 | 0.73 | 0.68 | ||
| Institutional Class (STRIX)4 | 11-30-2012 | – | – | – | -5.25 | 1.48 | 1.98 | 0.46 | 0.46 | ||
| Bloomberg Short-Intermediate Municipal Bond Index5 | – | – | – | – | -4.91 | 1.25 | 1.63 | – | – | ||
| 1 | Reflects the expense ratios as stated in the most recent prospectuses. The expense ratios shown are subject to change and may differ from the annualized expense ratios shown in the financial highlights of this report. |
| 2 | The manager has contractually committed through October 31, 2022, to waive fees and/or reimburse expenses to the extent necessary to cap total annual fund operating expenses after fee waivers at 0.81% for Class A, 1.56% for Class C, 0.43% for Class R6, 0.68% for Administrator Class, and 0.48% for Institutional Class. Brokerage commissions, stamp duty fees, interest, taxes, acquired fund fees and expenses (if any), and extraordinary expenses are excluded from the expense caps. Prior to or after the commitment expiration date, the caps may be increased or the commitment to maintain the caps may be terminated only with the approval of the Board of Trustees. Without these caps, the Fund’s returns would have been lower. The expense ratio paid by an investor is the net expense ratio (the total annual fund operating expenses after fee waivers) as stated in the prospectuses. |
| 3 | Historical performance shown for the Class R6 shares prior to their inception reflects the performance of the Administrator Class shares, and includes the higher expenses applicable to the Administrator Class shares. If these expenses had not been included, returns for the Class R6 shares would be higher. |
| 4 | Historical performance shown for the Institutional Class shares prior to their inception reflects the performance of the Administrator Class shares, and includes the higher expenses applicable to the Administrator Class shares. If these expenses had not been included, returns for the Institutional Class shares would be higher. |
| 5 | The Bloomberg Short-Intermediate Municipal Bond Index is a rules-based, market-value-weighted index composed of publicly traded municipal bonds that cover the U.S. dollar–denominated short-term tax-exempt bond market, including state and local general obligation bonds, revenue bonds, insured bonds, and prefunded bonds. You cannot invest directly in an index. |

| 1 | The chart compares the performance of Class A shares for the most recent ten years with the Bloomberg Short-Intermediate Municipal Bond Index. The chart assumes a hypothetical investment of $10,000 in Class A shares and reflects all operating expenses and assumes the maximum initial sales charge of 4.00%. |
| ■ | The Fund underperformed its benchmark, the Bloomberg Short-Intermediate Municipal Bond Index, for the 12-month period that ended June 30, 2022. |
| ■ | Credit-quality positioning was the largest detractor from relative performance as we were overweight lower-quality investment-grade and high-yield bonds, which underperformed higher-quality investment-grade bonds. Yield-curve positioning also detracted from performance as our overweight to the longest bonds underperformed. Broadly, the Fund maintained an underweight to general obligation (GO) bonds and an overweight to revenue bonds, which detracted from relative performance versus the benchmark. |
| ■ | The Fund maintained a short duration position throughout the period, which added to performance. Sector selection was also slightly positive for the period. |
| Credit quality as of June 30, 20221 |

| 1 | The credit quality distribution of portfolio holdings reflected in the chart is based on ratings from Standard & Poor’s, Moody’s Investors Service, and/or Fitch Ratings Ltd. Credit quality ratings apply to the underlying holdings of the Fund and not to the Fund itself. The percentages of the portfolio with the ratings depicted in the chart are calculated based on the market value of fixed income securities held by the Fund. If a security was rated by all three rating agencies, the middle rating was utilized. If rated by two of the three rating agencies, the lower rating was utilized, and if rated by one of the rating agencies, that rating was utilized. Standard & Poor’s rates the creditworthiness of bonds, ranging from AAA (highest) to D (lowest). Ratings from A to CCC may be modified by the addition of a plus (+) or minus (-) sign to show relative standing within the rating categories. Standard & Poor’s rates the creditworthiness of short-term notes from SP-1 (highest) to SP-3 (lowest). Moody’s rates the creditworthiness of bonds, ranging from Aaa (highest) to C (lowest). Ratings Aa to B may be modified by the addition of a number 1 (highest) to 3 (lowest) to show relative standing within the ratings categories. Moody’s rates the creditworthiness of short-term U.S. tax-exempt municipal securities from MIG 1/VMIG 1 (highest) to SG (lowest). Fitch rates the creditworthiness of bonds, ranging from AAA (highest) to D (lowest). Credit quality distribution is subject to change and may have changed since the date specified. |
| Effective maturity distribution as of June 30, 20221 |

| 1 | Figures represent the percentage of the Fund's long-term investments. These amounts are subject to change and may have changed since the date specified. |
| * | The Bloomberg Municipal Bond Index is an unmanaged index composed of long-term tax-exempt bonds with a minimum credit rating of Baa. You cannot invest directly in an index. |
| Beginning account value 1-1-2022 | Ending account value 6-30-2022 | Expenses paid during the period1 | Annualized net expense ratio | |
| Class A | ||||
| Actual | $1,000.00 | $ 943.56 | $3.81 | 0.79% |
| Hypothetical (5% return before expenses) | $1,000.00 | $1,020.88 | $3.96 | 0.79% |
| Class C | ||||
| Actual | $1,000.00 | $ 940.27 | $7.41 | 1.54% |
| Hypothetical (5% return before expenses) | $1,000.00 | $1,017.16 | $7.70 | 1.54% |
| Class R6 | ||||
| Actual | $1,000.00 | $ 945.34 | $1.98 | 0.41% |
| Hypothetical (5% return before expenses) | $1,000.00 | $1,022.76 | $2.06 | 0.41% |
| Administrator Class | ||||
| Actual | $1,000.00 | $ 944.08 | $3.28 | 0.68% |
| Hypothetical (5% return before expenses) | $1,000.00 | $1,021.42 | $3.41 | 0.68% |
| Institutional Class | ||||
| Actual | $1,000.00 | $ 945.11 | $2.22 | 0.46% |
| Hypothetical (5% return before expenses) | $1,000.00 | $1,022.51 | $2.31 | 0.46% |
| Interest rate | Maturity date | Principal | Value | ||
| Municipal obligations: 96.83% | |||||
| Alabama: 1.98% | |||||
| Health revenue: 0.22% | |||||
| Birmingham AL Special Care Facilities Ascension Senior Credit Group Series C-1 | 1.85% | 11-15-2046 | $ 5,395,000 | $ 5,396,707 | |
| Housing revenue: 0.39% | |||||
| Alabama HFA MFHR South Oak Residences Series A | 1.25 | 12-1-2025 | 10,000,000 | 9,630,343 | |
| Industrial development revenue: 0.15% | |||||
| Selma AL Industrial Development Board Refunding Bonds Gulf Opportunity Zone International Paper Company | 2.00 | 11-1-2033 | 3,675,000 | 3,585,348 | |
| Utilities revenue: 1.22% | |||||
| Black Belt Energy Gas District Alabama Gas Prepay Series A | 4.00 | 12-1-2048 | 2,000,000 | 2,034,863 | |
| Black Belt Energy Gas District Alabama Gas Project #6 Series B | 4.00 | 10-1-2052 | 6,500,000 | 6,578,605 | |
| Lower Alabama Gas Supply District Project #2 | 4.00 | 12-1-2050 | 8,660,000 | 8,787,886 | |
| Southeast Alabama Gas Supply District Project #2 Series 2018A | 4.00 | 6-1-2049 | 12,150,000 | 12,269,138 | |
| 29,670,492 | |||||
| 48,282,890 | |||||
| Alaska: 0.35% | |||||
| Health revenue: 0.23% | |||||
| Alaska IDA & Export Tanana Chiefs Conference Project Series 2019A | 5.00 | 10-1-2027 | 1,455,000 | 1,582,344 | |
| Alaska IDA & Export Tanana Chiefs Conference Project Series 2019A | 5.00 | 10-1-2028 | 1,530,000 | 1,675,369 | |
| Alaska IDA & Export Tanana Chiefs Conference Project Series 2019A | 5.00 | 10-1-2029 | 2,220,000 | 2,447,711 | |
| 5,705,424 | |||||
| Utilities revenue: 0.12% | |||||
| Alaska IDA & Export Power Refunding Bonds Snettisham Hydroelectric Project Series 2015 | 5.00 | 1-1-2023 | 2,835,000 | 2,871,159 | |
| 8,576,583 | |||||
| Arizona: 2.31% | |||||
| Education revenue: 0.64% | |||||
| Arizona Board of Regents University Arizona System Revenue Refunding Bonds Speed Series C | 5.00 | 8-1-2023 | 1,000,000 | 1,034,717 | |
| Arizona Board of Regents University Arizona System Revenue Refunding Bonds Speed Series C | 5.00 | 8-1-2025 | 600,000 | 646,145 | |
| Arizona IDA Education Revenue Agribusiness & Equine Center Incorporated Project Series 2017B 144Aøø | 4.00 | 3-1-2027 | 995,000 | 977,542 | |
| Arizona IDA Education Revenue Jerome Facility Project Series B | 4.00 | 7-1-2034 | 230,000 | 213,010 | |
| Arizona IDA Education Revenue Jerome Facility Project Series B | 5.00 | 7-1-2029 | 160,000 | 164,850 | |
| Arizona IDA Education Revenue Jerome Facility Project Series B | 5.00 | 7-1-2030 | 190,000 | 195,137 |
| Interest rate | Maturity date | Principal | Value | ||
| Education revenue (continued) | |||||
| Arizona IDA Education Revenue Jerome Facility Project Series B | 5.00% | 7-1-2031 | $ 200,000 | $ 204,747 | |
| Arizona IDA Education Revenue Jerome Facility Project Series B | 5.00 | 7-1-2032 | 210,000 | 214,489 | |
| Arizona IDA Education Revenue Jerome Facility Project Series B | 5.00 | 7-1-2033 | 220,000 | 224,258 | |
| Arizona IDA Education Revenue Leman Academy of Excellence Incorporated Parker Colorado Campus Project Series A 144A | 4.50 | 7-1-2029 | 765,000 | 745,305 | |
| Pima County AZ IDA American Leadership Academy Project Series 2015 144A | 4.60 | 6-15-2025 | 605,000 | 610,562 | |
| Pima County AZ IDA Charter Schools Project Series 2013 | 4.50 | 7-1-2022 | 710,000 | 710,000 | |
| Pima County AZ IDA Education Revenue Refunding Bonds 144A | 4.00 | 6-15-2026 | 2,585,000 | 2,558,007 | |
| Pima County AZ IDA Education Revenue Refunding Bonds 144A | 4.00 | 6-15-2028 | 2,785,000 | 2,705,939 | |
| Pima County AZ IDA Education Revenue Refunding Bonds American Leadership Project 144A | 4.00 | 6-15-2024 | 2,140,000 | 2,144,327 | |
| Pima County AZ IDA Education Revenue Refunding Bonds Facility Edkey Charter 144A | 3.50 | 7-1-2025 | 1,985,000 | 1,946,033 | |
| Pima County AZ IDA Noah Webster Schools Project Series A | 5.50 | 12-15-2023 | 415,000 | 420,704 | |
| 15,715,772 | |||||
| Health revenue: 0.66% | |||||
| Arizona Health Facilities Authority Banner Health Series B (SIFMA Municipal Swap +0.25%) ± | 1.23 | 1-1-2046 | 5,000,000 | 4,862,533 | |
| Maricopa County AZ IDA Senior Living Facilities Christian Care Retirement Apartments Incorporated Project | 5.00 | 1-1-2023 | 1,120,000 | 1,137,475 | |
| Maricopa County AZ IDA Senior Living Facilities Christian Care Surprise Incorporated Project 144A | 5.00 | 1-1-2026 | 3,420,000 | 3,090,763 | |
| Maricopa County AZ IDA Series 2019C (SIFMA Municipal Swap +0.57%) ± | 1.48 | 1-1-2035 | 5,485,000 | 5,450,362 | |
| Tempe AZ IDA Friendship Village of Tempe Project Series A | 4.00 | 12-1-2022 | 205,000 | 205,253 | |
| Tempe AZ IDA Friendship Village of Tempe Project Series A | 4.00 | 12-1-2023 | 215,000 | 214,674 | |
| Tempe AZ IDA Friendship Village of Tempe Project Series A | 4.00 | 12-1-2024 | 220,000 | 218,946 | |
| Tempe AZ IDA Friendship Village of Tempe Project Series A | 4.00 | 12-1-2025 | 270,000 | 266,946 | |
| Tempe AZ IDA Friendship Village of Tempe Project Series A | 4.00 | 12-1-2026 | 245,000 | 239,667 | |
| Tempe AZ IDA Friendship Village of Tempe Project Series A��� | 4.00 | 12-1-2027 | 350,000 | 338,411 | |
| 16,025,030 | |||||
| Industrial development revenue: 0.50% | |||||
| Chandler AZ IDA Intel Corporation Project | 5.00 | 6-1-2049 | 11,645,000 | 12,186,652 | |
| Miscellaneous revenue: 0.51% | |||||
| Arizona IDA Revenue Lincoln South Beltway Project | 5.00 | 2-1-2027 | 1,255,000 | 1,379,663 | |
| Arizona IDA Revenue Lincoln South Beltway Project | 5.00 | 5-1-2027 | 1,125,000 | 1,241,426 | |
| Arizona IDA Revenue Lincoln South Beltway Project | 5.00 | 8-1-2027 | 1,205,000 | 1,334,224 | |
| Arizona IDA Revenue Lincoln South Beltway Project | 5.00 | 11-1-2027 | 1,000,000 | 1,110,282 | |
| Navajo Nation Series A 144A | 4.00 | 12-1-2022 | 3,235,000 | 3,240,836 | |
| Navajo Nation Series A 144A | 5.00 | 12-1-2025 | 4,110,000 | 4,240,891 | |
| 12,547,322 | |||||
| 56,474,776 |
| Interest rate | Maturity date | Principal | Value | ||
| Arkansas: 0.10% | |||||
| Tax revenue: 0.10% | |||||
| Bentonville AR Sales & Use Tax Refunding and Improvement Bonds Series 2021B | 1.05% | 11-1-2046 | $ 2,240,000 | $ 2,155,821 | |
| Cabot AR Sales & Use Tax Refunding Bonds Series B | 4.00 | 12-1-2029 | 230,000 | 246,298 | |
| Cabot AR Sales & Use Tax Refunding Bonds Series B | 4.00 | 12-1-2030 | 125,000 | 133,248 | |
| 2,535,367 | |||||
| California: 2.98% | |||||
| Airport revenue: 0.13% | |||||
| Port of Oakland AMT Series H | 5.00 | 5-1-2024 | 225,000 | 237,044 | |
| Port of Oakland AMT Series H | 5.00 | 5-1-2024 | 2,875,000 | 3,013,045 | |
| 3,250,089 | |||||
| Education revenue: 0.45% | |||||
| California Municipal Finance Authority Charter School Nova Academy Project Series 2016A 144A | 4.00 | 6-15-2026 | 525,000 | 521,021 | |
| California School Finance Authority Charter School Rocketship Education Obligated Group Series 2017A 144A | 4.50 | 6-1-2027 | 250,000 | 253,657 | |
| The Regents of the University of California Series 2013AI | 5.00 | 5-15-2033 | 10,000,000 | 10,251,007 | |
| 11,025,685 | |||||
| GO revenue: 0.45% | |||||
| California Series A (State Street Bank & Trust Company LOC) ø | 0.78 | 5-1-2048 | 11,100,000 | 11,100,000 | |
| Health revenue: 0.82% | |||||
| California CDA Health Facilities Catholic Series D (AGM Insured) € | 0.88 | 7-1-2041 | 8,700,000 | 8,700,000 | |
| California CDA Health Facilities Catholic Series E (AGM Insured) € | 1.39 | 7-1-2040 | 8,525,000 | 8,525,000 | |
| California PFA Revenue Henry Mayo Newhall Hospital Series A | 4.00 | 10-15-2026 | 415,000 | 424,469 | |
| California PFA Revenue Henry Mayo Newhall Hospital Series A | 4.00 | 10-15-2027 | 400,000 | 407,837 | |
| California PFA Senior Living Revenue Refunding Bond Enso Village Project Series A 144A | 5.00 | 11-15-2036 | 1,000,000 | 984,843 | |
| California PFA Senior Living Revenue Refunding Bond Enso Village Project Series B2 144A | 2.38 | 11-15-2028 | 1,000,000 | 917,989 | |
| 19,960,138 | |||||
| Housing revenue: 0.16% | |||||
| California HFA Municipal Certificate of Participation Series 2 Class A | 4.00 | 3-20-2033 | 1,441,195 | 1,424,695 | |
| California Municipal Finance Authority Orchard Park Student Housing Project Series 2021 (BAM Insured) | 5.00 | 5-15-2024 | 500,000 | 522,528 | |
| California Municipal Finance Authority Orchard Park Student Housing Project Series 2021 (BAM Insured) | 5.00 | 5-15-2025 | 400,000 | 423,205 | |
| California Municipal Finance Authority Orchard Park Student Housing Project Series 2021 (BAM Insured) | 5.00 | 5-15-2026 | 400,000 | 428,577 |
| Interest rate | Maturity date | Principal | Value | ||
| Housing revenue (continued) | |||||
| California Municipal Finance Authority Orchard Park Student Housing Project Series 2021 (BAM Insured) | 5.00% | 5-15-2027 | $ 500,000 | $ 541,214 | |
| California Municipal Finance Authority Orchard Park Student Housing Project Series 2021 (BAM Insured) | 5.00 | 5-15-2028 | 400,000 | 435,472 | |
| 3,775,691 | |||||
| Miscellaneous revenue: 0.17% | |||||
| California Infrastructure and Economic Development Bank J Paul Getty Trust Series 2021-B2 | 3.00 | 10-1-2047 | 1,000,000 | 1,014,811 | |
| Compton CA PFA Refunding Bond 144A | 4.00 | 9-1-2022 | 1,175,000 | 1,175,748 | |
| Independent Cities Finance Authority California Sales Tax Revenue (AGM Insured) 144A | 4.00 | 6-1-2024 | 310,000 | 318,193 | |
| Independent Cities Finance Authority California Sales Tax Revenue (AGM Insured) 144A | 4.00 | 6-1-2026 | 350,000 | 364,516 | |
| Independent Cities Finance Authority California Sales Tax Revenue (AGM Insured) 144A | 4.00 | 6-1-2036 | 800,000 | 805,870 | |
| Tender Option Bond Trust Receipts/Floater Certificates Series 2021-XG0318 (Deutsche Bank LIQ) 144Aø | 1.04 | 6-15-2055 | 497,500 | 497,500 | |
| 4,176,638 | |||||
| Tax revenue: 0.06% | |||||
| Riverside County CA Public Financing Project Area #1 (BAM Insured) | 5.00 | 10-1-2026 | 1,250,000 | 1,345,876 | |
| Transportation revenue: 0.63% | |||||
| Bay Area Toll Authority Toll Bridge San Francisco Bay Area Series C (SIFMA Municipal Swap +0.45%) ± | 1.43 | 4-1-2056 | 2,000,000 | 1,959,256 | |
| Bay Area Toll Authority Toll Bridge San Francisco Bay Area Series D (SIFMA Municipal Swap +0.30%) ± | 1.28 | 4-1-2056 | 14,000,000 | 13,534,660 | |
| 15,493,916 | |||||
| Utilities revenue: 0.11% | |||||
| California Community Choice Financing Authority Clean Energy Project Green Bond Series B-1 | 4.00 | 2-1-2052 | 2,600,000 | 2,598,111 | |
| 72,726,144 | |||||
| Colorado: 1.01% | |||||
| Airport revenue: 0.23% | |||||
| Denver CO City & County Airport System Revenue Series 2012B | 5.00 | 12-1-2030 | 5,000,000 | 5,536,248 | |
| Education revenue: 0.32% | |||||
| Colorado ECFA Charter School New Summit Charter 144A | 4.00 | 7-1-2031 | 310,000 | 289,909 | |
| Colorado ECFA Eagle Ridge Academy Project 144A | 3.63 | 11-1-2026 | 1,250,000 | 1,250,224 | |
| Colorado ECFA Rocky Mountain Classical Academy Project | 6.38 | 9-1-2023 | 630,000 | 649,614 | |
| Colorado School of Mines Institutional Enterprise Refunding Bonds Series 2018A (1 Month LIBOR +0.50%) ± | 1.21 | 2-1-2023 | 5,595,000 | 5,575,960 | |
| 7,765,707 | |||||
| GO revenue: 0.14% | |||||
| Aviation Station North Metropolitan District #2 Colorado Improvement & Refunding Bonds Limited Tax Series A | 4.00 | 12-1-2029 | 500,000 | 472,611 | |
| Grand River CO Hospital District (AGM Insured) | 5.00 | 12-1-2025 | 1,000,000 | 1,071,816 |
| Interest rate | Maturity date | Principal | Value | ||
| GO revenue (continued) | |||||
| Mirabelle Metropolitan District #2 Colorado Senior Series A | 5.00% | 12-1-2039 | $ 700,000 | $ 662,577 | |
| Peak Metropolitan District #1 Colorado Limited Tax Series A 144A | 4.00 | 12-1-2035 | 500,000 | 430,790 | |
| Sterling Ranch Community Authority Board Colorado Supported Revenue Refunding Bonds and Improvement Limited Tax District #2 | 3.38 | 12-1-2030 | 500,000 | 433,503 | |
| Thompson Crossing Metropolitan District #4 Colorado Improvement & Refunding Bonds Limited Tax | 3.50 | 12-1-2029 | 515,000 | 467,510 | |
| 3,538,807 | |||||
| Health revenue: 0.13% | |||||
| Colorado Health Facilities Authority Hospital CommonSpirit Health Series B-2 | 5.00 | 8-1-2049 | 3,000,000 | 3,170,162 | |
| Miscellaneous revenue: 0.07% | |||||
| Colorado Bridge Enterprise Senior Revenue Bonds AMT Central 70 Project Private Activity Bond | 4.00 | 12-31-2024 | 1,610,000 | 1,663,514 | |
| Tax revenue: 0.09% | |||||
| Centerra CO Metropolitan District #1 Series 2017 144A | 5.00 | 12-1-2022 | 1,940,000 | 1,948,377 | |
| Pueblo CO Urban Renewal Authority Evraz Project Series B 144A¤ | 0.00 | 12-1-2025 | 200,000 | 165,983 | |
| 2,114,360 | |||||
| Transportation revenue: 0.03% | |||||
| Colorado E-470 Public Highway Authority Senior Revenue Bond Series 2020-A | 5.00 | 9-1-2040 | 800,000 | 835,052 | |
| 24,623,850 | |||||
| Connecticut: 2.27% | |||||
| Education revenue: 0.23% | |||||
| Connecticut HEFA University of Hartford Project Series N | 5.00 | 7-1-2026 | 575,000 | 600,134 | |
| Connecticut HEFA University of Hartford Project Series N | 5.00 | 7-1-2027 | 430,000 | 450,921 | |
| Connecticut HEFA University of Hartford Project Series N | 5.00 | 7-1-2028 | 530,000 | 555,400 | |
| Connecticut HEFAR Yale University Issue Series A-2 | 2.00 | 7-1-2042 | 1,500,000 | 1,453,993 | |
| Connecticut Higher Education Supplemental Loan Authority AMT Chelsea Loan Program Series B | 5.00 | 11-15-2025 | 480,000 | 522,560 | |
| Connecticut Higher Education Supplemental Loan Authority AMT Chelsea Loan Program Series B | 5.00 | 11-15-2026 | 385,000 | 427,139 | |
| Connecticut Higher Education Supplemental Loan Authority AMT Chelsea Loan Program Series B | 5.00 | 11-15-2026 | 940,000 | 1,025,617 | |
| Connecticut Higher Education Supplemental Loan Authority AMT Chelsea Loan Program Series B | 5.00 | 11-15-2027 | 125,000 | 138,682 | |
| Connecticut Higher Education Supplemental Loan Authority AMT Chelsea Loan Program Series B | 5.00 | 11-15-2027 | 500,000 | 551,238 | |
| 5,725,684 | |||||
| GO revenue: 0.37% | |||||
| Bridgeport CT Series A | 5.00 | 6-1-2026 | 1,220,000 | 1,330,923 | |
| Bridgeport CT Series A | 5.00 | 6-1-2027 | 1,425,000 | 1,573,224 | |
| Bridgeport CT Series A | 5.00 | 6-1-2028 | 1,605,000 | 1,790,580 |
| Interest rate | Maturity date | Principal | Value | ||
| GO revenue (continued) | |||||
| Hartford CT Series A | 5.00% | 4-1-2025 | $ 2,500,000 | $ 2,551,954 | |
| Hartford CT Series A | 5.00 | 4-1-2027 | 1,650,000 | 1,681,820 | |
| 8,928,501 | |||||
| Health revenue: 0.37% | |||||
| Connecticut HEFA Revenue Hartford Healthcare Series B-2 | 5.00 | 7-1-2053 | 7,800,000 | 8,540,673 | |
| Connecticut HEFA Revenue McLean Affiliates Incorporated Series B-2 144A | 2.75 | 1-1-2026 | 650,000 | 625,629 | |
| 9,166,302 | |||||
| Tax revenue: 1.30% | |||||
| Connecticut Special Tax Obligation Revenue Transportation Infrastructure Purpose Series A | 5.00 | 8-1-2029 | 17,125,000 | 18,302,145 | |
| Connecticut Special Tax Obligation Revenue Transportation Infrastructure Purpose Series B | 5.00 | 10-1-2030 | 3,000,000 | 3,351,035 | |
| Connecticut Special Tax Obligation Revenue Transportation Infrastructure Purpose Series B | 5.00 | 10-1-2031 | 9,000,000 | 10,001,195 | |
| 31,654,375 | |||||
| 55,474,862 | |||||
| Delaware: 0.05% | |||||
| Education revenue: 0.05% | |||||
| Delaware EDA Odyssey Charter School Project Series A 144A | 6.25 | 9-1-2025 | 1,225,000 | 1,268,400 | |
| District of Columbia: 0.51% | |||||
| Airport revenue: 0.27% | |||||
| Metropolitan Washington DC Airports Authority System Revenue Refunding Bond AMT Series A | 5.00 | 10-1-2025 | 6,000,000 | 6,439,193 | |
| Education revenue: 0.08% | |||||
| District of Columbia Revenue Two Rivers Public Charter School Incorporated | 3.00 | 6-1-2030 | 1,100,000 | 1,005,098 | |
| District of Columbia Revenue Two Rivers Public Charter School Incorporated | 4.00 | 6-1-2030 | 1,000,000 | 982,671 | |
| 1,987,769 | |||||
| Water & sewer revenue: 0.16% | |||||
| District of Columbia Water and Sewer Authority Public Utility Subordinated Lien Bond Series C | 1.75 | 10-1-2054 | 4,000,000 | 3,963,591 | |
| 12,390,553 | |||||
| Florida: 2.98% | |||||
| Airport revenue: 0.75% | |||||
| Broward County FL Port Facilities Revenue Refunding Bonds Series C | 5.00 | 9-1-2027 | 2,330,000 | 2,614,773 | |
| Miami-Dade County FL Aviation Refunding Bonds AMT | 5.00 | 10-1-2029 | 11,000,000 | 11,380,733 | |
| Miami-Dade County FL Aviation Refunding Bonds AMT | 5.00 | 10-1-2030 | 1,325,000 | 1,374,524 | |
| Miami-Dade County FL Seaport AMT Series B | 6.00 | 10-1-2032 | 1,385,000 | 1,452,241 | |
| Miami-Dade County FL Seaport AMT Series B | 6.00 | 10-1-2033 | 1,500,000 | 1,572,825 | |
| 18,395,096 |
| Interest rate | Maturity date | Principal | Value | ||
| Education revenue: 0.39% | |||||
| Capital Trust Agency Educational Facilities Renaissance Charter School Incorporated Projects Series 2017A 144A | 4.38% | 6-15-2027 | $ 955,000 | $ 949,782 | |
| Capital Trust Agency Educational Facilities Renaissance Charter School Incorporated Projects Series 2019A 144A | 4.00 | 6-15-2029 | 2,255,000 | 2,184,418 | |
| Capital Trust Agency Educational Facilities Renaissance Imagine School at Land O' Lakes 144A | 3.00 | 12-15-2029 | 420,000 | 379,768 | |
| Florida Development Finance Corporation Educational Facilities Revenue Renaissance Charter School Incorporated 144A | 4.00 | 9-15-2030 | 470,000 | 454,331 | |
| Florida State HEFAR Educational Facilities Florida Institute of Technology | 5.00 | 10-1-2027 | 650,000 | 696,829 | |
| Florida State HEFAR Educational Facilities Florida Institute of Technology | 5.00 | 10-1-2028 | 1,050,000 | 1,129,519 | |
| Florida State HEFAR Educational Facilities Florida Institute of Technology | 5.00 | 10-1-2029 | 1,000,000 | 1,077,274 | |
| Miami-Dade County FL IDA Youth Charter Schools Project Series 2015A 144A | 5.00 | 9-15-2025 | 550,000 | 556,314 | |
| Palm Beach County FL Educational Facilities Authority Revenue Atlantic University Incorporated | 4.00 | 10-1-2029 | 420,000 | 421,833 | |
| Palm Beach County FL Educational Facilities Authority Revenue Atlantic University Incorporated | 4.00 | 10-1-2030 | 870,000 | 866,142 | |
| Palm Beach County FL Educational Facilities Authority Revenue Atlantic University Incorporated | 4.00 | 10-1-2031 | 660,000 | 651,491 | |
| 9,367,701 | |||||
| Health revenue: 0.23% | |||||
| Florida Development Finance Corporation Senior Living Revenue Mayflower Retirement Community 144A | 1.75 | 6-1-2026 | 510,000 | 467,664 | |
| Palm Beach County FL HFA Revenue Toby and Leon Cooperman Sinai Residences Project | 2.63 | 6-1-2025 | 4,000,000 | 3,796,715 | |
| St. Johns County FL IDA Senior Living Vicars Landing Project Series A | 4.00 | 12-15-2029 | 225,000 | 206,672 | |
| St. Johns County FL IDA Senior Living Vicars Landing Project Series A | 4.00 | 12-15-2030 | 200,000 | 181,587 | |
| St. Johns County FL IDA Senior Living Vicars Landing Project Series A | 4.00 | 12-15-2031 | 205,000 | 183,557 | |
| St. Johns County FL IDA Senior Living Vicars Landing Project Series A | 4.00 | 12-15-2036 | 1,000,000 | 840,266 | |
| 5,676,461 | |||||
| Housing revenue: 0.21% | |||||
| Capital Trust Agency Florida College Park Towers Apartments Project (Department of Housing and Urban Development Insured) | 1.25 | 5-1-2024 | 4,000,000 | 3,968,679 | |
| University of West Florida Foundation Incorporated Dormitory Series A | 5.00 | 6-1-2023 | 1,190,000 | 1,222,087 | |
| 5,190,766 | |||||
| Industrial development revenue: 0.16% | |||||
| Escambia County FL Environmental Improvement Refunding Bonds International Paper Company Project Series B | 2.00 | 11-1-2033 | 825,000 | 804,874 |
| Interest rate | Maturity date | Principal | Value | ||
| Industrial development revenue (continued) | |||||
| Florida Development Finance Corporation Solid Waste AMT Pro USA Incorporated | 3.00% | 6-1-2032 | $ 1,500,000 | $ 1,214,475 | |
| Florida Development Finance Corporation Solid Waste AMT Pro USA Incorporated 144A | 5.00 | 5-1-2029 | 2,000,000 | 1,941,384 | |
| 3,960,733 | |||||
| Miscellaneous revenue: 0.14% | |||||
| Capital Trust Agency Florida College Park Towers Apartments Project 144A | 4.00 | 6-15-2024 | 1,000,000 | 987,113 | |
| Capital Trust Agency Florida College Park Towers Apartments Project 144A | 4.00 | 6-15-2025 | 350,000 | 342,013 | |
| Florida Village Community Development District #10 Special Assessment Bonds | 5.13 | 5-1-2024 | 905,000 | 915,301 | |
| Florida Village Community Development District #13 Special Assessment Bonds | 2.63 | 5-1-2024 | 250,000 | 243,980 | |
| Pinellas County FL IDA 2017 Foundation for Global Understanding Incorporated Project | 5.00 | 7-1-2029 | 810,000 | 833,883 | |
| 3,322,290 | |||||
| Resource recovery revenue: 0.14% | |||||
| Florida Development Finance Corporation Solid Waste AMT Pro USA Incorporated 144A | 5.00 | 8-1-2029 | 3,500,000 | 3,494,876 | |
| Transportation revenue: 0.06% | |||||
| Osceola County FL Transportation Revenue Improvement & Refunding Bonds Osceola Parkway Series 2019A-1 | 5.00 | 10-1-2027 | 950,000 | 1,009,104 | |
| Osceola County FL Transportation Revenue Improvement & Refunding Bonds Osceola Parkway Series 2019A-1 | 5.00 | 10-1-2029 | 450,000 | 480,346 | |
| 1,489,450 | |||||
| Water & sewer revenue: 0.90% | |||||
| Charlotte County FL IDA 144A | 4.00 | 10-1-2041 | 1,250,000 | 1,001,639 | |
| North Sumter County Utility Dependent District Florida Utility Revenue Sumter Water Conservation Authority Project (AGM Insured) | 5.00 | 10-1-2029 | 1,055,000 | 1,206,874 | |
| North Sumter County Utility Dependent District Florida Utility Revenue Sumter Water Conservation Authority Project (AGM Insured) | 5.00 | 10-1-2030 | 1,760,000 | 2,030,015 | |
| North Sumter County Utility Dependent District Florida Utility Revenue Sumter Water Conservation Authority Project (AGM Insured) | 5.00 | 10-1-2031 | 1,980,000 | 2,294,110 | |
| North Sumter County Utility Dependent District Florida Utility Revenue Sumter Water Conservation Authority Project (AGM Insured) | 5.00 | 10-1-2032 | 2,080,000 | 2,400,087 | |
| Tohopekaliga Water Authority Florida Utility System Series 2020 144A | 5.00 | 10-1-2025 | 12,000,000 | 13,061,582 | |
| 21,994,307 | |||||
| 72,891,680 | |||||
| Georgia: 5.48% | |||||
| Health revenue: 0.12% | |||||
| Fulton County GA Residential Care Facilities Elderly Authority Revenue Entrance Fee Canterbury Court 144A | 2.25 | 10-1-2028 | 3,665,000 | 3,070,621 |
| Interest rate | Maturity date | Principal | Value | ||
| Industrial development revenue: 0.19% | |||||
| George L Smith II Georgia World Congress Center Authority Convention Center Hotel Series B 144A | 3.63% | 1-1-2031 | $ 2,000,000 | $ 1,764,478 | |
| George L Smith II Georgia World Congress Center Authority Convention Center Hotel Series B 144A | 5.00 | 1-1-2036 | 1,750,000 | 1,654,520 | |
| George L Smith II Georgia World Congress Center Authority Convention Center Hotel Series B 144A | 5.00 | 1-1-2054 | 1,500,000 | 1,283,359 | |
| 4,702,357 | |||||
| Transportation revenue: 0.05% | |||||
| Georgia Road & Tollway Authority I-75 S Express Lanes Project Series A 144A¤ | 0.00 | 6-1-2024 | 1,300,000 | 1,230,240 | |
| Utilities revenue: 5.12% | |||||
| Appling County Development Authority Oglethorpe Power Corporation Hatch Project | 1.50 | 1-1-2038 | 2,500,000 | 2,395,965 | |
| Bartow County Development Authority Pollution Control Georgia Power Company Plant Bowen Project | 1.55 | 8-1-2043 | 6,500,000 | 6,493,098 | |
| Bartow County Development Authority Pollution Control Georgia Power Company Plant Bowen Project | 1.80 | 9-1-2029 | 1,000,000 | 888,441 | |
| Bartow County Development Authority Pollution Control Georgia Power Company Plant Bowen Project | 2.75 | 12-1-2032 | 4,950,000 | 4,945,807 | |
| Burke County GA Development Authority Oglethorpe Power Corporation Vogtle Project Series E | 3.25 | 11-1-2045 | 3,000,000 | 3,011,443 | |
| Burke County GA Development Authority Oglethorpe Power Corporation Vogtle Project Series F | 3.00 | 11-1-2045 | 14,955,000 | 14,986,202 | |
| Burke County GA Development Authority PCR Bonds Georgia Power Company Plant Vogtle Project | 1.70 | 12-1-2049 | 3,500,000 | 3,389,592 | |
| Burke County GA Development Authority PCR Bonds Georgia Power Company Plant Vogtle Project | 2.25 | 10-1-2032 | 1,500,000 | 1,490,803 | |
| Dalton GA Utilities Revenue Combined Bonds | 5.00 | 3-1-2023 | 625,000 | 638,390 | |
| Dalton GA Utilities Revenue Combined Bonds | 5.00 | 3-1-2024 | 350,000 | 366,594 | |
| Dalton GA Utilities Revenue Combined Bonds | 5.00 | 3-1-2025 | 400,000 | 425,162 | |
| Dalton GA Utilities Revenue Combined Bonds | 5.00 | 3-1-2026 | 600,000 | 647,667 | |
| Dalton GA Utilities Revenue Combined Bonds | 5.00 | 3-1-2027 | 700,000 | 767,061 | |
| Dalton GA Utilities Revenue Combined Bonds | 5.00 | 3-1-2028 | 850,000 | 941,895 | |
| Dalton GA Utilities Revenue Combined Bonds | 5.00 | 3-1-2029 | 1,000,000 | 1,118,662 | |
| Dalton GA Utilities Revenue Combined Bonds | 5.00 | 3-1-2030 | 1,100,000 | 1,240,916 | |
| Dalton GA Utilities Revenue Combined Bonds | 5.00 | 3-1-2031 | 1,000,000 | 1,119,005 | |
| Dalton GA Utilities Revenue Combined Bonds | 5.00 | 3-1-2032 | 1,000,000 | 1,111,169 | |
| Main Street Natural Gas Incorporated Gas Supply Revenue Bonds Series 2022A | 4.00 | 12-1-2028 | 3,000,000 | 3,019,127 | |
| Main Street Natural Gas Incorporated Gas Supply Revenue Bonds Series 2022A | 4.00 | 12-1-2029 | 4,500,000 | 4,495,824 | |
| Main Street Natural Gas Incorporated Gas Supply Revenue Bonds Series 2022C 144A | 4.00 | 8-1-2052 | 23,000,000 | 22,620,799 | |
| Main Street Natural Gas Incorporated Georgia Gas Project Series B | 4.00 | 8-1-2049 | 10,000,000 | 10,281,218 | |
| Main Street Natural Gas Incorporated Georgia Gas Project Series C | 4.00 | 3-1-2050 | 10,235,000 | 10,267,607 | |
| Main Street Natural Gas Incorporated Georgia Gas Project Series C | 4.00 | 5-1-2052 | 7,265,000 | 7,273,208 | |
| Main Street Natural Gas Incorporated Georgia Gas Project Subordinate Bond Series A (Royal Bank of Canada LIQ) | 4.00 | 4-1-2048 | 2,640,000 | 2,686,251 | |
| Main Street Natural Gas Incorporated Georgia Gas Project Subordinate Bond Series B (1 Month LIBOR +0.75%) ± | 1.46 | 4-1-2048 | 4,700,000 | 4,666,101 |
| Interest rate | Maturity date | Principal | Value | ||
| Utilities revenue (continued) | |||||
| Municipal Electric Authority Georgia General Resolution Projects Subordinate Bonds Series A | 5.00% | 1-1-2028 | $ 1,035,000 | $ 1,136,937 | |
| Municipal Electric Authority Georgia General Resolution Projects Subordinated Bonds Series A | 5.00 | 1-1-2027 | 1,010,000 | 1,097,451 | |
| Municipal Electric Authority Georgia Plant Vogtle Units 3&4 Project J Series A (AGM Insured) %% | 5.00 | 7-1-2030 | 350,000 | 388,287 | |
| Municipal Electric Authority Georgia Plant Vogtle Units 3&4 Project J Series A (AGM Insured) %% | 5.00 | 7-1-2032 | 1,100,000 | 1,223,156 | |
| Municipal Electric Authority Georgia Plant Vogtle Units 3&4 Project M Series A | 5.00 | 1-1-2027 | 300,000 | 325,976 | |
| Municipal Electric Authority Georgia Plant Vogtle Units 3&4 Project M Series A | 5.00 | 1-1-2028 | 400,000 | 439,396 | |
| Municipal Electric Authority Georgia Plant Vogtle Units 3&4 Project M Series A | 5.00 | 1-1-2029 | 400,000 | 438,879 | |
| Municipal Electric Authority Georgia Plant Vogtle Units 3&4 Project P Series B | 5.00 | 1-1-2028 | 1,000,000 | 1,090,567 | |
| Municipal Electric Authority Georgia Plant Vogtle Units 3&4 Project P Series B | 5.00 | 1-1-2029 | 910,000 | 993,267 | |
| Municipal Electric Authority Georgia Project One Subordinated Bonds Series A | 5.00 | 1-1-2027 | 1,150,000 | 1,249,573 | |
| Municipal Electric Authority Georgia Project One Subordinated Bonds Series A | 5.00 | 1-1-2028 | 1,270,000 | 1,395,082 | |
| Municipal Electric Authority Georgia Project One Subordinated Bonds Series A | 5.00 | 1-1-2029 | 1,140,000 | 1,259,137 | |
| Municipal Electric Authority Georgia Project One Subordinated Bonds Series A | 5.00 | 1-1-2030 | 1,025,000 | 1,123,429 | |
| Municipal Electric Authority Georgia Project One Subordinated Bonds Series A | 5.00 | 1-1-2031 | 1,385,000 | 1,511,328 | |
| 124,960,472 | |||||
| 133,963,690 | |||||
| Guam: 0.15% | |||||
| Miscellaneous revenue: 0.08% | |||||
| Guam Government Department Education Certificate of Participation Refunding Bonds John F Kennedy High School | 3.63 | 2-1-2025 | 750,000 | 721,372 | |
| Guam Government Department Education Certificate of Participation Refunding Bonds John F Kennedy High School | 4.25 | 2-1-2030 | 1,355,000 | 1,315,967 | |
| 2,037,339 | |||||
| Tax revenue: 0.07% | |||||
| Guam Government Business Privilege Tax Refunding Bonds Series F | 5.00 | 1-1-2030 | 750,000 | 790,598 | |
| Guam Government Business Privilege Tax Refunding Bonds Series F | 5.00 | 1-1-2031 | 750,000 | 791,890 | |
| 1,582,488 | |||||
| 3,619,827 |
| Interest rate | Maturity date | Principal | Value | ||
| Hawaii: 0.32% | |||||
| Health revenue: 0.32% | |||||
| Hawaii Department of Budget & Finance Queens Health System Series B (SIFMA Municipal Swap +0.45%) ± | 1.36% | 7-1-2039 | $ 7,880,000 | $ 7,880,000 | |
| Illinois: 16.51% | |||||
| Airport revenue: 2.17% | |||||
| Chicago IL Midway Airport Second Lien Refunding Bonds Series 2013A | 5.50 | 1-1-2027 | 3,925,000 | 3,971,718 | |
| Chicago IL Midway Airport Second Lien Refunding Bonds Series 2014A | 5.00 | 1-1-2026 | 7,000,000 | 7,209,191 | |
| Chicago IL Midway Airport Second Lien Refunding Bonds Series 2014A | 5.00 | 1-1-2030 | 5,925,000 | 6,066,549 | |
| Chicago IL O'Hare International Airport AMT Passenger Facility Charge Refunding Bonds Series B | 5.00 | 1-1-2032 | 5,125,000 | 5,132,934 | |
| Chicago IL O'Hare International Airport Customer Facility Charge | 5.25 | 1-1-2023 | 1,350,000 | 1,372,566 | |
| Chicago IL O'Hare International Airport Customer Facility Charge | 5.25 | 1-1-2024 | 1,665,000 | 1,691,042 | |
| Chicago IL O'Hare International Airport Passenger Facility Charge | 4.00 | 1-1-2029 | 10,955,000 | 10,962,061 | |
| Chicago IL O'Hare International Airport Senior Lien Refunding Bonds Series 2013A | 5.00 | 1-1-2026 | 2,690,000 | 2,726,366 | |
| Chicago IL O'Hare International Airport Senior Lien Refunding Bonds Series 2015A | 5.00 | 1-1-2028 | 10,820,000 | 11,285,445 | |
| Chicago IL O'Hare International Airport Senior Lien Refunding Bonds Series 2017D | 5.00 | 1-1-2025 | 2,450,000 | 2,590,102 | |
| 53,007,974 | |||||
| Education revenue: 1.14% | |||||
| Illinois Finance Authority Charter School Revenue Series A 144A | 4.00 | 7-1-2031 | 1,735,000 | 1,516,387 | |
| Illinois Finance Authority Charter School Revenue Series A 144A | 5.00 | 7-1-2041 | 4,475,000 | 3,880,508 | |
| Illinois Finance Authority Revenue Refunding Bonds Bradley University Project Series C | 5.00 | 8-1-2028 | 1,860,000 | 1,957,054 | |
| Illinois Finance Authority Revenue University Chicago Series A | 5.00 | 10-1-2031 | 4,000,000 | 4,631,070 | |
| Illinois Finance Authority Revenue University Chicago Series A | 5.00 | 10-1-2032 | 3,750,000 | 4,366,021 | |
| Southern Illinois University Board of Trustees Housing & Auxiliary Facilities System Series A (BAM Insured) | 4.00 | 4-1-2028 | 725,000 | 753,463 | |
| Southern Illinois University Series A (BAM Insured) %% | 5.00 | 4-1-2029 | 675,000 | 737,230 | |
| Southern Illinois University Series A (BAM Insured) %% | 5.00 | 4-1-2030 | 800,000 | 874,442 | |
| Southern Illinois University Series A (BAM Insured) %% | 5.00 | 4-1-2031 | 570,000 | 623,835 | |
| Southern Illinois University Series A (BAM Insured) %% | 5.00 | 4-1-2032 | 500,000 | 545,450 | |
| University of Illinois Board of Trustees Auxiliary Facilities System Revenue Refunding Bonds Series 2013A | 4.00 | 4-1-2030 | 5,000,000 | 5,006,128 | |
| University of Illinois Board of Trustees Auxiliary Facilities System Revenue Refunding Bonds Series 2013A | 5.00 | 4-1-2026 | 3,000,000 | 3,056,548 | |
| 27,948,136 | |||||
| GO revenue: 6.51% | |||||
| Berwyn IL Series A | 5.00 | 12-1-2028 | 3,000,000 | 3,059,940 | |
| Berwyn IL Series A | 5.00 | 12-1-2029 | 2,345,000 | 2,378,946 |
| Interest rate | Maturity date | Principal | Value | ||
| GO revenue (continued) | |||||
| Chicago IL Board of Education Dedicated Revenues Series A | 5.00% | 12-1-2031 | $ 2,500,000 | $ 2,615,057 | |
| Chicago IL Board of Education Dedicated Revenues Series A | 5.00 | 12-1-2033 | 5,300,000 | 5,480,226 | |
| Chicago IL Board of Education Dedicated Revenues Series A | 5.00 | 12-1-2034 | 1,500,000 | 1,547,535 | |
| Chicago IL Board of Education Unlimited Tax GO Refunding Bonds Series 2018A (AGM Insured) | 5.00 | 12-1-2024 | 3,000,000 | 3,163,136 | |
| Chicago IL CAB City Colleges (NPFGC Insured) ¤ | 0.00 | 1-1-2024 | 14,800,000 | 14,133,701 | |
| Chicago IL CAB City Colleges (NPFGC Insured) ¤ | 0.00 | 1-1-2027 | 7,720,000 | 6,537,748 | |
| Chicago IL Park District GO Limited Series A | 5.00 | 1-1-2023 | 800,000 | 811,774 | |
| Chicago IL Park District GO Limited Series A | 5.00 | 1-1-2024 | 550,000 | 571,218 | |
| Chicago IL Park District GO Limited Series A | 5.00 | 1-1-2025 | 625,000 | 659,193 | |
| Chicago IL Park District GO Limited Series C | 5.00 | 1-1-2023 | 1,000,000 | 1,014,717 | |
| Chicago IL Park District GO Limited Series C | 5.00 | 1-1-2024 | 410,000 | 425,817 | |
| Chicago IL Park District Harbor Facilities Series D | 5.00 | 1-1-2023 | 1,175,000 | 1,195,072 | |
| Chicago IL Park District Unlimited Tax Series E | 5.00 | 11-15-2022 | 1,235,000 | 1,248,784 | |
| Chicago IL Park District Unlimited Tax Series E | 5.00 | 11-15-2023 | 1,295,000 | 1,341,399 | |
| Chicago IL Refunding Bonds Project Series 2003B | 5.13 | 1-1-2027 | 1,700,000 | 1,762,545 | |
| Chicago IL Refunding Bonds Project Series 2003B | 5.50 | 1-1-2032 | 1,145,000 | 1,183,536 | |
| Chicago IL Refunding Bonds Project Series 2015C | 5.00 | 1-1-2023 | 765,000 | 777,502 | |
| Chicago IL Series A | 5.00 | 1-1-2025 | 2,000,000 | 2,076,464 | |
| Chicago IL Series A | 5.00 | 1-1-2027 | 8,000,000 | 8,460,179 | |
| Chicago IL Series A | 5.00 | 1-1-2028 | 6,125,000 | 6,506,645 | |
| Chicago IL Series C | 5.00 | 1-1-2026 | 970,000 | 1,016,887 | |
| Chicago IL Unrefunded Balance Refunding Bonds Series C | 5.00 | 1-1-2023 | 1,735,000 | 1,763,354 | |
| Cook County IL Community Consolidated School District #15 Limited Tax | 5.00 | 12-1-2026 | 2,540,000 | 2,769,922 | |
| Cook County IL Refunding Bond Series A | 5.00 | 11-15-2027 | 2,000,000 | 2,216,470 | |
| Cook County IL School District #153 Homewood Series A (AGM Insured) ¤ | 0.00 | 12-15-2023 | 1,225,000 | 1,183,767 | |
| Cook County IL School District #227 Rich Township Refunding Bonds Series 2015 | 3.00 | 12-1-2024 | 965,000 | 979,660 | |
| Cook County IL School District #99 Cicero Limited Tax (BAM Insured) | 5.00 | 12-1-2026 | 3,030,000 | 3,322,723 | |
| Cook County IL School District #99 Cicero Limited Tax (BAM Insured) | 5.00 | 12-1-2027 | 2,950,000 | 3,284,927 | |
| Cook County IL School District #99 Cicero Limited Tax (BAM Insured) | 5.00 | 12-1-2028 | 2,285,000 | 2,571,280 | |
| Cook County IL School District #99 Cicero Refunding Bonds Limited Tax Series B | 5.00 | 12-1-2022 | 1,000,000 | 1,012,829 | |
| Cook County IL School District #99 Cicero Refunding Bonds Limited Tax Series B | 5.00 | 12-1-2024 | 1,000,000 | 1,059,903 | |
| Cook County IL School District #99 Cicero Refunding Bonds Limited Tax Series B | 5.00 | 12-1-2025 | 1,000,000 | 1,077,895 | |
| Cook County IL Series 2021A | 5.00 | 11-15-2033 | 3,850,000 | 4,239,723 | |
| Cook County IL Series A (AGM Insured) | 5.00 | 11-15-2026 | 3,000,000 | 3,287,465 | |
| Cook County IL Series A | 5.00 | 11-15-2030 | 2,200,000 | 2,372,214 | |
| Decatur IL Macon County GO Refunding Bonds Series 2013 | 5.00 | 3-1-2024 | 1,405,000 | 1,434,692 | |
| DeKalb & Kane Counties IL Community Unit School District #427 Sycamore Prerefunded Bond Balance CAB (AGM Insured) ¤ | 0.00 | 1-1-2024 | 455,000 | 441,794 | |
| DeKalb & Kane Counties IL Community Unit School District #427 Sycamore Prerefunded Bond Balance CAB (AGM Insured) ¤ | 0.00 | 1-1-2024 | 2,345,000 | 2,276,941 |
| Interest rate | Maturity date | Principal | Value | ||
| GO revenue (continued) | |||||
| DeKalb & Kane Counties IL Community Unit School District #427 Sycamore Prerefunded Bond Balance CAB (AGM Insured) ¤ | 0.00% | 1-1-2024 | $ 2,830,000 | $ 2,717,705 | |
| DuPage & Cook Counties IL Township High School District #86 Hinsdale | 4.00 | 1-15-2034 | 2,815,000 | 2,877,642 | |
| Illinois Land Refunding Bonds Series A | 5.00 | 10-1-2026 | 3,000,000 | 3,209,762 | |
| Illinois Series 2016 | 5.00 | 11-1-2025 | 5,000,000 | 5,294,180 | |
| Illinois Series A | 5.00 | 4-1-2023 | 3,500,000 | 3,565,132 | |
| Kane, Cook & DuPage Counties IL School District #46 Elgin Series 2015A | 5.00 | 1-1-2028 | 1,555,000 | 1,620,806 | |
| Kane, Cook & DuPage Counties IL School District #46 Elgin Series 2015D | 5.00 | 1-1-2032 | 1,025,000 | 1,067,609 | |
| Madison-Macoupin Etc Counties IL Community College District #536 Series A (BAM Insured) | 5.00 | 11-1-2025 | 1,620,000 | 1,720,222 | |
| Madison-Macoupin Etc Counties IL Community College District #536 Series A (BAM Insured) | 5.00 | 11-1-2026 | 1,410,000 | 1,496,242 | |
| Peoria County IL School District #150 Peoria Series A (AGM Insured) | 4.00 | 12-1-2027 | 1,000,000 | 1,061,491 | |
| Peoria County IL School District #150 Peoria Series A (AGM Insured) | 4.00 | 12-1-2028 | 950,000 | 1,004,992 | |
| Peoria County IL School District #150 Peoria Series A (AGM Insured) | 4.00 | 12-1-2029 | 4,000,000 | 4,211,377 | |
| Rockford IL Waterworks System Series B (BAM Insured) | 5.00 | 12-15-2022 | 1,065,000 | 1,081,071 | |
| Waukegan IL Series 2015A (AGM Insured) | 5.00 | 12-30-2031 | 1,000,000 | 1,066,841 | |
| Will County IL | 4.00 | 11-15-2035 | 2,490,000 | 2,521,349 | |
| Will County IL Lincoln-Way Community High School District #210 Unrefunded Bond CAB (AGM Insured) ¤ | 0.00 | 1-1-2025 | 14,385,000 | 13,402,795 | |
| Will County IL Lincoln-Way Community High School District #210 Unrefunded Bond CAB (AGM Insured) ¤ | 0.00 | 1-1-2026 | 8,695,000 | 7,827,941 | |
| 159,010,737 | |||||
| Health revenue: 0.26% | |||||
| Illinois Finance Authority Revenue Bonds Advocate Health Care Network | 4.00 | 11-1-2030 | 3,000,000 | 3,092,966 | |
| Illinois Finance Authority Revenue Bonds Lutheran Life Communities | 4.00 | 11-1-2022 | 390,000 | 389,815 | |
| Illinois Finance Authority Revenue Bonds Lutheran Life Communities | 4.00 | 11-1-2024 | 420,000 | 416,126 | |
| Illinois Finance Authority Revenue Bonds Series 2014 | 5.00 | 8-1-2038 | 1,520,000 | 1,609,358 | |
| Illinois Finance Authority Revenue Refunding Bonds Smith Crossing Series 2022 | 4.00 | 10-15-2025 | 295,000 | 291,419 | |
| Illinois Finance Authority Revenue Refunding Bonds Smith Crossing Series 2022 | 4.00 | 10-15-2028 | 670,000 | 644,719 | |
| 6,444,403 | |||||
| Housing revenue: 0.10% | |||||
| Illinois Housing Development Authority Homeowner Mortgage Series 2016C | 2.90 | 8-1-2031 | 1,000,000 | 991,765 | |
| Northern Illinois University Auxiliary Facilities System Series 2021 (BAM Insured) | 5.00 | 10-1-2027 | 350,000 | 383,820 | |
| Northern Illinois University Auxiliary Facilities System Series 2021 (BAM Insured) | 5.00 | 10-1-2029 | 650,000 | 724,620 | |
| Northern Illinois University Auxiliary Facilities System Series 2021 (BAM Insured) | 5.00 | 10-1-2030 | 325,000 | 364,727 | |
| 2,464,932 |
| Interest rate | Maturity date | Principal | Value | ||
| Miscellaneous revenue: 1.14% | |||||
| Chicago IL Board of Education Unlimited Tax GO Refunding Bonds Series 2019B | 5.00% | 12-1-2026 | $ 2,000,000 | $ 2,087,446 | |
| Chicago IL Board of Education Unlimited Tax GO Refunding Bonds Series 2019B | 5.00 | 12-1-2027 | 1,625,000 | 1,703,244 | |
| Chicago IL Special Assessment Improvement Refunding Bonds Lakeshore East Project Series 2022 | 3.20 | 12-1-2029 | 325,000 | 292,725 | |
| Chicago IL Special Assessment Improvement Refunding Bonds Lakeshore East Project Series 2022 | 3.29 | 12-1-2030 | 350,000 | 312,409 | |
| Chicago IL Special Assessment Improvement Refunding Bonds Lakeshore East Project Series 2022 | 3.38 | 12-1-2031 | 375,000 | 331,721 | |
| Chicago IL Special Assessment Improvement Refunding Bonds Lakeshore East Project Series 2022 | 3.45 | 12-1-2032 | 300,000 | 263,732 | |
| Illinois Refunding Bonds Series 2016 | 5.00 | 2-1-2026 | 2,000,000 | 2,124,133 | |
| Illinois Series 2013 (AGM Insured) | 5.00 | 7-1-2023 | 4,875,000 | 5,009,501 | |
| Illinois Series 2013 | 5.50 | 7-1-2033 | 4,000,000 | 4,083,738 | |
| Illinois Series 2017D | 5.00 | 11-1-2022 | 1,805,000 | 1,821,358 | |
| Illinois Series A | 5.00 | 11-1-2023 | 8,955,000 | 9,226,714 | |
| Illinois Series A | 5.00 | 12-1-2035 | 650,000 | 674,709 | |
| 27,931,430 | |||||
| Tax revenue: 3.50% | |||||
| Chicago IL Motor Fuel Tax Refunding Bonds Series 2013 | 5.00 | 1-1-2023 | 2,400,000 | 2,440,406 | |
| Chicago IL Motor Fuel Tax Refunding Bonds Series 2013 | 5.00 | 1-1-2024 | 2,475,000 | 2,586,434 | |
| Cook County IL Sales Tax Revenue | 5.00 | 11-15-2029 | 1,000,000 | 1,110,861 | |
| Cook County IL Sales Tax Revenue Series A | 5.00 | 11-15-2029 | 675,000 | 764,005 | |
| Cook County IL Sales Tax Revenue Series A | 5.00 | 11-15-2030 | 3,575,000 | 4,079,747 | |
| Cook County IL Sales Tax Revenue Series A | 5.00 | 11-15-2031 | 2,250,000 | 2,547,491 | |
| Illinois Regional Transportation Authority Series A (AGM Insured) | 5.25 | 6-1-2024 | 9,995,000 | 10,585,899 | |
| Illinois Regional Transportation Authority Series B øø | 1.35 | 6-1-2025 | 5,110,000 | 5,110,000 | |
| Illinois Sales Tax Build Illinois Junior Obligation | 5.00 | 6-15-2025 | 9,025,000 | 9,215,437 | |
| Illinois Sales Tax First Series (NPFGC Insured) | 6.00 | 6-15-2024 | 515,000 | 545,385 | |
| Illinois Sales Tax First Series (NPFGC Insured) | 6.00 | 6-15-2025 | 8,365,000 | 9,066,383 | |
| Illinois Sports Facilities Authority Refunding Bonds State Tax Supported | 5.00 | 6-15-2028 | 1,000,000 | 1,021,603 | |
| Illinois Sports Facilities Authority Refunding Bonds State Tax Supported (BAM Insured) | 5.00 | 6-15-2028 | 1,500,000 | 1,646,468 | |
| Illinois Sports Facilities Authority Refunding Bonds State Tax Supported (BAM Insured) | 5.00 | 6-15-2028 | 1,515,000 | 1,662,932 | |
| Illinois Sports Facilities Authority Refunding Bonds State Tax Supported (BAM Insured) | 5.00 | 6-15-2030 | 2,000,000 | 2,201,342 | |
| Illinois Sports Facilities Authority Refunding Bonds State Tax Supported (BAM Insured) | 5.00 | 6-15-2030 | 3,250,000 | 3,577,181 | |
| Illinois Sports Facilities Authority Refunding Bonds State Tax Supported CAB (Ambac Insured) ¤ | 0.00 | 6-15-2026 | 1,740,000 | 1,523,109 | |
| Illinois Sports Facilities Authority Refunding Bonds State Tax Supported Series 2014 | 5.00 | 6-15-2023 | 3,220,000 | 3,298,742 | |
| Illinois Sports Facilities Authority Refunding Bonds State Tax Supported Series 2014 | 5.00 | 6-15-2024 | 4,135,000 | 4,243,473 | |
| Metropolitan Pier & Exposition Authority CAB McCormick Place Expansion Project Series A (NPFGC Insured) ¤ | 0.00 | 12-15-2022 | 1,390,000 | 1,375,531 | |
| Metropolitan Pier & Exposition Authority CAB McCormick Place Expansion Project Series A (NPFGC Insured) ¤ | 0.00 | 12-15-2029 | 1,750,000 | 1,312,908 | |
| Metropolitan Pier & Exposition Authority Prerefunded Bond (NPFGC Insured) ¤ | 0.00 | 12-15-2023 | 20,000 | 19,405 |
| Interest rate | Maturity date | Principal | Value | ||
| Tax revenue (continued) | |||||
| Metropolitan Pier & Exposition Authority Unrefunded Bond (NPFGC Insured) ¤ | 0.00% | 12-15-2023 | $ 1,105,000 | $ 1,060,826 | |
| Sales Tax Securitization Corporation Second Lien Series 2020A | 5.00 | 1-1-2028 | 5,000,000 | 5,492,448 | |
| Sales Tax Securitization Corporation Series 2017A | 5.00 | 1-1-2026 | 4,815,000 | 5,159,169 | |
| Sales Tax Securitization Corporation Series 2017A | 5.00 | 1-1-2027 | 1,000,000 | 1,086,585 | |
| St. Charles, Kane & DuPage Counties IL Series 2016 | 4.00 | 1-1-2023 | 855,000 | 852,253 | |
| St. Charles, Kane & DuPage Counties IL Series 2016 | 4.00 | 1-1-2024 | 885,000 | 874,120 | |
| St. Charles, Kane & DuPage Counties IL Series 2016 | 4.00 | 1-1-2025 | 925,000 | 903,598 | |
| 85,363,741 | |||||
| Tobacco revenue: 0.76% | |||||
| Railsplitter Tobacco Settlement Authority | 5.00 | 6-1-2023 | 18,000,000 | 18,452,533 | |
| Transportation revenue: 0.56% | |||||
| Illinois State Toll Highway Authority Senior Revenue Refunding Bonds Series B | 5.00 | 1-1-2029 | 11,990,000 | 13,618,770 | |
| Water & sewer revenue: 0.37% | |||||
| Chicago IL Wastewater Transmission Series B (AGM Insured) | 5.00 | 1-1-2031 | 3,140,000 | 3,374,502 | |
| Chicago IL Waterworks Second Lien | 5.00 | 11-1-2028 | 2,560,000 | 2,706,478 | |
| Chicago IL Waterworks Second Lien Series 2017-2 (AGM Insured) | 5.00 | 11-1-2030 | 2,620,000 | 2,849,129 | |
| 8,930,109 | |||||
| 403,172,765 | |||||
| Indiana: 1.75% | |||||
| Education revenue: 0.01% | |||||
| Indiana Finance Authority Environmental Facilities Revenue Refunding Bonds Kipp Indianapolis Incorporated Project Series A | 4.00 | 7-1-2030 | 210,000 | 205,083 | |
| Health revenue: 0.00% | |||||
| Indiana HFFA Ancilla System Incorporated (NPFGC Insured) | 5.25 | 7-1-2022 | 95,000 | 95,000 | |
| Industrial development revenue: 0.45% | |||||
| Illinois Finance Authority Tax-Exempt Private Activity Bonds Ohio River Bridges East End Crossing Project Series 2013A | 5.00 | 7-1-2044 | 5,550,000 | 5,711,610 | |
| Indiana Finance Authority Tax-Exempt Private Activity Bonds Series 2013 | 5.00 | 7-1-2048 | 5,215,000 | 5,366,855 | |
| 11,078,465 | |||||
| Miscellaneous revenue: 0.95% | |||||
| Indiana Bond Bank Revenue CAB Hamilton Company Projects Series B ¤ | 0.00 | 7-15-2026 | 735,000 | 655,003 | |
| Indiana Bond Bank Revenue CAB Hamilton Company Projects Series B ¤ | 0.00 | 7-15-2027 | 630,000 | 542,065 | |
| Indianapolis Industry Local Public Improvement Bond Bank Series A | 5.00 | 6-1-2028 | 5,710,000 | 6,343,996 | |
| Indianapolis Industry Local Public Improvement Bond Bank Series A | 5.00 | 6-1-2029 | 6,600,000 | 7,400,163 |
| Interest rate | Maturity date | Principal | Value | ||
| Miscellaneous revenue (continued) | |||||
| Indianapolis Industry Local Public Improvement Bond Bank Series A | 5.00% | 6-1-2030 | $ 6,300,000 | $ 7,115,277 | |
| Michigan City IN School Building Corporation Series 2016A | 5.00 | 1-15-2025 | 1,000,000 | 1,062,296 | |
| 23,118,800 | |||||
| Utilities revenue: 0.34% | |||||
| Indiana Finance Authority Environmental Facilities Revenue Refunding Bonds Indianapolis Land Power and Light Company Project Series A øø | 0.75 | 12-1-2038 | 3,000,000 | 2,577,151 | |
| Indiana Finance Authority Midwestern Disaster Relief Ohio Valley Electric Corporation Project Series 2012A | 4.25 | 11-1-2030 | 4,000,000 | 3,939,470 | |
| Indiana Finance Authority Midwestern Disaster Relief Revenue Various Ohio Valley Electric Corporation Project Series 2012B | 3.00 | 11-1-2030 | 2,000,000 | 1,809,302 | |
| 8,325,923 | |||||
| 42,823,271 | |||||
| Iowa: 0.86% | |||||
| Education revenue: 0.11% | |||||
| Iowa Student Loan Liquidity Corporation Senior Revenue Bonds AMT Series B | 5.00 | 12-1-2025 | 1,295,000 | 1,388,001 | |
| Iowa Student Loan Liquidity Corporation Senior Revenue Bonds AMT Series B | 5.00 | 12-1-2026 | 1,215,000 | 1,318,683 | |
| 2,706,684 | |||||
| GO revenue: 0.38% | |||||
| Coralville IA Taxable-Annual Appropriation Series 2018B | 4.40 | 5-1-2023 | 410,000 | 410,110 | |
| Coralville IA Taxable-Annual Appropriation Series 2018E | 7.00 | 6-1-2025 | 8,485,000 | 8,833,068 | |
| 9,243,178 | |||||
| Housing revenue: 0.30% | |||||
| Iowa Finance Authority Single Family Mortgage Series B (GNMA / FNMA / FHLMC Insured, U.S. Bank NA SPA) ø | 0.90 | 7-1-2047 | 7,400,000 | 7,400,000 | |
| Water & sewer revenue: 0.07% | |||||
| Xenia Dallas County IA Rural Water District Capital Loan Notes | 5.00 | 12-1-2031 | 1,615,000 | 1,716,589 | |
| 21,066,451 | |||||
| Kansas: 0.33% | |||||
| Health revenue: 0.05% | |||||
| Wichita KS Health Care Facilities Presbyterian Manors Obligated Group | 5.00 | 5-15-2026 | 1,105,000 | 1,109,935 |
| Interest rate | Maturity date | Principal | Value | ||
| Tax revenue: 0.28% | |||||
| Wyandotte County & Kansas City KS Special Obligation Improvement & Refunding Bonds Plaza Redevelopment Project | 4.00% | 12-1-2028 | $ 360,000 | $ 332,144 | |
| Wyandotte County & Kansas City KS Special Obligation Vacation Village Project Area 4 Major Multi-Sport Athletic Complex Project CAB Series 2015 144A¤ | 0.00 | 9-1-2034 | 23,570,000 | 6,634,729 | |
| 6,966,873 | |||||
| 8,076,808 | |||||
| Kentucky: 2.85% | |||||
| Education revenue: 0.17% | |||||
| Columbia KY Educational Development Lindsey Wilson College Incorporated Project | 3.00 | 12-1-2024 | 2,345,000 | 2,336,300 | |
| Columbia KY Educational Development Lindsey Wilson College Incorporated Project | 4.00 | 12-1-2029 | 570,000 | 577,130 | |
| Columbia KY Educational Development Lindsey Wilson College Incorporated Project | 4.00 | 12-1-2030 | 590,000 | 591,456 | |
| Columbia KY Educational Development Lindsey Wilson College Incorporated Project | 4.00 | 12-1-2031 | 615,000 | 610,319 | |
| 4,115,205 | |||||
| Health revenue: 0.33% | |||||
| Kentucky EDFA Health System Revenue Norton Healthcare Incorporate Series B (NPFGC Insured) ¤ | 0.00 | 10-1-2026 | 3,000,000 | 2,611,589 | |
| Kentucky EDFA Healthcare Facilities Rosedale Green Project Series 2015 | 5.00 | 11-15-2025 | 1,230,000 | 1,213,126 | |
| Kentucky EDFA Norton Healthcare Incorporated Series B (NPFGC Insured) ¤ | 0.00 | 10-1-2022 | 1,000,000 | 995,157 | |
| Louisville & Jefferson Counties KY Metro Health System Revenue Norton Healthcare Incorporated Series C | 5.00 | 10-1-2047 | 3,000,000 | 3,201,540 | |
| 8,021,412 | |||||
| Industrial development revenue: 0.10% | |||||
| Boone County KY Poll Control Duke Energy Kentucky Incorporated Series A | 3.70 | 8-1-2027 | 2,500,000 | 2,512,566 | |
| Miscellaneous revenue: 0.04% | |||||
| Kentucky State University Certificate of Participation (BAM Insured) | 3.00 | 11-1-2032 | 320,000 | 299,836 | |
| Kentucky State University Certificate of Participation (BAM Insured) | 4.00 | 11-1-2033 | 130,000 | 138,042 | |
| Kentucky State University Certificate of Participation (BAM Insured) | 4.00 | 11-1-2034 | 130,000 | 137,585 | |
| Kentucky State University Certificate of Participation (BAM Insured) | 5.00 | 11-1-2029 | 200,000 | 227,708 | |
| Kentucky State University Certificate of Participation (BAM Insured) | 5.00 | 11-1-2030 | 175,000 | 201,031 | |
| 1,004,202 | |||||
| Utilities revenue: 2.21% | |||||
| Kentucky Public Energy Authority Gas Supply Series A-1 | 4.00 | 12-1-2049 | 3,755,000 | 3,805,059 | |
| Kentucky Public Energy Authority Gas Supply Series B | 4.00 | 1-1-2049 | 14,725,000 | 14,901,653 | |
| Kentucky Public Energy Authority Gas Supply Series C | 4.00 | 12-1-2049 | 4,605,000 | 4,666,391 |
| Interest rate | Maturity date | Principal | Value | ||
| Utilities revenue (continued) | |||||
| Kentucky Public Energy Authority Gas Supply Series C-1 | 4.00% | 2-1-2050 | $14,960,000 | $ 15,082,370 | |
| Louisville & Jefferson Counties KY Metro Government PCR Series B | 1.35 | 11-1-2027 | 2,000,000 | 1,785,492 | |
| Trimble County KY PCR Bonds Louisville Gas and Electric Company Project Series 2001A | 0.63 | 9-1-2026 | 3,250,000 | 2,882,448 | |
| Trimble County KY PCR Bonds Louisville Gas and Electric Company Project Series 2001B | 1.35 | 11-1-2027 | 6,200,000 | 5,519,026 | |
| Trimble County KY PCR Bonds Louisville Gas and Electric Company Project Series 2016A | 1.30 | 9-1-2044 | 6,250,000 | 5,250,952 | |
| 53,893,391 | |||||
| 69,546,776 | |||||
| Louisiana: 1.33% | |||||
| Airport revenue: 0.19% | |||||
| New Orleans LA Aviation Board General North Terminal Project Series A | 5.00 | 1-1-2032 | 1,000,000 | 1,035,876 | |
| New Orleans LA Aviation Board Gulf Opportunity Zone Customer Facility Charges Revenue Refunding Bonds Consolidated Rental Car Project (AGM Insured) | 5.00 | 1-1-2031 | 1,250,000 | 1,361,086 | |
| New Orleans LA Aviation Board Gulf Opportunity Zone Customer Facility Charges Revenue Refunding Bonds Consolidated Rental Car Project (AGM Insured) | 5.00 | 1-1-2032 | 2,000,000 | 2,166,026 | |
| 4,562,988 | |||||
| Education revenue: 0.06% | |||||
| Louisiana Public Facilities Authority Loyola University Project Series 2017 ¤ | 0.00 | 10-1-2022 | 1,500,000 | 1,489,195 | |
| Industrial development revenue: 0.59% | |||||
| St. John the Baptist Parish LA Revenue Refunding Bonds Marathon Oil Corporation Project | 2.38 | 6-1-2037 | 8,330,000 | 7,797,379 | |
| St. John the Baptist Parish LA Series A | 2.20 | 6-1-2037 | 7,000,000 | 6,507,792 | |
| 14,305,171 | |||||
| Miscellaneous revenue: 0.13% | |||||
| Louisiana Local Government Environmental Facilities and CDA Jefferson Parish Gomesa Project 144Aøø | 4.00 | 11-1-2044 | 1,415,000 | 1,136,167 | |
| Louisiana State GO Bonds Series A | 5.00 | 2-1-2027 | 2,000,000 | 2,090,979 | |
| 3,227,146 | |||||
| Water & sewer revenue: 0.36% | |||||
| East Baton Rouge LA Refunding Bonds Multi Modal Series A | 1.30 | 2-1-2041 | 3,500,000 | 3,038,909 | |
| Greater Ouachita Water Company Incorporated Louisiana Waterworks and Sewer System Refunding Bonds (BAM Insured) | 3.00 | 9-1-2023 | 250,000 | 253,029 | |
| Greater Ouachita Water Company Incorporated Louisiana Waterworks and Sewer System Refunding Bonds (BAM Insured) | 5.00 | 9-1-2024 | 460,000 | 486,788 | |
| Greater Ouachita Water Company Incorporated Louisiana Waterworks and Sewer System Refunding Bonds (BAM Insured) | 5.00 | 9-1-2025 | 510,000 | 550,901 | |
| New Orleans LA Sewage Service Revenue Series B | 5.00 | 6-1-2026 | 350,000 | 381,414 | |
| New Orleans LA Sewage Service Revenue Series B | 5.00 | 6-1-2027 | 600,000 | 663,863 |
| Interest rate | Maturity date | Principal | Value | ||
| Water & sewer revenue (continued) | |||||
| New Orleans LA Sewage Service Revenue Series B | 5.00% | 6-1-2028 | $ 400,000 | $ 446,711 | |
| New Orleans LA Sewage Service Revenue Series B | 5.00 | 6-1-2029 | 600,000 | 676,725 | |
| New Orleans LA Sewage Service Revenue Series B | 5.00 | 6-1-2030 | 600,000 | 681,693 | |
| New Orleans LA Sewage Service Revenue Series B | 5.00 | 6-1-2031 | 1,520,000 | 1,722,261 | |
| 8,902,294 | |||||
| 32,486,794 | |||||
| Maine: 0.03% | |||||
| Health revenue: 0.03% | |||||
| Maine HEFA | 5.00 | 7-1-2027 | 180,000 | 201,820 | |
| Maine HEFA | 5.00 | 7-1-2027 | 570,000 | 622,821 | |
| 824,641 | |||||
| Maryland: 2.12% | |||||
| Education revenue: 0.12% | |||||
| Maryland Health and HEFAR Stevenson University Series A | 5.00 | 6-1-2029 | 300,000 | 319,800 | |
| Maryland Health and HEFAR Stevenson University Series A | 5.00 | 6-1-2031 | 350,000 | 372,765 | |
| Maryland Health and HEFAR Stevenson University Series A | 5.00 | 6-1-2033 | 425,000 | 447,117 | |
| Prince George's County MD Chesapeake Lighthouse Charter School Project Series 2015 144A | 5.25 | 8-1-2022 | 565,000 | 565,414 | |
| Prince George's County MD Chesapeake Lighthouse Charter School Project Series 2016 | 5.00 | 8-1-2026 | 1,180,000 | 1,187,314 | |
| 2,892,410 | |||||
| GO revenue: 0.54% | |||||
| Prince George's County MD Consolidated Public Improvement Bonds Series C | 4.00 | 8-1-2028 | 12,960,000 | 13,274,255 | |
| Health revenue: 0.08% | |||||
| Maryland Health and HEFAR Adventist Healthcare Series 2021 | 5.00 | 1-1-2026 | 495,000 | 523,290 | |
| Maryland Health and HEFAR Adventist Healthcare Series 2021 | 5.00 | 1-1-2027 | 430,000 | 457,359 | |
| Maryland Health and HEFAR Adventist Healthcare Series 2021 | 5.00 | 1-1-2028 | 300,000 | 322,012 | |
| Maryland Health and HEFAR Adventist Healthcare Series 2021 | 5.00 | 1-1-2029 | 290,000 | 312,205 | |
| Maryland Health and HEFAR Adventist Healthcare Series 2021 | 5.00 | 1-1-2030 | 285,000 | 307,464 | |
| 1,922,330 | |||||
| Housing revenue: 0.87% | |||||
| Maryland Community Development Administration Department of Housing & Community Multifamily Development Overlook Manor Townhouses Series C | 3.00 | 4-1-2024 | 4,600,000 | 4,629,687 |
| Interest rate | Maturity date | Principal | Value | ||
| Housing revenue (continued) | |||||
| Maryland Community Development Administration Department of Housing & Community Multifamily Development Windsor Valley III Apartments Series G (FHA Insured) | 1.05% | 12-1-2023 | $11,000,000 | $ 10,774,768 | |
| Maryland Community Development Administration Department of Housing & Community Multifamily Development Woodside Gardens Series A 144A | 1.33 | 1-1-2024 | 6,000,000 | 5,903,367 | |
| 21,307,822 | |||||
| Tax revenue: 0.39% | |||||
| Maryland Department of Transportation Consolidated 3rd Issue | 4.00 | 12-15-2027 | 9,260,000 | 9,478,023 | |
| Transportation revenue: 0.12% | |||||
| Maryland Economic Development Corporation Private Activity Green Bond Purple Line Light Rail Transit Partners LLC Series A-P3 | 5.00 | 11-12-2028 | 2,750,000 | 2,893,732 | |
| 51,768,572 | |||||
| Massachusetts: 3.59% | |||||
| Airport revenue: 0.37% | |||||
| Massachusetts Port Authority Revenue AMT Series E | 5.00 | 7-1-2031 | 1,000,000 | 1,113,576 | |
| Massachusetts Port Authority Revenue AMT Series E | 5.00 | 7-1-2032 | 1,500,000 | 1,662,521 | |
| Massachusetts Port Authority Revenue AMT Series E | 5.00 | 7-1-2033 | 3,000,000 | 3,311,669 | |
| Massachusetts Port Authority Revenue AMT Series E | 5.00 | 7-1-2034 | 2,615,000 | 2,877,498 | |
| 8,965,264 | |||||
| Education revenue: 0.99% | |||||
| Lowell MA Collegiate Charter School Revenue | 4.00 | 6-15-2024 | 215,000 | 214,240 | |
| Lowell MA Collegiate Charter School Revenue | 5.00 | 6-15-2029 | 490,000 | 497,867 | |
| Massachusetts Development Finance Agency Harvard University Series A | 5.00 | 7-15-2033 | 12,560,000 | 13,755,197 | |
| Massachusetts Development Finance Agency Lasell University Issue Series 2021 | 4.00 | 7-1-2029 | 340,000 | 328,910 | |
| Massachusetts Development Finance Agency Lasell University Issue Series 2021 | 4.00 | 7-1-2030 | 355,000 | 339,518 | |
| Massachusetts Development Finance Agency Lasell University Issue Series 2021 | 4.00 | 7-1-2031 | 370,000 | 350,146 | |
| Massachusetts Development Finance Agency Sabis International Charter School Series 2015 | 5.00 | 4-15-2025 | 630,000 | 645,620 | |
| Massachusetts Educational Financing Authority Education Loan Revenue AMT Issue Lien Senior Series 2018B | 5.00 | 7-1-2023 | 2,460,000 | 2,527,473 | |
| Massachusetts Educational Financing Authority Education Loan Revenue AMT Issue Lien Senior Series 2020B | 5.00 | 7-1-2026 | 1,000,000 | 1,077,456 | |
| Massachusetts Educational Financing Authority Education Loan Revenue AMT Issue Lien Senior Series 2020B | 5.00 | 7-1-2027 | 1,500,000 | 1,625,974 | |
| Massachusetts Educational Financing Authority Education Loan Revenue AMT Issue Lien Senior Series 2020B | 5.00 | 7-1-2028 | 1,250,000 | 1,360,400 | |
| Massachusetts Educational Financing Authority Education Loan Revenue AMT Issue Lien Senior Series 2020B | 5.00 | 7-1-2029 | 1,400,000 | 1,524,917 | |
| 24,247,718 | |||||
| Health revenue: 0.82% | |||||
| Massachusetts Development Finance Agency Linden Ponds Incorporated Facility 144A | 4.00 | 11-15-2023 | 580,000 | 586,728 |
| Interest rate | Maturity date | Principal | Value | ||
| Health revenue (continued) | |||||
| Massachusetts Development Finance Agency Partners Healthcare System Series S-3 (SIFMA Municipal Swap +0.50%) ± | 1.48% | 7-1-2038 | $14,870,000 | $ 14,807,387 | |
| Massachusetts Development Finance Agency Revenue Milford Regional Medical Center Series G 144A | 5.00 | 7-15-2026 | 150,000 | 158,895 | |
| Massachusetts Development Finance Agency Revenue Milford Regional Medical Center Series G 144A | 5.00 | 7-15-2027 | 160,000 | 171,032 | |
| Massachusetts Development Finance Agency Revenue Milford Regional Medical Center Series G 144A | 5.00 | 7-15-2028 | 175,000 | 187,843 | |
| Massachusetts Development Finance Agency Revenue Milford Regional Medical Center Series G 144A | 5.00 | 7-15-2029 | 300,000 | 323,537 | |
| Massachusetts Development Finance Agency Revenue Milford Regional Medical Center Series G 144A | 5.00 | 7-15-2030 | 320,000 | 346,154 | |
| Massachusetts Development Finance Agency Revenue Milford Regional Medical Center Series G 144A | 5.00 | 7-15-2031 | 350,000 | 363,889 | |
| Massachusetts Development Finance Agency Revenue Milford Regional Medical Center Series G 144A | 5.00 | 7-15-2032 | 400,000 | 411,665 | |
| Massachusetts Development Finance Authority Revenue Bonds Series 2019 T1 (SIFMA Municipal Swap +0.60%) 144A± | 1.58 | 7-1-2049 | 2,650,000 | 2,630,923 | |
| 19,988,053 | |||||
| Miscellaneous revenue: 0.83% | |||||
| Massachusetts Water Pollution Abatement Trust Series 17 | 5.00 | 2-1-2031 | 10,000,000 | 10,154,947 | |
| Massachusetts Water Pollution Abatement Trust Series 17 | 5.00 | 2-1-2032 | 10,000,000 | 10,149,170 | |
| 20,304,117 | |||||
| Transportation revenue: 0.58% | |||||
| Greater Attleboro Taunton Regional Transit Authority Massachusetts Revenue BAN | 1.00 | 8-19-2022 | 8,200,000 | 8,194,871 | |
| Lowell MA Regional Transit Authority Revenue BAN | 1.00 | 8-19-2022 | 6,000,000 | 5,996,327 | |
| 14,191,198 | |||||
| 87,696,350 | |||||
| Michigan: 2.28% | |||||
| Airport revenue: 0.21% | |||||
| Wayne County MI Airport Authority AMT Detroit Metropolitan Airport Series 2010C | 5.00 | 12-1-2022 | 1,000,000 | 1,003,237 | |
| Wayne County MI Airport Authority AMT Detroit Metropolitan Airport Series 2015F | 5.00 | 12-1-2030 | 4,000,000 | 4,188,990 | |
| 5,192,227 | |||||
| Education revenue: 0.18% | |||||
| Lake Superior State University Board of Trustees Series 2021 (AGM Insured) | 4.00 | 11-15-2029 | 405,000 | 422,830 | |
| Lake Superior State University Board of Trustees Series 2021 (AGM Insured) | 4.00 | 11-15-2030 | 405,000 | 422,487 | |
| Lake Superior State University Board of Trustees Series 2021 (AGM Insured) | 4.00 | 11-15-2031 | 400,000 | 415,326 | |
| Michigan Finance Authority Limited Obligation Refunding Bonds Higher Education College Creative Studies Project | 5.00 | 12-1-2026 | 840,000 | 851,503 | |
| Michigan Finance Authority Limited Obligation Refunding Bonds Higher Education College Creative Studies Project | 5.00 | 12-1-2027 | 585,000 | 592,748 |
| Interest rate | Maturity date | Principal | Value | ||
| Education revenue (continued) | |||||
| Michigan Finance Authority Limited Obligation Refunding Bonds Higher Education College Creative Studies Project | 5.00% | 12-1-2028 | $ 535,000 | $ 542,143 | |
| Michigan Finance Authority Limited Obligation Refunding Bonds Higher Education College Creative Studies Project | 5.00 | 12-1-2029 | 590,000 | 597,458 | |
| Michigan Finance Authority Limited Obligation Refunding Bonds Higher Education College Creative Studies Project | 5.00 | 12-1-2030 | 400,000 | 404,595 | |
| Michigan Finance Authority Limited Obligation Refunding Bonds Public School Academy Cesar Chavez Academy Project | 3.25 | 2-1-2024 | 195,000 | 192,060 | |
| 4,441,150 | |||||
| GO revenue: 0.09% | |||||
| Ingham County MI Williamston Community Schools Series A (Qualified School Board Loan Fund Insured) | 4.00 | 5-1-2024 | 1,025,000 | 1,058,820 | |
| Ingham County MI Williamston Community Schools Series A (Qualified School Board Loan Fund Insured) | 4.00 | 5-1-2025 | 1,000,000 | 1,041,804 | |
| 2,100,624 | |||||
| Health revenue: 0.26% | |||||
| Kalamazoo MI Economic Development Corporation Revenue Limited Obligation Heritage Community | 2.88 | 5-15-2026 | 1,520,000 | ��1,441,051 | |
| Michigan Finance Authority Bronson Healthcare Group Series B & C | 3.75 | 11-15-2049 | 4,800,000 | 4,964,011 | |
| 6,405,062 | |||||
| Industrial development revenue: 0.08% | |||||
| Michigan Strategic Fund Limited Obligation Revenue Graphic Packaging International LLC | 4.00 | 10-1-2061 | 2,000,000 | 1,979,158 | |
| Miscellaneous revenue: 0.56% | |||||
| Michigan Finance Authority Detroit Recovery Project Series 2014F | 3.80 | 10-1-2022 | 500,000 | 501,325 | |
| Michigan Finance Authority Detroit Recovery Project Series 2014F | 3.88 | 10-1-2023 | 2,500,000 | 2,522,383 | |
| Michigan Finance Authority Local Government Loan Program City of Detroit Financial Recovery Refunding Bonds Series F | 4.50 | 10-1-2029 | 5,685,000 | 5,729,295 | |
| Michigan Finance Authority Revenue Taxable Detroit Financial Recovery | 4.60 | 10-1-2022 | 335,000 | 335,703 | |
| Michigan Finance Authority Senior Lien Distributable State Aid | 5.00 | 11-1-2028 | 865,000 | 978,879 | |
| Michigan Finance Authority Senior Lien Distributable State Aid | 5.00 | 11-1-2029 | 1,500,000 | 1,707,944 | |
| Michigan Municipal Bond Authority Local Government Loan Program Series C (Ambac Insured) | 5.00 | 5-1-2023 | 710,000 | 710,149 | |
| Michigan Public Educational Facilities Authority Chandler Park Academy Project | 6.35 | 11-1-2028 | 1,140,000 | 1,140,845 | |
| 13,626,523 | |||||
| Tax revenue: 0.12% | |||||
| Michigan Finance Authority Series 2014B | 5.00 | 7-1-2032 | 3,000,000 | 3,056,817 | |
| Water & sewer revenue: 0.78% | |||||
| Detroit MI Water & Sewage Department Series A | 5.00 | 7-1-2022 | 1,000,000 | 1,000,000 | |
| Michigan Financial Authority Great Lakes Water Authority Series C-3 (AGM Insured) | 5.00 | 7-1-2031 | 3,000,000 | 3,117,677 |
| Interest rate | Maturity date | Principal | Value | ||
| Water & sewer revenue (continued) | |||||
| Michigan Financial Authority Local Government Loan Program Series C7 (NPFGC Insured) | 5.00% | 7-1-2022 | $ 2,000,000 | $ 2,000,000 | |
| Michigan Financial Authority Local Government Loan Program Series D1 (AGM Insured) | 5.00 | 7-1-2022 | 2,700,000 | 2,700,000 | |
| Michigan Financial Authority Local Government Loan Program Series D1 (AGM Insured) | 5.00 | 7-1-2023 | 2,000,000 | 2,062,826 | |
| Michigan Financial Authority Local Government Loan Program Series D6 (NPFGC Insured) | 5.00 | 7-1-2022 | 2,080,000 | 2,080,000 | |
| Michigan Financial Authority Local Government Loan Program Series D6 (NPFGC Insured) | 5.00 | 7-1-2023 | 3,670,000 | 3,781,988 | |
| Michigan Financial Authority Local Government Loan Program Series D6 (NPFGC Insured) | 5.00 | 7-1-2024 | 2,130,000 | 2,244,389 | |
| 18,986,880 | |||||
| 55,788,441 | |||||
| Minnesota: 0.86% | |||||
| Education revenue: 0.24% | |||||
| Cologne MN Charter School Lease Academy Project Series 2014A | 4.00 | 7-1-2023 | 260,000 | 260,399 | |
| Minneapolis MN Charter School Lease Revenue Northeast College Preparatory Project | 5.00 | 7-1-2040 | 875,000 | 808,487 | |
| Minnesota State HEFAR Refunding Bonds St. Catherine University Series A | 5.00 | 10-1-2024 | 545,000 | 571,328 | |
| Minnesota State HEFAR Refunding Bonds St. Catherine University Series A | 5.00 | 10-1-2027 | 1,035,000 | 1,126,106 | |
| Minnesota State HEFAR Refunding Bonds St. Catherine University Series A | 5.00 | 10-1-2029 | 660,000 | 718,905 | |
| St. Paul MN Housing & RDA Charter School Hmong College Preparatory Academy Project Series A | 5.00 | 9-1-2026 | 1,000,000 | 1,017,392 | |
| Woodbury MN Charter School Woodbury Leadership Academy Project Series A | 4.00 | 7-1-2031 | 690,000 | 640,526 | |
| Woodbury MN Charter School Woodbury Leadership Academy Project Series A | 4.00 | 7-1-2041 | 850,000 | 713,316 | |
| 5,856,459 | |||||
| Health revenue: 0.22% | |||||
| Shakopee MN Senior Housing Revenue Benedictine Living Community LLC Project 144A | 5.85 | 11-1-2058 | 5,500,000 | 5,489,641 | |
| Utilities revenue: 0.40% | |||||
| Minnseota Municpal Gas Agency Commodity Supply Revenue Bonds Series 2022 (U.S. SOFR +1.00%)(Royal Bank of Canada LIQ) ± | 2.02 | 12-1-2052 | 10,000,000 | 9,653,187 | |
| 20,999,287 | |||||
| Mississippi: 0.46% | |||||
| GO revenue: 0.16% | |||||
| Mississippi Development Bank Special Obligation Gulfport Mississippi Public Improvement Project | 4.00 | 9-1-2029 | 620,000 | 654,164 | |
| Mississippi Development Bank Special Obligation Gulfport Mississippi Public Improvement Project | 4.00 | 9-1-2030 | 565,000 | 586,934 | |
| Mississippi Development Bank Special Obligation Gulfport Mississippi Public Improvement Project | 4.00 | 9-1-2031 | 400,000 | 410,654 |
| Interest rate | Maturity date | Principal | Value | ||
| GO revenue (continued) | |||||
| Mississippi Development Bank Special Obligation Gulfport Mississippi Public Improvement Project | 4.00% | 9-1-2032 | $ 435,000 | $ 441,418 | |
| Mississippi Development Bank Special Obligation Gulfport Mississippi Public Improvement Project | 5.00 | 9-1-2024 | 355,000 | 374,520 | |
| Mississippi Development Bank Special Obligation Gulfport Mississippi Public Improvement Project | 5.00 | 9-1-2025 | 255,000 | 273,840 | |
| Mississippi Development Bank Special Obligation Gulfport Mississippi Public Improvement Project | 5.00 | 9-1-2026 | 225,000 | 245,656 | |
| Mississippi Development Bank Special Obligation Gulfport Mississippi Public Improvement Project | 5.00 | 9-1-2027 | 385,000 | �� 426,544 | |
| Mississippi Development Bank Special Obligation Gulfport Mississippi Public Improvement Project | 5.00 | 9-1-2028 | 315,000 | 352,521 | |
| 3,766,251 | |||||
| Health revenue: 0.30% | |||||
| Mississippi Hospital Equipment & Facilities Authority Baptist Memorial Health Care Project | 5.00 | 9-1-2044 | 3,000,000 | 3,162,704 | |
| Mississippi Hospital Equipment & Facilities Authority Revenue North Mississippi Health Services Series LI | 5.00 | 10-1-2040 | 3,930,000 | 4,260,293 | |
| 7,422,997 | |||||
| 11,189,248 | |||||
| Missouri: 2.75% | |||||
| Education revenue: 0.34% | |||||
| Missouri State HEFAR University Health Science | 5.00 | 10-1-2026 | 925,000 | 995,871 | |
| Missouri State HEFAR University Health Science | 5.00 | 10-1-2027 | 975,000 | 1,058,862 | |
| Missouri State HEFAR University Health Science | 5.00 | 10-1-2028 | 1,025,000 | 1,116,356 | |
| Missouri State HEFAR Webster University Project | 5.00 | 4-1-2023 | 1,050,000 | 1,065,092 | |
| Missouri State HEFAR Webster University Project | 5.00 | 4-1-2024 | 2,820,000 | 2,904,089 | |
| Missouri State HEFAR Webster University Project | 5.00 | 4-1-2025 | 600,000 | 625,352 | |
| Missouri State HEFAR Webster University Project | 5.00 | 4-1-2026 | 500,000 | 524,613 | |
| 8,290,235 | |||||
| Health revenue: 1.04% | |||||
| Missouri HEFAR Barnes-Jewish Christian Health System Series C | 5.00 | 5-1-2052 | 18,000,000 | 19,822,516 | |
| Missouri State HEFAR St. Lukes Health System Incorporated | 5.00 | 11-15-2030 | 5,425,000 | 5,744,064 | |
| 25,566,580 | |||||
| Housing revenue: 0.36% | |||||
| Missouri Southern State University Auxiliary Enterprise Revenue System | 3.00 | 10-1-2026 | 1,000,000 | 925,124 | |
| Missouri Southern State University Auxiliary Enterprise Revenue System | 4.00 | 10-1-2031 | 1,000,000 | 899,817 | |
| Port Authority of Kansas City MO MFHR Bonds Series 2022A (Department of Housing and Urban Development Insured) | 1.50 | 5-1-2024 | 7,000,000 | 6,950,893 | |
| 8,775,834 | |||||
| Miscellaneous revenue: 0.76% | |||||
| Kansas City MO IDA International Airport Terminal Modernization Project Series B | 5.00 | 3-1-2028 | 3,000,000 | 3,281,751 |
| Interest rate | Maturity date | Principal | Value | ||
| Miscellaneous revenue (continued) | |||||
| Kansas City MO IDA International Airport Terminal Modernization Project Series B | 5.00% | 3-1-2030 | $ 2,000,000 | $ 2,179,594 | |
| Missouri Public Utilities Commission Interim Construction Notes Series 2022 | 0.75 | 8-1-2023 | 10,000,000 | 9,828,800 | |
| Platte County MO Riverside-Quindaro Bend Levee District Project L-385 | 4.00 | 3-1-2023 | 1,010,000 | 1,020,644 | |
| Platte County MO Riverside-Quindaro Bend Levee District Project L-385 | 5.00 | 3-1-2024 | 1,000,000 | 1,035,966 | |
| Platte County MO Riverside-Quindaro Bend Levee District Project L-385 | 5.00 | 3-1-2025 | 1,105,000 | 1,150,217 | |
| 18,496,972 | |||||
| Tax revenue: 0.14% | |||||
| Branson MO IDA Branson Shoppes Series A | 4.00 | 11-1-2022 | 350,000 | 349,543 | |
| Branson MO IDA Branson Shoppes Series A | 4.00 | 11-1-2023 | 750,000 | 744,855 | |
| Hanley Road Corridor Transportation Development District Missouri Transportation Sales Tax Revenue Refunding Bonds | 1.63 | 10-1-2033 | 675,000 | 665,298 | |
| Hanley Road Corridor Transportation Development District Missouri Transportation Sales Tax Revenue Refunding Bonds | 2.00 | 10-1-2039 | 750,000 | 719,746 | |
| Richmond Heights MO Francis Place Redevelopment Project | 5.63 | 11-1-2025 | 915,000 | 888,525 | |
| 3,367,967 | |||||
| Water & sewer revenue: 0.11% | |||||
| Kansas City MO Sanitation Sewer System Revenue Series B | 5.00 | 1-1-2023 | 805,000 | 818,672 | |
| Kansas City MO Sanitation Sewer System Revenue Series B | 5.00 | 1-1-2025 | 810,000 | 866,634 | |
| Kansas City MO Sanitation Sewer System Revenue Series B | 5.00 | 1-1-2027 | 700,000 | 777,407 | |
| Kansas City MO Sanitation Sewer System Revenue Series B | 5.00 | 1-1-2028 | 275,000 | 310,083 | |
| 2,772,796 | |||||
| 67,270,384 | |||||
| Nebraska: 0.48% | |||||
| Airport revenue: 0.04% | |||||
| Lincoln NE Airport Authority | 5.00 | 7-1-2029 | 835,000 | 940,862 | |
| Education revenue: 0.09% | |||||
| Douglas County NE Educational Facilities Creighton University (SIFMA Municipal Swap +0.53%) ± | 1.51 | 7-1-2035 | 2,230,000 | 2,233,605 | |
| Utilities revenue: 0.35% | |||||
| Central Plains Energy Nebraska Gas Project #3 | 5.00 | 9-1-2025 | 3,290,000 | 3,456,443 | |
| Central Plains Energy Nebraska Gas Project #3 | 5.00 | 9-1-2026 | 3,750,000 | 3,965,421 | |
| Central Plains Energy Nebraska Gas Project #3 | 5.00 | 9-1-2027 | 1,000,000 | 1,063,330 | |
| 8,485,194 | |||||
| 11,659,661 |
| Interest rate | Maturity date | Principal | Value | ||
| Nevada: 0.11% | |||||
| Miscellaneous revenue: 0.08% | |||||
| Las Vegas NV Special Improvement District #816 Local Improvement Summerlin Village 22 | 2.00% | 6-1-2024 | $ 150,000 | $ 142,688 | |
| Las Vegas NV Special Improvement District #816 Local Improvement Summerlin Village 22 | 2.00 | 6-1-2025 | 180,000 | 165,817 | |
| Las Vegas NV Special Improvement District #816 Local Improvement Summerlin Village 22 | 2.00 | 6-1-2026 | 225,000 | 201,338 | |
| Las Vegas NV Special Improvement District #816 Local Improvement Summerlin Village 22 | 2.25 | 6-1-2027 | 250,000 | 218,494 | |
| Las Vegas NV Special Improvement District #816 Local Improvement Summerlin Village 22 | 2.50 | 6-1-2028 | 250,000 | 215,951 | |
| Las Vegas NV Special Improvement District #816 Local Improvement Summerlin Village 22 | 2.50 | 6-1-2029 | 200,000 | 167,696 | |
| Las Vegas NV Special Improvement District #816 Local Improvement Summerlin Village 22 | 2.63 | 6-1-2030 | 300,000 | 247,785 | |
| Las Vegas NV Special Improvement District #816 Local Improvement Summerlin Village 22 | 2.75 | 6-1-2031 | 225,000 | 183,245 | |
| Las Vegas NV Special Improvement District #816 Local Improvement Summerlin Village 22 | 2.75 | 6-1-2033 | 515,000 | 403,393 | |
| 1,946,407 | |||||
| Tax revenue: 0.03% | |||||
| Sparks NV Tourism Improvement District #1 Senior Revenue Refunding Bonds Sales Tax Anticipation Notes 144A | 2.50 | 6-15-2024 | 675,000 | 652,801 | |
| 2,599,208 | |||||
| New Hampshire: 0.10% | |||||
| Housing revenue: 0.10% | |||||
| New Hampshire National Finance Authority Municipal Certificates Series A | 4.13 | 1-20-2034 | 2,414,672 | 2,375,466 | |
| New Jersey: 4.12% | |||||
| Airport revenue: 0.49% | |||||
| New Jersey EDA Refunding Bonds Port Newark Container | 5.00 | 10-1-2025 | 2,750,000 | 2,890,627 | |
| New Jersey EDA Refunding Bonds Port Newark Container | 5.00 | 10-1-2026 | 2,130,000 | 2,258,187 | |
| New Jersey EDA Refunding Bonds Port Newark Container | 5.00 | 10-1-2027 | 1,675,000 | 1,786,788 | |
| South Jersey NJ Port Corporation Marine Terminal Series B | 5.00 | 1-1-2027 | 1,000,000 | 1,058,677 | |
| South Jersey NJ Port Corporation Marine Terminal Series B | 5.00 | 1-1-2028 | 500,000 | 531,185 | |
| South Jersey NJ Port Corporation Marine Terminal Series S-2 | 5.00 | 1-1-2023 | 1,665,000 | 1,692,703 | |
| South Jersey NJ Port Corporation Marine Terminal Series S-2 | 5.00 | 1-1-2024 | 1,750,000 | 1,827,738 | |
| 12,045,905 | |||||
| Education revenue: 0.57% | |||||
| Atlantic County NJ Improvement Authority Atlantic City Campus Phase II Project Series A (AGM Insured) | 4.00 | 7-1-2036 | 425,000 | 425,209 | |
| Atlantic County NJ Improvement Authority Atlantic City Campus Phase II Project Series A (AGM Insured) | 4.00 | 7-1-2037 | 150,000 | 148,060 | |
| Atlantic County NJ Improvement Authority Atlantic City Campus Phase II Project Series A (AGM Insured) | 4.00 | 7-1-2038 | 200,000 | 196,048 |
| Interest rate | Maturity date | Principal | Value | ||
| Education revenue (continued) | |||||
| Atlantic County NJ Improvement Authority Atlantic City Campus Phase II Project Series A (AGM Insured) | 5.00% | 7-1-2032 | $ 225,000 | $ 254,549 | |
| Atlantic County NJ Improvement Authority Atlantic City Campus Phase II Project Series A (AGM Insured) | 5.00 | 7-1-2034 | 225,000 | 252,898 | |
| New Jersey EDA Revenue School Facilities Construction Series QQQ | 5.00 | 6-15-2030 | 1,000,000 | 1,094,514 | |
| New Jersey EDA Revenue School Facilities Construction Series QQQ | 5.00 | 6-15-2031 | 500,000 | 544,484 | |
| New Jersey EDA School Facilities Construction Refunding Notes Series I (SIFMA Municipal Swap +1.60%) ± | 2.58 | 3-1-2028 | 10,000,000 | 10,065,459 | |
| Newark NJ Higher Educational Finance Corporation Charter Schools Incorporated Series 2015 A 144A | 4.63 | 8-15-2025 | 950,000 | 967,877 | |
| 13,949,098 | |||||
| GO revenue: 0.26% | |||||
| Atlantic City NJ Board Education Refunding Bonds (AGM Insured) | 4.00 | 4-1-2027 | 400,000 | 424,859 | |
| Atlantic City NJ Board Education Refunding Bonds (AGM Insured) | 4.00 | 4-1-2029 | 400,000 | 426,106 | |
| Atlantic City NJ Board Education Refunding Bonds (AGM Insured) | 4.00 | 4-1-2031 | 350,000 | 367,100 | |
| Atlantic City NJ Board Education Refunding Bonds (AGM Insured) | 4.00 | 4-1-2033 | 300,000 | 310,729 | |
| Atlantic City NJ Board Education Refunding Bonds (AGM Insured) | 4.00 | 4-1-2034 | 260,000 | 268,682 | |
| New Jersey EDA Revenue Refunding Bonds School Facilities Construction Series GGG 144A | 5.25 | 9-1-2026 | 2,000,000 | 2,143,926 | |
| Newark NJ Board of Education Refunding School Energy Savings Obligation (BAM Insured) | 5.00 | 7-15-2029 | 340,000 | 385,311 | |
| Newark NJ Board of Education Refunding School Energy Savings Obligation (BAM Insured) | 5.00 | 7-15-2030 | 325,000 | 371,599 | |
| Newark NJ Board of Education Refunding School Energy Savings Obligation (BAM Insured) | 5.00 | 7-15-2031 | 400,000 | 460,209 | |
| Newark NJ Board of Education Refunding School Energy Savings Obligation (BAM Insured) | 5.00 | 7-15-2032 | 430,000 | 491,288 | |
| Newark NJ Board of Education Refunding School Energy Savings Obligation (BAM Insured) | 5.00 | 7-15-2033 | 520,000 | 589,999 | |
| 6,239,808 | |||||
| Industrial development revenue: 0.08% | |||||
| New Jersey EDA Elite Pharmaceuticals Project Series A | 6.50 | 9-1-2030 | 305,000 | 269,916 | |
| New Jersey EDA The Goethals Bridge Replacement Project | 5.00 | 1-1-2023 | 1,520,000 | 1,535,598 | |
| 1,805,514 | |||||
| Miscellaneous revenue: 0.85% | |||||
| New Jersey EDA Motor Vehicle Surcharge Revenue Refunding Bonds Series A | 3.13 | 7-1-2029 | 5,620,000 | 5,325,867 | |
| New Jersey EDA Motor Vehicle Surcharge Revenue Refunding Bonds Series A | 3.38 | 7-1-2030 | 9,705,000 | 9,280,355 | |
| New Jersey EDA School Facilities Construction Refunding Bonds Project Series I (SIFMA Municipal Swap +1.25%) ± | 2.23 | 9-1-2025 | 4,500,000 | 4,550,705 | |
| New Jersey EDA School Facilities Construction Refunding Bonds Project Series NN (AGM Insured) | 5.00 | 3-1-2024 | 1,645,000 | 1,677,587 | |
| 20,834,514 |
| Interest rate | Maturity date | Principal | Value | ||
| Tax revenue: 0.51% | |||||
| New Jersey Garden State Preservation Trust Open & Farmland Series A (AGM Insured) | 5.75% | 11-1-2028 | $ 5,000,000 | $ 5,605,180 | |
| New Jersey Series 2020-A | 4.00 | 6-1-2030 | 3,000,000 | 3,171,032 | |
| New Jersey TTFA Transportation Program Series AA | 5.00 | 6-15-2035 | 2,000,000 | 2,138,021 | |
| New Jersey TTFA Transportation Program Series BB | 5.00 | 6-15-2030 | 1,500,000 | 1,615,317 | |
| 12,529,550 | |||||
| Transportation revenue: 1.09% | |||||
| New Jersey TTFA CAB Transportation System Series A ¤ | 0.00 | 12-15-2026 | 12,000,000 | 10,310,257 | |
| New Jersey TTFA CAB Transportation System Series C (Ambac Insured) ¤ | 0.00 | 12-15-2026 | 3,500,000 | 3,025,616 | |
| New Jersey TTFA Transportation Program Series 2013AA | 5.00 | 6-15-2023 | 4,740,000 | 4,876,168 | |
| New Jersey TTFA Transportation System Series 2010D | 5.00 | 12-15-2023 | 6,960,000 | 7,238,067 | |
| New Jersey TTFA Transportation System Series 2019A | 5.00 | 12-15-2025 | 1,000,000 | 1,060,533 | |
| 26,510,641 | |||||
| Water & sewer revenue: 0.27% | |||||
| New Jersey EDA | 2.20 | 10-1-2039 | 5,500,000 | 4,853,598 | |
| New Jersey EDA Water Facilities Revenue Refunding Bonds AMT New Jersey American Water Company Incorporated | 1.10 | 11-1-2029 | 2,075,000 | 1,803,005 | |
| 6,656,603 | |||||
| 100,571,633 | |||||
| New Mexico: 0.71% | |||||
| Industrial development revenue: 0.35% | |||||
| Farmington NM PCR Bonds Series 4 | 1.80 | 4-1-2029 | 10,000,000 | 8,622,366 | |
| Tax revenue: 0.07% | |||||
| Winrock Town Center Tax Increment Development District 1 Senior Lien Gross Receipts Series 2022 144A | 3.75 | 5-1-2028 | 867,000 | 807,386 | |
| Winrock Town Center Tax Increment Development District 1 Senior Lien Gross Receipts Series 2022 144A | 4.00 | 5-1-2033 | 1,035,000 | 915,786 | |
| 1,723,172 | |||||
| Utilities revenue: 0.29% | |||||
| New Mexico Municipal Energy Acquisition Authority Gas Supply Revenue Refunding & Acquisition Bond Subordinated Series A (Royal Bank of Canada LIQ) | 5.00 | 11-1-2039 | 6,660,000 | 7,017,898 | |
| 17,363,436 | |||||
| New York: 6.42% | |||||
| Airport revenue: 1.17% | |||||
| New York Transportation Development Corporation Special Facility AMT American Airlines Incorporated John F Kennedy International Airport Project | 2.25 | 8-1-2026 | 2,000,000 | 1,873,059 | |
| New York Transportation Development Corporation Special Facility AMT John F Kennedy International Airport Terminal 4 Project | 5.00 | 12-1-2032 | 5,500,000 | 5,795,197 | |
| Port Authority of New York & New Jersey Consolidated Bonds 185 Series | 5.00 | 9-1-2028 | 5,000,000 | 5,197,796 |
| Interest rate | Maturity date | Principal | Value | ||
| Airport revenue (continued) | |||||
| Port Authority of New York & New Jersey Consolidated Bonds 205 Series | 5.00% | 11-15-2025 | $ 475,000 | $ 517,527 | |
| Port Authority of New York & New Jersey Consolidated Bonds 207 Series | 5.00 | 9-15-2027 | 13,880,000 | 15,306,202 | |
| 28,689,781 | |||||
| Education revenue: 0.50% | |||||
| Build New York City Resource Corporation Bronx Charter School for International Cultures & Arts Series A | 3.88 | 4-15-2023 | 200,000 | 200,196 | |
| Build New York City Resource Corporation Richmond Preparatory Charter School Social Impact Project Series A 144A | 4.00 | 6-1-2031 | 650,000 | 609,507 | |
| Build New York City Resource Corporation Richmond Preparatory Charter School Social Impact Project Series A 144A | 5.00 | 6-1-2036 | 525,000 | 526,800 | |
| Build New York City Resource Corporation Richmond Preparatory Charter School Social Impact Project Series A 144A | 5.00 | 6-1-2041 | 400,000 | 397,563 | |
| Hempstead NY Local Development Corporation Education Revenue Refunding Bonds The Academy Charter School Project Series A | 4.05 | 2-1-2031 | 2,415,000 | 2,138,600 | |
| Hempstead NY Local Development Corporation Education Revenue Refunding Bonds The Academy Charter School Project Series A | 4.76 | 2-1-2027 | 970,000 | 955,888 | |
| Hempstead NY Local Development Corporation Education Revenue Refunding Bonds The Academy Charter School Project Series A | 5.45 | 2-1-2027 | 2,880,000 | 2,912,324 | |
| Hempstead NY Local Development Corporation Education Revenue Refunding Bonds The Academy Charter School Project Series A | 6.47 | 2-1-2033 | 1,435,000 | 1,537,142 | |
| Hempstead NY Local Development Corporation Education Revenue Refunding Bonds The Academy Charter School Project Series B | 4.76 | 2-1-2027 | 180,000 | 177,381 | |
| Hempstead NY Local Development Corporation The Academy Charter School Project Series A | 4.45 | 2-1-2041 | 500,000 | 411,459 | |
| New York Dormitory Authority Revenues Non-State Supported Debt Montefiore Obligation Group Series A | 5.00 | 7-1-2030 | 625,000 | 671,988 | |
| New York Dormitory Authority Revenues Non-State Supported Debt Montefiore Obligation Group Series A | 5.00 | 7-1-2037 | 200,000 | 211,997 | |
| New York Dormitory Authority Revenues Non-State Supported Debt Montefiore Obligation Group Series A | 5.00 | 7-1-2042 | 275,000 | 287,809 | |
| New York NY IDA Civic Facility Stars Churchill School Center Project (AGC Insured) ø | 2.25 | 10-1-2029 | 1,180,000 | 1,085,699 | |
| 12,124,353 | |||||
| GO revenue: 0.35% | |||||
| Cortland NY Enlarged City School District Revenue BAN | 2.00 | 7-29-2022 | 3,780,000 | 3,781,591 | |
| Poughkeepsie City NY Refunding Bonds Public Improvement | 4.00 | 4-15-2029 | 245,000 | 253,838 | |
| Poughkeepsie City NY Refunding Bonds Public Improvement | 5.00 | 6-1-2024 | 340,000 | 353,849 | |
| Poughkeepsie City NY Refunding Bonds Public Improvement | 5.00 | 6-1-2025 | 235,000 | 248,395 |
| Interest rate | Maturity date | Principal | Value | ||
| GO revenue (continued) | |||||
| Poughkeepsie City NY Refunding Bonds Public Improvement | 5.00% | 6-1-2031 | $ 600,000 | $ 627,890 | |
| Suffolk County NY Series A (BAM Insured) | 5.00 | 6-15-2028 | 3,000,000 | 3,358,424 | |
| 8,623,987 | |||||
| Health revenue: 0.51% | |||||
| Huntington NY Local Development Corporation Revenue Gurwin Independent Housing Incorporated | 3.00 | 7-1-2025 | 1,725,000 | 1,646,418 | |
| New York Dormitory Authority Revenues Non-State Supported Debt Montefiore Obligation Group Series A | 5.00 | 9-1-2028 | 1,400,000 | 1,495,001 | |
| New York Dormitory Authority Revenues Non-State Supported Debt Montefiore Obligation Group Series A | 5.00 | 9-1-2029 | 1,350,000 | 1,433,045 | |
| New York Dormitory Authority Revenues Non-State Supported Debt Northwell Health Obligated Group Series B-3 | 5.00 | 5-1-2048 | 6,000,000 | 6,416,629 | |
| Westchester County NY Local Development Corporation Purchase Senior Learning Community Incorporated 144A | 2.88 | 7-1-2026 | 1,500,000 | 1,400,955 | |
| 12,392,048 | |||||
| Housing revenue: 0.50% | |||||
| New York Housing Finance Agency Affordable Housing Revenue Various Sustainability Bonds Series J-2 | 1.10 | 11-1-2061 | 2,500,000 | 2,251,044 | |
| New York Housing Finance Agency Affordable Housing Revenue Various Sustainability Bonds Series K-2 | 1.00 | 11-1-2061 | 500,000 | 456,598 | |
| New York Mortgage Agency Homeowner Mortgage Revenue AMT Social Bonds Series 235 | 0.30 | 10-1-2022 | 465,000 | 463,762 | |
| New York Mortgage Agency Homeowner Mortgage Revenue AMT Social Bonds Series 235 | 0.40 | 4-1-2023 | 480,000 | 473,958 | |
| New York Mortgage Agency Homeowner Mortgage Revenue AMT Social Bonds Series 235 | 0.55 | 10-1-2023 | 760,000 | 742,849 | |
| New York Mortgage Agency Homeowner Mortgage Revenue AMT Social Bonds Series 235 | 0.65 | 4-1-2024 | 710,000 | 686,412 | |
| New York Mortgage Agency Homeowner Mortgage Revenue AMT Social Bonds Series 235 | 0.75 | 10-1-2024 | 825,000 | 788,916 | |
| New York Mortgage Agency Homeowner Mortgage Revenue AMT Social Bonds Series 235 | 0.88 | 4-1-2025 | 1,705,000 | 1,613,609 | |
| New York Mortgage Agency Homeowner Mortgage Revenue AMT Social Bonds Series 235 | 1.00 | 10-1-2025 | 2,415,000 | 2,267,924 | |
| New York Mortgage Agency Homeowner Mortgage Revenue AMT Social Bonds Series 235 | 1.05 | 4-1-2026 | 1,275,000 | 1,185,049 | |
| New York Mortgage Agency Homeowner Mortgage Revenue AMT Social Bonds Series 235 | 1.15 | 10-1-2026 | 1,335,000 | 1,231,925 | |
| 12,162,046 | |||||
| Industrial development revenue: 0.96% | |||||
| New York Liberty Development Corporation Refunding Bonds 4 World Trade Center Project | 2.80 | 9-15-2069 | 2,000,000 | 1,806,793 | |
| New York Transportation Development Corporation Exempt Facility Revenue New York Thruway Service Areas Project | 2.50 | 10-31-2031 | 750,000 | 625,902 | |
| New York Transportation Development Corporation Exempt Facility Revenue New York Thruway Service Areas Project | 4.00 | 10-31-2034 | 500,000 | 462,282 |
| Interest rate | Maturity date | Principal | Value | ||
| Industrial development revenue (continued) | |||||
| New York Transportation Development Corporation Special Facility AMT Revenue Delta Air Lines Incorporated LaGuardia Airport Terminals C&D Redevelopment | 5.00% | 1-1-2026 | $11,030,000 | $ 11,326,613 | |
| New York Transportation Development Corporation Special Facility AMT Revenue Delta Air Lines Incorporated LaGuardia Airport Terminals C&D Redevelopment | 5.00 | 10-1-2035 | 9,250,000 | 9,354,907 | |
| 23,576,497 | |||||
| Miscellaneous revenue: 0.53% | |||||
| New York City IDA Pilot Refunding Bonds Queens Baseball Stadium Project Series 2021A (AGM Insured) | 5.00 | 1-1-2025 | 1,250,000 | 1,321,790 | |
| New York City IDA Pilot Refunding Bonds Queens Baseball Stadium Project Series 2021A (AGM Insured) | 5.00 | 1-1-2030 | 1,750,000 | 1,938,439 | |
| New York Liberty Development Corporation Refunding Bonds 4 World Trade Center Project | 1.70 | 11-15-2030 | 4,000,000 | 3,305,428 | |
| New York Liberty Development Corporation Refunding Bonds 4 World Trade Center Project | 1.90 | 11-15-2031 | 2,000,000 | 1,634,303 | |
| New York Liberty Development Corporation Refunding Bonds 4 World Trade Center Project | 2.10 | 11-15-2032 | 5,000,000 | 4,059,056 | |
| Public Housing Capital Fund Trust II (Department of Housing and Urban Development Insured) 144A | 4.50 | 7-1-2022 | 28,436 | 28,438 | |
| Western Regional Off-Track Betting Corporation 144A | 3.00 | 12-1-2026 | 610,000 | 560,684 | |
| 12,848,138 | |||||
| Resource recovery revenue: 0.08% | |||||
| New York Environmental Facilities Corporation Solid Waste Disposal Revenue Casella Waste System Incorporate Project | 2.75 | 9-1-2050 | 2,000,000 | 1,895,693 | |
| Tax revenue: 0.31% | |||||
| Triborough Bridge & Tunnel Authority Payroll Mobility Tax Senior Lien Series A | 2.00 | 5-15-2045 | 7,900,000 | 7,510,279 | |
| Transportation revenue: 1.26% | �� | ||||
| New York Metropolitan Transportation Authority Revenue BAN Series D-1 | 5.00 | 9-1-2022 | 5,150,000 | 5,177,675 | |
| New York Metropolitan Transportation Authority Revenue Various Refunding Bonds Transportation Subordinated Series G-3 (SIFMA Municipal Swap +0.43%) ± | 1.41 | 11-1-2031 | 20,000,000 | 19,991,770 | |
| New York Metropolitan Transportation Authority Subordinated Bond Series 2002G-1F (U.S. SOFR +0.43%) ± | 1.45 | 11-1-2026 | 1,250,000 | 1,173,661 | |
| New York Metropolitan Transportation Authority Subordinated Bond Series A-1 | 5.00 | 11-15-2048 | 800,000 | 835,403 | |
| New York Metropolitan Transportation Authority Subordinated Bond Series C-1 | 5.00 | 11-15-2024 | 3,535,000 | 3,717,993 | |
| 30,896,502 |
| Interest rate | Maturity date | Principal | Value | ||
| Utilities revenue: 0.25% | |||||
| Long Island Power Authority Electric System General Revenue Bonds Series B øø | 0.85% | 9-1-2050 | $ 3,000,000 | $ 2,821,236 | |
| Long Island Power Authority Electric System General Revenue Bonds Series B øø | 1.50 | 9-1-2051 | 3,500,000 | 3,314,523 | |
| 6,135,759 | |||||
| 156,855,083 | |||||
| North Carolina: 0.30% | |||||
| Education revenue: 0.07% | |||||
| North Carolina Capital Facilities Finance Agency Educational Facilities Revenue Refunding Campbell University Series A | 5.00 | 10-1-2028 | 450,000 | 489,843 | |
| North Carolina Capital Facilities Finance Agency Educational Facilities Revenue Refunding Campbell University Series A | 5.00 | 10-1-2029 | 550,000 | 602,348 | |
| North Carolina Capital Facilities Finance Agency Educational Facilities Revenue Refunding Campbell University Series A | 5.00 | 10-1-2030 | 450,000 | 493,096 | |
| 1,585,287 | |||||
| Health revenue: 0.20% | |||||
| Charlotte Mecklenburg Hospital Authority North Carolina Health Care System Atrium Health Series E øø | 0.80 | 1-15-2048 | 2,000,000 | 1,891,903 | |
| North Carolina Medical Care Commission Health Care Facilities First Mortgage Lutheran Services Series A | 4.00 | 3-1-2029 | 275,000 | 257,650 | |
| North Carolina Medical Care Commission Health Care Facilities First Mortgage Lutheran Services Series A | 4.00 | 3-1-2030 | 285,000 | 262,592 | |
| North Carolina Medical Care Commission Health Care Facilities First Mortgage Lutheran Services Series A | 4.00 | 3-1-2031 | 290,000 | 263,141 | |
| North Carolina Medical Care Commission Health Care Facilities First Mortgage Lutheran Services Series A | 4.00 | 3-1-2036 | 900,000 | 761,451 | |
| North Carolina Medical Care Commission Retirement Facilities Revenue Entrance Fee Friends Homes Series B1 | 2.55 | 9-1-2026 | 1,575,000 | 1,475,083 | |
| 4,911,820 | |||||
| Industrial development revenue: 0.03% | |||||
| Columbus County NC Industrial Facilities and PCFA Refunding Bonds Recovery Zone Facility International Paper Company Project | 2.00 | 11-1-2033 | 850,000 | 829,264 | |
| 7,326,371 | |||||
| North Dakota: 0.81% | |||||
| GO revenue: 0.45% | |||||
| McKenzie County ND Public School District #1 School Building Series A | 5.00 | 8-1-2025 | 960,000 | 1,027,938 | |
| McKenzie County ND Public School District #1 School Building Series A | 5.00 | 8-1-2026 | 1,115,000 | 1,213,478 | |
| McKenzie County ND Public School District #1 School Building Series A | 5.00 | 8-1-2027 | 1,170,000 | 1,289,232 | |
| McKenzie County ND Public School District #1 School Building Series A | 5.00 | 8-1-2028 | 1,225,000 | 1,358,846 | |
| McKenzie County ND Public School District #1 School Building Series A | 5.00 | 8-1-2029 | 1,290,000 | 1,420,588 |
| Interest rate | Maturity date | Principal | Value | ||
| GO revenue (continued) | |||||
| McKenzie County ND Public School District #1 School Building Series A | 5.00% | 8-1-2030 | $ 1,355,000 | $ 1,485,346 | |
| McKenzie County ND Public School District #1 School Building Series A | 5.00 | 8-1-2031 | 1,420,000 | 1,551,011 | |
| McKenzie County ND Public School District #1 School Building Series A | 5.00 | 8-1-2032 | 1,490,000 | 1,622,818 | |
| 10,969,257 | |||||
| Health revenue: 0.27% | |||||
| Grand Forks ND Health Care System Revenue Altru Health System | 5.00 | 12-1-2029 | 1,650,000 | 1,798,477 | |
| Grand Forks ND Health Care System Revenue Altru Health System | 5.00 | 12-1-2030 | 1,600,000 | 1,750,876 | |
| Grand Forks ND Health Care System Revenue Altru Health System | 5.00 | 12-1-2032 | 2,805,000 | 3,022,385 | |
| 6,571,738 | |||||
| Miscellaneous revenue: 0.09% | |||||
| Cass County ND Joint Water Resources District Refunding Bond Temporary Improvement Series A | 0.48 | 5-1-2024 | 2,500,000 | 2,385,744 | |
| 19,926,739 | |||||
| Ohio: 2.28% | |||||
| Airport revenue: 0.09% | |||||
| Port of Greater Cincinnati Development Authority | 4.38 | 6-15-2056 | 2,340,000 | 2,166,643 | |
| Education revenue: 0.11% | |||||
| Allen County OH Port Authority Economic Development Revenue Refunding Bonds University Northwestern | 4.00 | 12-1-2031 | 710,000 | 693,752 | |
| Portage County OH Port Authority Northeast Ohio Medical University Project | 5.00 | 12-1-2026 | 1,980,000 | 1,981,610 | |
| 2,675,362 | |||||
| Health revenue: 0.47% | |||||
| Hamilton County OH Hospital Facilities Revenue UC Health | 5.00 | 9-15-2027 | 615,000 | 670,128 | |
| Hamilton County OH Hospital Facilities Revenue UC Health | 5.00 | 9-15-2028 | 650,000 | 711,502 | |
| Montgomery County OH Hospital Refunding Bonds Facilities Premier Health Partners | 5.00 | 11-15-2033 | 4,000,000 | 4,314,227 | |
| Montgomery County OH Hospital Refunding Bonds Facilities Premier Health Partners | 5.00 | 11-15-2034 | 5,460,000 | 5,877,171 | |
| 11,573,028 | |||||
| Miscellaneous revenue: 0.09% | |||||
| Ohio Capital Facilities Lease Adult Correctional Building Fund Series C ø | 1.20 | 10-1-2036 | 2,100,000 | 2,100,000 | |
| Resource recovery revenue: 0.20% | |||||
| Ohio Air Quality Development Authority Revenue Refunding Bonds AMT American Electric Power Company | 2.10 | 12-1-2027 | 4,930,000 | 4,782,686 |
| Interest rate | Maturity date | Principal | Value | ||
| Tax revenue: 0.28% | |||||
| Akron OH Income Tax Revenue | 4.00% | 12-1-2029 | $ 4,515,000 | $ 4,848,696 | |
| Akron OH Income Tax Revenue | 4.00 | 12-1-2030 | 1,830,000 | 1,942,582 | |
| 6,791,278 | |||||
| Utilities revenue: 0.79% | |||||
| American Municipal Power Ohio Incorporated Refunding Bonds | 5.00 | 2-15-2030 | 2,000,000 | 2,291,873 | |
| American Municipal Power Ohio Incorporated Refunding Bonds | 5.00 | 2-15-2031 | 1,700,000 | 1,959,143 | |
| Lancaster OH Port Authority Gas Supply Series A (Royal Bank of Canada LIQ) | 5.00 | 8-1-2049 | 6,355,000 | 6,665,247 | |
| Ohio Air Quality Development Authority Ohio Valley Electric Corporation Project Series 2009C | 1.50 | 2-1-2026 | 2,000,000 | 1,828,682 | |
| Ohio Air Quality Development Authority Ohio Valley Electric Corporation Project Series 2019A | 3.25 | 9-1-2029 | 7,000,000 | 6,558,539 | |
| 19,303,484 | |||||
| Water & sewer revenue: 0.25% | |||||
| Columbus OH Sewerage System | 5.00 | 6-1-2031 | 5,825,000 | 6,197,850 | |
| 55,590,331 | |||||
| Oklahoma: 0.70% | |||||
| Education revenue: 0.20% | |||||
| Oklahoma Development Finance Authority Revenue Refunding Bonds Oklahoma City University Project | 5.00 | 8-1-2025 | 925,000 | 955,297 | |
| Oklahoma Development Finance Authority Revenue Refunding Bonds Oklahoma City University Project | 5.00 | 8-1-2026 | 975,000 | 1,010,726 | |
| Oklahoma Development Finance Authority Revenue Refunding Bonds Oklahoma City University Project | 5.00 | 8-1-2027 | 1,370,000 | 1,423,449 | |
| Oklahoma Development Finance Authority Revenue Refunding Bonds Oklahoma City University Project | 5.00 | 8-1-2028 | 715,000 | 741,597 | |
| Oklahoma Development Finance Authority Revenue Refunding Bonds Oklahoma City University Project | 5.00 | 8-1-2029 | 755,000 | 782,502 | |
| 4,913,571 | |||||
| Miscellaneous revenue: 0.32% | |||||
| Carter County OK Public Facilities Authority Dickson Public Schools Project | 4.00 | 9-1-2025 | 350,000 | 366,724 | |
| Carter County OK Public Facilities Authority Dickson Public Schools Project | 5.00 | 9-1-2025 | 365,000 | 387,972 | |
| Muskogee OK Industrial Trust Educational Facilities Lease Muskogee Public Schools Project | 4.00 | 9-1-2028 | 2,500,000 | 2,614,536 | |
| Muskogee OK Industrial Trust Educational Facilities Lease Muskogee Public Schools Project | 4.00 | 9-1-2034 | 670,000 | 675,232 | |
| Muskogee OK Industrial Trust Educational Facilities Lease Muskogee Public Schools Project | 5.00 | 9-1-2024 | 890,000 | 934,715 | |
| Muskogee OK Industrial Trust Educational Facilities Lease Muskogee Public Schools Project | 5.00 | 9-1-2025 | 855,000 | 912,273 | |
| Muskogee OK Industrial Trust Educational Facilities Lease Muskogee Public Schools Project | 5.00 | 9-1-2026 | 1,810,000 | 1,956,156 | |
| 7,847,608 |
| Interest rate | Maturity date | Principal | Value | ||
| Tax revenue: 0.18% | |||||
| Tulsa OK Public Facilities Authority Capital Improvements | 4.00% | 10-1-2027 | $ 4,050,000 | $ 4,310,835 | |
| 17,072,014 | |||||
| Oregon: 0.79% | |||||
| Airport revenue: 0.05% | |||||
| Port of Portland OR Portland International Airport AMT Series 28 | 5.00 | 7-1-2024 | 1,125,000 | 1,178,241 | |
| Health revenue: 0.74% | |||||
| Clackamas County OR Hospital Facility Authority Revenue Senior Living Rose Villa Project | 2.75 | 11-15-2025 | 500,000 | 486,028 | |
| Multnomah County OR Hospital Facilities Authority Revenue Refunding Bonds Adventist Health System/West | 5.00 | 3-1-2040 | 9,500,000 | 9,979,334 | |
| Multnomah County OR Hospital Facilities Authority Revenue Refunding Bonds Terwilliger Plaza Parkview | 0.95 | 6-1-2027 | 1,900,000 | 1,679,368 | |
| Oregon State Facilities Authority Revenue Refunding Bonds Samaritan Health Services Project | 5.00 | 10-1-2025 | 400,000 | 426,073 | |
| Oregon State Facilities Authority Revenue Refunding Bonds Samaritan Health Services Project | 5.00 | 10-1-2026 | 125,000 | 134,990 | |
| Oregon State Facilities Authority Revenue Refunding Bonds Samaritan Health Services Project | 5.00 | 10-1-2027 | 300,000 | 324,750 | |
| Oregon State Facilities Authority Revenue Refunding Bonds Samaritan Health Services Project | 5.00 | 10-1-2031 | 1,750,000 | 1,828,691 | |
| YamHill County OR Hospital Authority Friendsview Series A | 5.00 | 11-15-2036 | 1,220,000 | 1,116,763 | |
| YamHill County OR Hospital Authority Friendsview Series A | 5.00 | 11-15-2046 | 1,540,000 | 1,314,292 | |
| YamHill County OR Hospital Authority Friendsview Series B2 | 2.13 | 11-15-2027 | 1,000,000 | 897,266 | |
| 18,187,555 | |||||
| 19,365,796 | |||||
| Pennsylvania: 5.10% | |||||
| Airport revenue: 0.64% | |||||
| Allegheny County PA Airport Authority AMT Series A | 5.00 | 1-1-2029 | 4,000,000 | 4,390,995 | |
| Allegheny County PA Airport Authority AMT Series A | 5.00 | 1-1-2030 | 3,000,000 | 3,302,180 | |
| Allegheny County PA Airport Authority AMT Series A | 5.00 | 1-1-2031 | 2,250,000 | 2,480,272 | |
| Allegheny County PA Airport Authority AMT Series A | 5.00 | 1-1-2033 | 5,000,000 | 5,436,695 | |
| 15,610,142 | |||||
| Education revenue: 0.57% | |||||
| Chester County PA IDA Avon Grove Charter School Project Series 2017A | 4.00 | 12-15-2027 | 1,485,000 | 1,479,790 | |
| Chester County PA IDA Collegium Charter School Project Series 2017A | 3.70 | 10-15-2022 | 400,000 | 399,878 | |
| Lehigh County General Purpose Authority Charter School Lehigh Valley Academy Regional Charter School Series 2022 | 4.00 | 6-1-2030 | 1,175,000 | 1,170,361 | |
| Lycoming County PA Authority Association of Independent Colleges & Universities of Pennsylvania Financing Program | 2.00 | 11-1-2035 | 3,000,000 | 2,999,975 | |
| Montgomery County PA HEFAR Arcadia University | 5.00 | 4-1-2023 | 1,555,000 | 1,583,504 | |
| Pennsylvania Higher Education Assistance Agency Education Loan Series A | 5.00 | 6-1-2028 | 600,000 | 647,696 |
| Interest rate | Maturity date | Principal | Value | ||
| Education revenue (continued) | |||||
| Pennsylvania Higher Education Assistance Agency Education Loan Series A | 5.00% | 6-1-2030 | $ 800,000 | $ 866,223 | |
| Philadelphia PA IDA Charter School Project Series 2016A | 4.50 | 8-1-2026 | 1,830,000 | 1,856,830 | |
| Philadelphia PA IDA Charter School Project Series 2016B | 4.88 | 8-1-2026 | 1,200,000 | 1,220,524 | |
| Philadelphia PA IDA Independence Charter School West Project Series 2019 | 4.00 | 6-15-2029 | 350,000 | 343,129 | |
| Philadelphia PA IDA Tacony Academy Christian School Project Series A-1 | 6.25 | 6-15-2023 | 140,000 | 144,097 | |
| South Central Pennsylvania General Authority Association of Independent Colleges & Universities Financing Program Series TT2 | 5.00 | 5-1-2029 | 245,000 | 270,678 | |
| South Central Pennsylvania General Authority Association of Independent Colleges & Universities Financing Program Series TT2 | 5.00 | 5-1-2030 | 395,000 | 439,187 | |
| South Central Pennsylvania General Authority Association of Independent Colleges & Universities Financing Program Series TT2 | 5.00 | 5-1-2031 | 485,000 | 542,373 | |
| 13,964,245 | |||||
| GO revenue: 1.41% | |||||
| Allegheny County PA Penn Hills Schools District Series 2015 (BAM Insured) | 5.00 | 11-15-2022 | 340,000 | 344,118 | |
| Allegheny County PA Penn Hills Schools District Series 2015 (BAM Insured) | 5.00 | 11-15-2023 | 1,025,000 | 1,065,376 | |
| Armstrong PA School District Refunding Bonds Series A (BAM Insured) | 5.00 | 3-15-2027 | 745,000 | 828,957 | |
| Armstrong PA School District Refunding Bonds Series A (BAM Insured) | 5.00 | 3-15-2029 | 920,000 | 1,050,485 | |
| Armstrong PA School District Refunding Bonds Series A (BAM Insured) | 5.00 | 3-15-2030 | 1,800,000 | 2,050,761 | |
| Bristol Township PA School District | 5.25 | 6-1-2031 | 6,990,000 | 7,210,085 | |
| Laurel Highlands PA School District (BAM Insured) | 3.00 | 2-1-2030 | 675,000 | 672,976 | |
| Laurel Highlands PA School District (BAM Insured) | 4.00 | 2-1-2027 | 980,000 | 1,032,972 | |
| Laurel Highlands PA School District (BAM Insured) | 4.00 | 2-1-2029 | 1,150,000 | 1,229,106 | |
| Philadelphia PA School District Series 2016D | 5.00 | 9-1-2022 | 3,565,000 | 3,584,875 | |
| Philadelphia PA School District Series 2016F | 5.00 | 9-1-2022 | 5,000,000 | 5,027,875 | |
| Philadelphia PA School District Series 2019A | 5.00 | 9-1-2030 | 2,500,000 | 2,779,347 | |
| Philadelphia PA School District Series 2019A | 5.00 | 9-1-2031 | 2,500,000 | 2,791,695 | |
| Scranton PA School District Series A | 5.00 | 6-1-2024 | 750,000 | 787,257 | |
| Scranton PA School District Series A | 5.00 | 6-1-2025 | 1,000,000 | 1,069,101 | |
| Scranton PA School District Series B (NPFGC Insured) | 5.00 | 6-1-2024 | 665,000 | 699,308 | |
| Scranton PA School District Series B (NPFGC Insured) | 5.00 | 6-1-2025 | 710,000 | 761,332 | |
| Scranton PA Series 2017 144A | 5.00 | 9-1-2023 | 1,355,000 | 1,380,952 | |
| 34,366,578 | |||||
| Health revenue: 0.63% | |||||
| Berks County PA Municipal Authority Tower Health Project Series B1 | 5.00 | 2-1-2040 | 6,000,000 | 5,965,666 | |
| Bucks County PA IDA Hospital Revenue Grand View Hospital Project | 5.00 | 7-1-2026 | 1,350,000 | 1,425,377 | |
| Bucks County PA IDA Hospital Revenue Grand View Hospital Project | 5.00 | 7-1-2028 | 1,500,000 | 1,593,160 | |
| Bucks County PA IDA Hospital Revenue Grand View Hospital Project | 5.00 | 7-1-2031 | 1,120,000 | 1,184,327 | |
| Bucks County PA IDA Hospital Revenue Grand View Hospital Project | 5.00 | 7-1-2032 | 955,000 | 995,025 |
| Interest rate | Maturity date | Principal | Value | ||
| Health revenue (continued) | |||||
| Bucks County PA IDA Hospital St. Lukes University Health Network | 4.00% | 8-15-2031 | $ 750,000 | $ 766,632 | |
| Bucks County PA IDA Hospital St. Lukes University Health Network | 4.00 | 8-15-2032 | 1,390,000 | 1,406,015 | |
| Lancaster PA IDA Health Center Revenue Refunding Landis Homes Retirement | 4.00 | 7-1-2031 | 430,000 | 401,537 | |
| Lancaster PA IDA Health Center Revenue Refunding Landis Homes Retirement | 4.00 | 7-1-2037 | 345,000 | 304,571 | |
| Westmoreland County PA IDA Health System Revenue Excela Health Project Series A | 5.00 | 7-1-2027 | 1,200,000 | 1,290,453 | |
| 15,332,763 | |||||
| Housing revenue: 0.36% | |||||
| East Hempfield Township Pennsylvania Industrial Development Student Services Incorporate Student Housing | 5.00 | 7-1-2025 | 790,000 | 823,132 | |
| Pennsylvania Housing Finance Agency MFHR Sherman Hills Series 2022 (Department of Housing and Urban Development Insured) | 1.25 | 2-1-2025 | 7,000,000 | 6,848,529 | |
| Pennsylvania Housing Finance Agency Single Family Mortgage AMT Series 128A | 4.75 | 4-1-2033 | 1,035,000 | 1,064,527 | |
| 8,736,188 | |||||
| Miscellaneous revenue: 0.09% | |||||
| Delaware Valley Regional Finance Authority Local Government Series B (Ambac Insured) | 5.70 | 7-1-2027 | 1,780,000 | 2,039,595 | |
| Delaware Valley Regional Finance Authority Local Government Series C (Ambac Insured) | 7.75 | 7-1-2027 | 125,000 | 154,497 | |
| 2,194,092 | |||||
| Resource recovery revenue: 0.90% | |||||
| Pennsylvania EDFA Solid Waste Disposal Republic Services Incorporated Project Series 2014A | 1.90 | 6-1-2044 | 3,000,000 | 3,000,000 | |
| Pennsylvania EDFA Solid Waste Disposal Republic Services Incorporated Project Series 2019B-1 | 2.00 | 4-1-2049 | 6,000,000 | 5,999,904 | |
| Pennsylvania EDFA Solid Waste Disposal Waste Management Incorporated Project Series 2019A | 1.75 | 8-1-2038 | 13,500,000 | 12,935,178 | |
| 21,935,082 | |||||
| Tax revenue: 0.09% | |||||
| Allentown PA Neighborhood Improvement Zone Development Authority Foward Delivery | 5.00 | 5-1-2029 | 500,000 | 536,585 | |
| Allentown PA Neighborhood Improvement Zone Development Authority Foward Delivery | 5.00 | 5-1-2030 | 500,000 | 539,157 | |
| Allentown PA Neighborhood Improvement Zone Development Authority Foward Delivery | 5.00 | 5-1-2031 | 550,000 | 594,179 | |
| Allentown PA Neighborhood Improvement Zone Development Authority Foward Delivery | 5.00 | 5-1-2032 | 600,000 | 649,800 | |
| 2,319,721 | |||||
| Transportation revenue: 0.12% | |||||
| Lancaster PA Guaranteed Parking Authority Series A (BAM Insured) | 4.00 | 9-1-2027 | 570,000 | 603,004 | |
| Lancaster PA Guaranteed Parking Authority Series A (BAM Insured) | 4.00 | 9-1-2028 | 590,000 | 625,318 |
| Interest rate | Maturity date | Principal | Value | ||
| Transportation revenue (continued) | |||||
| Lancaster PA Guaranteed Parking Authority Series A (BAM Insured) | 4.00% | 9-1-2029 | $ 410,000 | $ 431,370 | |
| Lancaster PA Guaranteed Parking Authority Series A (BAM Insured) | 4.00 | 9-1-2030 | 425,000 | 444,773 | |
| Lancaster PA Guaranteed Parking Authority Series A (BAM Insured) | 4.00 | 9-1-2031 | 440,000 | 458,034 | |
| Lancaster PA Guaranteed Parking Authority Series A (BAM Insured) | 4.00 | 9-1-2032 | 460,000 | 476,048 | |
| 3,038,547 | |||||
| Water & sewer revenue: 0.29% | |||||
| Luzerne County PA IDA Refunding Bonds AMT Pennsylvania American Water Company Project | 2.45 | 12-1-2039 | 3,250,000 | 3,075,829 | |
| Pittsburgh PA Water & Sewer Authority Series C (SIFMA Municipal Swap +0.65%)(AGM Insured) ± | 1.63 | 9-1-2040 | 4,000,000 | 4,001,999 | |
| 7,077,828 | |||||
| 124,575,186 | |||||
| Puerto Rico: 0.37% | |||||
| Water & sewer revenue: 0.37% | |||||
| Puerto Rico Commonwealth Aqueduct and Sewer Authority Revenue Refunding Bonds Senior Lien Series A 144A | 4.00 | 7-1-2022 | 5,000,000 | 5,000,000 | |
| Puerto Rico Commonwealth Aqueduct and Sewer Authority Revenue Refunding Bonds Senior Lien Series A 144A | 4.00 | 7-1-2023 | 4,000,000 | 4,008,649 | |
| 9,008,649 | |||||
| Rhode Island: 0.12% | |||||
| GO revenue: 0.08% | |||||
| Providence RI Refunding Bonds Series A | 5.00 | 1-15-2023 | 425,000 | 431,741 | |
| Providence RI Refunding Bonds Series A | 5.00 | 1-15-2024 | 400,000 | 415,748 | |
| Providence RI Refunding Bonds Series A | 5.00 | 1-15-2025 | 450,000 | 476,058 | |
| Providence RI Refunding Bonds Series A | 5.00 | 1-15-2026 | 450,000 | 482,904 | |
| 1,806,451 | |||||
| Housing revenue: 0.00% | |||||
| Rhode Island Housing & Mortgage Finance | 6.50 | 4-1-2027 | 15,000 | 15,034 | |
| Miscellaneous revenue: 0.04% | |||||
| Providence RI Public Buildings Authority Revenue Capital Improvement Program Projects Series A (AGM Insured) | 4.00 | 9-15-2023 | 1,000,000 | 1,023,629 | |
| 2,845,114 | |||||
| South Carolina: 0.22% | |||||
| Education revenue: 0.01% | |||||
| South Carolina Jobs EDA York Preparatory Academy Project Series A | 5.75 | 11-1-2023 | 270,000 | 278,757 | |
| Miscellaneous revenue: 0.02% | |||||
| Berkeley County SC Assessment Revenue Bonds Nexton Improvement District | 4.00 | 11-1-2030 | 425,000 | 412,553 |
| Interest rate | Maturity date | Principal | Value | ||
| Resource recovery revenue: 0.06% | |||||
| South Carolina Jobs EDA † | 8.00% | 12-6-2029 | $ 260,000 | $ 214,857 | |
| South Carolina Jobs EDA Solid Waste Disposal RePower South Berkeley LLC 144A† | 5.25 | 2-1-2027 | 3,310,000 | 1,324,000 | |
| 1,538,857 | |||||
| Utilities revenue: 0.13% | |||||
| South Carolina Public Service Authority Revenue Refunding Bonds and Improvement Series A | 5.00 | 12-1-2031 | 2,850,000 | 3,131,027 | |
| 5,361,194 | |||||
| South Dakota: 0.33% | |||||
| Health revenue: 0.33% | |||||
| South Dakota HEFA Avera Health Series A | 5.00 | 7-1-2033 | 7,675,000 | 8,033,160 | |
| Tennessee: 1.02% | |||||
| Housing revenue: 0.32% | |||||
| Metropolitan Government Nashville & Davidson County TN Health & Educational Facilities Board Richland Hills Apartments Project (Department of Housing and Urban Development Insured) | 1.25 | 12-1-2024 | 8,000,000 | 7,872,260 | |
| Utilities revenue: 0.70% | |||||
| Tennergy Corporation Tennessee Gas Series A | 4.00 | 12-1-2051 | 1,190,000 | 1,196,617 | |
| Tennessee Energy Acquisition Corporation Gas Project Series 2006B | 5.63 | 9-1-2026 | 925,000 | 1,003,664 | |
| Tennessee Energy Acquisition Corporation Gas Project Series 2017A | 4.00 | 5-1-2048 | 12,390,000 | 12,541,921 | |
| Tennessee Energy Acquisition Corporation Gas Project Series 2018 | 4.00 | 11-1-2049 | 2,210,000 | 2,244,121 | |
| 16,986,323 | |||||
| 24,858,583 | |||||
| Texas: 7.96% | |||||
| Airport revenue: 0.64% | |||||
| Dallas Fort Worth TX International Airport Refunding Bonds AMT Series A | 5.00 | 11-1-2024 | 4,000,000 | 4,239,057 | |
| Dallas Fort Worth TX International Airport Refunding Bonds AMT Series A | 5.00 | 11-1-2032 | 3,125,000 | 3,187,826 | |
| El Paso TX Airport Revenue Refunding Bonds El Paso International Airport | 5.00 | 8-15-2023 | 690,000 | 714,015 | |
| El Paso TX Airport Revenue Refunding Bonds El Paso International Airport | 5.00 | 8-15-2024 | 725,000 | 764,924 | |
| El Paso TX Airport Revenue Refunding Bonds El Paso International Airport | 5.00 | 8-15-2027 | 835,000 | 922,544 | |
| El Paso TX Airport Revenue Refunding Bonds El Paso International Airport | 5.00 | 8-15-2028 | 880,000 | 981,721 | |
| El Paso TX Airport Revenue Refunding Bonds El Paso International Airport | 5.00 | 8-15-2029 | 920,000 | 1,036,501 |
| Interest rate | Maturity date | Principal | Value | ||
| Airport revenue (continued) | |||||
| El Paso TX Airport Revenue Refunding Bonds El Paso International Airport | 5.00% | 8-15-2030 | $ 970,000 | $ 1,101,670 | |
| Houston TX Airport System Revenue Subordinate Refunding Bonds AMT Series A øø | 5.00 | 7-1-2031 | 2,750,000 | 2,750,000 | |
| 15,698,258 | |||||
| Education revenue: 1.41% | |||||
| Alamo TX Community College District Various Financing System | 1.70 | 11-1-2042 | 435,000 | 427,776 | |
| Arlington TX Higher Education Finance Corporation Education Series A | 4.00 | 2-15-2029 | 300,000 | 317,223 | |
| Arlington TX Higher Education Finance Corporation Education Series A | 4.00 | 8-15-2029 | 80,000 | 76,458 | |
| Arlington TX Higher Education Finance Corporation Education Series A | 4.00 | 2-15-2030 | 305,000 | 322,567 | |
| Arlington TX Higher Education Finance Corporation Education Series A | 4.00 | 8-15-2030 | 85,000 | 80,253 | |
| Arlington TX Higher Education Finance Corporation Education Series A | 4.00 | 2-15-2031 | 315,000 | 331,415 | |
| Arlington TX Higher Education Finance Corporation Education Series A | 4.00 | 2-15-2031 | 1,240,000 | 1,102,721 | |
| Arlington TX Higher Education Finance Corporation Education Series A | 4.00 | 8-15-2031 | 80,000 | 74,588 | |
| Arlington TX Higher Education Finance Corporation Education Series A | 5.00 | 8-15-2022 | 60,000 | 60,094 | |
| Arlington TX Higher Education Finance Corporation Education Series A | 5.00 | 8-15-2023 | 155,000 | 157,049 | |
| Arlington TX Higher Education Finance Corporation Education Series A | 5.00 | 8-15-2024 | 195,000 | 199,219 | |
| Arlington TX Higher Education Finance Corporation Education Series A | 5.00 | 8-15-2025 | 205,000 | 210,389 | |
| Arlington TX Higher Education Finance Corporation Education Series A | 5.00 | 8-15-2026 | 200,000 | 205,823 | |
| Arlington TX Higher Education Finance Corporation Education Series A | 5.00 | 8-15-2027 | 205,000 | 211,418 | |
| Arlington TX Higher Education Finance Corporation Education Series A | 5.00 | 8-15-2028 | 75,000 | 77,142 | |
| Austin TX Community College District Series A | 4.00 | 2-1-2023 | 320,000 | 324,579 | |
| Clifton TX Higher Education Finance Corporation Education Revenue IDEA Public Schools Series 2021T | 5.00 | 8-15-2029 | 315,000 | 345,375 | |
| Clifton TX Higher Education Finance Corporation Education Revenue IDEA Public Schools Series 2021T | 5.00 | 8-15-2030 | 385,000 | 422,769 | |
| Clifton TX Higher Education Finance Corporation Education Revenue IDEA Public Schools Series 2021T | 5.00 | 8-15-2031 | 435,000 | 477,606 | |
| Clifton TX Higher Education Finance Corporation Education Revenue IDEA Public Schools Series 2021T | 5.00 | 8-15-2032 | 515,000 | 565,262 | |
| Clifton TX Higher Education Finance Corporation Education Revenue International Leadership Texas Series A | 6.00 | 3-1-2029 | 2,150,000 | 2,187,005 | |
| Clifton TX Higher Education Finance Corporation International Leadership Series 2015A | 4.63 | 8-15-2025 | 7,040,000 | 7,072,662 | |
| Clifton TX Higher Education Finance Corporation Uplift Education Series 2018D | 5.00 | 8-15-2025 | 6,565,000 | 6,691,445 | |
| Clifton TX Higher Education Finance Corporation Uplift Education Series A | 4.00 | 12-1-2025 | 1,965,000 | 1,973,257 |
| Interest rate | Maturity date | Principal | Value | ||
| Education revenue (continued) | |||||
| Hale Center Education Facilities Corporation Improvement and Revenue Refunding Bonds Wayland Baptist University Project Series 2022 | 5.00% | 3-1-2028 | $ 1,635,000 | $ 1,730,337 | |
| Hale Center Education Facilities Corporation Improvement and Revenue Refunding Bonds Wayland Baptist University Project Series 2022 | 5.00 | 3-1-2029 | 1,015,000 | 1,073,866 | |
| Hale Center Education Facilities Corporation Improvement and Revenue Refunding Bonds Wayland Baptist University Project Series 2022 | 5.00 | 3-1-2030 | 2,040,000 | 2,154,504 | |
| New Hope TX Cultural Education Facilities Finance Corporation Education Cumberland Academy Incorporated Series 2020A 144A | 4.00 | 8-15-2030 | 1,735,000 | 1,653,803 | |
| Odessa TX College District Revenue Consolidated Fund (AGM Insured) | 4.00 | 7-1-2029 | 650,000 | 696,756 | |
| Odessa TX College District Revenue Consolidated Fund (AGM Insured) | 4.00 | 7-1-2030 | 870,000 | 933,583 | |
| Odessa TX College District Revenue Consolidated Fund (AGM Insured) | 4.00 | 7-1-2031 | 220,000 | 236,586 | |
| Odessa TX College District Revenue Consolidated Fund (AGM Insured) | 4.00 | 7-1-2032 | 460,000 | 489,303 | |
| Odessa TX College District Revenue Consolidated Fund (AGM Insured) | 4.00 | 7-1-2033 | 710,000 | 750,382 | |
| Odessa TX College District Revenue Consolidated Fund (AGM Insured) | 4.00 | 7-1-2034 | 500,000 | 523,134 | |
| Odessa TX College District Revenue Consolidated Fund (AGM Insured) | 4.00 | 7-1-2035 | 290,000 | 301,587 | |
| 34,457,936 | |||||
| GO revenue: 3.05% | |||||
| Brazosporight TX Independent School District School Building Series A | 4.00 | 2-15-2029 | 2,355,000 | 2,482,179 | |
| Denton TX Independent School District Refunding Bonds Series B | 5.00 | 8-15-2032 | 5,000,000 | 5,020,840 | |
| Fort Bend TX Independent School District Various Refunding Series B øø | 0.72 | 8-1-2051 | 1,500,000 | 1,377,708 | |
| Grapevine Colleyville TX Independent School Building | 5.00 | 8-15-2034 | 2,890,000 | 3,094,801 | |
| Grapevine Colleyville TX Independent School Building | 5.00 | 8-15-2035 | 1,600,000 | 1,712,394 | |
| Harris County TX Cypress-Fairbanks Independent High School Series B-1 øø | 0.28 | 2-15-2040 | 2,870,000 | 2,750,557 | |
| Houston TX Public Improvement Refunding Bonds Series A | 4.00 | 3-1-2031 | 10,110,000 | 10,447,446 | |
| Leander TX Independent School District CAB Bonds Series 2014C ¤ | 0.00 | 8-15-2035 | 2,975,000 | 1,638,939 | |
| Northside Texas Independent School District School Building Bond Series 2018 | 2.75 | 8-1-2048 | 11,275,000 | 11,458,497 | |
| Northwest Texas Independent School District Refunding Bonds | 5.00 | 2-15-2032 | 1,750,000 | 1,880,425 | |
| Texas Transportation Commission Mobility Fund Refunding Bonds Series A | 5.00 | 10-1-2030 | 30,760,000 | 32,777,948 | |
| 74,641,734 | |||||
| Health revenue: 0.30% | |||||
| Harris County TX Cultural Education Facilities Finance Corporation Revenue Texas Medical Center Series A øø | 0.90 | 5-15-2050 | 1,500,000 | 1,474,794 | |
| New Hope TX Cultural Education Facilities Finance Corporation Hospital Children's Health System of Texas Obligated Group Series 2017A | 5.00 | 8-15-2024 | 1,000,000 | 1,058,254 |
| Interest rate | Maturity date | Principal | Value | ||
| Health revenue (continued) | |||||
| New Hope TX Cultural Education Facilities Finance Corporation Hospital Children's Health System of Texas Obligated Group Series 2017A | 5.00% | 8-15-2026 | $ 2,000,000 | $ 2,202,531 | |
| New Hope TX Cultural Education Facilities Finance Corporation Retirement Facility Presbyterian Village North Project | 5.00 | 10-1-2023 | 1,570,000 | 1,578,684 | |
| Tarrant County TX Cultural Education Facilities Finance Corporation Retirement Facility Revenue MRC Stevenson Oaks Project | 3.00 | 11-15-2026 | 1,000,000 | 966,535 | |
| 7,280,798 | |||||
| Housing revenue: 0.10% | |||||
| New Hope TX Cultural Education Facilities Finance Corporation Collegiate Housing Tarleton State University Project Series 2015A | 5.00 | 4-1-2025 | 480,000 | 516,508 | |
| New Hope TX Cultural Education Facilities Finance Corporation Stephenville LLC Tarleton State University Project Series 2013A | 5.38 | 4-1-2028 | 1,845,000 | 1,894,445 | |
| 2,410,953 | |||||
| Industrial development revenue: 0.22% | |||||
| Brazoria County TX Industrial Development Corporation Solid Waste Disposal Facilities Aleon Renewable Metals LLC 144A | 10.00 | 6-1-2042 | 3,000,000 | 2,928,572 | |
| Port Beaumont TX Navigation District Dock and Wharf Facility Revenue Jefferson Gulf Coast Energy 144A | 2.50 | 1-1-2030 | 800,000 | 680,392 | |
| Port Beaumont TX Navigation District Dock and Wharf Facility Revenue Jefferson Gulf Coast Energy 144A | 2.63 | 1-1-2031 | 800,000 | 669,374 | |
| Port Beaumont TX Navigation District Dock and Wharf Facility Revenue Jefferson Gulf Coast Energy 144A | 2.75 | 1-1-2036 | 1,500,000 | 1,134,678 | |
| 5,413,016 | |||||
| Miscellaneous revenue: 0.54% | |||||
| Houston TX Airport System Revenue Refunding Bonds AMT Special Facilities United | 5.00 | 7-1-2027 | 1,750,000 | 1,774,821 | |
| Lower Colorado River Authority Texas Transmission Contract Transmission Services Corporation Project | 5.00 | 5-15-2028 | 1,845,000 | 1,924,357 | |
| Texas Transportation Commission Highway Improvement | 5.00 | 4-1-2027 | 3,010,000 | 3,168,961 | |
| Wise County TX Parker County Junior College District Project | 5.00 | 8-15-2025 | 505,000 | 534,155 | |
| Wise County TX Parker County Junior College District Project | 5.00 | 8-15-2028 | 1,630,000 | 1,769,951 | |
| Wise County TX Parker County Junior College District Project | 5.00 | 8-15-2031 | 680,000 | 750,031 | |
| Wise County TX Parker County Junior College District Project | 5.00 | 8-15-2034 | 980,000 | 1,061,177 | |
| Wood Glen TX Housing Finance Corporation Mortgage Copperwood Project Series A (NPFGC / FHA Insured) | 7.65 | 7-1-2022 | 2,125,000 | 2,125,000 | |
| 13,108,453 | |||||
| Transportation revenue: 0.38% | |||||
| Central Texas Regional Mobility Authority Revenue Senior Lien Series A | 5.00 | 1-1-2023 | 500,000 | 507,138 | |
| Central Texas Regional Mobility Authority Revenue Subordinated Lien BAN Series F | 5.00 | 1-1-2025 | 2,000,000 | 2,085,650 |
| Interest rate | Maturity date | Principal | Value | ||
| Transportation revenue (continued) | |||||
| Harris County TX Cultural Education Facilities Finance Corporation Revenue Texas Medical Center Series A | 5.00% | 8-15-2026 | $ 1,280,000 | $ 1,386,667 | |
| Texas Private Activity Bond Surface Transportation Corporation Senior Lien Revenue Refunding Bonds North Tarrant Express Managed Lanes Project Series A | 5.00 | 12-31-2030 | 1,000,000 | 1,056,170 | |
| Texas Private Activity Bond Surface Transportation Corporation Senior Lien Revenue Refunding Bonds North Tarrant Express Managed Lanes Project Series A | 5.00 | 12-31-2032 | 1,000,000 | 1,046,548 | |
| Texas Private Activity Bond Surface Transportation Corporation Senior Lien Revenue Refunding Bonds North Tarrant Express Managed Lanes Project Series A | 5.00 | 12-31-2033 | 3,000,000 | 3,125,135 | |
| 9,207,308 | |||||
| Utilities revenue: 0.59% | |||||
| Lower Colorado River Authority Texas Transmission Contract Transmission Services Corporation Project (AGM Insured) | 5.00 | 5-15-2029 | 1,745,000 | 1,977,699 | |
| Lower Colorado River Authority Texas Transmission Contract Transmission Services Corporation Project (AGM Insured) | 5.00 | 5-15-2030 | 990,000 | 1,132,581 | |
| San Antonio TX Electric & Gas Systems Various Revenue Refunding Bonds Junior Lien Series 2018 | 2.75 | 2-1-2048 | 6,000,000 | 6,012,763 | |
| San Antonio TX Electric & Gas Systems Various Revenue Refunding Bonds Junior Lien Series 2020 | 1.75 | 2-1-2049 | 4,250,000 | 4,109,380 | |
| Texas Municipal Gas Acquisition & Supply Corporation Series 2021 | 5.00 | 12-15-2024 | 1,100,000 | 1,144,968 | |
| 14,377,391 | |||||
| Water & sewer revenue: 0.73% | |||||
| Dallas TX Waterworks Refunding Bonds Series A | 5.00 | 10-1-2029 | 16,225,000 | 17,806,537 | |
| 194,402,384 | |||||
| Utah: 0.44% | |||||
| Airport revenue: 0.16% | |||||
| Salt Lake City UT Airport Revenue Bonds AMT Series 2018A | 5.00 | 7-1-2029 | 1,000,000 | 1,091,853 | |
| Salt Lake City UT Airport Revenue Bonds AMT Series 2018A | 5.00 | 7-1-2031 | 2,705,000 | 2,914,124 | |
| 4,005,977 | |||||
| Education revenue: 0.06% | |||||
| Utah Charter School Finance Authority Freedom Academy Foundation St. George 144A | 3.25 | 6-15-2031 | 540,000 | 476,446 | |
| Utah Charter School Finance Authority Ronald Wilson Reagan Academy Project Series A 144A | 3.50 | 2-15-2026 | 915,000 | 890,429 | |
| 1,366,875 | |||||
| Miscellaneous revenue: 0.22% | |||||
| Mida Mountain Village Public Infrastructure District Mountain Village Assessment Area #2 144A | 4.00 | 8-1-2024 | 1,000,000 | 996,340 | |
| Mida Mountain Village Public Infrastructure District Mountain Village Assessment Area #2 144A | 4.00 | 8-1-2026 | 1,000,000 | 983,254 | |
| Mida Mountain Village Public Infrastructure District Mountain Village Assessment Area #2 144A | 4.00 | 8-1-2028 | 1,000,000 | 962,679 |
| Interest rate | Maturity date | Principal | Value | ||
| Miscellaneous revenue (continued) | |||||
| Mida Mountain Village Public Infrastructure District Mountain Village Assessment Area #2 144A | 4.00% | 8-1-2029 | $ 580,000 | $ 550,314 | |
| Mida Mountain Village Public Infrastructure District Mountain Village Assessment Area #2 144A | 4.00 | 8-1-2030 | 680,000 | 635,437 | |
| Mida Mountain Village Public Infrastructure District Utah Special Assessment Revenue Bonds Area #2 Series 2021 144A | 4.00 | 8-1-2050 | 1,500,000 | 1,160,672 | |
| 5,288,696 | |||||
| 10,661,548 | |||||
| Vermont: 0.12% | |||||
| Education revenue: 0.05% | |||||
| Vermont Student Assistance Corporation Series A | 5.00 | 6-15-2023 | 1,200,000 | 1,235,045 | |
| Housing revenue: 0.07% | |||||
| Vermont Housing Finance Agency Multiple Purpose Series A (GNMA / FNMA / FHLMC Insured) | 3.75 | 11-1-2050 | 1,615,000 | 1,627,061 | |
| 2,862,106 | |||||
| Virginia: 2.26% | |||||
| Education revenue: 0.04% | |||||
| Virginia College Building Authority Educational Facilities Regent University Project | 5.00 | 6-1-2029 | 330,000 | 354,052 | |
| Virginia College Building Authority Educational Facilities Regent University Project | 5.00 | 6-1-2030 | 350,000 | 375,263 | |
| Virginia College Building Authority Educational Facilities Regent University Project | 5.00 | 6-1-2031 | 300,000 | 321,361 | |
| 1,050,676 | |||||
| Health revenue: 0.03% | |||||
| Roanoke VA EDA Residential Care Facility Revenue Richfield Living | 4.30 | 9-1-2030 | 770,000 | 620,009 | |
| Transportation revenue: 1.75% | |||||
| Chesapeake VA Bay Bridge & Tunnel District First Tier Generation Resolution | 5.00 | 11-1-2023 | 20,000,000 | 20,667,968 | |
| Toll Road Investors Partnership II LP Series 1999-B (National Public Finance Guaranty Insured) 144A¤ | 0.00 | 2-15-2029 | 10,000,000 | 6,790,914 | |
| Virginia SBA Financing Senior Lien Elizabeth River Crossings OpCo LLC Project Series 2012 øø | 6.00 | 1-1-2037 | 5,000,000 | 5,000,000 | |
| Virginia SBA Financing Senior Lien Elizabeth River Crossings OpCo LLC Project Series 2022 %% | 4.00 | 7-1-2029 | 1,750,000 | 1,748,172 | |
| Virginia SBA Financing Senior Lien Elizabeth River Crossings OpCo LLC Project Series 2022 %% | 4.00 | 7-1-2030 | 2,000,000 | 1,984,364 | |
| Virginia SBA Financing Senior Lien Revenue Refunding Bonds 95 Express Lane LLC Project AMT Series 2022 | 5.00 | 1-1-2032 | 3,225,000 | 3,511,446 | |
| Virginia SBA Financing Senior Lien Revenue Refunding Bonds 95 Express Lane LLC Project AMT Series 2022 | 5.00 | 7-1-2032 | 2,800,000 | 3,040,090 | |
| 42,742,954 | |||||
| Utilities revenue: 0.44% | |||||
| Chesapeake VA EDA Pollution Control Electric & Power Company Series 2008A | 1.90 | 2-1-2032 | 4,250,000 | 4,218,286 |
| Interest rate | Maturity date | Principal | Value | ||
| Utilities revenue (continued) | |||||
| Louisa VA IDA PCR Bonds Virginia Electric and Power Company Project Series 2008C | 1.65% | 11-1-2035 | $ 2,000,000 | $ 1,947,123 | |
| Wise County VA IDA Solid Waste & Sewage Disposal Revenue Bond Virginia Electric & Power Company Project Series A øø | 0.75 | 10-1-2040 | 5,000,000 | 4,606,632 | |
| 10,772,041 | |||||
| 55,185,680 | |||||
| Washington: 2.35% | |||||
| Airport revenue: 0.09% | |||||
| Port of Seattle WA Intermediate Lien Revenue Bonds AMT Series 2018A | 5.00 | 5-1-2036 | 2,030,000 | 2,183,200 | |
| GO revenue: 0.22% | |||||
| Washington State Refunding Bonds Motor Vehicle Fuel Tax | 5.00 | 6-1-2027 | 1,120,000 | 1,256,181 | |
| Washington State Refunding Bonds Motor Vehicle Fuel Tax | 5.00 | 6-1-2028 | 1,500,000 | 1,704,860 | |
| Washington State Refunding Bonds Motor Vehicle Fuel Tax | 5.00 | 6-1-2029 | 1,000,000 | 1,151,477 | |
| Washington State Refunding Bonds Motor Vehicle Fuel Tax | 5.00 | 6-1-2030 | 1,150,000 | 1,334,608 | |
| 5,447,126 | |||||
| Health revenue: 0.85% | |||||
| Skagit County WA Public Hospital District Refunding Bonds and Improvement Skagit Regional Health | 5.00 | 12-1-2029 | 3,975,000 | 4,190,747 | |
| Washington HCFR Authority Catholic Health Initiatives Series 2013B-2 (SIFMA Municipal Swap +1.40%) ± | 2.38 | 1-1-2035 | 11,000,000 | 11,043,369 | |
| Washington HCFR Authority CommonSpirit Health Series 2019B-3 | 5.00 | 8-1-2049 | 3,000,000 | 3,170,162 | |
| Washington Housing Finance Commission Nonprofit Housing Revenue Eliseo Project Series B-2 144A | 2.13 | 7-1-2027 | 1,500,000 | 1,341,135 | |
| Washington Housing Finance Commission Nonprofit Housing Revenue Rockwood Retirement Communities 144A | 3.00 | 7-1-2027 | 1,000,000 | 894,224 | |
| 20,639,637 | |||||
| Housing revenue: 0.60% | |||||
| King County WA Housing Authority Workforce Housing Preservation Pooled Revenue Refunding Bond | 2.00 | 10-1-2033 | 600,000 | 503,267 | |
| King County WA Housing Authority Workforce Housing Preservation Pooled Revenue Refunding Bond | 2.13 | 10-1-2036 | 2,000,000 | 1,603,115 | |
| King County WA Housing Authority Workforce Housing Preservation Pooled Revenue Refunding Bond | 4.00 | 10-1-2029 | 225,000 | 239,092 | |
| King County WA Housing Authority Workforce Housing Preservation Pooled Revenue Refunding Bond | 4.00 | 10-1-2030 | 200,000 | 212,795 | |
| King County WA Housing Authority Workforce Housing Preservation Pooled Revenue Refunding Bond | 4.00 | 10-1-2031 | 290,000 | 308,923 | |
| Seattle WA Housing Authority Northgate Plaza Project | 1.00 | 6-1-2026 | 2,000,000 | 1,884,781 | |
| Snohomish County WA Housing Authority | 5.00 | 4-1-2027 | 1,130,000 | 1,239,719 | |
| Snohomish County WA Housing Authority | 5.00 | 4-1-2028 | 1,610,000 | 1,776,388 | |
| Snohomish County WA Housing Authority | 5.00 | 4-1-2029 | 1,690,000 | 1,878,929 | |
| Washington Housing Finance Commission Downtowner Apartments Project (FHLMC LIQ) | 3.70 | 7-1-2030 | 5,000,000 | 5,014,764 | |
| 14,661,773 |
| Interest rate | Maturity date | Principal | Value | ||
| Tax revenue: 0.47% | |||||
| Central Puget Sound Washington Regional Refunding & Improvement Series S-1 | 5.00% | 11-1-2036 | $ 1,000,000 | $ 1,091,031 | |
| Central Puget Sound Washington Regional Refunding & Improvement Series S-1 | 5.00 | 11-1-2050 | 810,000 | 883,735 | |
| Washington Convention Center Junior Lodging Tax Notes | 4.00 | 7-1-2031 | 10,000,000 | 9,544,300 | |
| 11,519,066 | |||||
| Utilities revenue: 0.12% | |||||
| Seattle WA Municipal Light & Power Refunding Bond Series B (SIFMA Municipal Swap +0.25%) ± | 1.23 | 5-1-2045 | 3,000,000 | 2,964,922 | |
| 57,415,724 | |||||
| West Virginia: 0.43% | |||||
| Education revenue: 0.05% | |||||
| West Virginia University Revenues Refunding Bonds West Virginia University Projects Series B | 5.00 | 10-1-2041 | 1,000,000 | 1,105,513 | |
| Tax revenue: 0.13% | |||||
| Monongalia County WV Commission Improvement & Refunding Bonds University Town Center Series A 144A | 4.13 | 6-1-2043 | 900,000 | 800,702 | |
| Monongalia County WV Commission Special District University Town Center Series A 144A | 4.50 | 6-1-2027 | 2,490,000 | 2,483,402 | |
| 3,284,104 | |||||
| Utilities revenue: 0.21% | |||||
| West Virginia EDA Solid Waste Disposal Facilities Revenue Refunding Bonds Wheeling Power Company Mitchell Project Series 2013A | 3.00 | 6-1-2037 | 5,245,000 | 5,132,138 | |
| Water & sewer revenue: 0.04% | |||||
| Parkersburg WV Waterworks and Sewerage System Series A (BAM Insured) | 3.00 | 8-1-2022 | 250,000 | 250,295 | |
| Parkersburg WV Waterworks and Sewerage System Series A (BAM Insured) | 3.00 | 8-1-2024 | 400,000 | 406,316 | |
| Parkersburg WV Waterworks and Sewerage System Series A (BAM Insured) | 3.00 | 8-1-2025 | 400,000 | 407,204 | |
| 1,063,815 | |||||
| 10,585,570 | |||||
| Wisconsin: 3.08% | |||||
| Airport revenue: 0.01% | |||||
| Wisconsin PFA Airport Series C | 5.00 | 7-1-2022 | 360,000 | 360,000 | |
| Education revenue: 0.26% | |||||
| Corvian County WI Community School Revenue 144A | 4.25 | 6-15-2029 | 870,000 | 836,533 | |
| Milwaukee WI RDA Science Education Consortium Incorporated Project Series A | 4.75 | 8-1-2023 | 220,000 | 222,631 | |
| Pine Lake WI PFA Pine Lake Preparatory School Series 2015 144A | 4.35 | 3-1-2025 | 1,130,000 | 1,148,435 | |
| Wisconsin PFA Charter School Revenue American Preparatory Academy 144A | 4.00 | 7-15-2029 | 650,000 | 631,359 |
| Interest rate | Maturity date | Principal | Value | ||
| Education revenue (continued) | |||||
| Wisconsin PFA Conference Center & Hotel Revenue Foundation of The University of North Carolina at Charlotte Incorporated Series A 144A | 4.00% | 9-1-2036 | $ 1,000,000 | $ 880,855 | |
| Wisconsin PFA Education Revenue Corvian Community School Series A 144A | 4.00 | 6-15-2029 | 905,000 | 856,500 | |
| Wisconsin PFA Educational Facility Revenue Estancia Valley Classical Academy Project Series A 144A | 4.00 | 7-1-2031 | 1,150,000 | 1,022,916 | |
| Wisconsin PFA Revenue Refunding Bonds Roseman University of Health Sciences Project Series 2022 144A | 4.00 | 4-1-2032 | 900,000 | 865,056 | |
| 6,464,285 | |||||
| GO revenue: 0.88% | |||||
| Eau Claire WI Area School District Refunding Bonds | 5.00 | 4-1-2023 | 1,860,000 | 1,904,889 | |
| Eau Claire WI Area School District Refunding Bonds | 5.00 | 4-1-2024 | 1,000,000 | 1,049,996 | |
| Wisconsin Series B | 5.00 | 5-1-2031 | 12,230,000 | 13,309,479 | |
| Wisconsin Series B | 5.00 | 5-1-2034 | 5,000,000 | 5,310,757 | |
| 21,575,121 | |||||
| Health revenue: 0.80% | |||||
| Entrance Fee Principal PFA Searstone Project Series B-2 | 2.25 | 6-1-2027 | 1,840,000 | 1,660,292 | |
| Wisconsin HEFA Ascension Health Credit Group Series A | 4.00 | 11-15-2034 | 2,000,000 | 2,004,919 | |
| Wisconsin HEFA Bellin Memorial Hospital Series 2015 | 5.00 | 12-1-2022 | 755,000 | 765,615 | |
| Wisconsin HEFA Beloit Health System Incorporated | 5.00 | 7-1-2027 | 1,145,000 | 1,242,811 | |
| Wisconsin HEFA Beloit Health System Incorporated | 5.00 | 7-1-2028 | 600,000 | 655,714 | |
| Wisconsin HEFA Marshfield Clinic Health System Incorporated | 5.00 | 2-15-2052 | 3,000,000 | 3,163,294 | |
| Wisconsin HEFA St. Camillus Health System Incorporated | 2.25 | 11-1-2026 | 1,750,000 | 1,713,840 | |
| Wisconsin HEFA St. Camillus Health System Incorporated | 5.00 | 11-1-2027 | 375,000 | 379,866 | |
| Wisconsin HEFA St. Camillus Health System Incorporated | 5.00 | 11-1-2028 | 470,000 | 475,042 | |
| Wisconsin HEFA St. John's Community Incorporated Project %% | 4.00 | 9-15-2029 | 895,000 | 864,210 | |
| Wisconsin PFA Hospital Revenue Carson Valley Medical Center Series A | 4.00 | 12-1-2031 | 700,000 | 690,372 | |
| Wisconsin PFA Revenue Providence St. Joseph Health Obligated Group Series C | 4.00 | 10-1-2041 | 3,000,000 | 3,068,581 | |
| Wisconsin PFA Revenue Texas Biomedical Research Institute Series A | 4.00 | 6-1-2035 | 600,000 | 566,196 | |
| Wisconsin PFA Revenue Texas Biomedical Research Institute Series A | 5.00 | 6-1-2029 | 175,000 | 190,303 | |
| Wisconsin PFA Revenue Texas Biomedical Research Institute Series A | 5.00 | 6-1-2030 | 175,000 | 191,111 | |
| Wisconsin PFA Revenue Texas Biomedical Research Institute Series A | 5.00 | 6-1-2031 | 275,000 | 301,477 | |
| Wisconsin PFA Revenue Texas Biomedical Research Institute Series A | 5.00 | 6-1-2032 | 350,000 | 376,670 | |
| Wisconsin PFA Revenue Texas Biomedical Research Institute Series A | 5.00 | 6-1-2033 | 550,000 | 589,560 | |
| Wisconsin PFA Revenue Texas Biomedical Research Institute Series A | 5.00 | 6-1-2034 | 570,000 | 609,445 | |
| 19,509,318 |
| Interest rate | Maturity date | Principal | Value | ||
| Industrial development revenue: 0.27% | |||||
| Wisconsin PFA Grand Hyatt San Antonio Hotel Acquisition Project Series 2022A | 3.75% | 2-1-2032 | $ 850,000 | $ 807,387 | |
| Wisconsin PFA Series 2022A 144A | 5.50 | 2-1-2042 | 5,950,000 | 5,683,469 | |
| 6,490,856 | |||||
| Miscellaneous revenue: 0.13% | |||||
| Wisconsin State Series 2 | 5.00 | 11-1-2029 | 3,000,000 | 3,276,237 | |
| Tax revenue: 0.65% | |||||
| Wisconsin Center District Tax Revenue CAB Junior Dedicated Series D ¤ | 0.00 | 12-15-2028 | 260,000 | 210,828 | |
| Wisconsin Center District Tax Revenue CAB Junior Dedicated Series D ¤ | 0.00 | 12-15-2029 | 390,000 | 303,041 | |
| Wisconsin Center District Tax Revenue CAB Junior Dedicated Series D ¤ | 0.00 | 12-15-2030 | 550,000 | 408,696 | |
| Wisconsin Center District Tax Revenue CAB Senior Dedicated Series C (AGM Insured) ¤ | 0.00 | 12-15-2029 | 1,050,000 | 804,028 | |
| Wisconsin Center District Tax Revenue CAB Senior Dedicated Series C (AGM Insured) ¤ | 0.00 | 12-15-2031 | 1,350,000 | 940,833 | |
| Wisconsin State General Fund Annual Appropriations Series A | 5.00 | 5-1-2028 | 11,775,000 | 13,083,789 | |
| 15,751,215 | |||||
| Water & sewer revenue: 0.08% | |||||
| Wisconsin Clean Water Refunding Bonds Series 2012 | 5.00 | 6-1-2023 | 310,000 | 319,209 | |
| Wisconsin Clean Water Refunding Bonds Series 2015 | 5.00 | 6-1-2026 | 1,525,000 | 1,610,127 | |
| 1,929,336 | |||||
| 75,356,368 | |||||
| Total Municipal obligations (Cost $2,452,904,760) | 2,365,275,414 |
| Yield | Shares | ||||
| Short-term investments: 2.59% | |||||
| Investment companies: 2.59% | |||||
| Allspring Municipal Cash Management Money Market Fund Institutional Class ♠∞## | 0.85 | 63,215,221 | 63,253,150 | ||
| Total Short-term investments (Cost $63,251,027) | 63,253,150 | ||||
| Total investments in securities (Cost $2,516,155,787) | 99.42% | 2,428,528,564 | |||
| Other assets and liabilities, net | 0.58 | 14,071,560 | |||
| Total net assets | 100.00% | $2,442,600,124 |
| 144A | The security may be resold in transactions exempt from registration, normally to qualified institutional buyers, pursuant to Rule 144A under the Securities Act of 1933. |
| øø | The interest rate is determined and reset by the issuer periodically depending upon the terms of the security. The rate shown is the rate in effect at period end. |
| ± | Variable rate investment. The rate shown is the rate in effect at period end. |
| ø | Variable rate demand notes are subject to a demand feature which reduces the effective maturity. The maturity date shown represents the final maturity date of the security. The interest rate is determined and reset by the issuer daily, weekly, or monthly depending upon the terms of the security. The rate shown is the rate in effect at period end. |
| € | The security is an auction-rate security which has an interest rate that resets at predetermined short-term intervals through a Dutch auction. The rate shown is the rate in effect at period end. |
| ¤ | The security is issued in zero coupon form with no periodic interest payments. |
| † | Non-income-earning security |
| ## | All or a portion of this security is segregated for when-issued securities. |
| ♠ | The issuer of the security is an affiliated person of the Fund as defined in the Investment Company Act of 1940. |
| ∞ | The rate represents the 7-day annualized yield at period end. |
| %% | The security is purchased on a when-issued basis. |
| Abbreviations: | |
| AGC | Assured Guaranty Corporation |
| AGM | Assured Guaranty Municipal |
| Ambac | Ambac Financial Group Incorporated |
| AMT | Alternative minimum tax |
| BAM | Build America Mutual Assurance Company |
| BAN | Bond anticipation notes |
| CAB | Capital appreciation bond |
| CDA | Community Development Authority |
| ECFA | Educational & Cultural Facilities Authority |
| EDA | Economic Development Authority |
| EDFA | Economic Development Finance Authority |
| FHA | Federal Housing Administration |
| FHLMC | Federal Home Loan Mortgage Corporation |
| FNMA | Federal National Mortgage Association |
| GNMA | Government National Mortgage Association |
| GO | General obligation |
| HCFR | Healthcare facilities revenue |
| HEFA | Health & Educational Facilities Authority |
| HEFAR | Higher Education Facilities Authority Revenue |
| HFA | Housing Finance Authority |
| HFFA | Health Facilities Financing Authority |
| IDA | Industrial Development Authority |
| LIBOR | London Interbank Offered Rate |
| LIQ | Liquidity agreement |
| LOC | Letter of credit |
| MFHR | Multifamily housing revenue |
| NPFGC | National Public Finance Guarantee Corporation |
| PCFA | Pollution Control Financing Authority |
| PCR | Pollution control revenue |
| PFA | Public Finance Authority |
| RDA | Redevelopment Authority |
| SBA | Small Business Authority |
| SIFMA | Securities Industry and Financial Markets Association |
| SOFR | Secured Overnight Financing Rate |
| SPA | Standby purchase agreement |
| TTFA | Transportation Trust Fund Authority |
| Value, beginning of period | Purchases | Sales proceeds | Net realized gains (losses) | Net change in unrealized gains (losses) | Value, end of period | Shares, end of period | Income from affiliated securities | |
| Short-term investments | ||||||||
| Allspring Municipal Cash Management Money Market Fund Institutional Class | $83,256,830 | $908,187,530 | $(928,202,040) | $9,453 | $1,377 | $63,253,150 | 63,215,221 | $60,391 |
| Description | Number of contracts | Expiration date | Notional cost | Notional value | Unrealized gains | Unrealized losses |
| Short | ||||||
| 10-Year U.S. Treasury Notes | (200) | 9-21-2022 | $(23,649,660) | $(23,706,250) | $0 | $(56,590) |
| Assets | |
Investments in unaffiliated securities, at value (cost $2,452,904,760) | $ 2,365,275,414 |
Investments in affiliated securities, at value (cost $63,251,027) | 63,253,150 |
Cash | 14,208 |
Cash at broker segregated for futures contracts | 367,638 |
Receivable for interest | 24,518,785 |
Receivable for Fund shares sold | 4,348,294 |
Receivable for investments sold | 3,011,193 |
Prepaid expenses and other assets | 62,028 |
Total assets | 2,460,850,710 |
| Liabilities | |
Payable for when-issued transactions | 9,520,684 |
Payable for Fund shares redeemed | 7,022,584 |
Management fee payable | 739,803 |
Dividends payable | 504,053 |
Administration fees payable | 200,139 |
Payable for daily variation margin on open futures contracts | 56,590 |
Distribution fee payable | 24,630 |
Trustees’ fees and expenses payable | 2,719 |
Accrued expenses and other liabilities | 179,384 |
Total liabilities | 18,250,586 |
Total net assets | $2,442,600,124 |
| Net assets consist of | |
Paid-in capital | $ 2,549,171,687 |
Total distributable loss | (106,571,563) |
Total net assets | $2,442,600,124 |
| Computation of net asset value and offering price per share | |
Net assets – Class A | $ 508,573,138 |
Shares outstanding – Class A1 | 58,590,890 |
Net asset value per share – Class A | $8.68 |
Maximum offering price per share – Class A2 | $9.04 |
Net assets – Class C | $ 39,696,461 |
Shares outstanding – Class C1 | 4,557,592 |
Net asset value per share – Class C | $8.71 |
Net assets – Class R6 | $ 11,007,852 |
Shares outstanding – Class R61 | 1,268,092 |
Net asset value per share – Class R6 | $8.68 |
Net assets – Administrator Class | $ 76,815,589 |
Shares outstanding – Administrator Class1 | 8,854,700 |
Net asset value per share – Administrator Class | $8.68 |
Net assets – Institutional Class | $ 1,806,507,084 |
Shares outstanding – Institutional Class1 | 208,176,616 |
Net asset value per share – Institutional Class | $8.68 |
| 1 | The Fund has an unlimited number of authorized shares. |
| 2 | Maximum offering price is computed as 100/96 of net asset value. On investments of $50,000 or more, the offering price is reduced. |
| Investment income | |
Interest | $ 63,928,108 |
Income from affiliated securities | 60,391 |
Total investment income | 63,988,499 |
| Expenses | |
Management fee | 10,699,794 |
| Administration fees | |
Class A | 955,586 |
Class C | 80,222 |
Class R6 | 4,133 |
Administrator Class | 102,401 |
Institutional Class | 1,753,267 |
| Shareholder servicing fees | |
Class A | 1,493,092 |
Class C | 125,001 |
Administrator Class | 254,401 |
| Distribution fee | |
Class C | 375,003 |
Custody and accounting fees | 110,255 |
Professional fees | 76,516 |
Registration fees | 172,290 |
Shareholder report expenses | 80,512 |
Trustees’ fees and expenses | 20,033 |
Other fees and expenses | 55,408 |
Total expenses | 16,357,914 |
| Less: Fee waivers and/or expense reimbursements | |
Class A | (1,617) |
Administrator Class | (49,353) |
Net expenses | 16,306,944 |
Net investment income | 47,681,555 |
| Realized and unrealized gains (losses) on investments | |
| Net realized gains (losses) on | |
Unaffiliated securities | (10,666,115) |
Affiliated securities | 9,453 |
Futures contracts | 623,440 |
Net realized losses on investments | (10,033,222) |
| Net change in unrealized gains (losses) on | |
Unaffiliated securities | (200,566,088) |
Affiliated securities | 1,377 |
Futures contracts | (56,590) |
Net change in unrealized gains (losses) on investments | (200,621,301) |
Net realized and unrealized gains (losses) on investments | (210,654,523) |
Net decrease in net assets resulting from operations | $(162,972,968) |
| Year ended June 30, 2022 | Year ended June 30, 2021 | |||
| Operations | ||||
Net investment income | $ 47,681,555 | $ 48,317,416 | ||
Net realized gains (losses) on investments | (10,033,222) | 2,109,518 | ||
Net change in unrealized gains (losses) on investments | (200,621,301) | 44,670,512 | ||
Net increase (decrease) in net assets resulting from operations | (162,972,968) | 95,097,446 | ||
| Distributions to shareholders from | ||||
| Net investment income and net realized gains | ||||
Class A | (8,226,378) | (8,720,081) | ||
Class C | (312,087) | (448,752) | ||
Class R6 | (240,075) | (382,035) | ||
Administrator Class | (1,512,513) | (1,856,941) | ||
Institutional Class | (37,387,253) | (37,234,619) | ||
Total distributions to shareholders | (47,678,306) | (48,642,428) | ||
| Capital share transactions | Shares | Shares | ||
| Proceeds from shares sold | ||||
Class A | 10,739,692 | 98,440,532 | 20,714,962 | 192,340,071 |
Class C | 636,058 | 5,888,091 | 1,499,230 | 13,959,853 |
Class R6 | 576,086 | 5,291,077 | 605,823 | 5,608,705 |
Administrator Class | 3,043,843 | 28,151,678 | 3,675,293 | 34,067,514 |
Institutional Class | 105,486,944 | 953,288,175 | 116,362,031 | 1,079,938,083 |
| 1,091,059,553 | 1,325,914,226 | |||
| Reinvestment of distributions | ||||
Class A | 813,995 | 7,373,477 | 847,490 | 7,868,254 |
Class C | 31,998 | 289,895 | 43,525 | 405,245 |
Class R6 | 16,150 | 146,388 | 18,022 | 167,297 |
Administrator Class | 162,068 | 1,469,491 | 194,043 | 1,799,801 |
Institutional Class | 3,602,410 | 32,646,734 | 3,427,679 | 31,814,419 |
| 41,925,985 | 42,055,016 | |||
| Payment for shares redeemed | ||||
Class A | (19,694,585) | (177,517,874) | (14,333,244) | (133,073,086) |
Class C | (2,145,684) | (19,520,756) | (3,057,048) | (28,421,728) |
Class R6 | (1,210,075) | (11,157,810) | (968,596) | (9,001,156) |
Administrator Class | (6,280,931) | (56,916,202) | (4,583,793) | (42,503,136) |
Institutional Class | (143,530,875) | (1,284,623,827) | (76,704,450) | (712,279,926) |
| (1,549,736,469) | (925,279,032) | |||
Net increase (decrease) in net assets resulting from capital share transactions | (416,750,931) | 442,690,210 | ||
Total increase (decrease) in net assets | (627,402,205) | 489,145,228 | ||
| Net assets | ||||
Beginning of period | 3,070,002,329 | 2,580,857,101 | ||
End of period | $ 2,442,600,124 | $3,070,002,329 | ||
| Year ended June 30 | |||||
| Class A | 2022 | 2021 | 2020 | 2019 | 2018 |
Net asset value, beginning of period | $9.33 | $9.17 | $9.14 | $8.93 | $8.94 |
Net investment income | 0.13 | 0.14 | 0.17 | 0.18 | 0.15 |
Net realized and unrealized gains (losses) on investments | (0.65) | 0.16 | 0.03 | 0.21 | 0.01 |
Total from investment operations | (0.52) | 0.30 | 0.20 | 0.39 | 0.16 |
| Distributions to shareholders from | |||||
Net investment income | (0.13) | (0.14) | (0.16) | (0.18) | (0.15) |
Net realized gains | 0.00 | 0.00 | (0.01) | 0.00 | (0.02) |
Total distributions to shareholders | (0.13) | (0.14) | (0.17) | (0.18) | (0.17) |
Net asset value, end of period | $8.68 | $9.33 | $9.17 | $9.14 | $8.93 |
Total return1 | (5.66)% | 3.26% | 2.23% | 4.41% | 1.82% |
| Ratios to average net assets (annualized) | |||||
Gross expenses | 0.79% | 0.79% | 0.79% | 0.80% | 0.82% |
Net expenses | 0.79% | 0.79% | 0.79% | 0.80% | 0.82% |
Net investment income | 1.38% | 1.47% | 1.81% | 1.99% | 1.69% |
| Supplemental data | |||||
Portfolio turnover rate | 24% | 11% | 26% | 29% | 33% |
Net assets, end of period (000s omitted) | $508,573 | $622,409 | $545,670 | $528,004 | $491,128 |
| 1 | Total return calculations do not include any sales charges. |
| Year ended June 30 | |||||
| Class C | 2022 | 2021 | 2020 | 2019 | 2018 |
Net asset value, beginning of period | $9.36 | $9.20 | $9.17 | $8.96 | $8.97 |
Net investment income | 0.06 | 0.07 | 0.10 | 0.11 1 | 0.08 1 |
Net realized and unrealized gains (losses) on investments | (0.65) | 0.16 | 0.04 | 0.21 | 0.01 |
Total from investment operations | (0.59) | 0.23 | 0.14 | 0.32 | 0.09 |
| Distributions to shareholders from | |||||
Net investment income | (0.06) | (0.07) | (0.10) | (0.11) | (0.08) |
Net realized gains | 0.00 | 0.00 | (0.01) | 0.00 | (0.02) |
Total distributions to shareholders | (0.06) | (0.07) | (0.11) | (0.11) | (0.10) |
Net asset value, end of period | $8.71 | $9.36 | $9.20 | $9.17 | $8.96 |
Total return2 | (6.34)% | 2.49% | 1.47% | 3.62% | 1.06% |
| Ratios to average net assets (annualized) | |||||
Gross expenses | 1.54% | 1.54% | 1.54% | 1.55% | 1.57% |
Net expenses | 1.54% | 1.54% | 1.54% | 1.55% | 1.57% |
Net investment income | 0.62% | 0.72% | 1.06% | 1.24% | 0.94% |
| Supplemental data | |||||
Portfolio turnover rate | 24% | 11% | 26% | 29% | 33% |
Net assets, end of period (000s omitted) | $39,696 | $56,483 | $69,472 | $82,331 | $115,518 |
| 1 | Calculated based upon average shares outstanding |
| 2 | Total return calculations do not include any sales charges. |
| Year ended June 30 | ||||
| Class R6 | 2022 | 2021 | 2020 | 2019 1 |
Net asset value, beginning of period | $9.33 | $9.17 | $9.15 | $8.94 |
Net investment income | 0.16 | 0.17 | 0.20 | 0.20 |
Net realized and unrealized gains (losses) on investments | (0.65) | 0.16 | 0.03 | 0.21 |
Total from investment operations | (0.49) | 0.33 | 0.23 | 0.41 |
| Distributions to shareholders from | ||||
Net investment income | (0.16) | (0.17) | (0.20) | (0.20) |
Net realized gains | 0.00 | 0.00 | (0.01) | 0.00 |
Total distributions to shareholders | (0.16) | (0.17) | (0.21) | (0.20) |
Net asset value, end of period | $8.68 | $9.33 | $9.17 | $9.15 |
Total return2 | (5.30)% | 3.65% | 2.51% | 4.61% |
| Ratios to average net assets (annualized) | ||||
Gross expenses | 0.41% | 0.41% | 0.41% | 0.41% |
Net expenses | 0.41% | 0.41% | 0.41% | 0.41% |
Net investment income | 1.74% | 1.85% | 2.19% | 2.39% |
| Supplemental data | ||||
Portfolio turnover rate | 24% | 11% | 26% | 29% |
Net assets, end of period (000s omitted) | $11,008 | $17,590 | $20,459 | $13,291 |
| 1 | For the period from July 31, 2018 (commencement of class operations) to June 30, 2019 |
| 2 | Returns for periods of less than one year are not annualized. |
| Year ended June 30 | |||||
| Administrator Class | 2022 | 2021 | 2020 | 2019 | 2018 |
Net asset value, beginning of period | $9.32 | $9.17 | $9.14 | $8.93 | $8.93 |
Net investment income | 0.13 | 0.15 | 0.17 | 0.19 | 0.16 |
Net realized and unrealized gains (losses) on investments | (0.63) | 0.15 | 0.04 | 0.21 | 0.02 |
Total from investment operations | (0.50) | 0.30 | 0.21 | 0.40 | 0.18 |
| Distributions to shareholders from | |||||
Net investment income | (0.14) | (0.15) | (0.17) | (0.19) | (0.16) |
Net realized gains | 0.00 | 0.00 | (0.01) | 0.00 | (0.02) |
Total distributions to shareholders | (0.14) | (0.15) | (0.18) | (0.19) | (0.18) |
Net asset value, end of period | $8.68 | $9.32 | $9.17 | $9.14 | $8.93 |
Total return | (5.46)% | 3.27% | 2.34% | 4.53% | 2.07% |
| Ratios to average net assets (annualized) | |||||
Gross expenses | 0.73% | 0.73% | 0.73% | 0.73% | 0.76% |
Net expenses | 0.68% | 0.68% | 0.68% | 0.68% | 0.68% |
Net investment income | 1.48% | 1.58% | 1.92% | 2.10% | 1.80% |
| Supplemental data | |||||
Portfolio turnover rate | 24% | 11% | 26% | 29% | 33% |
Net assets, end of period (000s omitted) | $76,816 | $111,200 | $115,889 | $149,097 | $191,723 |
| Year ended June 30 | |||||
| Institutional Class | 2022 | 2021 | 2020 | 2019 | 2018 |
Net asset value, beginning of period | $9.32 | $9.17 | $9.14 | $8.93 | $8.94 |
Net investment income | 0.16 | 0.17 | 0.20 | 0.21 | 0.18 |
Net realized and unrealized gains (losses) on investments | (0.64) | 0.15 | 0.04 | 0.21 | 0.01 |
Total from investment operations | (0.48) | 0.32 | 0.24 | 0.42 | 0.19 |
| Distributions to shareholders from | |||||
Net investment income | (0.16) | (0.17) | (0.20) | (0.21) | (0.18) |
Net realized gains | 0.00 | 0.00 | (0.01) | 0.00 | (0.02) |
Total distributions to shareholders | (0.16) | (0.17) | (0.21) | (0.21) | (0.20) |
Net asset value, end of period | $8.68 | $9.32 | $9.17 | $9.14 | $8.93 |
Total return | (5.25)% | 3.49% | 2.57% | 4.75% | 2.16% |
| Ratios to average net assets (annualized) | |||||
Gross expenses | 0.46% | 0.46% | 0.46% | 0.47% | 0.49% |
Net expenses | 0.46% | 0.46% | 0.46% | 0.47% | 0.48% |
Net investment income | 1.71% | 1.80% | 2.14% | 2.32% | 2.05% |
| Supplemental data | |||||
Portfolio turnover rate | 24% | 11% | 26% | 29% | 33% |
Net assets, end of period (000s omitted) | $1,806,507 | $2,262,320 | $1,829,368 | $1,647,093 | $1,224,170 |
| Gross unrealized gains | $ 10,873,899 |
| Gross unrealized losses | (98,891,372) |
| Net unrealized losses | $(88,017,473) |
| ■ | Level 1 – quoted prices in active markets for identical securities |
| ■ | Level 2 – other significant observable inputs (including quoted prices for similar securities, interest rates, prepayment speeds, credit risk, etc.) |
| ■ | Level 3 – significant unobservable inputs (including the Fund’s own assumptions in determining the fair value of investments) |
| Quoted prices (Level 1) | Other significant observable inputs (Level 2) | Significant unobservable inputs (Level 3) | Total | |
| Assets | ||||
| Investments in: | ||||
| Municipal obligations | $ 0 | $ 2,365,275,414 | $0 | $ 2,365,275,414 |
| Short-term investments | ||||
| Investment companies | 63,253,150 | 0 | 0 | 63,253,150 |
| Total assets | $63,253,150 | $2,365,275,414 | $0 | $2,428,528,564 |
| Liabilities | ||||
| Futures contracts | $ 56,590 | $ 0 | $0 | $ 56,590 |
| Total liabilities | $ 56,590 | $ 0 | $0 | $ 56,590 |
| Average daily net assets | Management fee |
| First $500 million | 0.400% |
| Next $500 million | 0.375 |
| Next $2 billion | 0.350 |
| Next $2 billion | 0.325 |
| Next $5 billion | 0.290 |
| Over $10 billion | 0.280 |
| Class-level administration fee | |
| Class A | 0.16% |
| Class C | 0.16 |
| Class R6 | 0.03 |
| Administrator Class | 0.10 |
| Institutional Class | 0.08 |
| Expense ratio caps | |
| Class A | 0.81% |
| Class C | 1.56 |
| Class R6 | 0.43 |
| Administrator Class | 0.68 |
| Institutional Class | 0.48 |
| Undistributed tax-exempt income | Unrealized losses | Capital loss carryforward |
| $398,479 | $(88,017,473) | $(18,439,321) |
Allspring Funds Trust:

| Name and year of birth | Position held and length of service* | Principal occupations during past five years or longer | Current other public company or investment company directorships |
| William R. Ebsworth (Born 1957) | Trustee, since 2015 | Retired. From 1984 to 2013, equities analyst, portfolio manager, research director and chief investment officer at Fidelity Management and Research Company in Boston, Tokyo, and Hong Kong, and retired in 2013 as Chief Investment Officer of Fidelity Strategic Advisers, Inc. where he led a team of investment professionals managing client assets. Prior thereto, Board member of Hong Kong Securities Clearing Co., Hong Kong Options Clearing Corp., the Thailand International Fund, Ltd., Fidelity Investments Life Insurance Company, and Empire Fidelity Investments Life Insurance Company. Audit Committee Chair and Investment Committee Chair of the Vincent Memorial Hospital Endowment (non-profit organization). Mr. Ebsworth is a CFA® charterholder. | N/A |
| Jane A. Freeman (Born 1953) | Trustee, since 2015; Chair Liaison, since 2018 | Retired. From 2012 to 2014 and 1999 to 2008, Chief Financial Officer of Scientific Learning Corporation. From 2008 to 2012, Ms. Freeman provided consulting services related to strategic business projects. Prior to 1999, Portfolio Manager at Rockefeller & Co. and Scudder, Stevens & Clark. Board member of the Harding Loevner Funds from 1996 to 2014, serving as both Lead Independent Director and chair of the Audit Committee. Board member of the Russell Exchange Traded Funds Trust from 2011 to 2012 and the chair of the Audit Committee. Ms. Freeman is also an inactive Chartered Financial Analyst. | N/A |
| Isaiah Harris, Jr. (Born 1952) | Trustee, since 2009; Audit Committee Chair, since 2019 | Retired. Chairman of the Board of CIGNA Corporation from 2009 to 2021, and Director from 2005 to 2008. From 2003 to 2011, Director of Deluxe Corporation. Prior thereto, President and CEO of BellSouth Advertising and Publishing Corp. from 2005 to 2007, President and CEO of BellSouth Enterprises from 2004 to 2005 and President of BellSouth Consumer Services from 2000 to 2003. Emeritus member of the Iowa State University Foundation Board of Governors. Emeritus Member of the Advisory Board of Iowa State University School of Business. Advisory Board Member, Palm Harbor Academy (private school). Advisory Board Member, Fellowship of Christian Athletes. Mr. Harris is a certified public accountant (inactive status). | N/A |
| David F. Larcker (Born 1950) | Trustee, since 2009 | James Irvin Miller Professor of Accounting at the Graduate School of Business (Emeritus), Stanford University, Director of the Corporate Governance Research Initiative and Senior Faculty of The Rock Center for Corporate Governance since 2006. From 2005 to 2008, Professor of Accounting at the Graduate School of Business, Stanford University. Prior thereto, Ernst & Young Professor of Accounting at The Wharton School, University of Pennsylvania from 1985 to 2005. | N/A |
| Name and year of birth | Position held and length of service* | Principal occupations during past five years or longer | Current other public company or investment company directorships |
| Olivia S. Mitchell (Born 1953) | Trustee, since 2006; Nominating and Governance Committee Chair, since 2018 | International Foundation of Employee Benefit Plans Professor since 1993, Wharton School of the University of Pennsylvania. Director of Wharton’s Pension Research Council and Boettner Center on Pensions & Retirement Research, and Research Associate at the National Bureau of Economic Research. Previously taught at Cornell University from 1978 to 1993. | N/A |
| Timothy J. Penny (Born 1951) | Trustee, since 1996; Chair, since 2018 | President and Chief Executive Officer of Southern Minnesota Initiative Foundation, a non-profit organization, since 2007. Member of the Board of Trustees of NorthStar Education Finance, Inc., a non-profit organization, since 2007. | N/A |
| James G. Polisson (Born 1959) | Trustee, since 2018 | Retired. Chief Marketing Officer, Source (ETF) UK Services, Ltd, from 2015 to 2017. From 2012 to 2015, Principal of The Polisson Group, LLC, a management consulting, corporate advisory and principal investing company. Chief Executive Officer and Managing Director at Russell Investments, Global Exchange Traded Funds from 2010 to 2012. Managing Director of Barclays Global Investors from 1998 to 2010 and Global Chief Marketing Officer for iShares and Barclays Global Investors from 2000 to 2010. Trustee of the San Francisco Mechanics’ Institute, a non-profit organization, from 2013 to 2015. Board member of the Russell Exchange Traded Fund Trust from 2011 to 2012. Director of Barclays Global Investors Holdings Deutschland GmbH from 2006 to 2009. Mr. Polisson is an attorney and has a retired status with the Massachusetts and District of Columbia Bar Associations. | N/A |
| Pamela Wheelock (Born 1959) | Trustee, since January 2020; previously Trustee from January 2018 to July 2019 | Board member of the Destination Medical Center Economic Development Agency, Rochester, Minnesota since 2019. Interim President of the McKnight Foundation from January to September 2020. McKnight Foundation Consultant, November 2020 to February 2021. Acting Commissioner, Minnesota Department of Human Services, July 2019 through September 2019. Consultant (part-time), Minnesota Department of Human Services, October 2019 through December 2019. Chief Operating Officer, Twin Cities Habitat for Humanity from 2017 to 2019. Vice President of University Services, University of Minnesota from 2012 to 2016. Prior thereto, on the Board of Directors, Governance Committee and Finance Committee for the Minnesota Philanthropy Partners (Saint Paul Foundation) from 2012 to 2018, Interim Chief Executive Officer of Blue Cross Blue Shield of Minnesota from 2011 to 2012, Chairman of the Board from 2009 to 2012 and Board Director from 2003 to 2015. Vice President, Leadership and Community Engagement, Bush Foundation, Saint Paul, Minnesota (a private foundation) from 2009 to 2011. Executive Vice President and Chief Financial Officer, Minnesota Sports and Entertainment from 2004 to 2009 and Senior Vice President from 2002 to 2004. Executive Vice President of the Minnesota Wild Foundation from 2004 to 2008. Commissioner of Finance, State of Minnesota, from 1999 to 2002. Currently Board Chair of the Minnesota Wild Foundation since 2010. | N/A |
| Name and year of birth | Position held and length of service | Principal occupations during past five years or longer |
| Andrew Owen (Born 1960) | President, since 2017 | President, Chief Executive Officer and Director of Allspring Funds Management, LLC since 2017 and co-president of Galliard Capital Management, LLC, an affiliate of Allspring Funds Management, LLC, since 2019. Prior thereto, Head of Affiliated Managers, Allspring Global Investments, from 2014 to 2019 and Executive Vice President responsible for marketing, investments and product development for Allspring Funds Management, LLC, from 2009 to 2014. In addition, Mr. Owen was an Executive Vice President of Wells Fargo & Company from 2014 to 2021. |
| Jeremy DePalma (Born 1974) | Treasurer, since 2012 (for certain funds in the Fund Complex); since 2021 (for the remaining funds in the Fund Complex) | Senior Vice President of Allspring Funds Management, LLC since 2009. Senior Vice President of Evergreen Investment Management Company, LLC from 2008 to 2010 and head of the Fund Reporting and Control Team within Fund Administration from 2005 to 2010. |
| Kate McKinley (Born 1977) | Chief Legal Officer, since 2021 | Chief Legal Officer of Allspring Global Investments since 2021. Prior thereto, held various roles at State Street Global Advisors beginning in 2010, including serving as Senior Vice President and General Counsel from 2019 to 2021, and Chief Operating Officer of the Institutional Client Group from 2016 - 2019. Prior to working at State Street Global Advisors served as Assistant General Counsel for Bank of America Corporation from 2005 to 2010 and as an Associate at WilmerHale from 2002 to 2005. |
| Christopher Baker (Born 1976) | Chief Compliance Officer, since 2022 | Global Chief Compliance Officer for Allspring Global Investments since 2022. Prior thereto, Chief Compliance Officer for State Street Global Advisors from 2018 to 2021. Senior Compliance Officer for the State Street divisions of Alternative Investment Solutions, Sector Solutions, and Global Marketing from 2015 to 2018. From 2010 to 2015 Vice President, Global Head of Investment and Marketing Compliance for State Street Global Advisors. |
| Matthew Prasse (Born 1983) | Secretary, since 2021 | Senior Counsel of the Allspring Legal Department since 2021. Senior Counsel of the Wells Fargo Legal Department from 2018 to 2021. Previously, Counsel for Barings LLC from 2015 to 2018. Prior to joining Barings, Associate at Morgan, Lewis & Bockius LLP from 2008 to 2015. |
P.O. Box 219967
Kansas City, MO 64121-9967

1-800-222-8222 or visit the Fund's website at allspringglobal.com. Read the prospectus carefully before you invest or send money.
A257/AR257 06-22

Municipal Income Fund
| 2 | |
| 6 | |
| 11 | |
| 12 | |
| Financial statements | |
| 43 | |
| 44 | |
| 45 | |
| 46 | |
| 52 | |
| 57 | |
| 58 |

| 1 | The S&P 500 Index consists of 500 stocks chosen for market size, liquidity, and industry group representation. It is a market-value-weighted index with each stock's weight in the index proportionate to its market value. You cannot invest directly in an index. |
| 2 | The Morgan Stanley Capital International (MSCI) All Country World Index (ACWI) ex USA Index (Net) is a free-float-adjusted market-capitalization-weighted index that is designed to measure the equity market performance of developed and emerging markets, excluding the U.S. Source: MSCI. MSCI makes no express or implied warranties or representations and shall have no liability whatsoever with respect to any MSCI data contained herein. The MSCI data may not be further redistributed or used as a basis for other indexes or any securities or financial products. This report is not approved, reviewed, or produced by MSCI. You cannot invest directly in an index. |
| 3 | The MSCI Emerging Markets (EM) Index (Net) (USD) is a free-float-adjusted market-capitalization-weighted index that is designed to measure equity market performance of emerging markets. You cannot invest directly in an index. |
| 4 | The Bloomberg U.S. Aggregate Bond Index is a broad-based benchmark that measures the investment-grade, U.S.-dollar-denominated, fixed-rate taxable bond market, including Treasuries, government-related and corporate securities, mortgage-backed securities (agency fixed-rate and hybrid adjustable-rate mortgage pass-throughs), asset-backed securities, and commercial mortgage-backed securities. You cannot invest directly in an index. |
| 5 | The Bloomberg Global Aggregate ex-USD Index (unhedged) is an unmanaged index that provides a broad-based measure of the global investment-grade fixed-income markets excluding the U.S.-dollar-denominated debt market. You cannot invest directly in an index. |
| 6 | The Bloomberg Municipal Bond Index is an unmanaged index composed of long-term tax-exempt bonds with a minimum credit rating of Baa. You cannot invest directly in an index. |
| 7 | The ICE BofA U.S. High Yield Index is a market-capitalization-weighted index of domestic and Yankee high-yield bonds. The index tracks the performance of high-yield securities traded in the U.S. bond market. You cannot invest directly in an index. Copyright 2022. ICE Data Indices, LLC. All rights reserved. |
| 1 | The Consumer Price Index (CPI) is a measure of the average change over time in the prices paid by urban consumers for a market basket of consumer goods and services. You cannot invest directly in an index. |
| 2 | The MSCI ACWI (Net) is a free-float-adjusted market-capitalization-weighted index that is designed to measure the equity market performance of developed and emerging markets. You cannot invest directly in an index. |

President
Allspring Funds
| Investment objective | The Fund seeks current income exempt from federal income tax, consistent with capital preservation. |
| Manager | Allspring Funds Management, LLC |
| Subadviser | Allspring Global Investments, LLC |
| Portfolio managers | Bruce R. Johns, James Randazzo, Nicholos Venditti |
| Average annual total returns (%) as of June 30, 2022 | |||||||||||
| Including sales charge | Excluding sales charge | Expense ratios1 (%) | |||||||||
| Inception date | 1 year | 5 year | 10 year | 1 year | 5 year | 10 year | Gross | Net 2 | |||
| Class A (SMAVX) | 10-2-2000 | -3.36 | 0.16 | 0.20 | -1.38 | 0.57 | 0.40 | 0.66 | 0.50 | ||
| Class A2 (WFUNX)3 | 5-29-2020 | – | – | – | -1.36 | 0.57 | 0.40 | 0.56 | 0.40 | ||
| Class C (WFUSX) | 3-31-2008 | -2.67 | 0.07 | -0.20 | -1.67 | 0.07 | -0.20 | 1.41 | 1.25 | ||
| Class R6 (WUSRX)4 | 7-31-2018 | – | – | – | -1.09 | 0.87 | 0.71 | 0.28 | 0.20 | ||
| Administrator Class (WUSMX) | 7-30-2010 | – | – | – | -1.39 | 0.61 | 0.45 | 0.60 | 0.50 | ||
| Institutional Class (SMAIX) | 7-31-2000 | – | – | – | -1.14 | 0.83 | 0.69 | 0.33 | 0.25 | ||
| Ultra Short-Term Municipal Income Blended Index5 | – | – | – | – | -0.57 | 0.88 | 0.64 | – | – | ||
| Bloomberg 1 Year Municipal Bond Index6 | – | – | – | – | -1.24 | 0.99 | 0.85 | – | – | ||
| iMoneyNet Tax-Free National Institutional Money Market Funds Average7 | – | – | – | – | 0.10 | 0.76 | 0.43 | – | – | ||
| 1 | Reflects the expense ratios as stated in the most recent prospectuses. The expense ratios shown are subject to change and may differ from the annualized expense ratios shown in the financial highlights of this report. |
| 2 | The manager has contractually committed through October 31, 2022 (October 31, 2023 for Class A2), to waive fees and/or reimburse expenses to the extent necessary to cap total annual fund operating expenses after fee waivers at 0.50% for Class A, 0.40% for Class A2, 1.25% for Class C, 0.20% for Class R6, 0.50% for Administrator Class, and 0.25% for Institutional Class. Brokerage commissions, stamp duty fees, interest, taxes, acquired fund fees and expenses (if any), and extraordinary expenses are excluded from the expense caps. Prior to or after the commitment expiration date, the caps may be increased or the commitment to maintain the caps may be terminated only with the approval of the Board of Trustees. Without these caps, the Fund’s returns would have been lower. The expense ratio paid by an investor is the net expense ratio (the total annual fund operating expenses after fee waivers) as stated in the prospectuses. |
| 3 | Historical performance for the Class A2 shares prior to their inception reflects the performance of the Class A shares, and includes the higher expenses applicable to the Class A shares. If these expenses had not been included, returns for the Class A2 shares would be higher. |
| 4 | Historical performance shown for the Class R6 shares prior to their inception reflects the performance of the Institutional Class shares, and includes the higher expenses applicable to the Institutional Class shares. If these expenses had not been included, returns for the Class R6 shares would be higher. |
| 5 | Source: Allspring Funds Management LLC. The Ultra Short-Term Municipal Income Blended Index is composed 50% of the Bloomberg 1 Year Municipal Bond Index and 50% of the iMoneyNet Tax-Free National Institutional Money Market Funds Average. You cannot invest directly in an index. |
| 6 | The Bloomberg 1 Year Municipal Bond Index is the one-year component of the Bloomberg Municipal Bond Index, which is an unmanaged index composed of long-term tax-exempt bonds with a minimum credit rating of Baa. You cannot invest directly in an index. |

| 1 | The chart compares the performance of Class A shares for the most recent ten years with the Ultra Short-Term Municipal Income Blended Index, Bloomberg 1 Year Municipal Bond Index and iMoneyNet Tax-Free National Institutional Money Market Funds Average. The chart assumes a hypothetical investment of $10,000 in Class A shares and reflects all operating expenses and assumes the maximum initial sales charge of 2.00%. |
| 7 | iMoneyNet Tax-Free National Institutional Money Market Funds Average is the return of an unmanaged group of money market funds. You cannot invest directly in this average. |
| ■ | The Fund underperformed its benchmark, the Ultra Short-Term Municipal Income Blended Index, for the 12-month period that ended June 30, 2022. |
| ■ | The Fund maintained a duration position shorter than the Bloomberg 1 Year Municipal Bond Index but longer than the target duration along with a barbell-style yield-curve position. Both positions detracted from relative performance as interest rates increased across the curve with the longest-maturity bonds underperforming. |
| ■ | An overweight to A-rated credit contributed to relative performance versus the benchmark. This was slightly offset by underweights to higher-quality issues. |
| ■ | Security selection and sector allocation contributed to relative performance. |
| Credit quality as of June 30, 20221 |

| 1 | The credit quality distribution of portfolio holdings reflected in the chart is based on ratings from Standard & Poor’s, Moody’s Investors Service, and/or Fitch Ratings Ltd. Credit quality ratings apply to the underlying holdings of the Fund and not to the Fund itself. The percentages of the portfolio with the ratings depicted in the chart are calculated based on the market value of fixed income securities held by the Fund. If a security was rated by all three rating agencies, the middle rating was utilized. If rated by two of the three rating agencies, the lower rating was utilized, and if rated by one of the rating agencies, that rating was utilized. Standard & Poor’s rates the creditworthiness of bonds, ranging from AAA (highest) to D (lowest). Ratings from A to CCC may be modified by the addition of a plus (+) or minus (-) sign to show relative standing within the rating categories. Standard & Poor’s rates the creditworthiness of short-term notes from SP-1 (highest) to SP-3 (lowest). Moody’s rates the creditworthiness of bonds, ranging from Aaa (highest) to C (lowest). Ratings Aa to B may be modified by the addition of a number 1 (highest) to 3 (lowest) to show relative standing within the ratings categories. Moody’s rates the creditworthiness of short-term U.S. tax-exempt municipal securities from MIG 1/VMIG 1 (highest) to SG (lowest). Fitch rates the creditworthiness of bonds, ranging from AAA (highest) to D (lowest). Credit quality distribution is subject to change and may have changed since the date specified. |
| Effective maturity distribution as of June 30, 20221 |

| 1 | Figures represent the percentage of the Fund's long-term investments. These amounts are subject to change and may have changed since the date specified. |
| * | The Bloomberg Municipal Bond Index is an unmanaged index composed of long-term tax-exempt bonds with a minimum credit rating of Baa. You cannot invest directly in an index |
| Beginning account value 1-1-2022 | Ending account value 6-30-2022 | Expenses paid during the period1 | Annualized net expense ratio | |
| Class A | ||||
| Actual | $1,000.00 | $ 987.43 | $2.46 | 0.50% |
| Hypothetical (5% return before expenses) | $1,000.00 | $1,022.32 | $2.51 | 0.50% |
| Class A2 | ||||
| Actual | $1,000.00 | $ 987.65 | $2.22 | 0.45% |
| Hypothetical (5% return before expenses) | $1,000.00 | $1,022.56 | $2.26 | 0.45% |
| Class C | ||||
| Actual | $1,000.00 | $ 985.32 | $4.87 | 0.99% |
| Hypothetical (5% return before expenses) | $1,000.00 | $1,019.89 | $4.96 | 0.99% |
| Class R6 | ||||
| Actual | $1,000.00 | $ 988.88 | $0.99 | 0.20% |
| Hypothetical (5% return before expenses) | $1,000.00 | $1,023.80 | $1.00 | 0.20% |
| Administrator Class | ||||
| Actual | $1,000.00 | $ 987.41 | $2.46 | 0.50% |
| Hypothetical (5% return before expenses) | $1,000.00 | $1,022.32 | $2.51 | 0.50% |
| Institutional Class | ||||
| Actual | $1,000.00 | $ 988.63 | $1.23 | 0.25% |
| Hypothetical (5% return before expenses) | $1,000.00 | $1,023.55 | $1.25 | 0.25% |
| Principal | Value | ||||
| Closed end municipal bond fund obligations: 2.87% | |||||
| California: 0.40% | |||||
| Nuveen California AMT-Free Quality Municipal Income Fund MuniFund Preferred Shares Series A (70 shares) 1.41% 144Aø | $ 7,000,000 | $ 7,000,000 | |||
| New York: 1.38% | |||||
| Nuveen New York Quality Municipal Income Fund Institutional MuniFund Term Preferred Shares (242 shares) 1.41% 144Aø | 24,200,000 | 24,200,000 | |||
| Other: 1.09% | |||||
| Nuveen AMT-Free Municipal Credit Income Fund MuniFund Preferred Shares Series B (50 shares) 1.48% 144Aø | 5,000,000 | 5,000,000 | |||
| Nuveen AMT-Free Municipal Credit Income Fund MuniFund Preferred Shares Series D (110 shares) 1.41% 144Aø | 11,000,000 | 11,000,000 | |||
| Nuveen Quality Municipal Income Fund Series 1-2118 (30 shares) 1.07% 144Aø | 3,000,000 | 3,000,000 | |||
| 19,000,000 | |||||
| Total Closed end municipal bond fund obligations (Cost $50,200,000) | 50,200,000 |
| Interest rate | Maturity date | ||||
| Municipal obligations: 95.99% | |||||
| Alabama: 3.28% | |||||
| Education revenue: 0.03% | |||||
| University of South Alabama Series 2021 (BAM Insured) | 4.00% | 4-1-2025 | 500,000 | 521,807 | |
| Health revenue: 1.98% | |||||
| Alabama Health Care Authority for Baptist Health Series B ø | 1.38 | 11-1-2042 | 14,500,000 | 14,500,000 | |
| Alabama Health Care Authority for Baptist Health Series B (AGC Insured) € | 1.49 | 11-15-2037 | 19,250,000 | 19,250,000 | |
| Tender Option Bond Trust Receipts/Certificates Series 2020-XG0301 (Bank of America NA LOC, AGM Insured, Bank of America NA LIQ) 144Aø | 0.95 | 6-1-2050 | 945,000 | 945,000 | |
| 34,695,000 | |||||
| Miscellaneous revenue: 0.12% | |||||
| Alabama Corrections Institution Finance Authority Revenue Bonds Series 2022A %% | 5.00 | 9-1-2022 | 1,000,000 | 1,004,739 | |
| Alabama Corrections Institution Finance Authority Revenue Bonds Series 2022A %% | 5.00 | 7-1-2023 | 1,000,000 | 1,029,427 | |
| 2,034,166 | |||||
| Utilities revenue: 1.15% | |||||
| Black Belt Energy Gas District Gas Supply Project Series 2017A (Royal Bank of Canada LIQ) | 4.00 | 8-1-2047 | 4,415,000 | 4,415,000 | |
| Black Belt Energy Gas Supply Revenue Bonds Series 2022D-2 (U.S. SOFR +1.40%) ±%% | 2.43 | 7-1-2052 | 3,500,000 | 3,462,612 |
| Interest rate | Maturity date | Principal | Value | ||
| Utilities revenue (continued) | |||||
| Chatom AL Industrial Development Board Alabama Electric Series A (National Rural Utilities Cooperative Finance SPA) ø | 0.50% | 8-1-2037 | $ 8,195,000 | $ 8,195,000 | |
| Southeast Alabama Gas Supply District Project #1 Series A | 4.00 | 4-1-2049 | 4,000,000 | 4,050,678 | |
| 20,123,290 | |||||
| 57,374,263 | |||||
| Alaska: 0.55% | |||||
| Airport revenue: 0.15% | |||||
| Alaska International Airports System Revenue Refunding Bonds Series 2021C | 5.00 | 10-1-2022 | 500,000 | 503,854 | |
| Alaska International Airports System Revenue Refunding Bonds Series 2021C | 5.00 | 10-1-2025 | 2,000,000 | 2,144,466 | |
| 2,648,320 | |||||
| Miscellaneous revenue: 0.40% | |||||
| Alaska Municipal Bond Bank Series 1 | 5.00 | 12-1-2022 | 3,000,000 | 3,042,178 | |
| Alaska Municipal Bond Bank Series 1 | 5.00 | 12-1-2023 | 1,900,000 | 1,980,958 | |
| Alaska Municipal Bond Bank Series 1 | 5.00 | 12-1-2024 | 1,750,000 | 1,864,135 | |
| 6,887,271 | |||||
| 9,535,591 | |||||
| Arizona: 1.46% | |||||
| Education revenue: 0.11% | |||||
| Tender Option Bond Trust Receipts/Floater Certificates Series 2020-XF2862 (Mizuho Capital Markets LLC LOC, Mizuho Capital Markets LLC LIQ) 144Aø | 1.11 | 12-15-2047 | 1,985,299 | 1,985,299 | |
| Health revenue: 0.49% | |||||
| Arizona Health Facilities Authority Banner Health Series B (SIFMA Municipal Swap +0.25%) ± | 1.23 | 1-1-2046 | 4,000,000 | 3,890,026 | |
| Maricopa County AZ IDA Series 2021A | 5.00 | 9-1-2024 | 150,000 | 157,536 | |
| Maricopa County AZ IDA Series 2021A | 5.00 | 9-1-2025 | 500,000 | 534,275 | |
| Maricopa County AZ IDA Series A | 5.00 | 1-1-2048 | 3,910,000 | 3,945,861 | |
| 8,527,698 | |||||
| Industrial development revenue: 0.86% | |||||
| Chandler AZ IDA Intel Corporation Project | 2.70 | 12-1-2037 | 3,415,000 | 3,435,460 | |
| Chandler AZ IDA Intel Corporation Project | 5.00 | 6-1-2049 | 2,425,000 | 2,537,796 | |
| Phoenix AZ IDA Various Republic Services Incorporated Projects | 2.00 | 12-1-2035 | 9,000,000 | 8,999,027 | |
| 14,972,283 | |||||
| 25,485,280 | |||||
| Arkansas: 0.56% | |||||
| Health revenue: 0.08% | |||||
| Batesville AK Public Facilities Board Hospital White River Health System Incorporated | 5.00 | 6-1-2024 | 1,345,000 | 1,392,935 |
| Interest rate | Maturity date | Principal | Value | ||
| Housing revenue: 0.45% | |||||
| Arkansas Development Finance Authority MFHR Cottages Apartments (Department of Housing and Urban Development Insured) | 1.25% | 12-1-2024 | $ 1,835,000 | $ 1,805,700 | |
| Arkansas Development Finance Authority Multifamily Housing Homes Project (Department of Housing and Urban Development Insured) | 1.20 | 3-1-2024 | 6,000,000 | 5,997,293 | |
| 7,802,993 | |||||
| Tax revenue: 0.03% | |||||
| Cabot AR Series 2021B | 5.00 | 12-1-2023 | 200,000 | 208,579 | |
| Cabot AR Series 2021B | 5.00 | 12-1-2025 | 275,000 | 299,327 | |
| 507,906 | |||||
| 9,703,834 | |||||
| California: 6.60% | |||||
| GO revenue: 0.51% | |||||
| Los Angeles CA Tax and Revenue Anticipation Notes %% | 4.00 | 6-29-2023 | 8,500,000 | 8,663,762 | |
| Oceanside CA Unified School District Series 2012-C ¤ | 0.00 | 8-1-2051 | 1,255,000 | 200,622 | |
| 8,864,384 | |||||
| Health revenue: 3.99% | |||||
| California CDA Emanate Health Series A | 5.00 | 4-1-2025 | 750,000 | 795,921 | |
| California CDA Health Facilities Catholic Series D (AGM Insured) € | 0.88 | 7-1-2041 | 24,850,000 | 24,850,000 | |
| California CDA Health Facilities Catholic Series E (AGM Insured) € | 1.39 | 7-1-2040 | 2,225,000 | 2,225,000 | |
| California CDA Health Facilities Catholic Series F (AGM Insured) € | 1.00 | 7-1-2040 | 16,300,000 | 16,300,000 | |
| California CDA Kaiser Permanente Commercial Paper | 0.83 | 8-2-2022 | 3,800,000 | 3,798,170 | |
| California HFFA Adventist Health System Series 2013A | 5.00 | 3-1-2025 | 2,500,000 | 2,539,051 | |
| California HFFA Kaiser Permanente Series C | 5.00 | 8-1-2031 | 2,740,000 | 2,769,511 | |
| California PFA Kaiser Permanente Series 2021A | 4.00 | 10-15-2025 | 400,000 | 409,356 | |
| Palomar CA Pomerado Health Care District Certificate of Participation Series A (AGM Insured) € | 1.70 | 11-1-2036 | 8,975,000 | 8,975,000 | |
| Palomar CA Pomerado Health Care District Certificate of Participation Series B (AGM Insured) € | 1.00 | 11-1-2036 | 1,250,000 | 1,250,000 | |
| Palomar CA Pomerado Health Care District Certificate of Participation Series C (AGM Insured) € | 1.50 | 11-1-2036 | 925,000 | 925,000 | |
| Tender Option Bond Trust Receipts/Certificates Series 2018-XG0175 (Bank of America NA LIQ) 144Aø | 1.04 | 3-1-2039 | 4,825,000 | 4,825,000 | |
| 69,662,009 | |||||
| Housing revenue: 0.91% | |||||
| California CDA Uptown Newport Apartments Series 2017 AA & BB (East West Bank LOC) ø | 0.95 | 3-1-2057 | 13,000,000 | 13,000,000 | |
| Tender Option Bond Trust Receipts/Certificates Series 2020-MIZ9012 (Mizuho Capital Markets LLC LIQ) 144Aø | 1.16 | 10-1-2036 | 2,874,000 | 2,874,000 | |
| 15,874,000 | |||||
| Miscellaneous revenue: 0.11% | |||||
| California Infrastructure & Economic Development Bank Brightline West Passenger Rail Project Series 2021B øø | 0.39 | 10-1-2047 | 2,000,000 | 1,954,778 |
| Interest rate | Maturity date | Principal | Value | ||
| Tax revenue: 0.27% | |||||
| Cathedral City CA RDA Series 2021C (BAM Insured) | 4.00% | 8-1-2025 | $ 600,000 | $ 623,952 | |
| Tender Option Bond Trust Receipts/Certificates Various States Floaters Series 2021-XF1238 (Royal Bank of Canada LIQ) 144Aø | 0.94 | 6-1-2028 | 1,700,000 | 1,700,000 | |
| Western Placer Unified School District Special Tax BAN Community Facilities | 2.00 | 6-1-2025 | 2,500,000 | 2,418,324 | |
| 4,742,276 | |||||
| Transportation revenue: 0.62% | |||||
| Bay Area Toll Authority Series B (SIFMA Municipal Swap +0.28%) ± | 1.26 | 4-1-2056 | 3,500,000 | 3,481,206 | |
| San Diego CA Association of Governments Series 2019A | 5.00 | 11-15-2023 | 7,250,000 | 7,325,536 | |
| 10,806,742 | |||||
| Utilities revenue: 0.19% | |||||
| California Community Choice Financing Authority Clean Energy Project Series 2021A | 4.00 | 12-1-2023 | 800,000 | 813,437 | |
| Vernon CA Electric System Series A | 5.00 | 10-1-2023 | 1,250,000 | 1,285,063 | |
| Vernon CA Electric System Series A | 5.00 | 10-1-2024 | 1,200,000 | 1,251,853 | |
| 3,350,353 | |||||
| 115,254,542 | |||||
| Colorado: 0.83% | |||||
| Airport revenue: 0.28% | |||||
| Denver CO Airport System Subordinate Revenue Bonds Series 2013B | 5.00 | 11-15-2025 | 2,835,000 | 2,932,268 | |
| Denver CO City and County Airport Revenue AMT Series B-2 | 5.00 | 11-15-2031 | 1,840,000 | 1,979,956 | |
| 4,912,224 | |||||
| Education revenue: 0.08% | |||||
| University of Colorado Enterprise and Refunding Bond Series C | 2.00 | 6-1-2054 | 1,500,000 | 1,479,752 | |
| Health revenue: 0.03% | |||||
| Colorado Health Facilities Authority Catholic Health Initiatives Series B-3 | 4.00 | 1-1-2024 | 530,000 | 525,847 | |
| Miscellaneous revenue: 0.26% | |||||
| Colorado Bridge Enterprise Central 70 Project Series 2017 | 4.00 | 12-31-2023 | 1,385,000 | 1,424,650 | |
| Colorado Bridge Enterprise Central 70 Project Series 2017 | 4.00 | 6-30-2024 | 2,000,000 | 2,056,040 | |
| Colorado Bridge Enterprise Senior Revenue Bonds AMT Central 70 Project Private Activity Bond | 4.00 | 12-31-2024 | 1,000,000 | 1,033,239 | |
| 4,513,929 | |||||
| Tax revenue: 0.02% | |||||
| Regional Transportation District Private Activity Revenue Denver Transit Partners Eagle P3 | 5.00 | 7-15-2024 | 300,000 | 309,386 |
| Interest rate | Maturity date | Principal | Value | ||
| Transportation revenue: 0.13% | |||||
| E-470 Public Highway Authority Revenue Series B (U.S. SOFR +0.35%) ± | 1.37% | 9-1-2039 | $ 2,250,000 | $ 2,218,875 | |
| Water & sewer revenue: 0.03% | |||||
| Central Weld County CO Water District Water Revenue (AGM Insured) | 5.00 | 12-1-2025 | 520,000 | 564,398 | |
| 14,524,411 | |||||
| Connecticut: 3.05% | |||||
| Education revenue: 1.02% | |||||
| Connecticut HEFAR Yale University Issue Series A | 1.10 | 7-1-2048 | 7,405,000 | 7,357,131 | |
| Connecticut HEFAR Yale University issue Series B | 0.55 | 7-1-2037 | 8,150,000 | 8,014,226 | |
| Connecticut Higher Education Supplemental Loan Authority CHESLA Loan Program | 5.00 | 11-15-2022 | 1,350,000 | 1,367,387 | |
| Connecticut Higher Education Supplemental Loan Authority CHESLA Loan Program | 5.00 | 11-15-2024 | 585,000 | 623,595 | |
| Connecticut Higher Education Supplemental Loan Authority CHESLA Loan Program Series B | 5.00 | 11-15-2023 | 440,000 | 457,834 | |
| 17,820,173 | |||||
| GO revenue: 0.77% | |||||
| Bridgeport CT Series A | 5.00 | 6-1-2023 | 655,000 | 674,039 | |
| Bridgeport CT Series A | 5.00 | 6-1-2024 | 800,000 | 842,655 | |
| Bridgeport CT Series A | 5.00 | 6-1-2025 | 2,695,000 | 2,894,556 | |
| Bridgeport CT Series C | 5.00 | 2-15-2024 | 445,000 | 465,780 | |
| Bridgeport CT Series C | 5.00 | 2-15-2025 | 750,000 | 800,838 | |
| Connecticut Series A | 3.00 | 1-15-2025 | 3,000,000 | 3,046,083 | |
| Connecticut Series C | 3.00 | 6-1-2023 | 600,000 | 606,980 | |
| Connecticut Series C | 3.00 | 6-1-2024 | 1,055,000 | 1,073,251 | |
| Connecticut Series C | 4.00 | 6-1-2023 | 435,000 | 443,952 | |
| Connecticut Series C | 4.00 | 6-1-2024 | 500,000 | 517,943 | |
| North Branford CT BAN | 2.00 | 8-4-2022 | 2,000,000 | 2,001,457 | |
| 13,367,534 | |||||
| Health revenue: 0.05% | |||||
| Connecticut HEFA Revenue Bonds Stamford Hospital Issue Series M | 5.00 | 7-1-2023 | 175,000 | 179,193 | |
| Connecticut HEFA Stamford Hospital Series L-1 | 4.00 | 7-1-2024 | 600,000 | 611,097 | |
| 790,290 | |||||
| Housing revenue: 1.06% | |||||
| Connecticut HFA Mortgage Finance Program Bonds Series A Subseries A-4 (SIFMA Municipal Swap +0.30%) ± | 1.28 | 11-15-2050 | 15,000,000 | 14,828,637 | |
| Connecticut HFA Series A Subseries A-1 | 0.30 | 11-15-2024 | 500,000 | 475,538 | |
| Connecticut HFA Series A Subseries A-1 | 0.40 | 11-15-2023 | 300,000 | 293,630 | |
| Connecticut HFA Series A Subseries A-1 | 0.40 | 5-15-2025 | 500,000 | 468,379 | |
| Waterbury CT Housing Authority MFHR Exchange Place Project | 0.40 | 2-1-2023 | 2,500,000 | 2,496,406 | |
| 18,562,590 | |||||
| Tax revenue: 0.15% | |||||
| Connecticut Tax Obligation Revenue Transportation Infrastructure Purpose | 5.00 | 5-1-2023 | 375,000 | 385,130 |
| Interest rate | Maturity date | Principal | Value | ||
| Tax revenue (continued) | |||||
| Connecticut Tax Obligation Revenue Transportation Infrastructure Purpose | 5.00% | 5-1-2024 | $ 1,000,000 | $ 1,053,343 | |
| Connecticut Tax Obligation Revenue Transportation Infrastructure Purpose | 5.00 | 5-1-2025 | 1,150,000 | 1,238,701 | |
| 2,677,174 | |||||
| 53,217,761 | |||||
| Delaware: 0.16% | |||||
| Miscellaneous revenue: 0.16% | |||||
| Tender Option Bond Trust Receipts/Floater Certificates Series 2021-XF2945 (Mizuho Capital Markets LLC LOC, Mizuho Capital Markets LLC LIQ) 144Aø | 1.11 | 6-15-2043 | 2,840,000 | 2,840,000 | |
| District of Columbia: 2.15% | |||||
| Airport revenue: 0.30% | |||||
| Metropolitan Washington DC Airports Authority Revenue and Refunding Bonds Series 2021A | 5.00 | 10-1-2022 | 2,000,000 | 2,016,389 | |
| Metropolitan Washington DC Airports Authority Revenue and Refunding Bonds Series 2021A | 5.00 | 10-1-2024 | 3,000,000 | 3,163,670 | |
| 5,180,059 | |||||
| Housing revenue: 1.50% | |||||
| District of Columbia HFA MFHR 1550 First Street Project | 2.80 | 6-1-2039 | 6,500,000 | 6,503,561 | |
| District of Columbia HFA Park Southern Apartments Project (FHA Insured) | 0.70 | 6-1-2024 | 20,000,000 | 19,662,212 | |
| 26,165,773 | |||||
| Transportation revenue: 0.33% | |||||
| Washington DC Metropolitan Area Transit Authority Series A | 5.00 | 7-15-2023 | 3,600,000 | 3,720,002 | |
| Washington DC Metropolitan Area Transit Authority Series A | 5.00 | 7-15-2024 | 2,000,000 | 2,117,821 | |
| 5,837,823 | |||||
| Water & sewer revenue: 0.02% | |||||
| District of Columbia Water and Sewer Authority Public Utility Subordinated Lien Bond Series C | 1.75 | 10-1-2054 | 300,000 | 297,269 | |
| 37,480,924 | |||||
| Florida: 3.36% | |||||
| Education revenue: 0.04% | |||||
| Florida HEFAR Florida Institute of Technology | 5.00 | 10-1-2023 | 500,000 | 513,840 | |
| Florida HEFAR Florida Institute of Technology | 5.00 | 10-1-2024 | 250,000 | 260,141 | |
| 773,981 | |||||
| Health revenue: 0.61% | |||||
| Jacksonville FL HCFR Baptist Health Series D ø | 0.91 | 8-1-2036 | 900,000 | 900,000 | |
| Jacksonville FL HCFR Series E ø | 0.91 | 8-1-2036 | 1,000,000 | 1,000,000 | |
| Lee Memorial Health System Series B ø | 1.23 | 4-1-2049 | 8,800,000 | 8,800,000 | |
| 10,700,000 |
| Interest rate | Maturity date | Principal | Value | ||
| Housing revenue: 2.25% | |||||
| Capital Trust Agency Florida College Park Towers Apartments Project (Department of Housing and Urban Development Insured) | 1.25% | 5-1-2024 | $14,000,000 | $ 13,890,376 | |
| Capital Trust Agency Florida Council Towers Apartments Project Series A | 1.50 | 11-1-2023 | 10,450,000 | 10,424,663 | |
| Deutsche Bank Short Puttable Exempt Adjustable Receipts/Long Inverse Floating Exempt Receipts Trust Series DBE-8055 (Deutsche Bank LOC, Deutsche Bank LIQ) 144Aø | 1.38 | 11-1-2058 | 9,975,000 | 9,975,000 | |
| Miami-Dade County FL HFA MFHR | 0.25 | 12-1-2023 | 5,000,000 | 4,957,707 | |
| 39,247,746 | |||||
| Miscellaneous revenue: 0.32% | |||||
| Miami-Dade County FL School Board Certificate of Participation Series A | 5.00 | 5-1-2031 | 3,100,000 | 3,255,100 | |
| Refunding Certificate of Participation School Board of Hillsborough County FL Series 2015A | 5.00 | 7-1-2026 | 2,235,000 | 2,401,025 | |
| 5,656,125 | |||||
| Transportation revenue: 0.03% | |||||
| Miami-Dade County FL Expressway Authority Series B | 5.00 | 7-1-2022 | 460,000 | 460,000 | |
| Water & sewer revenue: 0.11% | |||||
| North Sumter County Utility Dependent District Utility Revenue Bonds Series 2021 (AGM Insured) | 5.00 | 10-1-2025 | 635,000 | 687,030 | |
| North Sumter County Utility Dependent District Utility Revenue Bonds Series 2021 (AGM Insured) | 5.00 | 10-1-2026 | 1,100,000 | 1,210,942 | |
| 1,897,972 | |||||
| 58,735,824 | |||||
| Georgia: 1.95% | |||||
| Health revenue: 0.16% | |||||
| Cobb County GA Kennestone Hospital Authority Revenue Anticipation Certificate Wellstar Health System | 5.00 | 4-1-2024 | 1,300,000 | 1,364,766 | |
| Cobb County GA Kennestone Hospital Authority Revenue Anticipation Certificate Wellstar Health System | 5.00 | 4-1-2025 | 660,000 | 700,410 | |
| The Hospital Authority of Hall County & the City of Gainesville Revenue Anticipation Certificate Series 2021A | 5.00 | 2-15-2026 | 700,000 | 754,828 | |
| 2,820,004 | |||||
| Housing revenue: 1.06% | |||||
| Augusta GA Housing Authority Georgia Multifamily Housing Series 2021 (Department of Housing and Urban Development Insured) | 1.25 | 12-1-2024 | 8,875,000 | 8,733,288 | |
| College Park GA Business & IDA Series 2021B | 1.25 | 7-1-2025 | 10,000,000 | 9,703,198 | |
| 18,436,486 | |||||
| Utilities revenue: 0.73% | |||||
| Burke County GA Development Authority Georgia Power Company Plant Vogtle Project | 1.55 | 12-1-2049 | 4,100,000 | 4,095,646 | |
| Georgia Municipal Electric Authority Bonds (AGM Insured) %% | 5.00 | 7-1-2025 | 200,000 | 211,696 |
| Interest rate | Maturity date | Principal | Value | ||
| Utilities revenue (continued) | |||||
| Georgia Municipal Electric Authority Bonds (AGM Insured) %% | 5.00% | 7-1-2026 | $ 300,000 | $ 323,829 | |
| Main Street Natural Gas Incorporated Gas Supply Revenue Bonds Series 2018C (Royal Bank of Canada LIQ) | 4.00 | 8-1-2048 | 805,000 | 821,241 | |
| Main Street Natural Gas Incorporated Gas Supply Revenue Bonds Series 2021C | 4.00 | 12-1-2024 | 700,000 | 711,215 | |
| Main Street Natural Gas Incorporated Gas Supply Revenue Bonds Series 2021C | 4.00 | 12-1-2025 | 1,000,000 | 1,017,355 | |
| Main Street Natural Gas Incorporated Gas Supply Revenue Bonds Series 2022A | 4.00 | 12-1-2023 | 1,000,000 | 1,013,340 | |
| Main Street Natural Gas Incorporated Gas Supply Revenue Bonds Series 2022A | 4.00 | 12-1-2026 | 2,200,000 | 2,236,311 | |
| Monroe County GA Development Authority PCR Georgia Power Company Plant Scherer Project First Series 2009 | 1.00 | 7-1-2049 | 1,875,000 | 1,666,910 | |
| Municipal Electric Authority of Georgia Plant Vogtle Units 3&4 Project J Bonds Series 2021A | 5.00 | 1-1-2024 | 165,000 | 171,637 | |
| Municipal Electric Authority of Georgia Plant Vogtle Units 3&4 Project J Bonds Series 2021A (AGM Insured) | 5.00 | 1-1-2025 | 200,000 | 211,685 | |
| Municipal Electric Authority of Georgia Plant Vogtle Units 3&4 Project J Bonds Series 2021A (AGM Insured) | 5.00 | 1-1-2026 | 225,000 | 241,237 | |
| 12,722,102 | |||||
| 33,978,592 | |||||
| Guam: 0.14% | |||||
| Airport revenue: 0.14% | |||||
| Guam International Airport Authority AMT Refunding Bond Series A | 5.00 | 10-1-2022 | 1,000,000 | 1,008,049 | |
| Guam International Airport Authority AMT Refunding Bond Series A | 5.00 | 10-1-2023 | 1,395,000 | 1,443,834 | |
| 2,451,883 | |||||
| Hawaii: 0.51% | |||||
| GO revenue: 0.24% | |||||
| Honolulu HI GO Bonds Series 2022A %% | 5.00 | 11-1-2023 | 2,250,000 | 2,338,361 | |
| Honolulu HI GO Bonds Series 2022A %% | 5.00 | 11-1-2024 | 1,750,000 | 1,858,945 | |
| 4,197,306 | |||||
| Health revenue: 0.10% | |||||
| Hawaii Department of Budget & Finance Queens Health System Series B (SIFMA Municipal Swap +0.45%) ± | 1.36 | 7-1-2039 | 1,750,000 | 1,750,000 | |
| Utilities revenue: 0.17% | |||||
| Hawaii Department of Budget & Finance Hawaiian Electric Company Series 2017A | 3.10 | 5-1-2026 | 3,000,000 | 2,977,449 | |
| 8,924,755 | |||||
| Idaho: 0.13% | |||||
| Housing revenue: 0.13% | |||||
| Idaho Housing & Finance Association Series A ø | 1.11 | 1-1-2038 | 2,345,000 | 2,345,000 |
| Interest rate | Maturity date | Principal | Value | ||
| Illinois: 4.82% | |||||
| Airport revenue: 0.24% | |||||
| Chicago IL O'Hare International Airport Senior Lien Refunding Bonds Series 2013A | 5.00% | 1-1-2026 | $ 4,205,000 | $ 4,261,847 | |
| Education revenue: 0.33% | |||||
| Illinois Finance Authority Benedictine University Series 2021 | 5.00 | 10-1-2025 | 600,000 | 620,670 | |
| Illinois Finance Authority University of Chicago Series 2021A | 5.00 | 10-1-2023 | 1,400,000 | 1,454,791 | |
| Illinois Finance Authority University of Chicago Series 2021A | 5.00 | 10-1-2025 | 1,500,000 | 1,624,859 | |
| Southern Illinois University Housing and Auxiliary Facilities Refunding Revenue Bonds Series A (BAM Insured) | 4.00 | 4-1-2024 | 1,200,000 | 1,228,829 | |
| Southern Illinois University Housing and Auxiliary Facilities System Series 2022A (BAM Insured) %% | 5.00 | 4-1-2025 | 750,000 | 792,596 | |
| 5,721,745 | |||||
| GO revenue: 1.49% | |||||
| Chicago IL Board of Education Series 2020A | 5.00 | 12-1-2022 | 400,000 | 403,475 | |
| Chicago IL CAB City Colleges (NPFGC Insured) ¤ | 0.00 | 1-1-2024 | 3,670,000 | 3,504,776 | |
| Chicago IL Series 2002B | 5.00 | 1-1-2026 | 2,750,000 | 2,848,159 | |
| Chicago IL Series A | 5.00 | 1-1-2025 | 2,500,000 | 2,595,581 | |
| Cook County IL Refunding Bond Series 2021A | 5.00 | 11-15-2022 | 4,000,000 | 4,050,935 | |
| Cook County IL Refunding Bond Series C | 5.00 | 11-15-2022 | 3,045,000 | 3,083,774 | |
| Illinois Series 2022A | 5.00 | 3-1-2023 | 2,000,000 | 2,033,583 | |
| Illinois Series A | 5.00 | 3-1-2024 | 1,500,000 | 1,554,195 | |
| Kane & Cook Counties IL Community College District #509 Series 2021B | 4.00 | 12-15-2025 | 1,200,000 | 1,264,357 | |
| Peoria IL Refunding Bonds Series A (BAM Insured) | 4.00 | 1-1-2025 | 1,250,000 | 1,296,278 | |
| Peoria IL Refunding Bonds Series A (BAM Insured) | 4.00 | 1-1-2026 | 500,000 | 522,052 | |
| Whiteside & Lee Counties IL Community Unit School District 5 Series A (BAM Insured) | 4.00 | 12-1-2022 | 1,375,000 | 1,388,516 | |
| Whiteside & Lee Counties IL Community Unit School District 5 Series A (BAM Insured) | 4.00 | 12-1-2023 | 1,435,000 | 1,473,315 | |
| 26,018,996 | |||||
| Health revenue: 0.16% | |||||
| Illinios Finance Authority Revenue Refunding Bonds Series 2022 | 4.00 | 10-15-2023 | 205,000 | 204,737 | |
| Illinois Finance Authority Healthcare System Series B-1 | 5.00 | 5-15-2050 | 1,200,000 | 1,251,837 | |
| Illinois Finance Authority Rehabilitation Institute of Chicago | 5.00 | 7-1-2023 | 1,100,000 | 1,124,185 | |
| Illinois Finance Authority Revenue Refunding Bonds Series 2022 | 4.00 | 10-15-2024 | 210,000 | 208,636 | |
| 2,789,395 | |||||
| Miscellaneous revenue: 0.70% | |||||
| Chicago IL Board of Education Series B | 5.00 | 12-1-2022 | 1,500,000 | 1,513,030 | |
| Chicago IL Board of Education Series B | 5.00 | 12-1-2023 | 1,150,000 | 1,174,381 | |
| Illinois Refunding Bond | 5.00 | 8-1-2022 | 2,290,000 | 2,294,932 | |
| Illinois Refunding Bonds Series 2016 | 5.00 | 2-1-2026 | 4,000,000 | 4,248,266 | |
| Illinois Series A | 5.00 | 3-1-2023 | 3,000,000 | 3,050,374 | |
| 12,280,983 |
| Interest rate | Maturity date | Principal | Value | ||
| Tax revenue: 1.59% | |||||
| Illinois Regional Transportation Authority Series B øø | 1.35% | 6-1-2025 | $17,585,000 | $ 17,585,000 | |
| Illinois Sales Tax Revenue Refunding Bond Series C | 4.00 | 6-15-2023 | 1,000,000 | 1,013,541 | |
| Illinois Series 2013 | 5.00 | 6-15-2024 | 1,000,000 | 1,022,138 | |
| Metropolitan Pier & Exposition Authority McCormick Place Project Non-Callable Bond Series B | 5.00 | 12-15-2022 | 5,925,000 | 5,996,758 | |
| Metropolitan Pier & Exposition Authority McCormick Place Project Refunding Bonds Series A | 3.00 | 6-15-2024 | 2,100,000 | 2,087,124 | |
| 27,704,561 | |||||
| Water & sewer revenue: 0.31% | |||||
| Chicago IL Water Revenue Refunding Bonds Series 2004 | 5.00 | 11-1-2023 | 1,645,000 | 1,698,633 | |
| Geneva IL Series 2021 | 4.00 | 2-1-2024 | 650,000 | 669,461 | |
| Joliet IL Waterworks and Sewerage Senior Lien Revenue BAN Series 2022 | 5.00 | 1-1-2024 | 2,000,000 | 2,076,559 | |
| South Sangamon IL Water Commission (AGM Insured) | 4.00 | 1-1-2023 | 500,000 | 504,693 | |
| South Sangamon IL Water Commission (AGM Insured) | 4.00 | 1-1-2026 | 500,000 | 518,398 | |
| 5,467,744 | |||||
| 84,245,271 | |||||
| Indiana: 2.16% | |||||
| Education revenue: 0.03% | |||||
| Town of Upland IN Economic Development Revenue Bonds Series 2021 | 4.00 | 9-1-2025 | 590,000 | 610,188 | |
| GO revenue: 0.12% | |||||
| Center Grove IN Community School Corporation Series 2021B | 4.00 | 7-1-2023 | 2,025,000 | 2,063,837 | |
| Housing revenue: 0.07% | |||||
| Indianapolis IN MFHR Series 2022A | 3.00 | 5-1-2027 | 1,251,000 | 1,264,170 | |
| Industrial development revenue: 0.98% | |||||
| Indiana Finance Authority Tax-Exempt Private Activity Bonds Series 2013 | 5.00 | 7-1-2048 | 14,315,000 | 14,731,837 | |
| Whiting IN Environmental Facilities North America Incorporated Project | 5.00 | 11-1-2047 | 2,250,000 | 2,361,492 | |
| 17,093,329 | |||||
| Miscellaneous revenue: 0.64% | |||||
| Brownsburg IN 1999 School Building Corporation BAN 144A | 1.75 | 2-1-2023 | 6,000,000 | 6,000,633 | |
| Fort Wayne IN RDA Indiana Lease Rental Revenue Refunding Bonds Series 2022 | 4.00 | 8-1-2023 | 795,000 | 812,737 | |
| Fort Wayne IN RDA Lease Rental Revenue Refunding Bonds Series 2022 | 4.00 | 8-1-2024 | 730,000 | 756,079 | |
| Indianapolis IN Series 2021A | 5.00 | 6-1-2024 | 1,700,000 | 1,784,448 | |
| Marion Industry High School Building Corporation First Mortgage Bonds Series B | 4.00 | 7-15-2022 | 95,000 | 95,070 | |
| Marion Industry High School Building Corporation First Mortgage Bonds Series B | 4.00 | 7-15-2023 | 210,000 | 214,588 | |
| Marion Industry High School Building Corporation First Mortgage Bonds Series B | 4.00 | 1-15-2024 | 215,000 | 221,271 | |
| Marion Industry High School Building Corporation First Mortgage Bonds Series B | 4.00 | 7-15-2024 | 220,000 | 227,811 |
| Interest rate | Maturity date | Principal | Value | ||
| Miscellaneous revenue (continued) | |||||
| Marion Industry High School Building Corporation First Mortgage Bonds Series B | 4.00% | 1-15-2025 | $ 225,000 | $ 234,355 | |
| Marion Industry High School Building Corporation First Mortgage Bonds Series B | 4.00 | 7-15-2025 | 225,000 | 235,697 | |
| Tippecanoe County IN Vinton-Tecumseh School Building Corporation Series 2021 | 3.00 | 1-15-2025 | 505,000 | 512,420 | |
| 11,095,109 | |||||
| Utilities revenue: 0.32% | |||||
| Mount Vernon Industry Environmental Southern Industry Gas and Electric Company øø | 0.88 | 9-1-2055 | 5,750,000 | 5,653,625 | |
| 37,780,258 | |||||
| Iowa: 0.53% | |||||
| Industrial development revenue: 0.53% | |||||
| Iowa Finance Authority Midwestern Disaster Area Economic Development Revenue Bonds Series 2009B ø | 0.96 | 9-1-2036 | 6,200,000 | 6,200,000 | |
| Iowa Finance Authority Solid Waste Facilities Revenue (Citibank NA LOC) | 1.50 | 1-1-2042 | 3,000,000 | 2,981,757 | |
| 9,181,757 | |||||
| Kansas: 0.31% | |||||
| Health revenue: 0.03% | |||||
| Wichita KS HCFR Series I | 3.75 | 5-15-2023 | 485,000 | 482,022 | |
| Utilities revenue: 0.28% | |||||
| Burlington KS Environmental Impact Series A ø | 1.05 | 9-1-2035 | 5,000,000 | 5,000,000 | |
| 5,482,022 | |||||
| Kentucky: 1.68% | |||||
| Education revenue: 0.06% | |||||
| Columbia KY Kentucky Educational Development Funding Revenue Bonds Series 2021 | 4.00 | 12-1-2022 | 175,000 | 176,364 | |
| Columbia KY Kentucky Educational Development Funding Revenue Bonds Series 2021 | 4.00 | 12-1-2023 | 450,000 | 459,183 | |
| Columbia KY Kentucky Educational Development Funding Revenue Bonds Series 2021 | 4.00 | 12-1-2025 | 485,000 | 498,920 | |
| 1,134,467 | |||||
| Health revenue: 0.17% | |||||
| Kentucky EDFA Norton Healthcare Incorporated Series B (NPFGC Insured) ¤ | 0.00 | 10-1-2022 | 2,920,000 | 2,905,859 | |
| Housing revenue: 0.57% | |||||
| Kentucky Housing Corporation MFHR City View Park Project | 1.16 | 2-1-2023 | 10,000,000 | 9,998,001 | |
| Industrial development revenue: 0.65% | |||||
| Boone Country KY PCR Various Refunding Bonds Duke Energy (Sumitomo Mitsui Banking Corporation LOC) ø | 0.93 | 8-1-2027 | 11,295,000 | 11,295,000 |
| Interest rate | Maturity date | Principal | Value | ||
| Utilities revenue: 0.12% | |||||
| Paducah KY Electric Plant Board Refunding Bond | 5.00% | 10-1-2023 | $ 1,995,000 | $ 2,065,087 | |
| Water & sewer revenue: 0.11% | |||||
| Kentucky Rural Water Financing Agency Series 2021A | 0.40 | 5-1-2023 | 2,000,000 | 1,957,669 | |
| 29,356,083 | |||||
| Louisiana: 1.58% | |||||
| Airport revenue: 0.32% | |||||
| Louisiana Offshore Terminal Authority Deepwater Loop LLC Project Series B-1A | 2.00 | 10-1-2040 | 5,540,000 | 5,539,900 | |
| Health revenue: 0.29% | |||||
| Louisiana Public Facilities Authority Hospital Revenue Louisiana Children's Medical Center Project | 5.00 | 6-1-2045 | 5,000,000 | 5,139,844 | |
| Miscellaneous revenue: 0.70% | |||||
| Louisiana Local Government Environmental Facilities and CDA Subordinated Lien Bond East Baton Rouge øø | 0.88 | 2-1-2046 | 9,000,000 | 8,200,684 | |
| Louisiana Stadium & Exposition District Revenue BAN | 4.00 | 7-3-2023 | 3,925,000 | 3,975,712 | |
| 12,176,396 | |||||
| Tax revenue: 0.27% | |||||
| Louisiana Gasoline and Fuel Tax Second Lien Revenue Refunding Bonds Series A (U.S. SOFR +0.50%) ± | 1.56 | 5-1-2043 | 4,960,000 | 4,761,619 | |
| 27,617,759 | |||||
| Maine: 0.10% | |||||
| Education revenue: 0.02% | |||||
| Maine Student Loan Authority AMT Refunding Student Loan Revenue Bond Class A Series 2019A-1 (AGM Insured) | 5.00 | 12-1-2022 | 370,000 | 375,050 | |
| Health revenue: 0.08% | |||||
| Maine HEFAR Bonds Series 2020A | 4.00 | 7-1-2024 | 335,000 | 345,055 | |
| Maine HEFAR Bonds Series 2020A | 4.00 | 7-1-2024 | 420,000 | 435,677 | |
| Maine HEFAR Bonds Series 2020A | 5.00 | 7-1-2023 | 255,000 | 263,138 | |
| Maine HEFAR Bonds Series 2020A | 5.00 | 7-1-2023 | 320,000 | 330,116 | |
| 1,373,986 | |||||
| 1,749,036 | |||||
| Maryland: 2.42% | |||||
| Health revenue: 0.08% | |||||
| Maryland Health & HEFAR Adventist Healthcare Series 2021 | 5.00 | 1-1-2023 | 795,000 | 804,712 | |
| Maryland Health & HEFAR Adventist Healthcare Series 2021 | 5.00 | 1-1-2024 | 540,000 | 556,742 | |
| 1,361,454 | |||||
| Housing revenue: 2.17% | |||||
| CDA Department of Housing & Community Development Multifamily Development Revenue Bonds Series 2021B | 0.80 | 9-1-2023 | 15,000,000 | 14,789,709 |
| Interest rate | Maturity date | Principal | Value | ||
| Housing revenue (continued) | |||||
| Maryland CDA Department of Housing & Community Multifamily Development Windsor Valley III Apartments Series G (FHA Insured) | 1.05% | 12-1-2023 | $10,000,000 | $ 9,795,244 | |
| Maryland CDA Department of Housing & Community Multifamily Development Woodside Gardens Series A 144A | 1.33 | 1-1-2024 | 6,000,000 | 5,903,367 | |
| Maryland CDA Department of Housing Rosemont Tower LLC Series A (GNMA Insured) 144A | 0.83 | 5-1-2023 | 7,400,000 | 7,334,757 | |
| 37,823,077 | |||||
| Utilities revenue: 0.17% | |||||
| Maryland Economic Development Corporation PCR Potomac Electric Power Company Project | 1.70 | 9-1-2022 | 3,000,000 | 2,999,698 | |
| 42,184,229 | |||||
| Massachusetts: 1.86% | |||||
| Education revenue: 0.04% | |||||
| Massachusetts Development Finance Agency Lasell University Revenue Refunding Bonds | 4.00 | 7-1-2022 | 205,000 | 205,000 | |
| Massachusetts Development Finance Agency Lasell University Revenue Refunding Bonds | 4.00 | 7-1-2023 | 210,000 | 210,727 | |
| Massachusetts Development Finance Agency Lasell University Revenue Refunding Bonds | 4.00 | 7-1-2024 | 225,000 | 225,639 | |
| 641,366 | |||||
| Health revenue: 0.49% | |||||
| Massachusetts Development Finance Agency Milford Regional Medical Center Series G 144A | 5.00 | 7-15-2022 | 115,000 | 115,088 | |
| Massachusetts Development Finance Agency Milford Regional Medical Center Series G 144A | 5.00 | 7-15-2023 | 125,000 | 127,902 | |
| Massachusetts Development Finance Agency Milford Regional Medical Center Series G 144A | 5.00 | 7-15-2024 | 125,000 | 129,607 | |
| Massachusetts Development Finance Agency Wellforce Incorporate Series C (AGM Insured) | 5.00 | 10-1-2023 | 635,000 | 658,102 | |
| Massachusetts HEFA Partners Healthcare Series G-2 (AGM Insured) € | 0.84 | 7-1-2042 | 7,520,000 | 7,520,000 | |
| 8,550,699 | |||||
| Housing revenue: 0.33% | |||||
| Boston Housing Authority Capital Program Revenue Refunding Series B | 5.00 | 10-1-2024 | 650,000 | 690,581 | |
| Boston Housing Authority Capital Program Revenue Refunding Series B | 5.00 | 10-1-2025 | 380,000 | 412,374 | |
| Massachusetts Development Finance Agency MFHR Bonds Salem Heights Series B | 0.25 | 7-1-2024 | 2,750,000 | 2,686,497 | |
| Massachusetts HFA Series 212 | 1.45 | 12-1-2049 | 2,000,000 | 1,998,733 | |
| 5,788,185 | |||||
| Tax revenue: 0.10% | |||||
| Massachusetts Bay Transportation Authority Series B-1 | 5.00 | 7-1-2023 | 1,775,000 | 1,832,533 |
| Interest rate | Maturity date | Principal | Value | ||
| Transportation revenue: 0.90% | |||||
| Massachusetts Department of Transportation Refunding Bond | 5.00% | 1-1-2039 | $15,490,000 | $ 15,721,782 | |
| 32,534,565 | |||||
| Michigan: 2.10% | |||||
| Education revenue: 0.03% | |||||
| Lake Superior State University Michigan Revenue Refunding General Revenue Refunding Bonds Series 2012 (AGM Insured) | 4.00 | 11-15-2023 | 525,000 | 539,171 | |
| GO revenue: 0.16% | |||||
| Genesee County MI Carman-Ainsworth Community School | 4.00 | 5-1-2025 | 2,685,000 | 2,793,516 | |
| Health revenue: 0.24% | |||||
| Kent MI Hospital Finance Authority Series 2015A ø | 1.16 | 1-15-2047 | 2,000,000 | 2,000,000 | |
| Michigan Finance Authority Bronson Healthcare Group Incorporated Series 2019B | 3.50 | 11-15-2044 | 800,000 | 804,085 | |
| Michigan Finance Authority Hospital Revenue Refunding Bonds McLaren Heath Care Series A | 5.00 | 6-1-2025 | 1,350,000 | 1,352,110 | |
| 4,156,195 | |||||
| Housing revenue: 1.13% | |||||
| Michigan Housing Development Authority Series D (TD Bank NA SPA) ø | 0.90 | 6-1-2030 | 5,370,000 | 5,370,000 | |
| Michigan State Housing Development AMT Refunding Bond Series B (TD Bank NA SPA) ø | 0.94 | 6-1-2038 | 14,415,000 | 14,415,000 | |
| 19,785,000 | |||||
| Tax revenue: 0.54% | |||||
| Tender Option Bond Trust Receipts/Certificates (AGM Insured, Morgan Stanley Bank LIQ) 144Aø | 1.11 | 7-1-2043 | 9,410,000 | 9,410,000 | |
| 36,683,882 | |||||
| Minnesota: 2.12% | |||||
| GO revenue: 1.78% | |||||
| Hennepin County MN Series 2018B (TD Bank NA SPA) ø | 0.90 | 12-1-2038 | 1,000,000 | 1,000,000 | |
| JPMorgan Chase Puttable Tax-Exempt Receipts Trust Series 5027 (JPMorgan Chase & Company LIQ) 144Aø | 1.09 | 3-20-2024 | 30,000,000 | 30,000,000 | |
| 31,000,000 | |||||
| Health revenue: 0.02% | |||||
| Minnesota HCFR Maple Grove Hospital Corporation | 5.00 | 5-1-2023 | 390,000 | 399,434 | |
| Miscellaneous revenue: 0.17% | |||||
| Lake Agassiz Education Cooperative Certificate of Participation Series A | 3.00 | 2-1-2023 | 255,000 | 255,980 | |
| Lake Agassiz Education Cooperative Certificate of Participation Series A | 3.00 | 2-1-2024 | 265,000 | 266,358 | |
| Minnesota Rural Water Financial Authority Public Projects Construction Notes | 2.63 | 12-1-2023 | 2,500,000 | 2,500,269 | |
| 3,022,607 |
| Interest rate | Maturity date | Principal | Value | ||
| Utilities revenue: 0.15% | |||||
| Minnesota Municipal Gas Agency Commodity Supply Revenue Bonds Series 2022 (Royal Bank of Canada LIQ) | 4.00% | 12-1-2023 | $ 2,500,000 | $ 2,548,236 | |
| 36,970,277 | |||||
| Mississippi: 0.51% | |||||
| Health revenue: 0.51% | |||||
| Mississippi Hospital Equipment & Facilities Authority Baptist Memorial Health Care Project øø | 0.20 | 9-1-2036 | 9,000,000 | 8,970,202 | |
| Missouri: 0.68% | |||||
| Miscellaneous revenue: 0.31% | |||||
| Missouri Public Utilities Commission Interim Construction Notes Series 2022 | 0.75 | 8-1-2023 | 5,400,000 | 5,307,552 | |
| Utilities revenue: 0.37% | |||||
| Missouri Environmental Improvement Revenue Refunding Bonds Series 1992 | 1.60 | 12-1-2022 | 6,500,000 | 6,493,023 | |
| 11,800,575 | |||||
| Nebraska: 0.93% | |||||
| Miscellaneous revenue: 0.36% | |||||
| Gretna NE Series 2021 | 4.00 | 12-15-2025 | 3,000,000 | 3,101,045 | |
| Gretna NE Tax Supported Certificates Series 2022 | 5.00 | 12-15-2025 | 3,000,000 | 3,177,533 | |
| 6,278,578 | |||||
| Utilities revenue: 0.57% | |||||
| Nebraska Public Power District Revenue General Series A øø | 0.60 | 1-1-2051 | 10,075,000 | 9,916,130 | |
| 16,194,708 | |||||
| Nevada: 1.70% | |||||
| Airport revenue: 0.20% | |||||
| Clark County NV Airport System Junior Subordinate Lien Revenue Notes Series 2021B | 5.00 | 7-1-2025 | 3,200,000 | 3,416,709 | |
| GO revenue: 0.15% | |||||
| Clark County NV School District Refunding Bond Limited Tax Series A | 5.00 | 6-15-2023 | 2,095,000 | 2,158,581 | |
| Clark County NV School District Refunding Bond Limited Tax Series C | 5.00 | 6-15-2023 | 500,000 | 515,174 | |
| 2,673,755 | |||||
| Housing revenue: 0.36% | |||||
| Nevada Housing Division Multi Unit Housing Whittell Pointe | 0.30 | 10-1-2023 | 6,365,000 | 6,333,416 | |
| Industrial development revenue: 0.99% | |||||
| Director of the State of Nevada Department of Business and Industry Revenue Bonds Series 2020A 144A | 0.85 | 1-1-2050 | 17,500,000 | 17,266,664 | |
| 29,690,544 |
| Interest rate | Maturity date | Principal | Value | ||
| New Jersey: 2.94% | |||||
| Education revenue: 0.07% | |||||
| New Jersey Higher Education Assistance Authority Series B | 5.00% | 12-1-2023 | $ 300,000 | $ 311,083 | |
| New Jersey Higher Education Assistance Authority Series B | 5.00 | 12-1-2025 | 850,000 | 910,471 | |
| 1,221,554 | |||||
| GO revenue: 1.86% | |||||
| New Jersey EDA Revenue Refunding Bonds School Facilities Construction Series GGG 144A | 5.25 | 9-1-2026 | 5,000,000 | 5,359,816 | |
| New Jersey EDA School Facilities Construction Notes Series GGG 144A | 5.25 | 9-1-2022 | 10,000,000 | 10,057,545 | |
| New Jersey EDA Series G 144A | 5.25 | 9-1-2023 | 10,000,000 | 10,359,421 | |
| Newark NJ Refunding Bond Qualified General Improvement Series A | 5.00 | 10-1-2022 | 750,000 | 755,800 | |
| Plainfield NJ BAN | 1.00 | 8-16-2022 | 6,000,000 | 5,996,525 | |
| 32,529,107 | |||||
| Miscellaneous revenue: 0.38% | |||||
| Burlington County NJ Bridge Commission Series 2021C | 2.00 | 11-10-2022 | 4,000,000 | 4,008,942 | |
| New Jersey Transportation Trust Fund Series D | 5.25 | 12-15-2023 | 2,600,000 | 2,713,068 | |
| 6,722,010 | |||||
| Tax revenue: 0.18% | |||||
| New Jersey COVID-19 Emergency Series A | 4.00 | 6-1-2023 | 3,000,000 | 3,054,925 | |
| Transportation revenue: 0.17% | |||||
| New Brunswick NJ Parking Authority City Guaranteed Series B (Municipal Government Guaranty Insured) | 5.00 | 9-1-2022 | 700,000 | 703,825 | |
| New Brunswick NJ Parking Authority City Guaranteed Series B (BAM Insured) | 5.00 | 9-1-2024 | 875,000 | 927,667 | |
| New Jersey TTFA Series A | 5.25 | 12-15-2022 | 1,295,000 | 1,316,552 | |
| 2,948,044 | |||||
| Water & sewer revenue: 0.28% | |||||
| New Jersey EDA Refunding Bond AMT American Water Company Incorporated | 1.20 | 11-1-2034 | 5,000,000 | 4,947,919 | |
| 51,423,559 | |||||
| New Mexico: 0.44% | |||||
| Health revenue: 0.04% | |||||
| New Mexico Hospital Equipment Loan Council Hospital Improvement System Sanitary Juan Regional | 5.00 | 6-1-2023 | 665,000 | 682,324 | |
| Utilities revenue: 0.40% | |||||
| Farmington NM PCR Bonds Series 2010B | 3.00 | 6-1-2040 | 7,000,000 | 7,038,794 | |
| 7,721,118 | |||||
| New York: 12.60% | |||||
| Airport revenue: 0.27% | |||||
| New York Transportation Development Corporation Series 2022 | 5.00 | 12-1-2026 | 2,000,000 | 2,118,842 |
| Interest rate | Maturity date | Principal | Value | ||
| Airport revenue (continued) | |||||
| New York Transportation Development Corporation Special Facility Revenue Terminal 4 John F Kennedy International | 5.00% | 12-1-2023 | $ 1,260,000 | $ 1,297,704 | |
| New York Transportation Development Corporation Special Facility Revenue Terminal 4 John F Kennedy International | 5.00 | 12-1-2024 | 1,250,000 | 1,304,888 | |
| 4,721,434 | |||||
| Education revenue: 0.29% | |||||
| Albany NY IDA Foundation State University Project Series A ø | 1.02 | 7-1-2032 | 2,265,000 | 2,265,000 | |
| New York Dormitory Authority Iona College Series 2022 | 5.00 | 7-1-2023 | 550,000 | 564,267 | |
| Saratoga County NY Capital Resource Corporation Revenue Refunding Skidmore College Series A | 5.00 | 7-1-2022 | 550,000 | 550,000 | |
| Saratoga County NY Capital Resource Corporation Revenue Refunding Skidmore College Series A | 5.00 | 7-1-2023 | 575,000 | 593,350 | |
| Saratoga County NY Capital Resource Corporation Revenue Refunding Skidmore College Series A | 5.00 | 7-1-2024 | 600,000 | 631,982 | |
| Saratoga County NY Capital Resource Corporation Revenue Refunding Skidmore College Series A | 5.00 | 7-1-2025 | 425,000 | 455,681 | |
| 5,060,280 | |||||
| GO revenue: 3.99% | |||||
| Corinth NY Central School District BAN | 1.25 | 7-22-2022 | 3,340,000 | 3,339,721 | |
| Cortland NY Enlarged City School District Revenue BAN | 2.00 | 7-29-2022 | 3,780,000 | 3,781,591 | |
| Long Beach NY Public Improvement Series A | 5.00 | 9-1-2022 | 1,770,000 | 1,779,165 | |
| Long Beach NY Public Improvement Series A | 5.00 | 9-1-2023 | 2,075,000 | 2,138,384 | |
| New York NY Adjusted Fiscal 2008 Subordinate Bond Series A-4 (AGM Insured) € | 1.13 | 8-1-2026 | 2,775,000 | 2,775,000 | |
| New York NY Adjusted Fiscal 2008 Subordinate Bond Series C-4 (AGC Insured) € | 1.10 | 10-1-2027 | 24,650,000 | 24,650,000 | |
| New York NY Series 3 ø | 1.19 | 4-1-2042 | 6,500,000 | 6,500,000 | |
| New York NY Series J Subordinate Bond Series J-2 (AGM Insured) € | 1.15 | 6-1-2036 | 1,350,000 | 1,350,000 | |
| New York NY Series J Subordinate Bond Series J3 (AGM Insured) € | 1.15 | 6-1-2036 | 9,425,000 | 9,425,000 | |
| New York NY Subordinate Bond Series C-4 (AGM Insured) € | 1.00 | 1-1-2032 | 800,000 | 800,000 | |
| New York NY Various Fiscal 2021 Series 2 ø | 1.25 | 4-1-2042 | 500,000 | 500,000 | |
| Oyster Bay NY New York Water District Notes 2022 | 3.00 | 3-9-2023 | 12,000,000 | 12,077,918 | |
| Yonkers NY Series 2021A (AGM Insured) | 5.00 | 2-15-2025 | 315,000 | 335,691 | |
| Yonkers NY Series 2021B (AGM Insured) | 5.00 | 2-15-2025 | 305,000 | 325,034 | |
| 69,777,504 | |||||
| Health revenue: 0.40% | |||||
| Broome County NY Local Development Corporation United Health Services Hospital Incorporated Project (AGM Insured) | 5.00 | 4-1-2024 | 500,000 | 524,910 | |
| Broome County NY Local Development Corporation United Health Services Hospital Incorporated Project (AGM Insured) | 5.00 | 4-1-2025 | 500,000 | 534,031 |
| Interest rate | Maturity date | Principal | Value | ||
| Health revenue (continued) | |||||
| New York Dormitory Authority Catholic Health Systems Obligated Group Revenue Bond Series 2019B (Manufacturers & Traders Trust Company LOC) ø | 0.98% | 7-1-2048 | $ 2,000,000 | $ 2,000,000 | |
| New York NY Health & Hospital Corporation Health System Bonds Series A | 5.00 | 2-15-2025 | 3,615,000 | 3,862,886 | |
| 6,921,827 | |||||
| Housing revenue: 1.81% | |||||
| Deutsche Bank Short Puttable Exempt Adjustable Receipts/Long Inverse Floating Exempt Receipts Trust Series DBE-8063 (Deutsche Bank LOC, Deutsche Bank LIQ) 144Aø | 1.38 | 10-1-2045 | 10,718,814 | 10,718,814 | |
| East Rochester NY Housing Authority Home Good Shepherd Project Series A (Citizens Bank LOC) ø | 1.01 | 12-1-2036 | 2,260,000 | 2,260,000 | |
| New York Housing Development MFHR Bonds Series C3 (Barclays Bank plc SPA) ø | 1.00 | 5-1-2062 | 6,000,000 | 6,000,000 | |
| New York Housing Finance Agency Revenue Affordable Housing Series J Climate | 0.75 | 5-1-2025 | 8,250,000 | 7,801,239 | |
| New York NY Housing Development Corporation Series A-3 | 1.13 | 5-1-2060 | 4,000,000 | 3,846,902 | |
| New York NY Housing Development Corporation Series C-2 øø | 0.70 | 11-1-2060 | 1,000,000 | 932,560 | |
| 31,559,515 | |||||
| Industrial development revenue: 1.09% | |||||
| New York Energy Research & Development Authority PCR Keyspan Generation Series A (Ambac Insured) € | 2.00 | 10-1-2028 | 900,000 | 900,000 | |
| New York Transportation Development Corporation Series 2018 | 5.00 | 1-1-2023 | 12,750,000 | 12,846,152 | |
| New York Transportation Development Corporation Special Facilities Revenue Delta Airlines Incorporated LaGuardia Airport Terminals C&D Redevelopment Project | 5.00 | 1-1-2024 | 5,250,000 | 5,338,968 | |
| 19,085,120 | |||||
| Miscellaneous revenue: 0.06% | |||||
| New York IDA Series 2021A (AGM Insured) | 5.00 | 1-1-2026 | 1,000,000 | 1,074,233 | |
| Resource recovery revenue: 0.57% | |||||
| New York NY Environmental Facilities Corporation Waste Management Incorporated Project Series 2012 | 2.00 | 5-1-2030 | 10,000,000 | 9,999,581 | |
| Tax revenue: 0.62% | |||||
| New York NY Transitional Finance Authority Subordinate Bond Series 1-B (SIFMA Municipal Swap +0.80%) ± | 1.78 | 11-1-2022 | 3,525,000 | 3,535,481 | |
| Tender Option Bond Trust Receipts/Certificates Series 2021-XF1109 (Deutsche Bank LIQ) 144Aø | 1.04 | 3-15-2048 | 1,447,500 | 1,447,500 | |
| Tender Option Bond Trust Receipts/Certificates Series 2021-XF1125 (Deutsche Bank LIQ) 144Aø | 1.04 | 5-15-2051 | 3,005,500 | 3,005,500 | |
| Triborough Bridge & Tunnel Authority Series 2022B %% | 5.00 | 5-15-2024 | 2,705,000 | 2,842,887 | |
| 10,831,368 | |||||
| Transportation revenue: 3.11% | |||||
| New York Metropolitan Transportation Authority BAN | 5.00 | 2-1-2023 | 4,050,000 | 4,118,923 | |
| New York Metropolitan Transportation Authority Refunding Green Bonds Series D1 | 5.00 | 11-15-2034 | 9,000,000 | 9,394,462 |
| Interest rate | Maturity date | Principal | Value | ||
| Transportation revenue (continued) | |||||
| New York Metropolitan Transportation Authority Revenue BAN Series 2019F | 5.00% | 11-15-2022 | $ 3,000,000 | $ 3,034,169 | |
| New York Metropolitan Transportation Authority Series B (1 Month LIBOR +0.55%) ± | 1.26 | 11-1-2041 | 6,255,000 | 6,233,226 | |
| New York Metropolitan Transportation Authority Subordinate Bond Series 2012A-2 (Bank of Montreal LOC) ø | 1.20 | 11-15-2041 | 5,600,000 | 5,600,000 | |
| New York Metropolitan Transportation Authority Subordinate Bond Series D2 (SIFMA Municipal Swap +0.45%) ± | 1.43 | 11-15-2044 | 18,460,000 | 18,408,006 | |
| Triborough Bridge & Tunnel Authority Series 2013A (U.S. SOFR +0.38%) ± | 1.39 | 1-1-2032 | 3,955,000 | 3,867,380 | |
| Triborough Bridge & Tunnel Authority Series A | 5.00 | 11-15-2023 | 1,570,000 | 1,612,310 | |
| Triborough Bridge & Tunnel Authority Subordinated Bonds Series B-2 (State Street Bank & Trust Company LOC) ø | 1.19 | 1-1-2032 | 2,000,000 | 2,000,000 | |
| 54,268,476 | |||||
| Water & sewer revenue: 0.39% | |||||
| New York Municipal Water Finance Authority Second General Resolution Revenue Bonds Series DD ø | 1.23 | 6-15-2033 | 2,000,000 | 2,000,000 | |
| New York Municipal Water Finance Authority Water & Sewer System Revenue Second General Resolution | 4.00 | 6-15-2024 | 3,000,000 | 3,117,829 | |
| New York Water Finance Authority Series DD | 5.00 | 6-15-2025 | 1,535,000 | 1,658,538 | |
| 6,776,367 | |||||
| 220,075,705 | |||||
| North Carolina: 1.71% | |||||
| Health revenue: 0.12% | |||||
| Charlotte Mecklenburg Hospital Authority North Carolina Health Care System Atrium Health Series E øø | 0.80 | 1-15-2048 | 1,500,000 | 1,418,927 | |
| North Carolina Health Care Facilities First Mortgage Revenue Bonds Series A | 3.00 | 3-1-2023 | 200,000 | 198,406 | |
| North Carolina Health Care Facilities First Mortgage Revenue Bonds Series A | 4.00 | 3-1-2024 | 215,000 | 213,496 | |
| North Carolina Health Care Facilities First Mortgage Revenue Bonds Series A | 4.00 | 3-1-2025 | 265,000 | 260,795 | |
| 2,091,624 | |||||
| Industrial development revenue: 0.10% | |||||
| Columbus County NC PCFA International Paper Company Project Series 2019C | 2.10 | 3-1-2027 | 1,750,000 | 1,719,811 | |
| Miscellaneous revenue: 0.01% | |||||
| Tender Option Bond Trust Receipts/Certificates Series 2021-XG0331 (Deutsche Bank LIQ) 144Aø | 1.04 | 6-1-2048 | 163,000 | 163,000 | |
| Resource recovery revenue: 1.00% | |||||
| North Carolina Capital Finance Republic Services Incorporated Project Series 2013 | 2.60 | 6-1-2038 | 17,500,000 | 17,503,941 |
| Interest rate | Maturity date | Principal | Value | ||
| Transportation revenue: 0.48% | |||||
| North Carolina Turnpike Authority Triangle Expressway System Series 2020 | 5.00% | 2-1-2024 | $ 8,000,000 | $ 8,328,474 | |
| 29,806,850 | |||||
| North Dakota: 0.27% | |||||
| Miscellaneous revenue: 0.27% | |||||
| Cass County ND Joint Water Resources District Refunding Bond Temporary Improvement Series A | 0.48 | 5-1-2024 | 5,000,000 | 4,771,488 | |
| Ohio: 5.67% | |||||
| Airport revenue: 0.07% | |||||
| Cleveland OH Airport System Revenue Bonds Series 2019B | 5.00 | 1-1-2023 | 1,200,000 | 1,217,130 | |
| Education revenue: 0.05% | |||||
| Ohio Higher Educational Facility Commission | 5.00 | 5-1-2025 | 885,000 | 939,508 | |
| GO revenue: 1.68% | |||||
| Akron OH Refunding Bonds Series 2020 | 2.00 | 12-1-2022 | 1,135,000 | 1,136,794 | |
| Coshocton County OH Series 2021 | 1.00 | 12-29-2022 | 10,000,000 | 9,958,395 | |
| Elyria OH Various Purpose BAN Series 2022 | 3.13 | 6-28-2023 | 1,890,000 | 1,903,410 | |
| Lorain County OH Various Purpose BAN Series 2022A | 2.50 | 5-3-2023 | 4,000,000 | 4,003,574 | |
| Newark OH Various Purpose BAN Series 2021 | 1.10 | 9-27-2022 | 2,900,000 | 2,896,491 | |
| Newark OH Various Purpose BAN Series 2021 | 1.10 | 9-27-2022 | 3,000,000 | 2,996,370 | |
| Newark OH Various Purpose BAN Series 2021�� | 1.25 | 9-29-2022 | 3,500,000 | 3,496,906 | |
| Newark OH Various Purpose BAN Series 2022 | 2.00 | 3-23-2023 | 2,175,000 | 2,175,049 | |
| Toledo OH Refunding Bond Limited Tax Various Purpose | 3.00 | 12-1-2022 | 310,000 | 311,863 | |
| Toledo OH Refunding Bond Limited Tax Various Purpose | 3.00 | 12-1-2023 | 440,000 | 445,991 | |
| 29,324,843 | |||||
| Health revenue: 0.40% | |||||
| Allen County OH Mercy Health Hospital | 5.00 | 12-1-2024 | 2,325,000 | 2,467,076 | |
| Ohio State Hospital Series 2021B ø | 1.15 | 1-15-2049 | 4,500,000 | 4,500,000 | |
| 6,967,076 | |||||
| Housing revenue: 0.59% | |||||
| Ohio HFA MFHR Series 2022 (Department of Housing and Urban Development Insured) | 3.00 | 10-1-2024 | 3,750,000 | 3,781,826 | |
| Ohio HFA MFHR Series 2022 (Department of Housing and Urban Development Insured) | 3.35 | 7-1-2025 | 2,000,000 | 2,012,469 | |
| Ohio HFA Series 2021 (Department of Housing and Urban Development Insured) | 1.25 | 8-1-2024 | 4,500,000 | 4,449,884 | |
| 10,244,179 | |||||
| Industrial development revenue: 1.37% | |||||
| Ohio Air Quality Development Authority Exempt Facilities Revenue Bond ø | 0.98 | 4-1-2051 | 24,000,000 | 24,000,000 | |
| Miscellaneous revenue: 0.83% | |||||
| American Municipal Power Incorporated BAN Electric System Improvement | 1.25 | 11-30-2022 | 500,000 | 498,873 | |
| American Municipal Power Incorporated BAN Electric System Improvement | 1.25 | 12-1-2022 | 600,000 | 598,639 |
| Interest rate | Maturity date | Principal | Value | ||
| Miscellaneous revenue (continued) | |||||
| American Municipal Power Incorporated BAN Electric System Improvement | 3.50% | 6-22-2023 | $ 2,600,000 | $ 2,621,475 | |
| Board of Education of Southeast Local School District Counties of Wayne Holmes & Stark Certificate of Participation Series 2021 | 3.00 | 12-1-2022 | 440,000 | 442,644 | |
| Board of Education of Southeast Local School District Counties of Wayne Holmes & Stark Certificate of Participation Series 2021 | 3.00 | 12-1-2023 | 585,000 | 593,291 | |
| Board of Education of Southeast Local School District Counties of Wayne Holmes & Stark Certificate of Participation Series 2021 | 3.00 | 12-1-2024 | 230,000 | 233,629 | |
| Ohio Capital Facilities Lease Adult Correctional Building Fund Series C ø | 1.20 | 10-1-2036 | 6,200,000 | 6,200,000 | |
| Orange Village OH Recreational Trail Special Assessment BAN Series 2021 | 0.20 | 8-25-2022 | 3,275,000 | 3,268,785 | |
| 14,457,336 | |||||
| Tax revenue: 0.35% | |||||
| Akron OH Community Learning Centers Income Tax Revenue Refunding Bonds Series 2022 | 4.00 | 12-1-2022 | 3,075,000 | 3,106,735 | |
| Lakewood City OH Various Purpose Income Tax Revenue Notes Series 2022 | 1.75 | 3-16-2023 | 3,000,000 | 2,994,106 | |
| 6,100,841 | |||||
| Utilities revenue: 0.33% | |||||
| American Municipal Power Incorporated BAN Electric System Improvement | 5.00 | 2-15-2025 | 500,000 | 536,656 | |
| Lancaster OH Port Authority Gas Supply Series A (Royal Bank of Canada LIQ) | 5.00 | 8-1-2049 | 5,000,000 | 5,244,097 | |
| 5,780,753 | |||||
| 99,031,666 | |||||
| Oklahoma: 0.42% | |||||
| Education revenue: 0.03% | |||||
| University of Oklahoma General Revenue Refunding Bond Series 2020B | 5.00 | 7-1-2025 | 510,000 | 543,781 | |
| Miscellaneous revenue: 0.39% | |||||
| Canadian County OK Educational Facilities Authority Mustang Public Schools Project | 3.00 | 9-1-2022 | 2,000,000 | 2,005,285 | |
| Kay County OK Public Building Authority | 4.00 | 4-1-2023 | 450,000 | 454,481 | |
| Oklahoma County OK Finance Authority Jones Public School Project | 4.00 | 9-1-2023 | 330,000 | 336,075 | |
| Oklahoma County OK Finance Authority Jones Public School Project | 4.00 | 9-1-2024 | 525,000 | 539,663 | |
| Osage County OK Industrial Authority Use Tax Revenue BAN Series 2022 | 2.00 | 9-1-2023 | 3,500,000 | 3,483,102 | |
| 6,818,606 | |||||
| 7,362,387 |
| Interest rate | Maturity date | Principal | Value | ||
| Oregon: 0.81% | |||||
| Airport revenue: 0.07% | |||||
| Port of Portland OR Portland International Airport AMT | 5.00% | 7-1-2022 | $ 1,200,000 | $ 1,200,000 | |
| Education revenue: 0.08% | |||||
| Yamhill County OR Linfield University Project Series A | 4.00 | 10-1-2022 | 500,000 | 502,489 | |
| Yamhill County OR Linfield University Project Series A | 4.00 | 10-1-2024 | 850,000 | 866,980 | |
| 1,369,469 | |||||
| GO revenue: 0.04% | |||||
| Morrow County OR Series 2021A | 4.00 | 6-1-2024 | 325,000 | 334,815 | |
| Morrow County OR Series 2021A | 4.00 | 6-1-2025 | 325,000 | 337,945 | |
| 672,760 | |||||
| Health revenue: 0.05% | |||||
| Multnomah County OR Hospital Facilities Authority Revenue Refunding Bonds Terwilliger Plaza Parkview | 0.95 | 6-1-2027 | 1,000,000 | 883,878 | |
| Industrial development revenue: 0.57% | |||||
| Oregon Business Development Commission Intel Corporation Project Series 232 | 2.40 | 12-1-2040 | 10,000,000 | 10,027,242 | |
| 14,153,349 | |||||
| Pennsylvania: 5.29% | |||||
| Airport revenue: 0.25% | |||||
| Philadelphia PA Airport Revenue Refunding Bond AMT Series C Private Activity Bond | 5.00 | 7-1-2022 | 2,750,000 | 2,750,000 | |
| Philadelphia PA Airport Revenue Refunding Bond Series A Private Activity Bond | 5.00 | 7-1-2025 | 1,545,000 | 1,657,458 | |
| 4,407,458 | |||||
| Education revenue: 1.04% | |||||
| Delaware County Authority University Revenue Neumann University | 5.00 | 10-1-2024 | 500,000 | 514,486 | |
| Delaware County Authority University Revenue Neumann University | 5.00 | 10-1-2025 | 525,000 | 543,895 | |
| Huntington County PA General Authority Revenue Bond Series 2021 TT3 | 5.00 | 10-1-2025 | 355,000 | 374,871 | |
| Huntington County PA General Authority Revenue Bond Series 2021 TT3 | 5.00 | 10-1-2026 | 430,000 | 458,537 | |
| Northampton County General Purpose Authority College Revenue Refunding Bonds Series of 2003 (U.S. Bank NA SPA) ø | 0.91 | 11-1-2023 | 150,000 | 150,000 | |
| Pennsylvania HEFA Association of Independent Colleges & Universities of Pennsylvania Financing Program Series T-3 | 3.50 | 5-1-2033 | 2,000,000 | 2,013,205 | |
| Pennsylvania HEFA Thomas Jefferson University Revenue Bonds Series 2015B ø | 1.21 | 9-1-2045 | 150,000 | 150,000 | |
| Philadelphia PA IDA Thomas Jefferson University Series B ø | 1.21 | 9-1-2050 | 10,000,000 | 10,000,000 | |
| Tender Option Bond Trust Receipts/Floater Certificates Series 2019-XF2836 (Mizuho Capital Markets LLC LOC, Mizuho Capital Markets LLC LIQ) 144Aø | 1.11 | 6-15-2039 | 3,935,000 | 3,935,000 | |
| 18,139,994 |
| Interest rate | Maturity date | Principal | Value | ||
| GO revenue: 0.31% | |||||
| Albert Gallatin PA Area School District Series A (AGM Insured) | 4.00% | 9-1-2023 | $ 1,000,000 | $ 1,023,484 | |
| Albert Gallatin PA Area School District Series A (AGM Insured) | 4.00 | 9-1-2024 | 725,000 | 752,525 | |
| Dunmore PA Series A (AGM Insured) | 2.00 | 9-1-2022 | 440,000 | 440,373 | |
| Dunmore PA Series A (AGM Insured) | 2.00 | 9-1-2024 | 765,000 | 754,146 | |
| Dunmore PA Series A (AGM Insured) | 2.00 | 9-1-2026 | 170,000 | 162,598 | |
| Hollidaysburg PA Area School District | 4.00 | 7-15-2023 | 525,000 | 537,012 | |
| Octorara PA Area School District (AGM Insured) | 4.00 | 4-1-2025 | 600,000 | 627,019 | |
| Riverside PA School District GO Bonds (BAM Insured) | 3.00 | 10-15-2023 | 480,000 | 486,187 | |
| Riverside PA School District GO Bonds (BAM Insured) | 4.00 | 10-15-2025 | 550,000 | 577,018 | |
| 5,360,362 | |||||
| Health revenue: 0.99% | |||||
| Allegheny County PA Hospital Development Authority Series 2017D-2 (SIFMA Municipal Swap +0.70%) ± | 1.68 | 11-15-2047 | 6,000,000 | 5,981,344 | |
| Montgomery County PA Higher Education & Health Authority Series 2018A | 5.00 | 9-1-2022 | 1,250,000 | 1,256,869 | |
| Montgomery County PA Higher Education & Health Authority Series 2018D ø | 1.21 | 9-1-2050 | 10,000,000 | 10,000,000 | |
| 17,238,213 | |||||
| Housing revenue: 1.29% | |||||
| Pennsylvania HFA Limited Norris Homes Phase V | 1.40 | 1-1-2043 | 10,500,000 | 10,459,368 | |
| Pennsylvania HFA Limited Obligation Multifamily Development Bonds Series 2022 (Department of Housing and Urban Development Insured) | 1.50 | 7-1-2024 | 5,000,000 | 4,954,784 | |
| Pennsylvania HFA Single Family Series 2021-137 | 0.40 | 4-1-2023 | 325,000 | 321,496 | |
| Pennsylvania HFA Single Family Series 2021-137 | 0.45 | 10-1-2023 | 325,000 | 318,243 | |
| Pennsylvania Housing Finance Agency MFHR Sherman Hills Series 2022 (Department of Housing and Urban Development Insured) | 1.25 | 2-1-2025 | 6,675,000 | 6,530,562 | |
| 22,584,453 | |||||
| Miscellaneous revenue: 0.37% | |||||
| Pennsylvania EDFA Refunding Bond Philadelphia Bioslides Facility | 3.00 | 1-1-2024 | 865,000 | 873,203 | |
| Pittsburgh & Allegheny Counties PA Sports and Exhibition Authority Regional Asset District (AGM Insured) | 4.00 | 2-1-2025 | 1,860,000 | 1,932,711 | |
| Southeastern Pennsylvania Transportation | 5.00 | 6-1-2024 | 1,000,000 | 1,046,811 | |
| Southeastern Pennsylvania Transportation | 5.00 | 6-1-2025 | 1,000,000 | 1,067,073 | |
| State Public School Building Authority Prerefunded Bond Series A (AGM Insured) | 5.00 | 12-1-2023 | 1,450,000 | 1,513,227 | |
| 6,433,025 | |||||
| Resource recovery revenue: 0.64% | |||||
| Pennsylvania EDFA Solid Waste Disposal Refunding Revenue Bonds Series 2021B | 1.10 | 6-1-2031 | 1,000,000 | 881,460 | |
| Pennsylvania EDFA Solid Waste Disposal Republic Services Incorporated Project Series 2014A | 1.90 | 6-1-2044 | 2,000,000 | 2,000,000 | |
| Pennsylvania EDFA Solid Waste Disposal Waste Management Incorporated Project Series 2013 | 2.00 | 8-1-2045 | 8,350,000 | 8,349,650 | |
| 11,231,110 |
| Interest rate | Maturity date | Principal | Value | ||
| Tax revenue: 0.04% | |||||
| Allentown PA Neighborhood Improvement Zone Development Authority Tax Revenue Refunding Bonds Series 2022 | 5.00% | 5-1-2024 | $ 150,000 | $ 155,755 | |
| Allentown PA Neighborhood Improvement Zone Development Authority Tax Revenue Refunding Bonds Series 2022 | 5.00 | 5-1-2025 | 500,000 | 523,850 | |
| 679,605 | |||||
| Transportation revenue: 0.05% | |||||
| Pennsylvania Turnpike Series B | 5.00 | 12-1-2023 | 425,000 | 443,290 | |
| Pennsylvania Turnpike Series B | 5.00 | 12-1-2024 | 450,000 | 480,114 | |
| 923,404 | |||||
| Water & sewer revenue: 0.31% | |||||
| Allegheny County PA Sanitary Authority Series A | 4.00 | 6-1-2024 | 300,000 | 310,652 | |
| Allegheny County PA Sanitary Authority Series A | 4.00 | 6-1-2025 | 150,000 | 157,411 | |
| Pittsburgh PA Water & Sewer Authority Series C (SIFMA Municipal Swap +0.65%)(AGM Insured) ± | 1.63 | 9-1-2040 | 5,000,000 | 5,002,499 | |
| 5,470,562 | |||||
| 92,468,186 | |||||
| Rhode Island: 0.28% | |||||
| Health revenue: 0.22% | |||||
| Rhode Island Health & Educational Building Corporation Refunding Bond Hospital Financing Lifespan Obligated Group | 5.00 | 5-15-2023 | 1,300,000 | 1,331,729 | |
| Rhode Island Health & Educational Building Corporation Refunding Bond Hospital Financing Lifespan Obligated Group | 5.00 | 5-15-2024 | 2,475,000 | 2,589,280 | |
| 3,921,009 | |||||
| Miscellaneous revenue: 0.06% | |||||
| Providence RI Public Buildings Authority Revenue Capital Improvement Program Projects Series A (AGM Insured) | 4.00 | 9-15-2023 | 1,000,000 | 1,023,629 | |
| 4,944,638 | |||||
| South Carolina: 0.57% | |||||
| Health revenue: 0.57% | |||||
| South Carolina Jobs EDA Prisma Health Obligated Group Series C ø | 1.23 | 5-1-2048 | 10,000,000 | 10,000,000 | |
| South Dakota: 0.36% | |||||
| Resource recovery revenue: 0.36% | |||||
| South Dakota EDA Riverview Project (AgCountry Farm Credit Services LOC) ø | 1.03 | 11-1-2051 | 6,250,000 | 6,250,000 |
| Interest rate | Maturity date | Principal | Value | ||
| Tennessee: 0.91% | |||||
| Airport revenue: 0.28% | |||||
| Memphis TN Airport Revenue Refunding Bonds Series 2020B | 5.00% | 7-1-2023 | $ 2,000,000 | $ 2,053,863 | |
| Shelby County TN Airport Authority Series 2021A | 5.00 | 7-1-2025 | 2,750,000 | 2,919,944 | |
| 4,973,807 | |||||
| Health revenue: 0.07% | |||||
| Greeneville TN Board of the Town HEFA Series 2018A | 5.00 | 7-1-2022 | 1,280,000 | 1,280,000 | |
| Housing revenue: 0.17% | |||||
| Memphis TN Health Educational & Housing Facility Board MFHR Collateralized Memphis Towers | 0.25 | 12-1-2023 | 3,000,000 | 2,976,777 | |
| Utilities revenue: 0.39% | |||||
| Memphis TN Electric System Series A | 4.00 | 12-1-2022 | 435,000 | 439,596 | |
| Memphis TN Electric System Series A | 5.00 | 12-1-2023 | 425,000 | 443,895 | |
| Memphis TN Electric System Series A | 5.00 | 12-1-2024 | 500,000 | 534,432 | |
| Tennessee Energy Acquisition Corporation Gas Project Series 2017A | 4.00 | 5-1-2048 | 5,250,000 | 5,314,373 | |
| 6,732,296 | |||||
| 15,962,880 | |||||
| Texas: 9.12% | |||||
| Airport revenue: 0.72% | |||||
| Dallas Fort Worth TX International Airport Refunding Bonds AMT Series A | 5.00 | 11-1-2024 | 5,000,000 | 5,298,822 | |
| Dallas Fort Worth TX International Airport Series A | 5.00 | 11-1-2024 | 1,500,000 | 1,589,646 | |
| Houston TX Airport System Series C | 5.00 | 7-1-2022 | 2,500,000 | 2,500,000 | |
| Love Field Airport Modernization Corporation Texas General Airport Revenue Refunding Bonds Series 2021 | 5.00 | 11-1-2024 | 3,000,000 | 3,154,927 | |
| 12,543,395 | |||||
| Education revenue: 0.10% | |||||
| Arlington TX Higher Education Finance Corporation Education Revenue Bonds Series 2021A | 4.00 | 2-15-2024 | 110,000 | 113,526 | |
| Arlington TX Higher Education Finance Corporation Education Revenue Bonds Series 2021A | 4.00 | 2-15-2025 | 170,000 | 176,714 | |
| Arlington TX Higher Education Finance Corporation Education Revenue Bonds Series 2021A | 4.00 | 2-15-2026 | 280,000 | 293,444 | |
| Hale Center TX Educational Facilities Corporation Revenue Improvement and Refunding Bonds Series 2022 | 5.00 | 3-1-2026 | 675,000 | 710,568 | |
| Odessa College District Consolidated Fund Revenue Bonds Series 2021 (AGM Insured) | 4.00 | 7-1-2023 | 500,000 | 510,678 | |
| 1,804,930 | |||||
| GO revenue: 2.59% | |||||
| Andrews County TX Hospital District Series 2021 | 5.00 | 3-15-2025 | 1,140,000 | 1,214,092 | |
| Beaumont TX Certificate of Obligation Series 2021 | 5.00 | 3-1-2025 | 1,065,000 | 1,144,788 | |
| Beaumont TX Certificate of Obligation Series 2021 | 5.00 | 3-1-2026 | 1,120,000 | 1,228,631 | |
| Burleson TX Independent School District | 2.50 | 2-1-2047 | 7,885,000 | 7,892,208 | |
| Fort Bend TX Independent School District School Building Series B øø | 0.88 | 8-1-2050 | 3,130,000 | 2,980,639 |
| Interest rate | Maturity date | Principal | Value | ||
| GO revenue (continued) | |||||
| Harris County TX Cypress-Fairbanks Independent High School Series B-1 øø | 0.28% | 2-15-2040 | $ 3,825,000 | $ 3,665,812 | |
| Katy TX Independent School District School Building Bonds Series 2021C | 1.50 | 8-15-2050 | 4,500,000 | 4,411,516 | |
| Little Elm TX Independent School Series 2020 øø | 0.68 | 8-15-2048 | 1,690,000 | 1,599,326 | |
| North East Texas Independent School District Unlimited Tax School Building Bonds Series 2013B øø | 0.25 | 8-1-2032 | 3,325,000 | 3,325,000 | |
| North East TX Independent School District Series 2022B | 2.00 | 8-1-2052 | 2,600,000 | 2,601,986 | |
| Northside Texas Independent School District Building Project | 1.60 | 8-1-2049 | 3,170,000 | 3,123,702 | |
| Plainview TX Independent School District Series B | 1.50 | 2-15-2050 | 9,000,000 | 8,943,897 | |
| Port Arthur TX Certificate of Obligation (BAM Insured) | 5.00 | 2-15-2023 | 565,000 | 576,542 | |
| Port Arthur TX Certificate of Obligation (BAM Insured) | 5.00 | 2-15-2025 | 445,000 | 475,397 | |
| Tomball TX Independent School District School Building Series B-1 øø | 0.45 | 2-15-2036 | 2,000,000 | 1,971,298 | |
| 45,154,834 | |||||
| Health revenue: 1.68% | |||||
| Coastal Bend TX Health Facilities Development Corporation (AGM Insured) € | 1.10 | 7-1-2031 | 8,550,000 | 8,550,000 | |
| Harris County TX Cultural Education Facilities Finance Corporation Hospital Memorial Hermann Series 2019A | 5.00 | 12-1-2026 | 1,000,000 | 1,084,474 | |
| Harris County TX Cultural Education Facilities Finance Corporation Hospital Memorial Hermann Series 2020C-2 | 5.00 | 6-1-2032 | 3,000,000 | 3,172,489 | |
| Harris County TX Cultural Education Facilities Finance Corporation Revenue Texas Medical Center Series A øø | 0.90 | 5-15-2050 | 2,100,000 | 2,064,711 | |
| Harris County TX Health Facilities Development Corporation Series A3 (AGM Insured) € | 1.75 | 7-1-2031 | 6,525,000 | 6,525,000 | |
| Harris County TX Health Facilities Development Corporation Series A4 (AGM Insured) € | 1.10 | 7-1-2031 | 8,000,000 | 8,000,000 | |
| 29,396,674 | |||||
| Housing revenue: 1.80% | |||||
| Cameron County TX Housing Finance Corporation Series 2022 | 3.50 | 12-1-2024 | 3,000,000 | 3,034,828 | |
| Galveston TX Public Facility Corporation MFHR Bonds Series 2021 (Department of Housing and Urban Development Insured) | 0.47 | 8-1-2025 | 5,200,000 | 4,878,193 | |
| Housing Options Incorporated MFHR Bonds Brooks Manor The Oaks Project Series 2021 | 0.50 | 8-1-2041 | 6,250,000 | 5,843,616 | |
| Odessa TX Housing Finance Corporation MFHR Vera Odessa Apartments (FHA Insured) | 0.35 | 9-1-2023 | 6,500,000 | 6,409,824 | |
| Port Aransas TX Public Facilities Corporation MFHR Palladium Port Aransas Apartments | 0.70 | 1-1-2024 | 6,400,000 | 6,347,429 | |
| Tender Option Bond Trust Receipts/Certificates Series 2021-XF1109 (Deutsche Bank LIQ) 144Aø | 1.23 | 7-1-2061 | 5,000,000 | 5,000,000 | |
| 31,513,890 | |||||
| Industrial development revenue: 0.90% | |||||
| Austin TX Convention First Tier Series A | 5.00 | 1-1-2023 | 750,000 | 757,588 | |
| Port Arthur TX Navigation District Industrial Development Corporation Total Petrochemicals USA Incorporated Project ø | 1.00 | 6-1-2041 | 15,000,000 | 15,000,000 | |
| 15,757,588 |
| Interest rate | Maturity date | Principal | Value | ||
| Miscellaneous revenue: 0.06% | |||||
| Dallas TX Performing Arts Cultural Facilities Corporation Revenue Bonds Series 2008A (Bank of America NA LOC) ø | 0.94% | 9-1-2041 | $ 548,000 | $ 548,000 | |
| Wise County TX Lease Revenue Refunding Bond Parker County Junior College | 5.00 | 8-15-2024 | 450,000 | 468,827 | |
| 1,016,827 | |||||
| Resource recovery revenue: 0.63% | |||||
| Port Arthur TX Navigation District Jefferson County Environmental Facilities Motiva Enterprises LLC Project Series E ø | 1.18 | 11-1-2040 | 11,000,000 | 11,000,000 | |
| Tax revenue: 0.04% | |||||
| Houston TX East Downtown RDA Series 2021 | 5.00 | 9-1-2022 | 725,000 | 728,835 | |
| Transportation revenue: 0.15% | |||||
| Central Texas Regional Mobility Authority Revenue Subordinated Lien BAN Series F | 5.00 | 1-1-2025 | 2,500,000 | 2,607,062 | |
| Utilities revenue: 0.45% | |||||
| Lower Colorado River Authority Series 2022 | 5.00 | 5-15-2023 | 395,000 | 405,498 | |
| Lower Colorado River Authority Series 2022 | 5.00 | 5-15-2025 | 2,670,000 | 2,862,905 | |
| Texas Municipal Gas Acquisition & Supply Corporation Series 2021 | 5.00 | 12-15-2022 | 1,250,000 | 1,264,051 | |
| Texas Municipal Gas Acquisition & Supply Corporation Series 2021 | 5.00 | 12-15-2024 | 1,500,000 | 1,561,320 | |
| Texas Municipal Power Agency Transmission System (AGM Insured) | 3.00 | 9-1-2024 | 750,000 | 762,267 | |
| Texas Municipal Power Agency Transmission System (AGM Insured) | 3.00 | 9-1-2025 | 1,000,000 | 1,018,412 | |
| 7,874,453 | |||||
| 159,398,488 | |||||
| Utah: 0.08% | |||||
| Airport revenue: 0.08% | |||||
| Salt Lake City UT Salt Lake City International Airport Airport Revenue Bonds Series 2021A | 5.00 | 7-1-2025 | 1,325,000 | 1,412,764 | |
| Vermont: 0.11% | |||||
| Education revenue: 0.11% | |||||
| Vermont Educational & Health Buildings St. Michaels College Project | 5.00 | 10-1-2023 | 1,185,000 | 1,191,916 | |
| Vermont Educational & Health Buildings St. Michaels College Project | 5.00 | 10-1-2024 | 675,000 | 678,680 | |
| 1,870,596 | |||||
| Virginia: 3.16% | |||||
| Education revenue: 0.04% | |||||
| Virginia College Building Authority Regent University Project | 5.00 | 6-1-2023 | 250,000 | 256,012 |
| Interest rate | Maturity date | Principal | Value | ||
| Education revenue (continued) | |||||
| Virginia College Building Authority Regent University Project | 5.00% | 6-1-2024 | $ 225,000 | $ 233,995 | |
| Virginia College Building Authority Regent University Project | 5.00 | 6-1-2025 | 250,000 | 263,109 | |
| 753,116 | |||||
| Health revenue: 0.06% | |||||
| Virginia Small Business Financing Authority Revenue National Senior Campuses Incorporate Series A | 5.00 | 1-1-2023 | 500,000 | 506,084 | |
| Virginia Small Business Financing Authority Revenue National Senior Campuses Incorporate Series A | 5.00 | 1-1-2024 | 500,000 | 517,502 | |
| 1,023,586 | |||||
| Housing revenue: 1.46% | |||||
| Fairfax County VA Redevelopment and Housing Authority Multifamily Housing One University Senior Apartments | 1.25 | 12-1-2025 | 15,000,000 | 14,445,515 | |
| Spotsylvania County VA EDA Palmers Creek Apartments Project (FHA / GNMA Insured) | 0.65 | 8-1-2022 | 8,700,000 | 8,689,672 | |
| Spotsylvania VA EDA Virginia Housing Revenue Bonds Series 2022 (FHA / GNMA Insured) | 1.50 | 8-1-2022 | 2,300,000 | 2,300,051 | |
| 25,435,238 | |||||
| Industrial development revenue: 0.34% | |||||
| Louisa VA IDA Pollution Control Virginia Electric & Power Company Series A | 1.90 | 11-1-2035 | 4,000,000 | 3,970,151 | |
| Peninsula VA Ports Authority Coal Terminal Refunding Bond Dominion Terminal Associates Project | 1.70 | 10-1-2033 | 2,000,000 | 1,998,640 | |
| 5,968,791 | |||||
| Miscellaneous revenue: 0.16% | |||||
| Louisa VA IDA Electric and Power Company Project Series A | 0.75 | 11-1-2035 | 3,000,000 | 2,763,979 | |
| Transportation revenue: 0.71% | |||||
| Chesapeake VA Bay Bridge & Tunnel District First Tier Generation Resolution | 5.00 | 11-1-2023 | 4,520,000 | 4,670,961 | |
| Virginia Small Business Financing Authority Revenue Bonds Series 2012 | 5.50 | 1-1-2042 | 7,750,000 | 7,750,000 | |
| 12,420,961 | |||||
| Utilities revenue: 0.39% | |||||
| Halifax County VA IDA Recovery Zone Facility Revenue Bonds Series 2010A | 1.65 | 12-1-2041 | 3,500,000 | 3,407,465 | |
| Wise County VA IDA Solid Waste & Sewage Disposal Revenue Bond | 1.20 | 11-1-2040 | 3,525,000 | 3,402,677 | |
| 6,810,142 | |||||
| 55,175,813 | |||||
| Washington: 0.45% | |||||
| Airport revenue: 0.15% | |||||
| Port of Seattle WA AMT Intermediate Lien Series C | 5.00 | 4-1-2025 | 2,500,000 | 2,621,328 |
| Interest rate | Maturity date | Principal | Value | ||
| Health revenue: 0.04% | |||||
| Washington HCFR Series 2021 144A | 5.00% | 12-1-2022 | $ 230,000 | $ 233,271 | |
| Washington HCFR Series 2021 144A | 5.00 | 12-1-2023 | 250,000 | 260,475 | |
| Washington HCFR Series 2021 144A | 5.00 | 12-1-2024 | 195,000 | 205,744 | |
| 699,490 | |||||
| Housing revenue: 0.26% | |||||
| Everett WA Housing Authority MFHR Baker Heights Legacy | 0.30 | 9-1-2024 | 2,500,000 | 2,432,644 | |
| Seattle WA Housing Authority Northgate Plaza Project | 1.00 | 6-1-2026 | 2,175,000 | 2,049,700 | |
| 4,482,344 | |||||
| 7,803,162 | |||||
| West Virginia: 0.39% | |||||
| Health revenue: 0.24% | |||||
| West Virginia Hospital Finance Authority United Health System | 5.00 | 6-1-2024 | 4,000,000 | 4,187,242 | |
| Industrial development revenue: 0.15% | |||||
| West Virginia EDA Solid Waste Disposal Facilities Revenue Refunding Appalachian Power Company øø | 0.63 | 12-1-2038 | 3,000,000 | 2,660,339 | |
| 6,847,581 | |||||
| Wisconsin: 2.00% | |||||
| Education revenue: 0.15% | |||||
| Wisconsin HEFA Revenue Various Refunding Bond Medical College Series B (U.S. Bank NA LOC) ø | 0.65 | 12-1-2033 | 500,000 | 500,000 | |
| Wisconsin HEFA Series 2022 %% | 5.00 | 10-1-2023 | 2,000,000 | 2,071,633 | |
| 2,571,633 | |||||
| GO revenue: 0.06% | |||||
| Dane County WI AMT Promissory Notes Apartment Project Series D | 2.63 | 6-1-2023 | 980,000 | 980,534 | |
| Health revenue: 1.30% | |||||
| PFA Wisconsin Hospital Renown Regional Medical Center Project Series A | 5.00 | 6-1-2025 | 385,000 | 409,045 | |
| Wisconsin HEFA Advocate Aurora Health Credit Group Series C3 (SIFMA Municipal Swap +0.55%) ± | 1.53 | 8-15-2054 | 7,065,000 | 7,045,917 | |
| Wisconsin HEFA Marshfield Clinic Health System Incorporated | 5.00 | 2-15-2052 | 10,000,000 | 10,544,312 | |
| Wisconsin HEFA Revenue Bonds Series 2022A ø | 1.29 | 2-15-2053 | 2,000,000 | 2,000,000 | |
| Wisconsin HEFA Series 2022 %% | 4.00 | 9-15-2023 | 710,000 | 711,519 | |
| Wisconsin HEFA Series 2022 %% | 4.00 | 9-15-2024 | 735,000 | 735,280 | |
| Wisconsin HEFA St. Camillus Health System Series A | 5.00 | 11-1-2022 | 120,000 | 120,252 | |
| Wisconsin HEFA St. Camillus Health System Series A | 5.00 | 11-1-2023 | 125,000 | 125,993 | |
| Wisconsin HEFA St. Camillus Health System Series A | 5.00 | 7-1-2024 | 945,000 | 987,475 | |
| 22,679,793 | |||||
| Housing revenue: 0.19% | |||||
| Tender Option Bond Trust Receipts/Floater Certificates Series 2020-XF2871 (Mizuho Capital Markets LLC LOC, Mizuho Capital Markets LLC LIQ) 144Aø | 1.13 | 11-1-2025 | 3,363,000 | 3,363,000 |
| Interest rate | Maturity date | Principal | Value | ||
| Miscellaneous revenue: 0.22% | |||||
| Clayton WI BAN Series B | 2.00% | 6-1-2026 | $ 1,000,000 | $ 950,141 | |
| Wisconsin GO Series A (SIFMA Municipal Swap +0.42%) ±%% | 1.20 | 5-1-2025 | 3,000,000 | 3,000,001 | |
| 3,950,142 | |||||
| Water & sewer revenue: 0.08% | |||||
| Clayton WI Water System and Sewer System Series C | 2.00 | 6-1-2026 | 1,500,000 | 1,425,212 | |
| 34,970,314 | |||||
| Wyoming: 0.18% | |||||
| Health revenue: 0.05% | |||||
| Laramie County WY Series 2021 | 4.00 | 5-1-2025 | 750,000 | 781,979 | |
| Housing revenue: 0.13% | |||||
| Wyoming CDA Housing Revenue Bonds 2021 Series B | 0.25 | 12-1-2022 | 1,135,000 | 1,129,211 | |
| Wyoming CDA Housing Revenue Bonds 2021 Series B | 0.35 | 12-1-2023 | 1,235,000 | 1,207,199 | |
| 2,336,410 | |||||
| 3,118,389 | |||||
| Total Municipal obligations (Cost $1,695,188,968) | 1,676,862,761 |
| Yield | Shares | ||||
| Short-term investments: 2.00% | |||||
| Investment companies: 2.00% | |||||
| Allspring Municipal Cash Management Money Market Fund Institutional Class ♠∞## | 0.85 | 34,877,770 | 34,898,697 | ||
| Total Short-term investments (Cost $34,898,697) | 34,898,697 | ||||
| Total investments in securities (Cost $1,780,287,665) | 100.86% | 1,761,961,458 | |||
| Other assets and liabilities, net | (0.86) | (15,010,046) | |||
| Total net assets | 100.00% | $1,746,951,412 |
| 144A | The security may be resold in transactions exempt from registration, normally to qualified institutional buyers, pursuant to Rule 144A under the Securities Act of 1933. |
| ø | Variable rate demand notes are subject to a demand feature which reduces the effective maturity. The maturity date shown represents the final maturity date of the security. The interest rate is determined and reset by the issuer daily, weekly, or monthly depending upon the terms of the security. The rate shown is the rate in effect at period end. |
| € | The security is an auction-rate security which has an interest rate that resets at predetermined short-term intervals through a Dutch auction. The rate shown is the rate in effect at period end. |
| ± | Variable rate investment. The rate shown is the rate in effect at period end. |
| ¤ | The security is issued in zero coupon form with no periodic interest payments. |
| øø | The interest rate is determined and reset by the issuer periodically depending upon the terms of the security. The rate shown is the rate in effect at period end. |
| ## | All or a portion of this security is segregated for when-issued securities. |
| ♠ | The issuer of the security is an affiliated person of the Fund as defined in the Investment Company Act of 1940. |
| ∞ | The rate represents the 7-day annualized yield at period end. |
| %% | The security is purchased on a when-issued basis. |
| Abbreviations: | |
| AGC | Assured Guaranty Corporation |
| AGM | Assured Guaranty Municipal |
| Ambac | Ambac Financial Group Incorporated |
| AMT | Alternative minimum tax |
| BAM | Build America Mutual Assurance Company |
| BAN | Bond anticipation notes |
| CAB | Capital appreciation bond |
| CDA | Community Development Authority |
| EDA | Economic Development Authority |
| EDFA | Economic Development Finance Authority |
| FHA | Federal Housing Administration |
| GNMA | Government National Mortgage Association |
| GO | General obligation |
| HCFR | Healthcare facilities revenue |
| HEFA | Health & Educational Facilities Authority |
| HEFAR | Higher Education Facilities Authority Revenue |
| HFA | Housing Finance Authority |
| HFFA | Health Facilities Financing Authority |
| IDA | Industrial Development Authority |
| LIBOR | London Interbank Offered Rate |
| LIQ | Liquidity agreement |
| LOC | Letter of credit |
| MFHR | Multifamily housing revenue |
| NPFGC | National Public Finance Guarantee Corporation |
| PCFA | Pollution Control Financing Authority |
| PCR | Pollution control revenue |
| PFA | Public Finance Authority |
| RDA | Redevelopment Authority |
| SIFMA | Securities Industry and Financial Markets Association |
| SOFR | Secured Overnight Financing Rate |
| SPA | Standby purchase agreement |
| TTFA | Transportation Trust Fund Authority |
| Value, beginning of period | Purchases | Sales proceeds | Net realized gains (losses) | Net change in unrealized gains (losses) | Value, end of period | Shares, end of period | Income from affiliated securities | |
| Short-term investments | ||||||||
| Allspring Municipal Cash Management Money Market Fund Institutional Class | $22,974,666 | $1,227,842,187 | $(1,215,921,645) | $3,489 | $0 | $34,898,697 | 34,877,770 | $24,786 |
| Assets | |
Investments in unaffiliated securities, at value (cost $1,745,388,968) | $ 1,727,062,761 |
Investments in affiliated securities, at value (cost $34,898,697) | 34,898,697 |
Cash | 4,842,240 |
Receivable for Fund shares sold | 9,612,012 |
Receivable for interest | 9,471,279 |
Receivable for investments sold | 3,306,275 |
Total assets | 1,789,193,264 |
| Liabilities | |
Payable for when-issued transactions | 31,814,307 |
Payable for investments purchased | 5,834,013 |
Payable for Fund shares redeemed | 3,040,149 |
Dividends payable | 711,828 |
Management fee payable | 209,283 |
Administration fees payable | 110,088 |
Trustees’ fees and expenses payable | 2,509 |
Distribution fee payable | 1,369 |
Accrued expenses and other liabilities | 518,306 |
Total liabilities | 42,241,852 |
Total net assets | $1,746,951,412 |
| Net assets consist of | |
Paid-in capital | $ 1,796,214,819 |
Total distributable loss | (49,263,407) |
Total net assets | $1,746,951,412 |
| Computation of net asset value and offering price per share | |
Net assets – Class A | $ 291,007,784 |
Shares outstanding – Class A1 | 30,784,026 |
Net asset value per share – Class A | $9.45 |
Maximum offering price per share – Class A2 | $9.64 |
Net assets – Class A2 | $ 39,575,117 |
Shares outstanding – Class A21 | 4,186,551 |
Net asset value per share – Class A2 | $9.45 |
Net assets – Class C | $ 2,447,596 |
Shares outstanding – Class C1 | 262,554 |
Net asset value per share – Class C | $9.32 |
Net assets – Class R6 | $ 668,632,531 |
Shares outstanding – Class R61 | 70,738,723 |
Net asset value per share – Class R6 | $9.45 |
Net assets – Administrator Class | $ 10,928,616 |
Shares outstanding – Administrator Class1 | 1,155,919 |
Net asset value per share – Administrator Class | $9.45 |
Net assets – Institutional Class | $ 734,359,768 |
Shares outstanding – Institutional Class1 | 77,679,121 |
Net asset value per share – Institutional Class | $9.45 |
| 1 | The Fund has an unlimited number of authorized shares. |
| 2 | Maximum offering price is computed as 100/98.00 of net asset value. On investments of $100,000 or more, the offering price is reduced. |
| Investment income | |
Interest | $ 15,417,429 |
Income from affiliated securities | 24,786 |
Total investment income | 15,442,215 |
| Expenses | |
Management fee | 4,774,504 |
| Administration fees | |
Class A | 486,691 |
Class A2 | 72,340 |
Class C | 1,889 |
Class R6 | 258,111 |
Administrator Class | 13,322 |
Institutional Class | 629,298 |
| Shareholder servicing fees | |
Class A | 756,471 |
Class A2 | 102,869 |
Class C | 2,924 |
Administrator Class | 32,977 |
| Distribution fee | |
Class C | 8,772 |
Custody and accounting fees | 72,588 |
Professional fees | 52,569 |
Registration fees | 78,344 |
Shareholder report expenses | 55,431 |
Trustees’ fees and expenses | 20,059 |
Other fees and expenses | 26,754 |
Total expenses | 7,445,913 |
| Less: Fee waivers and/or expense reimbursements | |
Fund-level | (1,638,499) |
Class A | (273,547) |
Class A2 | (36,170) |
Class C | (6,140) |
Administrator Class | (2,664) |
Net expenses | 5,488,893 |
Net investment income | 9,953,322 |
| Realized and unrealized gains (losses) on investments | |
| Net realized gains (losses) on | |
Unaffiliated securities | (3,381,023) |
Affiliated securities | 3,489 |
Net realized losses on investments | (3,377,534) |
Net change in unrealized gains (losses) on investments | (27,597,940) |
Net realized and unrealized gains (losses) on investments | (30,975,474) |
Net decrease in net assets resulting from operations | $(21,022,152) |
| Year ended June 30, 2022 | Year ended June 30, 2021 | |||
| Operations | ||||
Net investment income | $ 9,953,322 | $ 14,242,899 | ||
Payment from affiliate | 0 | 12,001 | ||
Net realized gains (losses) on investments | (3,377,534) | 339,117 | ||
Net change in unrealized gains (losses) on investments | (27,597,940) | 4,485,904 | ||
Net increase (decrease) in net assets resulting from operations | (21,022,152) | 19,079,921 | ||
| Distributions to shareholders from | ||||
| Net investment income and net realized gains | ||||
Class A | (865,557) | (1,412,794) | ||
Class A2 | (131,876) | (156,384) | ||
Class C | (248) | (253) | ||
Class R6 | (4,825,090) | (6,808,565) | ||
Administrator Class | (35,353) | (69,078) | ||
Institutional Class | (4,088,084) | (5,707,681) | ||
Total distributions to shareholders | (9,946,208) | (14,154,755) | ||
| Capital share transactions | Shares | Shares | ||
| Proceeds from shares sold | ||||
Class A | 7,968,345 | 76,073,481 | 5,093,988 | 48,928,927 |
Class A2 | 2,041,156 | 19,575,873 | 7,328,354 | 70,341,559 |
Class C | 201,436 | 1,874,708 | 61,571 | 583,244 |
Class R6 | 88,642,693 | 846,259,035 | 158,459,210 | 1,522,217,879 |
Administrator Class | 177,949 | 1,693,573 | 543,811 | 5,227,119 |
Institutional Class | 65,339,432 | 623,543,205 | 92,746,825 | 890,877,143 |
| 1,569,019,875 | 2,538,175,871 | |||
| Reinvestment of distributions | ||||
Class A | 87,879 | 835,057 | 141,373 | 1,357,877 |
Class A2 | 13,879 | 131,851 | 16,269 | 156,288 |
Class C | 12 | 110 | 18 | 167 |
Class R6 | 26,441 | 253,024 | 19,480 | 187,146 |
Administrator Class | 3,673 | 34,931 | 7,113 | 68,323 |
Institutional Class | 346,770 | 3,303,797 | 497,683 | 4,781,327 |
| 4,558,770 | 6,551,128 | |||
| Payment for shares redeemed | ||||
Class A | (10,322,156) | (98,496,147) | (11,426,668) | (109,720,519) |
Class A2 | (2,275,348) | (21,707,756) | (2,940,369) | (28,246,076) |
Class C | (114,010) | (1,077,939) | (197,232) | (1,866,537) |
Class R6 | (125,369,945) | (1,197,296,289) | (136,889,668) | (1,315,002,785) |
Administrator Class | (602,756) | (5,745,921) | (876,603) | (8,422,649) |
Institutional Class | (69,550,721) | (664,217,591) | (83,148,500) | (798,973,174) |
| (1,988,541,643) | (2,262,231,740) | |||
Net increase (decrease) in net assets resulting from capital share transactions | (414,962,998) | 282,495,259 | ||
Total increase (decrease) in net assets | (445,931,358) | 287,420,425 | ||
| Net assets | ||||
Beginning of period | 2,192,882,770 | 1,905,462,345 | ||
End of period | $ 1,746,951,412 | $ 2,192,882,770 | ||
| Year ended June 30 | |||||
| Class A | 2022 | 2021 | 2020 | 2019 | 2018 |
Net asset value, beginning of period | $9.61 | $9.59 | $9.60 | $9.57 | $9.57 |
Net investment income | 0.03 | 0.04 | 0.12 | 0.12 1 | 0.08 |
Net realized and unrealized gains (losses) on investments | (0.16) | 0.02 | (0.01) | 0.03 | 0.00 2 |
Total from investment operations | (0.13) | 0.06 | 0.11 | 0.15 | 0.08 |
| Distributions to shareholders from | |||||
Net investment income | (0.03) | (0.04) | (0.12) | (0.12) | (0.08) |
Net asset value, end of period | $9.45 | $9.61 | $9.59 | $9.60 | $9.57 |
Total return3 | (1.38)% | 0.62% | 1.13% | 1.63% | 0.88% |
| Ratios to average net assets (annualized) | |||||
Gross expenses | 0.66% | 0.66% | 0.77% | 0.77% | 0.77% |
Net expenses | 0.50% | 0.50% | 0.65% | 0.67% | 0.67% |
Net investment income | 0.29% | 0.42% | 1.21% | 1.28% | 0.86% |
| Supplemental data | |||||
Portfolio turnover rate | 46% | 30% | 55% | 55% | 50% |
Net assets, end of period (000s omitted) | $291,008 | $317,609 | $376,203 | $444,581 | $702,570 |
| 1 | Calculated based upon average shares outstanding |
| 2 | Amount is less than $0.005. |
| 3 | Total return calculations do not include any sales charges. |
| Year ended June 30 | |||
| Class A2 | 2022 | 2021 | 2020 1 |
Net asset value, beginning of period | $9.61 | $9.59 | $9.58 |
Net investment income | 0.03 | 0.04 | 0.01 |
Net realized and unrealized gains (losses) on investments | (0.16) | 0.02 | 0.01 |
Total from investment operations | (0.13) | 0.06 | 0.02 |
| Distributions to shareholders from | |||
Net investment income | (0.03) | (0.04) | (0.01) |
Net asset value, end of period | $9.45 | $9.61 | $9.59 |
Total return2 | (1.36)% | 0.62% | 0.18% |
| Ratios to average net assets (annualized) | |||
Gross expenses | 0.64% | 0.66% | 0.65% |
Net expenses | 0.48% | 0.50% | 0.50% |
Net investment income | 0.29% | 0.40% | 0.88% |
| Supplemental data | |||
Portfolio turnover rate | 46% | 30% | 55% |
Net assets, end of period (000s omitted) | $39,575 | $42,354 | $25 |
| 1 | For the period from May 29, 2020 (commencement of class operations) to June 30, 2020 |
| 2 | Returns for periods of less than one year are not annualized. |
| Year ended June 30 | |||||
| Class C | 2022 | 2021 | 2020 | 2019 | 2018 |
Net asset value, beginning of period | $9.48 | $9.41 | $9.43 | $9.40 | $9.40 |
Net investment income | 0.00 1,2 | 0.00 1,2 | 0.04 1 | 0.05 1 | 0.01 1 |
Payment from affiliate | 0.00 | 0.07 | 0.00 | 0.00 | 0.00 |
Net realized and unrealized gains (losses) on investments | (0.16) | 0.00 | (0.02) | 0.03 | 0.00 2 |
Total from investment operations | (0.16) | 0.07 | 0.02 | 0.08 | 0.01 |
| Distributions to shareholders from | |||||
Net investment income | (0.00) 2 | (0.00) 2 | (0.04) | (0.05) | (0.01) |
Net asset value, end of period | $9.32 | $9.48 | $9.41 | $9.43 | $9.40 |
Total return3 | (1.67)% | 0.76% 4 | 0.26% | 0.87% | 0.16% |
| Ratios to average net assets (annualized) | |||||
Gross expenses | 1.40% | 1.41% | 1.51% | 1.52% | 1.52% |
Net expenses | 0.81% * | 0.92% * | 1.41% | 1.42% | 1.42% |
Net investment income | 0.02% | 0.02% | 0.47% | 0.54% | 0.11% |
| Supplemental data | |||||
Portfolio turnover rate | 46% | 30% | 55% | 55% | 50% |
Net assets, end of period (000s omitted) | $2,448 | $1,659 | $2,925 | $10,135 | $17,154 |
| * | Ratio includes class-level expenses which were voluntarily waived by the investment manager. Without this voluntary waiver, the net expense ratio would be increased by the following amounts: |
| Year ended June 30, 2022 | 0.44% |
| Year ended June 30, 2021 | 0.33% |
| 1 | Calculated based upon average shares outstanding |
| 2 | Amount is less than $0.005. |
| 3 | Total return calculations do not include any sales charges. |
| 4 | During the year ended June 30, 2021, the Fund received a payment from an affiliate that had an impact of 0.73% on total return. See Note 4 in the Notes to Financial Statements for additional information. |
| Year ended June 30 | ||||
| Class R6 | 2022 | 2021 | 2020 | 2019 1 |
Net asset value, beginning of period | $9.61 | $9.59 | $9.60 | $9.58 |
Net investment income | 0.06 | 0.07 | 0.15 | 0.15 2 |
Net realized and unrealized gains (losses) on investments | (0.16) | 0.02 | (0.01) | 0.02 |
Total from investment operations | (0.10) | 0.09 | 0.14 | 0.17 |
| Distributions to shareholders from | ||||
Net investment income | (0.06) | (0.07) | (0.15) | (0.15) |
Net asset value, end of period | $9.45 | $9.61 | $9.59 | $9.60 |
Total return3 | (1.09)% | 0.92% | 1.47% | 1.76% |
| Ratios to average net assets (annualized) | ||||
Gross expenses | 0.28% | 0.28% | 0.38% | 0.39% |
Net expenses | 0.20% | 0.20% | 0.31% | 0.32% |
Net investment income | 0.56% | 0.71% | 1.54% | 1.73% |
| Supplemental data | ||||
Portfolio turnover rate | 46% | 30% | 55% | 55% |
Net assets, end of period (000s omitted) | $668,633 | $1,032,413 | $822,986 | $770,634 |
| 1 | For the period from July 31, 2018 (commencement of class operations) to June 30, 2019 |
| 2 | Calculated based upon average shares outstanding |
| 3 | Returns for periods of less than one year are not annualized. |
| Year ended June 30 | |||||
| Administrator Class | 2022 | 2021 | 2020 | 2019 | 2018 |
Net asset value, beginning of period | $9.61 | $9.59 | $9.60 | $9.57 | $9.57 |
Net investment income | 0.03 1 | 0.04 | 0.12 1 | 0.13 1 | 0.08 1 |
Net realized and unrealized gains (losses) on investments | (0.16) | 0.02 | (0.01) | 0.03 | 0.01 |
Total from investment operations | (0.13) | 0.06 | 0.11 | 0.16 | 0.09 |
| Distributions to shareholders from | |||||
Net investment income | (0.03) | (0.04) | (0.12) | (0.13) | (0.09) |
Net asset value, end of period | $9.45 | $9.61 | $9.59 | $9.60 | $9.57 |
Total return | (1.39)% | 0.62% | 1.19% | 1.70% | 0.95% |
| Ratios to average net assets (annualized) | |||||
Gross expenses | 0.60% | 0.60% | 0.70% | 0.70% | 0.70% |
Net expenses | 0.50% | 0.50% | 0.59% | 0.60% | 0.60% |
Net investment income | 0.27% | 0.42% | 1.28% | 1.34% | 0.82% |
| Supplemental data | |||||
Portfolio turnover rate | 46% | 30% | 55% | 55% | 50% |
Net assets, end of period (000s omitted) | $10,929 | $15,157 | $18,243 | $25,649 | $53,746 |
| 1 | Calculated based upon average shares outstanding |
| Year ended June 30 | |||||
| Institutional Class | 2022 | 2021 | 2020 | 2019 | 2018 |
Net asset value, beginning of period | $9.61 | $9.59 | $9.60 | $9.57 | $9.58 |
Net investment income | 0.05 | 0.06 | 0.14 | 0.15 1 | 0.11 |
Net realized and unrealized gains (losses) on investments | (0.16) | 0.02 | 0.00 | 0.03 | (0.01) |
Total from investment operations | (0.11) | 0.08 | 0.14 | 0.18 | 0.10 |
| Distributions to shareholders from | |||||
Net investment income | (0.05) | (0.06) | (0.15) | (0.15) | (0.11) |
Net asset value, end of period | $9.45 | $9.61 | $9.59 | $9.60 | $9.57 |
Total return | (1.14)% | 0.87% | 1.42% | 1.93% | 1.07% |
| Ratios to average net assets (annualized) | |||||
Gross expenses | 0.33% | 0.33% | 0.43% | 0.44% | 0.44% |
Net expenses | 0.25% | 0.25% | 0.36% | 0.37% | 0.37% |
Net investment income | 0.52% | 0.66% | 1.50% | 1.56% | 1.16% |
| Supplemental data | |||||
Portfolio turnover rate | 46% | 30% | 55% | 55% | 50% |
Net assets, end of period (000s omitted) | $734,360 | $783,690 | $685,081 | $643,762 | $2,141,197 |
| 1 | Calculated based upon average shares outstanding |
| Gross unrealized gains | $ 922,083 |
| Gross unrealized losses | (19,248,290) |
| Net unrealized losses | $(18,326,207) |
| ■ | Level 1 – quoted prices in active markets for identical securities |
| ■ | Level 2 – other significant observable inputs (including quoted prices for similar securities, interest rates, prepayment speeds, credit risk, etc.) |
| ■ | Level 3 – significant unobservable inputs (including the Fund’s own assumptions in determining the fair value of investments) |
| Quoted prices (Level 1) | Other significant observable inputs (Level 2) | Significant unobservable inputs (Level 3) | Total | |
| Assets | ||||
| Investments in: | ||||
| Closed end municipal bond fund obligations | $ 0 | $ 50,200,000 | $0 | $ 50,200,000 |
| Municipal obligations | 0 | 1,676,862,761 | 0 | 1,676,862,761 |
| Short-term investments | ||||
| Investment companies | 34,898,697 | 0 | 0 | 34,898,697 |
| Total assets | $34,898,697 | $1,727,062,761 | $0 | $1,761,961,458 |
| Average daily net assets | Management fee |
| First $1 billion | 0.250% |
| Next $4 billion | 0.225 |
| Next $5 billion | 0.190 |
| Over $10 billion | 0.180 |
| Class-level administration fee | |
| Class A | 0.16% |
| Class A2 | 0.16 |
| Class C | 0.16 |
| Class R6 | 0.03 |
| Administrator Class | 0.10 |
| Institutional Class | 0.08 |
| Expense ratio caps | |
| Class A | 0.50% |
| Class A2 | 0.40 |
| Class C | 1.25 |
| Class R6 | 0.20 |
| Administrator Class | 0.50 |
| Institutional Class | 0.25 |
| Undistributed tax-exempt income | Unrealized losses | Capital loss carryforward |
| $211,446 | $(18,326,207) | $(30,436,818) |
Allspring Funds Trust:

| Name and year of birth | Position held and length of service* | Principal occupations during past five years or longer | Current other public company or investment company directorships |
| William R. Ebsworth (Born 1957) | Trustee, since 2015 | Retired. From 1984 to 2013, equities analyst, portfolio manager, research director and chief investment officer at Fidelity Management and Research Company in Boston, Tokyo, and Hong Kong, and retired in 2013 as Chief Investment Officer of Fidelity Strategic Advisers, Inc. where he led a team of investment professionals managing client assets. Prior thereto, Board member of Hong Kong Securities Clearing Co., Hong Kong Options Clearing Corp., the Thailand International Fund, Ltd., Fidelity Investments Life Insurance Company, and Empire Fidelity Investments Life Insurance Company. Audit Committee Chair and Investment Committee Chair of the Vincent Memorial Hospital Endowment (non-profit organization). Mr. Ebsworth is a CFA® charterholder. | N/A |
| Jane A. Freeman (Born 1953) | Trustee, since 2015; Chair Liaison, since 2018 | Retired. From 2012 to 2014 and 1999 to 2008, Chief Financial Officer of Scientific Learning Corporation. From 2008 to 2012, Ms. Freeman provided consulting services related to strategic business projects. Prior to 1999, Portfolio Manager at Rockefeller & Co. and Scudder, Stevens & Clark. Board member of the Harding Loevner Funds from 1996 to 2014, serving as both Lead Independent Director and chair of the Audit Committee. Board member of the Russell Exchange Traded Funds Trust from 2011 to 2012 and the chair of the Audit Committee. Ms. Freeman is also an inactive Chartered Financial Analyst. | N/A |
| Isaiah Harris, Jr. (Born 1952) | Trustee, since 2009; Audit Committee Chair, since 2019 | Retired. Chairman of the Board of CIGNA Corporation from 2009 to 2021, and Director from 2005 to 2008. From 2003 to 2011, Director of Deluxe Corporation. Prior thereto, President and CEO of BellSouth Advertising and Publishing Corp. from 2005 to 2007, President and CEO of BellSouth Enterprises from 2004 to 2005 and President of BellSouth Consumer Services from 2000 to 2003. Emeritus member of the Iowa State University Foundation Board of Governors. Emeritus Member of the Advisory Board of Iowa State University School of Business. Advisory Board Member, Palm Harbor Academy (private school). Advisory Board Member, Fellowship of Christian Athletes. Mr. Harris is a certified public accountant (inactive status). | N/A |
| David F. Larcker (Born 1950) | Trustee, since 2009 | James Irvin Miller Professor of Accounting at the Graduate School of Business (Emeritus), Stanford University, Director of the Corporate Governance Research Initiative and Senior Faculty of The Rock Center for Corporate Governance since 2006. From 2005 to 2008, Professor of Accounting at the Graduate School of Business, Stanford University. Prior thereto, Ernst & Young Professor of Accounting at The Wharton School, University of Pennsylvania from 1985 to 2005. | N/A |
| Name and year of birth | Position held and length of service* | Principal occupations during past five years or longer | Current other public company or investment company directorships |
| Olivia S. Mitchell (Born 1953) | Trustee, since 2006; Nominating and Governance Committee Chair, since 2018 | International Foundation of Employee Benefit Plans Professor since 1993, Wharton School of the University of Pennsylvania. Director of Wharton’s Pension Research Council and Boettner Center on Pensions & Retirement Research, and Research Associate at the National Bureau of Economic Research. Previously taught at Cornell University from 1978 to 1993. | N/A |
| Timothy J. Penny (Born 1951) | Trustee, since 1996; Chair, since 2018 | President and Chief Executive Officer of Southern Minnesota Initiative Foundation, a non-profit organization, since 2007. Member of the Board of Trustees of NorthStar Education Finance, Inc., a non-profit organization, since 2007. | N/A |
| James G. Polisson (Born 1959) | Trustee, since 2018 | Retired. Chief Marketing Officer, Source (ETF) UK Services, Ltd, from 2015 to 2017. From 2012 to 2015, Principal of The Polisson Group, LLC, a management consulting, corporate advisory and principal investing company. Chief Executive Officer and Managing Director at Russell Investments, Global Exchange Traded Funds from 2010 to 2012. Managing Director of Barclays Global Investors from 1998 to 2010 and Global Chief Marketing Officer for iShares and Barclays Global Investors from 2000 to 2010. Trustee of the San Francisco Mechanics’ Institute, a non-profit organization, from 2013 to 2015. Board member of the Russell Exchange Traded Fund Trust from 2011 to 2012. Director of Barclays Global Investors Holdings Deutschland GmbH from 2006 to 2009. Mr. Polisson is an attorney and has a retired status with the Massachusetts and District of Columbia Bar Associations. | N/A |
| Pamela Wheelock (Born 1959) | Trustee, since January 2020; previously Trustee from January 2018 to July 2019 | Board member of the Destination Medical Center Economic Development Agency, Rochester, Minnesota since 2019. Interim President of the McKnight Foundation from January to September 2020. McKnight Foundation Consultant, November 2020 to February 2021. Acting Commissioner, Minnesota Department of Human Services, July 2019 through September 2019. Consultant (part-time), Minnesota Department of Human Services, October 2019 through December 2019. Chief Operating Officer, Twin Cities Habitat for Humanity from 2017 to 2019. Vice President of University Services, University of Minnesota from 2012 to 2016. Prior thereto, on the Board of Directors, Governance Committee and Finance Committee for the Minnesota Philanthropy Partners (Saint Paul Foundation) from 2012 to 2018, Interim Chief Executive Officer of Blue Cross Blue Shield of Minnesota from 2011 to 2012, Chairman of the Board from 2009 to 2012 and Board Director from 2003 to 2015. Vice President, Leadership and Community Engagement, Bush Foundation, Saint Paul, Minnesota (a private foundation) from 2009 to 2011. Executive Vice President and Chief Financial Officer, Minnesota Sports and Entertainment from 2004 to 2009 and Senior Vice President from 2002 to 2004. Executive Vice President of the Minnesota Wild Foundation from 2004 to 2008. Commissioner of Finance, State of Minnesota, from 1999 to 2002. Currently Board Chair of the Minnesota Wild Foundation since 2010. | N/A |
| Name and year of birth | Position held and length of service | Principal occupations during past five years or longer |
| Andrew Owen (Born 1960) | President, since 2017 | President, Chief Executive Officer and Director of Allspring Funds Management, LLC since 2017 and co-president of Galliard Capital Management, LLC, an affiliate of Allspring Funds Management, LLC, since 2019. Prior thereto, Head of Affiliated Managers, Allspring Global Investments, from 2014 to 2019 and Executive Vice President responsible for marketing, investments and product development for Allspring Funds Management, LLC, from 2009 to 2014. In addition, Mr. Owen was an Executive Vice President of Wells Fargo & Company from 2014 to 2021. |
| Jeremy DePalma (Born 1974) | Treasurer, since 2012 (for certain funds in the Fund Complex); since 2021 (for the remaining funds in the Fund Complex) | Senior Vice President of Allspring Funds Management, LLC since 2009. Senior Vice President of Evergreen Investment Management Company, LLC from 2008 to 2010 and head of the Fund Reporting and Control Team within Fund Administration from 2005 to 2010. |
| Kate McKinley (Born 1977) | Chief Legal Officer, since 2021 | Chief Legal Officer of Allspring Global Investments since 2021. Prior thereto, held various roles at State Street Global Advisors beginning in 2010, including serving as Senior Vice President and General Counsel from 2019 to 2021, and Chief Operating Officer of the Institutional Client Group from 2016 - 2019. Prior to working at State Street Global Advisors served as Assistant General Counsel for Bank of America Corporation from 2005 to 2010 and as an Associate at WilmerHale from 2002 to 2005. |
| Christopher Baker (Born 1976) | Chief Compliance Officer, since 2022 | Global Chief Compliance Officer for Allspring Global Investments since 2022. Prior thereto, Chief Compliance Officer for State Street Global Advisors from 2018 to 2021. Senior Compliance Officer for the State Street divisions of Alternative Investment Solutions, Sector Solutions, and Global Marketing from 2015 to 2018. From 2010 to 2015 Vice President, Global Head of Investment and Marketing Compliance for State Street Global Advisors. |
| Matthew Prasse (Born 1983) | Secretary, since 2021 | Senior Counsel of the Allspring Legal Department since 2021. Senior Counsel of the Wells Fargo Legal Department from 2018 to 2021. Previously, Counsel for Barings LLC from 2015 to 2018. Prior to joining Barings, Associate at Morgan, Lewis & Bockius LLP from 2008 to 2015. |
P.O. Box 219967
Kansas City, MO 64121-9967

1-800-222-8222 or visit the Fund's website at allspringglobal.com. Read the prospectus carefully before you invest or send money.
A258/AR258 06-22

Wisconsin Tax-Free Fund
| 2 | |
| 6 | |
| 11 | |
| 12 | |
| Financial statements | |
| 20 | |
| 21 | |
| 22 | |
| 23 | |
| 26 | |
| 32 | |
| 33 |

| 1 | The S&P 500 Index consists of 500 stocks chosen for market size, liquidity, and industry group representation. It is a market-value-weighted index with each stock's weight in the index proportionate to its market value. You cannot invest directly in an index. |
| 2 | The Morgan Stanley Capital International (MSCI) All Country World Index (ACWI) ex USA Index (Net) is a free-float-adjusted market-capitalization-weighted index that is designed to measure the equity market performance of developed and emerging markets, excluding the U.S. Source: MSCI. MSCI makes no express or implied warranties or representations and shall have no liability whatsoever with respect to any MSCI data contained herein. The MSCI data may not be further redistributed or used as a basis for other indexes or any securities or financial products. This report is not approved, reviewed, or produced by MSCI. You cannot invest directly in an index. |
| 3 | The MSCI Emerging Markets (EM) Index (Net) (USD) is a free-float-adjusted market-capitalization-weighted index that is designed to measure equity market performance of emerging markets. You cannot invest directly in an index. |
| 4 | The Bloomberg U.S. Aggregate Bond Index is a broad-based benchmark that measures the investment-grade, U.S.-dollar-denominated, fixed-rate taxable bond market, including Treasuries, government-related and corporate securities, mortgage-backed securities (agency fixed-rate and hybrid adjustable-rate mortgage pass-throughs), asset-backed securities, and commercial mortgage-backed securities. You cannot invest directly in an index. |
| 5 | The Bloomberg Global Aggregate ex-USD Index (unhedged) is an unmanaged index that provides a broad-based measure of the global investment-grade fixed-income markets excluding the U.S.-dollar-denominated debt market. You cannot invest directly in an index. |
| 6 | The Bloomberg Municipal Bond Index is an unmanaged index composed of long-term tax-exempt bonds with a minimum credit rating of Baa. You cannot invest directly in an index. |
| 7 | The ICE BofA U.S. High Yield Index is a market-capitalization-weighted index of domestic and Yankee high-yield bonds. The index tracks the performance of high-yield securities traded in the U.S. bond market. You cannot invest directly in an index. Copyright 2022. ICE Data Indices, LLC. All rights reserved. |
| 1 | The Consumer Price Index (CPI) is a measure of the average change over time in the prices paid by urban consumers for a market basket of consumer goods and services. You cannot invest directly in an index. |
| 2 | The MSCI ACWI (Net) is a free-float-adjusted market-capitalization-weighted index that is designed to measure the equity market performance of developed and emerging markets. You cannot invest directly in an index. |

President
Allspring Funds
| Investment objective | The Fund seeks current income exempt from federal income tax and Wisconsin individual income tax. |
| Manager | Allspring Funds Management, LLC |
| Subadviser | Allspring Global Investments, LLC |
| Portfolio managers | Bruce R. Johns, Kerry Laurin, Thomas Stoeckmann |
| Average annual total returns (%) as of June 30, 2022 | |||||||||||
| Including sales charge | Excluding sales charge | Expense ratios1 (%) | |||||||||
| Inception date | 1 year | 5 year | 10 year | 1 year | 5 year | 10 year | Gross | Net 2 | |||
| Class A (WWTFX) | 3-31-2008 | -11.11 | 0.34 | 1.38 | -6.93 | 1.27 | 1.85 | 0.92 | 0.70 | ||
| Class C (WWTCX) | 12-26-2002 | -8.64 | 0.50 | 1.24 | -7.64 | 0.50 | 1.24 | 1.67 | 1.45 | ||
| Institutional Class (WWTIX)3 | 10-31-2016 | – | – | – | -6.78 | 1.44 | 1.95 | 0.59 | 0.52 | ||
| Bloomberg Municipal Bond Index4 | – | – | – | – | -8.57 | 1.51 | 2.38 | – | – | ||
| Bloomberg Wisconsin Municipal Bond Index5 | – | – | – | – | -8.09 | 1.25 | 2.14 | – | – | ||
| 1 | Reflects the expense ratios as stated in the most recent prospectuses. The expense ratios shown are subject to change and may differ from the annualized expense ratios shown in the financial highlights of this report. |
| 2 | The manager has contractually committed through October 31, 2022, to waive fees and/or reimburse expenses to the extent necessary to cap total annual fund operating expenses after fee waivers at 0.70% for Class A, 1.45% for Class C, and 0.52% for Institutional Class. Brokerage commissions, stamp duty fees, interest, taxes, acquired fund fees and expenses (if any), and extraordinary expenses are excluded from the expense caps. Prior to or after the commitment expiration date, the caps may be increased or the commitment to maintain the caps may be terminated only with the approval of the Board of Trustees. Without these caps, the Fund’s returns would have been lower. The expense ratio paid by an investor is the net expense ratio (the total annual fund operating expenses after fee waivers) as stated in the prospectuses. |
| 3 | Historical performance shown for the Institutional Class shares prior to their inception reflects the performance of the Class A shares, and includes the higher expenses applicable to the Class A shares. If these expenses had been included, returns for the Institutional Class shares would be higher. |
| 4 | The Bloomberg Municipal Bond Index is an unmanaged index composed of long-term tax-exempt bonds with a minimum credit rating of Baa. You cannot invest directly in an index. |
| 5 | The Bloomberg Wisconsin Municipal Bond Index is the Wisconsin component of the Bloomberg Municipal Bond Index. You cannot invest directly in an index. |

| 1 | The chart compares the performance of Class A shares for the most recent ten years with the Bloomberg Municipal Bond Index and Bloomberg Wisconsin Municipal Bond Index. The chart assumes a hypothetical investment of $10,000 in Class A shares and reflects all operating expenses and assumes the maximum initial sales charge of 4.50%. |
| ■ | The Fund outperformed both the Bloomberg Municipal Bond Index and the Bloomberg Wisconsin Municipal Bond Index for the 12 months that ended June 30, 2022. |
| ■ | The Fund’s conservative duration positioning and yield-curve positioning contributed strongly to performance as rates increased across the entire yield curve during the period in response to the Federal Reserve’s (Fed) monetary tightening policy. We were underweight longer-term bonds, which trailed the overall fixed income market, and strongly overweight short-term bonds, which outperformed the market. |
| ■ | Individual bond selection and sector allocation contributed to performance. While we were underweight general obligation (GO) bonds, which outpaced the overall market, and overweight revenue bonds, which lagged, our security selection within the revenue bond sector helped offset underperformance. The Fund was overweight both housing and hospital bonds, which performed poorly, but security selection offset the disappointing performance. The Fund was significantly underweight the transportation sector, which trailed higher-quality investment-grade bonds. |
| ■ | Credit positioning detracted from performance as we were overweight lower-quality investment-grade bonds, which underperformed relative to higher-quality investment-grade bonds. We were underweight higher-quality investment-grade bonds. |
| Credit quality as of June 30, 20221 |

| 1 | The credit quality distribution of portfolio holdings reflected in the chart is based on ratings from Standard & Poor’s, Moody’s Investors Service, and/or Fitch Ratings Ltd. Credit quality ratings apply to the underlying holdings of the Fund and not to the Fund itself. The percentages of the portfolio with the ratings depicted in the chart are calculated based on the market value of fixed income securities held by the Fund. If a security was rated by all three rating agencies, the middle rating was utilized. If rated by two of the three rating agencies, the lower rating was utilized, and if rated by one of the rating agencies, that rating was utilized. Standard & Poor’s rates the creditworthiness of bonds, ranging from AAA (highest) to D (lowest). Ratings from A to CCC may be modified by the addition of a plus (+) or minus (-) sign to show relative standing within the rating categories. Standard & Poor’s rates the creditworthiness of short-term notes from SP-1 (highest) to SP-3 (lowest). Moody’s rates the creditworthiness of bonds, ranging from Aaa (highest) to C (lowest). Ratings Aa to B may be modified by the addition of a number 1 (highest) to 3 (lowest) to show relative standing within the ratings categories. Moody’s rates the creditworthiness of short-term U.S. tax-exempt municipal securities from MIG 1/VMIG 1 (highest) to SG (lowest). Fitch rates the creditworthiness of bonds, ranging from AAA (highest) to D (lowest). Credit quality distribution is subject to change and may have changed since the date specified. |
| Effective maturity distribution as of June 30, 20221 |

| 1 | Figures represent the percentage of the Fund's long-term investments. These amounts are subject to change and may have changed since the date specified. |
| Beginning account value 1-1-2022 | Ending account value 6-30-2022 | Expenses paid during the period1 | Annualized net expense ratio | |
| Class A | ||||
| Actual | $1,000.00 | $ 927.00 | $3.25 | 0.68% |
| Hypothetical (5% return before expenses) | $1,000.00 | $1,021.42 | $3.41 | 0.68% |
| Class C | ||||
| Actual | $1,000.00 | $ 923.46 | $6.92 | 1.45% |
| Hypothetical (5% return before expenses) | $1,000.00 | $1,017.60 | $7.25 | 1.45% |
| Institutional Class | ||||
| Actual | $1,000.00 | $ 927.76 | $2.49 | 0.52% |
| Hypothetical (5% return before expenses) | $1,000.00 | $1,022.22 | $2.61 | 0.52% |
| Interest rate | Maturity date | Principal | Value | ||
| Municipal obligations: 102.94% | |||||
| Alabama: 1.36% | |||||
| Utilities revenue: 1.36% | |||||
| Black Belt Energy Gas District Gas Supply Project #7 Series C-1 | 4.00% | 12-1-2025 | $1,000,000 | $ 1,017,999 | |
| Black Belt Energy Gas District Series 2021C-1 | 4.00 | 10-1-2052 | 1,000,000 | 1,012,106 | |
| 2,030,105 | |||||
| Guam: 6.35% | |||||
| Airport revenue: 3.51% | |||||
| Guam International Airport Authority Revenue A.B. Won Pat International Airport Series 2013C (AGM Insured) | 6.00 | 10-1-2034 | 365,000 | 382,859 | |
| Guam International Airport Authority Revenue A.B. Won Pat International Airport Series C | 6.38 | 10-1-2043 | 1,670,000 | 1,759,333 | |
| Guam International Airport Authority Revenue Prerefunded Bond AMT General Series C (AGM Insured) | 6.13 | 10-1-2043 | 270,000 | 280,702 | |
| Guam International Airport Authority Revenue Prerefunded Bond AMT General Series C (AGM Insured) | 6.13 | 10-1-2043 | 1,230,000 | 1,292,053 | |
| Guam Port Authority AMT Series A | 5.00 | 7-1-2048 | 1,000,000 | 1,054,378 | |
| Guam Port Authority AMT Series B | 5.00 | 7-1-2034 | 445,000 | 472,669 | |
| 5,241,994 | |||||
| Miscellaneous revenue: 0.94% | |||||
| Guam Education Financing Foundation Refunding Bond Certificate of Participation Series 2016A ## | 5.00 | 10-1-2022 | 1,400,000 | 1,406,994 | |
| Tax revenue: 0.99% | |||||
| Guam Government Business Privilege Tax Revenue Refunding Bonds Series F | 4.00 | 1-1-2042 | 500,000 | 441,147 | |
| Guam Government Hotel Occupancy Refunding Bond Series A | 5.00 | 11-1-2035 | 1,000,000 | 1,036,250 | |
| 1,477,397 | |||||
| Utilities revenue: 0.35% | |||||
| Guam Power Authority Series A %% | 5.00 | 10-1-2026 | 500,000 | 531,110 | |
| Water & sewer revenue: 0.56% | |||||
| Guam Government Waterworks Authority Series A | 5.00 | 1-1-2050 | 300,000 | 312,729 | |
| Guam Government Waterworks Authority Water and Wastewater Refunding Bond | 5.00 | 7-1-2034 | 500,000 | 524,985 | |
| 837,714 | |||||
| 9,495,209 | |||||
| Illinois: 2.80% | |||||
| GO revenue: 1.99% | |||||
| Chicago IL CAB City Colleges (NPFGC Insured) ¤ | 0.00 | 1-1-2027 | 1,000,000 | 846,859 | |
| Chicago IL Park District Special Recreation Activity Series E | 5.00 | 11-15-2027 | 1,000,000 | 1,076,894 | |
| Illinois Series A | 5.00 | 3-1-2024 | 500,000 | 518,065 | |
| Illinois Series A | 5.25 | 3-1-2037 | 500,000 | 537,035 | |
| 2,978,853 |
| Interest rate | Maturity date | Principal | Value | ||
| Miscellaneous revenue: 0.81% | |||||
| Chicago IL Special Assessment Improvement Bonds Refunding Series 2022 Lakeshore East Project | 2.69% | 12-1-2026 | $ 305,000 | $ 284,142 | |
| Illinois Series 2013 | 5.50 | 7-1-2026 | 250,000 | 256,470 | |
| Illinois Series C | 5.00 | 11-1-2029 | 630,000 | 670,643 | |
| 1,211,255 | |||||
| 4,190,108 | |||||
| New Jersey: 1.17% | |||||
| Tax revenue: 0.26% | |||||
| New Jersey COVID-19 Emergency Series A | 5.00 | 6-1-2027 | 350,000 | 385,898 | |
| Transportation revenue: 0.91% | |||||
| New Jersey TTFA CAB Series A ¤ | 0.00 | 12-15-2031 | 2,000,000 | 1,356,898 | |
| 1,742,796 | |||||
| New York: 0.97% | |||||
| Education revenue: 0.97% | |||||
| Hempstead NY Local Development Corporation The Academy Charter School Project Series A | 4.45 | 2-1-2041 | 500,000 | 411,459 | |
| Hempstead NY Local Development Corporation The Academy Charter School Project Series A | 6.24 | 2-1-2047 | 1,000,000 | 1,041,379 | |
| 1,452,838 | |||||
| Pennsylvania: 3.11% | |||||
| Education revenue: 0.39% | |||||
| Lehigh County PA General Purpose Authority Charter School Revenue Bonds Series 2022 | 4.00 | 6-1-2032 | 600,000 | 588,189 | |
| Health revenue: 1.41% | |||||
| Montgomery County PA Higher Education and Health Authority Thomas Jefferson University Revenue Bonds Series 2022B | 5.00 | 5-1-2052 | 2,000,000 | 2,101,375 | |
| Housing revenue: 1.31% | |||||
| Pennsylvania Housing Finance Agency MFHR Sherman Hills Series 2022 (Department of Housing and Urban Development Insured) | 1.25 | 2-1-2025 | 2,000,000 | 1,956,723 | |
| 4,646,287 | |||||
| Puerto Rico: 1.31% | |||||
| Health revenue: 1.31% | |||||
| Puerto Rico Industrial Tourist Educational Medical & Environmental Control Facilities Financing Authority Hospital Auxilio Mutuo Obligated Group Project | 5.00 | 7-1-2031 | 435,000 | 481,930 | |
| Puerto Rico Industrial Tourist Educational Medical & Environmental Control Facilities Financing Authority Hospital Auxilio Mutuo Obligated Group Project 2021 | 5.00 | 7-1-2026 | 205,000 | 219,681 |
| Interest rate | Maturity date | Principal | Value | ||
| Health revenue (continued) | |||||
| Puerto Rico Industrial Tourist Educational Medical & Environmental Control Facilities Financing Authority Hospital Auxilio Mutuo Obligated Group Project 2021 | 5.00% | 7-1-2032 | $ 925,000 | $ 1,016,268 | |
| Puerto Rico Industrial Tourist Educational Medical & Environmental Control Facilities Financing Authority Hospital Auxilio Mutuo Obligated Group Project 2021 | 5.00 | 7-1-2034 | 220,000 | 239,448 | |
| 1,957,327 | |||||
| South Carolina: 0.67% | |||||
| Utilities revenue: 0.67% | |||||
| South Carolina Statewide Public Service Authority Revenue Refunding Bond and Improvement Series A | 4.00 | 12-1-2033 | 1,000,000 | 1,000,061 | |
| Texas: 2.03% | |||||
| Education revenue: 0.70% | |||||
| Hale Center Texas Education Facilities Corporation Revenue Refunding Bond Wayland Baptist University Project Series 2022 | 5.00 | 3-1-2027 | 990,000 | 1,047,548 | |
| GO revenue: 1.33% | |||||
| Denton TX Independent School District School Building | 4.00 | 8-15-2048 | 2,000,000 | 1,993,262 | |
| 3,040,810 | |||||
| Virgin Islands: 0.09% | |||||
| Tax revenue: 0.09% | |||||
| Virgin Islands PFA Gross Receipts Taxes Loan Notes (AGM Insured) ## | 4.00 | 10-1-2022 | 140,000 | 140,572 | |
| Virginia: 1.34% | |||||
| Transportation revenue: 1.34% | |||||
| Virginia Small Business Financing Authority Revenue Bonds Series 2012 | 5.50 | 1-1-2042 | 2,000,000 | 2,000,000 | |
| Wisconsin: 81.74% | |||||
| Education revenue: 9.19% | |||||
| Milwaukee WI RDA Science Education Consortium Incorporated Project Series A | 6.25 | 8-1-2043 | 2,100,000 | 2,138,142 | |
| Platteville WI RDA University of Wisconsin Platteville Real Estate Foundation Incorporated ## | 5.00 | 7-1-2022 | 355,000 | 355,000 | |
| Platteville WI RDA University of Wisconsin Platteville Real Estate Foundation Incorporated | 5.00 | 7-1-2032 | 1,500,000 | 1,501,563 | |
| Platteville WI RDA University of Wisconsin Platteville Real Estate Foundation Incorporated | 5.00 | 7-1-2042 | 1,000,000 | 1,001,042 | |
| Wisconsin HEFA Milwaukee School Engineering Project (AGM Insured) | 2.00 | 4-1-2038 | 1,200,000 | 880,520 | |
| Wisconsin HEFA Milwaukee School Engineering Project (AGM Insured) | 2.13 | 4-1-2039 | 1,000,000 | 734,625 | |
| Wisconsin HEFA Milwaukee School Engineering Project (AGM Insured) | 2.13 | 4-1-2040 | 1,000,000 | 720,050 | |
| Wisconsin HEFA Milwaukee School Engineering Project (AGM Insured) | 2.25 | 4-1-2041 | 750,000 | 542,430 | |
| Wisconsin HEFA Milwaukee School Engineering Project (AGM Insured) | 2.25 | 4-1-2042 | 1,000,000 | 711,809 |
| Interest rate | Maturity date | Principal | Value | ||
| Education revenue (continued) | |||||
| Wisconsin HEFA Revenue Lawrence University | 4.00% | 3-15-2040 | $1,555,000 | $ 1,378,903 | |
| Wisconsin HEFA Revenue Lawrence University | 4.00 | 2-1-2045 | 1,685,000 | 1,624,505 | |
| Wisconsin HEFA The Medical College of Wisconsin Incorporated Series 2022 | 5.00 | 12-1-2041 | 2,000,000 | 2,151,323 | |
| 13,739,912 | |||||
| GO revenue: 1.18% | |||||
| Milwaukee WI Series B6 | 3.00 | 4-1-2024 | 570,000 | 578,640 | |
| Milwaukee WI Series B6 | 5.00 | 4-1-2023 | 580,000 | 594,301 | |
| Milwaukee WI Series B6 | 5.00 | 4-1-2025 | 550,000 | 588,492 | |
| 1,761,433 | |||||
| Health revenue: 20.33% | |||||
| PFA Wisconsin Healthcare Facilities Appalachian Regional Healthcare System Series A | 5.00 | 7-1-2037 | 275,000 | 290,241 | |
| PFA Wisconsin Healthcare Facilities Appalachian Regional Healthcare System Series A | 5.00 | 7-1-2038 | 375,000 | 394,305 | |
| Wisconsin HEFA Bellin Memorial Hospital Incorporated Refunding Revenue Bond Series 2015 | 3.38 | 12-1-2031 | 180,000 | 180,553 | |
| Wisconsin HEFA Bellin Memorial Hospital Incorporated Series 2015 | 3.13 | 12-1-2029 | 150,000 | 150,153 | |
| Wisconsin HEFA Bellin Memorial Hospital Incorporated Series A | 5.00 | 12-1-2027 | 175,000 | 191,916 | |
| Wisconsin HEFA Bellin Memorial Hospital Incorporated Series A | 5.00 | 12-1-2028 | 200,000 | 220,499 | |
| Wisconsin HEFA Bellin Memorial Hospital Incorporated Series A | 5.00 | 12-1-2029 | 150,000 | 165,549 | |
| Wisconsin HEFA Bellin Memorial Hospital Incorporated Series A | 5.00 | 12-1-2030 | 275,000 | 301,044 | |
| Wisconsin HEFA Beloit Health System Incorporated | 4.00 | 7-1-2036 | 3,000,000 | 2,992,540 | |
| Wisconsin HEFA Beloit Health System Incorporated | 5.00 | 7-1-2028 | 50,000 | 54,643 | |
| Wisconsin HEFA Beloit Health System Incorporated | 5.00 | 7-1-2029 | 1,270,000 | 1,398,173 | |
| Wisconsin HEFA Marshfield Clinic Health System | 3.00 | 2-15-2031 | 230,000 | 220,495 | |
| Wisconsin HEFA Marshfield Clinic Health System | 3.25 | 2-15-2032 | 185,000 | 179,551 | |
| Wisconsin HEFA Marshfield Clinic Health System | 4.00 | 2-15-2042 | 500,000 | 460,907 | |
| Wisconsin HEFA Marshfield Clinic Health System | 5.00 | 2-15-2047 | 3,385,000 | 3,478,928 | |
| Wisconsin HEFA Marshfield Clinic Health System Obligated Group Series C | 5.00 | 2-15-2027 | 400,000 | 432,275 | |
| Wisconsin HEFA Marshfield Clinic Health System Obligated Group Series C | 5.00 | 2-15-2028 | 650,000 | 699,008 | |
| Wisconsin HEFA Marshfield Clinic Health System Obligated Group Series C | 5.00 | 2-15-2029 | 500,000 | 535,301 | |
| Wisconsin HEFA Milwaukee School Engineering Project | 5.00 | 12-1-2025 | 135,000 | 144,832 | |
| Wisconsin HEFA Monroe Clinic Incorporated | 3.00 | 2-15-2035 | 520,000 | 530,732 | |
| Wisconsin HEFA Monroe Clinic Incorporated | 4.00 | 2-15-2031 | 900,000 | 945,994 | |
| Wisconsin HEFA Monroe Clinic Incorporated | 4.00 | 2-15-2033 | 550,000 | 578,107 | |
| Wisconsin HEFA Monroe Clinic Incorporated | 5.00 | 2-15-2028 | 900,000 | 973,432 | |
| Wisconsin HEFA Monroe Clinic Incorporated | 5.00 | 2-15-2029 | 575,000 | 621,915 | |
| Wisconsin HEFA Monroe Clinic Incorporated | 5.00 | 2-15-2030 | 340,000 | 367,741 | |
| Wisconsin HEFA Refunding Bond Bellin Memorial Hospital Incorporated | 4.00 | 12-1-2035 | 1,000,000 | 1,001,446 | |
| Wisconsin HEFA Refunding Bond Bellin Memorial Hospital Incorporated | 5.00 | 12-1-2025 | 1,500,000 | 1,567,480 | |
| Wisconsin HEFA Refunding Bond Bellin Memorial Hospital Incorporated | 5.00 | 12-1-2026 | 1,740,000 | 1,815,092 |
| Interest rate | Maturity date | Principal | Value | ||
| Health revenue (continued) | |||||
| Wisconsin HEFA Rogers Memorial Hospital Incorporated Series A | 5.00% | 7-1-2044 | $ 200,000 | $ 205,312 | |
| Wisconsin HEFA Rogers Memorial Hospital Incorporated Series A | 5.00 | 7-1-2049 | 250,000 | 255,869 | |
| Wisconsin HEFA Rogers Memorial Hospital Incorporated Series B | 5.00 | 7-1-2044 | 3,485,000 | 3,533,091 | |
| Wisconsin HEFA Saint John's Communities Incorporated Series 2015B | 5.00 | 9-15-2045 | 1,000,000 | 1,006,911 | |
| Wisconsin HEFA Saint John's Communities Incorporated Series 2022 %% | 4.00 | 9-15-2045 | 650,000 | 539,949 | |
| Wisconsin HEFA Saint John's Communities Incorporated Series B | 4.00 | 9-15-2045 | 475,000 | 402,658 | |
| Wisconsin HEFA Three Pillars Senior Living Communities Series 2021A ## | 4.00 | 8-15-2023 | 125,000 | 125,590 | |
| Wisconsin HEFA Three Pillars Senior Living Communities Series 2021A | 4.00 | 8-15-2024 | 125,000 | 125,599 | |
| Wisconsin HEFA Three Pillars Senior Living Communities Series 2021A | 4.00 | 8-15-2030 | 100,000 | 97,759 | |
| Wisconsin HEFA Three Pillars Senior Living Communities Series 2021A | 4.00 | 8-15-2031 | 75,000 | 72,875 | |
| Wisconsin HEFA Three Pillars Senior Living Communities Series 2021A | 4.00 | 8-15-2041 | 2,145,000 | 1,954,393 | |
| Wisconsin HEFA Three Pillars Senior Living Communities Series 2021A | 4.00 | 8-15-2046 | 850,000 | 746,809 | |
| Wisconsin HEFA Three Pillars Senior Living Communities Series 2021A | 4.00 | 8-15-2051 | 500,000 | 429,197 | |
| 30,388,864 | |||||
| Housing revenue: 17.24% | |||||
| Green Bay WI Housing Authority Housing Revenue Refunding Bond Student University Village Housing Incorporated | 2.00 | 4-1-2023 | 50,000 | 49,981 | |
| Green Bay WI Housing Authority Housing Revenue Refunding Bond Student University Village Housing Incorporated | 2.00 | 4-1-2028 | 125,000 | 119,026 | |
| Green Bay WI Housing Authority Housing Revenue Refunding Bond Student University Village Housing Incorporated | 2.00 | 4-1-2029 | 250,000 | 232,147 | |
| Green Bay WI Housing Authority Housing Revenue Refunding Bond Student University Village Housing Incorporated | 2.00 | 4-1-2030 | 875,000 | 778,873 | |
| Wisconsin Housing & EDA AMT Series A | 4.63 | 11-1-2037 | 10,000 | 10,004 | |
| Wisconsin Housing & EDA Madison Pool Project Series A | 4.55 | 7-1-2037 | 165,000 | 169,921 | |
| Wisconsin Housing & EDA Madison Pool Project Series A | 4.70 | 7-1-2047 | 2,300,000 | 2,329,711 | |
| Wisconsin Housing & EDA Madison Pool Project Series A | 4.85 | 7-1-2052 | 3,000,000 | 3,050,552 | |
| Wisconsin Housing & EDA Series A | 1.60 | 11-1-2048 | 665,000 | 664,722 | |
| Wisconsin Housing & EDA Series A | 1.70 | 11-1-2052 | 1,900,000 | 1,887,138 | |
| Wisconsin Housing & EDA Series A ## | 3.00 | 11-1-2022 | 125,000 | 125,588 | |
| Wisconsin Housing & EDA Series A | 3.38 | 5-1-2057 | 635,000 | 508,103 | |
| Wisconsin Housing & EDA Series A | 3.40 | 11-1-2032 | 2,450,000 | 2,381,576 | |
| Wisconsin Housing & EDA Series A | 3.95 | 11-1-2038 | 2,000,000 | 2,002,716 | |
| Wisconsin Housing & EDA Series A | 4.05 | 12-1-2049 | 800,000 | 770,154 | |
| Wisconsin Housing & EDA Series A | 5.75 | 11-1-2043 | 1,240,000 | 1,258,422 | |
| Wisconsin Housing & EDA Series B (Department of Housing and Urban Development Insured) | 0.40 | 5-1-2045 | 1,445,000 | 1,401,460 | |
| Wisconsin Housing & EDA Series B (FHLB SPA) ø | 0.90 | 5-1-2055 | 2,510,000 | 2,510,000 | |
| Wisconsin Housing & EDA Series C (Department of Housing and Urban Development Insured) | 0.61 | 11-1-2042 | 2,900,000 | 2,783,303 | |
| Wisconsin Housing & EDA Series C (Department of Housing and Urban Development Insured) | 0.80 | 5-1-2025 | 275,000 | 260,843 |
| Interest rate | Maturity date | Principal | Value | ||
| Housing revenue (continued) | |||||
| Wisconsin Housing & EDA Series C (Department of Housing and Urban Development Insured) | 0.85% | 11-1-2025 | $ 320,000 | $ 300,669 | |
| Wisconsin Housing & EDA Series C (Department of Housing and Urban Development Insured) | 0.95 | 5-1-2026 | 205,000 | 190,491 | |
| Wisconsin Housing & EDA Series C (Department of Housing and Urban Development Insured) | 1.00 | 11-1-2026 | 330,000 | 303,880 | |
| Wisconsin Housing & EDA Series C (Department of Housing and Urban Development Insured) | 1.20 | 5-1-2027 | 310,000 | 283,101 | |
| Wisconsin Housing & EDA Series C (Department of Housing and Urban Development Insured) | 1.35 | 11-1-2027 | 345,000 | 313,760 | |
| Wisconsin Housing & EDA Series C | 3.88 | 11-1-2035 | 1,100,000 | 1,081,750 | |
| 25,767,891 | |||||
| Miscellaneous revenue: 21.29% | |||||
| Appleton WI RDA Fox Cities Performing Arts Center Project Series B (Associated Bank NA LOC) ø | 1.07 | 6-1-2036 | 7,500,000 | 7,500,000 | |
| Ashwaubenon WI CDA Lease Revenue Brown County Expo Center Project | 4.00 | 6-1-2031 | 1,310,000 | 1,385,116 | |
| Ashwaubenon WI CDA Lease Revenue Brown County Expo Center Project | 4.00 | 6-1-2035 | 900,000 | 926,349 | |
| Ashwaubenon WI CDA Lease Revenue Brown County Expo Center Project | 4.00 | 6-1-2036 | 265,000 | 272,338 | |
| Ashwaubenon WI CDA Lease Revenue Brown County Expo Center Project CAB ¤ | 0.00 | 6-1-2049 | 8,000,000 | 2,351,068 | |
| Kaukauna WI RDA | 3.75 | 6-1-2032 | 850,000 | 859,054 | |
| Kaukauna WI RDA ## | 4.00 | 6-1-2023 | 200,000 | 203,553 | |
| Kaukauna WI RDA | 4.00 | 6-1-2025 | 425,000 | 442,655 | |
| Kaukauna WI RDA | 4.00 | 6-1-2028 | 425,000 | 440,238 | |
| Kaukauna WI RDA | 4.00 | 6-1-2035 | 900,000 | 915,396 | |
| Milwaukee WI RDA Lease Public Schools | 5.00 | 11-15-2033 | 750,000 | 820,572 | |
| Milwaukee WI RDA Lease Public Schools Series A | 5.00 | 11-15-2026 | 220,000 | 241,081 | |
| Milwaukee WI RDA Milwaukee Public Schools | 5.00 | 11-15-2028 | 325,000 | 357,831 | |
| Milwaukee WI RDA Milwaukee Public Schools | 5.00 | 11-15-2034 | 675,000 | 737,351 | |
| Milwaukee WI RDA Milwaukee Public Schools | 5.00 | 11-15-2035 | 1,000,000 | 1,090,653 | |
| Milwaukee WI RDA Milwaukee Public Schools | 5.00 | 11-15-2036 | 500,000 | 544,468 | |
| Milwaukee WI RDA Milwaukee Public Schools Series A | 5.00 | 11-15-2024 | 280,000 | 297,502 | |
| Milwaukee WI RDA Milwaukee Public Schools Series A | 5.00 | 11-15-2027 | 1,020,000 | 1,125,258 | |
| Milwaukee WI RDA Milwaukee Public Schools Series A | 5.00 | 11-15-2028 | 1,000,000 | 1,101,020 | |
| Milwaukee WI RDA Milwaukee Public Schools Series A | 5.00 | 11-15-2031 | 750,000 | 821,866 | |
| Milwaukee WI RDA Revenue Refunding Bond Milwaukee Public Schools (NPFGC Insured) ## | 4.00 | 8-1-2023 | 1,100,000 | 1,123,716 | |
| Weston WI CDA Series A ## | 1.75 | 10-1-2022 | 200,000 | 200,184 | |
| Weston WI CDA Series A ## | 1.90 | 10-1-2023 | 800,000 | 800,679 | |
| Weston WI CDA Series A | 2.00 | 10-1-2024 | 625,000 | 616,785 | |
| Weston WI CDA Series A | 2.15 | 10-1-2025 | 615,000 | 611,625 | |
| Weston WI CDA Series A | 2.25 | 10-1-2026 | 940,000 | 934,038 | |
| Weston WI CDA Series A | 2.40 | 10-1-2027 | 570,000 | 567,137 | |
| Wisconsin Dells Community Development Authority Series B | 3.35 | 3-1-2026 | 530,000 | 531,219 | |
| Wisconsin GO Series A (SIFMA Municipal Swap +0.42%) ±%% | 1.20 | 5-1-2025 | 4,000,000 | 4,000,001 | |
| 31,818,753 | |||||
| Tax revenue: 12.51% | |||||
| Southeast Wisconsin Professional Baseball Park District Series A (NPFGC Insured) | 5.50 | 12-15-2023 | 1,600,000 | 1,680,684 |
| Interest rate | Maturity date | Principal | Value | ||
| Tax revenue (continued) | |||||
| Southeast Wisconsin Professional Baseball Park District Series A (NPFGC Insured) | 5.50% | 12-15-2026 | $2,435,000 | $ 2,668,591 | |
| Warrens WI CDA Interim Community Development Workout Extension | 3.70 | 11-1-2029 | 137,240 | 84,717 | |
| Wisconsin Center District Appropriation Milwaukee Arena Project 2016 | 5.00 | 12-15-2023 | 550,000 | 573,816 | |
| Wisconsin Center District CAB (AGM Insured) ¤ | 0.00 | 12-15-2030 | 295,000 | 215,604 | |
| Wisconsin Center District CAB Junior Dedicated Series D ¤ | 0.00 | 12-15-2045 | 1,250,000 | 438,475 | |
| Wisconsin Center District CAB Senior Dedicated Milwaukee Arena Project Series A (BAM Insured) ¤ | 0.00 | 12-15-2033 | 2,985,000 | 1,884,383 | |
| Wisconsin Center District CAB Series A (NPFGC Insured) ¤ | 0.00 | 12-15-2027 | 100,000 | 83,177 | |
| Wisconsin Center District Junior Dedicated Bond Series A ## | 5.00 | 12-15-2022 | 730,000 | 741,316 | |
| Wisconsin Center District Junior Dedicated Bond Series A | 5.00 | 12-15-2030 | 2,100,000 | 2,132,553 | |
| Wisconsin Center District Junior Dedicated Tax Revenue Prerefunded Bond (AGM Insured) | 5.25 | 12-15-2023 | 570,000 | 574,818 | |
| Wisconsin Center District Junior Dedicated Tax Revenue Prerefunded Bond (AGM Insured) | 5.25 | 12-15-2027 | 220,000 | 243,251 | |
| Wisconsin Center District Junior Dedicated Tax Revenue Unrefunded Balance Refunding Bond (AGM Insured) | 5.25 | 12-15-2023 | 605,000 | 623,045 | |
| Wisconsin Center District Junior Dedicated Tax Revenue Unrefunded Balance Refunding Bond (AGM Insured) | 5.25 | 12-15-2027 | 785,000 | 862,752 | |
| Wisconsin Center District Milwaukee Arena Project | 4.00 | 12-15-2032 | 1,100,000 | 1,136,535 | |
| Wisconsin Center District Milwaukee Arena Project | 4.00 | 12-15-2033 | 920,000 | 951,743 | |
| Wisconsin Center District Milwaukee Arena Project | 4.00 | 12-15-2034 | 2,000,000 | 2,052,289 | |
| Wisconsin Center District Milwaukee Arena Project | 5.00 | 12-15-2032 | 85,000 | 92,787 | |
| Wisconsin Center District Tax Revenue CAB Senior Dedicated Series C (AGM Insured) ¤ | 0.00 | 12-15-2028 | 1,075,000 | 860,714 | |
| Wisconsin Center District Tax Revenue CAB Senior Dedicated Series C (AGM Insured) ¤ | 0.00 | 12-15-2030 | 1,095,000 | 800,292 | |
| 18,701,542 | |||||
| 122,178,395 | |||||
| Total Municipal obligations (Cost $160,432,179) | 153,874,508 | ||||
| Total investments in securities (Cost $160,432,179) | 102.94% | 153,874,508 | |||
| Other assets and liabilities, net | (2.94) | (4,395,390) | |||
| Total net assets | 100.00% | $149,479,118 |
| ## | All or a portion of this security is segregated for when-issued securities. |
| ¤ | The security is issued in zero coupon form with no periodic interest payments. |
| ø | Variable rate demand notes are subject to a demand feature which reduces the effective maturity. The maturity date shown represents the final maturity date of the security. The interest rate is determined and reset by the issuer daily, weekly, or monthly depending upon the terms of the security. The rate shown is the rate in effect at period end. |
| ± | Variable rate investment. The rate shown is the rate in effect at period end. |
| %% | The security is purchased on a when-issued basis. |
| Abbreviations: | |
| AGM | Assured Guaranty Municipal |
| AMT | Alternative minimum tax |
| BAM | Build America Mutual Assurance Company |
| CAB | Capital appreciation bond |
| CDA | Community Development Authority |
| EDA | Economic Development Authority |
| FHLB | Federal Home Loan Bank |
| GO | General obligation |
| HEFA | Health & Educational Facilities Authority |
| LOC | Letter of credit |
| MFHR | Multifamily housing revenue |
| NPFGC | National Public Finance Guarantee Corporation |
| PFA | Public Finance Authority |
| RDA | Redevelopment Authority |
| SIFMA | Securities Industry and Financial Markets Association |
| SPA | Standby purchase agreement |
| TTFA | Transportation Trust Fund Authority |
| Assets | |
Investments in unaffiliated securities, at value (cost $160,432,179) | $ 153,874,508 |
Cash | 524,346 |
Receivable for interest | 1,479,305 |
Receivable for Fund shares sold | 138,977 |
Prepaid expenses and other assets | 46,266 |
Total assets | 156,063,402 |
| Liabilities | |
Payable for when-issued transactions | 5,207,899 |
Payable for Fund shares redeemed | 759,902 |
Payable for investments purchased | 533,752 |
Management fee payable | 31,073 |
Administration fees payable | 14,822 |
Dividends payable | 11,225 |
Distribution fee payable | 2,572 |
Trustees’ fees and expenses payable | 448 |
Accrued expenses and other liabilities | 22,591 |
Total liabilities | 6,584,284 |
Total net assets | $149,479,118 |
| Net assets consist of | |
Paid-in capital | $ 156,251,915 |
Total distributable loss | (6,772,797) |
Total net assets | $149,479,118 |
| Computation of net asset value and offering price per share | |
Net assets – Class A | $ 66,388,061 |
Shares outstanding – Class A1 | 6,446,670 |
Net asset value per share – Class A | $10.30 |
Maximum offering price per share – Class A2 | $10.79 |
Net assets – Class C | $ 4,204,191 |
Shares outstanding – Class C1 | 408,263 |
Net asset value per share – Class C | $10.30 |
Net assets – Institutional Class | $ 78,886,866 |
Shares outstanding – Institutional Class1 | 7,659,352 |
Net asset value per share – Institutional Class | $10.30 |
| 1 | The Fund has an unlimited number of authorized shares. |
| 2 | Maximum offering price is computed as 100/95.50 of net asset value. On investments of $50,000 or more, the offering price is reduced. |
| Investment income | |
Interest | $ 4,201,687 |
| Expenses | |
Management fee | 677,927 |
| Administration fees | |
Class A | 119,359 |
Class C | 8,358 |
Institutional Class | 71,727 |
| Shareholder servicing fees | |
Class A | 186,482 |
Class C | 12,892 |
| Distribution fee | |
Class C | 38,675 |
Custody and accounting fees | 7,374 |
Professional fees | 63,434 |
Registration fees | 58,293 |
Shareholder report expenses | 34,006 |
Trustees’ fees and expenses | 20,059 |
Other fees and expenses | 7,975 |
Total expenses | 1,306,561 |
| Less: Fee waivers and/or expense reimbursements | |
Fund-level | (118,409) |
Class A | (126,819) |
Class C | (7,314) |
Net expenses | 1,054,019 |
Net investment income | 3,147,668 |
| Realized and unrealized gains (losses) on investments | |
| Net realized gains (losses) on | |
Unaffiliated securities | (197,350) |
Futures contracts | 11,529 |
Net realized losses on investments | (185,821) |
Net change in unrealized gains (losses) on investments | (14,929,330) |
Net realized and unrealized gains (losses) on investments | (15,115,151) |
Net decrease in net assets resulting from operations | $(11,967,483) |
| Year ended June 30, 2022 | Year ended June 30, 2021 | |||
| Operations | ||||
Net investment income | $ 3,147,668 | $ 3,085,902 | ||
Net realized gains (losses) on investments | (185,821) | 168,026 | ||
Net change in unrealized gains (losses) on investments | (14,929,330) | 2,114,690 | ||
Net increase (decrease) in net assets resulting from operations | (11,967,483) | 5,368,618 | ||
| Distributions to shareholders from | ||||
| Net investment income and net realized gains | ||||
Class A | (1,413,674) | (1,436,866) | ||
Class C | (58,669) | (61,394) | ||
Institutional Class | (1,850,887) | (1,589,155) | ||
Total distributions to shareholders | (3,323,230) | (3,087,415) | ||
| Capital share transactions | Shares | Shares | ||
| Proceeds from shares sold | ||||
Class A | 620,159 | 6,828,863 | 1,001,834 | 11,225,322 |
Class C | 91,176 | 995,979 | 147,885 | 1,660,980 |
Institutional Class | 3,238,533 | 35,149,888 | 3,206,169 | 36,011,523 |
| 42,974,730 | 48,897,825 | |||
| Reinvestment of distributions | ||||
Class A | 116,034 | 1,267,180 | 113,871 | 1,277,627 |
Class C | 5,293 | 57,878 | 5,397 | 60,528 |
Institutional Class | 166,521 | 1,819,075 | 135,932 | 1,525,501 |
| 3,144,133 | 2,863,656 | |||
| Payment for shares redeemed | ||||
Class A | (1,100,996) | (11,868,079) | (1,603,254) | (17,980,789) |
Class C | (175,453) | (1,884,410) | (191,338) | (2,141,864) |
Institutional Class | (3,600,905) | (38,548,690) | (1,621,298) | (18,213,318) |
| (52,301,179) | (38,335,971) | |||
Net increase (decrease) in net assets resulting from capital share transactions | (6,182,316) | 13,425,510 | ||
Total increase (decrease) in net assets | (21,473,029) | 15,706,713 | ||
| Net assets | ||||
Beginning of period | 170,952,147 | 155,245,434 | ||
End of period | $149,479,118 | $170,952,147 | ||
| Year ended June 30 | |||||
| Class A | 2022 | 2021 | 2020 | 2019 | 2018 |
Net asset value, beginning of period | $11.28 | $11.12 | $11.04 | $10.74 | $10.83 |
Net investment income | 0.20 | 0.21 | 0.25 | 0.29 | 0.28 |
Net realized and unrealized gains (losses) on investments | (0.97) | 0.16 | 0.08 | 0.30 | (0.09) |
Total from investment operations | (0.77) | 0.37 | 0.33 | 0.59 | 0.19 |
| Distributions to shareholders from | |||||
Net investment income | (0.20) | (0.21) | (0.25) | (0.29) | (0.28) |
Net realized gains | (0.01) | 0.00 | (0.00) 1 | 0.00 | 0.00 |
Total distributions to shareholders | (0.21) | (0.21) | (0.25) | (0.29) | (0.28) |
Net asset value, end of period | $10.30 | $11.28 | $11.12 | $11.04 | $10.74 |
Total return2 | (6.93)% | 3.37% | 3.05% | 5.56% | 1.76% |
| Ratios to average net assets (annualized) | |||||
Gross expenses | 0.92% | 0.92% | 0.95% | 0.94% | 0.88% |
Net expenses | 0.69% | 0.68% | 0.69% | 0.70% | 0.70% |
Net investment income | 1.79% | 1.88% | 2.24% | 2.66% | 2.57% |
| Supplemental data | |||||
Portfolio turnover rate | 12% | 10% | 24% | 8% | 11% |
Net assets, end of period (000s omitted) | $66,388 | $76,836 | $81,173 | $84,924 | $87,790 |
| 1 | Amount is less than $0.005. |
| 2 | Total return calculations do not include any sales charges. |
| Year ended June 30 | |||||
| Class C | 2022 | 2021 | 2020 | 2019 | 2018 |
Net asset value, beginning of period | $11.28 | $11.12 | $11.04 | $10.74 | $10.83 |
Net investment income | 0.11 | 0.13 | 0.17 1 | 0.21 | 0.20 |
Net realized and unrealized gains (losses) on investments | (0.97) | 0.16 | 0.08 | 0.30 | (0.09) |
Total from investment operations | (0.86) | 0.29 | 0.25 | 0.51 | 0.11 |
| Distributions to shareholders from | |||||
Net investment income | (0.11) | (0.13) | (0.17) | (0.21) | (0.20) |
Net realized gains | (0.01) | 0.00 | (0.00) 2 | 0.00 | 0.00 |
Total distributions to shareholders | (0.12) | (0.13) | (0.17) | (0.21) | (0.20) |
Net asset value, end of period | $10.30 | $11.28 | $11.12 | $11.04 | $10.74 |
Total return3 | (7.64)% | 2.58% | 2.27% | 4.78% | 1.01% |
| Ratios to average net assets (annualized) | |||||
Gross expenses | 1.66% | 1.67% | 1.70% | 1.69% | 1.63% |
Net expenses | 1.45% | 1.45% | 1.45% | 1.45% | 1.45% |
Net investment income | 1.02% | 1.12% | 1.49% | 1.92% | 1.83% |
| Supplemental data | |||||
Portfolio turnover rate | 12% | 10% | 24% | 8% | 11% |
Net assets, end of period (000s omitted) | $4,204 | $5,496 | $5,842 | $6,687 | $8,105 |
| 1 | Calculated based upon average shares outstanding |
| 2 | Amount is less than $0.005. |
| 3 | Total return calculations do not include any sales charges. |
| Year ended June 30 | |||||
| Institutional Class | 2022 | 2021 | 2020 | 2019 | 2018 |
Net asset value, beginning of period | $11.28 | $11.12 | $11.04 | $10.74 | $10.83 |
Net investment income | 0.22 | 0.23 | 0.27 | 0.31 | 0.30 |
Net realized and unrealized gains (losses) on investments | (0.97) | 0.16 | 0.08 | 0.30 | (0.09) |
Total from investment operations | (0.75) | 0.39 | 0.35 | 0.61 | 0.21 |
| Distributions to shareholders from | |||||
Net investment income | (0.22) | (0.23) | (0.27) | (0.31) | (0.30) |
Net realized gains | (0.01) | 0.00 | (0.00) 1 | 0.00 | 0.00 |
Total distributions to shareholders | (0.23) | (0.23) | (0.27) | (0.31) | (0.30) |
Net asset value, end of period | $10.30 | $11.28 | $11.12 | $11.04 | $10.74 |
Total return | (6.78)% | 3.54% | 3.23% | 5.75% | 1.95% |
| Ratios to average net assets (annualized) | |||||
Gross expenses | 0.59% | 0.59% | 0.62% | 0.61% | 0.55% |
Net expenses | 0.52% | 0.52% | 0.52% | 0.52% | 0.52% |
Net investment income | 1.96% | 2.04% | 2.40% | 2.85% | 2.79% |
| Supplemental data | |||||
Portfolio turnover rate | 12% | 10% | 24% | 8% | 11% |
Net assets, end of period (000s omitted) | $78,887 | $88,620 | $68,230 | $43,978 | $36,181 |
| 1 | Amount is less than $0.005. |
| Gross unrealized gains | $ 1,027,223 |
| Gross unrealized losses | (7,584,495) |
| Net unrealized losses | $(6,557,272) |
| Paid-in capital | Total distributable loss |
| $(3,460) | $3,460 |
| ■ | Level 1 – quoted prices in active markets for identical securities |
| ■ | Level 2 – other significant observable inputs (including quoted prices for similar securities, interest rates, prepayment speeds, credit risk, etc.) |
| ■ | Level 3 – significant unobservable inputs (including the Fund’s own assumptions in determining the fair value of investments) |
| Quoted prices (Level 1) | Other significant observable inputs (Level 2) | Significant unobservable inputs (Level 3) | Total | |
| Assets | ||||
| Investments in: | ||||
| Municipal obligations | $0 | $153,874,508 | $0 | $153,874,508 |
| Average daily net assets | Management fee |
| First $500 million | 0.400% |
| Next $500 million | 0.375 |
| Next $2 billion | 0.350 |
| Next $2 billion | 0.325 |
| Next $5 billion | 0.290 |
| Over $10 billion | 0.280 |
| Class-level administration fee | |
| Class A | 0.16% |
| Class C | 0.16 |
| Institutional Class | 0.08 |
| Expense ratio caps | |
| Class A | 0.70% |
| Class C | 1.45 |
| Institutional Class | 0.52 |
| Year ended June 30 | ||
| 2022 | 2021 | |
| Tax-exempt income | $3,147,668 | $3,087,415 |
| Ordinary income | 18,479 | 0 |
| Long-term capital gain | 157,083 | 0 |
| Unrealized losses | Post-October capital losses deferred |
| $(6,557,272) | $(204,300) |
Allspring Funds Trust:

| Name and year of birth | Position held and length of service* | Principal occupations during past five years or longer | Current other public company or investment company directorships |
| William R. Ebsworth (Born 1957) | Trustee, since 2015 | Retired. From 1984 to 2013, equities analyst, portfolio manager, research director and chief investment officer at Fidelity Management and Research Company in Boston, Tokyo, and Hong Kong, and retired in 2013 as Chief Investment Officer of Fidelity Strategic Advisers, Inc. where he led a team of investment professionals managing client assets. Prior thereto, Board member of Hong Kong Securities Clearing Co., Hong Kong Options Clearing Corp., the Thailand International Fund, Ltd., Fidelity Investments Life Insurance Company, and Empire Fidelity Investments Life Insurance Company. Audit Committee Chair and Investment Committee Chair of the Vincent Memorial Hospital Endowment (non-profit organization). Mr. Ebsworth is a CFA® charterholder. | N/A |
| Jane A. Freeman (Born 1953) | Trustee, since 2015; Chair Liaison, since 2018 | Retired. From 2012 to 2014 and 1999 to 2008, Chief Financial Officer of Scientific Learning Corporation. From 2008 to 2012, Ms. Freeman provided consulting services related to strategic business projects. Prior to 1999, Portfolio Manager at Rockefeller & Co. and Scudder, Stevens & Clark. Board member of the Harding Loevner Funds from 1996 to 2014, serving as both Lead Independent Director and chair of the Audit Committee. Board member of the Russell Exchange Traded Funds Trust from 2011 to 2012 and the chair of the Audit Committee. Ms. Freeman is also an inactive Chartered Financial Analyst. | N/A |
| Isaiah Harris, Jr. (Born 1952) | Trustee, since 2009; Audit Committee Chair, since 2019 | Retired. Chairman of the Board of CIGNA Corporation from 2009 to 2021, and Director from 2005 to 2008. From 2003 to 2011, Director of Deluxe Corporation. Prior thereto, President and CEO of BellSouth Advertising and Publishing Corp. from 2005 to 2007, President and CEO of BellSouth Enterprises from 2004 to 2005 and President of BellSouth Consumer Services from 2000 to 2003. Emeritus member of the Iowa State University Foundation Board of Governors. Emeritus Member of the Advisory Board of Iowa State University School of Business. Advisory Board Member, Palm Harbor Academy (private school). Advisory Board Member, Fellowship of Christian Athletes. Mr. Harris is a certified public accountant (inactive status). | N/A |
| David F. Larcker (Born 1950) | Trustee, since 2009 | James Irvin Miller Professor of Accounting at the Graduate School of Business (Emeritus), Stanford University, Director of the Corporate Governance Research Initiative and Senior Faculty of The Rock Center for Corporate Governance since 2006. From 2005 to 2008, Professor of Accounting at the Graduate School of Business, Stanford University. Prior thereto, Ernst & Young Professor of Accounting at The Wharton School, University of Pennsylvania from 1985 to 2005. | N/A |
| Name and year of birth | Position held and length of service* | Principal occupations during past five years or longer | Current other public company or investment company directorships |
| Olivia S. Mitchell (Born 1953) | Trustee, since 2006; Nominating and Governance Committee Chair, since 2018 | International Foundation of Employee Benefit Plans Professor since 1993, Wharton School of the University of Pennsylvania. Director of Wharton’s Pension Research Council and Boettner Center on Pensions & Retirement Research, and Research Associate at the National Bureau of Economic Research. Previously taught at Cornell University from 1978 to 1993. | N/A |
| Timothy J. Penny (Born 1951) | Trustee, since 1996; Chair, since 2018 | President and Chief Executive Officer of Southern Minnesota Initiative Foundation, a non-profit organization, since 2007. Member of the Board of Trustees of NorthStar Education Finance, Inc., a non-profit organization, since 2007. | N/A |
| James G. Polisson (Born 1959) | Trustee, since 2018 | Retired. Chief Marketing Officer, Source (ETF) UK Services, Ltd, from 2015 to 2017. From 2012 to 2015, Principal of The Polisson Group, LLC, a management consulting, corporate advisory and principal investing company. Chief Executive Officer and Managing Director at Russell Investments, Global Exchange Traded Funds from 2010 to 2012. Managing Director of Barclays Global Investors from 1998 to 2010 and Global Chief Marketing Officer for iShares and Barclays Global Investors from 2000 to 2010. Trustee of the San Francisco Mechanics’ Institute, a non-profit organization, from 2013 to 2015. Board member of the Russell Exchange Traded Fund Trust from 2011 to 2012. Director of Barclays Global Investors Holdings Deutschland GmbH from 2006 to 2009. Mr. Polisson is an attorney and has a retired status with the Massachusetts and District of Columbia Bar Associations. | N/A |
| Pamela Wheelock (Born 1959) | Trustee, since January 2020; previously Trustee from January 2018 to July 2019 | Board member of the Destination Medical Center Economic Development Agency, Rochester, Minnesota since 2019. Interim President of the McKnight Foundation from January to September 2020. McKnight Foundation Consultant, November 2020 to February 2021. Acting Commissioner, Minnesota Department of Human Services, July 2019 through September 2019. Consultant (part-time), Minnesota Department of Human Services, October 2019 through December 2019. Chief Operating Officer, Twin Cities Habitat for Humanity from 2017 to 2019. Vice President of University Services, University of Minnesota from 2012 to 2016. Prior thereto, on the Board of Directors, Governance Committee and Finance Committee for the Minnesota Philanthropy Partners (Saint Paul Foundation) from 2012 to 2018, Interim Chief Executive Officer of Blue Cross Blue Shield of Minnesota from 2011 to 2012, Chairman of the Board from 2009 to 2012 and Board Director from 2003 to 2015. Vice President, Leadership and Community Engagement, Bush Foundation, Saint Paul, Minnesota (a private foundation) from 2009 to 2011. Executive Vice President and Chief Financial Officer, Minnesota Sports and Entertainment from 2004 to 2009 and Senior Vice President from 2002 to 2004. Executive Vice President of the Minnesota Wild Foundation from 2004 to 2008. Commissioner of Finance, State of Minnesota, from 1999 to 2002. Currently Board Chair of the Minnesota Wild Foundation since 2010. | N/A |
| Name and year of birth | Position held and length of service | Principal occupations during past five years or longer |
| Andrew Owen (Born 1960) | President, since 2017 | President, Chief Executive Officer and Director of Allspring Funds Management, LLC since 2017 and co-president of Galliard Capital Management, LLC, an affiliate of Allspring Funds Management, LLC, since 2019. Prior thereto, Head of Affiliated Managers, Allspring Global Investments, from 2014 to 2019 and Executive Vice President responsible for marketing, investments and product development for Allspring Funds Management, LLC, from 2009 to 2014. In addition, Mr. Owen was an Executive Vice President of Wells Fargo & Company from 2014 to 2021. |
| Jeremy DePalma (Born 1974) | Treasurer, since 2012 (for certain funds in the Fund Complex); since 2021 (for the remaining funds in the Fund Complex) | Senior Vice President of Allspring Funds Management, LLC since 2009. Senior Vice President of Evergreen Investment Management Company, LLC from 2008 to 2010 and head of the Fund Reporting and Control Team within Fund Administration from 2005 to 2010. |
| Kate McKinley (Born 1977) | Chief Legal Officer, since 2021 | Chief Legal Officer of Allspring Global Investments since 2021. Prior thereto, held various roles at State Street Global Advisors beginning in 2010, including serving as Senior Vice President and General Counsel from 2019 to 2021, and Chief Operating Officer of the Institutional Client Group from 2016 - 2019. Prior to working at State Street Global Advisors served as Assistant General Counsel for Bank of America Corporation from 2005 to 2010 and as an Associate at WilmerHale from 2002 to 2005. |
| Christopher Baker (Born 1976) | Chief Compliance Officer, since 2022 | Global Chief Compliance Officer for Allspring Global Investments since 2022. Prior thereto, Chief Compliance Officer for State Street Global Advisors from 2018 to 2021. Senior Compliance Officer for the State Street divisions of Alternative Investment Solutions, Sector Solutions, and Global Marketing from 2015 to 2018. From 2010 to 2015 Vice President, Global Head of Investment and Marketing Compliance for State Street Global Advisors. |
| Matthew Prasse (Born 1983) | Secretary, since 2021 | Senior Counsel of the Allspring Legal Department since 2021. Senior Counsel of the Wells Fargo Legal Department from 2018 to 2021. Previously, Counsel for Barings LLC from 2015 to 2018. Prior to joining Barings, Associate at Morgan, Lewis & Bockius LLP from 2008 to 2015. |
P.O. Box 219967
Kansas City, MO 64121-9967

1-800-222-8222 or visit the Fund's website at allspringglobal.com. Read the prospectus carefully before you invest or send money.
A259/AR259 06-22

Alternative Risk Premia Fund
| 2 | |
| 6 | |
| 10 | |
| 11 | |
| Consolidated financial statements | |
| 21 | |
| 22 | |
| 23 | |
| 24 | |
| 26 | |
| 34 | |
| 35 |

| 1 | The S&P 500 Index consists of 500 stocks chosen for market size, liquidity, and industry group representation. It is a market-value-weighted index with each stock's weight in the index proportionate to its market value. You cannot invest directly in an index. |
| 2 | The Morgan Stanley Capital International (MSCI) All Country World Index (ACWI) ex USA Index (Net) is a free-float-adjusted market-capitalization-weighted index that is designed to measure the equity market performance of developed and emerging markets, excluding the U.S. Source: MSCI. MSCI makes no express or implied warranties or representations and shall have no liability whatsoever with respect to any MSCI data contained herein. The MSCI data may not be further redistributed or used as a basis for other indexes or any securities or financial products. This report is not approved, reviewed, or produced by MSCI. You cannot invest directly in an index. |
| 3 | The MSCI Emerging Markets (EM) Index (Net) (USD) is a free-float-adjusted market-capitalization-weighted index that is designed to measure equity market performance of emerging markets. You cannot invest directly in an index. |
| 4 | The Bloomberg U.S. Aggregate Bond Index is a broad-based benchmark that measures the investment-grade, U.S.-dollar-denominated, fixed-rate taxable bond market, including Treasuries, government-related and corporate securities, mortgage-backed securities (agency fixed-rate and hybrid adjustable-rate mortgage pass-throughs), asset-backed securities, and commercial mortgage-backed securities. You cannot invest directly in an index. |
| 5 | The Bloomberg Global Aggregate ex-USD Index (unhedged) is an unmanaged index that provides a broad-based measure of the global investment-grade fixed-income markets excluding the U.S.-dollar-denominated debt market. You cannot invest directly in an index. |
| 6 | The Bloomberg Municipal Bond Index is an unmanaged index composed of long-term tax-exempt bonds with a minimum credit rating of Baa. You cannot invest directly in an index. |
| 7 | The ICE BofA U.S. High Yield Index is a market-capitalization-weighted index of domestic and Yankee high-yield bonds. The index tracks the performance of high-yield securities traded in the U.S. bond market. You cannot invest directly in an index. Copyright 2022. ICE Data Indices, LLC. All rights reserved. |
| 1 | The Consumer Price Index (CPI) is a measure of the average change over time in the prices paid by urban consumers for a market basket of consumer goods and services. You cannot invest directly in an index. |
| 2 | The MSCI ACWI (Net) is a free-float-adjusted market-capitalization-weighted index that is designed to measure the equity market performance of developed and emerging markets. You cannot invest directly in an index. |

President
Allspring Funds
| Investment objective | The Fund seeks long-term capital appreciation. |
| Manager | Allspring Funds Management, LLC |
| Subadvisers | Allspring Global Investments, LLC |
| Allspring Global Investments (UK) Limited | |
| Portfolio managers | Petros N. Bocray, CFA®‡, FRM, Eddie Cheng, CFA®‡, Monisha Jayakumar |
| Average annual total returns (%) as of June 30, 2022 | |||||
| Expense ratios1 (%) | |||||
| Inception date | 1 year | Since inception | Gross | Net 2 | |
| Class R6 (WRPRX) | 1-29-2019 | 7.54 ♠ | -2.33 | 1.12 | 0.65 |
| Institutional Class (WRPIX) | 1-29-2019 | 7.44 ♠ | -2.45 | 1.22 | 0.75 |
| ICE BofA 3-Month U.S. Treasury Bill Index3 | – | 0.17 | 0.86 * | – | – |
| ♠ | Total return differs from the return in the Financial Highlights in this report. The total return presented is calculated based on the Net Asset Value (NAV) at which the shareholder transactions were processed. The NAV and total return presented in the Financial Highlights reflects certain adjustments made to the net assets of the Fund that are necessary under U.S. generally accepted accounting principles. |
| * | Based on the inception date of the oldest Fund class. |
| 1 | Reflects the expense ratios as stated in the most recent prospectuses, which include the impact of 0.03% in acquired fund fees and expenses. The expense ratios shown are subject to change and may differ from the annualized expense ratios shown in the financial highlights of this report, which do not include acquired fund fees and expenses. |
| 2 | The manager has contractually committed through October 31, 2022, to waive fees and/or reimburse expenses to the extent necessary to cap total annual fund operating expenses after fee waivers at 0.62% for Class R6 and 0.72% for Institutional Class. Brokerage commissions, stamp duty fees, interest, taxes, acquired fund fees and expenses (if any), and extraordinary expenses are excluded from the expense caps. Prior to or after the commitment expiration date, the caps may be increased or the commitment to maintain the caps may be terminated only with the approval of the Board of Trustees. Without these caps, the Fund’s returns would have been lower. The expense ratio paid by an investor is the net expense ratio (the total annual fund operating expenses after fee waivers) as stated in the prospectuses. |
| 3 | The ICE BofA 3-Month U.S. Treasury Bill Index is an unmanaged index that is comprised of a single U.S. Treasury issue with approximately three months to final maturity, purchased at the beginning of each month and held for one full month. You cannot invest directly in an index. Copyright 2022. ICE Data Indices, LLC. All rights reserved. |
| ‡ | CFA® and Chartered Financial Analyst® are trademarks owned by CFA Institute. |

| 1 | The chart compares the performance of Institutional Class shares since inception with the ICE BofA 3-Month U.S. Treasury Bill Index. The chart assumes a hypothetical investment of $1,000,000 in Institutional Class shares and reflects all operating expenses. |
| ■ | The Fund outperformed its benchmark, the ICE BofA 3-Month U.S. Treasury Bill Index, for the 12-month period that ended June 30, 2022. |
| ■ | The top contributors included our cross-asset trend strategy (+5.32), carry (+4.5%), and multi-factor equity (+3.2%). |
| ■ | The largest detractor was our macro value strategy (-3.3%). |
| ■ | The Fund uses derivatives, including but not limited to equity futures, bond futures, commodity futures, and currency forwards, to achieve its desired exposure in different asset classes (which in turn helps the Fund arrive at its desired leverage, risk, and return targets). These derivatives are the most commonly traded instruments on main exchanges and are highly liquid. |
| Net asset exposure as of June 30, 20221 | ||
| % of net assets | ||
| Long positions | Short positions | |
| Stocks | 32 | 22 |
| Bond futures | 28 | 116 |
| Currency forwards | 40 | 61 |
| Equity index futures | 4 | 6 |
| Commodity futures | 15 | 13 |
| 1 | Figures are subject to change and may have changed since the date specified. |
| Beginning account value 1-1-2022 | Ending account value 6-30-2022 | Consolidated expenses paid during the period1 | Annualized net expense ratio | |
| Class R6 | ||||
| Actual | $1,000.00 | $1,080.47 | $3.20 | 0.62% |
| Hypothetical (5% return before expenses) | $1,000.00 | $1,021.72 | $3.11 | 0.62% |
| Institutional Class | ||||
| Actual | $1,000.00 | $1,079.48 | $3.71 | 0.72% |
| Hypothetical (5% return before expenses) | $1,000.00 | $1,021.22 | $3.61 | 0.72% |
| Yield | Shares | Value | |||
| Short-term investments: 94.42% | |||||
| Investment companies: 48.67% | |||||
| Allspring Government Money Market Fund Select Class ♠∞* | 1.26% | 26,833,161 | $26,833,161 |
| Maturity date | Principal | ||||
| U.S. Treasury securities: 45.75% | |||||
| U.S. Treasury Bill ☼ | 0.25 | 7-14-2022 | $14,900,000 | 14,894,268 | |
| U.S. Treasury Bill ☼# | 2.43 | 12-29-2022 | 7,750,000 | 7,655,704 | |
| U.S. Treasury Bill ☼# | 2.72 | 6-15-2023 | 2,750,000 | 2,678,485 | |
| 25,228,457 | |||||
| Total Short-term investments (Cost $52,066,559) | 52,061,618 | ||||
| Total investments in securities (Cost $52,066,559) | 94.42% | 52,061,618 | |||
| Other assets and liabilities, net | 5.58 | 3,076,414 | |||
| Total net assets | 100.00% | $55,138,032 |
| ♠ | The issuer of the security is an affiliated person of the Fund as defined in the Investment Company Act of 1940. |
| * | A portion of the holding represents an investment held in Alt Risk Premia Special Investments (Cayman) Ltd., the consolidated entity. |
| ∞ | The rate represents the 7-day annualized yield at period end. |
| ☼ | Zero coupon security. The rate represents the current yield to maturity. |
| # | All or a portion of this security is segregated as collateral for investments in derivative instruments. |
| Value, beginning of period | Purchases | Sales proceeds | Net realized gains (losses) | Net change in unrealized gains (losses) | Value, end of period | Shares, end of period | Income from affiliated securities | |
| Short-term investments | ||||||||
| Allspring Government Money Market Fund Select Class | $19,278,685 | $142,786,284 | $(135,231,808) | $0 | $0 | $26,833,161 | 26,833,161 | $39,407 |
| Currency to be received | Currency to be delivered | Counterparty | Settlement date | Unrealized gains | Unrealized losses | |
| 2,419,926,000 IDR | 166,581 USD | Goldman Sachs International | 7-20-2022 | $ 0 | $ (4,170) | |
| 1,902,394,000 CLP | 2,300,717 USD | Goldman Sachs International | 7-20-2022 | 0 | (234,283) | |
| 48,857,000 MXN | 2,473,435 USD | Goldman Sachs International | 7-20-2022 | 0 | (50,465) | |
| 2,813,000 GBP | 3,530,619 USD | Goldman Sachs International | 7-20-2022 | 0 | (105,570) | |
| 3,002,000 EUR | 3,229,104 USD | Goldman Sachs International | 7-20-2022 | 0 | (80,106) | |
| 482,128,000 HUF | 1,304,805 USD | Goldman Sachs International | 7-20-2022 | 0 | (33,518) | |
| 8,644,000 PLN | 2,011,295 USD | Goldman Sachs International | 7-20-2022 | 0 | (86,502) | |
| 401,916,000 JPY | 3,007,316 USD | Goldman Sachs International | 7-20-2022 | 0 | (42,509) | |
| 10,566,000 BRL | 2,145,350 USD | Goldman Sachs International | 7-20-2022 | 0 | (135,682) | |
| 6,651,000 ZAR | 432,368 USD | Goldman Sachs International | 7-20-2022 | 0 | (24,173) | |
| 49,970,000 CZK | 2,165,498 USD | Goldman Sachs International | 7-20-2022 | 0 | (52,749) | |
| 1,182,906 USD | 1,485,387,000 KRW | Goldman Sachs International | 7-20-2022 | 38,693 | 0 | |
| 1,099,322 USD | 10,744,000 SEK | Goldman Sachs International | 7-20-2022 | 48,538 | 0 | |
| 10,717,259 USD | 101,275,000 NOK | Goldman Sachs International | 7-20-2022 | 432,651 | 0 | |
| 818,302 USD | 1,026,000 CAD | Goldman Sachs International | 7-20-2022 | 21,212 | 0 | |
| 1,628,357 USD | 2,521,000 NZD | Goldman Sachs International | 7-20-2022 | 54,017 | 0 | |
| 8,131,744 USD | 11,275,000 AUD | Goldman Sachs International | 7-20-2022 | 348,493 | 0 | |
| 10,720 USD | 836,000 INR | Goldman Sachs International | 7-20-2022 | 146 | 0 | |
| 10,879,974 USD | 10,578,000 CHF | Goldman Sachs International | 7-20-2022 | 0 | (210,487) | |
| $943,750 | $(1,060,214) |
| Description | Number of contracts | Expiration date | Notional cost | Notional value | Unrealized gains | Unrealized losses | |
| Long | |||||||
| CAC 40 Index | 8 | 7-15-2022 | $ 517,661 | $ 495,806 | $ 0 | $ (21,855) | |
| London Metal Exchange Copper Futures** | 3 | 7-18-2022 | 716,339 | 619,800 | 0 | (96,539) | |
| London Metal Exchange Nickel Futures** | 1 | 7-18-2022 | 181,517 | 135,906 | 0 | (45,611) | |
| London Metal Exchange Zinc Futures** | 4 | 7-18-2022 | 391,024 | 318,175 | 0 | (72,849) | |
| Brent Crude Futures** | 6 | 7-29-2022 | 687,735 | 654,180 | 0 | (33,555) | |
| Gasoline RBOB Futures** | 6 | 7-29-2022 | 918,795 | 891,148 | 0 | (27,647) | |
| NY Harbor Ultra-Low Sulfur Diesel Futures** | 9 | 7-29-2022 | 1,600,965 | 1,447,929 | 0 | (153,036) | |
| Low Sugar Gas Oil Futures** | 7 | 8-11-2022 | 869,668 | 786,800 | 0 | (82,868) | |
| Lean Hogs Futures** | 3 | 8-12-2022 | 129,743 | 122,520 | 0 | (7,223) | |
| Soybean Meal Futures** | 11 | 8-12-2022 | 454,192 | 479,050 | 24,858 | 0 | |
| Gold 100 Ounces Futures** | 3 | 8-29-2022 | 550,250 | 542,190 | 0 | (8,060) | |
| Live Cattle Futures** | 27 | 8-31-2022 | 1,430,443 | 1,431,810 | 1,367 | 0 | |
| Euro-Bund Futures | 11 | 9-8-2022 | 1,740,335 | 1,715,054 | 0 | (25,281) | |
| 10-Year Australian Treasury Bonds | 166 | 9-15-2022 | 13,711,414 | 13,623,166 | 0 | (88,248) | |
| S&P/TSX 60 Index | 3 | 9-15-2022 | 576,147 | 532,551 | 0 | (43,596) | |
| SPI 200 Index | 5 | 9-15-2022 | 583,613 | 557,463 | 0 | (26,150) | |
| FTSE 100 Index | 7 | 9-16-2022 | 609,614 | 606,788 | 0 | (2,826) | |
| Coffee C Futures** | 4 | 9-20-2022 | 342,841 | 345,150 | 2,309 | 0 | |
| Silver Futures** | 5 | 9-28-2022 | 542,142 | 508,800 | 0 | (33,342) | |
| Cotton #2 Futures** | 16 | 12-7-2022 | 948,657 | 790,720 | 0 | (157,937) | |
| Short | |||||||
| London Metal Exchange Aluminium Futures** | (9) | 7-18-2022 | (640,454) | (547,313) | 93,141 | 0 | |
| London Metal Exchange Copper Futures** | (3) | 7-18-2022 | (712,486) | (619,800) | 92,686 | 0 | |
| London Metal Exchange Lead Futures** | (14) | 7-18-2022 | (779,789) | (669,725) | 110,064 | 0 | |
| London Metal Exchange Zinc Futures** | (2) | 7-18-2022 | (193,778) | (159,088) | 34,690 | 0 | |
| WTI Crude Futures** | (2) | 7-20-2022 | (234,453) | (211,520) | 22,933 | 0 | |
| Soybean Futures** | (1) | 8-12-2022 | (78,409) | (78,025) | 384 | 0 | |
| Soybean Oil Futures** | (19) | 8-12-2022 | (785,219) | (763,914) | 21,305 | 0 | |
| Natural Gas Futures** | (2) | 8-29-2022 | (172,373) | (107,840) | 64,533 | 0 | |
| TOPIX Index | (4) | 9-8-2022 | (567,929) | (551,445) | 16,484 | 0 | |
| 10-Year Japanese Treasury Bonds | (27) | 9-12-2022 | (29,706,168) | (29,573,040) | 133,128 | 0 | |
| Corn Futures** | (33) | 9-14-2022 | (1,203,961) | (1,037,438) | 166,523 | 0 | |
| KC Hard Red Winter Wheat Futures** | (5) | 9-14-2022 | (292,106) | (237,938) | 54,168 | 0 | |
| Wheat Futures** | (32) | 9-14-2022 | (1,735,081) | (1,414,400) | 320,681 | 0 | |
| Cocoa Futures** | (30) | 9-15-2022 | (727,983) | (702,000) | 25,983 | 0 | |
| DAX Futures Index | (1) | 9-16-2022 | (365,142) | (334,584) | 30,558 | 0 | |
| E-Mini Nasdaq 100 Index | (2) | 9-16-2022 | (474,733) | (461,180) | 13,553 | 0 | |
| E-Mini Russell 2000 Index | (4) | 9-16-2022 | (360,181) | (341,600) | 18,581 | 0 | |
| E-Mini S&P 500 Index | (3) | 9-16-2022 | (585,089) | (568,425) | 16,664 | 0 | |
| MSCI Emerging Markets Index | (9) | 9-16-2022 | (447,321) | (451,215) | 0 | (3,894) | |
| Euro STOXX 50 Futures | (12) | 9-16-2022 | (438,763) | (432,720) | 6,043 | 0 | |
| 10-Year Canadian Treasury Bonds | (121) | 9-20-2022 | (12,016,961) | (11,655,368) | 361,593 | 0 | |
| 10-Year U.S. Treasury Notes | (143) | 9-21-2022 | (17,114,241) | (16,949,969) | 164,272 | 0 | |
| Long Gilt Bonds | (40) | 9-28-2022 | (5,759,580) | (5,549,915) | 209,665 | 0 | |
| Sugar #11 World Futures** | (68) | 9-30-2022 | (1,435,654) | (1,408,960) | 26,694 | 0 | |
| $2,032,860 | $(930,517) |
| ** | Represents an investment held in Alt Risk Premia Special Investments (Cayman) Ltd., the consolidated entity. |
| Reference asset/index | Counterparty | Payment frequency | Maturity date | Notional amount | Value | Unrealized gains | Unrealized losses |
| Synthetic total return swap† | Goldman Sachs International | Monthly | 2-1-2024 | $4,775,050 | $5,014,097 | $239,047 | $0 |
| † | The Fund receives or pays the difference between the total return on a portfolio of long and short positions underlying the total return swap and the return on a specified benchmark (either the Federal Funds Effective Rate or the One Month LIBOR), plus or minus a spread in a typical range of 20-75 basis points (bps; 100 bps equal 1.00%). The spread is determined based upon the country and/or currency of the individual underlying positions. Certain short positions may be subject to higher market rates. |
| Reference asset | Shares | Value | % of swap basket value | |
| Long positions | ||||
| Common stocks | ||||
| Communication services | ||||
| Diversified telecommunication services | ||||
| Hong Kong Telecommunications Trust & Hong Kong Trust Limited | 47,000 | $ 63,131 | 1.26% | |
| Spark New Zealand Limited | 23,333 | 69,949 | 1.40 | |
| Vision Incorporated | 5,600 | 53,284 | 1.06 | |
| Entertainment | ||||
| Avex Incorporated | 5,600 | 55,637 | 1.11 | |
| Toho Company Limited Tokyo | 1,700 | 61,457 | 1.23 | |
| Universal Music Group NV | 4,185 | 83,915 | 1.67 | |
| Interactive media & services | ||||
| Auto Trader Group plc | 22,572 | 152,497 | 3.04 | |
| Kakaku.com Incorporated | 5,300 | 87,422 | 1.74 | |
| Media | ||||
| Sirius XM Holdings Incorporated | 8,727 | 53,497 | 1.07 | |
| Wireless telecommunication services | ||||
| Tele2 AB Class B | 10,352 | 117,892 | 2.35 | |
| 798,681 | ||||
| Consumer discretionary | ||||
| Automobiles | ||||
| Isuzu Motors Limited | 7,200 | 79,652 | 1.59 | |
| Mazda Motor Corporation | 13,300 | 108,807 | 2.17 | |
| Hotels, restaurants & leisure | ||||
| Domino's Pizza Enterprises Limited | 1,743 | 81,811 | 1.63 | |
| La Francaise des Jeux SA | 1,486 | 51,421 | 1.03 | |
| Yum! Brands Incorporated | 1,070 | 121,456 | 2.42 | |
| Household durables | ||||
| Iida Group Holdings Company Limited | 4,100 | 63,126 | 1.26 | |
| Leisure products | ||||
| Hasbro Incorporated | 614 | 50,274 | 1.00 | |
| Specialty retail | ||||
| AutoZone Incorporated | 24 | 51,579 | 1.03 |
| Reference asset | Shares | Value | % of swap basket value | |
| Long positions (continued) | ||||
| Textiles, apparel & luxury goods | ||||
| Gildan Activewear Incorporated | 4,200 | $ 120,890 | 2.41% | |
| Pandora AS | 1,241 | 78,070 | 1.56 | |
| 807,086 | ||||
| Consumer staples | ||||
| Food & staples retailing | ||||
| Ingles Markets Incorporated Class A | 647 | 56,127 | 1.12 | |
| SpartanNash Company | 2,731 | 82,394 | 1.64 | |
| The Kroger Company | 1,582 | 74,876 | 1.50 | |
| Food products | ||||
| Kellogg Company | 914 | 65,205 | 1.30 | |
| The Hershey Company | 373 | 80,255 | 1.60 | |
| Tyson Foods Incorporated Class A | 821 | 70,655 | 1.41 | |
| Household products | ||||
| Church & Dwight Company Incorporated | 970 | 89,880 | 1.79 | |
| Personal products | ||||
| Pola Orbis Holdings Incorporated | 7,300 | 89,905 | 1.79 | |
| 609,297 | ||||
| Energy | ||||
| Oil, gas & consumable fuels | ||||
| Idemitsu Kosan Company Limited | 3,300 | 79,533 | 1.58 | |
| Origin Energy Limited | 15,695 | 62,076 | 1.24 | |
| 141,609 | ||||
| Financials | ||||
| Banks | ||||
| Banco Bilbao Vizcaya Argentaria SA | 13,643 | 61,914 | 1.23 | |
| Capital markets | ||||
| Cboe Global Markets Incorporated | 448 | 50,709 | 1.01 | |
| FactSet Research Systems Incorporated | 241 | 92,681 | 1.85 | |
| SEI Investments Company | 2,647 | 142,991 | 2.85 | |
| TMX Group Limited | 700 | 71,240 | 1.42 | |
| Diversified financial services | ||||
| A-Mark Precious Metals Incorporated | 1,912 | 61,662 | 1.23 | |
| Exor NV | 1,438 | 89,634 | 1.79 | |
| Wendel SA | 893 | 74,632 | 1.49 | |
| Insurance | ||||
| American Financial Group Incorporated | 597 | 82,870 | 1.65 | |
| Assurant Incorporated | 703 | 121,514 | 2.43 | |
| Erie Indemnity Company Class A | 650 | 124,924 | 2.49 | |
| Fairfax Financial Holdings Limited | 100 | 52,991 | 1.06 | |
| Medibank Private Limited | 36,691 | 82,309 | 1.64 | |
| 1,110,071 | ||||
| Health care | ||||
| Biotechnology | ||||
| Biogen Incorporated | 409 | 83,411 | 1.66 | |
| Radius Health Incorporated | 5,651 | 58,601 | 1.17 | |
| Regeneron Pharmaceuticals Incorporated | 105 | 62,069 | 1.24 | |
| Health care equipment & supplies | ||||
| BioMerieux Incorporated | 634 | 61,922 | 1.23 | |
| Getinge AB Class B | 2,582 | 59,668 | 1.19 |
| Reference asset | Shares | Value | % of swap basket value | |
| Long positions (continued) | ||||
| Health care technology | ||||
| NextGen Healthcare Incorporated | 2,934 | $ 51,169 | 1.02% | |
| Pharmaceuticals | ||||
| Bristol-Myers Squibb Company | 874 | 67,298 | 1.34 | |
| Ipsen SA | 769 | 72,569 | 1.45 | |
| Orion Oyj Class B | 3,904 | 174,285 | 3.48 | |
| 690,992 | ||||
| Industrials | ||||
| Aerospace & defense | ||||
| Northrop Grumman Corporation | 129 | 61,736 | 1.23 | |
| Air freight & logistics | ||||
| C.H. Robinson Worldwide Incorporated | 732 | 74,203 | 1.48 | |
| Electrical equipment | ||||
| ABB Limited | 2,781 | 74,168 | 1.48 | |
| Fuji Electric Holdings Company Limited | 1,800 | 74,558 | 1.49 | |
| Prysmian SpA | 2,498 | 68,612 | 1.37 | |
| Industrial conglomerates | ||||
| DCC plc | 866 | 53,742 | 1.07 | |
| Machinery | ||||
| Hino Motors Limited | 20,100 | 103,255 | 2.06 | |
| Professional services | ||||
| Persol Holdings Company Limited | 6,600 | 119,956 | 2.40 | |
| Robert Half International Incorporated | 1,106 | 82,828 | 1.65 | |
| TrueBlue Incorporated | 2,833 | 50,711 | 1.01 | |
| Road & rail | ||||
| J.B. Hunt Transport Services Incorporated | 442 | 69,602 | 1.39 | |
| Knight-Swift Transportation Holdings Incorporated | 1,718 | 79,526 | 1.58 | |
| Nippon Express Holdings Incorporated | 2,000 | 108,638 | 2.17 | |
| Old Dominion Freight Line Incorporated | 251 | 64,326 | 1.28 | |
| Trading companies & distributors | ||||
| W.W. Grainger Incorporated | 188 | 85,433 | 1.70 | |
| 1,171,294 | ||||
| Information technology | ||||
| Communications equipment | ||||
| Juniper Networks Incorporated | 2,336 | 66,576 | 1.33 | |
| Electronic equipment, instruments & components | ||||
| Arrow Electronics Incorporated | 989 | 110,857 | 2.21 | |
| Esprinet SpA | 8,088 | 57,932 | 1.16 | |
| Japan Display Incorporated | 150,800 | 76,689 | 1.53 | |
| Venture Corporation Limited | 7,600 | 90,972 | 1.81 | |
| IT services | ||||
| Cognizant Technology Solutions Corporation Class A | 2,004 | 135,250 | 2.70 | |
| CSG Systems International Incorporated | 955 | 56,994 | 1.14 | |
| Gartner Incorporated | 328 | 79,320 | 1.58 | |
| Jack Henry & Associates Incorporated | 877 | 157,878 | 3.15 | |
| VeriSign Incorporated | 454 | 75,968 | 1.51 | |
| Software | ||||
| Cadence Design Systems Incorporated | 391 | 58,662 | 1.17 | |
| Concensus Cloud Solution | 1,468 | 64,122 | 1.28 | |
| Dropbox Incorporated Class A | 2,915 | 61,186 | 1.22 | |
| Fair Isaac Corporation | 306 | 122,675 | 2.44 | |
| Guidewire Software Incorporated | 848 | 60,200 | 1.20 |
| Reference asset | Shares | Value | % of swap basket value | |
| Long positions (continued) | ||||
| Software (continued) | ||||
| Nemetschek SE | 927 | $ 56,111 | 1.12% | |
| Open Text Corporation (Toronto Exchange) | 3,800 | 143,740 | 2.87 | |
| The Sage Group plc | 22,785 | 176,069 | 3.51 | |
| Verint Systems Incorporated | 1,330 | 56,326 | 1.12 | |
| Technology hardware, storage & peripherals | ||||
| Avid Technology Incorporated | 2,012 | 52,211 | 1.04 | |
| 1,759,738 | ||||
| Materials | ||||
| Chemicals | ||||
| CF Industries Holdings Incorporated | 629 | 53,924 | 1.08 | |
| Nufarm Limited | 15,291 | 53,723 | 1.07 | |
| Containers & packaging | ||||
| Orora Limited | 31,262 | 78,762 | 1.57 | |
| Metals & mining | ||||
| Suncoke Energy Incorporated | 7,394 | 50,353 | 1.00 | |
| 236,762 | ||||
| Real estate | ||||
| Equity REITs | ||||
| Artis REIT | 5,500 | 50,249 | 1.00 | |
| Primaris REIT | 5,500 | 52,257 | 1.05 | |
| Real estate management & development | ||||
| Daito Trust Construction Company Limited | 1,300 | 112,198 | 2.24 | |
| Sino Land Company | 44,000 | 64,933 | 1.29 | |
| 279,637 | ||||
| Utilities | ||||
| Electric utilities | ||||
| CK Infrastructure Holdings Limited | 8,500 | 52,104 | 1.04 | |
| Red Eléctrica Corporacion SA | 3,309 | 62,505 | 1.25 | |
| Multi-utilities | ||||
| SembCorp Industries Limited | 25,700 | 52,721 | 1.05 | |
| 167,330 |
| Dividend yield | ||||
| Preferred stocks | ||||
| Consumer discretionary | ||||
| Automobiles | ||||
| Bayerische Motoren Werke AG | 8.51% | 1,339 | 94,857 | 1.89 |
| Short positions | ||||
| Common stocks | ||||
| Communication services | ||||
| Diversified telecommunication services | ||||
| Cellnex Telecom SA | (2,731) | (105,978) | (2.11) | |
| Verizon Communications Incorporated | (1,257) | (63,793) | (1.27) | |
| Entertainment | ||||
| Embracer Group AB | (8,811) | (67,174) | (1.34) |
| Reference asset | Shares | Value | % of swapbasket value | |
| Short positions (continued) | ||||
| Interactive media & services | ||||
| Adevinta ASA | (11,010) | $ (79,532) | (1.59)% | |
| Media | ||||
| Comcast Corporation Class A | (1,418) | (55,642) | (1.11) | |
| Wireless telecommunication services | ||||
| Softbank Group Corporation | (1,500) | (57,875) | (1.15) | |
| (429,994) | ||||
| Consumer discretionary | ||||
| Automobiles | ||||
| Lucid Group Incorporated | (3,948) | (67,748) | (1.35) | |
| Rivian Automotive Incorporated Class A | (2,572) | (66,203) | (1.32) | |
| Household durables | ||||
| Sony Corporation | (1,700) | (139,015) | (2.77) | |
| Internet & direct marketing retail | ||||
| Rakuten Incorporated | (12,800) | (57,736) | (1.15) | |
| Specialty retail | ||||
| Fast Retailing Company Limited | (100) | (52,388) | (1.05) | |
| Floor & Decor Holdings Inc Class A | (924) | (58,175) | (1.16) | |
| Textiles, apparel & luxury goods | ||||
| LVMH Moet Hennessy Louis Vuitton SE | (139) | (84,733) | (1.69) | |
| (525,998) | ||||
| Consumer staples | ||||
| Beverages | ||||
| Asahi Group Holdings Limited | (1,600) | (52,417) | (1.05) | |
| Food & staples retailing | ||||
| Aeon Company Limited | (7,500) | (130,122) | (2.59) | |
| Ocado Group plc | (6,850) | (65,140) | (1.30) | |
| Seven & I Holdings Company Limited | (2,000) | (77,639) | (1.55) | |
| Woolworths Group Limited | (2,221) | (54,576) | (1.09) | |
| Food products | ||||
| Nestle SA | (674) | (78,679) | (1.57) | |
| Tobacco | ||||
| Japan Tobacco Incorporated | (3,000) | (51,872) | (1.03) | |
| (510,445) | ||||
| Energy | ||||
| Oil, gas & consumable fuels | ||||
| Enbridge Incorporated | (1,200) | (50,677) | (1.01) | |
| Santos Limited | (10,017) | (51,304) | (1.03) | |
| TC Energy Corporation | (1,900) | (98,424) | (1.96) | |
| (200,405) | ||||
| Financials | ||||
| Banks | ||||
| JPMorgan Chase & Company | (703) | (79,165) | (1.58) | |
| Capital markets | ||||
| Matsui Securities Company Limited | (9,800) | (58,144) | (1.16) | |
| The Charles Schwab Corporation | (889) | (56,167) | (1.12) | |
| Diversified financial services | ||||
| Groupe Bruxelles Lambert SA | (672) | (56,112) | (1.12) | |
| Insurance | ||||
| AIA Group Limited | (13,800) | (149,576) | (2.98) |
| Reference asset | Shares | Value | % of swapbasket value | |
| Short positions (continued) | ||||
| Insurance (continued) | ||||
| Allianz SE | (396) | $ (75,578) | (1.51)% | |
| Great-West Lifeco Incorporated | (3,000) | (73,252) | (1.46) | |
| Phoenix Group Holdings plc | (15,892) | (114,215) | (2.28) | |
| (662,209) | ||||
| Health care | ||||
| Biotechnology | ||||
| Exact Sciences Corporations | (1,513) | (59,597) | (1.19) | |
| Sage Therapeutics Incorporated | (1,643) | (53,069) | (1.06) | |
| Pharmaceuticals | ||||
| Arvinas Incorporated | (1,226) | (51,602) | (1.03) | |
| Astrazeneca plc | (544) | (71,519) | (1.42) | |
| (235,787) | ||||
| Industrials | ||||
| Aerospace & defense | ||||
| Airbus SE | (544) | (52,704) | (1.05) | |
| CAE Incorporated | (2,100) | (51,750) | (1.03) | |
| Safran SA | (515) | (50,845) | (1.01) | |
| Transdigm Group Incorporated | (109) | (58,497) | (1.17) | |
| Building products | ||||
| Daikin Industries Limited | (600) | (96,182) | (1.92) | |
| Construction & engineering | ||||
| Vinci SA | (1,009) | (89,835) | (1.79) | |
| Willscot Mobile Mini Holdings Corporation | (1,630) | (52,845) | (1.05) | |
| Electrical equipment | ||||
| Plug Power Incorporated | (3,313) | (54,896) | (1.09) | |
| Machinery | ||||
| Alstom SA | (3,641) | (82,379) | (1.65) | |
| FANUC Corporation | (500) | (78,272) | (1.56) | |
| Toyota Industries Corporation | (2,100) | (130,012) | (2.59) | |
| Professional services | ||||
| Clarivate plc | (6,817) | (94,484) | (1.89) | |
| Costar Group Incorporated | (1,016) | (61,377) | (1.22) | |
| Road & rail | ||||
| Uber Technologies Incorporated | (3,448) | (70,546) | (1.41) | |
| (1,024,624) | ||||
| Information technology | ||||
| Electronic equipment, instruments & components | ||||
| Teledyne Technologies Incorporated | (176) | (66,019) | (1.32) | |
| IT services | ||||
| WEX Incorporated | (364) | (56,624) | (1.13) | |
| Worldline SA | (1,700) | (63,030) | (1.26) | |
| Semiconductors & semiconductor equipment | ||||
| Analog Devices Incorporated | (666) | (97,296) | (1.94) | |
| Infineon Technologies AG | (2,394) | (57,928) | (1.15) | |
| Software | ||||
| Aveva Group plc | (3,241) | (88,808) | (1.77) | |
| Lightspeed Commerce Incorporated | (2,700) | (60,200) | (1.20) |
| Reference asset | Shares | Value | % of swapbasket value | |
| Short positions (continued) | ||||
| Software (continued) | ||||
| salesforce.com Incorporated | (505) | $ (83,345) | (1.66)% | |
| Xero Limited | (1,035) | (54,981) | (1.10) | |
| (628,231) | ||||
| Materials | ||||
| Chemicals | ||||
| International Flavors & Fragrances Incorporated | (1,146) | (136,512) | (2.72) | |
| Metals & mining | ||||
| Ivanhoe Mines Limited Class A | (15,400) | (88,653) | (1.77) | |
| Lithium Americas Corporation | (2,900) | (58,419) | (1.17) | |
| (283,584) | ||||
| Real estate | ||||
| Equity REITs | ||||
| Advance Residence Investment Corporation | (20) | (53,213) | (1.06) | |
| American Tower Corporation | (300) | (76,677) | (1.53) | |
| Nippon Building Fund Incorporated | (25) | (124,558) | (2.48) | |
| Realty Income Corporation | (1,907) | (130,172) | (2.60) | |
| Real estate management & development | ||||
| Capitaland Investment Limited | (26,400) | (72,589) | (1.45) | |
| (457,209) | ||||
| Utilities | ||||
| Electric utilities | ||||
| Enel SpA | (11,063) | (60,518) | (1.21) | |
| Nextera Energy Incorporated | (877) | (67,932) | (1.35) | |
| (128,450) |
| Abbreviations: | |
| REIT | Real estate investment trust |
| Assets | |
Investments in unaffiliated securities, at value (cost $25,233,398) | $ 25,228,457 |
Investments in affiliated securities, at value (cost $26,833,161) | 26,833,161 |
Cash | 153,887 |
Cash due from broker | 115,752 |
Cash at broker segregated for futures contracts | 7,885,297 |
Unrealized gains on forward foreign currency contracts | 943,750 |
Receivable for daily variation margin on open futures contracts | 328,858 |
Unrealized gains on swap contracts | 239,047 |
Receivable for interest | 18,203 |
Receivable from manager | 1,244 |
Receivable for Fund shares sold | 690 |
Prepaid expenses and other assets | 36,315 |
Total assets | 61,784,661 |
| Liabilities | |
Payable for investments purchased | 4,939,101 |
Unrealized losses on forward foreign currency contracts | 1,060,214 |
Payable for daily variation margin on open futures contracts | 472,619 |
Cash due to broker | 153,887 |
Payable for Fund shares redeemed | 15,200 |
Trustees’ fees and expenses payable | 4,152 |
Administration fees payable | 1,456 |
Total liabilities | 6,646,629 |
Total net assets | $55,138,032 |
| Net assets consist of | |
Paid-in capital | $ 52,048,465 |
Total distributable earnings | 3,089,567 |
Total net assets | $55,138,032 |
| Computation of net asset value per share | |
Net assets – Class R6 | $ 54,204,777 |
Shares outstanding – Class R61 | 5,939,322 |
Net asset value per share – Class R6 | $9.13 |
Net assets – Institutional Class | $ 933,255 |
Shares outstanding – Institutional Class1 | 102,500 |
Net asset value per share – Institutional Class | $9.10 |
| 1 | The Fund has an unlimited number of authorized shares. |
| Investment income | |
Income from affiliated securities | $ 39,407 |
| Expenses | |
Management fee | 403,999 |
| Administration fees | |
Class R6 | 20,130 |
Institutional Class | 304 |
Custody and accounting fees | 75,976 |
Professional fees | 80,954 |
Registration fees | 43,693 |
Shareholder report expenses | 39,357 |
Trustees’ fees and expenses | 21,102 |
Other fees and expenses | 89,449 |
Total expenses | 774,964 |
| Less: Fee waivers and/or expense reimbursements | |
Fund-level | (357,030) |
Institutional Class | (234) |
Net expenses | 417,700 |
Net investment loss | (378,293) |
| Realized and unrealized gains (losses) on investments | |
| Net realized gains (losses) on | |
Unaffiliated securities | 27,849 |
Forward foreign currency contracts | (179,998) |
Futures contracts | 2,222,867 |
Swap contracts | 1,864,573 |
Net realized gains on investments | 3,935,291 |
| Net change in unrealized gains (losses) on | |
Unaffiliated securities | (4,848) |
Forward foreign currency contracts | (377,046) |
Futures contracts | 1,240,785 |
Swap contracts | 75,118 |
Net change in unrealized gains (losses) on investments | 934,009 |
Net realized and unrealized gains (losses) on investments | 4,869,300 |
Net increase in net assets resulting from operations | $4,491,007 |
| Year ended June 30, 2022 | Year ended June 30, 2021 | |||
| Operations | ||||
Net investment loss | $ (378,293) | $ (402,351) | ||
Net realized gains on investments | 3,935,291 | 2,101,490 | ||
Net change in unrealized gains (losses) on investments | 934,009 | 929,303 | ||
Net increase in net assets resulting from operations | 4,491,007 | 2,628,442 | ||
| Capital share transactions | Shares | Shares | ||
| Proceeds from shares sold | ||||
Class R6 | 104,165 | 886,741 | 6,163,717 | 50,264,988 |
Institutional Class | 100,000 | 853,000 | 0 | 0 |
| 1,739,741 | 50,264,988 | |||
| Payment for shares redeemed | ||||
Class R6 | (2,679,117) | (23,152,340) | (5,848,516) | (46,618,904) |
Net increase (decrease) in net assets resulting from capital share transactions | (21,412,599) | 3,646,084 | ||
Total increase (decrease) in net assets | (16,921,592) | 6,274,526 | ||
| Net assets | ||||
Beginning of period | 72,059,624 | 65,785,098 | ||
End of period | $ 55,138,032 | $ 72,059,624 | ||
| Year ended June 30 | ||||
| Class R6 | 2022 | 2021 | 2020 | 2019 1 |
Net asset value, beginning of period | $8.46 | $8.02 | $9.75 | $10.00 |
Net investment income (loss) | (0.11) | (0.05) 2 | 0.10 | 0.07 |
Net realized and unrealized gains (losses) on investments | 0.78 | 0.49 | (1.73) | (0.32) |
Total from investment operations | 0.67 | 0.44 | (1.63) | (0.25) |
| Distributions to shareholders from | ||||
Net investment income | 0.00 | 0.00 | (0.03) | 0.00 |
Net realized gains | 0.00 | 0.00 | (0.07) | 0.00 |
Total distributions to shareholders | 0.00 | 0.00 | (0.10) | 0.00 |
Net asset value, end of period | $9.13 | $8.46 | $8.02 | $9.75 |
Total return3 | 7.92% | 5.49% | (16.78)% | (2.50)% |
| Ratios to average net assets (annualized) | ||||
Gross expenses | 1.15% | 1.09% | 1.04% | 1.56% |
Net expenses | 0.62% | 0.62% | 0.62% | 0.62% |
Net investment income (loss) | (0.56)% | (0.58)% | 1.03% | 1.78% |
| Supplemental data | ||||
Portfolio turnover rate | 0% | 0% | 0% | 0% |
Net assets, end of period (000s omitted) | $54,205 | $72,039 | $65,765 | $38,957 |
| 1 | For the period from January 29, 2019 (commencement of class operations) to June 30, 2019 |
| 2 | Calculated based upon average shares outstanding |
| 3 | Returns for periods of less than one year are not annualized. |
| Year ended June 30 | ||||
| Institutional Class | 2022 | 2021 | 2020 | 2019 1 |
Net asset value, beginning of period | $8.44 | $8.02 | $9.74 | $10.00 |
Net investment income (loss) | (0.10) | (0.05) | 0.09 | 0.07 |
Net realized and unrealized gains (losses) on investments | 0.76 | 0.47 | (1.72) | (0.33) |
Total from investment operations | 0.66 | 0.42 | (1.63) | (0.26) |
| Distributions to shareholders from | ||||
Net investment income | 0.00 | 0.00 | (0.02) | 0.00 |
Net realized gains | 0.00 | 0.00 | (0.07) | 0.00 |
Total distributions to shareholders | 0.00 | 0.00 | (0.09) | 0.00 |
Net asset value, end of period | $9.10 | $8.44 | $8.02 | $9.74 |
Total return2 | 7.82% | 5.24% | (16.87)% | (2.60)% |
| Ratios to average net assets (annualized) | ||||
Gross expenses | 1.35% | 1.21% | 1.15% | 1.68% |
Net expenses | 0.72% | 0.72% | 0.72% | 0.72% |
Net investment income (loss) | (0.53)% | (0.68)% | 0.95% | 1.69% |
| Supplemental data | ||||
Portfolio turnover rate | 0% | 0% | 0% | 0% |
Net assets, end of period (000s omitted) | $933 | $21 | $20 | $24 |
| 1 | For the period from January 29, 2019 (commencement of class operations) to June 30, 2019 |
| 2 | Returns for periods of less than one year are not annualized. |
| Gross unrealized gains | $ 4,570,475 |
| Gross unrealized losses | (4,214,972) |
| Net unrealized gains | $ 355,503 |
| ■ | Level 1 – quoted prices in active markets for identical securities |
| ■ | Level 2 – other significant observable inputs (including quoted prices for similar securities, interest rates, prepayment speeds, credit risk, etc.) |
| ■ | Level 3 – significant unobservable inputs (including the Fund’s own assumptions in determining the fair value of investments) |
| Quoted prices (Level 1) | Other significant observable inputs (Level 2) | Significant unobservable inpouts (level 3) | Total | |
| Assets | ||||
| Investments in: | ||||
| Short-term investments | ||||
| Investment companies | $ 26,833,161 | $ 0 | $0 | $ 26,833,161 |
| U.S. Treasury Securities | 25,228,457 | 0 | 0 | 25,228,457 |
| 52,061,618 | 0 | 0 | 52,061,618 | |
| Forward foreign currency contracts | 0 | 943,750 | 0 | 943,750 |
| Futures contracts | 2,032,860 | 0 | 0 | 2,032,860 |
| Swap contracts | 0 | 239,047 | 0 | 239,047 |
| Total assets | $54,094,478 | $1,182,797 | $0 | $55,277,275 |
| Liabilitites | ||||
| Forward foreign currency contracts | $ 0 | $ 1,060,214 | $0 | $ 1,060,214 |
| Futures contracts | 930,517 | 0 | 0 | 930,517 |
| Total liabilities | $ 930,517 | $1,060,214 | $0 | $ 1,990,731 |
| Average daily net assets | Management fee |
| First $500 million | 0.600% |
| Next $500 million | 0.575 |
| Next $2 billion | 0.550 |
| Next $2 billion | 0.525 |
| Next $5 billion | 0.490 |
| Over $10 billion | 0.480 |
| Class-level administration fee | |
| Class R6 | 0.03% |
| Institutional Class | 0.13 |
| Expense ratio caps | |
| Class R6 | 0.62% |
| Institutional Class | 0.72 |
| Futures contracts | |
| Average notional balance on long futures | $87,258,453 |
| Average notional balance on short futures | 86,060,248 |
| Forward foreign currency contracts | |
| Average contract amounts to buy | $64,465,979 |
| Average contract amounts to sell | 72,441,998 |
| Swap contracts | |
| Average notional balance | $ 5,588,222 |
| Asset derivatives | Liability derivatives | ||||
| Consolidated Statement of Assets and Liabilities location | Fair value | Consolidated Statement of Assets and Liabilities location | Fair value | ||
| Interest rate risk | Unrealized gains on futures contracts | $ 868,658* | Unrealized losses on futures contracts | $ 113,529* | |
| Commodity risk | Unrealized gains on futures contracts | 1,062,319* | Unrealized losses on futures contracts | 718,667* | |
| Equity risk | Unrealized gains on futures contracts | 101,883* | Unrealized losses on futures contracts | 98,321* | |
| Unrealized gains on swaps contracts | 239,047 | Unrealized losses on swaps contracts | 0 | ||
| Foreign currency risk | Unrealized gains on forward foreign currency contracts | 943,750 | Unrealized losses on forward foreign currency contracts | 1,060,214 | |
| $3,215,657 | $1,990,731 | ||||
| Net realized gains (losses) on derivatives | ||||
| Forward foreign currency contracts | Futures contracts | Swap contracts | Total | |
| Interest rate risk | $ 0 | $(1,189,880) | $ 0 | $(1,189,880) |
| Commodity risk | 0 | 3,842,739 | 0 | 3,842,739 |
| Equity risk | 0 | (429,992) | 1,864,573 | 1,434,581 |
| Foreign currency risk | (179,998) | 0 | 0 | (179,998) |
| $(179,998) | $ 2,222,867 | $1,864,573 | $ 3,907,442 | |
| Net change in unrealized gains (losses) on derivatives | ||||
| Forward foreign currency contracts | Futures contracts | Swap contracts | Total | |
| Interest rate risk | $ 0 | $ 1,056,742 | $ 0 | $1,056,742 |
| Commodity risk | 0 | 169,881 | 0 | 169,881 |
| Equity risk | 0 | 14,162 | 75,118 | 89,280 |
| Foreign currency risk | (377,046) | 0 | 0 | (377,046) |
| $(377,046) | $1,240,785 | $75,118 | $ 938,857 | |
| Counterparty | Gross amounts of assets in the Consolidated Statement of Assets and Liabilities | Amounts subject to netting agreements | Collateral received | Net amount of assets |
| Goldman Sachs International | $1,182,797 | $(1,060,214) | $0 | $122,583 |
| Counterparty | Gross amounts of assets in the Consolidated Statement of Assets and Liabilities | Amounts subject to netting agreements | Collateral received | Net amount of assets |
| Goldman Sachs International | $1,060,214 | $(1,060,214) | $0 | $0 |
| Undistributed ordinary income | Undistributed long-term gain | Unrealized gains |
| $1,290,581 | $1,443,432 | $355,554 |
Allspring Funds Trust:

| Name and year of birth | Position held and length of service* | Principal occupations during past five years or longer | Current other public company or investment company directorships |
| William R. Ebsworth (Born 1957) | Trustee, since 2015 | Retired. From 1984 to 2013, equities analyst, portfolio manager, research director and chief investment officer at Fidelity Management and Research Company in Boston, Tokyo, and Hong Kong, and retired in 2013 as Chief Investment Officer of Fidelity Strategic Advisers, Inc. where he led a team of investment professionals managing client assets. Prior thereto, Board member of Hong Kong Securities Clearing Co., Hong Kong Options Clearing Corp., the Thailand International Fund, Ltd., Fidelity Investments Life Insurance Company, and Empire Fidelity Investments Life Insurance Company. Audit Committee Chair and Investment Committee Chair of the Vincent Memorial Hospital Endowment (non-profit organization). Mr. Ebsworth is a CFA® charterholder. | N/A |
| Jane A. Freeman (Born 1953) | Trustee, since 2015; Chair Liaison, since 2018 | Retired. From 2012 to 2014 and 1999 to 2008, Chief Financial Officer of Scientific Learning Corporation. From 2008 to 2012, Ms. Freeman provided consulting services related to strategic business projects. Prior to 1999, Portfolio Manager at Rockefeller & Co. and Scudder, Stevens & Clark. Board member of the Harding Loevner Funds from 1996 to 2014, serving as both Lead Independent Director and chair of the Audit Committee. Board member of the Russell Exchange Traded Funds Trust from 2011 to 2012 and the chair of the Audit Committee. Ms. Freeman is also an inactive Chartered Financial Analyst. | N/A |
| Isaiah Harris, Jr. (Born 1952) | Trustee, since 2009; Audit Committee Chair, since 2019 | Retired. Chairman of the Board of CIGNA Corporation from 2009 to 2021, and Director from 2005 to 2008. From 2003 to 2011, Director of Deluxe Corporation. Prior thereto, President and CEO of BellSouth Advertising and Publishing Corp. from 2005 to 2007, President and CEO of BellSouth Enterprises from 2004 to 2005 and President of BellSouth Consumer Services from 2000 to 2003. Emeritus member of the Iowa State University Foundation Board of Governors. Emeritus Member of the Advisory Board of Iowa State University School of Business. Advisory Board Member, Palm Harbor Academy (private school). Advisory Board Member, Fellowship of Christian Athletes. Mr. Harris is a certified public accountant (inactive status). | N/A |
| David F. Larcker (Born 1950) | Trustee, since 2009 | James Irvin Miller Professor of Accounting at the Graduate School of Business (Emeritus), Stanford University, Director of the Corporate Governance Research Initiative and Senior Faculty of The Rock Center for Corporate Governance since 2006. From 2005 to 2008, Professor of Accounting at the Graduate School of Business, Stanford University. Prior thereto, Ernst & Young Professor of Accounting at The Wharton School, University of Pennsylvania from 1985 to 2005. | N/A |
| Name and year of birth | Position held and length of service* | Principal occupations during past five years or longer | Current other public company or investment company directorships |
| Olivia S. Mitchell (Born 1953) | Trustee, since 2006; Nominating and Governance Committee Chair, since 2018 | International Foundation of Employee Benefit Plans Professor since 1993, Wharton School of the University of Pennsylvania. Director of Wharton’s Pension Research Council and Boettner Center on Pensions & Retirement Research, and Research Associate at the National Bureau of Economic Research. Previously taught at Cornell University from 1978 to 1993. | N/A |
| Timothy J. Penny (Born 1951) | Trustee, since 1996; Chair, since 2018 | President and Chief Executive Officer of Southern Minnesota Initiative Foundation, a non-profit organization, since 2007. Member of the Board of Trustees of NorthStar Education Finance, Inc., a non-profit organization, since 2007. | N/A |
| James G. Polisson (Born 1959) | Trustee, since 2018 | Retired. Chief Marketing Officer, Source (ETF) UK Services, Ltd, from 2015 to 2017. From 2012 to 2015, Principal of The Polisson Group, LLC, a management consulting, corporate advisory and principal investing company. Chief Executive Officer and Managing Director at Russell Investments, Global Exchange Traded Funds from 2010 to 2012. Managing Director of Barclays Global Investors from 1998 to 2010 and Global Chief Marketing Officer for iShares and Barclays Global Investors from 2000 to 2010. Trustee of the San Francisco Mechanics’ Institute, a non-profit organization, from 2013 to 2015. Board member of the Russell Exchange Traded Fund Trust from 2011 to 2012. Director of Barclays Global Investors Holdings Deutschland GmbH from 2006 to 2009. Mr. Polisson is an attorney and has a retired status with the Massachusetts and District of Columbia Bar Associations. | N/A |
| Pamela Wheelock (Born 1959) | Trustee, since January 2020; previously Trustee from January 2018 to July 2019 | Board member of the Destination Medical Center Economic Development Agency, Rochester, Minnesota since 2019. Interim President of the McKnight Foundation from January to September 2020. McKnight Foundation Consultant, November 2020 to February 2021. Acting Commissioner, Minnesota Department of Human Services, July 2019 through September 2019. Consultant (part-time), Minnesota Department of Human Services, October 2019 through December 2019. Chief Operating Officer, Twin Cities Habitat for Humanity from 2017 to 2019. Vice President of University Services, University of Minnesota from 2012 to 2016. Prior thereto, on the Board of Directors, Governance Committee and Finance Committee for the Minnesota Philanthropy Partners (Saint Paul Foundation) from 2012 to 2018, Interim Chief Executive Officer of Blue Cross Blue Shield of Minnesota from 2011 to 2012, Chairman of the Board from 2009 to 2012 and Board Director from 2003 to 2015. Vice President, Leadership and Community Engagement, Bush Foundation, Saint Paul, Minnesota (a private foundation) from 2009 to 2011. Executive Vice President and Chief Financial Officer, Minnesota Sports and Entertainment from 2004 to 2009 and Senior Vice President from 2002 to 2004. Executive Vice President of the Minnesota Wild Foundation from 2004 to 2008. Commissioner of Finance, State of Minnesota, from 1999 to 2002. Currently Board Chair of the Minnesota Wild Foundation since 2010. | N/A |
| Name and year of birth | Position held and length of service | Principal occupations during past five years or longer |
| Andrew Owen (Born 1960) | President, since 2017 | President, Chief Executive Officer and Director of Allspring Funds Management, LLC since 2017 and co-president of Galliard Capital Management, LLC, an affiliate of Allspring Funds Management, LLC, since 2019. Prior thereto, Head of Affiliated Managers, Allspring Global Investments, from 2014 to 2019 and Executive Vice President responsible for marketing, investments and product development for Allspring Funds Management, LLC, from 2009 to 2014. In addition, Mr. Owen was an Executive Vice President of Wells Fargo & Company from 2014 to 2021. |
| Jeremy DePalma (Born 1974) | Treasurer, since 2012 (for certain funds in the Fund Complex); since 2021 (for the remaining funds in the Fund Complex) | Senior Vice President of Allspring Funds Management, LLC since 2009. Senior Vice President of Evergreen Investment Management Company, LLC from 2008 to 2010 and head of the Fund Reporting and Control Team within Fund Administration from 2005 to 2010. |
| Kate McKinley (Born 1977) | Chief Legal Officer, since 2021 | Chief Legal Officer of Allspring Global Investments since 2021. Prior thereto, held various roles at State Street Global Advisors beginning in 2010, including serving as Senior Vice President and General Counsel from 2019 to 2021, and Chief Operating Officer of the Institutional Client Group from 2016 - 2019. Prior to working at State Street Global Advisors served as Assistant General Counsel for Bank of America Corporation from 2005 to 2010 and as an Associate at WilmerHale from 2002 to 2005. |
| Christopher Baker (Born 1976) | Chief Compliance Officer, since 2022 | Global Chief Compliance Officer for Allspring Global Investments since 2022. Prior thereto, Chief Compliance Officer for State Street Global Advisors from 2018 to 2021. Senior Compliance Officer for the State Street divisions of Alternative Investment Solutions, Sector Solutions, and Global Marketing from 2015 to 2018. From 2010 to 2015 Vice President, Global Head of Investment and Marketing Compliance for State Street Global Advisors. |
| Matthew Prasse (Born 1983) | Secretary, since 2021 | Senior Counsel of the Allspring Legal Department since 2021. Senior Counsel of the Wells Fargo Legal Department from 2018 to 2021. Previously, Counsel for Barings LLC from 2015 to 2018. Prior to joining Barings, Associate at Morgan, Lewis & Bockius LLP from 2008 to 2015. |
P.O. Box 219967
Kansas City, MO 64121-9967

1-800-222-8222 or visit the Fund's website at allspringglobal.com. Read the prospectus carefully before you invest or send money.
A295/AR295 06-22
ITEM 2. CODE OF ETHICS
(a) As of the end of the period covered by the report, Allspring Funds Trust has adopted a code of ethics that applies to its President and Treasurer. A copy of the code of ethics is filed as an exhibit to this Form N-CSR.
(c) During the period covered by this report, there were no amendments to the provisions of the code of ethics adopted in Item 2(a) above.
(d) During the period covered by this report, there were no implicit or explicit waivers to the provisions of the code of ethics adopted in Item 2(a) above.
ITEM 3. AUDIT COMMITTEE FINANCIAL EXPERT
The Board of Trustees of Allspring Funds Trust has determined that Isaiah Harris is an audit committee financial expert, as defined in Item 3 of Form N-CSR. Mr. Harris is independent for purposes of Item 3 of Form N-CSR.
ITEM 4. PRINCIPAL ACCOUNTANT FEES AND SERVICES
(a), (b), (c), (d) The following table presents aggregate fees billed in each of the last two fiscal years for services rendered
to the Registrant by the Registrant’s principal accountant. These fees were billed to the registrant and were approved by
the Registrant’s audit committee.
| Fiscal | Fiscal | |||||||
| year ended | year ended | |||||||
| June 30, 2022 | June 30, 2021 | |||||||
Audit fees | $ | 696,040 | $ | 662,670 | ||||
Audit-related fees | — | — | ||||||
Tax fees (1) | 32,455 | 31,320 | ||||||
All other fees | — | — | ||||||
|
|
|
| |||||
| $ | 728,495 | $ | 693,990 | |||||
|
|
|
| |||||
| (1) | Tax fees consist of fees for tax compliance, tax advice, tax planning and excise tax. |
| (e) | The Chair of the Audit Committees is authorized to pre-approve: (1) audit services for the mutual funds of Allspring Funds Trust; (2) non-audit tax or compliance consulting or training services provided to the Funds by the independent auditors (“Auditors”) if the fees for any particular engagement are not anticipated to exceed $50,000; and (3) non-audit tax or compliance consulting or training services provided by the Auditors to a Fund’s investment adviser and its controlling entities (where pre-approval is required because the engagement relates directly to the operations and financial reporting of the Fund) if the fee to the Auditors for any particular engagement is not anticipated to exceed $50,000. For any such pre-approval sought from the Chair, Management shall prepare a brief description of the proposed services. |
If the Chair approves of such service, he or she shall sign the statement prepared by Management. Such written statement shall be presented to the full Committees at their next regularly scheduled meetings.
(f) Not applicable
(g) Not applicable
(h) Not applicable
ITEM 5. AUDIT COMMITTEE OF LISTED REGISTRANTS
Not applicable.
ITEM 6. INVESTMENTS
A Portfolio of Investments for each series of Allspring Funds Trust is included as part of the report to shareholders filed under Item 1 of this Form.
ITEM 7. DISCLOSURE OF PROXY VOTING POLICIES AND PROCEDURES FOR CLOSED-END MANAGEMENT INVESTMENT COMPANIES
Not applicable.
ITEM 8. PORTFOLIO MANAGERS OF CLOSED-END MANAGEMENT INVESTMENT COMPANIES
Not applicable.
ITEM 9. PURCHASES OF EQUITY SECURITIES BY CLOSED-END MANAGEMENT INVESTMENT COMPANY AND AFFILIATED PURCHASERS
Not applicable.
ITEM 10. SUBMISSION OF MATTERS TO A VOTE OF SECURITY HOLDERS
There have been no material changes to the procedures by which shareholders may recommend nominees to the registrant’s Board of Trustees that have been implemented since the registrant’s last provided disclosure in response to the requirements of this Item.
ITEM 11. CONTROLS AND PROCEDURES
(a) The President and Treasurer have concluded that the Allspring Funds Trust disclosure controls and procedures (as defined in Rule 30a-3(c) under the Investment Company Act of 1940) provide reasonable assurances that material information relating to the registrant is made known to them by the appropriate persons based on their evaluation of these controls and procedures as of a date within 90 days of the filing of this report.
(b) There were no significant changes in the registrant’s internal controls over financial reporting (as defined in Rule 30a-3(d) under the Investment Company Act of 1940) that occurred during the most recent fiscal half-year of the period covered by this report that materially affected, or is reasonably likely to materially affect, the registrant’s internal control over financial reporting.
ITEM 12. DISCLOSURES OF SECURITIES LENDING ACTIVITES FOR CLOSED-END MANAGEMENT INVESTMENT COMPANIES
Not applicable.
ITEM 13. EXHIBITS
| (a)(1) | Code of Ethics. | |
| (a)(2) | Certifications pursuant to Section 302 of the Sarbanes-Oxley Act of 2002. | |
| (b) | Certifications pursuant to Section 906 of the Sarbanes-Oxley Act of 2002. | |
SIGNATURES
Pursuant to the requirements of the Securities Exchange Act of 1934 and the Investment Company Act of 1940, the registrant has duly caused this report to be signed on its behalf by the undersigned, thereunto duly authorized.
| Allspring Funds Trust | ||
| By: | /s/ Andrew Owen | |
| Andrew Owen | ||
| President | ||
| Date: August 25, 2022 | ||
Pursuant to the requirements of the Securities Exchange Act of 1934 and the Investment Company Act of 1940, this report has been signed below by the following persons on behalf of the registrant and in the capacities and on the date indicated.
| Allspring Funds Trust | ||
| By: | /s/ Andrew Owen | |
| Andrew Owen | ||
| President | ||
| Date: August 25, 2022 | ||
| By: | /s/Jeremy DePalma | |
| Jeremy DePalma | ||
| Treasurer | ||
| Date: August 25, 2022 | ||